incontact pro intouch reference manual · thanks to our customers for valuable feedback and...
TRANSCRIPT

inContact Pro inTouch
Reference Manual
Page | 2
Error! No text of specified style in document.
inContact PRO inTouch Reference Manual Title inContact PRO inTouch Reference Manual
Revision 02112010
Copyright ©2010 inContact, Inc.
About inContact
inContact, Inc. provides the market leading on-demand contact center platform, inContact, to over 500 contact centers across the globe. With its roots in telecommunications and network infrastructure, inContact is unique in its offering because it combines a powerful connectivity backbone with a world-class software platform. The inContact platform has grown from a powerful ACD with skills-based routing, CTI, and IVR with speech recognition, to include an innovative online hiring solution, an eLearning and communications application, workforce management functionality, and a customer feedback and survey solution. Because the inContact platform is delivered through a Software-as-a-Service (SaaS) model, inContact customers can realize significant cost savings and flexibility compared to premises-based alternatives. To learn more about inContact, visit www.incontact.com.
Contributors Thanks to our customers for valuable feedback and inContact’s dedicated staff.
Page | 3
Table of Contents
Table of Contents Using inTouch .................................................................................... 9
Log In .............................................................................................. 10
Skills ................................................................................................ 14
Campaigns ....................................................................................... 16
Real-Time Reports ............................................................................ 17
Agent Count by State ....................................................................... 18
Agent Counter .................................................................................. 22
Agent Counter: Report Properties: ....................................................... 24
Agent List ......................................................................................... 27
Agent List: Report Menu ..................................................................... 29
Agent List: Report Properties .............................................................. 32
Agent List: Agent Zoom ..................................................................... 37
Agent List: Agent Zoom - Change Report Detail .................................... 41
Agent List: Agent Zoom - Monitor and Record Calls ............................... 45
Contact List ...................................................................................... 47
Contact List: Report Menu .................................................................. 50
Contact List Menu: Report Properties ................................................... 52
Contact List: Contact Zoom ................................................................ 59
Contacts States by Skill .................................................................... 60
Contacts States by Skill: Report Menu .................................................. 62
Queue Counter ................................................................................. 64
Queue Counter: Report Properties ....................................................... 65
Queue Trend..................................................................................... 71

Page | 4
Table of Contents
Queue Trend: Report Menu ................................................................. 73
Queue Trend: Report Properties .......................................................... 75
Service Level .................................................................................... 79
Service Level: Report Menu ................................................................ 81
Service Level: Update Report .............................................................. 82
Service Level: Report Properties .......................................................... 83
Service Level: Show Graph ................................................................. 87
Service Level Report: Show Report Data .............................................. 88
Skill Summary .................................................................................. 90
Skill Summary Report: Properties ........................................................ 94
Historical Reports ........................................................................... 101
Agent Performance ........................................................................ 103
Agent Performance: Report Menu ...................................................... 105
Agent Performance: Report Properties ............................................... 108
Agent Performance: Show Graph ....................................................... 112
Agent Performance: Show Report Data .............................................. 115
Agent Performance by Hour ........................................................... 117
Agent Performance by Hour: Report Menu .......................................... 119
Agent Performance by Hour: Report Properties ................................... 123
Agent Performance by Hour: Show Graph ........................................... 131
Agent Performance by Hour: Show Report Data .................................. 132
Agent Summary by Day .................................................................. 134
Agent Summary by Day: Report Menu ............................................... 137
Agent Summary by Day: Report Properties ......................................... 141
Agent Summary by Day: Show Graph ................................................ 151
Page | 5
Table of Contents
Agent Summary by Day: Show Report Data ........................................ 152
Agent Summary by Day: Contacts ..................................................... 153
Agent Summary by Day: Durations (min) ........................................... 155
Agent Summary by Day: Total Time vs. % Total ................................. 157
Agent Summary by Day: Ave Durations (sec) ..................................... 159
Agent Summary by Day: Refused / Held Abandon ............................... 161
Agent Summary by Day: Contacts and Durations ................................ 164
Campaign/Skill Summary Report ................................................... 166
Campaign/Summary: Report Menu .................................................... 170
Campaign/Skill Summary: Report Properties ....................................... 174
Contact Statistics ........................................................................... 179
Contact Statistics: Report Menu ........................................................ 181
Contact Statistics: Report Properties .................................................. 184
Contact Statistics: Show Graph ......................................................... 201
Contact Statistics: Show Report Data ................................................. 203
Media Comparison .......................................................................... 205
Media Comparison: Report Menu ....................................................... 207
Media Comparison: Report Properties ................................................ 210
Media Comparison: Show Graph ........................................................ 217
Media Comparison: View Data ........................................................... 218
Skill Dispositions Pie ...................................................................... 220
Skill Dispositions Pie: Report Menu .................................................... 222
Skill Dispositions Pie: Report Properties .............................................. 225
Skill Disposition Pie: Show Graph ...................................................... 228
Skill Disposition Pie: Show Report Data .............................................. 229
Page | 6
Table of Contents
Skill Dispositions Chart .................................................................. 230
Skill Dispositions Chart: Report Menu ................................................. 232
Skill Dispositions Chart: Report Properties .......................................... 234
Unavailable Stats ........................................................................... 238
Unavailable Stats: Report Menu ........................................................ 240
Unavailable Stats: Report Properties .................................................. 243
Unavailable Statistics: Show Graph .................................................... 248
Unavailable Statistics: Show Report Data ........................................... 249
Custom Reporting .......................................................................... 250
Agent Statistics .............................................................................. 255
Agent Summary by Agent ............................................................... 264
Agent Summary by Day .................................................................. 273
Agent Summary by Month .............................................................. 281
Agent Summary by Week ............................................................... 288
Agent Time Card ............................................................................. 295
Agent Unavailable by Week ............................................................ 300
Agent Unavailable Time .................................................................. 304
Campaign Summary by Campaign .................................................. 310
Campaign Summary by Month ........................................................ 319
Campaign Summary by Skill ........................................................... 328
Campaign Summary by Week ......................................................... 337
Contact Statistics ........................................................................... 346
Contact Statistics by Campaign and Month ......................................... 354
Contact Statistics By Campaign And Day ............................................ 358
Contact Statistics By Campaign And Hour ........................................... 362
Page | 7
Table of Contents
Contact Statistics By Campaign And Half Hour .................................... 366
Contact Statistics By Point of Contact And Month ................................. 370
Contact Statistics By Point of Contact And Day .................................... 374
Contact Statistics By Point of Contact And Hour ................................... 378
Contact Statistics By Point of Contact And Half Hour ............................ 382
Contact Statistics By Skill And Month ................................................. 386
Contact Statistics By Skill And Day .................................................... 391
Contact Statistics By Skill And Hour ................................................... 395
Contact Statistics By Skill And Half Hour ............................................ 399
Dialer Agent Project Summary ....................................................... 403
Dialer Project Summary ................................................................. 408
List - Agents and Skill Proficiency .................................................. 413
List- Agent Skill and Proficiencies: Yes - Just view skill proficiency totals 416
List- Agent Skill and Proficiencies: No - View totals and agent details ..... 418
List - Agents ................................................................................... 420
List - Current Campaigns and Skills ................................................ 425
List - Current Configured Stations .................................................. 429
List - Current Points of Contact by Media ....................................... 431
List - Team and Outstates (Unavailable Codes) .............................. 434
View Data Grouped By Team............................................................. 437
View Data Grouped By Unavailable Codes ........................................... 439
Max Port Utilization ........................................................................ 441
Port Utilization By Day ..................................................................... 444
Port Utilization By Half Hour .............................................................. 446
Port Utilization By Hour .................................................................... 448
Page | 8
Table of Contents
Port Utilization By Month .................................................................. 450
Windows Menu ............................................................................... 452
Chart Properties ............................................................................. 455
Frequently Asked Questions ........................................................... 463
Page | 9
Using inTouch
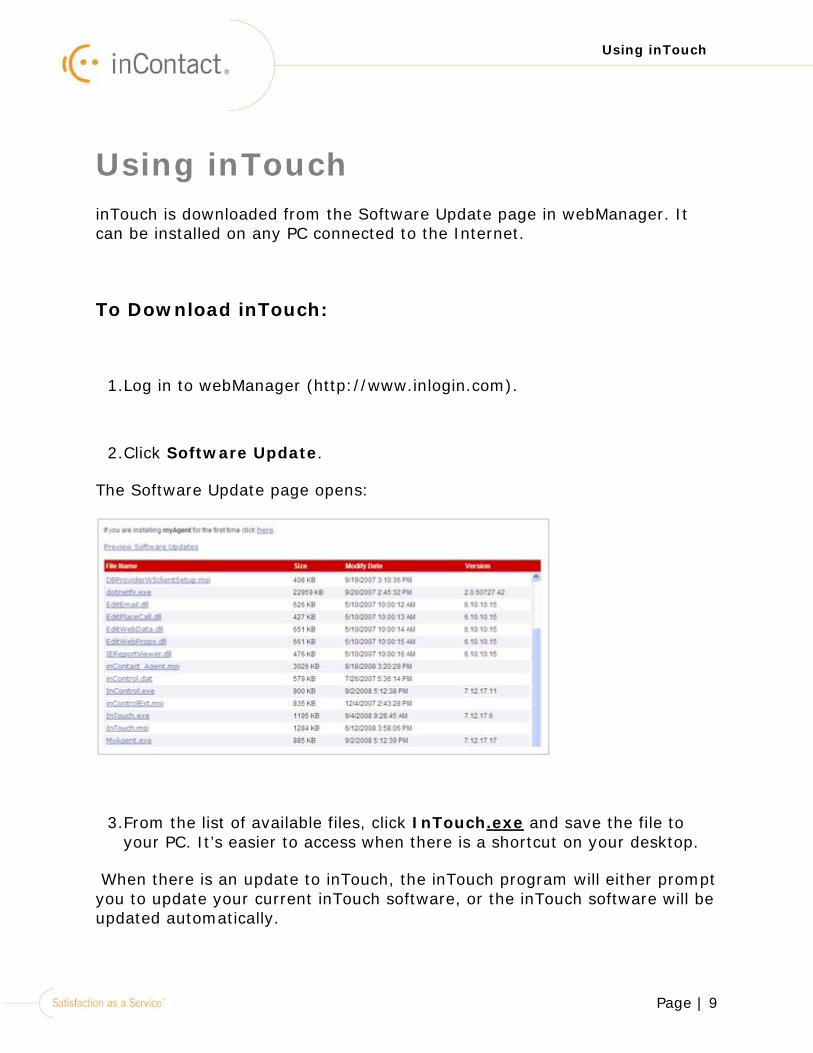
Using inTouch inTouch is downloaded from the Software Update page in webManager. It can be installed on any PC connected to the Internet.
To Download inTouch:
1.Log in to webManager (http://www.inlogin.com).
2.Click Software Update.
The Software Update page opens:
3.From the list of available files, click InTouch.exe
When there is an update to inTouch, the inTouch program will either prompt you to update your current inTouch software, or the inTouch software will be updated automatically.
and save the file to your PC. It’s easier to access when there is a shortcut on your desktop.
Page | 10
Log In
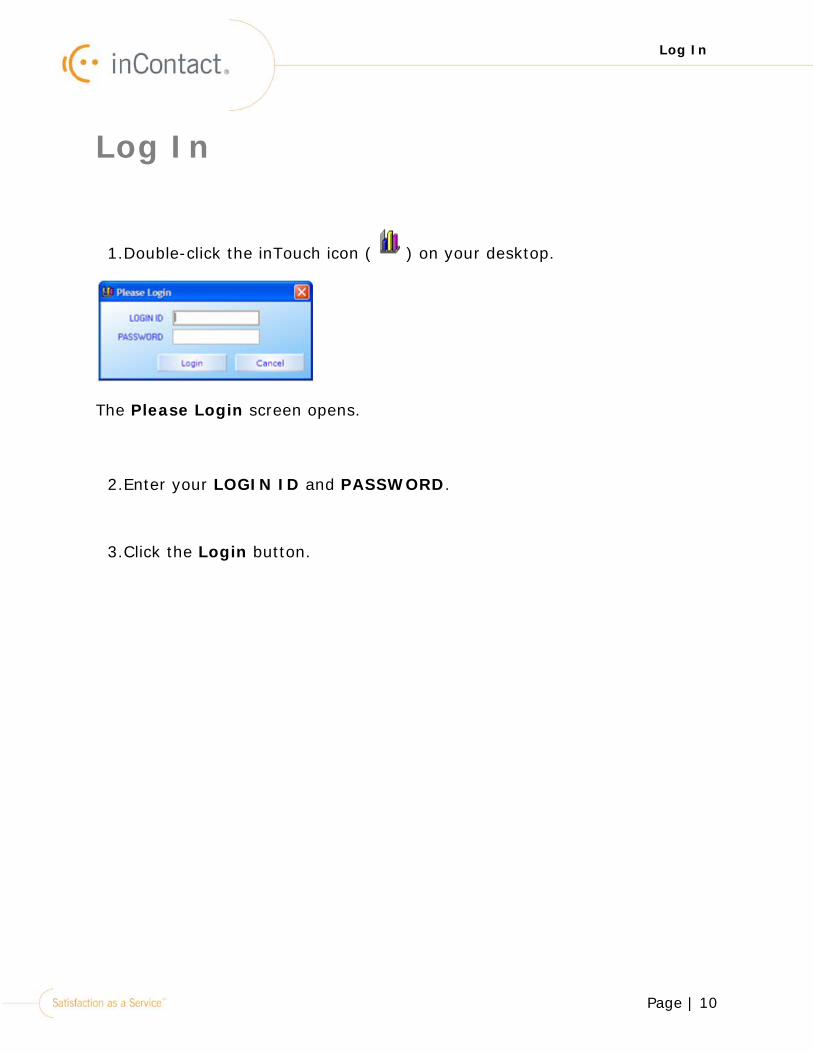
Log In
1.Double-click the inTouch icon ( ) on your desktop.
The Please Login screen opens.
2.Enter your LOGIN ID and PASSWORD.
3.Click the Login button.
Page | 11
Log In
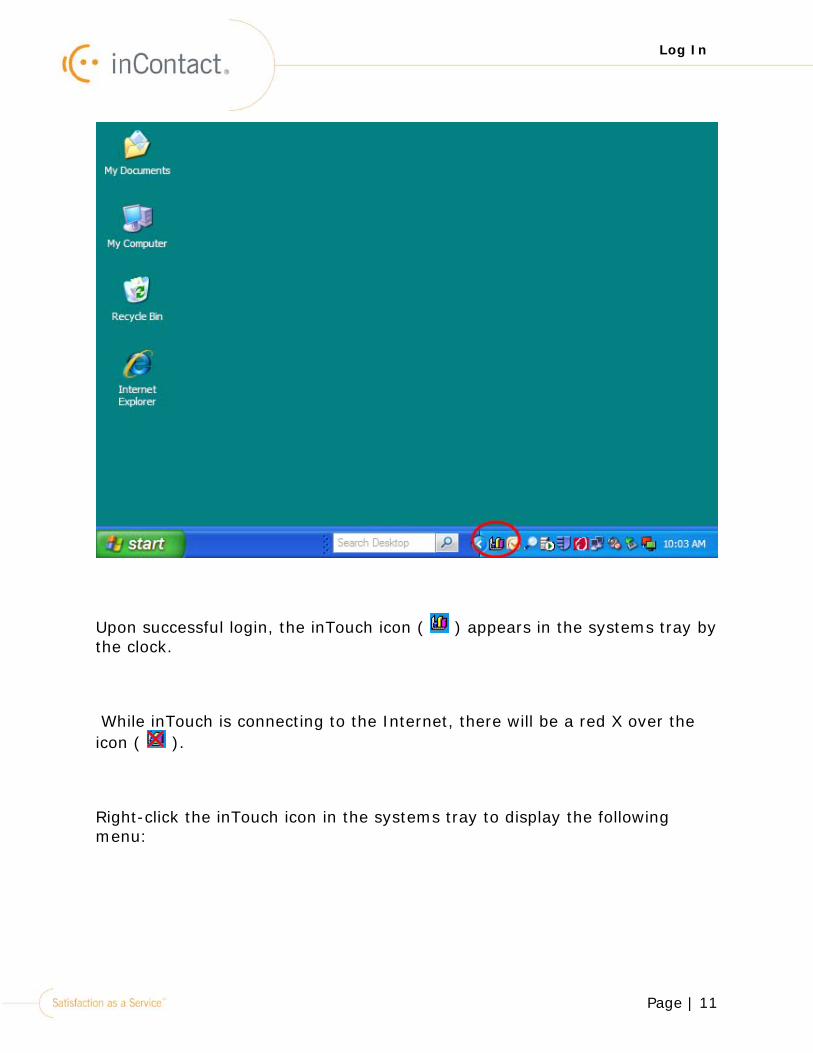
Upon successful login, the inTouch icon ( ) appears in the systems tray by the clock.
While inTouch is connecting to the Internet, there will be a red X over the icon ( ).
Right-click the inTouch icon in the systems tray to display the following menu:
Page | 12
Log In
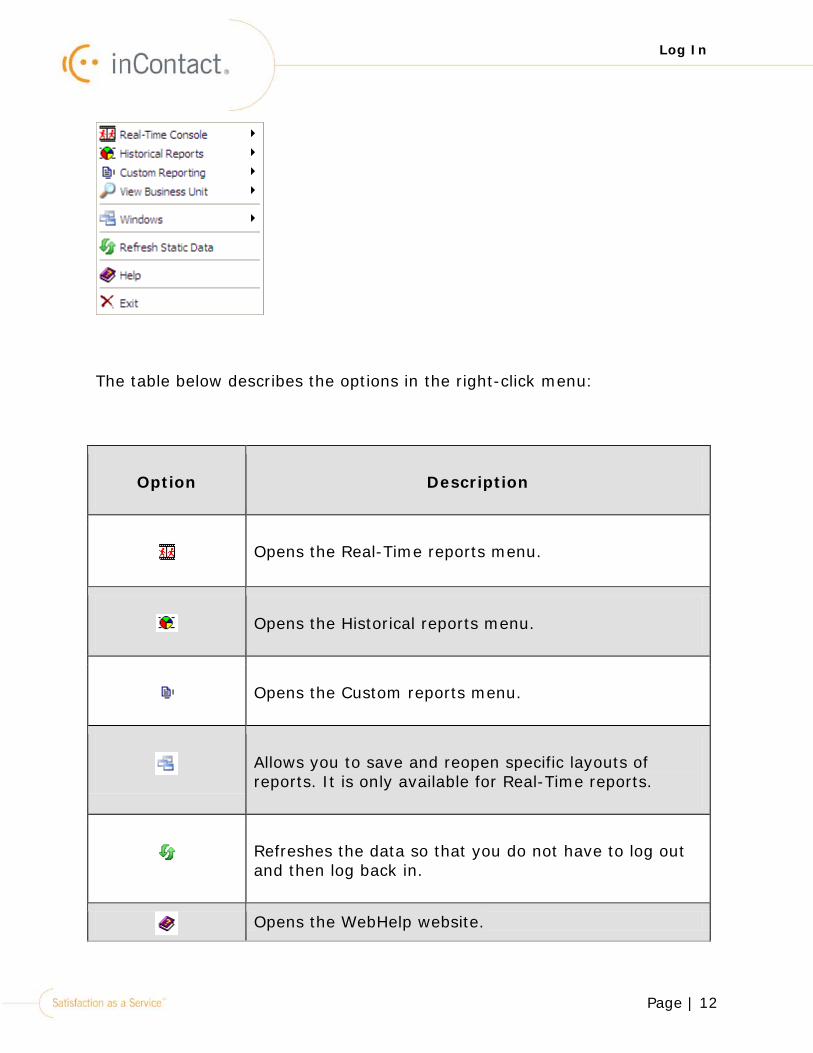
The table below describes the options in the right-click menu:
Option Description
Opens the Real-Time reports menu.
Opens the Historical reports menu.
Opens the Custom reports menu.
Allows you to save and reopen specific layouts of reports. It is only available for Real-Time reports.
Refreshes the data so that you do not have to log out and then log back in.
Opens the WebHelp website.
Page | 13
Log In
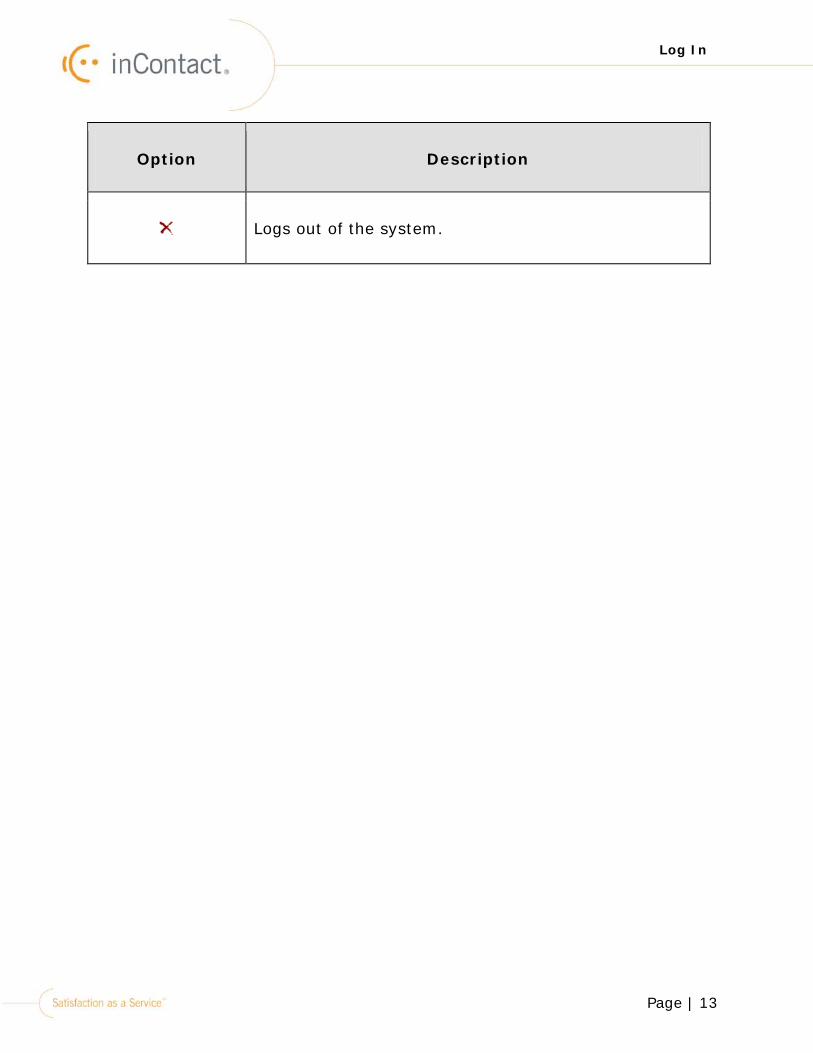
Option Description
Logs out of the system.
Page | 14
Skills
Skills inContact is a skills-based routing system. The skill of a contact can change based on the type of contact it is. The contact will be delivered to an agent who has the same skill set, i.e., phone call, email, chat, or fax.
Each skill that is created must be assigned one of four media types:
• Phone Call skill - to handle phone call contacts
•Email skill - to handle email contacts
• Chat skill - to handle chat contacts
• Fax skill - to handle fax contacts
Each skill must also be assigned either an inbound or outbound state (phone call and email skills are the skills that can be outbound). Possible skills that can be created are:
• Inbound Phone Call skill - to handle incoming phone call contacts
• Outbound Phone Call skill - to make outbound phone call contacts
• Inbound Email skill - to handle incoming email contacts
• Outbound Email skill - to send outbound email contacts
Page | 15
Skills
• Inbound Chat skill - to handle incoming chat contacts
• Inbound Fax skill - to handle fax contacts
Depending on the information you need, this report generates data for:
•Campaigns
•Skills
Page | 16
Campaigns
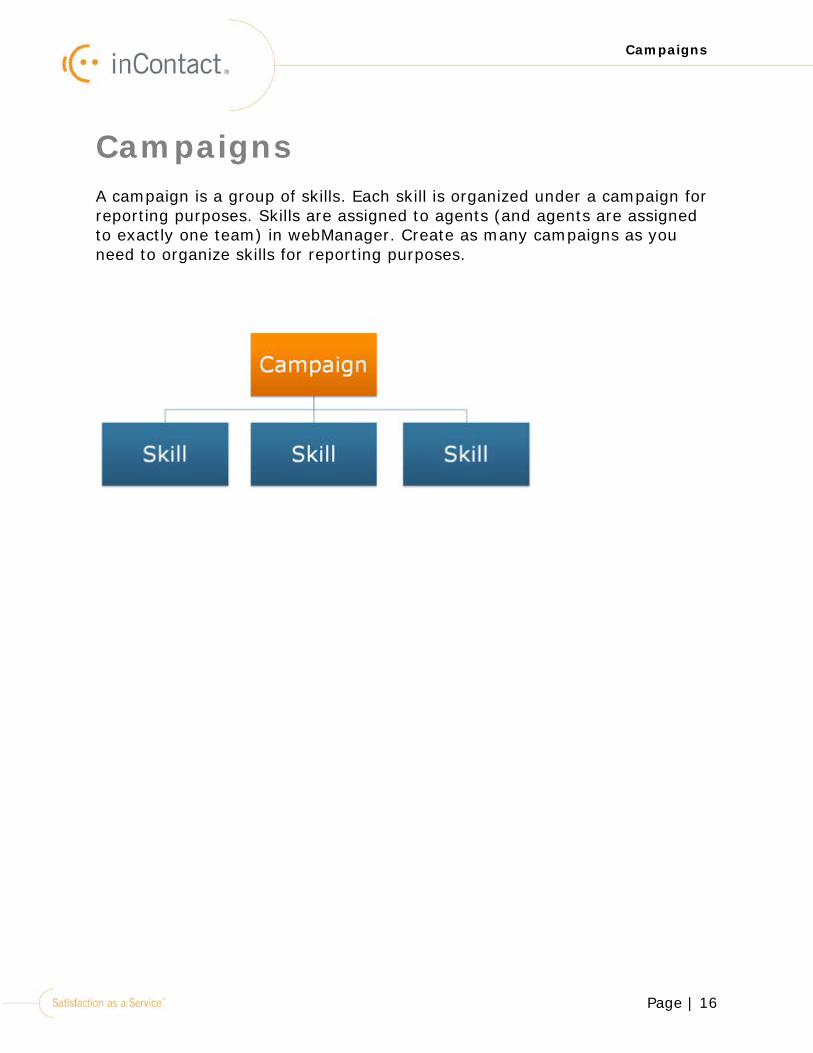
Campaigns A campaign is a group of skills. Each skill is organized under a campaign for reporting purposes. Skills are assigned to agents (and agents are assigned to exactly one team) in webManager. Create as many campaigns as you need to organize skills for reporting purposes.
Page | 17
Real-Time Reports
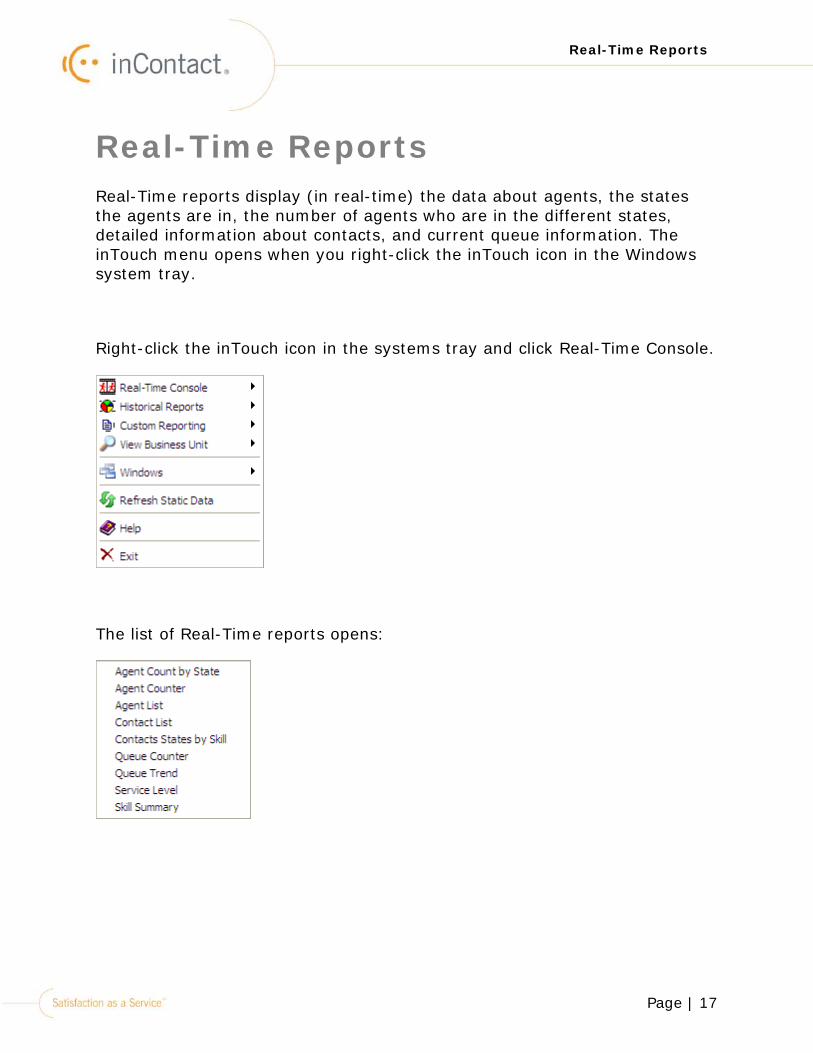
Real-Time Reports Real-Time reports display (in real-time) the data about agents, the states the agents are in, the number of agents who are in the different states, detailed information about contacts, and current queue information. The inTouch menu opens when you right-click the inTouch icon in the Windows system tray.
Right-click the inTouch icon in the systems tray and click Real-Time Console.
The list of Real-Time reports opens:

Page | 18
Agent Count by State
Agent Count by State
The Agent Count by State report shows the number of agents who are currently logged in to myAgent. The exact number of agents in each state is displayed at the top of each bar:
1.Right-click the icon in the systems tray.
2.Select Real-Time Console > Agent Count by State.
The Agent Count by State report opens:
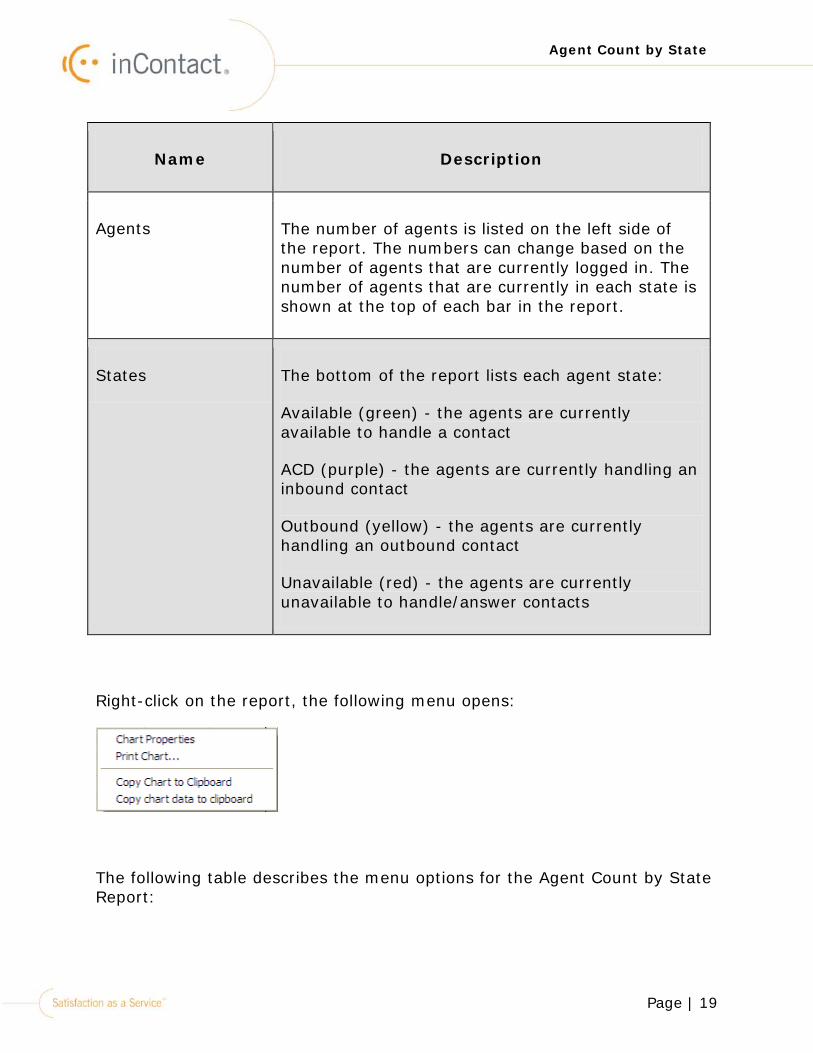
The following table describes the data in the Agent Count by State report:
Name Description
Page | 19
Agent Count by State
Name Description
Agents The number of agents is listed on the left side of the report. The numbers can change based on the number of agents that are currently logged in. The number of agents that are currently in each state is shown at the top of each bar in the report.
States The bottom of the report lists each agent state:
Available (green) - the agents are currently available to handle a contact
ACD (purple) - the agents are currently handling an inbound contact
Outbound (yellow) - the agents are currently handling an outbound contact
Unavailable (red) - the agents are currently unavailable to handle/answer contacts
Right-click on the report, the following menu opens:
The following table describes the menu options for the Agent Count by State Report:
Page | 20
Agent Count by State
Menu Item Description
Chart Properties The default chart type for this report is the pie chart. If this chart type does not generate the data you want to view, you can change the chart type for a session. For more information, See "Chart Properties" on page 455.
Print Chart Selecting this option opens a screen where you can specify what you want printed. This screen also prints the chart directly to the default printer configured for your computer.
Copy chart to clipboard
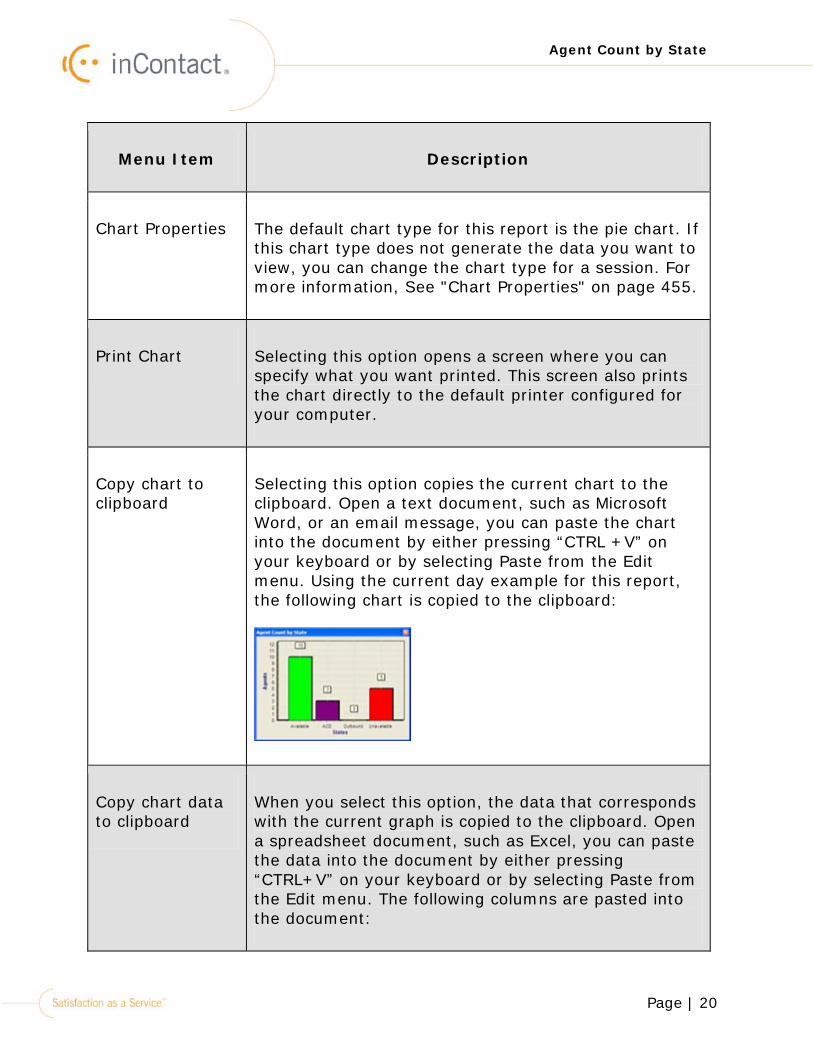
Selecting this option copies the current chart to the clipboard. Open a text document, such as Microsoft Word, or an email message, you can paste the chart into the document by either pressing “CTRL +V” on your keyboard or by selecting Paste from the Edit menu. Using the current day example for this report, the following chart is copied to the clipboard:
Copy chart data to clipboard
When you select this option, the data that corresponds with the current graph is copied to the clipboard. Open a spreadsheet document, such as Excel, you can paste the data into the document by either pressing “CTRL+V” on your keyboard or by selecting Paste from the Edit menu. The following columns are pasted into the document:
Page | 21
Agent Count by State
Menu Item Description
Page | 22
Agent Counter
Agent Counter
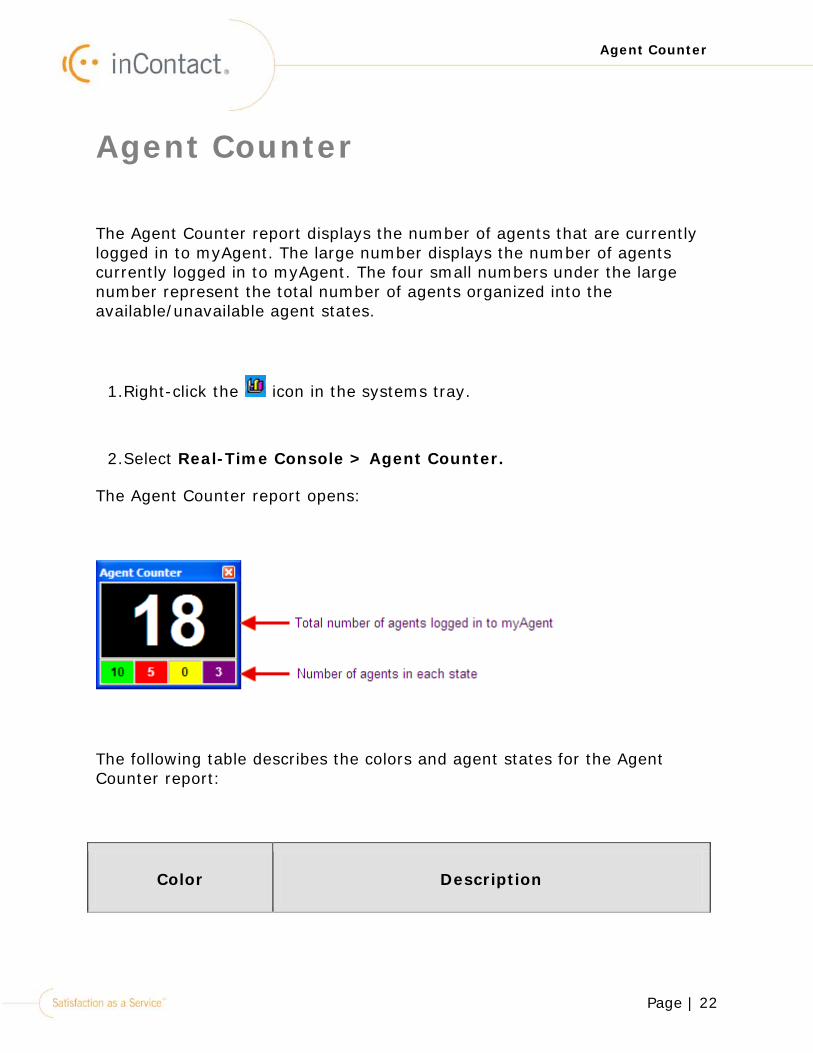
The Agent Counter report displays the number of agents that are currently logged in to myAgent. The large number displays the number of agents currently logged in to myAgent. The four small numbers under the large number represent the total number of agents organized into the available/unavailable agent states.
1.Right-click the icon in the systems tray.
2.Select Real-Time Console > Agent Counter.
The Agent Counter report opens:
The following table describes the colors and agent states for the Agent Counter report:
Color Description
Page | 23
Agent Counter
Color Description
Green The number of agents who are in an available state.
Red The number of agents who are in an unavailable state.
Yellow The number of agents who are in an outbound state.
Purple The number of agents who are in an ACD (Inbound) state.
The report properties are used to select filters for specific data to be generated.
Page | 24
Agent Counter
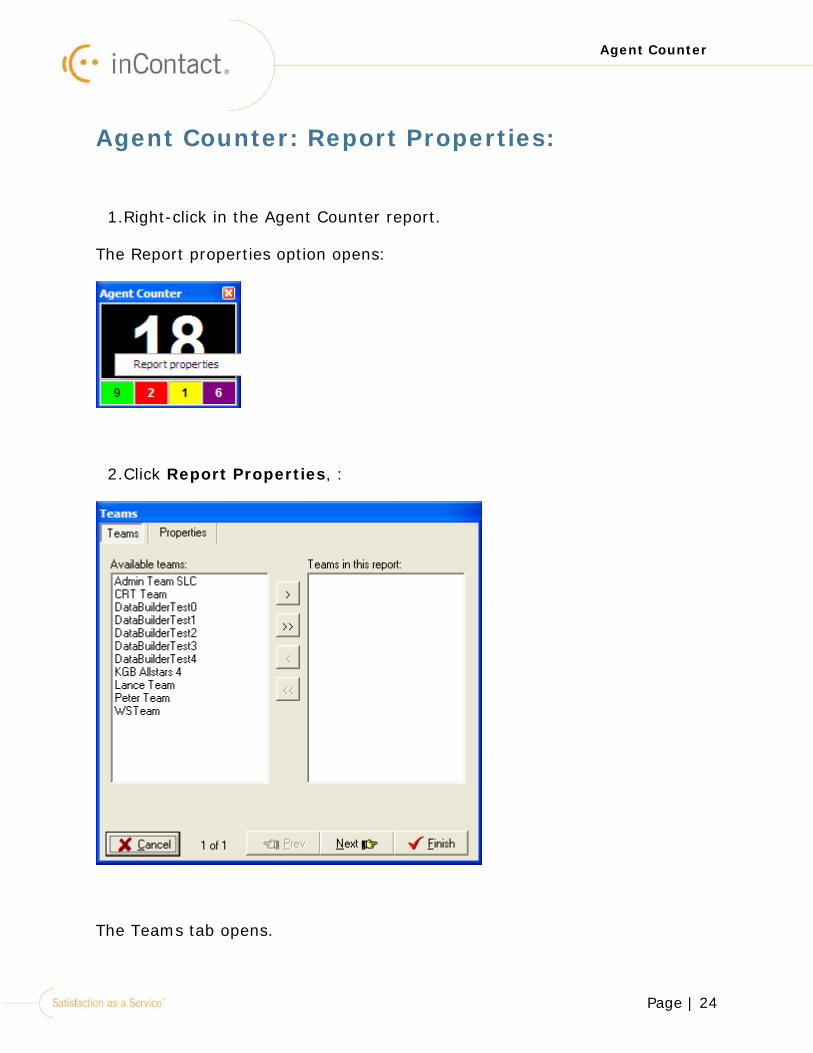
Agent Counter: Report Properties:
1.Right-click in the Agent Counter report.
The Report properties option opens:
2.Click Report Properties, :
The Teams tab opens.
Page | 25
Agent Counter
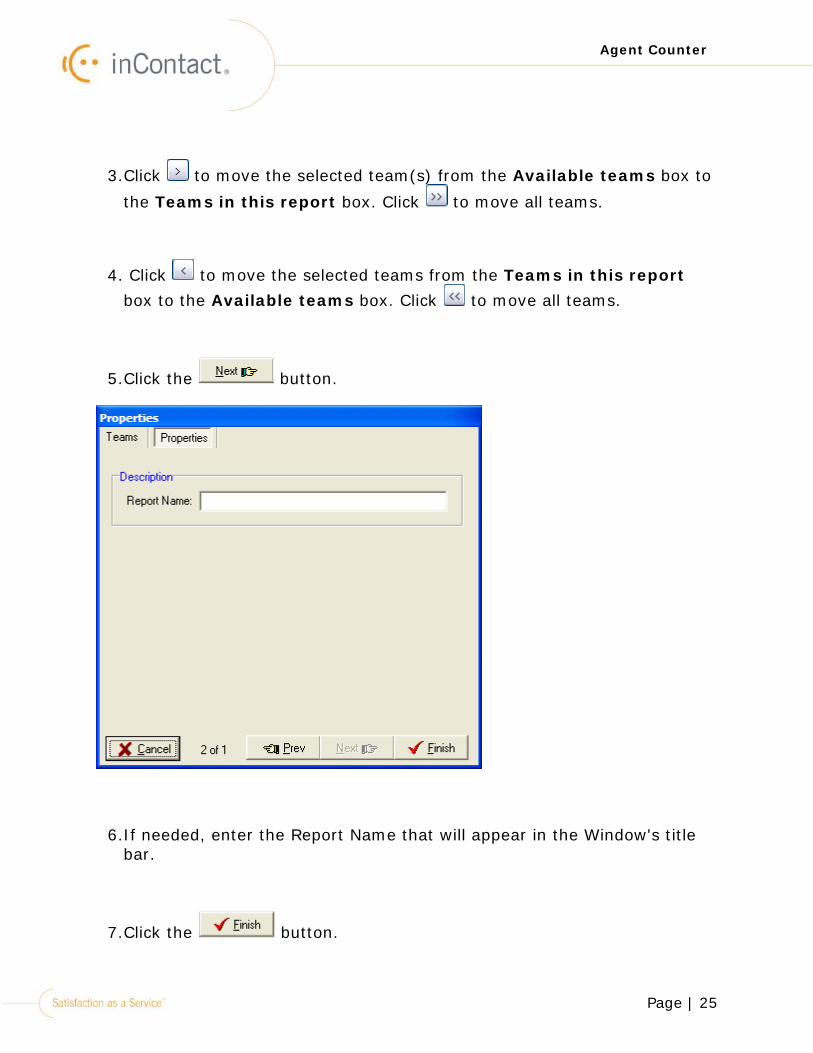
3.Click to move the selected team(s) from the Available teams box to
the Teams in this report box. Click to move all teams.
4. Click to move the selected teams from the Teams in this report box to the Available teams box. Click to move all teams.
5.Click the button.
6.If needed, enter the Report Name that will appear in the Window's title bar.
7.Click the button.
Page | 26
Agent Counter
Agents currently logged into myAgent who belong to the selected teams will be displayed in the Agent Counter report.
Page | 27
Agent List
Agent List
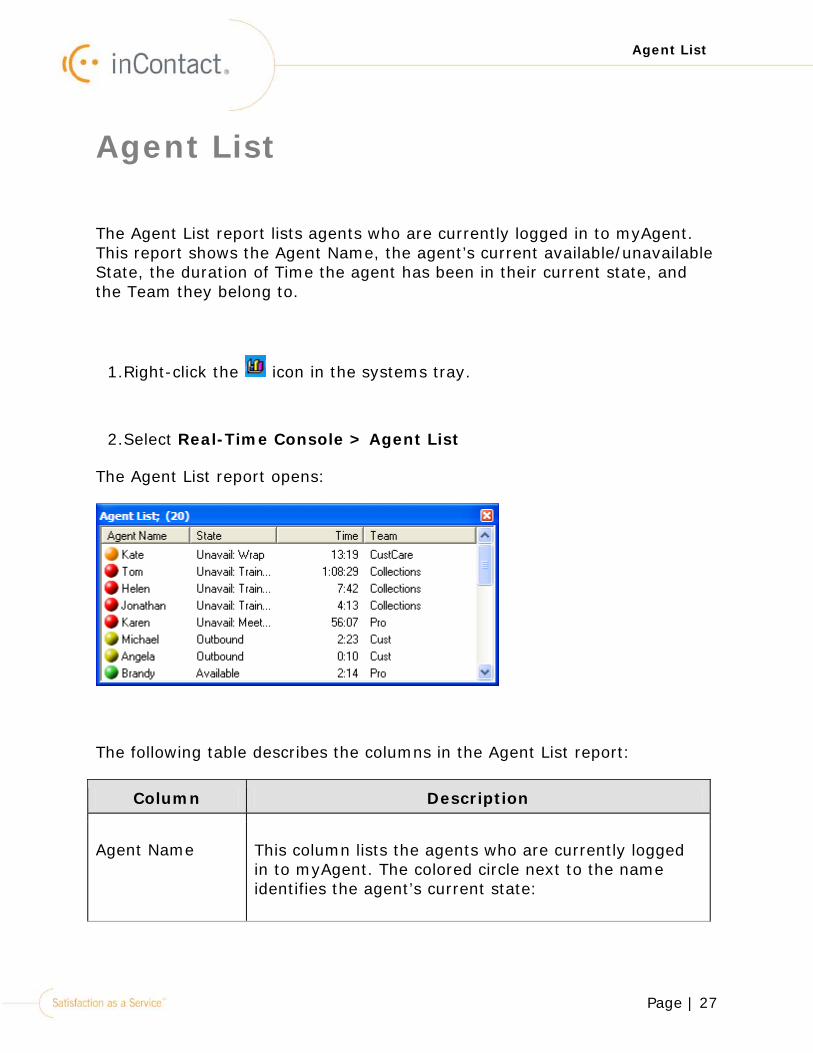
The Agent List report lists agents who are currently logged in to myAgent. This report shows the Agent Name, the agent’s current available/unavailable State, the duration of Time the agent has been in their current state, and the Team they belong to.
1.Right-click the icon in the systems tray.
2.Select Real-Time Console > Agent List
The Agent List report opens:
The following table describes the columns in the Agent List report:
Column Description
Agent Name This column lists the agents who are currently logged in to myAgent. The colored circle next to the name identifies the agent’s current state:
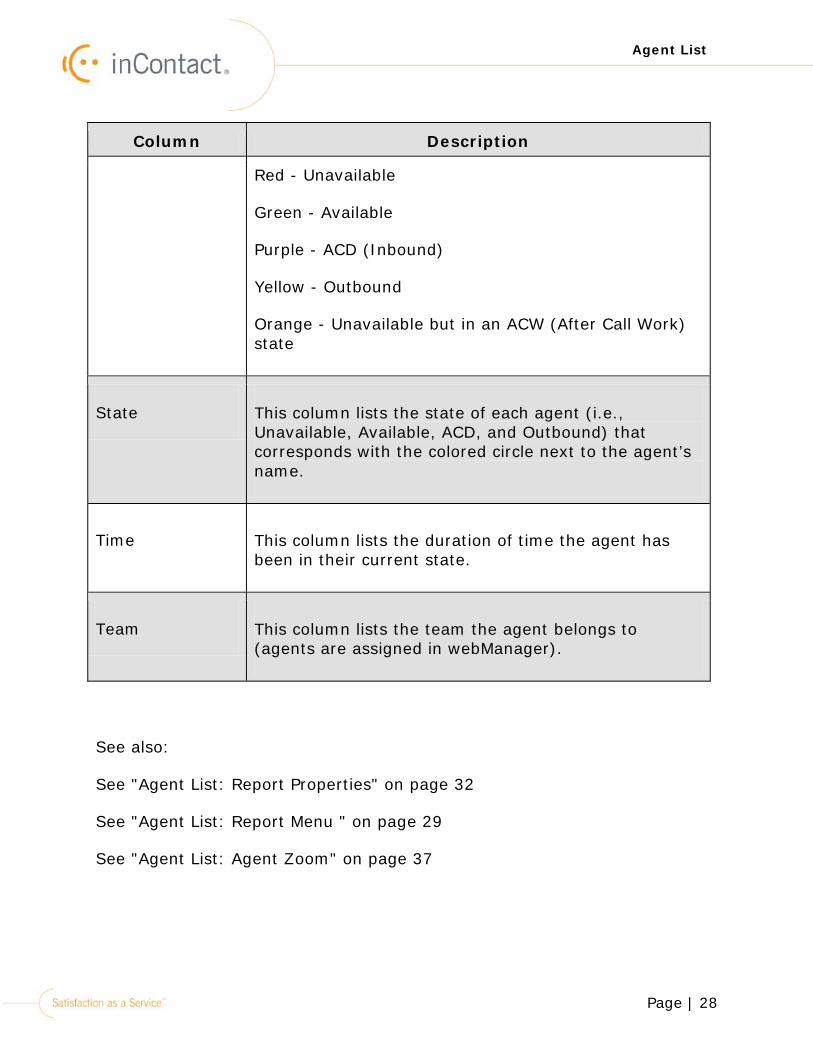
Page | 28
Agent List
Column Description
Red - Unavailable
Green - Available
Purple - ACD (Inbound)
Yellow - Outbound
Orange - Unavailable but in an ACW (After Call Work) state
State This column lists the state of each agent (i.e., Unavailable, Available, ACD, and Outbound) that corresponds with the colored circle next to the agent’s name.
Time This column lists the duration of time the agent has been in their current state.
Team This column lists the team the agent belongs to (agents are assigned in webManager).
See also:
See "Agent List: Report Properties" on page 32
See "Agent List: Report Menu " on page 29
See "Agent List: Agent Zoom" on page 37
Page | 29
Agent List
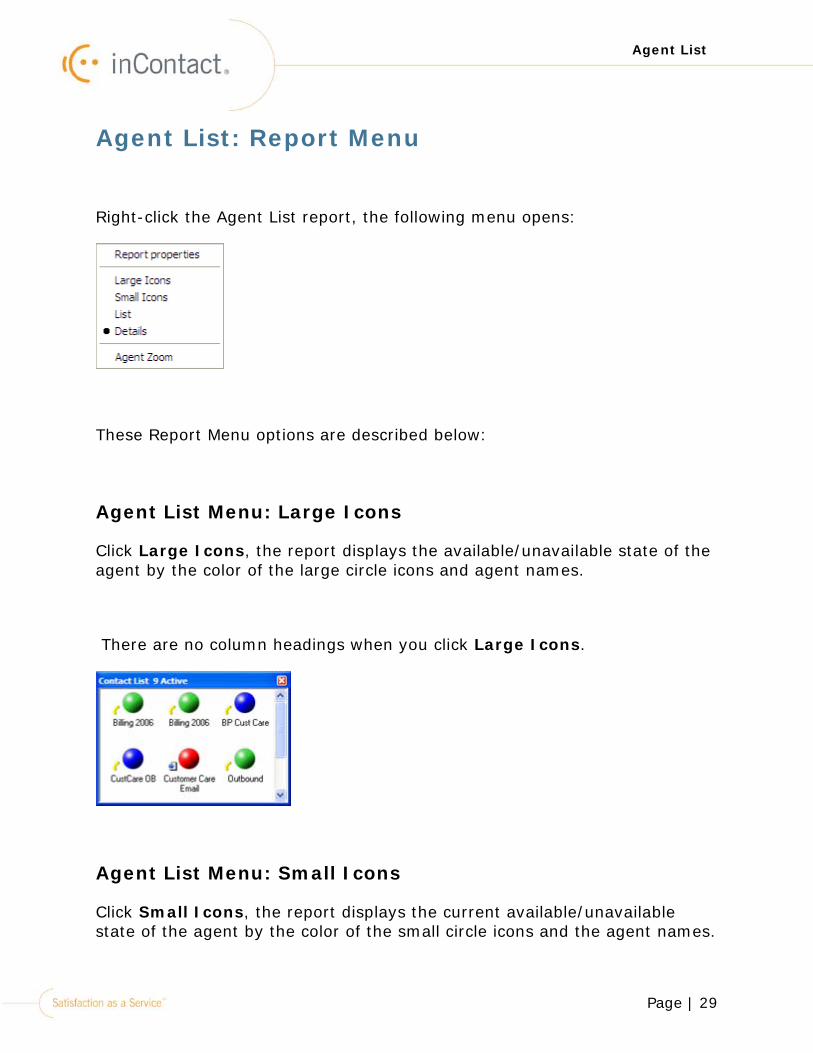
Agent List: Report Menu
Right-click the Agent List report, the following menu opens:
These Report Menu options are described below:
Agent List Menu: Large Icons
Click Large Icons, the report displays the available/unavailable state of the agent by the color of the large circle icons and agent names.
There are no column headings when you click Large Icons.
Agent List Menu: Small Icons
Click Small Icons, the report displays the current available/unavailable state of the agent by the color of the small circle icons and the agent names.
Page | 30
Agent List
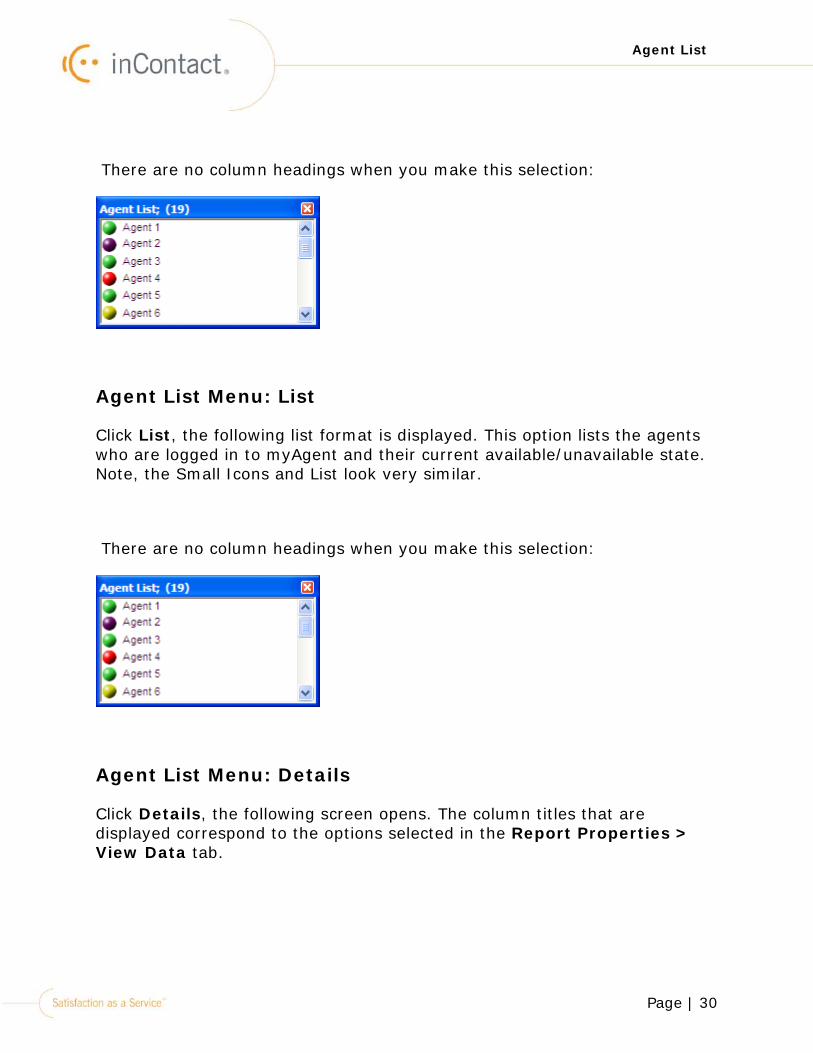
There are no column headings when you make this selection:
Agent List Menu: List
Click List, the following list format is displayed. This option lists the agents who are logged in to myAgent and their current available/unavailable state. Note, the Small Icons and List look very similar.
There are no column headings when you make this selection:
Agent List Menu: Details
Click Details, the following screen opens. The column titles that are displayed correspond to the options selected in the Report Properties > View Data tab.
Page | 31
Agent List
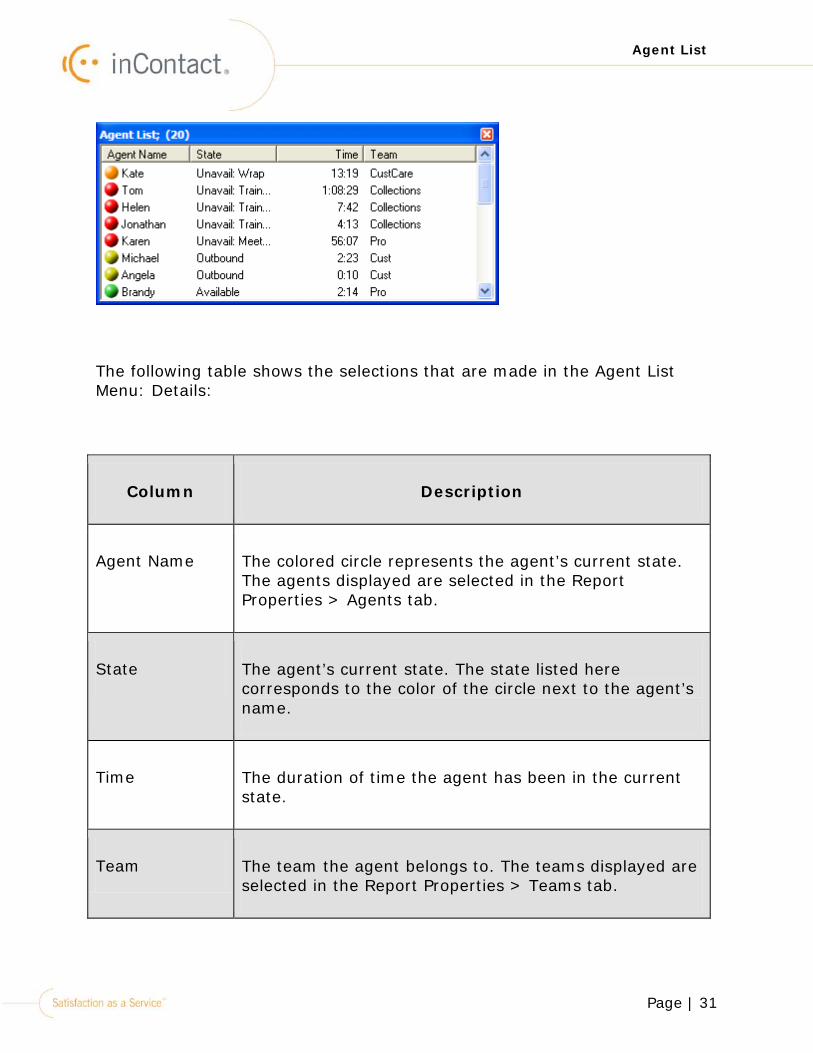
The following table shows the selections that are made in the Agent List Menu: Details:
Column Description
Agent Name The colored circle represents the agent’s current state. The agents displayed are selected in the Report Properties > Agents tab.
State The agent’s current state. The state listed here corresponds to the color of the circle next to the agent’s name.
Time The duration of time the agent has been in the current state.
Team The team the agent belongs to. The teams displayed are selected in the Report Properties > Teams tab.
Page | 32
Agent List
Agent List: Report Properties
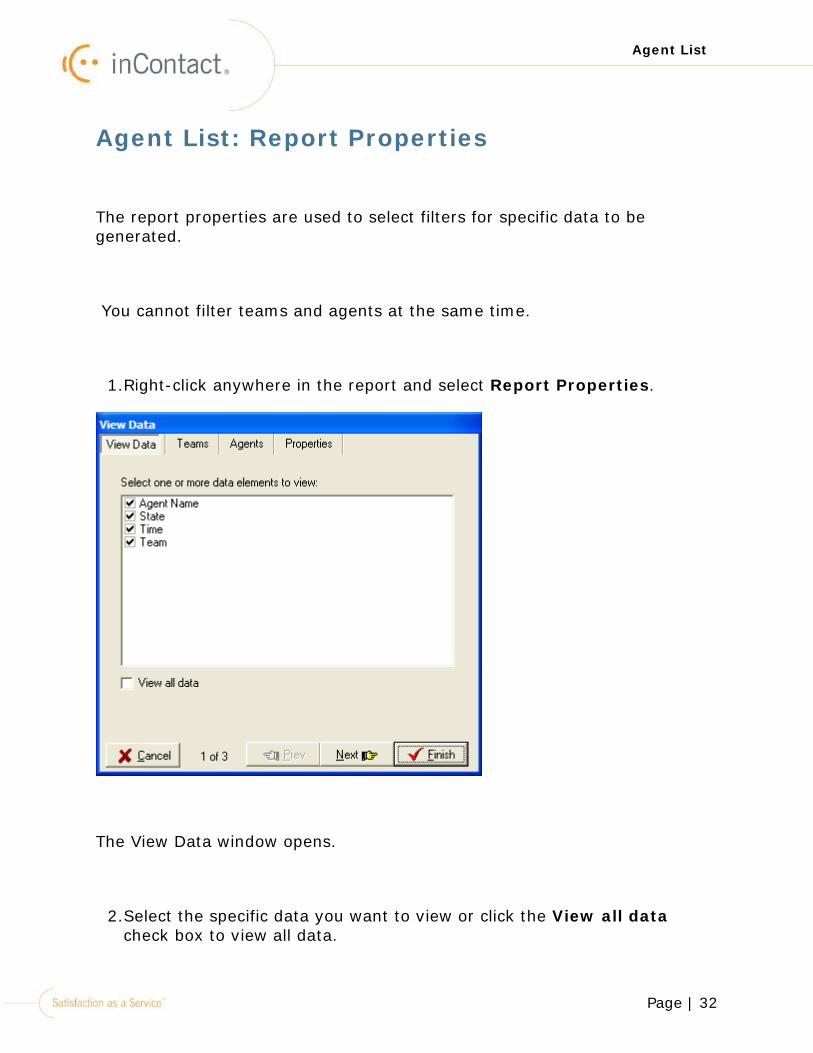
The report properties are used to select filters for specific data to be generated.
You cannot filter teams and agents at the same time.
1.Right-click anywhere in the report and select Report Properties.
The View Data window opens.
2.Select the specific data you want to view or click the View all data check box to view all data.
Page | 33
Agent List
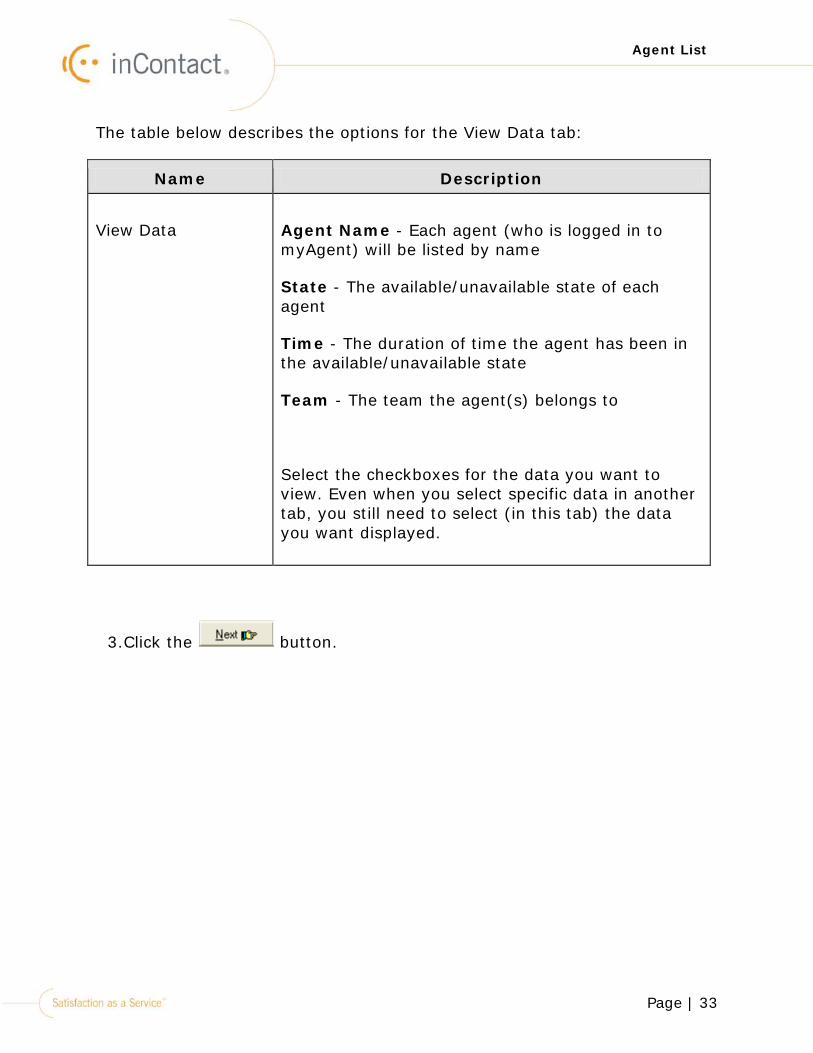
The table below describes the options for the View Data tab:
Name Description
View Data Agent Name - Each agent (who is logged in to myAgent) will be listed by name
State - The available/unavailable state of each agent
Time - The duration of time the agent has been in the available/unavailable state
Team - The team the agent(s) belongs to
Select the checkboxes for the data you want to view. Even when you select specific data in another tab, you still need to select (in this tab) the data you want displayed.
3.Click the button.
Page | 34
Agent List
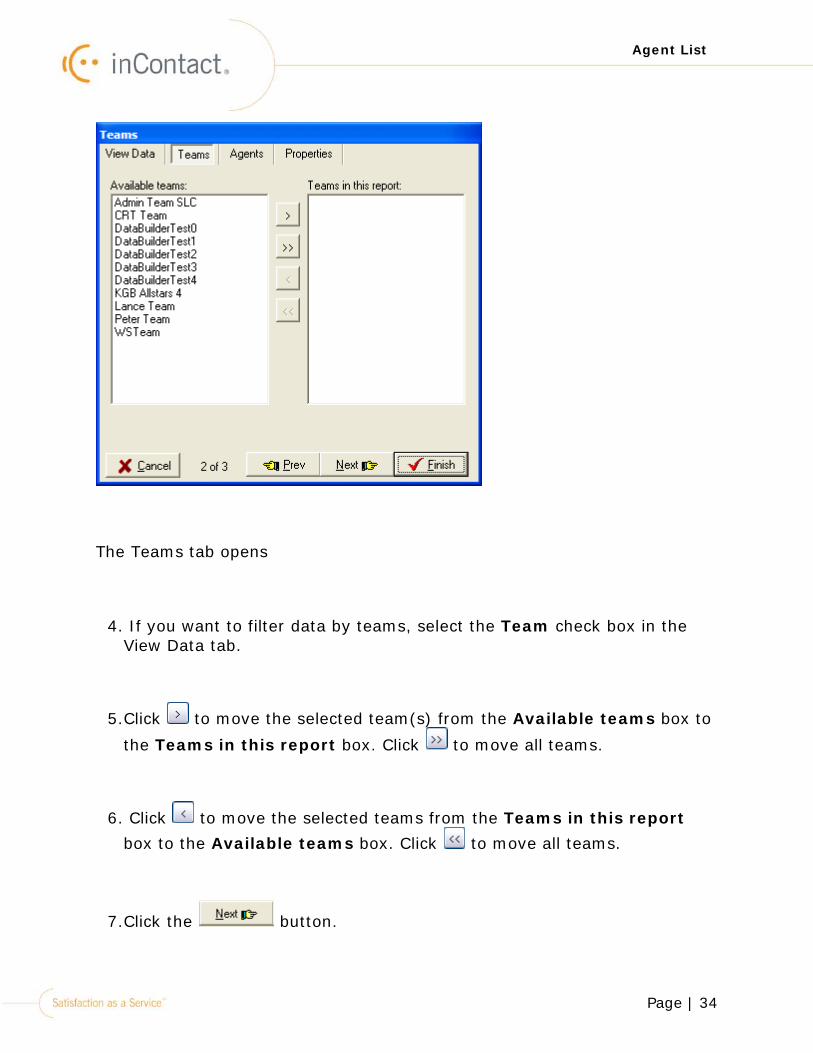
The Teams tab opens
4. If you want to filter data by teams, select the Team check box in the View Data tab.
5.Click to move the selected team(s) from the Available teams box to
the Teams in this report box. Click to move all teams.
6. Click to move the selected teams from the Teams in this report box to the Available teams box. Click to move all teams.
7.Click the button.
Page | 35
Agent List
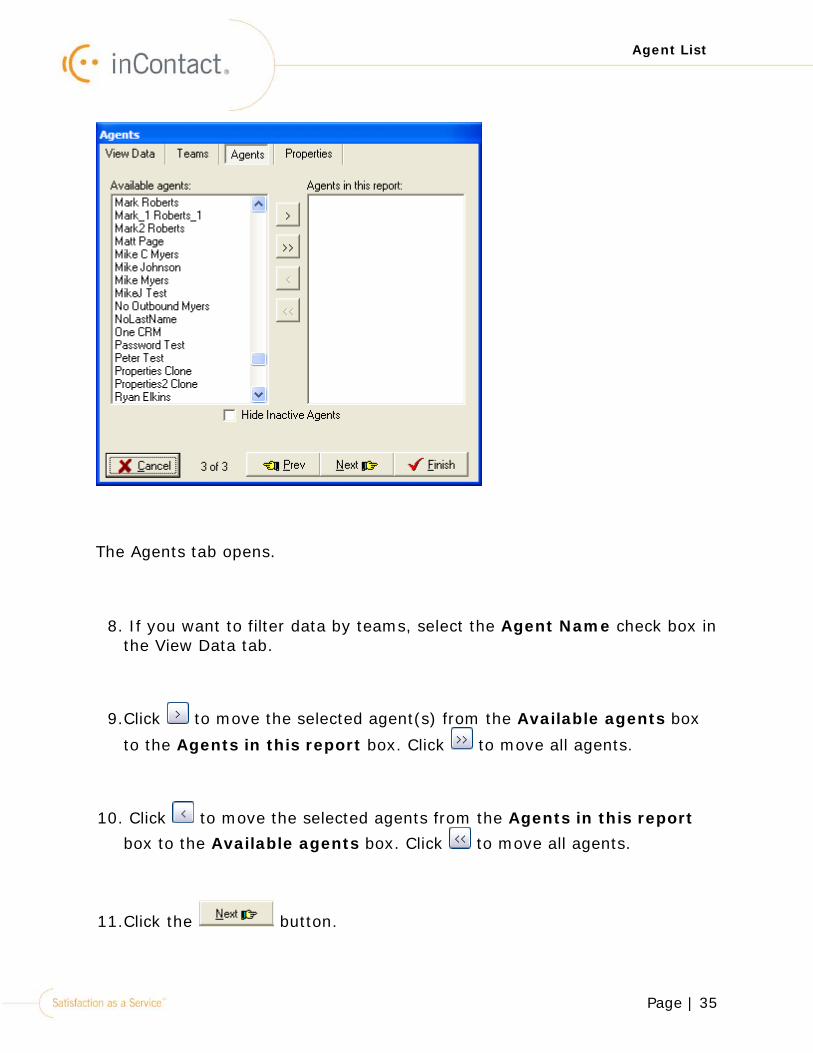
The Agents tab opens.
8. If you want to filter data by teams, select the Agent Name check box in the View Data tab.
9.Click to move the selected agent(s) from the Available agents box
to the Agents in this report box. Click to move all agents.
10. Click to move the selected agents from the Agents in this report box to the Available agents box. Click to move all agents.
11.Click the button.
Page | 36
Agent List
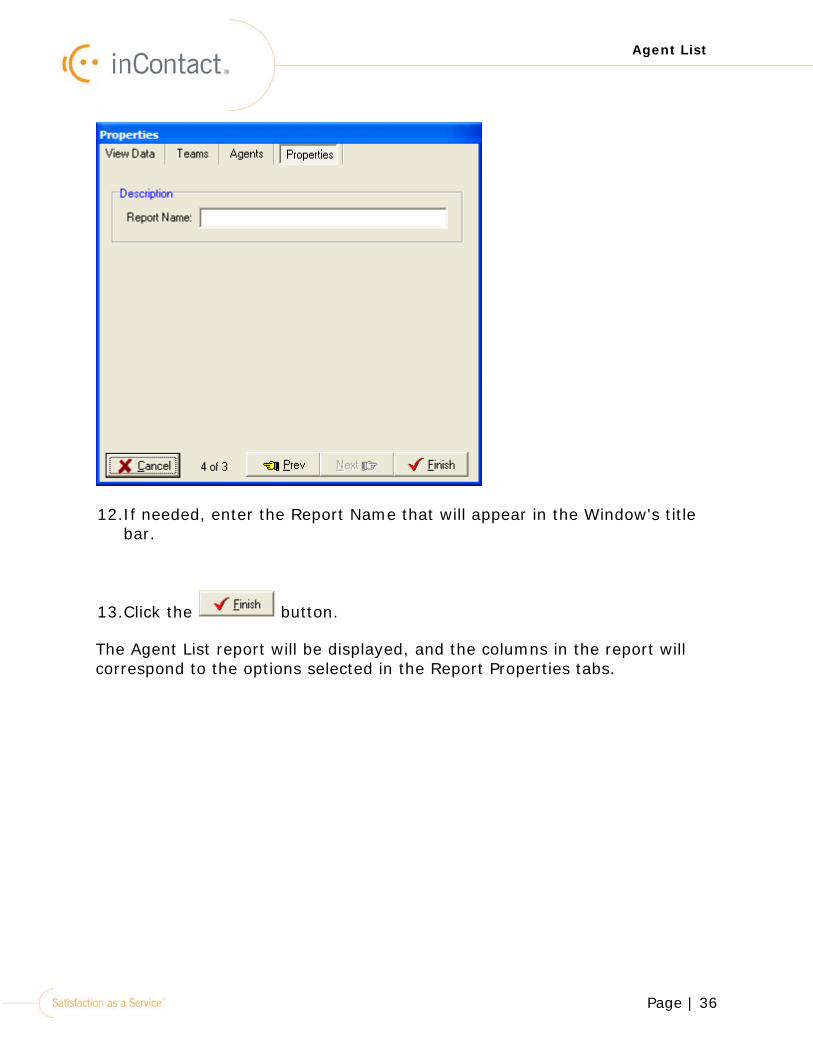
12.If needed, enter the Report Name that will appear in the Window's title bar.
13.Click the button.
The Agent List report will be displayed, and the columns in the report will correspond to the options selected in the Report Properties tabs.
Page | 37
Agent List
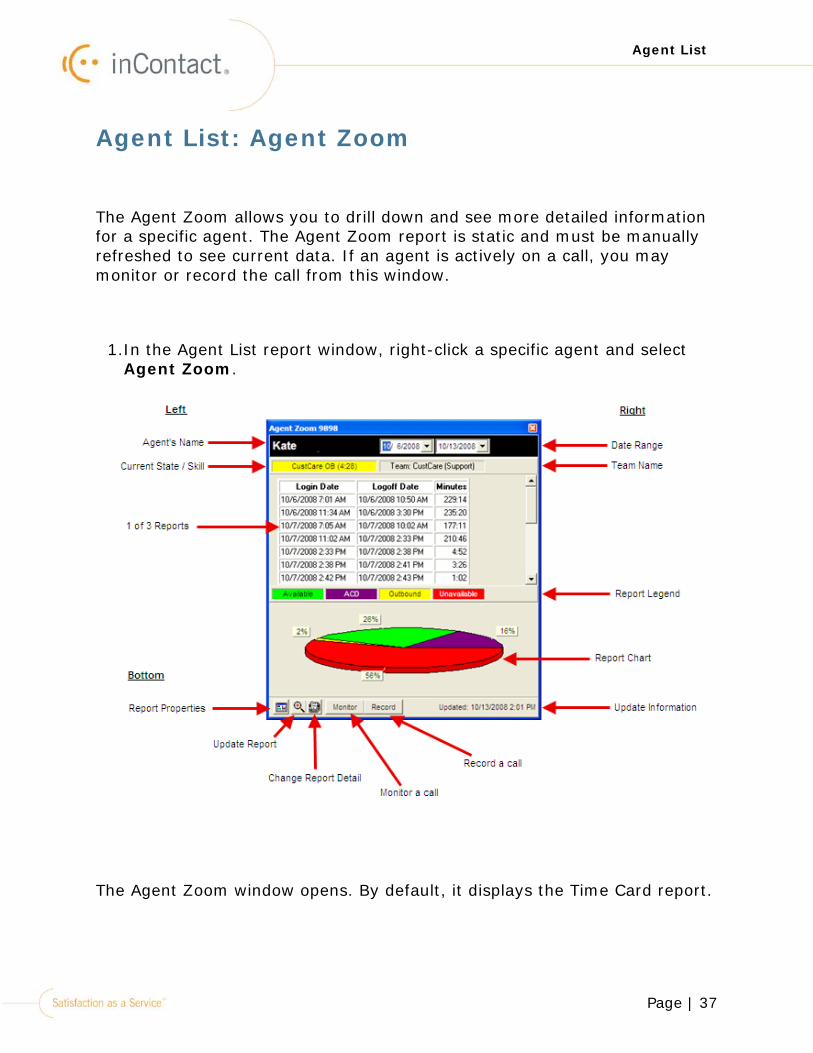
Agent List: Agent Zoom
The Agent Zoom allows you to drill down and see more detailed information for a specific agent. The Agent Zoom report is static and must be manually refreshed to see current data. If an agent is actively on a call, you may monitor or record the call from this window.
1.In the Agent List report window, right-click a specific agent and select Agent Zoom.
The Agent Zoom window opens. By default, it displays the Time Card report.
Page | 38
Agent List
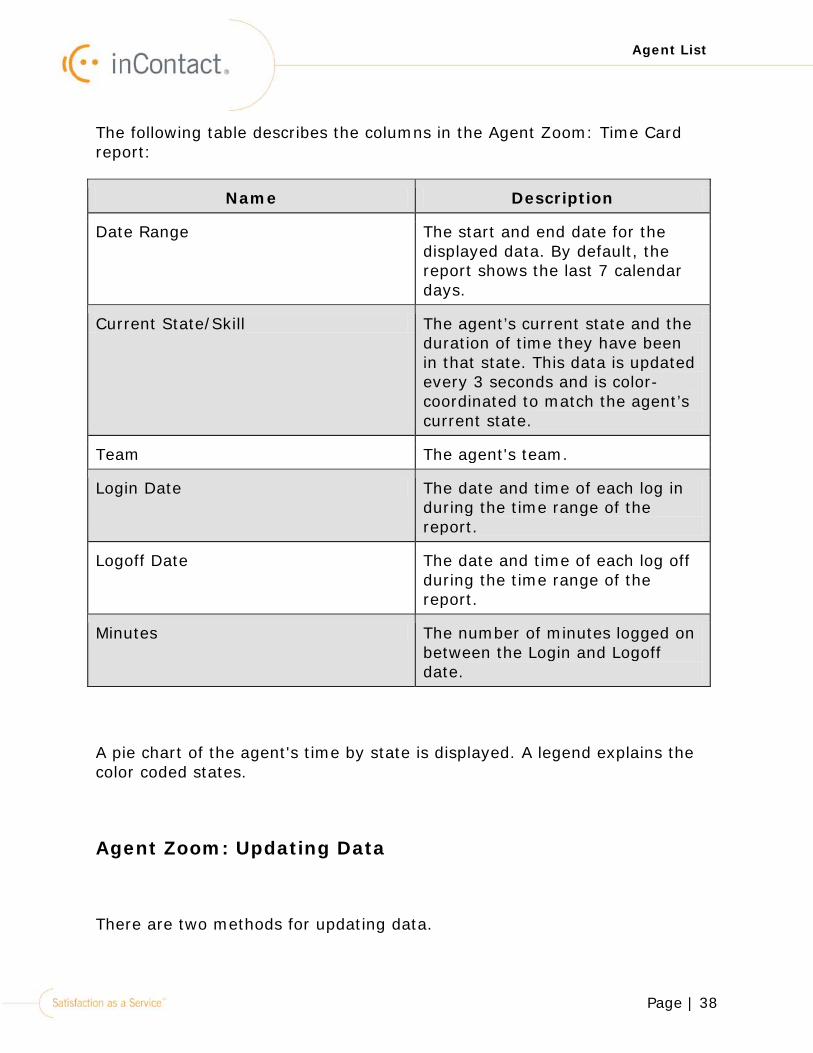
The following table describes the columns in the Agent Zoom: Time Card report:
Name Description
Date Range The start and end date for the displayed data. By default, the report shows the last 7 calendar days.
Current State/Skill The agent’s current state and the duration of time they have been in that state. This data is updated every 3 seconds and is color-coordinated to match the agent’s current state.
Team The agent's team.
Login Date The date and time of each log in during the time range of the report.
Logoff Date The date and time of each log off during the time range of the report.
Minutes The number of minutes logged on between the Login and Logoff date.
A pie chart of the agent's time by state is displayed. A legend explains the color coded states.
Agent Zoom: Updating Data
There are two methods for updating data.
Page | 39
Agent List
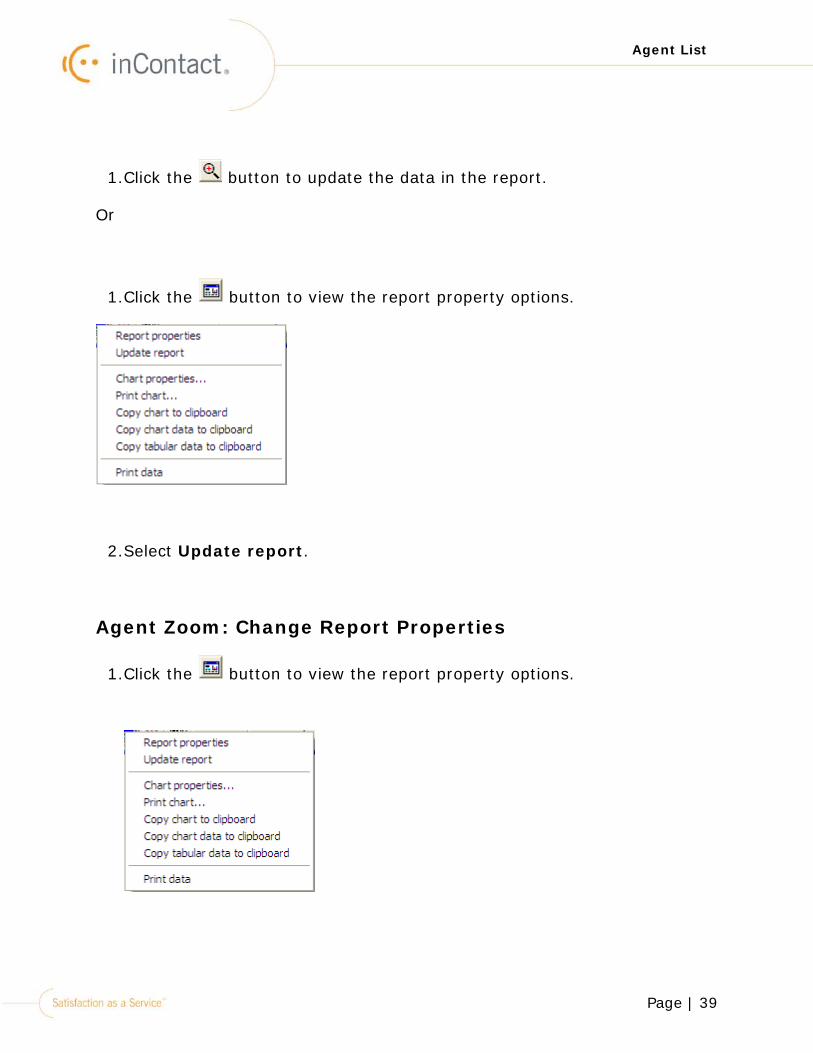
1.Click the button to update the data in the report.
Or
1.Click the button to view the report property options.
2.Select Update report.
Agent Zoom: Change Report Properties
1.Click the button to view the report property options.
Page | 40
Agent List
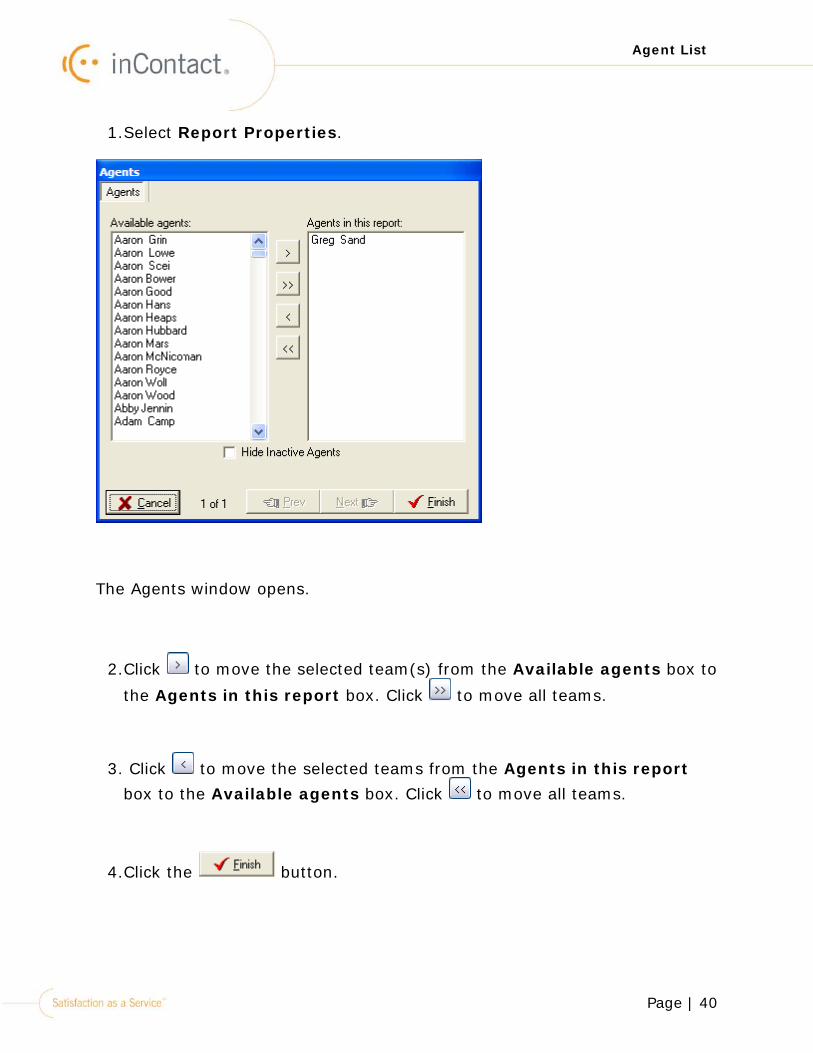
1.Select Report Properties.
The Agents window opens.
2.Click to move the selected team(s) from the Available agents box to
the Agents in this report box. Click to move all teams.
3. Click to move the selected teams from the Agents in this report box to the Available agents box. Click to move all teams.
4.Click the button.

Page | 41
Agent List
Agent List: Agent Zoom - Change Report Detail
Three reports are available in the Agent Zoom window: Time Card, State log and State Summary. The data will appear in the table and the pie chart. The default report is Time Card.
1.In the Agent Zoom window, click the button.
Page | 42
Agent List
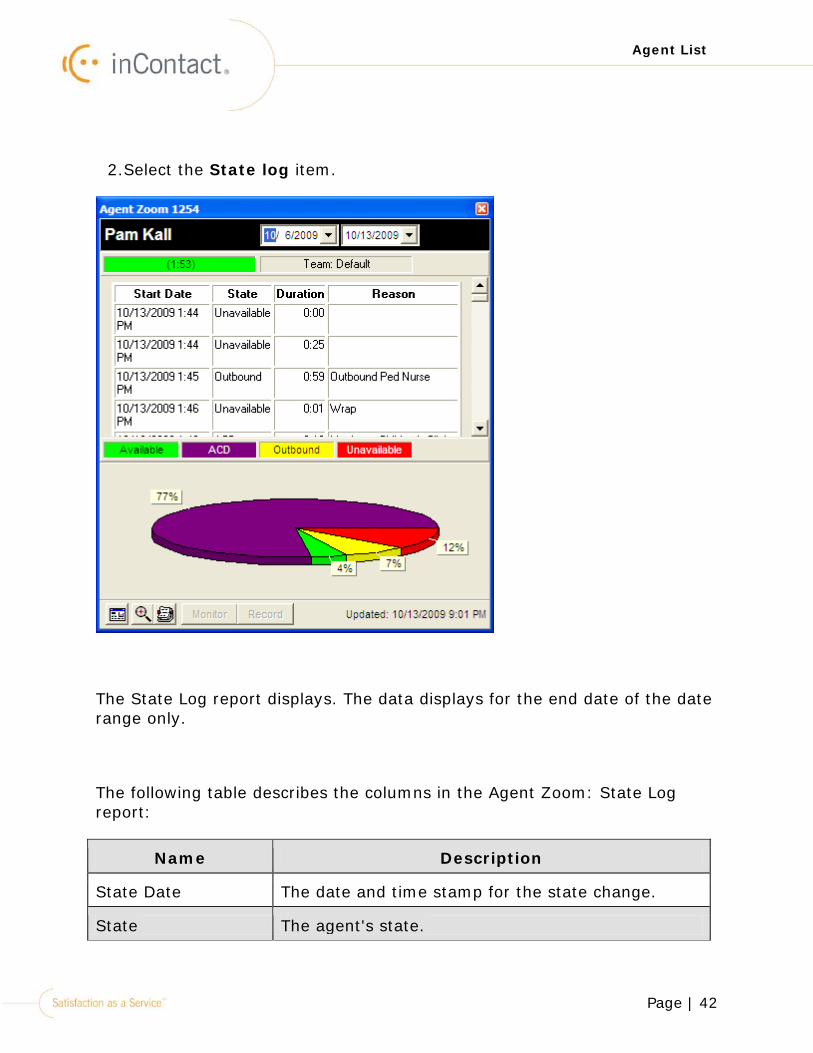
2.Select the State log item.
The State Log report displays. The data displays for the end date of the date range only.
The following table describes the columns in the Agent Zoom: State Log report:
Name Description
State Date The date and time stamp for the state change.
State The agent's state.
Page | 43
Agent List
Name Description
Duration The duration of the state in minutes and seconds.
Reason The state reason, also known as reason code. These codes are customized for your team and are a more detailed explanation of the unavailable state.
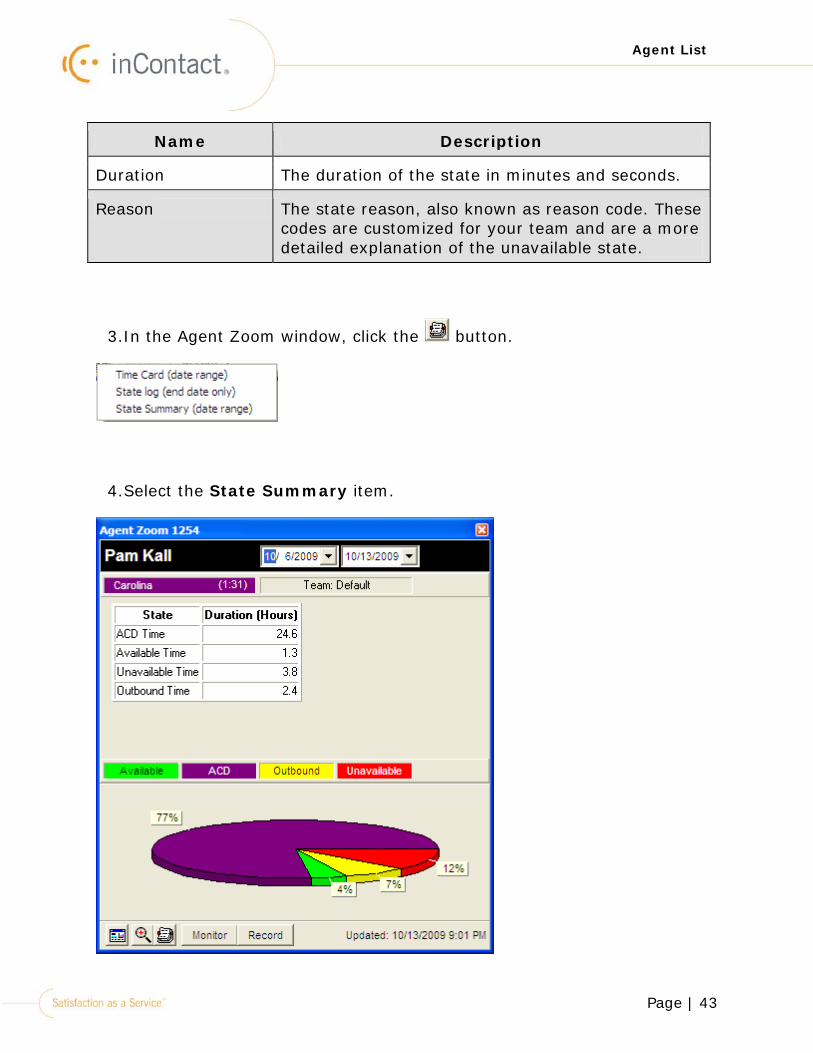
3.In the Agent Zoom window, click the button.
4.Select the State Summary item.
Page | 44
Agent List
The State Summary report displays. The data displays for the date range.
The following table describes the columns in the Agent Zoom: State Summary report:
Name Description
State The different states the agent has been in during the date range.
Duration The duration in hours of each state in the date range.
Page | 45
Agent List
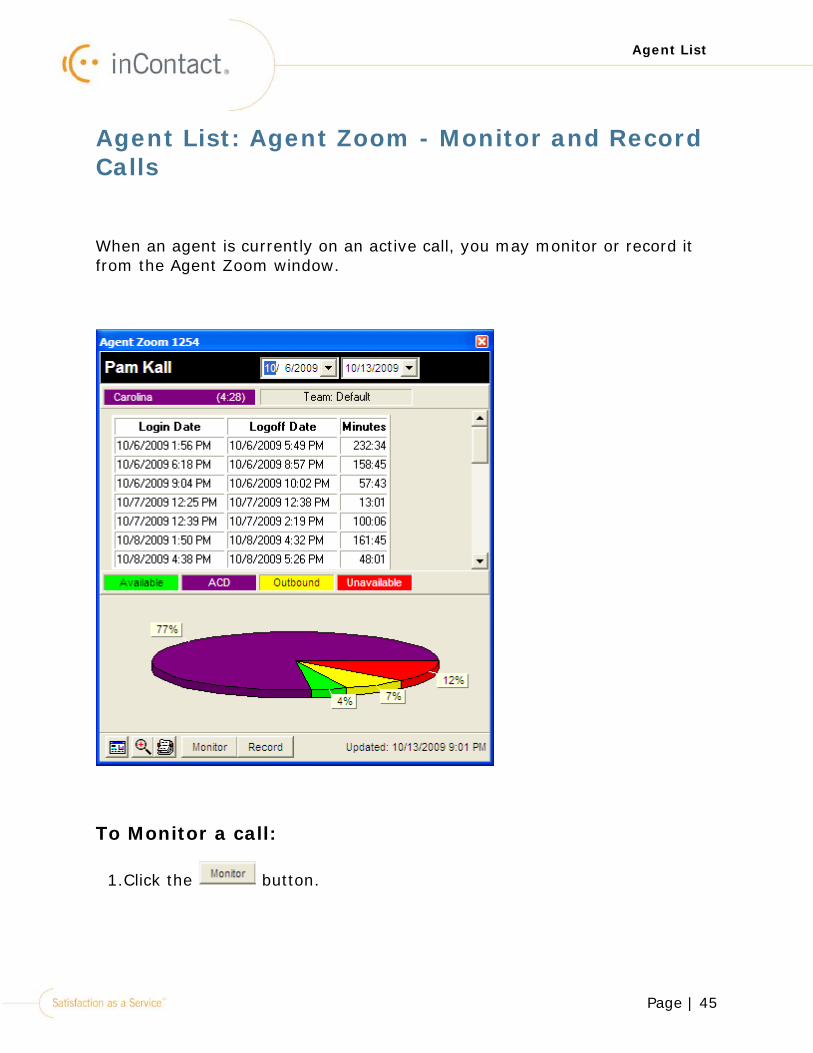
Agent List: Agent Zoom - Monitor and Record Calls
When an agent is currently on an active call, you may monitor or record it from the Agent Zoom window.
To Monitor a call:
1.Click the button.
Page | 46
Agent List
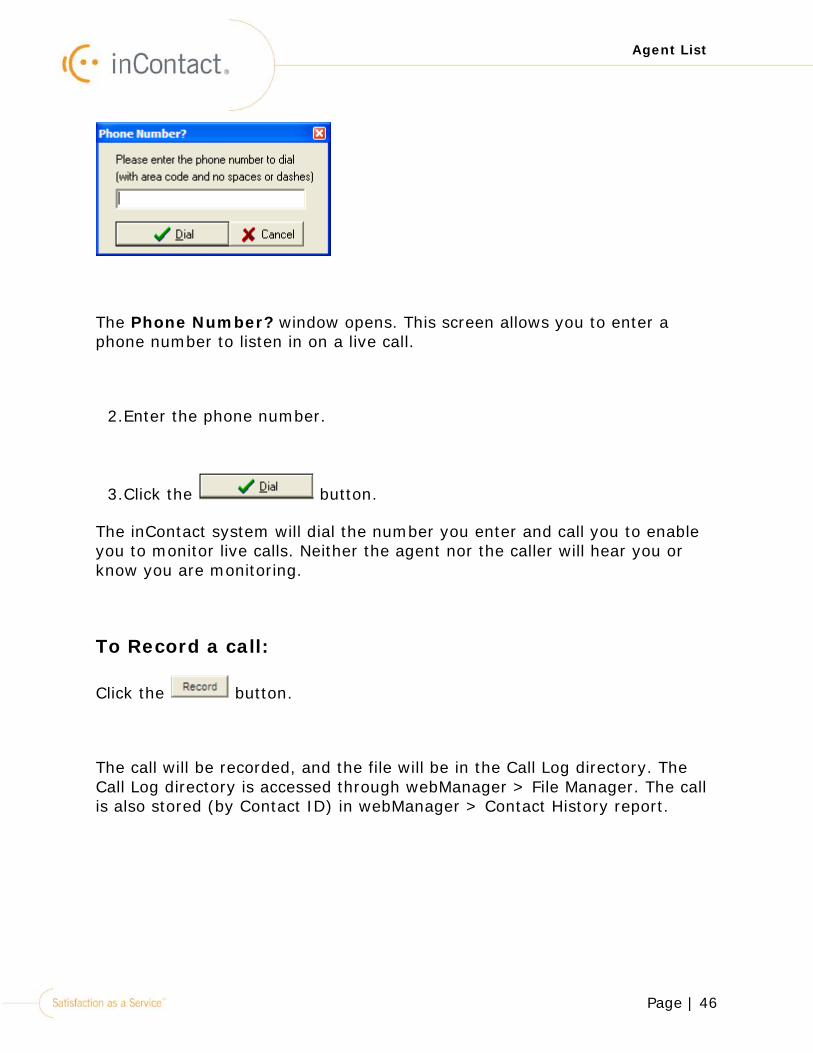
The Phone Number? window opens. This screen allows you to enter a phone number to listen in on a live call.
2.Enter the phone number.
3.Click the button.
The inContact system will dial the number you enter and call you to enable you to monitor live calls. Neither the agent nor the caller will hear you or know you are monitoring.
To Record a call:
Click the button.
The call will be recorded, and the file will be in the Call Log directory. The Call Log directory is accessed through webManager > File Manager. The call is also stored (by Contact ID) in webManager > Contact History report.
Page | 47
Contact List
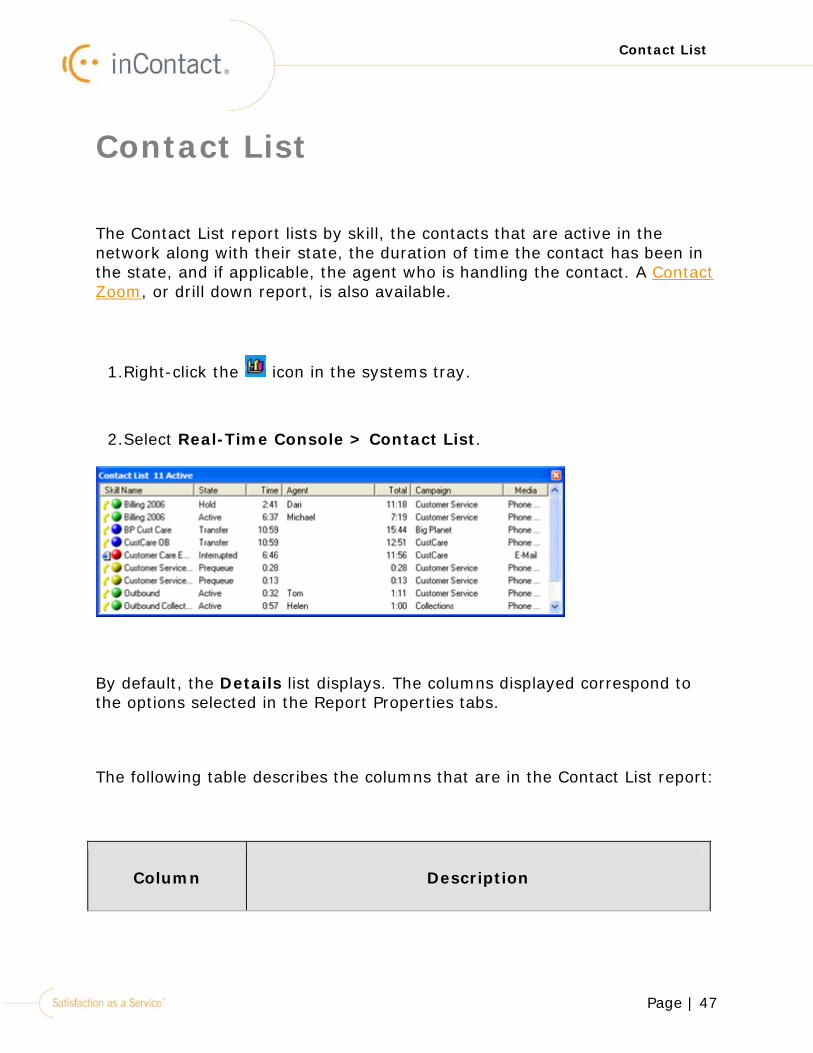
Contact List
The Contact List report lists by skill, the contacts that are active in the network along with their state, the duration of time the contact has been in the state, and if applicable, the agent who is handling the contact. A Contact Zoom, or drill down report, is also available.
1.Right-click the icon in the systems tray.
2.Select Real-Time Console > Contact List.
By default, the Details list displays. The columns displayed correspond to the options selected in the Report Properties tabs.
The following table describes the columns that are in the Contact List report:
Column Description

Page | 48
Contact List
Column Description
Skill Name The skill name associated with the contact. If the Media Icon checkbox is selected in the Report Properties > View Data tab, the icon associated with the Media Type is displayed next to the skill name.
State The contact’s current state. This column identifies whether or not the contact is inbound or outbound. The state listed here corresponds to the colored circle next to the skill name.
Green: A green circle represents a contact in an active state. An active contact is either with an agent or on hold with an agent.
Red: A red circle represents a contact that is in an in queue state. In queue time is either when a contact is routing to an agent, or is in a callback state.
Yellow: A yellow circle represents a Prequeue state. A Prequeue state can be either a contact going through an IVR or being spawned (for example, Dialer calls can be spawned).
Blue: A blue circle represents a post-queue state. The contact is active in the network, but not transferred. For example the customer may be participating in an IVR survey.
Time The duration of time the contact has been in the current state.
Agent The agent who is handling the contact, if applicable.
Page | 49
Contact List
Column Description
Total The total duration of time the contact has been in inContact.
Campaign The campaign the skill belongs to.
Media The media type of the contact.
Page | 50
Contact List
Contact List: Report Menu
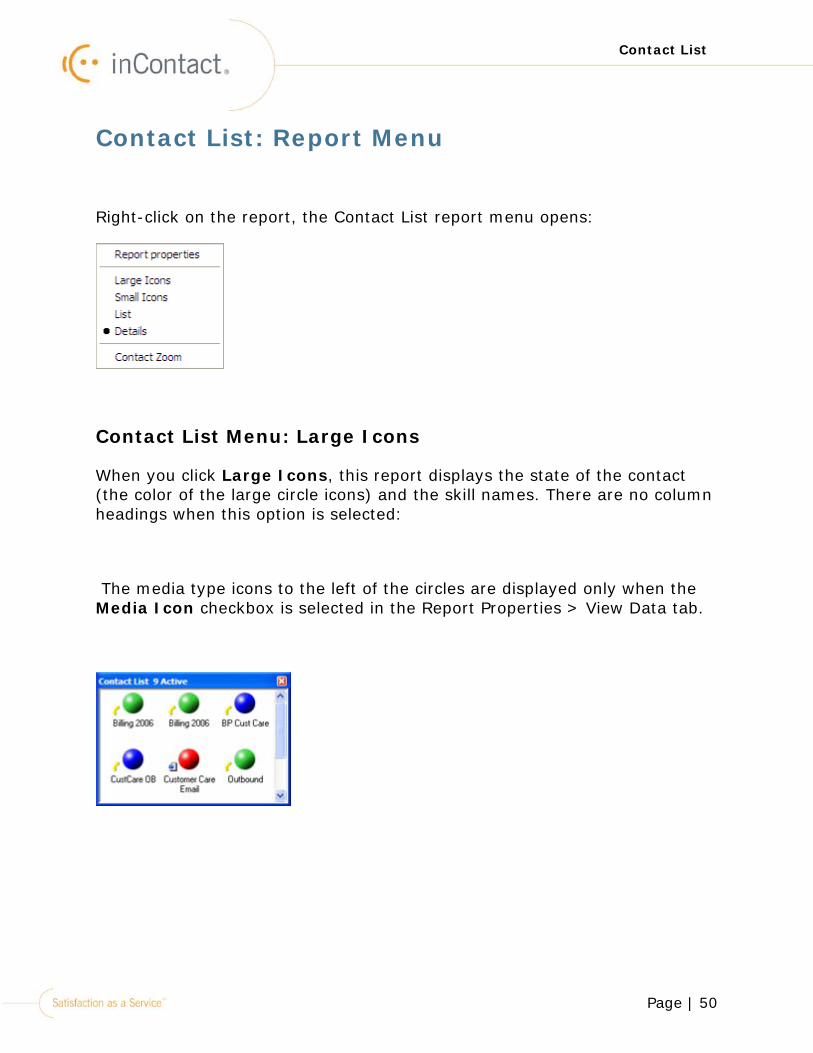
Right-click on the report, the Contact List report menu opens:
Contact List Menu: Large Icons
When you click Large Icons, this report displays the state of the contact (the color of the large circle icons) and the skill names. There are no column headings when this option is selected:
The media type icons to the left of the circles are displayed only when the Media Icon checkbox is selected in the Report Properties > View Data tab.
Page | 51
Contact List
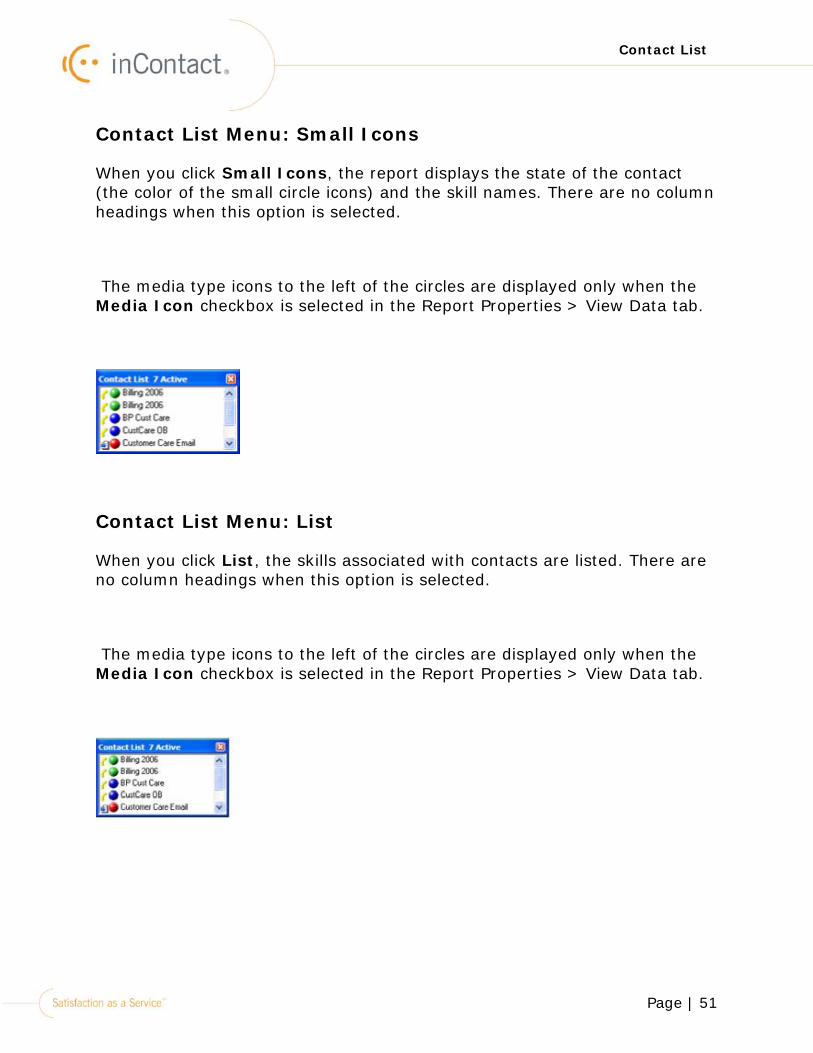
Contact List Menu: Small Icons
When you click Small Icons, the report displays the state of the contact (the color of the small circle icons) and the skill names. There are no column headings when this option is selected.
The media type icons to the left of the circles are displayed only when the Media Icon checkbox is selected in the Report Properties > View Data tab.
Contact List Menu: List
When you click List, the skills associated with contacts are listed. There are no column headings when this option is selected.
The media type icons to the left of the circles are displayed only when the Media Icon checkbox is selected in the Report Properties > View Data tab.

Page | 52
Contact List
Contact List Menu: Report Properties
The report properties are used to select filters for specific data to be generated.
1.Right-click on the report, the Contact List report menu opens:
2.Click Report Properties.
Page | 53
Contact List
The View Data screen opens.
3.Select the specific data you want to view, or click the View all data check box.
The table below describes the View Data tab options:
Name Description
View Data This tab lists 8 filters you can include in this report. These filters will be the column headings that are displayed in the main report:
Skill Name - Each skill will be listed in this column
State - The available/unavailable state of each contact will be listed in this column
Time - The duration of time the contact has been in the state
Agent - The agent who is currently handling the contact
Total - The total duration of time the contact has been in inContact
Campaign - The campaign the skill belongs to
Media - The media type of the contact
Media Icon - The icon for the media type will be displayed next to the Skill Name
Select the check boxes for the data you want to view. Even when you select specific data in another
Page | 54
Contact List
Name Description
tab, you will still need to select the check boxes in this tab for the data you want displayed.
Note! Click the Campaign check box if you want to view Campaigns for this report. Click the Skill Name check box if you want to view Skills for this report.
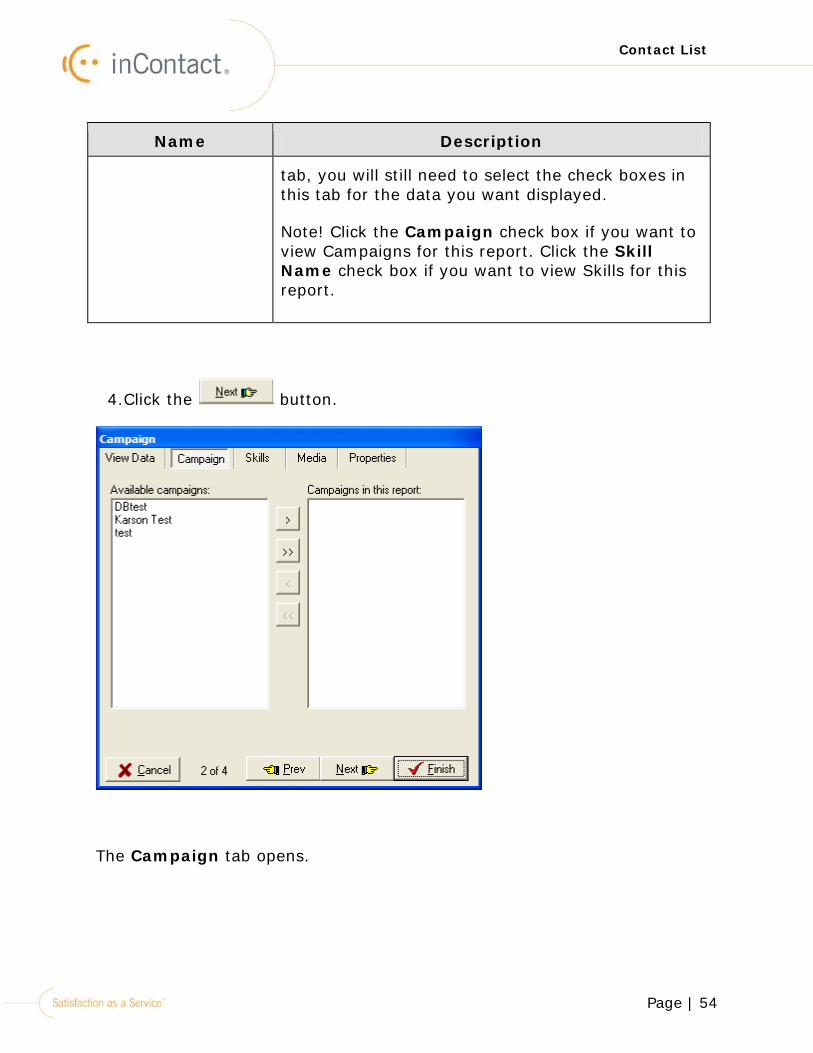
4.Click the button.
The Campaign tab opens.
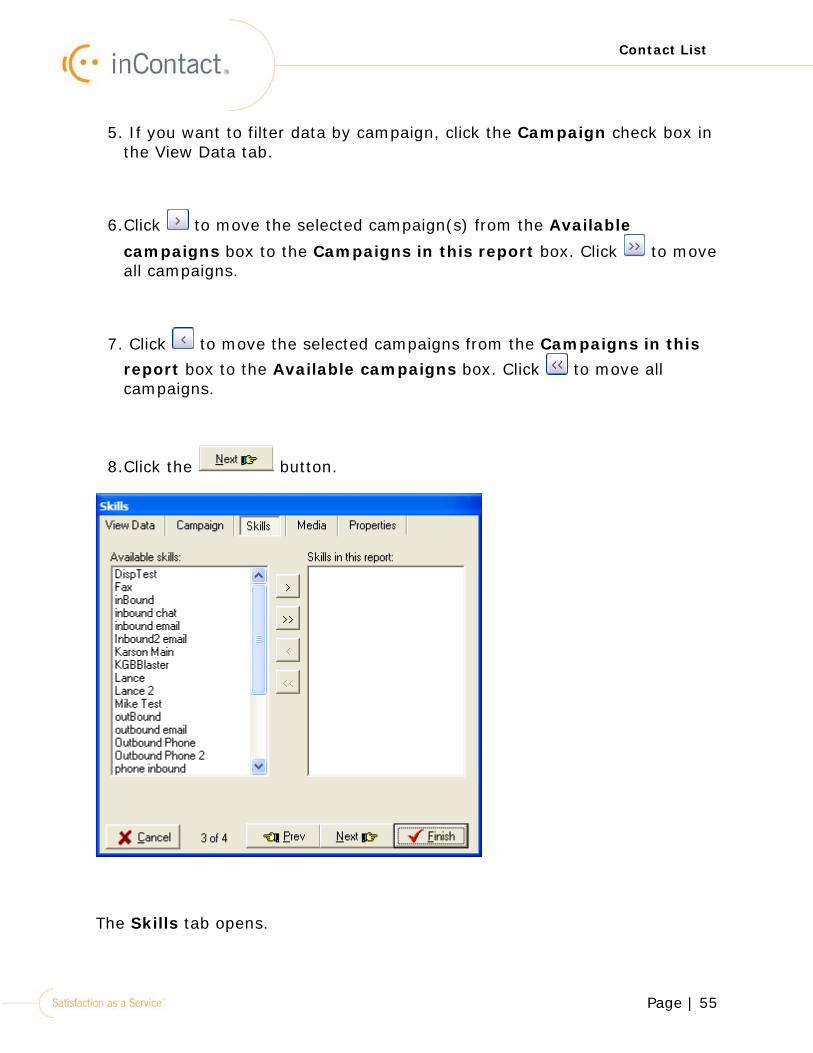
Page | 55
Contact List
5. If you want to filter data by campaign, click the Campaign check box in the View Data tab.
6.Click to move the selected campaign(s) from the Available
campaigns box to the Campaigns in this report box. Click to move all campaigns.
7. Click to move the selected campaigns from the Campaigns in this report box to the Available campaigns box. Click to move all campaigns.
8.Click the button.
The Skills tab opens.
Page | 56
Contact List
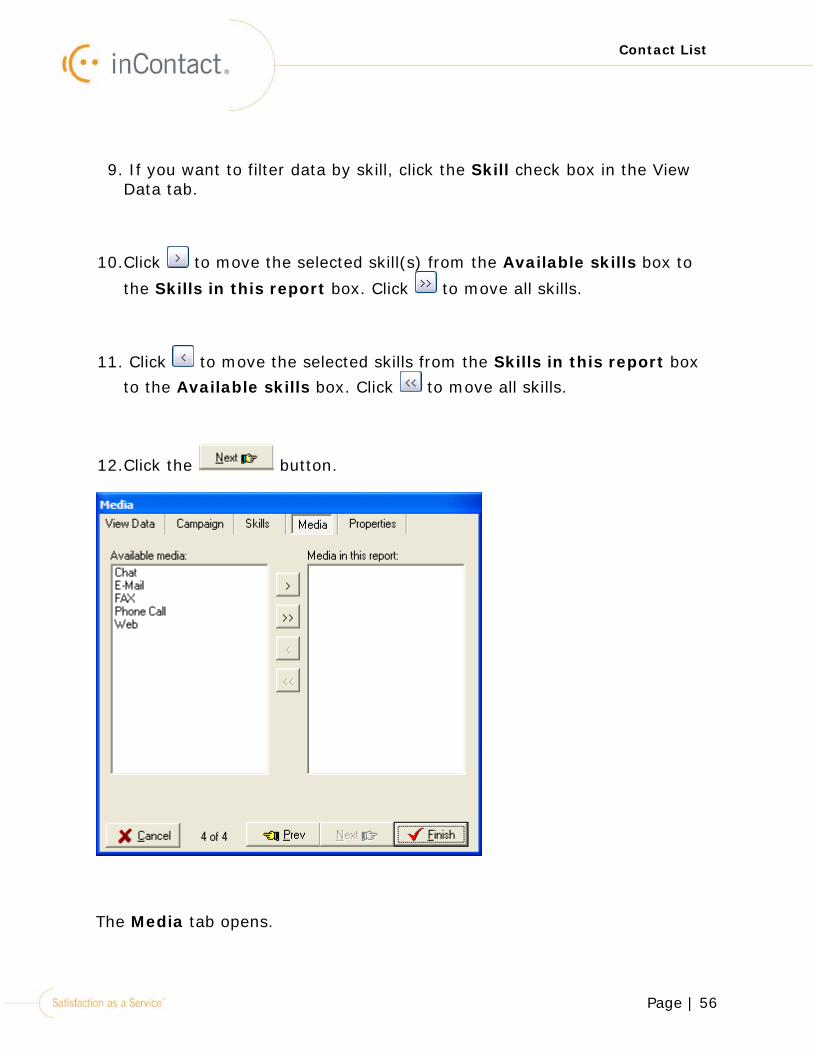
9. If you want to filter data by skill, click the Skill check box in the View Data tab.
10.Click to move the selected skill(s) from the Available skills box to
the Skills in this report box. Click to move all skills.
11. Click to move the selected skills from the Skills in this report box to the Available skills box. Click to move all skills.
12.Click the button.
The Media tab opens.

Page | 57
Contact List
13.Click to move the selected skill(s) from the Available media box to
the Media in this report box. Click to move all skills.
14. Click to move the selected skills from the Media in this report box to the Available media box. Click to move all skills.
15.Click the button.
16.If needed, enter the Report Name that will appear in the Window's title bar.
17.Click the button.
Page | 58
Contact List
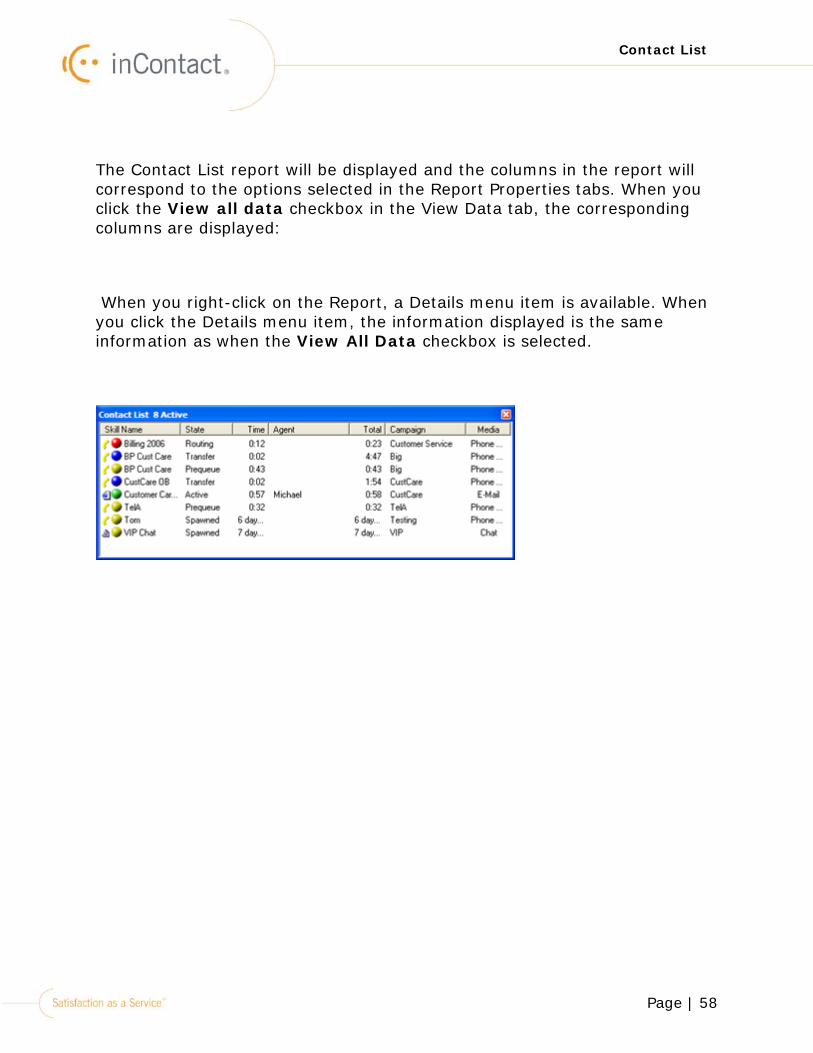
The Contact List report will be displayed and the columns in the report will correspond to the options selected in the Report Properties tabs. When you click the View all data checkbox in the View Data tab, the corresponding columns are displayed:
When you right-click on the Report, a Details menu item is available. When you click the Details menu item, the information displayed is the same information as when the View All Data checkbox is selected.
Page | 59
Contact List
Contact List: Contact Zoom
Right-click on the report, the Contact List report menu opens:
Click Contact Zoom, the Contact Zoom screen opens:
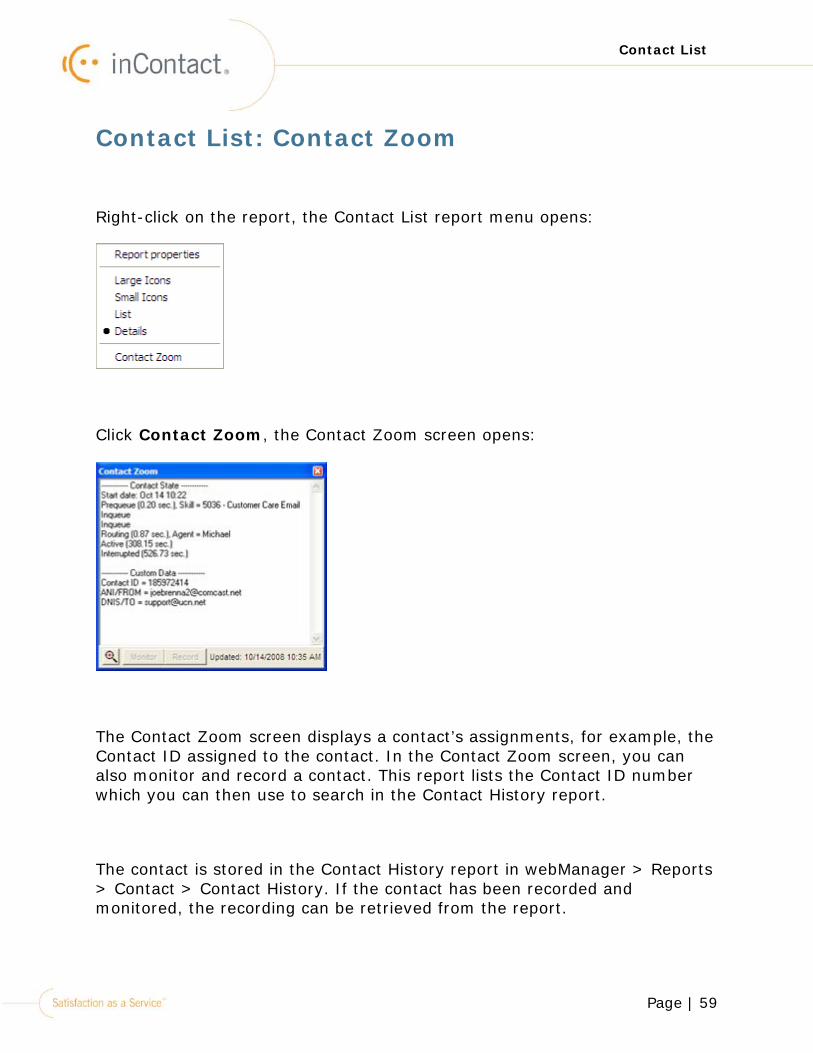
The Contact Zoom screen displays a contact’s assignments, for example, the Contact ID assigned to the contact. In the Contact Zoom screen, you can also monitor and record a contact. This report lists the Contact ID number which you can then use to search in the Contact History report.
The contact is stored in the Contact History report in webManager > Reports > Contact > Contact History. If the contact has been recorded and monitored, the recording can be retrieved from the report.
Page | 60
Contacts States by Skill
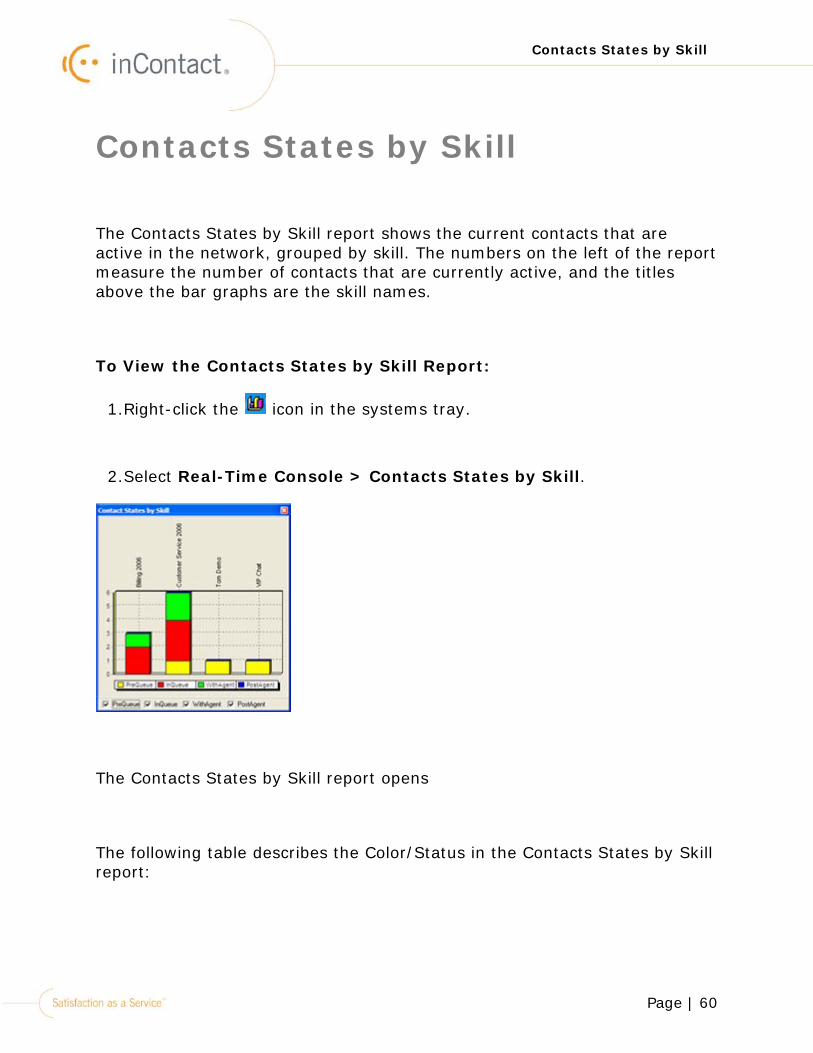
Contacts States by Skill
The Contacts States by Skill report shows the current contacts that are active in the network, grouped by skill. The numbers on the left of the report measure the number of contacts that are currently active, and the titles above the bar graphs are the skill names.
To View the Contacts States by Skill Report:
1.Right-click the icon in the systems tray.
2.Select Real-Time Console > Contacts States by Skill.
The Contacts States by Skill report opens
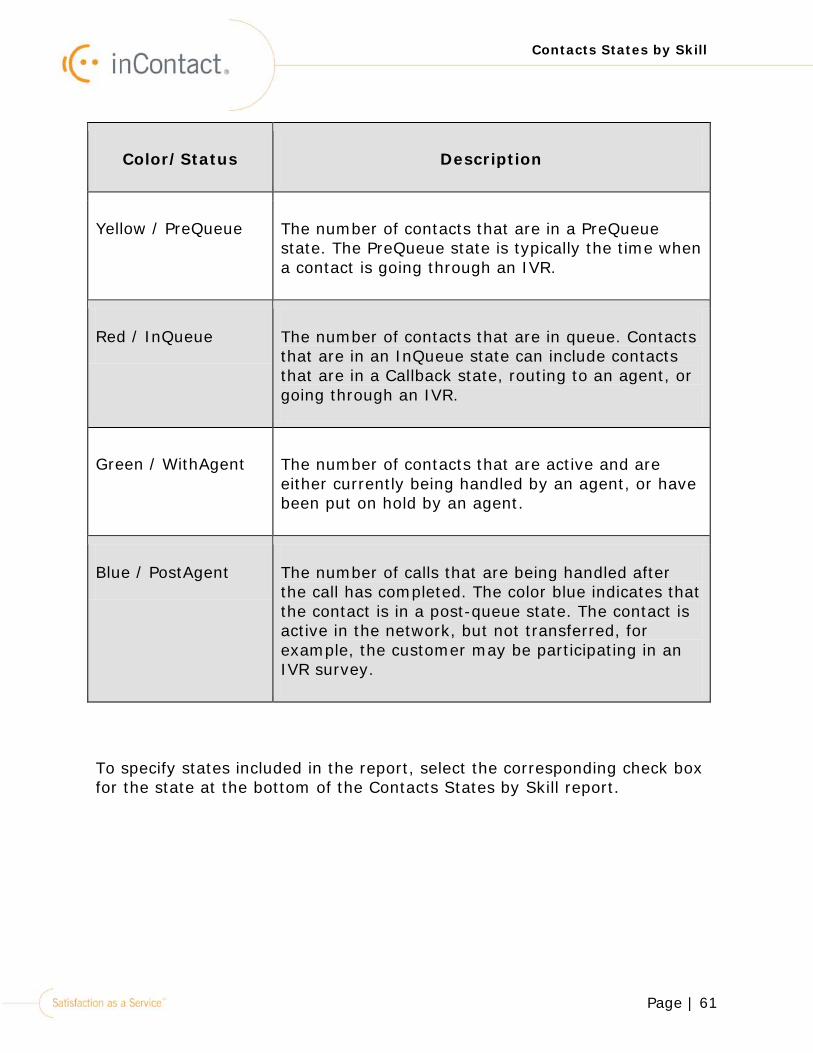
The following table describes the Color/Status in the Contacts States by Skill report:
Page | 61
Contacts States by Skill
Color/Status Description
Yellow / PreQueue The number of contacts that are in a PreQueue state. The PreQueue state is typically the time when a contact is going through an IVR.
Red / InQueue The number of contacts that are in queue. Contacts that are in an InQueue state can include contacts that are in a Callback state, routing to an agent, or going through an IVR.
Green / WithAgent The number of contacts that are active and are either currently being handled by an agent, or have been put on hold by an agent.
Blue / PostAgent The number of calls that are being handled after the call has completed. The color blue indicates that the contact is in a post-queue state. The contact is active in the network, but not transferred, for example, the customer may be participating in an IVR survey.
To specify states included in the report, select the corresponding check box for the state at the bottom of the Contacts States by Skill report.
Page | 62
Contacts States by Skill
Contacts States by Skill: Report Menu
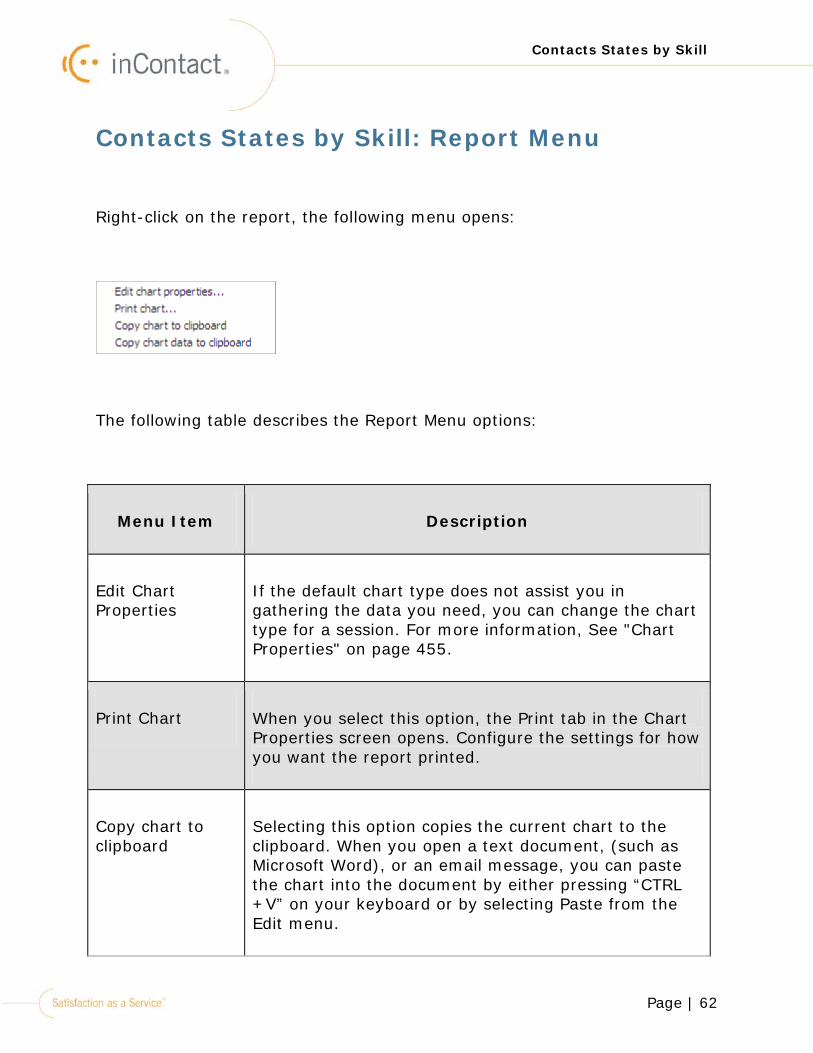
Right-click on the report, the following menu opens:
The following table describes the Report Menu options:
Menu Item Description
Edit Chart Properties
If the default chart type does not assist you in gathering the data you need, you can change the chart type for a session. For more information, See "Chart Properties" on page 455.
Print Chart When you select this option, the Print tab in the Chart Properties screen opens. Configure the settings for how you want the report printed.
Copy chart to clipboard
Selecting this option copies the current chart to the clipboard. When you open a text document, (such as Microsoft Word), or an email message, you can paste the chart into the document by either pressing “CTRL +V” on your keyboard or by selecting Paste from the Edit menu.
Page | 63
Contacts States by Skill
Menu Item Description
Copy chart data to clipboard
When you select this option, the data that corresponds with the current graph is copied to the clipboard. When you open a spreadsheet document, such as Excel, you can paste the data into the document by either pressing “CTRL+V” on your keyboard or by selecting Paste from the Edit menu.
Page | 64
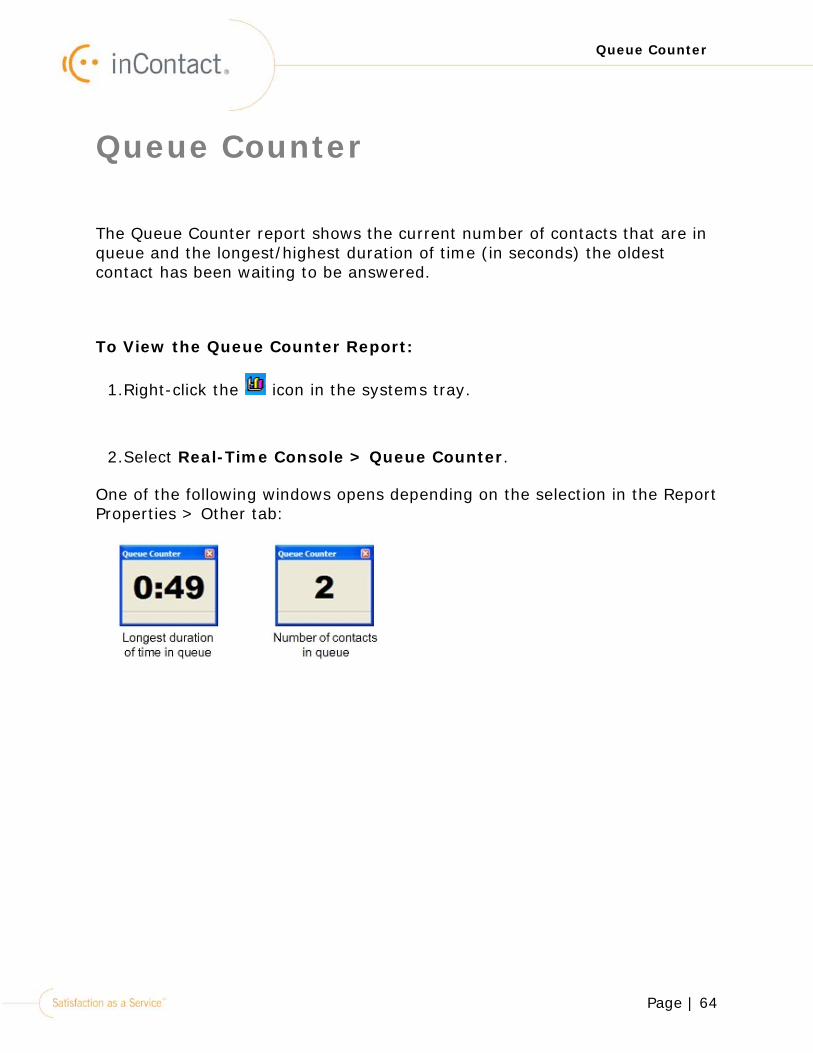
Queue Counter
Queue Counter
The Queue Counter report shows the current number of contacts that are in queue and the longest/highest duration of time (in seconds) the oldest contact has been waiting to be answered.
To View the Queue Counter Report:
1.Right-click the icon in the systems tray.
2.Select Real-Time Console > Queue Counter.
One of the following windows opens depending on the selection in the Report Properties > Other tab:
Page | 65
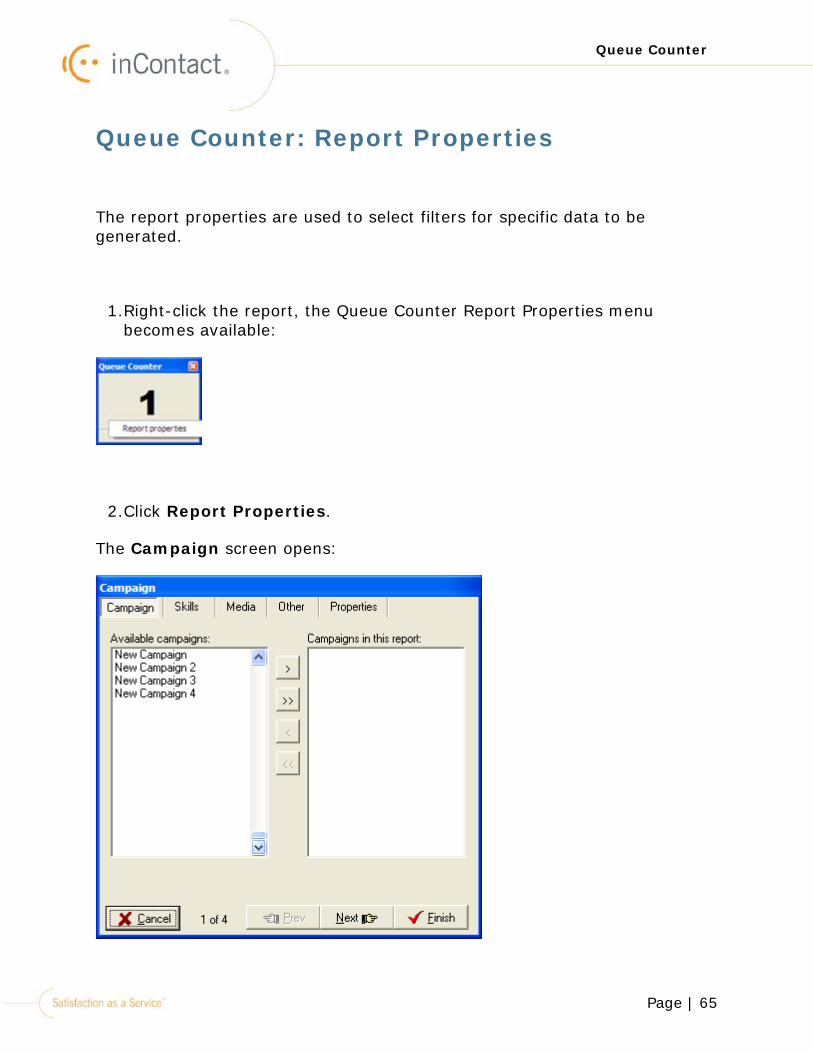
Queue Counter
Queue Counter: Report Properties
The report properties are used to select filters for specific data to be generated.
1.Right-click the report, the Queue Counter Report Properties menu becomes available:
2.Click Report Properties.
The Campaign screen opens:
Page | 66
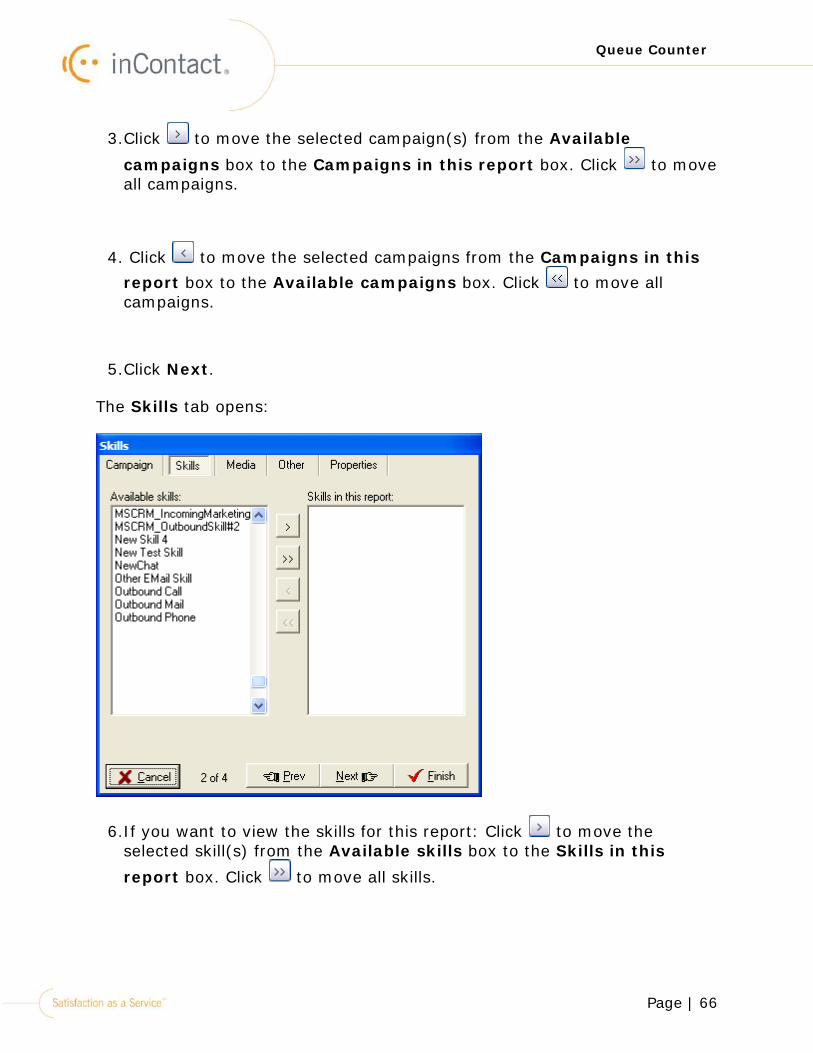
Queue Counter
3.Click to move the selected campaign(s) from the Available
campaigns box to the Campaigns in this report box. Click to move all campaigns.
4. Click to move the selected campaigns from the Campaigns in this report box to the Available campaigns box. Click to move all campaigns.
5.Click Next.
The Skills tab opens:
6.If you want to view the skills for this report: Click to move the selected skill(s) from the Available skills box to the Skills in this report box. Click to move all skills.
Page | 67
Queue Counter
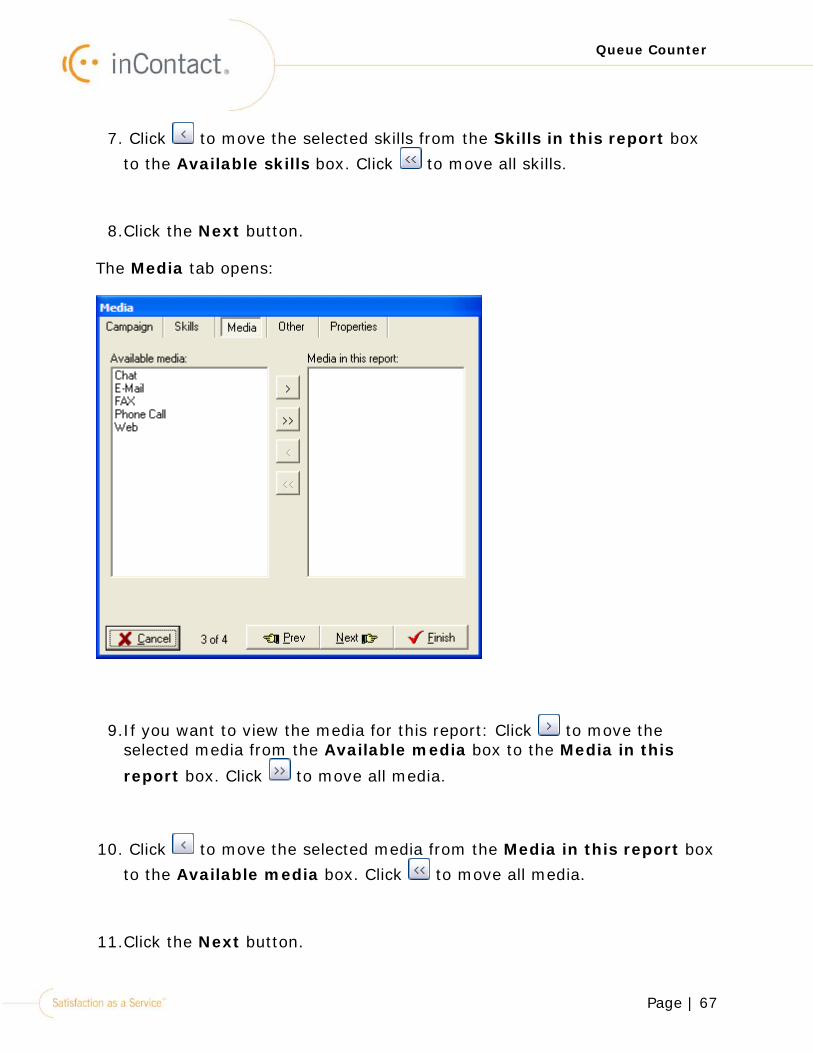
7. Click to move the selected skills from the Skills in this report box to the Available skills box. Click to move all skills.
8.Click the Next button.
The Media tab opens:
9.If you want to view the media for this report: Click to move the selected media from the Available media box to the Media in this report box. Click to move all media.
10. Click to move the selected media from the Media in this report box to the Available media box. Click to move all media.
11.Click the Next button.
Page | 68
Queue Counter
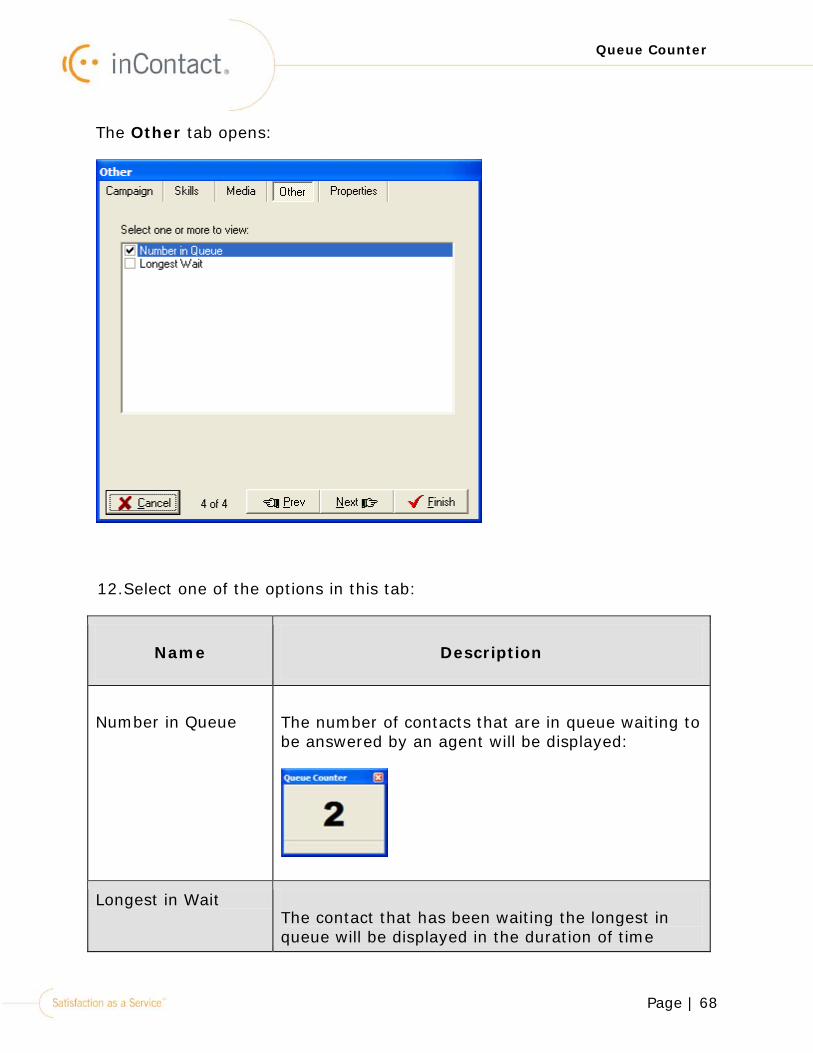
The Other tab opens:
12.Select one of the options in this tab:
Name Description
Number in Queue The number of contacts that are in queue waiting to be answered by an agent will be displayed:
Longest in Wait The contact that has been waiting the longest in queue will be displayed in the duration of time
Page | 69
Queue Counter
Name Description
(minutes:seconds).
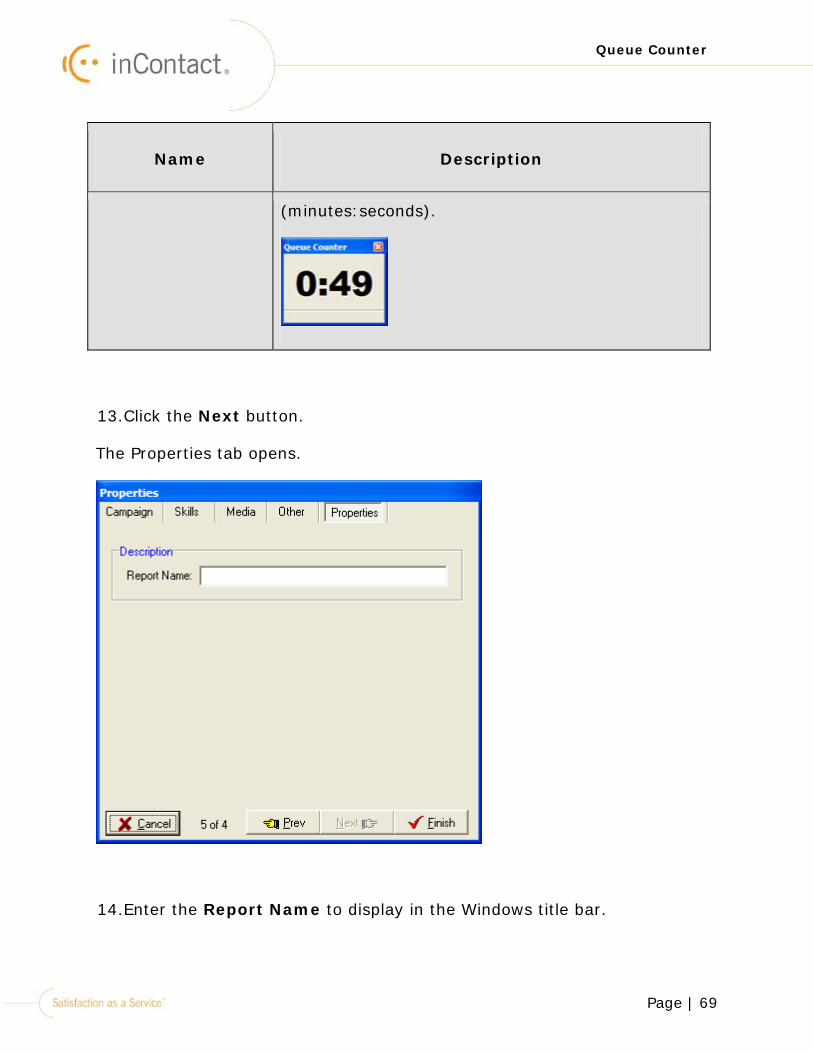
13.Click the Next button.
The Properties tab opens.
14.Enter the Report Name to display in the Windows title bar.
Page | 70
Queue Counter
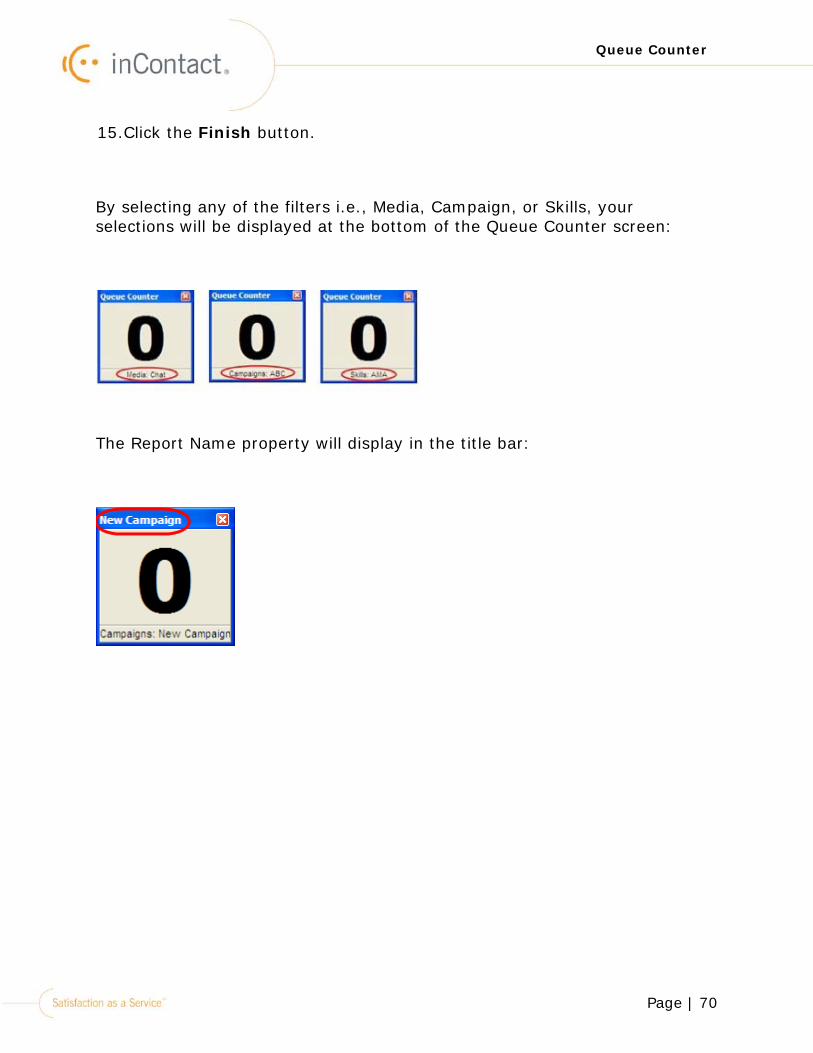
15.Click the Finish button.
By selecting any of the filters i.e., Media, Campaign, or Skills, your selections will be displayed at the bottom of the Queue Counter screen:
The Report Name property will display in the title bar:
Page | 71
Queue Trend
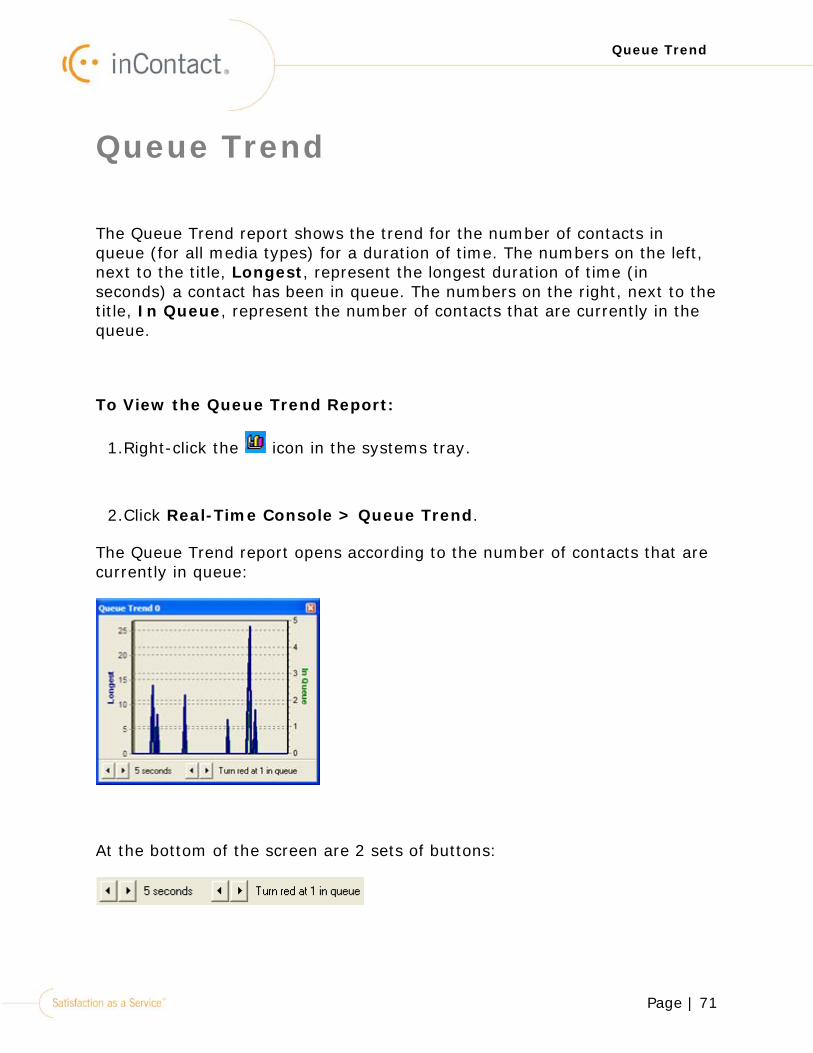
Queue Trend
The Queue Trend report shows the trend for the number of contacts in queue (for all media types) for a duration of time. The numbers on the left, next to the title, Longest, represent the longest duration of time (in seconds) a contact has been in queue. The numbers on the right, next to the title, In Queue, represent the number of contacts that are currently in the queue.
To View the Queue Trend Report:
1.Right-click the icon in the systems tray.
2.Click Real-Time Console > Queue Trend.
The Queue Trend report opens according to the number of contacts that are currently in queue:
At the bottom of the screen are 2 sets of buttons:
Page | 72
Queue Trend
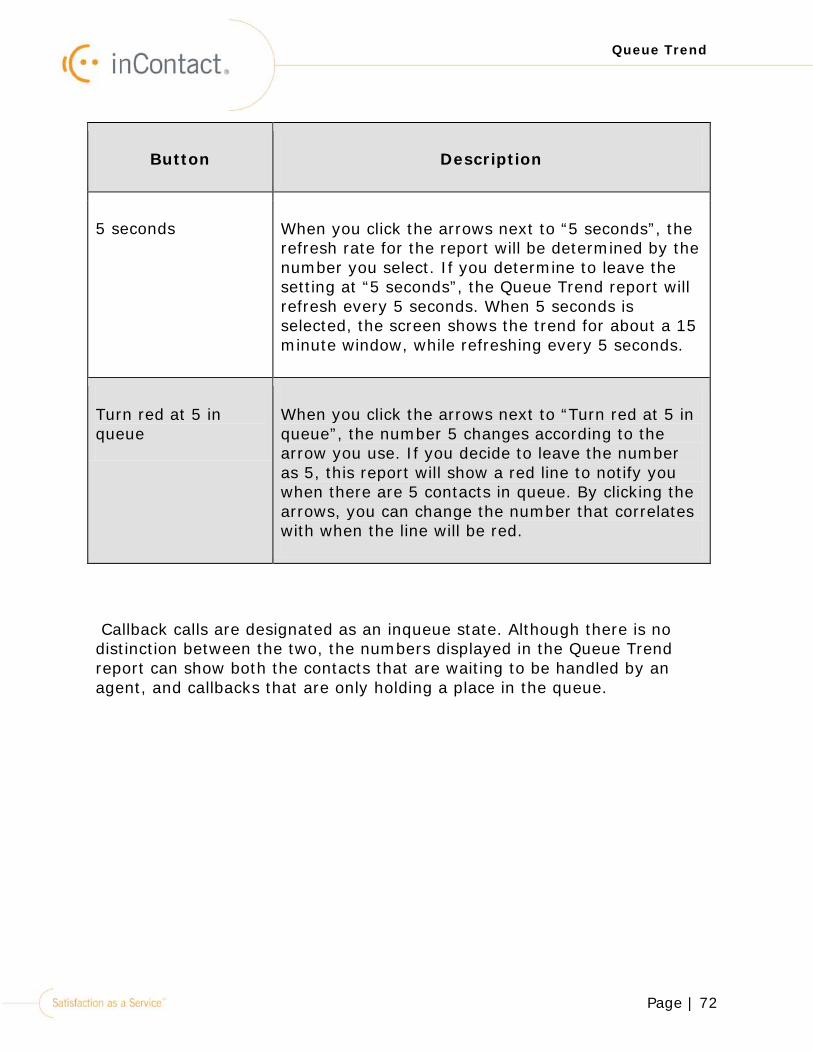
Button Description
5 seconds When you click the arrows next to “5 seconds”, the refresh rate for the report will be determined by the number you select. If you determine to leave the setting at “5 seconds”, the Queue Trend report will refresh every 5 seconds. When 5 seconds is selected, the screen shows the trend for about a 15 minute window, while refreshing every 5 seconds.
Turn red at 5 in queue
When you click the arrows next to “Turn red at 5 in queue”, the number 5 changes according to the arrow you use. If you decide to leave the number as 5, this report will show a red line to notify you when there are 5 contacts in queue. By clicking the arrows, you can change the number that correlates with when the line will be red.
Callback calls are designated as an inqueue state. Although there is no distinction between the two, the numbers displayed in the Queue Trend report can show both the contacts that are waiting to be handled by an agent, and callbacks that are only holding a place in the queue.
Page | 73
Queue Trend
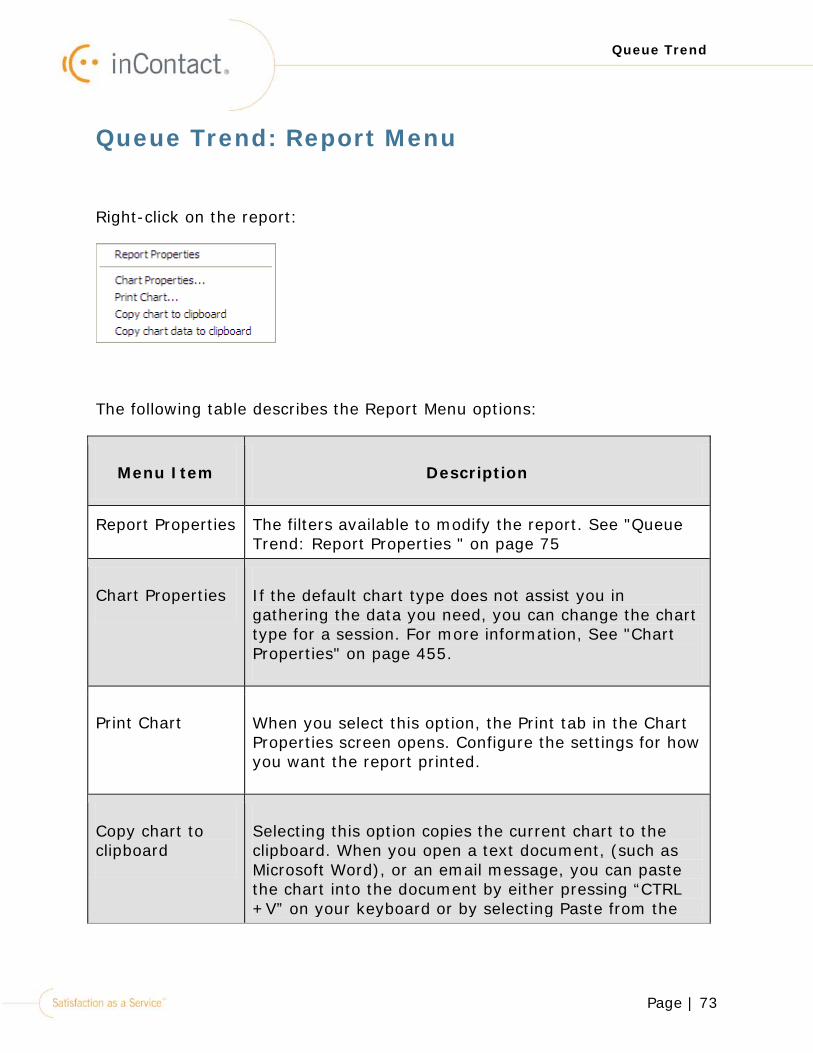
Queue Trend: Report Menu
Right-click on the report:
The following table describes the Report Menu options:
Menu Item Description
Report Properties The filters available to modify the report. See "Queue Trend: Report Properties " on page 75
Chart Properties If the default chart type does not assist you in gathering the data you need, you can change the chart type for a session. For more information, See "Chart Properties" on page 455.
Print Chart When you select this option, the Print tab in the Chart Properties screen opens. Configure the settings for how you want the report printed.
Copy chart to clipboard
Selecting this option copies the current chart to the clipboard. When you open a text document, (such as Microsoft Word), or an email message, you can paste the chart into the document by either pressing “CTRL +V” on your keyboard or by selecting Paste from the
Page | 74
Queue Trend
Menu Item Description
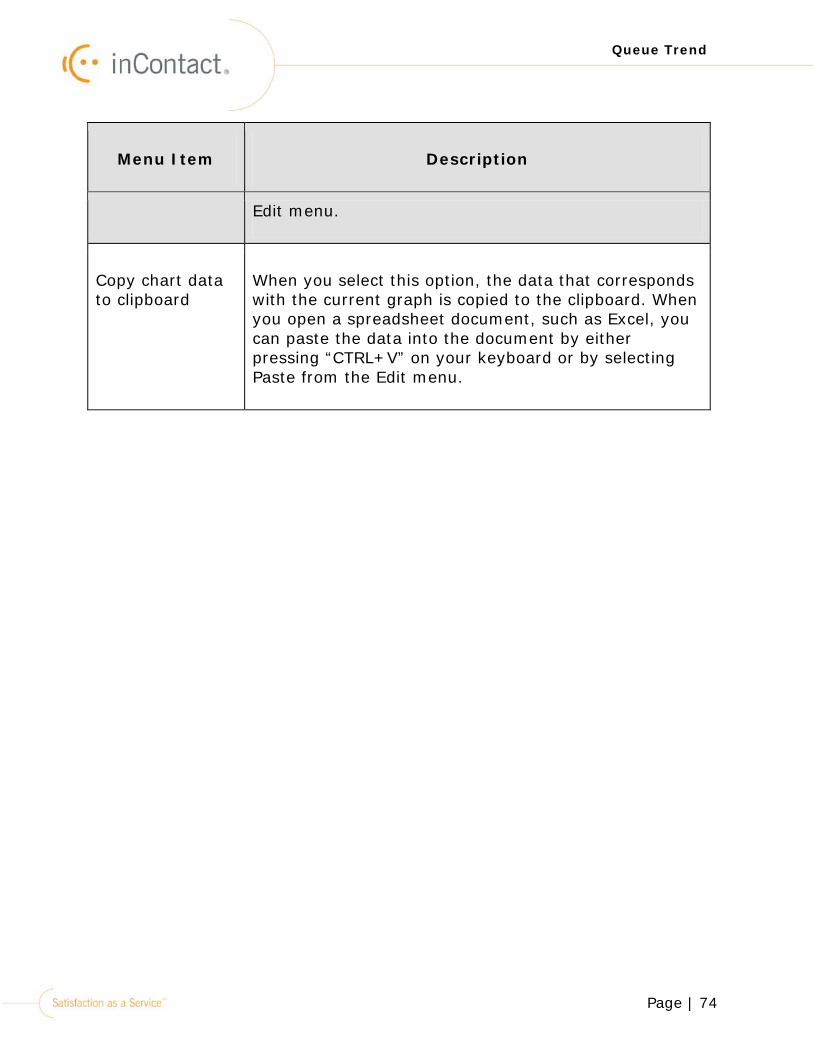
Edit menu.
Copy chart data to clipboard
When you select this option, the data that corresponds with the current graph is copied to the clipboard. When you open a spreadsheet document, such as Excel, you can paste the data into the document by either pressing “CTRL+V” on your keyboard or by selecting Paste from the Edit menu.
Page | 75
Queue Trend
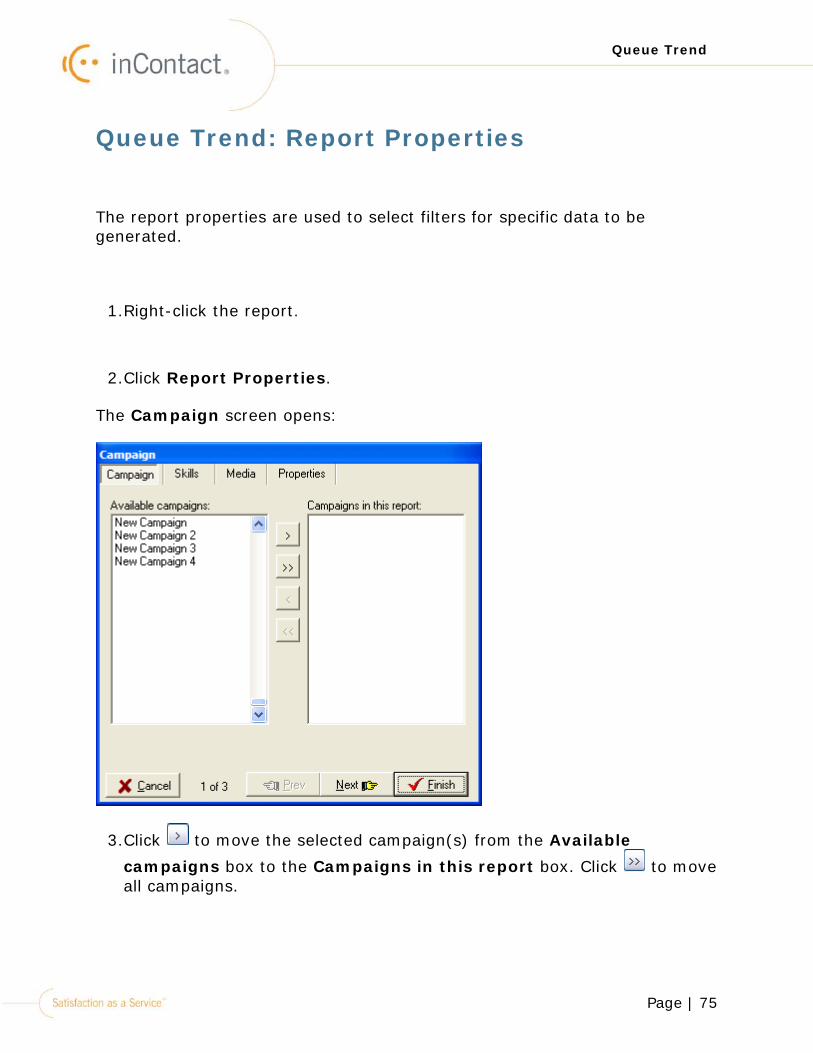
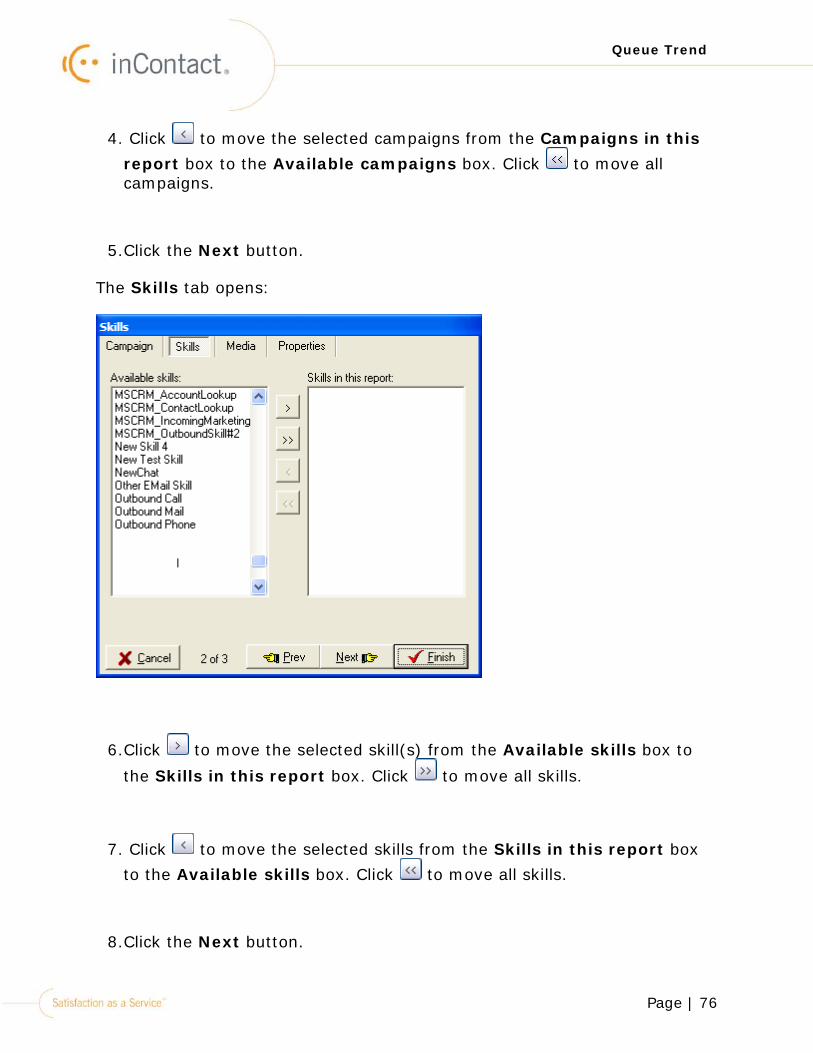
Queue Trend: Report Properties
The report properties are used to select filters for specific data to be generated.
1.Right-click the report.
2.Click Report Properties.
The Campaign screen opens:
3.Click to move the selected campaign(s) from the Available
campaigns box to the Campaigns in this report box. Click to move all campaigns.
Page | 76
Queue Trend
4. Click to move the selected campaigns from the Campaigns in this report box to the Available campaigns box. Click to move all campaigns.
5.Click the Next button.
The Skills tab opens:
6.Click to move the selected skill(s) from the Available skills box to
the Skills in this report box. Click to move all skills.
7. Click to move the selected skills from the Skills in this report box to the Available skills box. Click to move all skills.
8.Click the Next button.
Page | 77
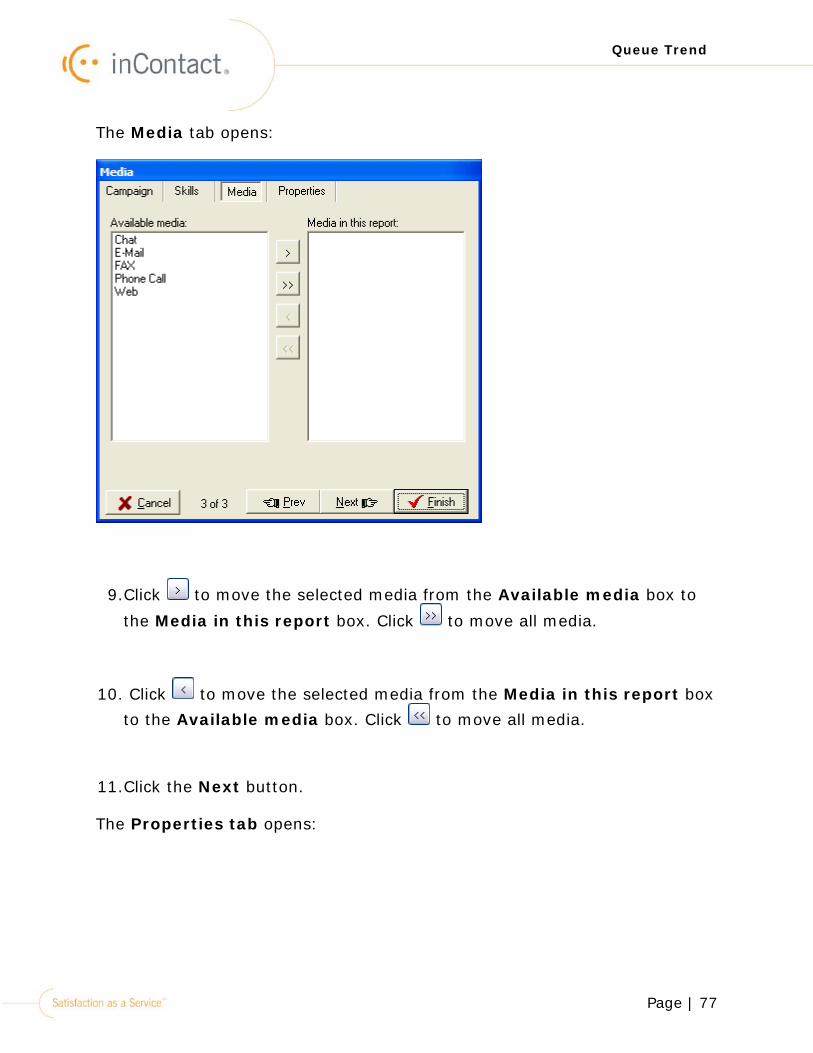
Queue Trend
The Media tab opens:
9.Click to move the selected media from the Available media box to
the Media in this report box. Click to move all media.
10. Click to move the selected media from the Media in this report box to the Available media box. Click to move all media.
11.Click the Next button.
The Properties tab opens:
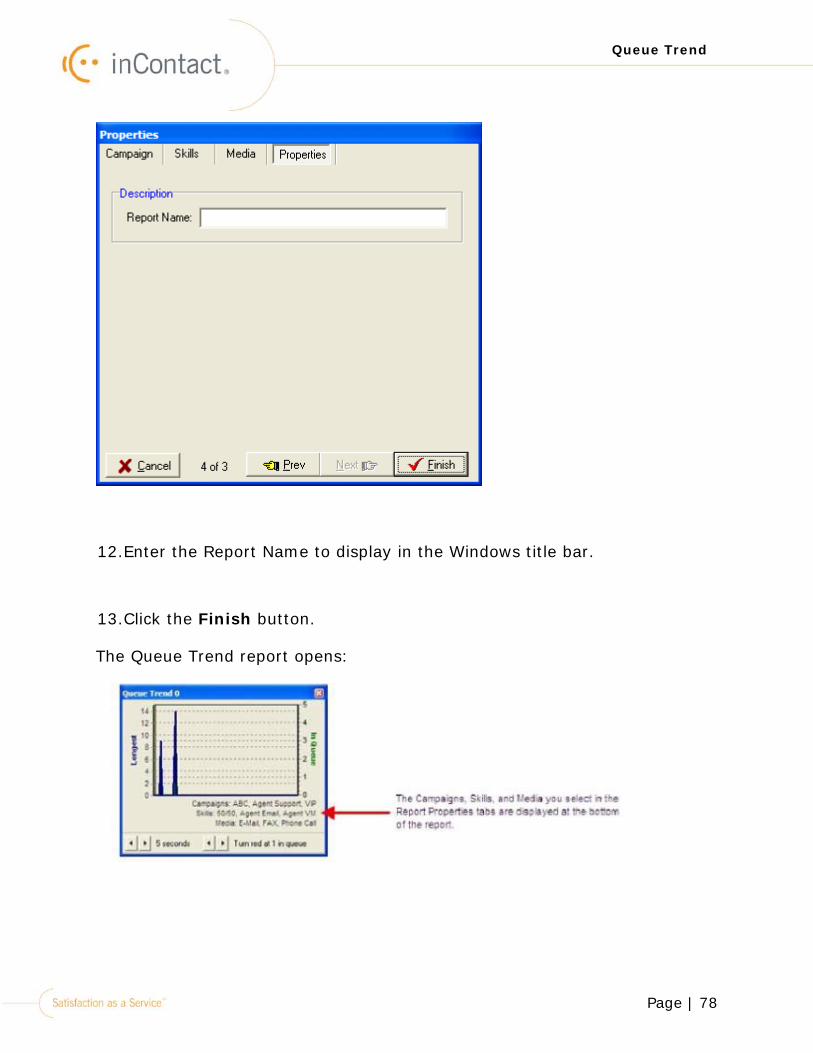
Page | 78
Queue Trend
12.Enter the Report Name to display in the Windows title bar.
13.Click the Finish button.
The Queue Trend report opens:
Page | 79
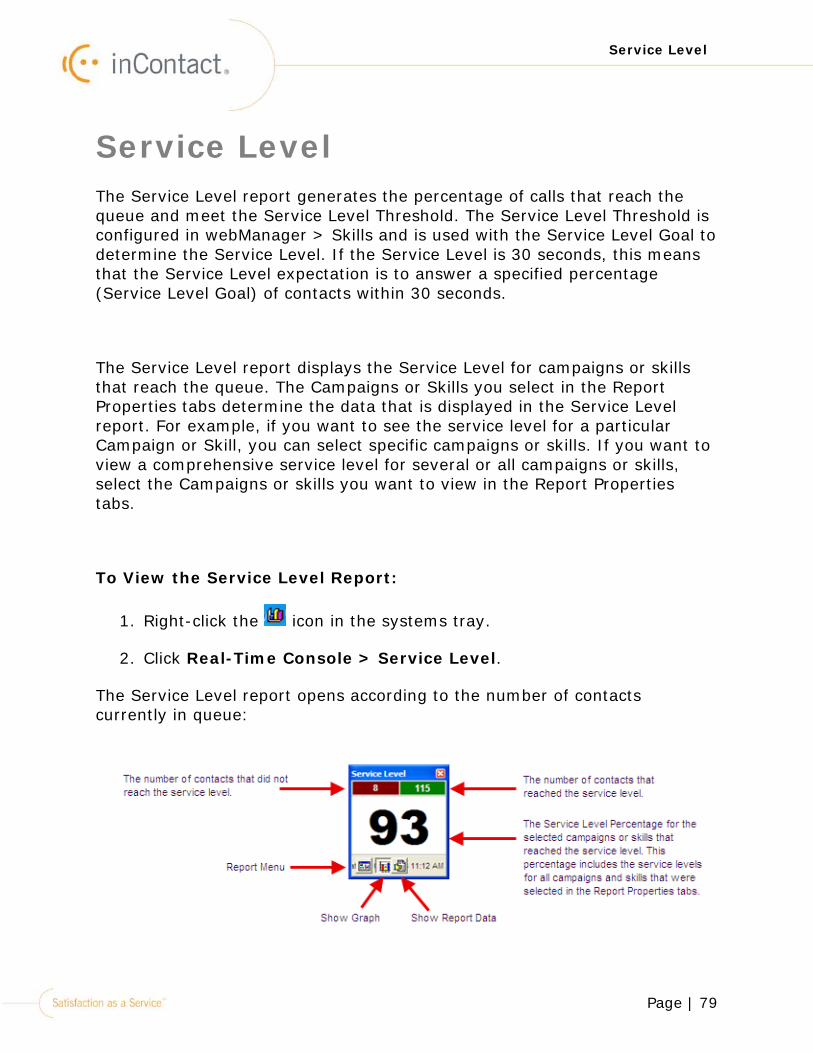
Service Level
Service Level The Service Level report generates the percentage of calls that reach the queue and meet the Service Level Threshold. The Service Level Threshold is configured in webManager > Skills and is used with the Service Level Goal to determine the Service Level. If the Service Level is 30 seconds, this means that the Service Level expectation is to answer a specified percentage (Service Level Goal) of contacts within 30 seconds.
The Service Level report displays the Service Level for campaigns or skills that reach the queue. The Campaigns or Skills you select in the Report Properties tabs determine the data that is displayed in the Service Level report. For example, if you want to see the service level for a particular Campaign or Skill, you can select specific campaigns or skills. If you want to view a comprehensive service level for several or all campaigns or skills, select the Campaigns or skills you want to view in the Report Properties tabs.
To View the Service Level Report:
1. Right-click the icon in the systems tray.
2. Click Real-Time Console > Service Level.
The Service Level report opens according to the number of contacts currently in queue:
Page | 80
Service Level
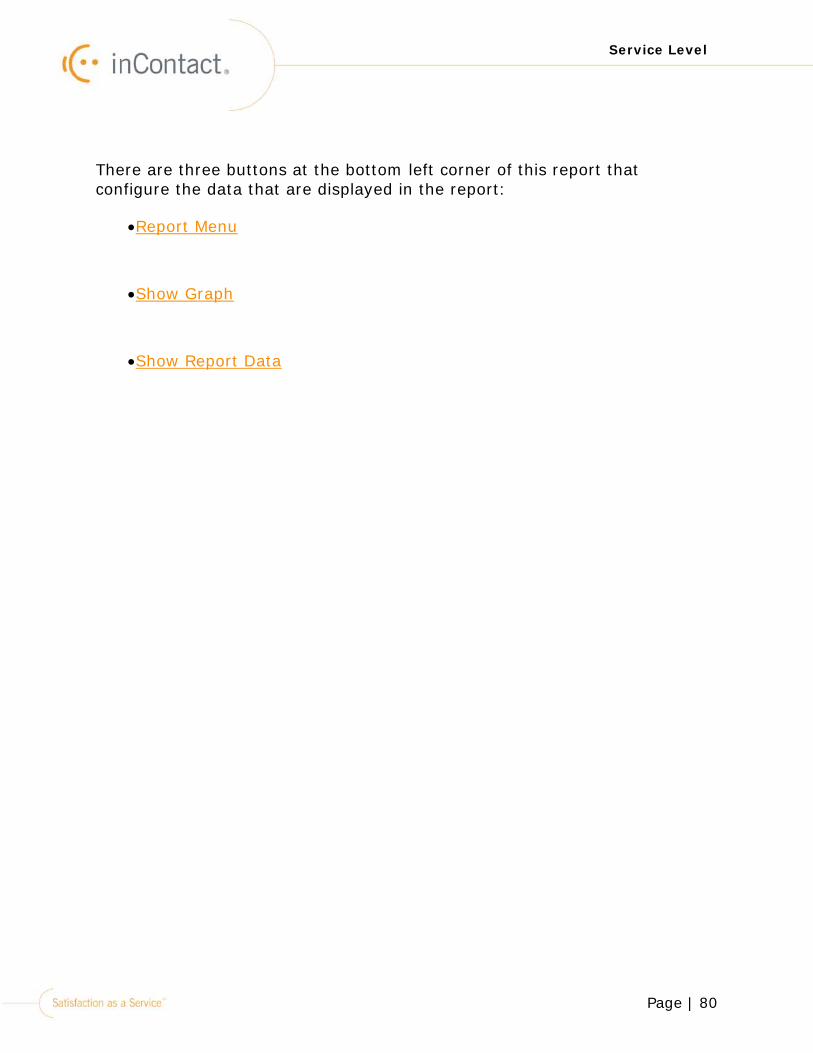
There are three buttons at the bottom left corner of this report that configure the data that are displayed in the report:
•Report Menu
•Show Graph
•Show Report Data
Page | 81
Service Level
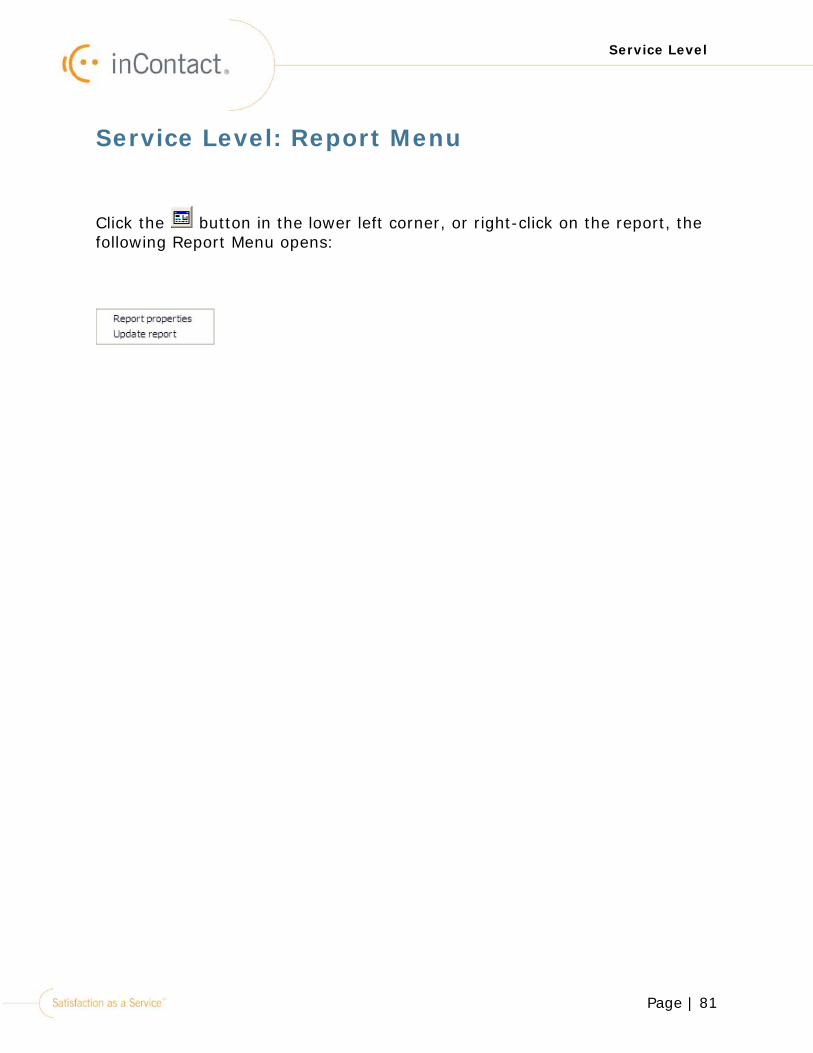
Service Level: Report Menu
Click the button in the lower left corner, or right-click on the report, the following Report Menu opens:
Page | 82
Service Level
Service Level: Update Report
Click Update Report and the Service Level Report is updated. The Service Level Report is updated automatically every two minutes. However, if you want to view data at the current moment, click Update Report to update it immediately.
Page | 83
Service Level
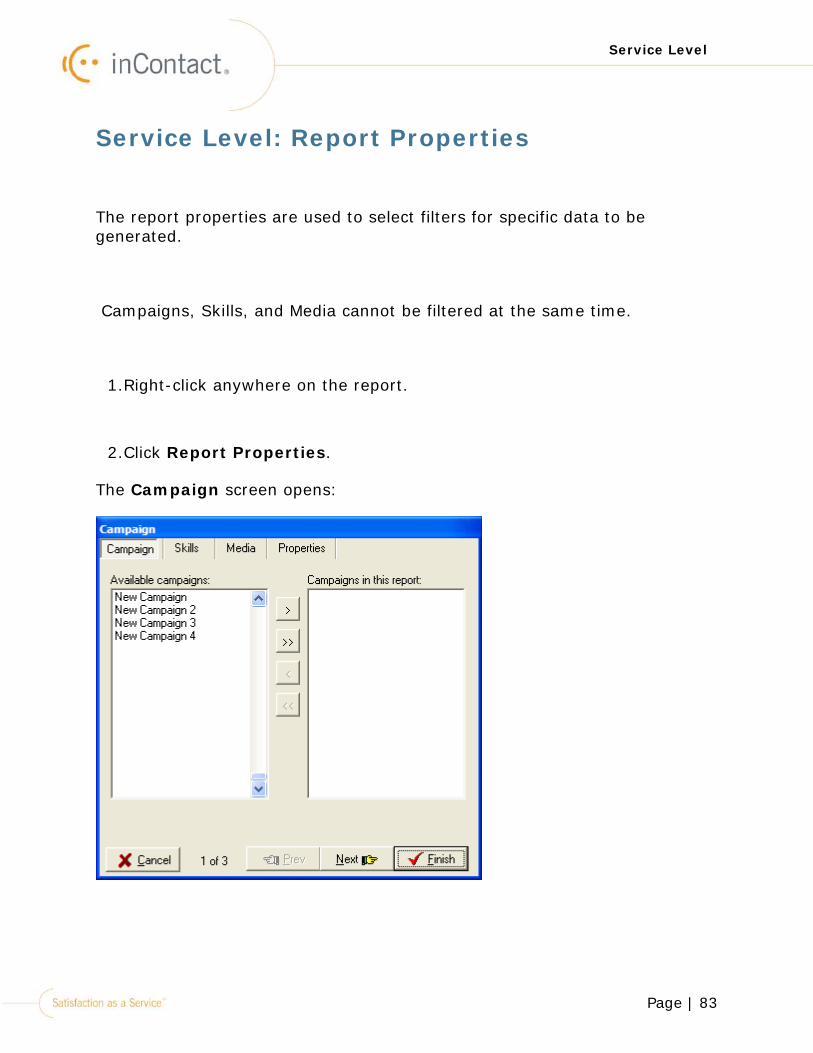
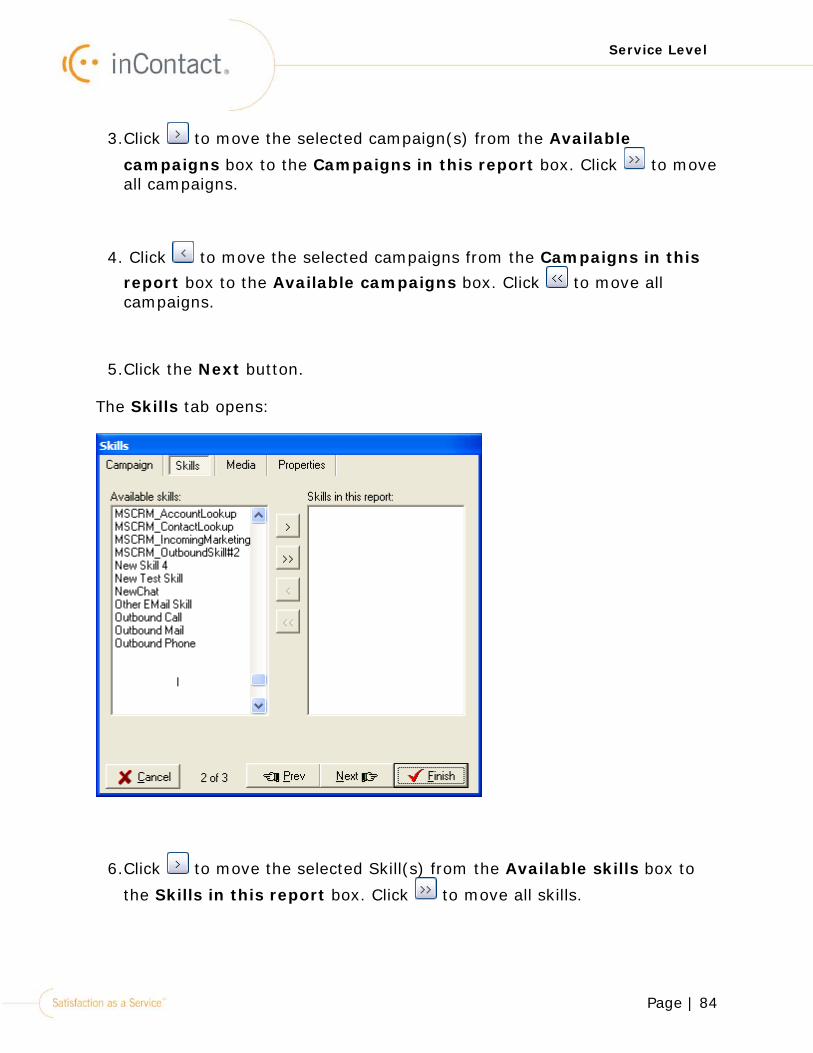
Service Level: Report Properties
The report properties are used to select filters for specific data to be generated.
Campaigns, Skills, and Media cannot be filtered at the same time.
1.Right-click anywhere on the report.
2.Click Report Properties.
The Campaign screen opens:
Page | 84
Service Level
3.Click to move the selected campaign(s) from the Available
campaigns box to the Campaigns in this report box. Click to move all campaigns.
4. Click to move the selected campaigns from the Campaigns in this report box to the Available campaigns box. Click to move all campaigns.
5.Click the Next button.
The Skills tab opens:
6.Click to move the selected Skill(s) from the Available skills box to
the Skills in this report box. Click to move all skills.
Page | 85
Service Level
7. Click to move the selected skills from the Skills in this report box to the Available skills box. Click to move all skills.
8.Click Next.
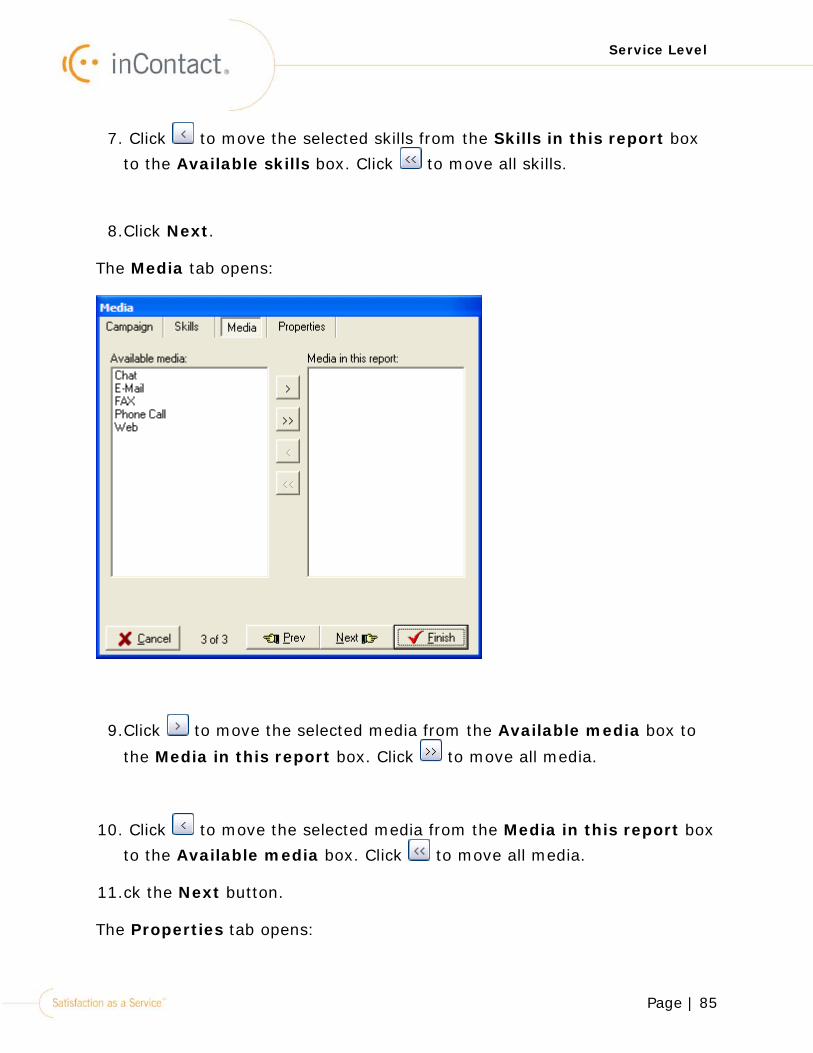
The Media tab opens:
9.Click to move the selected media from the Available media box to
the Media in this report box. Click to move all media.
10. Click to move the selected media from the Media in this report box to the Available media box. Click to move all media.
11.ck the Next button.
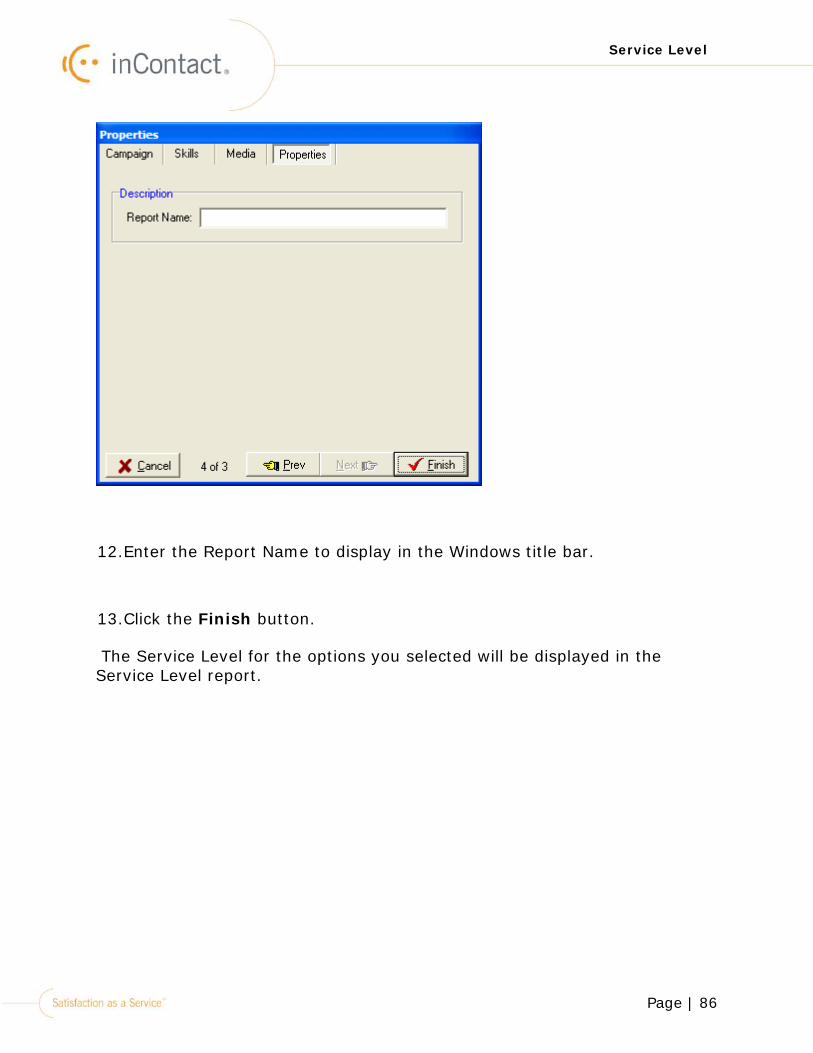
The Properties tab opens:
Page | 86
Service Level
12.Enter the Report Name to display in the Windows title bar.
13.Click the Finish button.
The Service Level for the options you selected will be displayed in the Service Level report.
Page | 87
Service Level
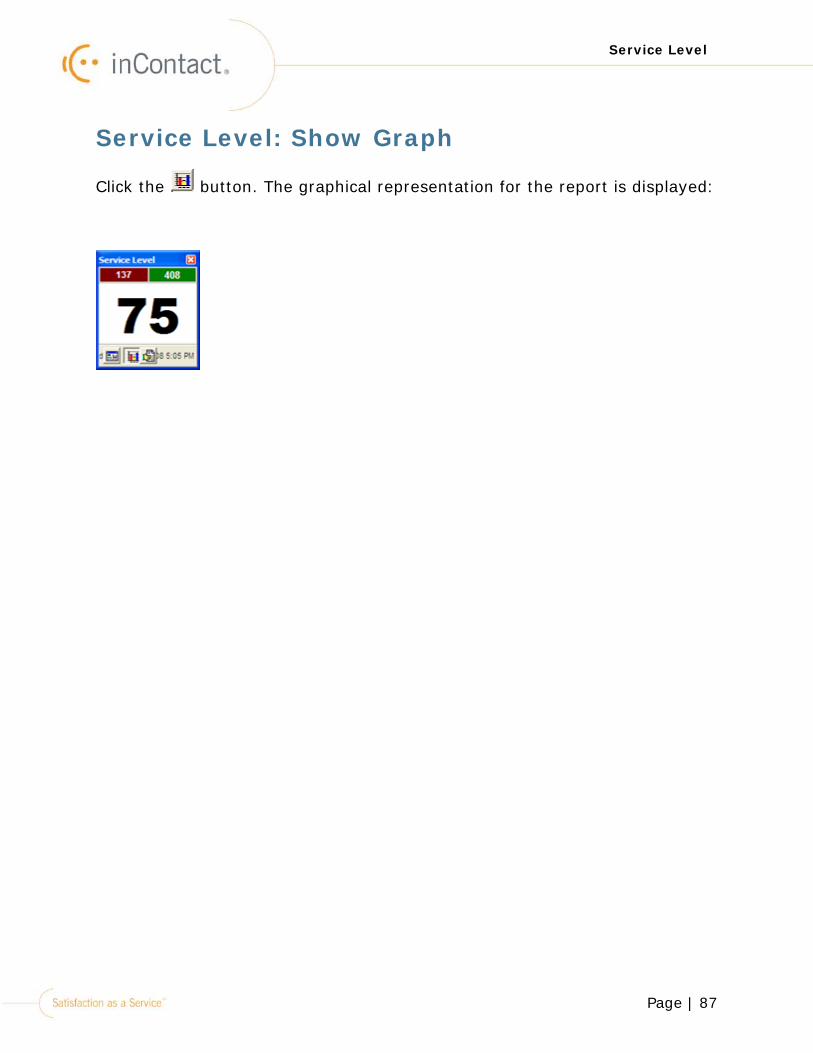
Service Level: Show Graph
Click the button. The graphical representation for the report is displayed:
Page | 88
Service Level
Service Level Report: Show Report Data
Click on the Service Level Report. The data for the report is displayed:
The Service Level chart displays the following columns of data:
Column Description
Skill The skills that were selected (i.e., filtered) in the Report Properties > Skills tab.
In SLA This column shows the number of contacts that were inside the Service Level for the skill listed in the Skill column i.e., they reached the Service Level.
Out SLA This column shows the number of contacts that were outside the Service Level for the skill listed in the Skill column i.e., they never reached the service level.
Offered The number of contacts that entered inContact, but
Page | 89
Service Level
Column Description
never entered the queue. The contacts may have gone through a self-service IVR or the skill may have changed once the contact was in queue.
Service Level The percentage of contacts that reached the Service Level for the skill i.e., the percentage of contacts that were answered in the service level requirement for the skill.
Page | 90
Skill Summary
Skill Summary
The Skill Summary report displays real-time data that automatically refreshes every 60 seconds. The Service Level Agreement fields and Average fields are recalculated every five minutes. You have the ability to change which columns display and add ranges to data that will display in red when outside of the acceptable range.
1.Right-click the icon in the systems tray.
2.Select the Real-Time Console > Skill Summary menu item.
Page | 91
Skill Summary
The inTouch dialog opens
The following fields display:
Field Name Description
Skill Name The name of the skill the data relates to.

Page | 92
Skill Summary
Field Name Description
Cur Queued The Current Queue Count for the skill.
Longest Dur The Longest Duration in Queue in minutes and seconds.
SLA % Service Level percentage.
In SLA The number of contacts in Service Level.
Out SLA The number of contacts out of Service Level.
Agt Log In The number of Agents Logged in Skill.
Agt Working The number of Agents Working in Skill.
Agt Avail The number of Agents in the Available state with Skill.
Agt Unavail The number of Agents in the Unavailable state with Skill.
Incoming The number of inbound Contacts.
Page | 93
Skill Summary
Field Name Description
Queued The number of Queued Contacts.
Handled The number of Contacts Handled.
Hold Time The Hold Time.
Abandon The Abandon Count.
Abandon % The Abandon Rate. The abandon count / inqueue count.
ASA Average Speed to Answer.
Ave Talk Average Talk Time.
Ave Wrap Average Wrap up Time.
Ave Handle Average Handle Time. This includes talk time, hold time and wrap-up time.
Page | 94
Skill Summary
Skill Summary Report: Properties
1.Right-click anywhere in the report window.
2.Select the Report properties menu item
The Campaign window opens.
3.Click to move the selected campaign(s) from the Available campaigns box to the Campaigns in this report box. Click to move all campaigns.
4. Click to move the selected campaigns from the Campaigns in this report box to the Available campaigns box. Click to move all campaigns.
Page | 95
Skill Summary
5.Click the Next button.
The Skills tab opens:
6.Click to move the selected skill(s) from the Available skills box to
the Skills in this report box. Click to move all skills.
7. Click to move the selected skills from the Skills in this report box to the Available skills box. Click to move all skills.
8.Click the Next button.
The Media tab opens:
Page | 96
Skill Summary
9.Click to move the selected media from the Available media box to
the Media in this report box. Click to move all media.
10. Click to move the selected media from the Media in this report box to the Available media box. Click to move all media.
11.Click the Next button.
Both Skills and Media cannot be selected at the same time. Choose one or the other.
The Other tab opens:
Page | 97
Skill Summary
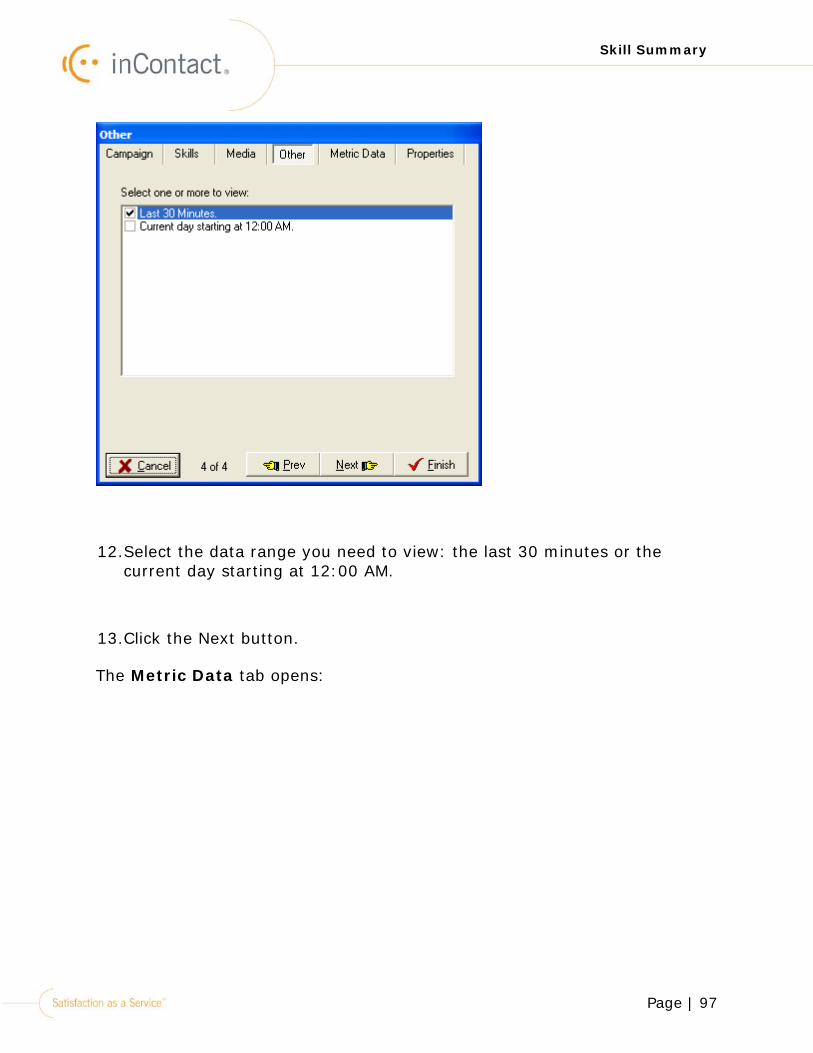
12.Select the data range you need to view: the last 30 minutes or the current day starting at 12:00 AM.
13.Click the Next button.
The Metric Data tab opens:
Page | 98
Skill Summary
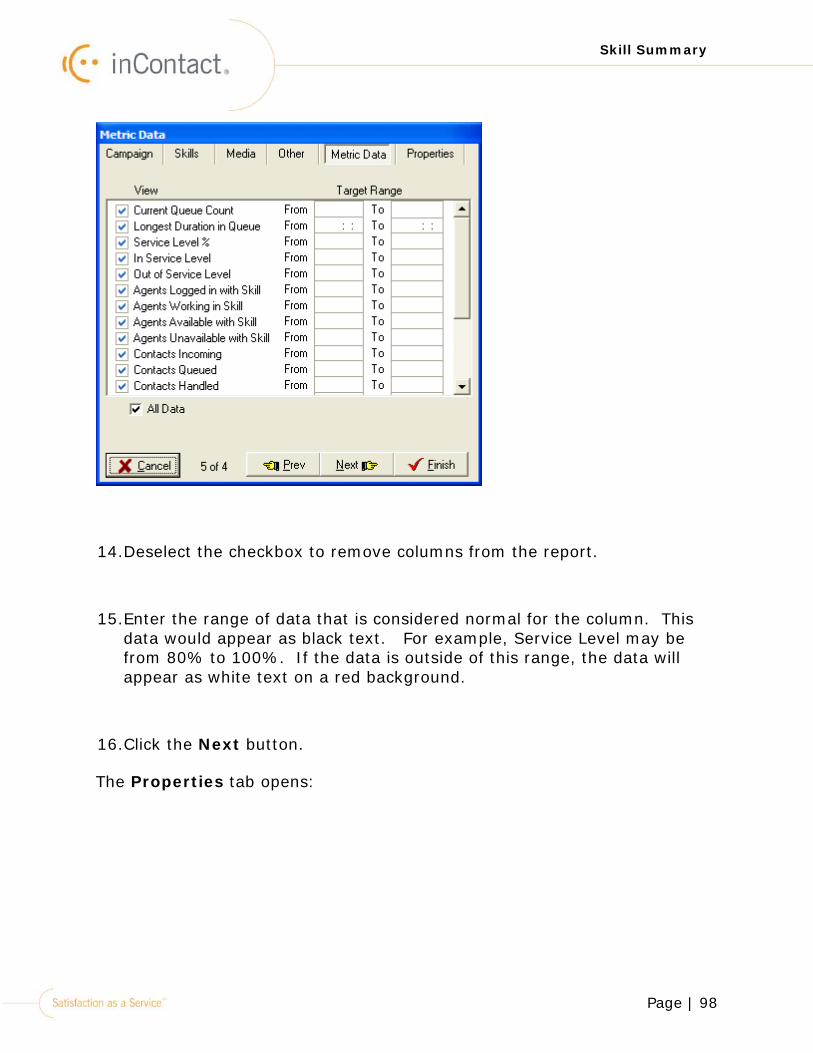
14.Deselect the checkbox to remove columns from the report.
15.Enter the range of data that is considered normal for the column. This data would appear as black text. For example, Service Level may be from 80% to 100%. If the data is outside of this range, the data will appear as white text on a red background.
16.Click the Next button.
The Properties tab opens:
Page | 99
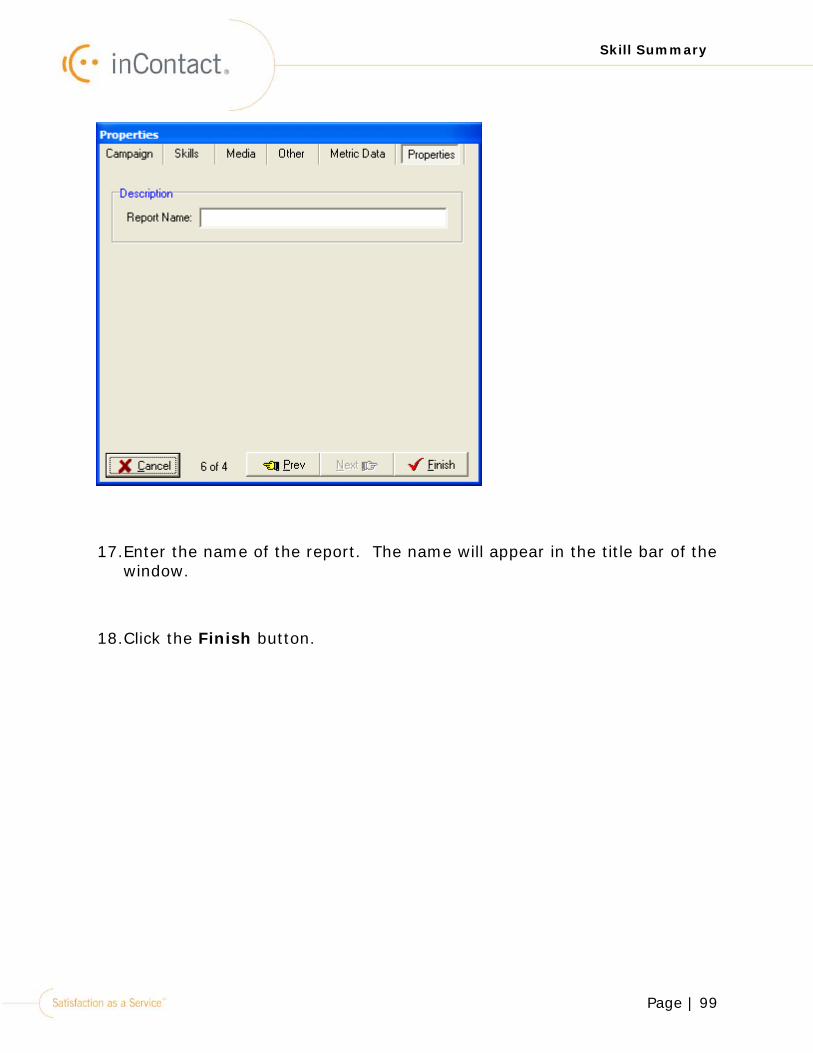
Skill Summary
17.Enter the name of the report. The name will appear in the title bar of the window.
18.Click the Finish button.
Page | 100
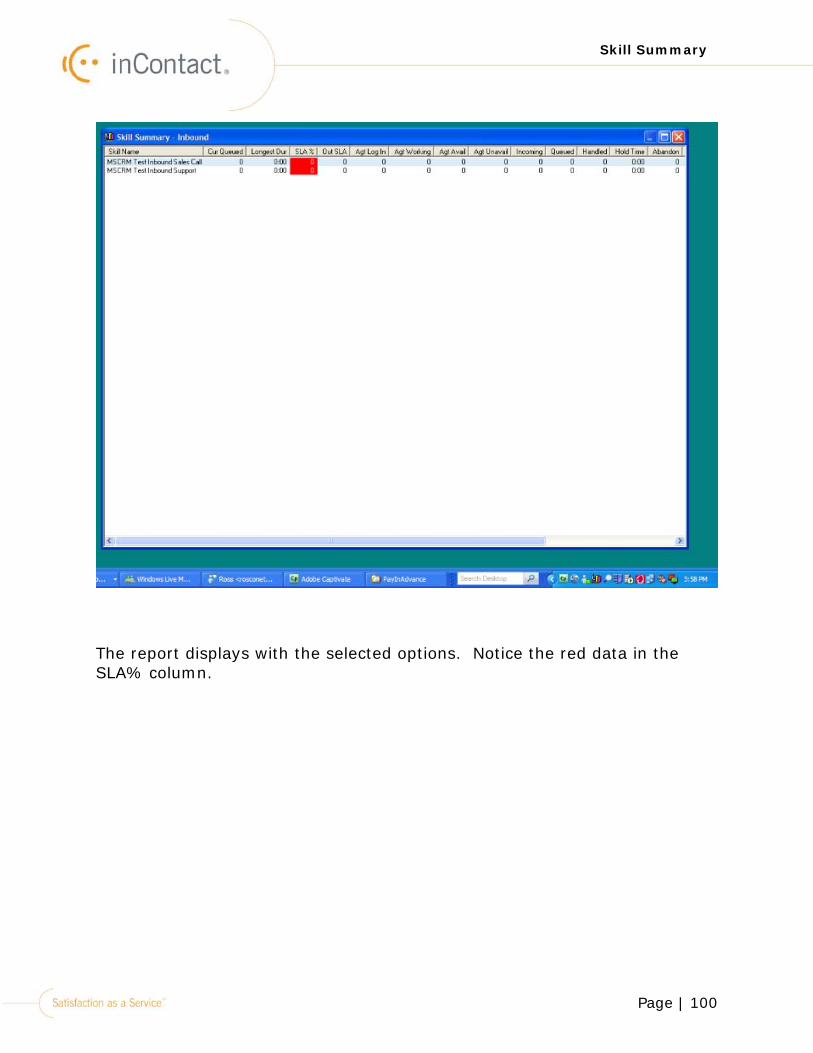
Skill Summary
The report displays with the selected options. Notice the red data in the SLA% column.
Page | 101
Historical Reports
Historical Reports
Historical reports display data about agents, campaigns, skills, and unavailable states in your contact center. Data can be generated for any date range or duration of time (in minutes or seconds) for hour, day, week, and month. Using the buttons in the lower left corner of each report, you can view historical reports as either a graph or a grid of data.
Historical reports do not refresh automatically; however, for the current day, you can refresh them at any time by clicking the Report Menu > Refresh Static Data. After a refresh, the information in an historical report is no older than 120 seconds.
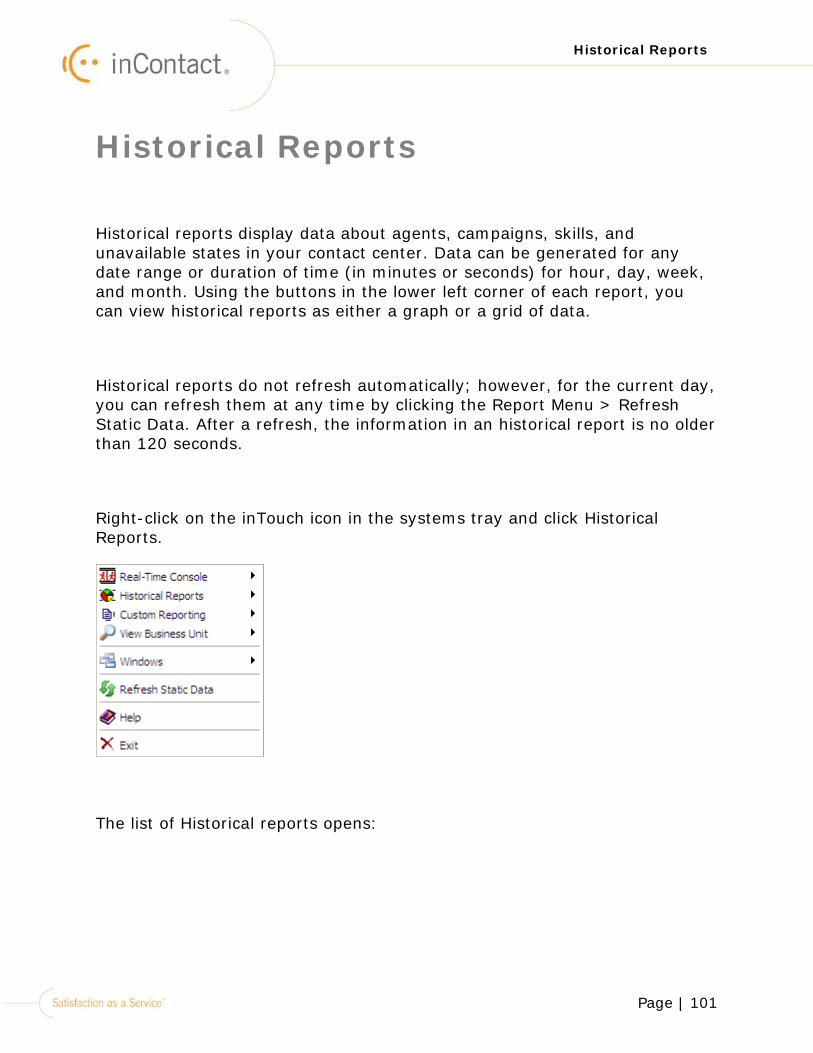
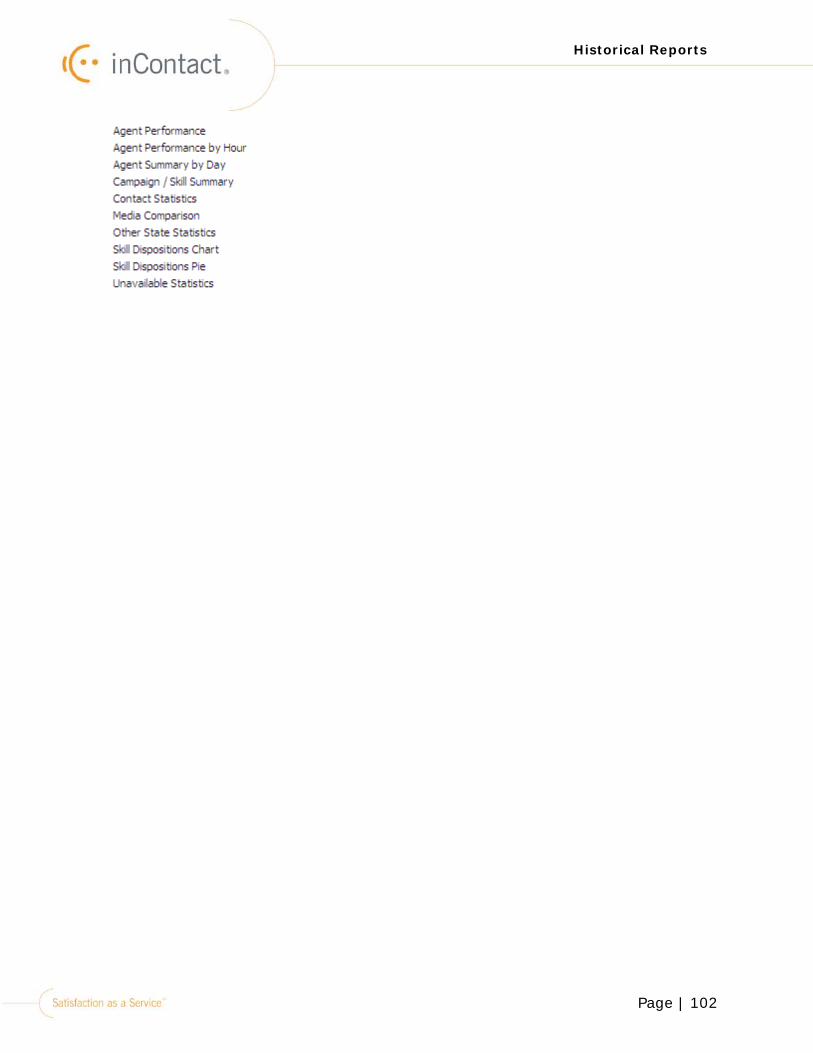
Right-click on the inTouch icon in the systems tray and click Historical Reports.
The list of Historical reports opens:
Page | 102
Historical Reports
Page | 103
Agent Performance
Agent Performance
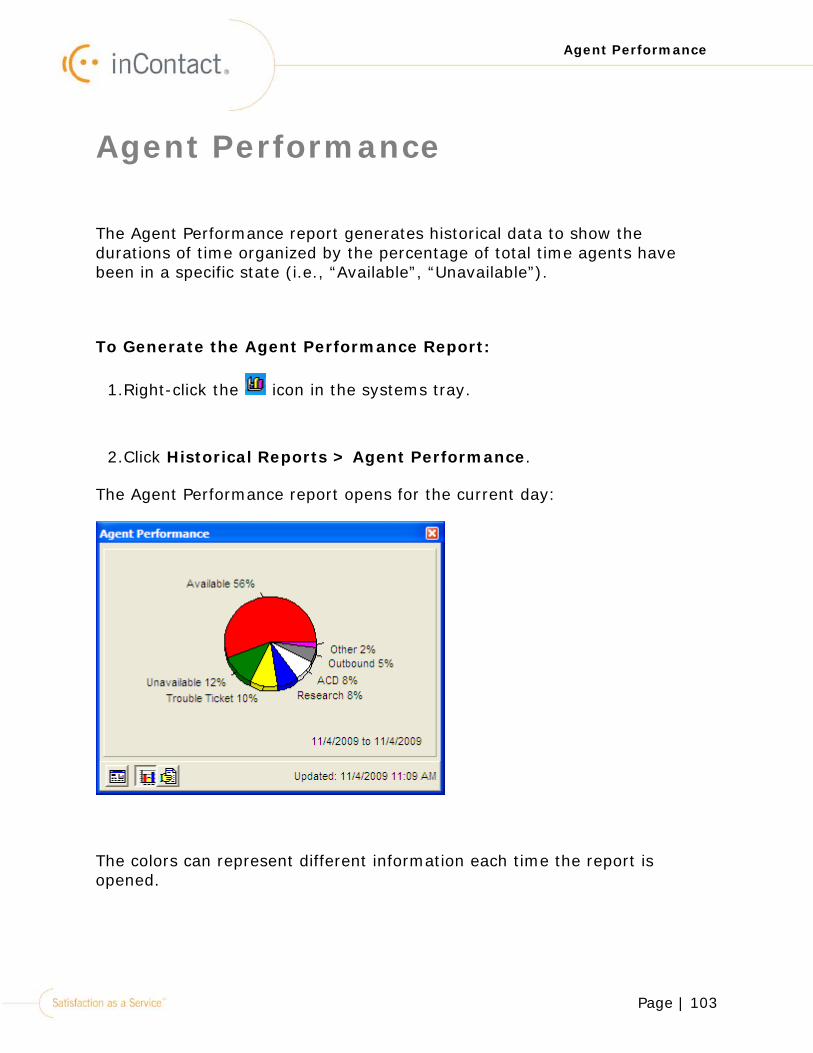
The Agent Performance report generates historical data to show the durations of time organized by the percentage of total time agents have been in a specific state (i.e., “Available”, “Unavailable”).
To Generate the Agent Performance Report:
1.Right-click the icon in the systems tray.
2.Click Historical Reports > Agent Performance.
The Agent Performance report opens for the current day:
The colors can represent different information each time the report is opened.

Page | 104
Agent Performance
Using the three buttons in the lower left corner, different views of the Agent Performance report can be generated according to your business needs:
•Report Menu
•Show Graph
•Show Report Data
Page | 105
Agent Performance
Agent Performance: Report Menu
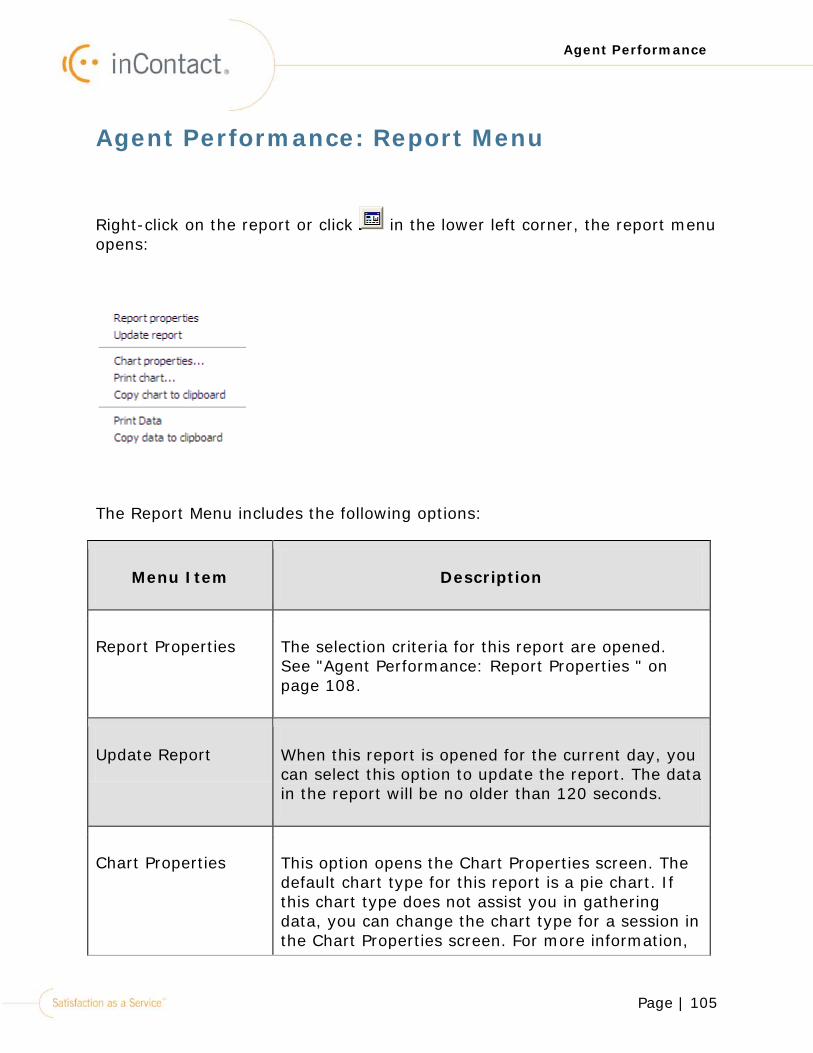
Right-click on the report or click in the lower left corner, the report menu opens:
The Report Menu includes the following options:
Menu Item Description
Report Properties The selection criteria for this report are opened. See "Agent Performance: Report Properties " on page 108.
Update Report When this report is opened for the current day, you can select this option to update the report. The data in the report will be no older than 120 seconds.
Chart Properties This option opens the Chart Properties screen. The default chart type for this report is a pie chart. If this chart type does not assist you in gathering data, you can change the chart type for a session in the Chart Properties screen. For more information,
Page | 106
Agent Performance
Menu Item Description
see "Chart Properties" on page 455.
Print chart Selecting this option opens a screen to specify the information that you what printed. This screen also prints the chart directly to the default printer configured for your computer.
Copy chart to Clipboard
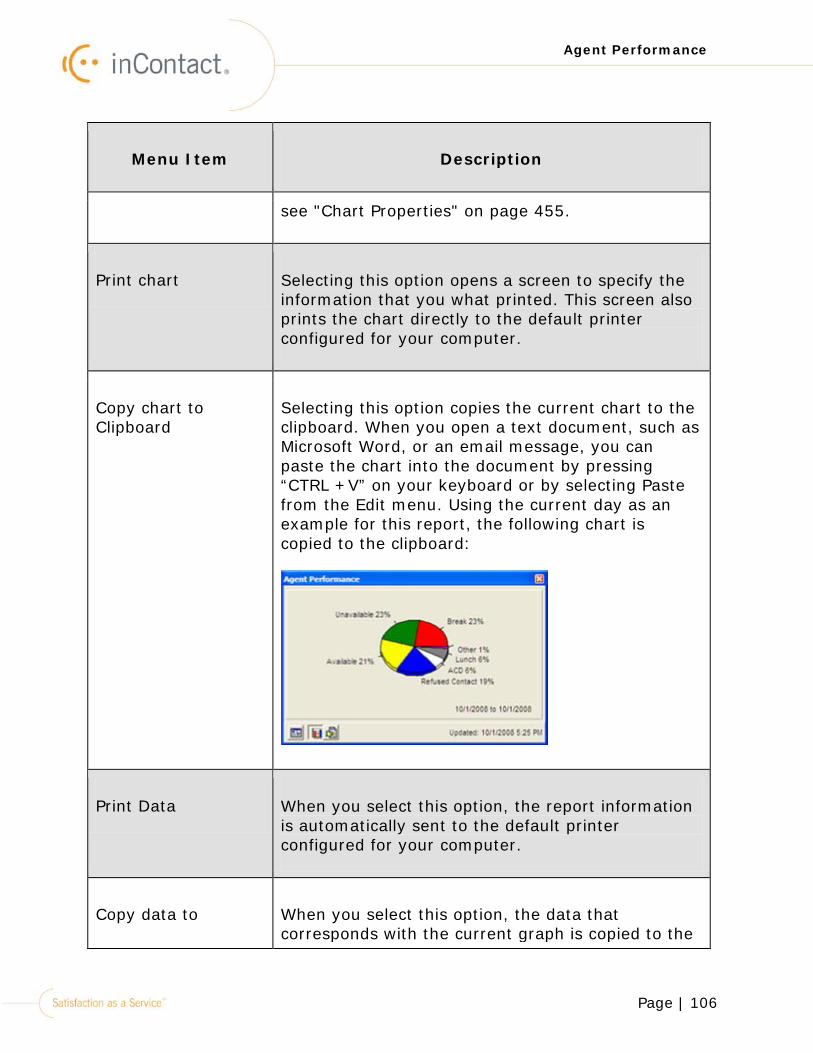
Selecting this option copies the current chart to the clipboard. When you open a text document, such as Microsoft Word, or an email message, you can paste the chart into the document by pressing “CTRL +V” on your keyboard or by selecting Paste from the Edit menu. Using the current day as an example for this report, the following chart is copied to the clipboard:
Print Data When you select this option, the report information is automatically sent to the default printer configured for your computer.
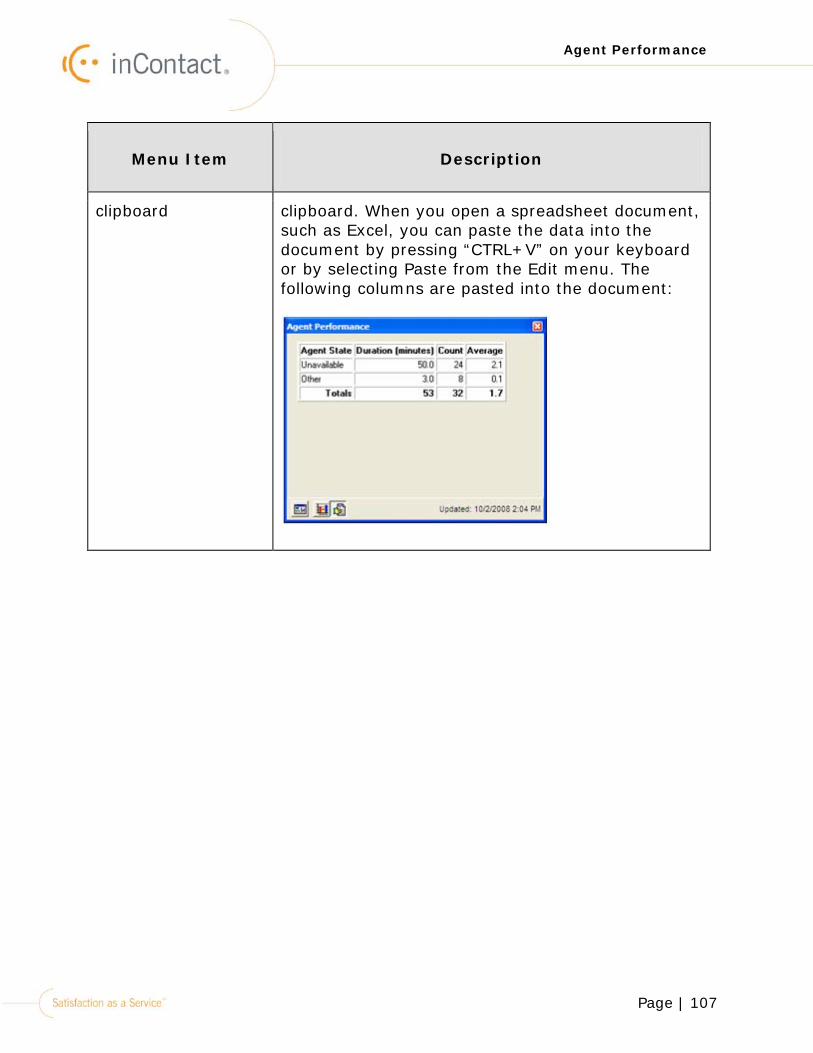
Copy data to When you select this option, the data that corresponds with the current graph is copied to the
Page | 107
Agent Performance
Menu Item Description
clipboard clipboard. When you open a spreadsheet document, such as Excel, you can paste the data into the document by pressing “CTRL+V” on your keyboard or by selecting Paste from the Edit menu. The following columns are pasted into the document:
Page | 108
Agent Performance
Agent Performance: Report Properties
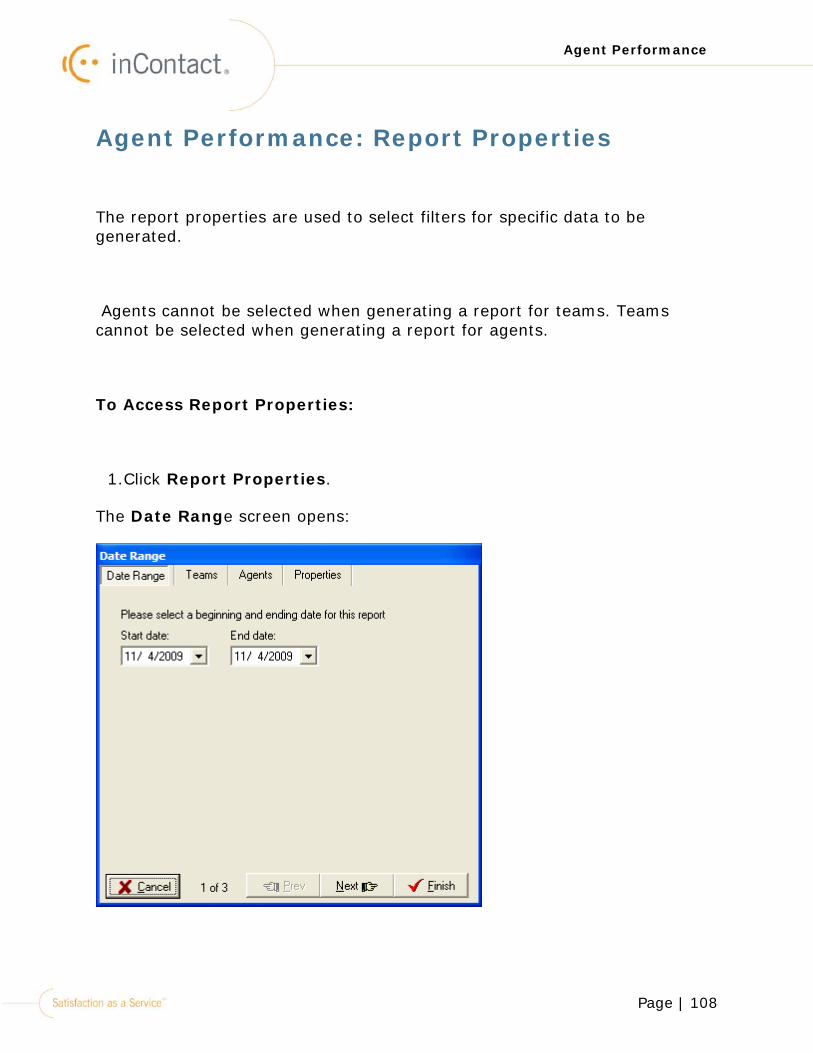
The report properties are used to select filters for specific data to be generated.
Agents cannot be selected when generating a report for teams. Teams cannot be selected when generating a report for agents.
To Access Report Properties:
1.Click Report Properties.
The Date Range screen opens:

Page | 109
Agent Performance
2.Select the Start date for the report.
3.Select the End date for the report.
4.Click the Next button.
The Teams tab opens:
5.Click to move the selected team(s) from the Available teams box to
the Teams in this report box. Click to move all teams.
6. Click to move the selected teams from the Teams in this report box to the Available teams box. Click to move all teams.
Page | 110
Agent Performance
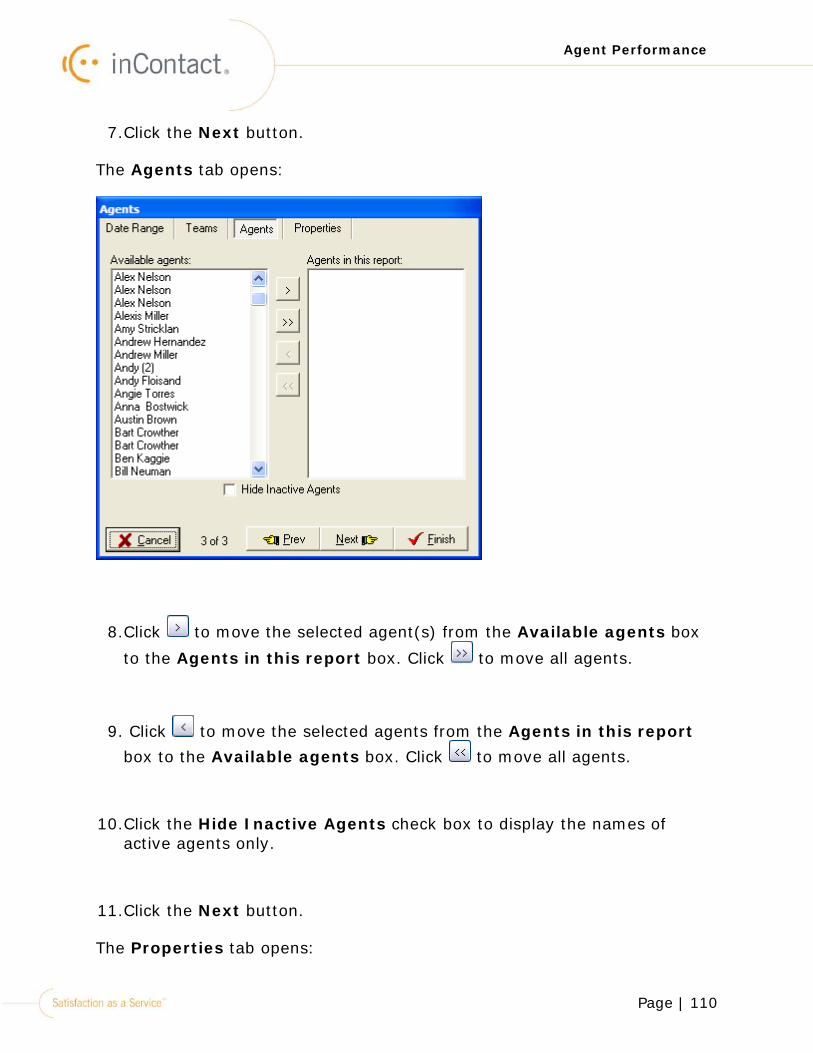
7.Click the Next button.
The Agents tab opens:
8.Click to move the selected agent(s) from the Available agents box
to the Agents in this report box. Click to move all agents.
9. Click to move the selected agents from the Agents in this report box to the Available agents box. Click to move all agents.
10.Click the Hide Inactive Agents check box to display the names of active agents only.
11.Click the Next button.
The Properties tab opens:
Page | 111
Agent Performance
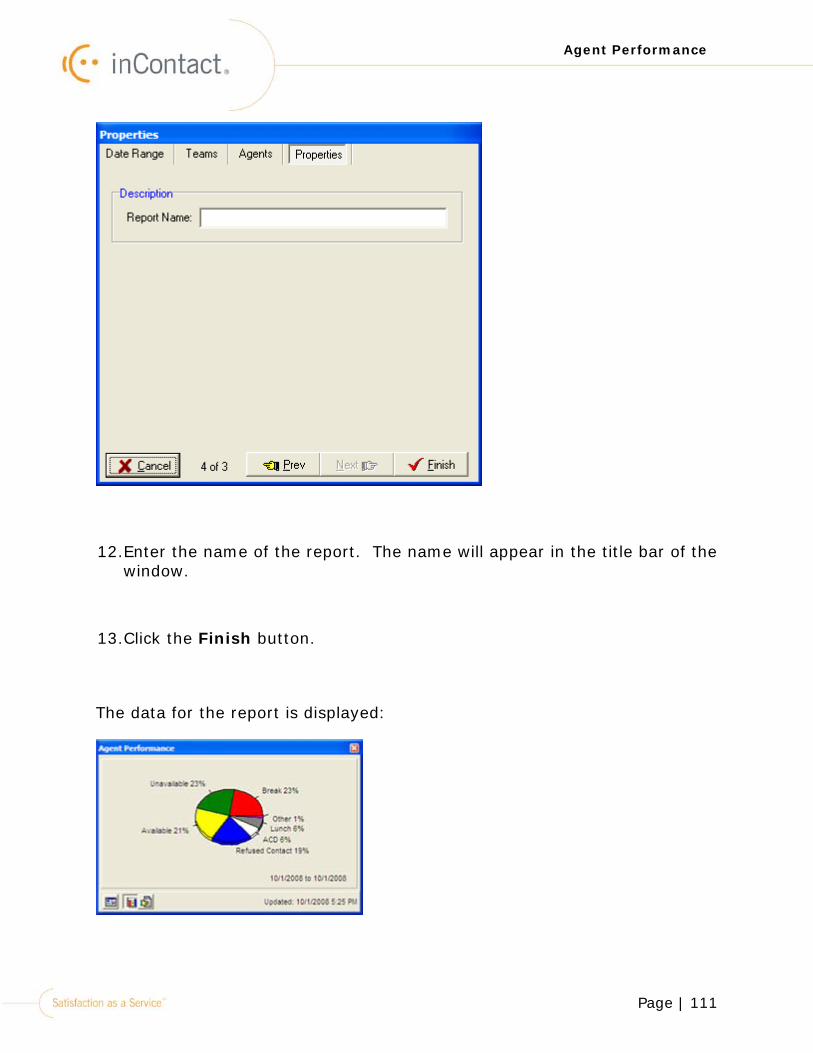
12.Enter the name of the report. The name will appear in the title bar of the window.
13.Click the Finish button.
The data for the report is displayed:
Page | 112
Agent Performance
Agent Performance: Show Graph
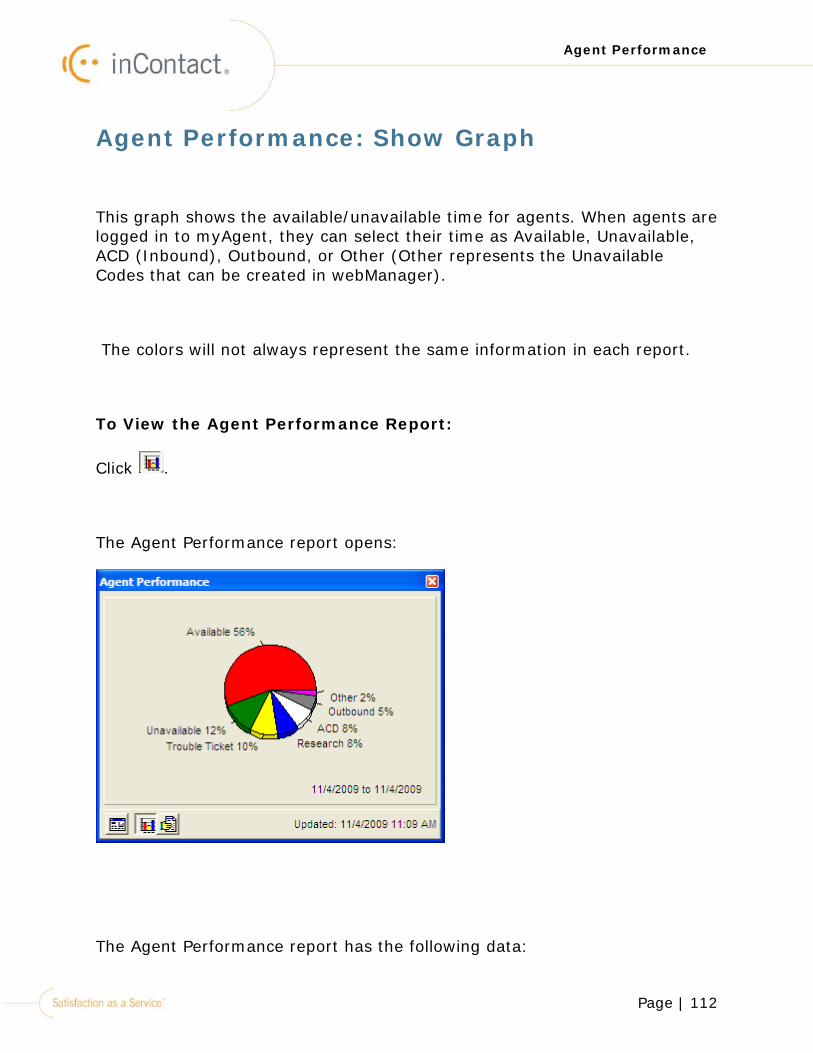
This graph shows the available/unavailable time for agents. When agents are logged in to myAgent, they can select their time as Available, Unavailable, ACD (Inbound), Outbound, or Other (Other represents the Unavailable Codes that can be created in webManager).
The colors will not always represent the same information in each report.
To View the Agent Performance Report:
Click .
The Agent Performance report opens:
The Agent Performance report has the following data:
Page | 113
Agent Performance
Name Description
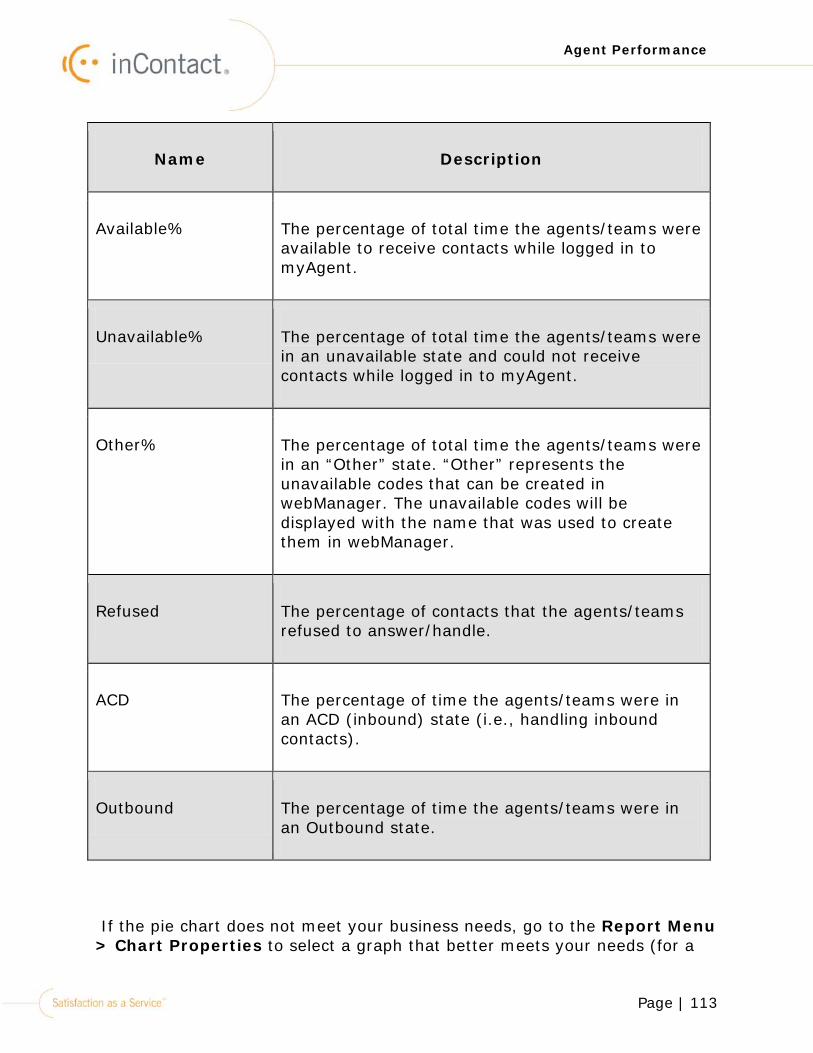
Available% The percentage of total time the agents/teams were available to receive contacts while logged in to myAgent.
Unavailable% The percentage of total time the agents/teams were in an unavailable state and could not receive contacts while logged in to myAgent.
Other% The percentage of total time the agents/teams were in an “Other” state. “Other” represents the unavailable codes that can be created in webManager. The unavailable codes will be displayed with the name that was used to create them in webManager.
Refused The percentage of contacts that the agents/teams refused to answer/handle.
ACD The percentage of time the agents/teams were in an ACD (inbound) state (i.e., handling inbound contacts).
Outbound The percentage of time the agents/teams were in an Outbound state.
If the pie chart does not meet your business needs, go to the Report Menu > Chart Properties to select a graph that better meets your needs (for a
Page | 114
Agent Performance
session). For more information on changing the chart type. See "Chart Properties" on page 455.
Page | 115
Agent Performance
Agent Performance: Show Report Data
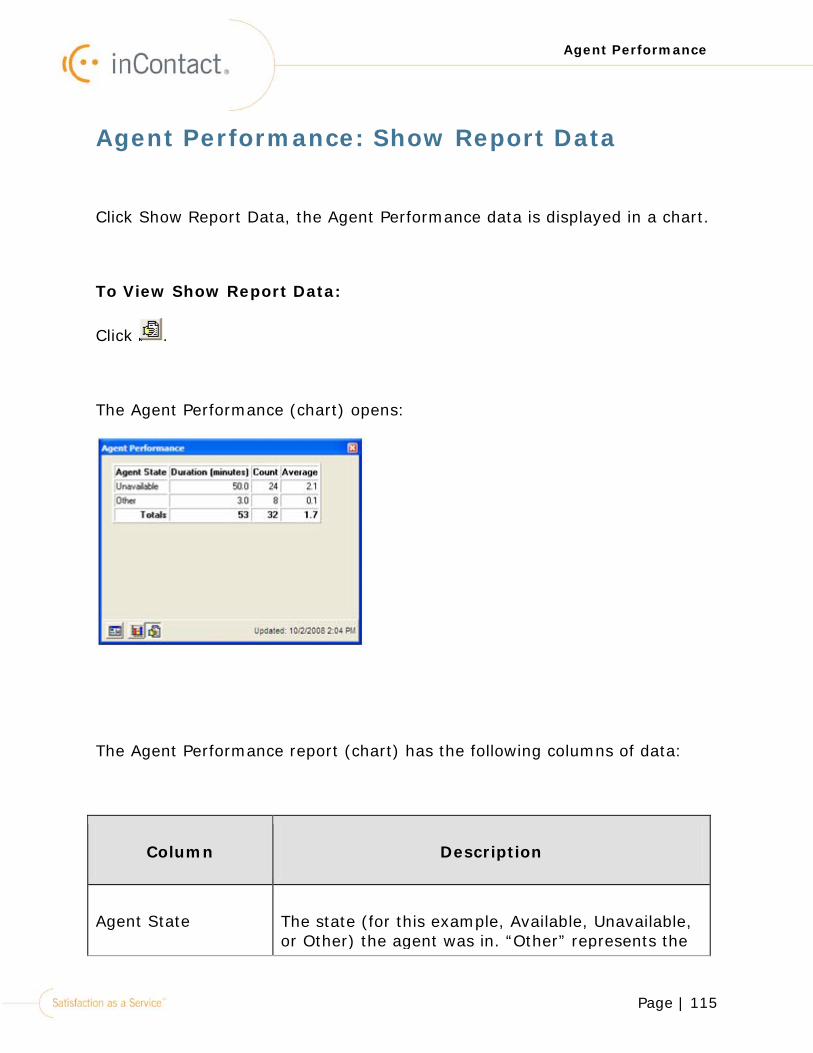
Click Show Report Data, the Agent Performance data is displayed in a chart.
To View Show Report Data:
Click .
The Agent Performance (chart) opens:
The Agent Performance report (chart) has the following columns of data:
Column Description
Agent State The state (for this example, Available, Unavailable, or Other) the agent was in. “Other” represents the
Page | 116
Agent Performance
Column Description
unavailable codes that are created in webManager. The names of the Unavailable codes will be displayed in the Agent State.
Duration (min) The duration of time (in minutes) the agent was in the Agent State.
Count The number of times the agent went to the agent state.
Average The average duration of time an agent was in the agent state.
Totals The totals for each column.
Select “Copy data to clipboard” from the Report Menu. The data will be copied to the clipboard. You can then open a spreadsheet program such as Excel and press “CTRL + V” to paste the data in to the file, or select “Paste” from the Edit menu.
Page | 117
Agent Performance by Hour
Agent Performance by Hour
The Agent Performance by Hour report generates data to show the number of state changes per hour for each agent. You can view the number of times an agent was Available, Unavailable, etc.
For example, you could view what happens from 10:00 A.M. - 1:00 P.M. every day. You could also view whether or not the contact volume increases or decreases and then make an informed decision for scheduling agents based on the patterns you see in this report.
Agents cannot be selected when generating a report for teams. Teams cannot be selected when generating a report for agents.
To Generate the Agent Performance by Hour Report:
1.Right-click the icon in the systems tray.
2.Click Historical Reports > Agent Performance by Hour.
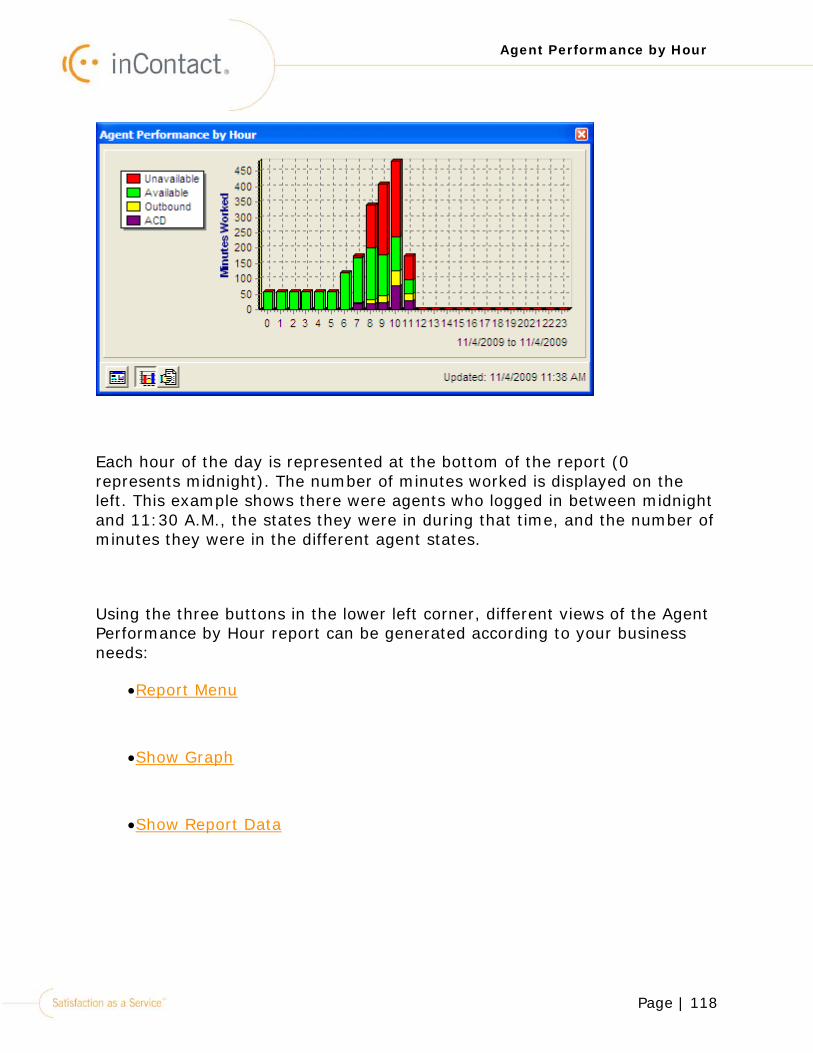
The Agent Performance by Hour report opens:
Page | 118
Agent Performance by Hour
Each hour of the day is represented at the bottom of the report (0 represents midnight). The number of minutes worked is displayed on the left. This example shows there were agents who logged in between midnight and 11:30 A.M., the states they were in during that time, and the number of minutes they were in the different agent states.
Using the three buttons in the lower left corner, different views of the Agent Performance by Hour report can be generated according to your business needs:
•Report Menu
•Show Graph
•Show Report Data
Page | 119
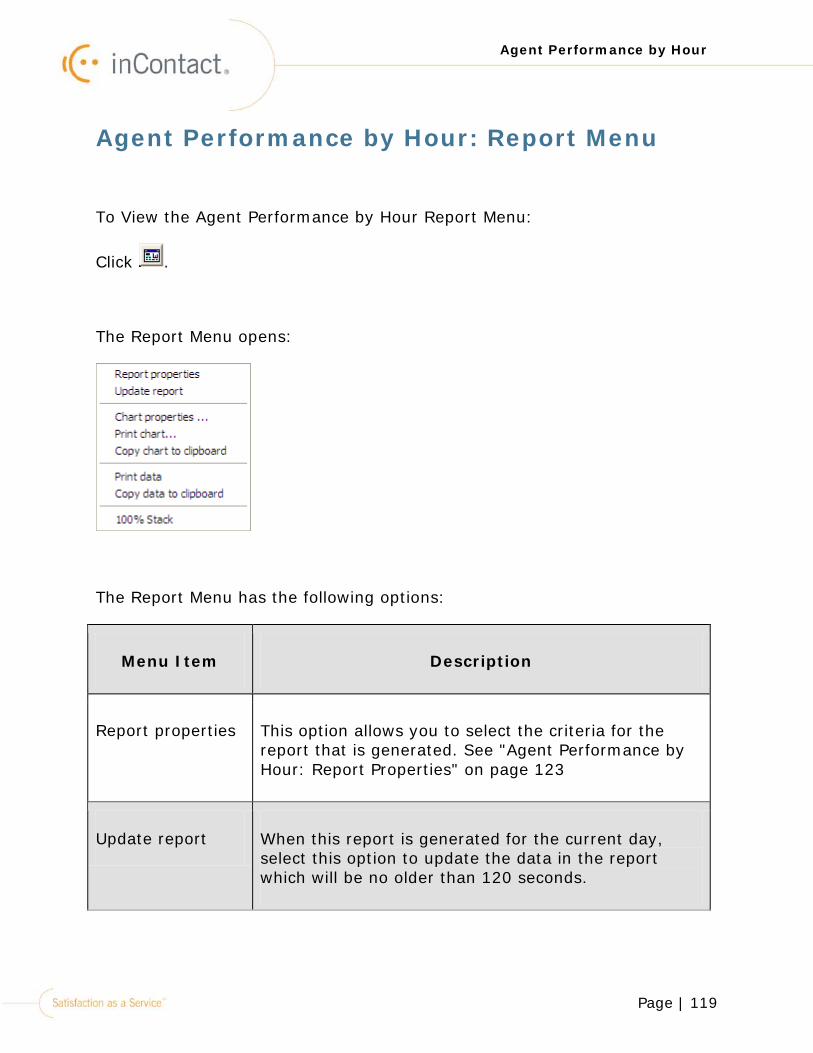
Agent Performance by Hour
Agent Performance by Hour: Report Menu
To View the Agent Performance by Hour Report Menu:
Click .
The Report Menu opens:
The Report Menu has the following options:
Menu Item Description
Report properties This option allows you to select the criteria for the report that is generated. See "Agent Performance by Hour: Report Properties" on page 123
Update report When this report is generated for the current day, select this option to update the data in the report which will be no older than 120 seconds.
Page | 120
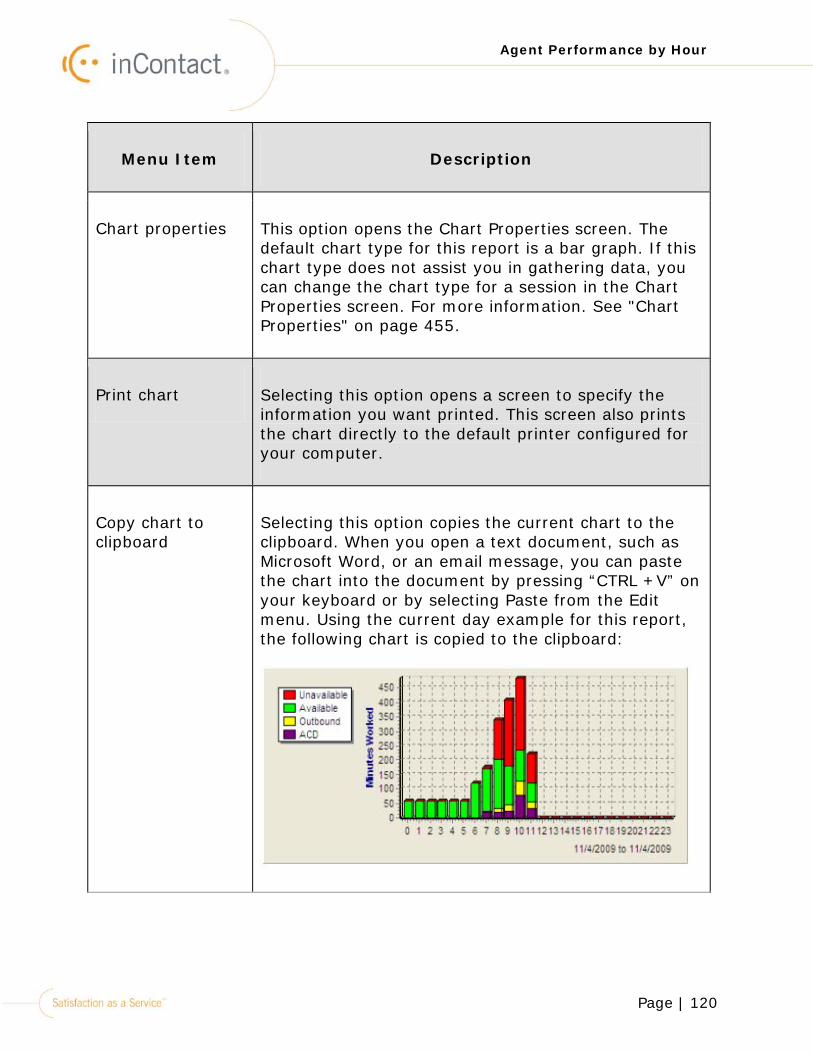
Agent Performance by Hour
Menu Item Description
Chart properties This option opens the Chart Properties screen. The default chart type for this report is a bar graph. If this chart type does not assist you in gathering data, you can change the chart type for a session in the Chart Properties screen. For more information. See "Chart Properties" on page 455.
Print chart Selecting this option opens a screen to specify the information you want printed. This screen also prints the chart directly to the default printer configured for your computer.
Copy chart to clipboard
Selecting this option copies the current chart to the clipboard. When you open a text document, such as Microsoft Word, or an email message, you can paste the chart into the document by pressing “CTRL +V” on your keyboard or by selecting Paste from the Edit menu. Using the current day example for this report, the following chart is copied to the clipboard:
Page | 121
Agent Performance by Hour
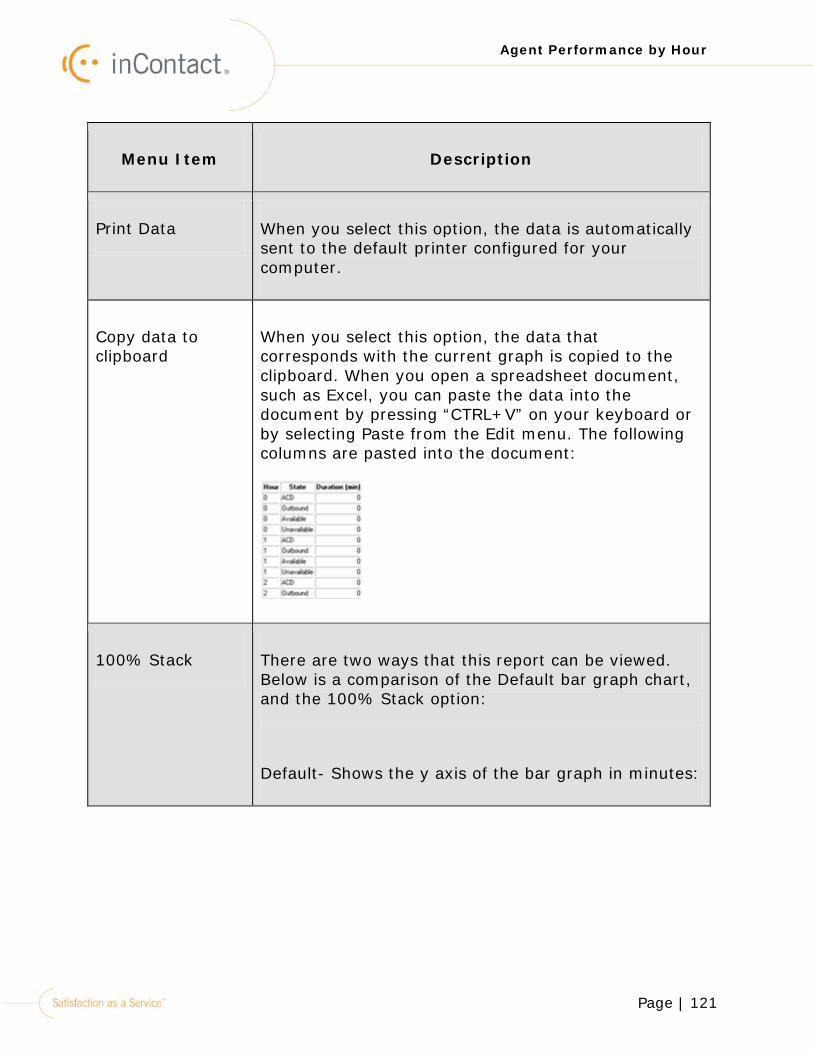
Menu Item Description
Print Data When you select this option, the data is automatically sent to the default printer configured for your computer.
Copy data to clipboard
When you select this option, the data that corresponds with the current graph is copied to the clipboard. When you open a spreadsheet document, such as Excel, you can paste the data into the document by pressing “CTRL+V” on your keyboard or by selecting Paste from the Edit menu. The following columns are pasted into the document:
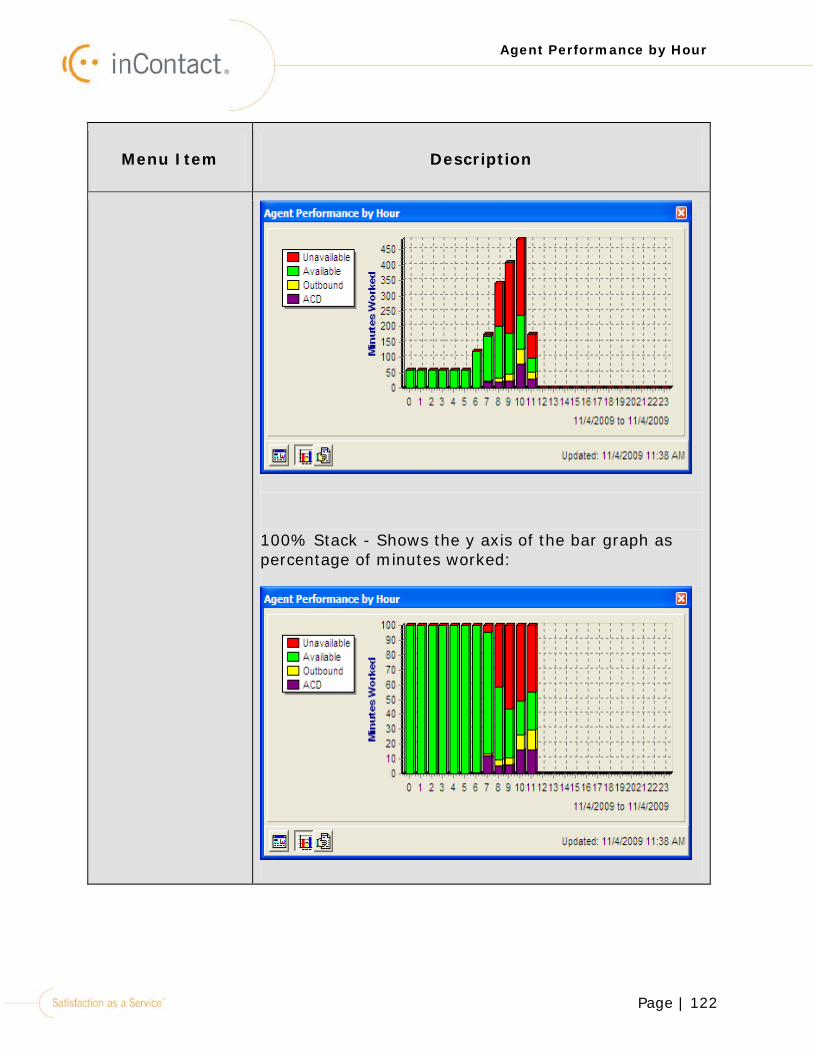
100% Stack There are two ways that this report can be viewed. Below is a comparison of the Default bar graph chart, and the 100% Stack option:
Default- Shows the y axis of the bar graph in minutes:
Page | 122
Agent Performance by Hour
Menu Item Description
100% Stack - Shows the y axis of the bar graph as percentage of minutes worked:
Page | 123
Agent Performance by Hour
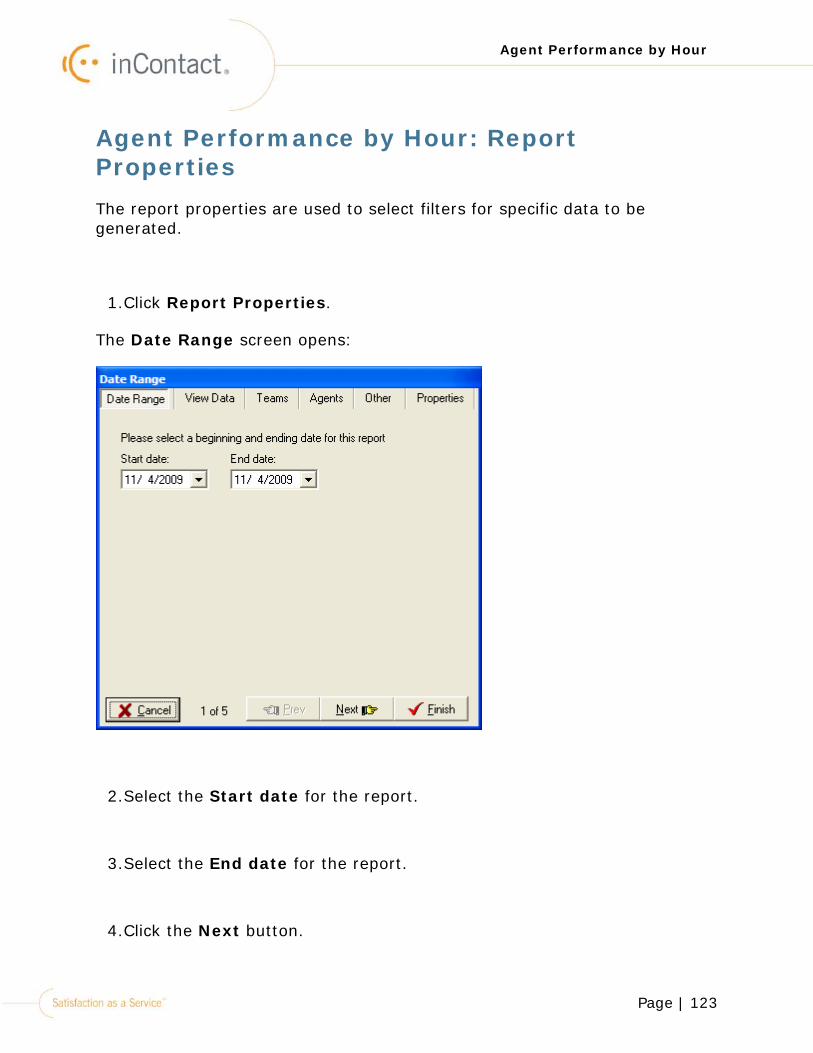
Agent Performance by Hour: Report Properties The report properties are used to select filters for specific data to be generated.
1.Click Report Properties.
The Date Range screen opens:
2.Select the Start date for the report.
3.Select the End date for the report.
4.Click the Next button.
Page | 124
Agent Performance by Hour
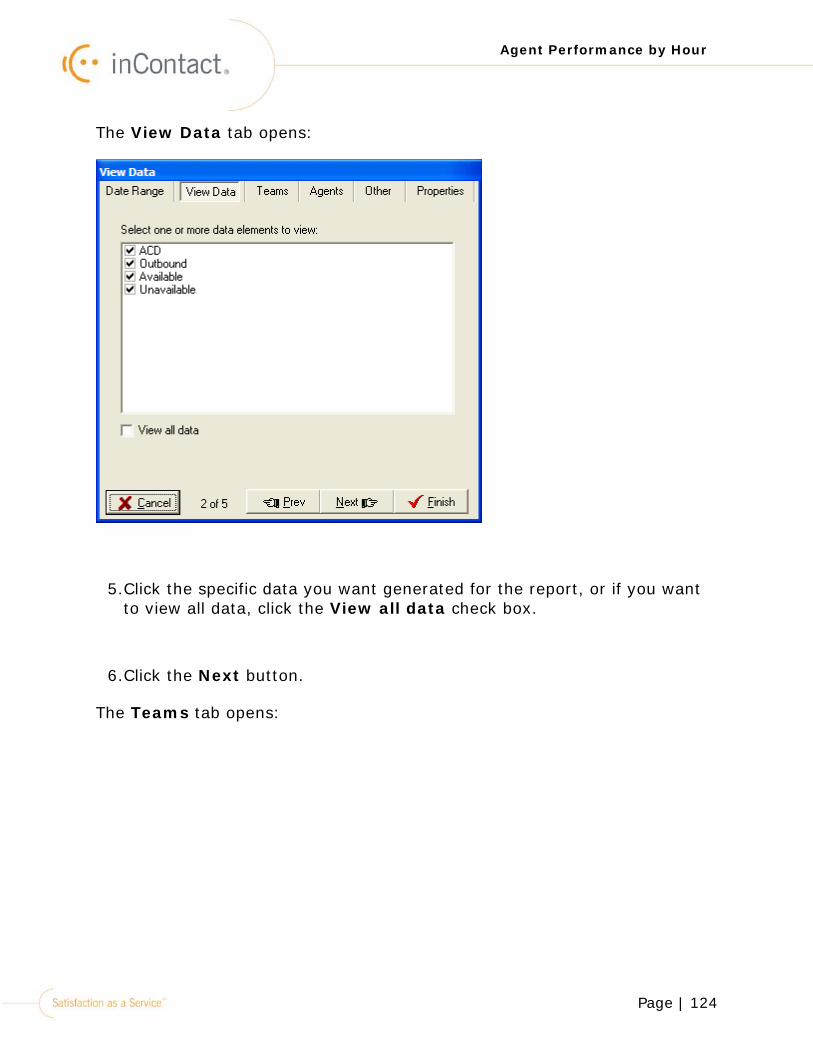
The View Data tab opens:
5.Click the specific data you want generated for the report, or if you want to view all data, click the View all data check box.
6.Click the Next button.
The Teams tab opens:
Page | 125
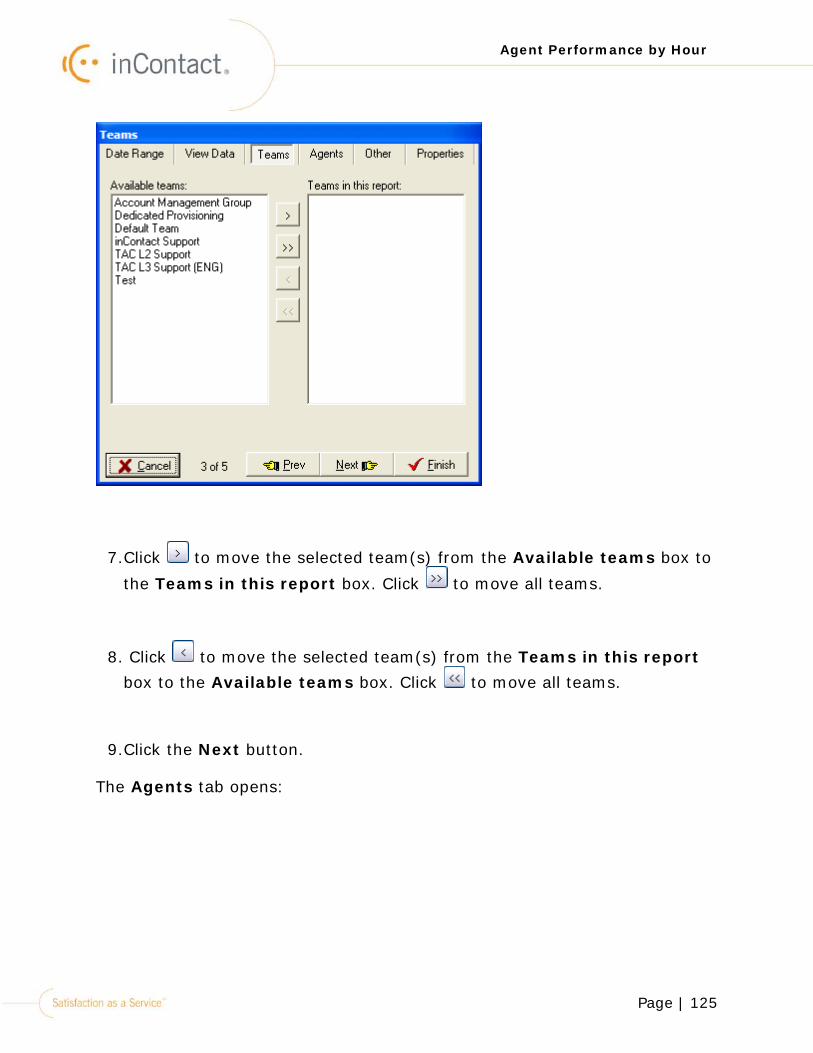
Agent Performance by Hour
7.Click to move the selected team(s) from the Available teams box to
the Teams in this report box. Click to move all teams.
8. Click to move the selected team(s) from the Teams in this report box to the Available teams box. Click to move all teams.
9.Click the Next button.
The Agents tab opens:
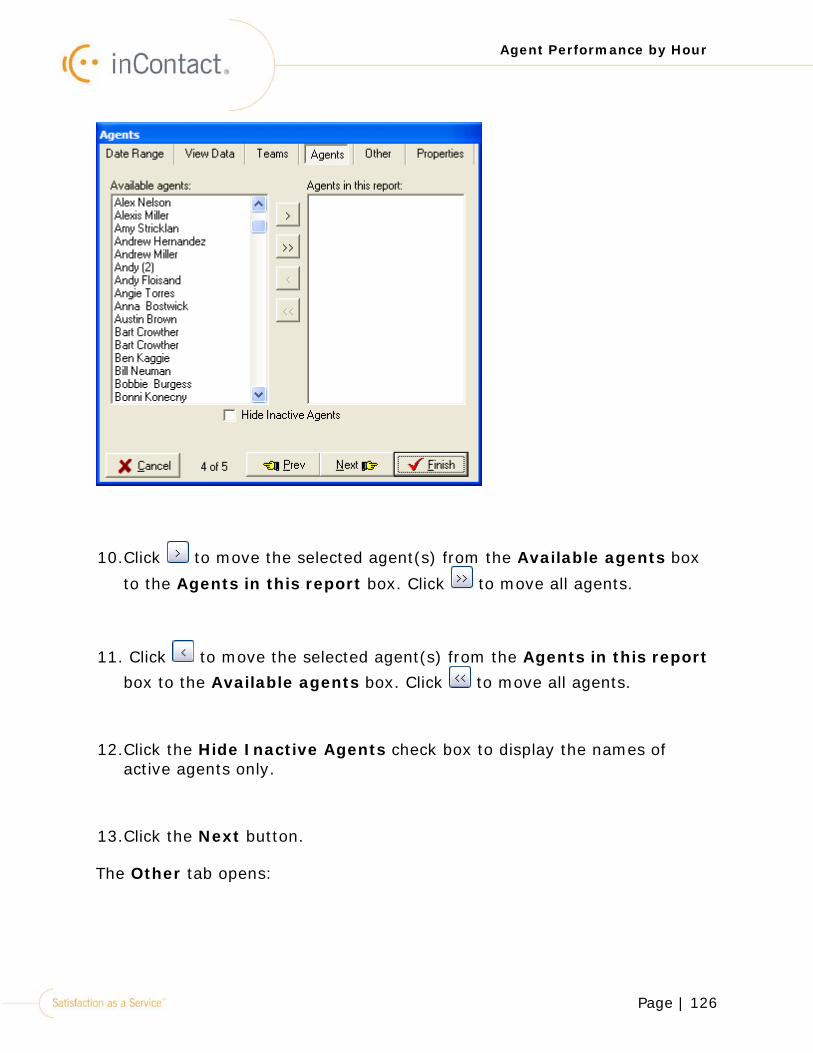
Page | 126
Agent Performance by Hour
10.Click to move the selected agent(s) from the Available agents box
to the Agents in this report box. Click to move all agents.
11. Click to move the selected agent(s) from the Agents in this report box to the Available agents box. Click to move all agents.
12.Click the Hide Inactive Agents check box to display the names of active agents only.
13.Click the Next button.
The Other tab opens:
Page | 127
Agent Performance by Hour
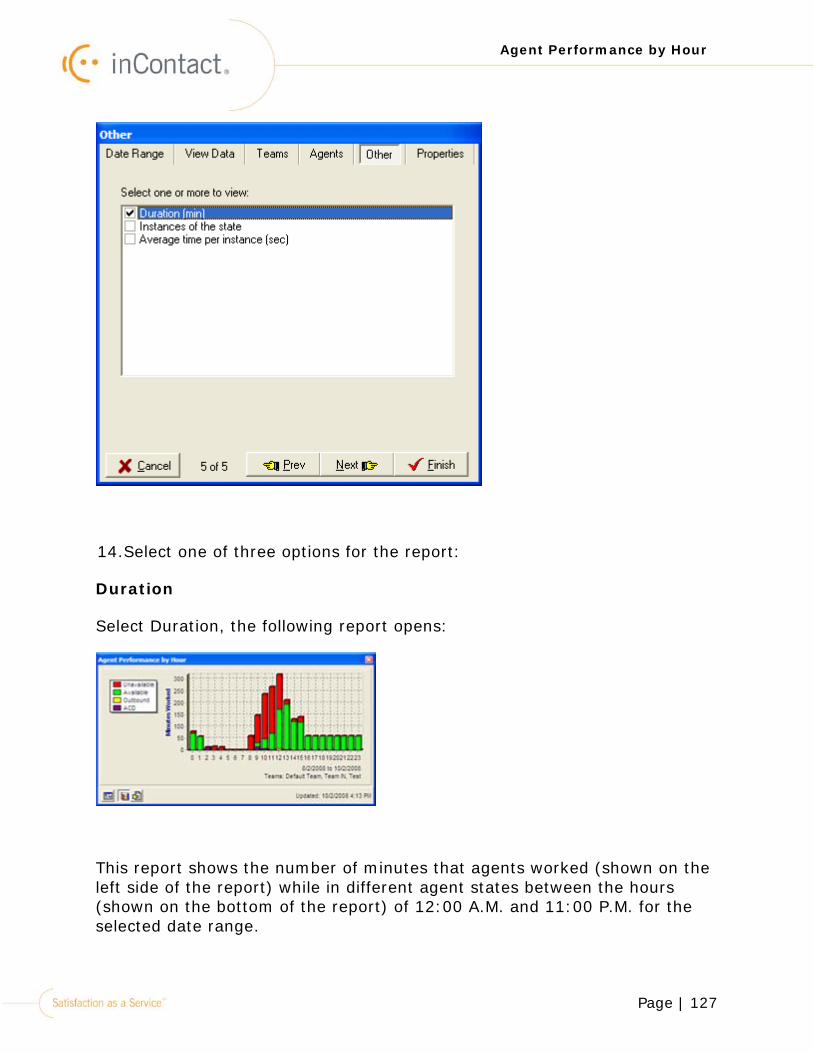
14.Select one of three options for the report:
Duration
Select Duration, the following report opens:
This report shows the number of minutes that agents worked (shown on the left side of the report) while in different agent states between the hours (shown on the bottom of the report) of 12:00 A.M. and 11:00 P.M. for the selected date range.
Page | 128
Agent Performance by Hour
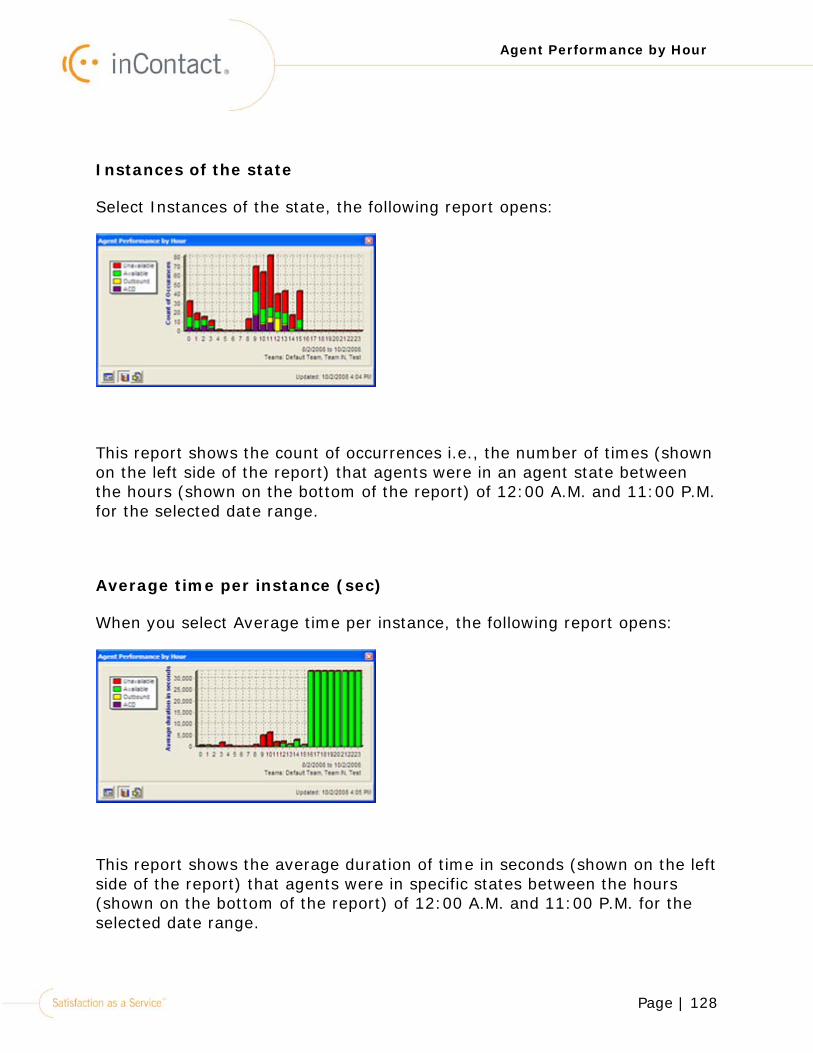
Instances of the state
Select Instances of the state, the following report opens:
This report shows the count of occurrences i.e., the number of times (shown on the left side of the report) that agents were in an agent state between the hours (shown on the bottom of the report) of 12:00 A.M. and 11:00 P.M. for the selected date range.
Average time per instance (sec)
When you select Average time per instance, the following report opens:
This report shows the average duration of time in seconds (shown on the left side of the report) that agents were in specific states between the hours (shown on the bottom of the report) of 12:00 A.M. and 11:00 P.M. for the selected date range.
Page | 129
Agent Performance by Hour
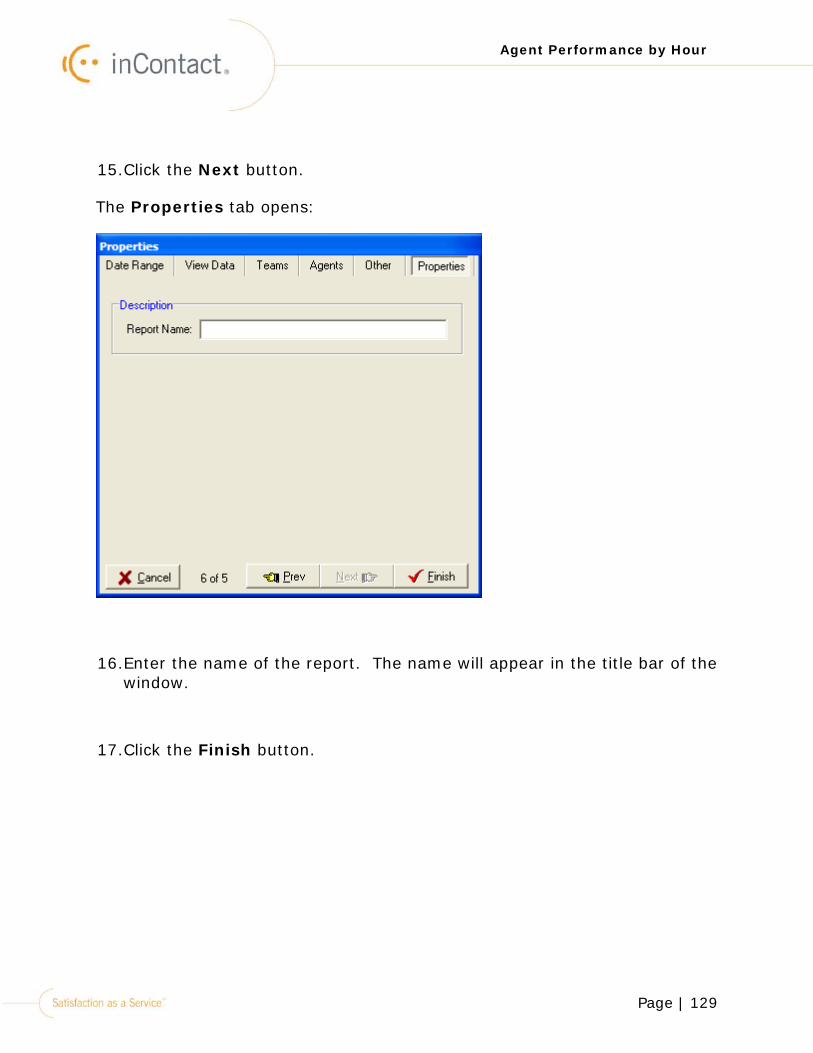
15.Click the Next button.
The Properties tab opens:
16.Enter the name of the report. The name will appear in the title bar of the window.
17.Click the Finish button.

Page | 130
Agent Performance by Hour
The report displays with the options selected.
Page | 131
Agent Performance by Hour
Agent Performance by Hour: Show Graph
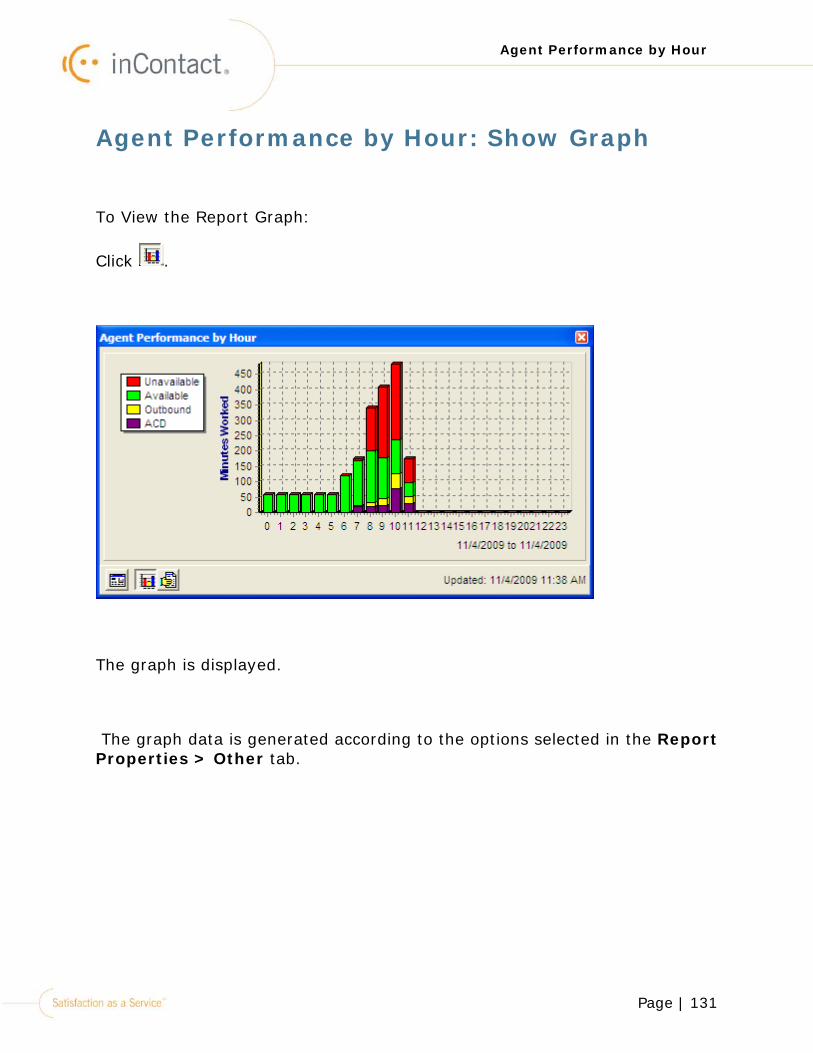
To View the Report Graph:
Click .
The graph is displayed.
The graph data is generated according to the options selected in the Report Properties > Other tab.
Page | 132
Agent Performance by Hour
Agent Performance by Hour: Show Report Data
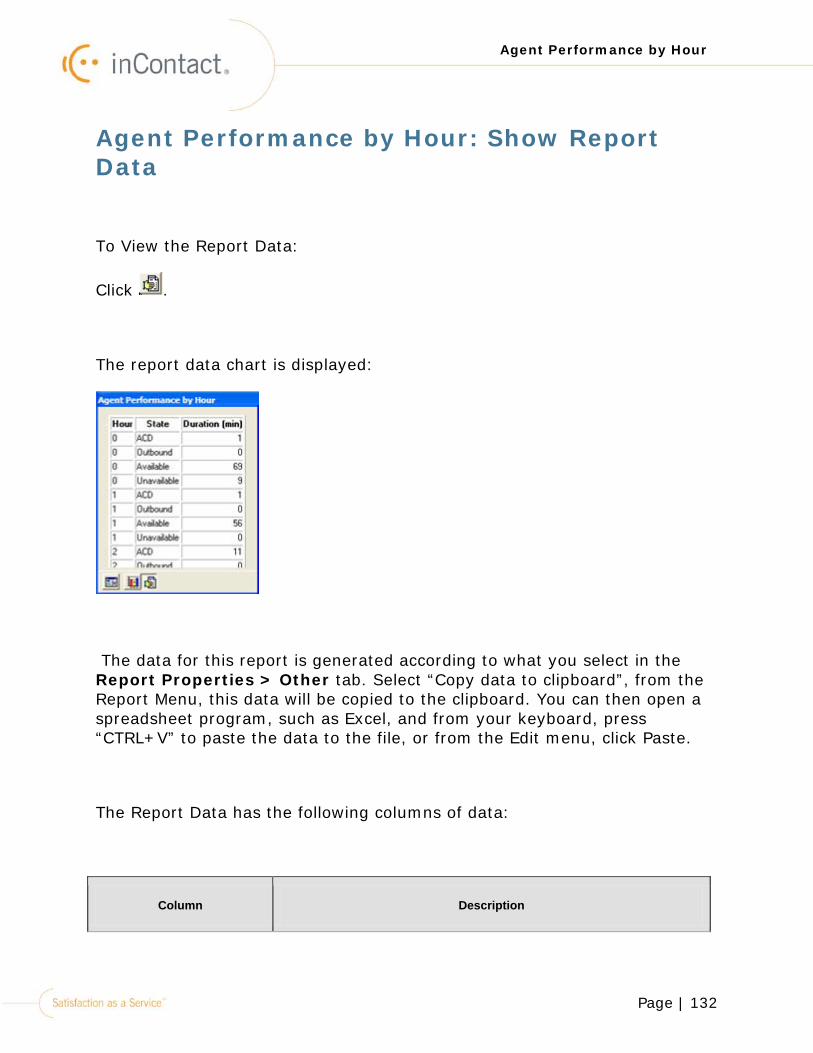
To View the Report Data:
Click .
The report data chart is displayed:
The data for this report is generated according to what you select in the Report Properties > Other tab. Select “Copy data to clipboard”, from the Report Menu, this data will be copied to the clipboard. You can then open a spreadsheet program, such as Excel, and from your keyboard, press “CTRL+V” to paste the data to the file, or from the Edit menu, click Paste.
The Report Data has the following columns of data:
Column Description
Page | 133
Agent Performance by Hour
Hour This column shows the hours in a day (0 - 23).
Note! Zero (0) symbolizes midnight or 12:00 A.M.
State This column displays the agent state(s) i.e., Unavailable, Available, Outbound, or ACD (Inbound), which agents were in during a specified hour.
Duration (min) This column displays the duration of time (in minutes) the agent was in the specified state. The first two columns, Hour and State will always be the same, but the last column will be 1) Duration, 2) Instances of the state, or 3) Average time per instance (seconds) according to what you select in the Report Properties > Other tab.
Page | 134
Agent Summary by Day
Agent Summary by Day
The Agent Summary by Day report summarizes agent activity by selected day. This report includes the number of inbound, outbound, and refused contacts that were handled and the number of hours the agent worked for the selected day.
There are several variations available for this report that are summarized in this section.
To Generate the Agent Summary by Day Report:
1.Right-click the icon in the systems tray.
2.Click Historical Reports > Agent Summary by Day.
By default, the Agent Summary by Day report opens with data for 14 days prior:
Page | 135
Agent Summary by Day
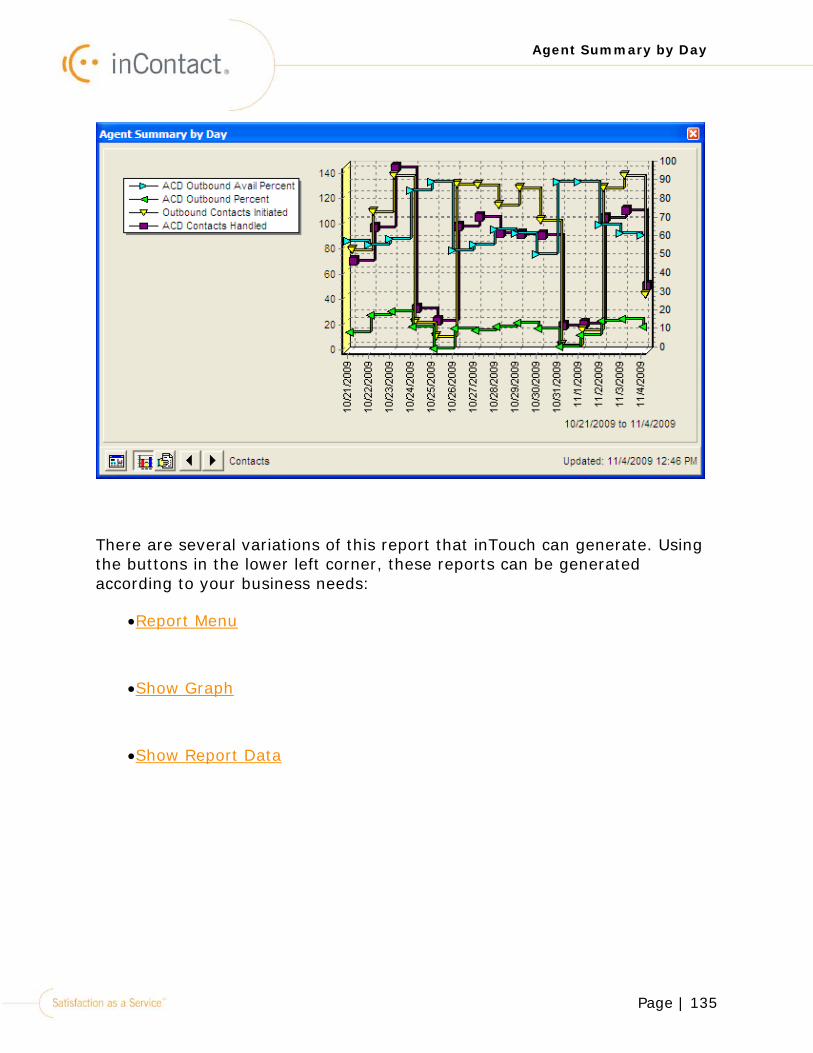
There are several variations of this report that inTouch can generate. Using the buttons in the lower left corner, these reports can be generated according to your business needs:
•Report Menu
•Show Graph
•Show Report Data
Page | 136
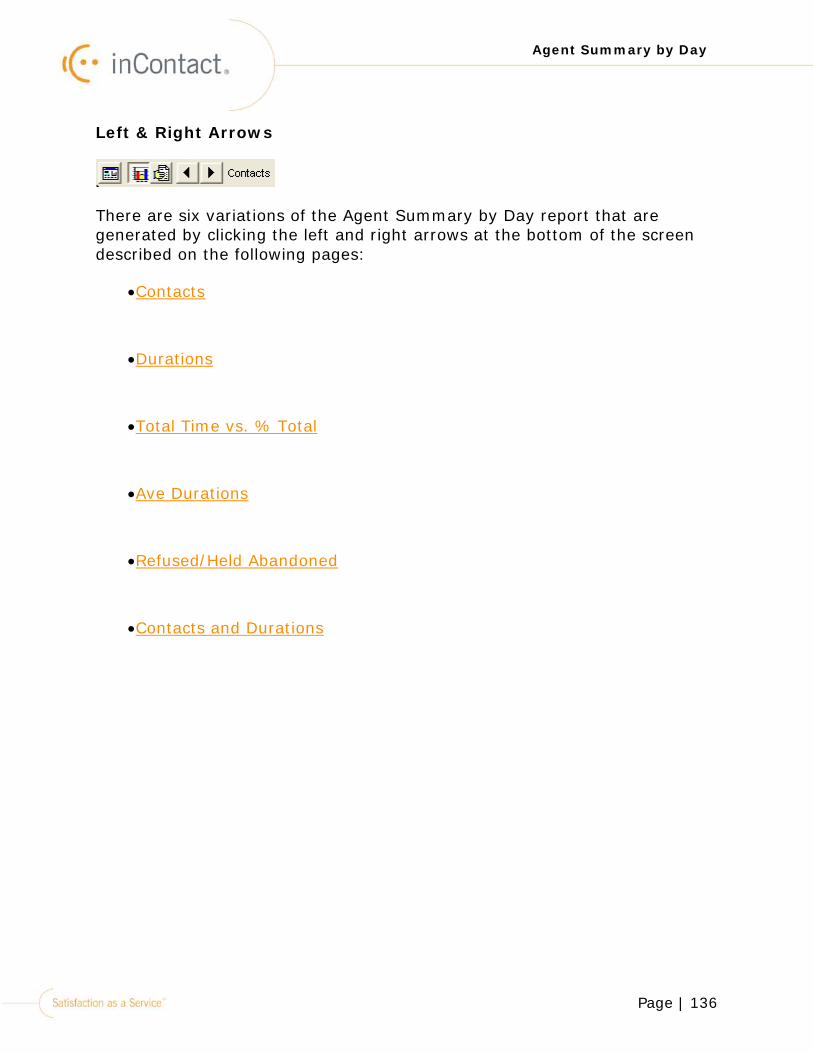
Agent Summary by Day
Left & Right Arrows
There are six variations of the Agent Summary by Day report that are generated by clicking the left and right arrows at the bottom of the screen described on the following pages:
•Contacts
•Durations
•Total Time vs. % Total
•Ave Durations
•Refused/Held Abandoned
•Contacts and Durations
Page | 137
Agent Summary by Day
Agent Summary by Day: Report Menu
To View the Report Menu:
Click .
The Report Menu opens:
This report menu includes the following options:
Menu Item Description
Report properties When you select this option, tabs with the filter selection criteria open for this report. See "Agent Summary by Day: Report Properties " on page 141.
Update report When this report is generated for the current day,
Page | 138
Agent Summary by Day
Menu Item Description
select this option to update the report. When you update the report, the data will be no older than 120 seconds.
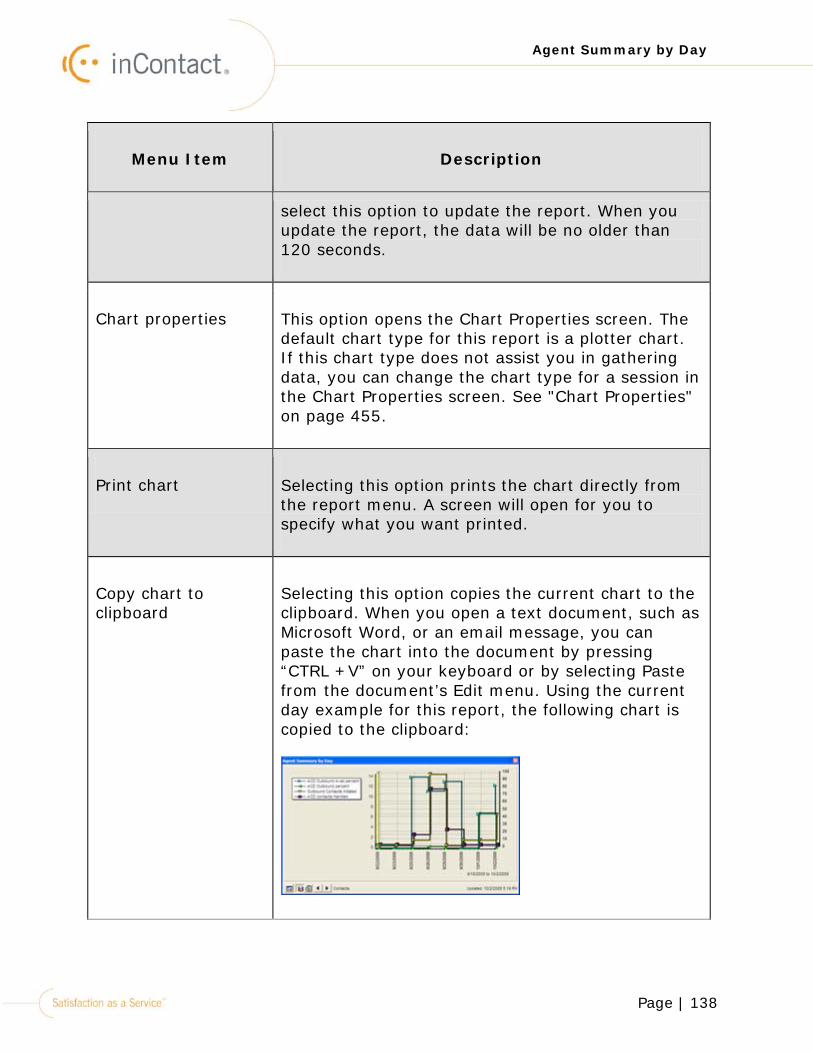
Chart properties This option opens the Chart Properties screen. The default chart type for this report is a plotter chart. If this chart type does not assist you in gathering data, you can change the chart type for a session in the Chart Properties screen. See "Chart Properties" on page 455.
Print chart Selecting this option prints the chart directly from the report menu. A screen will open for you to specify what you want printed.
Copy chart to clipboard
Selecting this option copies the current chart to the clipboard. When you open a text document, such as Microsoft Word, or an email message, you can paste the chart into the document by pressing “CTRL +V” on your keyboard or by selecting Paste from the document’s Edit menu. Using the current day example for this report, the following chart is copied to the clipboard:
Page | 139
Agent Summary by Day
Menu Item Description
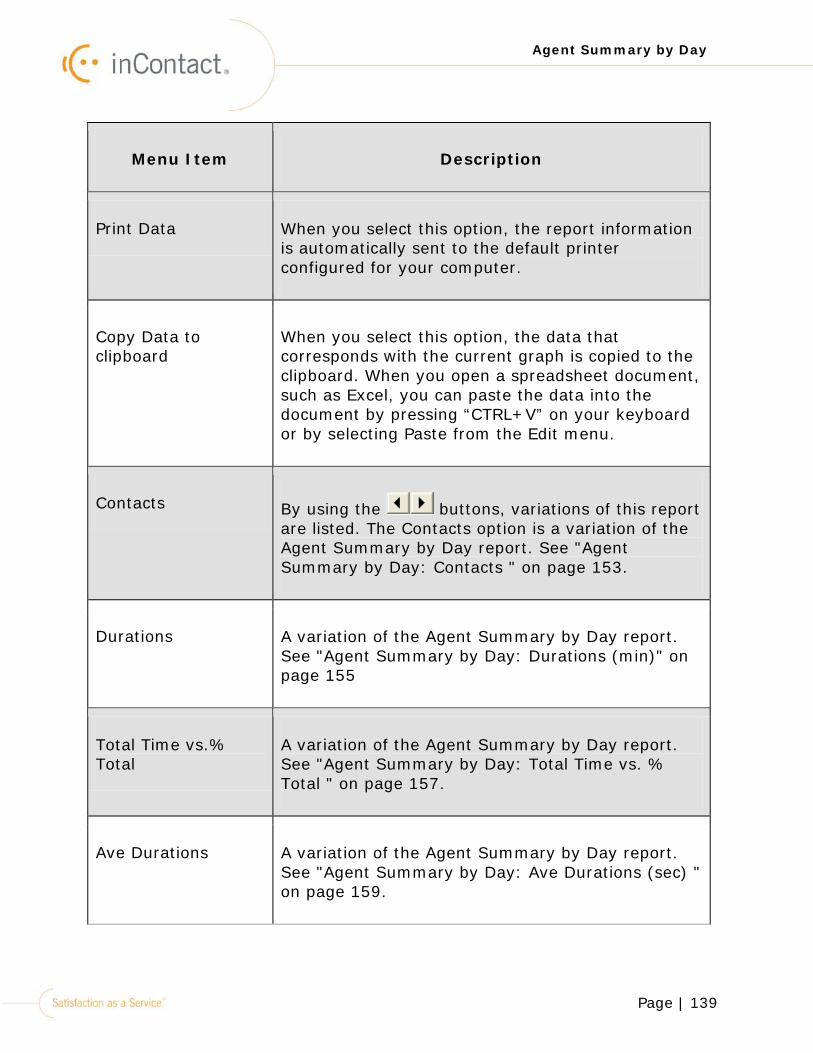
Print Data When you select this option, the report information is automatically sent to the default printer configured for your computer.
Copy Data to clipboard
When you select this option, the data that corresponds with the current graph is copied to the clipboard. When you open a spreadsheet document, such as Excel, you can paste the data into the document by pressing “CTRL+V” on your keyboard or by selecting Paste from the Edit menu.
Contacts By using the buttons, variations of this report are listed. The Contacts option is a variation of the Agent Summary by Day report. See "Agent Summary by Day: Contacts " on page 153.
Durations A variation of the Agent Summary by Day report. See "Agent Summary by Day: Durations (min)" on page 155
Total Time vs.% Total
A variation of the Agent Summary by Day report. See "Agent Summary by Day: Total Time vs. % Total " on page 157.
Ave Durations A variation of the Agent Summary by Day report. See "Agent Summary by Day: Ave Durations (sec) " on page 159.
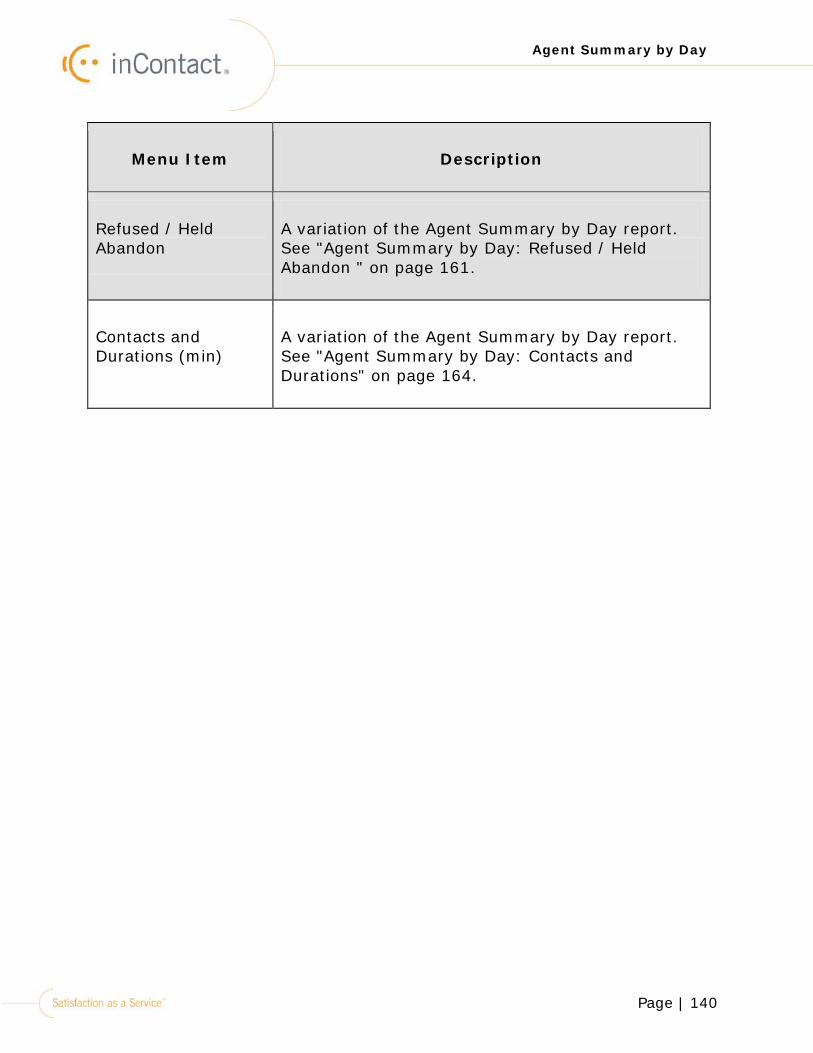
Page | 140
Agent Summary by Day
Menu Item Description
Refused / Held Abandon
A variation of the Agent Summary by Day report. See "Agent Summary by Day: Refused / Held Abandon " on page 161.
Contacts and Durations (min)
A variation of the Agent Summary by Day report. See "Agent Summary by Day: Contacts and Durations" on page 164.
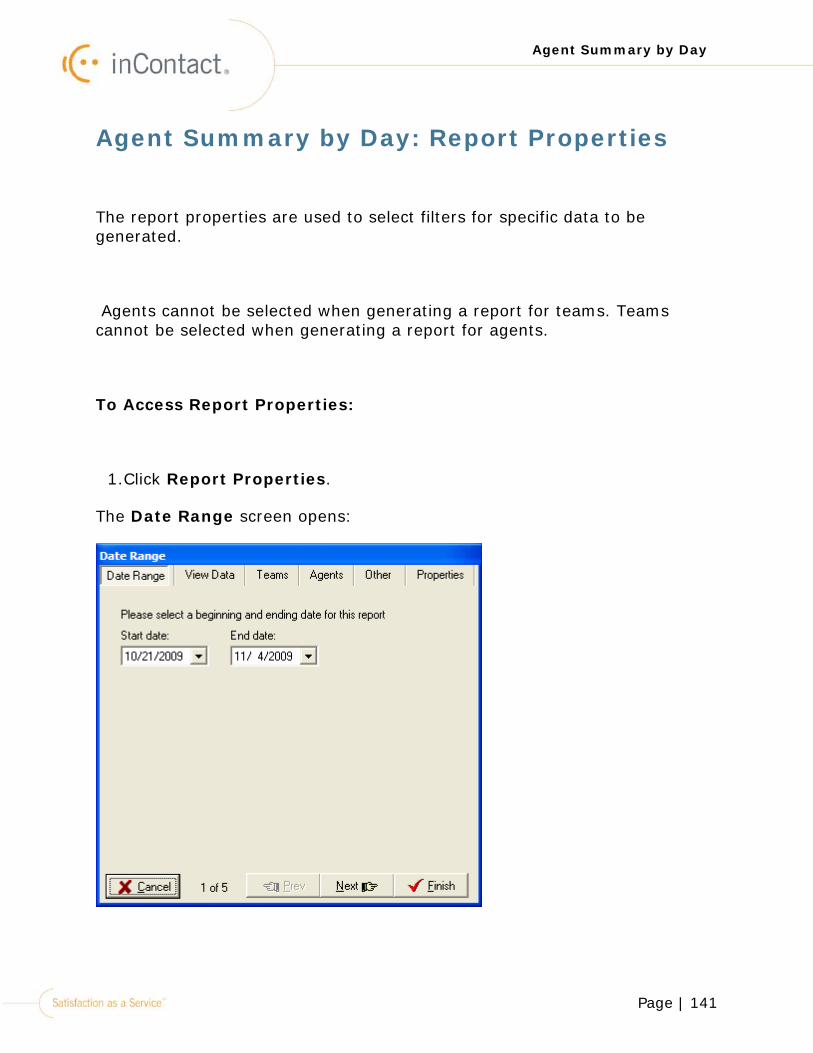
Page | 141
Agent Summary by Day
Agent Summary by Day: Report Properties
The report properties are used to select filters for specific data to be generated.
Agents cannot be selected when generating a report for teams. Teams cannot be selected when generating a report for agents.
To Access Report Properties:
1.Click Report Properties.
The Date Range screen opens:
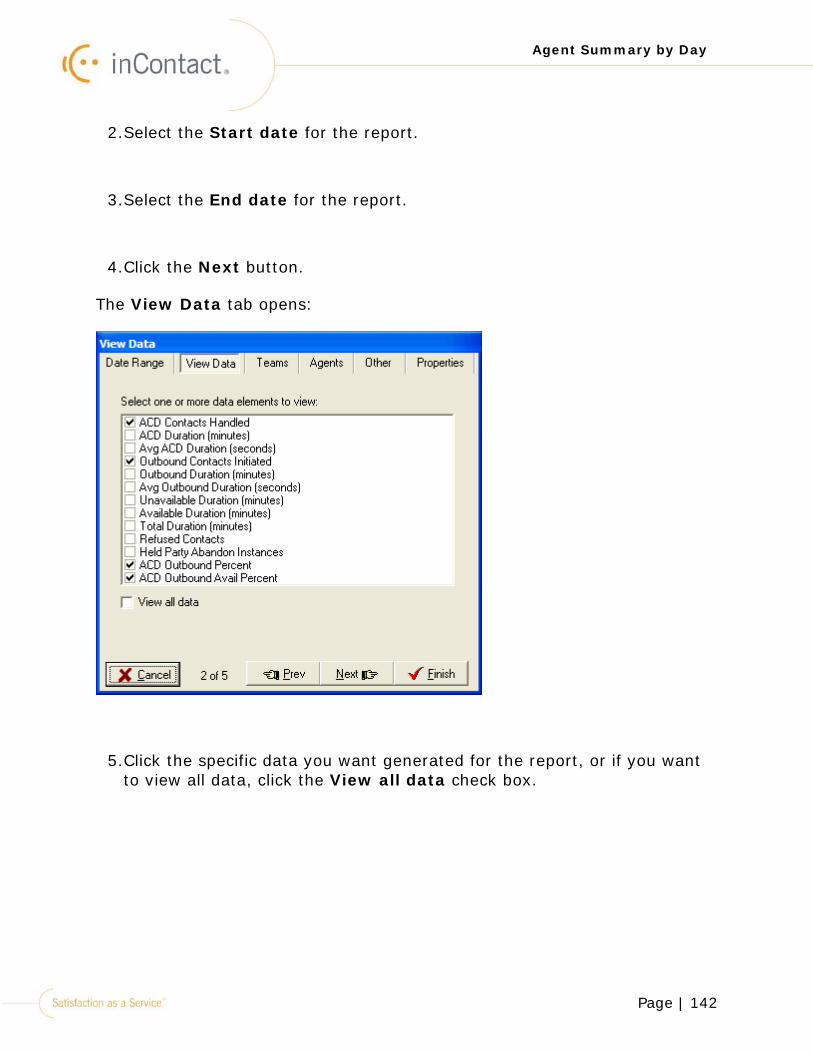
Page | 142
Agent Summary by Day
2.Select the Start date for the report.
3.Select the End date for the report.
4.Click the Next button.
The View Data tab opens:
5.Click the specific data you want generated for the report, or if you want to view all data, click the View all data check box.
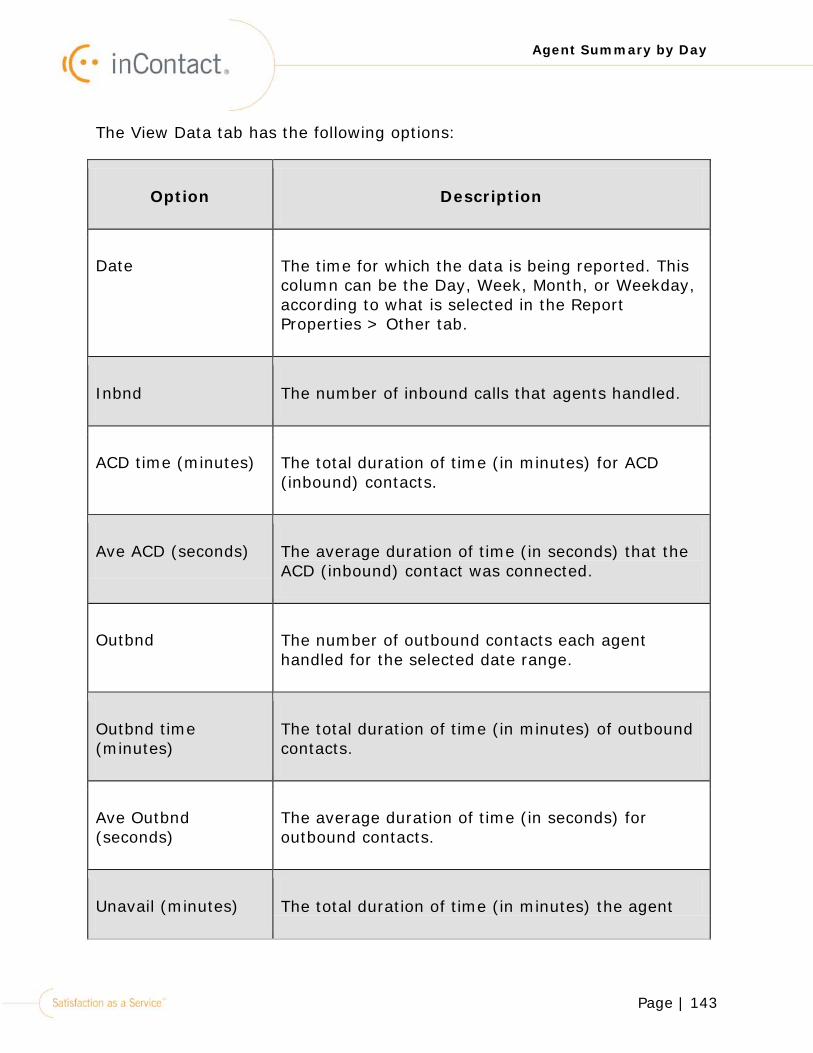
Page | 143
Agent Summary by Day
The View Data tab has the following options:
Option Description
Date The time for which the data is being reported. This column can be the Day, Week, Month, or Weekday, according to what is selected in the Report Properties > Other tab.
Inbnd The number of inbound calls that agents handled.
ACD time (minutes) The total duration of time (in minutes) for ACD (inbound) contacts.
Ave ACD (seconds) The average duration of time (in seconds) that the ACD (inbound) contact was connected.
Outbnd The number of outbound contacts each agent handled for the selected date range.
Outbnd time (minutes)
The total duration of time (in minutes) of outbound contacts.
Ave Outbnd (seconds)
The average duration of time (in seconds) for outbound contacts.
Unavail (minutes) The total duration of time (in minutes) the agent
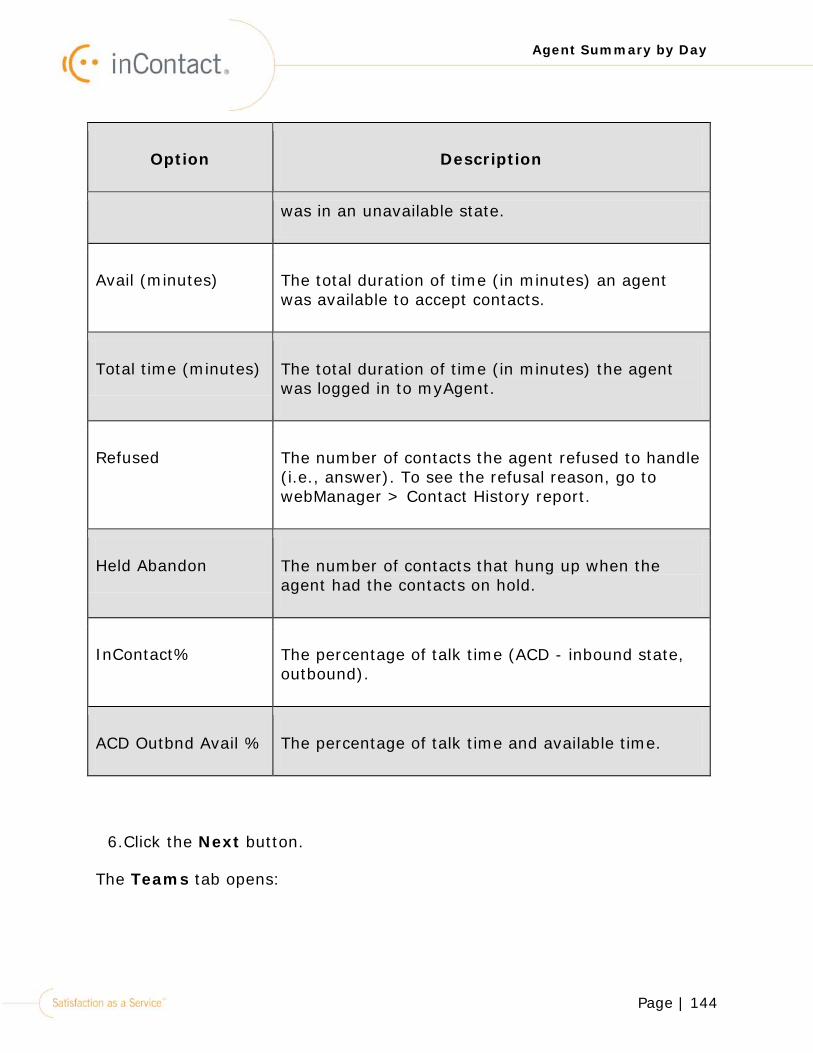
Page | 144
Agent Summary by Day
Option Description
was in an unavailable state.
Avail (minutes) The total duration of time (in minutes) an agent was available to accept contacts.
Total time (minutes) The total duration of time (in minutes) the agent was logged in to myAgent.
Refused The number of contacts the agent refused to handle (i.e., answer). To see the refusal reason, go to webManager > Contact History report.
Held Abandon The number of contacts that hung up when the agent had the contacts on hold.
InContact% The percentage of talk time (ACD - inbound state, outbound).
ACD Outbnd Avail % The percentage of talk time and available time.
6.Click the Next button.
The Teams tab opens:

Page | 145
Agent Summary by Day
7.Click to move the selected team(s) from the Available teams box to
the Teams in this report box. Click to move all teams.
8. Click to move the selected team(s) from the Teams in this report box to the Available teams box. Click to move all teams.
9.Click the Next button.
The Agents tab opens:
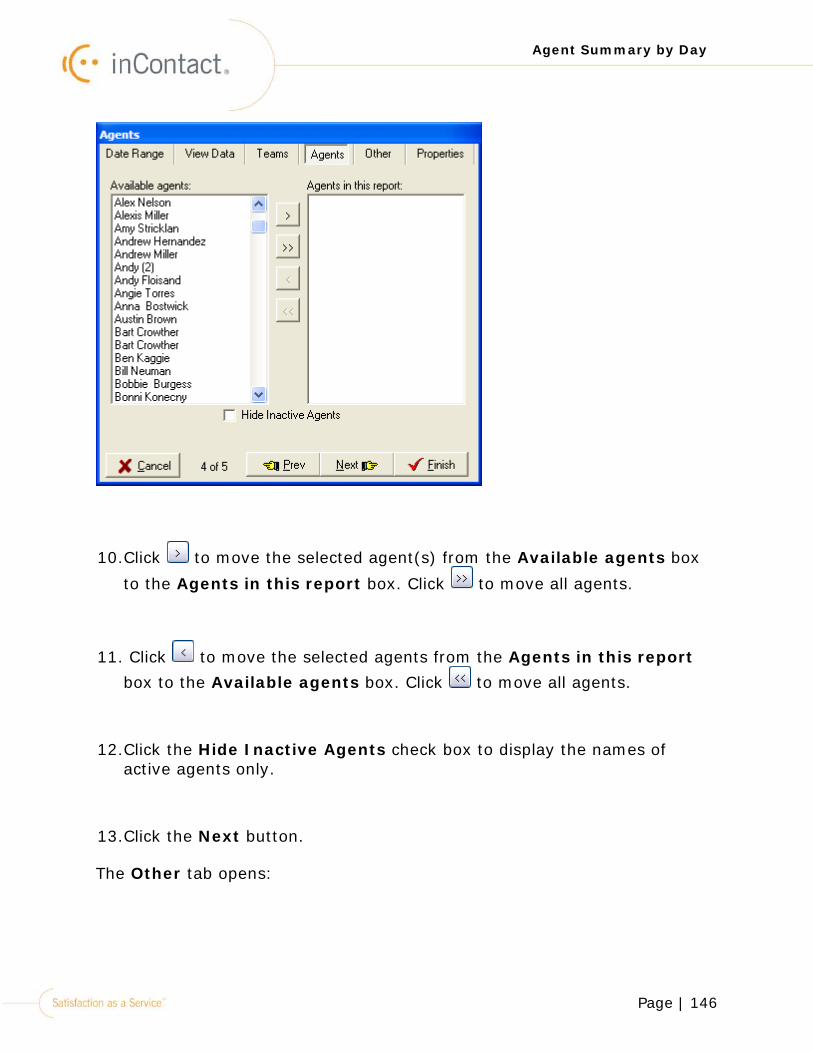
Page | 146
Agent Summary by Day
10.Click to move the selected agent(s) from the Available agents box
to the Agents in this report box. Click to move all agents.
11. Click to move the selected agents from the Agents in this report box to the Available agents box. Click to move all agents.
12.Click the Hide Inactive Agents check box to display the names of active agents only.
13.Click the Next button.
The Other tab opens:
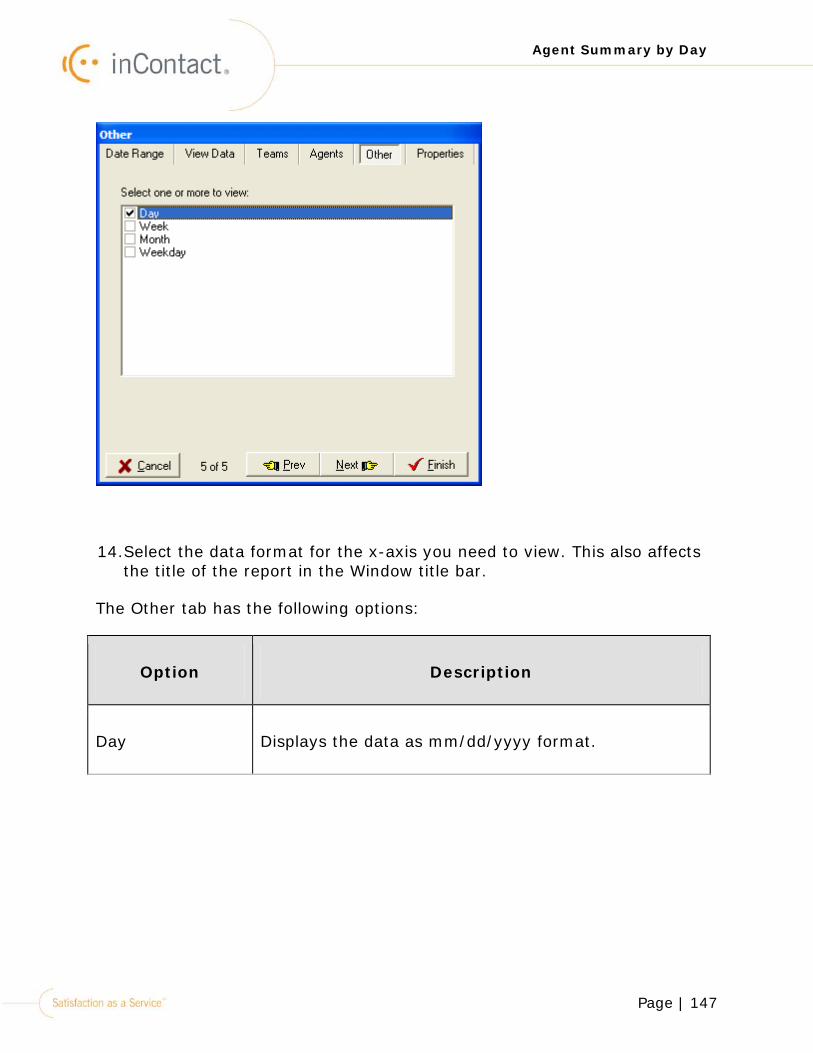
Page | 147
Agent Summary by Day
14.Select the data format for the x-axis you need to view. This also affects the title of the report in the Window title bar.
The Other tab has the following options:
Option Description
Day Displays the data as mm/dd/yyyy format.
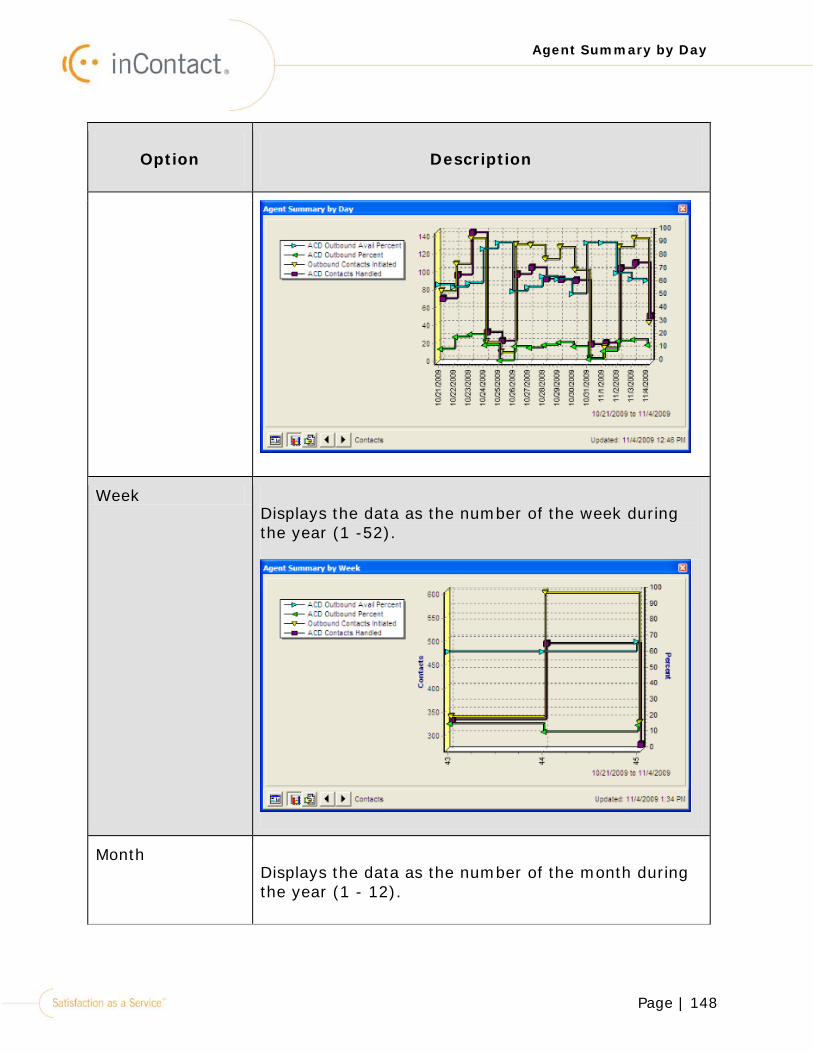
Page | 148
Agent Summary by Day
Option Description
Week Displays the data as the number of the week during the year (1 -52).
Month Displays the data as the number of the month during the year (1 - 12).
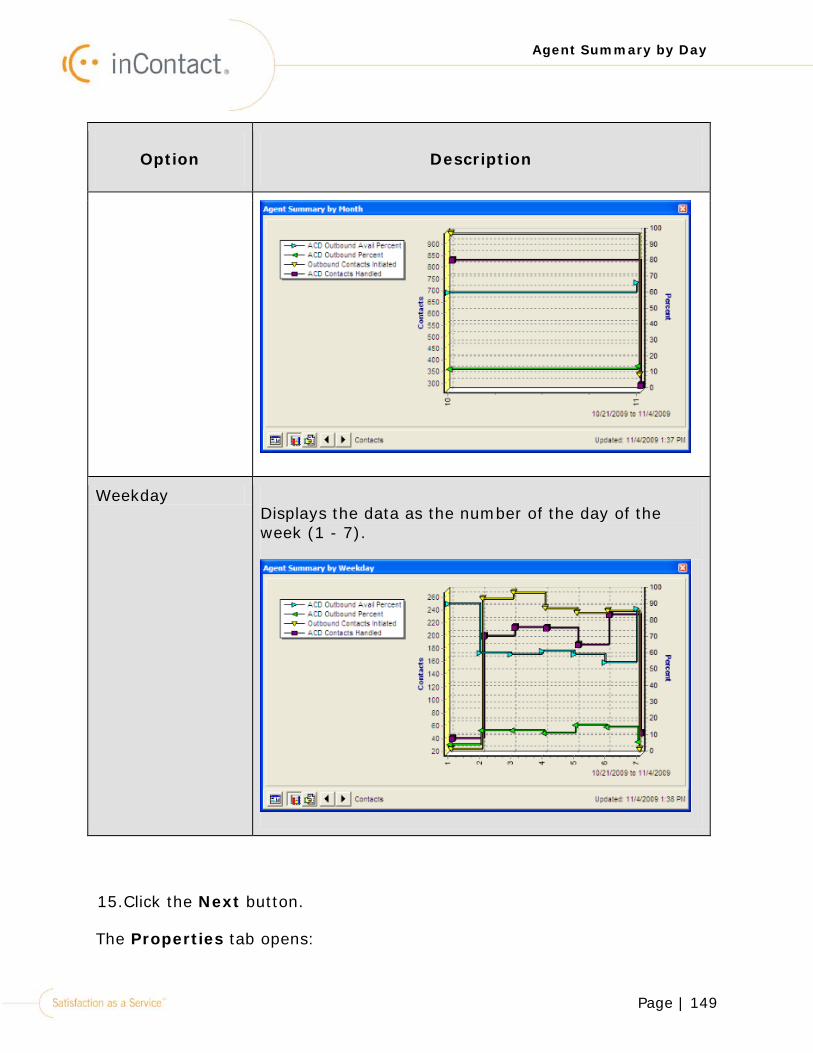
Page | 149
Agent Summary by Day
Option Description
Weekday Displays the data as the number of the day of the week (1 - 7).
15.Click the Next button.
The Properties tab opens:
Page | 150
Agent Summary by Day
16.Enter the name of the report. The name will appear in the title bar of the window.
17.Click the Finish button.
The Agent Summary by Day report is generated.

Page | 151
Agent Summary by Day
Agent Summary by Day: Show Graph
The Agent Summary by Day report is a visual representation of contacts. The legend shows what the different lines in the chart represent. By default, this report will be generated in a line plotter chart. However, this report can be changed to another chart type for a session.
To View the Report Graph:
Click .
The chart for this report is displayed:
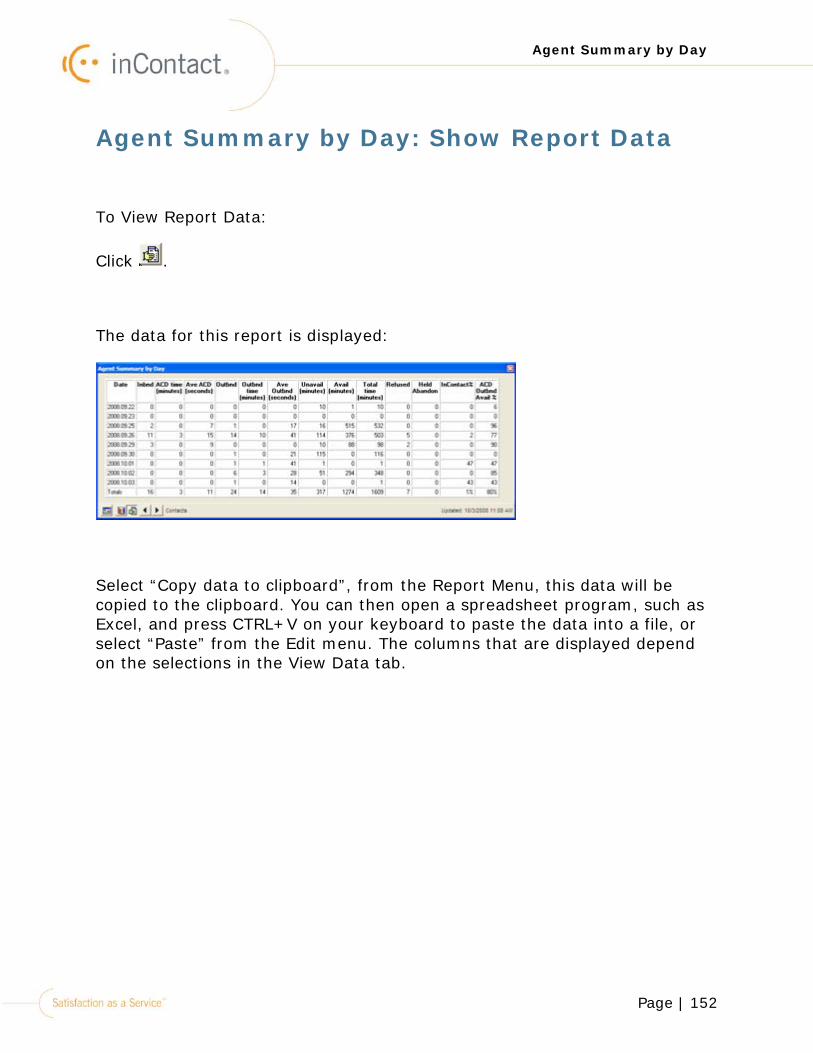
Page | 152
Agent Summary by Day
Agent Summary by Day: Show Report Data
To View Report Data:
Click .
The data for this report is displayed:
Select “Copy data to clipboard”, from the Report Menu, this data will be copied to the clipboard. You can then open a spreadsheet program, such as Excel, and press CTRL+V on your keyboard to paste the data into a file, or select “Paste” from the Edit menu. The columns that are displayed depend on the selections in the View Data tab.
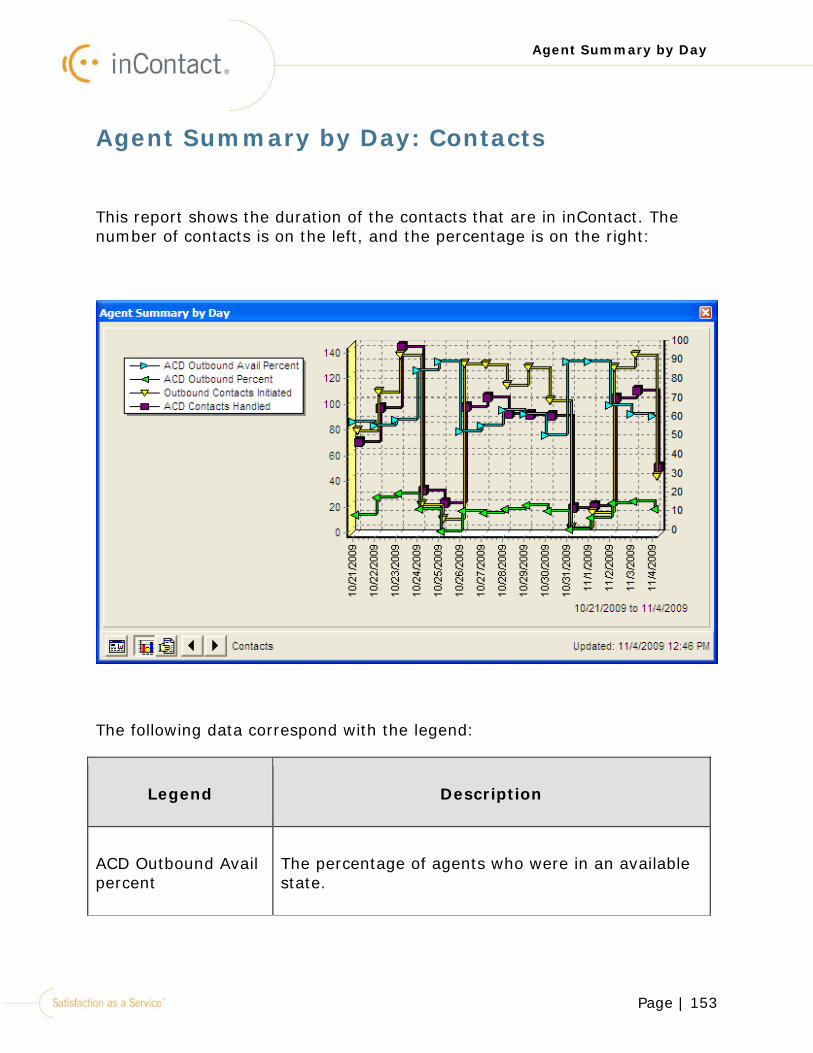
Page | 153
Agent Summary by Day
Agent Summary by Day: Contacts
This report shows the duration of the contacts that are in inContact. The number of contacts is on the left, and the percentage is on the right:
The following data correspond with the legend:
Legend Description
ACD Outbound Avail percent
The percentage of agents who were in an available state.
Page | 154
Agent Summary by Day
Legend Description
ACD Outbound percent
The percentage of outbound contacts that were initiated by the agents for a specified day.
Outbound Contacts Initiated
The number of outbound contacts that agents initiated on the specified day.
ACD Contacts Handled
The number of ACD (Inbound) contacts that were handled by agents.
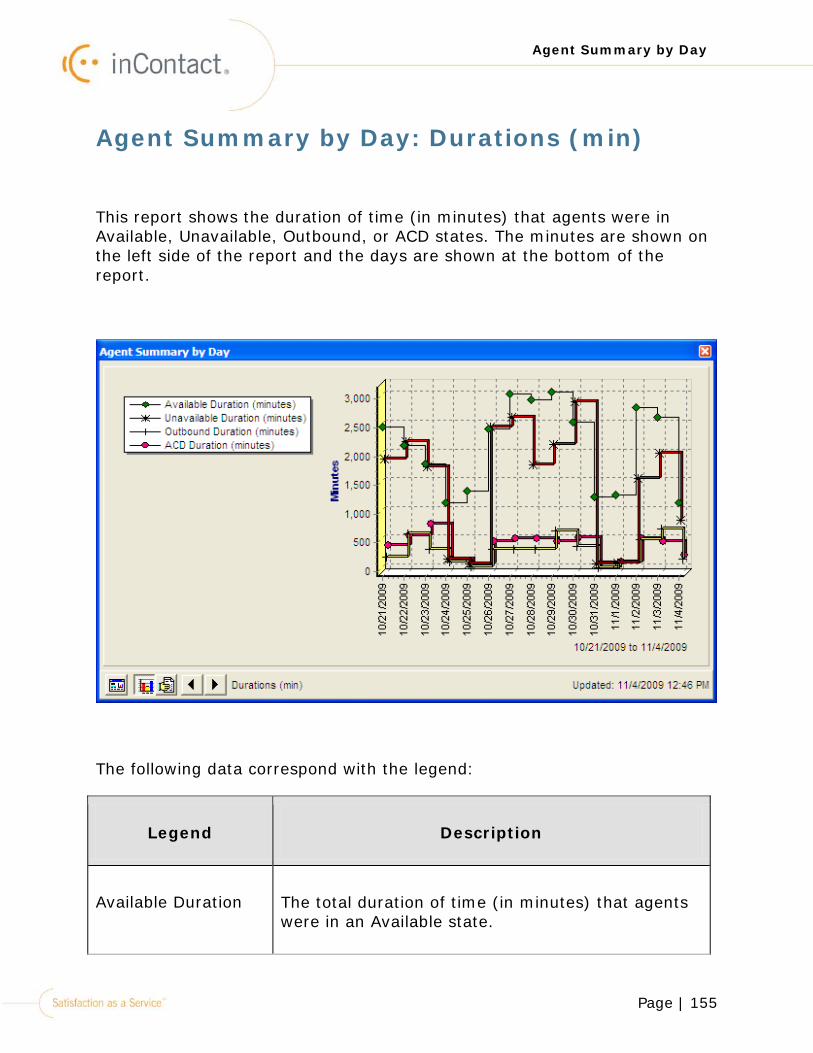
Page | 155
Agent Summary by Day
Agent Summary by Day: Durations (min)
This report shows the duration of time (in minutes) that agents were in Available, Unavailable, Outbound, or ACD states. The minutes are shown on the left side of the report and the days are shown at the bottom of the report.
The following data correspond with the legend:
Legend Description
Available Duration The total duration of time (in minutes) that agents were in an Available state.
Page | 156
Agent Summary by Day
Legend Description
Unavailable Duration The total duration of time (in minutes) that agents were in an Unavailable state.
Outbound duration The total duration of time (in minutes) that agents were handling outbound contacts.
ACD duration The total duration of time (in minutes) that agents were handling inbound contacts.
The report format can be changed by selecting the Chart Properties option in the Report Menu, and then selecting the chart type you want applied for a session.
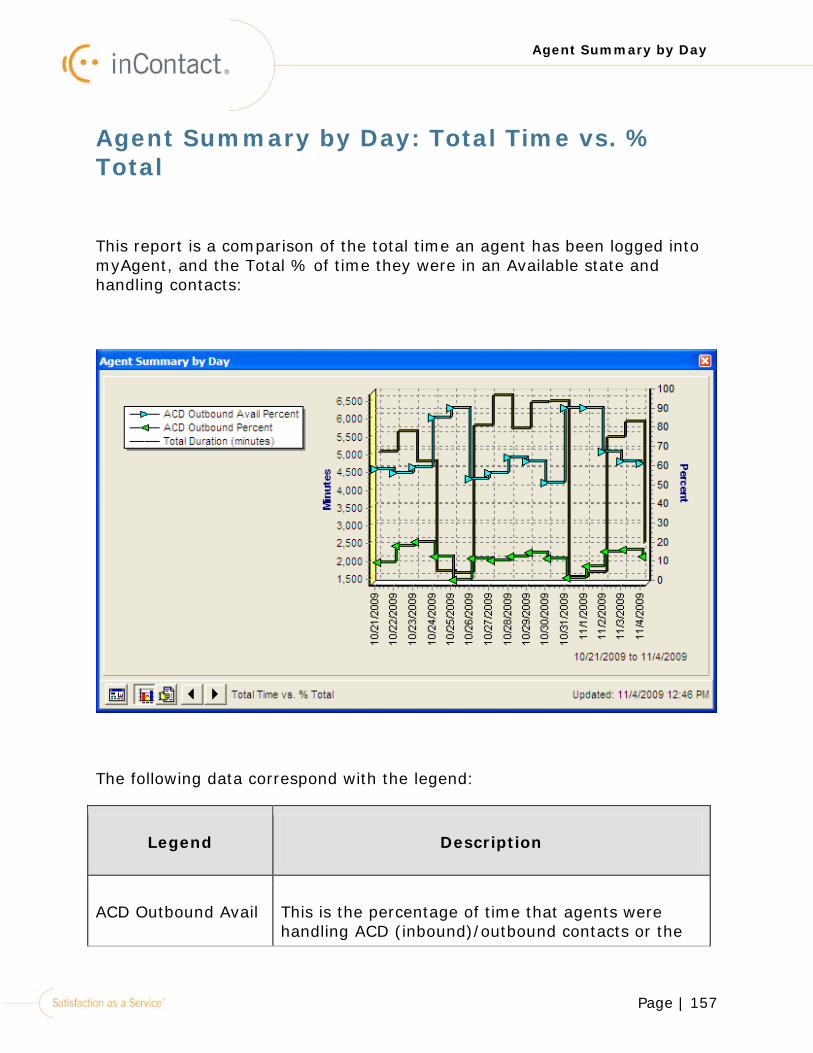
Page | 157
Agent Summary by Day
Agent Summary by Day: Total Time vs. % Total
This report is a comparison of the total time an agent has been logged into myAgent, and the Total % of time they were in an Available state and handling contacts:
The following data correspond with the legend:
Legend Description
ACD Outbound Avail This is the percentage of time that agents were handling ACD (inbound)/outbound contacts or the
Page | 158
Agent Summary by Day
Legend Description
Percent agents that were in an available state to handle contacts.
ACD Outbound Percent
The percentage of time the agents were handling ACD (inbound)/outbound contacts.
Total duration (minutes)
The total duration of time (in minutes) the agents were logged in to myAgent.
The report format can be changed by selecting the Chart Properties option from the Report Menu, and then selecting the chart type you want applied for a session.
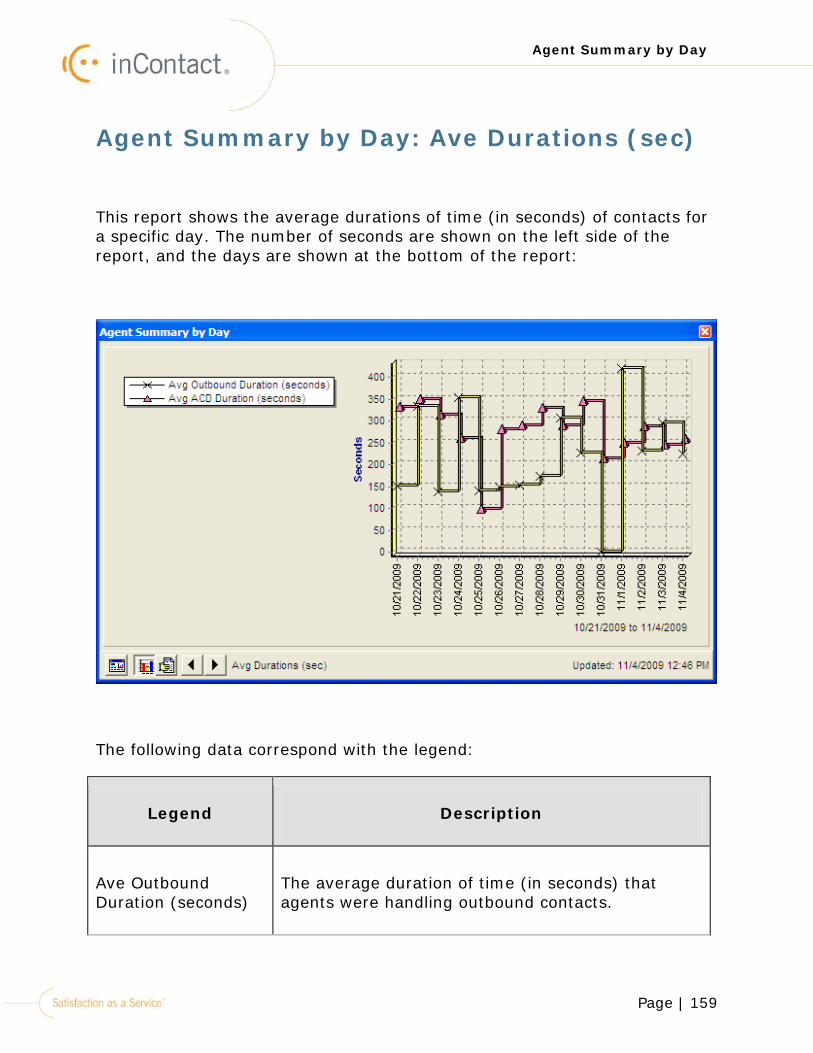
Page | 159
Agent Summary by Day
Agent Summary by Day: Ave Durations (sec)
This report shows the average durations of time (in seconds) of contacts for a specific day. The number of seconds are shown on the left side of the report, and the days are shown at the bottom of the report:
The following data correspond with the legend:
Legend Description
Ave Outbound Duration (seconds)
The average duration of time (in seconds) that agents were handling outbound contacts.
Page | 160
Agent Summary by Day
Legend Description
Ave ACD duration (seconds)
The average duration of time (in seconds) that agents were handling ACD (inbound) contacts.
The report format of a plotter chart can be changed by selecting the Chart Properties option from the Report Menu, and then selecting the chart type you want applied for this report for a session.
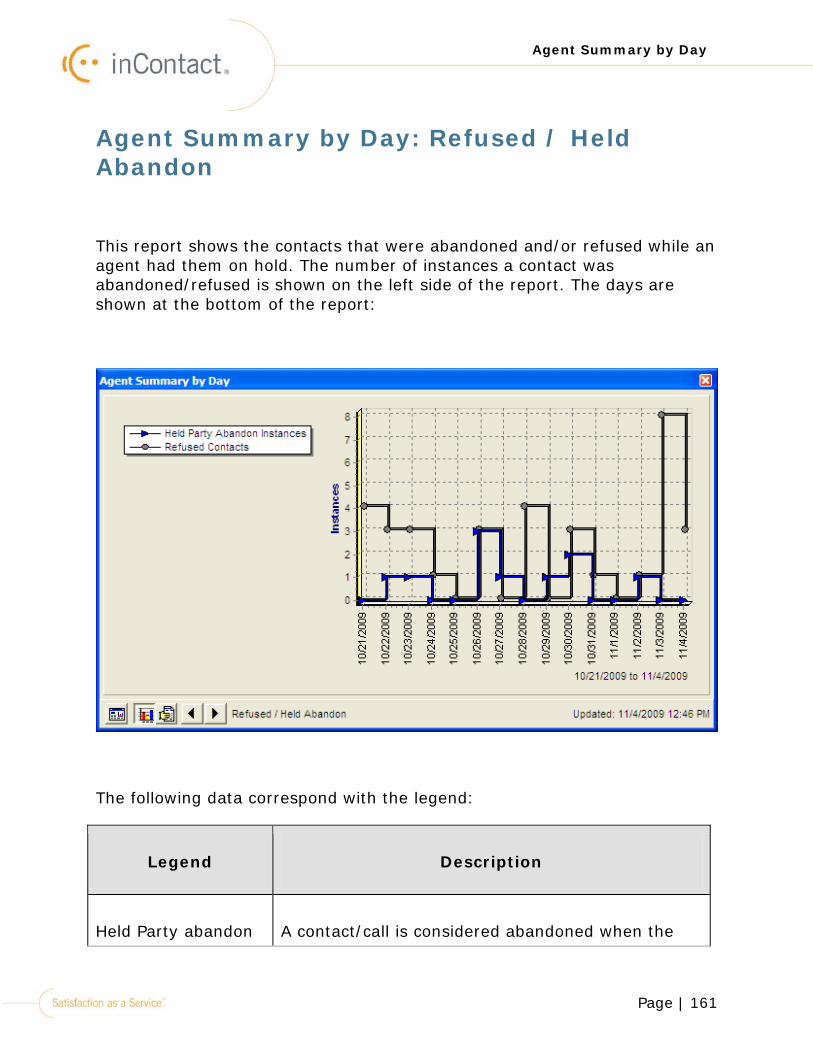
Page | 161
Agent Summary by Day
Agent Summary by Day: Refused / Held Abandon
This report shows the contacts that were abandoned and/or refused while an agent had them on hold. The number of instances a contact was abandoned/refused is shown on the left side of the report. The days are shown at the bottom of the report:
The following data correspond with the legend:
Legend Description
Held Party abandon A contact/call is considered abandoned when the
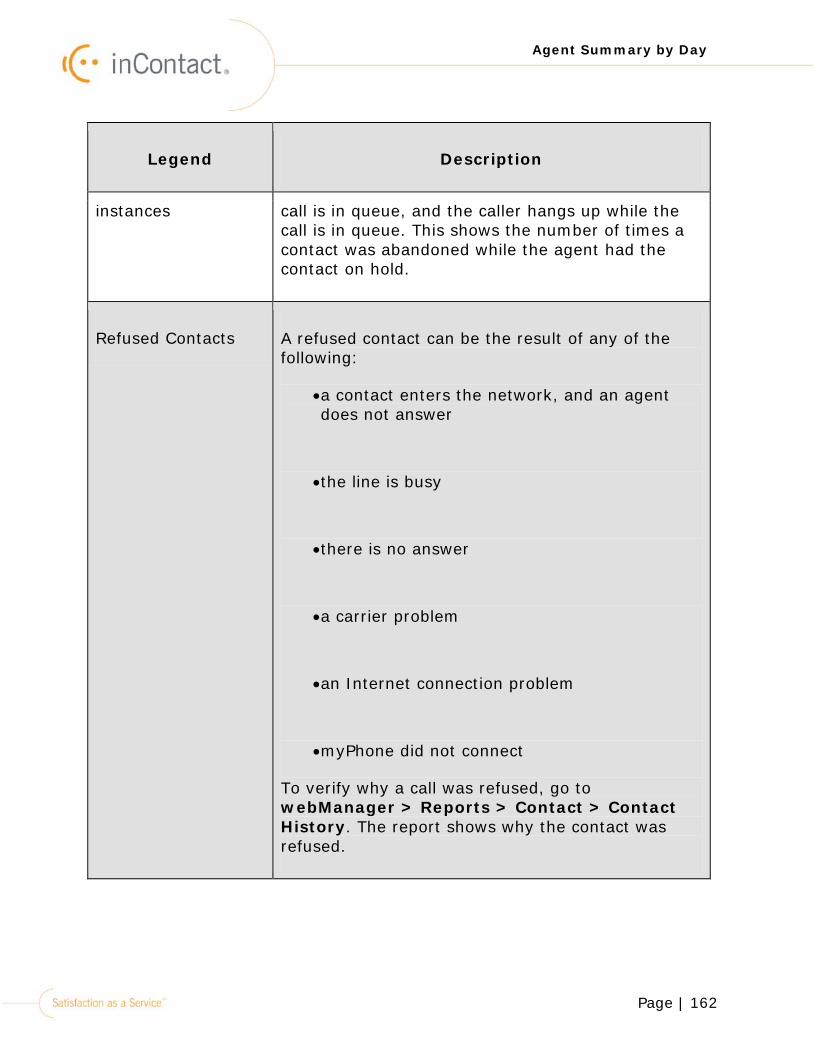
Page | 162
Agent Summary by Day
Legend Description
instances call is in queue, and the caller hangs up while the call is in queue. This shows the number of times a contact was abandoned while the agent had the contact on hold.
Refused Contacts A refused contact can be the result of any of the following:
•a contact enters the network, and an agent does not answer
•the line is busy
•there is no answer
•a carrier problem
•an Internet connection problem
•myPhone did not connect
To verify why a call was refused, go to webManager > Reports > Contact > Contact History. The report shows why the contact was refused.
Page | 163
Agent Summary by Day
The default report is in a plotter chart. If you would like to change the default report chart type for a session, click the Chart Properties option in the Report Menu.
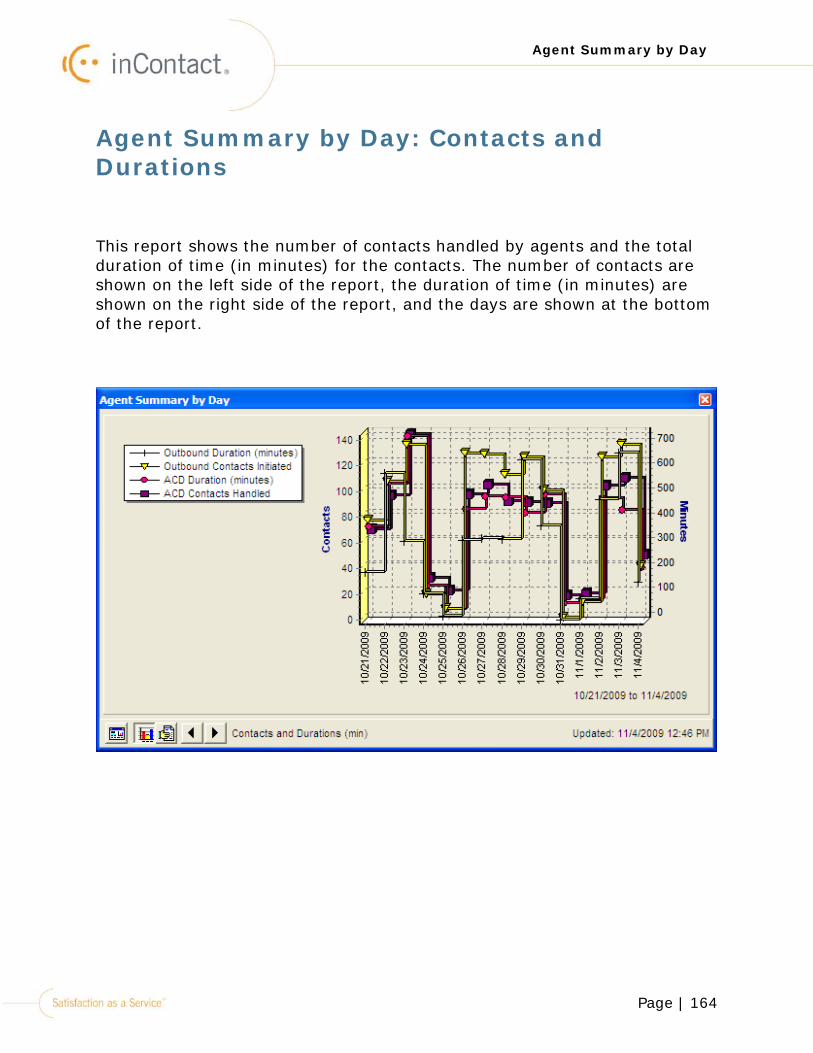
Page | 164
Agent Summary by Day
Agent Summary by Day: Contacts and Durations
This report shows the number of contacts handled by agents and the total duration of time (in minutes) for the contacts. The number of contacts are shown on the left side of the report, the duration of time (in minutes) are shown on the right side of the report, and the days are shown at the bottom of the report.
Page | 165
Agent Summary by Day
The following data correspond with the legend:
Legend Description
Outbound duration (minutes)
The total duration of time (in minutes) for outbound contacts.
Outbound Contacts Initiated
The number of outbound contacts that were initiated by the agents.
ACD duration
(minutes)
The total duration of time (in minutes) for ACD (inbound) contacts.
ACD Contacts Handled
The number of ACD (inbound) contacts that agents handled.
The default report is in a plotter chart. If you would like to change the Chart Type for a session, click the Chart Properties option in the Report Menu.
Page | 166
Campaign/Skill Summary Report
Campaign/Skill Summary Report
The Campaign/Summary report is generated for Campaigns or Skills. Any time an inbound or outbound communication channel is opened from any source - either by a customer or an agent, that event is considered a contact. In order to handle a contact, an agent must be assigned a skill.
Skills are grouped under a Campaign and are assigned to agents who use the myAgent interface. There is no limit to the number of skills that can be assigned to an agent.
Skills cannot be selected when you are generating a Campaign Summary report. Campaigns cannot be selected when you are generating a Skill Summary report.
To Generate a Campaign/Skill Summary Report:
1.Right-click the icon in the systems tray.
2.Click Historical Reports > Campaign/Skill Summary.
The screen (the name shows the selected skill or campaign) below opens.
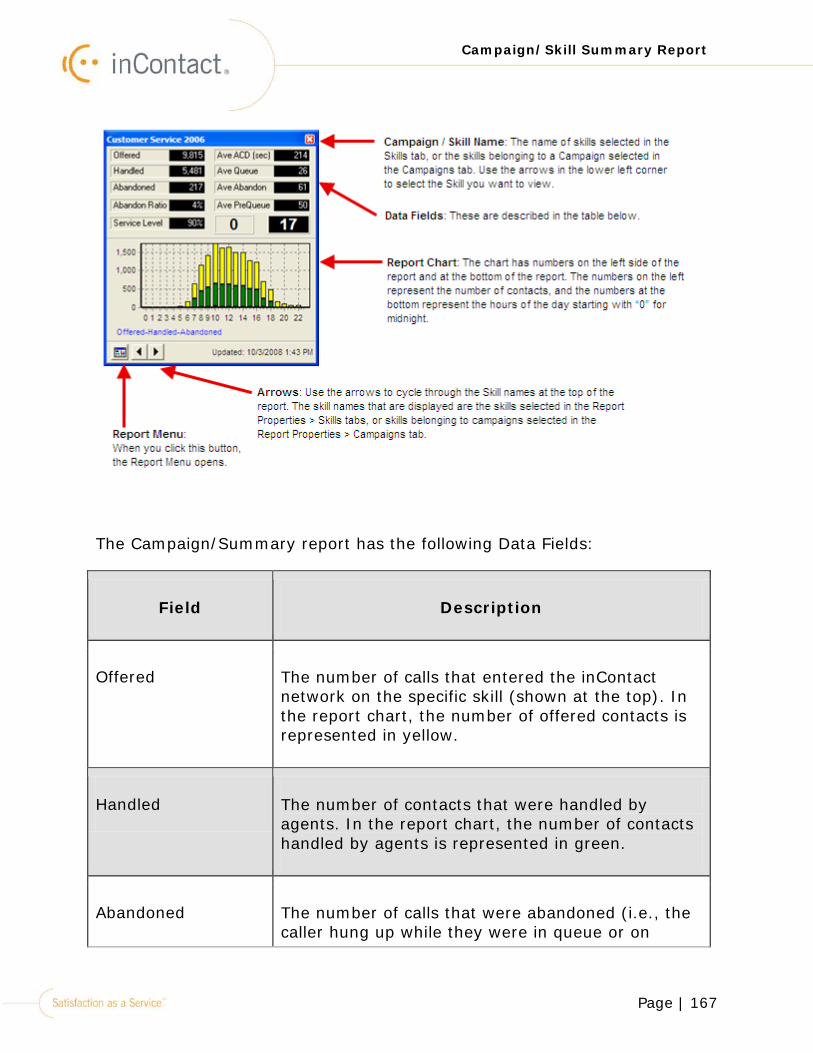
Page | 167
Campaign/Skill Summary Report
The Campaign/Summary report has the following Data Fields:
Field Description
Offered The number of calls that entered the inContact network on the specific skill (shown at the top). In the report chart, the number of offered contacts is represented in yellow.
Handled The number of contacts that were handled by agents. In the report chart, the number of contacts handled by agents is represented in green.
Abandoned The number of calls that were abandoned (i.e., the caller hung up while they were in queue or on
Page | 168
Campaign/Skill Summary Report
Field Description
hold.) In the report chart, this number is represented in red.
Abandon Ratio The percentage of the total number of contacts that have been abandoned (i.e., the caller hung up while their call was in queue or on hold).
Service Level The Service Level for this Skill. (The Service Level is configured in webManager).
Ave ACD (sec) Average duration of time (in seconds) that agents handled ACD (inbound) contacts.
Ave Queue The average duration of time (in seconds) that contacts were in queue.
Ave Abandon The average duration of time (in seconds) that a call was in queue before it was abandoned.
Ave PreQueue The average duration of time (in seconds) a contact was in an IVR before going to queue.
Numbers
Underneath the Ave PreQueue field, there are two numbers. The number on the left represents the number of contacts that are currently in queue, for this example, “0”. The number on the right represents the number of agents that are currently
Page | 169
Campaign/Skill Summary Report
Field Description
logged in, for this example, “17”. When you right-click the field on the right side, you will be able to see the different states that the agents are in.
There are several variations of this report that inTouch can generate. Using the buttons in the lower left corner, these reports can be generated according to your business needs:
•Report Menu
•Arrows
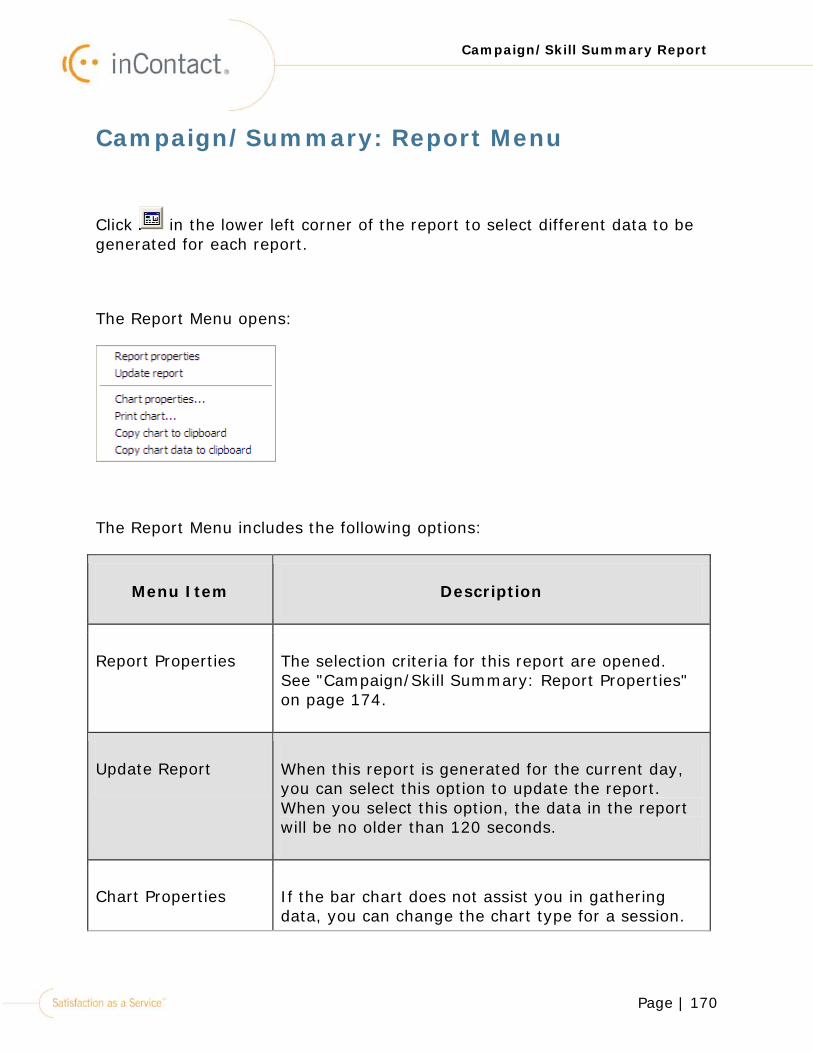
Page | 170
Campaign/Skill Summary Report
Campaign/Summary: Report Menu
Click in the lower left corner of the report to select different data to be generated for each report.
The Report Menu opens:
The Report Menu includes the following options:
Menu Item Description
Report Properties The selection criteria for this report are opened. See "Campaign/Skill Summary: Report Properties" on page 174.
Update Report When this report is generated for the current day, you can select this option to update the report. When you select this option, the data in the report will be no older than 120 seconds.
Chart Properties If the bar chart does not assist you in gathering data, you can change the chart type for a session.
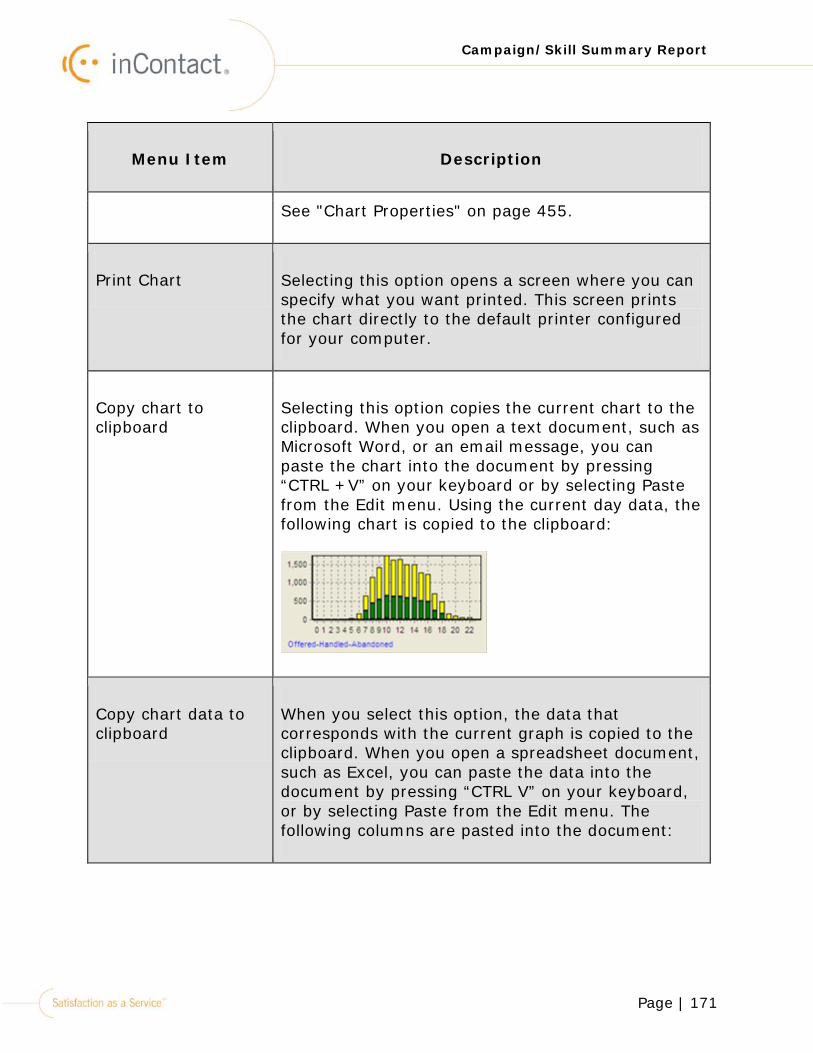
Page | 171
Campaign/Skill Summary Report
Menu Item Description
See "Chart Properties" on page 455.
Print Chart Selecting this option opens a screen where you can specify what you want printed. This screen prints the chart directly to the default printer configured for your computer.
Copy chart to clipboard
Selecting this option copies the current chart to the clipboard. When you open a text document, such as Microsoft Word, or an email message, you can paste the chart into the document by pressing “CTRL +V” on your keyboard or by selecting Paste from the Edit menu. Using the current day data, the following chart is copied to the clipboard:
Copy chart data to clipboard
When you select this option, the data that corresponds with the current graph is copied to the clipboard. When you open a spreadsheet document, such as Excel, you can paste the data into the document by pressing “CTRL V” on your keyboard, or by selecting Paste from the Edit menu. The following columns are pasted into the document:
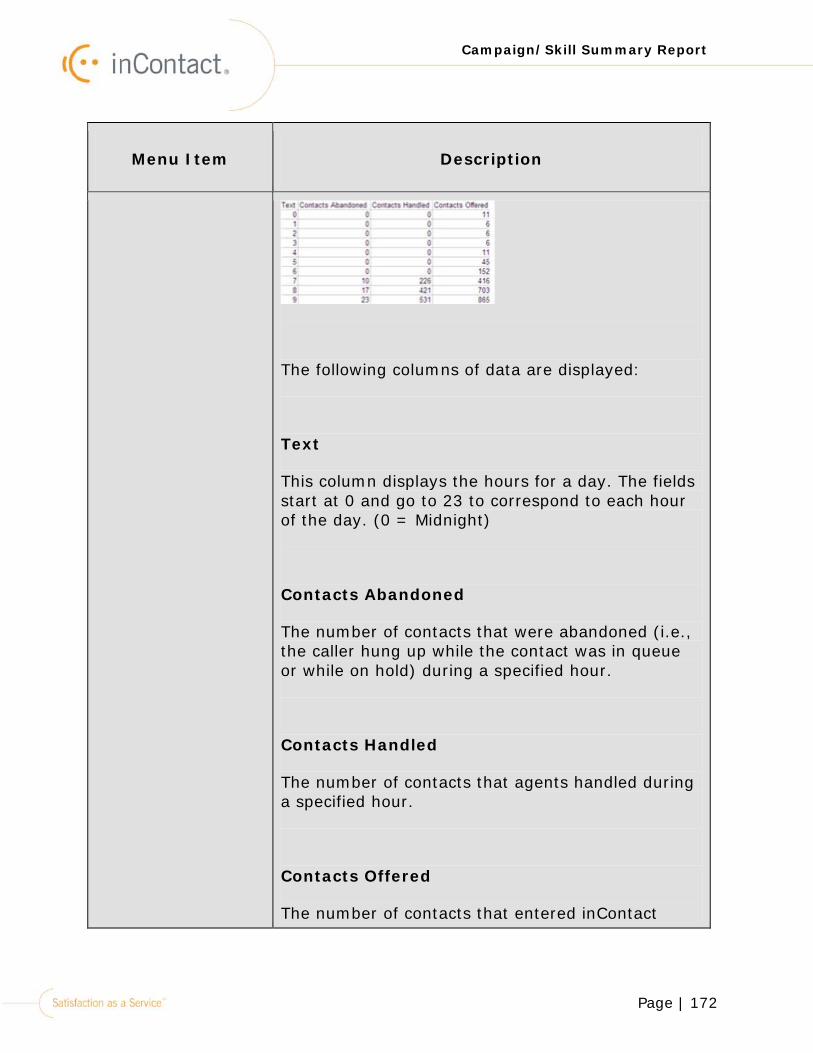
Page | 172
Campaign/Skill Summary Report
Menu Item Description
The following columns of data are displayed:
Text
This column displays the hours for a day. The fields start at 0 and go to 23 to correspond to each hour of the day. (0 = Midnight)
Contacts Abandoned
The number of contacts that were abandoned (i.e., the caller hung up while the contact was in queue or while on hold) during a specified hour.
Contacts Handled
The number of contacts that agents handled during a specified hour.
Contacts Offered
The number of contacts that entered inContact
Page | 173
Campaign/Skill Summary Report
Menu Item Description
during a specified hour.
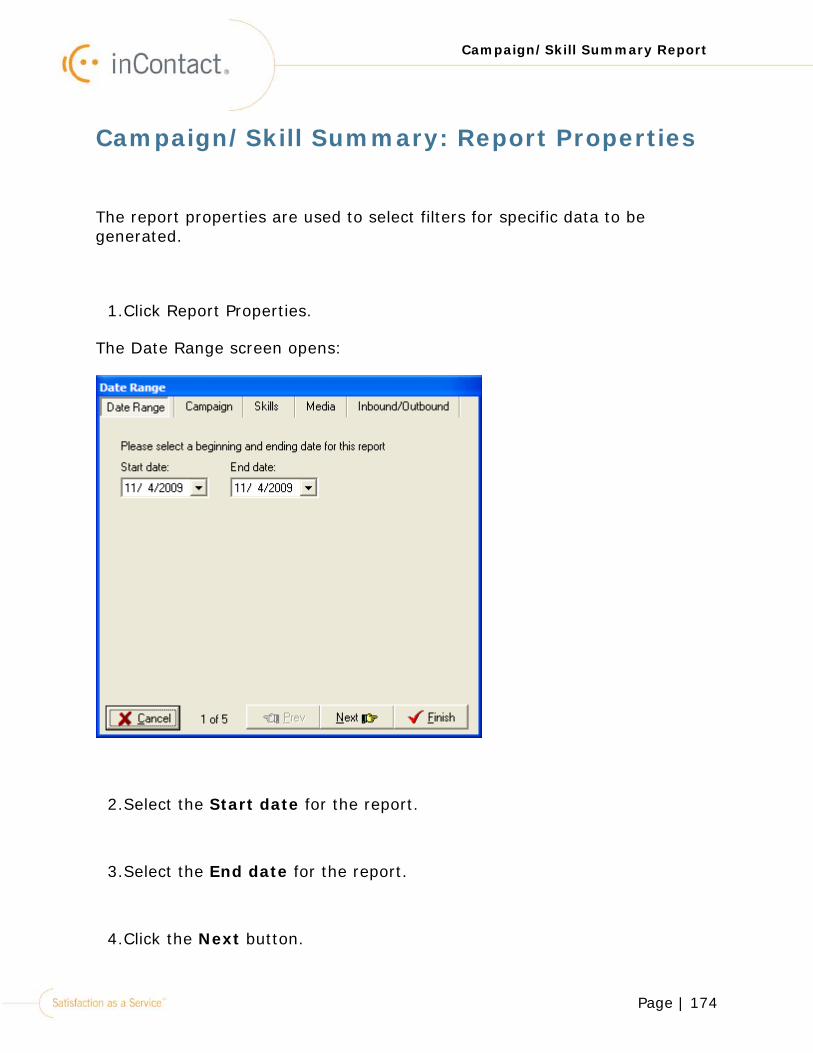
Page | 174
Campaign/Skill Summary Report
Campaign/Skill Summary: Report Properties
The report properties are used to select filters for specific data to be generated.
1.Click Report Properties.
The Date Range screen opens:
2.Select the Start date for the report.
3.Select the End date for the report.
4.Click the Next button.
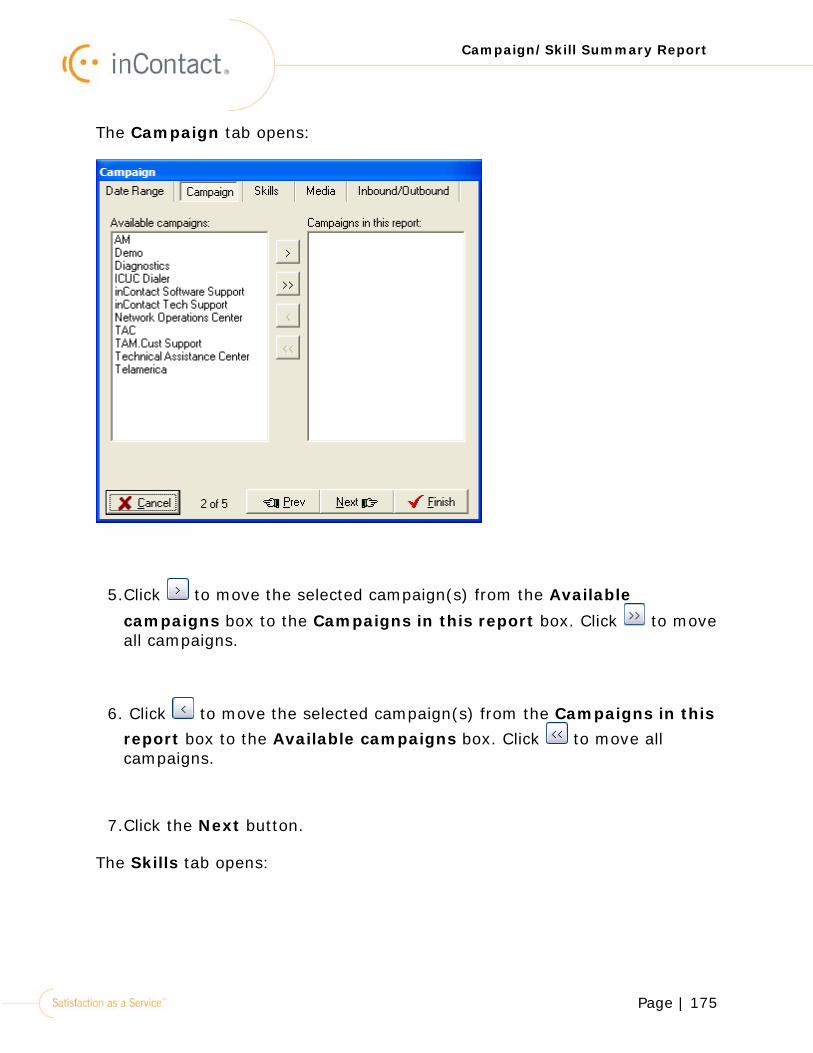
Page | 175
Campaign/Skill Summary Report
The Campaign tab opens:
5.Click to move the selected campaign(s) from the Available campaigns box to the Campaigns in this report box. Click to move all campaigns.
6. Click to move the selected campaign(s) from the Campaigns in this report box to the Available campaigns box. Click to move all campaigns.
7.Click the Next button.
The Skills tab opens:
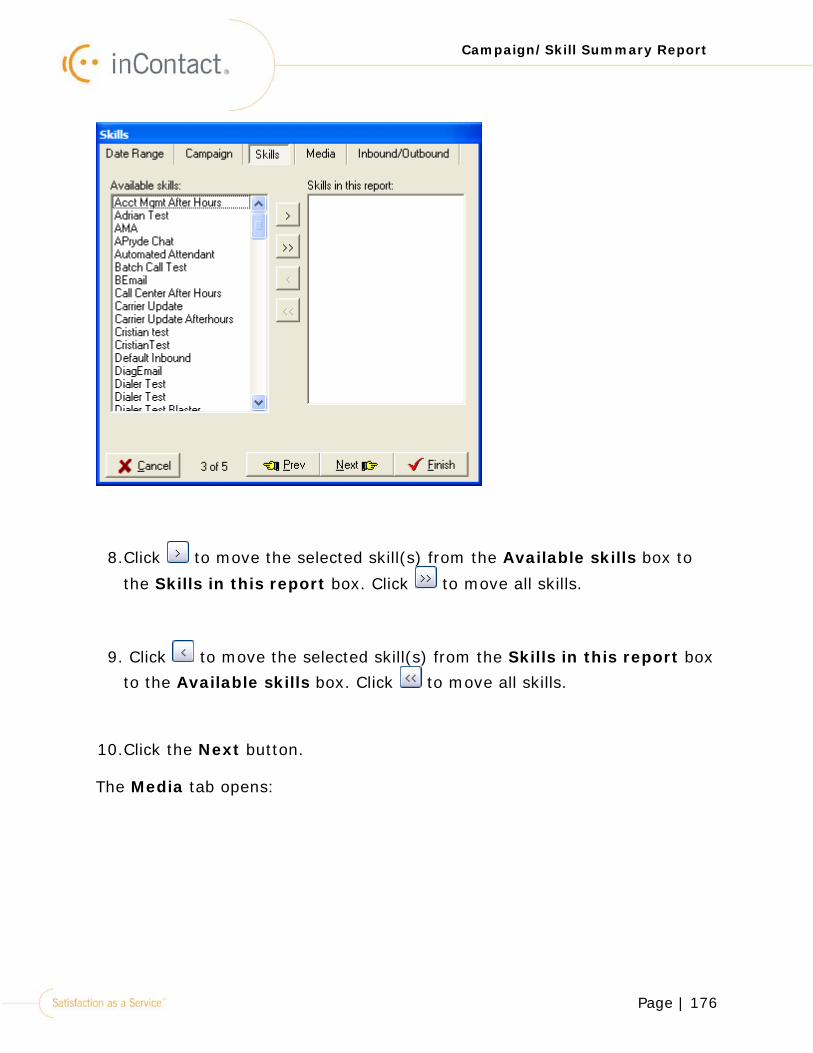
Page | 176
Campaign/Skill Summary Report
8.Click to move the selected skill(s) from the Available skills box to
the Skills in this report box. Click to move all skills.
9. Click to move the selected skill(s) from the Skills in this report box to the Available skills box. Click to move all skills.
10.Click the Next button.
The Media tab opens:
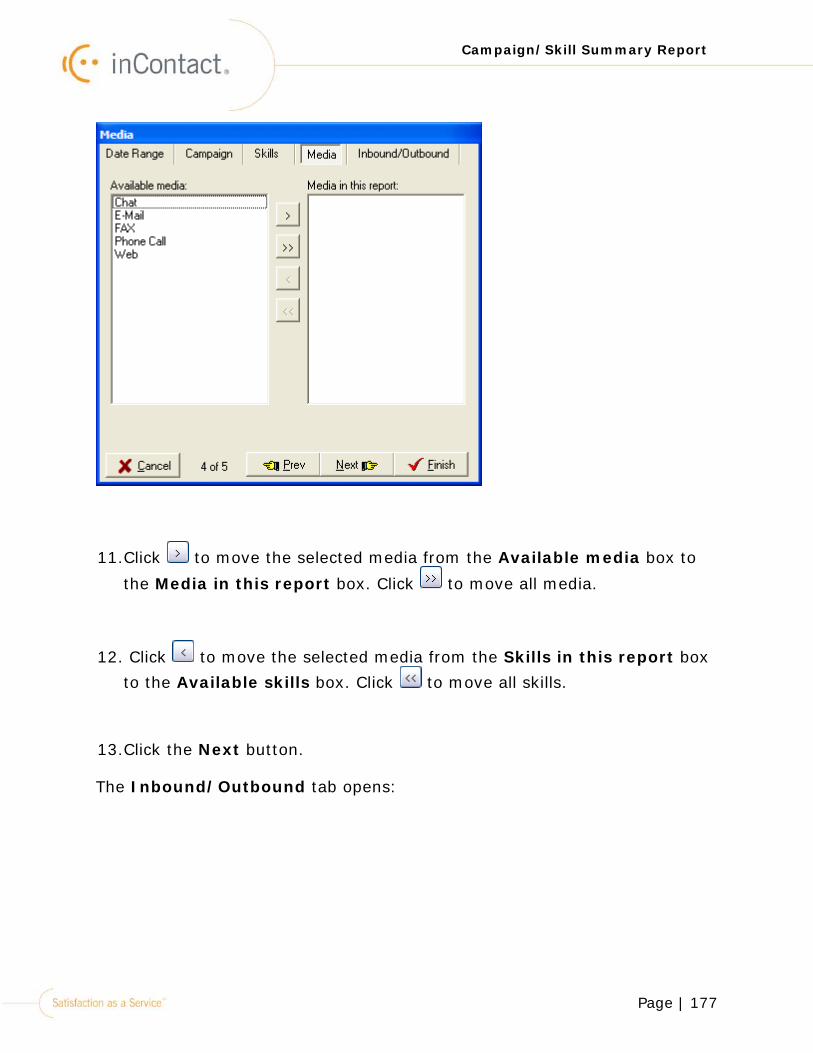
Page | 177
Campaign/Skill Summary Report
11.Click to move the selected media from the Available media box to
the Media in this report box. Click to move all media.
12. Click to move the selected media from the Skills in this report box to the Available skills box. Click to move all skills.
13.Click the Next button.
The Inbound/Outbound tab opens:
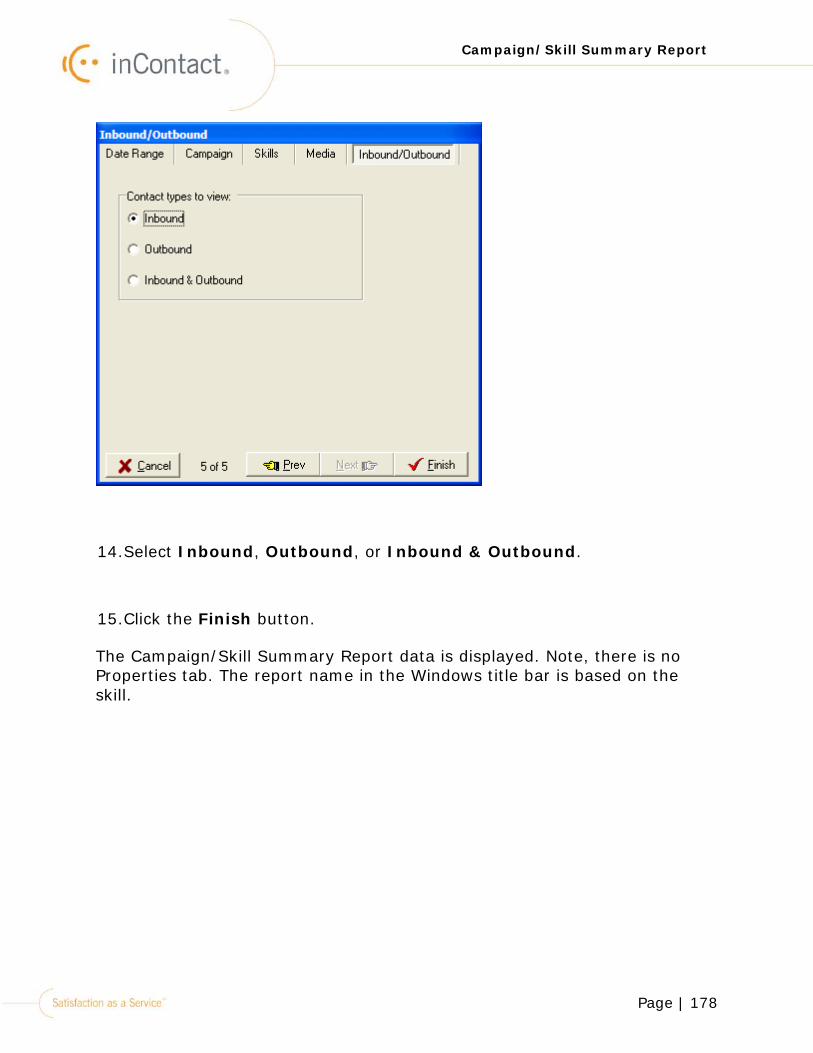
Page | 178
Campaign/Skill Summary Report
14.Select Inbound, Outbound, or Inbound & Outbound.
15.Click the Finish button.
The Campaign/Skill Summary Report data is displayed. Note, there is no Properties tab. The report name in the Windows title bar is based on the skill.
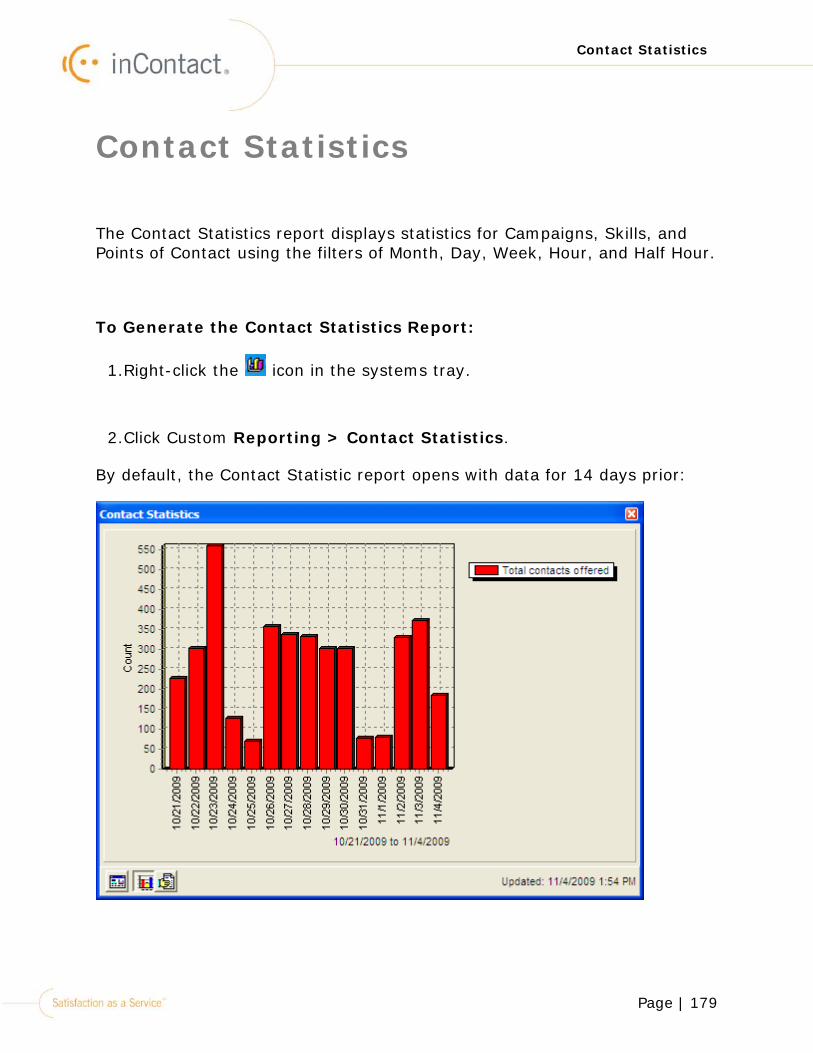
Page | 179
Contact Statistics
Contact Statistics
The Contact Statistics report displays statistics for Campaigns, Skills, and Points of Contact using the filters of Month, Day, Week, Hour, and Half Hour.
To Generate the Contact Statistics Report:
1.Right-click the icon in the systems tray.
2.Click Custom Reporting > Contact Statistics.
By default, the Contact Statistic report opens with data for 14 days prior:
Page | 180
Contact Statistics
There are several variations of this report that inTouch can generate. Using the buttons in the lower left corner, these reports can be generated according to your business needs:
•Report Menu
•Show Graph
•Show Report Data
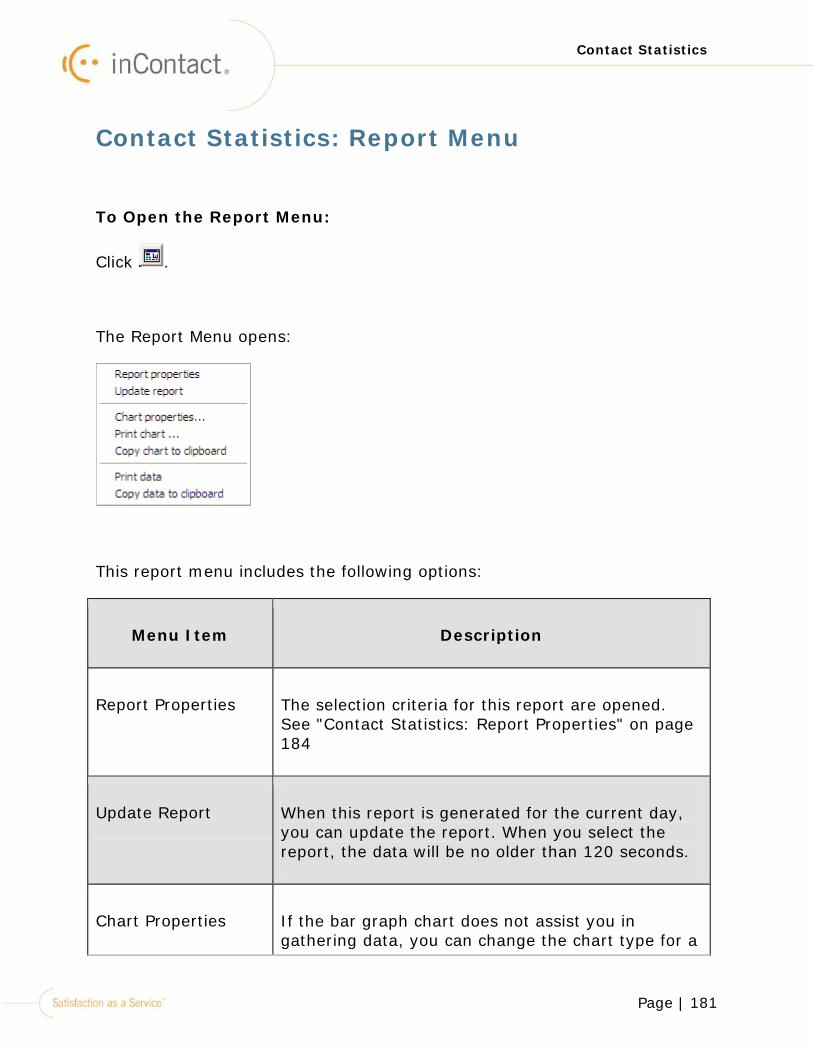
Page | 181
Contact Statistics
Contact Statistics: Report Menu
To Open the Report Menu:
Click .
The Report Menu opens:
This report menu includes the following options:
Menu Item Description
Report Properties The selection criteria for this report are opened. See "Contact Statistics: Report Properties" on page 184
Update Report When this report is generated for the current day, you can update the report. When you select the report, the data will be no older than 120 seconds.
Chart Properties If the bar graph chart does not assist you in gathering data, you can change the chart type for a
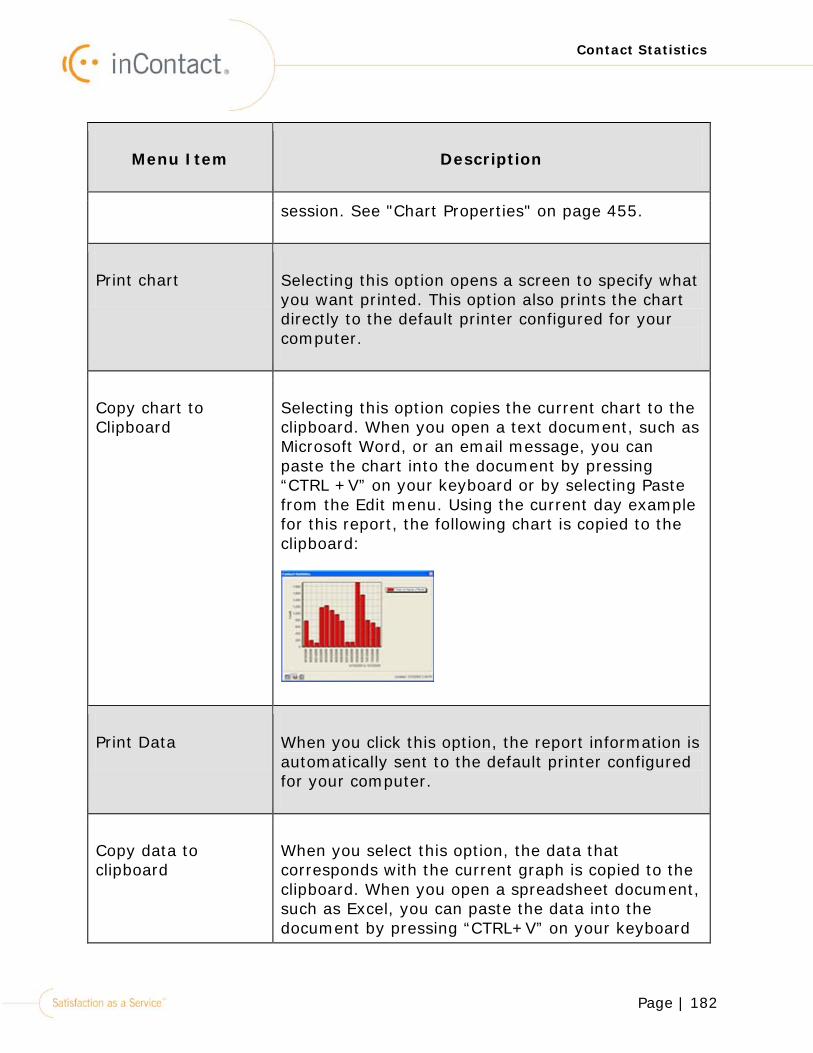
Page | 182
Contact Statistics
Menu Item Description
session. See "Chart Properties" on page 455.
Print chart Selecting this option opens a screen to specify what you want printed. This option also prints the chart directly to the default printer configured for your computer.
Copy chart to Clipboard
Selecting this option copies the current chart to the clipboard. When you open a text document, such as Microsoft Word, or an email message, you can paste the chart into the document by pressing “CTRL +V” on your keyboard or by selecting Paste from the Edit menu. Using the current day example for this report, the following chart is copied to the clipboard:
Print Data When you click this option, the report information is automatically sent to the default printer configured for your computer.
Copy data to clipboard
When you select this option, the data that corresponds with the current graph is copied to the clipboard. When you open a spreadsheet document, such as Excel, you can paste the data into the document by pressing “CTRL+V” on your keyboard
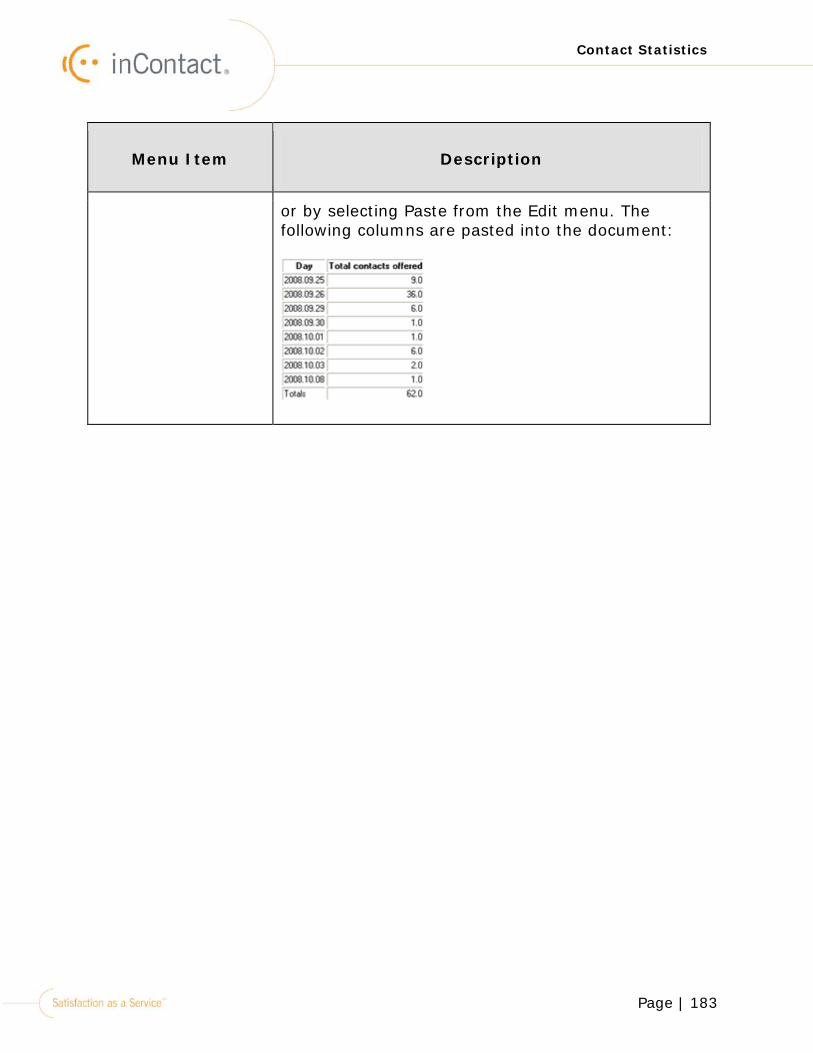
Page | 183
Contact Statistics
Menu Item Description
or by selecting Paste from the Edit menu. The following columns are pasted into the document:
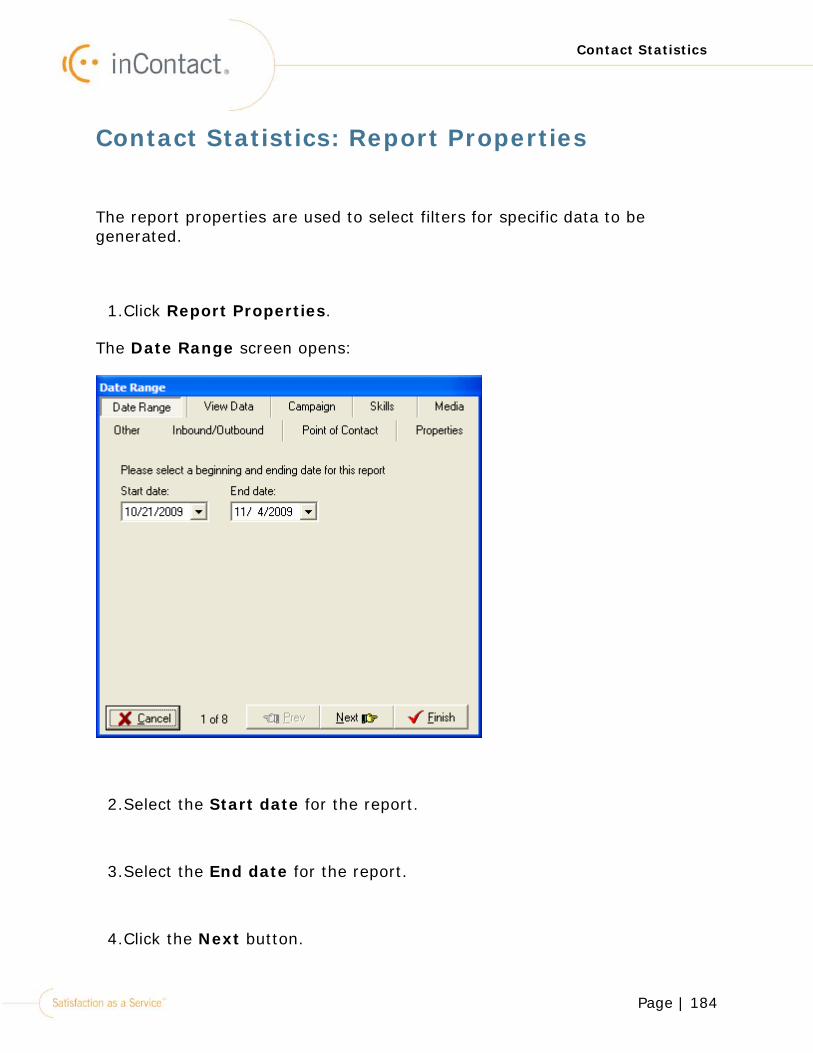
Page | 184
Contact Statistics
Contact Statistics: Report Properties
The report properties are used to select filters for specific data to be generated.
1.Click Report Properties.
The Date Range screen opens:
2.Select the Start date for the report.
3.Select the End date for the report.
4.Click the Next button.
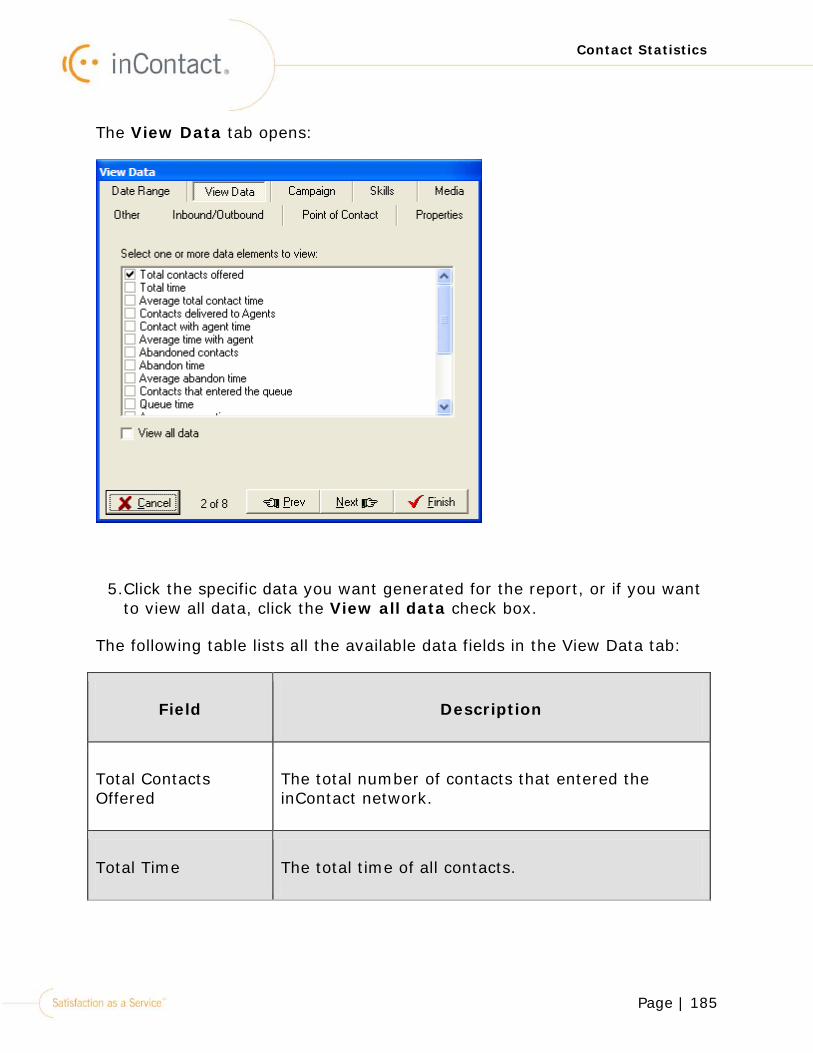
Page | 185
Contact Statistics
The View Data tab opens:
5.Click the specific data you want generated for the report, or if you want to view all data, click the View all data check box.
The following table lists all the available data fields in the View Data tab:
Field Description
Total Contacts Offered
The total number of contacts that entered the inContact network.
Total Time The total time of all contacts.
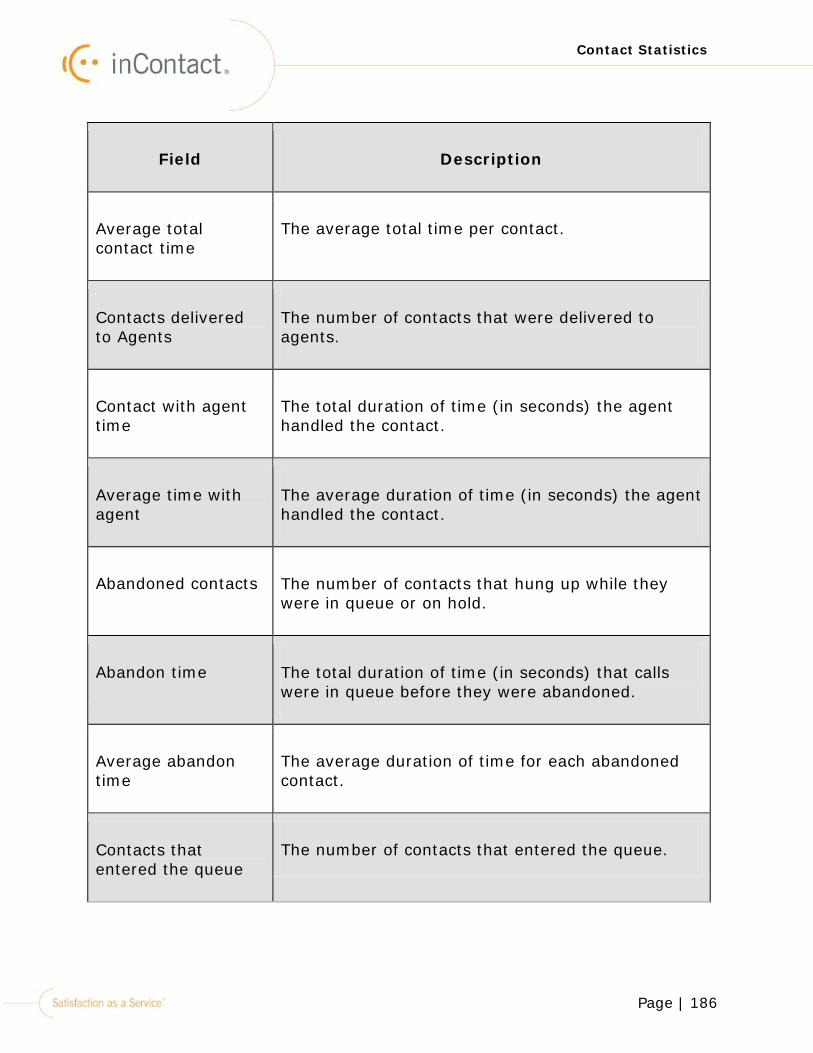
Page | 186
Contact Statistics
Field Description
Average total contact time
The average total time per contact.
Contacts delivered to Agents
The number of contacts that were delivered to agents.
Contact with agent time
The total duration of time (in seconds) the agent handled the contact.
Average time with agent
The average duration of time (in seconds) the agent handled the contact.
Abandoned contacts The number of contacts that hung up while they were in queue or on hold.
Abandon time The total duration of time (in seconds) that calls were in queue before they were abandoned.
Average abandon time
The average duration of time for each abandoned contact.
Contacts that entered the queue
The number of contacts that entered the queue.
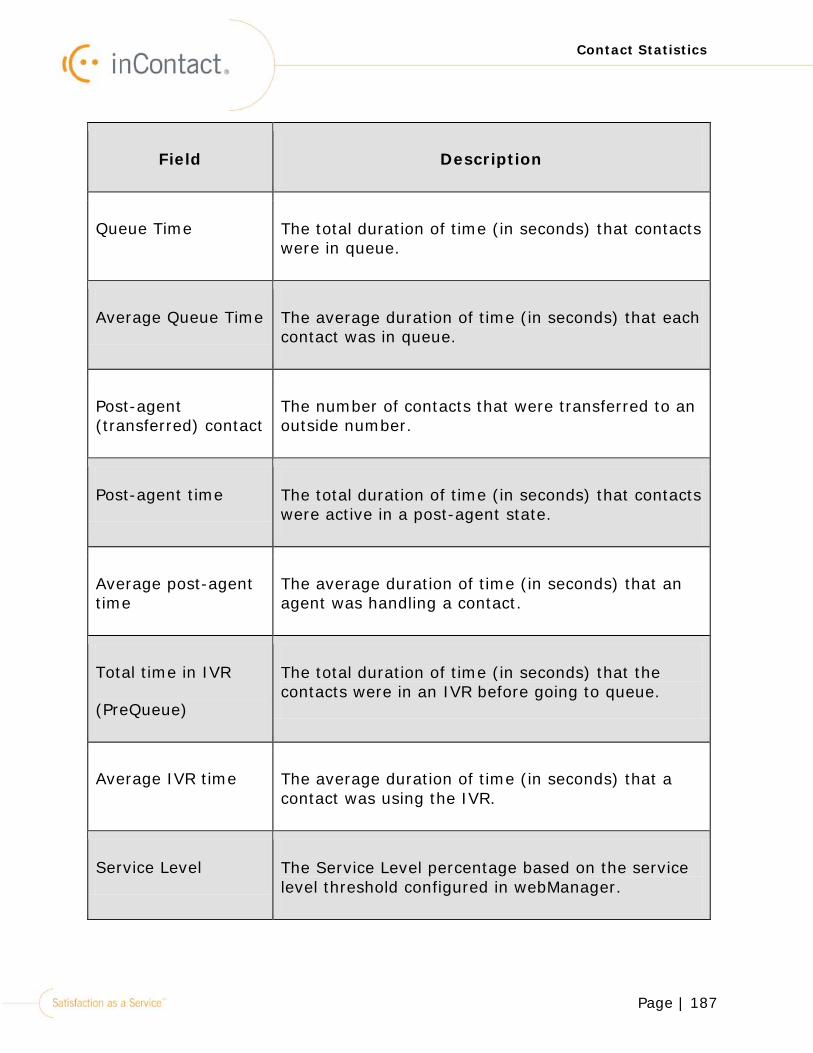
Page | 187
Contact Statistics
Field Description
Queue Time The total duration of time (in seconds) that contacts were in queue.
Average Queue Time The average duration of time (in seconds) that each contact was in queue.
Post-agent (transferred) contact
The number of contacts that were transferred to an outside number.
Post-agent time The total duration of time (in seconds) that contacts were active in a post-agent state.
Average post-agent time
The average duration of time (in seconds) that an agent was handling a contact.
Total time in IVR
(PreQueue)
The total duration of time (in seconds) that the contacts were in an IVR before going to queue.
Average IVR time The average duration of time (in seconds) that a contact was using the IVR.
Service Level The Service Level percentage based on the service level threshold configured in webManager.
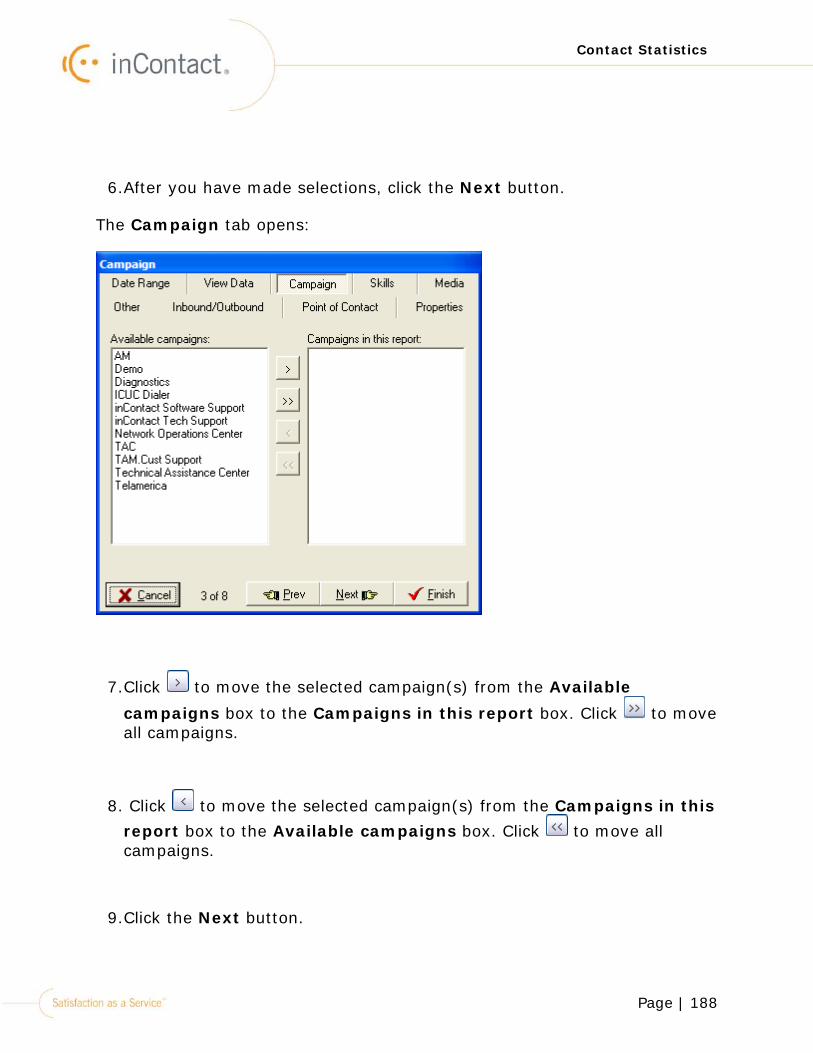
Page | 188
Contact Statistics
6.After you have made selections, click the Next button.
The Campaign tab opens:
7.Click to move the selected campaign(s) from the Available
campaigns box to the Campaigns in this report box. Click to move all campaigns.
8. Click to move the selected campaign(s) from the Campaigns in this report box to the Available campaigns box. Click to move all campaigns.
9.Click the Next button.
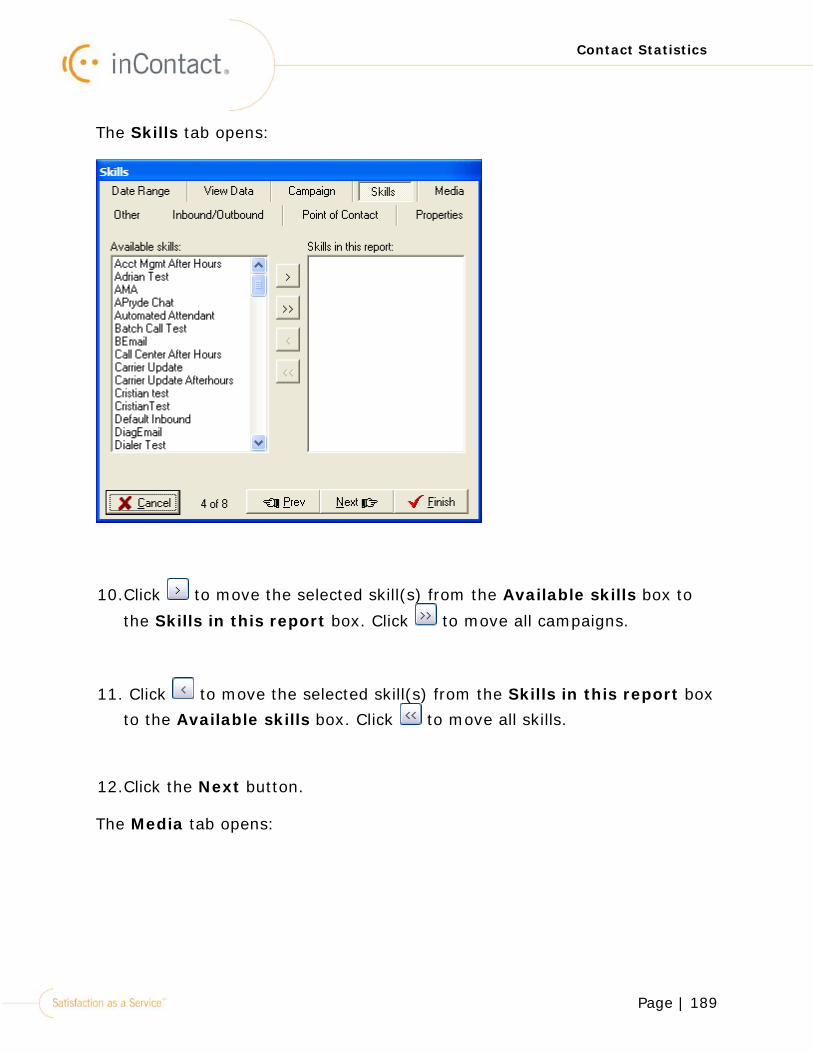
Page | 189
Contact Statistics
The Skills tab opens:
10.Click to move the selected skill(s) from the Available skills box to
the Skills in this report box. Click to move all campaigns.
11. Click to move the selected skill(s) from the Skills in this report box to the Available skills box. Click to move all skills.
12.Click the Next button.
The Media tab opens:
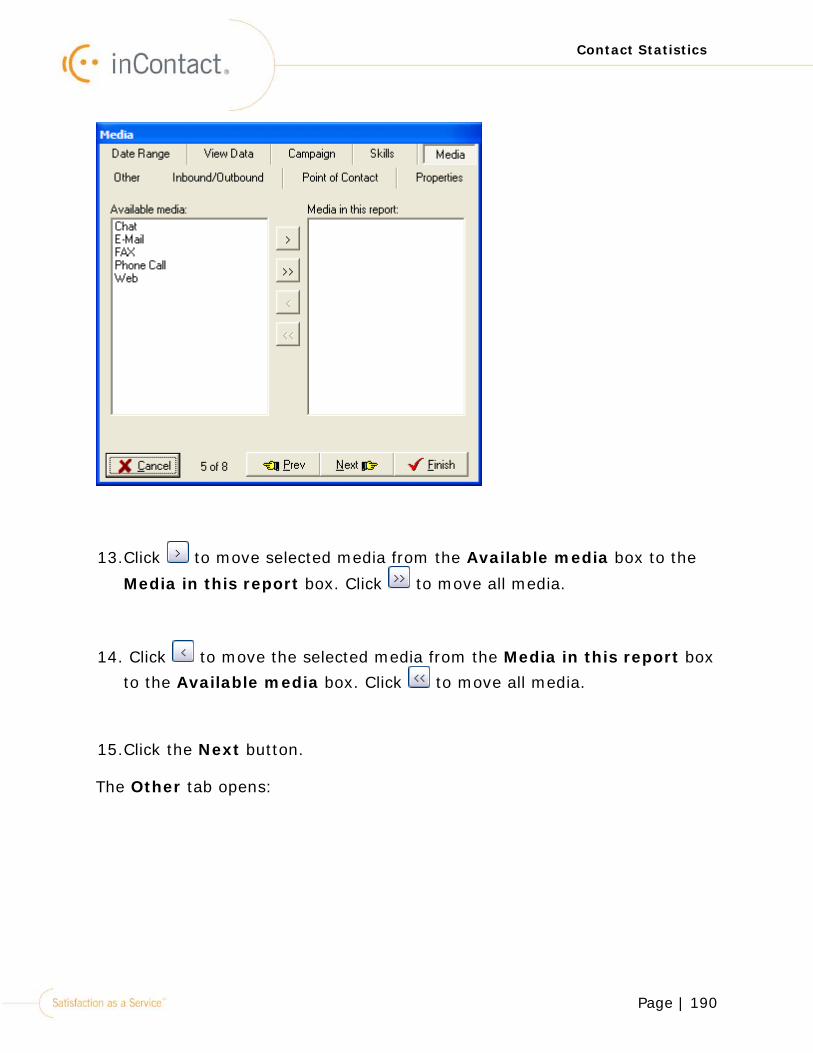
Page | 190
Contact Statistics
13.Click to move selected media from the Available media box to the
Media in this report box. Click to move all media.
14. Click to move the selected media from the Media in this report box to the Available media box. Click to move all media.
15.Click the Next button.
The Other tab opens:
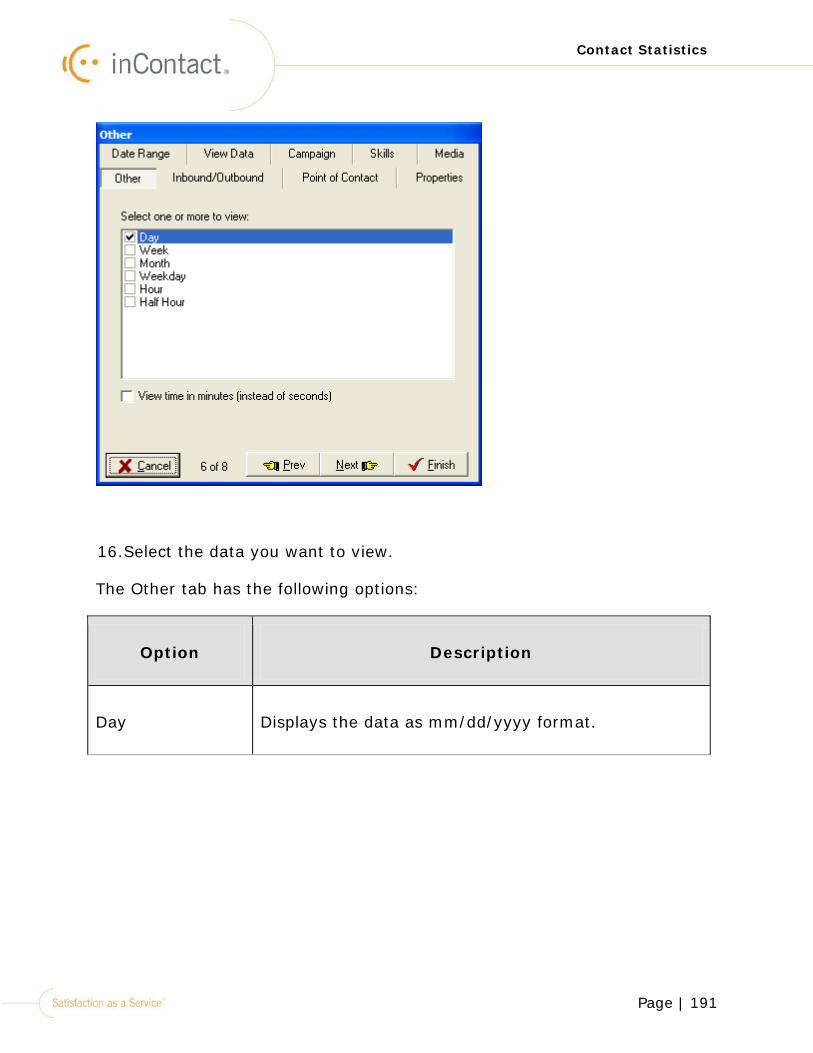
Page | 191
Contact Statistics
16.Select the data you want to view.
The Other tab has the following options:
Option Description
Day Displays the data as mm/dd/yyyy format.
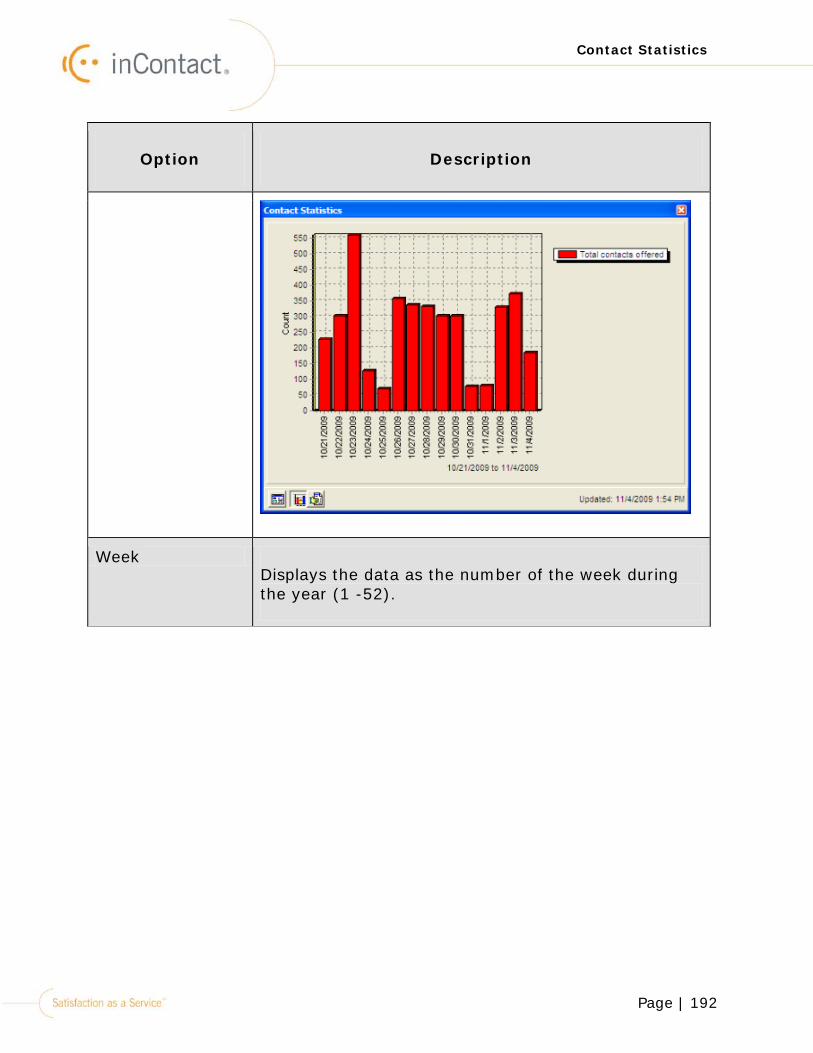
Page | 192
Contact Statistics
Option Description
Week Displays the data as the number of the week during the year (1 -52).
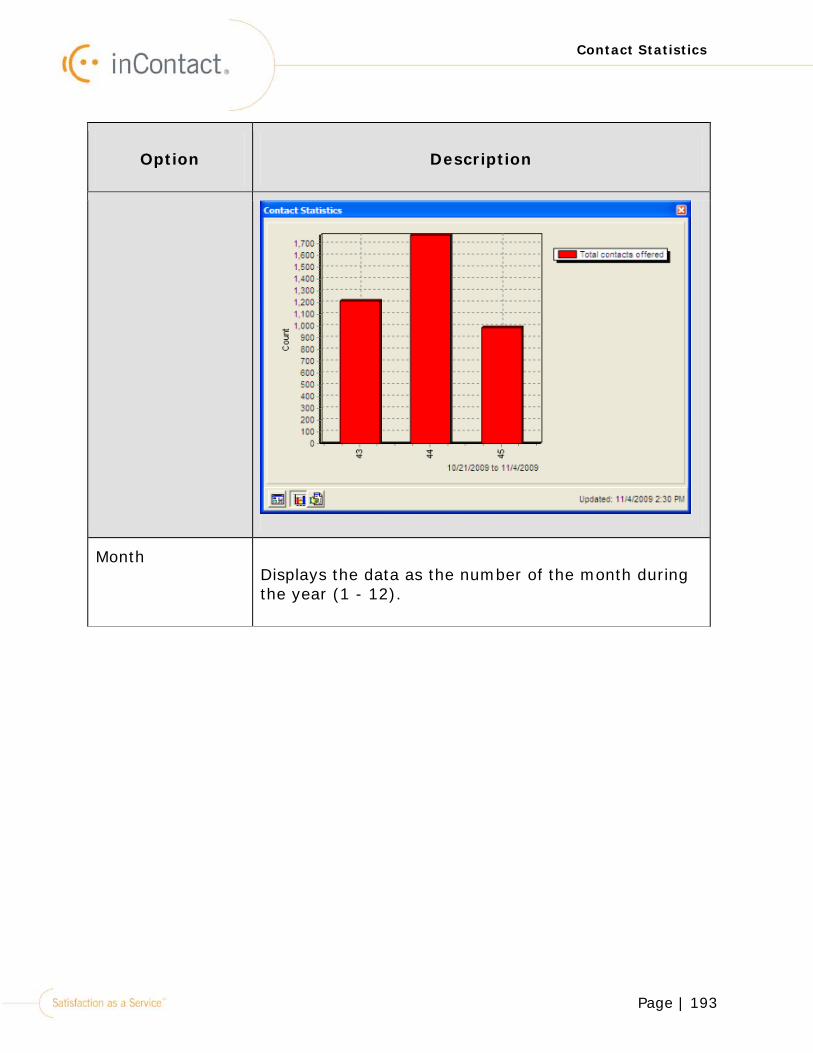
Page | 193
Contact Statistics
Option Description
Month Displays the data as the number of the month during the year (1 - 12).
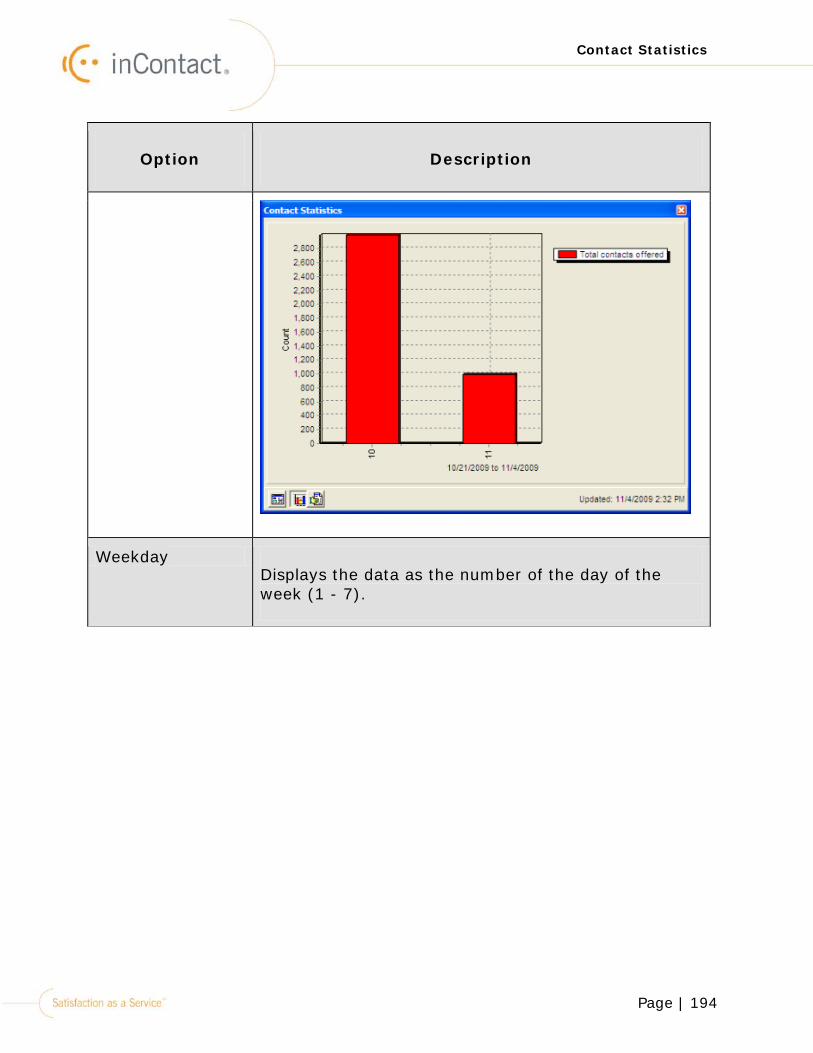
Page | 194
Contact Statistics
Option Description
Weekday Displays the data as the number of the day of the week (1 - 7).
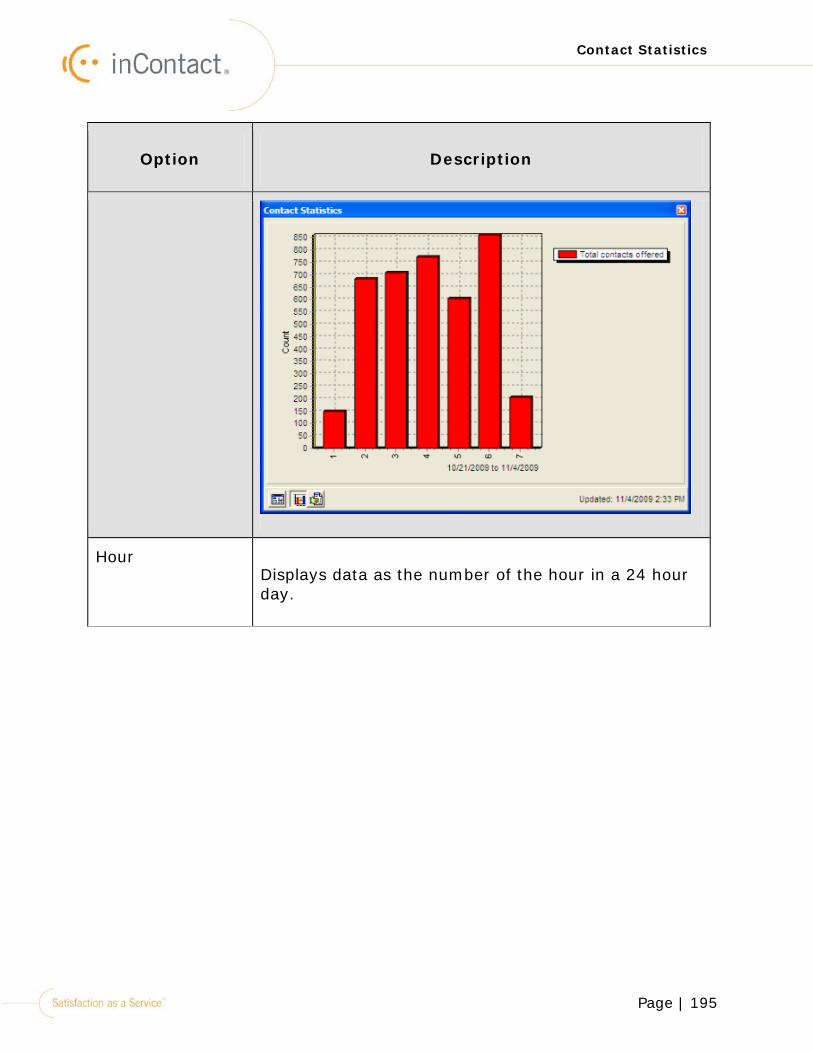
Page | 195
Contact Statistics
Option Description
Hour Displays data as the number of the hour in a 24 hour day.
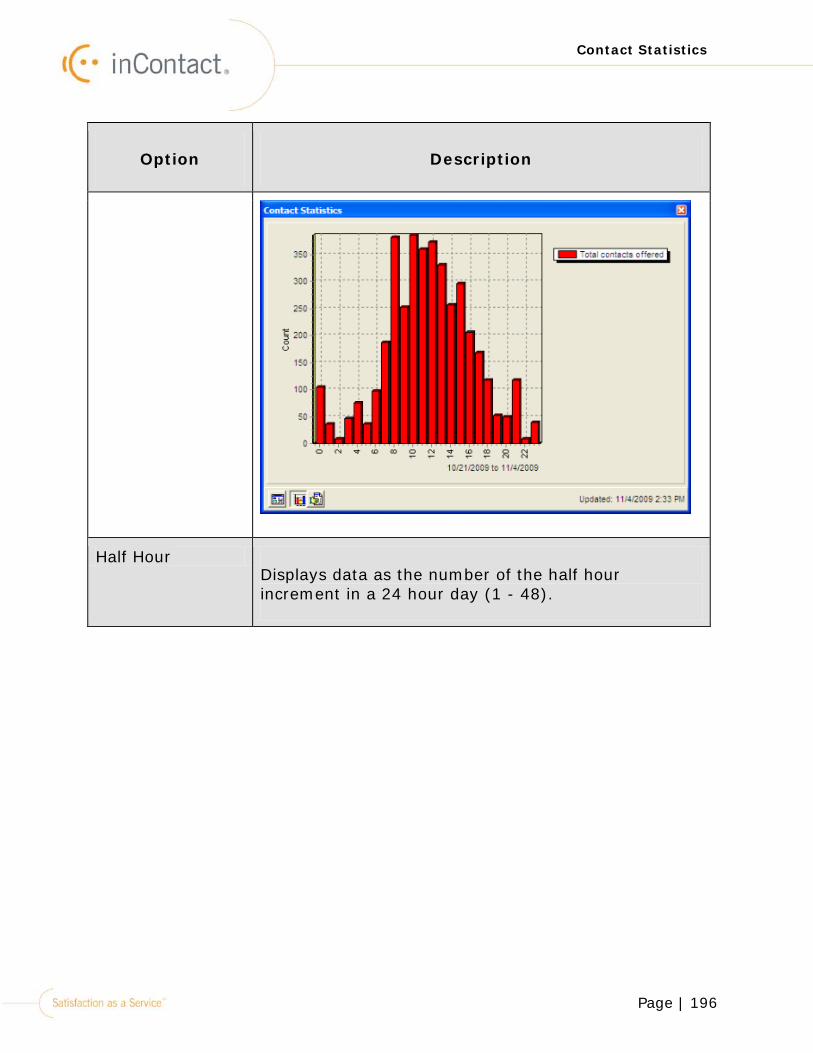
Page | 196
Contact Statistics
Option Description
Half Hour Displays data as the number of the half hour increment in a 24 hour day (1 - 48).
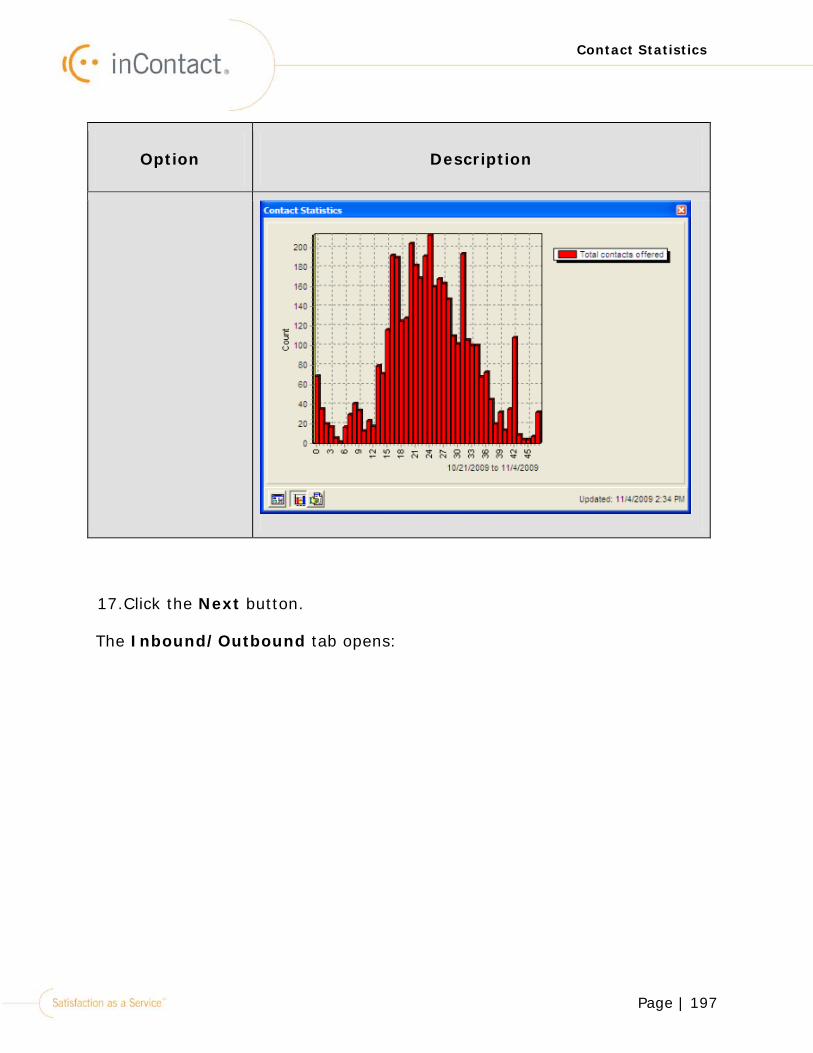
Page | 197
Contact Statistics
Option Description
17.Click the Next button.
The Inbound/Outbound tab opens:
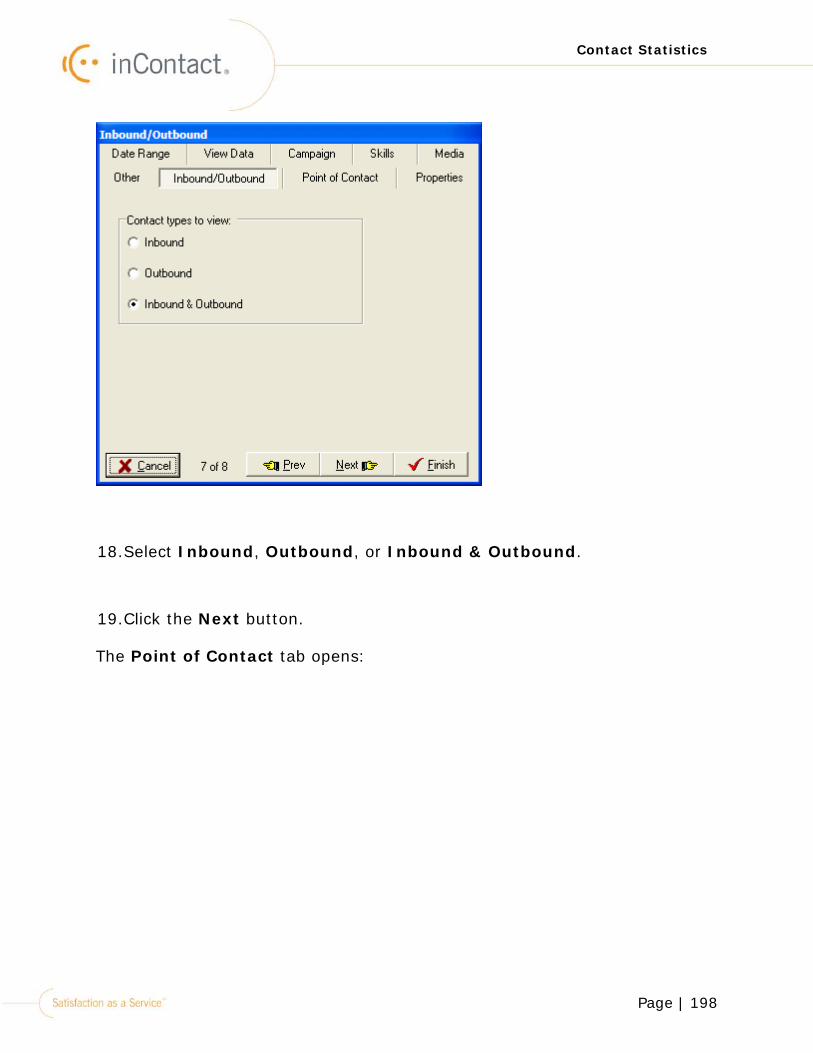
Page | 198
Contact Statistics
18.Select Inbound, Outbound, or Inbound & Outbound.
19.Click the Next button.
The Point of Contact tab opens:
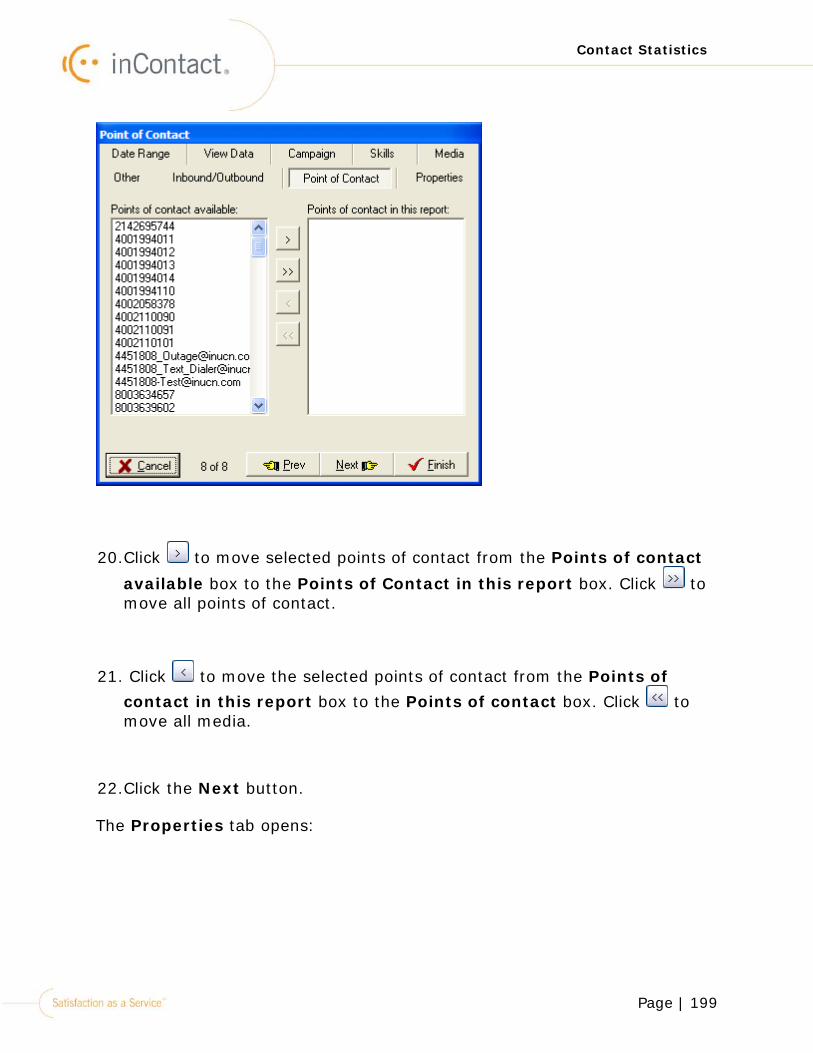
Page | 199
Contact Statistics
20.Click to move selected points of contact from the Points of contact available box to the Points of Contact in this report box. Click to move all points of contact.
21. Click to move the selected points of contact from the Points of contact in this report box to the Points of contact box. Click to move all media.
22.Click the Next button.
The Properties tab opens:

Page | 200
Contact Statistics
23.Enter the name of the report. The name will appear in the title bar of the window.
24.Click the Finish button.
The report displays with the selected options.
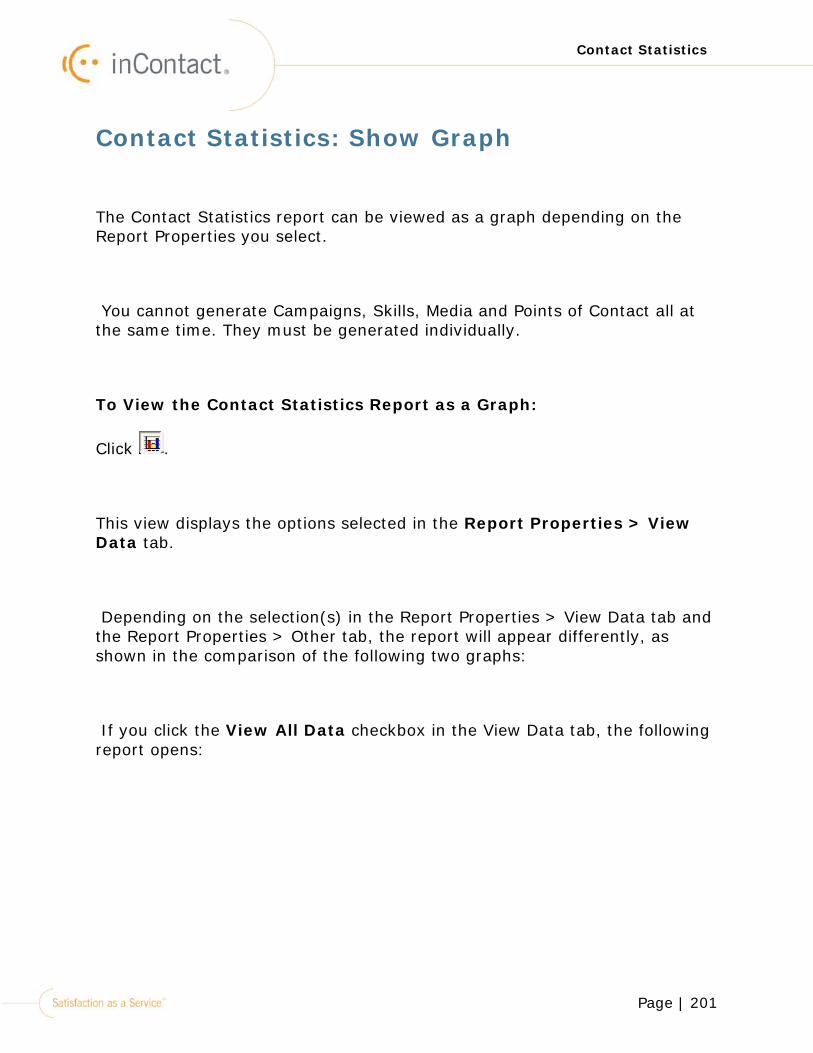
Page | 201
Contact Statistics
Contact Statistics: Show Graph
The Contact Statistics report can be viewed as a graph depending on the Report Properties you select.
You cannot generate Campaigns, Skills, Media and Points of Contact all at the same time. They must be generated individually.
To View the Contact Statistics Report as a Graph:
Click .
This view displays the options selected in the Report Properties > View Data tab.
Depending on the selection(s) in the Report Properties > View Data tab and the Report Properties > Other tab, the report will appear differently, as shown in the comparison of the following two graphs:
If you click the View All Data checkbox in the View Data tab, the following report opens:
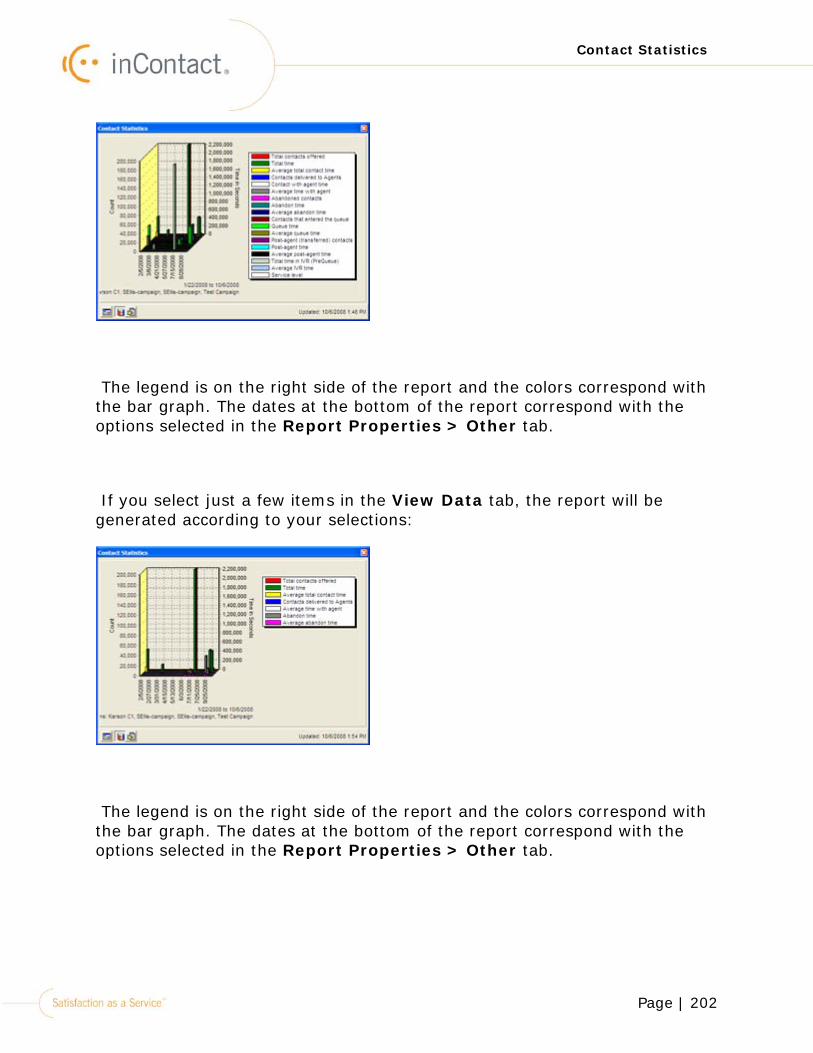
Page | 202
Contact Statistics
The legend is on the right side of the report and the colors correspond with the bar graph. The dates at the bottom of the report correspond with the options selected in the Report Properties > Other tab.
If you select just a few items in the View Data tab, the report will be generated according to your selections:
The legend is on the right side of the report and the colors correspond with the bar graph. The dates at the bottom of the report correspond with the options selected in the Report Properties > Other tab.
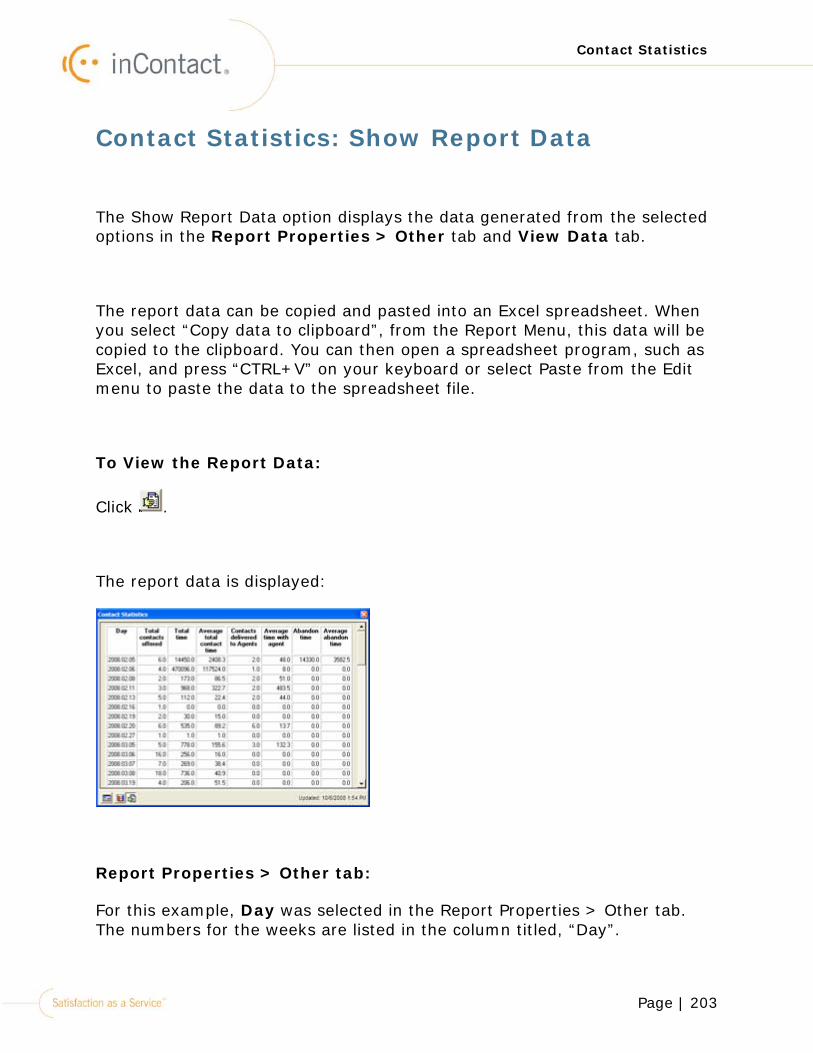
Page | 203
Contact Statistics
Contact Statistics: Show Report Data
The Show Report Data option displays the data generated from the selected options in the Report Properties > Other tab and View Data tab.
The report data can be copied and pasted into an Excel spreadsheet. When you select “Copy data to clipboard”, from the Report Menu, this data will be copied to the clipboard. You can then open a spreadsheet program, such as Excel, and press “CTRL+V” on your keyboard or select Paste from the Edit menu to paste the data to the spreadsheet file.
To View the Report Data:
Click .
The report data is displayed:
Report Properties > Other tab:
For this example, Day was selected in the Report Properties > Other tab. The numbers for the weeks are listed in the column titled, “Day”.
Page | 204
Contact Statistics
Report Properties > View Data tab:
Each of the selections in the View Data tab become the column headings for this report. For this example, the following selections were made in the Report Properties > View Data tab:
•Total contacts offered
•Total time
•Average total contact time
•Contacts delivered to Agents
•Average time with agent
•Abandon time
•Average abandon time
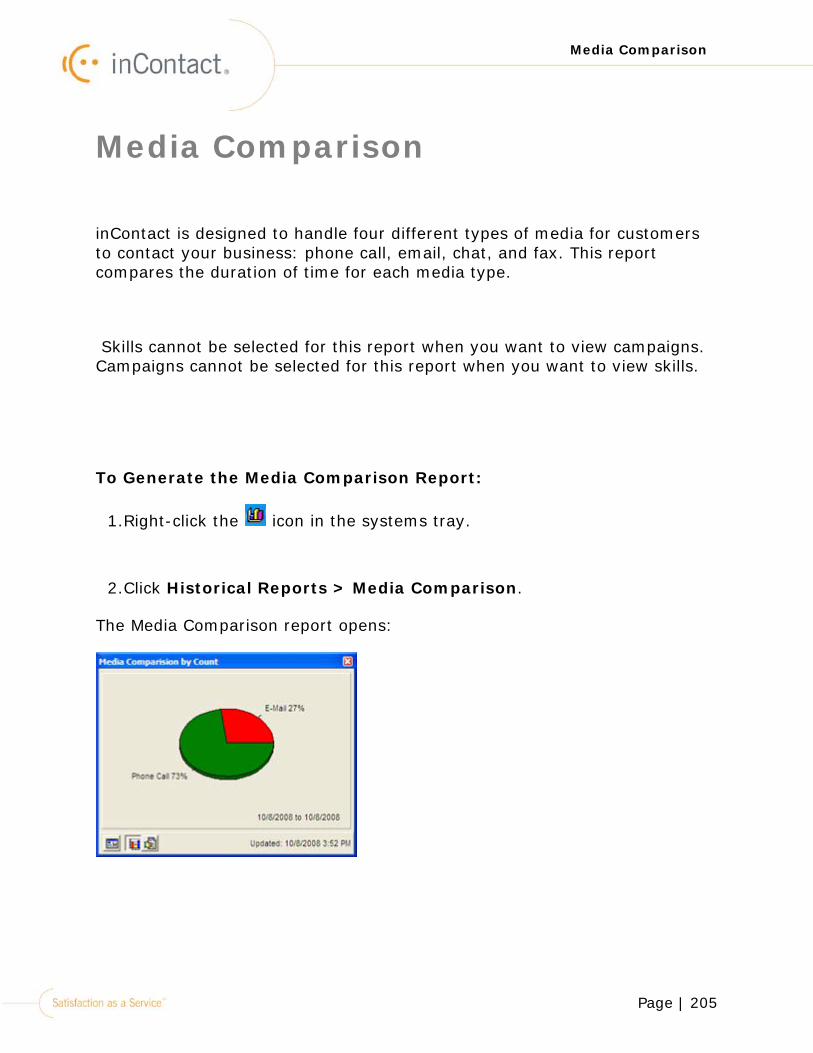
Page | 205
Media Comparison
Media Comparison
inContact is designed to handle four different types of media for customers to contact your business: phone call, email, chat, and fax. This report compares the duration of time for each media type.
Skills cannot be selected for this report when you want to view campaigns. Campaigns cannot be selected for this report when you want to view skills.
To Generate the Media Comparison Report:
1.Right-click the icon in the systems tray.
2.Click Historical Reports > Media Comparison.
The Media Comparison report opens:
Page | 206
Media Comparison
There are different views available for this report. Using the three buttons in the lower left corner, different reports can be generated according to your business needs:
• Report Menu
• Show Graph
• Show Report Data
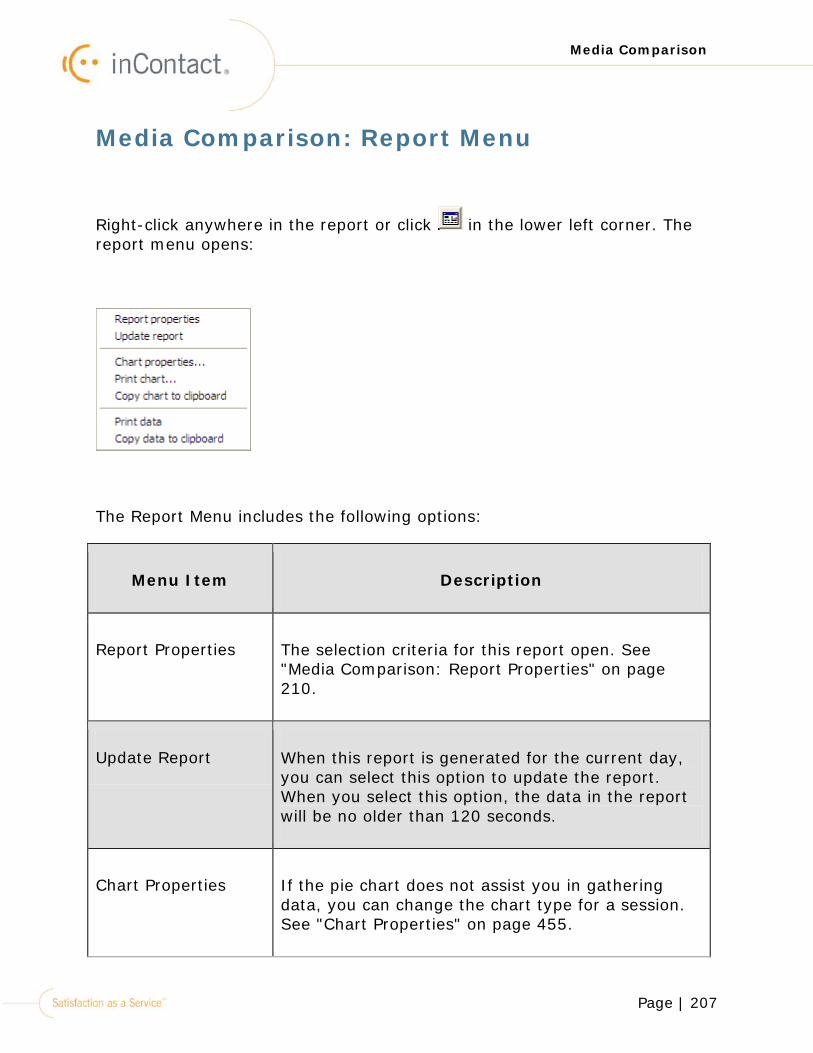
Page | 207
Media Comparison
Media Comparison: Report Menu
Right-click anywhere in the report or click in the lower left corner. The report menu opens:
The Report Menu includes the following options:
Menu Item Description
Report Properties The selection criteria for this report open. See "Media Comparison: Report Properties" on page 210.
Update Report When this report is generated for the current day, you can select this option to update the report. When you select this option, the data in the report will be no older than 120 seconds.
Chart Properties If the pie chart does not assist you in gathering data, you can change the chart type for a session. See "Chart Properties" on page 455.
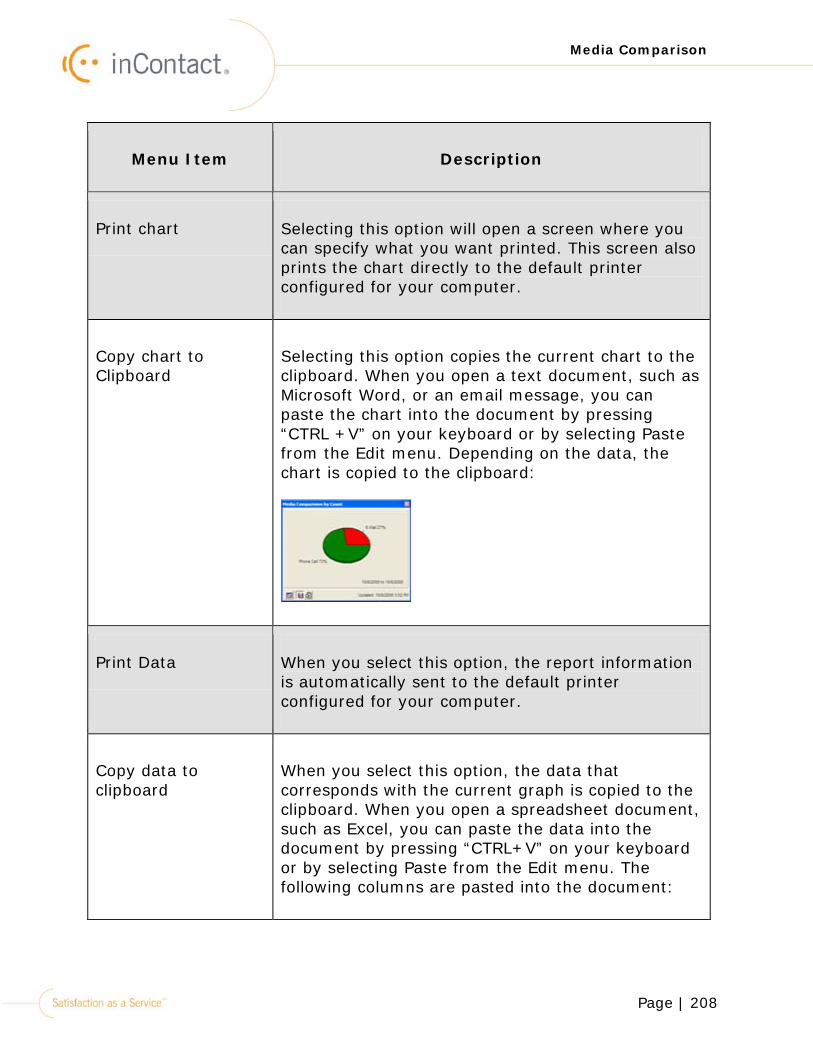
Page | 208
Media Comparison
Menu Item Description
Print chart Selecting this option will open a screen where you can specify what you want printed. This screen also prints the chart directly to the default printer configured for your computer.
Copy chart to Clipboard
Selecting this option copies the current chart to the clipboard. When you open a text document, such as Microsoft Word, or an email message, you can paste the chart into the document by pressing “CTRL +V” on your keyboard or by selecting Paste from the Edit menu. Depending on the data, the chart is copied to the clipboard:
Print Data When you select this option, the report information is automatically sent to the default printer configured for your computer.
Copy data to clipboard
When you select this option, the data that corresponds with the current graph is copied to the clipboard. When you open a spreadsheet document, such as Excel, you can paste the data into the document by pressing “CTRL+V” on your keyboard or by selecting Paste from the Edit menu. The following columns are pasted into the document:
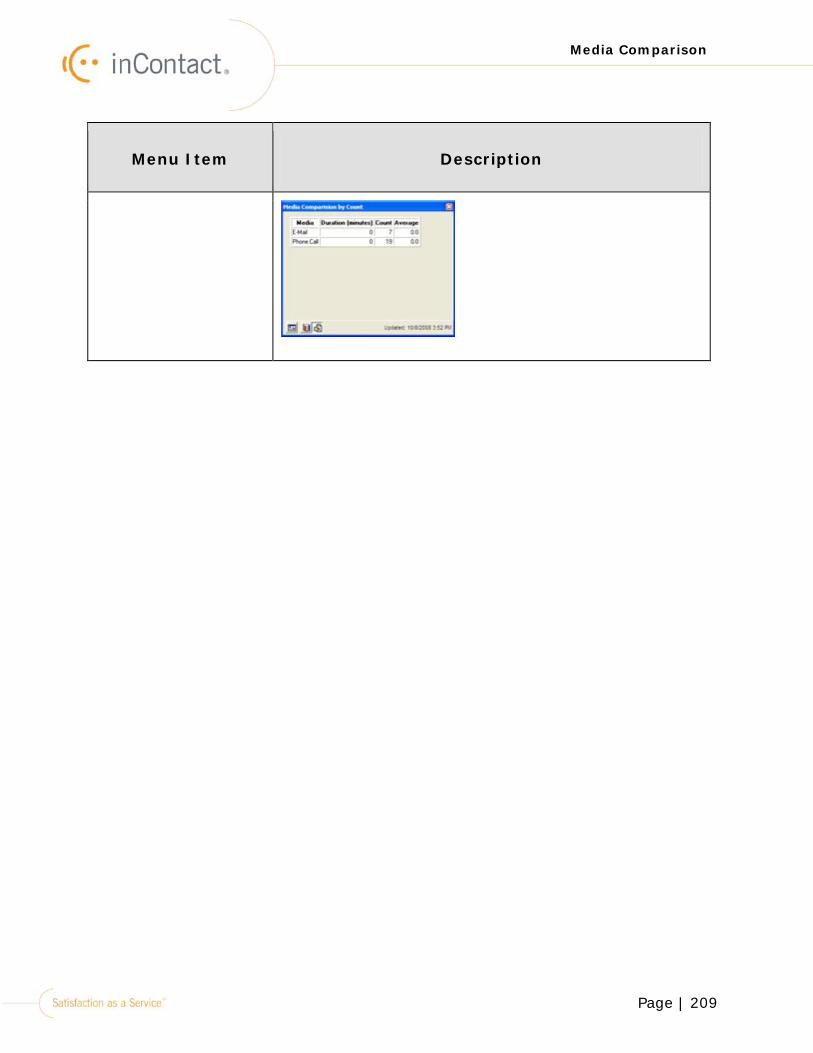
Page | 209
Media Comparison
Menu Item Description
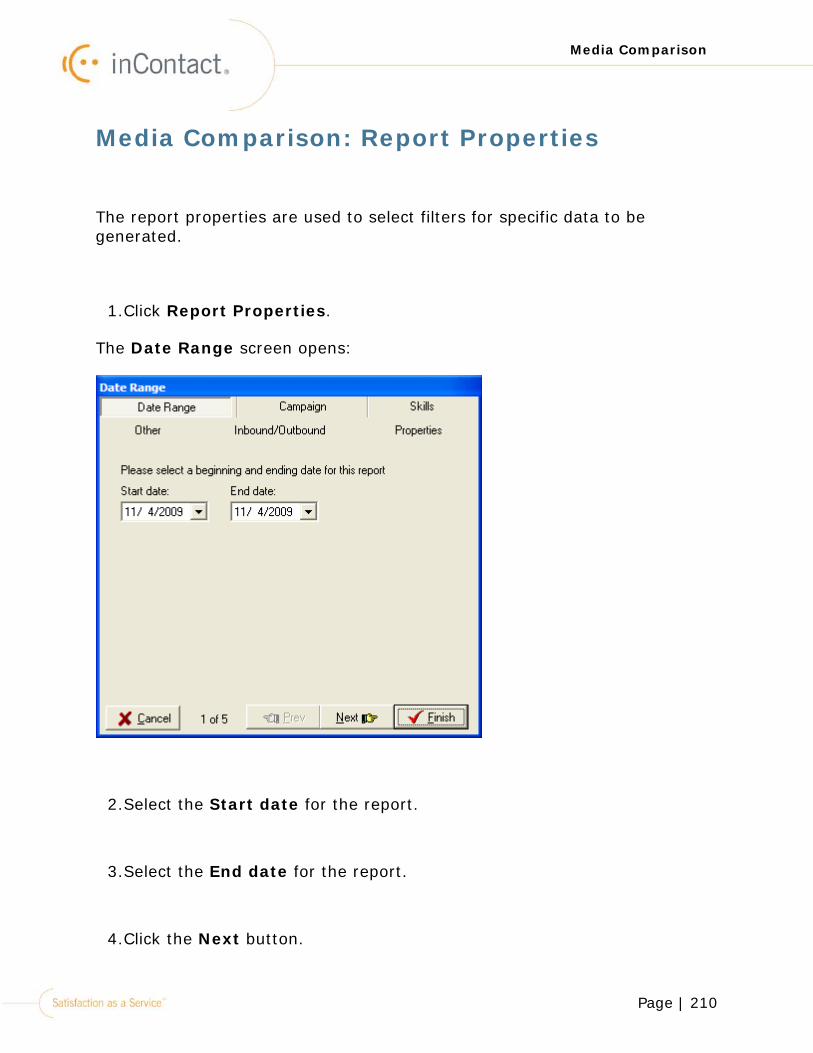
Page | 210
Media Comparison
Media Comparison: Report Properties
The report properties are used to select filters for specific data to be generated.
1.Click Report Properties.
The Date Range screen opens:
2.Select the Start date for the report.
3.Select the End date for the report.
4.Click the Next button.
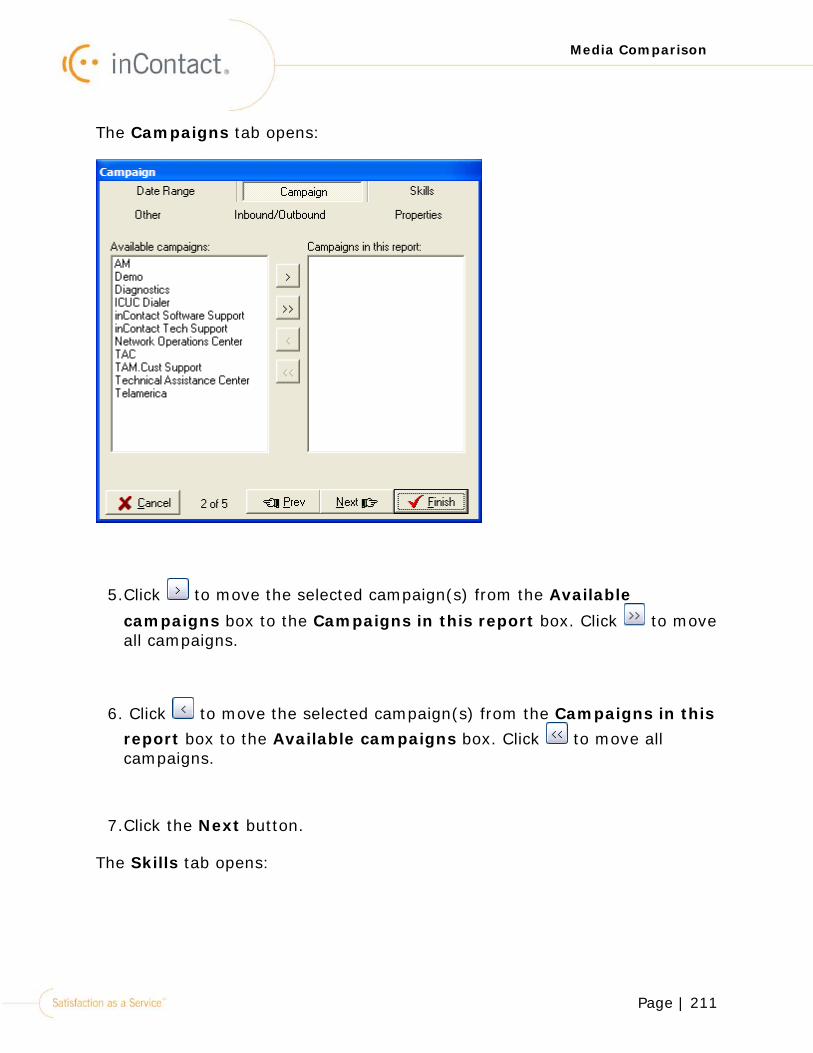
Page | 211
Media Comparison
The Campaigns tab opens:
5.Click to move the selected campaign(s) from the Available campaigns box to the Campaigns in this report box. Click to move all campaigns.
6. Click to move the selected campaign(s) from the Campaigns in this report box to the Available campaigns box. Click to move all campaigns.
7.Click the Next button.
The Skills tab opens:
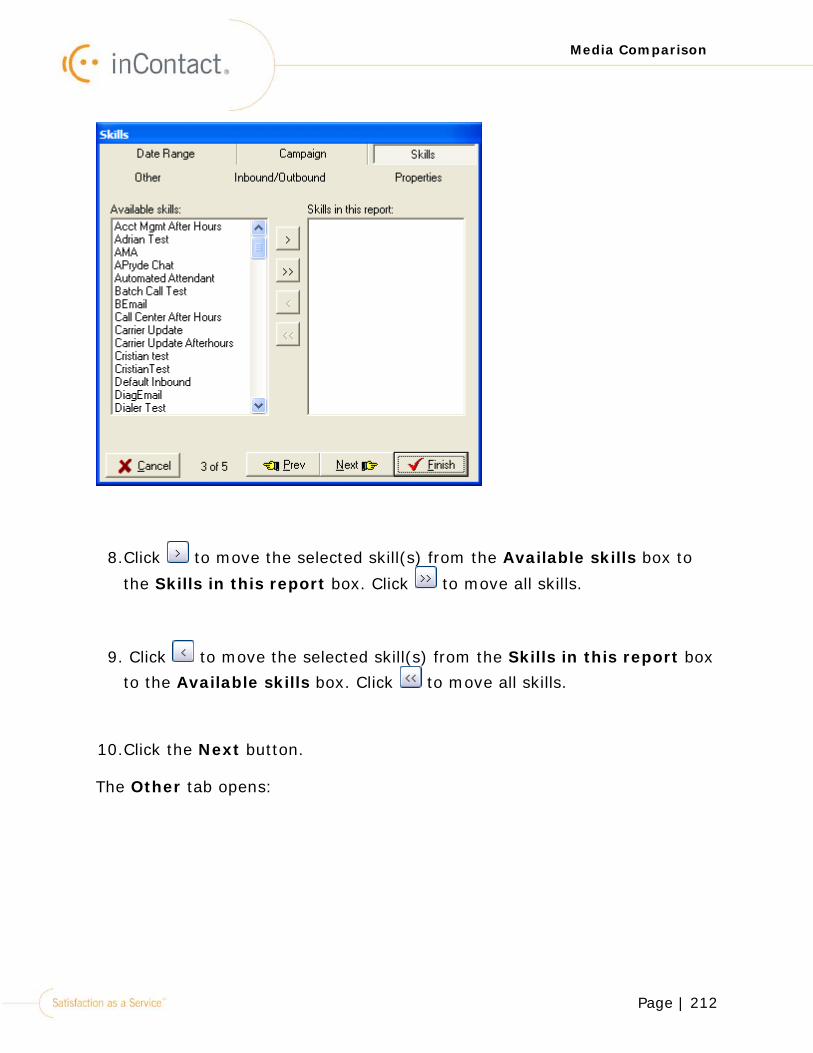
Page | 212
Media Comparison
8.Click to move the selected skill(s) from the Available skills box to
the Skills in this report box. Click to move all skills.
9. Click to move the selected skill(s) from the Skills in this report box to the Available skills box. Click to move all skills.
10.Click the Next button.
The Other tab opens:
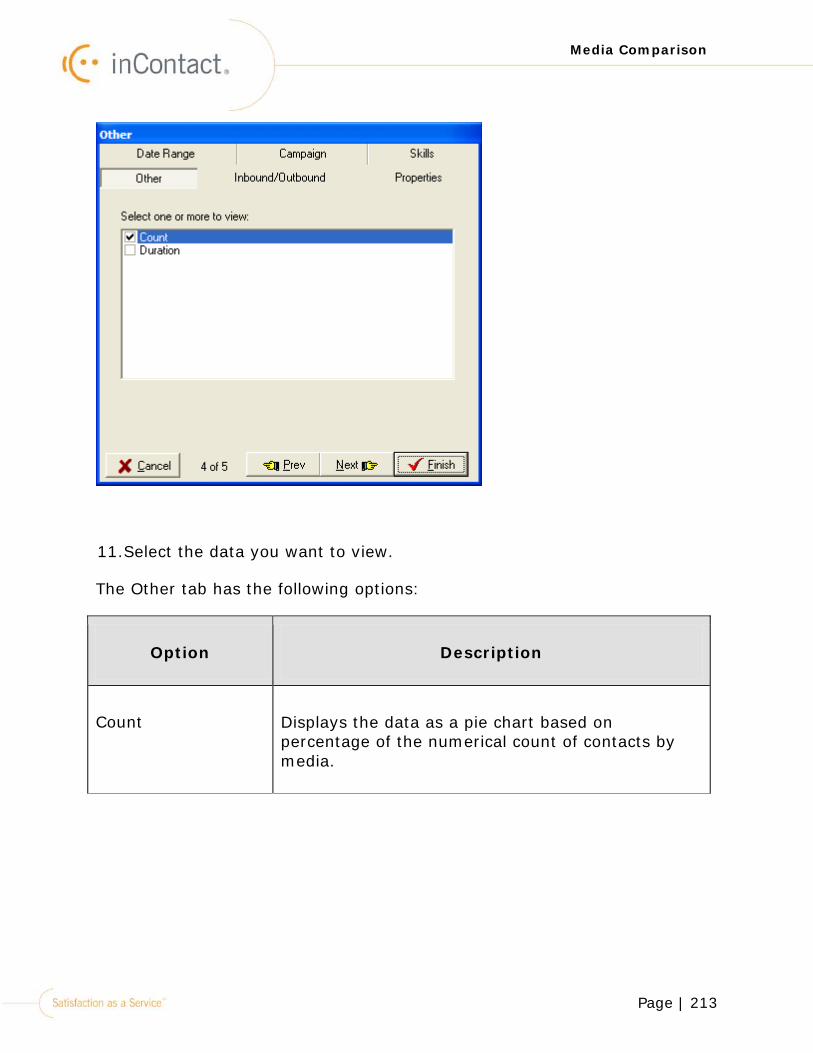
Page | 213
Media Comparison
11.Select the data you want to view.
The Other tab has the following options:
Option Description
Count Displays the data as a pie chart based on percentage of the numerical count of contacts by media.
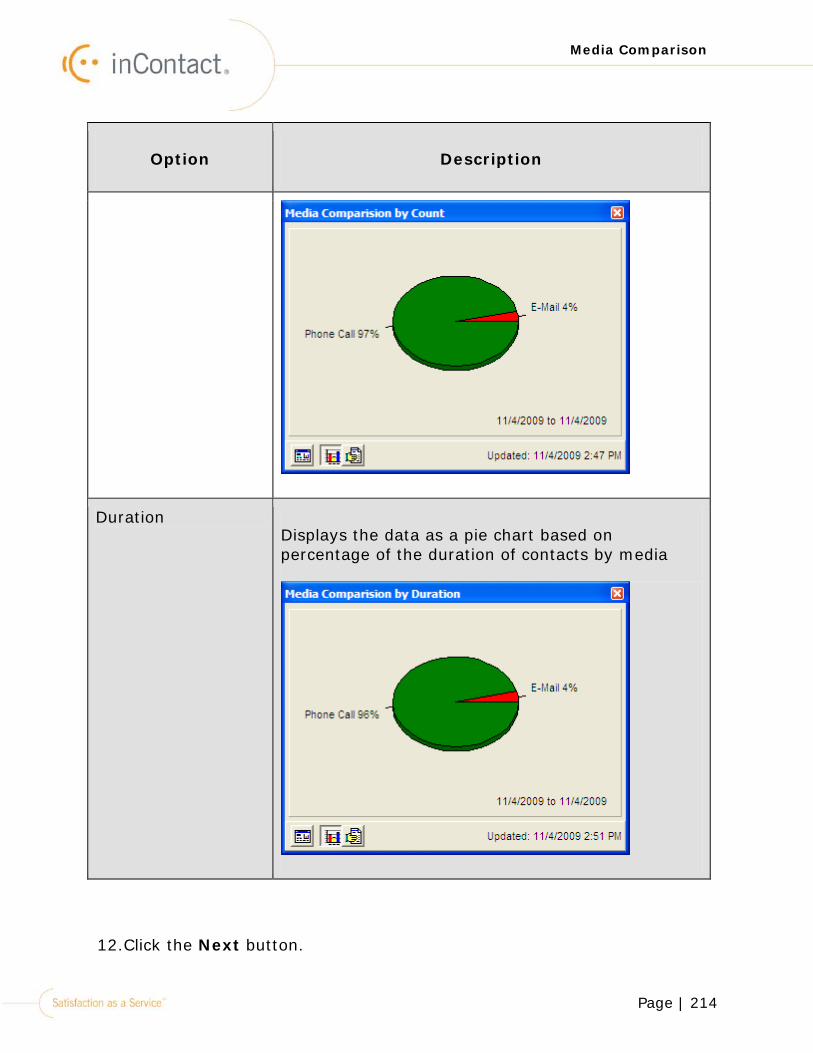
Page | 214
Media Comparison
Option Description
Duration Displays the data as a pie chart based on percentage of the duration of contacts by media
12.Click the Next button.
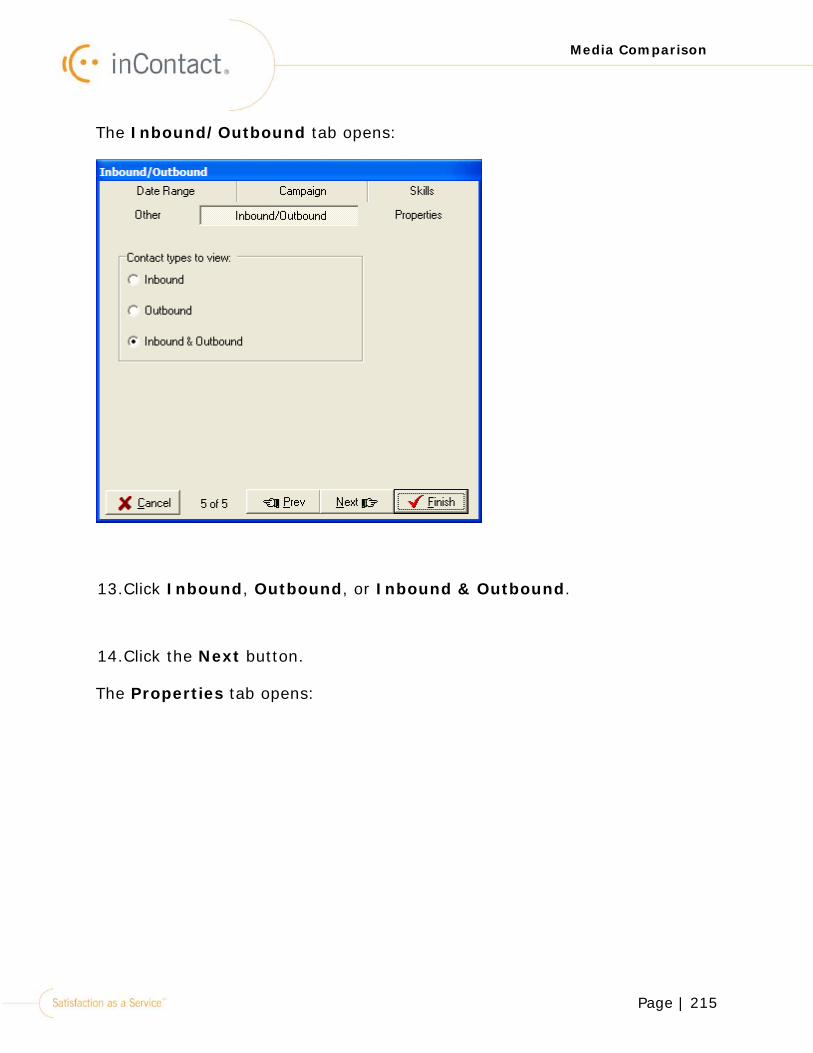
Page | 215
Media Comparison
The Inbound/Outbound tab opens:
13.Click Inbound, Outbound, or Inbound & Outbound.
14.Click the Next button.
The Properties tab opens:
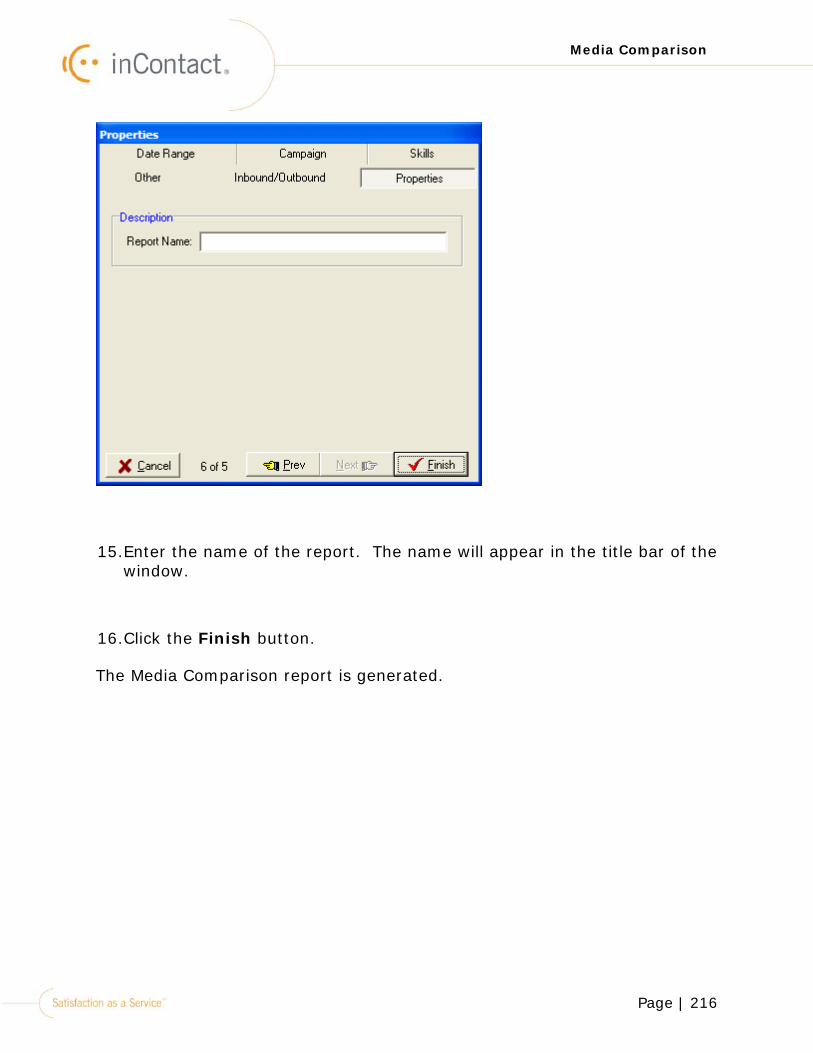
Page | 216
Media Comparison
15.Enter the name of the report. The name will appear in the title bar of the window.
16.Click the Finish button.
The Media Comparison report is generated.
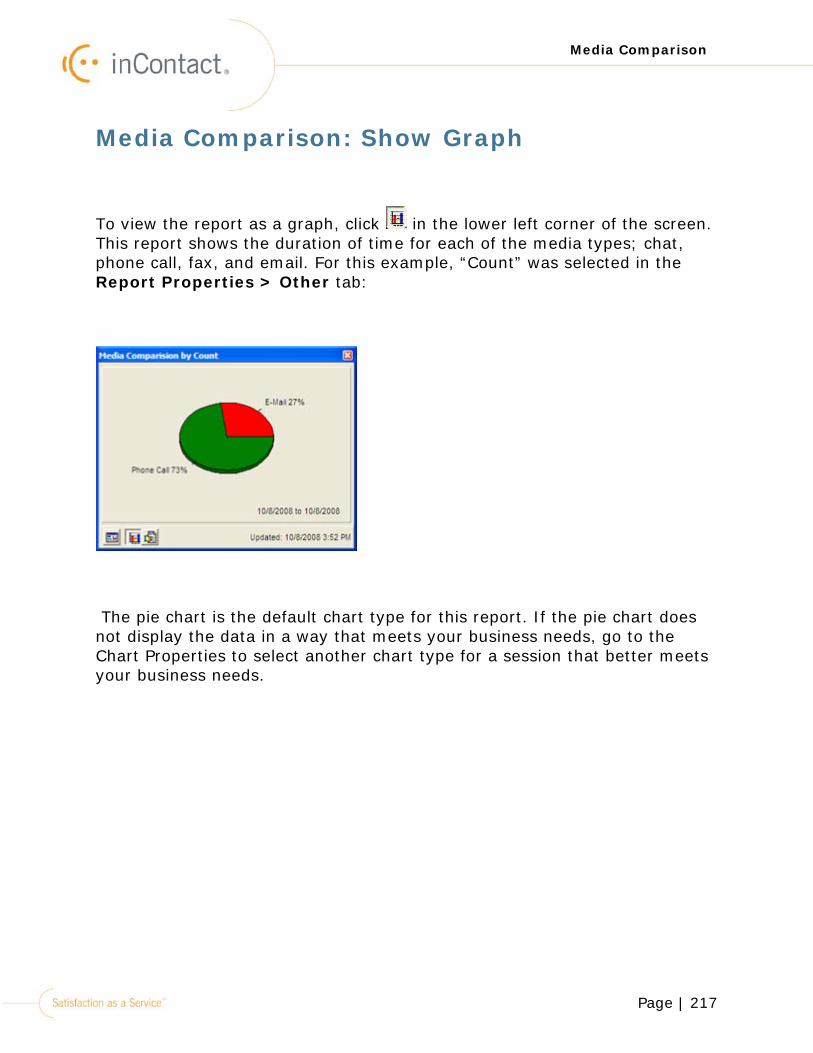
Page | 217
Media Comparison
Media Comparison: Show Graph
To view the report as a graph, click in the lower left corner of the screen. This report shows the duration of time for each of the media types; chat, phone call, fax, and email. For this example, “Count” was selected in the Report Properties > Other tab:
The pie chart is the default chart type for this report. If the pie chart does not display the data in a way that meets your business needs, go to the Chart Properties to select another chart type for a session that better meets your business needs.
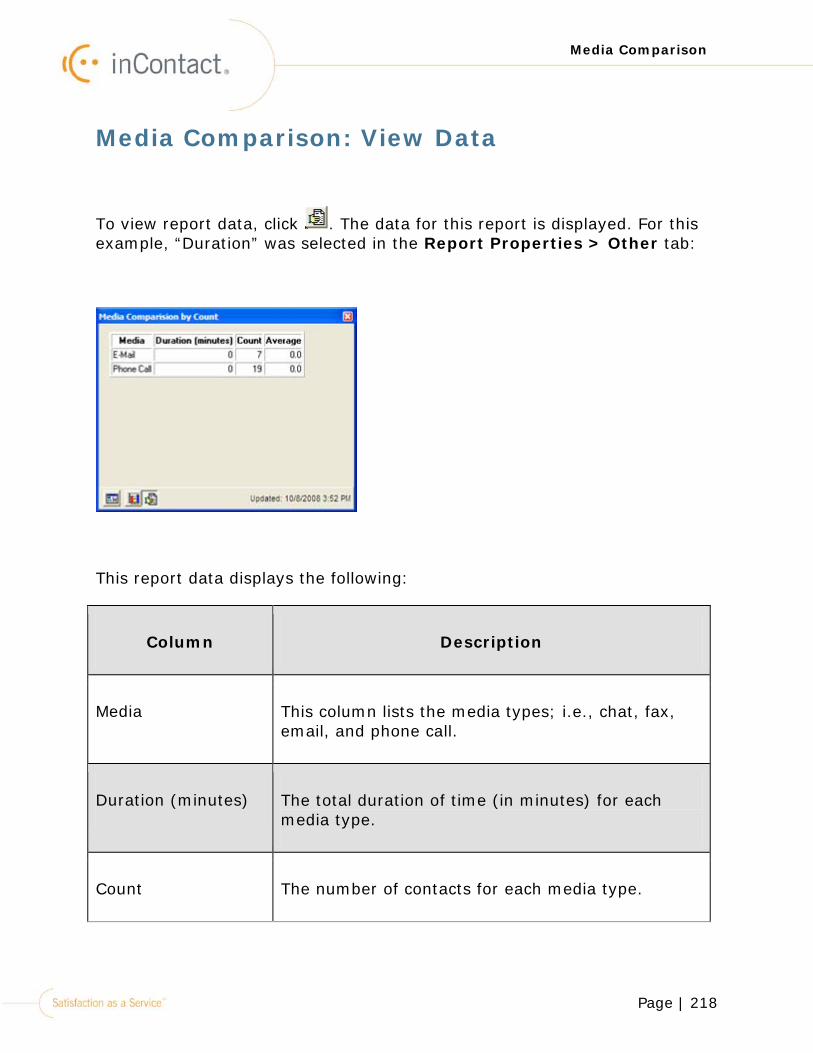
Page | 218
Media Comparison
Media Comparison: View Data
To view report data, click . The data for this report is displayed. For this example, “Duration” was selected in the Report Properties > Other tab:
This report data displays the following:
Column Description
Media This column lists the media types; i.e., chat, fax, email, and phone call.
Duration (minutes) The total duration of time (in minutes) for each media type.
Count The number of contacts for each media type.
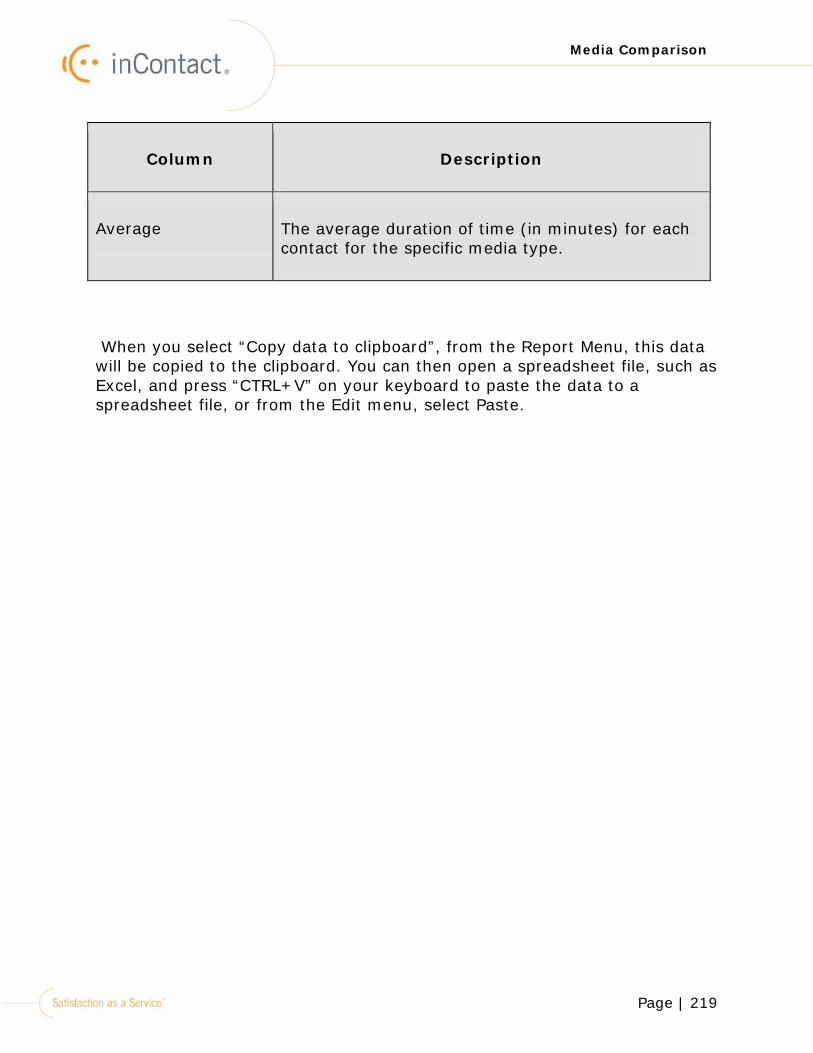
Page | 219
Media Comparison
Column Description
Average The average duration of time (in minutes) for each contact for the specific media type.
When you select “Copy data to clipboard”, from the Report Menu, this data will be copied to the clipboard. You can then open a spreadsheet file, such as Excel, and press “CTRL+V” on your keyboard to paste the data to a spreadsheet file, or from the Edit menu, select Paste.
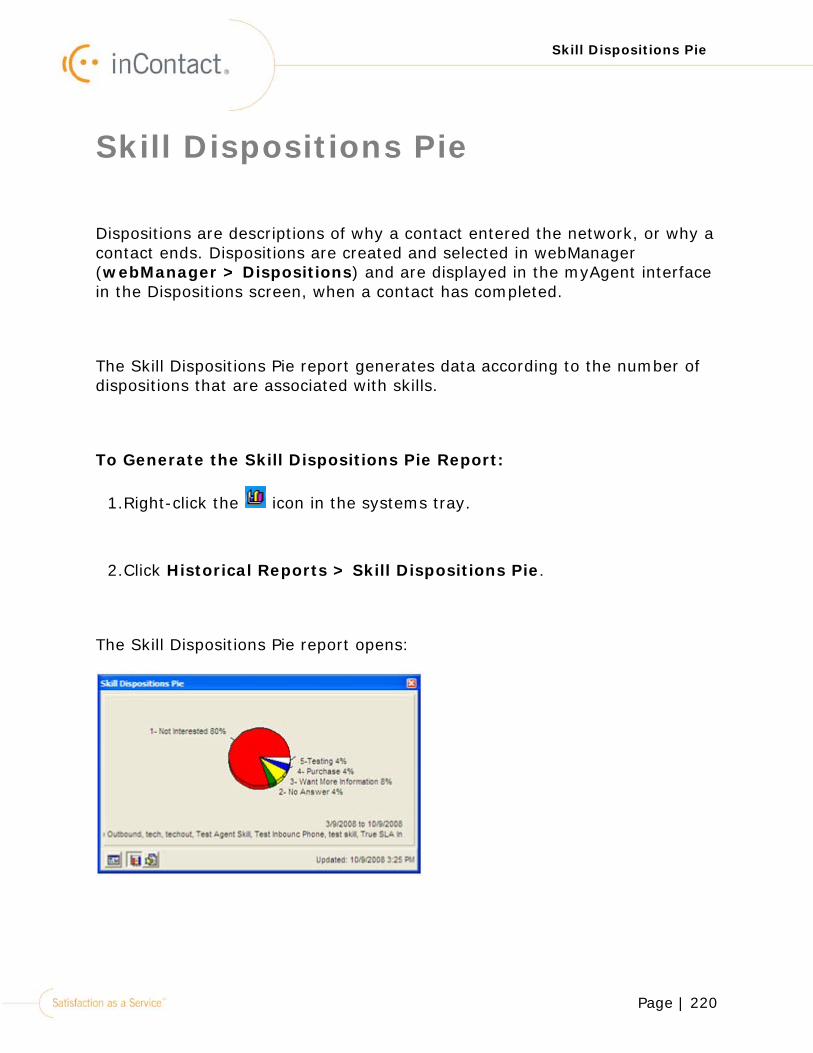
Page | 220
Skill Dispositions Pie
Skill Dispositions Pie
Dispositions are descriptions of why a contact entered the network, or why a contact ends. Dispositions are created and selected in webManager (webManager > Dispositions) and are displayed in the myAgent interface in the Dispositions screen, when a contact has completed.
The Skill Dispositions Pie report generates data according to the number of dispositions that are associated with skills.
To Generate the Skill Dispositions Pie Report:
1.Right-click the icon in the systems tray.
2.Click Historical Reports > Skill Dispositions Pie.
The Skill Dispositions Pie report opens:
Page | 221
Skill Dispositions Pie
There are different views of this report that inTouch can generate. Using the three buttons in the lower left corner, different reports can be generated according to your business needs:
•Report Menu
•Show Graph
•Show Report Data
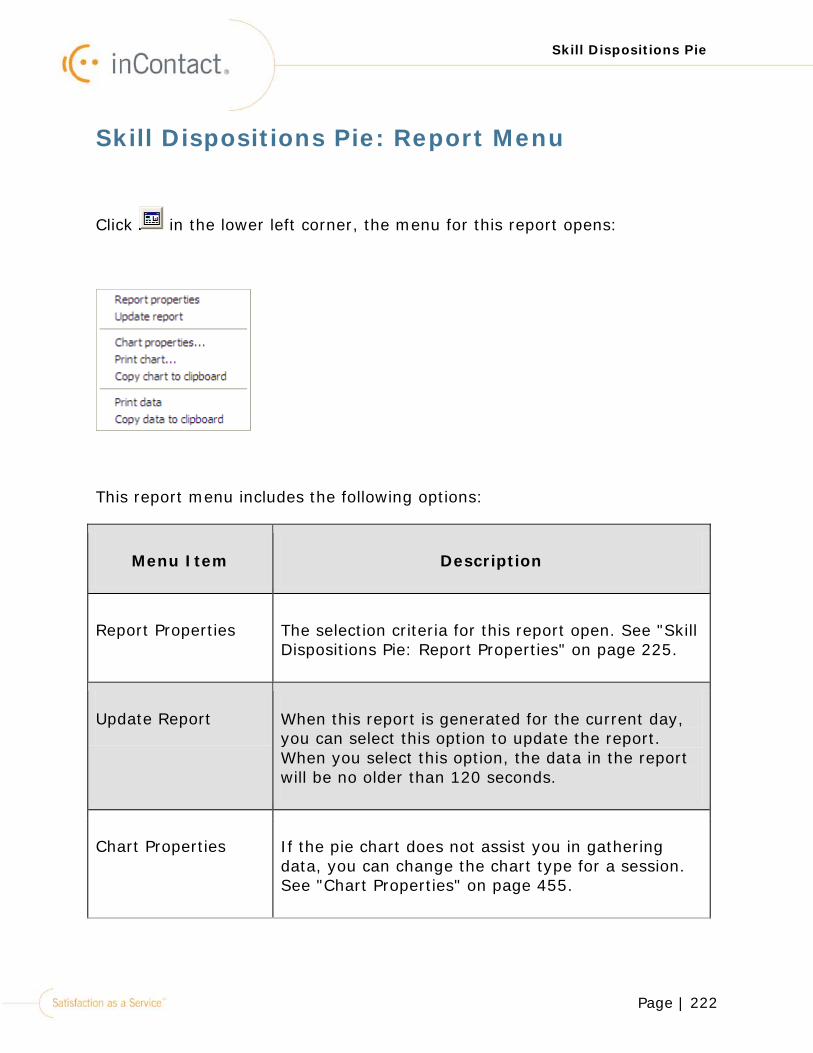
Page | 222
Skill Dispositions Pie
Skill Dispositions Pie: Report Menu
Click in the lower left corner, the menu for this report opens:
This report menu includes the following options:
Menu Item Description
Report Properties The selection criteria for this report open. See "Skill Dispositions Pie: Report Properties" on page 225.
Update Report When this report is generated for the current day, you can select this option to update the report. When you select this option, the data in the report will be no older than 120 seconds.
Chart Properties If the pie chart does not assist you in gathering data, you can change the chart type for a session. See "Chart Properties" on page 455.
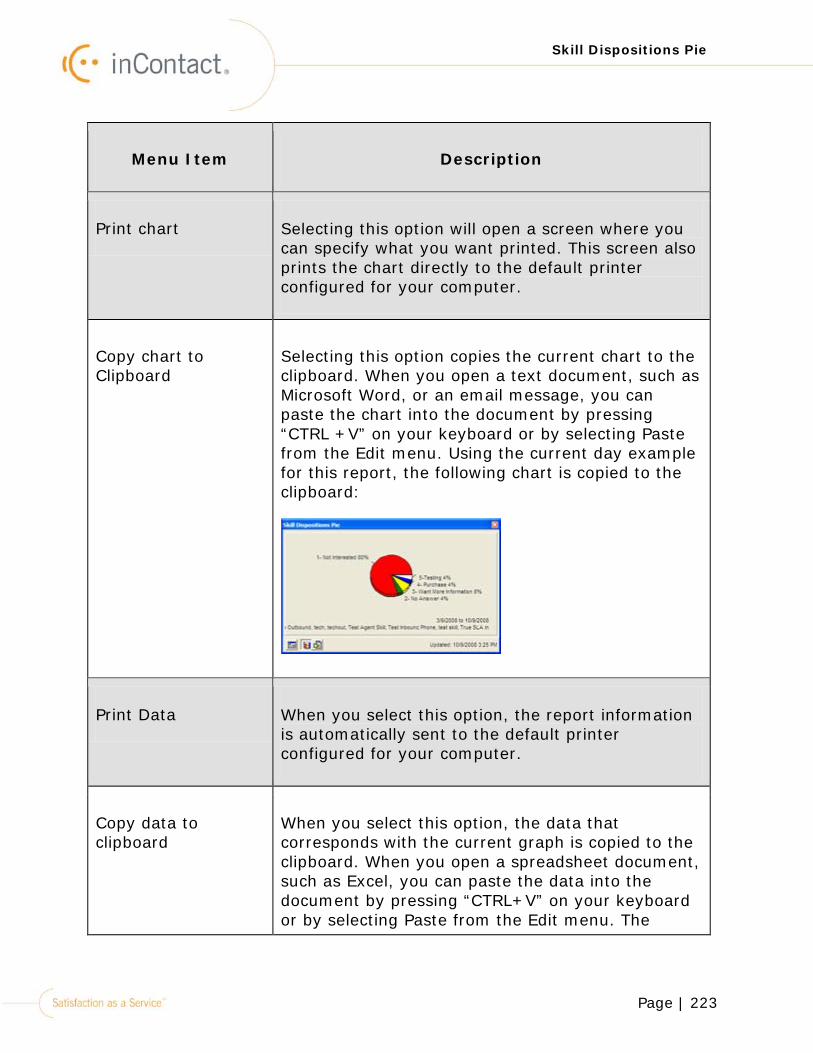
Page | 223
Skill Dispositions Pie
Menu Item Description
Print chart Selecting this option will open a screen where you can specify what you want printed. This screen also prints the chart directly to the default printer configured for your computer.
Copy chart to Clipboard
Selecting this option copies the current chart to the clipboard. When you open a text document, such as Microsoft Word, or an email message, you can paste the chart into the document by pressing “CTRL +V” on your keyboard or by selecting Paste from the Edit menu. Using the current day example for this report, the following chart is copied to the clipboard:
Print Data When you select this option, the report information is automatically sent to the default printer configured for your computer.
Copy data to clipboard
When you select this option, the data that corresponds with the current graph is copied to the clipboard. When you open a spreadsheet document, such as Excel, you can paste the data into the document by pressing “CTRL+V” on your keyboard or by selecting Paste from the Edit menu. The
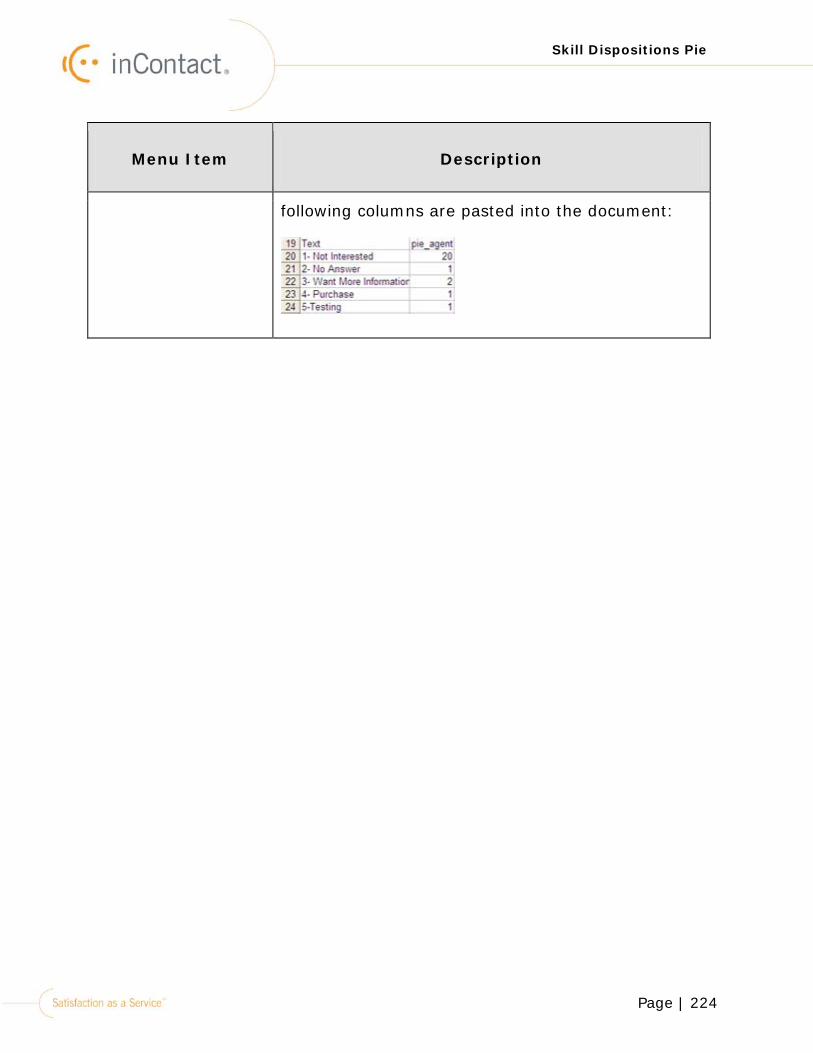
Page | 224
Skill Dispositions Pie
Menu Item Description
following columns are pasted into the document:
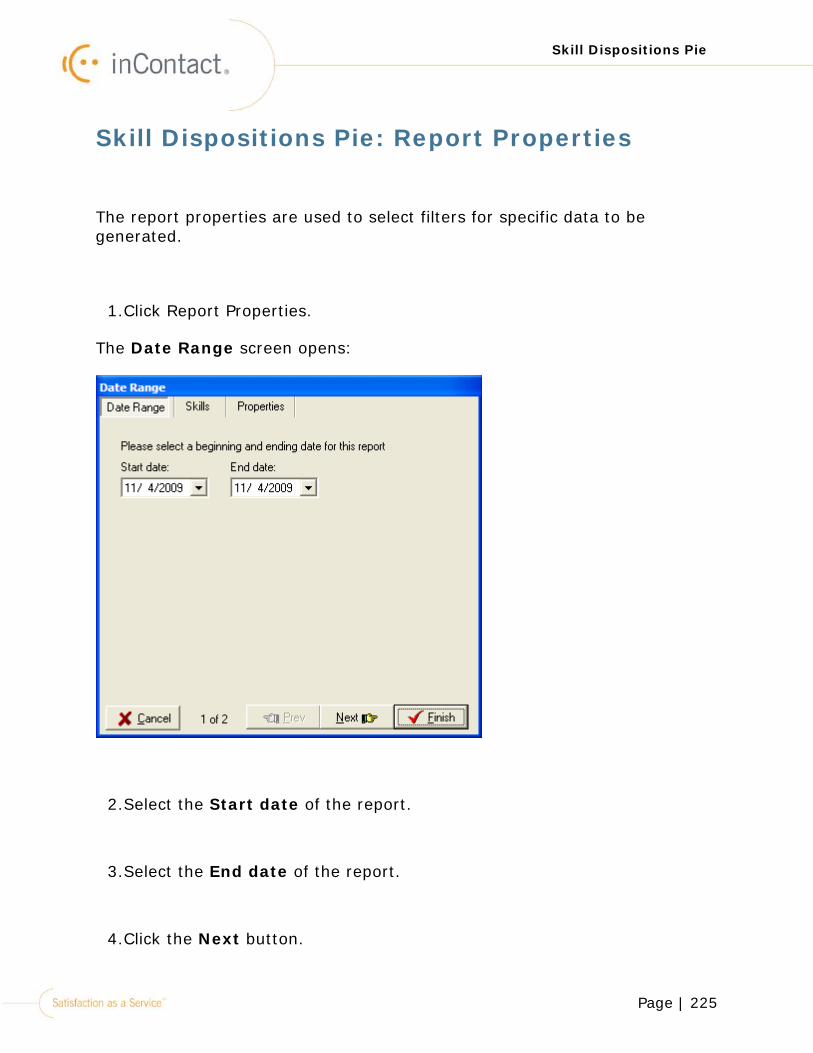
Page | 225
Skill Dispositions Pie
Skill Dispositions Pie: Report Properties
The report properties are used to select filters for specific data to be generated.
1.Click Report Properties.
The Date Range screen opens:
2.Select the Start date of the report.
3.Select the End date of the report.
4.Click the Next button.
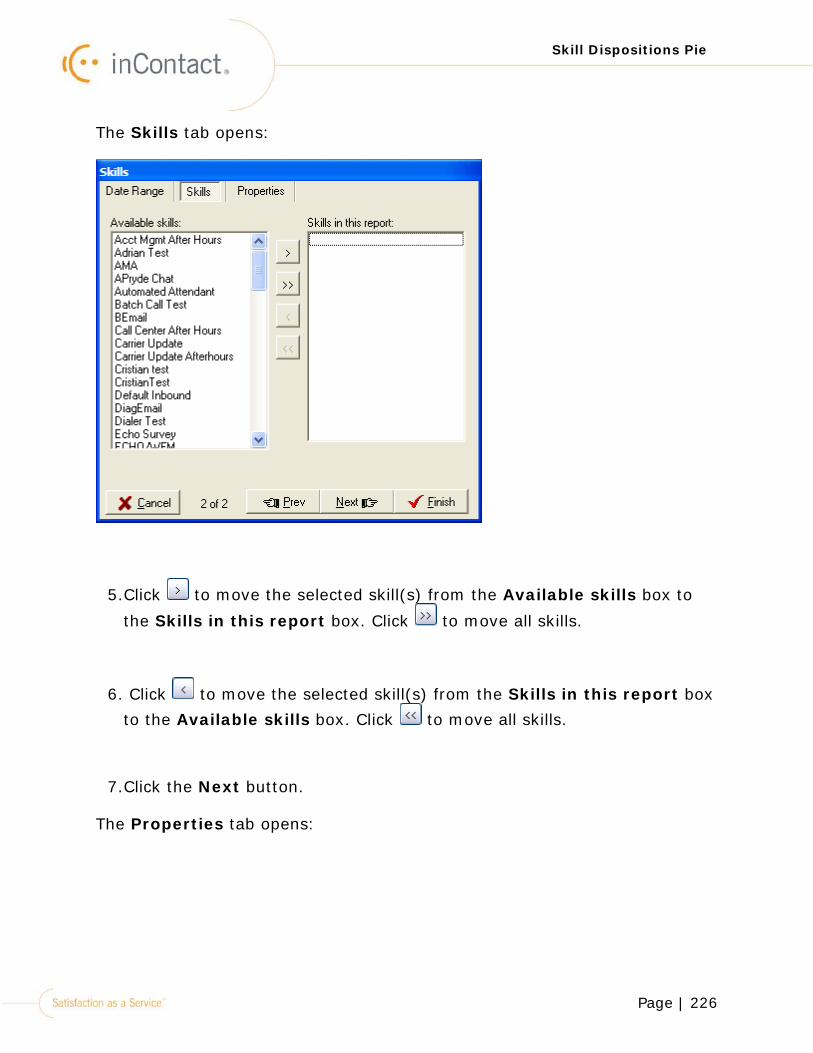
Page | 226
Skill Dispositions Pie
The Skills tab opens:
5.Click to move the selected skill(s) from the Available skills box to
the Skills in this report box. Click to move all skills.
6. Click to move the selected skill(s) from the Skills in this report box to the Available skills box. Click to move all skills.
7.Click the Next button.
The Properties tab opens:
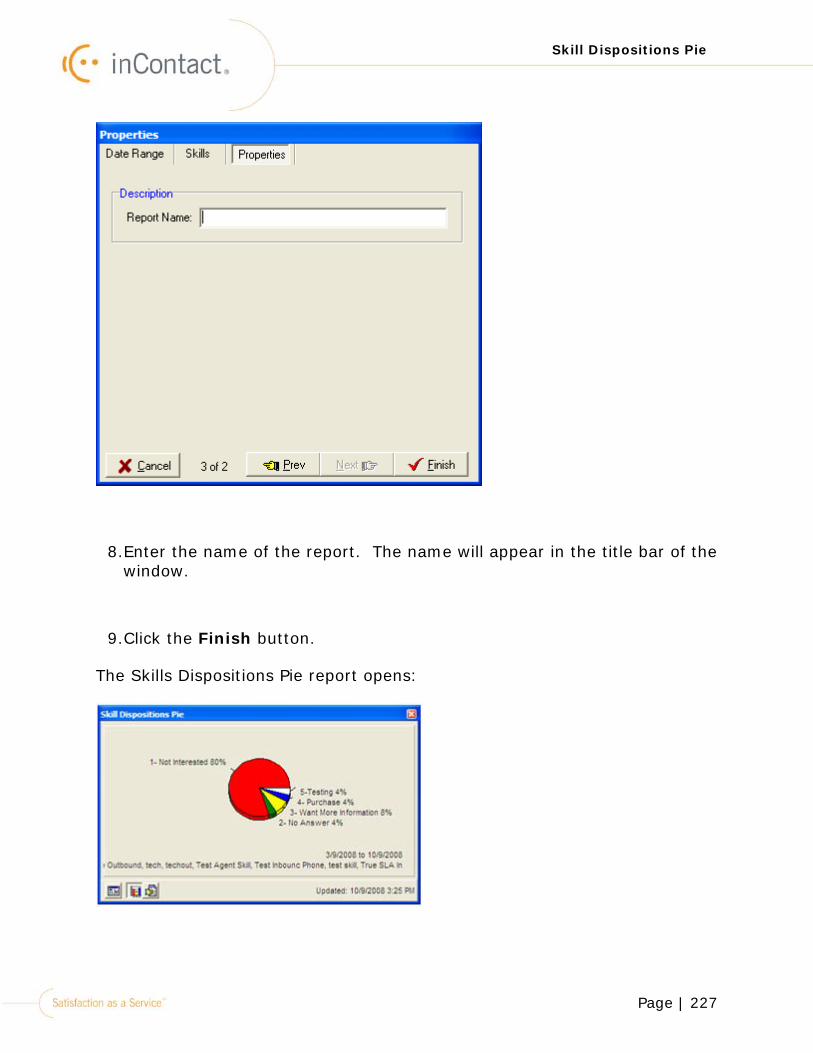
Page | 227
Skill Dispositions Pie
8.Enter the name of the report. The name will appear in the title bar of the window.
9.Click the Finish button.
The Skills Dispositions Pie report opens:
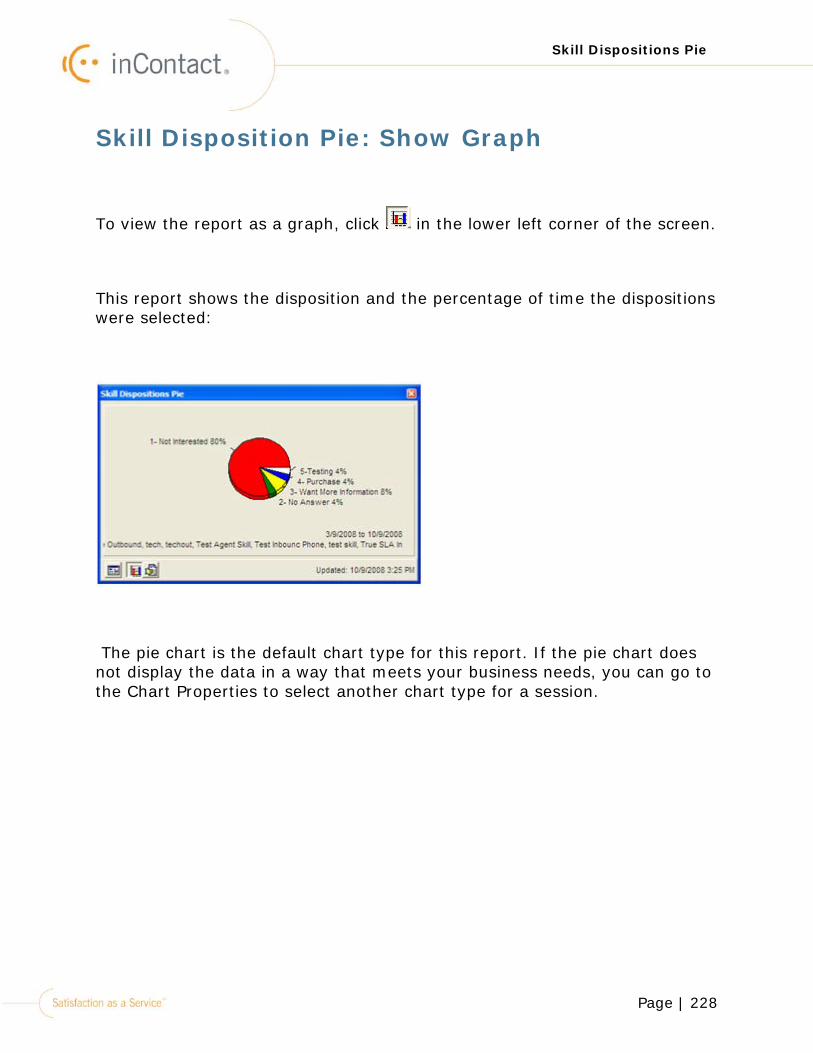
Page | 228
Skill Dispositions Pie
Skill Disposition Pie: Show Graph
To view the report as a graph, click in the lower left corner of the screen.
This report shows the disposition and the percentage of time the dispositions were selected:
The pie chart is the default chart type for this report. If the pie chart does not display the data in a way that meets your business needs, you can go to the Chart Properties to select another chart type for a session.
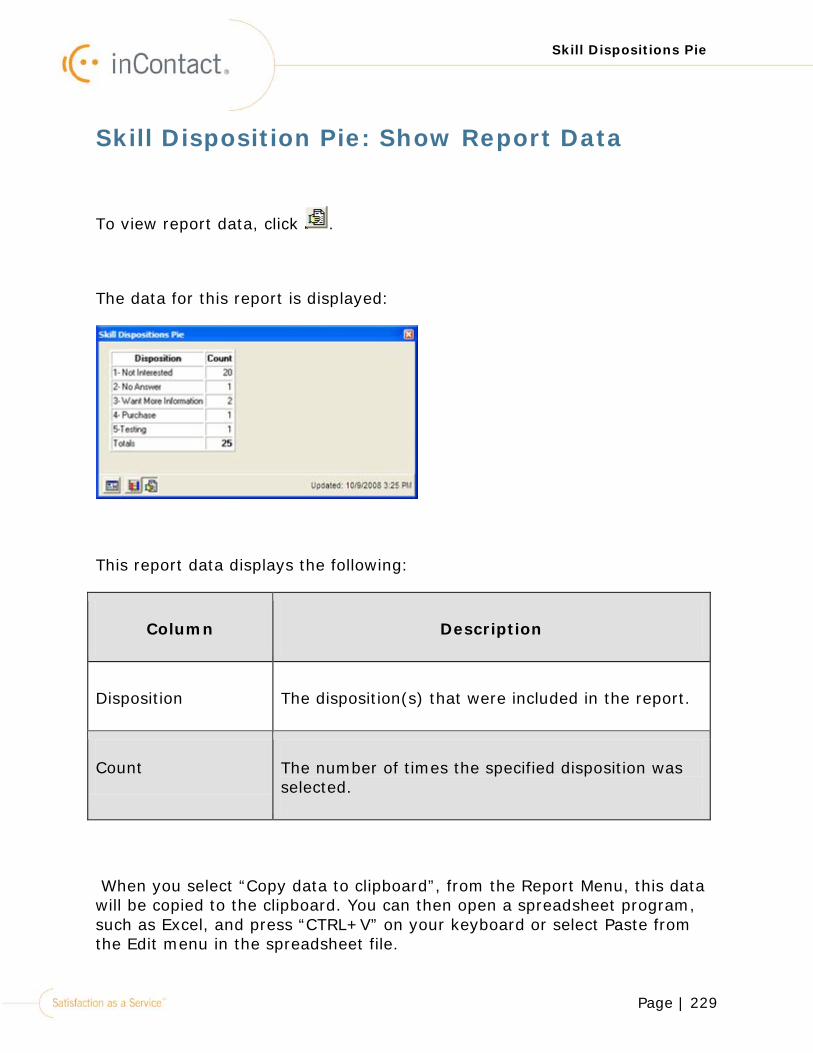
Page | 229
Skill Dispositions Pie
Skill Disposition Pie: Show Report Data
To view report data, click .
The data for this report is displayed:
This report data displays the following:
Column Description
Disposition The disposition(s) that were included in the report.
Count The number of times the specified disposition was selected.
When you select “Copy data to clipboard”, from the Report Menu, this data will be copied to the clipboard. You can then open a spreadsheet program, such as Excel, and press “CTRL+V” on your keyboard or select Paste from the Edit menu in the spreadsheet file.
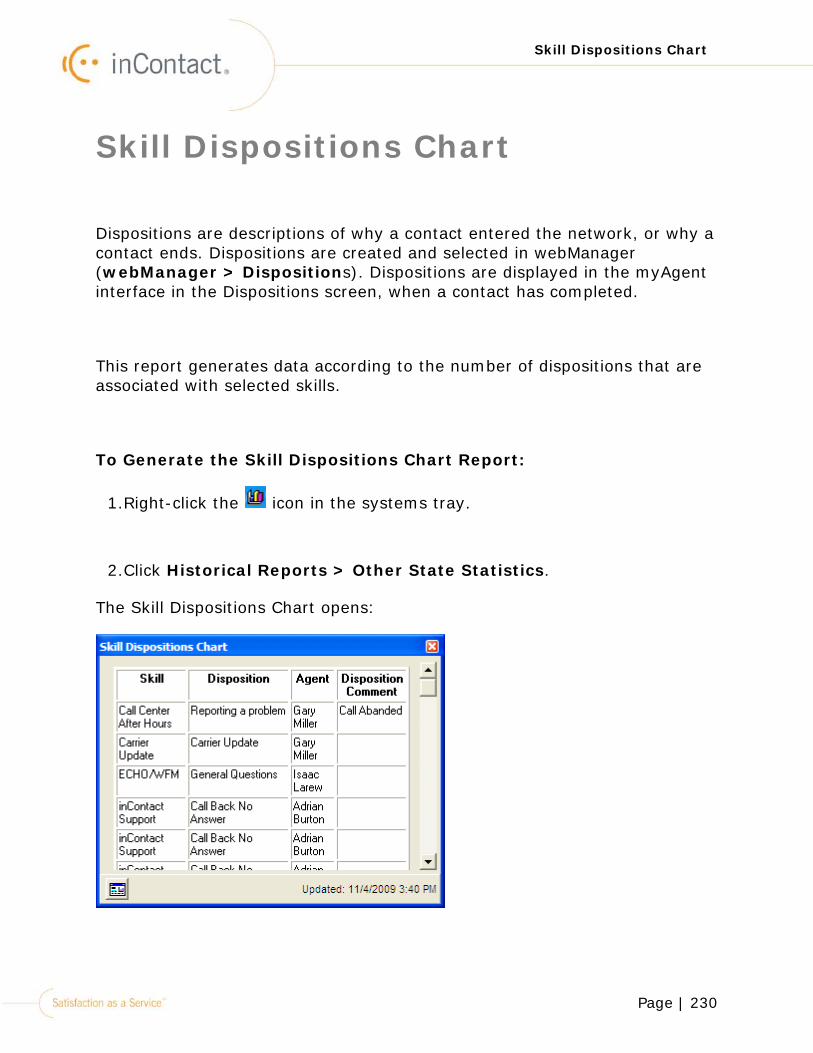
Page | 230
Skill Dispositions Chart
Skill Dispositions Chart
Dispositions are descriptions of why a contact entered the network, or why a contact ends. Dispositions are created and selected in webManager (webManager > Dispositions). Dispositions are displayed in the myAgent interface in the Dispositions screen, when a contact has completed.
This report generates data according to the number of dispositions that are associated with selected skills.
To Generate the Skill Dispositions Chart Report:
1.Right-click the icon in the systems tray.
2.Click Historical Reports > Other State Statistics.
The Skill Dispositions Chart opens:

Page | 231
Skill Dispositions Chart
Only the Report Menu button is available. See "Skill Dispositions Chart: Report Menu" on page 232.
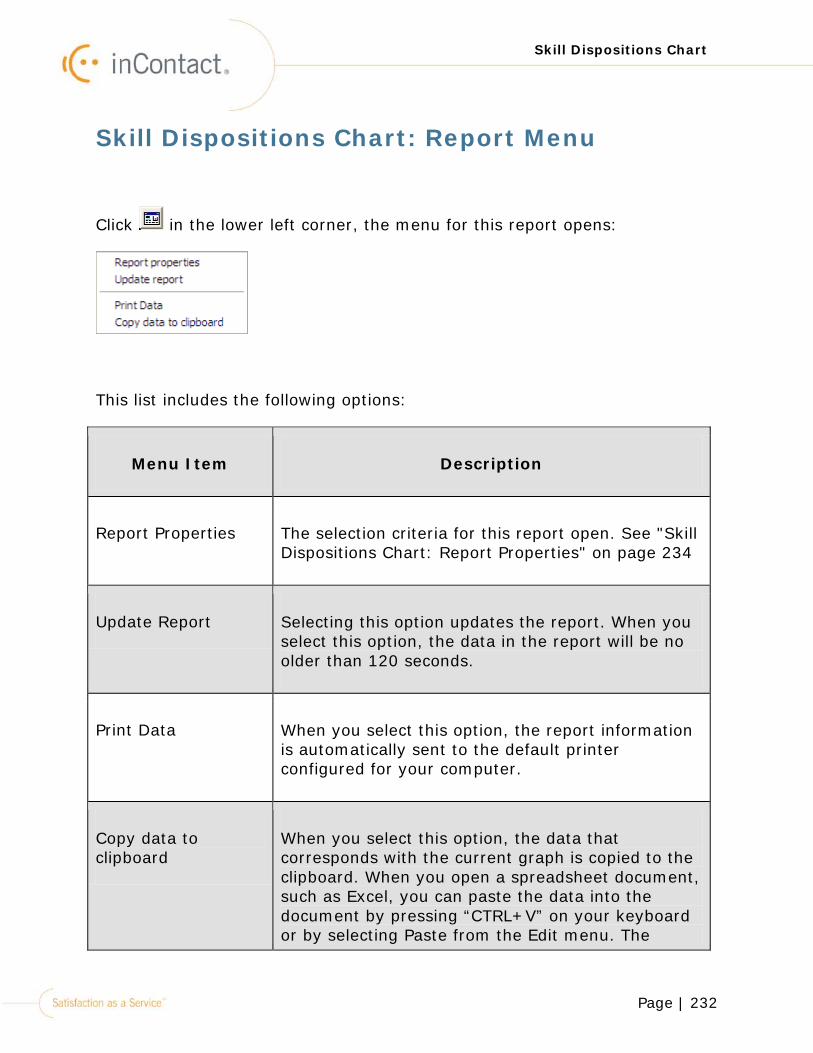
Page | 232
Skill Dispositions Chart
Skill Dispositions Chart: Report Menu
Click in the lower left corner, the menu for this report opens:
This list includes the following options:
Menu Item Description
Report Properties The selection criteria for this report open. See "Skill Dispositions Chart: Report Properties" on page 234
Update Report Selecting this option updates the report. When you select this option, the data in the report will be no older than 120 seconds.
Print Data When you select this option, the report information is automatically sent to the default printer configured for your computer.
Copy data to clipboard
When you select this option, the data that corresponds with the current graph is copied to the clipboard. When you open a spreadsheet document, such as Excel, you can paste the data into the document by pressing “CTRL+V” on your keyboard or by selecting Paste from the Edit menu. The
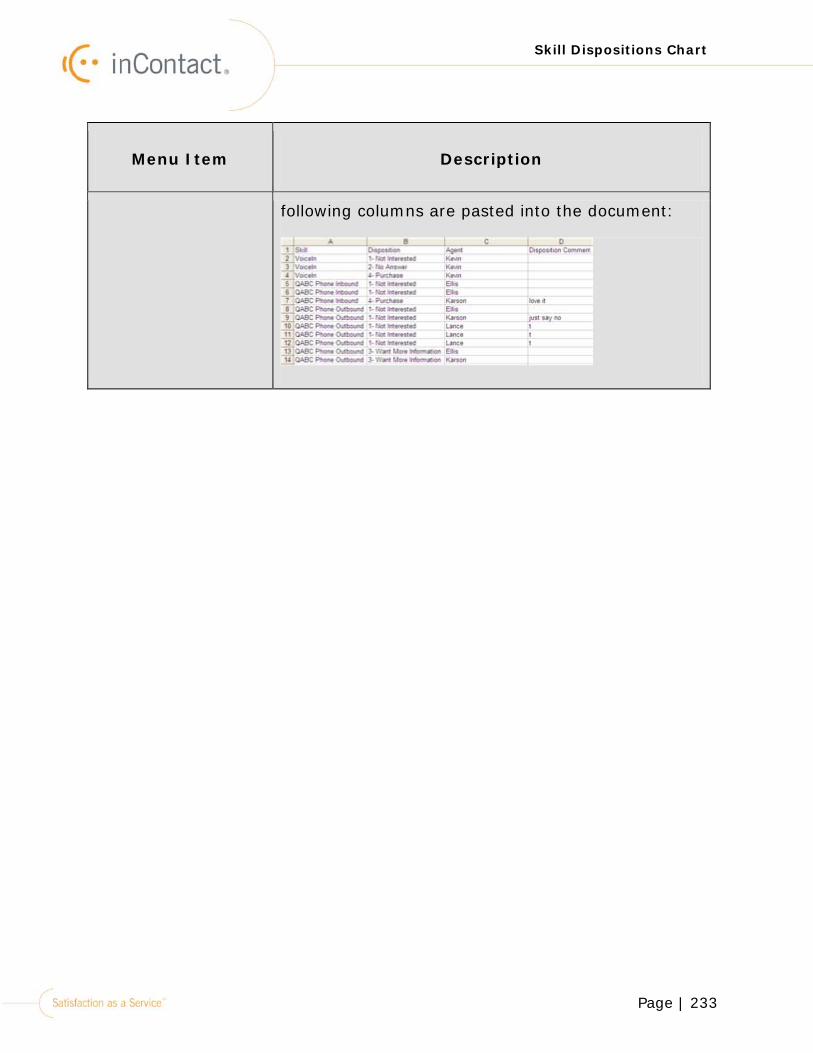
Page | 233
Skill Dispositions Chart
Menu Item Description
following columns are pasted into the document:
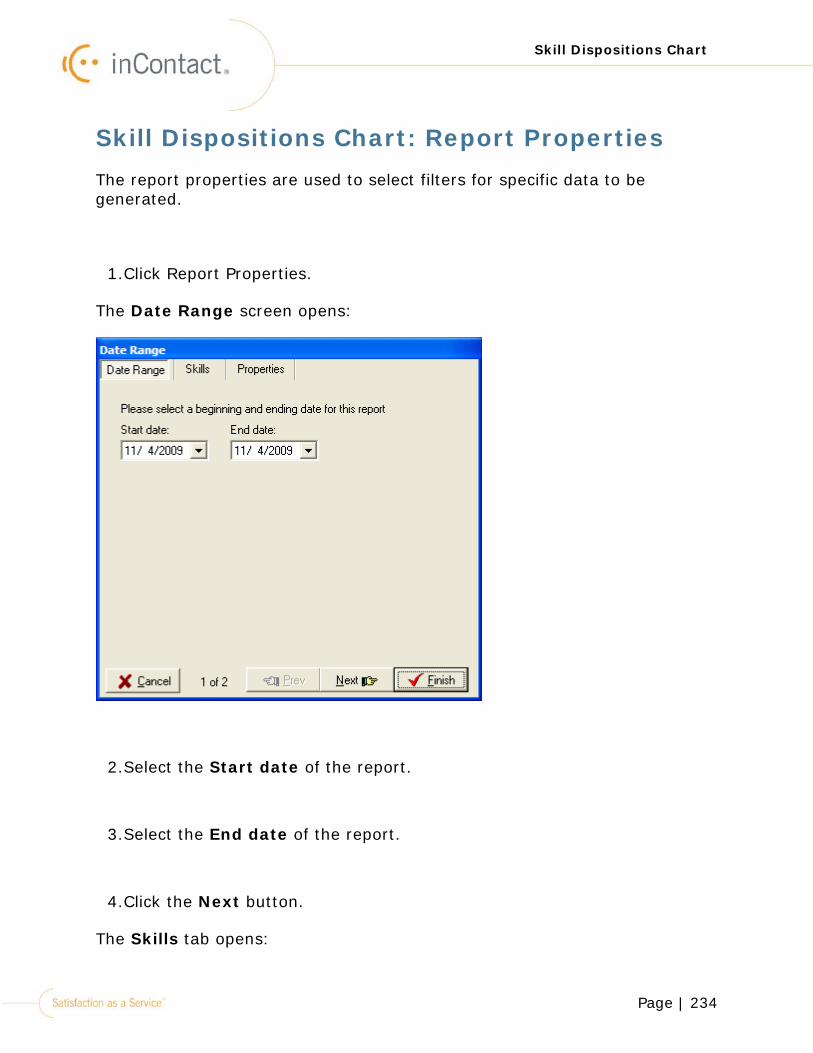
Page | 234
Skill Dispositions Chart
Skill Dispositions Chart: Report Properties The report properties are used to select filters for specific data to be generated.
1.Click Report Properties.
The Date Range screen opens:
2.Select the Start date of the report.
3.Select the End date of the report.
4.Click the Next button.
The Skills tab opens:
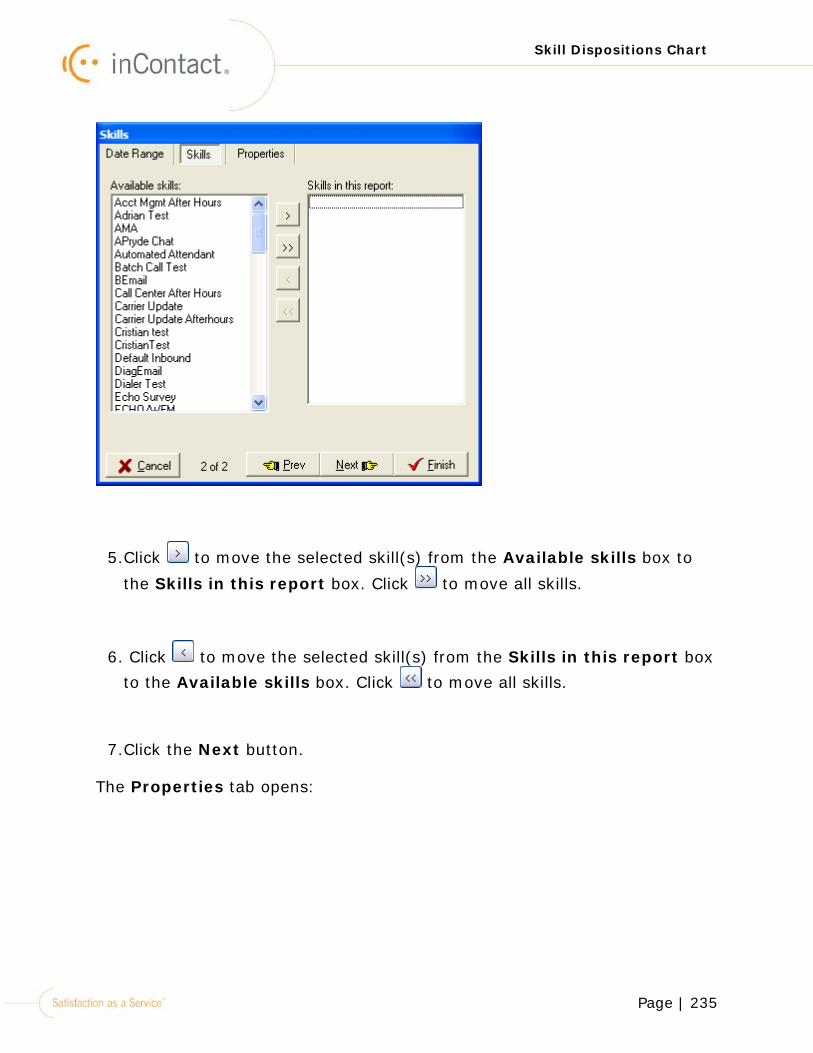
Page | 235
Skill Dispositions Chart
5.Click to move the selected skill(s) from the Available skills box to
the Skills in this report box. Click to move all skills.
6. Click to move the selected skill(s) from the Skills in this report box to the Available skills box. Click to move all skills.
7.Click the Next button.
The Properties tab opens:
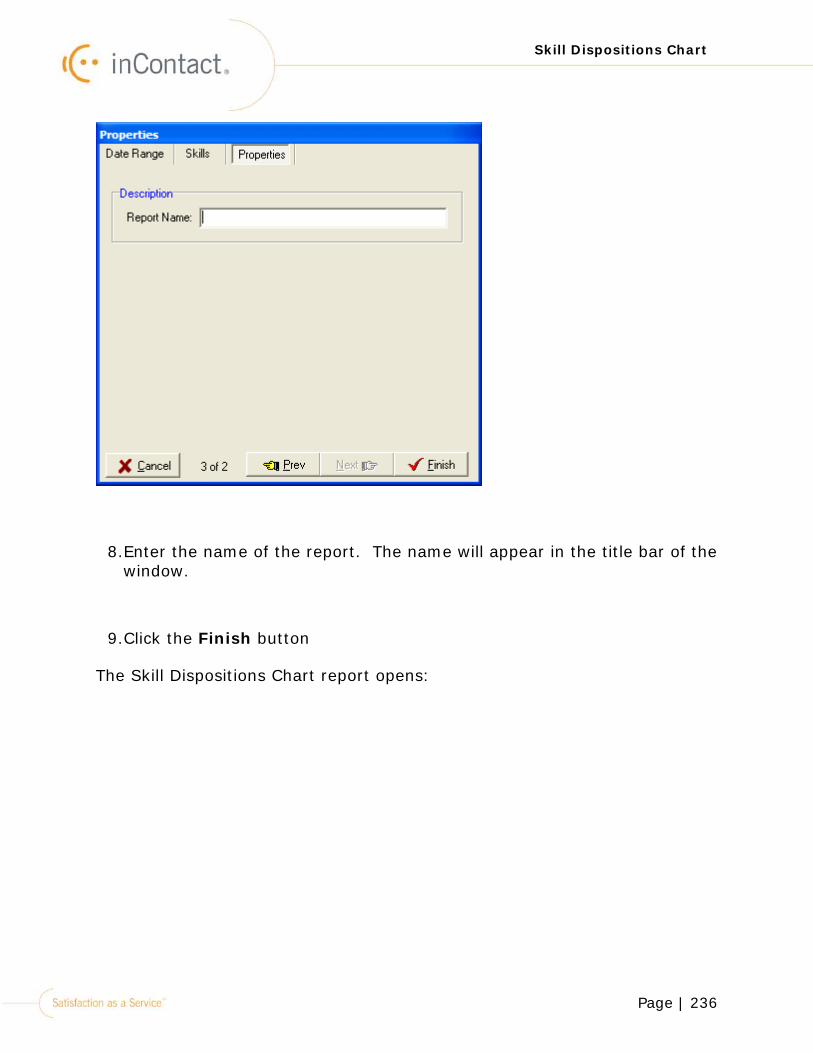
Page | 236
Skill Dispositions Chart
8.Enter the name of the report. The name will appear in the title bar of the window.
9.Click the Finish button
The Skill Dispositions Chart report opens:
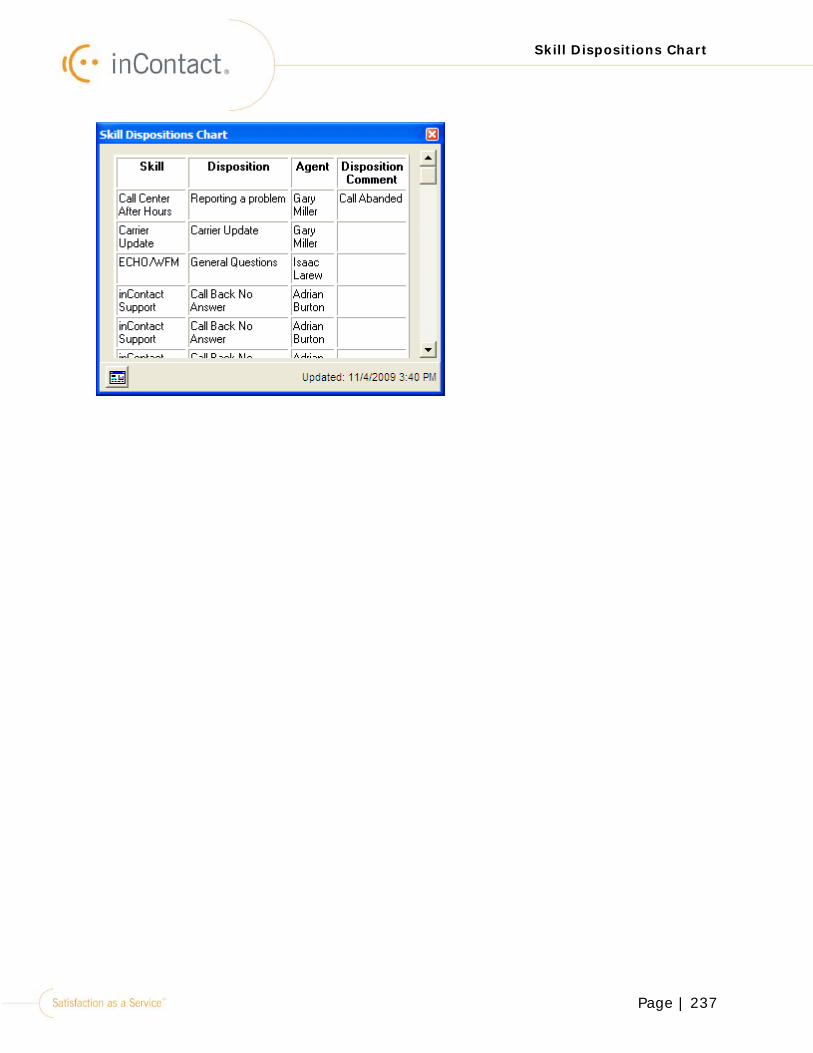
Page | 237
Skill Dispositions Chart
Page | 238
Unavailable Stats
Unavailable Stats
The data for the Unavailable Stats report are generated based on the unavailable codes that are created in webManager (webManager > Unavailable Codes). Unavailable codes are optional, customized reasons that agents can select in myAgent for going to an unavailable state.
If you configure unavailable codes for a team, an agent assigned to that team will have to select an unavailable code before they can go to an unavailable state. When an agent selects an unavailable code, inContact records the unavailable codes that agents select. This report shows the percentage of agents who selected the different unavailable codes.
To Generate the Unavailable Stats Report:
1.Right-click the icon in the systems tray.
2.Click Historical Reports > Unavailable Stats.
The Unavailable Stats report opens:
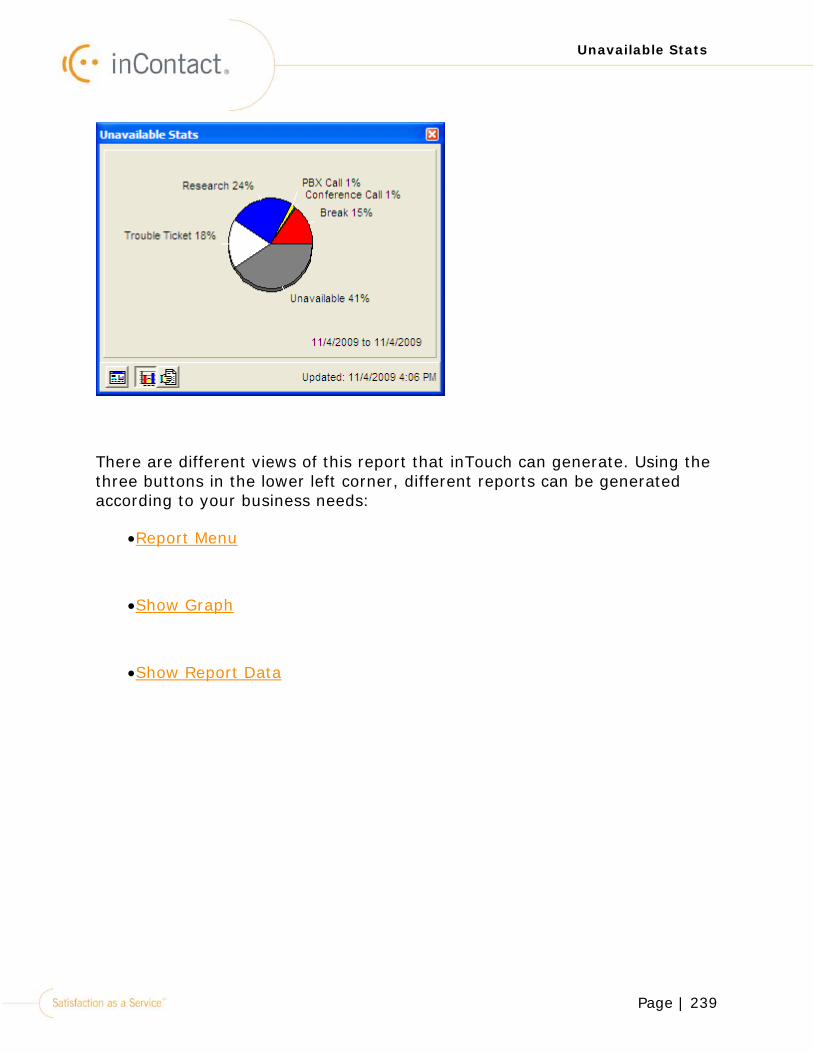
Page | 239
Unavailable Stats
There are different views of this report that inTouch can generate. Using the three buttons in the lower left corner, different reports can be generated according to your business needs:
•Report Menu
•Show Graph
•Show Report Data
Page | 240
Unavailable Stats
Unavailable Stats: Report Menu
Click in the lower left corner, the report menu opens:
The Report Menu includes the following options:
Menu Item Description
Report Properties The selection criteria for this report open. See "Unavailable Stats: Report Properties" on page 243
Update Report When this report is generated for the current day, you can select this option to update the report. When you select this option, the data in the report will be no older than 120 seconds.
Chart Properties If the pie chart does not assist you in gathering data, you can change the chart type for a session. See "Chart Properties" on page 455.
Page | 241
Unavailable Stats
Menu Item Description
Print chart Selecting this option opens a screen where you can specify what you want printed. This screen also prints the chart directly to the default printer configured for your computer.
Copy chart to Clipboard
Selecting this option copies the current chart to the clipboard. When you open a text document, such as Microsoft Word, or an email message, you can paste the chart into the document by pressing “CTRL +V” on your keyboard or by selecting Paste from the Edit menu. Using the current day example for this report, the following chart is copied to the clipboard:
Print Data When you select this option, the report information is automatically sent to the default printer configured for your computer.
Copy data to clipboard
When you select this option, the data that corresponds with the current graph is copied to the clipboard. When you open a spreadsheet document, such as Excel, you can paste the data into the document by pressing “CTRL+V” on your keyboard
Page | 242
Unavailable Stats
Menu Item Description
or by selecting Paste from the Edit menu. The following columns are pasted into the document:
Page | 243
Unavailable Stats
Unavailable Stats: Report Properties
The report properties are used to select filters for specific data to be generated.
1.Click Report Properties.
The Date Range screen opens:
2.Select the Start date of the report.
3.Select the End date of the report.
4.Click the Next button.
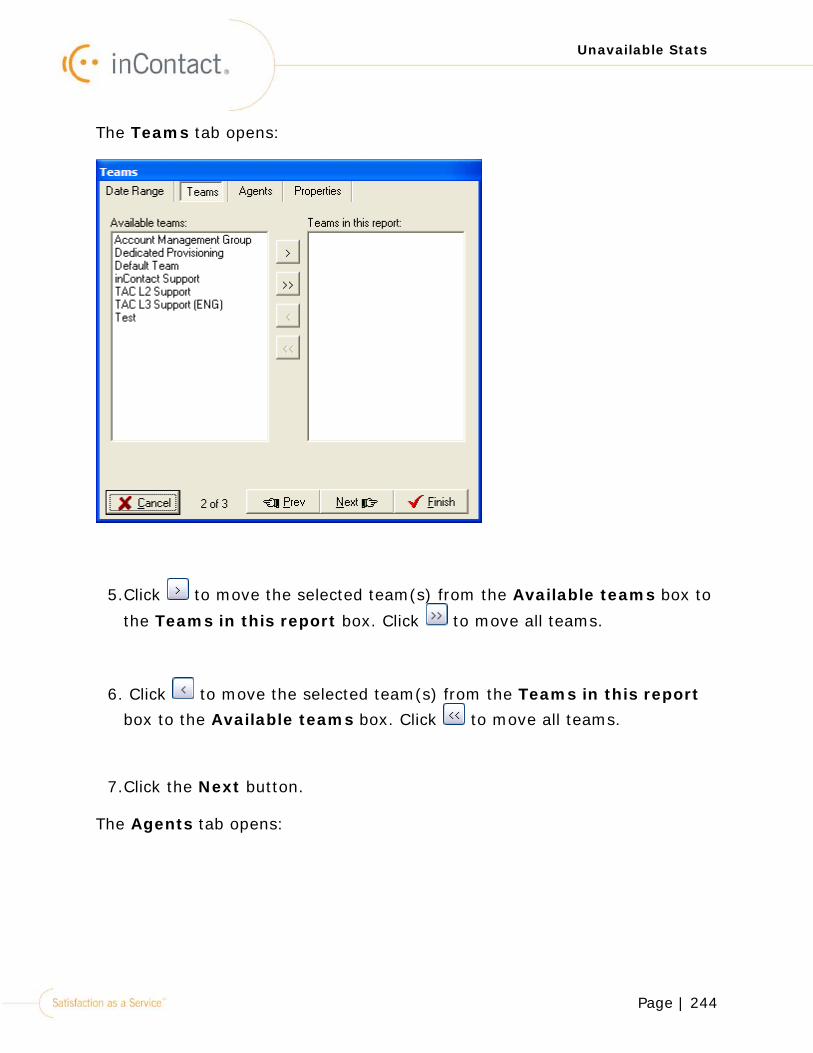
Page | 244
Unavailable Stats
The Teams tab opens:
5.Click to move the selected team(s) from the Available teams box to
the Teams in this report box. Click to move all teams.
6. Click to move the selected team(s) from the Teams in this report box to the Available teams box. Click to move all teams.
7.Click the Next button.
The Agents tab opens:
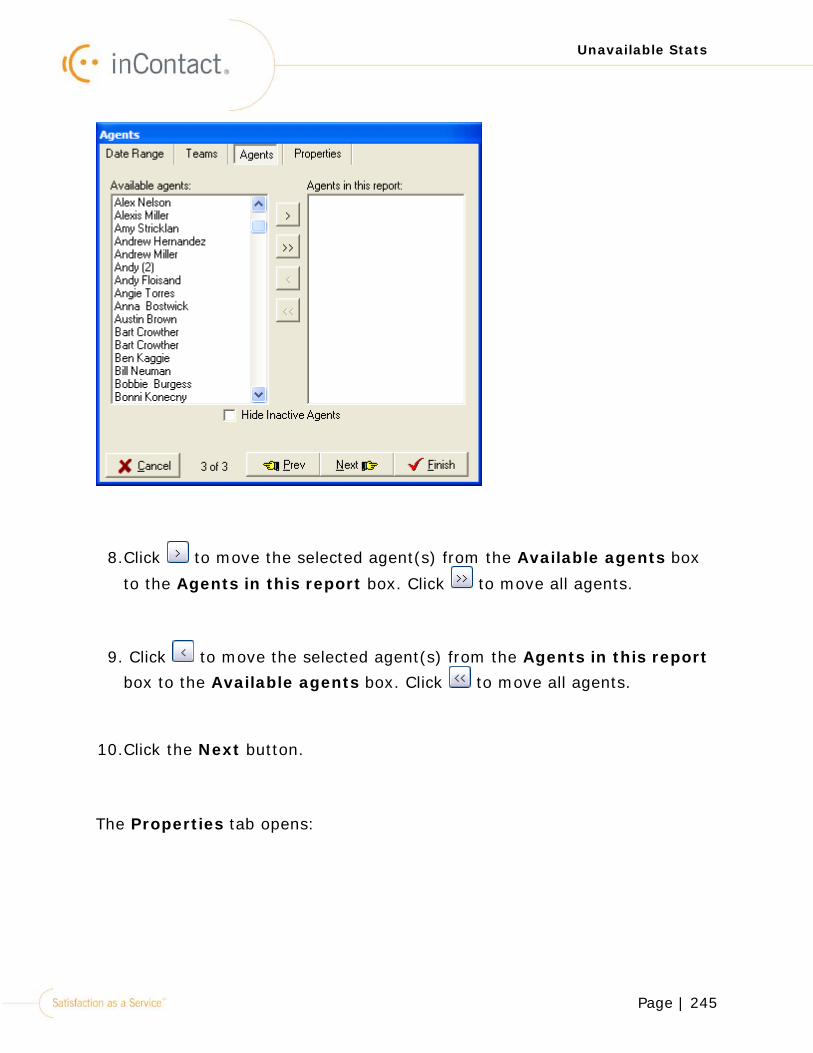
Page | 245
Unavailable Stats
8.Click to move the selected agent(s) from the Available agents box
to the Agents in this report box. Click to move all agents.
9. Click to move the selected agent(s) from the Agents in this report box to the Available agents box. Click to move all agents.
10.Click the Next button.
The Properties tab opens:
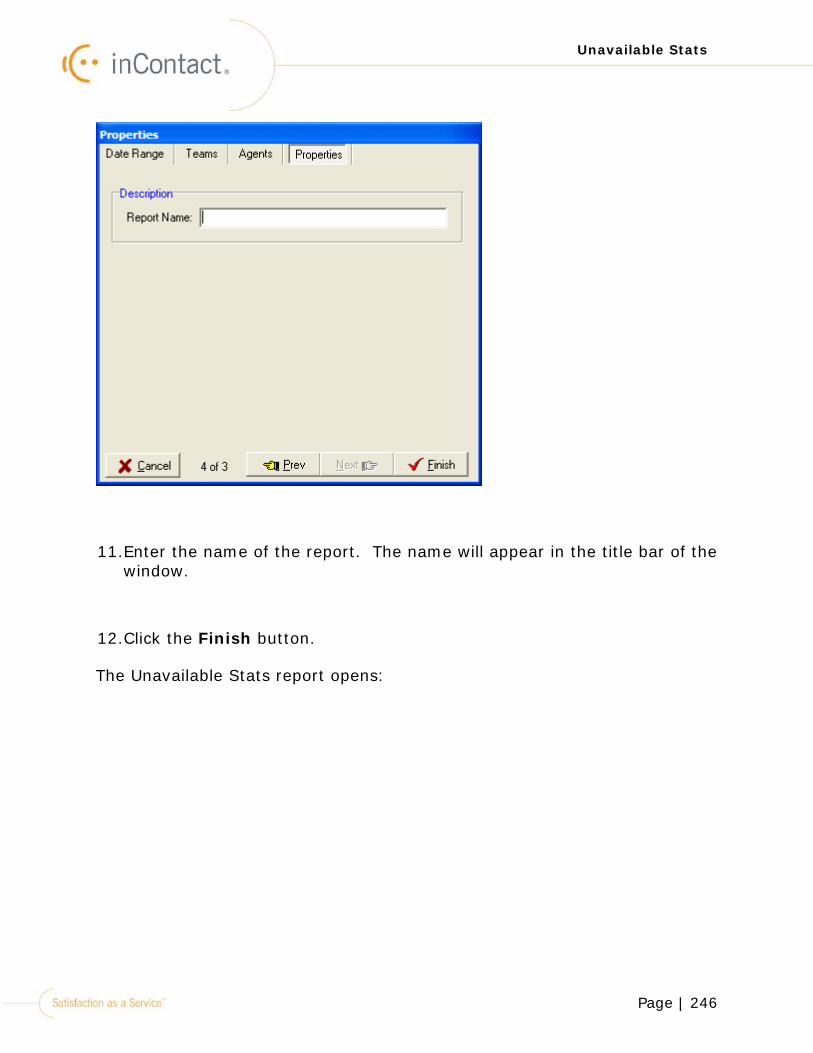
Page | 246
Unavailable Stats
11.Enter the name of the report. The name will appear in the title bar of the window.
12.Click the Finish button.
The Unavailable Stats report opens:
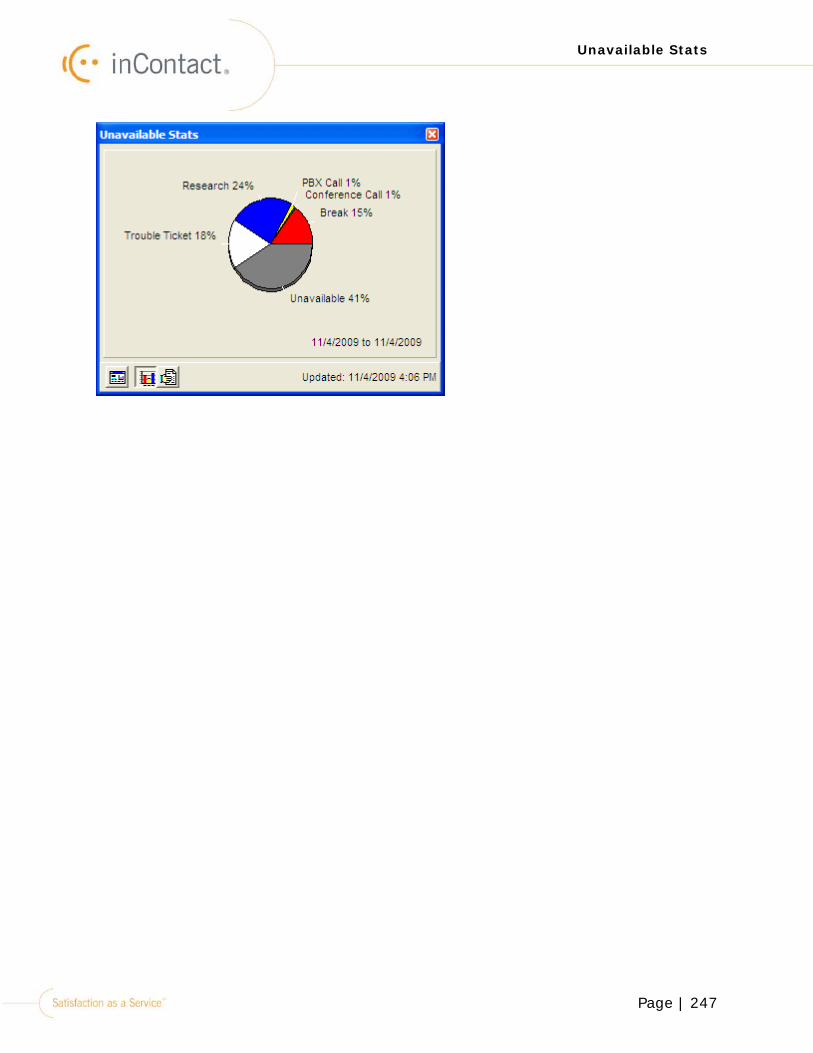
Page | 247
Unavailable Stats
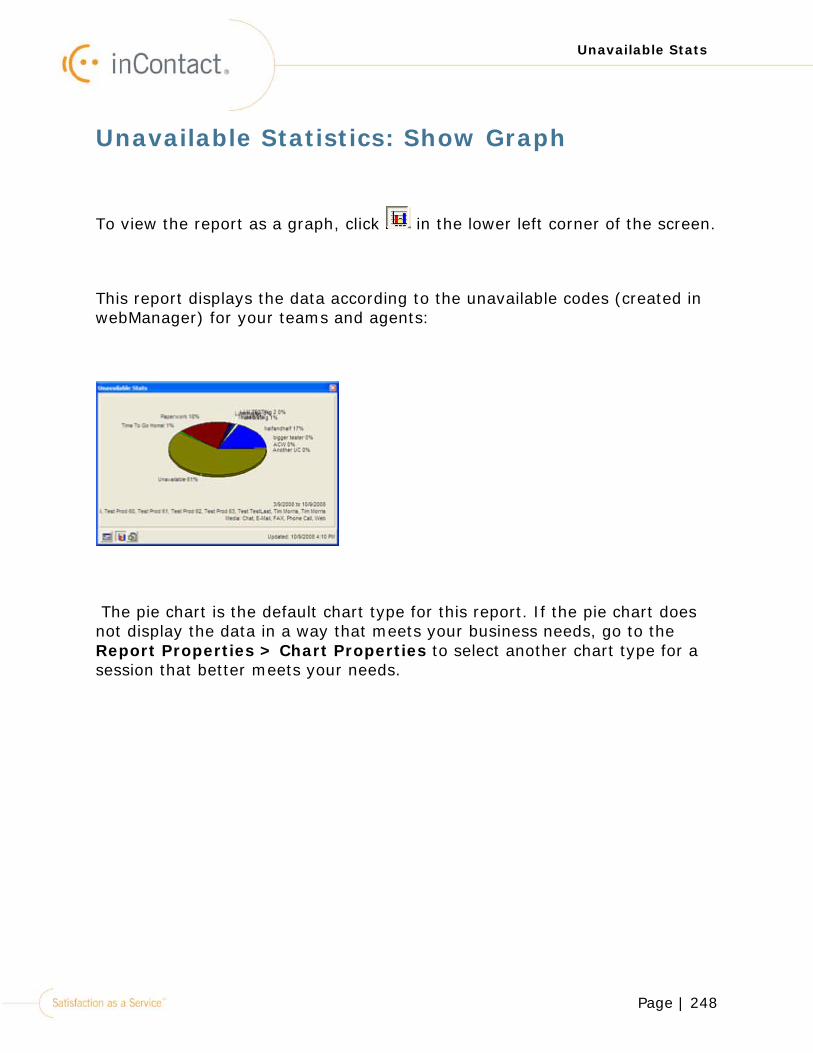
Page | 248
Unavailable Stats
Unavailable Statistics: Show Graph
To view the report as a graph, click in the lower left corner of the screen.
This report displays the data according to the unavailable codes (created in webManager) for your teams and agents:
The pie chart is the default chart type for this report. If the pie chart does not display the data in a way that meets your business needs, go to the Report Properties > Chart Properties to select another chart type for a session that better meets your needs.
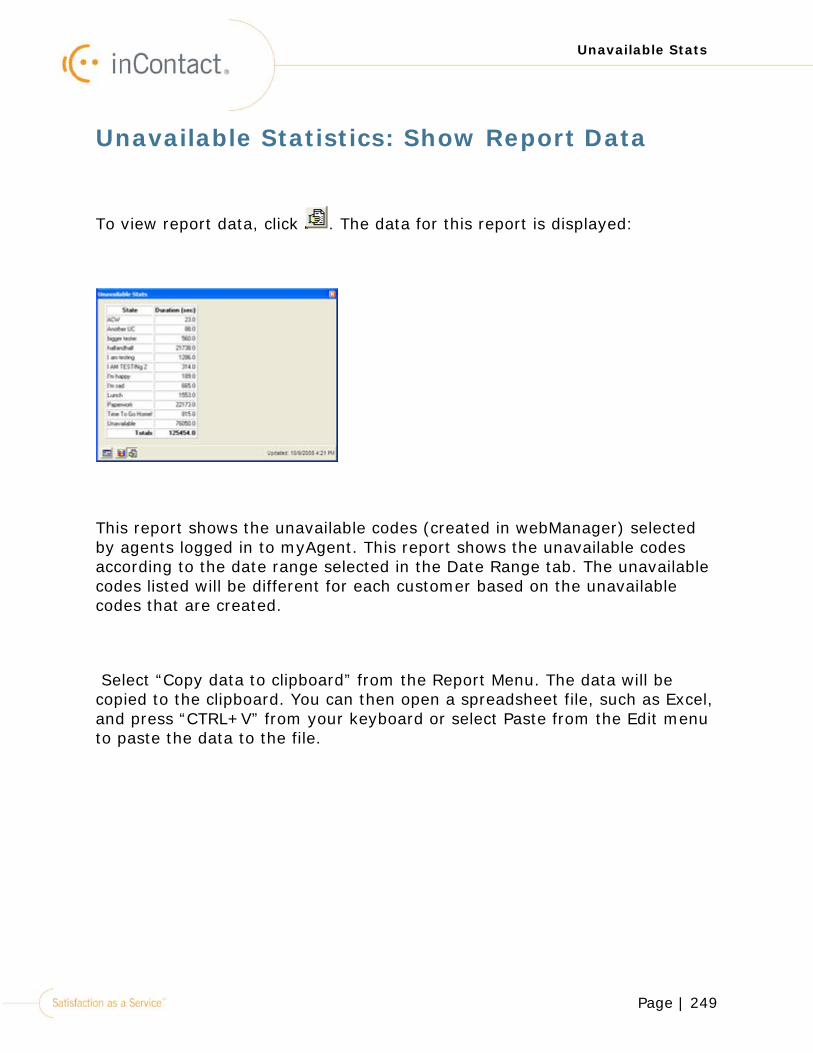
Page | 249
Unavailable Stats
Unavailable Statistics: Show Report Data
To view report data, click . The data for this report is displayed:
This report shows the unavailable codes (created in webManager) selected by agents logged in to myAgent. This report shows the unavailable codes according to the date range selected in the Date Range tab. The unavailable codes listed will be different for each customer based on the unavailable codes that are created.
Select “Copy data to clipboard” from the Report Menu. The data will be copied to the clipboard. You can then open a spreadsheet file, such as Excel, and press “CTRL+V” from your keyboard or select Paste from the Edit menu to paste the data to the file.
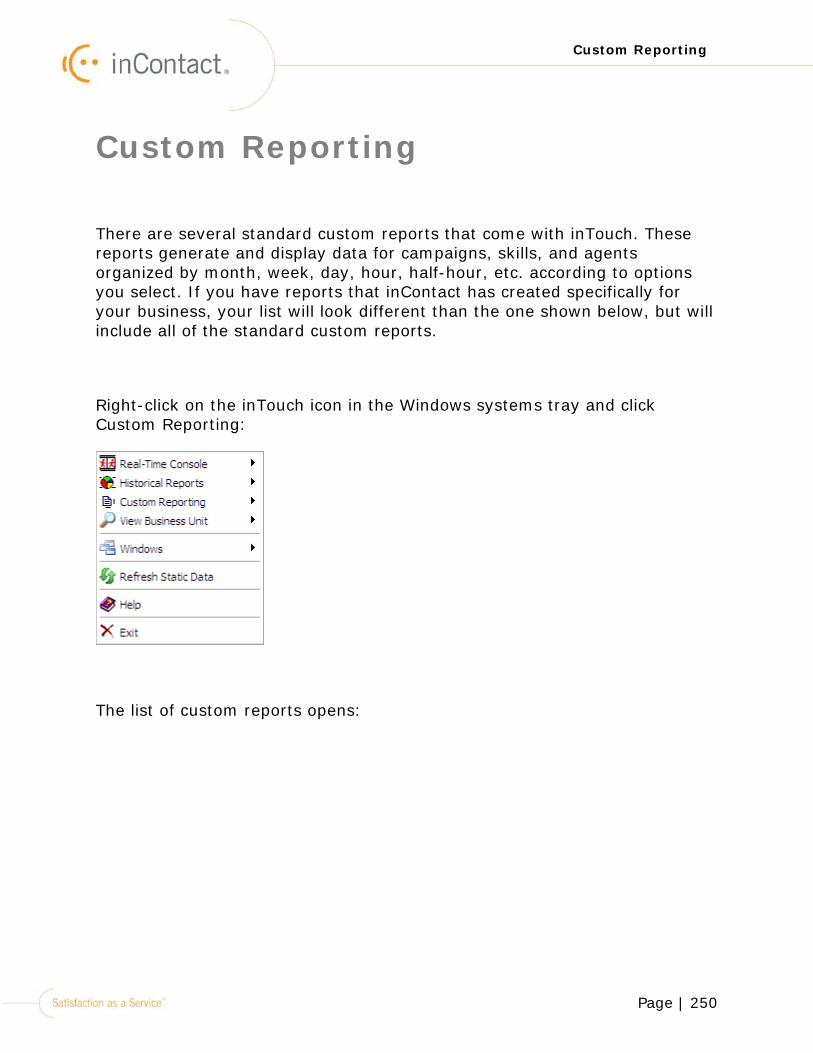
Page | 250
Custom Reporting
Custom Reporting
There are several standard custom reports that come with inTouch. These reports generate and display data for campaigns, skills, and agents organized by month, week, day, hour, half-hour, etc. according to options you select. If you have reports that inContact has created specifically for your business, your list will look different than the one shown below, but will include all of the standard custom reports.
Right-click on the inTouch icon in the Windows systems tray and click Custom Reporting:
The list of custom reports opens:
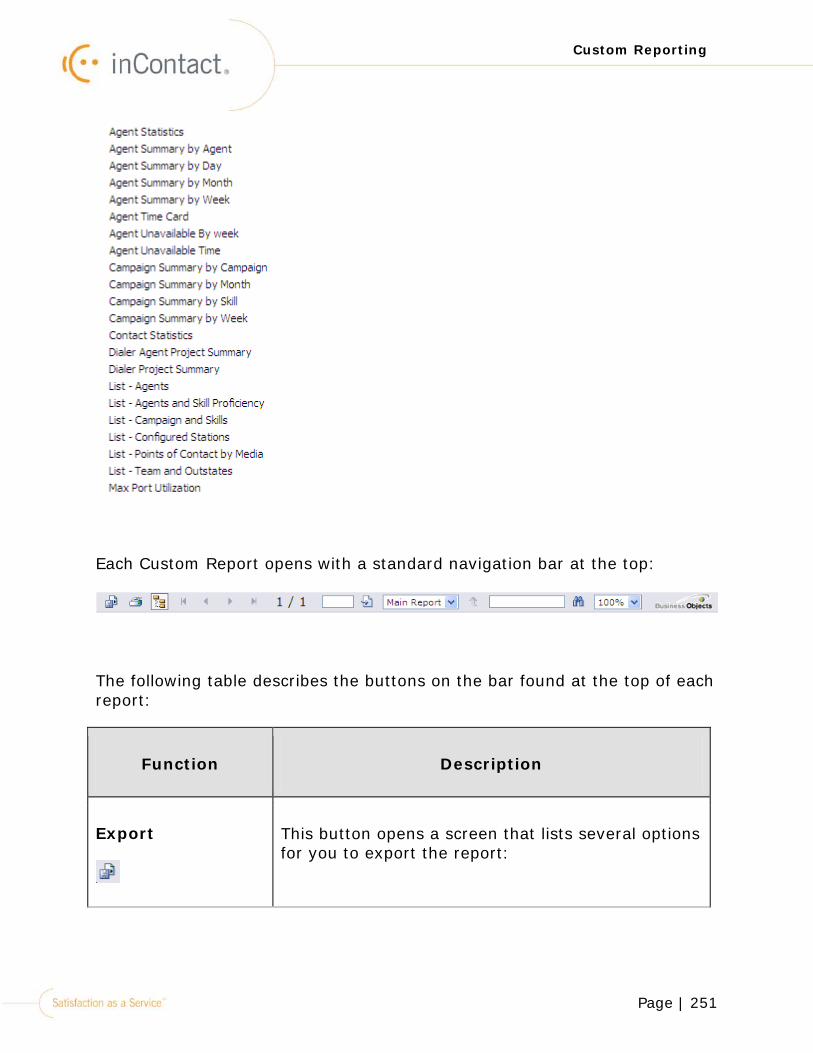
Page | 251
Custom Reporting
Each Custom Report opens with a standard navigation bar at the top:
The following table describes the buttons on the bar found at the top of each report:
Function Description
Export
This button opens a screen that lists several options for you to export the report:
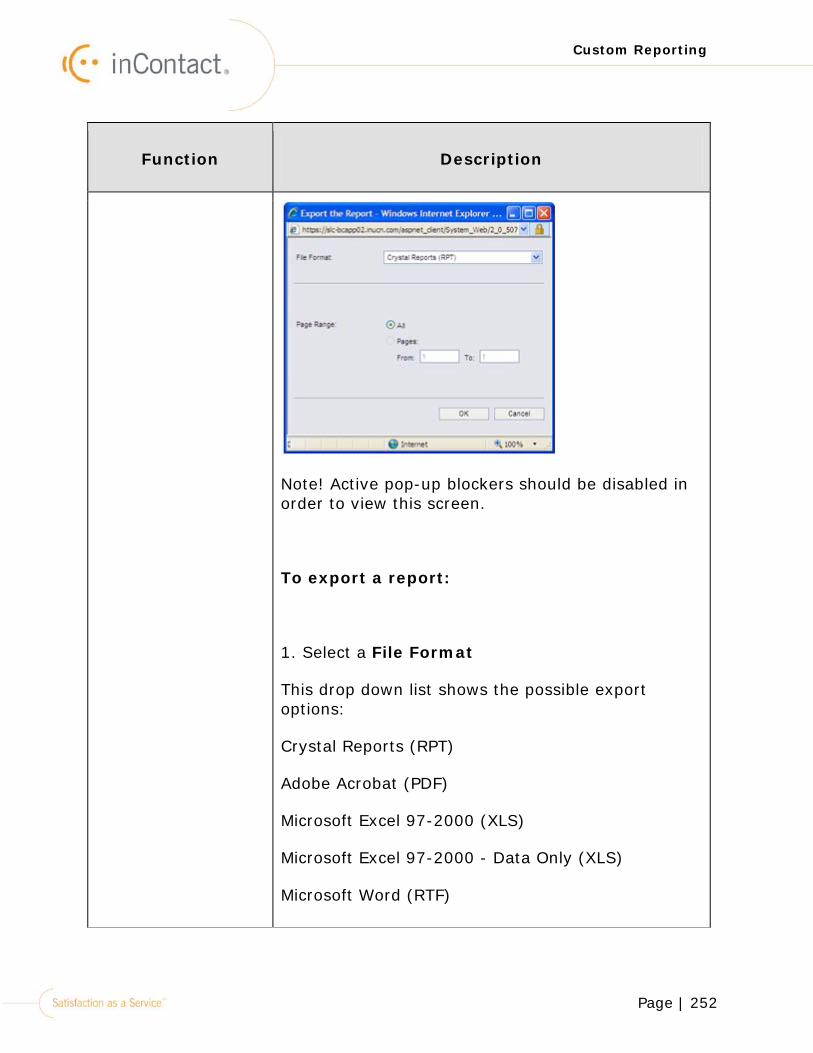
Page | 252
Custom Reporting
Function Description
Note! Active pop-up blockers should be disabled in order to view this screen.
To export a report:
1. Select a File Format
This drop down list shows the possible export options:
Crystal Reports (RPT)
Adobe Acrobat (PDF)
Microsoft Excel 97-2000 (XLS)
Microsoft Excel 97-2000 - Data Only (XLS)
Microsoft Word (RTF)
Page | 253
Custom Reporting
Function Description
Microsoft Word - Editable (RTF)
Rich Text Format (RTF)
2. Select a Page Range
This field provides an “All” selection or a “From” and “To” selection. Select the option that works best for the data you want to export.
3. Click OK once you have selected the File Format and the Page Range.
This button sends the report to a printer.
Show/Hide Group Tree
This button opens or closes the tree view of the links in the report. This button provides links on the left side of the page. The links in the tree view are generated according to what was selected for the report filter.
For example, if you selected all of the agents in the Agents tab, all of the agents will be listed when the tree view is selected. When you select a link in the tree view, the corresponding text in the report will be highlighted in orange to make it easy to find:
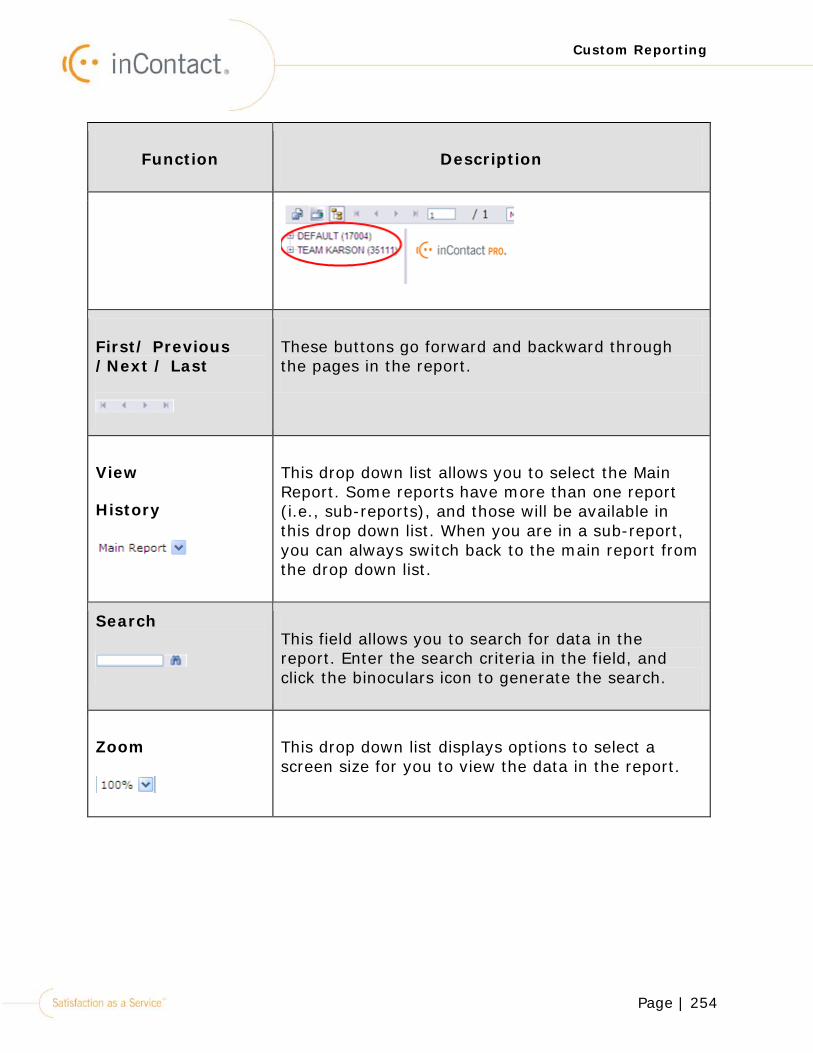
Page | 254
Custom Reporting
Function Description
First/ Previous /Next / Last
These buttons go forward and backward through the pages in the report.
View
History
This drop down list allows you to select the Main Report. Some reports have more than one report (i.e., sub-reports), and those will be available in this drop down list. When you are in a sub-report, you can always switch back to the main report from the drop down list.
Search
This field allows you to search for data in the report. Enter the search criteria in the field, and click the binoculars icon to generate the search.
Zoom
This drop down list displays options to select a screen size for you to view the data in the report.
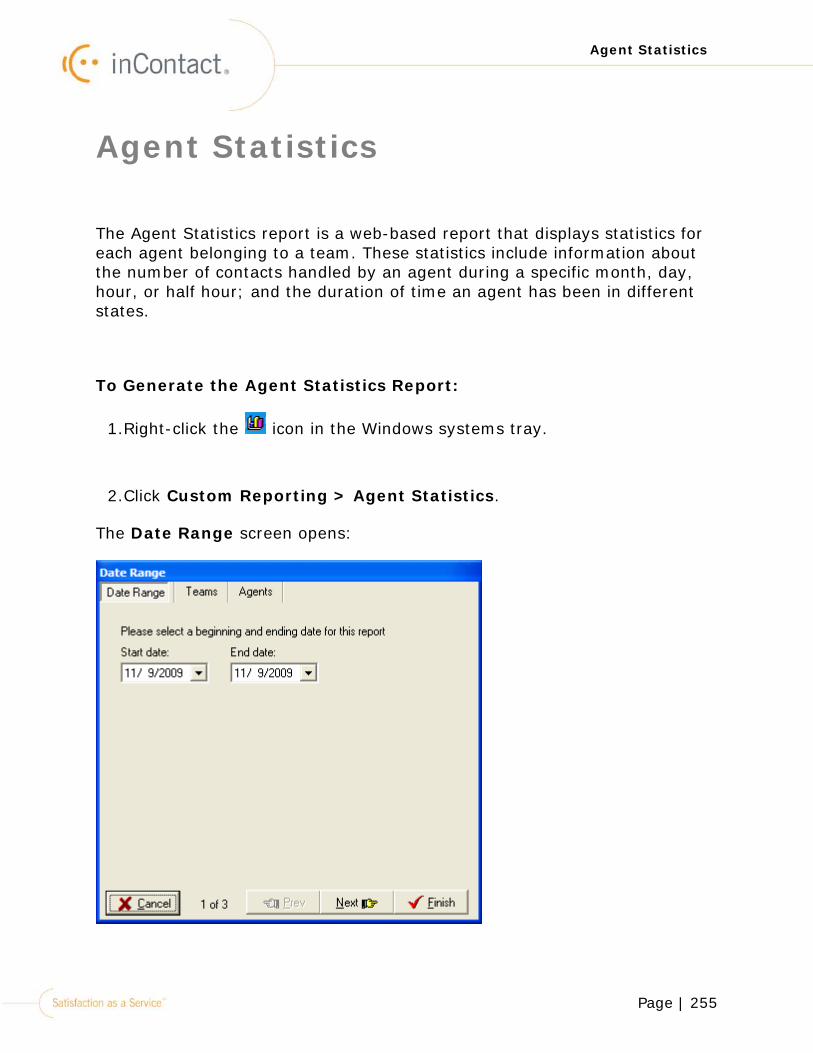
Page | 255
Agent Statistics
Agent Statistics
The Agent Statistics report is a web-based report that displays statistics for each agent belonging to a team. These statistics include information about the number of contacts handled by an agent during a specific month, day, hour, or half hour; and the duration of time an agent has been in different states.
To Generate the Agent Statistics Report:
1.Right-click the icon in the Windows systems tray.
2.Click Custom Reporting > Agent Statistics.
The Date Range screen opens:
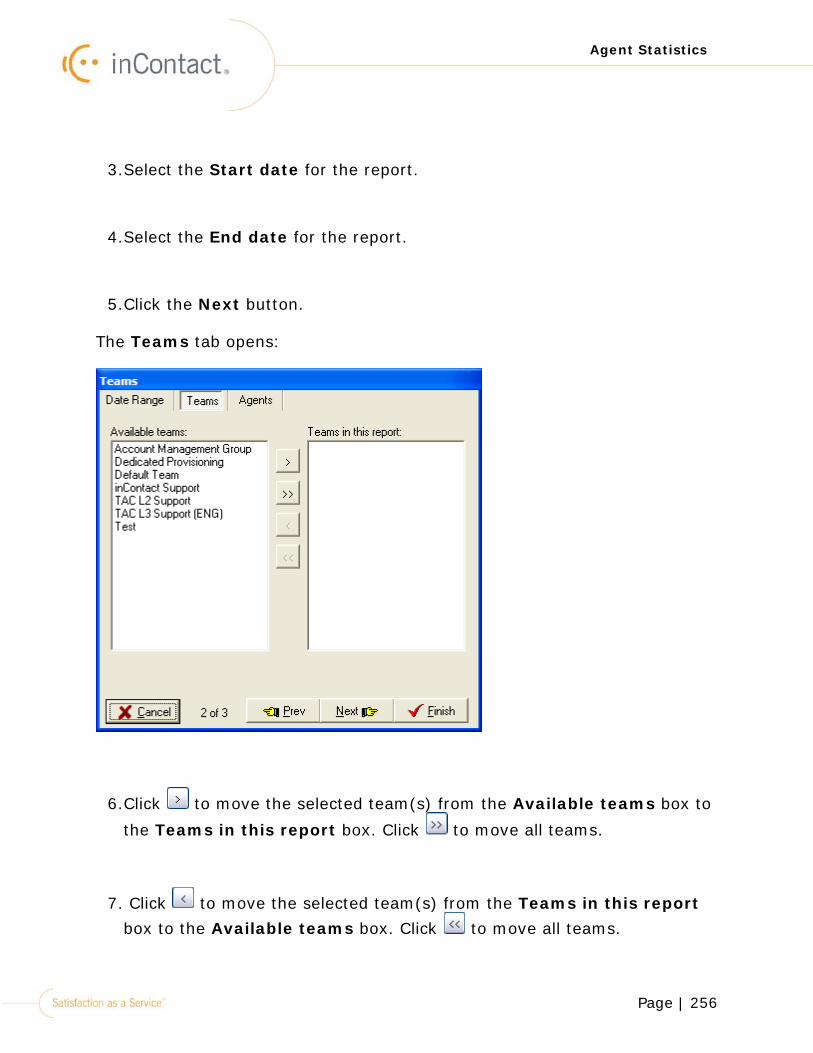
Page | 256
Agent Statistics
3.Select the Start date for the report.
4.Select the End date for the report.
5.Click the Next button.
The Teams tab opens:
6.Click to move the selected team(s) from the Available teams box to
the Teams in this report box. Click to move all teams.
7. Click to move the selected team(s) from the Teams in this report box to the Available teams box. Click to move all teams.
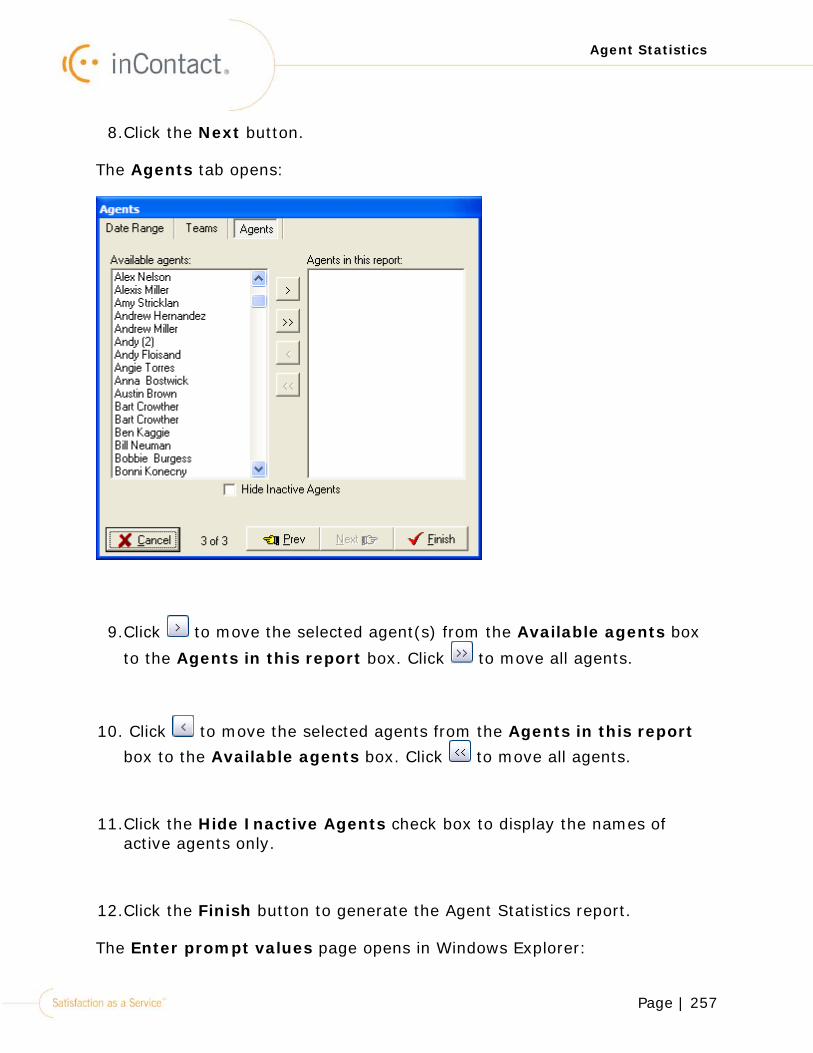
Page | 257
Agent Statistics
8.Click the Next button.
The Agents tab opens:
9.Click to move the selected agent(s) from the Available agents box
to the Agents in this report box. Click to move all agents.
10. Click to move the selected agents from the Agents in this report box to the Available agents box. Click to move all agents.
11.Click the Hide Inactive Agents check box to display the names of active agents only.
12.Click the Finish button to generate the Agent Statistics report.
The Enter prompt values page opens in Windows Explorer:
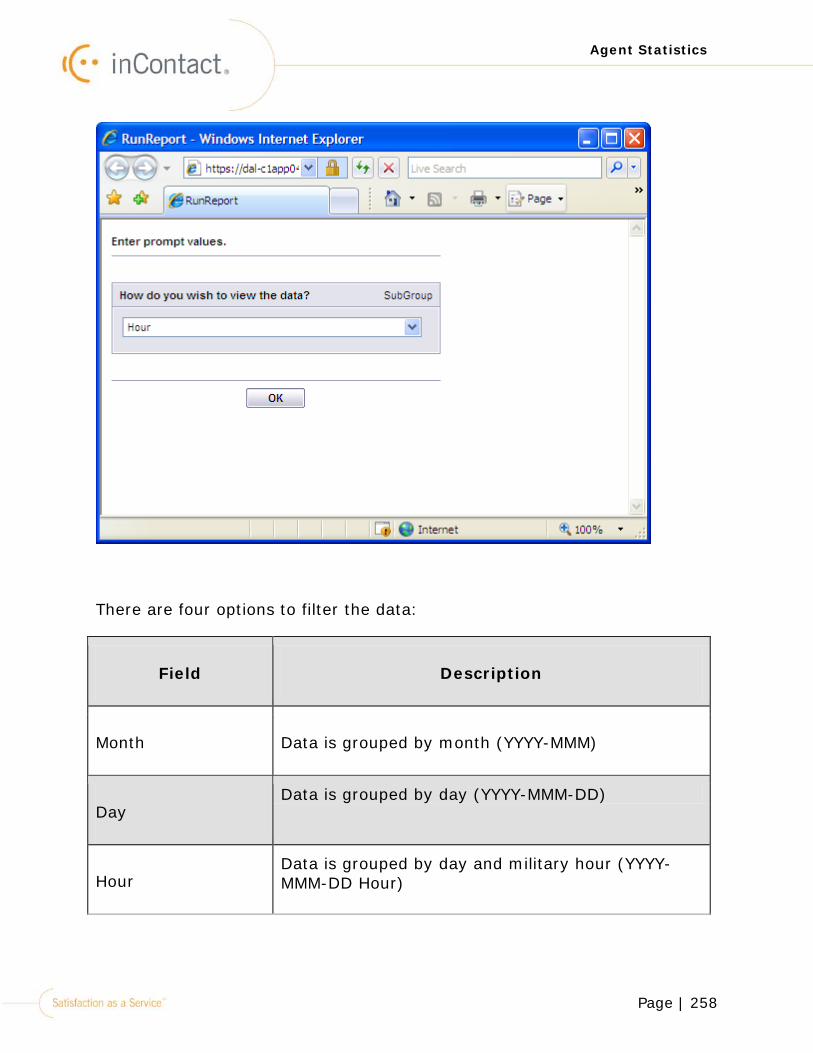
Page | 258
Agent Statistics
There are four options to filter the data:
Field Description
Month Data is grouped by month (YYYY-MMM)
Day Data is grouped by day (YYYY-MMM-DD)
Hour Data is grouped by day and military hour (YYYY-MMM-DD Hour)
Page | 259
Agent Statistics
Field Description
Half Hour Data is grouped by day and military half-hour (YYYY-MMM-DD Hour)
After clicking OK for the selected filter, the following report(s) open, according to the options you select:
•Agent Statistics By Month
•Agent Statistics By Day
•Agent Statistics By Hour
•Agent Statistics By Half Hour
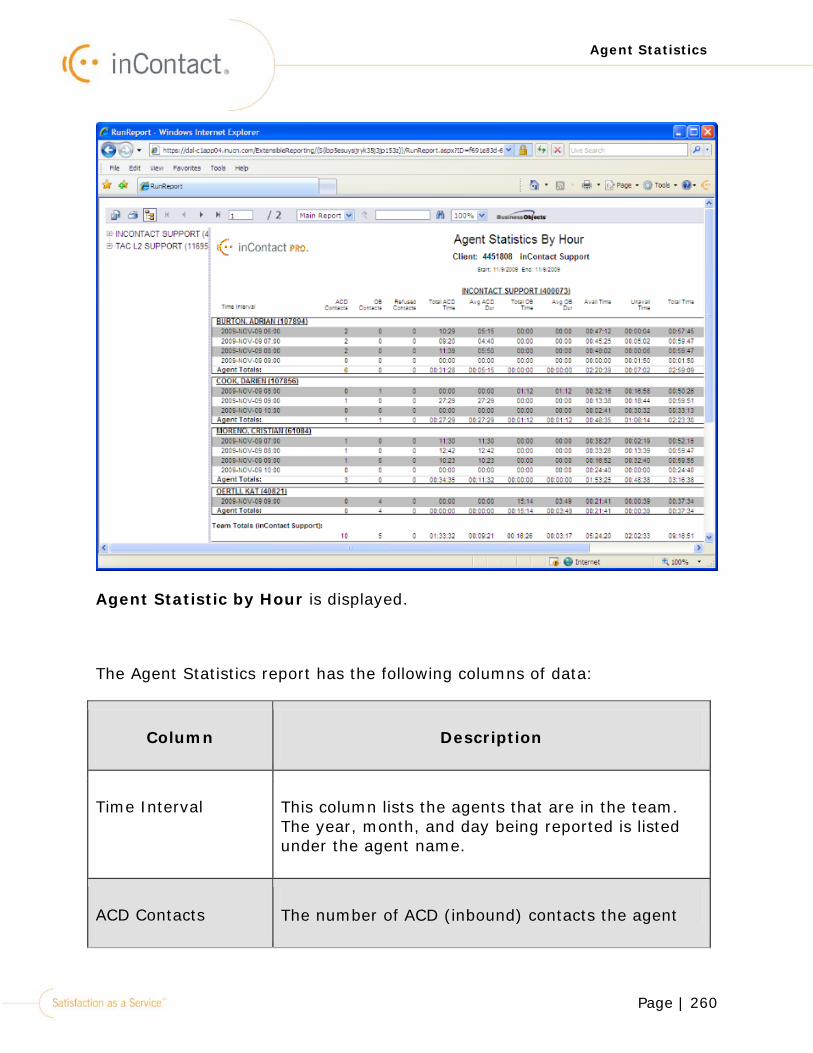
Page | 260
Agent Statistics
Agent Statistic by Hour is displayed.
The Agent Statistics report has the following columns of data:
Column Description
Time Interval This column lists the agents that are in the team. The year, month, and day being reported is listed under the agent name.
ACD Contacts The number of ACD (inbound) contacts the agent
Page | 261
Agent Statistics
Column Description
handled for the specified day.
OB Contacts Outbound contacts. The number of outbound contacts the agent handled.
Note! Any contact tied to a skill with an “outbound” attribute is included in this value.
Refused Contacts The number of contacts that were offered to agents but were not successfully delivered. A refused contact can be the result of any of the following:
an attempt was made to deliver a contact to the network, but an agent did not answer it
•the line is busy
•there is no answer
•a carrier problem
•an Internet connection problem
•myPhone did not connect
To verify why a call was refused, go to webManager > Reports > Contact > Contact History. This report
Page | 262
Agent Statistics
Column Description
will show the reason a contact was refused.
Total ACD Time The total duration of time the contacts handled by agents were in an ACD (inbound) state.
Avg ACD Dur The average duration of time agents were in an ACD (inbound) state.
Total OB Time The total duration of time agents were in an outbound state.
Avg OB Dur The average duration of time an agent was in an outbound state.
Avail Time The duration of time an agent was “Available” meaning the agent was available to handle a new contact.
Unavail Time The duration of time an agent was in an “Unavailable” state.
Note! In webManager > Unavailable Codes, you can create unavailable codes for agents to select when they go unavailable.
Page | 263
Agent Statistics
Column Description
Total Time The total duration of time an agent was logged in to myAgent.
Working Rate The percentage of total time the agent was actually working. This is defined by ACD Time + Outbound time + Available time divided by the total time logged in to myAgent.
Active Rate The percentage of total time the agent was actually working AND the time the agent was in an available state. This is defined by ACD time + Outbound time divided by the total time logged in to inContact.
Unavail Rate The percentage of total time the agent is in an unavailable state and cannot accept new contacts. This data is generated by the Unavailable Time divided by the Total Time logged in to myAgent.
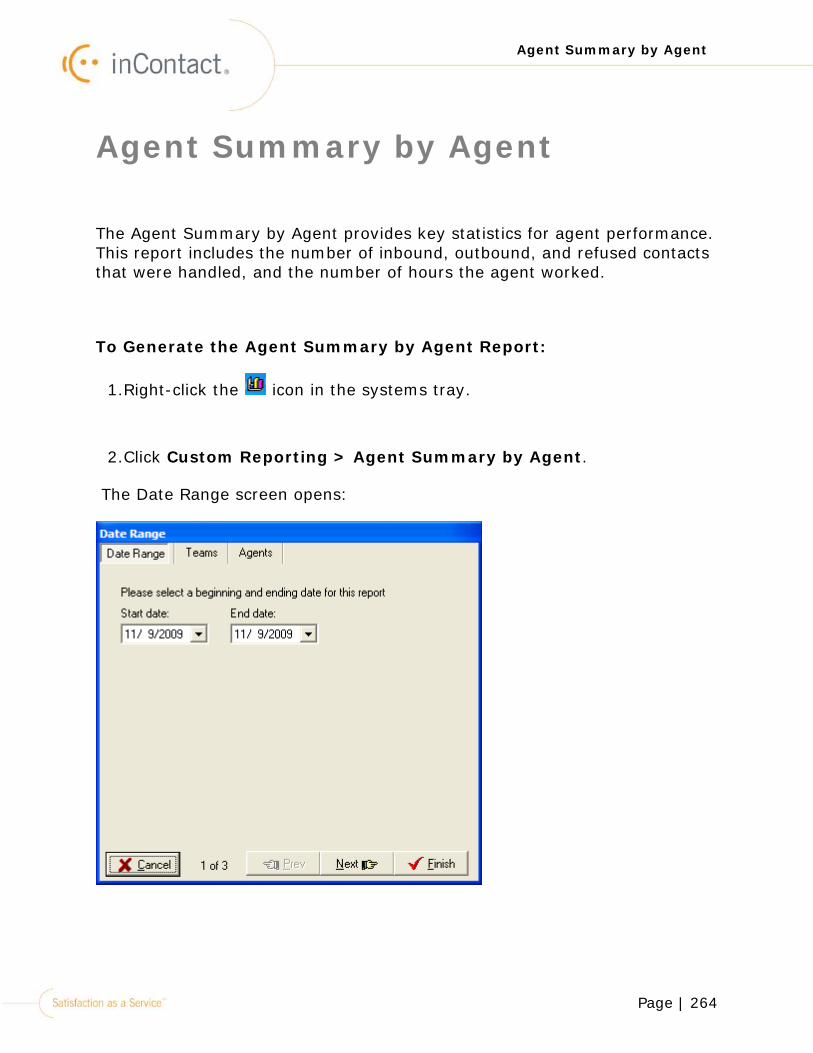
Page | 264
Agent Summary by Agent
Agent Summary by Agent
The Agent Summary by Agent provides key statistics for agent performance. This report includes the number of inbound, outbound, and refused contacts that were handled, and the number of hours the agent worked.
To Generate the Agent Summary by Agent Report:
1.Right-click the icon in the systems tray.
2.Click Custom Reporting > Agent Summary by Agent.
The Date Range screen opens:

Page | 265
Agent Summary by Agent
3.Select the Start date for the report.
4.Select the End date for the report.
5.Click the Next button.
The Teams tab opens:
6.Click to move the selected team(s) from the Available teams box to
the Teams in this report box. Click to move all teams.
7. Click to move the selected team(s) from the Teams in this report box to the Available teams box. Click to move all teams.
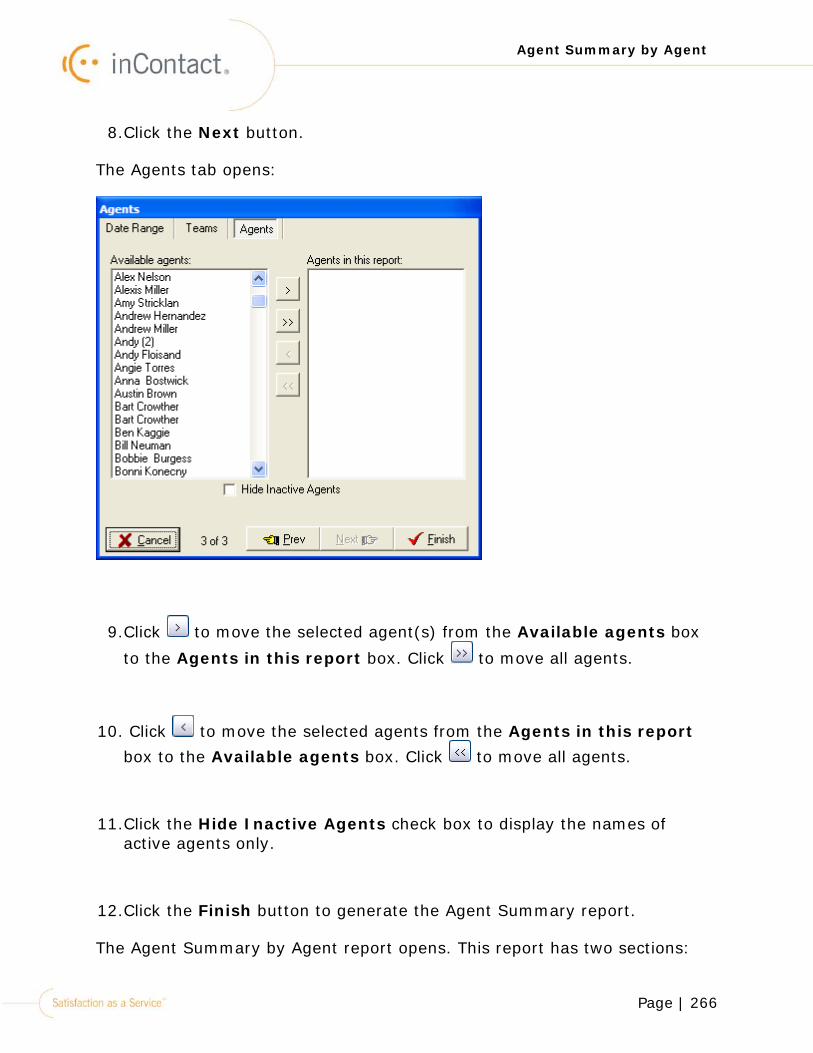
Page | 266
Agent Summary by Agent
8.Click the Next button.
The Agents tab opens:
9.Click to move the selected agent(s) from the Available agents box
to the Agents in this report box. Click to move all agents.
10. Click to move the selected agents from the Agents in this report box to the Available agents box. Click to move all agents.
11.Click the Hide Inactive Agents check box to display the names of active agents only.
12.Click the Finish button to generate the Agent Summary report.
The Agent Summary by Agent report opens. This report has two sections:
Page | 267
Agent Summary by Agent
•Comparison of All Agents
•Individual Reports for Each Agent
Comparison of All Agents:
Click Finish in the Date Range screen, the following page opens. This page shows a comparison of all agents:
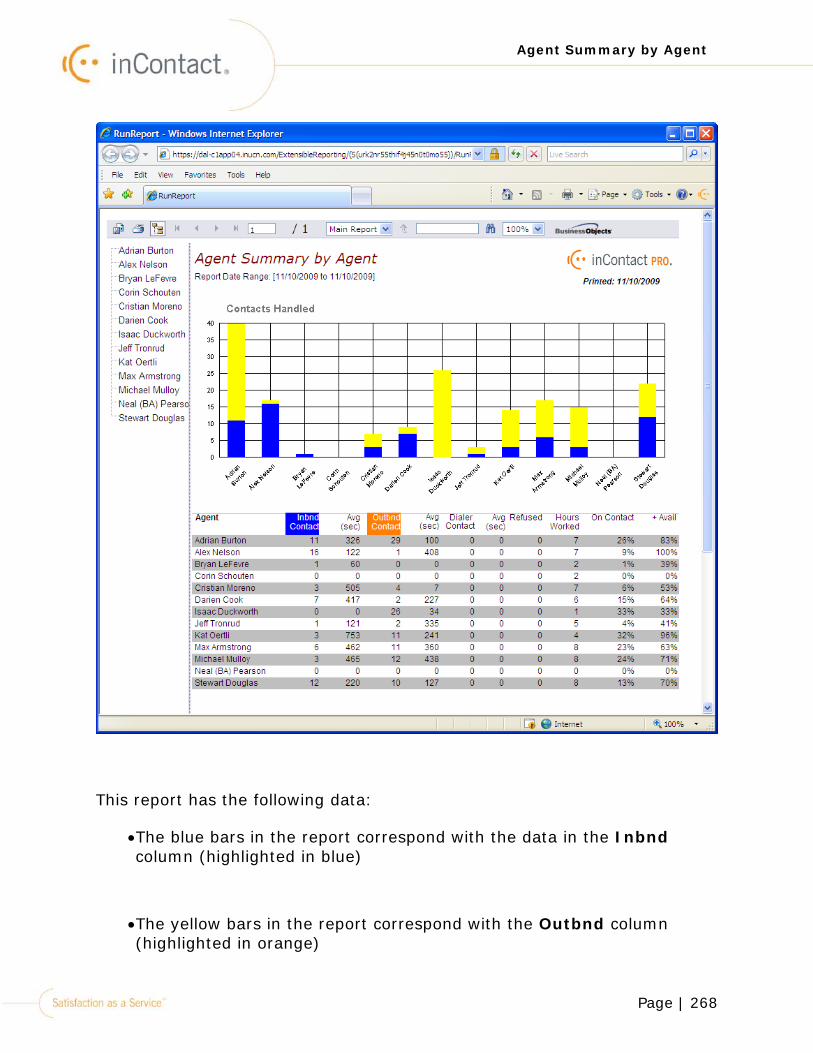
Page | 268
Agent Summary by Agent
This report has the following data:
•The blue bars in the report correspond with the data in the Inbnd column (highlighted in blue)
•The yellow bars in the report correspond with the Outbnd column (highlighted in orange)
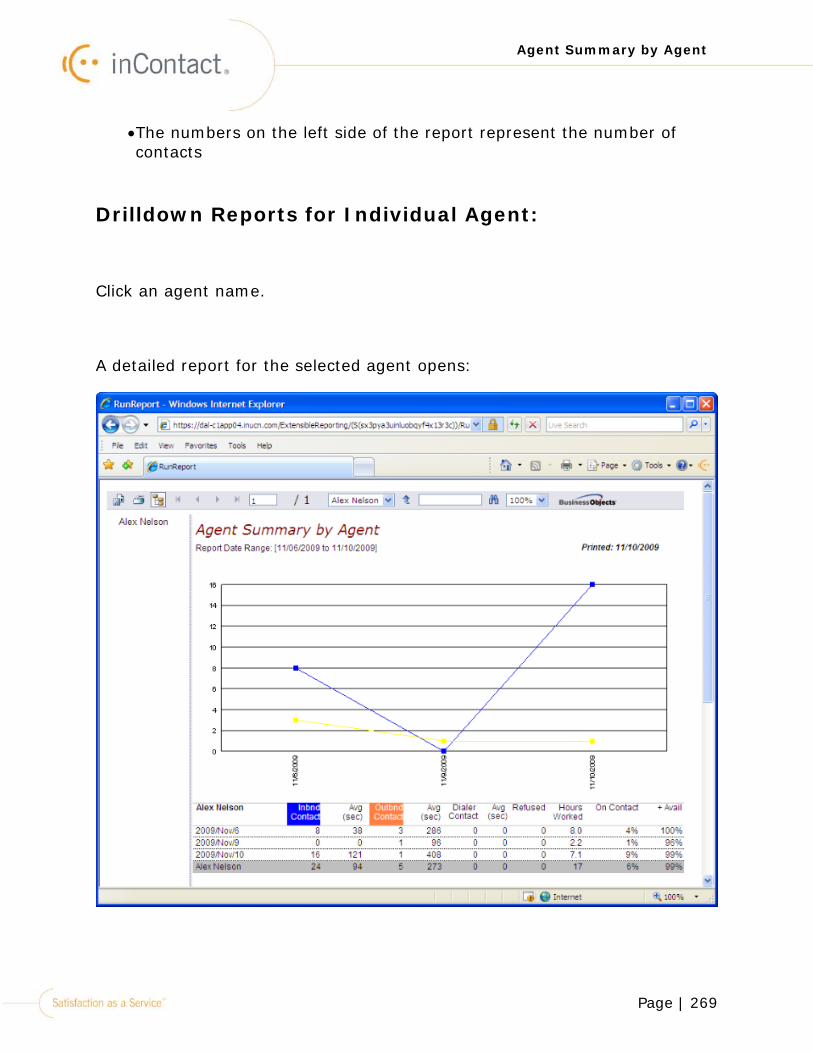
Page | 269
Agent Summary by Agent
•The numbers on the left side of the report represent the number of contacts
Drilldown Reports for Individual Agent:
Click an agent name.
A detailed report for the selected agent opens:
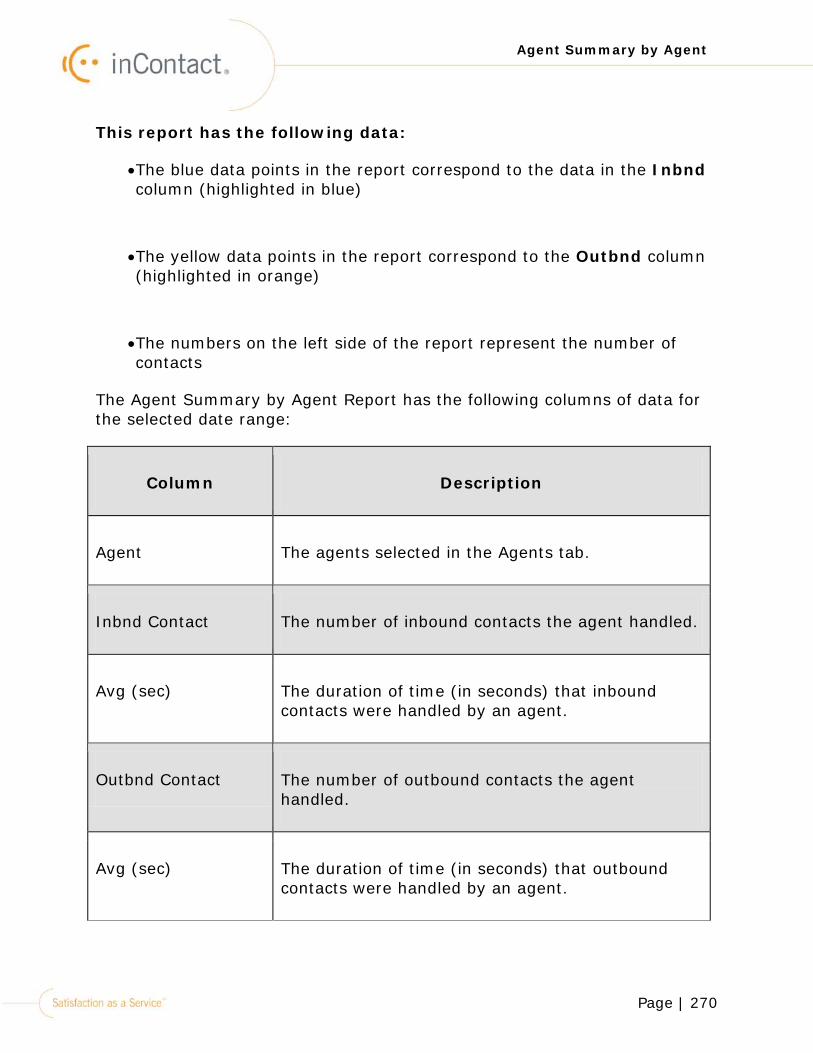
Page | 270
Agent Summary by Agent
This report has the following data:
•The blue data points in the report correspond to the data in the Inbnd column (highlighted in blue)
•The yellow data points in the report correspond to the Outbnd column (highlighted in orange)
•The numbers on the left side of the report represent the number of contacts
The Agent Summary by Agent Report has the following columns of data for the selected date range:
Column Description
Agent The agents selected in the Agents tab.
Inbnd Contact The number of inbound contacts the agent handled.
Avg (sec) The duration of time (in seconds) that inbound contacts were handled by an agent.
Outbnd Contact The number of outbound contacts the agent handled.
Avg (sec) The duration of time (in seconds) that outbound contacts were handled by an agent.
Page | 271
Agent Summary by Agent
Column Description
Refused A refused contact can be the result of any of the following:
an attempt was made to deliver a contact, but an agent did not answer it
•the line was busy
•there was no answer
•a carrier problem
•an Internet connection problem
•myPhone did not connect
To verify why a call was refused, go to webManager > Reports > Contact > Contact History. The report will show you why the contact was refused.
Dialer Contact Dialer calls (Power Dialer and Blaster Opt Out) will show up as Outbound Contacts on this report and the Dialer Contact column will show the number of outbound dialer contacts that were dispositioned as “Contact”.
This column does not necessarily show the number
Page | 272
Agent Summary by Agent
Column Description
of dialer calls the agent handled. For example, if the agent selects a disposition that is marked as Connect, Final, and DNC, but not Contact, that call will not be counted in this column.
Note! To create a disposition as Connect, Final, DNC, and Contact, go to webManager > Dialer > Dispositions tab > Agent Dispositions. If you have any questions, please call your Customer Service Representative.
Avg (sec) The duration of time (in seconds) that dialer contacts were handled by an agent.
Refused The number of dialer contacts that were refused (i.e., not answered) by the agent.
Note! If the contact was not answered by the assigned agent, it will be routed to another agent.
Hours Worked The number of hours the agent worked.
On Contact The percentage of the Hours Worked that the agent was handling contacts.
+ Avail The percentage of time the agent was in an “Available” state.
Page | 273
Agent Summary by Day
Agent Summary by Day
The Agent Summary by Day report displays data for the days selected within the date range. This report generates data to compare the number of inbound, outbound, and refused contacts that were handled; and the number of hours the agent worked for a particular week.
The Agent Summary by Day report shows the number of contacts by day. The days are listed at the bottom of the report. The numbers on the left side of the report represent the number of contacts that were handled.
To Generate the Agent Summary by Week Report:
1.Right-click the icon in the systems tray.
2.Click Custom Reporting > Agent Summary by Day.
The Date Range screen opens:
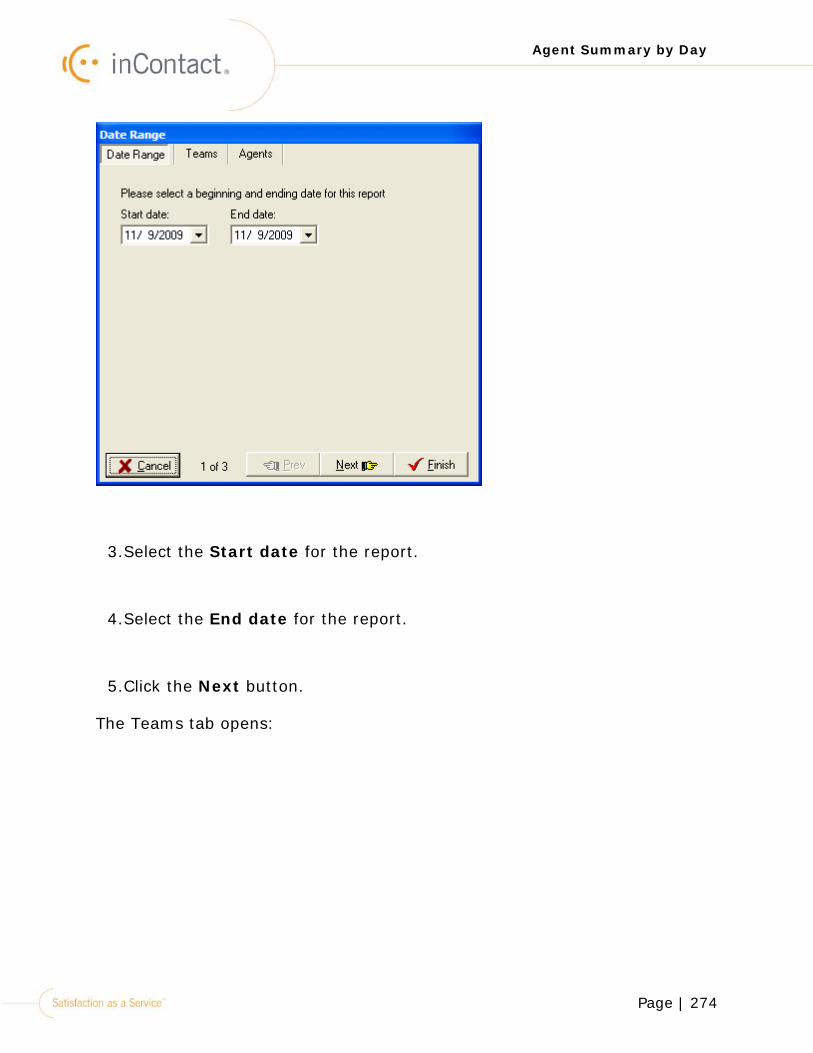
Page | 274
Agent Summary by Day
3.Select the Start date for the report.
4.Select the End date for the report.
5.Click the Next button.
The Teams tab opens:

Page | 275
Agent Summary by Day
6.Click to move the selected team(s) from the Available teams box to
the Teams in this report box. Click to move all teams.
7. Click to move the selected team(s) from the Teams in this report box to the Available teams box. Click to move all teams.
8.Click the Next button.
The Agents tab opens:
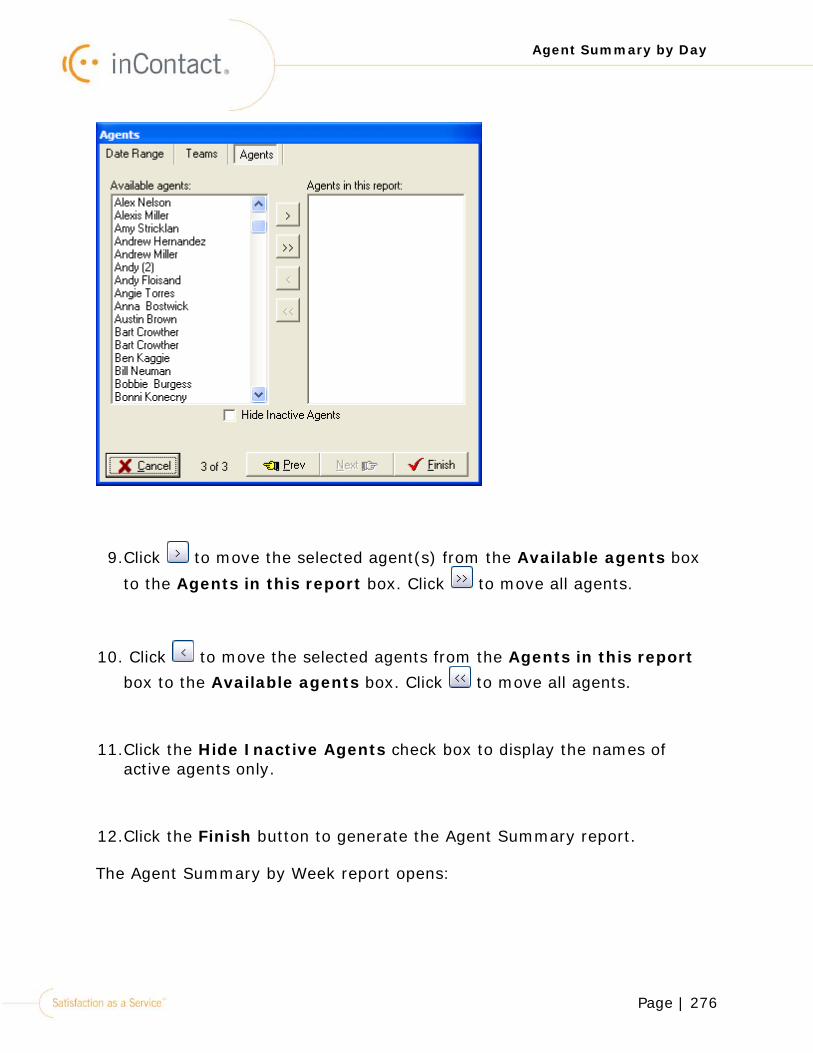
Page | 276
Agent Summary by Day
9.Click to move the selected agent(s) from the Available agents box
to the Agents in this report box. Click to move all agents.
10. Click to move the selected agents from the Agents in this report box to the Available agents box. Click to move all agents.
11.Click the Hide Inactive Agents check box to display the names of active agents only.
12.Click the Finish button to generate the Agent Summary report.
The Agent Summary by Week report opens:
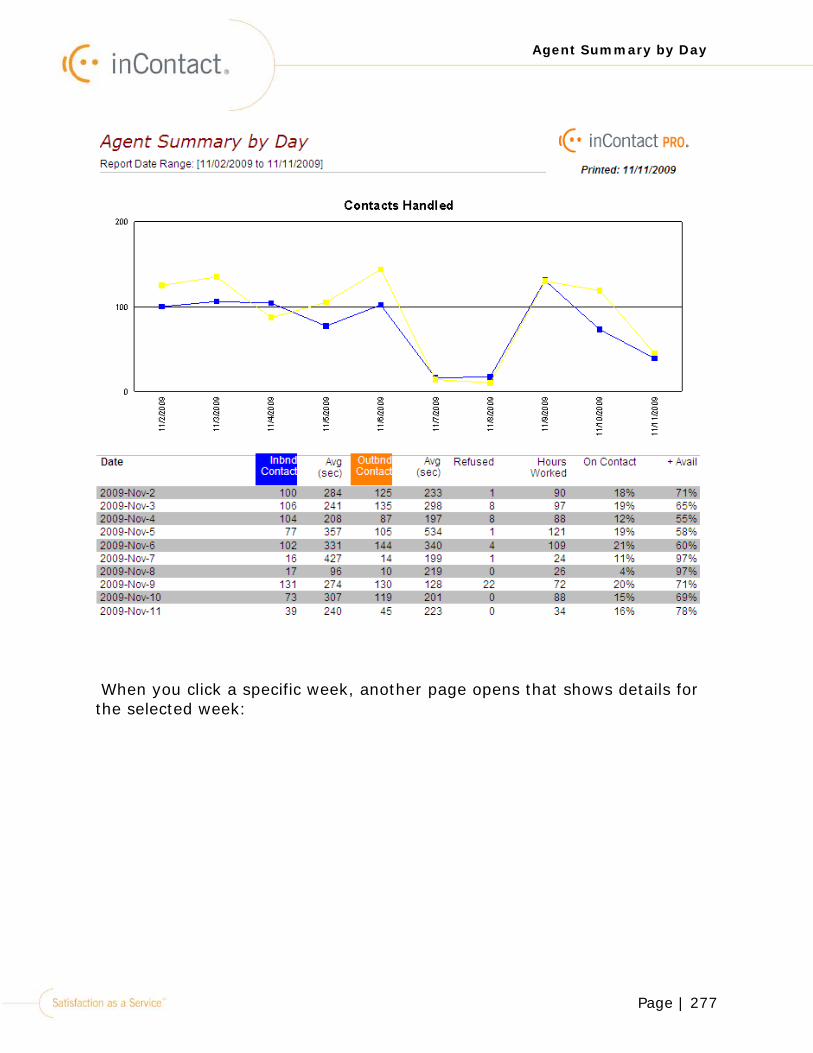
Page | 277
Agent Summary by Day
When you click a specific week, another page opens that shows details for the selected week:
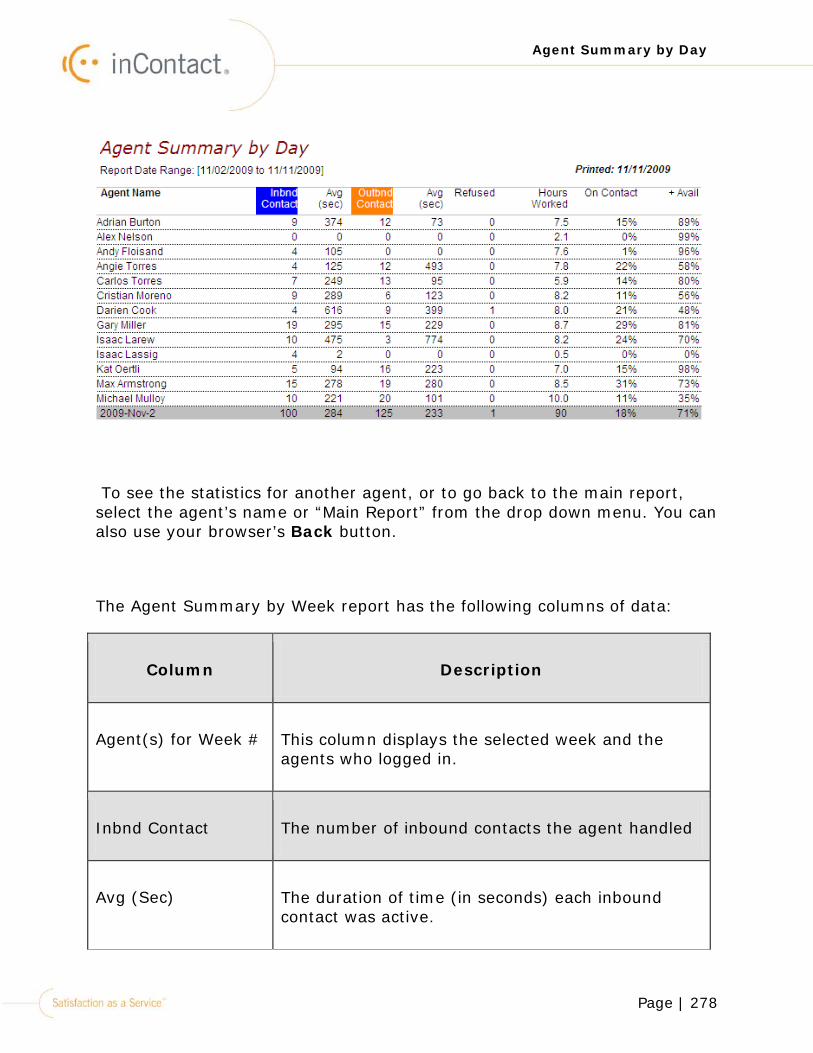
Page | 278
Agent Summary by Day
To see the statistics for another agent, or to go back to the main report, select the agent’s name or “Main Report” from the drop down menu. You can also use your browser’s Back button.
The Agent Summary by Week report has the following columns of data:
Column Description
Agent(s) for Week # This column displays the selected week and the agents who logged in.
Inbnd Contact The number of inbound contacts the agent handled
Avg (Sec) The duration of time (in seconds) each inbound contact was active.
Page | 279
Agent Summary by Day
Column Description
Outbnd Contact The number of outbound contacts the agent handled.
Avg (Sec) The duration of time (in seconds) the outbound contacts were active.
Refused A refused contact can be the result of any of the following:
an attempt was made to deliver a contact to the network, but an agent did not answer it
•the line was busy
•there was no answer
•a carrier problem
•an Internet connection problem
•myPhone did not connect
To verify why a call was refused during a selected week, go to webManager > Reports > Contact History. The report shows why the contact was refused.
Page | 280
Agent Summary by Day
Column Description
Hours Worked The number of hours the agent worked.
On Contact The percentage of Hours Worked that the agent was handling contacts.
+ Avail The percentage of Hours Worked that the agent was in an “Available” state.
Page | 281
Agent Summary by Month
Agent Summary by Month
The Agent Summary By Month report displays data for the months selected in the date range. This report generates data to compare the number of inbound, outbound, and refused contacts that were handled; and the number of hours that the agent worked for a selected month(s).
The months are listed at the bottom of the report. The numbers on the left represent the number of contacts that were handled.
To Generate the Agent Summary by Month Report:
1.Right-click the icon in the systems tray.
2.Click Custom Reporting > Agent Summary by Month.
The Date Range screen opens:

Page | 282
Agent Summary by Month
3.Select the Start date for the report.
4.Select the End date for the report.
5.Click the Next button.
The Teams tab opens:

Page | 283
Agent Summary by Month
6.Click to move the selected team(s) from the Available teams box to
the Teams in this report box. Click to move all teams.
7. Click to move the selected team(s) from the Teams in this report box to the Available teams box. Click to move all teams.
8.Click the Next button.
The Agents tab opens:

Page | 284
Agent Summary by Month
9.Click to move the selected agent(s) from the Available agents box
to the Agents in this report box. Click to move all agents.
10. Click to move the selected agents from the Agents in this report box to the Available agents box. Click to move all agents.
11.Click the Hide Inactive Agents check box to display the names of active agents only.
12.Click the Finish button to generate the Agent Summary report.
The Agent Summary by Month report opens:
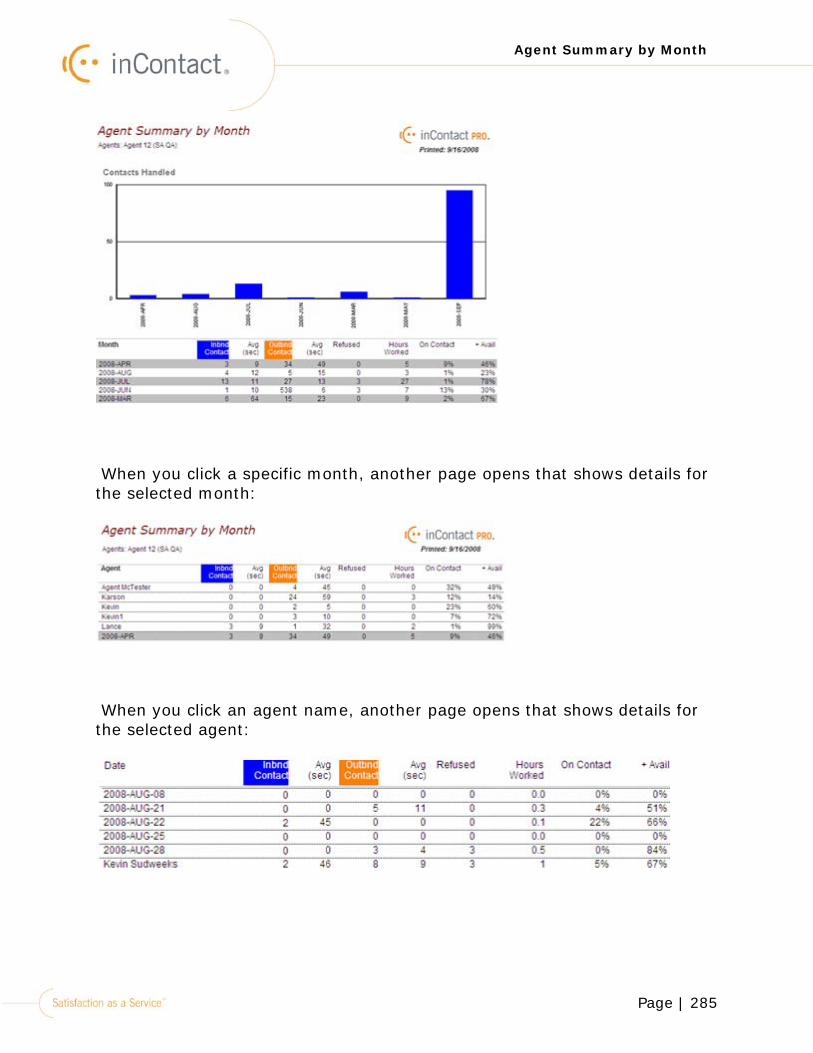
Page | 285
Agent Summary by Month
When you click a specific month, another page opens that shows details for the selected month:
When you click an agent name, another page opens that shows details for the selected agent:
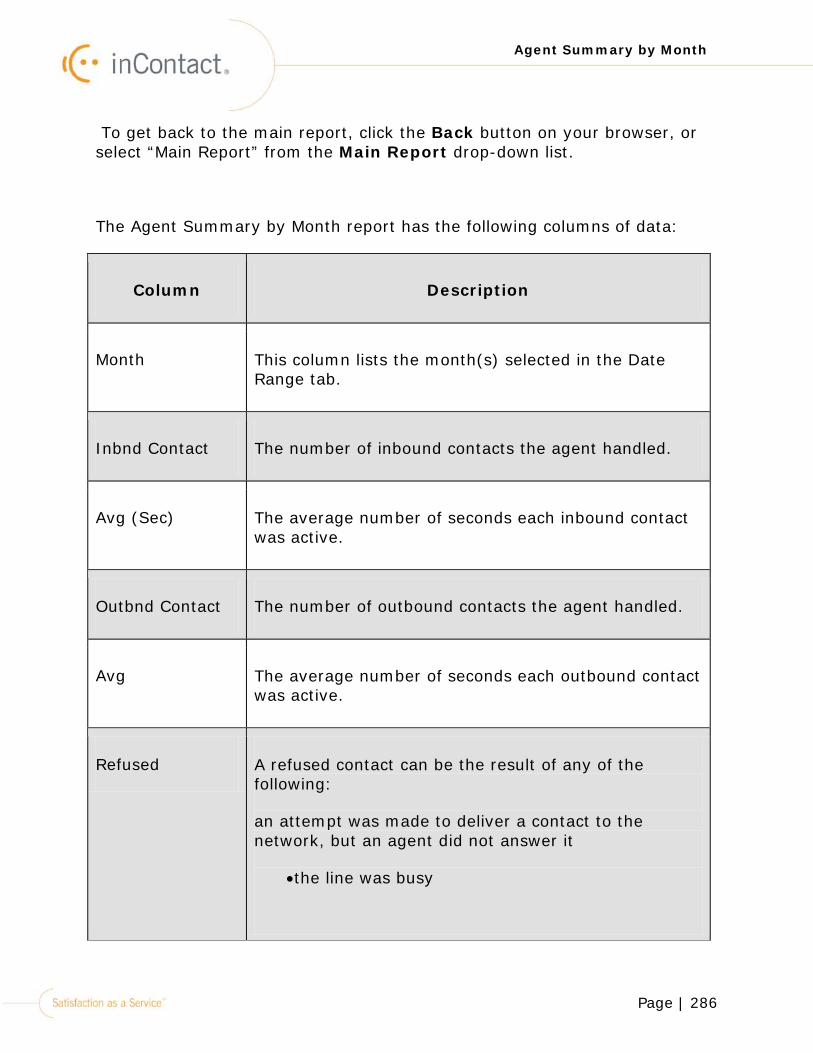
Page | 286
Agent Summary by Month
To get back to the main report, click the Back button on your browser, or select “Main Report” from the Main Report drop-down list.
The Agent Summary by Month report has the following columns of data:
Column Description
Month This column lists the month(s) selected in the Date Range tab.
Inbnd Contact The number of inbound contacts the agent handled.
Avg (Sec) The average number of seconds each inbound contact was active.
Outbnd Contact The number of outbound contacts the agent handled.
Avg The average number of seconds each outbound contact was active.
Refused A refused contact can be the result of any of the following:
an attempt was made to deliver a contact to the network, but an agent did not answer it
•the line was busy
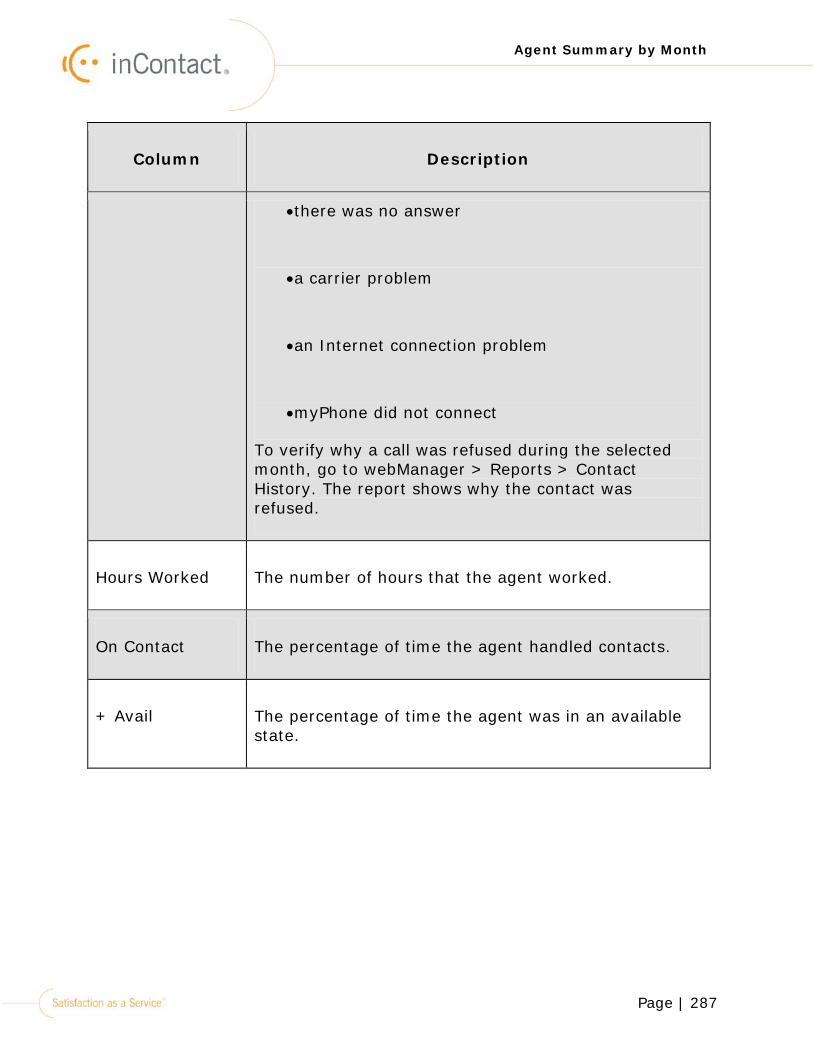
Page | 287
Agent Summary by Month
Column Description
•there was no answer
•a carrier problem
•an Internet connection problem
•myPhone did not connect
To verify why a call was refused during the selected month, go to webManager > Reports > Contact History. The report shows why the contact was refused.
Hours Worked The number of hours that the agent worked.
On Contact The percentage of time the agent handled contacts.
+ Avail The percentage of time the agent was in an available state.
Page | 288
Agent Summary by Week
Agent Summary by Week
The Agent Summary by Week report displays data for the weeks selected within the date range. This report generates data to compare the number of inbound, outbound, and refused contacts that were handled; and the number of hours the agent worked for a particular week.
The Agent Summary by Week report shows the number of contacts by week. The weeks are listed at the bottom of the report. The numbers on the left side of the report represent the number of contacts that were handled.
To Generate the Agent Summary by Week Report:
1.Right-click the icon in the systems tray.
2.Click Custom Reporting > Agent Summary by Week.
The Date Range screen opens:

Page | 289
Agent Summary by Week
3.Select the Start date for the report.
4.Select the End date for the report.
5.Click the Next button.
The Teams tab opens:

Page | 290
Agent Summary by Week
6.Click to move the selected team(s) from the Available teams box to
the Teams in this report box. Click to move all teams.
7. Click to move the selected team(s) from the Teams in this report box to the Available teams box. Click to move all teams.
8.Click the Next button.
The Agents tab opens:
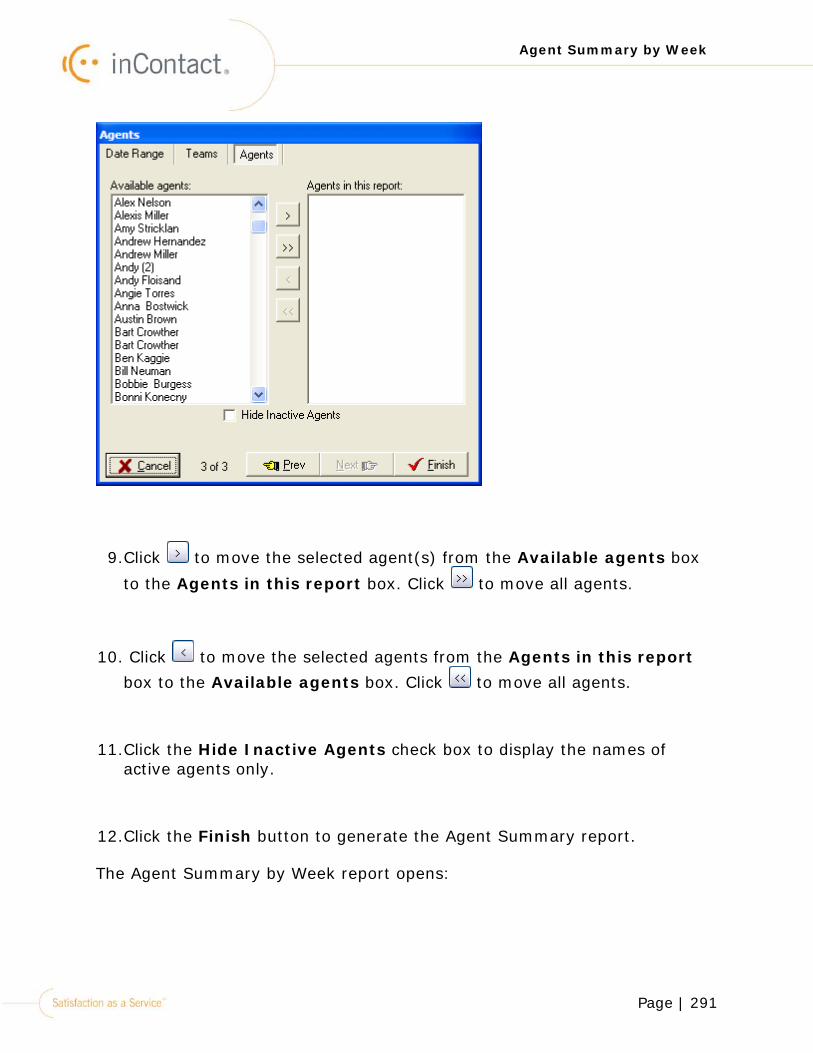
Page | 291
Agent Summary by Week
9.Click to move the selected agent(s) from the Available agents box
to the Agents in this report box. Click to move all agents.
10. Click to move the selected agents from the Agents in this report box to the Available agents box. Click to move all agents.
11.Click the Hide Inactive Agents check box to display the names of active agents only.
12.Click the Finish button to generate the Agent Summary report.
The Agent Summary by Week report opens:
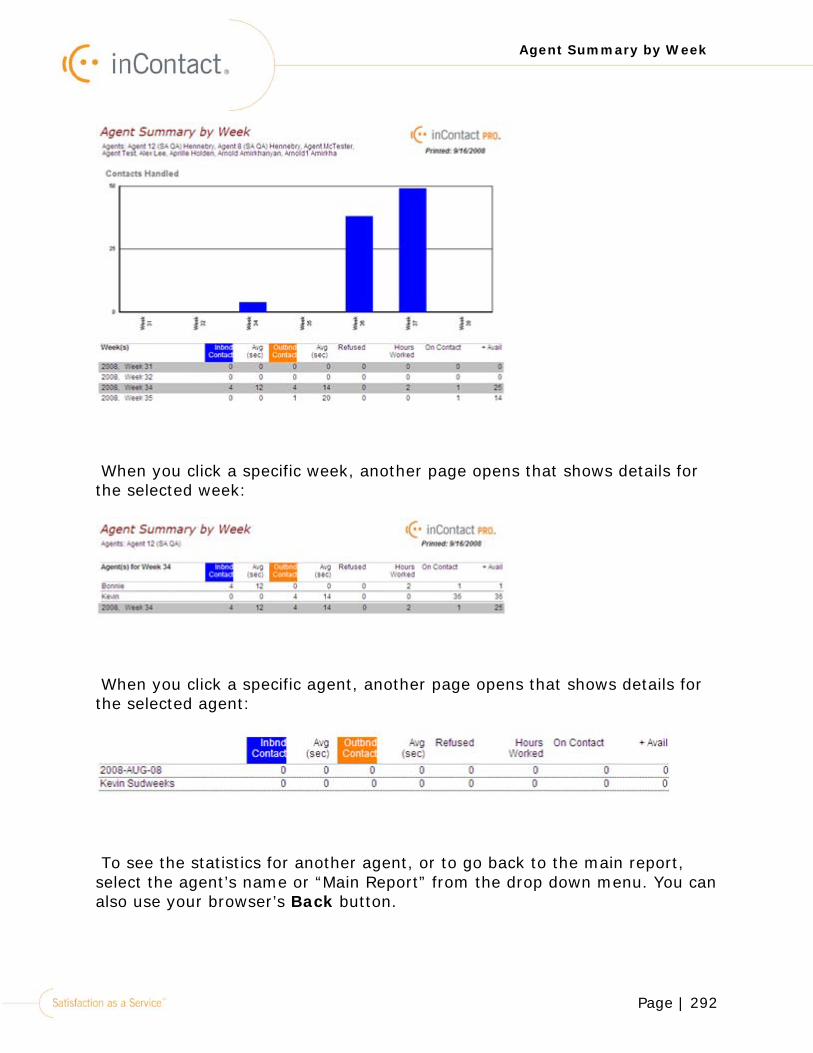
Page | 292
Agent Summary by Week
When you click a specific week, another page opens that shows details for the selected week:
When you click a specific agent, another page opens that shows details for the selected agent:
To see the statistics for another agent, or to go back to the main report, select the agent’s name or “Main Report” from the drop down menu. You can also use your browser’s Back button.
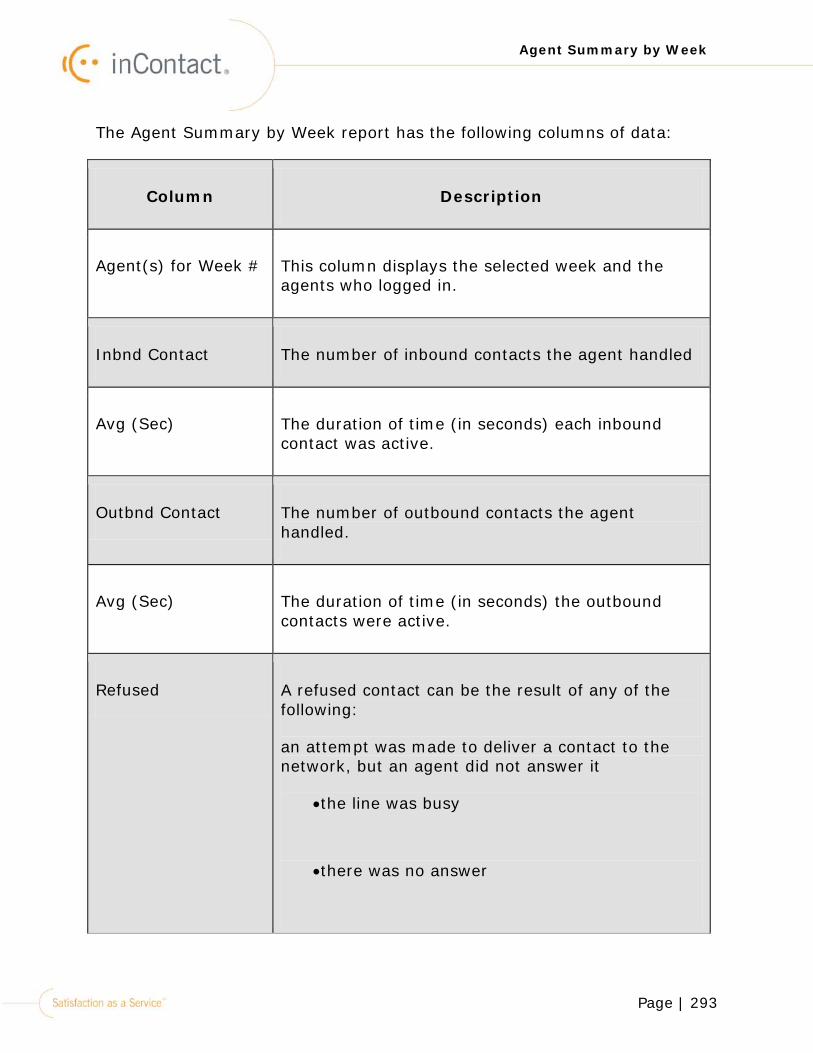
Page | 293
Agent Summary by Week
The Agent Summary by Week report has the following columns of data:
Column Description
Agent(s) for Week # This column displays the selected week and the agents who logged in.
Inbnd Contact The number of inbound contacts the agent handled
Avg (Sec) The duration of time (in seconds) each inbound contact was active.
Outbnd Contact The number of outbound contacts the agent handled.
Avg (Sec) The duration of time (in seconds) the outbound contacts were active.
Refused A refused contact can be the result of any of the following:
an attempt was made to deliver a contact to the network, but an agent did not answer it
•the line was busy
•there was no answer
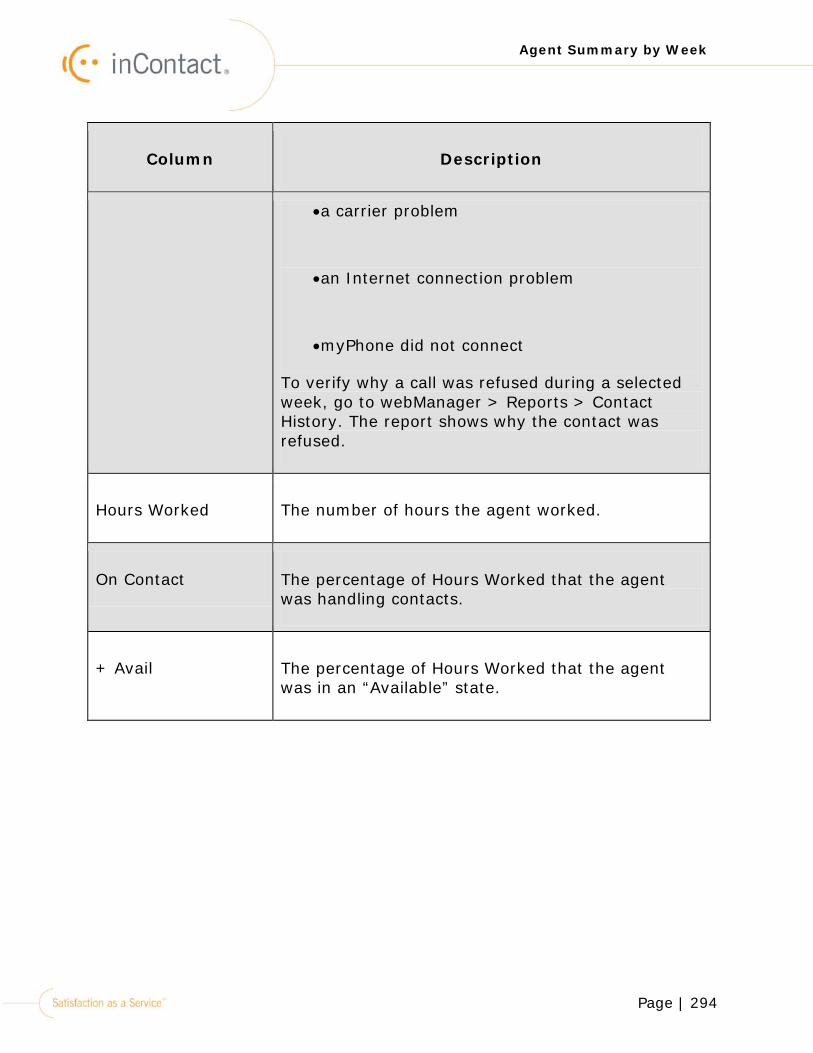
Page | 294
Agent Summary by Week
Column Description
•a carrier problem
•an Internet connection problem
•myPhone did not connect
To verify why a call was refused during a selected week, go to webManager > Reports > Contact History. The report shows why the contact was refused.
Hours Worked The number of hours the agent worked.
On Contact The percentage of Hours Worked that the agent was handling contacts.
+ Avail The percentage of Hours Worked that the agent was in an “Available” state.
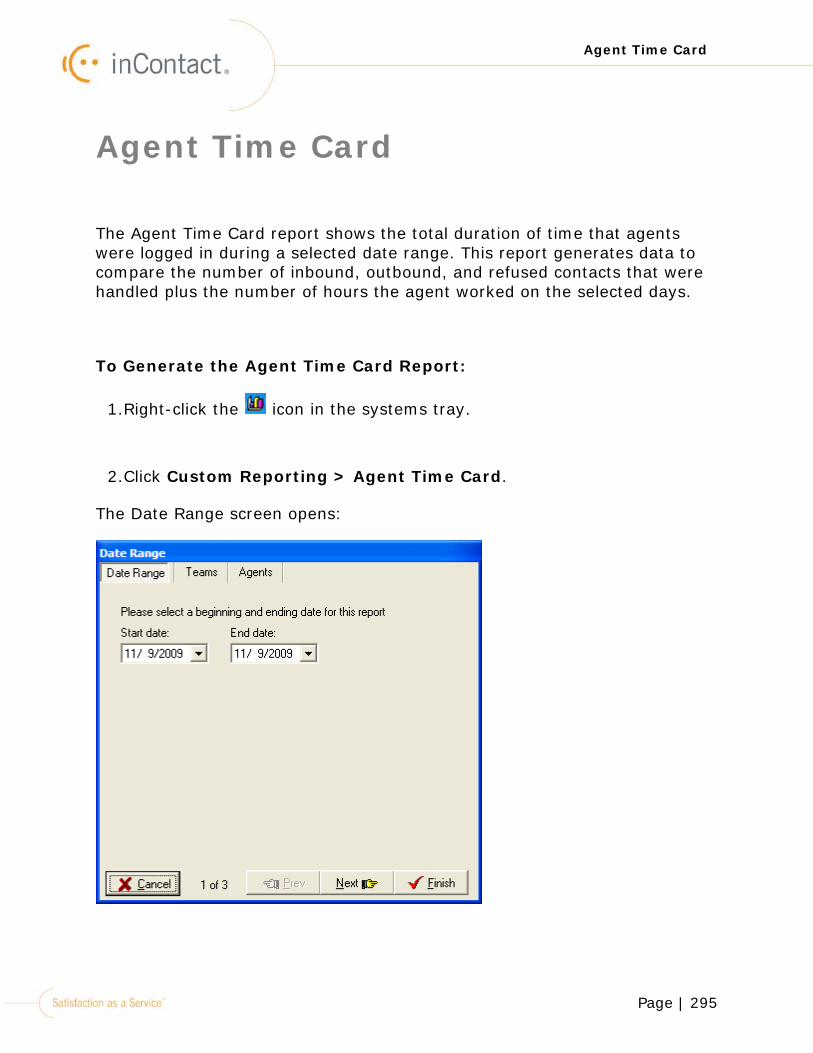
Page | 295
Agent Time Card
Agent Time Card
The Agent Time Card report shows the total duration of time that agents were logged in during a selected date range. This report generates data to compare the number of inbound, outbound, and refused contacts that were handled plus the number of hours the agent worked on the selected days.
To Generate the Agent Time Card Report:
1.Right-click the icon in the systems tray.
2.Click Custom Reporting > Agent Time Card.
The Date Range screen opens:
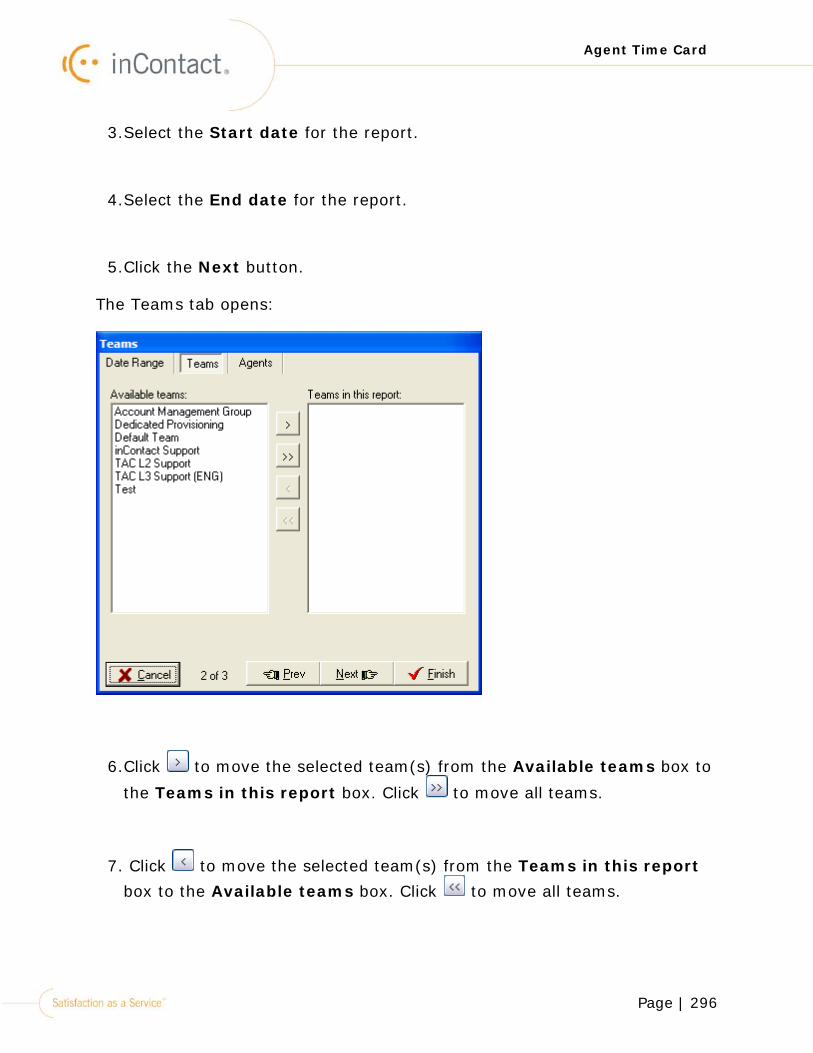
Page | 296
Agent Time Card
3.Select the Start date for the report.
4.Select the End date for the report.
5.Click the Next button.
The Teams tab opens:
6.Click to move the selected team(s) from the Available teams box to
the Teams in this report box. Click to move all teams.
7. Click to move the selected team(s) from the Teams in this report box to the Available teams box. Click to move all teams.
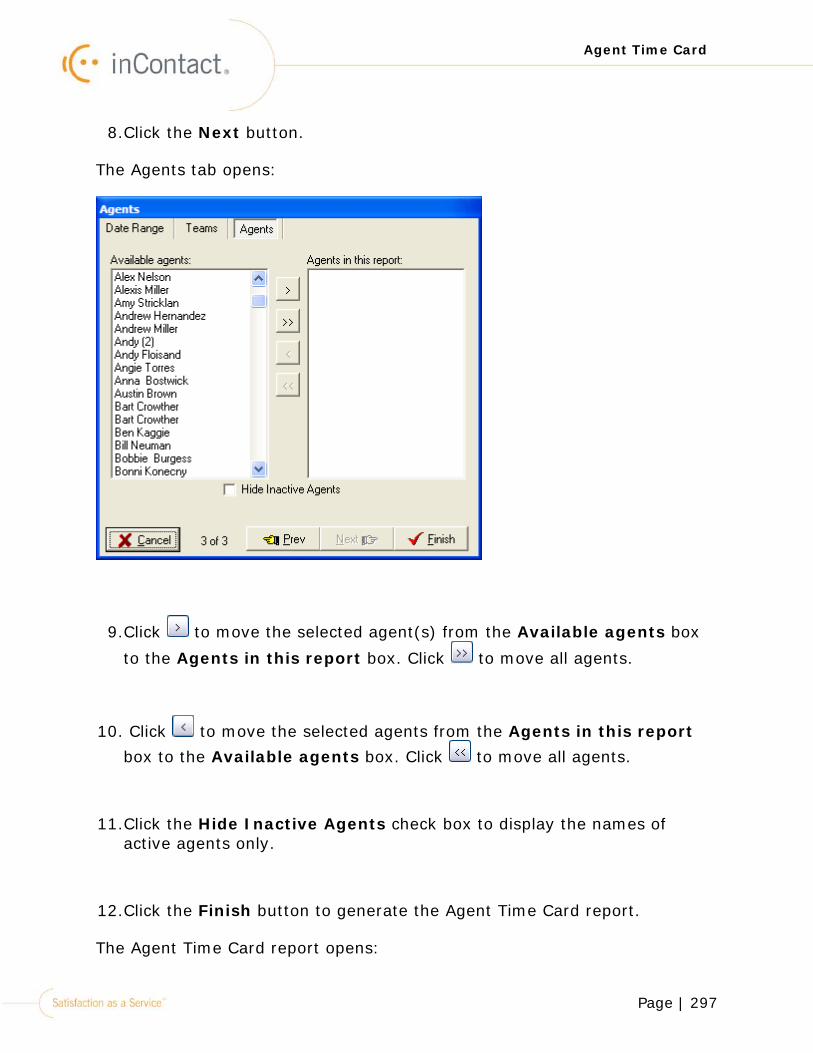
Page | 297
Agent Time Card
8.Click the Next button.
The Agents tab opens:
9.Click to move the selected agent(s) from the Available agents box
to the Agents in this report box. Click to move all agents.
10. Click to move the selected agents from the Agents in this report box to the Available agents box. Click to move all agents.
11.Click the Hide Inactive Agents check box to display the names of active agents only.
12.Click the Finish button to generate the Agent Time Card report.
The Agent Time Card report opens:
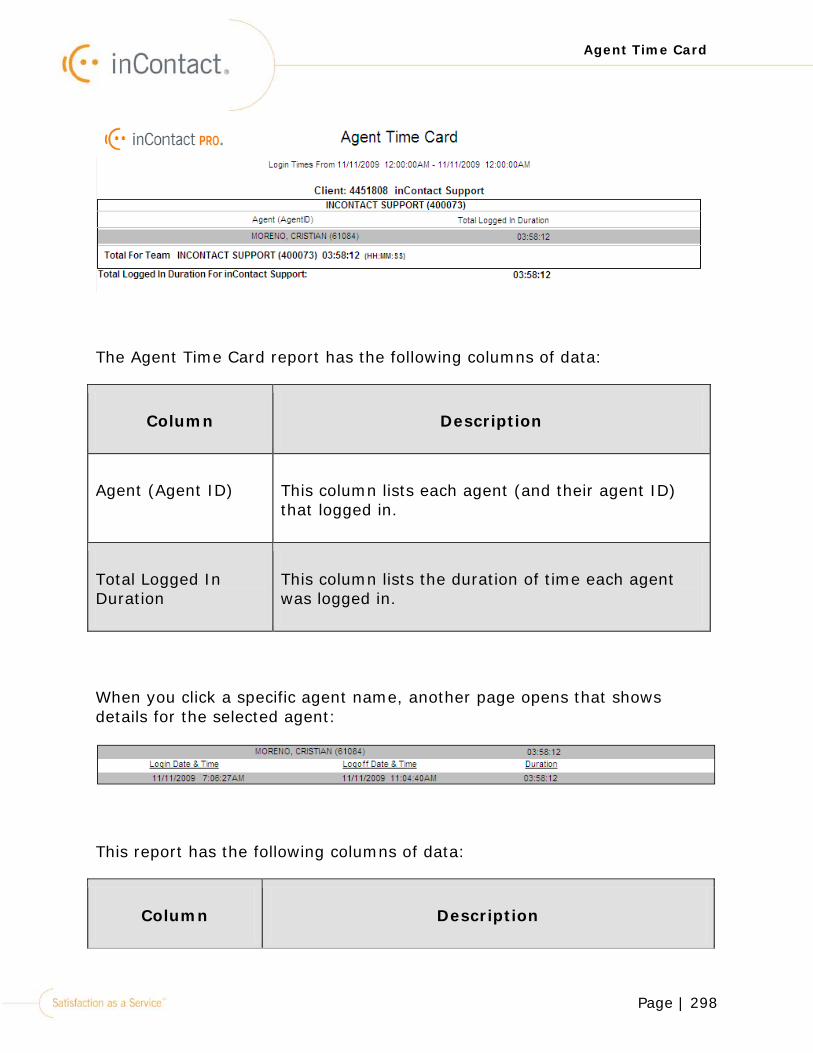
Page | 298
Agent Time Card
The Agent Time Card report has the following columns of data:
Column Description
Agent (Agent ID) This column lists each agent (and their agent ID) that logged in.
Total Logged In Duration
This column lists the duration of time each agent was logged in.
When you click a specific agent name, another page opens that shows details for the selected agent:
This report has the following columns of data:
Column Description
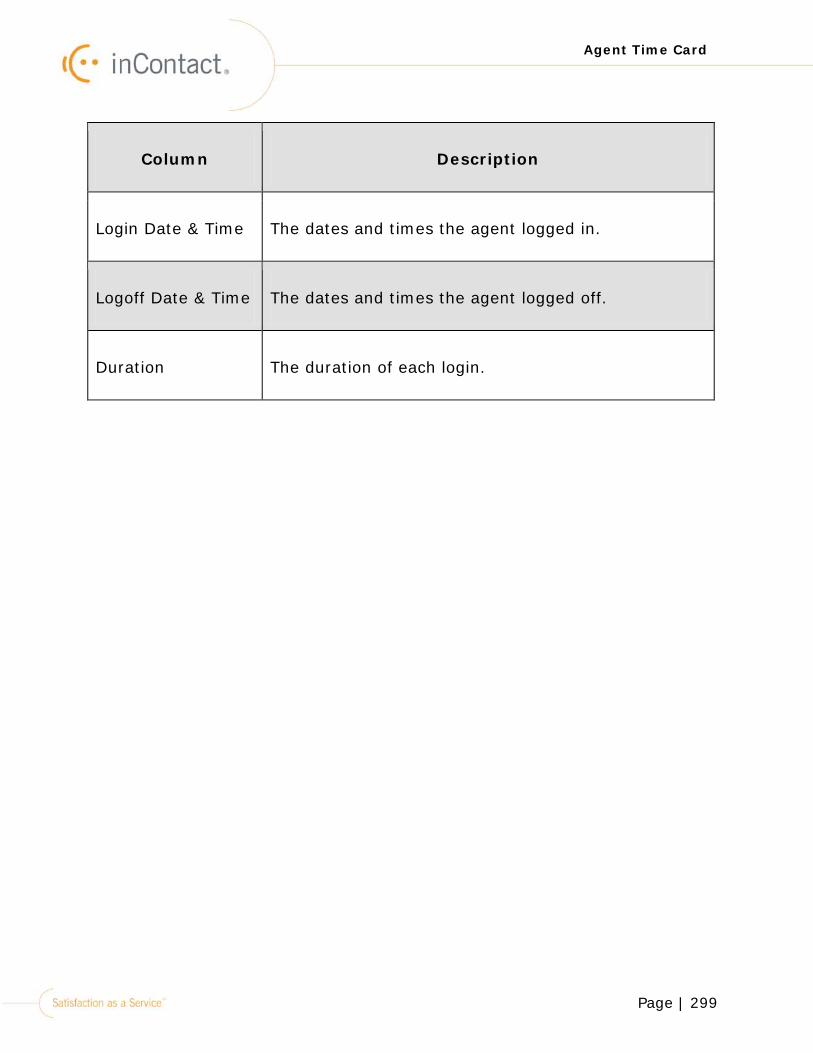
Page | 299
Agent Time Card
Column Description
Login Date & Time The dates and times the agent logged in.
Logoff Date & Time The dates and times the agent logged off.
Duration The duration of each login.
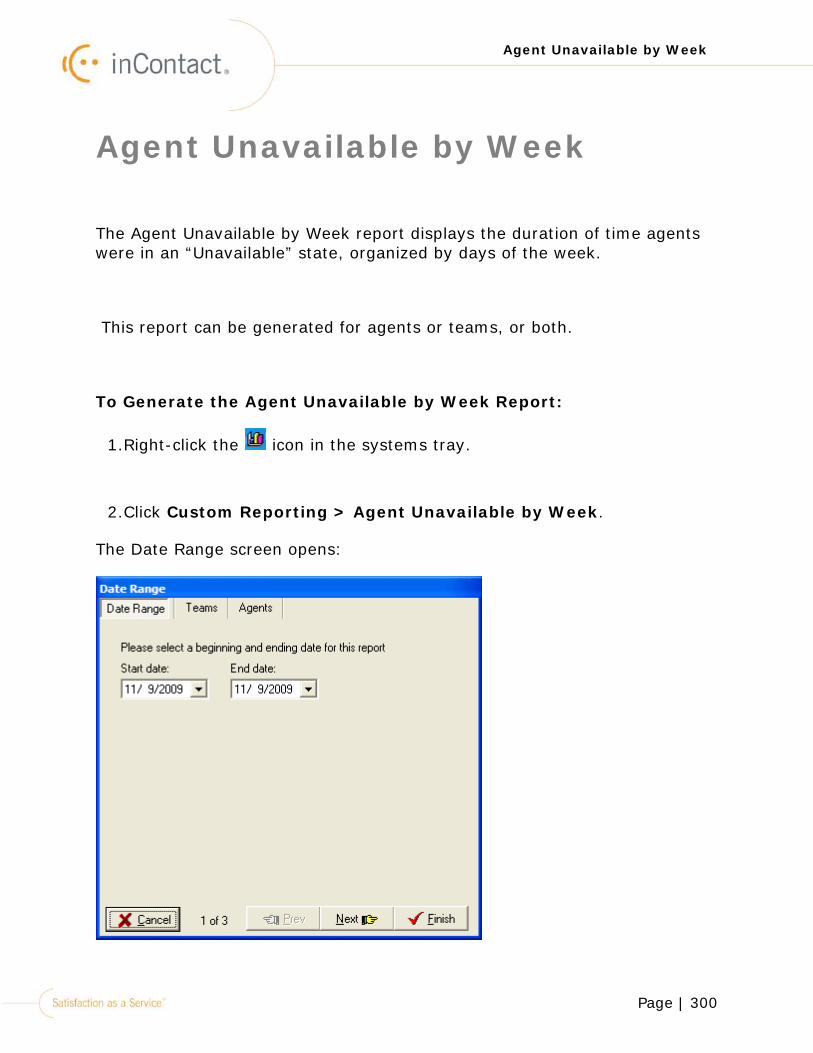
Page | 300
Agent Unavailable by Week
Agent Unavailable by Week
The Agent Unavailable by Week report displays the duration of time agents were in an “Unavailable” state, organized by days of the week.
This report can be generated for agents or teams, or both.
To Generate the Agent Unavailable by Week Report:
1.Right-click the icon in the systems tray.
2.Click Custom Reporting > Agent Unavailable by Week.
The Date Range screen opens:
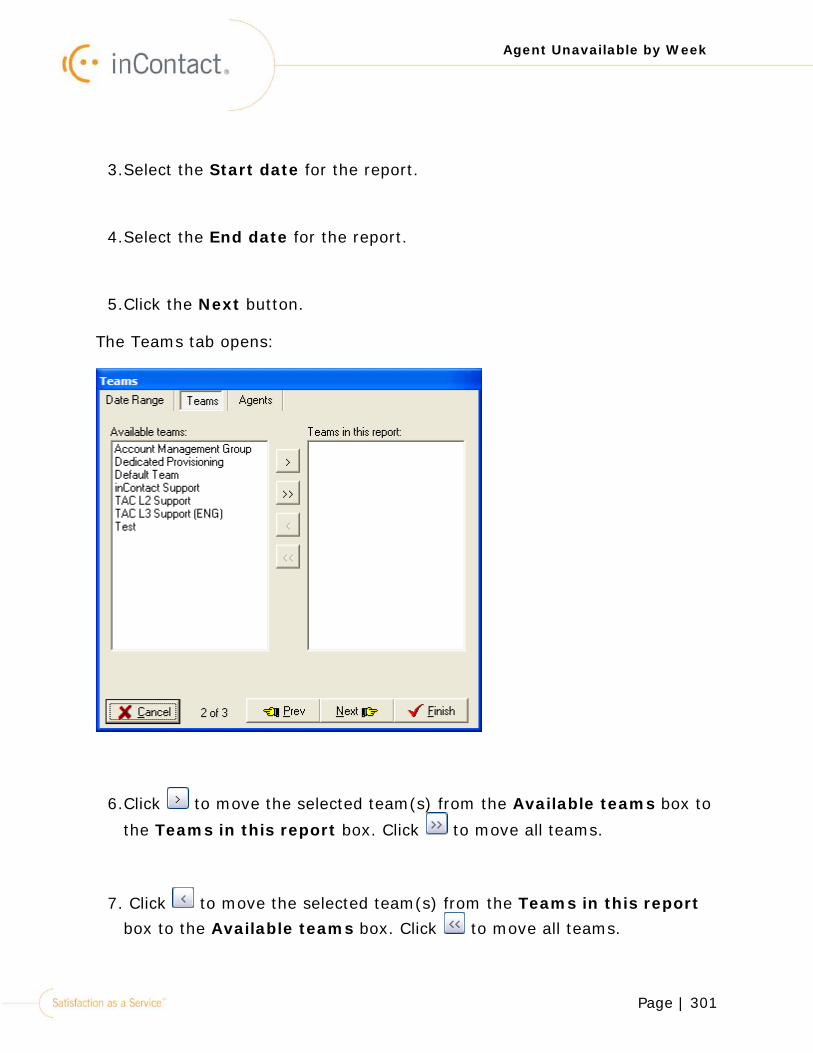
Page | 301
Agent Unavailable by Week
3.Select the Start date for the report.
4.Select the End date for the report.
5.Click the Next button.
The Teams tab opens:
6.Click to move the selected team(s) from the Available teams box to
the Teams in this report box. Click to move all teams.
7. Click to move the selected team(s) from the Teams in this report box to the Available teams box. Click to move all teams.
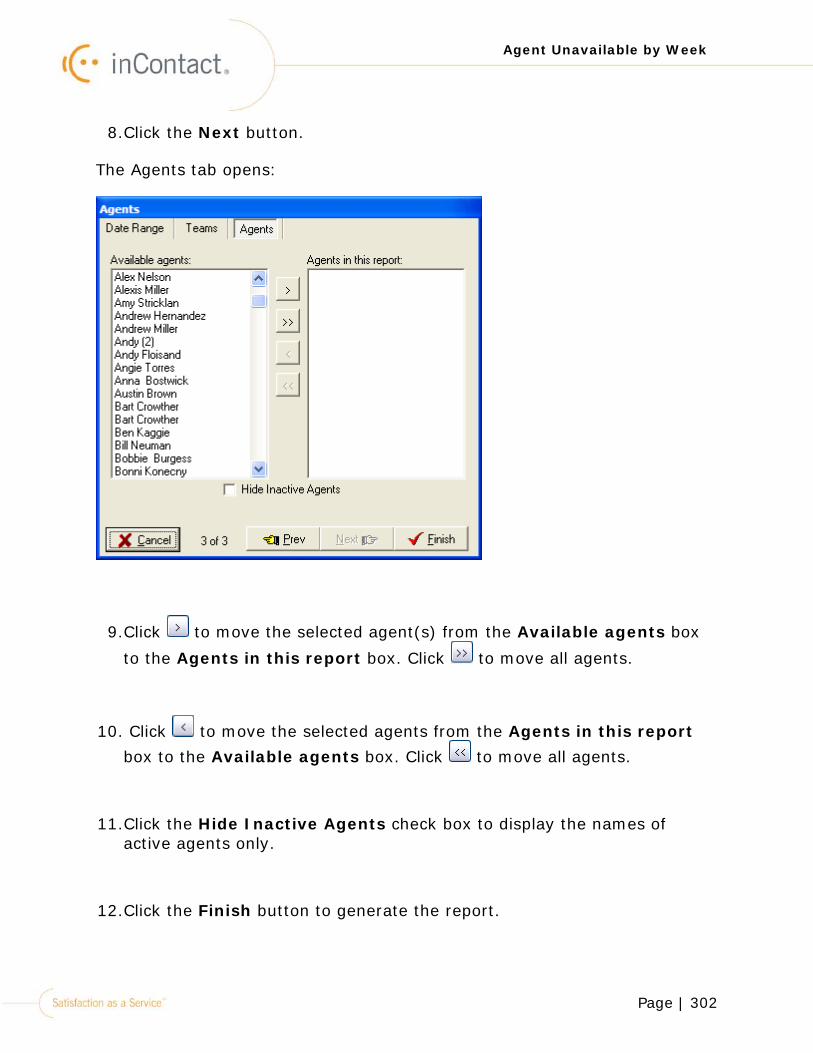
Page | 302
Agent Unavailable by Week
8.Click the Next button.
The Agents tab opens:
9.Click to move the selected agent(s) from the Available agents box
to the Agents in this report box. Click to move all agents.
10. Click to move the selected agents from the Agents in this report box to the Available agents box. Click to move all agents.
11.Click the Hide Inactive Agents check box to display the names of active agents only.
12.Click the Finish button to generate the report.
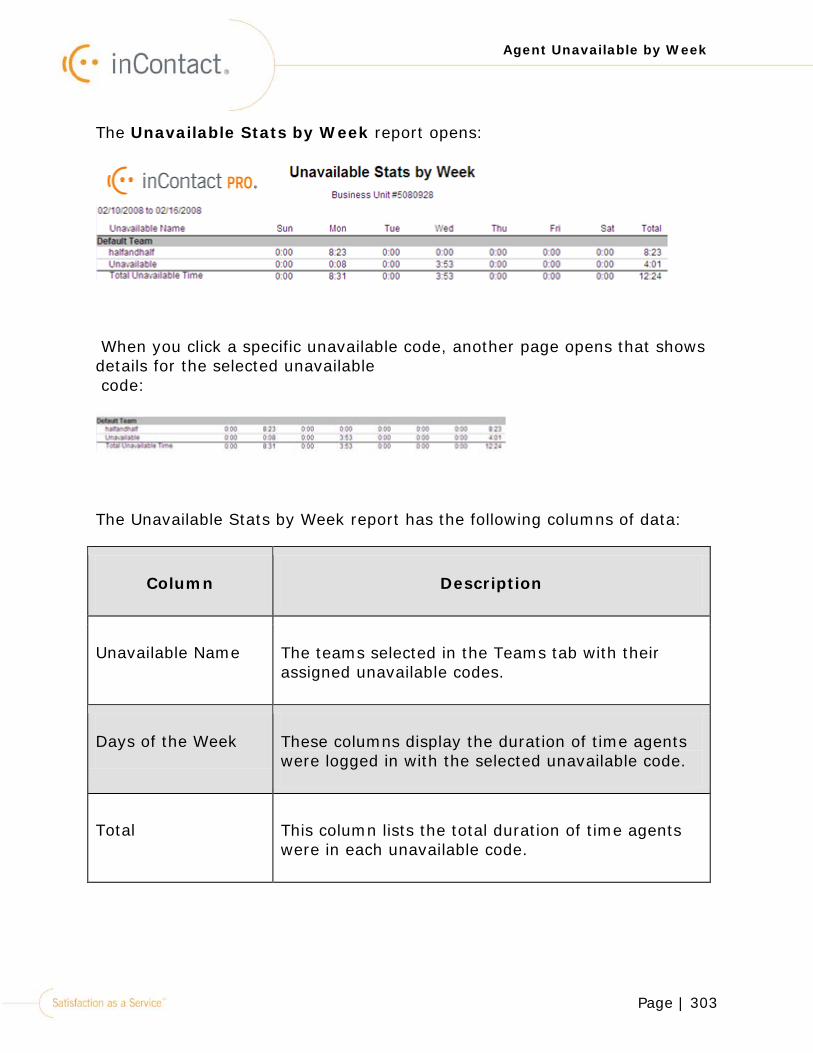
Page | 303
Agent Unavailable by Week
The Unavailable Stats by Week report opens:
When you click a specific unavailable code, another page opens that shows details for the selected unavailable code:
The Unavailable Stats by Week report has the following columns of data:
Column Description
Unavailable Name The teams selected in the Teams tab with their assigned unavailable codes.
Days of the Week These columns display the duration of time agents were logged in with the selected unavailable code.
Total This column lists the total duration of time agents were in each unavailable code.
Page | 304
Agent Unavailable Time
Agent Unavailable Time
The Agent Unavailable Time report shows the duration of time agents were in an “Unavailable” state, organized by the unavailable codes the agent selected. You can also view the total time an agent was unavailable during the selected date range. Unavailable Codes are created in webManager > Unavailable Codes.
This report can be generated for agents or teams, or both.
To Generate the Agent Unavailable Time Report:
1.Right-click the icon in the systems tray.
2.Click Custom Reporting > Agent Unavailable Time.
The Date Range screen opens:

Page | 305
Agent Unavailable Time
3.Select the Start date for the report.
4.Select the End date for the report.
5.Click the Next button.
The Teams tab opens:

Page | 306
Agent Unavailable Time
6.Click to move the selected team(s) from the Available teams box to
the Teams in this report box. Click to move all teams.
7. Click to move the selected team(s) from the Teams in this report box to the Available teams box. Click to move all teams.
8.Click the Next button.
The Agents tab opens:

Page | 307
Agent Unavailable Time
9.Click to move the selected agent(s) from the Available agents box
to the Agents in this report box. Click to move all agents.
10. Click to move the selected agents from the Agents in this report box to the Available agents box. Click to move all agents.
11.Click the Hide Inactive Agents check box to display the names of active agents only.
12.Click the Finish button to generate the report.
The Agent Unavailable Time report opens:

Page | 308
Agent Unavailable Time
When you click a specific agent, another page opens that shows details for the selected agent:
This page displays the same information that was displayed in the main report. When you want to view the main report, select Main Report from the drop down list.
The Agent Unavailable Time report has the following columns of data:
Column Description
Agent Name
Each agent that was selected in the Agents tab will be displayed in a row with the data that is specific to the unavailable code(s) they selected.
Unavailable Description
The unavailable codes the agent selected during the specified date range will be listed under each agent name.
Total Time The total duration of time the agent was in an unavailable state.
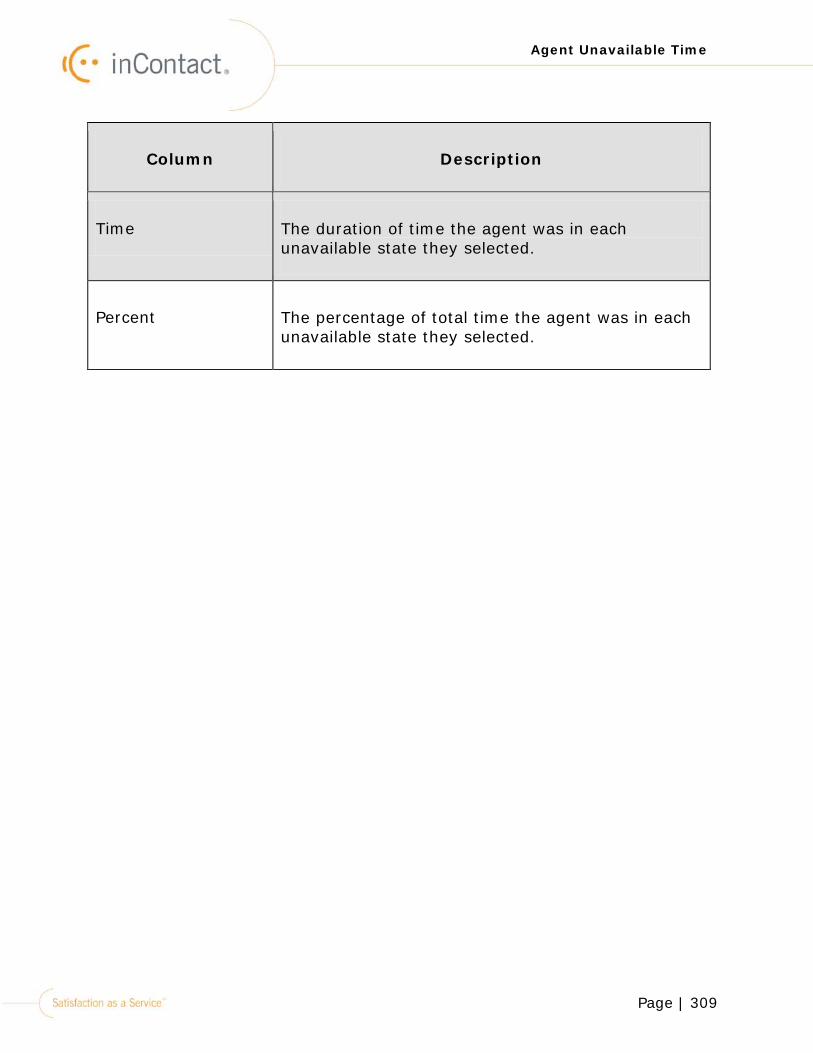
Page | 309
Agent Unavailable Time
Column Description
Time The duration of time the agent was in each unavailable state they selected.
Percent The percentage of total time the agent was in each unavailable state they selected.
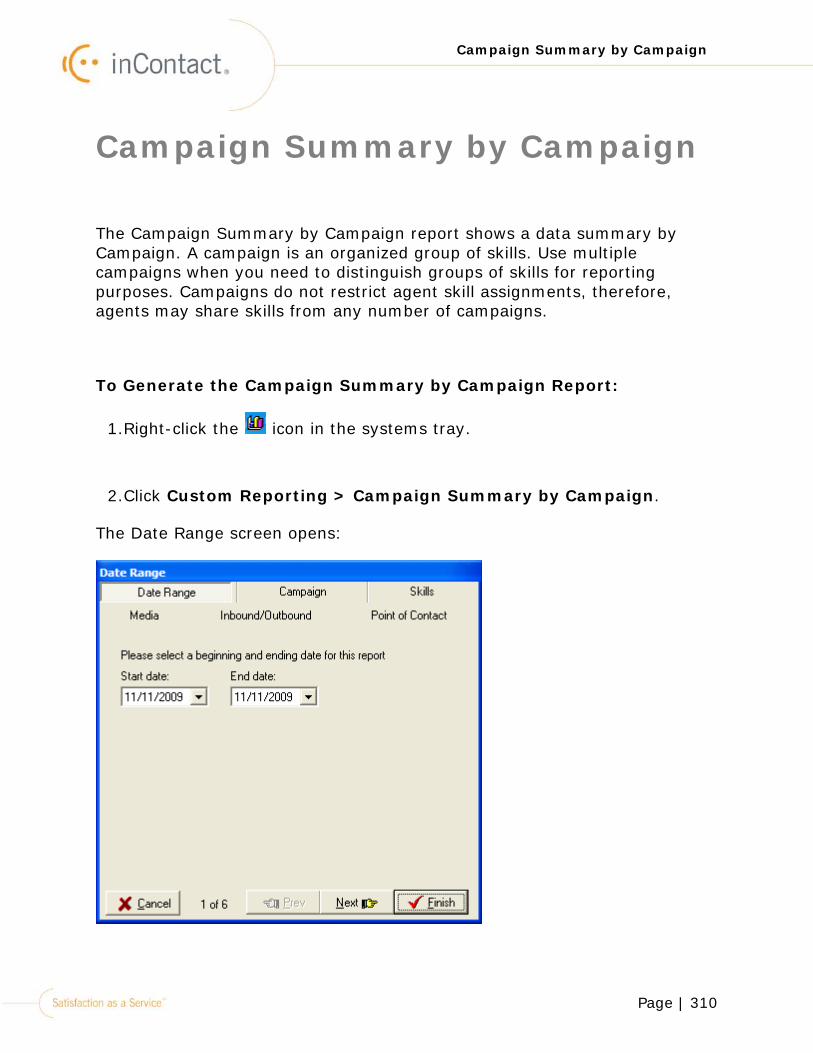
Page | 310
Campaign Summary by Campaign
Campaign Summary by Campaign
The Campaign Summary by Campaign report shows a data summary by Campaign. A campaign is an organized group of skills. Use multiple campaigns when you need to distinguish groups of skills for reporting purposes. Campaigns do not restrict agent skill assignments, therefore, agents may share skills from any number of campaigns.
To Generate the Campaign Summary by Campaign Report:
1.Right-click the icon in the systems tray.
2.Click Custom Reporting > Campaign Summary by Campaign.
The Date Range screen opens:
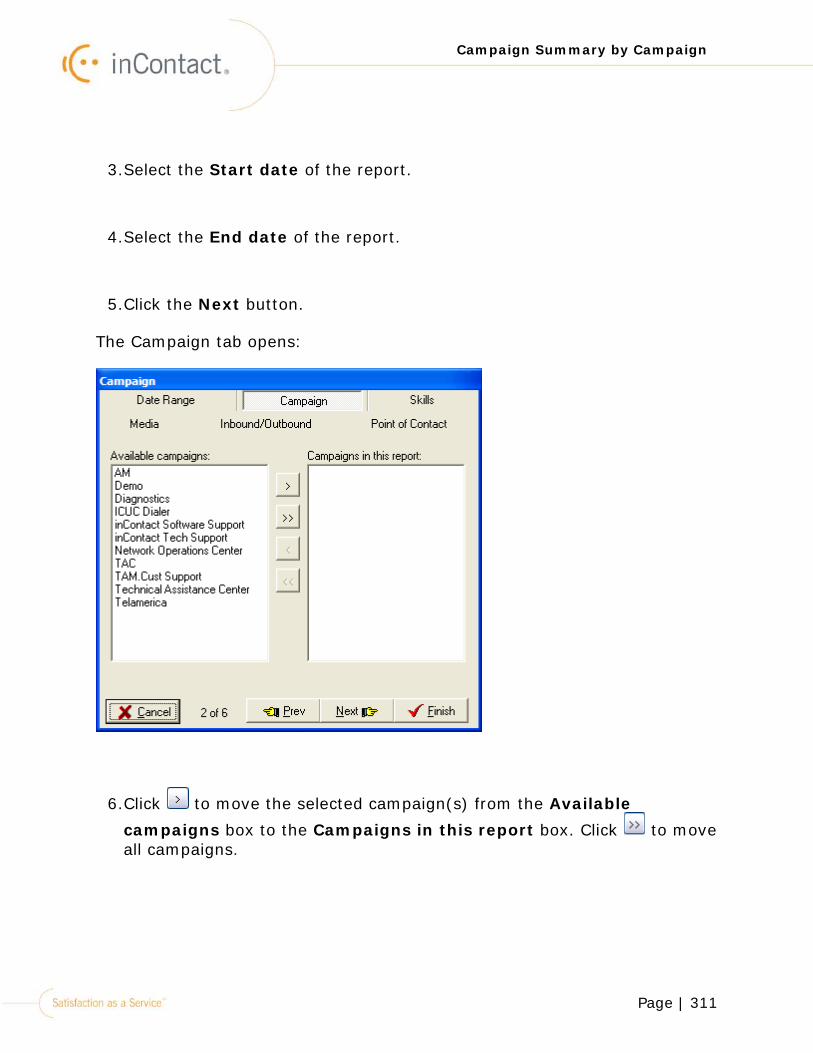
Page | 311
Campaign Summary by Campaign
3.Select the Start date of the report.
4.Select the End date of the report.
5.Click the Next button.
The Campaign tab opens:
6.Click to move the selected campaign(s) from the Available
campaigns box to the Campaigns in this report box. Click to move all campaigns.
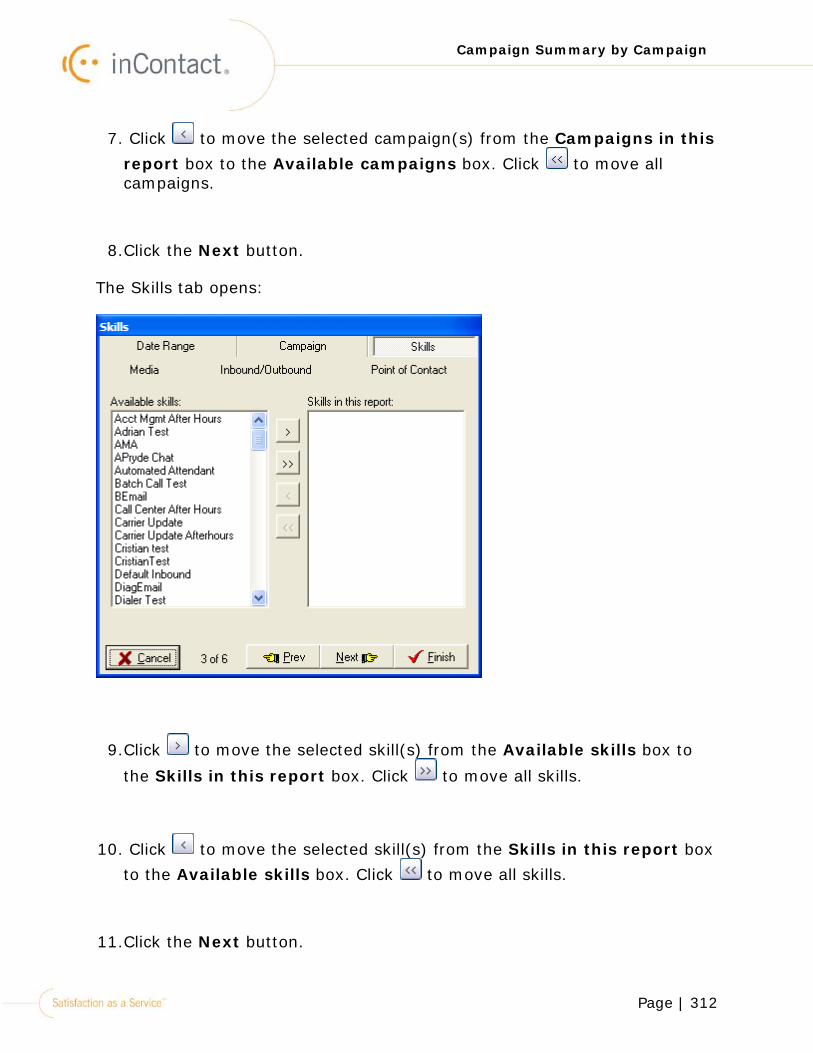
Page | 312
Campaign Summary by Campaign
7. Click to move the selected campaign(s) from the Campaigns in this report box to the Available campaigns box. Click to move all campaigns.
8.Click the Next button.
The Skills tab opens:
9.Click to move the selected skill(s) from the Available skills box to
the Skills in this report box. Click to move all skills.
10. Click to move the selected skill(s) from the Skills in this report box to the Available skills box. Click to move all skills.
11.Click the Next button.

Page | 313
Campaign Summary by Campaign
The Media tab opens:
12.Click to move the selected media from the Available media box to
the Media in this report box. Click to move all media.
13. Click to move the selected media from the Media in this report box to the Available media box. Click to move all media.
14.Click the Next button.
The Inbound/Outbound tab opens:
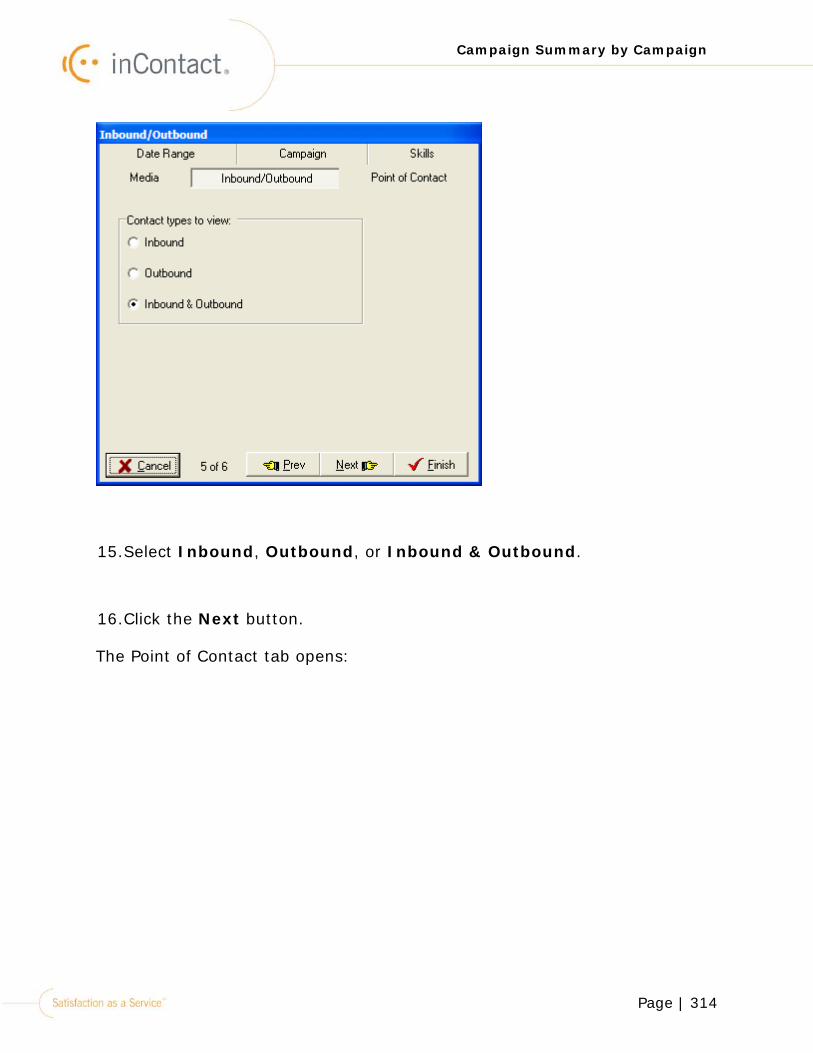
Page | 314
Campaign Summary by Campaign
15.Select Inbound, Outbound, or Inbound & Outbound.
16.Click the Next button.
The Point of Contact tab opens:
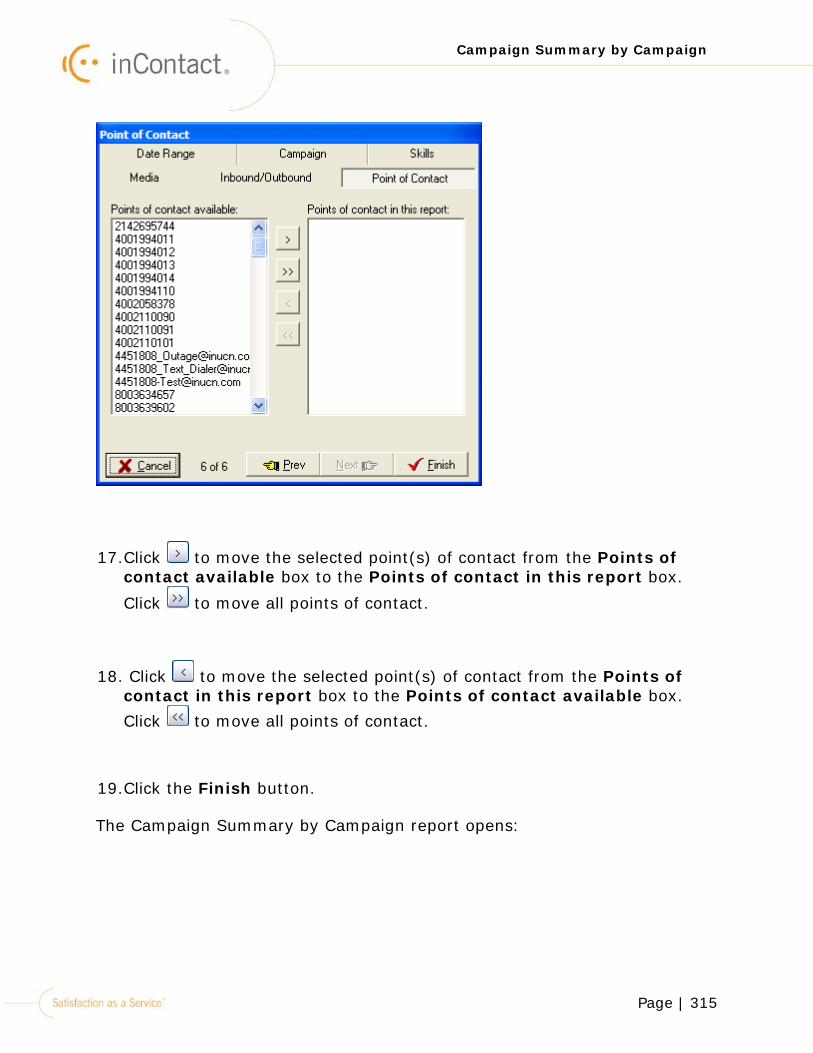
Page | 315
Campaign Summary by Campaign
17.Click to move the selected point(s) of contact from the Points of contact available box to the Points of contact in this report box.
Click to move all points of contact.
18. Click to move the selected point(s) of contact from the Points of contact in this report box to the Points of contact available box. Click to move all points of contact.
19.Click the Finish button.
The Campaign Summary by Campaign report opens:
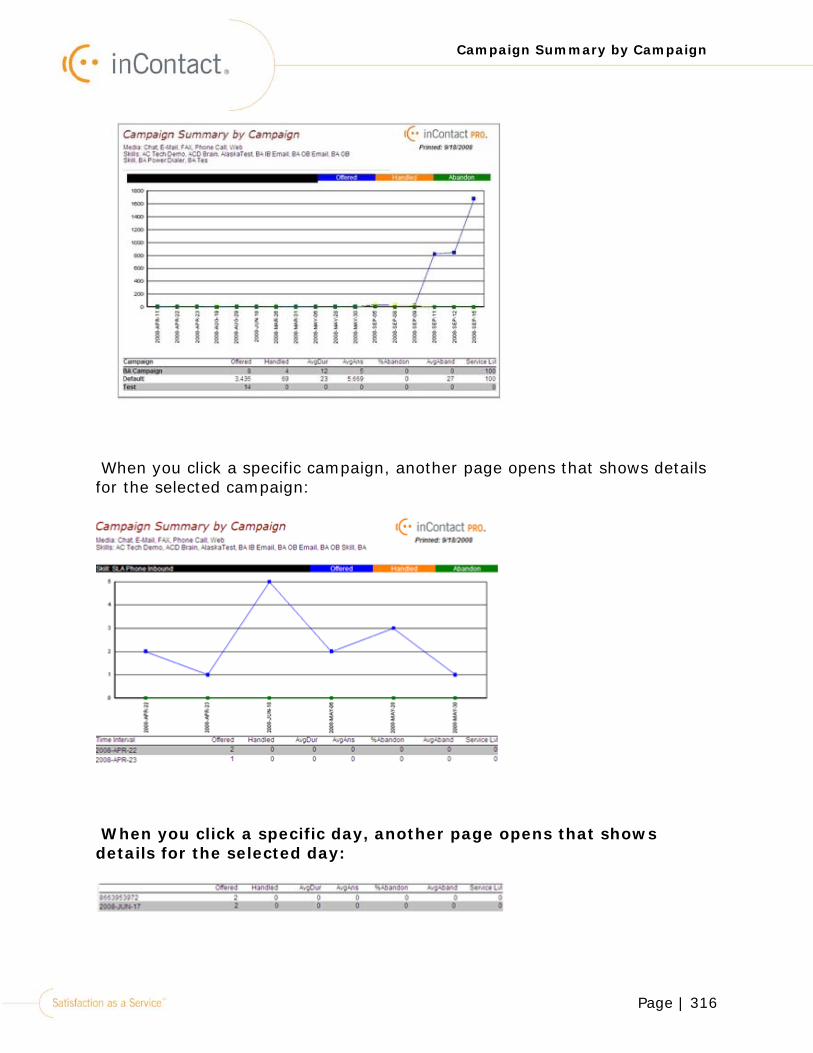
Page | 316
Campaign Summary by Campaign
When you click a specific campaign, another page opens that shows details for the selected campaign:
When you click a specific day, another page opens that shows details for the selected day:
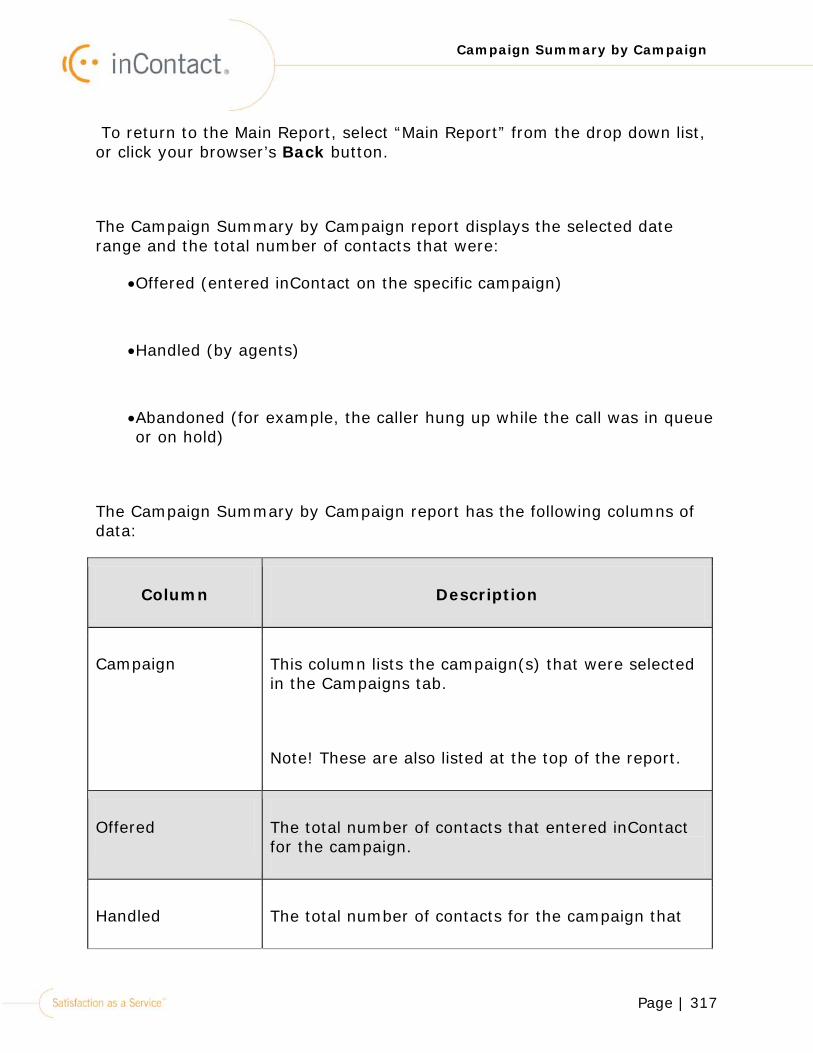
Page | 317
Campaign Summary by Campaign
To return to the Main Report, select “Main Report” from the drop down list, or click your browser’s Back button.
The Campaign Summary by Campaign report displays the selected date range and the total number of contacts that were:
•Offered (entered inContact on the specific campaign)
•Handled (by agents)
•Abandoned (for example, the caller hung up while the call was in queue or on hold)
The Campaign Summary by Campaign report has the following columns of data:
Column Description
Campaign This column lists the campaign(s) that were selected in the Campaigns tab.
Note! These are also listed at the top of the report.
Offered The total number of contacts that entered inContact for the campaign.
Handled The total number of contacts for the campaign that
Page | 318
Campaign Summary by Campaign
Column Description
were handled by agents.
Avg Dur The average duration of time (in seconds) for each active contact.
Avg Ans The average number of contacts for the campaign that were answered by agents.
%Abandon The percentage of answered calls that were abandoned. Abandoned contacts can be when a caller hangs up while their call is in queue or on hold. An abandoned contact can also happen when the contact is lost due to a bad network connection or a bad phone line.
AvgAband The average number of abandoned contacts for the campaign.
Service Lvl The percentage of the service level that was reached for the campaign. (The Service Level is configured in webManager > Skills.)
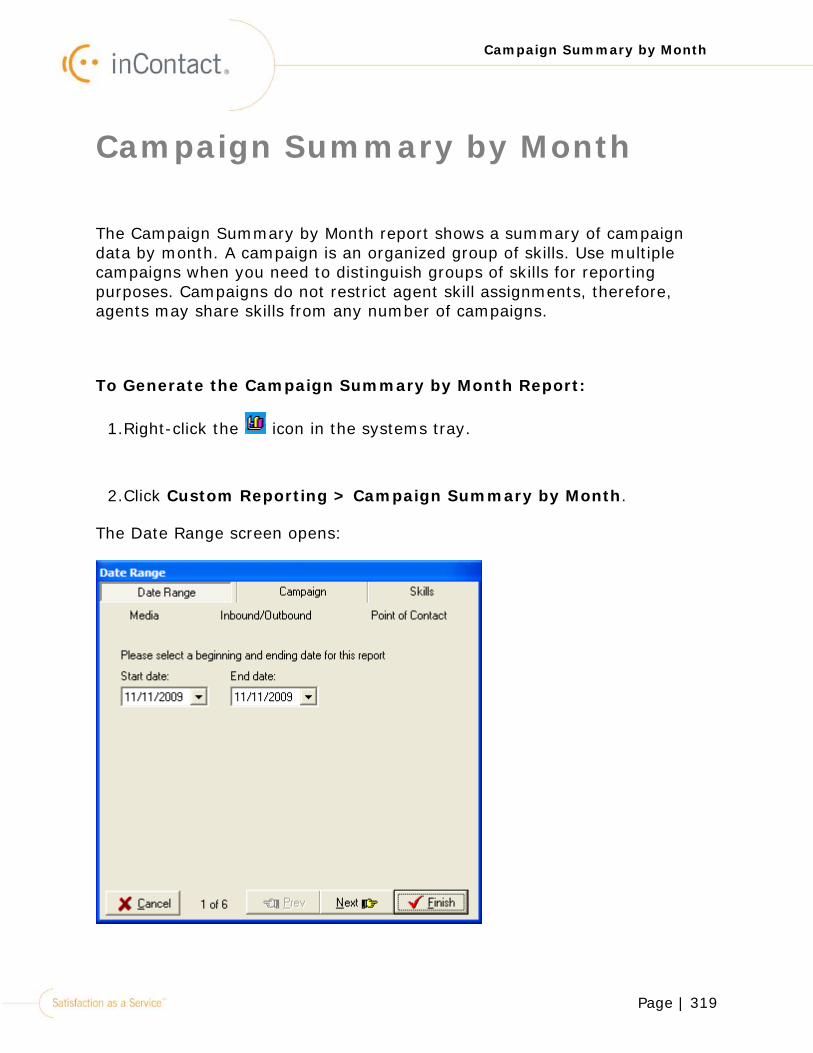
Page | 319
Campaign Summary by Month
Campaign Summary by Month
The Campaign Summary by Month report shows a summary of campaign data by month. A campaign is an organized group of skills. Use multiple campaigns when you need to distinguish groups of skills for reporting purposes. Campaigns do not restrict agent skill assignments, therefore, agents may share skills from any number of campaigns.
To Generate the Campaign Summary by Month Report:
1.Right-click the icon in the systems tray.
2.Click Custom Reporting > Campaign Summary by Month.
The Date Range screen opens:

Page | 320
Campaign Summary by Month
3.Select the Start date of the report.
4.Select the End date of the report.
5.Click the Next button.
The Campaign tab opens:
6.Click to move the selected campaign(s) from the Available
campaigns box to the Campaigns in this report box. Click to move all campaigns.

Page | 321
Campaign Summary by Month
7. Click to move the selected campaign(s) from the Campaigns in this report box to the Available campaigns box. Click to move all campaigns.
8.Click the Next button.
The Skills tab opens:
9.Click to move the selected skill(s) from the Available skills box to
the Skills in this report box. Click to move all skills.
10. Click to move the selected skill(s) from the Skills in this report box to the Available skills box. Click to move all skills.
11.Click the Next button.
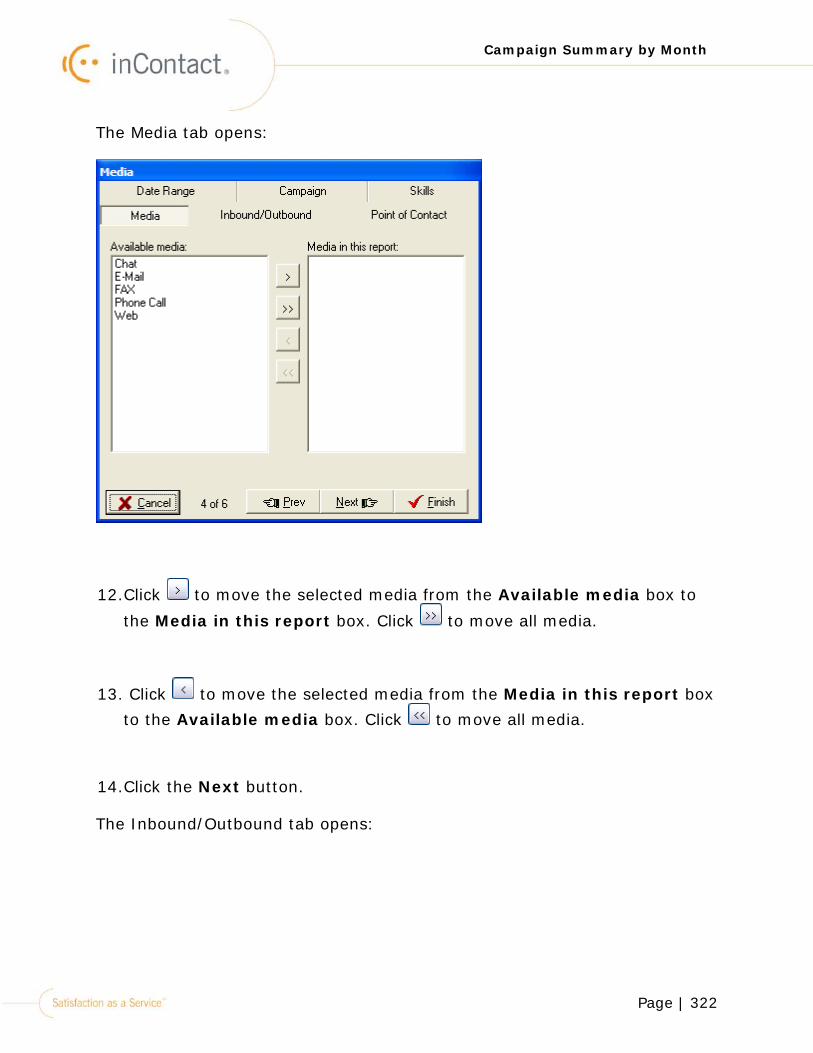
Page | 322
Campaign Summary by Month
The Media tab opens:
12.Click to move the selected media from the Available media box to
the Media in this report box. Click to move all media.
13. Click to move the selected media from the Media in this report box to the Available media box. Click to move all media.
14.Click the Next button.
The Inbound/Outbound tab opens:

Page | 323
Campaign Summary by Month
15.Select Inbound, Outbound, or Inbound & Outbound.
16.Click the Next button.
The Point of Contact tab opens:

Page | 324
Campaign Summary by Month
17.Click to move the selected point(s) of contact from the Points of contact available box to the Points of contact in this report box.
Click to move all points of contact.
18. Click to move the selected point(s) of contact from the Points of contact in this report box to the Points of contact available box. Click to move all points of contact.
19.Click the Finish button.
The Campaign Summary by Month report opens:
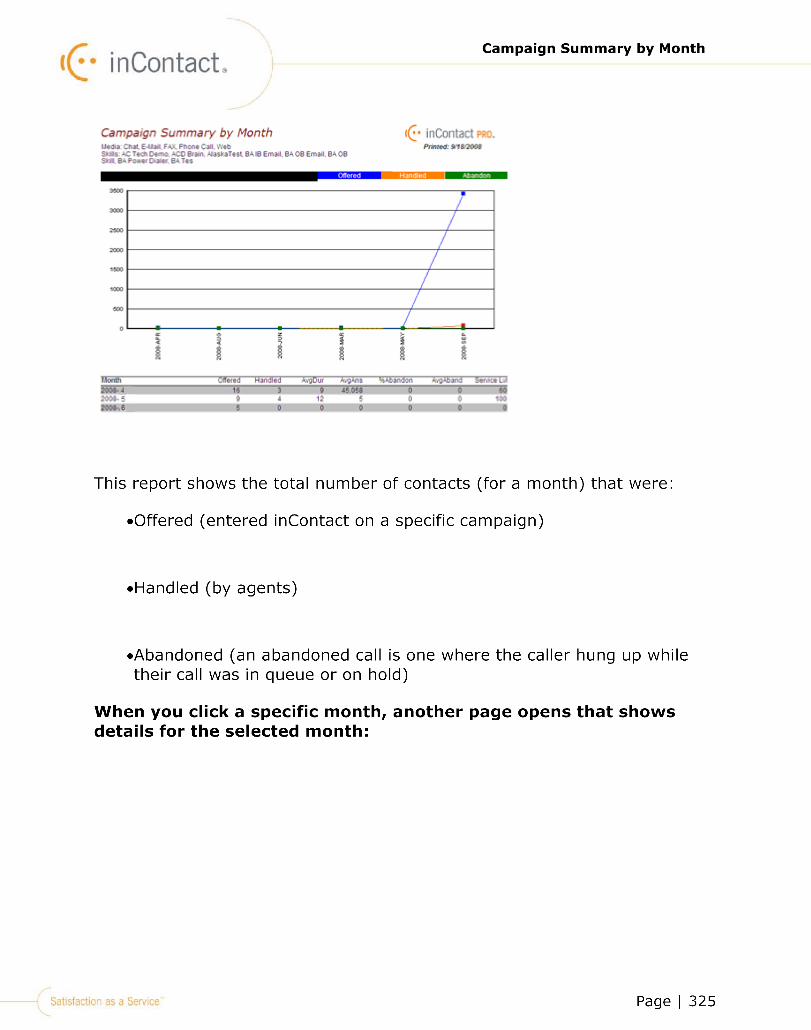

Page | 326
Campaign Summary by Month
When you click a specific day, another page opens that shows details for the selected day:
To go back to the main report, select Main Report from the drop down list or you can click your browser’s Back button.
The Campaign Summary by Month report has the following columns of data:
Column Description
Month This column lists the month(s) and year(s) within the selected date range.

Page | 327
Campaign Summary by Month
Column Description
Offered The total number of contacts that entered inContact for the campaign.
Handled The total number of contacts that were handled by agents for the campaign.
AvgDur The average duration of time (in seconds) for each contact in the campaign.
AvgAns The average number of contacts that were answered by agents in the campaign.
%Abandon The percentage of contacts that entered inContact for the campaign during the specified month that were abandoned. An abandoned contact can be when a caller hangs up their call while it is in queue or on hold. An abandoned contact can also be when a contact is lost due to a bad network connection or a bad phone line.
AvgAband The average number of abandoned contacts for this campaign.
Service Lvl The percentage of the service level that was reached for the campaign. (The Service Level is configured in webManager > Skills).
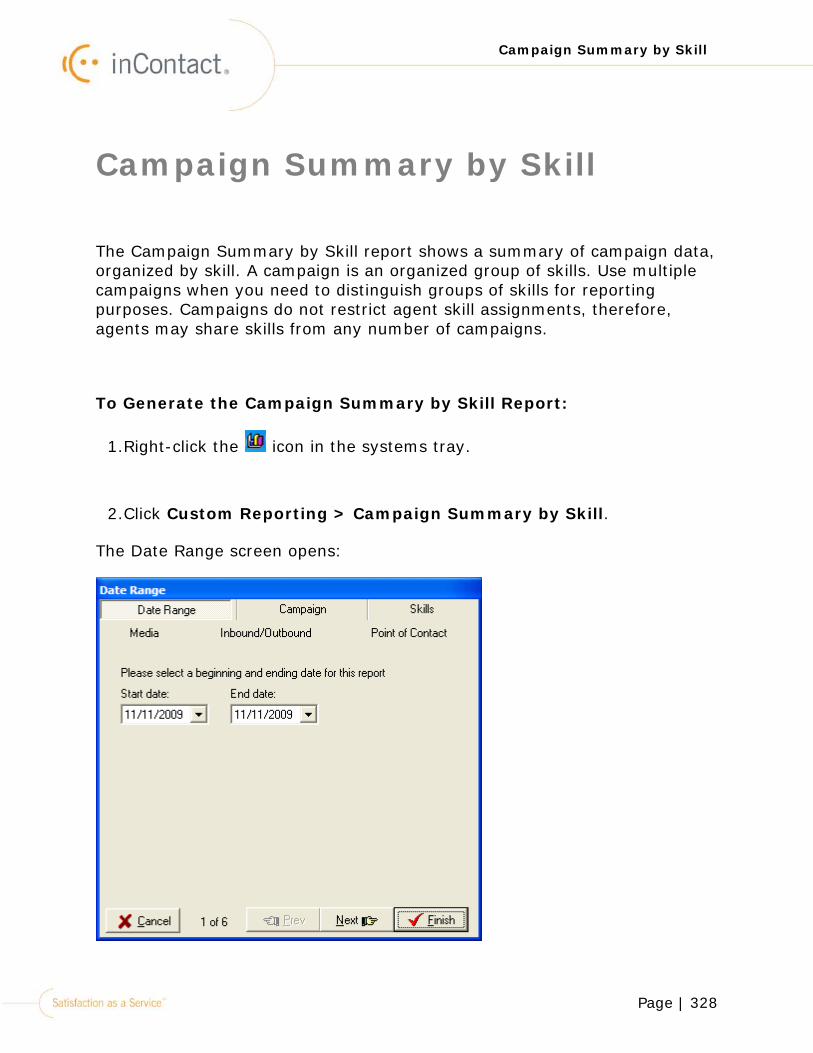
Page | 328
Campaign Summary by Skill
Campaign Summary by Skill
The Campaign Summary by Skill report shows a summary of campaign data, organized by skill. A campaign is an organized group of skills. Use multiple campaigns when you need to distinguish groups of skills for reporting purposes. Campaigns do not restrict agent skill assignments, therefore, agents may share skills from any number of campaigns.
To Generate the Campaign Summary by Skill Report:
1.Right-click the icon in the systems tray.
2.Click Custom Reporting > Campaign Summary by Skill.
The Date Range screen opens:
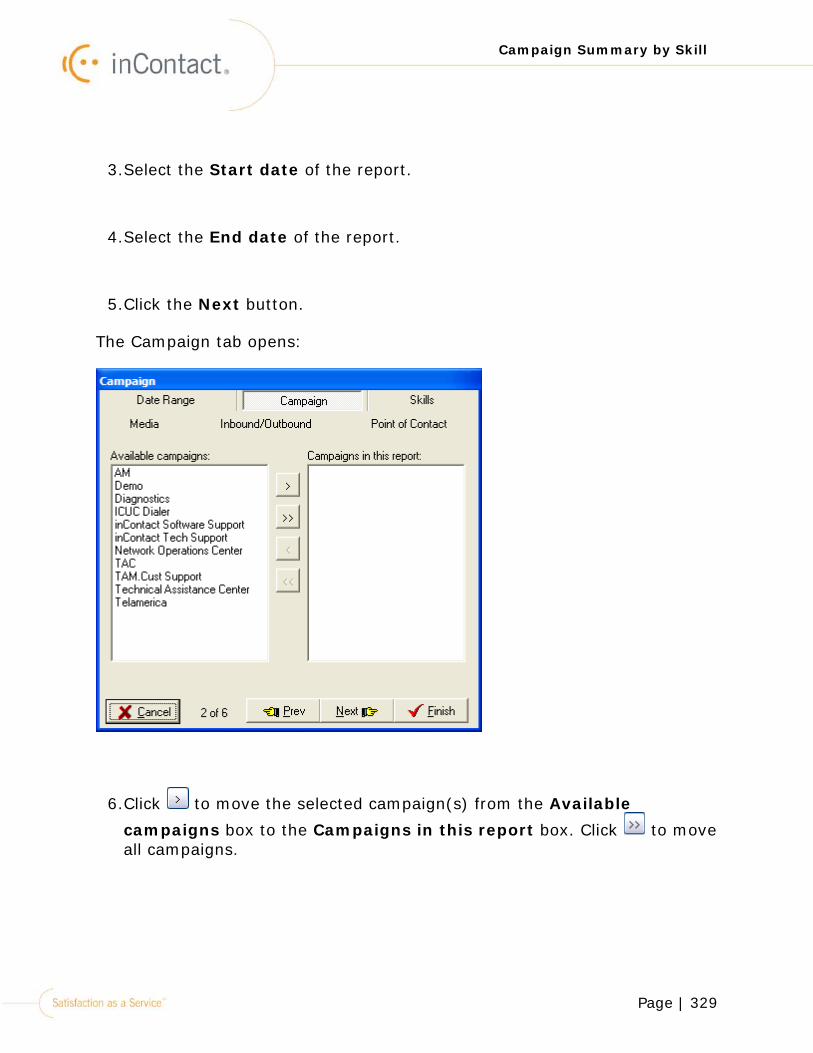
Page | 329
Campaign Summary by Skill
3.Select the Start date of the report.
4.Select the End date of the report.
5.Click the Next button.
The Campaign tab opens:
6.Click to move the selected campaign(s) from the Available
campaigns box to the Campaigns in this report box. Click to move all campaigns.
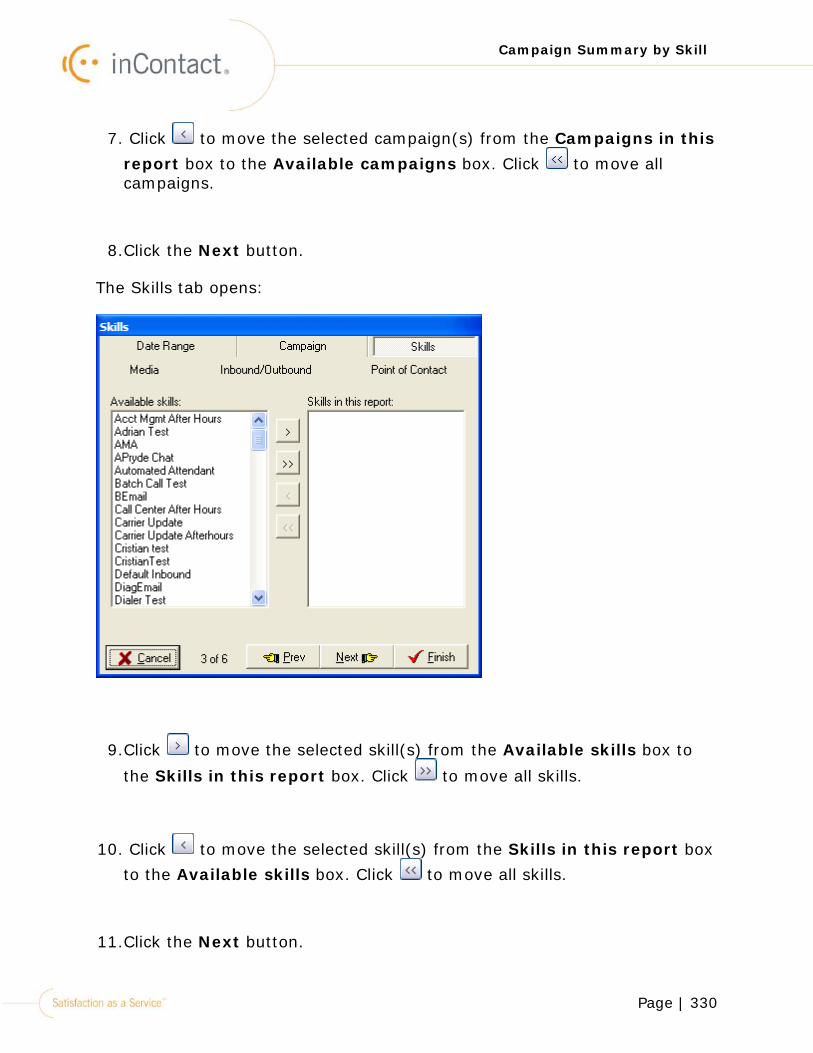
Page | 330
Campaign Summary by Skill
7. Click to move the selected campaign(s) from the Campaigns in this report box to the Available campaigns box. Click to move all campaigns.
8.Click the Next button.
The Skills tab opens:
9.Click to move the selected skill(s) from the Available skills box to
the Skills in this report box. Click to move all skills.
10. Click to move the selected skill(s) from the Skills in this report box to the Available skills box. Click to move all skills.
11.Click the Next button.
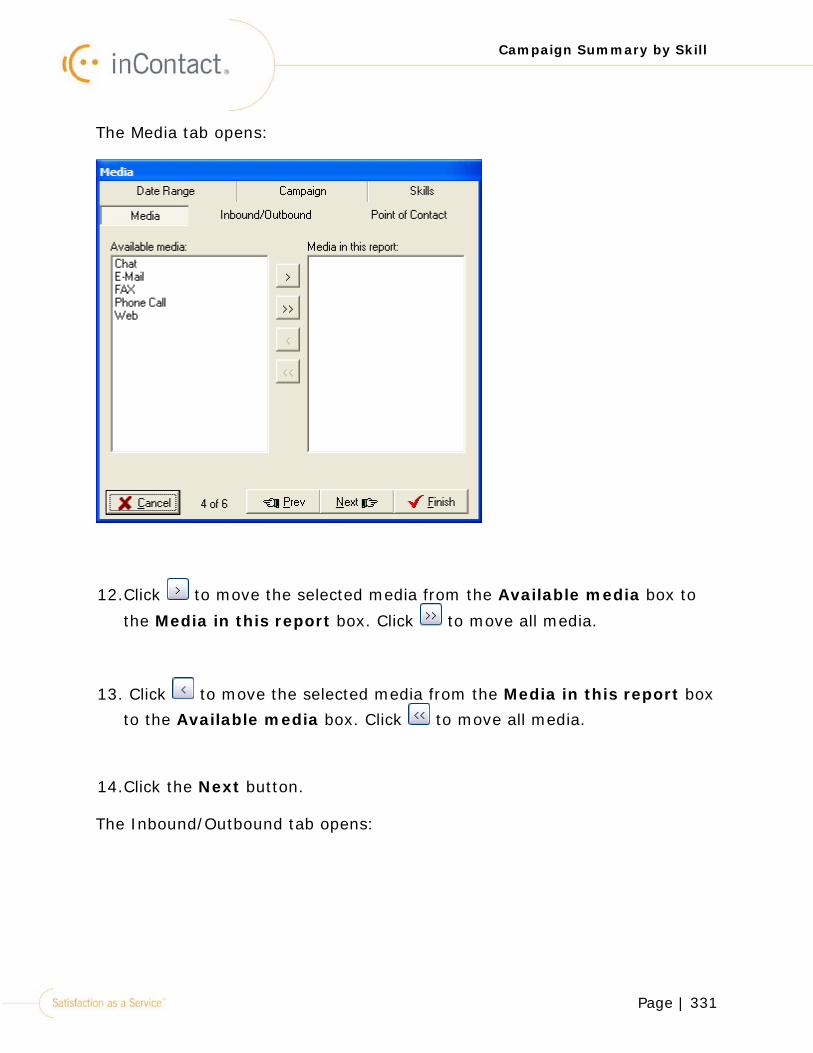
Page | 331
Campaign Summary by Skill
The Media tab opens:
12.Click to move the selected media from the Available media box to
the Media in this report box. Click to move all media.
13. Click to move the selected media from the Media in this report box to the Available media box. Click to move all media.
14.Click the Next button.
The Inbound/Outbound tab opens:

Page | 332
Campaign Summary by Skill
15.Select Inbound, Outbound, or Inbound & Outbound.
16.Click the Next button.
The Point of Contact tab opens:

Page | 333
Campaign Summary by Skill
17.Click to move the selected point(s) of contact from the Points of contact available box to the Points of contact in this report box.
Click to move all points of contact.
18. Click to move the selected point(s) of contact from the Points of contact in this report box to the Points of contact available box. Click to move all points of contact.
19.Click the Finish button.
The Campaign Summary by Month report opens:
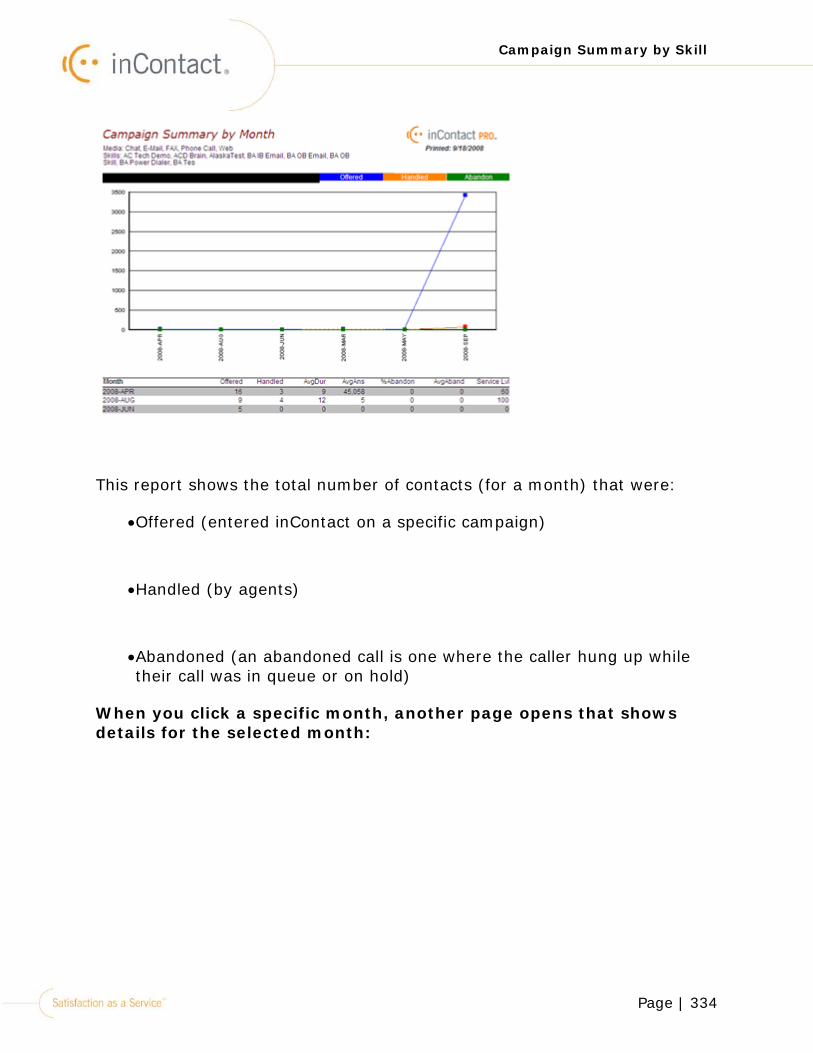
Page | 334
Campaign Summary by Skill
This report shows the total number of contacts (for a month) that were:
•Offered (entered inContact on a specific campaign)
•Handled (by agents)
•Abandoned (an abandoned call is one where the caller hung up while their call was in queue or on hold)
When you click a specific month, another page opens that shows details for the selected month:
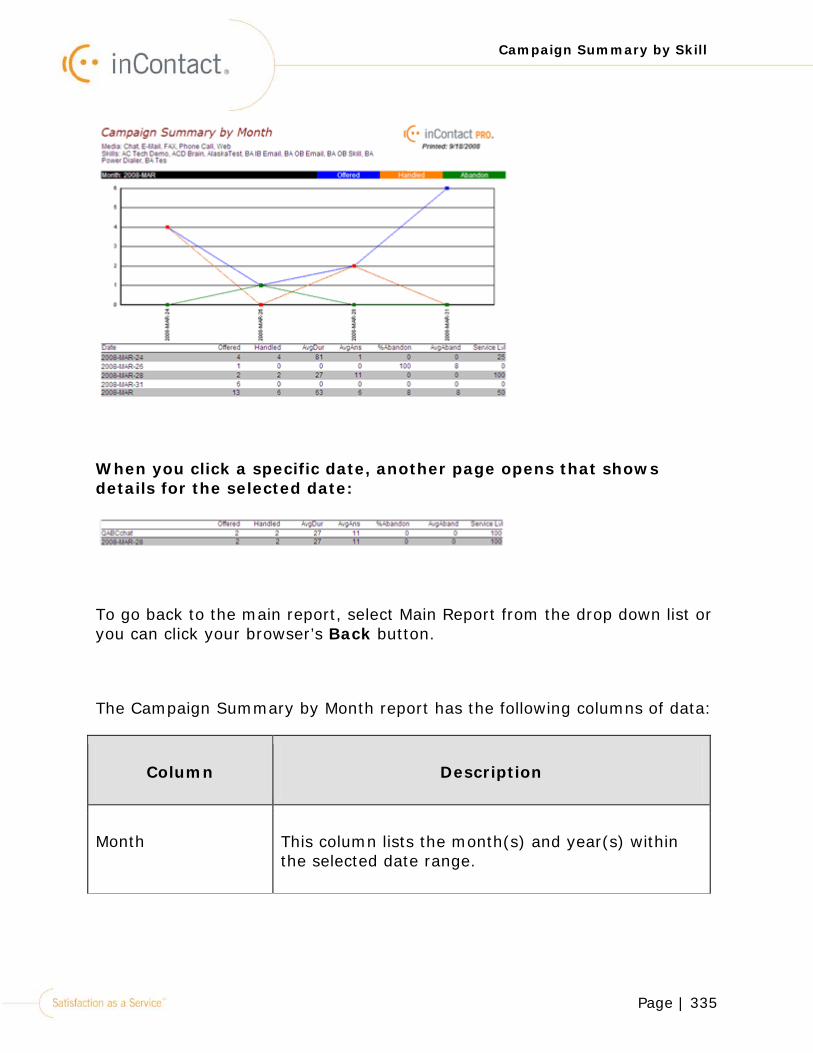
Page | 335
Campaign Summary by Skill
When you click a specific date, another page opens that shows details for the selected date:
To go back to the main report, select Main Report from the drop down list or you can click your browser’s Back button.
The Campaign Summary by Month report has the following columns of data:
Column Description
Month This column lists the month(s) and year(s) within the selected date range.
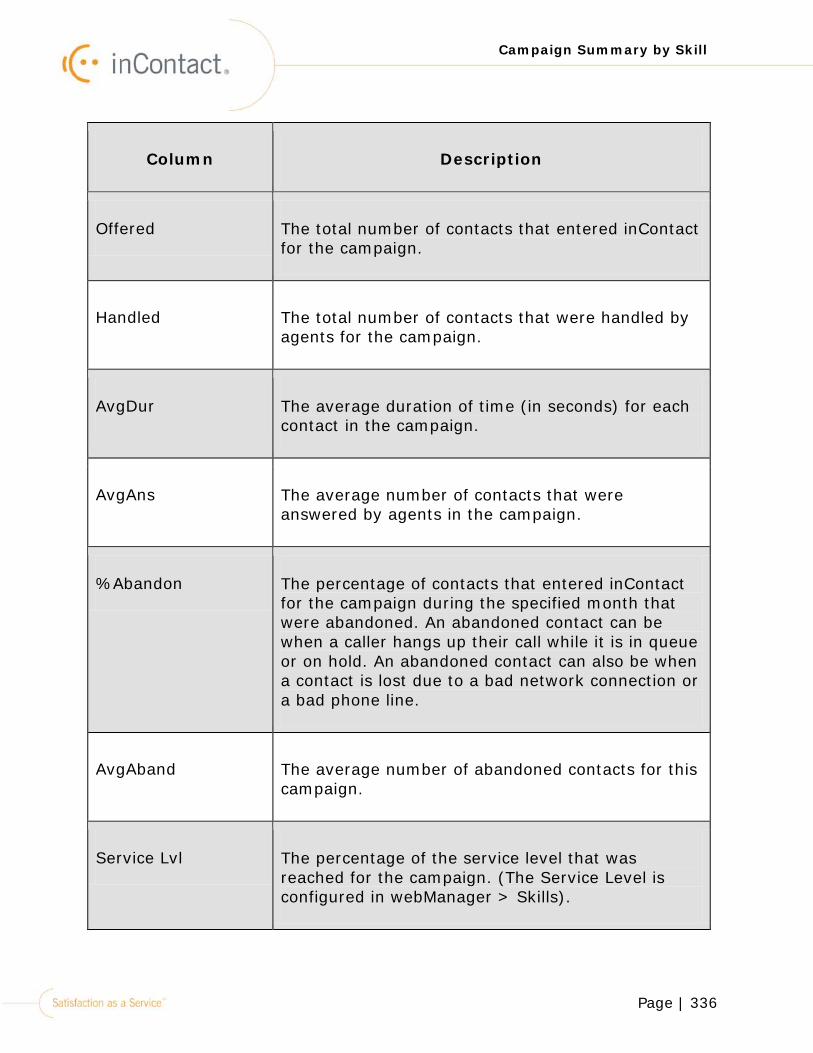
Page | 336
Campaign Summary by Skill
Column Description
Offered The total number of contacts that entered inContact for the campaign.
Handled The total number of contacts that were handled by agents for the campaign.
AvgDur The average duration of time (in seconds) for each contact in the campaign.
AvgAns The average number of contacts that were answered by agents in the campaign.
%Abandon The percentage of contacts that entered inContact for the campaign during the specified month that were abandoned. An abandoned contact can be when a caller hangs up their call while it is in queue or on hold. An abandoned contact can also be when a contact is lost due to a bad network connection or a bad phone line.
AvgAband The average number of abandoned contacts for this campaign.
Service Lvl The percentage of the service level that was reached for the campaign. (The Service Level is configured in webManager > Skills).
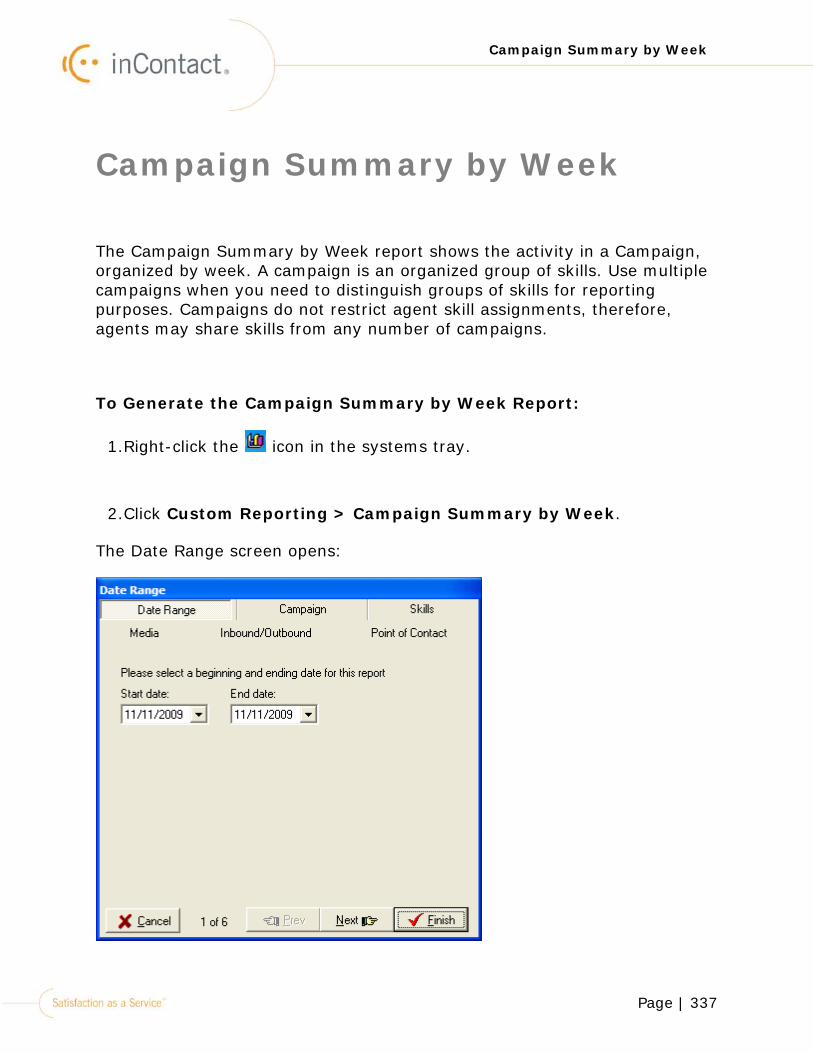
Page | 337
Campaign Summary by Week
Campaign Summary by Week
The Campaign Summary by Week report shows the activity in a Campaign, organized by week. A campaign is an organized group of skills. Use multiple campaigns when you need to distinguish groups of skills for reporting purposes. Campaigns do not restrict agent skill assignments, therefore, agents may share skills from any number of campaigns.
To Generate the Campaign Summary by Week Report:
1.Right-click the icon in the systems tray.
2.Click Custom Reporting > Campaign Summary by Week.
The Date Range screen opens:

Page | 338
Campaign Summary by Week
3.Select the Start date of the report.
4.Select the End date of the report.
5.Click the Next button.
The Campaign tab opens:
6.Click to move the selected campaign(s) from the Available
campaigns box to the Campaigns in this report box. Click to move all campaigns.

Page | 339
Campaign Summary by Week
7. Click to move the selected campaign(s) from the Campaigns in this report box to the Available campaigns box. Click to move all campaigns.
8.Click the Next button.
The Skills tab opens:
9.Click to move the selected skill(s) from the Available skills box to
the Skills in this report box. Click to move all skills.
10. Click to move the selected skill(s) from the Skills in this report box to the Available skills box. Click to move all skills.
11.Click the Next button.
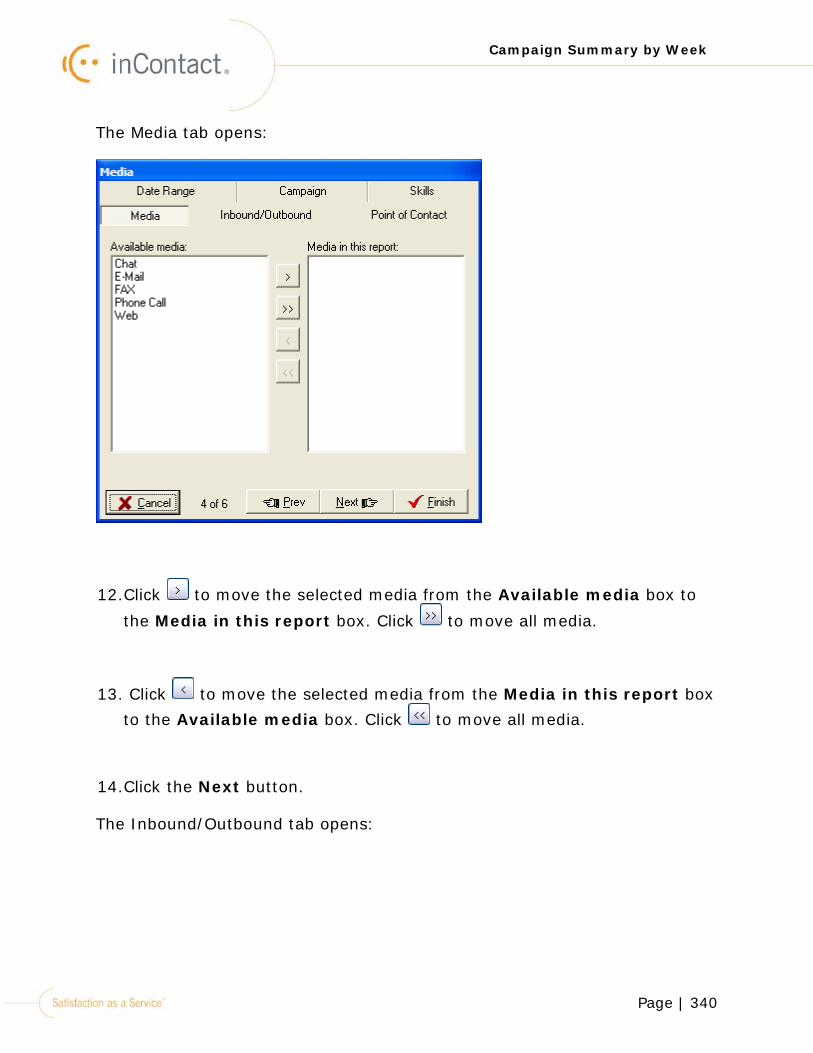
Page | 340
Campaign Summary by Week
The Media tab opens:
12.Click to move the selected media from the Available media box to
the Media in this report box. Click to move all media.
13. Click to move the selected media from the Media in this report box to the Available media box. Click to move all media.
14.Click the Next button.
The Inbound/Outbound tab opens:

Page | 341
Campaign Summary by Week
15.Select Inbound, Outbound, or Inbound & Outbound.
16.Click the Next button.
The Point of Contact tab opens:

Page | 342
Campaign Summary by Week
17.Click to move the selected point(s) of contact from the Points of contact available box to the Points of contact in this report box.
Click to move all points of contact.
18. Click to move the selected point(s) of contact from the Points of contact in this report box to the Points of contact available box. Click to move all points of contact.
19.Click the Finish button.
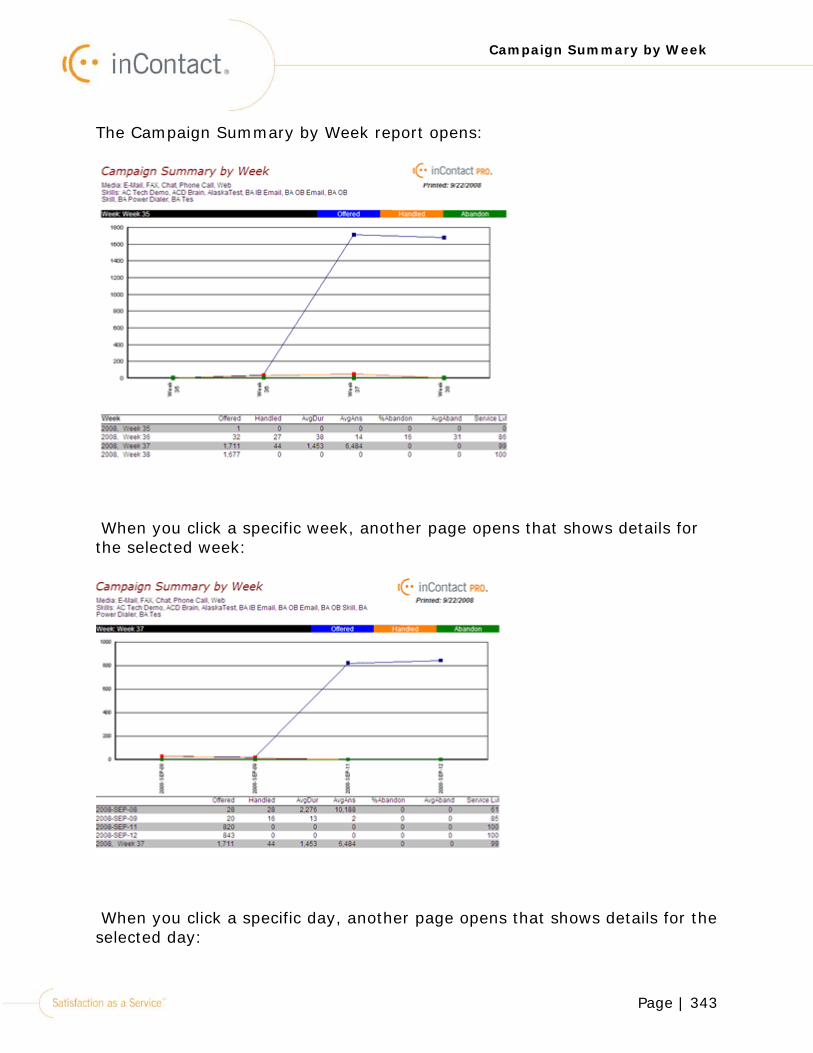
Page | 343
Campaign Summary by Week
The Campaign Summary by Week report opens:
When you click a specific week, another page opens that shows details for the selected week:
When you click a specific day, another page opens that shows details for the selected day:
Page | 344
Campaign Summary by Week
To return to the Campaign Summary by Week report, select “Main Report” from the drop down list and the main report will be opened.
The Campaign Summary by Week report has the following columns of data:
Column Description
Week The weeks that are within the date range that was selected in the Date Range tab.
Offered The number of contacts associated with the selected campaigns that entered inContact.
Handled The number of contacts associated with the selected campaigns that were handled by agents.
AvgDur The average duration of time (in seconds) for each contact that entered the network on the campaigns selected in the Campaign tab.
AvgAns The average number of contacts that entered inContact on the selected campaign that were answered by agents.

Page | 345
Campaign Summary by Week
Column Description
%Abandon The percentage of answered contacts that were abandoned. Abandoned contacts can also be contacts that were dropped due to a bad network connection or a bad phone line.
AvgAband The average number of contacts associated with the selected campaigns that were abandoned during the specified week.
Service Lvl The service level percentage that was reached for the campaigns during the specified week. The Service Level is configured in webManager > Skills.
Page | 346
Contact Statistics
Contact Statistics
The Contact Statistics report generates data for contacts based on two criteria, group and time interval. The two criteria may be selected from the following lists:
Group the data by:
•Campaign
•Skill
•Point of Contact
Time interval:
•Month
•Day
•Hour
•Half hour
To Generate the Contact Statistics By Campaign And Month Report:
Page | 347
Contact Statistics
1.Right-click the icon in the Windows systems tray.
2.Click Custom Reporting > Contact Statistics.
The Date Range screen opens:
3.Select the Start date for the report.
4.Select the End date for the report.
5.Click the Next button.
The Campaigns tab opens:
Page | 348
Contact Statistics
6.Click to move the selected team(s) from the Available campaigns
box to the Campaigns in this report box. Click to move all campaigns.
7. Click to move the selected team(s) from the Campaigns in this report box to the Campaign teams box. Click to move all campaigns.
8.Click the Next button.
The Skills tab opens:
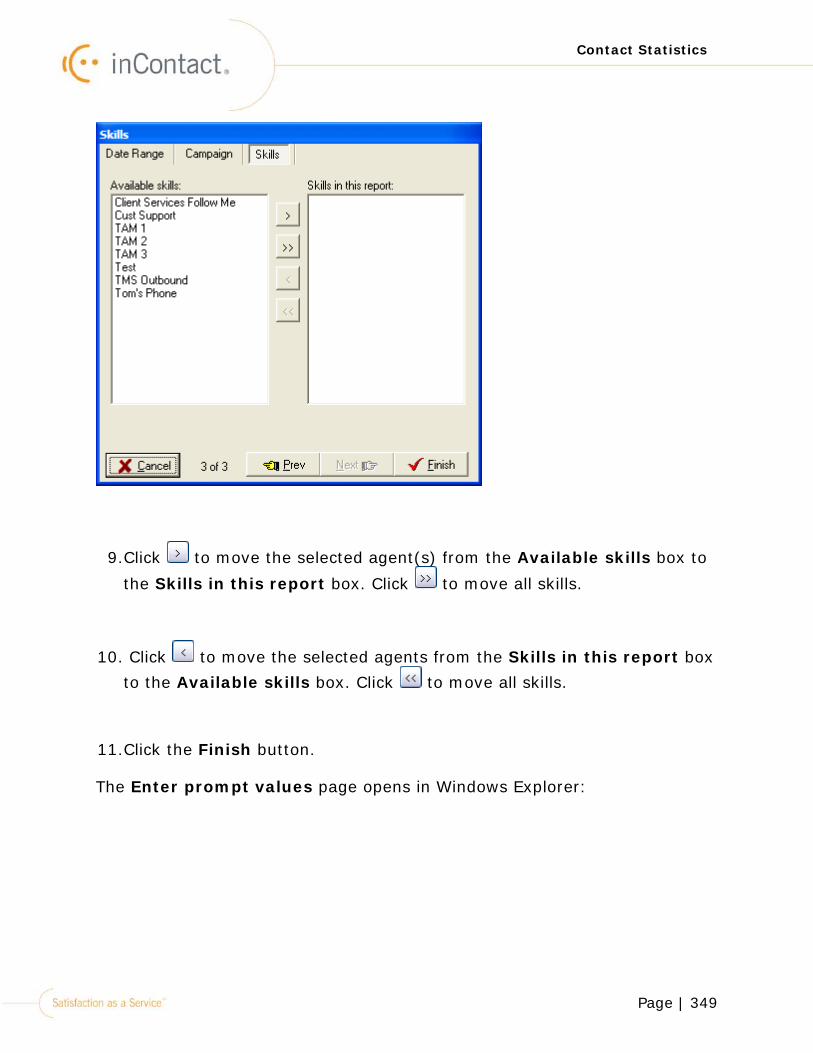
Page | 349
Contact Statistics
9.Click to move the selected agent(s) from the Available skills box to
the Skills in this report box. Click to move all skills.
10. Click to move the selected agents from the Skills in this report box to the Available skills box. Click to move all skills.
11.Click the Finish button.
The Enter prompt values page opens in Windows Explorer:
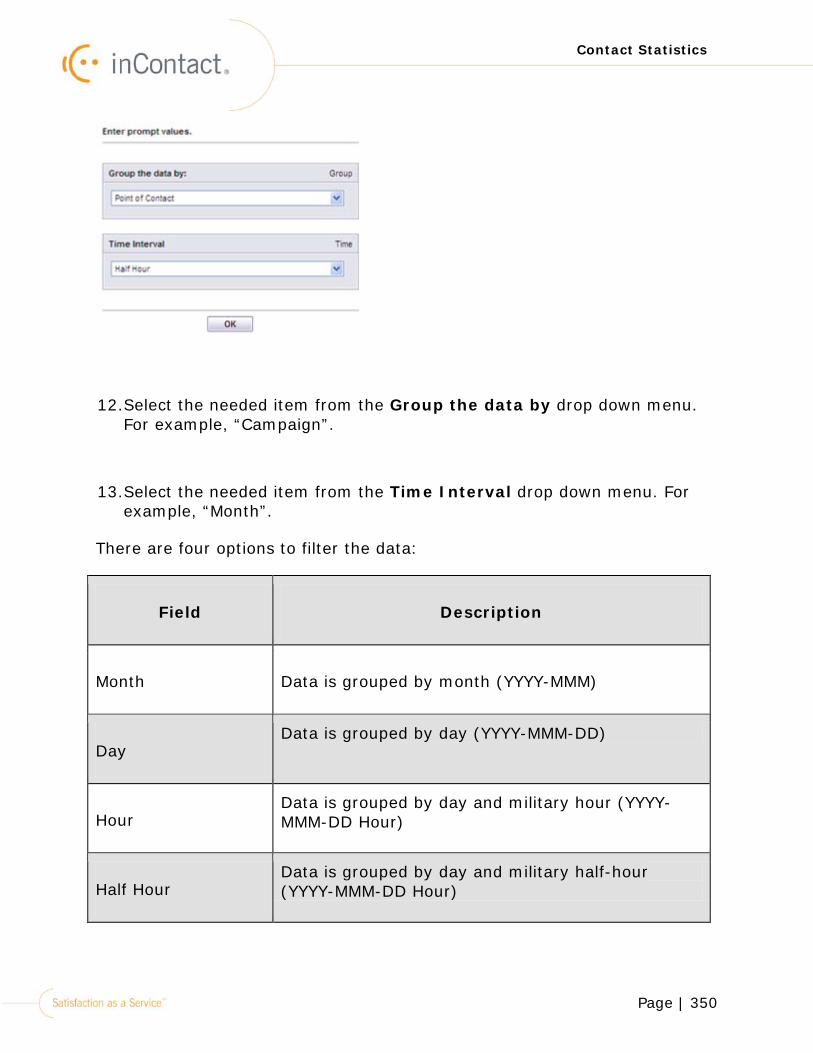
Page | 350
Contact Statistics
12.Select the needed item from the Group the data by drop down menu. For example, “Campaign”.
13.Select the needed item from the Time Interval drop down menu. For example, “Month”.
There are four options to filter the data:
Field Description
Month Data is grouped by month (YYYY-MMM)
Day Data is grouped by day (YYYY-MMM-DD)
Hour Data is grouped by day and military hour (YYYY-MMM-DD Hour)
Half Hour Data is grouped by day and military half-hour (YYYY-MMM-DD Hour)
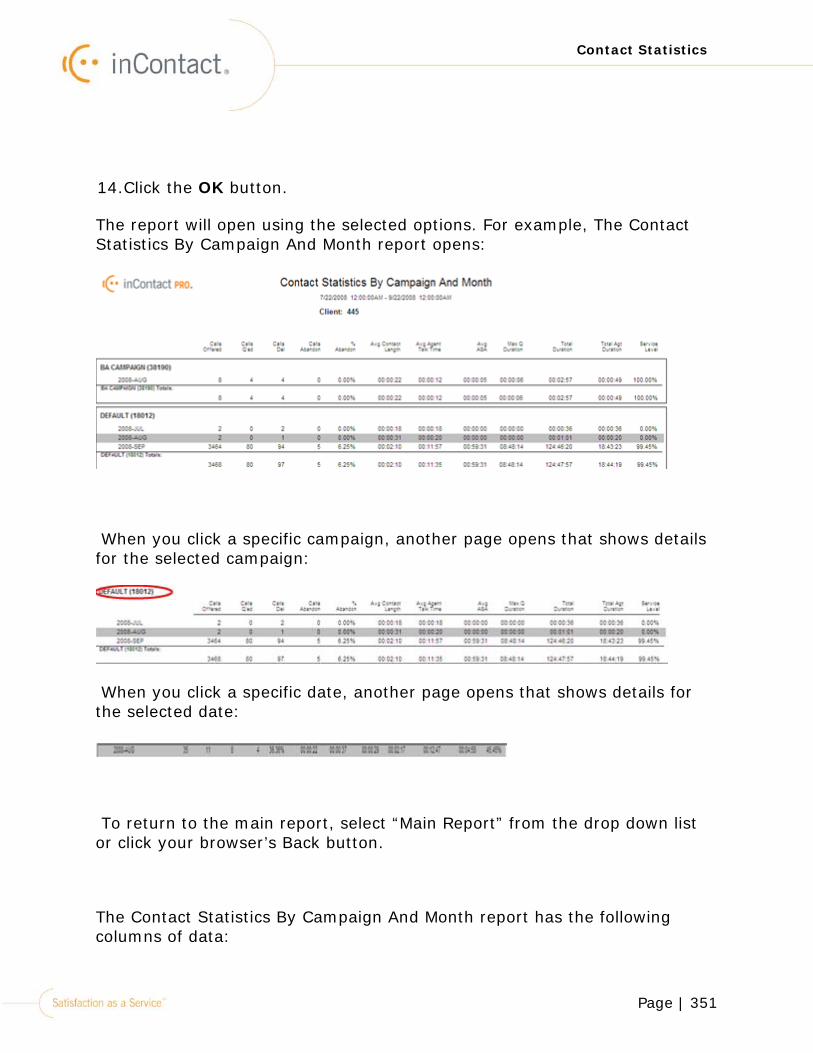
Page | 351
Contact Statistics
14.Click the OK button.
The report will open using the selected options. For example, The Contact Statistics By Campaign And Month report opens:
When you click a specific campaign, another page opens that shows details for the selected campaign:
When you click a specific date, another page opens that shows details for the selected date:
To return to the main report, select “Main Report” from the drop down list or click your browser’s Back button.
The Contact Statistics By Campaign And Month report has the following columns of data:
Page | 352
Contact Statistics
Column Description
(No Heading) The criteria selected displays. For more details see the individual reports listed below.
Calls Offered The number of calls that entered inContact for the campaign.
Calls Q’ed The number of calls associated with the campaign that were placed in queue.
Calls Del The number of calls that were delivered to an agent for the campaign.
Calls Abandon The number of calls associated with the campaign that were abandoned. Abandoned
contacts can be contacts that were dropped due to a bad network connection or a bad phone line.
% Abandon The percentage of total calls associated with the campaign that were abandoned.
Avg Contact Length The average duration of time for each contact during a month interval.
Avg Agent Talk Time The average duration of time the agent handled
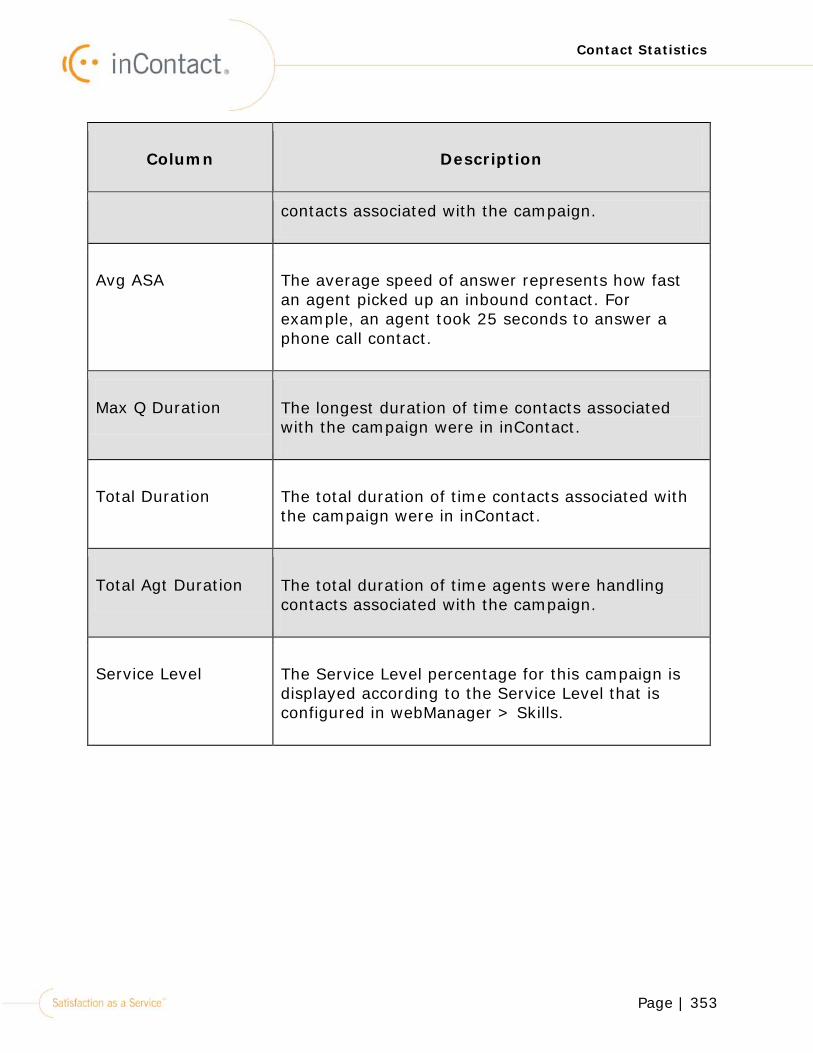
Page | 353
Contact Statistics
Column Description
contacts associated with the campaign.
Avg ASA The average speed of answer represents how fast an agent picked up an inbound contact. For example, an agent took 25 seconds to answer a phone call contact.
Max Q Duration The longest duration of time contacts associated with the campaign were in inContact.
Total Duration The total duration of time contacts associated with the campaign were in inContact.
Total Agt Duration The total duration of time agents were handling contacts associated with the campaign.
Service Level The Service Level percentage for this campaign is displayed according to the Service Level that is configured in webManager > Skills.
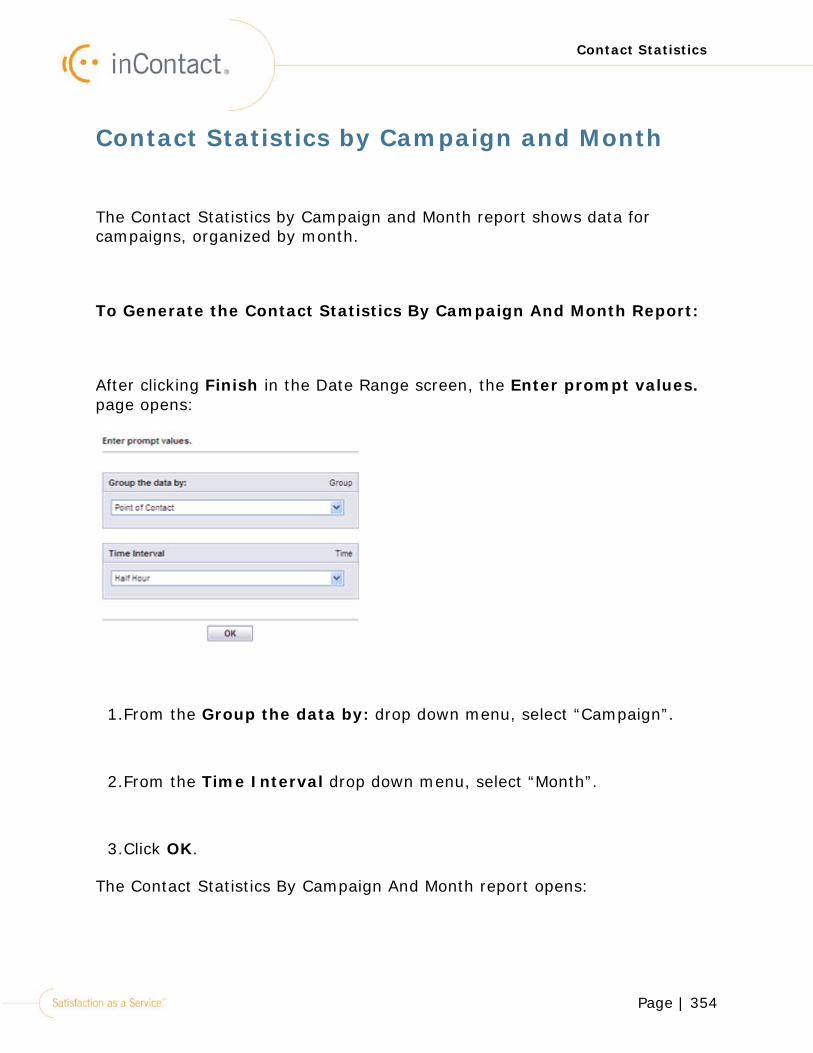
Page | 354
Contact Statistics
Contact Statistics by Campaign and Month
The Contact Statistics by Campaign and Month report shows data for campaigns, organized by month.
To Generate the Contact Statistics By Campaign And Month Report:
After clicking Finish in the Date Range screen, the Enter prompt values. page opens:
1.From the Group the data by: drop down menu, select “Campaign”.
2.From the Time Interval drop down menu, select “Month”.
3.Click OK.
The Contact Statistics By Campaign And Month report opens:
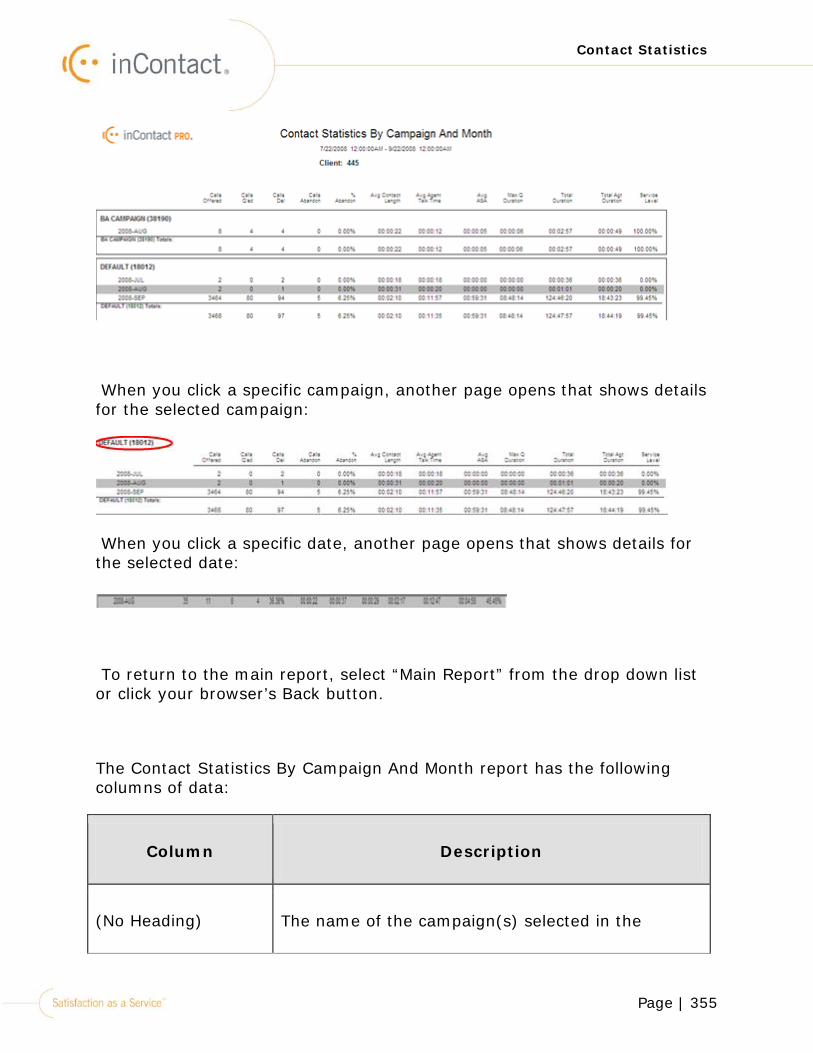
Page | 355
Contact Statistics
When you click a specific campaign, another page opens that shows details for the selected campaign:
When you click a specific date, another page opens that shows details for the selected date:
To return to the main report, select “Main Report” from the drop down list or click your browser’s Back button.
The Contact Statistics By Campaign And Month report has the following columns of data:
Column Description
(No Heading) The name of the campaign(s) selected in the
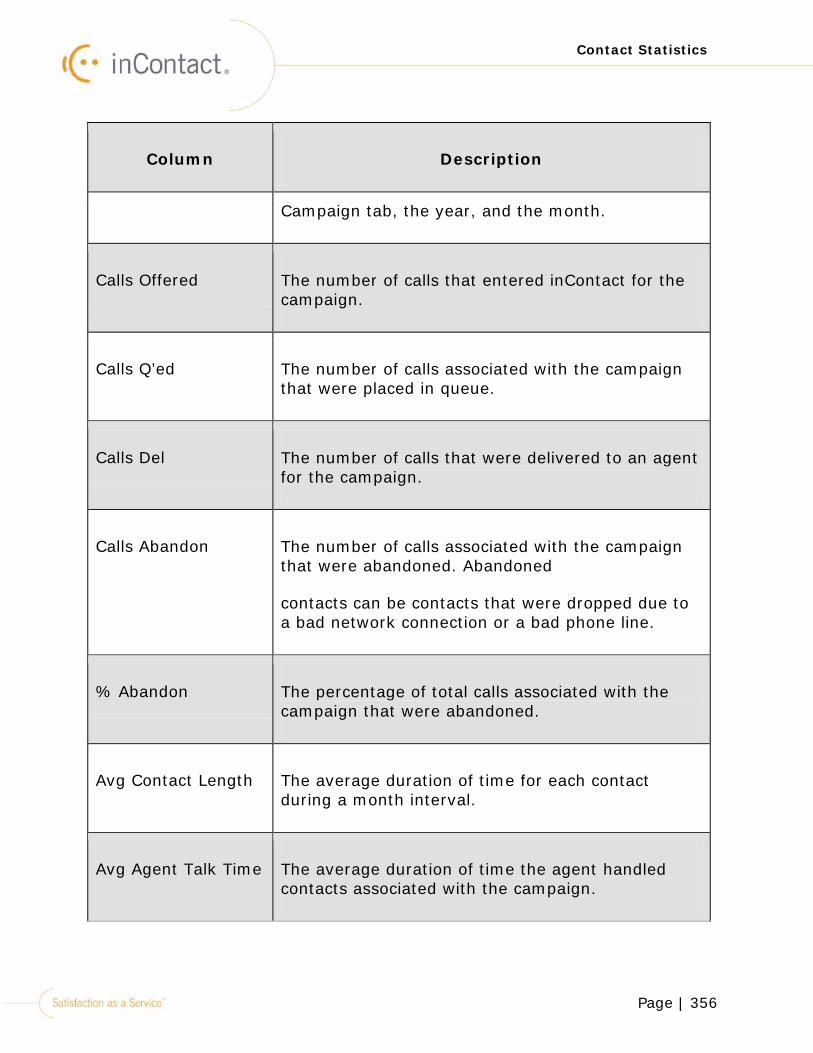
Page | 356
Contact Statistics
Column Description
Campaign tab, the year, and the month.
Calls Offered The number of calls that entered inContact for the campaign.
Calls Q’ed The number of calls associated with the campaign that were placed in queue.
Calls Del The number of calls that were delivered to an agent for the campaign.
Calls Abandon The number of calls associated with the campaign that were abandoned. Abandoned
contacts can be contacts that were dropped due to a bad network connection or a bad phone line.
% Abandon The percentage of total calls associated with the campaign that were abandoned.
Avg Contact Length The average duration of time for each contact during a month interval.
Avg Agent Talk Time The average duration of time the agent handled contacts associated with the campaign.
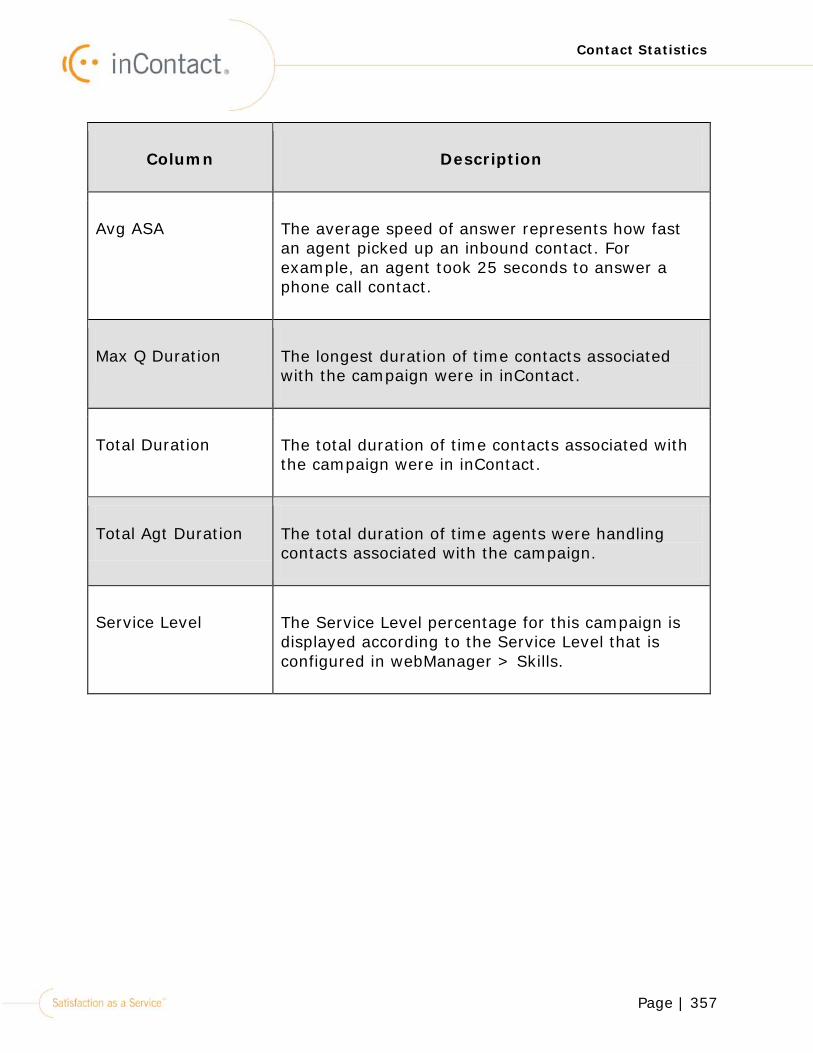
Page | 357
Contact Statistics
Column Description
Avg ASA The average speed of answer represents how fast an agent picked up an inbound contact. For example, an agent took 25 seconds to answer a phone call contact.
Max Q Duration The longest duration of time contacts associated with the campaign were in inContact.
Total Duration The total duration of time contacts associated with the campaign were in inContact.
Total Agt Duration The total duration of time agents were handling contacts associated with the campaign.
Service Level The Service Level percentage for this campaign is displayed according to the Service Level that is configured in webManager > Skills.
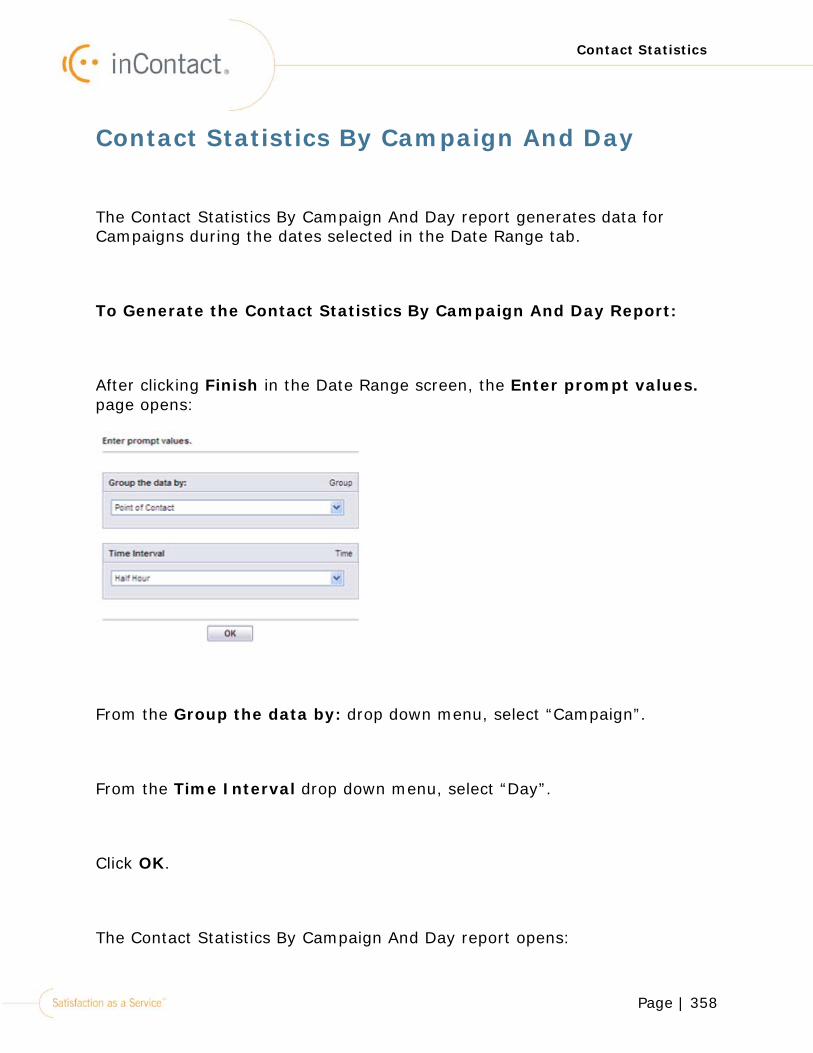
Page | 358
Contact Statistics
Contact Statistics By Campaign And Day
The Contact Statistics By Campaign And Day report generates data for Campaigns during the dates selected in the Date Range tab.
To Generate the Contact Statistics By Campaign And Day Report:
After clicking Finish in the Date Range screen, the Enter prompt values. page opens:
From the Group the data by: drop down menu, select “Campaign”.
From the Time Interval drop down menu, select “Day”.
Click OK.
The Contact Statistics By Campaign And Day report opens:
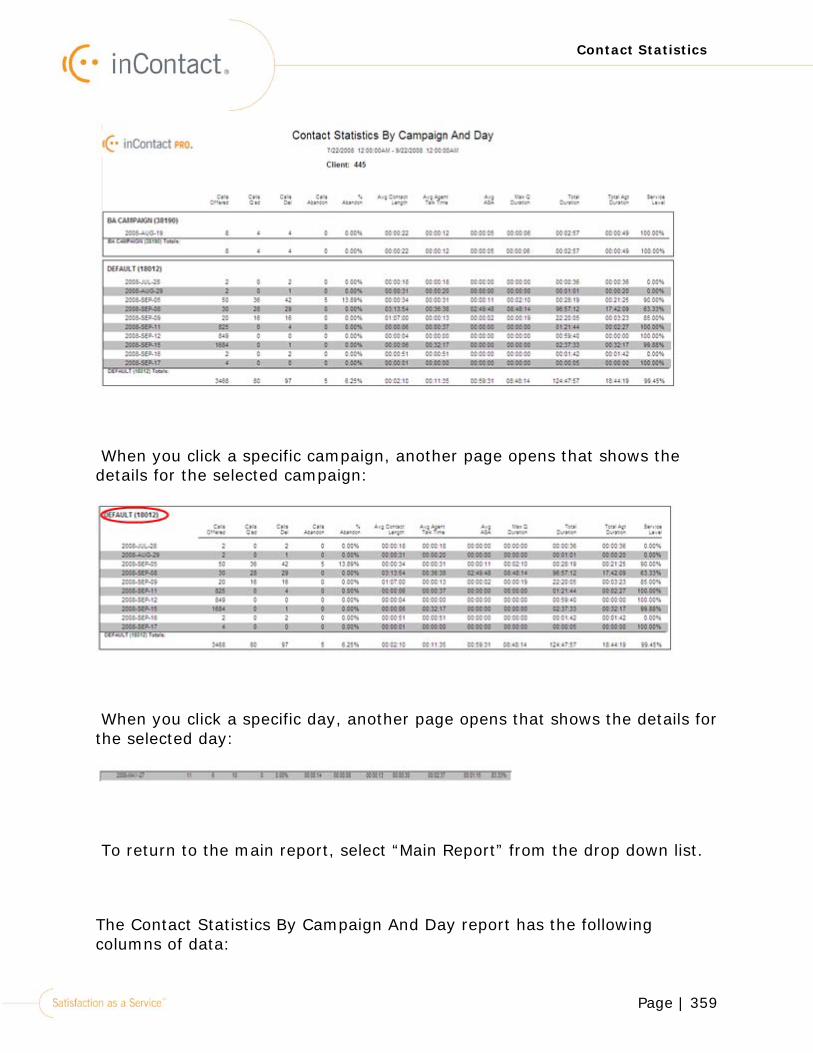
Page | 359
Contact Statistics
When you click a specific campaign, another page opens that shows the details for the selected campaign:
When you click a specific day, another page opens that shows the details for the selected day:
To return to the main report, select “Main Report” from the drop down list.
The Contact Statistics By Campaign And Day report has the following columns of data:
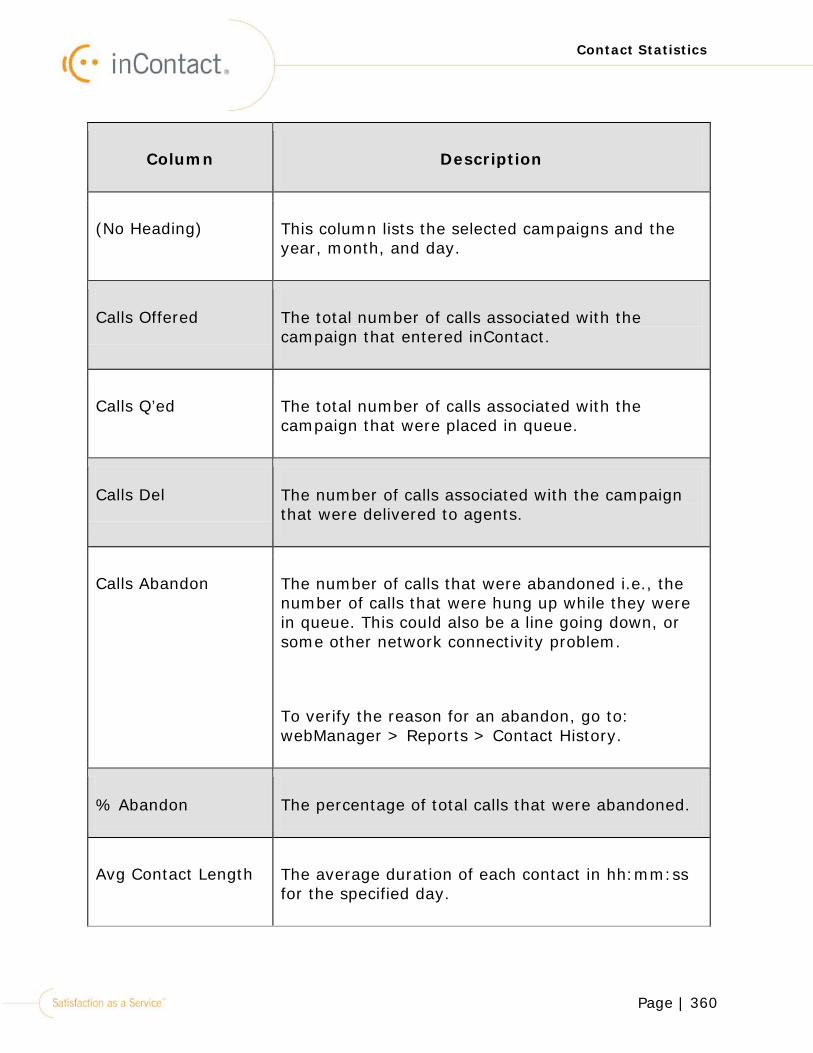
Page | 360
Contact Statistics
Column Description
(No Heading) This column lists the selected campaigns and the year, month, and day.
Calls Offered The total number of calls associated with the campaign that entered inContact.
Calls Q’ed The total number of calls associated with the campaign that were placed in queue.
Calls Del The number of calls associated with the campaign that were delivered to agents.
Calls Abandon The number of calls that were abandoned i.e., the number of calls that were hung up while they were in queue. This could also be a line going down, or some other network connectivity problem.
To verify the reason for an abandon, go to: webManager > Reports > Contact History.
% Abandon The percentage of total calls that were abandoned.
Avg Contact Length The average duration of each contact in hh:mm:ss for the specified day.

Page | 361
Contact Statistics
Column Description
Avg Agent Talk Time The average duration of time the agents talked with the contact.
Avg ASA The average speed of answer represents how fast an agent picked up an inbound contact. For example, an agent took 25 seconds to answer a phone call contact.
Max Q Duration The maximum duration of time a contact associated with this campaign was in queue during the specified day.
Total Duration The total duration of time (hh:mm:sec) of the contact during the specified day.
Total Agt Duration The total duration of time (in hh:mm:ss) the agent handled the contact during the specified day.
Service Level The service level percentage. The Service Level is configured in webManager > Skills. This percentage is the service level percentage that was reached on the specified day for the campaign.
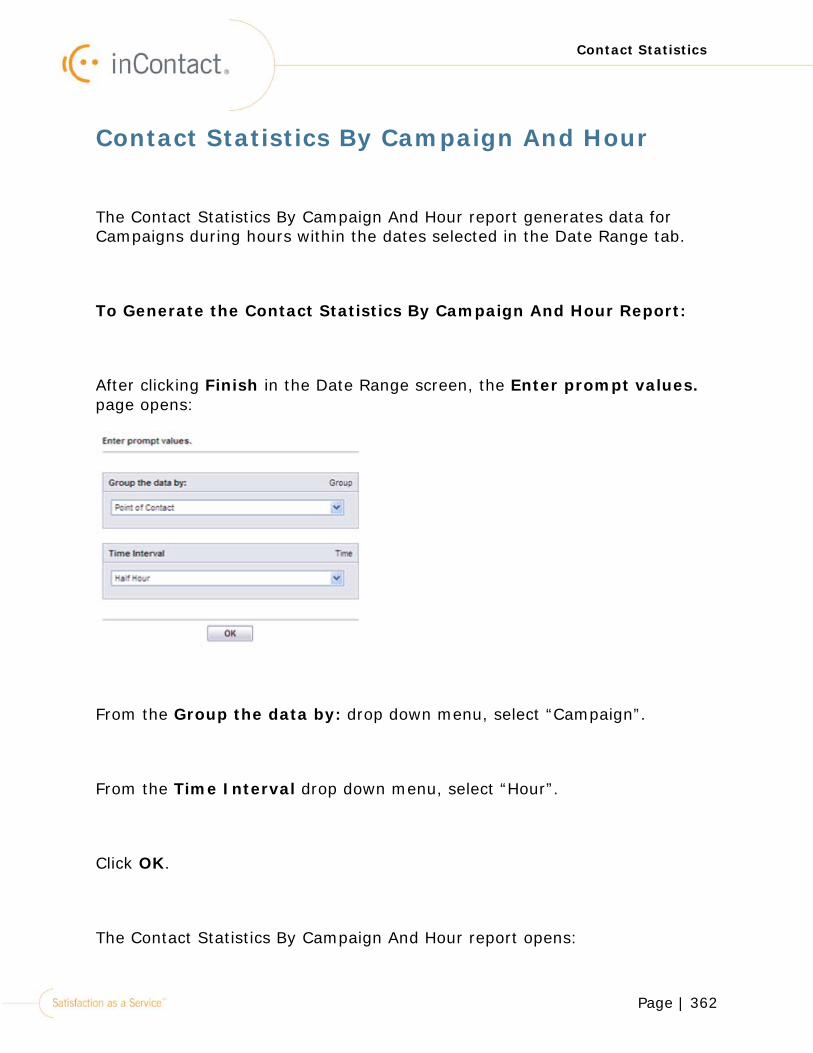
Page | 362
Contact Statistics
Contact Statistics By Campaign And Hour
The Contact Statistics By Campaign And Hour report generates data for Campaigns during hours within the dates selected in the Date Range tab.
To Generate the Contact Statistics By Campaign And Hour Report:
After clicking Finish in the Date Range screen, the Enter prompt values. page opens:
From the Group the data by: drop down menu, select “Campaign”.
From the Time Interval drop down menu, select “Hour”.
Click OK.
The Contact Statistics By Campaign And Hour report opens:
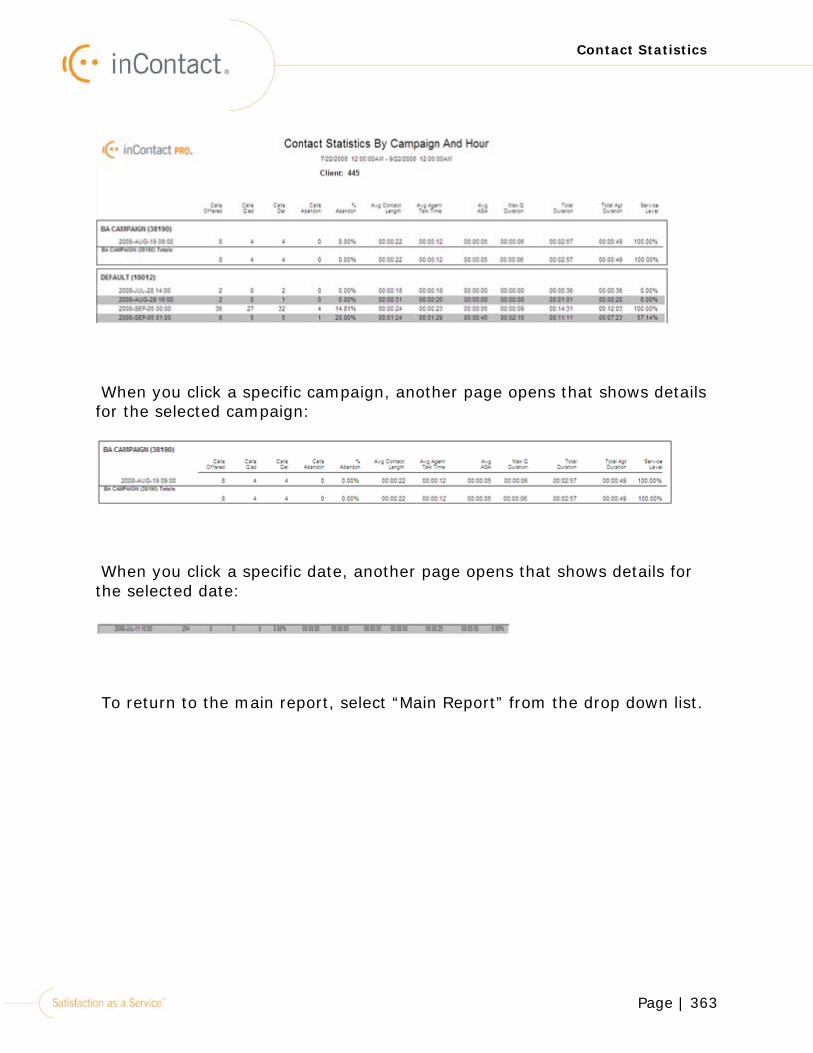
Page | 363
Contact Statistics
When you click a specific campaign, another page opens that shows details for the selected campaign:
When you click a specific date, another page opens that shows details for the selected date:
To return to the main report, select “Main Report” from the drop down list.
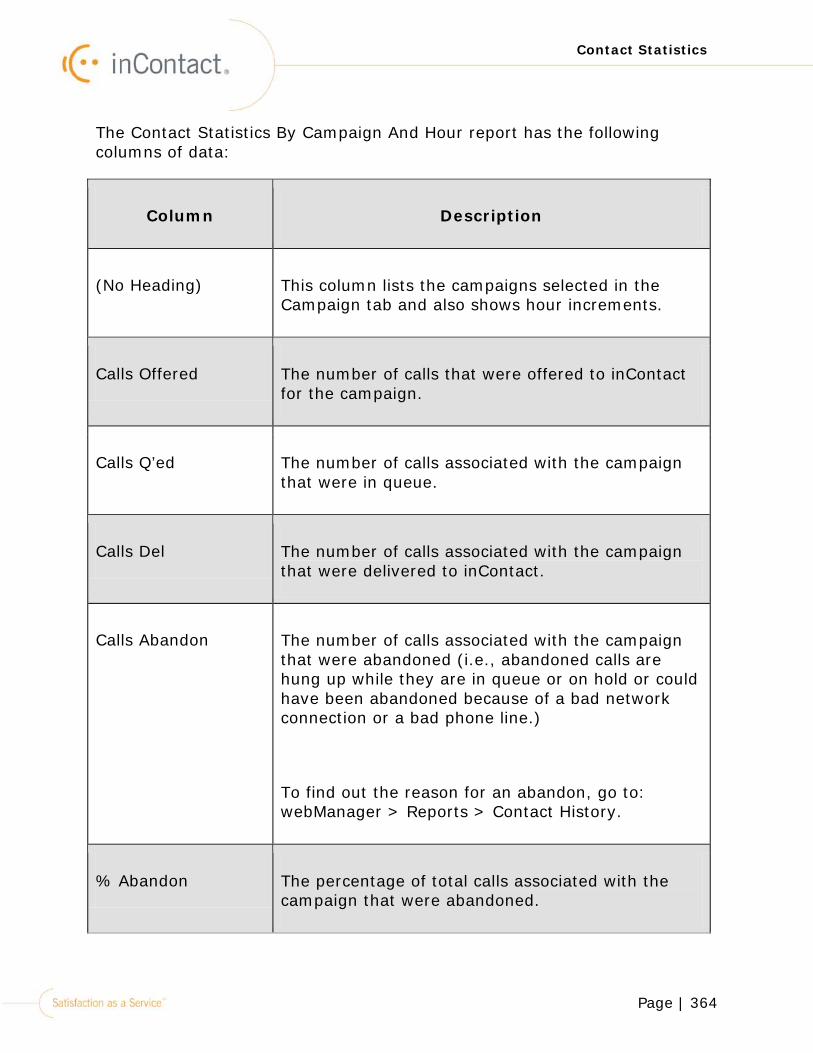
Page | 364
Contact Statistics
The Contact Statistics By Campaign And Hour report has the following columns of data:
Column Description
(No Heading) This column lists the campaigns selected in the Campaign tab and also shows hour increments.
Calls Offered The number of calls that were offered to inContact for the campaign.
Calls Q’ed The number of calls associated with the campaign that were in queue.
Calls Del The number of calls associated with the campaign that were delivered to inContact.
Calls Abandon The number of calls associated with the campaign that were abandoned (i.e., abandoned calls are hung up while they are in queue or on hold or could have been abandoned because of a bad network connection or a bad phone line.)
To find out the reason for an abandon, go to: webManager > Reports > Contact History.
% Abandon The percentage of total calls associated with the campaign that were abandoned.
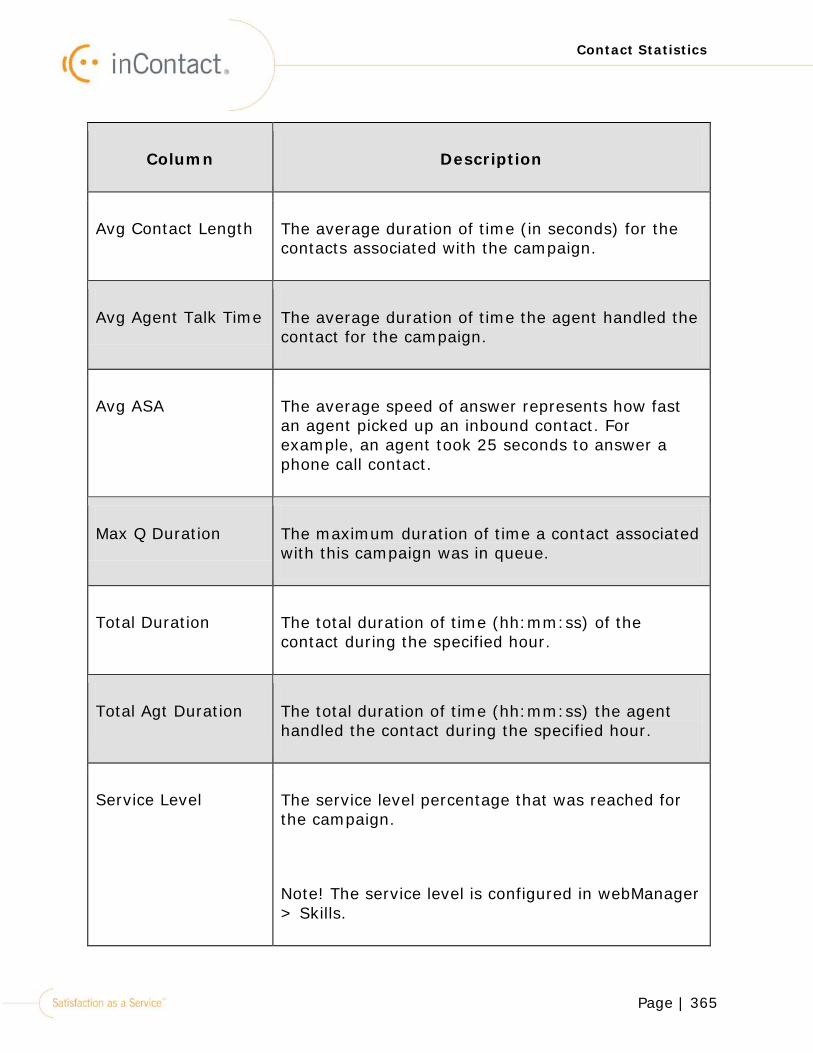
Page | 365
Contact Statistics
Column Description
Avg Contact Length The average duration of time (in seconds) for the contacts associated with the campaign.
Avg Agent Talk Time The average duration of time the agent handled the contact for the campaign.
Avg ASA The average speed of answer represents how fast an agent picked up an inbound contact. For example, an agent took 25 seconds to answer a phone call contact.
Max Q Duration The maximum duration of time a contact associated with this campaign was in queue.
Total Duration The total duration of time (hh:mm:ss) of the contact during the specified hour.
Total Agt Duration The total duration of time (hh:mm:ss) the agent handled the contact during the specified hour.
Service Level The service level percentage that was reached for the campaign.
Note! The service level is configured in webManager > Skills.
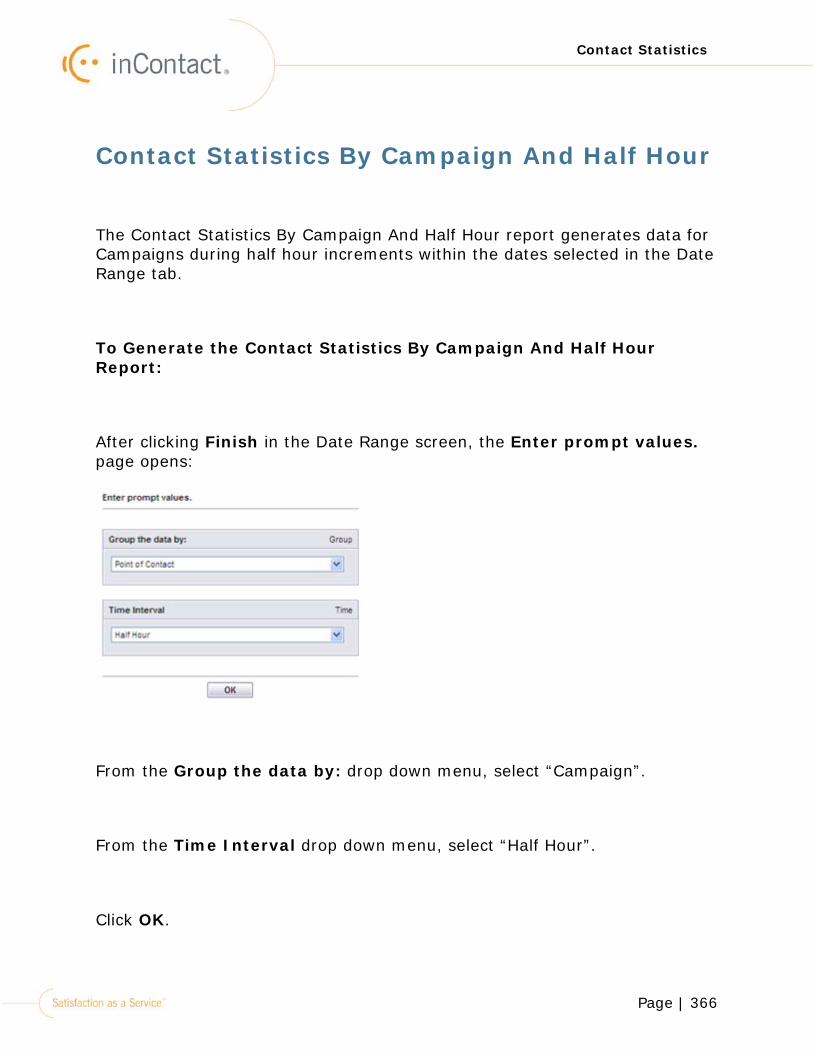
Page | 366
Contact Statistics
Contact Statistics By Campaign And Half Hour
The Contact Statistics By Campaign And Half Hour report generates data for Campaigns during half hour increments within the dates selected in the Date Range tab.
To Generate the Contact Statistics By Campaign And Half Hour Report:
After clicking Finish in the Date Range screen, the Enter prompt values. page opens:
From the Group the data by: drop down menu, select “Campaign”.
From the Time Interval drop down menu, select “Half Hour”.
Click OK.
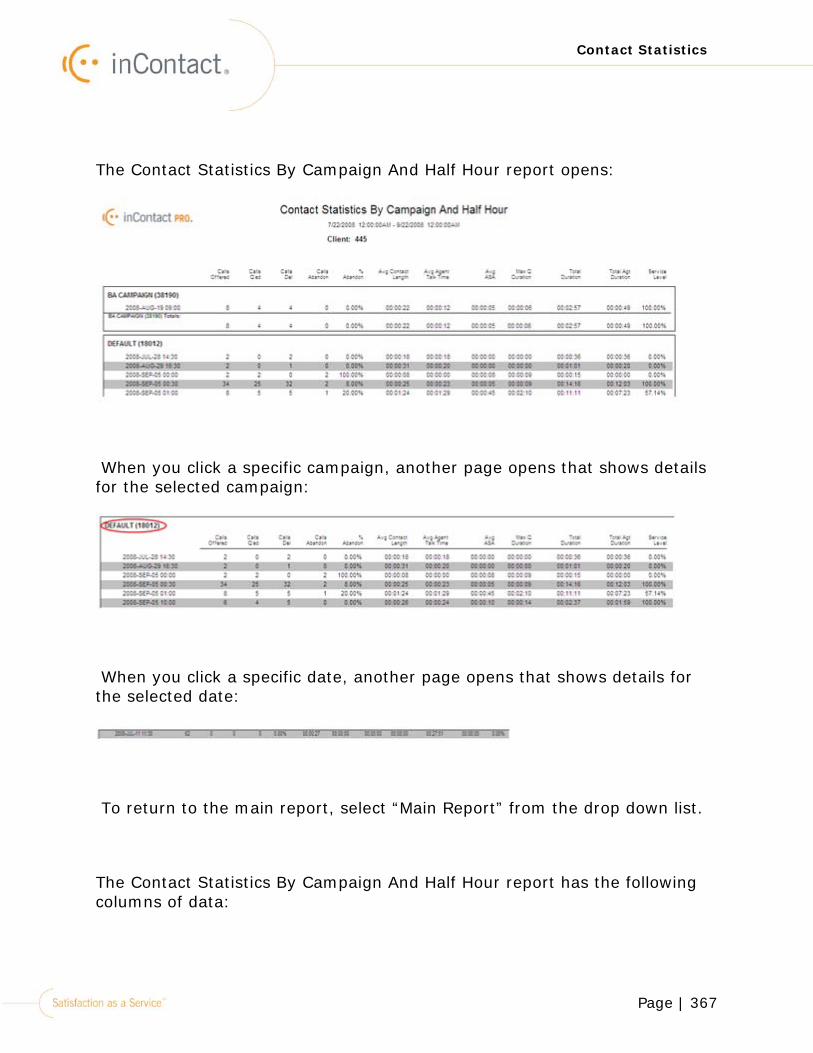
Page | 367
Contact Statistics
The Contact Statistics By Campaign And Half Hour report opens:
When you click a specific campaign, another page opens that shows details for the selected campaign:
When you click a specific date, another page opens that shows details for the selected date:
To return to the main report, select “Main Report” from the drop down list.
The Contact Statistics By Campaign And Half Hour report has the following columns of data:
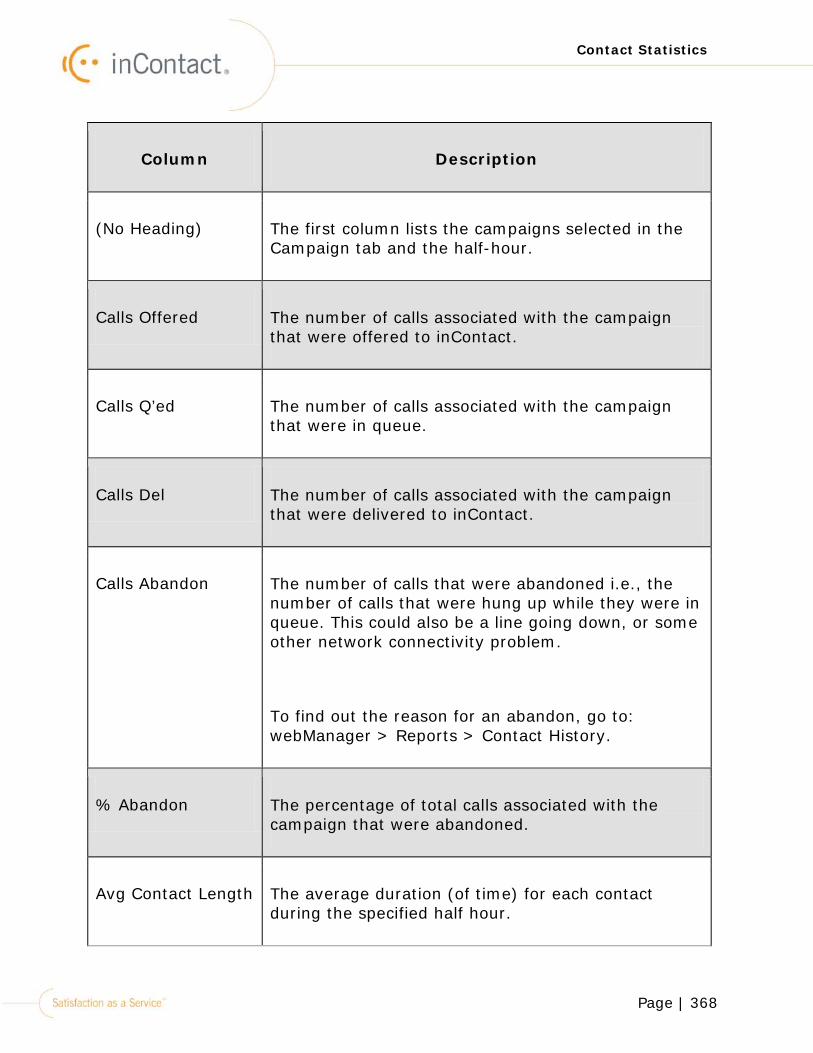
Page | 368
Contact Statistics
Column Description
(No Heading) The first column lists the campaigns selected in the Campaign tab and the half-hour.
Calls Offered The number of calls associated with the campaign that were offered to inContact.
Calls Q’ed The number of calls associated with the campaign that were in queue.
Calls Del The number of calls associated with the campaign that were delivered to inContact.
Calls Abandon The number of calls that were abandoned i.e., the number of calls that were hung up while they were in queue. This could also be a line going down, or some other network connectivity problem.
To find out the reason for an abandon, go to: webManager > Reports > Contact History.
% Abandon The percentage of total calls associated with the campaign that were abandoned.
Avg Contact Length The average duration (of time) for each contact during the specified half hour.
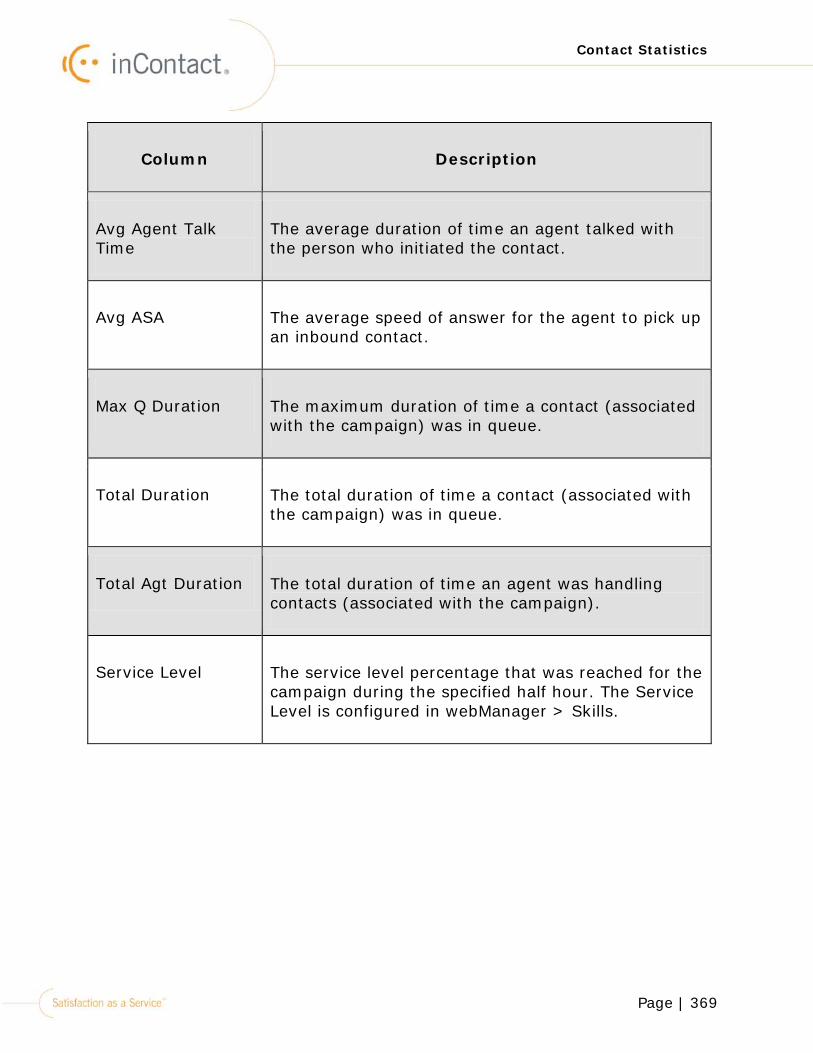
Page | 369
Contact Statistics
Column Description
Avg Agent Talk Time
The average duration of time an agent talked with the person who initiated the contact.
Avg ASA The average speed of answer for the agent to pick up an inbound contact.
Max Q Duration The maximum duration of time a contact (associated with the campaign) was in queue.
Total Duration The total duration of time a contact (associated with the campaign) was in queue.
Total Agt Duration The total duration of time an agent was handling contacts (associated with the campaign).
Service Level The service level percentage that was reached for the campaign during the specified half hour. The Service Level is configured in webManager > Skills.
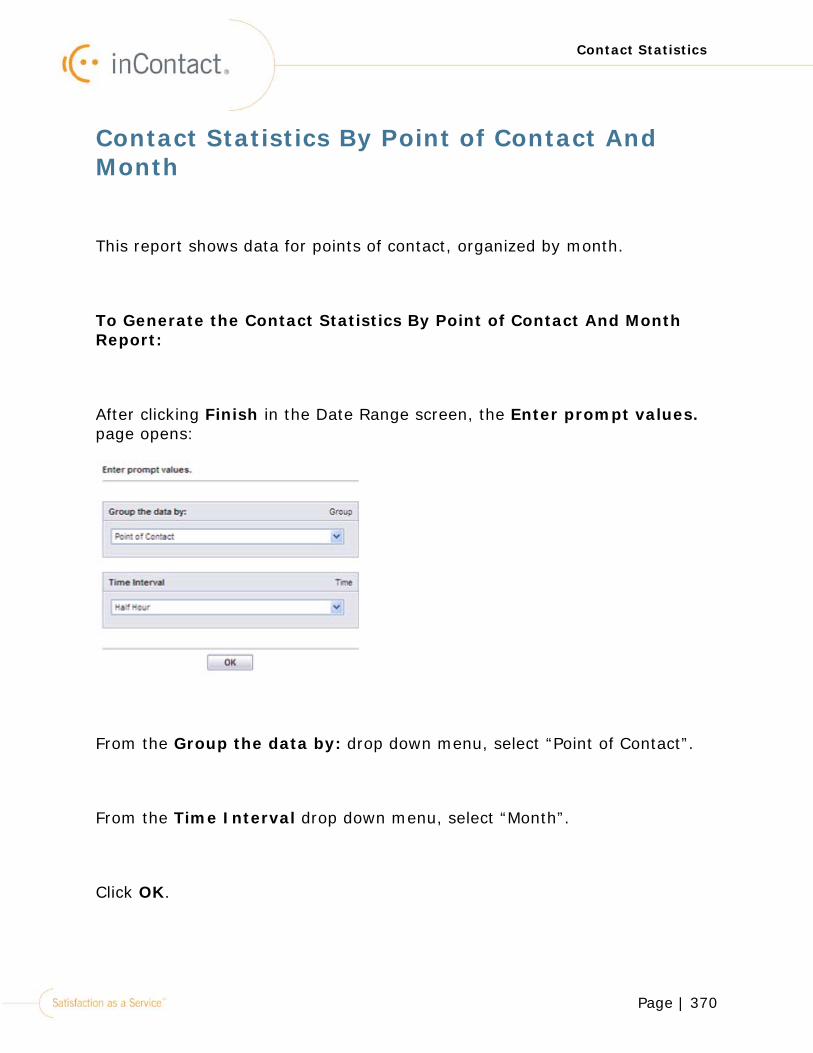
Page | 370
Contact Statistics
Contact Statistics By Point of Contact And Month
This report shows data for points of contact, organized by month.
To Generate the Contact Statistics By Point of Contact And Month Report:
After clicking Finish in the Date Range screen, the Enter prompt values. page opens:
From the Group the data by: drop down menu, select “Point of Contact”.
From the Time Interval drop down menu, select “Month”.
Click OK.
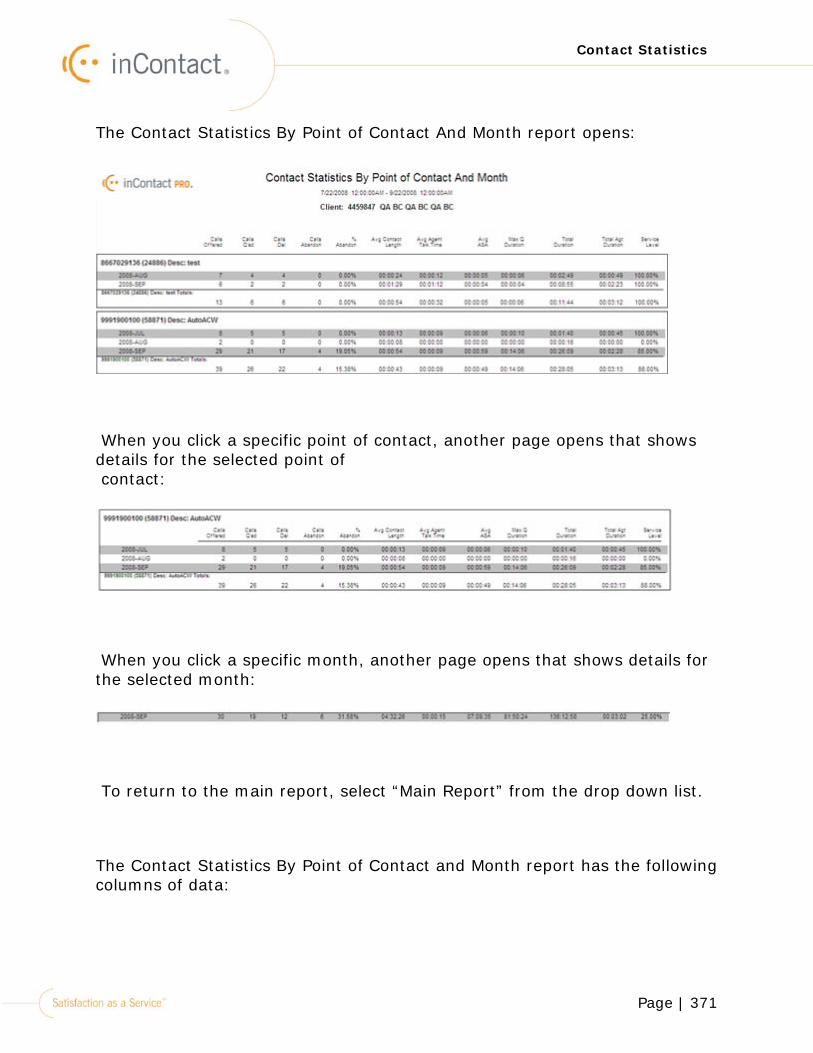
Page | 371
Contact Statistics
The Contact Statistics By Point of Contact And Month report opens:
When you click a specific point of contact, another page opens that shows details for the selected point of contact:
When you click a specific month, another page opens that shows details for the selected month:
To return to the main report, select “Main Report” from the drop down list.
The Contact Statistics By Point of Contact and Month report has the following columns of data:
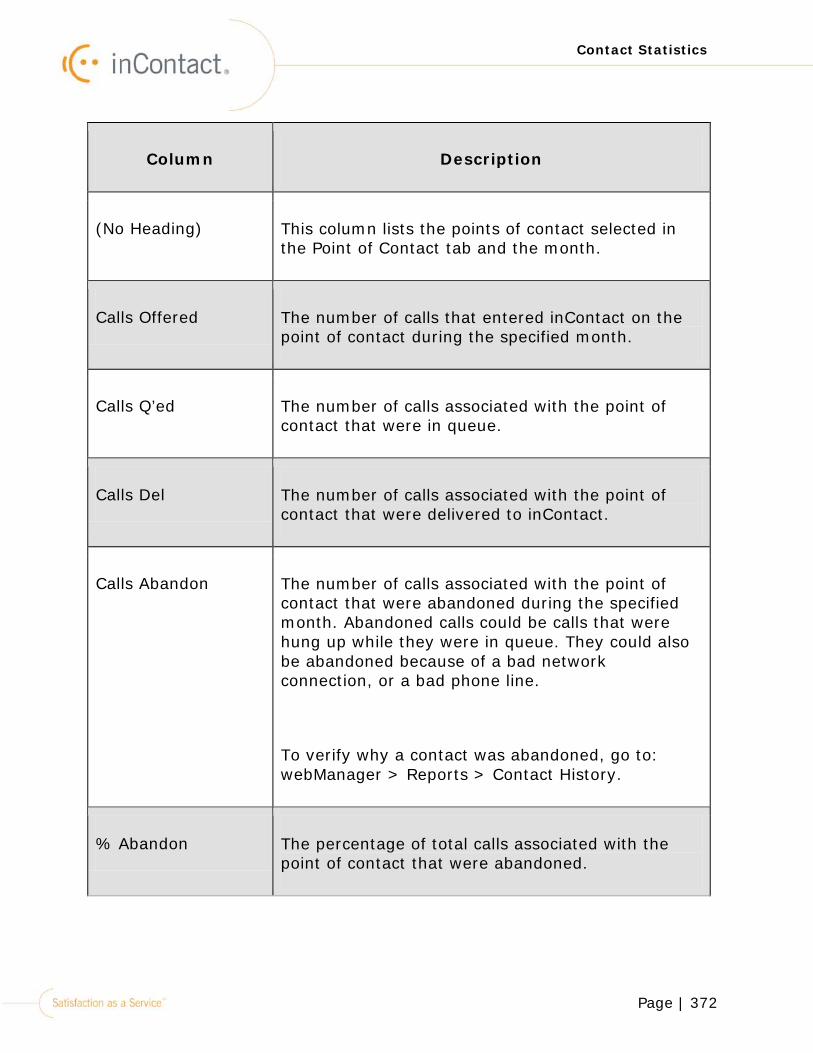
Page | 372
Contact Statistics
Column Description
(No Heading) This column lists the points of contact selected in the Point of Contact tab and the month.
Calls Offered The number of calls that entered inContact on the point of contact during the specified month.
Calls Q’ed The number of calls associated with the point of contact that were in queue.
Calls Del The number of calls associated with the point of contact that were delivered to inContact.
Calls Abandon The number of calls associated with the point of contact that were abandoned during the specified month. Abandoned calls could be calls that were hung up while they were in queue. They could also be abandoned because of a bad network connection, or a bad phone line.
To verify why a contact was abandoned, go to: webManager > Reports > Contact History.
% Abandon The percentage of total calls associated with the point of contact that were abandoned.
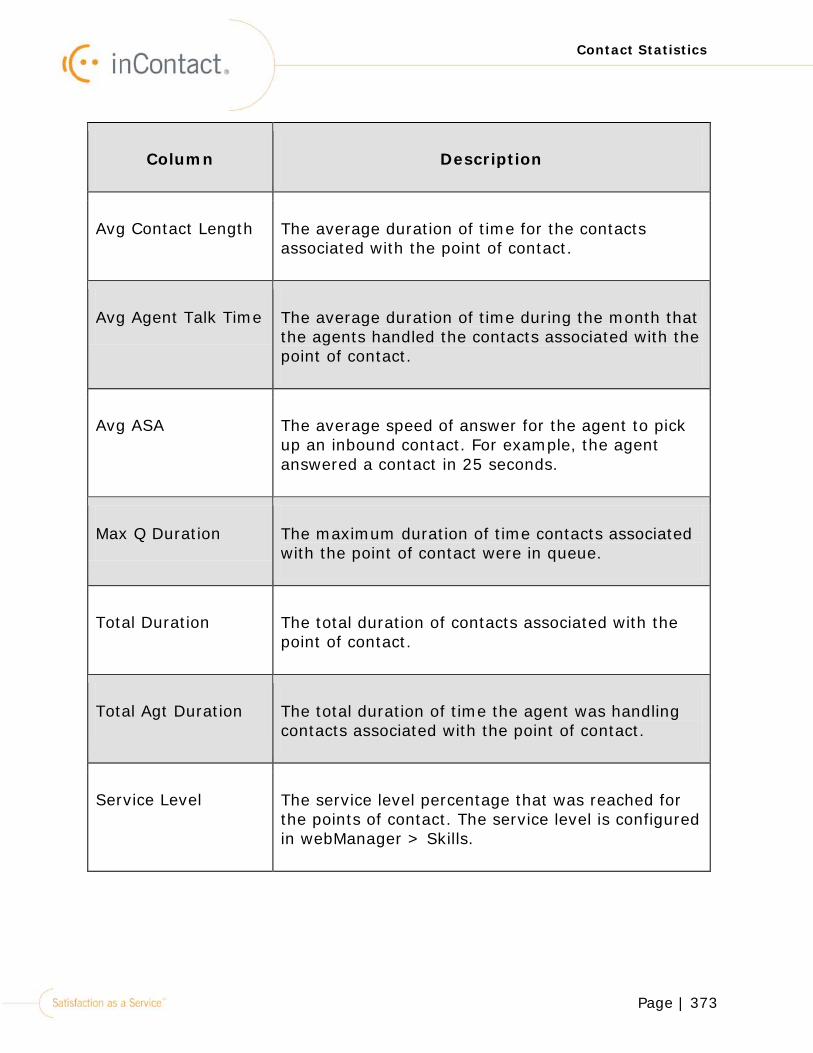
Page | 373
Contact Statistics
Column Description
Avg Contact Length The average duration of time for the contacts associated with the point of contact.
Avg Agent Talk Time The average duration of time during the month that the agents handled the contacts associated with the point of contact.
Avg ASA The average speed of answer for the agent to pick up an inbound contact. For example, the agent answered a contact in 25 seconds.
Max Q Duration The maximum duration of time contacts associated with the point of contact were in queue.
Total Duration The total duration of contacts associated with the point of contact.
Total Agt Duration The total duration of time the agent was handling contacts associated with the point of contact.
Service Level The service level percentage that was reached for the points of contact. The service level is configured in webManager > Skills.
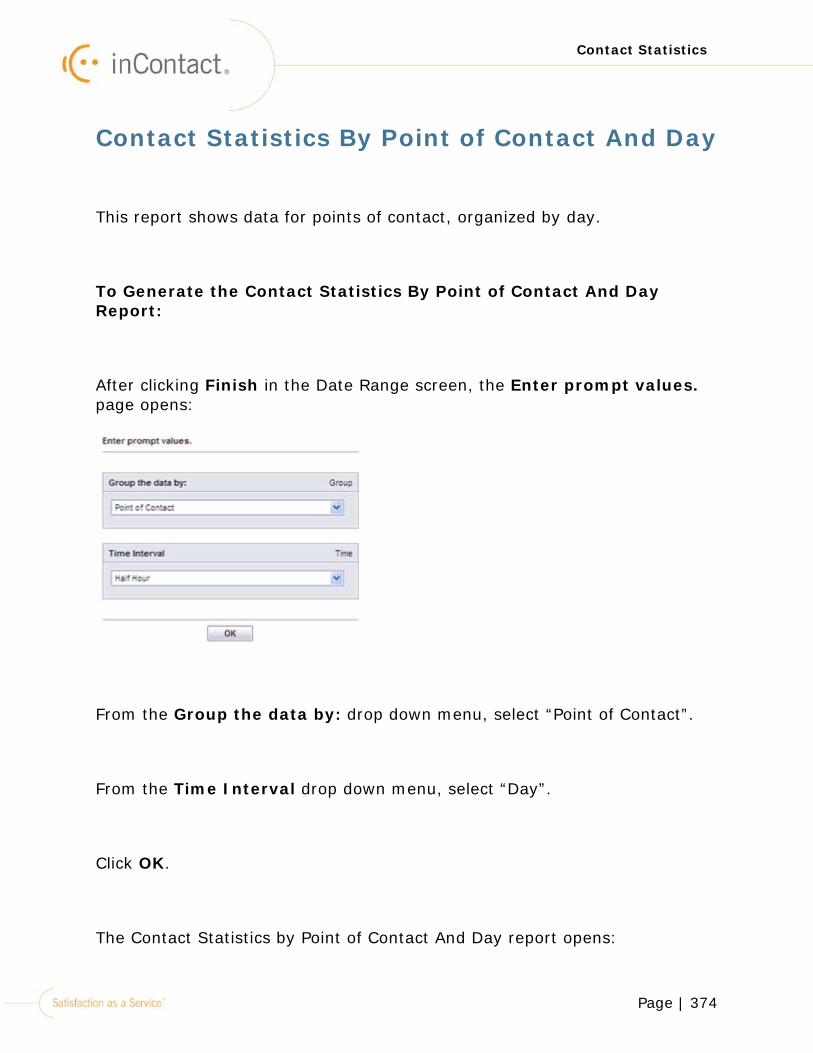
Page | 374
Contact Statistics
Contact Statistics By Point of Contact And Day
This report shows data for points of contact, organized by day.
To Generate the Contact Statistics By Point of Contact And Day Report:
After clicking Finish in the Date Range screen, the Enter prompt values. page opens:
From the Group the data by: drop down menu, select “Point of Contact”.
From the Time Interval drop down menu, select “Day”.
Click OK.
The Contact Statistics by Point of Contact And Day report opens:
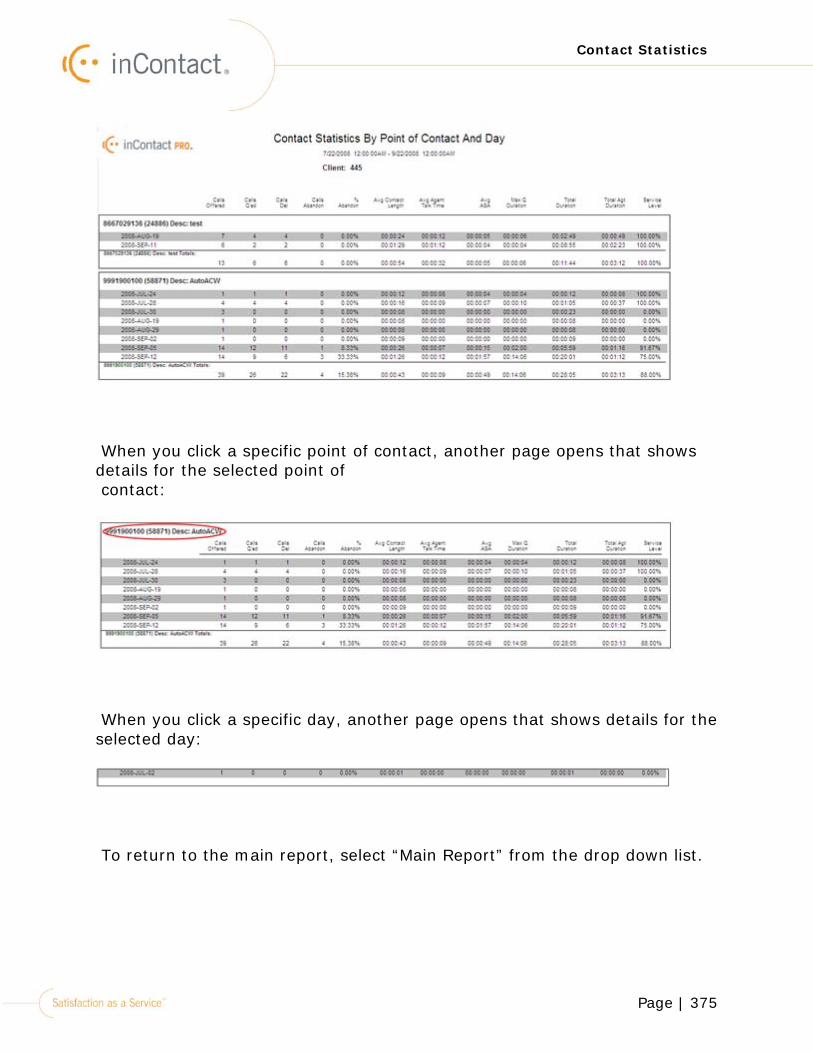
Page | 375
Contact Statistics
When you click a specific point of contact, another page opens that shows details for the selected point of contact:
When you click a specific day, another page opens that shows details for the selected day:
To return to the main report, select “Main Report” from the drop down list.
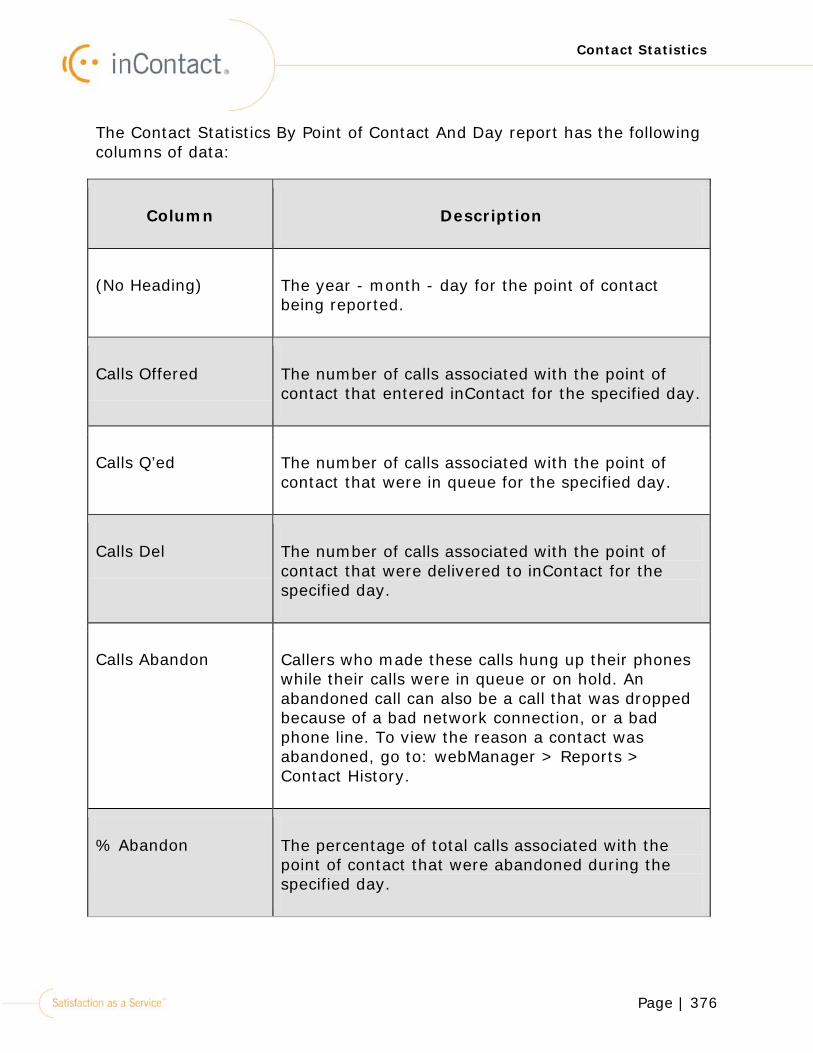
Page | 376
Contact Statistics
The Contact Statistics By Point of Contact And Day report has the following columns of data:
Column Description
(No Heading) The year - month - day for the point of contact being reported.
Calls Offered The number of calls associated with the point of contact that entered inContact for the specified day.
Calls Q’ed The number of calls associated with the point of contact that were in queue for the specified day.
Calls Del The number of calls associated with the point of contact that were delivered to inContact for the specified day.
Calls Abandon Callers who made these calls hung up their phones while their calls were in queue or on hold. An abandoned call can also be a call that was dropped because of a bad network connection, or a bad phone line. To view the reason a contact was abandoned, go to: webManager > Reports > Contact History.
% Abandon The percentage of total calls associated with the point of contact that were abandoned during the specified day.
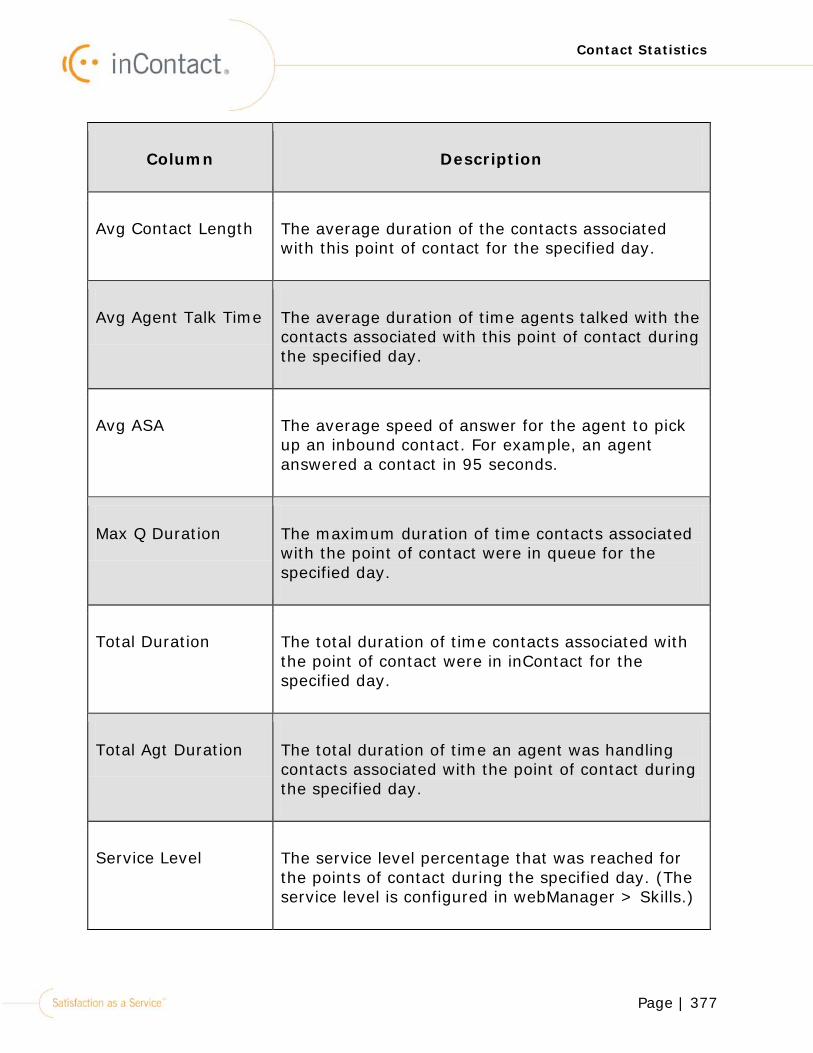
Page | 377
Contact Statistics
Column Description
Avg Contact Length The average duration of the contacts associated with this point of contact for the specified day.
Avg Agent Talk Time The average duration of time agents talked with the contacts associated with this point of contact during the specified day.
Avg ASA The average speed of answer for the agent to pick up an inbound contact. For example, an agent answered a contact in 95 seconds.
Max Q Duration The maximum duration of time contacts associated with the point of contact were in queue for the specified day.
Total Duration The total duration of time contacts associated with the point of contact were in inContact for the specified day.
Total Agt Duration The total duration of time an agent was handling contacts associated with the point of contact during the specified day.
Service Level The service level percentage that was reached for the points of contact during the specified day. (The service level is configured in webManager > Skills.)
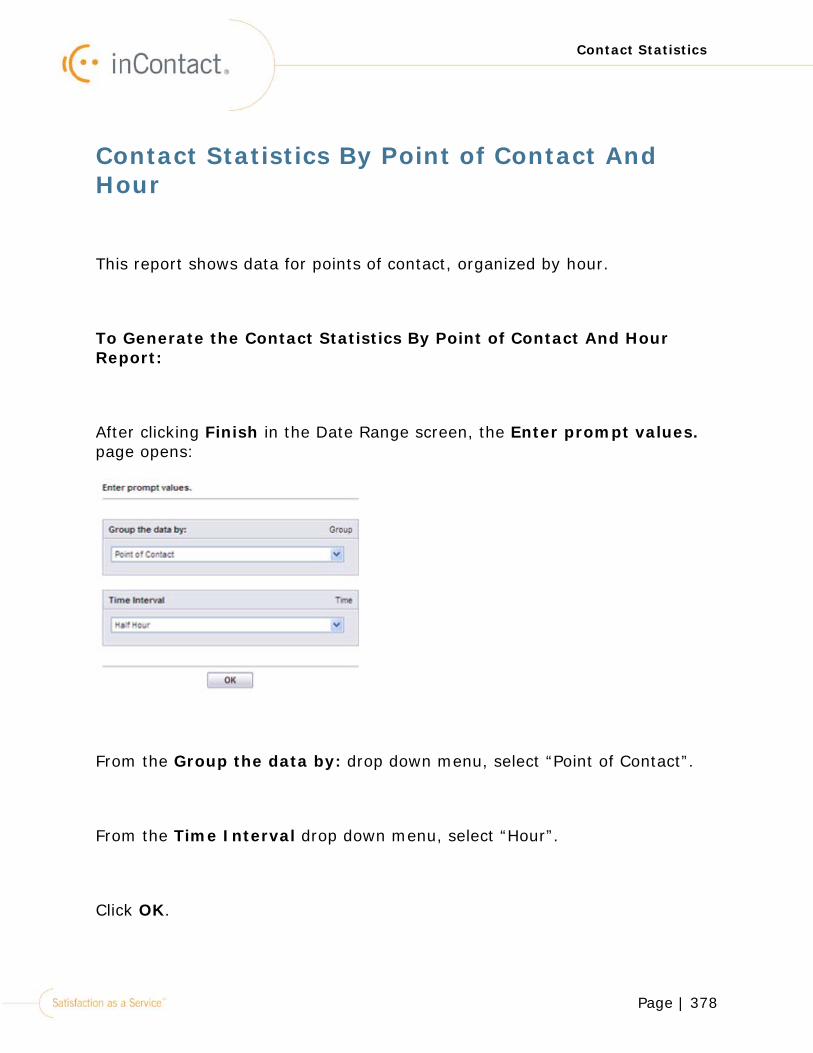
Page | 378
Contact Statistics
Contact Statistics By Point of Contact And Hour
This report shows data for points of contact, organized by hour.
To Generate the Contact Statistics By Point of Contact And Hour Report:
After clicking Finish in the Date Range screen, the Enter prompt values. page opens:
From the Group the data by: drop down menu, select “Point of Contact”.
From the Time Interval drop down menu, select “Hour”.
Click OK.
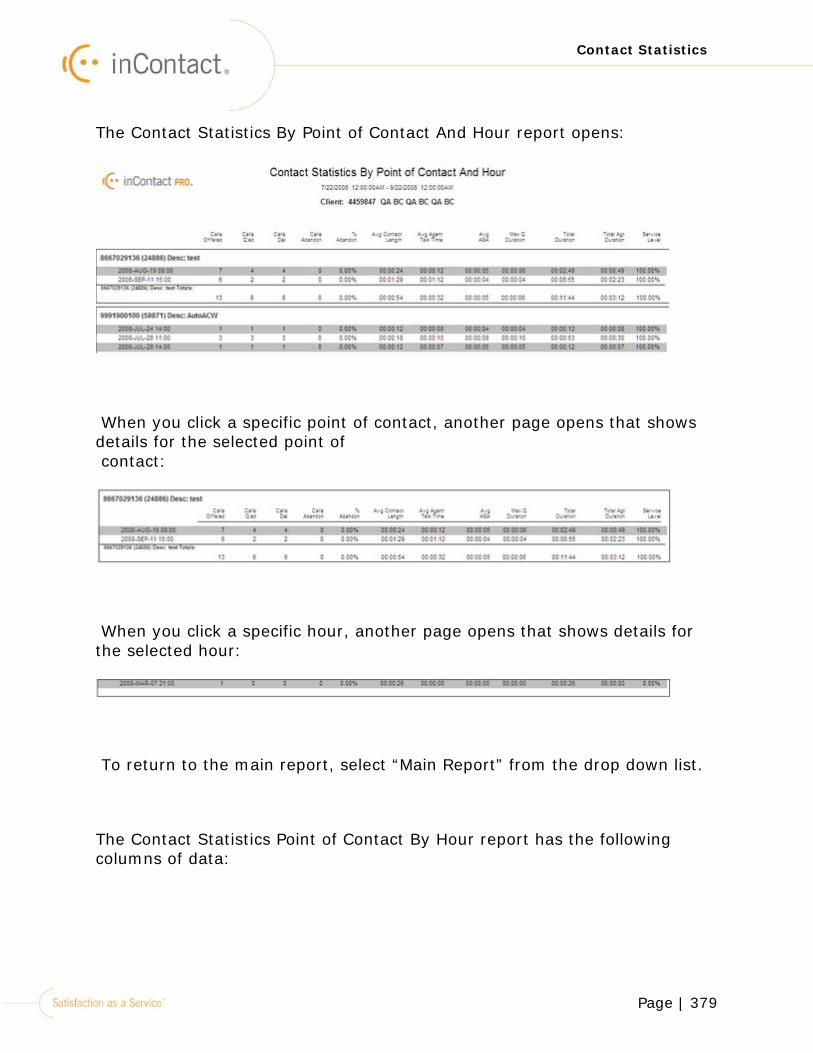
Page | 379
Contact Statistics
The Contact Statistics By Point of Contact And Hour report opens:
When you click a specific point of contact, another page opens that shows details for the selected point of contact:
When you click a specific hour, another page opens that shows details for the selected hour:
To return to the main report, select “Main Report” from the drop down list.
The Contact Statistics Point of Contact By Hour report has the following columns of data:
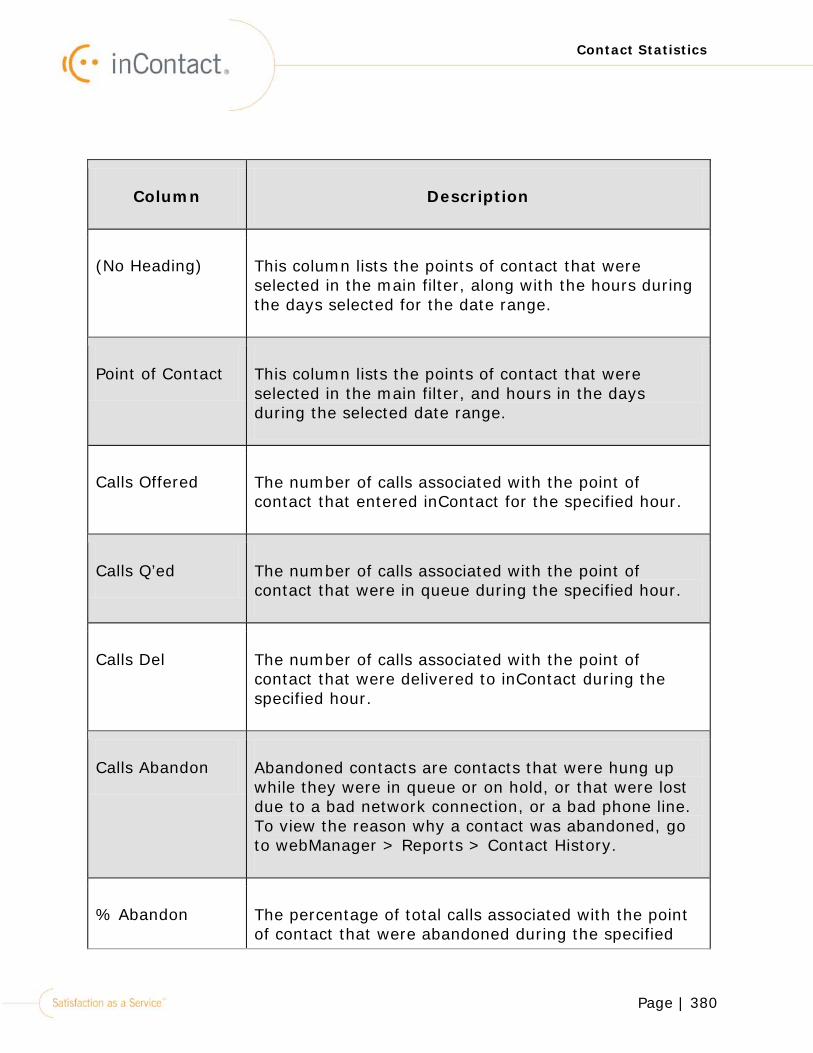
Page | 380
Contact Statistics
Column Description
(No Heading) This column lists the points of contact that were selected in the main filter, along with the hours during the days selected for the date range.
Point of Contact This column lists the points of contact that were selected in the main filter, and hours in the days during the selected date range.
Calls Offered The number of calls associated with the point of contact that entered inContact for the specified hour.
Calls Q’ed The number of calls associated with the point of contact that were in queue during the specified hour.
Calls Del The number of calls associated with the point of contact that were delivered to inContact during the specified hour.
Calls Abandon Abandoned contacts are contacts that were hung up while they were in queue or on hold, or that were lost due to a bad network connection, or a bad phone line. To view the reason why a contact was abandoned, go to webManager > Reports > Contact History.
% Abandon The percentage of total calls associated with the point of contact that were abandoned during the specified
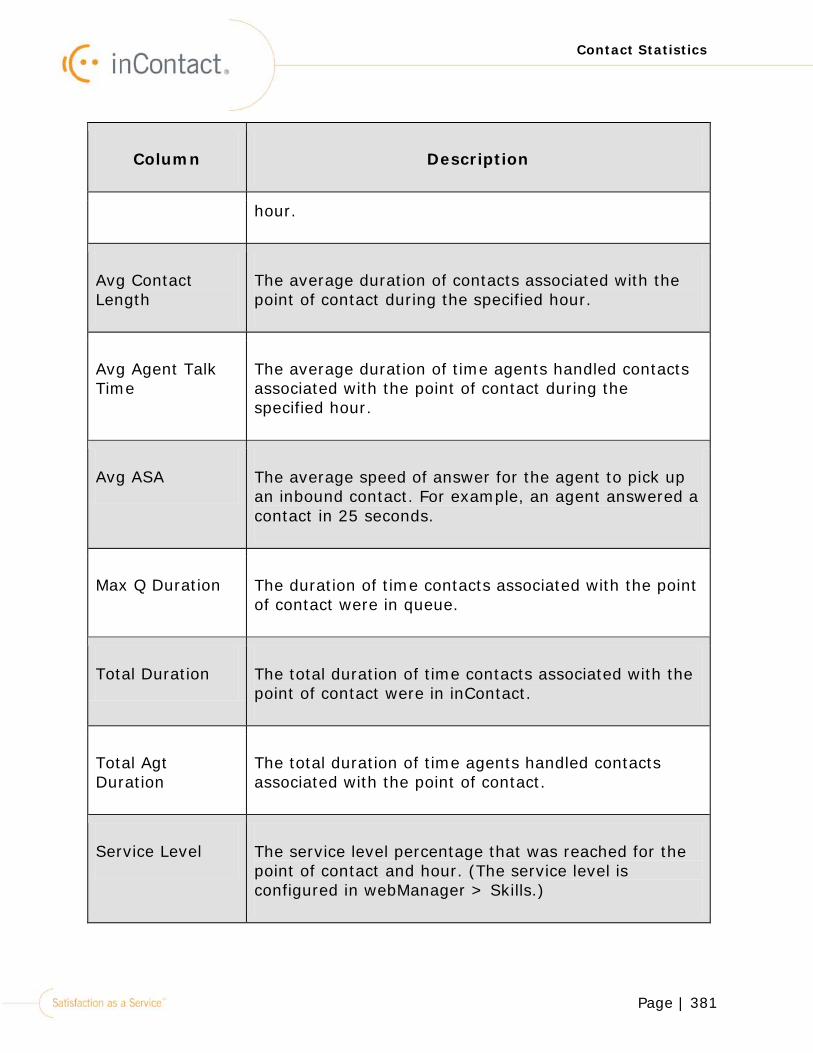
Page | 381
Contact Statistics
Column Description
hour.
Avg Contact Length
The average duration of contacts associated with the point of contact during the specified hour.
Avg Agent Talk Time
The average duration of time agents handled contacts associated with the point of contact during the specified hour.
Avg ASA The average speed of answer for the agent to pick up an inbound contact. For example, an agent answered a contact in 25 seconds.
Max Q Duration The duration of time contacts associated with the point of contact were in queue.
Total Duration The total duration of time contacts associated with the point of contact were in inContact.
Total Agt Duration
The total duration of time agents handled contacts associated with the point of contact.
Service Level The service level percentage that was reached for the point of contact and hour. (The service level is configured in webManager > Skills.)
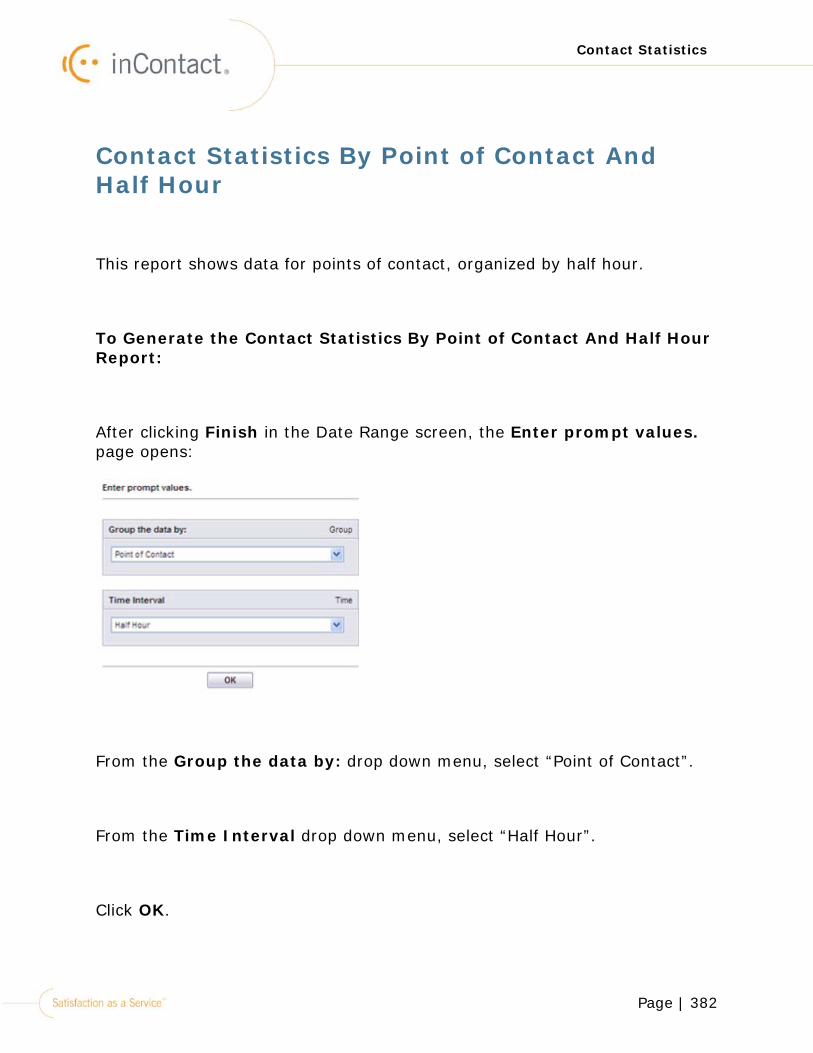
Page | 382
Contact Statistics
Contact Statistics By Point of Contact And Half Hour
This report shows data for points of contact, organized by half hour.
To Generate the Contact Statistics By Point of Contact And Half Hour Report:
After clicking Finish in the Date Range screen, the Enter prompt values. page opens:
From the Group the data by: drop down menu, select “Point of Contact”.
From the Time Interval drop down menu, select “Half Hour”.
Click OK.
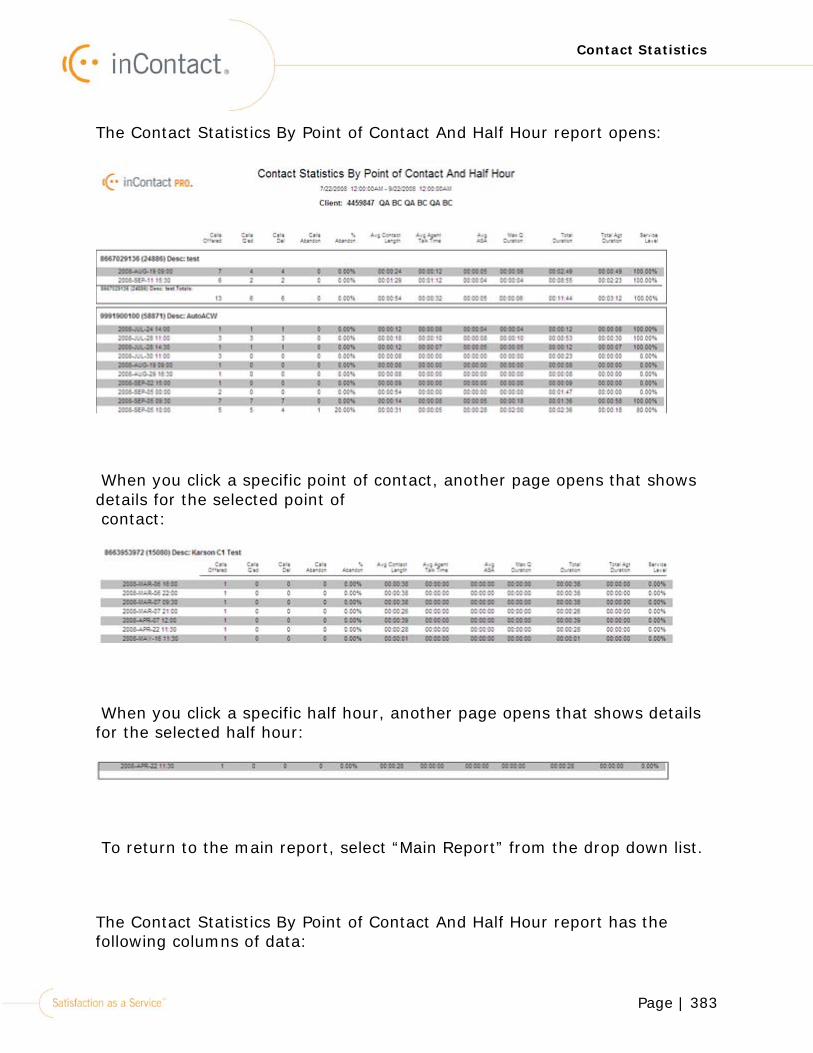
Page | 383
Contact Statistics
The Contact Statistics By Point of Contact And Half Hour report opens:
When you click a specific point of contact, another page opens that shows details for the selected point of contact:
When you click a specific half hour, another page opens that shows details for the selected half hour:
To return to the main report, select “Main Report” from the drop down list.
The Contact Statistics By Point of Contact And Half Hour report has the following columns of data:
Page | 384
Contact Statistics
Column Description
Point of Contact and Half Hour
This column lists the points of contact that were selected in the main filter, and also lists the half hour time intervals for the days during the selected date range.
Calls Offered The number of calls associated with the point of contact that entered inContact during the specified half hour.
Calls Q’ed The number of calls associated with the point of contact that were in queue during the specified half hour.
Calls Del The number of calls associated with the point of contact that were delivered to inContact during the specified half hour.
Calls Abandon The number of calls associated with the point of contact that were abandoned while the call was in queue. An abandoned call can be when a caller hangs up while their call is in queue, or when a call is dropped because of a bad network connection, or a bad phone line. To view the reason a call was abandoned, go to:
webManager > Reports > Contact History.
% Abandon The percentage of total calls associated with the point of contact that were abandoned
Page | 385
Contact Statistics
Column Description
during the specified half hour.
Avg Contact Length The average duration of contacts associated with the point of contact during the specified half hour.
Avg Agent Talk Time The average duration of time agents talked with the contacts associated with the point of contact.
Avg ASA The average speed of answer for the agent to pick up an inbound contact. For example, it took an agent 25 seconds to answer a call.
Max Q Duration The maximum duration of time contacts associated with the point of contact were in queue during the specified half hour.
Total Duration The duration of time contacts associated with the point of contact were in inContact.
Total Agt Duration The total duration of time the agent handled contacts associated with this point of contact.
Service Level The service level percentage that was reached for the points of contact during the specified half hour. The Service Level is configured in webManager > Skills.
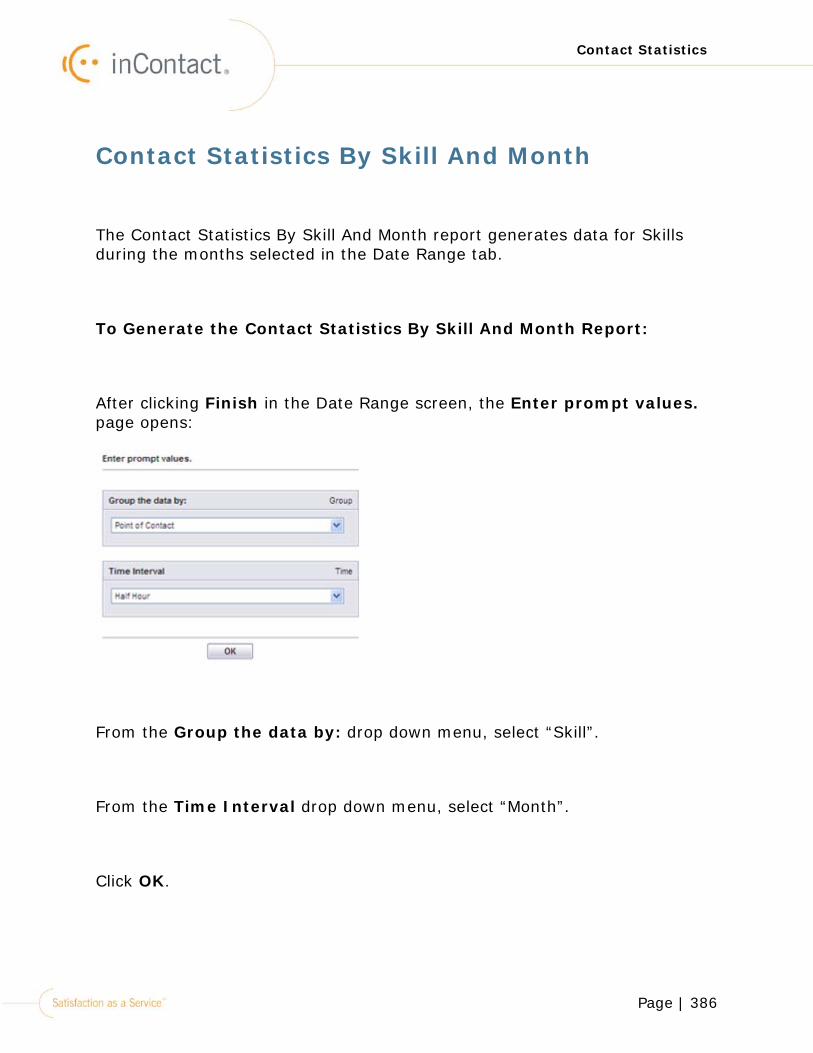
Page | 386
Contact Statistics
Contact Statistics By Skill And Month
The Contact Statistics By Skill And Month report generates data for Skills during the months selected in the Date Range tab.
To Generate the Contact Statistics By Skill And Month Report:
After clicking Finish in the Date Range screen, the Enter prompt values. page opens:
From the Group the data by: drop down menu, select “Skill”.
From the Time Interval drop down menu, select “Month”.
Click OK.
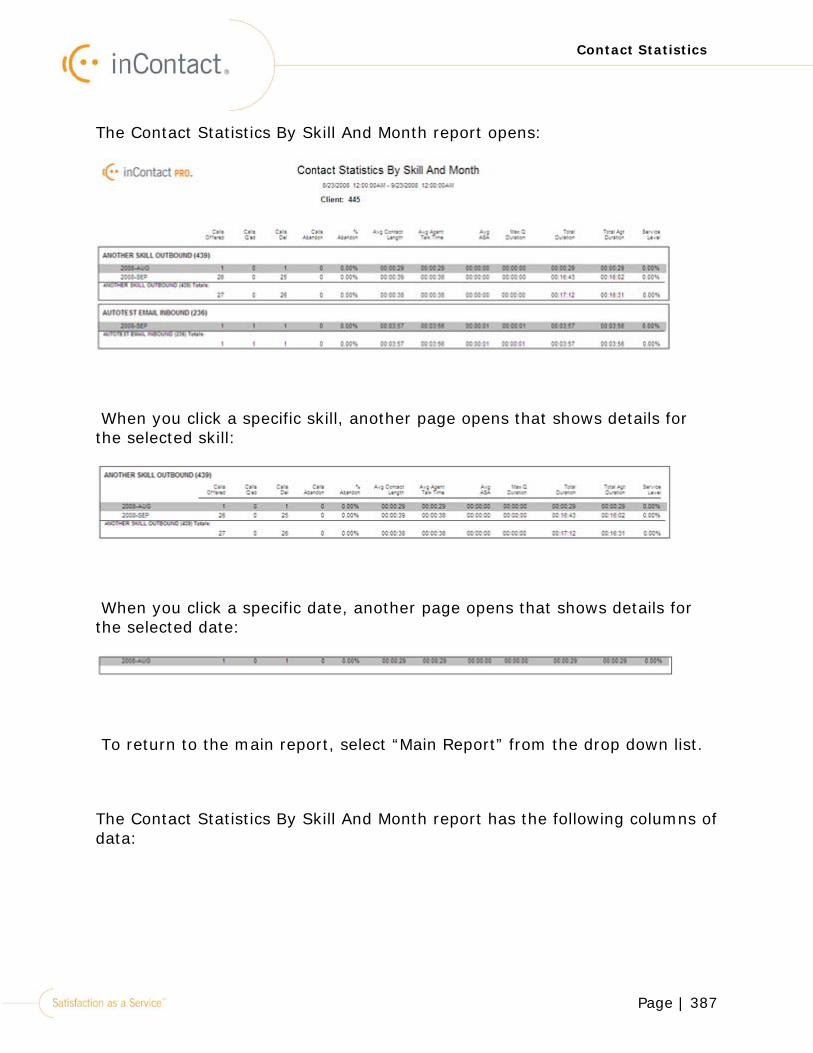
Page | 387
Contact Statistics
The Contact Statistics By Skill And Month report opens:
When you click a specific skill, another page opens that shows details for the selected skill:
When you click a specific date, another page opens that shows details for the selected date:
To return to the main report, select “Main Report” from the drop down list.
The Contact Statistics By Skill And Month report has the following columns of data:
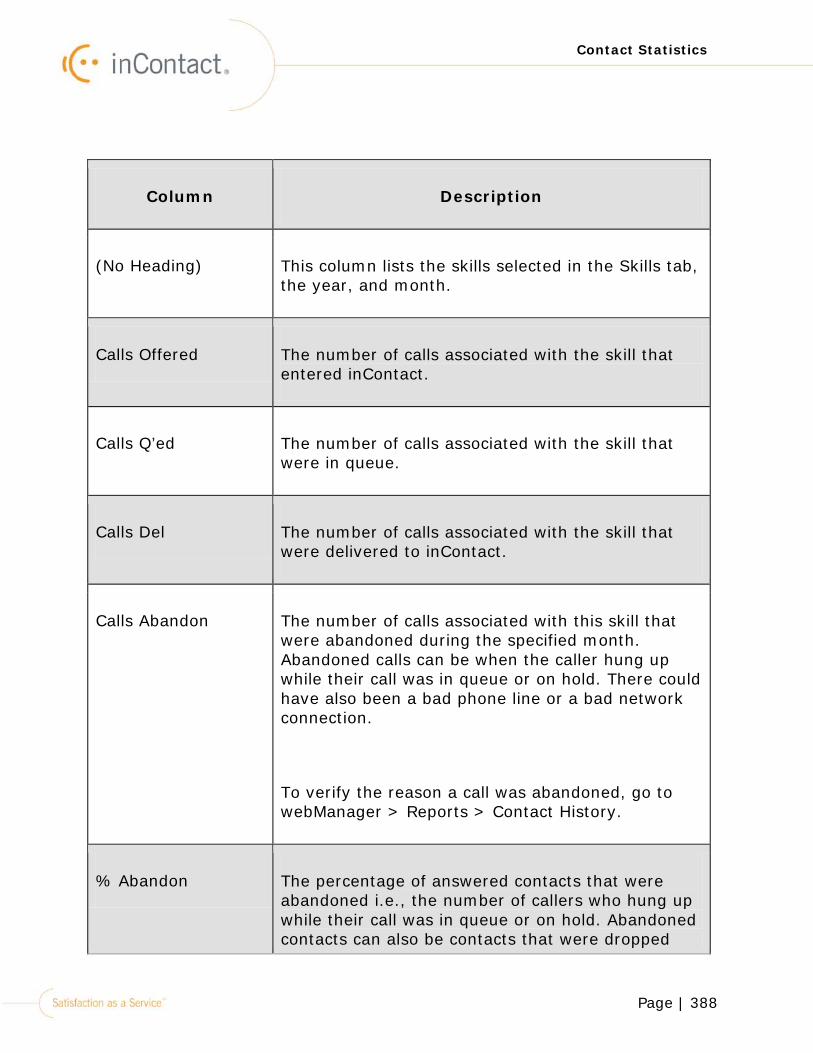
Page | 388
Contact Statistics
Column Description
(No Heading) This column lists the skills selected in the Skills tab, the year, and month.
Calls Offered The number of calls associated with the skill that entered inContact.
Calls Q’ed The number of calls associated with the skill that were in queue.
Calls Del The number of calls associated with the skill that were delivered to inContact.
Calls Abandon The number of calls associated with this skill that were abandoned during the specified month. Abandoned calls can be when the caller hung up while their call was in queue or on hold. There could have also been a bad phone line or a bad network connection.
To verify the reason a call was abandoned, go to webManager > Reports > Contact History.
% Abandon The percentage of answered contacts that were abandoned i.e., the number of callers who hung up while their call was in queue or on hold. Abandoned contacts can also be contacts that were dropped
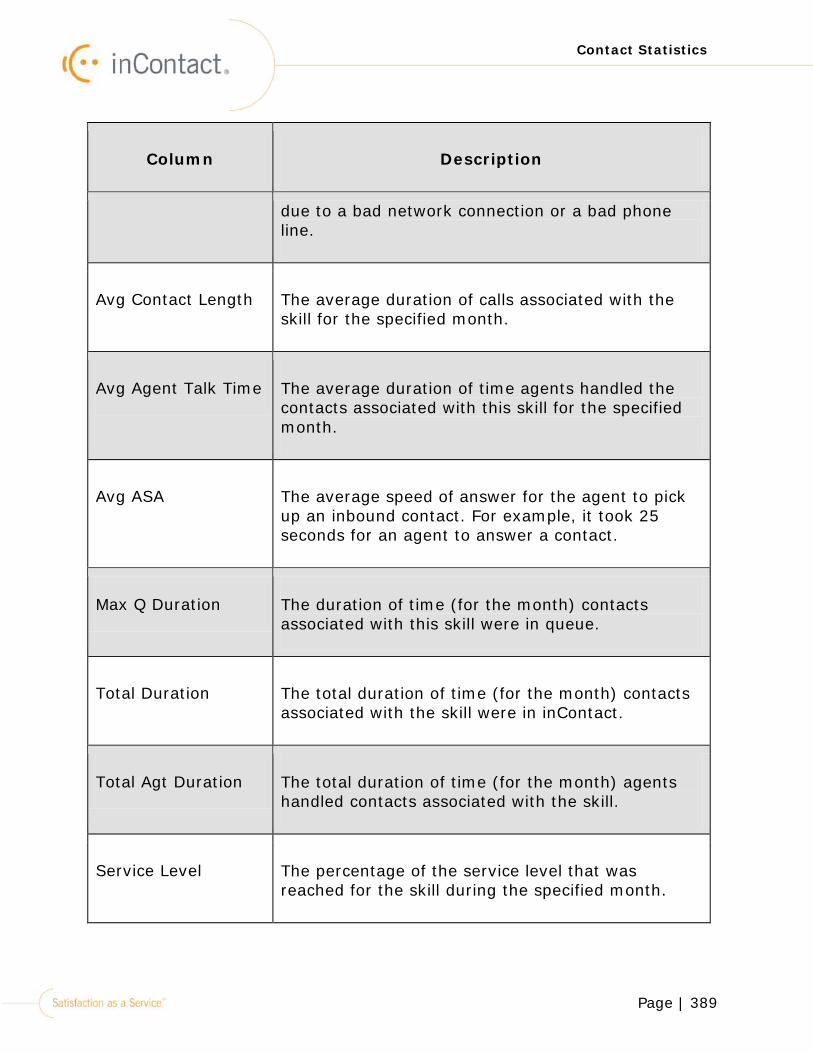
Page | 389
Contact Statistics
Column Description
due to a bad network connection or a bad phone line.
Avg Contact Length The average duration of calls associated with the skill for the specified month.
Avg Agent Talk Time The average duration of time agents handled the contacts associated with this skill for the specified month.
Avg ASA The average speed of answer for the agent to pick up an inbound contact. For example, it took 25 seconds for an agent to answer a contact.
Max Q Duration The duration of time (for the month) contacts associated with this skill were in queue.
Total Duration The total duration of time (for the month) contacts associated with the skill were in inContact.
Total Agt Duration The total duration of time (for the month) agents handled contacts associated with the skill.
Service Level The percentage of the service level that was reached for the skill during the specified month.
Page | 390
Contact Statistics
Column Description
Note! The service level is configured in webManager > Skills.

Page | 391
Contact Statistics
Contact Statistics By Skill And Day
The Contact Statistics By Skill And Day report generates data for Skills during the time selected in the Date Range tab.
To Generate the Contact Statistics By Skill And Day Report:
After clicking Finish in the Date Range screen, the Enter prompt values. page opens:
From the Group the data by: drop down menu, select “Skill”.
From the Time Interval drop down menu, select “Day”.
Click OK.
The Contact Statistics By Skill And Day report opens:

Page | 392
Contact Statistics
When you click a specific skill, another page opens that shows details for the selected skill:
When you click a specific date, another page opens that shows details for the selected date:
To return to the main report, select “Main Report” from the drop down list.
The Contact Statistics By Skill And Day report has the following columns of data for the specified day:
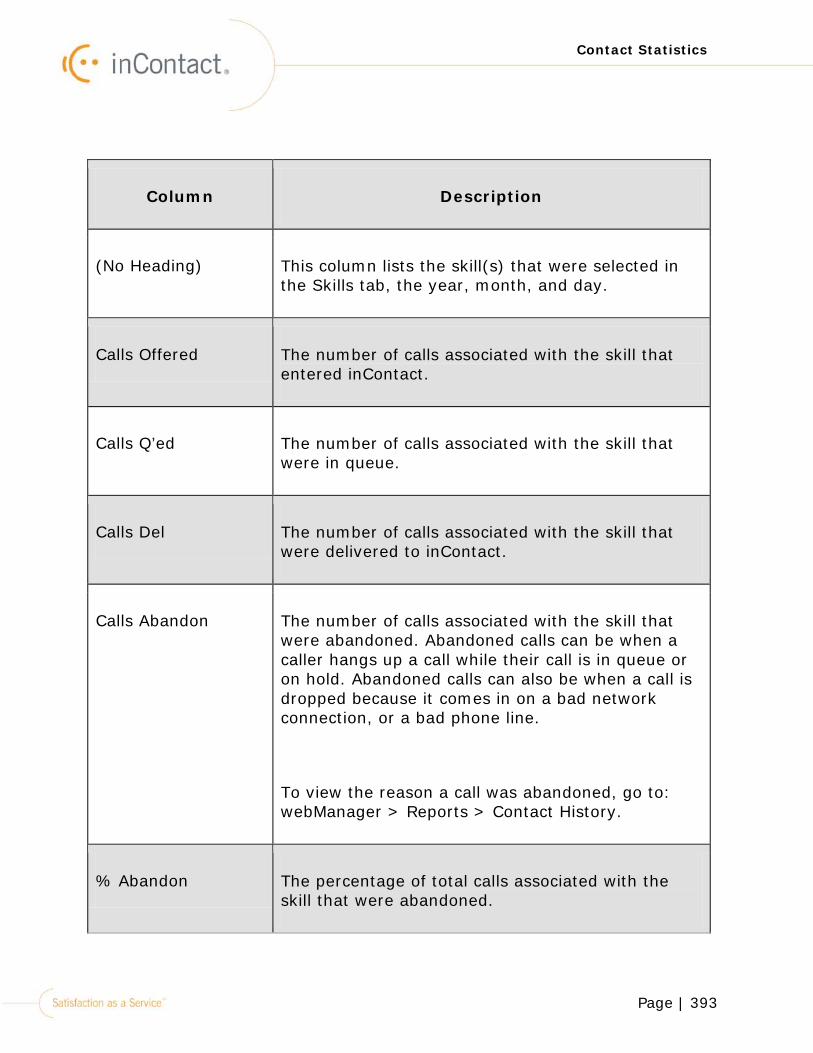
Page | 393
Contact Statistics
Column Description
(No Heading) This column lists the skill(s) that were selected in the Skills tab, the year, month, and day.
Calls Offered The number of calls associated with the skill that entered inContact.
Calls Q’ed The number of calls associated with the skill that were in queue.
Calls Del The number of calls associated with the skill that were delivered to inContact.
Calls Abandon The number of calls associated with the skill that were abandoned. Abandoned calls can be when a caller hangs up a call while their call is in queue or on hold. Abandoned calls can also be when a call is dropped because it comes in on a bad network connection, or a bad phone line.
To view the reason a call was abandoned, go to: webManager > Reports > Contact History.
% Abandon The percentage of total calls associated with the skill that were abandoned.
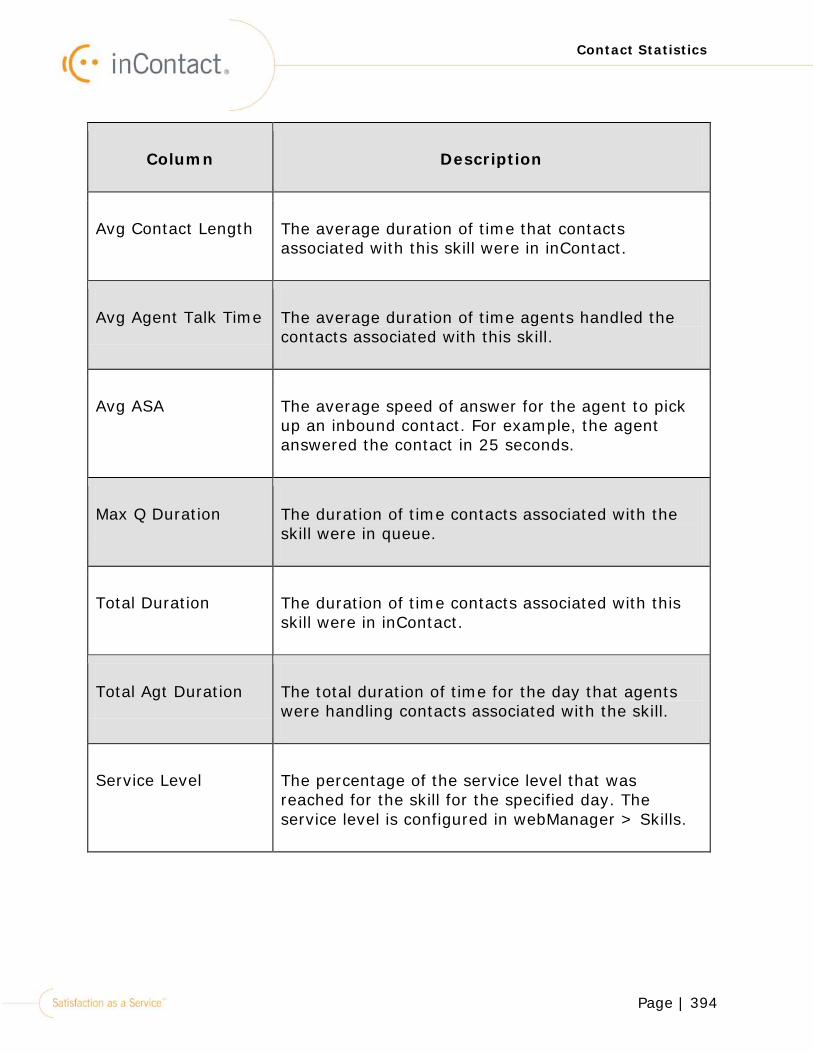
Page | 394
Contact Statistics
Column Description
Avg Contact Length The average duration of time that contacts associated with this skill were in inContact.
Avg Agent Talk Time The average duration of time agents handled the contacts associated with this skill.
Avg ASA The average speed of answer for the agent to pick up an inbound contact. For example, the agent answered the contact in 25 seconds.
Max Q Duration The duration of time contacts associated with the skill were in queue.
Total Duration The duration of time contacts associated with this skill were in inContact.
Total Agt Duration The total duration of time for the day that agents were handling contacts associated with the skill.
Service Level The percentage of the service level that was reached for the skill for the specified day. The service level is configured in webManager > Skills.
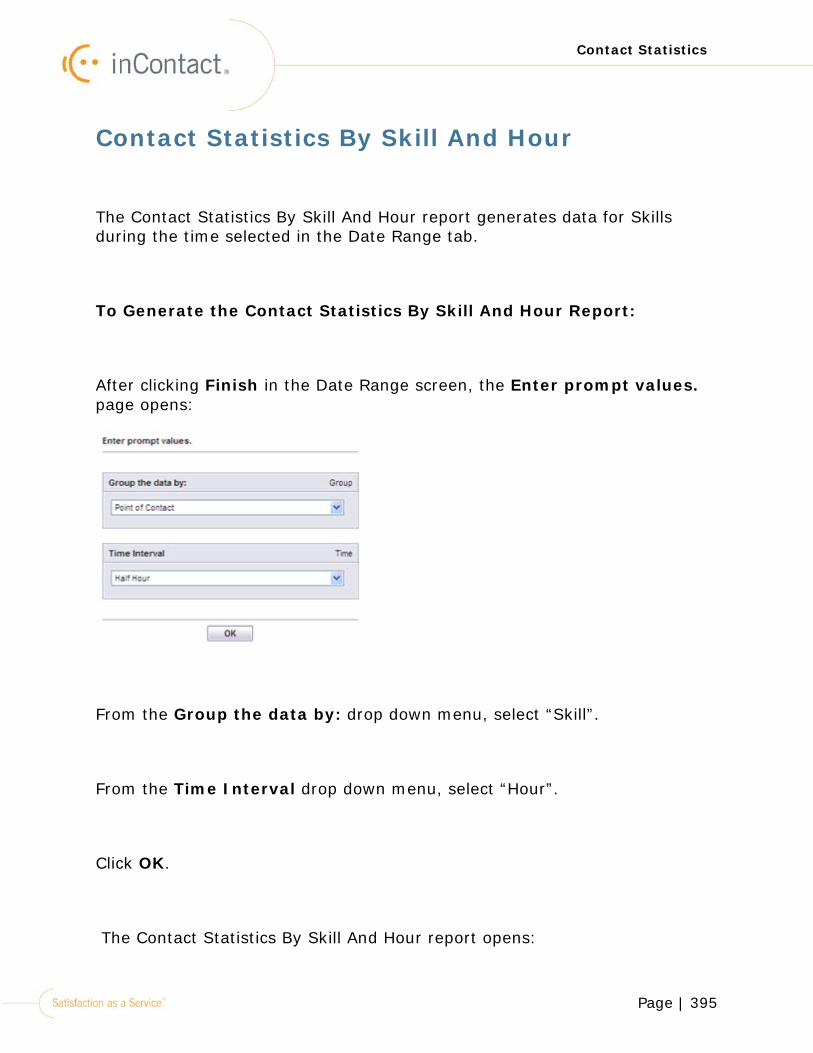
Page | 395
Contact Statistics
Contact Statistics By Skill And Hour
The Contact Statistics By Skill And Hour report generates data for Skills during the time selected in the Date Range tab.
To Generate the Contact Statistics By Skill And Hour Report:
After clicking Finish in the Date Range screen, the Enter prompt values. page opens:
From the Group the data by: drop down menu, select “Skill”.
From the Time Interval drop down menu, select “Hour”.
Click OK.
The Contact Statistics By Skill And Hour report opens:
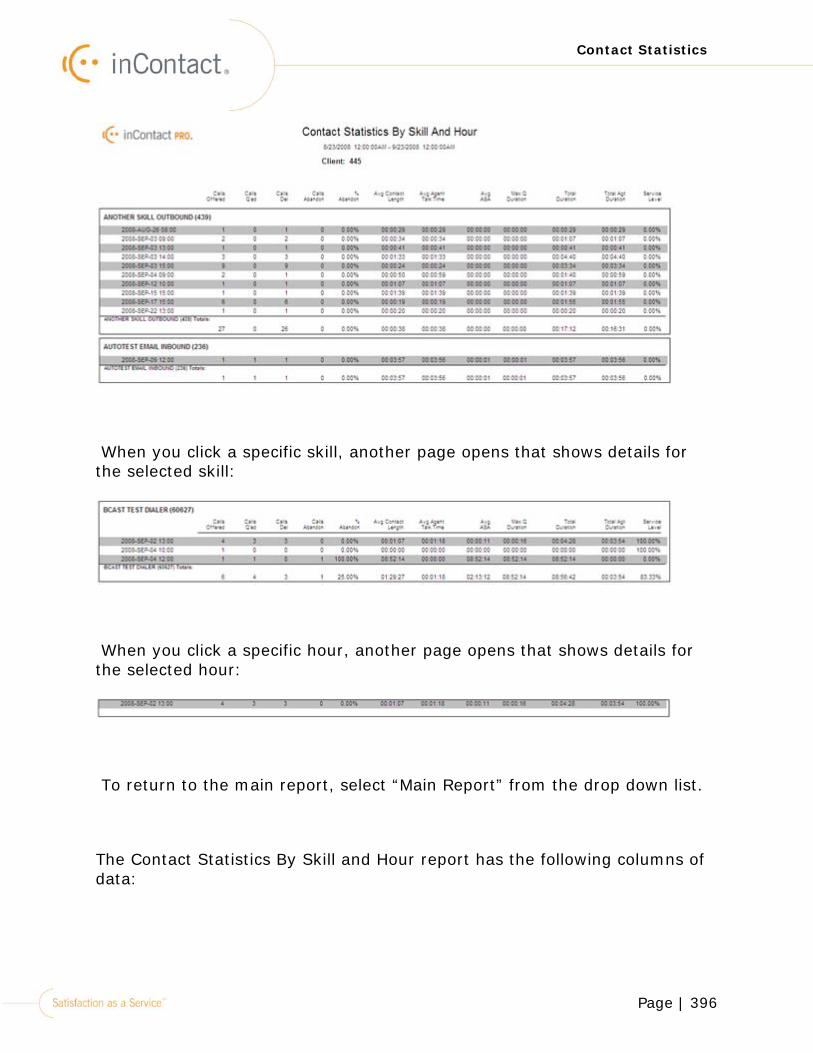
Page | 396
Contact Statistics
When you click a specific skill, another page opens that shows details for the selected skill:
When you click a specific hour, another page opens that shows details for the selected hour:
To return to the main report, select “Main Report” from the drop down list.
The Contact Statistics By Skill and Hour report has the following columns of data:
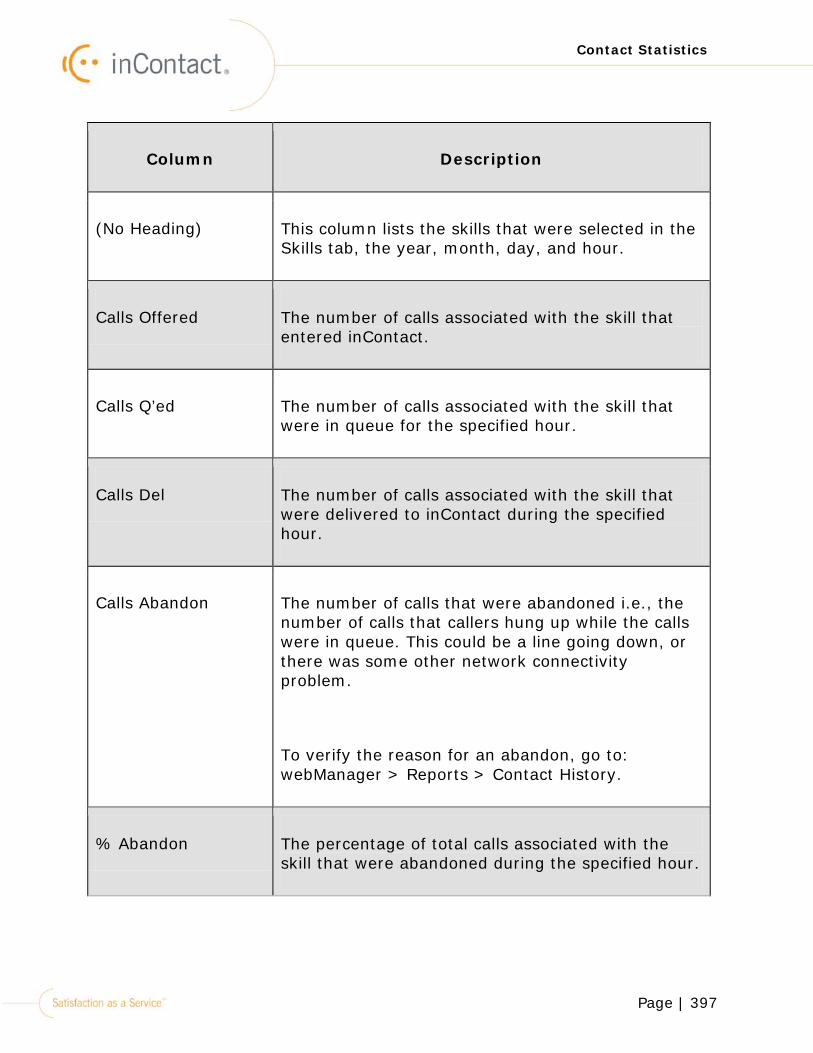
Page | 397
Contact Statistics
Column Description
(No Heading) This column lists the skills that were selected in the Skills tab, the year, month, day, and hour.
Calls Offered The number of calls associated with the skill that entered inContact.
Calls Q’ed The number of calls associated with the skill that were in queue for the specified hour.
Calls Del The number of calls associated with the skill that were delivered to inContact during the specified hour.
Calls Abandon The number of calls that were abandoned i.e., the number of calls that callers hung up while the calls were in queue. This could be a line going down, or there was some other network connectivity problem.
To verify the reason for an abandon, go to: webManager > Reports > Contact History.
% Abandon The percentage of total calls associated with the skill that were abandoned during the specified hour.
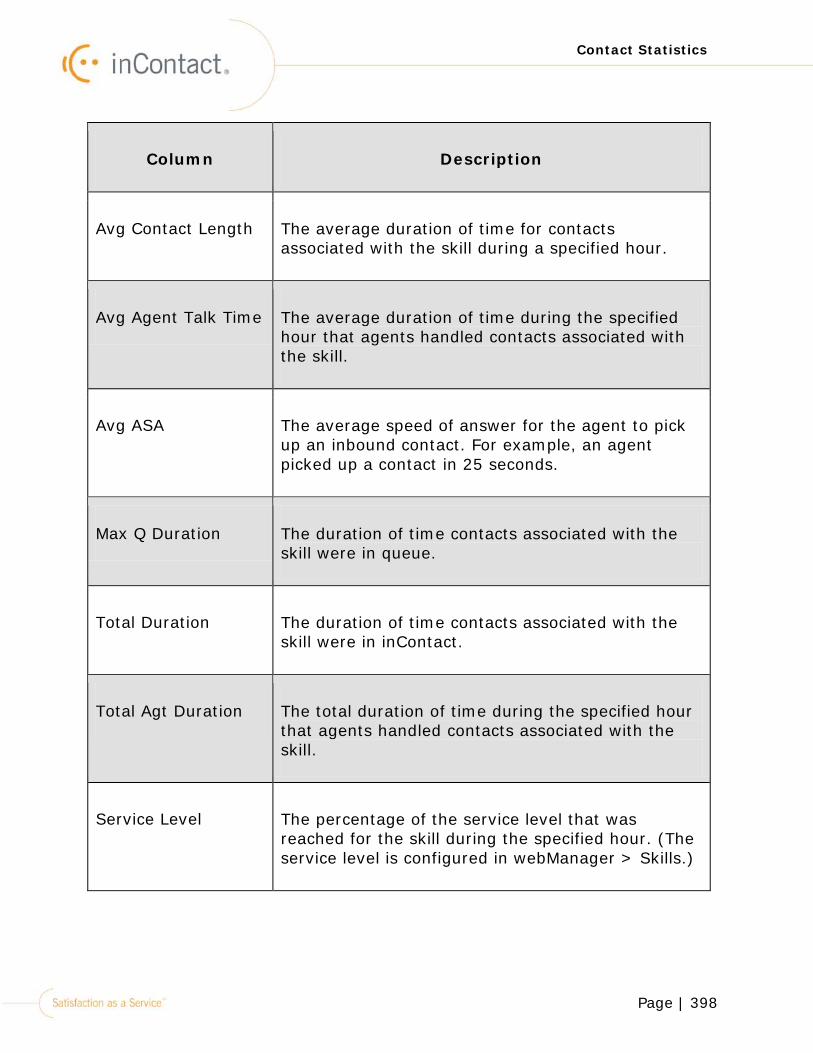
Page | 398
Contact Statistics
Column Description
Avg Contact Length The average duration of time for contacts associated with the skill during a specified hour.
Avg Agent Talk Time The average duration of time during the specified hour that agents handled contacts associated with the skill.
Avg ASA The average speed of answer for the agent to pick up an inbound contact. For example, an agent picked up a contact in 25 seconds.
Max Q Duration The duration of time contacts associated with the skill were in queue.
Total Duration The duration of time contacts associated with the skill were in inContact.
Total Agt Duration The total duration of time during the specified hour that agents handled contacts associated with the skill.
Service Level The percentage of the service level that was reached for the skill during the specified hour. (The service level is configured in webManager > Skills.)

Page | 399
Contact Statistics
Contact Statistics By Skill And Half Hour
This report shows data for skills, organized by half hour.
To Generate the Contact Statistics By Skill And Half Hour Report:
After clicking Finish in the Date Range screen, the Enter prompt values. page opens:
From the Group the data by: drop down menu, select “Skill”.
From the Time Interval drop down menu, select “Half Hour”.
Click OK.
The Contact Statistics By Skill And Half Hour report opens:
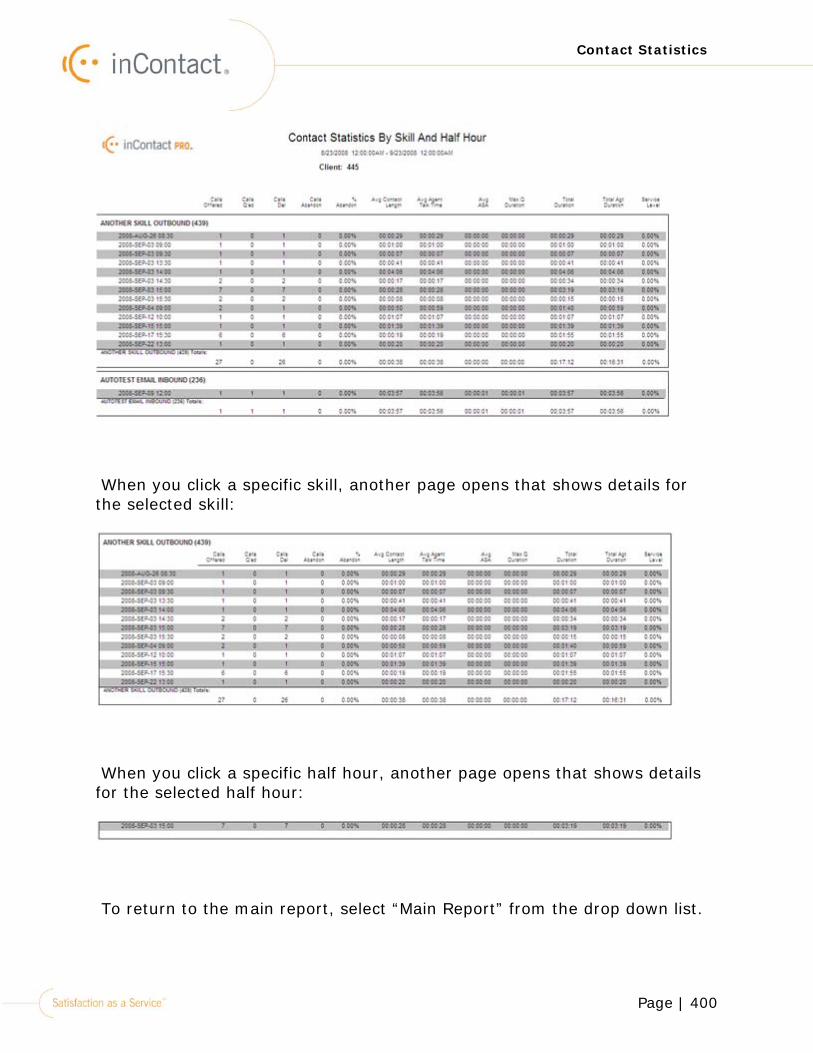
Page | 400
Contact Statistics
When you click a specific skill, another page opens that shows details for the selected skill:
When you click a specific half hour, another page opens that shows details for the selected half hour:
To return to the main report, select “Main Report” from the drop down list.
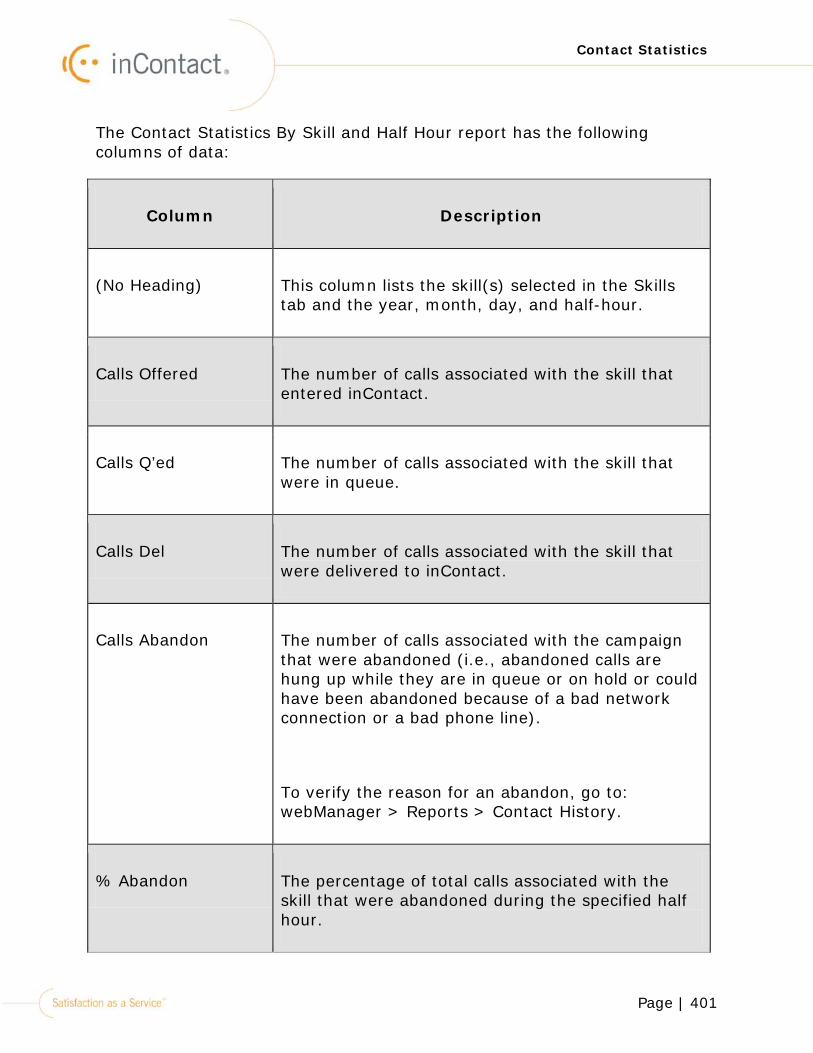
Page | 401
Contact Statistics
The Contact Statistics By Skill and Half Hour report has the following columns of data:
Column Description
(No Heading) This column lists the skill(s) selected in the Skills tab and the year, month, day, and half-hour.
Calls Offered The number of calls associated with the skill that entered inContact.
Calls Q’ed The number of calls associated with the skill that were in queue.
Calls Del The number of calls associated with the skill that were delivered to inContact.
Calls Abandon The number of calls associated with the campaign that were abandoned (i.e., abandoned calls are hung up while they are in queue or on hold or could have been abandoned because of a bad network connection or a bad phone line).
To verify the reason for an abandon, go to: webManager > Reports > Contact History.
% Abandon The percentage of total calls associated with the skill that were abandoned during the specified half hour.
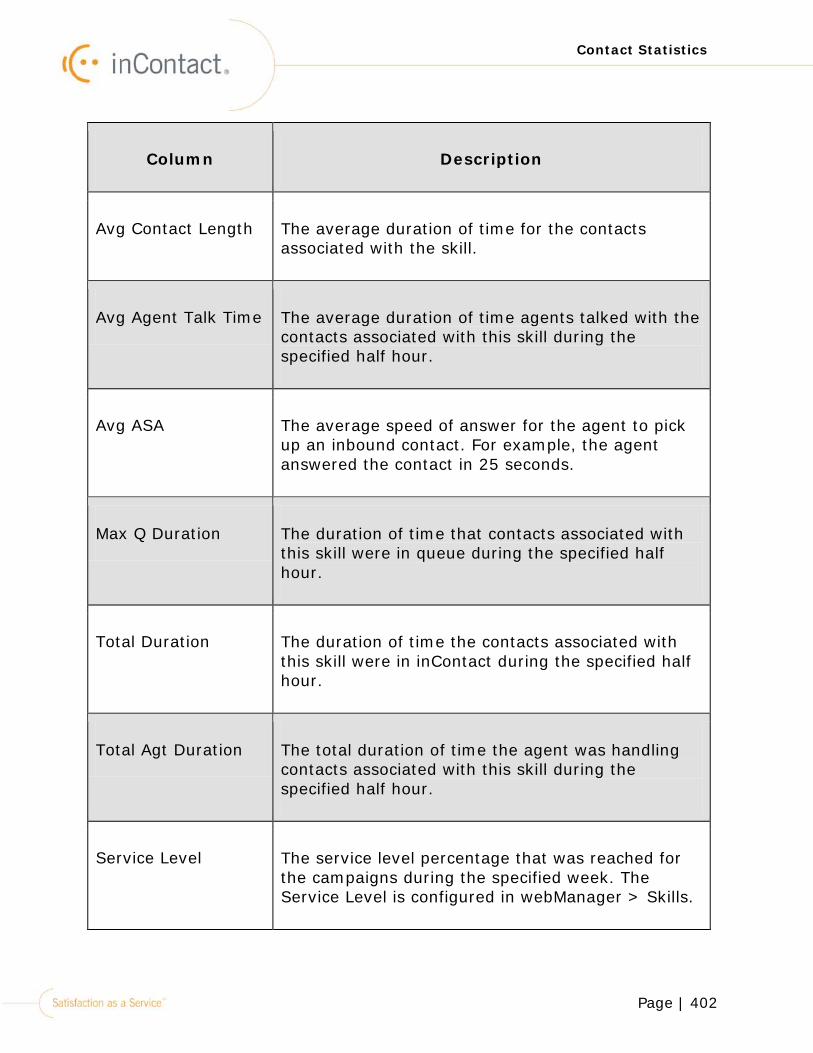
Page | 402
Contact Statistics
Column Description
Avg Contact Length The average duration of time for the contacts associated with the skill.
Avg Agent Talk Time The average duration of time agents talked with the contacts associated with this skill during the specified half hour.
Avg ASA The average speed of answer for the agent to pick up an inbound contact. For example, the agent answered the contact in 25 seconds.
Max Q Duration The duration of time that contacts associated with this skill were in queue during the specified half hour.
Total Duration The duration of time the contacts associated with this skill were in inContact during the specified half hour.
Total Agt Duration The total duration of time the agent was handling contacts associated with this skill during the specified half hour.
Service Level The service level percentage that was reached for the campaigns during the specified week. The Service Level is configured in webManager > Skills.
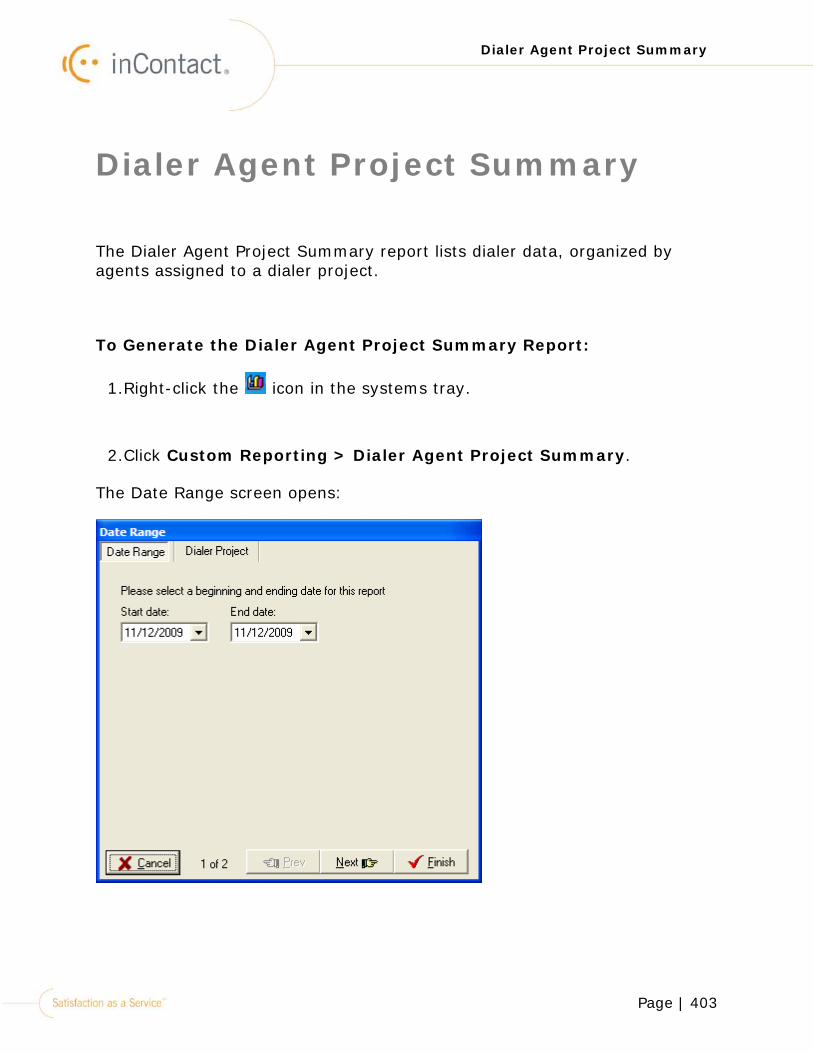
Page | 403
Dialer Agent Project Summary
Dialer Agent Project Summary
The Dialer Agent Project Summary report lists dialer data, organized by agents assigned to a dialer project.
To Generate the Dialer Agent Project Summary Report:
1.Right-click the icon in the systems tray.
2.Click Custom Reporting > Dialer Agent Project Summary.
The Date Range screen opens:

Page | 404
Dialer Agent Project Summary
3.Select the Start date for the report.
4.Select the End date for the report.
5.Click the Next button.
The Dialer Project tab opens:
6.Click to move the selected dialer project(s) from the Available dialer
projects box to the Dialer projects in this report box. Click to move all dialer projects.
7. Click to move the selected dialer projects from the Dialer projects in this report box to the Available dialer projects box. Click to move all dialer projects.
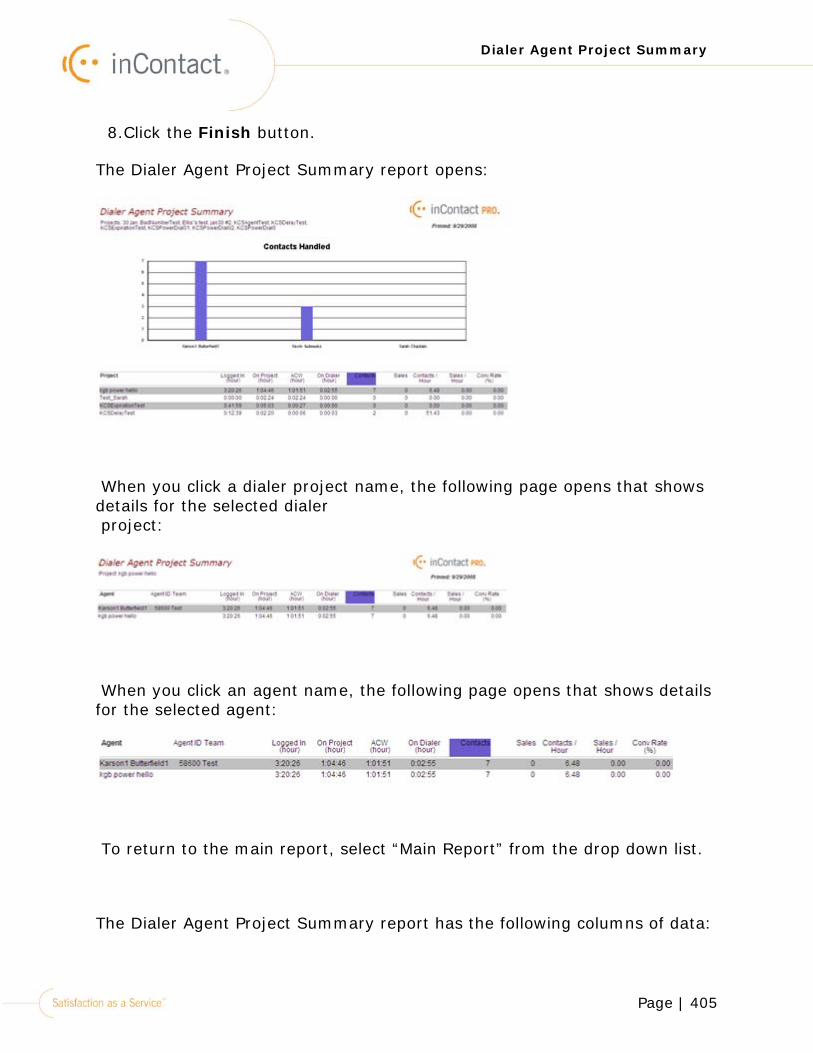
Page | 405
Dialer Agent Project Summary
8.Click the Finish button.
The Dialer Agent Project Summary report opens:
When you click a dialer project name, the following page opens that shows details for the selected dialer project:
When you click an agent name, the following page opens that shows details for the selected agent:
To return to the main report, select “Main Report” from the drop down list.
The Dialer Agent Project Summary report has the following columns of data:
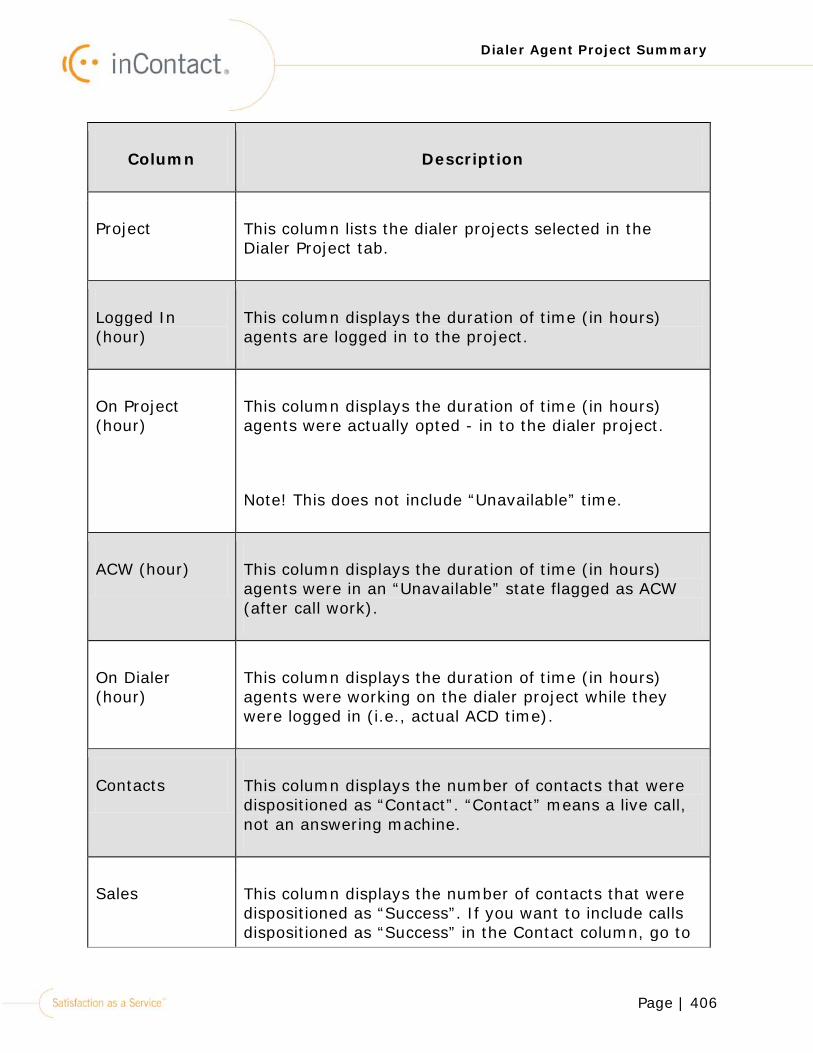
Page | 406
Dialer Agent Project Summary
Column Description
Project This column lists the dialer projects selected in the Dialer Project tab.
Logged In (hour)
This column displays the duration of time (in hours) agents are logged in to the project.
On Project (hour)
This column displays the duration of time (in hours) agents were actually opted - in to the dialer project.
Note! This does not include “Unavailable” time.
ACW (hour) This column displays the duration of time (in hours) agents were in an “Unavailable” state flagged as ACW (after call work).
On Dialer (hour)
This column displays the duration of time (in hours) agents were working on the dialer project while they were logged in (i.e., actual ACD time).
Contacts This column displays the number of contacts that were dispositioned as “Contact”. “Contact” means a live call, not an answering machine.
Sales This column displays the number of contacts that were dispositioned as “Success”. If you want to include calls dispositioned as “Success” in the Contact column, go to
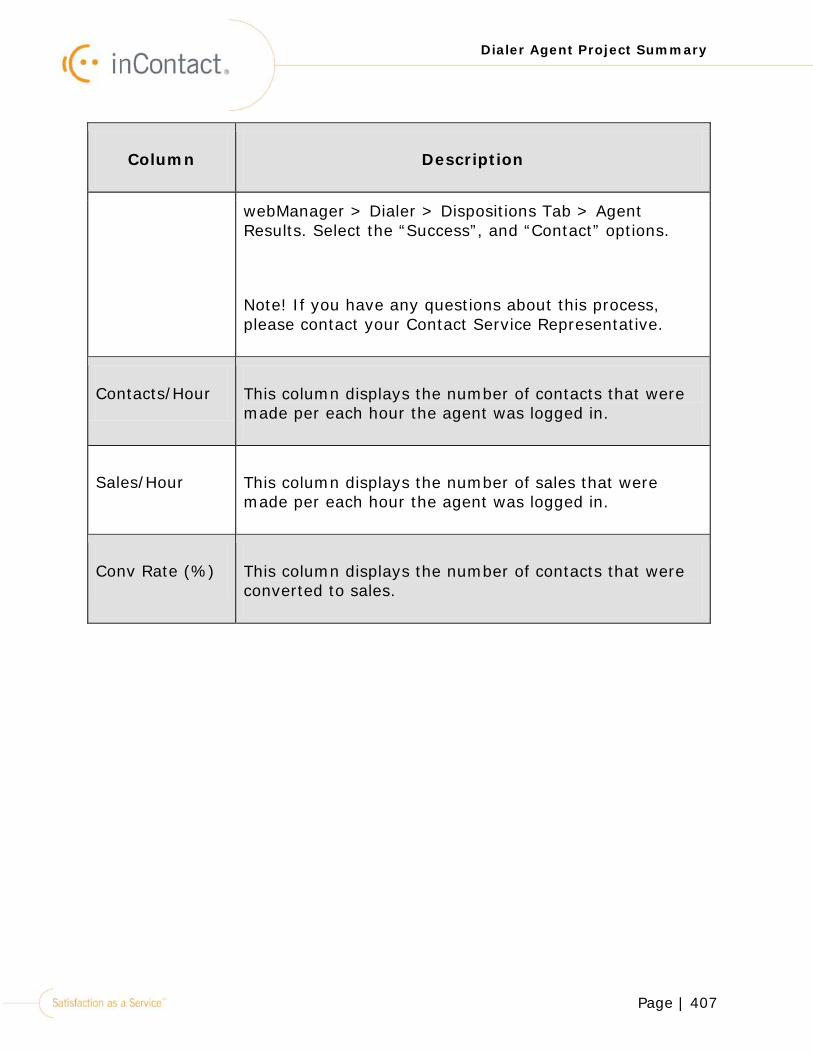
Page | 407
Dialer Agent Project Summary
Column Description
webManager > Dialer > Dispositions Tab > Agent Results. Select the “Success”, and “Contact” options.
Note! If you have any questions about this process, please contact your Contact Service Representative.
Contacts/Hour This column displays the number of contacts that were made per each hour the agent was logged in.
Sales/Hour This column displays the number of sales that were made per each hour the agent was logged in.
Conv Rate (%) This column displays the number of contacts that were converted to sales.
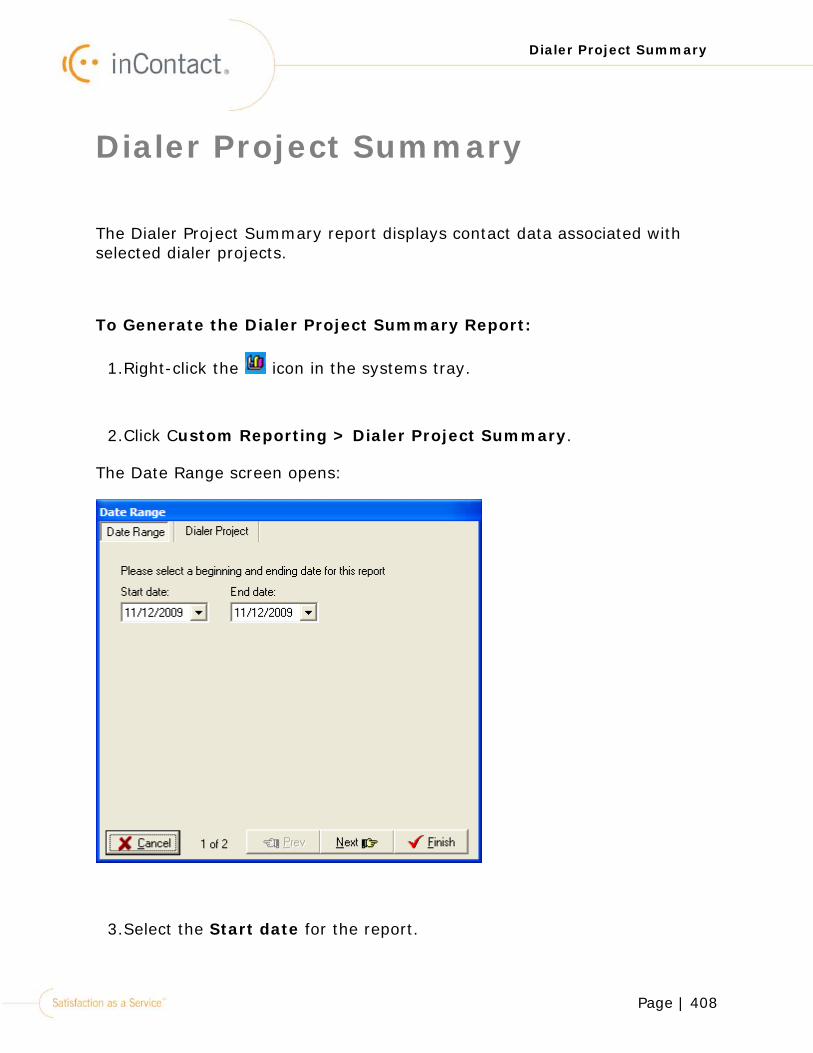
Page | 408
Dialer Project Summary
Dialer Project Summary
The Dialer Project Summary report displays contact data associated with selected dialer projects.
To Generate the Dialer Project Summary Report:
1.Right-click the icon in the systems tray.
2.Click Custom Reporting > Dialer Project Summary.
The Date Range screen opens:
3.Select the Start date for the report.
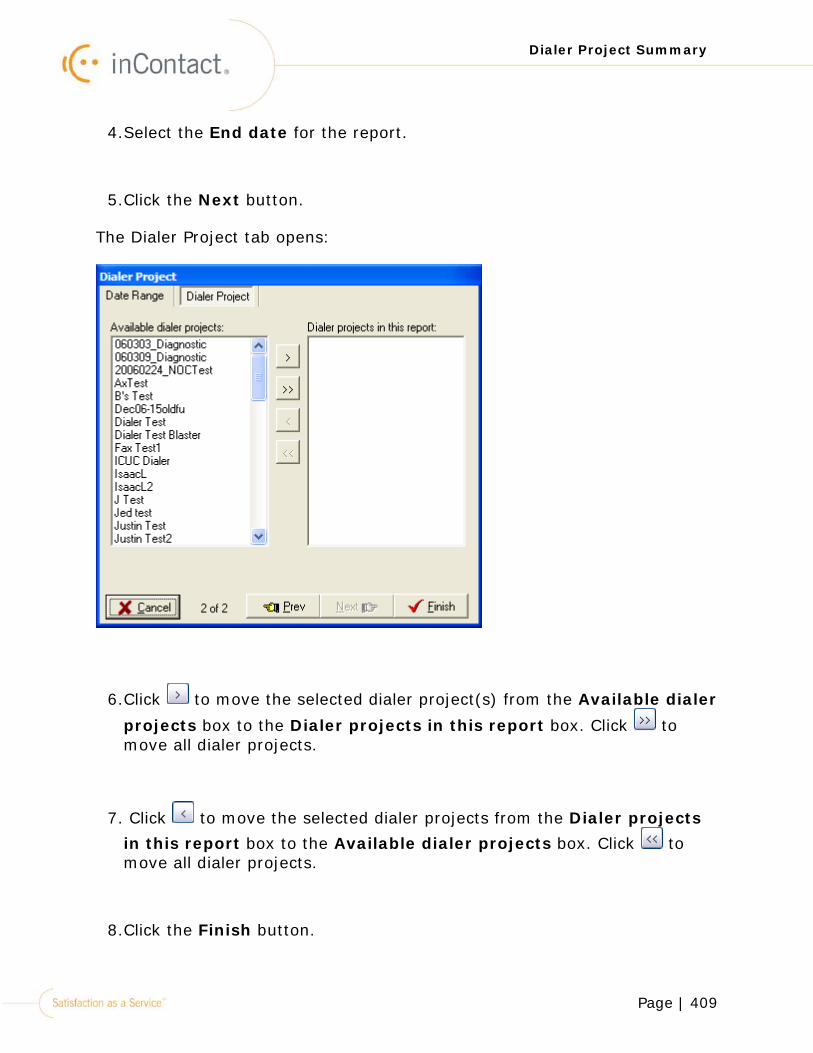
Page | 409
Dialer Project Summary
4.Select the End date for the report.
5.Click the Next button.
The Dialer Project tab opens:
6.Click to move the selected dialer project(s) from the Available dialer projects box to the Dialer projects in this report box. Click to move all dialer projects.
7. Click to move the selected dialer projects from the Dialer projects in this report box to the Available dialer projects box. Click to move all dialer projects.
8.Click the Finish button.
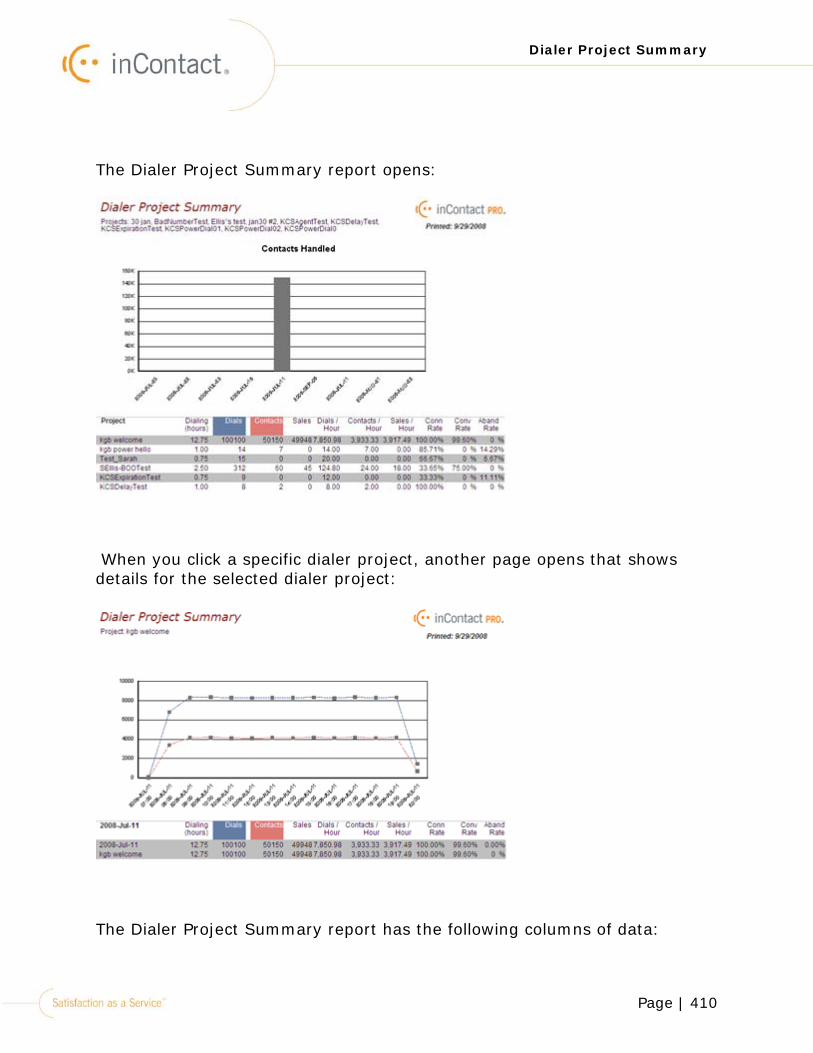
Page | 410
Dialer Project Summary
The Dialer Project Summary report opens:
When you click a specific dialer project, another page opens that shows details for the selected dialer project:
The Dialer Project Summary report has the following columns of data:
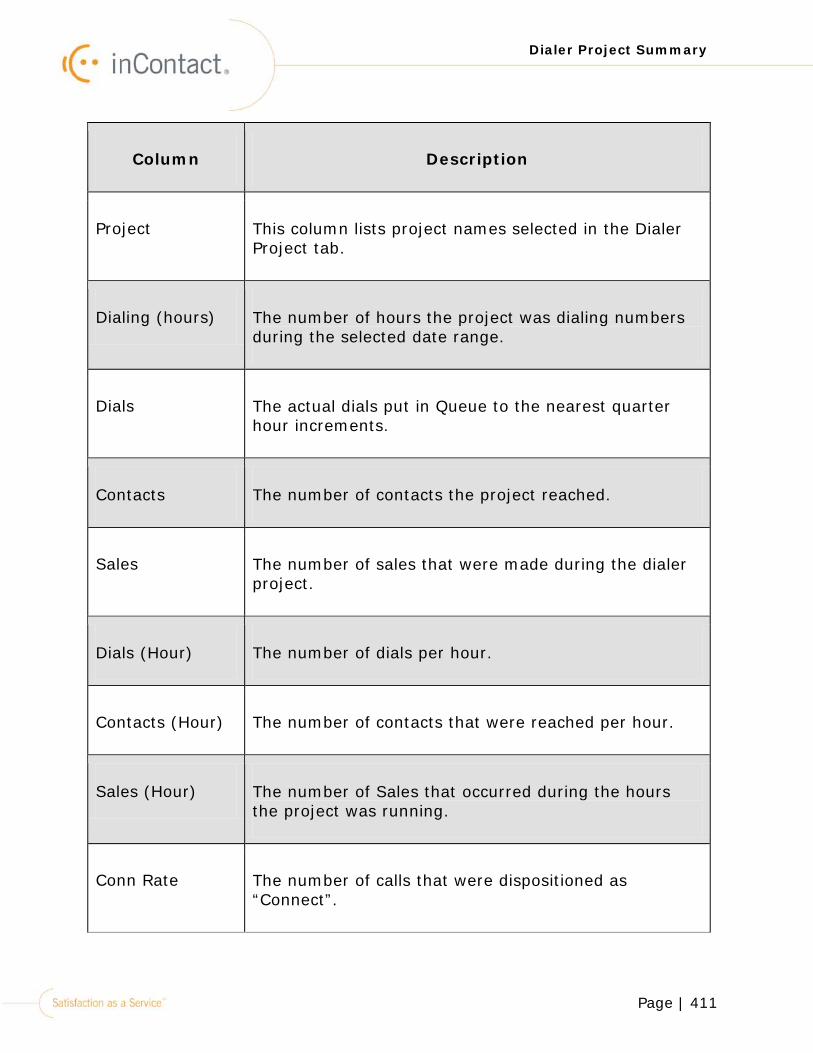
Page | 411
Dialer Project Summary
Column Description
Project This column lists project names selected in the Dialer Project tab.
Dialing (hours) The number of hours the project was dialing numbers during the selected date range.
Dials The actual dials put in Queue to the nearest quarter hour increments.
Contacts The number of contacts the project reached.
Sales The number of sales that were made during the dialer project.
Dials (Hour) The number of dials per hour.
Contacts (Hour) The number of contacts that were reached per hour.
Sales (Hour) The number of Sales that occurred during the hours the project was running.
Conn Rate The number of calls that were dispositioned as “Connect”.
Page | 412
Dialer Project Summary
Column Description
Conv Rate The number of calls that were dispositioned as “Success”.
Aband Rate The number of dials that were abandoned i.e., the dialed contacts that hung up, were disconnected, not serviced quick enough (for inbound), or were lost due to bad network connections.
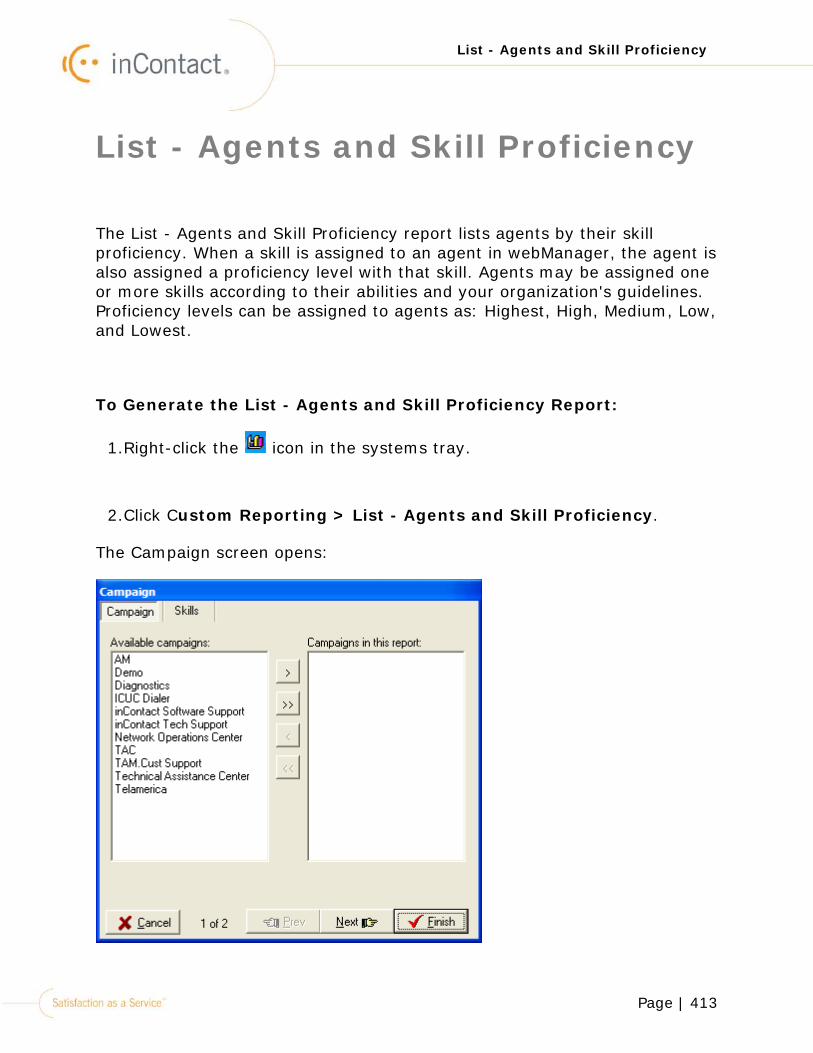
Page | 413
List - Agents and Skill Proficiency
List - Agents and Skill Proficiency
The List - Agents and Skill Proficiency report lists agents by their skill proficiency. When a skill is assigned to an agent in webManager, the agent is also assigned a proficiency level with that skill. Agents may be assigned one or more skills according to their abilities and your organization's guidelines. Proficiency levels can be assigned to agents as: Highest, High, Medium, Low, and Lowest.
To Generate the List - Agents and Skill Proficiency Report:
1.Right-click the icon in the systems tray.
2.Click Custom Reporting > List - Agents and Skill Proficiency.
The Campaign screen opens:
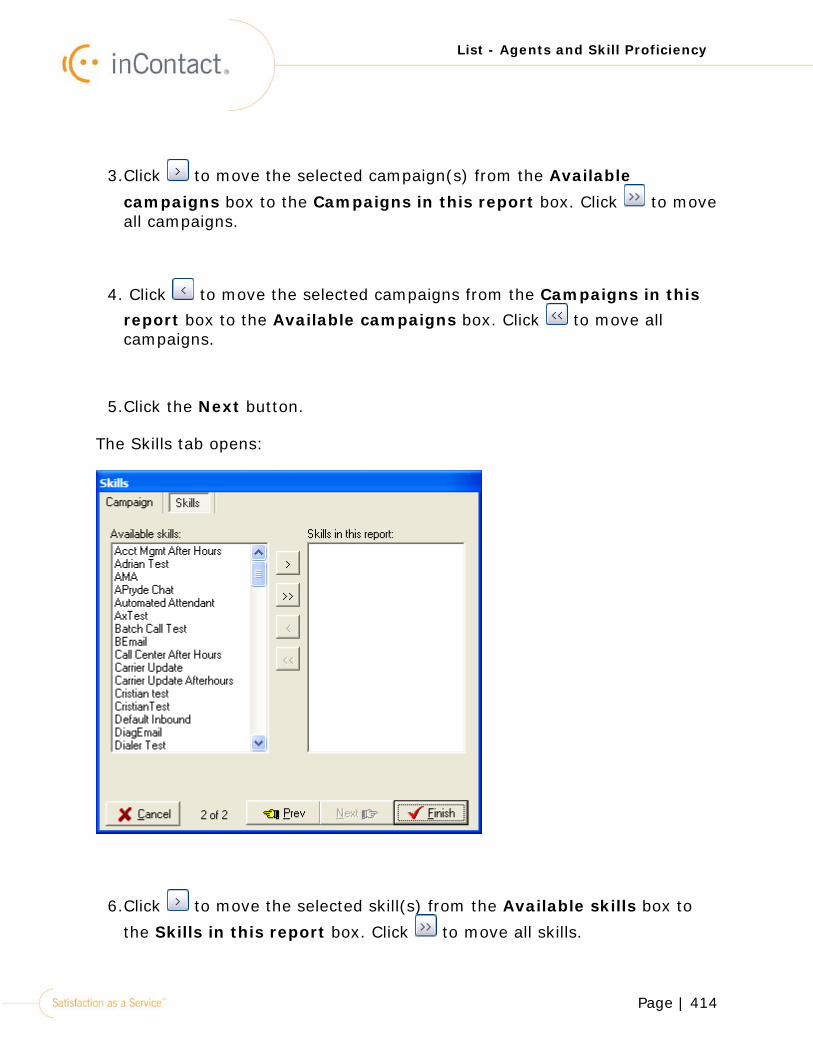
Page | 414
List - Agents and Skill Proficiency
3.Click to move the selected campaign(s) from the Available
campaigns box to the Campaigns in this report box. Click to move all campaigns.
4. Click to move the selected campaigns from the Campaigns in this report box to the Available campaigns box. Click to move all campaigns.
5.Click the Next button.
The Skills tab opens:
6.Click to move the selected skill(s) from the Available skills box to
the Skills in this report box. Click to move all skills.
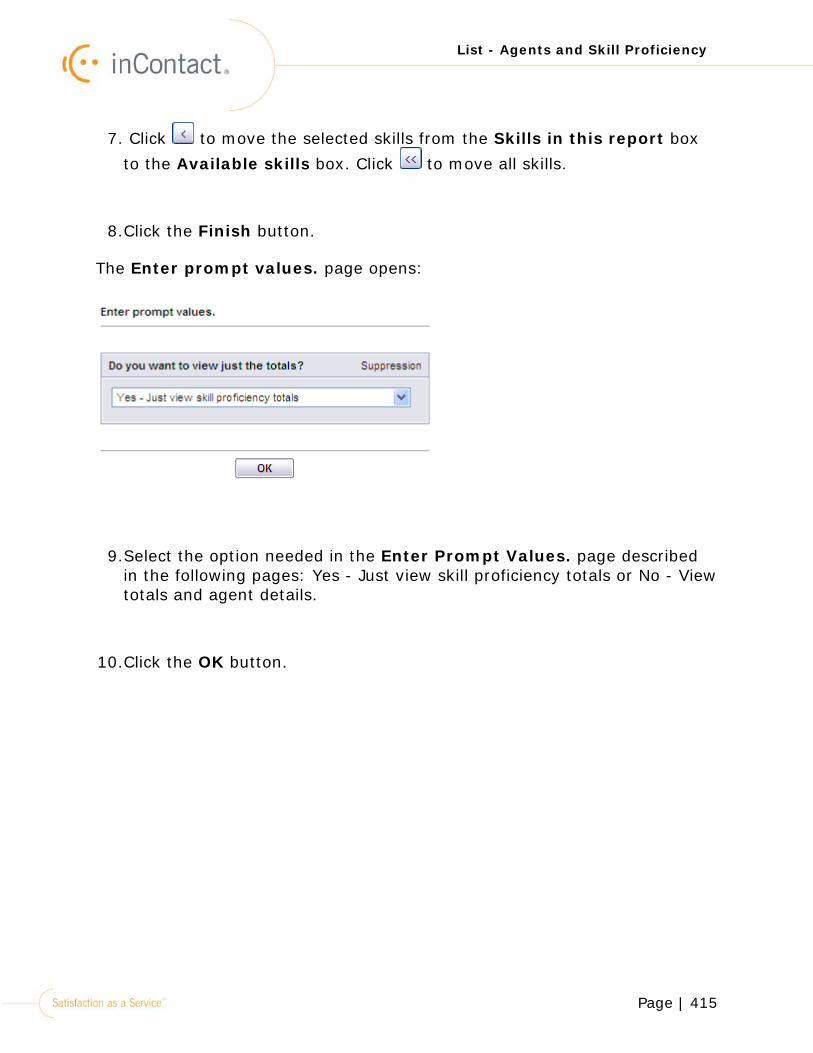
Page | 415
List - Agents and Skill Proficiency
7. Click to move the selected skills from the Skills in this report box to the Available skills box. Click to move all skills.
8.Click the Finish button.
The Enter prompt values. page opens:
9.Select the option needed in the Enter Prompt Values. page described in the following pages: Yes - Just view skill proficiency totals or No - View totals and agent details.
10.Click the OK button.
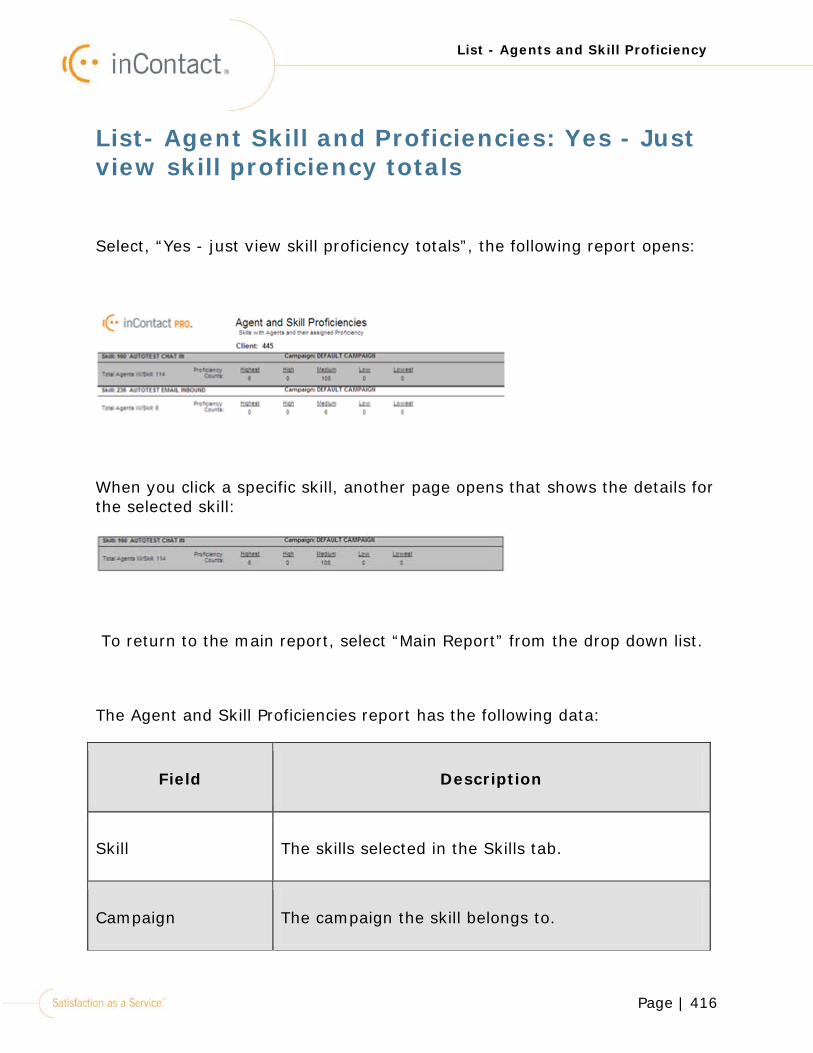
Page | 416
List - Agents and Skill Proficiency
List- Agent Skill and Proficiencies: Yes - Just view skill proficiency totals
Select, “Yes - just view skill proficiency totals”, the following report opens:
When you click a specific skill, another page opens that shows the details for the selected skill:
To return to the main report, select “Main Report” from the drop down list.
The Agent and Skill Proficiencies report has the following data:
Field Description
Skill The skills selected in the Skills tab.
Campaign The campaign the skill belongs to.
Page | 417
List - Agents and Skill Proficiency
Field Description
Total Agents W/Skill The total number of agents assigned to the skill.
Proficiency Counts Each agent can be assigned one of five skill proficiency levels in webManager > Agents > Skills tab; Highest, High, Medium, Low, and Lowest.
The Proficiency Counts show the number of agents who have been assigned to each proficiency level for the skill.
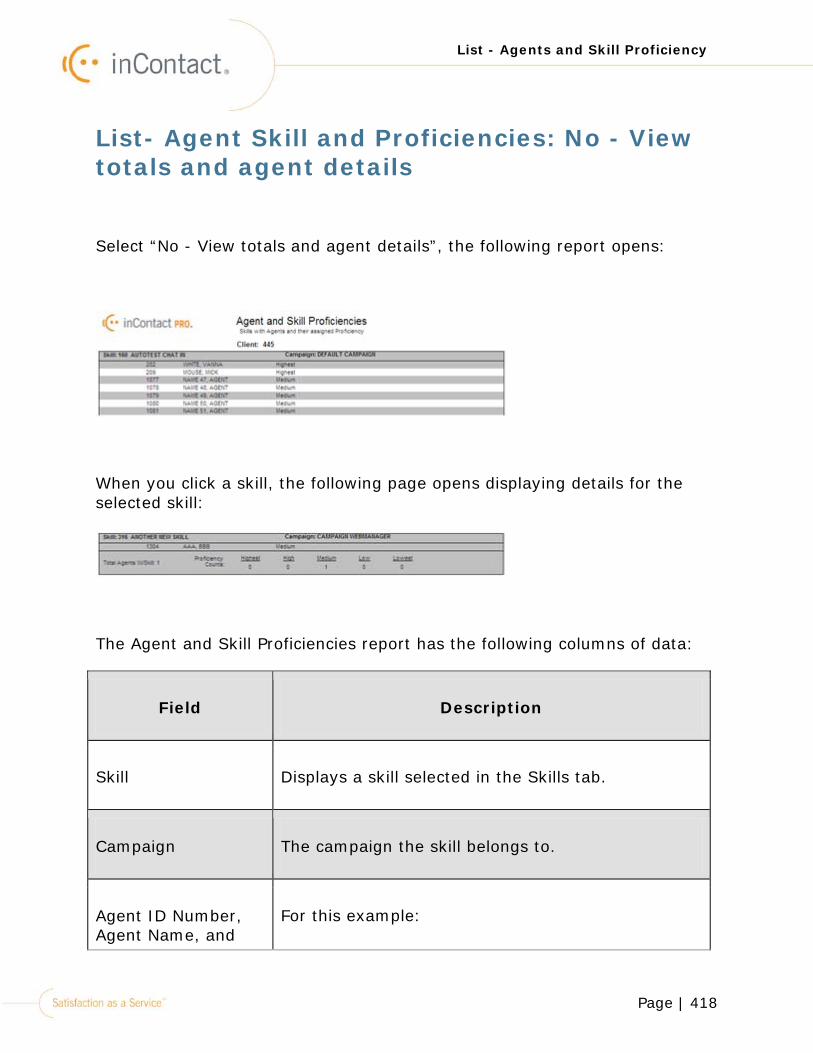
Page | 418
List - Agents and Skill Proficiency
List- Agent Skill and Proficiencies: No - View totals and agent details
Select “No - View totals and agent details”, the following report opens:
When you click a skill, the following page opens displaying details for the selected skill:
The Agent and Skill Proficiencies report has the following columns of data:
Field Description
Skill Displays a skill selected in the Skills tab.
Campaign The campaign the skill belongs to.
Agent ID Number, Agent Name, and
For this example:
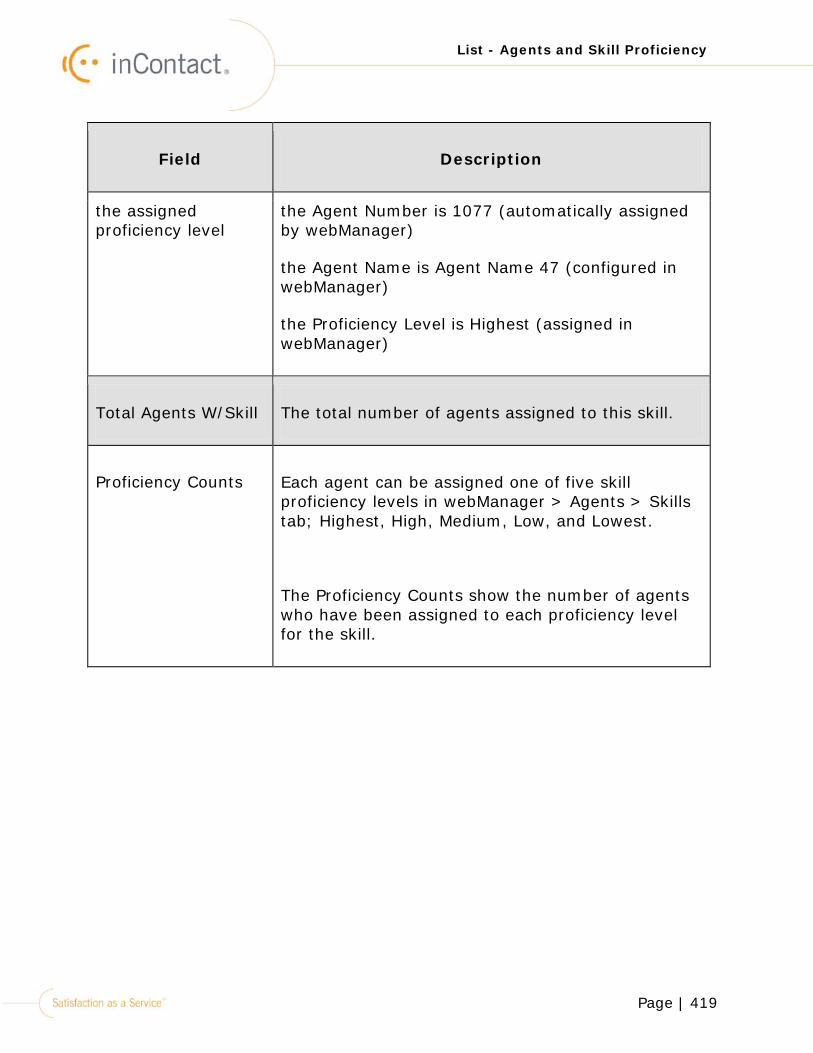
Page | 419
List - Agents and Skill Proficiency
Field Description
the assigned proficiency level
the Agent Number is 1077 (automatically assigned by webManager)
the Agent Name is Agent Name 47 (configured in webManager)
the Proficiency Level is Highest (assigned in webManager)
Total Agents W/Skill The total number of agents assigned to this skill.
Proficiency Counts Each agent can be assigned one of five skill proficiency levels in webManager > Agents > Skills tab; Highest, High, Medium, Low, and Lowest.
The Proficiency Counts show the number of agents who have been assigned to each proficiency level for the skill.
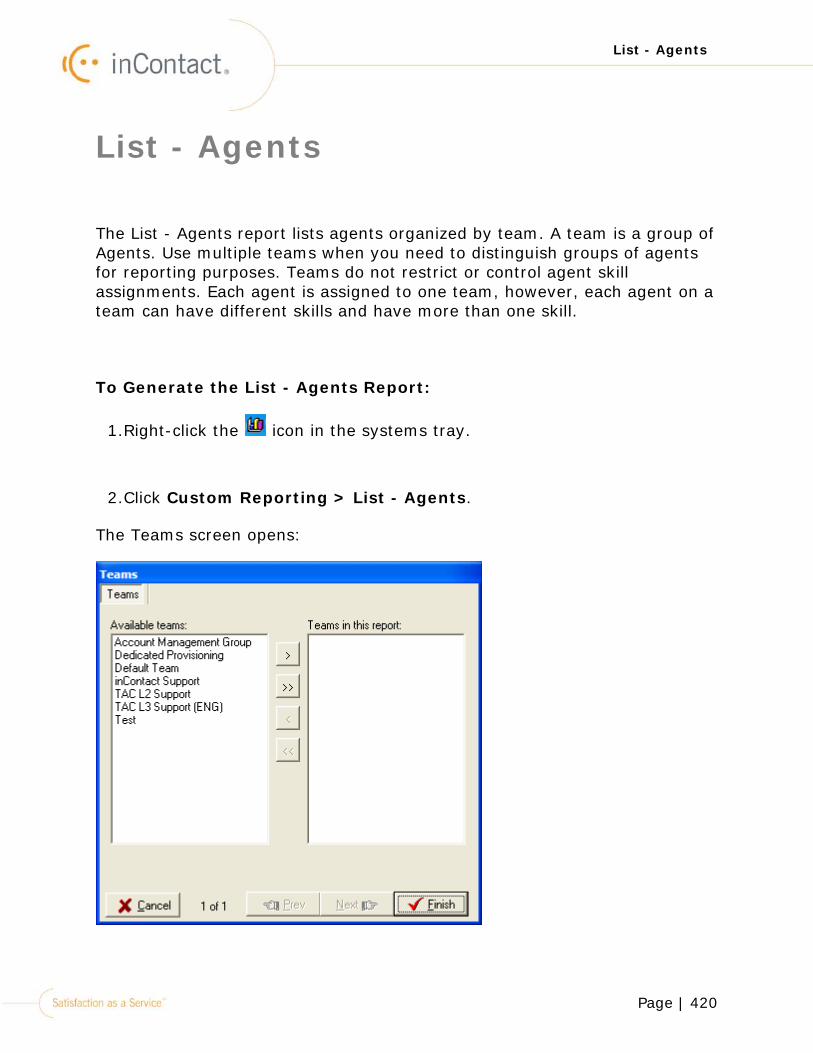
Page | 420
List - Agents
List - Agents
The List - Agents report lists agents organized by team. A team is a group of Agents. Use multiple teams when you need to distinguish groups of agents for reporting purposes. Teams do not restrict or control agent skill assignments. Each agent is assigned to one team, however, each agent on a team can have different skills and have more than one skill.
To Generate the List - Agents Report:
1.Right-click the icon in the systems tray.
2.Click Custom Reporting > List - Agents.
The Teams screen opens:
Page | 421
List - Agents
Click to move the selected team(s) from the Available teams box to the
Teams in this report box. Click to move all teams.
Click to move the selected team(s) from the Teams in this report box to the Available teams box. Click to move all teams.
Click Finish.
The List - Agents By Team report opens:
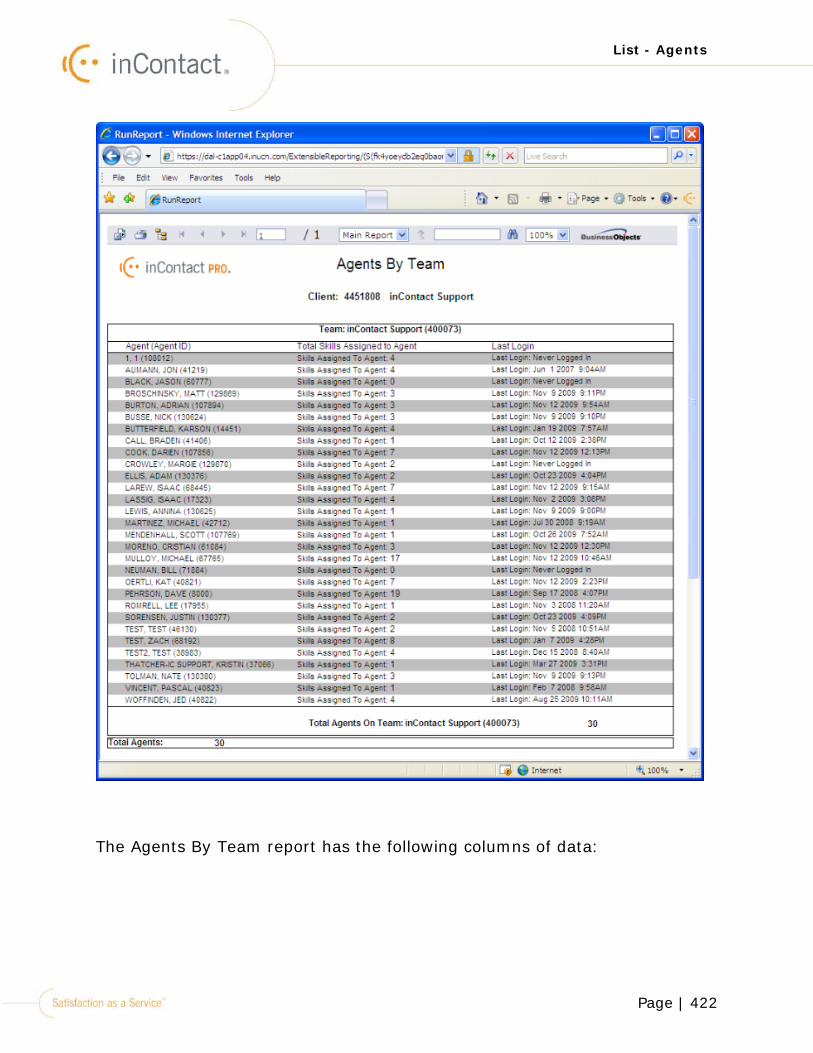
Page | 422
List - Agents
The Agents By Team report has the following columns of data:
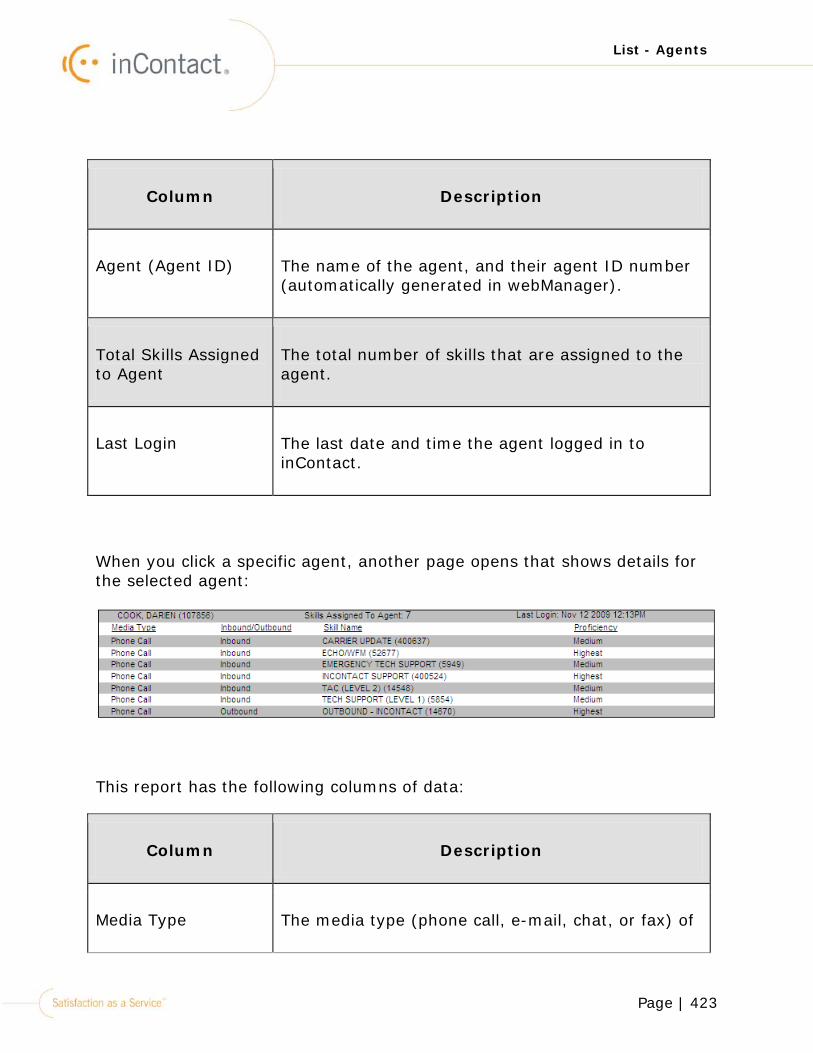
Page | 423
List - Agents
Column Description
Agent (Agent ID) The name of the agent, and their agent ID number (automatically generated in webManager).
Total Skills Assigned to Agent
The total number of skills that are assigned to the agent.
Last Login The last date and time the agent logged in to inContact.
When you click a specific agent, another page opens that shows details for the selected agent:
This report has the following columns of data:
Column Description
Media Type The media type (phone call, e-mail, chat, or fax) of
Page | 424
List - Agents
Column Description
the skills assigned to the agent.
Inbound/Outbound The Inbound/Outbound configuration for the skills assigned to the agent.
Skill Name The name of the skills assigned to the agent.
Proficiency The proficiency level assigned to the agent for the associated skill. The proficiency levels for the agent can be Highest, High, Medium, Low, and Lowest.
To get back to the main report, select “Main Report” from the drop down list.
Page | 425
List - Current Campaigns and Skills
List - Current Campaigns and Skills
The List - Current Campaigns and Skills report lists campaigns and the skills assigned to them. A campaign is a group of skills. This report shows the Campaigns that are selected in the Campaigns tab, and the skills assigned to the campaign are organized by Media Type (Chat, Email, Fax, and Phone Call).
To Generate the List - Current Campaigns and Skills Report:
1.Right-click the icon in the systems tray.
2.Click Custom Reporting > List - Current Campaigns and Skill.
The Campaign screen opens:
Page | 426
List - Current Campaigns and Skills
3.Click to move the selected campaign(s) from the Available campaigns box to the Campaigns in this report box. Click to move all campaigns.
4. Click to move the selected campaign(s) from the Campaigns in this report box to the Available campaigns box. Click to move all campaigns.
5.Click the Finish button.
The List - Current Campaigns & Associated Skills report opens:
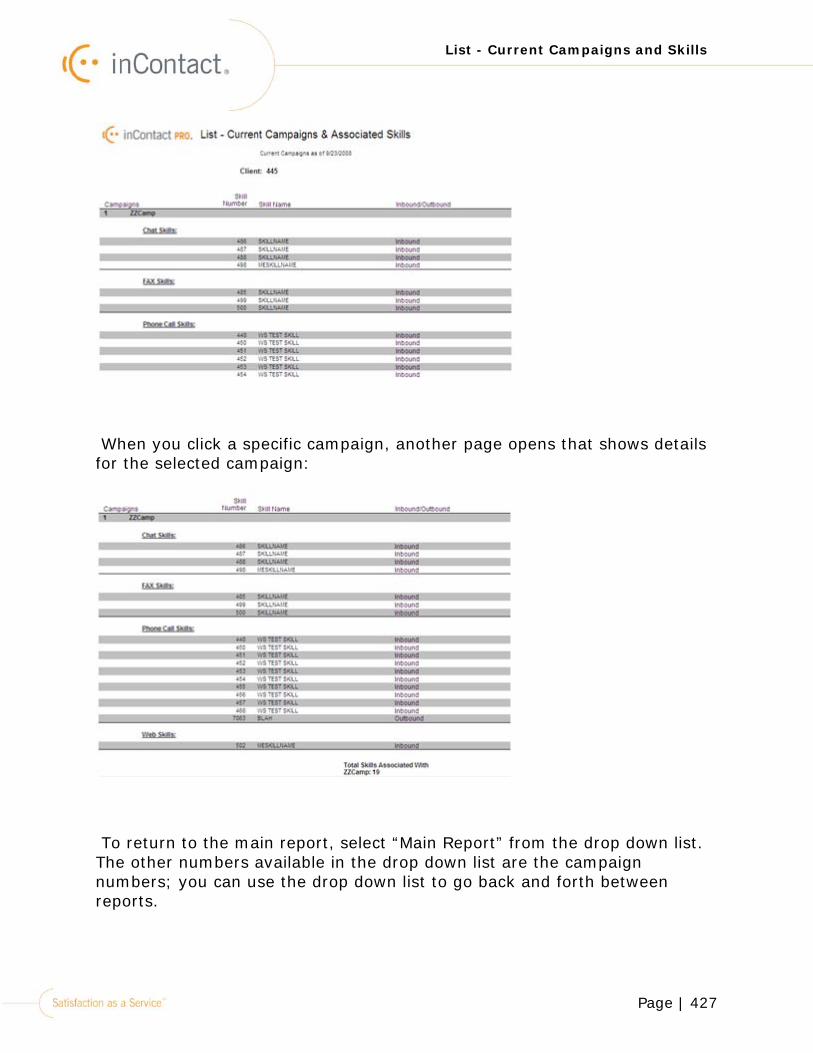
Page | 427
List - Current Campaigns and Skills
When you click a specific campaign, another page opens that shows details for the selected campaign:
To return to the main report, select “Main Report” from the drop down list. The other numbers available in the drop down list are the campaign numbers; you can use the drop down list to go back and forth between reports.
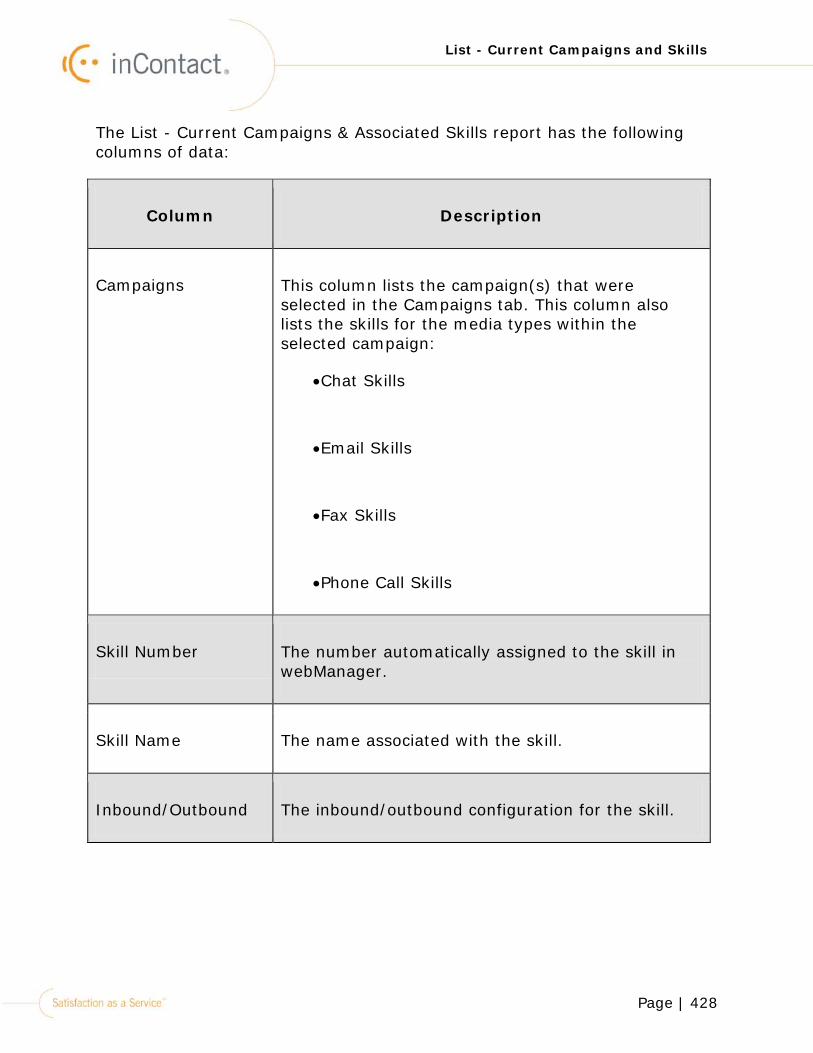
Page | 428
List - Current Campaigns and Skills
The List - Current Campaigns & Associated Skills report has the following columns of data:
Column Description
Campaigns This column lists the campaign(s) that were selected in the Campaigns tab. This column also lists the skills for the media types within the selected campaign:
•Chat Skills
•Email Skills
•Fax Skills
•Phone Call Skills
Skill Number The number automatically assigned to the skill in webManager.
Skill Name The name associated with the skill.
Inbound/Outbound The inbound/outbound configuration for the skill.
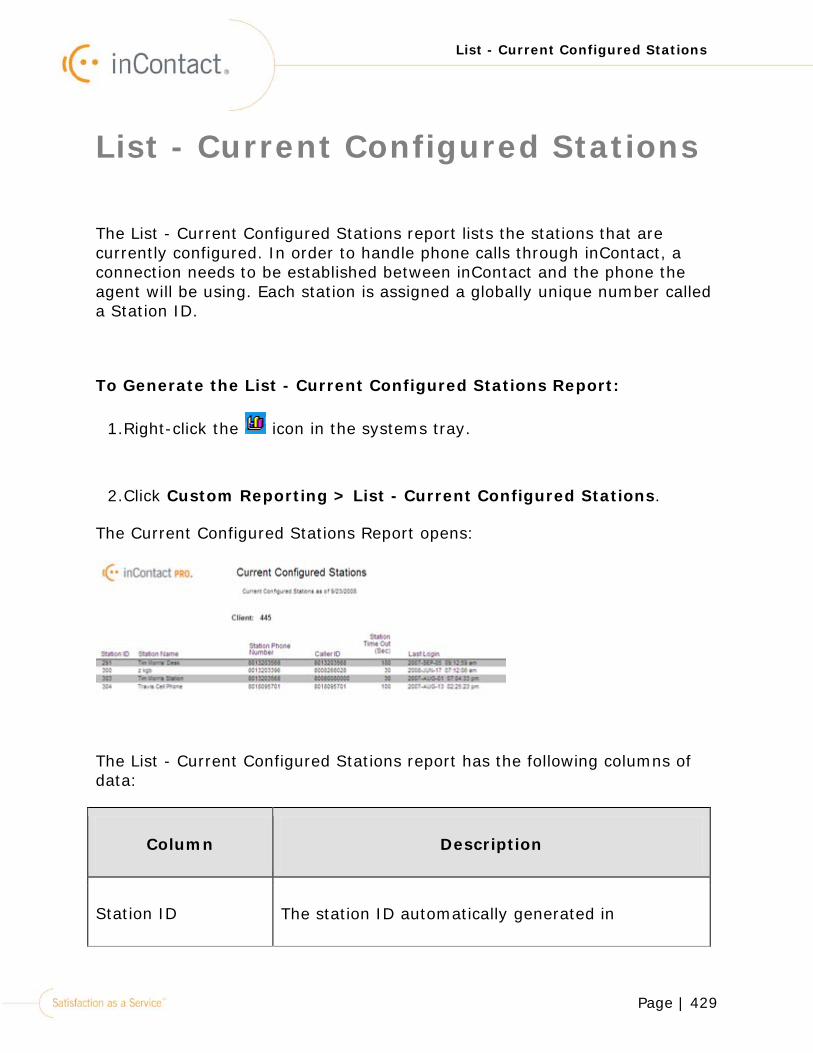
Page | 429
List - Current Configured Stations
List - Current Configured Stations
The List - Current Configured Stations report lists the stations that are currently configured. In order to handle phone calls through inContact, a connection needs to be established between inContact and the phone the agent will be using. Each station is assigned a globally unique number called a Station ID.
To Generate the List - Current Configured Stations Report:
1.Right-click the icon in the systems tray.
2.Click Custom Reporting > List - Current Configured Stations.
The Current Configured Stations Report opens:
The List - Current Configured Stations report has the following columns of data:
Column Description
Station ID The station ID automatically generated in
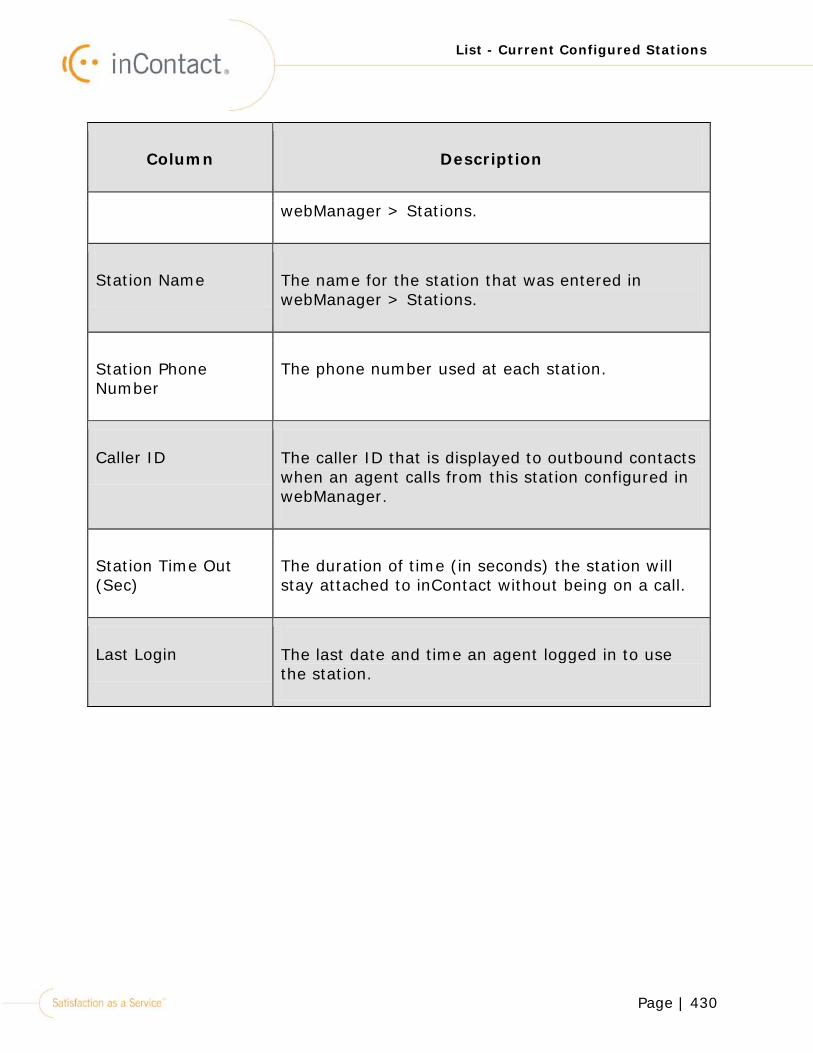
Page | 430
List - Current Configured Stations
Column Description
webManager > Stations.
Station Name The name for the station that was entered in webManager > Stations.
Station Phone Number
The phone number used at each station.
Caller ID The caller ID that is displayed to outbound contacts when an agent calls from this station configured in webManager.
Station Time Out (Sec)
The duration of time (in seconds) the station will stay attached to inContact without being on a call.
Last Login The last date and time an agent logged in to use the station.
Page | 431
List - Current Points of Contact by Media
List - Current Points of Contact by Media
The List - Current Points of Contact by Media report lists the current Points of Contact by Media Type (Chat, Email, Fax, and Phone Call). A POC (point-of-contact) is the generic inContact term that describes how an incoming contact initiates an inContact script. Voice points-of-contact trigger a script based on phone numbers (i.e., DNIS), Email POC's trigger scripts based on email addresses, Chat POC's trigger scripts based on chat names, and Fax/Document POC's are simply ID's.
Every configured POC is required to have an associated default skill and script name. The associated script can change the skill associated with a contact, but there must always be a default skill that is assigned to the contact.
To Generate the List - Current Points of Contact by Media Report:
1.Right-click the icon in the systems tray.
2.Click Custom Reporting > List - Current Points of Contact by Media.
The List - Current Points of Contact by Media Type report opens:
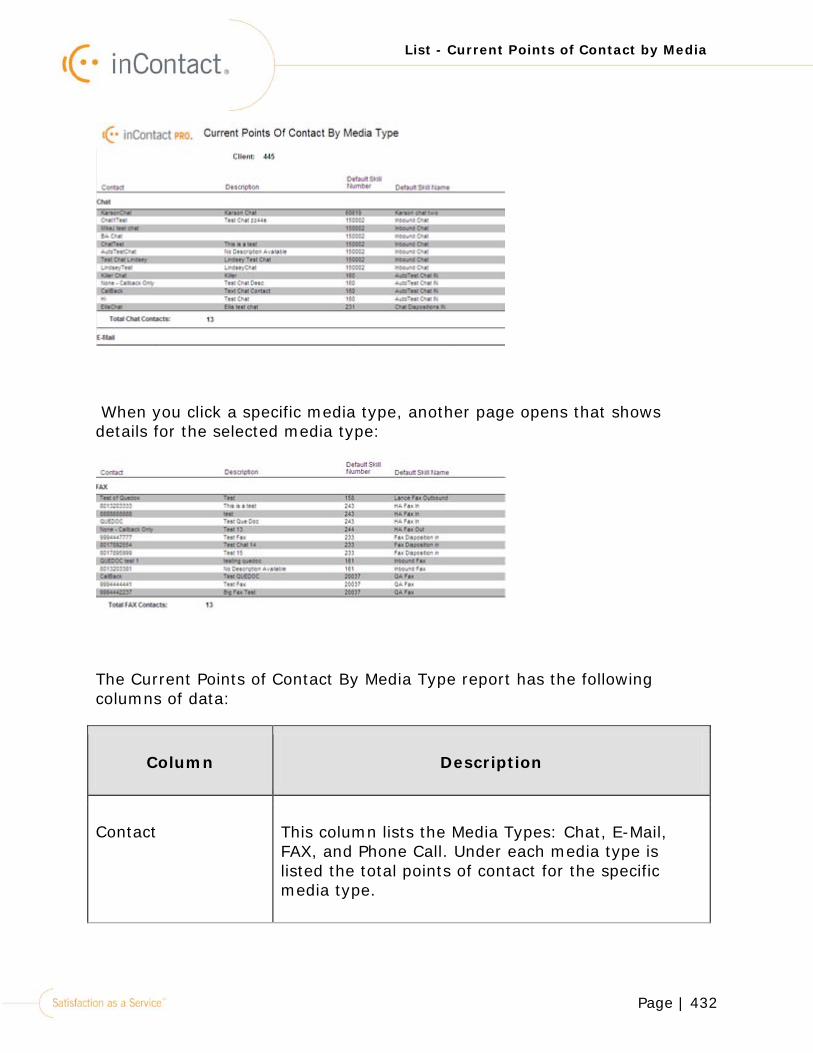
Page | 432
List - Current Points of Contact by Media
When you click a specific media type, another page opens that shows details for the selected media type:
The Current Points of Contact By Media Type report has the following columns of data:
Column Description
Contact This column lists the Media Types: Chat, E-Mail, FAX, and Phone Call. Under each media type is listed the total points of contact for the specific media type.
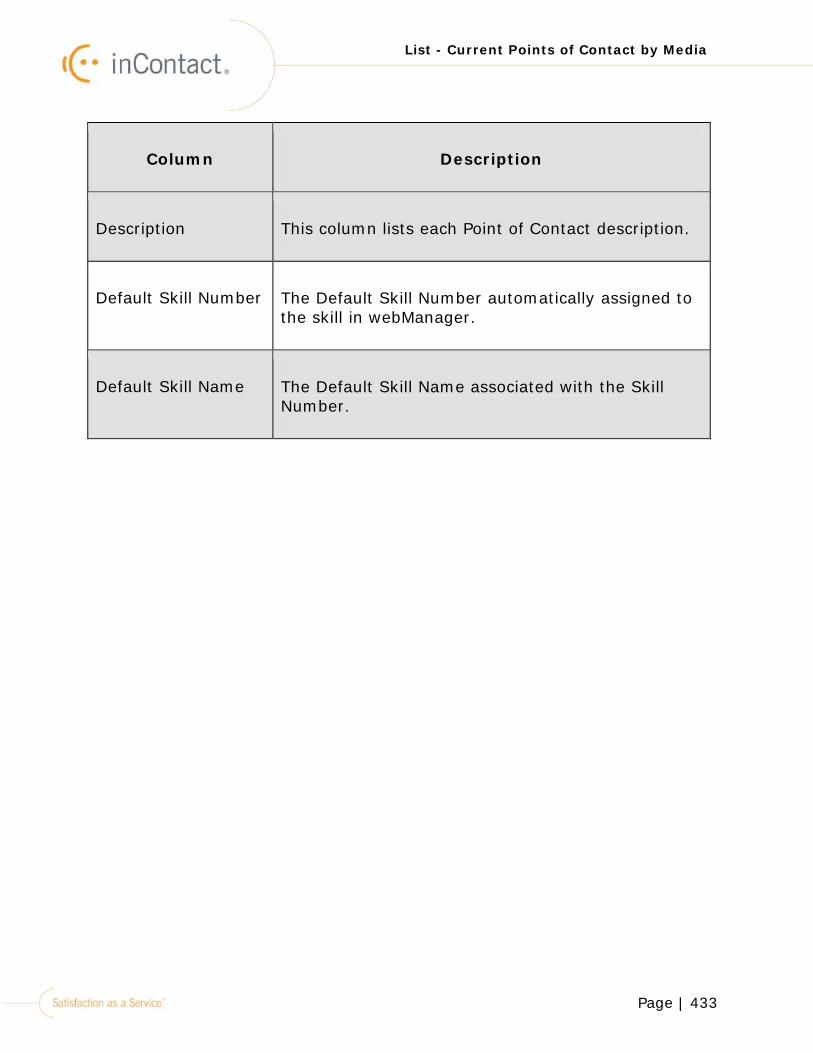
Page | 433
List - Current Points of Contact by Media
Column Description
Description This column lists each Point of Contact description.
Default Skill Number The Default Skill Number automatically assigned to the skill in webManager.
Default Skill Name The Default Skill Name associated with the Skill Number.
Page | 434
List - Team and Outstates (Unavailable Codes)
List - Team and Outstates (Unavailable Codes)
The List - Team and Outstates (Unavailable Codes) report lists teams and the unavailable codes assigned to them. Unavailable codes are created in webManager. When agents are logged in to myAgent, they can select “Available” to indicate they are ready to handle contacts, or they can select “Unavailable” and an unavailable code to indicate they are unavailable to handle inbound or outbound contacts. Selecting “Unavailable” will prevent contacts from being delivered.
To Generate the List - Team and Unavailable Codes Report:
1.Right-click the icon in the systems tray.
2.Click Custom Reporting > List - Team and Unavailable Codes.
The Teams screen opens:

Page | 435
List - Team and Outstates (Unavailable Codes)
3.Click to move the selected team(s) from the Available teams box to
the Teams in this report box. Click to move all teams.
4. Click to move the selected team(s) from the Teams in this report box to the Available teams box. Click to move all teams.
5.Click the Finish button.
The Enter prompt values. page opens:
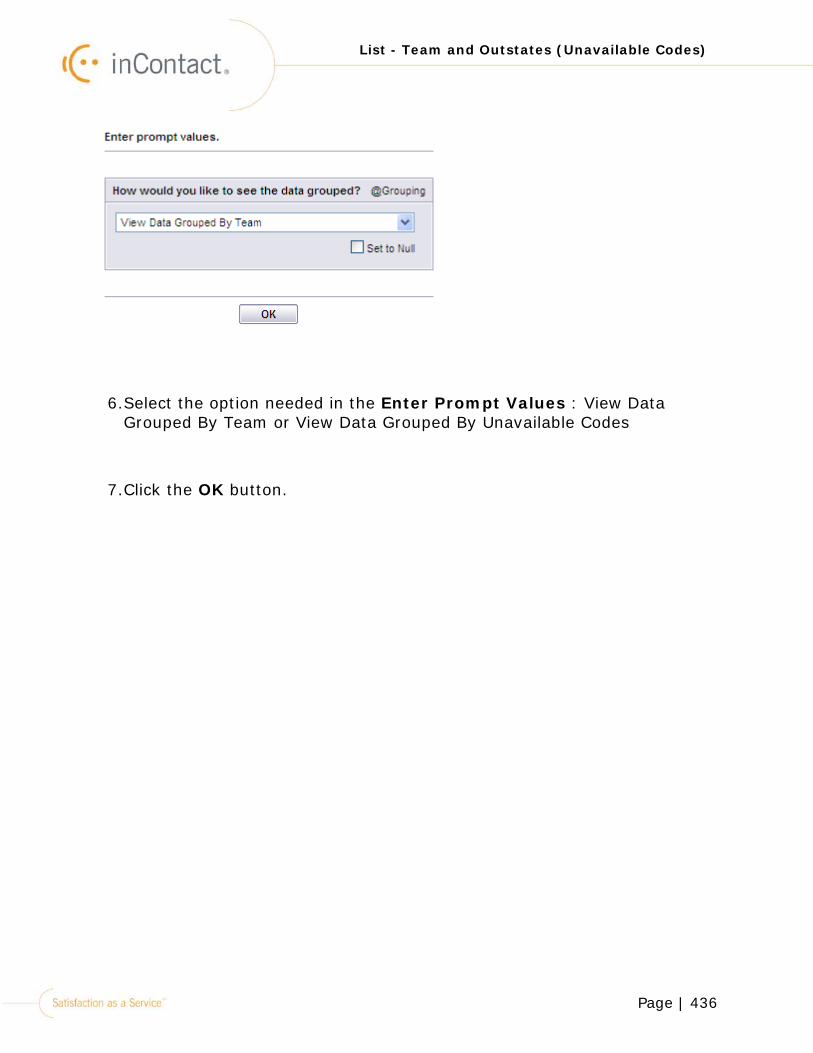
Page | 436
List - Team and Outstates (Unavailable Codes)
6.Select the option needed in the Enter Prompt Values : View Data Grouped By Team or View Data Grouped By Unavailable Codes
7.Click the OK button.
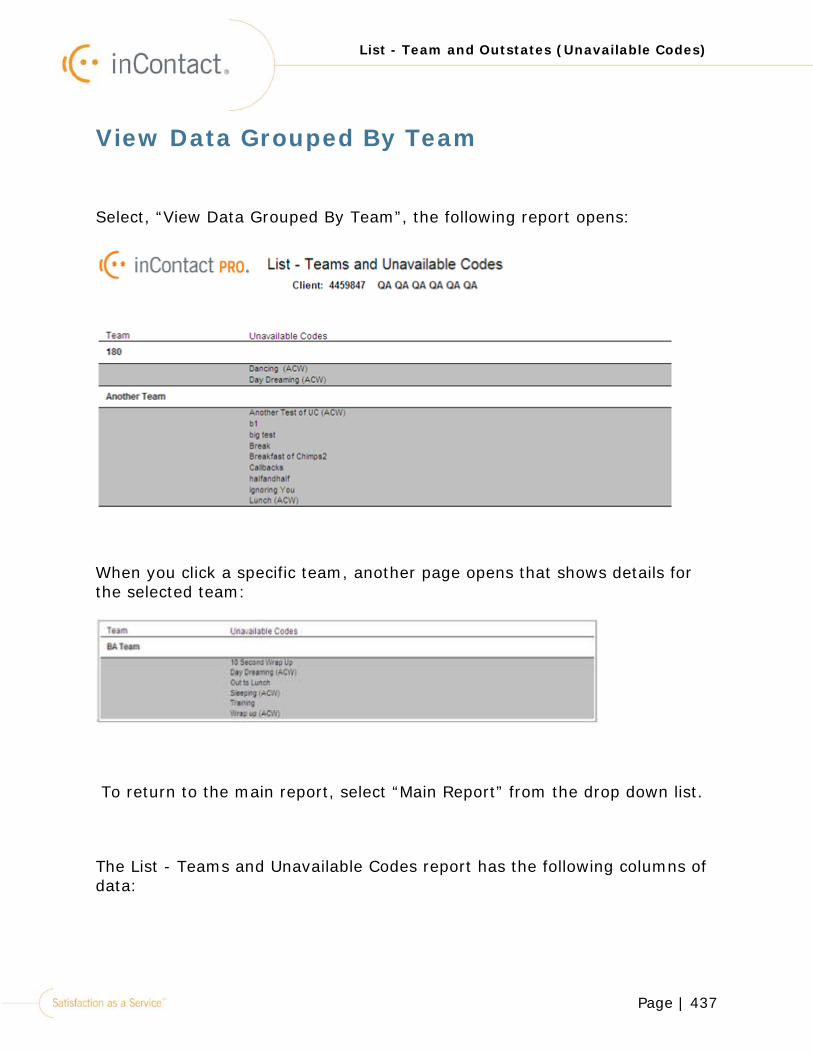
Page | 437
List - Team and Outstates (Unavailable Codes)
View Data Grouped By Team
Select, “View Data Grouped By Team”, the following report opens:
When you click a specific team, another page opens that shows details for the selected team:
To return to the main report, select “Main Report” from the drop down list.
The List - Teams and Unavailable Codes report has the following columns of data:
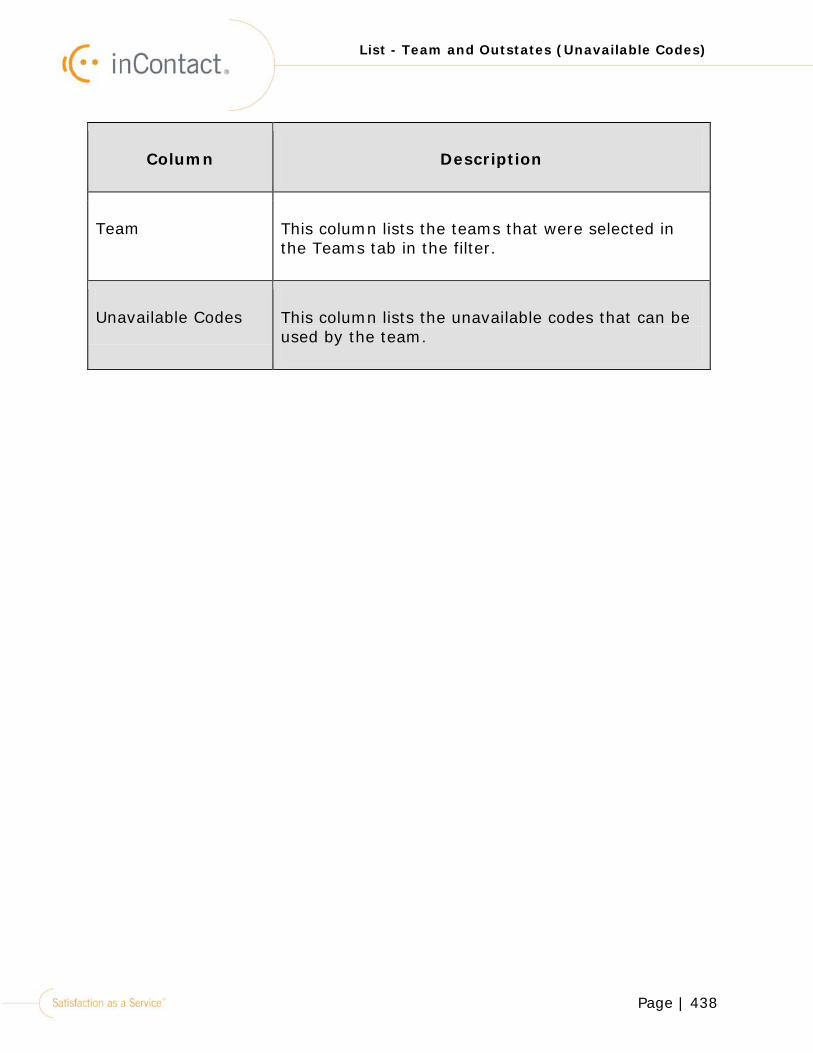
Page | 438
List - Team and Outstates (Unavailable Codes)
Column Description
Team This column lists the teams that were selected in the Teams tab in the filter.
Unavailable Codes This column lists the unavailable codes that can be used by the team.
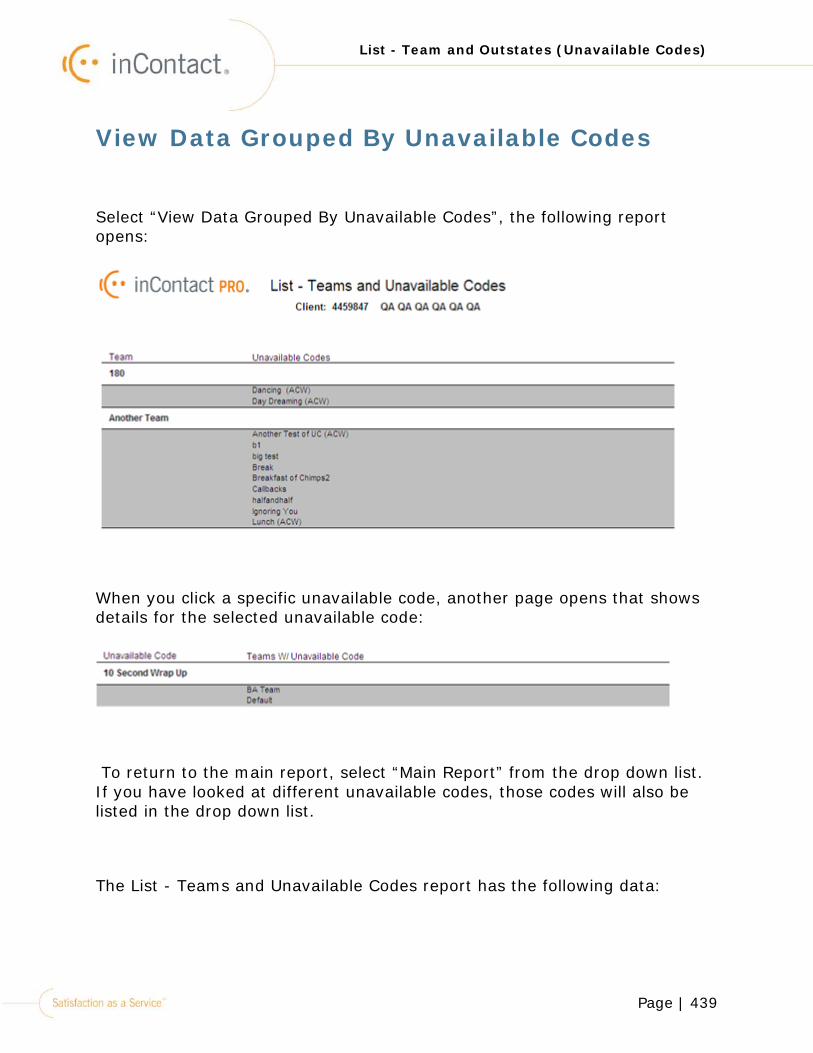
Page | 439
List - Team and Outstates (Unavailable Codes)
View Data Grouped By Unavailable Codes
Select “View Data Grouped By Unavailable Codes”, the following report opens:
When you click a specific unavailable code, another page opens that shows details for the selected unavailable code:
To return to the main report, select “Main Report” from the drop down list. If you have looked at different unavailable codes, those codes will also be listed in the drop down list.
The List - Teams and Unavailable Codes report has the following data:
Page | 440
List - Team and Outstates (Unavailable Codes)
Column Description
Unavailable Code This column lists the unavailable codes that have been created in webManager.
Teams W/ Unavailable Code
This column lists all of the teams that can use the unavailable code(s).
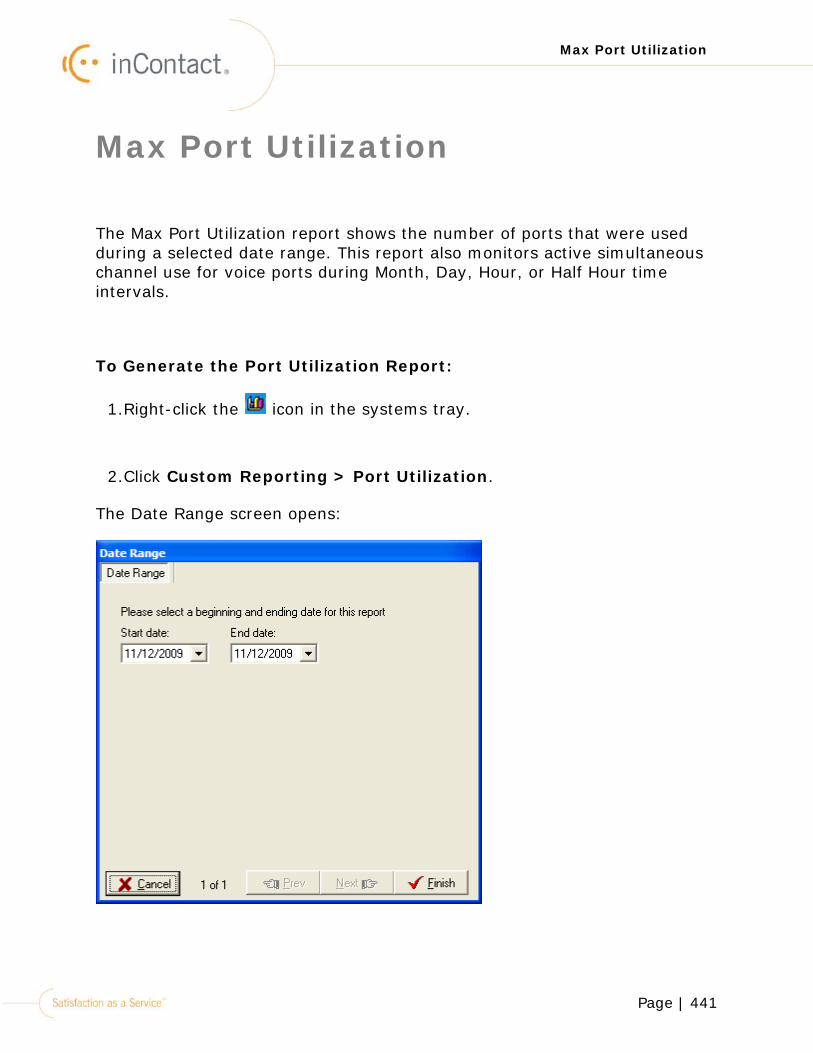
Page | 441
Max Port Utilization
Max Port Utilization
The Max Port Utilization report shows the number of ports that were used during a selected date range. This report also monitors active simultaneous channel use for voice ports during Month, Day, Hour, or Half Hour time intervals.
To Generate the Port Utilization Report:
1.Right-click the icon in the systems tray.
2.Click Custom Reporting > Port Utilization.
The Date Range screen opens:
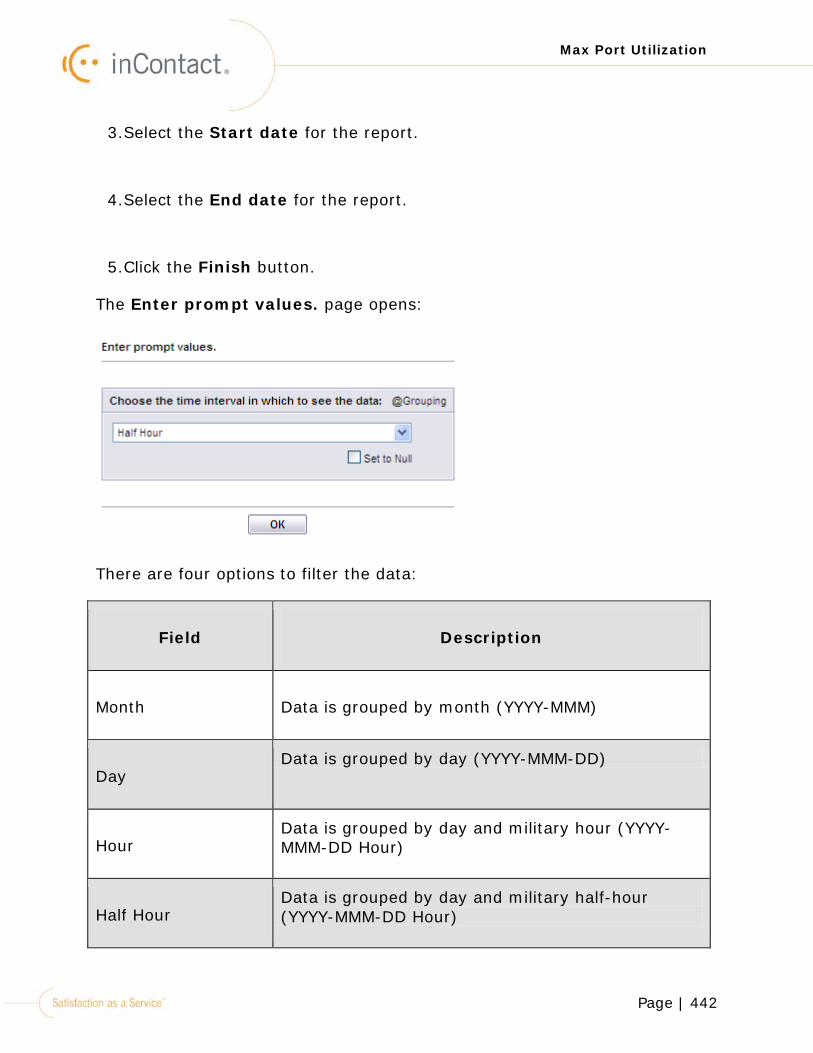
Page | 442
Max Port Utilization
3.Select the Start date for the report.
4.Select the End date for the report.
5.Click the Finish button.
The Enter prompt values. page opens:
There are four options to filter the data:
Field Description
Month Data is grouped by month (YYYY-MMM)
Day Data is grouped by day (YYYY-MMM-DD)
Hour Data is grouped by day and military hour (YYYY-MMM-DD Hour)
Half Hour Data is grouped by day and military half-hour (YYYY-MMM-DD Hour)
Page | 443
Max Port Utilization
After clicking OK for the selected filter, the following report(s) open, according to the options you select:
•Port Utilization By Month
•Port Utilization By Day
•Port Utilization By Hour
•Port Utilization By Half Hour
Page | 444
Max Port Utilization
Port Utilization By Day
The Port Utilization By Day report generates data to display the maximum number of ports used for a day.
The Port Utilization By Day report opens:
The Port Utilization By Day report has the following columns of data:
Column Description
(No Heading) The Year and Month being generated for the report.
Time Interval The year, month, and day for the date range being generated.

Page | 445
Max Port Utilization
Column Description
Voice The maximum number of voice ports that were used.
E-mail The maximum number of email ports that were used.
Chat The maximum number of chat ports that were used.
FAX The maximum number of fax ports that were used.
Page | 446
Max Port Utilization
Port Utilization By Half Hour
The Port Utilization By Half Hour report generates data to display the maximum number of ports that were used during half hour intervals for the selected date range.
The Port Utilization By Half Hour report opens:
The Port Utilization By Half Hour report has the following columns of data:
Column Description
(No Heading) The year, month, day, and half hour being reported.
Time Interval The half hour intervals for the selected day.
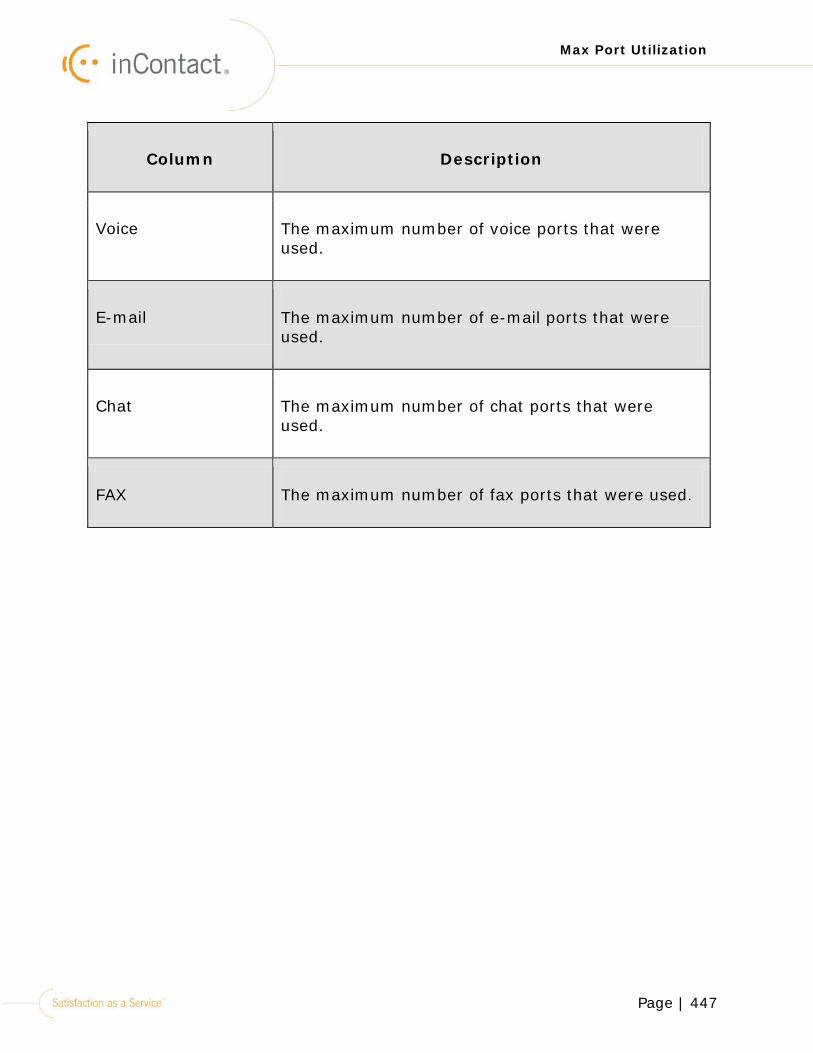
Page | 447
Max Port Utilization
Column Description
Voice The maximum number of voice ports that were used.
E-mail The maximum number of e-mail ports that were used.
Chat The maximum number of chat ports that were used.
FAX The maximum number of fax ports that were used.
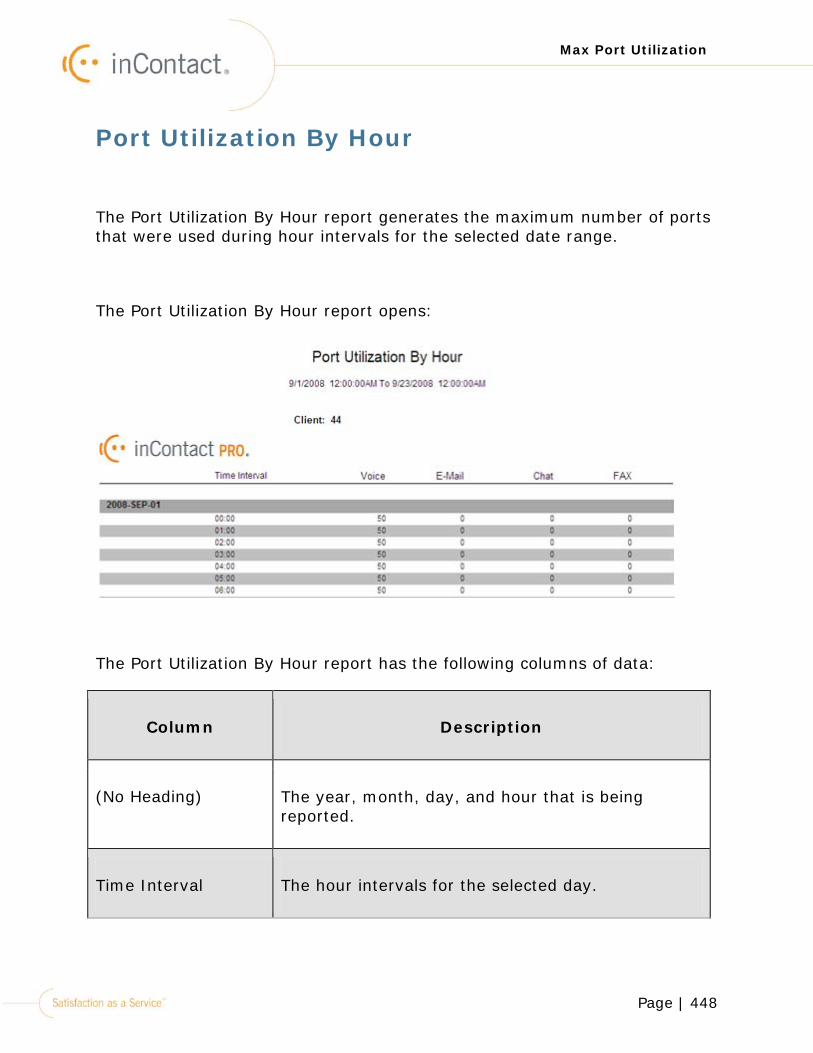
Page | 448
Max Port Utilization
Port Utilization By Hour
The Port Utilization By Hour report generates the maximum number of ports that were used during hour intervals for the selected date range.
The Port Utilization By Hour report opens:
The Port Utilization By Hour report has the following columns of data:
Column Description
(No Heading) The year, month, day, and hour that is being reported.
Time Interval The hour intervals for the selected day.
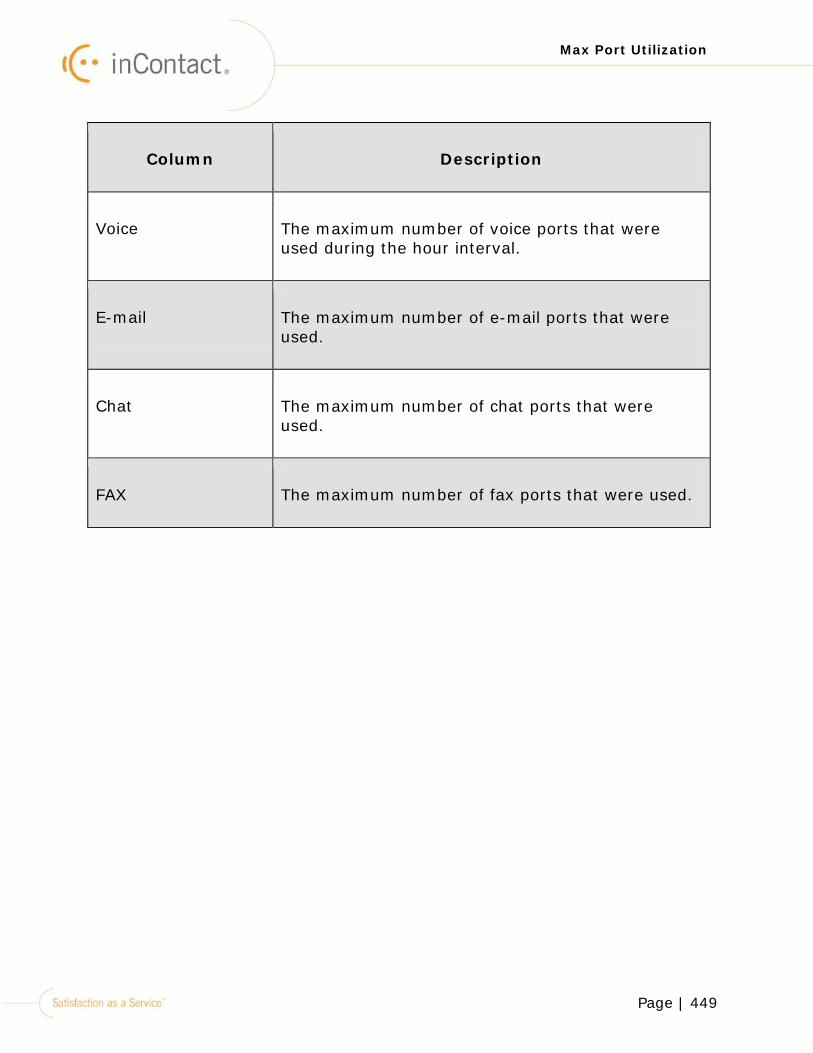
Page | 449
Max Port Utilization
Column Description
Voice The maximum number of voice ports that were used during the hour interval.
E-mail The maximum number of e-mail ports that were used.
Chat The maximum number of chat ports that were used.
FAX The maximum number of fax ports that were used.
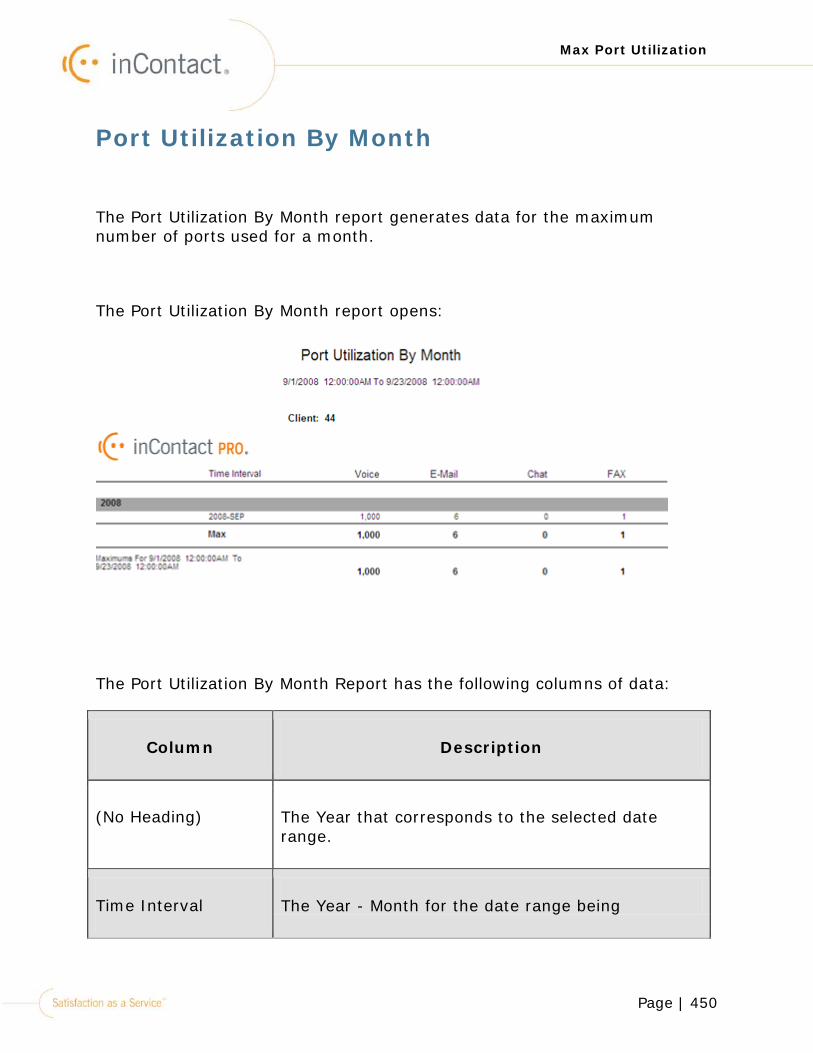
Page | 450
Max Port Utilization
Port Utilization By Month
The Port Utilization By Month report generates data for the maximum number of ports used for a month.
The Port Utilization By Month report opens:
The Port Utilization By Month Report has the following columns of data:
Column Description
(No Heading) The Year that corresponds to the selected date range.
Time Interval The Year - Month for the date range being
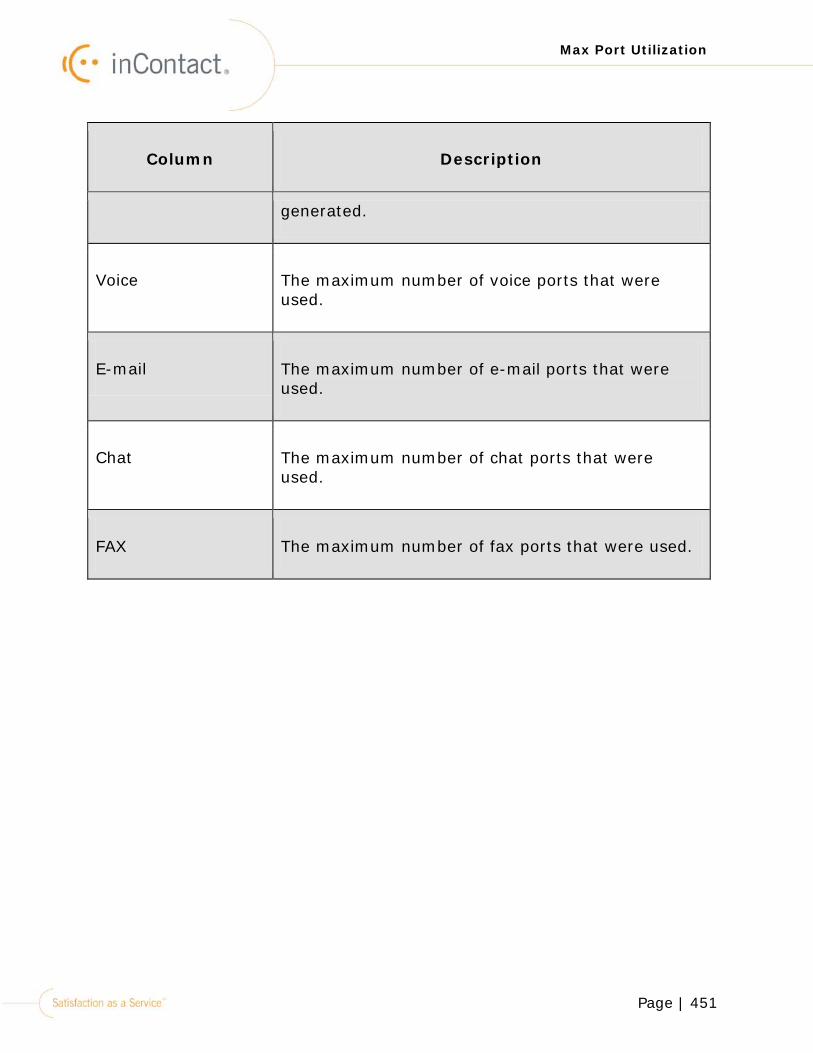
Page | 451
Max Port Utilization
Column Description
generated.
Voice The maximum number of voice ports that were used.
E-mail The maximum number of e-mail ports that were used.
Chat The maximum number of chat ports that were used.
FAX The maximum number of fax ports that were used.
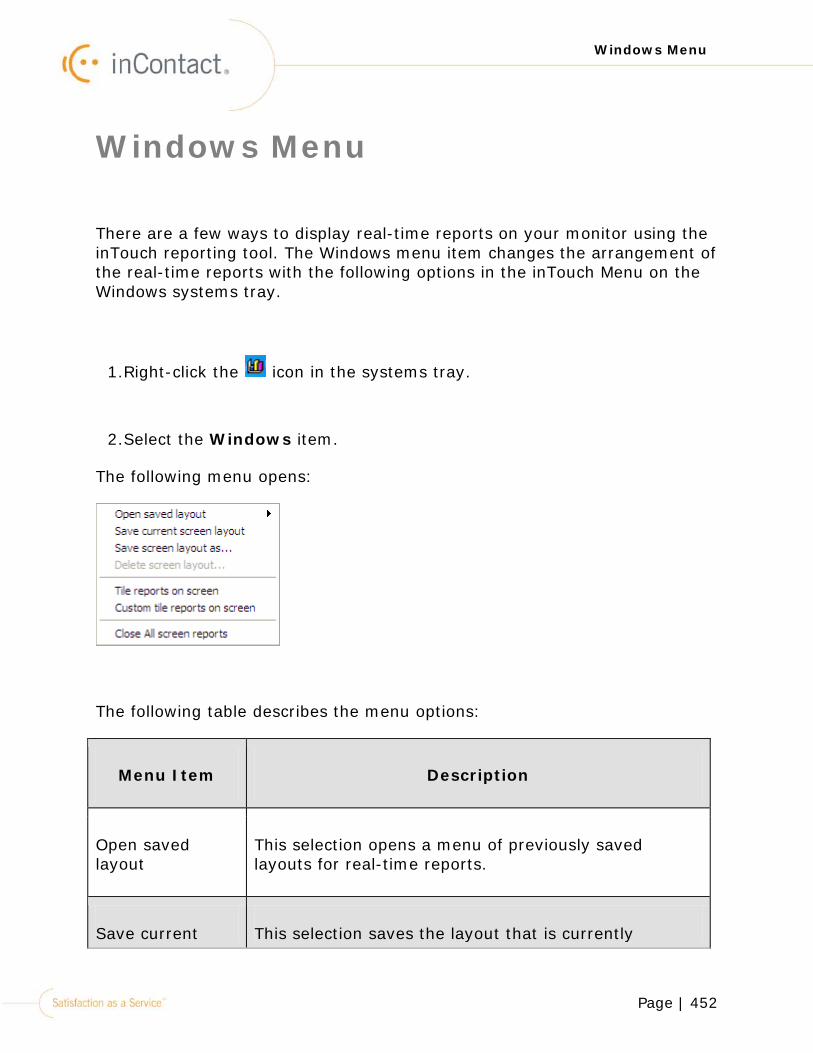
Page | 452
Windows Menu
Windows Menu
There are a few ways to display real-time reports on your monitor using the inTouch reporting tool. The Windows menu item changes the arrangement of the real-time reports with the following options in the inTouch Menu on the Windows systems tray.
1.Right-click the icon in the systems tray.
2.Select the Windows item.
The following menu opens:
The following table describes the menu options:
Menu Item Description
Open saved layout
This selection opens a menu of previously saved layouts for real-time reports.
Save current This selection saves the layout that is currently
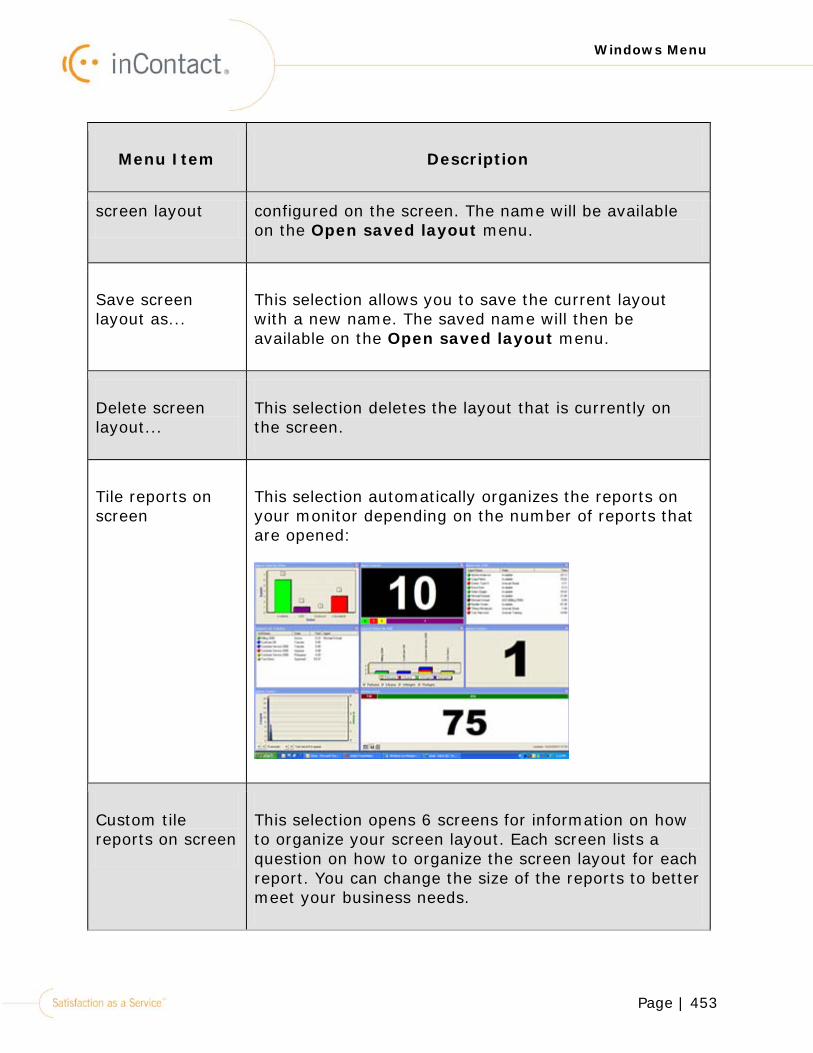
Page | 453
Windows Menu
Menu Item Description
screen layout configured on the screen. The name will be available on the Open saved layout menu.
Save screen layout as...
This selection allows you to save the current layout with a new name. The saved name will then be available on the Open saved layout menu.
Delete screen layout...
This selection deletes the layout that is currently on the screen.
Tile reports on screen
This selection automatically organizes the reports on your monitor depending on the number of reports that are opened:
Custom tile reports on screen
This selection opens 6 screens for information on how to organize your screen layout. Each screen lists a question on how to organize the screen layout for each report. You can change the size of the reports to better meet your business needs.
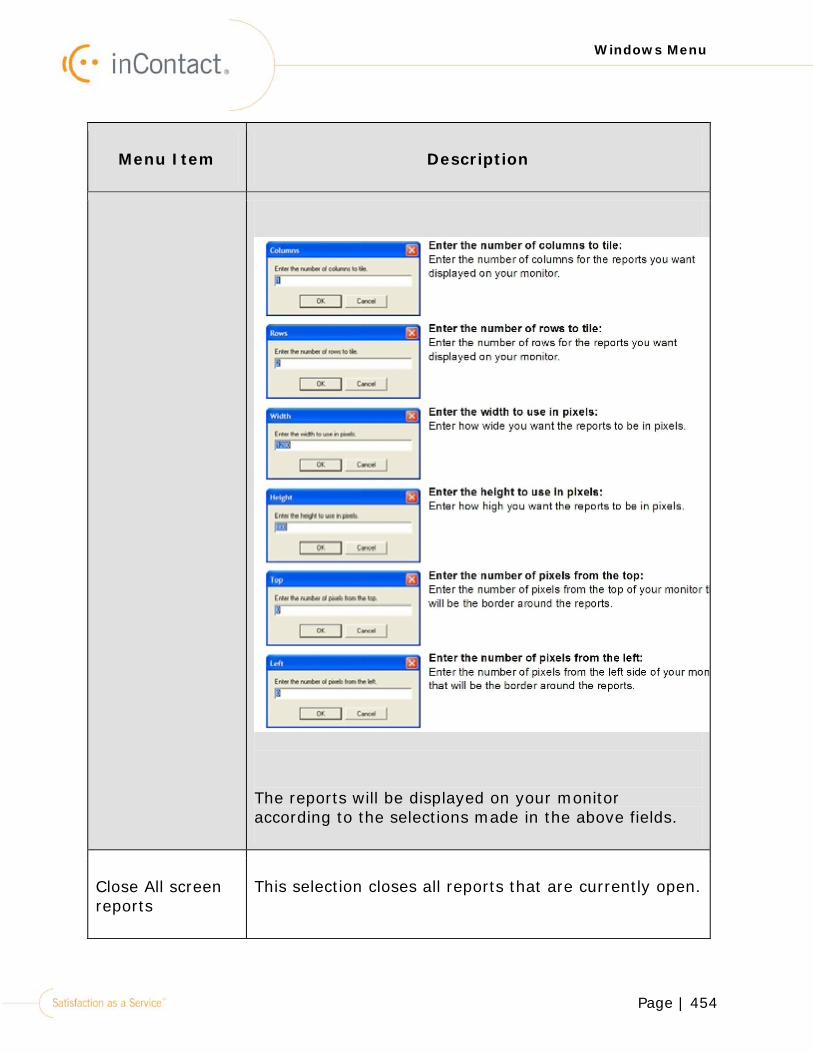
Page | 454
Windows Menu
Menu Item Description
The reports will be displayed on your monitor according to the selections made in the above fields.
Close All screen reports
This selection closes all reports that are currently open.
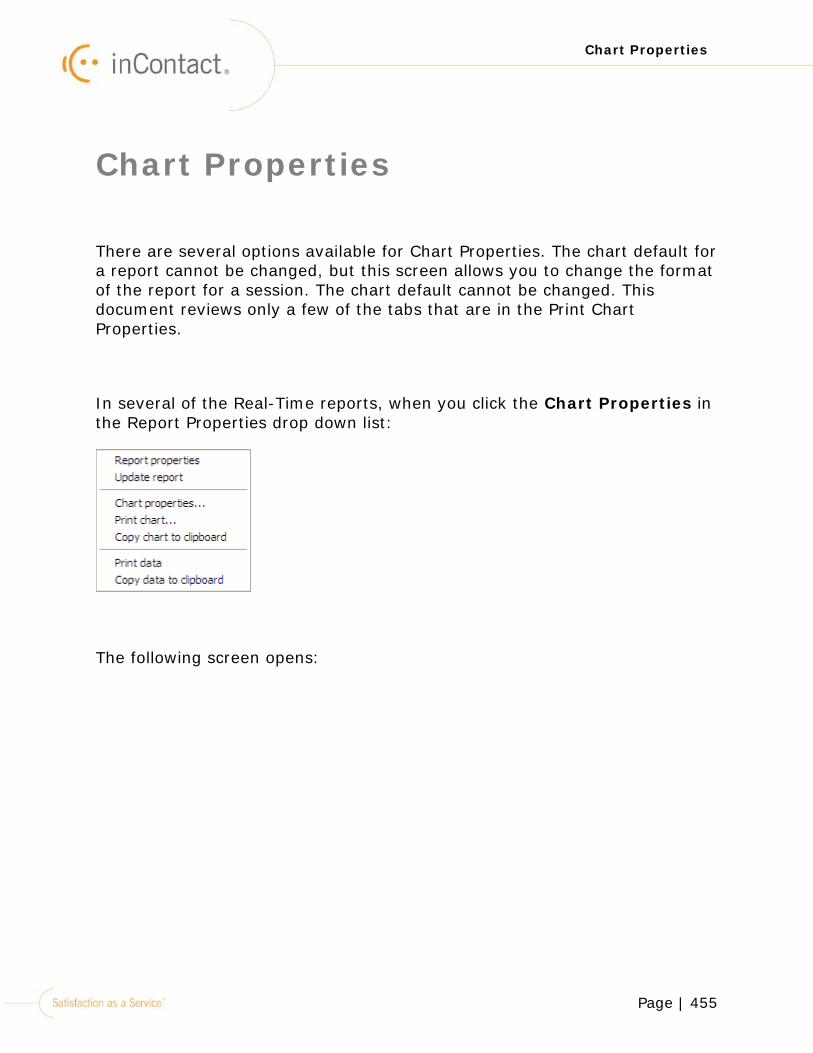
Page | 455
Chart Properties
Chart Properties
There are several options available for Chart Properties. The chart default for a report cannot be changed, but this screen allows you to change the format of the report for a session. The chart default cannot be changed. This document reviews only a few of the tabs that are in the Print Chart Properties.
In several of the Real-Time reports, when you click the Chart Properties in the Report Properties drop down list:
The following screen opens:
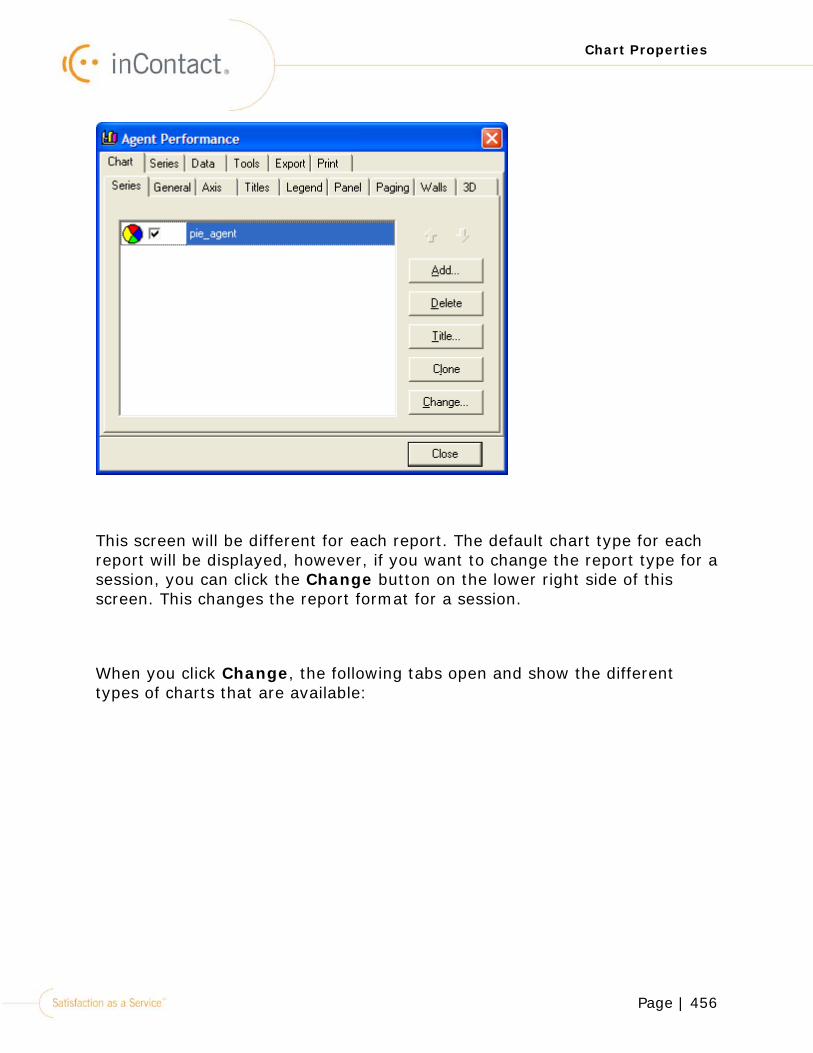
Page | 456
Chart Properties
This screen will be different for each report. The default chart type for each report will be displayed, however, if you want to change the report type for a session, you can click the Change button on the lower right side of this screen. This changes the report format for a session.
When you click Change, the following tabs open and show the different types of charts that are available:
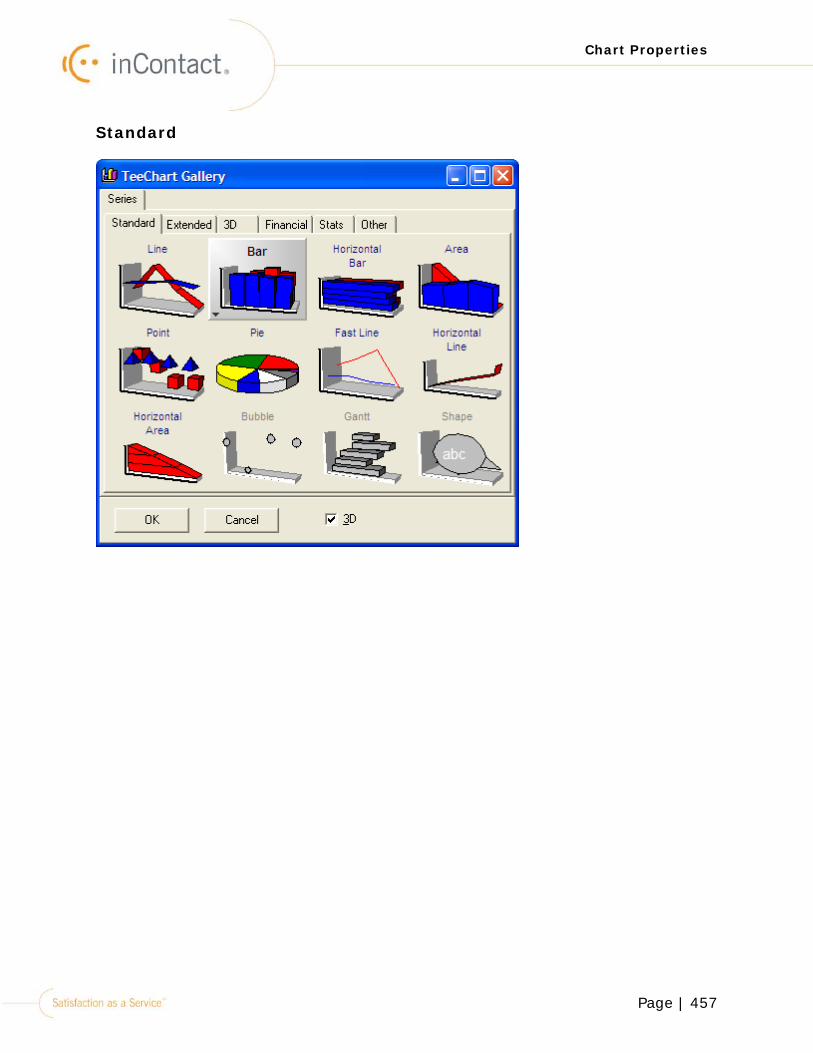
Page | 457
Chart Properties
Standard
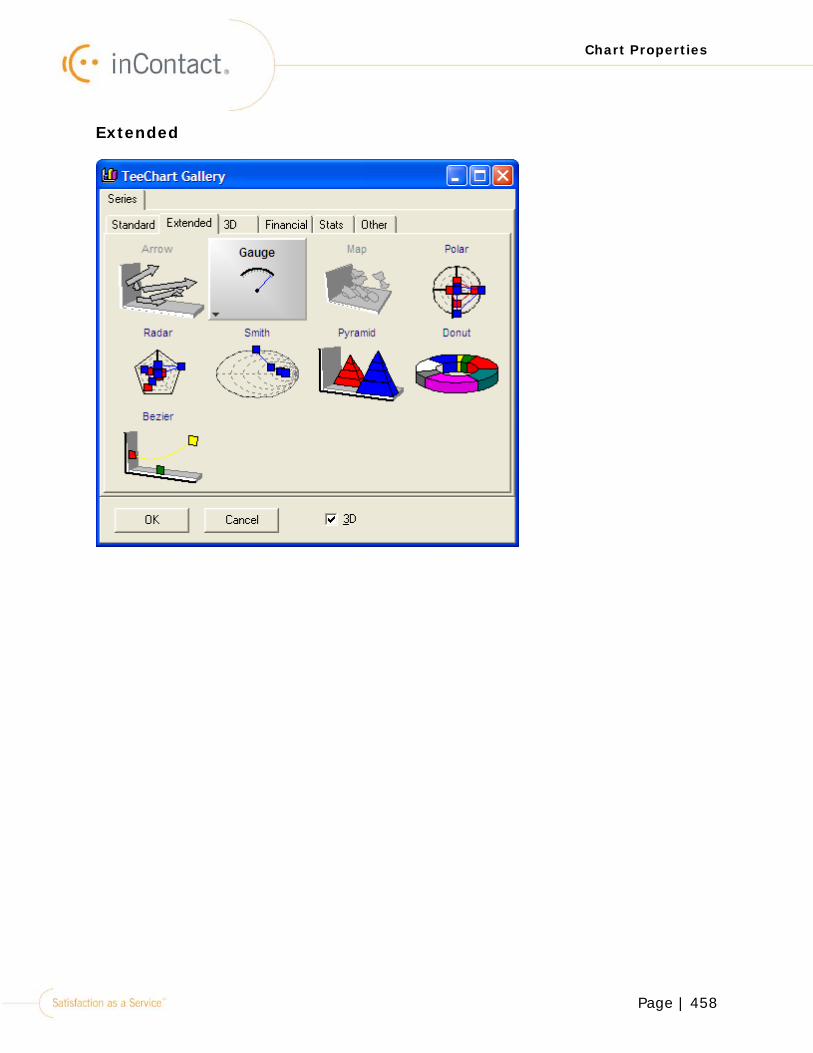
Page | 458
Chart Properties
Extended
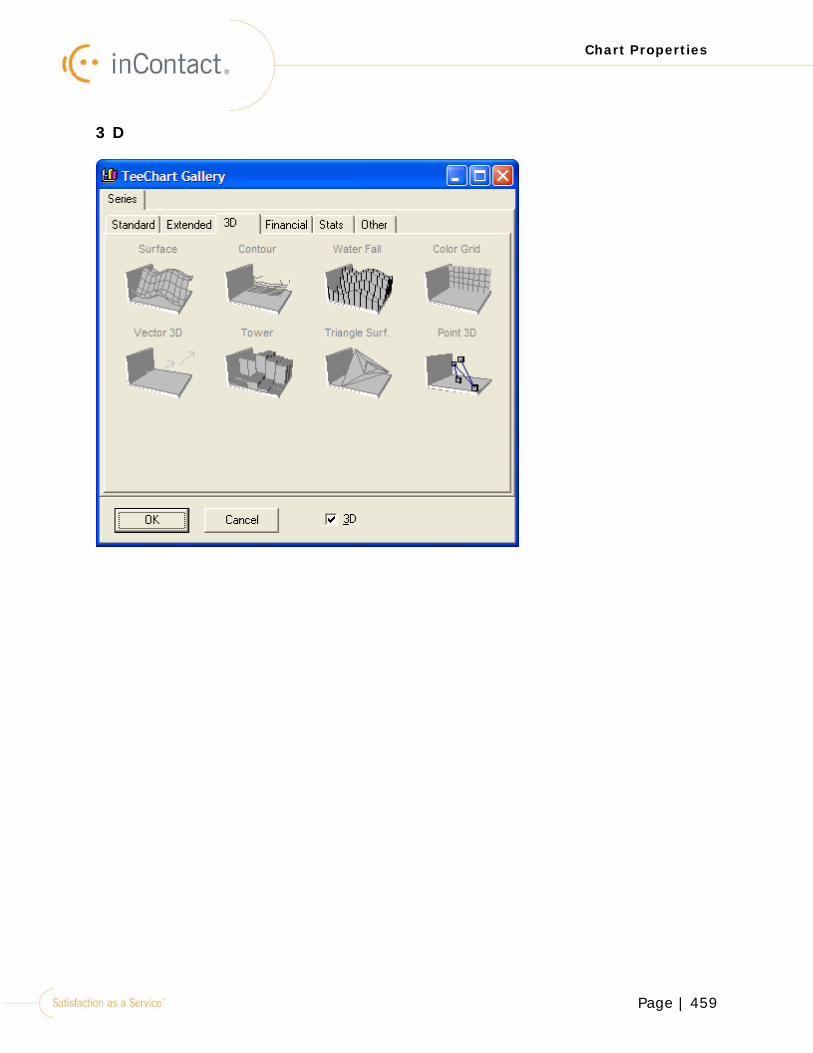
Page | 459
Chart Properties
3 D
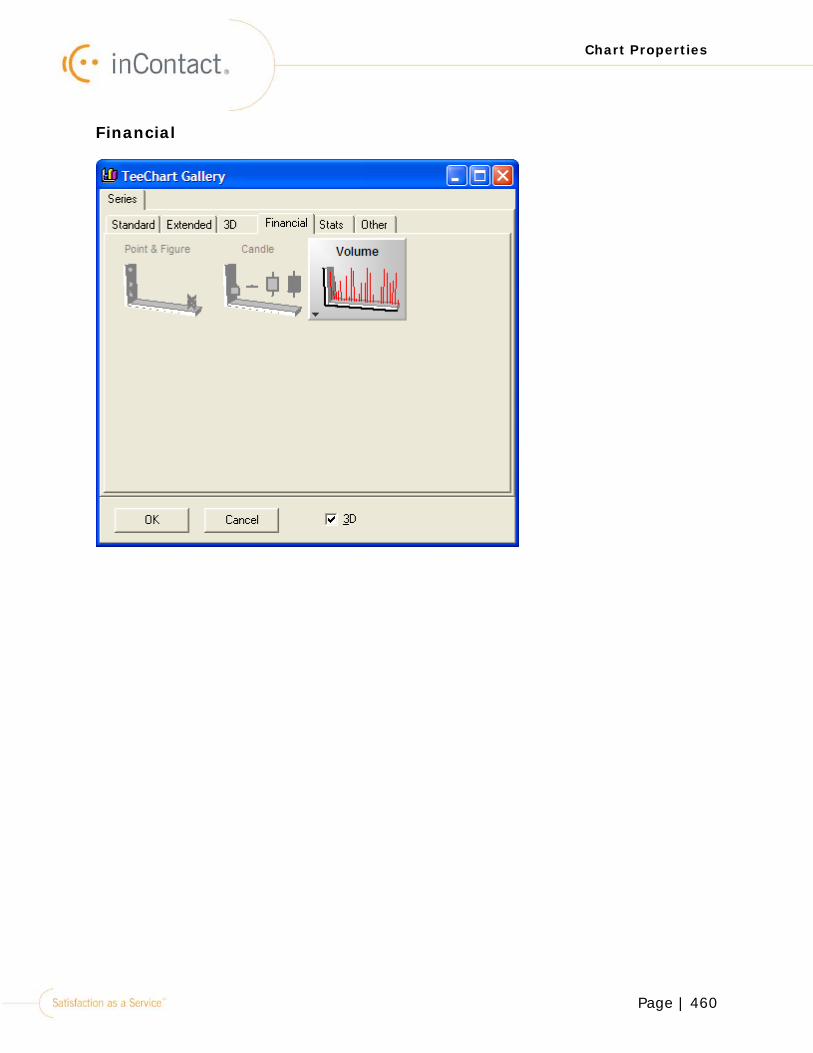
Page | 460
Chart Properties
Financial
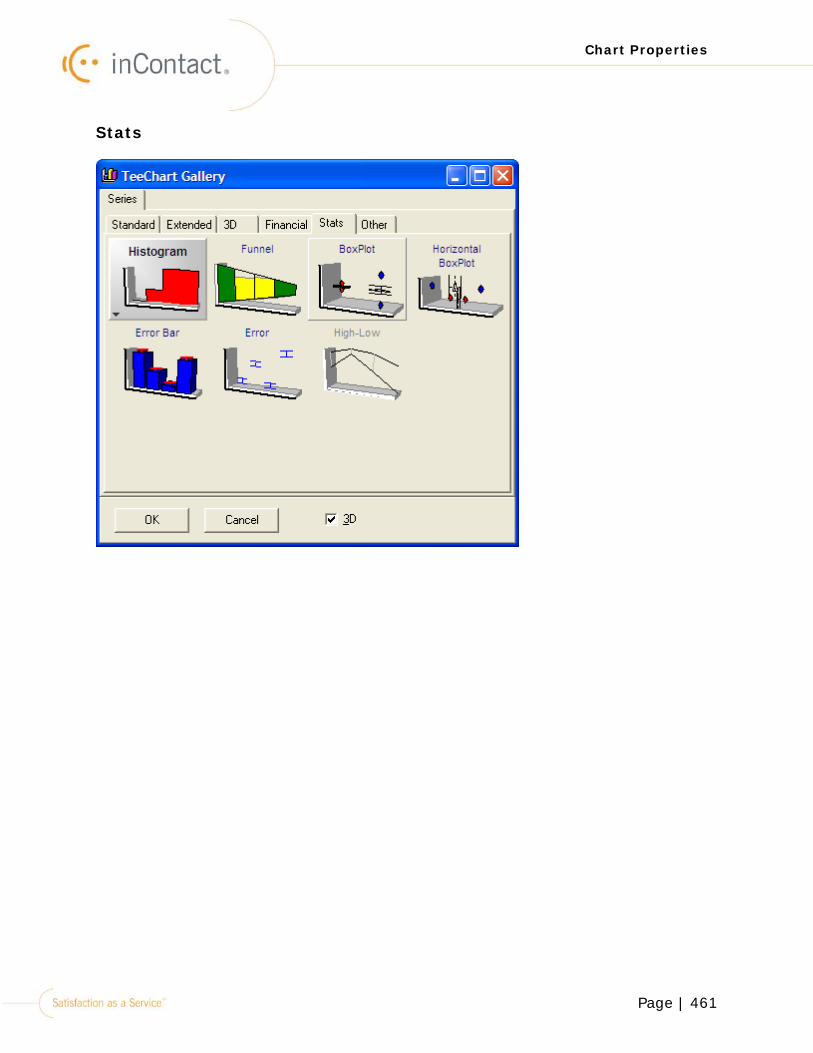
Page | 461
Chart Properties
Stats
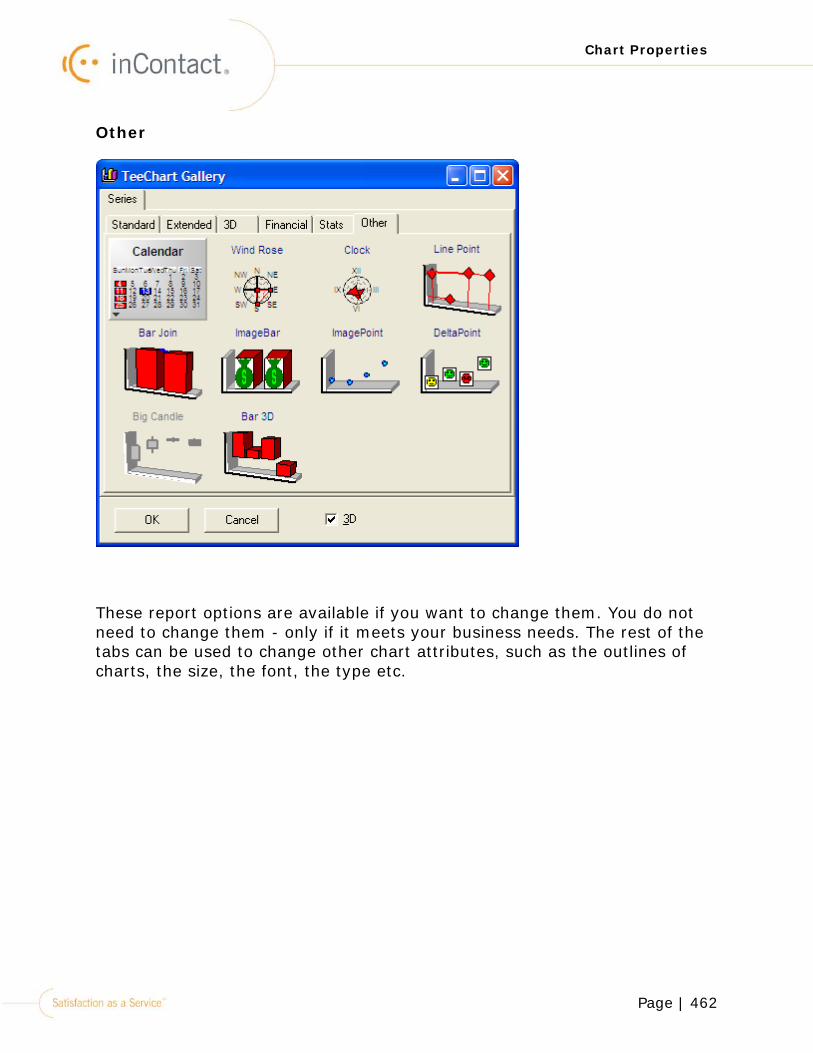
Page | 462
Chart Properties
Other
These report options are available if you want to change them. You do not need to change them - only if it meets your business needs. The rest of the tabs can be used to change other chart attributes, such as the outlines of charts, the size, the font, the type etc.
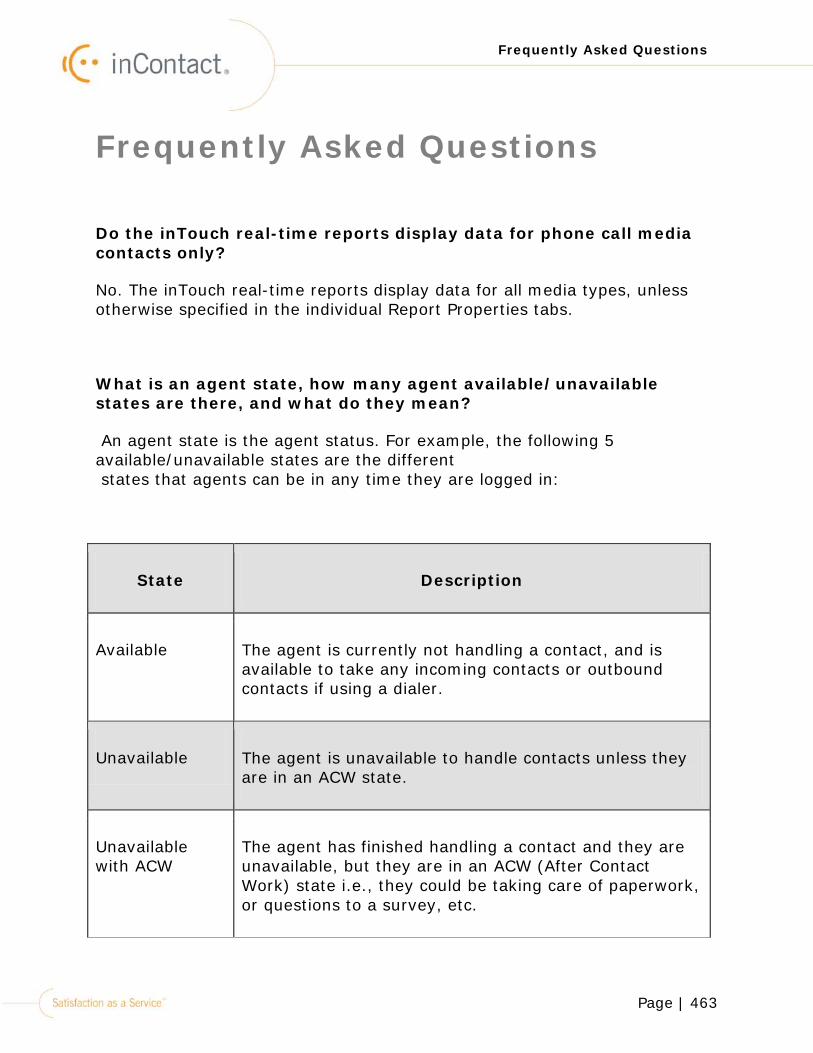
Page | 463
Frequently Asked Questions
Frequently Asked Questions
Do the inTouch real-time reports display data for phone call media contacts only?
No. The inTouch real-time reports display data for all media types, unless otherwise specified in the individual Report Properties tabs.
What is an agent state, how many agent available/unavailable states are there, and what do they mean?
An agent state is the agent status. For example, the following 5 available/unavailable states are the different states that agents can be in any time they are logged in:
State Description
Available The agent is currently not handling a contact, and is available to take any incoming contacts or outbound contacts if using a dialer.
Unavailable The agent is unavailable to handle contacts unless they are in an ACW state.
Unavailable with ACW
The agent has finished handling a contact and they are unavailable, but they are in an ACW (After Contact Work) state i.e., they could be taking care of paperwork, or questions to a survey, etc.
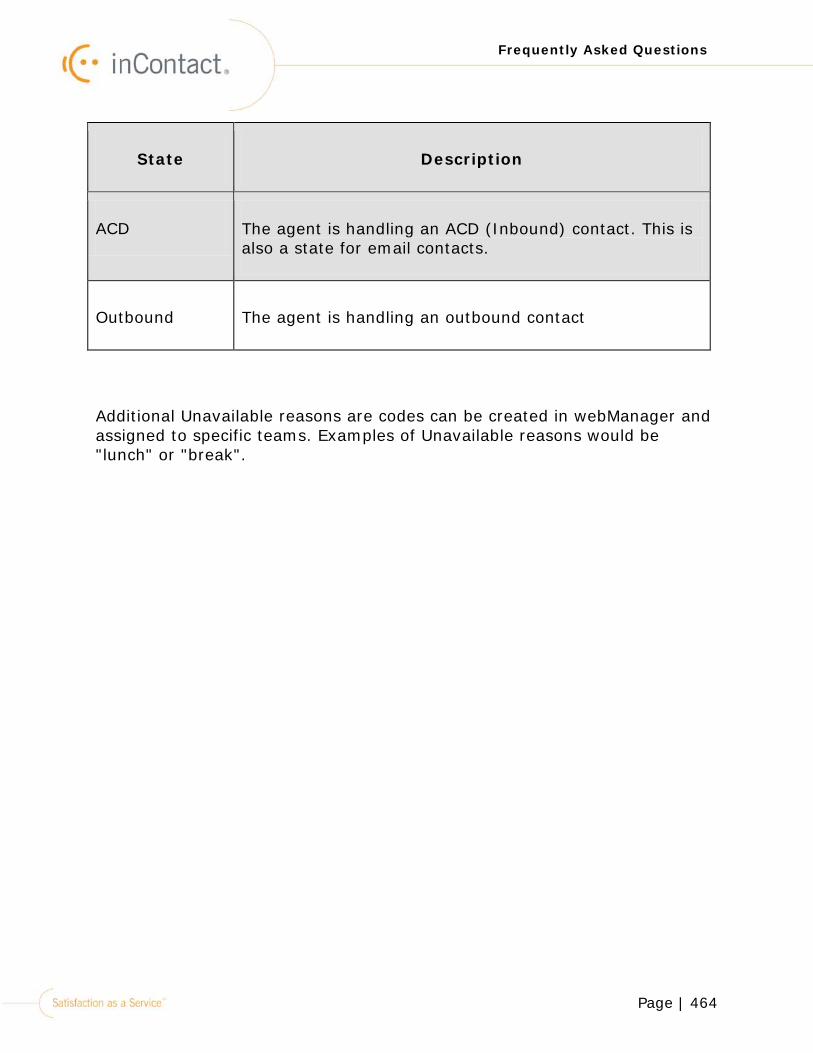
Page | 464
Frequently Asked Questions
State Description
ACD The agent is handling an ACD (Inbound) contact. This is also a state for email contacts.
Outbound The agent is handling an outbound contact
Additional Unavailable reasons are codes can be created in webManager and assigned to specific teams. Examples of Unavailable reasons would be "lunch" or "break".