incorparating mechanistic modeling & simulation to … mechanistic modeling & simulation to...
TRANSCRIPT

Incorporating Mechanistic Modeling & Simulation to Assist with
Formulation Development and Regulatory Evaluations
Viera Lukacova Simulations Plus, Inc.

The Generic Product Development Process
Product Selection &
Development • 6
Months
Pilot BE Studies
• 6 Months
Batch Scale-up • 3 Months
Pivotal BE Study • 3 Months
ANDA Filing & Review • 24 Months
Failing here multiple times can cause significant delays
Missing “specifications” can be costly
2

Outline • Why Modeling & Simulation? • Overview of Mechanistic Simulation Models
– Predicting in vivo absorption & PK
• Applications in Generic Product Development – Generating IVIVCs – Performing virtual bioequivalence trials and establishing
dissolution specifications – Understanding food effects
• A successful biowaiver case study • Conclusions
3

How can simulation software be used?
• Dissolution Method Development – Which in vitro method best correlates with an in vivo profile?
• Formulation Design
– How do I design my formulation to achieve bioequivalence?
• Establish Dissolution Specifications
– What is the acceptable variability in key parameters before we are no longer bioequivalent?
4

Flow Diagram for Simulation Studies
5
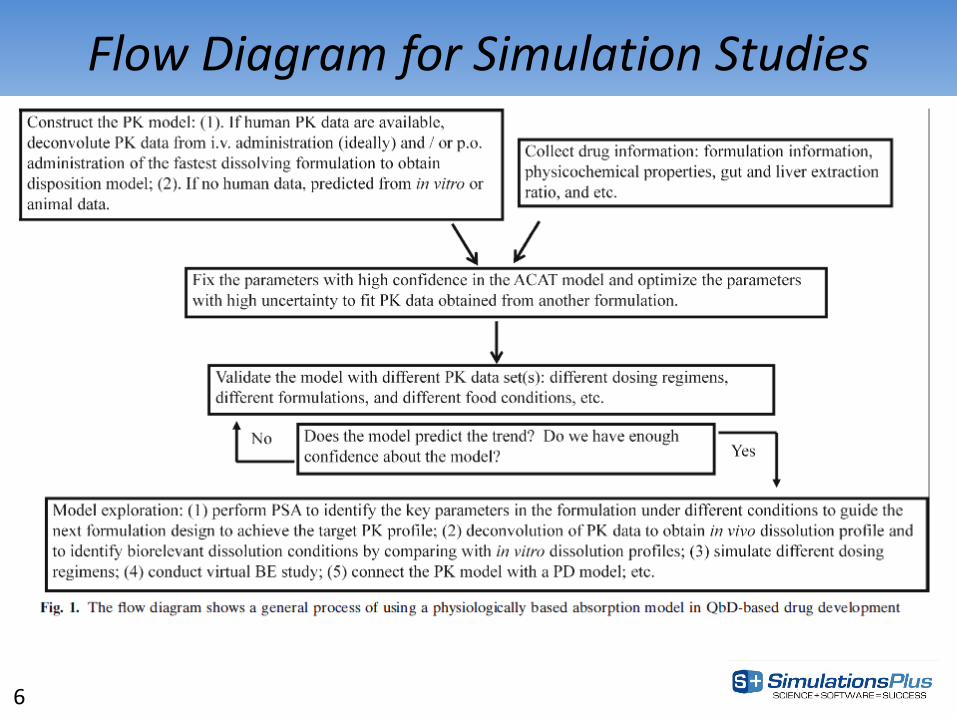
Flow Diagram for Simulation Studies
6

GastroPlus
Regional Absorption
Load observed pilot study data for 1st test product
QbD: Generate early IVIVCs
Identify in vitro release for new test
Biopharm properties - Peff, Sw, pKa, logP,
fup, Rbp
Formulation - Dose, dosage
form, particle size, release profile
Structure → ADMET Pred.
In vitro Experiments
Deconvolute in vivo dissolution of RLD
IV/IR Cp-time profile
Build the baseline absorption/PK
model
Observed PK for RLD
The Big Picture
QbD: Virtual bioequivalence trials
Will we be successful?
7

8
Mechanistic Absorption Modeling (MAM)
Physiologically based Pharmacokinetics (PBPK)

• dose or from previous compartment
• unreleased & undissolved & dissolved
Processes Involved in Oral Absorption
Drug in solution,
Clumen
Degradation
Lumen
Enterocytes
Gut wall metabolism
Blood
Centerocytes
Cmesentery/portal vein
These phenomena: • are happening simultaneously • are repeated in each of the compartments of the gastrointestinal tract
Local pH, fluid volume, concentration of bile salts …
Passive and carrier mediated
transport
Clumen
Transit In Transit Out
Dissolution
Precipitation
• to next compartment or excretion
• unreleased & undissolved & dissolved
binding/lysosomal trapping
9

Km
10

Nonlinear Dose Dependence of Midazolam Metabolism in Gut and Liver
GastroPlus simulations of nonlinear dose dependence for midazolam using in vitro Km and Vmax and iv PK. (Agoram et al., 2001)
Experimental GastroPlus Compartmental SimulatedDose Cmax AUC Cmax AUC Fa% FDP% Fb%7.5 0.028 69 0.021 65 99 45 2415 0.056 154 0.052 158 99 55 2930 0.13 453 0.120 369 99 64 34
11

12
Observed nonlinear dose dependence for valacyclovir
Weller, S. Clin. Pharm. Ther. 54(6):595 (1993) 12

GastroPlus simulation of nonlinear dose dependence for influx transport of valacyclovir
Bolger MB, et al. AAPS Journal 11(2):353 (2009) GastroPlus results were first reported in Feb. 2003 at AAPS Drug Transport Workshop, Peachtree City, GA
13

QbD: Beyond mechanistic oral absorption Pulmonary (PCAT™) Oral Cavity (OCCAT™)
Ocular (OCAT™) Dermal (TCAT™)
14

Developing a mechanistic in vitro-in vivo correlation
(IVIVC)
15

Deconvolution (with GastroPlus™ Mechanistic Absorption method)
• Inputs (in addition to the data required for the traditional methods): – Physiological parameters – Drug properties (solubility, Peff, logP, pKa, etc.)
• Outputs: A model that combines all available in silico, in vitro and in vivo information and
provides: – in vivo dissolution, absorption and bioavailability vs. time profiles – Description of site dependent absorption – Description of tissue contributions to first pass extraction
Deconvolution
in vivo dissolution vs. time along the gut– NOT F%!
16

Absorption
F Fa
D PV
FDp (not Fa!)
Metabolism Metabolism
A SC
Bioavailability
Difference between traditional and mechanistic deconvolution?
mechanistic
* Modified from van de Waterbeemd, H, and Gifford, E. ADMET In Silico Modelling: Towards Prediction Paradise? Nat. Rev. Drug Disc. 2003, 2:192-204
17

Absorption
F Fa
D PV
FDp (not Fa!)
Metabolism Metabolism
A SC
Bioavailability
traditional
?
Difference between traditional and mechanistic deconvolution?
* Modified from van de Waterbeemd, H, and Gifford, E. ADMET In Silico Modelling: Towards Prediction Paradise? Nat. Rev. Drug Disc. 2003, 2:192-204
18

Mirza et al., Pharm. Res. (2012)
Comparison of IVIVC Methods: Predicting PK of new products
19
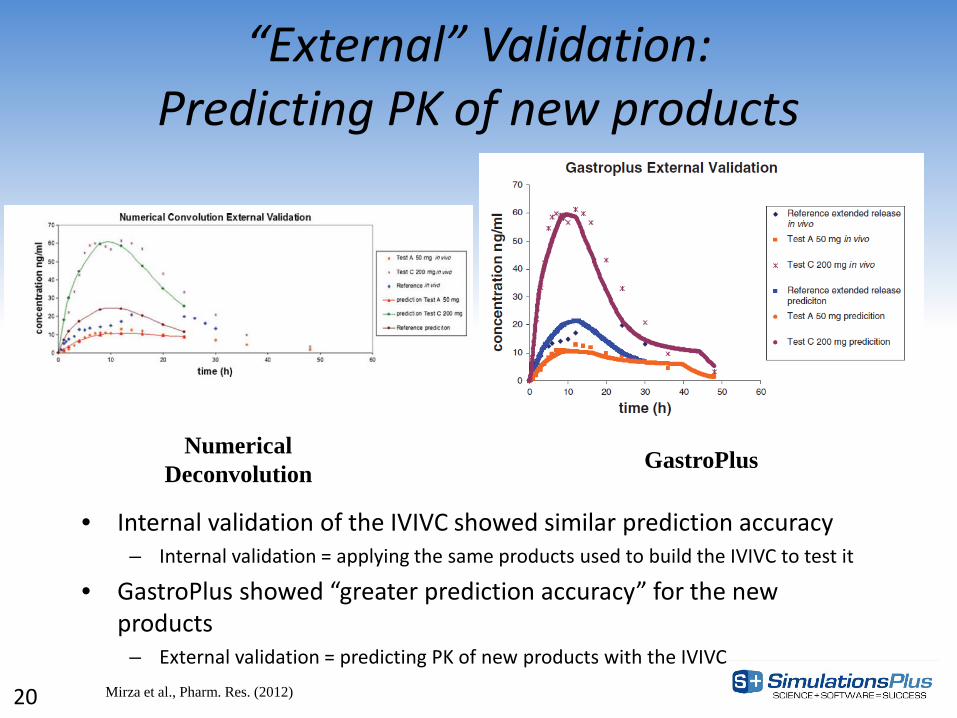
“External” Validation: Predicting PK of new products
• Internal validation of the IVIVC showed similar prediction accuracy – Internal validation = applying the same products used to build the IVIVC to test it
• GastroPlus showed “greater prediction accuracy” for the new products
– External validation = predicting PK of new products with the IVIVC
Numerical Deconvolution GastroPlus
Mirza et al., Pharm. Res. (2012) 20

IVIVC for BCS Class II (F = 66%)
21
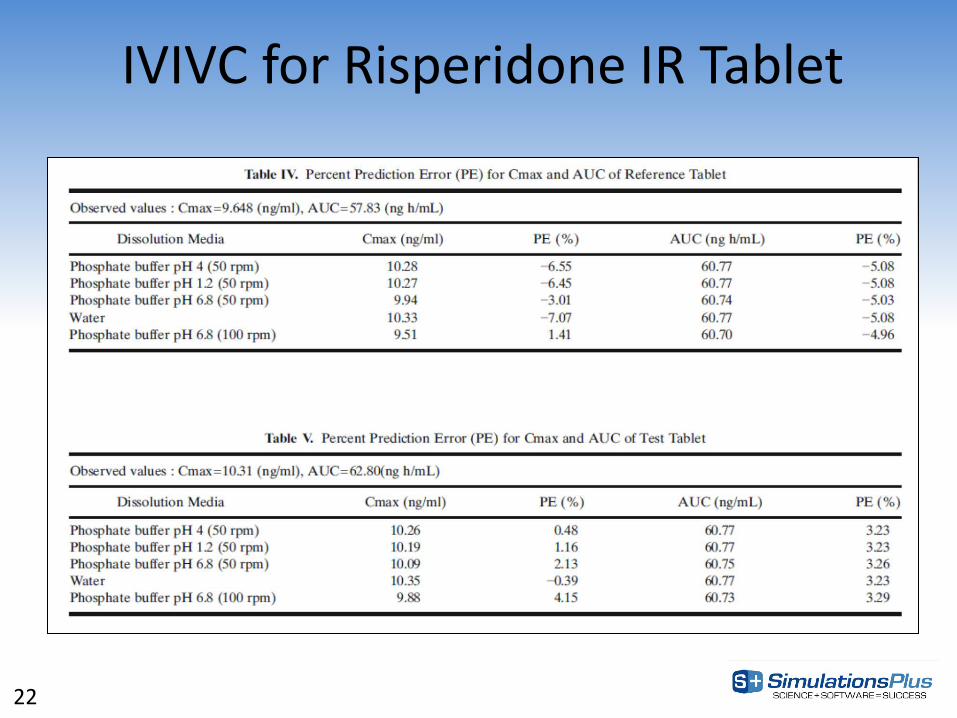
IVIVC for Risperidone IR Tablet
22

Virtual Bioequivalence Trials
23

A population has variability as function of age, gender, weight, height (BMI), disease state.
You
24

Virtual Bioequivalence Trials Bioequivalence trials are run to demonstrate bioequivalence between a test
formulation and a reference formulation. To demonstrate bioequivalence, the test product must duplicate the Cmax
and AUC of the reference product within 80-125% at 90% confidence intervals under both fasted and fed conditions.
The number of subjects in the trial can affect the outcome. If the number of
subjects is too small, the trial might fail when the product is actually bioequivalent. If the number is too large, time and money are wasted.
Failure of a bioequivalence trial is very expensive and time-consuming. Virtual bioequivalence trials can help to predict whether a formulation is
likely to pass or fail. They are not perfect, but they provide an important decision-making tool to use with all other information.
25

Establish dissolution specifications
10% variability around HPMC content 25 virtual lots simulated in DDDPlus
100th percentile (‘extreme’) dissolution profiles loaded into GastroPlus to predict PK
0
5
10
15
20
25
30
35
0 8 16 24 32 40 48 56 64 72
Conc
(ug/
mL)
Time (hours)
Predicted PK Profiles
26
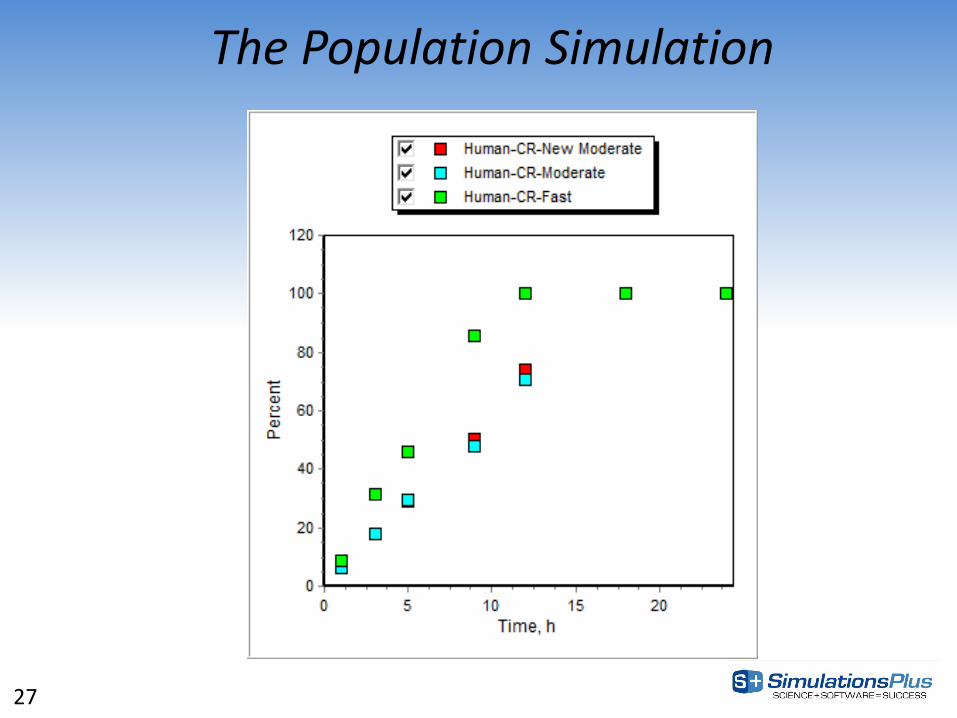
The Population Simulation
27

The Population Simulation
28
Understanding food effects
29
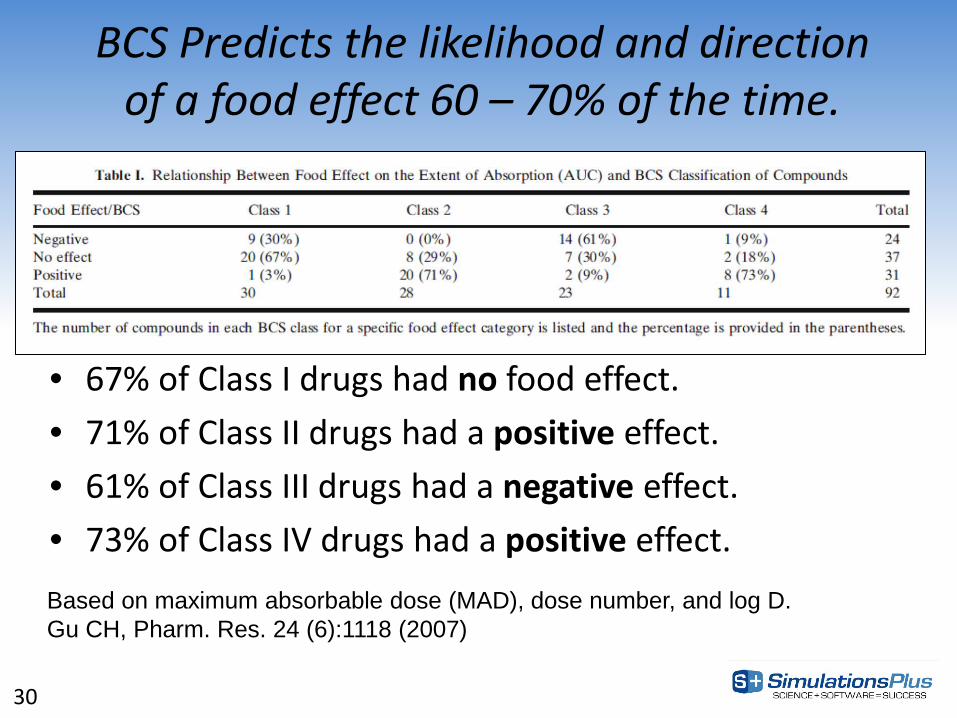
BCS Predicts the likelihood and direction of a food effect 60 – 70% of the time.
• 67% of Class I drugs had no food effect. • 71% of Class II drugs had a positive effect. • 61% of Class III drugs had a negative effect. • 73% of Class IV drugs had a positive effect. Based on maximum absorbable dose (MAD), dose number, and log D. Gu CH, Pharm. Res. 24 (6):1118 (2007)
30

Fed State – Light and High Fat Meal
Main changes between Fasted and Fed state: - Higher stomach volume - Changes in pH (stomach and upper SI) - Longer gastric emptying - Higher bile salt concentrations
31

Gastric emptying is expected to vary between high-fat and light meals
The fat in high-fat meal may aid in dissolution of highly lipophilic compounds.
Fed State – Light and High Fat Meal
32
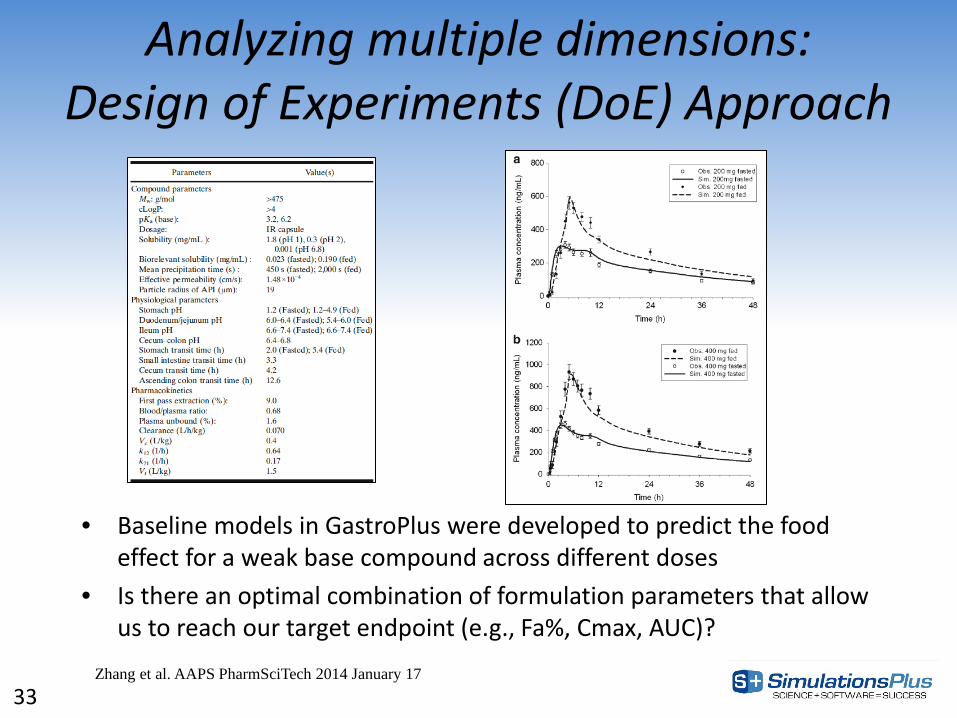
Analyzing multiple dimensions: Design of Experiments (DoE) Approach
• Baseline models in GastroPlus were developed to predict the food effect for a weak base compound across different doses
• Is there an optimal combination of formulation parameters that allow us to reach our target endpoint (e.g., Fa%, Cmax, AUC)?
Zhang et al. AAPS PharmSciTech 2014 January 17 33

• Is there an optimal combination of formulation parameters that allow us to reach our target endpoint (e.g., Fa%, Cmax, AUC)?
• Can we “design out” the food effect?
Zhang et al. AAPS PharmSciTech 2014 January 17
Analyzing multiple dimensions: Design of Experiments (DoE) Approach
34

3D Parameter Sensitivity Analysis
• Parameter sensitivity analysis was run across dose and particle size together
• API particle size reduction may be useful to mitigate the food effect
Zhang et al. AAPS PharmSciTech 2014 January 17
Fasted Fed
35

Pharmaceutical Development
Predicting food effect for BCS Class II compounds
(Xia et al., 2013)
Incorporating modeling & simulation
to assist with oral product development
(Mathias et al., 2012)
Incorporating PBPK to assist with salt
selection
(Chiang et al., 2013)
Virtual bioequivalence trials to predict BE of
different product batches
(Mitra et al., 2014)
36

Pharmaceutical Development
Incorporating M&S to assist with Quality by Design (QbD)
(Zhang et al., 2011)
Role of M&S in drug development and
regulatory evaluation
(Jiang et al., 2011)
Using M&S to predict virtual BE and assess
dissolution specifications
(Babiskin et al., 2015)
Generating mechanistic IVIVCs to predict test
formulations
(Mirza et al., 2012)
37

Re-engineered formulations and “virtual” bioequivalence:
A successful biowaiver case study
38
Objectives • Post approval, sponsor’s manufacturing process
change resulted in different particle size distributions for new lots
• With GastroPlus, could they apply for a biowaiver by: – assessing the effects of changes in particle size distribution
of the active pharmaceutical ingredient (API) on its oral bioavailability?
– predicting the virtual bioequivalence between the “new” and “old” API lots?
39

Tasks
• Determine the most appropriate absorption/PBPK model for the API across several doses for the non-engineered lots
• Assess the effect of particle size on API exposure for the immediate release formulation
• Evaluate predicted bioequivalence of the tablets manufactured with particle-engineered (PE) API (narrower particle size distribution) versus the tablets manufactured with non particle-engineered (NPE) API (broader particle size distribution)
40

Formulation Specifications
Tistaert, C. AAPS 2015 41

Part I: Model Validation
Tistaert, C. AAPS 2015 42

Part II: Parameter Sensitivity Analysis
Tistaert, C. AAPS 2015 43

Part III: Virtual BE Simulations
Tistaert, C. AAPS 2015 44

Part III: Virtual BE Simulations
Tistaert, C. AAPS 2015 45

Summary • A mechanistic, physiologically-based absorption/PK model was
constructed in GastroPlus and validated across three dose levels (50, 100, and 300 mg) using in vivo data collected from tablets manufactured with non-particle-engineered API.
• Parameter sensitivity analysis showed that mean particle size would be the main property that determines whether formulations are likely to be bioequivalent, regardless of dose.
• Virtual bioequivalence trial simulations showed that, for a sufficiently powered study, the population-derived Cmax and AUC values would be bioequivalent between the tablets manufactured with non-particle-engineered (NPE) vs. new-particle-engineered (PE) API, regardless of the dose.
• Regulatory agencies approved the sponsor’s biowaiver application
46

How Modeling & Simulation Can Save Resources in Generic R&D
• Understand the mechanisms that affect the absorption/PK of reference products earlier – Gain unique insight into the release kinetics & establish better targets
• Guide formulation & dissolution method design – Improve chances for success in follow-up pilot studies
• Estimate population behaviors before running clinical trials (virtual bioequivalence trials) – Separate formulation & physiological effects
• Ultimate goal:
Reduce “trial and error”
47