incorporating feasibility and collaboration into large-scale planning...
TRANSCRIPT

MARINE ECOLOGY PROGRESS SERIESMar Ecol Prog Ser
Vol. 604: 211–222, 2018https://doi.org/10.3354/meps12743
Published October 4
INTRODUCTION
Coral reef fisheries are harvested beyond sustain-able levels in many regions, which is often linked toloss of biodiversity and ecosystem functions (Dulvy etal. 2004, Bellwood et al. 2011, McClanahan et al.
2011, Mora et al. 2011). Local fishery management,along with reduction of regional and global drivers ofdegradation, is imperative for recovery of reefs andsustainable fisheries (Hughes et al. 2010, Graham etal. 2013). Prioritizing locations for restrictions on fish-eries or marine protected areas (MPAs) by utilizing
© The authors 2018. Open Access under Creative Commons byAttribution Licence. Use, distribution and reproduction are un -restricted. Authors and original publication must be credited.
Publisher: Inter-Research · www.int-res.com
*Corresponding author: [email protected]
ABSTRACT: Broad-scale overharvesting of fish is one of the major drivers of marine biodiversityloss and poverty, particularly in countries with high dependence on coral reefs. Given the hetero-geneity of fishing effort and management success, and the scarcity of management resources, it isnecessary to identify broad-scale locations for promoting successful fisheries management andconservation. Here, we assessed how fisheries management and conservation priorities in theWestern Indian Ocean would change if the objectives were to (1) minimize lost fishing opportunity,(2) minimize the time for fish biomass to recover, (3) avoid locations of low management feasibilitybased on historical management outcomes, and (4) incorporate international collaboration to opti-mize the rate for achieving goals. When prioritizing for rapid recovery of fish biomass rather thanminimizing lost fishing opportunity, we found that the area of priority management zones changedby over 60% in some countries. When locations of low management feasibility were avoided, therecovery time of fish biomass across the region increased 4-fold. International collaborations prior-itized management zones in remote, high biomass, and low fishing pressure reefs and reduced therecovery time of fish 5-fold compared to non-collaboration scenarios. Thus, many of these conser-vation objectives favored wealthy and sparsely populated over poorer and natural resource depend-ent countries. Consequently, this study shows how prioritization policies, incentives, decisions, andconflicts will produce highly variable outcomes and challenges for sustainability.
KEY WORDS: Africa · Conservation planning · Marine and fisheries policy · Marxan · IndianOcean · Sustainable fisheries
OPENPEN ACCESSCCESS
Incorporating feasibility and collaboration intolarge-scale planning for regional recovery of coral
reef fisheries
Kendall R. Jones1,2,3,8,*, Joseph M. Maina2,4, Salit Kark2,5, Timothy R. McClanahan6, Carissa J. Klein1, Maria Beger2,7
1School of Earth and Environmental Sciences, University of Queensland, St Lucia, QLD 4072, Australia2Centre for Conservation and Biodiversity Science, School of Biological Sciences, University of Queensland, St. Lucia,
QLD 4072, Australia3Wildlife Conservation Society, Global Conservation Program, Bronx, NY 10460, USA
4Department of Environmental Sciences, Macquarie University, North Ryde, NSW 2109, Australia5The Biodiversity Research Group, School of Biological Sciences, University of Queensland, St Lucia, QLD 4072, Australia
6Wildlife Conservation Society, Marine Programs, Bronx, NY 10460, USA7School of Biology, Faculty of Biological Sciences, University of Leeds, Leeds LS2 9JT, UK
8Present address: School of Earth and Environmental Sciences, University of Queensland, St Lucia, QLD 4072, Australia

Mar Ecol Prog Ser 604: 211–222, 2018
marine spatial planning methods is expected to im -prove fisheries and the services provided by marineecosystems (Fernandes et al. 2005, Gaines et al.2010). However, planning less frequently considersthe outcomes of different priorities, assumptions, in -cen tives, decisions, and consequences of large-scalecollaboration histories, instead aiming to minimizethe adverse impacts of conservation plans on fish-eries (Ban & Klein 2009, Metcalfe et al. 2015).
While fisheries policies and management actionspropose to achieve sustainable fisheries, the lack ofclear and scaled metrics of success has led to poor plan-ning inmanycases (Wormetal.2009).Oneusefulmetricis reef fish biomass, because it is easily measured andis associated with predictable declines in ecologicalstates, processes, and ecosystem services (Mc Clana -hanetal.2011,Pereira et al. 2013, Karr et al. 2015, Mac-Neil et al. 2015). Therefore, reef biomass is an integra-tive metric that can be used for setting managementobjectives with clear ecological thresholds (McClana-han 2018). For example, in the Western Indian Ocean(WIO), maximum sustainable fisheries yield and eco-logical health occurs when total reef biomass is be-tween 300 and 600 kg ha−1 (McClanahan et al. 2011).Conservation areas, where all ecological processes aremaintained, should have a biomass of ~1150 kg ha−1
in the WIO (McClanahan et al. 2015). Consequently, bio mass thresholds and recovery rates can inform spa-tial prioritization objectives (McClanahan et al. 2016).
Increasing agreement and compliance with man-agement plans should be a primary objective whendeveloping sustainable fisheries policies (MacNeil etal. 2015, McClanahan et al. 2016). Therefore, there isa need to consider how socioeconomic and politicalcharacteristics influence the likelihood of achievingstrong compliance (hereafter referred to as ‘manage-ment feasibility’) (Mascia 2003, McClanahan et al.2016). The factors influencing management feasibilityare diverse, and include strength of governance (Os-trom 2007), perceptions of management legitimacy(McClanahan & Abunge 2016), and willingness ofmanagement entities to collaborate (Knight et al.2010). While some maps of feasibility have been de-veloped across a variety of spatial scales (O’Connor etal. 2003, Knight et al. 2010, Mills et al. 2013), it israrely considered in spatial prioritization (Polasky2008, Mills et al. 2013). By making feasibility a con-straint in spatial prioritization, the risk of inappropriateplacement and compliance failures is minimized.
International collaboration is also important in socio-politically complex regions where conflicts oc cur onborders and management resources are scarce, suchas the WIO (Cordner 2010, Bueger 2013, Kark et al.
2015). Collaboration, when successful, has been shownto substantially reduce the cost and area required formanaging terrestrial and marine environments (Karket al. 2009, Mazor et al. 2013). Management costs andeffectiveness vary across the WIO and collaborationhas the potential to reduce shared costs to achieve de-sired outcomes, such as maintaining fish populations.Transboundary conservation, for example, has beenidentified as a regional priority between Kenya, Tan-zania, and Mozambique to reap potential benefits ofcollaboration (Nairobi Convention 2015).
By explicitly incorporating management feasibilityand international collaboration into management ob -jectives, we built on previous spatial prioritizationsusing fish biomass recovery information (McClana-han et al. 2016). First, we assessed how using fishbiomass recovery changed the spatial distribution offishery management priority zones compared to thecommon zoning method of minimizing lost fishingopportunity. Second, we tested the influence of man-agement feasibility on regional management priori-ties with a feasibility index using measures of fishbiomass uncertainty, effectiveness of existing man-agement, and estimates of collaboration potential be -tween WIO countries. Finally, we explored potentialsocio-politically relevant scenarios of internationalcollaboration to consider how collaboration can im -prove fish biomass recovery goals.
MATERIALS AND METHODS
The study area covered the mapped coral reefs inthe large region of Kenya to South Africa, and east tothe Maldives and Chagos. A previous study developeda 2.5 km2 grid of fish biomass model based on a pub-licly available map (Reefs at Risk: www.wri.org/ our-work/project/reefs-risk) and 7 predictor variables andtheir interactions (McClanahan et al. 2016). Variableswere those known to influence the large-scale distri-butions of fish, and included strictness of manage-ment, compliance with management, the presence offishing, distance to markets and market population,and 3 measures of sea surface temperature (Cinner etal. 2016). It is important to note that a limitation of thismodel is its inability to incorporate smaller scale localinfluences, such as benthic cover. While detailed ben-thic cover data would have been informative, data areonly available for a small sub-section of the WIO(Maina et al. 2015), so could not be included. Time-to-recovery maps were developed using fish biomass re-covery rates (kg yr−1) to thresholds for sustainablefishing (450 kg ha−1) and for conservation areas
212

Jones et al.: Using feasibility in reef recovery planning
(1150 kg ha−1). McClanahan et al. (2011) based thesethresholds on the fact that maximum sustained fishingyield in the WIO occurs be tween 300 and 600 kg ha−1
and selected the sustainable fishing threshold as themid-range estimate for sustainable fishing production(450 kg ha−1). They also used a conservation thresholdof 1150 kg ha−1 because below this level is where thefirst measured changes in ecological processes (e.g.carnivory and herbivory) begin to appear. For fullmethodological details on fish biomass modeling andbiomass thresholds, see McClanahan et al. (2016).
Spatial prioritization for reef fishery management
We used the conservation prioritization softwareMarxan with Zones (Watts et al. 2009) to identify pri-ority areas for fisheries management. Marxan withZones uses a simulated annealing algorithm to deter-mine sets of sites that fulfill pre-determined quantita-tive targets for biodiversity features while minimizingcost, and also allows for the selection of different man-agement zones (Watts et al. 2009), such as conserva-tion zones or sustainable fishing areas. The costvalues used in Marxan with Zones can reflect actualmonetary costs (e.g. land purchase price), or any othervalue that is desirable to minimize (e.g. lost fishingopportunity). We used the 2.5 km2 grid from thefish biomass model as a planning unit, and used thearea of the World Conservation Monitoring Centre(WCMC) coral reef distribution (UNEP-WCMC et al.2010) in each planning unit as a biodiversity feature.We explored questions using different prioritizationobjectives, but for all objectives we set targets (i.e.proportion of reef in a zone) to include 50% of reefarea in sustainable fishing zones and 20% in conser-vation zones, while accounting for existing high com-pliance fishery closures (McClanahan et al. 2016). Weconducted 10 Marxan with Zones runs of 100 repeti-tions for each objective, producing 10 ‘best solution’outputs for each objective. The ‘best solution’ outputis the reserve system that performs best at reaching itsfeature targets with minimal cost. To map Marxanwith Zones results, we considered a planning unit tobe selected as a conservation or sustainable fishingzone if it was selected in 8 of the 10 ‘best solution’ out-puts. Using these base methods, we analyzed 3 spatialprioritization objectives — fishing opportunity base-line, time-to-recovery, and management feasibility —which differed only in the values used to be mini -mized by Marxan with Zones (see Table S1 in theSupplement at www. int-res. com/ articles/ suppl/ m604p211_ supp. pdf for a summary of objectives).
Fishing opportunity baseline objective
Our baseline spatial prioritization objective usedestimates of artisanal fishing landings as the value tobe minimized in Marxan with Zones. Minimizing lostfishing opportunity is a common approach in spatialprioritization analyses (Klein et al. 2010, Grantham etal. 2013, Mazor et al. 2013), and we hereafter refer tothis objective as the fishing opportunity baselineobjective. Fish landing estimates were taken fromHalpern et al. (2008), which modeled fish landingsfrom national FAO small-scale fisheries statistics; thedata are freely available (doi:10.5063/F19Z92TW).These data give approximate annual artisanal fishingcatch at a 1 km2 resolution. As our planning unitswere 2.5 km2, we used the average artisanal fishingcatch within each planning unit as the value to beminimized in Marxan with Zones. Because the arti-sanal fishing data did not cover remote islands andatolls, we assigned planning units without artisanalfishing data the lowest quartile value of artisanalfishing estimates for the region. Therefore, the Marxanwith Zones algorithm ensured that conservation andsustainable fisheries zones contained at least 20 and50% of coral reef in the WIO, respectively, whileminimizing the amount of lost opportunity for arti-sanal fishing due to the placement of managementzones.
Time-to-recovery objective
Our second spatial prioritization objective followedMcClanahan et al. (2016) by using Marxan with Zonesto minimize fish biomass recovery time (hereafter thetime-to-recovery objective). Compared to the fishingopportunity baseline objective, this substitutes fishbiomass recovery time for artisanal fishing catch asthe value to be minimized. Thus, our time-to-recov-ery for the sustainable fishing zone reflects how longit takes for fish biomass to recover to 450 kg ha−1.Similarly, the time-to-recovery value for the conser-vation zone reflects how long it would take for bio-mass to recover to 1150 kg ha−1.
Management feasibility objective
To examine the impacts of incorporating manage-ment feasibility, we used the following equation tocreate a feasibility score (F) that represented the rawtime-to-recovery values used in the fish biomass re -covery objective, weighted by a measure of manage-
213

Mar Ecol Prog Ser 604: 211–222, 2018
ment feasibility (hereafter the management feasibil-ity objective). F was used as the value to be mini-mized in Marxan with Zones, and was calculatedusing the following equation (see Figs. S1 & S2 in theSupplement for maps of F values):
Fi (i =1…n) = Ti(Ei + C1 + Ri) (1)
where Ti represents the time-to-recovery (in years) ofcoral reef in planning unit i, and n is the total numberof planning units. E represents the percentage of suc-cessfully managed MPAs in a country, and was takenfrom Rocliffe et al. (2014) for all countries and territo-ries except Bassas Da India, British Indian OceanTerritory, Glorioso, Ile Europa, Ile Tromelin, and theMaldives, which were assigned E from Reefs at RiskRevisited (Burke et al. 2011). These values were thennormalized be tween 0 and 100 using a fuzzy logiclinearly decreasing membership function. E was in -cluded because new management activities are likelyto be more feasible in areas where current manage-ment practices are successful.
C represents the potential for collaboration be -tween countries, and was calculated by normalizingcountry-level collaboration scores from Levin et al.(2018) between 0 and 100 using a fuzzy logic linearlydecreasing membership function and spatially as -sign ing these country scores to planning units. Thesecollaboration scores were derived using linkagesbetween nations based on biodiversity (number ofshared species), trade (import/export value be tweencountries), governance (number of shared environ -mental agreements), and spatial location (geographicrelationship) (Levin et al. 2018). We used Thiessenpolygons (Thiessen 1911) to determine the nearestex clusive economic zone (EEZ) boundary for eachplanning unit, and assigned planning units the col-laboration score for the 2 countries that share bound-aries (Fig. S3 in the Supplement). For example, aplanning unit where the closest EEZ boundary isbetween Kenya and Tanzania would receive the Cvalue for Kenya−Tanzania collaboration. Areas ofhigh collaborative potential may be more feasible formanagement when considering cross-boundary col-laboration, especially for reefs located between 2countries or territories (Levin et al. 2018).
Ri represents a measure of model over-estimationof fish biomass recovery time for planning unit i, andis computed from the residuals of the biomass predic-tion model. To calculate R, we used the predictedbiomass at upper and lower 95% confidence inter-vals (CI) from McClanahan et al. (2016) to calculatetime-to-recovery. This allowed us to produce opti-mistic estimates of time-to-recovery (i.e. from using
upper CI) and conservative estimates of time-to-recovery (i.e. from using lower CI). We then com-puted R as the ratio of conservative time-to-recoveryestimates (lower CI) and optimistic time-to-recoveryestimates (upper CI), from the mean predictions ofbiomass recovery time (taken from McClanahan etal. 2016). These values were then normalized be tween0 and 100 using a fuzzy logic linearly decreasingmembership function. Our feasibility metric penal-izes areas where optimistic biomass predictions (upperCI) are further from mean predictions than conserva-tive biomass predictions (lower CI), because modeledfish biomass in these areas is more likely to be over-estimated than underestimated. We included vari-able R to penalize areas where biomass overestima-tion is more likely than underestimation, because ifbiomass is overestimated the actual time-to-recoveryfor that area will be longer than anticipated. In thereverse situation, time-to-recovery will be underesti-mated and management activities will be required fora shorter time than anticipated.
Cross-boundary collaboration scenarios
To investigate the role of cross-boundary collabo-ration in spatial management prioritization, we allo-cated planning units to countries or regions usingEEZs (e.g. Kenya, Glorioso Islands). We compared 3international collaboration scenarios, sensu Kark etal. (2009) and Mazor et al. (2013). These were (1) fullcollaboration scenario with all countries collaborat-ing; (2) partial collaboration scenario, where coun-tries that are currently part of conservation/environ-mental management agreements collaborate; and (3)no collaboration scenario, where each country actedin isolation. For the partial collaboration scenario weused 2 groups of collaborating countries: Kenya andTanzania, who have identified transnational collabo-ration as a regional priority as per the recent conven-tion of parties (COP8) of the Nairobi convention(Nairobi Convention 2015), and members of theIndian Ocean Commission (Comoros, Madagascar,Mauritius, Seychelles and Réunion; Commission del’Océan Indien 2011).
Comparing prioritization objectives and collaboration scenarios
To compare management priorities under the (1)fishing opportunity baseline, (2) time-to-recovery,and (3) management feasibility objectives, we calcu-
214
Jones et al.: Using feasibility in reef recovery planning
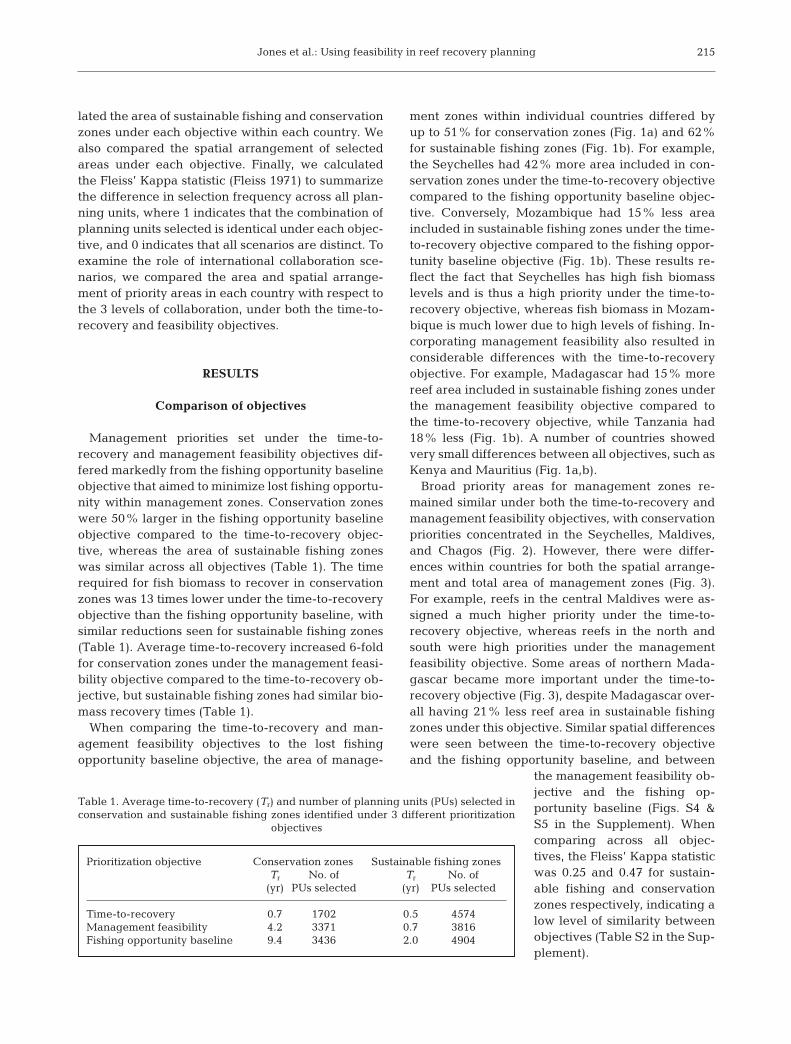
lated the area of sustainable fishing and conservationzones under each objective within each country. Wealso compared the spatial arrangement of selectedareas under each objective. Finally, we calculatedthe Fleiss’ Kappa statistic (Fleiss 1971) to summarizethe difference in selection frequency across all plan-ning units, where 1 indicates that the combination ofplanning units selected is identical under each objec-tive, and 0 indicates that all scenarios are distinct. Toexamine the role of international collaboration sce-narios, we compared the area and spatial arrange-ment of priority areas in each country with respect tothe 3 levels of collaboration, under both the time-to-recovery and feasibility objectives.
RESULTS
Comparison of objectives
Management priorities set under the time-to-recovery and management feasibility objectives dif-fered markedly from the fishing opportunity baselineobjective that aimed to minimize lost fishing opportu-nity within management zones. Conservation zoneswere 50% larger in the fishing opportunity baselineobjective compared to the time-to-recovery objec-tive, whereas the area of sustainable fishing zoneswas similar across all objectives (Table 1). The timerequired for fish biomass to recover in conservationzones was 13 times lower under the time-to-recoveryobjective than the fishing opportunity baseline, withsimilar reductions seen for sustainable fishing zones(Table 1). Average time-to-recovery increased 6-foldfor conservation zones under the management feasi-bility objective compared to the time-to-recovery ob -jective, but sustainable fishing zones had similar bio-mass recovery times (Table 1).
When comparing the time-to-recovery and man-agement feasibility objectives to the lost fishingopportunity baseline objective, the area of manage-
ment zones within individual countries differed byup to 51% for conservation zones (Fig. 1a) and 62%for sustainable fishing zones (Fig. 1b). For example,the Seychelles had 42% more area included in con-servation zones under the time-to-recovery objectivecompared to the fishing opportunity baseline objec-tive. Conversely, Mozambique had 15% less areaincluded in sustainable fishing zones under the time-to-recovery objective compared to the fishing oppor-tunity baseline objective (Fig. 1b). These results re -flect the fact that Seychelles has high fish biomasslevels and is thus a high priority under the time-to-recovery objective, whereas fish biomass in Mozam-bique is much lower due to high levels of fishing. In -corporating management feasibility also resulted inconsiderable differences with the time-to-recoveryobjective. For example, Madagascar had 15% morereef area included in sustainable fishing zones underthe management feasibility objective compared tothe time-to-recovery objective, while Tanzania had18% less (Fig. 1b). A number of countries showedvery small differences between all objectives, such asKenya and Mauritius (Fig. 1a,b).
Broad priority areas for management zones re -mained similar under both the time-to-recovery andmanagement feasibility objectives, with conservationpriorities concentrated in the Seychelles, Maldives,and Chagos (Fig. 2). However, there were differ-ences within countries for both the spatial arrange-ment and total area of management zones (Fig. 3).For example, reefs in the central Maldives were as -signed a much higher priority under the time-to-recovery objective, whereas reefs in the north andsouth were high priorities under the managementfeasibility objective. Some areas of northern Mada-gascar became more important under the time-to-recovery objective (Fig. 3), despite Madagascar over-all having 21% less reef area in sustainable fishingzones under this objective. Similar spatial differenceswere seen between the time-to-recovery objectiveand the fishing opportunity baseline, and between
the management feasibility ob -jective and the fishing op -portunity baseline (Figs. S4 &S5 in the Supplement). Whencomparing across all objec-tives, the Fleiss’ Kappa statisticwas 0.25 and 0.47 for sustain-able fishing and conservationzones respectively, indicating alow level of similarity betweenobjectives (Table S2 in the Sup-plement).
215
Prioritization objective Conservation zones Sustainable fishing zones Tr No. of Tr No. of (yr) PUs selected (yr) PUs selected
Time-to-recovery 0.7 1702 0.5 4574Management feasibility 4.2 3371 0.7 3816Fishing opportunity baseline 9.4 3436 2.0 4904
Table 1. Average time-to-recovery (Tr) and number of planning units (PUs) selected inconservation and sustainable fishing zones identified under 3 different prioritization
objectives

Mar Ecol Prog Ser 604: 211–222, 2018216
Cross-boundary collaboration priorities
Cross-boundary collaboration reduced overall time-to-recovery and the area of management zones by re-distributing management priorities toward island na-tions with high fish biomass, such as the Seychellesand Chagos. Results were similar under both time-to-recovery and management feasibility objectives, sohere we report on the results of the time-to-recoveryobjective. Under a no collaboration scenario, the timerequired for fish biomass recovery was increased 5.4times in conservation zones, and 3.4 times in sustain-able fishing zones compared to the full collaborationscenario (Table 2). The partial collaboration scenarioreduced recovery time by 37% in conservation zones,and over 150% for sustainable fishing zones (Table 2).A full collaboration scenario also required around21% less area for conservation zones, and 38% less
for sustainable fishing zones compared to a scenariowithout collaboration (Table 2).
Collaboration substantially changed the location ofmanagement priorities, concentrating priorities inremote locations with high fish biomass (Fig. 4). Forexample, Chagos had 62% of its reef contained inconservation zones under a full collaboration sce-nario, but only 24% under a partial collaboration sce-nario (Fig. 4b). Conversely, Réunion had only 13% ofits reef contained in sustainable fishing zones underfull collaboration, but this rose to 51% under the nocollaboration scenarios (Fig. 4a). In some nations, theeffect of collaboration had contrasting effects for con-servation zones and sustainable fishing zones. TheSeychelles contained around 30% more reef in con-servation zones under both collaboration scenarios,but around 20% less reef within sustainable fishingzones (Fig. 4).
–50–40–30–20–10
0102030405060
Reef
are
a in
con
serv
atio
n zo
ne(%
)
–40–30–20–10
0102030
Time to recovery
Management feasibility
40506070
a
b
Reef
are
a in
sus
tain
able
fishi
ng z
one
(%)
Réunion
Fig. 1. Average difference from fishing opportunity baseline objective for (a) conservation zones and (b) sustainable fishingzones, expressed as reef area included in conservation and sustainable fishing zones, for priorities identified under thetime-to-recovery objective (white) and the management feasibility objective (grey). Conservation zones and sustainablefishing zones contain 20 and 50% of total Western Indian Ocean (WIO) reef area, respectively. Values are the average of 10
‘best solution’ outputs from Marxan with Zones

Jones et al.: Using feasibility in reef recovery planning
DISCUSSION
Incorporating management feasibility and fish bio-mass recovery into spatial prioritization considerablychanged the spatial arrangement of priority locationscompared to the baseline, where lost fishing opportu-nity was the main consideration. Furthermore, thetime required for fish biomass to recover increasedsubstantially when avoiding zoning locations of lowmanagement feasibility. These increases were attrib-utable to management zones being shifted frominfeasible high biomass reefs to lower biomass areaswith greater feasibility. Consequently, incorporatingmanagement feasibility into spatial prioritizationscan help avoid spending resources where effectivemanagement seems unlikely (Mills et al. 2013).
Clearly, managing fisheries for socio-economic goalssuch as food and income is important, but conserva-tion may be challenging and expensive if feasibilityis not addressed first (Hicks 2011, McClanahan &Abunge 2016).
Fishery closures or MPAs often face considerableopposition from fishers, and the imposition of MPAsor other fishery management policies, such as gearrestrictions or catch quotas, is unlikely to succeedwithout broad consensus and community support(Jameson et al. 2002, Beger et al. 2004, McClanahanet al. 2005, FAO 2006, Kamat 2014). Providing infor-mation on the length of time required for manage-ment to meet demonstrable ecological targets and in -corporating fish biomass recovery into managementplanning should increase knowledge and gain sup-
217
Fig. 2. Priority areas (selected in >80% of Marxan with Zones runs) for conservation and sustainable fishing zones from 10 ‘bestsolution’ Marxan with Zones outputs: (a) priorities identified to minimize the time required for fish biomass recovery to sus-tainable fishing (450 kg ha−1) and conservation (1150 kg ha−1) thresholds (time-to-recovery objective). (b) Priorities identifiedto minimize time-to-recovery and avoid areas of low management feasibility (management feasibility objective). Each sce-nario contains 20% of the total reef area as conservation zones, and 50% as sustainable fishing zones. This figure is available
in high resolution at www.int-res.com/articles/suppl/m604p211_Fig2.png

Mar Ecol Prog Ser 604: 211–222, 2018
port from stakeholders. Where many people are highlydependent on coral reefs for food and income, suchas the WIO (Donner & Potere 2007), stakeholder per-ceptions and participation are critical to avoidingcompliance failures (Graham et al. 2007, Levy 2010,McClanahan 2010).
International collaborations de crease costsof conservation and fishery management ef -forts but result in management zones beingasymmetrically distributed (Table 2, Fig. 4).Fully collaborative conservation plans leadto some countries being exempt from conser-vation zones (e.g. South Africa, Réunion),while others face additional management re-sponsibilities (e.g. Seychelles). As such, theefficiencies gained by collaboration must bebalanced with social equity considerations(Kark et al. 2009, 2015, Halpern et al. 2013).
Other spatial prioritization ana lyses came to similarconclusions for the WIO (Maina et al. 2015, McClana-han et al. 2016) and other marine regions (Kark et al.2009, Mazor et al. 2013, Beger et al. 2015). Conse-quently, any gains achieved through regional collab-oration will also need to balance considerations of
218
Fig. 3. Difference in planning unit selection frequency for (a) conservation zones, and (b) sustainable fishing zones under time-to-recovery and management feasibility objectives. Planning units are blue if they had equal selection frequencies under bothobjectives. This figure is available in high resolution at www.int-res.com/articles/suppl/m604p211_Fig3.png
International Conservation zones Sustainable fishing zonescollaboration Tr No. of Tr No. of
(yr) PUs selected (yr) PUs selected
Full 0.7 1702 0.5 4574Partial 2.4 1632 0.7 4468None 3.8 2128 1.7 7267
Table 2. Average time-to-recovery (Tr) and number of planning units(PUs) selected in conservation and sustainable fishing zones identified
under 3 different scenarios of international collaboration

Jones et al.: Using feasibility in reef recovery planning
sharing costs and responsibilities equitably. Amongthe many considerations of collaborative natural re-source management are the broader suite of eco-nomic, political, and social barriers that influence im-plementation decisions (Sandwith et al. 2001).
The prioritization approach used here favors pro-tecting high biomass areas, which essentially triageslow biomass sites. Protecting high biomass is one of anumber of goals of management and therefore alter-native, and possibly a portfolio of, goals and zoningap proaches should be considered. For example, Mc-Clanahan et al. (2016) proposed prioritizing the recov-ery of severely degraded reefs and the surroundingreefs. Another approach not mentioned here is to con-sider larval dispersal in spatial prioritizations to pro-mote population recovery and persistence (Beger etal. 2010, 2015, Krueck et al. 2017, Álvarez-Romero etal. 2018, Magris et al. 2018). Depending on spatialscales, future work should consider using larval dis-persal models (Treml et al. 2008, Kool et al. 2011) orgenetic measures (Selkoe & Toonen 2011, Beger et al.2014) to represent the larval connectivity within MPAnetworks. Given the empirical needs and computation
complexity of larval dispersal information, simpler ap-proaches for informing MPA placement will be useful(e.g. minimizing distance between MPAs and fishinggrounds; Krueck et al. 2017), although this does notdiscount the need for future research on incorporatinglarval dispersal into spatial prioritization, as the latterhas been shown to influence priorities considerably(Magris et al. 2016). Including the costs of variousmanagement options, such as fisheries closures versusgear restrictions, has also been shown to substantiallyalter management priorities (Ban et al. 2011, Mc-Gowan et al. 2018). Furthermore, while total fish bio-mass is a useful holistic metric of reef function, it doesnot consider the different recovery rates of fish thatare important for recovery of reef function (MacNeilet al. 2015, Martin et al. 2017). Consequently, futureresearch priorities should include (1) combining spa-tial prioritization ap proaches to identify areas thatoverlap under multiple objectives (Allnutt et al. 2012),and (2) considering differential recovery rates andecological functions of fish (McClanahan et al. 2015).
The data and estimates of management feasibilityused here have a number of limitations. Firstly, we
219
0102030405060708090
100
0102030405060708090
100 Total collaboration Realistic collaboration No collaboration
Reef
in c
onse
rvat
ion
zone
(%)
a
b
Reef
in s
usta
inab
lefis
hing
zon
e (%
)
Réunion
Fig. 4. Percentage of reef of each country contained in priority areas identified under 3 international collaboration scenarios, under time-to-recovery objective. Percentage of reef in each country contained in (a) conservation zones and (b) sustainable
fishing zones. Values are the average of 10 ‘best solution’ outputs from Marxan with Zones

Mar Ecol Prog Ser 604: 211–222, 2018220
used only one conservation feature — the area of coralreef per planning unit. While unlikely to change ourmain conclusions, incorporating better data on spe-cies’ distributions or biogeographical habitats, alongwith other conservation objectives (e.g. achievingrepresentation) would likely alter the location of man-agement priorities (Allnutt et al. 2012). Secondly,while our analyses were conducted at a broad spatialscale, the size of fisheries closures in the WIO is rela-tively small and compliance in these closures ismainly a local scale issue. Local scale studies whichbuild upon our analysis could add important nuancesto fisheries management plans. Thirdly, the manage-ment feasibility metric used here is dependent on na-tional-level data and could be improved by incorpo-rating more local scale assessments. Managementfeasibility is influenced by several factors not capturedin our metric, including human values and percep-tions, as well as economic, ecological, and technicalissues (Salomon et al. 2011, Pascoe et al. 2014, Mc-Clanahan & Abunge 2016). Future studies should alsoconsider the ability of local authorities to effectivelyenforce fishery closures, and the existence and com-petency of interacting governance networks (Nagen-dra & Ostrom 2012, Morrison 2017). Finally, percep-tions of fishing re strictions and potential willingnessto comply with regulations is known to vary consider-ably within and between WIO countries (Daw et al.2012, McClanahan & Abunge 2016). Data on the per-ception of fishing restrictions by local communitiescould be used to assess the likelihood of compliancewith fisheries closures/ restrictions, thereby improvingfuture management feasibility metrics.
There are also a number of limitations with the arti-sanal fishing data used in the fishing opportunitybaseline objective, although they are the only high-resolution artisanal fishing data available across theentire WIO. These data use coastal population anddistance-to-land to spatially model the small-scaledistribution of national-scale catches (Halpern et al.2008). This likely overestimates fishing catch on reefsnear populated coastal ports, especially when fishlandings at these ports reflect fishing effort from alarge surrounding area. While artisanal fishing is no-toriously difficult to estimate (Zeller et al. 2006,Halpern et al. 2008), incorporating local-scale data onlandings at specific ports would help to avoid over -estimation around densely populated areas. Further-more, the artisanal fishing data does not discern be-tween fisheries (e.g. reef fisheries, pelagic/ offshorefisheries), and so reef fishing pressure is likely over-estimated in places such as the Maldives, where fish-ers often target pelagic species (Hemmings et al.
2014). This will unduly reduce their selection by theMarxan with Zones objective function aiming to minimize cost. Consequently, incorporating data oncatches of specific fish taxa (e.g. Watson 2017) couldrefine estimates of artisanal fishing to ensure theycapture reef fishing effort specifically.
This study demonstrates how incorporating fishbiomass recovery, management feasibility, and inter-national collaboration affects fishery managementpriorities in the WIO — favoring remote and lightlyfished regions. We also show that incorporating man-agement feasibility redistributes priorities to wealth-ier nations or to those with histories of more effectivemanagement. Both outcomes result in an uneven dis-tribution of management priorities, and may furtherburden people in poorer countries where effectivefishery management is badly needed to promote foodsecurity. It is clear that for spatial prioritization analy-ses to be useful and incorporated into decision mak-ing, many possible values, incentives, scenarios, andmetrics must be considered (Allnutt et al. 2012,McClanahan et al. 2016).
Acknowledgements. Support for the data collection andstudy was provided by the Western Indian Ocean MarineScience Association-Marine Science for Management Pro-gram (WIOMSA-MASMA) and the John D. and Catherine T.MacArthur Foundation. The Wildlife Conservation Society,through grants from the John D. and Catherine T. MacAr-thur Foundation and Australian Research Council (ARC)Center of Excellence for Environmental Decisions (CEED)supported the spatial modeling aspects of the study. S.K.was supported by the ARC, and M.B. was supported byMarie Skłodowska-Curie Fellowship 747102. Members ofthe ARC CEED working group on the Indian Ocean, inclu-ding N. Levin and J. Watson, are thanked for promoting aninterest in, and discussions around marine conservationplanning in the Indian Ocean.
LITERATURE CITED
Allnutt TF, McClanahan TR, Andréfouët S, Baker M andothers (2012) Comparison of marine spatial planningmethods in Madagascar demonstrates value of alterna-tive approaches. PLOS ONE 7: e28969
Álvarez-Romero JG, Munguía-Vega A, Beger M, del MarMancha-Cisneros M and others (2018) Designing con-nected marine reserves in the face of global warming.Glob Change Biol 24: e671−e691
Ban NC, Klein CJ (2009) Spatial socioeconomic data as a costin systematic marine conservation planning. Conserv Lett2: 206−215
Ban NC, Adams V, Pressey RL, Hicks J (2011) Promise andproblems for estimating management costs of marineprotected areas. Conserv Lett 4: 241−252
Beger M, Harborne AR, Dacles TP, Solandt JL, Ledesma GL(2004) A framework of lessons learned from community-based marine reserves and its effectiveness in guiding a

Jones et al.: Using feasibility in reef recovery planning
new coastal management initiative in the Philippines.Environ Manage 34: 786−801
Beger M, Linke S, Watts M, Game E, Treml E, Ball I, Poss-ingham HP (2010) Incorporating asymmetric connectiv-ity into spatial decision making for conservation. Con-serv Lett 3: 359−368
Beger M, Selkoe KA, Treml E, Barber PH and others (2014)Evolving coral reef conservation with genetic informa-tion. Bull Mar Sci 90: 159−185
Beger M, McGowan J, Treml EA, Green AL and others (2015)Integrating regional conservation priorities for multipleobjectives into national policy. Nat Commun 6: 8208
Bellwood DR, Hoey AS, Hughes TP (2011) Human activityselectively impacts the ecosystem roles of parrotfishes oncoral reefs. Proc R Soc B 279: 1621−1629
Bueger C (2013) Communities of security practice at work?The emerging African maritime security regime. AfrSecur 6: 297−316
Burke L, Reytar K, Spalding M, Perry AL (2011) Reefs at riskrevisited. World Resources Institute, Washington, DC
Cinner JE, Huchery C, MacNeill MA, Graham NAJ and oth-ers (2016) Bright spots among the world's coral reefs.Nature 535:416–419
Commission de l’Océan Indien (2011) Smart Fish. Les paysmembres de la COI. http:// commission ocean indien.org/membres/
Cordner L (2010) Rethinking maritime security in the IndianOcean Region. J Indian Ocean Reg 6: 67−85
Daw TM, Cinner JE, McClanahan TR, Brown K, Stead SM,Graham NAJ, Maina J (2012) To fish or not to fish: factorsat multiple scales affecting artisanal fishers’ readiness toexit a declining fishery. PLOS ONE 7: e31460
Donner SD, Potere D (2007) The inequity of the global threatto coral reefs. Bioscience 57: 214−215
Dulvy NK, Freckleton RP, Polunin NVC (2004) Coral reefcascades and the indirect effects of predator removal byexploitation. Ecol Lett 7: 410−416
FAO (2006) Report and documentation of the expert work-shop on marine protected areas and fisheries manage-ment: review of issues and considerations. Food andAgriculture Organization of the United Nations, Rome
Fernandes L, Day JON, Lewis A, Slegers S and others (2005)Establishing representative no-take areas in the GreatBarrier Reef: large-scale implementation of theory onmarine protected areas. Conserv Biol 19: 1733−1744
Fleiss JL (1971) Measuring nominal scale agreement amongmany raters. Psychol Bull 76: 378−382
Gaines SD, White C, Carr MH, Palumbi SR (2010) Design-ing marine reserve networks for both conservation andfisheries management. Proc Natl Acad Sci USA 107: 18286−18293
Graham N, Ferro RST, Karp WA, MacMullen P (2007) Fish-ing practice, gear design, and the ecosystem approach —three case studies demonstrating the effect of manage-ment strategy on gear selectivity and discards. ICES JMar Sci 64: 744−750
Graham NA, Bellwood DR, Cinner JE, Hughes TP, NorströmAV, Nyström M (2013) Managing resilience to reversephase shifts in coral reefs. Front Ecol Environ 11: 541−548
Grantham HS, Agostini VN, Wilson J, Mangubhai S and oth-ers (2013) A comparison of zoning analyses to inform theplanning of a marine protected area network in RajaAmpat, Indonesia. Mar Policy 38: 184−194
Halpern BS, Walbridge S, Selkoe KA, Kappel CV and others(2008) A global map of human impact on marine ecosys-
tems. Science 319: 948−952Halpern BS, Klein CJ, Brown CJ, Beger M and others (2013)
Achieving the triple bottom line in the face of inherenttrade-offs among social equity, economic return, andconservation. Proc Natl Acad Sci USA 110: 6229−6234 r
Hemmings M, Harper S, Zeller D (2014) Reconstruction oftotal marine catches for the Maldives: 1950−2010. In: Zylich K, Zeller D, Ang M, Pauly D (eds) Fisheries catchreconstructions: islands, Part IV. Fisheries Centre, Uni-versity of British Columbia, Vancouver
Hicks CC (2011) How do we value our reefs? Risks andtradeoffs across scales in ‘biomass-based’ economies.Coast Manage 39: 358−376
Hughes TP, Graham NAJ, Jackson JBC, Mumby PJ, SteneckRS (2010) Rising to the challenge of sustaining coral reefresilience. Trends Ecol Evol 25: 633−642
Jameson SC, Tupper MH, Ridley JM (2002) The three screendoors: Can marine ‘protected’ areas be effective? MarPollut Bull 44: 1177−1183
Kamat V (2014) ‘The ocean is our farm’: marine conserva-tion, food insecurity, and social suffering in southeasternTanzania. Hum Organ 73: 289−298
Kark S, Levin N, Grantham HS, Possingham HP (2009)Between-country collaboration and consideration of costsincrease conservation planning efficiency in the Mediter-ranean Basin. Proc Natl Acad Sci USA 106: 15368−15373
Kark S, Tulloch A, Gordon A, Mazor T, Bunnefeld N, LevinN (2015) Cross-boundary collaboration: key to the con-servation puzzle. Curr Opin Environ Sustain 12: 12−24
Karr KA, Fujita R, Halpern BS, Kappel CV and others (2015)Thresholds in Caribbean coral reefs: implications for eco-system-based fishery management. J Appl Ecol 52: 402−412
Klein CJ, Ban NC, Halpern BS, Beger M and others (2010)Prioritizing land and sea conservation investments toprotect coral reefs. PLOS ONE 5: e12431
Knight AT, Cowling RM, Difford M, Campbell BM (2010)Mapping human and social dimensions of conservationopportunity for the scheduling of conservation action onprivate land. Conserv Biol 24: 1348−1358
Kool JT, Paris CB, Barber PH, Cowen RK (2011) Connectiv-ity and the development of population genetic structurein Indo-West Pacific coral reef communities. Glob EcolBiogeogr 20: 695−706
Krueck NC, Ahmadia GN, Possingham HP, Riginos C, TremlEA, Mumby PJ (2017) Marine reserve targets to sustainand rebuild unregulated fisheries. PLOS Biol 15: e2000537
Levin N, Beger M, Maina J, McClanahan T, Kark S (2018)Evaluating the potential for transboundary managementof marine biodiversity in the Western Indian Ocean. Aus-tralas J Environ Manage 25: 62−85
Levy S (2010) Catch shares management. Bioscience 60: 780−785
MacNeil MA, Graham NAJ, Cinner JE, Wilson SK and oth-ers (2015) Recovery potential of the world’s coral reeffishes. Nature 520: 341−344
Magris RA, Treml EA, Pressey RL, Weeks R (2016) Integrat-ing multiple species connectivity and habitat quality intoconservation planning for coral reefs. Ecography 39: 649−664
Magris RA, Andrello M, Pressey RL, Mouillot D, Dalonge -ville A, Jacobi MN, Manel S (2018) Biologically repre-sentative and well-connected marine reserves enhancebiodiversity persistence in conservation planning. Con-serv Lett 11: e12439
221

Mar Ecol Prog Ser 604: 211–222, 2018222
Maina JM, Jones KR, Hicks CC, McClanahan TR, WatsonJEM, Tuda AO, Andréfouët S (2015) Designing climate-resilient marine protected area networks by combiningremotely sensed coral reef habitat with coastal multi-usemaps. Remote Sens 7: 16571−16587
Martin TSH, Connolly RM, Olds AD, Ceccarelli DM, FennerDE, Schlacher TA, Beger M (2017) Subsistence harvest-ing by a small community does not substantially compro-mise coral reef fish assemblages. ICES J Mar Sci 74: 2191−2200
Mascia MB (2003) The human dimension of coral reef mar-ine protected areas: recent social science research andits policy implications. Conserv Biol 17: 630−632
Mazor T, Possingham HP, Kark S (2013) Collaborationamong countries in marine conservation can achievesubstantial efficiencies. Divers Distrib 19: 1380−1393
McClanahan TR (2010) Effects of fisheries closures and gearrestrictions on fishing income in a Kenyan coral reef.Conserv Biol 24: 1519−1528
McClanahan TR (2018) Multicriteria estimates of coral reeffishery sustainability. Fish Fish 19: 807−820
McClanahan TR, Abunge CA (2016) Perceptions of fishingaccess restrictions and the disparity of benefits amongstakeholder communities and nations of south-easternAfrica. Fish Fish 17: 417−437
McClanahan T, Davies J, Maina J (2005) Factors influencingresource users and managers’ perceptions towards mar-ine protected area management in Kenya. Environ Con-serv 32: 42−49
McClanahan TR, Graham NAJ, MacNeil MA, Muthiga NA,Cinner JE, Bruggemann JH, Wilson SK (2011) Criticalthresholds and tangible targets for ecosystem-basedmanagement of coral reef fisheries. Proc Natl Acad SciUSA 108: 17230−17233
McClanahan TR, Graham NAJ, MacNeil MA, Cinner JE(2015) Biomass based targets and the management ofmultispecies coral reef fisheries. Conserv Biol 29: 409−417
McClanahan TR, Maina JM, Graham NAJ, Jones KR (2016)Modeling reef fish biomass, recovery potential, and man-agement priorities in the Western Indian Ocean. PLOSONE 11: e0154585
McGowan J, Bode M, Holden MH, Davis K and others(2018) Ocean zoning within a sparing versus sharingframework. Theor Ecol 11: 245−254
Metcalfe K, Vas S, Engelhard GH, Villanueva MC, Smith RJ,Mackinson S (2015) Evaluating conservation and fish-eries management strategies by linking spatial prioritiza-tion software and ecosystem and fisheries modellingtools. J Appl Ecol 52: 665−674
Mills M, Pressey RL, Ban NC, Foale S, Aswani S, Knight AT(2013) Understanding characteristics that define the fea-sibility of conservation actions in a common pool marineresource governance system. Conserv Lett 6: 418−429
Mora C, Aburto-Oropeza O, Ayala Bocos A, Ayotte PM andothers (2011) Global human footprint on the linkagebetween biodiversity and ecosystem functioning in reeffishes. PLOS Biol 9: e1000606
Morrison TH (2017) Evolving polycentric governance ofthe Great Barrier Reef. Proc Natl Acad Sci USA 114:
E3013−E3021Nagendra H, Ostrom E (2012) Polycentric governance of
multifunctional forested landscapes. Int J Commons 6: 104−133
Nairobi Convention (2015) The eighth conference of the par-ties to the Nairobi Convention for the protection, man-agement and development of the marine and coastalenvironment of the Western Indian Ocean (Nairobi Con-vention), Mahe, Seychelles. https://www.unenvironment.org/ nairobiconvention/eighth-conference-parties-nairobi-convention
O’Connor C, Marvier M, Kareiva P (2003) Biological vs.social, economic and political priority-setting in conser-vation. Ecol Lett 6: 706−711
Ostrom E (2007) A diagnostic approach for going beyondpanaceas. Proc Natl Acad Sci USA 104: 15181−15187
Pascoe S, Brooks K, Cannard T, Dichmont CM, Jebreen E,Schirmer J, Triantafillos L (2014) Social objectives of fish-eries management: What are managers’ priorities? OceanCoast Manage 98: 1−10
Pereira HM, Ferrier S, Walters M, Geller GN and others(2013) Essential biodiversity variables. Science 339: 277−278
Polasky S (2008) Why conservation planning needs socio -economic data. Proc Natl Acad Sci USA 105: 6505−6506
Salomon AK, Gaichas SK, Jensen OP, Agostini VN and oth-ers (2011) Bridging the divide between fisheries andmarine conservation science. Bull Mar Sci 87: 251−274
Sandwith T, Shine C, Hamilton L, Sheppard D (2001) Trans-boundary protected areas for peace and cooperation.IUCN, Gland
Selkoe KA, Toonen RJ (2011) Marine connectivity: a newlook at pelagic larval duration and genetic metrics of dis-persal. Mar Ecol Prog Ser 436: 291−305
Thiessen AH (1911) Precipitation averages for large areas.Mon Weather Rev 39: 1082−1089
Treml EA, Halpin PN, Urban DL, Pratson LF (2008) Model-ing population connectivity by ocean currents, a graph-theoretic approach for marine conservation. Landsc Ecol23: 19−36
UNEP-WCMC (United Nations Environment Programme-World Conservation Monitoring Centre), WorldFish Cen-tre, WRI (World Resources Institute), TNC (The NatureConservancy) (2010) Global distribution of warm-watercoral reefs, compiled from multiple sources including theMillennium Coral Reef Mapping Project. UNEP WorldConservation Monitoring Centre, Cambridge
Watson RA (2017) A database of global marine commercial,small-scale, illegal and unreported fisheries catch 1950−2014. Sci Data 4: 170039
Watts ME, Ball IR, Stewart RS, Klein CJ and others (2009)Marxan with Zones: software for optimal conservationbased land- and sea-use zoning. Environ Model Softw24: 1513−1521
Worm B, Hilborn R, Baum JK, Branch TA and others (2009)Rebuilding global fisheries. Science 325: 578−585
Zeller D, Booth S, Craig P, Pauly D (2006) Reconstructionof coral reef fisheries catches in American Samoa, 1950−2002. Coral Reefs 25: 144−152
Editorial responsibility: Simonetta Fraschetti, Salento, Italy
Submitted: December 22, 2017; Accepted: September 3, 2018Proofs received from author(s): September 24, 2018