increased international air transport
TRANSCRIPT

Global Forum on Transport and Environment in a Globalising World
10-12 November 2008, Guadalajara, Mexico
The Environmental Impacts of Increased International Air Transport
Past trends and future perspectives
Eric Pels of VU University, Amsterdam, the Netherlands
2
FOREWORD
This paper was prepared by Dr. Eric Pels of VU University, Amsterdam, the Netherlands, as a
contribution to the OECD/ITF Global Forum on Transport and Environment in a Globalising World that
will be held 10-12 November 2008 in Guadalajara, Mexico.
The paper discusses the environmental impacts of changes in international aviation activity – past
trends and future perspectives. Minor modifications have been made to the paper in the aftermath of the
Global Forum.
The views expressed are those of the author, and do not necessarily reflect the views of the OECD or
its member countries.
Copyright OECD, 2008.
Applications for permission to reproduce or translate all or part of this material should be addressed to: Head of Publications Service, OECD, 2 rue André-Pascal, 75775 Paris Cedex 16, France

3
TABLE OF CONTENTS
FOREWORD ................................................................................................................................................... 2
THE ENVIRONMENTAL IMPACTS OF INCREASED INTERNATIONAL AIR TRANSPORT – PAST
TRENDS AND FUTURE PERSPECTIVES .................................................................................................. 5
1. Introduction .......................................................................................................................................... 5 2. Effects of deregulation of aviation markets in the U.S. and E.U .......................................................... 5
2.1 Aviation and the economy ........................................................................................................... 5 2.2 Airline network development ...................................................................................................... 6
3. Technological developments ................................................................................................................ 8 4. Environmental effects of aviation ....................................................................................................... 12
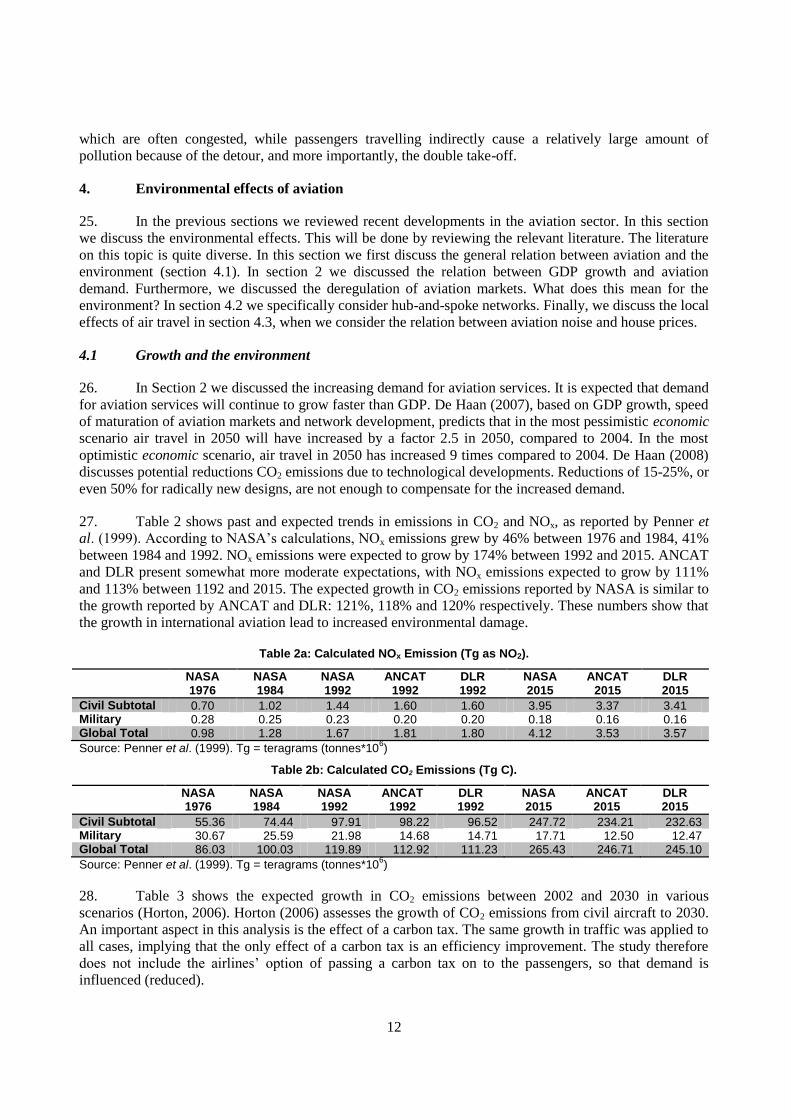
4.1 Growth and the environment ..................................................................................................... 12 4.2 Hub-and-spoke networks ........................................................................................................... 17 4.3 The effect of aviation on house prices ....................................................................................... 18
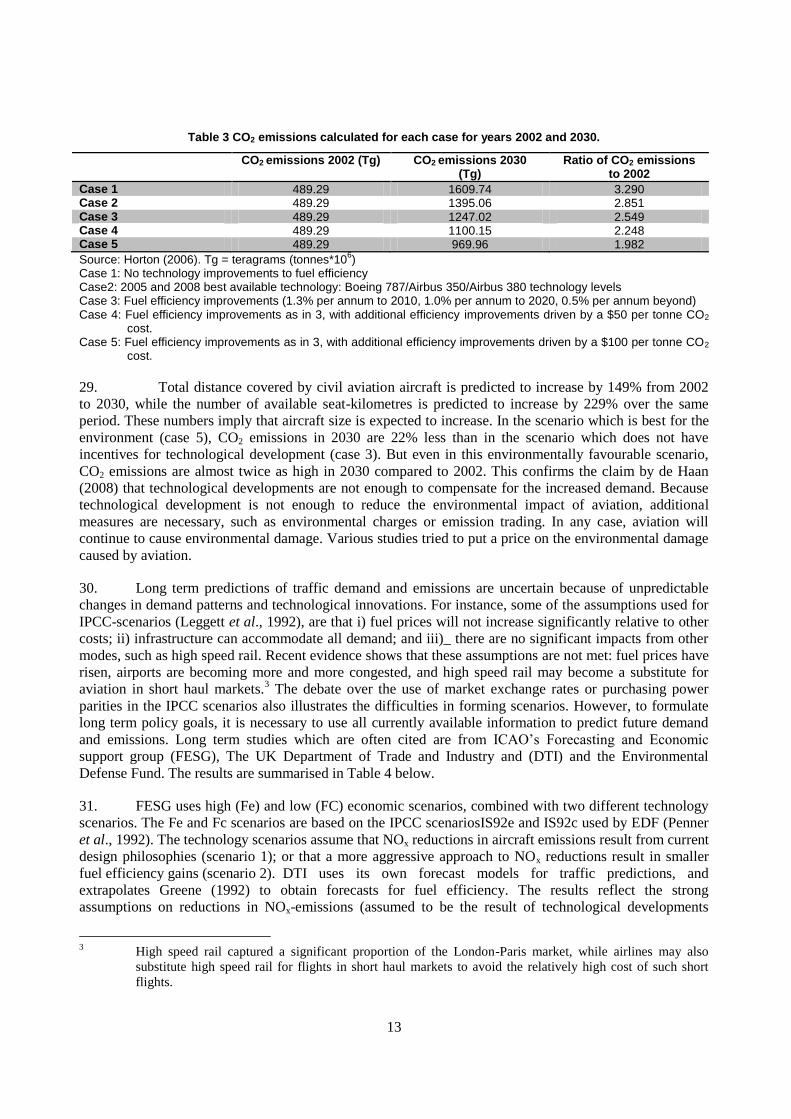
5. Conclusion .......................................................................................................................................... 19
REFERENCES .............................................................................................................................................. 21

4

5
THE ENVIRONMENTAL IMPACTS OF INCREASED INTERNATIONAL AIR TRANSPORT –
PAST TRENDS AND FUTURE PERSPECTIVES
1. Introduction
1. The environmental impact of air travel gets a lot of attention in the media as well as in the policy
debates. Air travel contributes to climate change, and causes environmental and economic damage by its
CO2, NOx, noise and other emissions. In economic terms, air travel causes external effects, which somehow
need to be accounted for in the price of air travel. A number of countries (e.g. the U.K., France and the
Netherlands) have therefore implemented a departure tax. But whether such a tax covers the environmental
cost of air travel, not included in the ticket price, is a difficult question. This leads to heated debates about,
for instance, the ticket taxes. Opponents of such taxes argue that a ticket tax is harmful for the economy,
while the effect on the CO2 emissions is questionable if passengers can easily switch to an airport in a
nearby country which does not levy such a tax.
2. In this paper we review the literature on the environmental impact of aviation, discuss trends in
emission patterns, and see how the external cost of aviation is determined in various studies. Fuel
consumption and CO2-emissions grew 2 to 4% in the period from 1990-2004, and are expected to grow
further (Schlager et al., 2007). Next to the economic growth, we discuss technological and network
developments as determinants of aviation emissions. The purpose of the paper is to determine how
developments in the aviation sector in the last few decades have impacted on the environment, and what
this means for transport and environmental policy Global aircraft emissions influence the climate in
various ways. The Intergovernmental Panel on Climatic Change (IPCC) completed a report on the effects
of aviation on the global climate, and is a much cited reference in this field (Penner et al., 1999). Lee
(2004) reports that new insights indicate that the effects may be larger than reported by IPCC in 1999. This
is a technological issue that we do not touch upon in this paper.
3. The paper is organized as follows. Section 2 summarizes developments in the aviation sector
since the Second World War. Section 3 discusses the literature on the environmental impact of aviation.
Section 4 concludes.
2. Effects of deregulation of aviation markets in the U.S. and E.U
4. This section discusses some historical developments in the aviation sector. These insights are
necessary to understand some of the environmental effects discussed in section 3, and to discuss the policy
implications.
2.1 Aviation and the economy
5. Passenger numbers have steadily increased over the last decades. Table 1 below summarizes the
growth rates of the gross domestic product and air traffic measured in revenue passenger kilometres (RPK)
(Boeing Aircraft Company, 2007). In the past 20 years, the growth rate in revenue passenger kilometres

6
exceeded GDP growth. This pattern is expected to continue in the next 20 years. In Asia, growth in RPK is
relatively high compared to Europe and the U.S. because of the more rapid economic development. Many
researchers report a strong correlation between the growth rates of the gross domestic product and air
traffic measured in revenue passenger kilometres (see e.g. Doganis, 2001), so that the high expected
economic growth translates to high expected growth in demand for aviation services.
Table 1 GDP and Revenue Passenger Kilometres growth rates
North America Europe China Southwest Asia
1987-
2006
2007-
2026
1987-
2006
2007-
2026
1987-
2006
2007-
2026
1987-
2006
2007-
2026
GDP growth rate 3.2% 2.8% 2% 2.1% 9.9% 6.6% 5.6% 5.7%
RPK growth rate 4.1% 4.0% 5.7% 4.2% 11.0% 8.0% 6.2% 6.9%
GDP-to-RPK multiplier 1.3 1.4 2.9 2.0 1.1 1.2 1.1 1.2
Source: Boeing Aircraft Company (2007).
6. IATA reports that aviation contributed an estimated US$ 3.557 billion to the global economy in
2007; which was roughly 7.5% of world GDP.1 Air transport has a direct impact on GDP through the
airlines and all suppliers. But also air transport also impacts on the economy in the regions surrounding
airports. For instance, Button and Taylor (2000) find empirical evidence that areas surrounding U.S.
airports (hubs) that have attracted international air services (to the EU), retained or internally generated
relatively more employment than those without such services. Although additional gains tend to decline as
airports continue to grow, most national governments and operators of hubs find it important to acquire or
maintain a hub-status for their most important airport, as they consider this an important asset to the
economy. Economic growth stimulates aviation demand, but as we have seen above, airline network
developments also impact on aviation demand, and thus emission patterns. We therefore discuss this
further below.
2.2 Airline network development
7. In the last two decades, the deregulation of aviation markets in the U.S. and E.U. led two
interesting developments in international aviation networks. As a result of concentration in international
aviation markets, large passenger flows fly indirectly, and therefore relatively long distances. In this
section we discuss the background of this trend, while in Section 3 we discuss the environmental impact.
8. At the Chicago convention of 1944 the future of the international aviation markets was discussed.
It was decided that capacity and frequency were to be negotiated in bilateral agreements, and that and fares
were to be regulated by the International Air Transport Association (IATA). Airlines were limited in their
ability to compete.
9. In essence, there was no market mechanism that would lead to economically efficient prices and
frequencies. As a result, costs were high and prices did not reflect demand. Customer preferences,
frequencies and routes operated had become a political issue rather than an outcome of market forces.
Already in 1960, the Economist wrote: “The basic trouble remains that the world has too many airlines,
most of them inefficient, undercapitalized and unprofitable”.
10. Also within the United States markets were closed. The Civil Aeronautics Authority, later
renamed as the Civil Aeronautics Board (CAB), determined routes and regulated fares in the U.S. to
protect the carriers from “destructive” competition and protect consumers, while allowing airlines to obtain
a reasonable return on ticket sales. During the 1960s and 1970s it became more and more clear that
government regulations were too restrictive for the airline industry. In 1978 the Airline Deregulation Act
1 www.iata.org/pressroom/facts_figures/fact_sheets/economic_social_benefits.htm.

7
was passed. All restrictions on (domestic) routes, fares and schedules were to be removed. Increased airline
operating efficiency and competition were expected to benefit both airlines and passengers.
11. Following deregulation of the U.S. aviation market, there was a large scale entry of new carriers,
followed by the rapid departure of almost all of them. Immediately after the deregulation, there were about
40 major carriers, while some 15 years later there were six or seven. It thus appears that competition did
not increase following the deregulation, albeit that fares decreased in real terms since the deregulation. The
decline in fares from 1976 to 1985 represented a savings of $11 billion U.S. to passengers in 1986 (Kahn,
1988). The disciplining effect of competition was, however, geographically unevenly distributed. Airlines
were free to operate their most efficient networks, and most airlines decided to operate the hub-and-spoke
network, which allows for the exploitation of density economies, and reduces fixed cost per link. The
number of competitors may have actually decreased on routes starting or terminating at a hub. On routes
between hubs and on long haul, connecting flights, there may, however, be fierce competition. These
developments meant that passengers in long-haul markets within the U.S., and in international
(intercontinental) markets often had to make detours; i.e. use indirect flights with relatively long flight
distances and two take-offs.
12. The hub-and-spoke systems allow for the creation of so-called fortress hubs. Zhang (1996) shows
that airlines using hub-spoke networks may not have an incentive to invade each other‟s network, because
this may lower profits in the „original‟ network. Zhang uses the network depicted in Figure 1 to make this
point, where airline 1 uses H as a hub, serves AH and BH directly, and AB indirectly, while airline 2 uses
K as a hub, serves AK and BK directly, and serves AB indirectly. This network is not realistic since the
market between hubs is missing, but similar results are obtained when this market is included.
Figure 1 Network configuration
13. When airline 1 invades markets AK and BK, the price decreases because of increased
competition. Airline 2 responds by increasing its output in the AB market; : lowers average costs on the
AK and BK links because of density economies. Airline 1 looses output in AB-market (airline 2 captures
part of the AB-market of airline 1), so that average costs on the AH and BH links increase. As a result,
flights ion the AH and BH markets get more expensive, and the number of passengers in these markets
decreases. Because output is decreased in the original network (HAB), the additional profits of the new AK
and BK markets have to be balanced against losses in the original network. When density economies are
strong (effects mentioned above are strong) and willingness-to-pay is high, attacking the network of airline
2 decreases profits for airline 1. Therefore, entry in competitor‟s network may lead to lower overall profits.
Instead, more often than not, airlines choose to enter alliance agreements rather than to enter a competitive
game. This means that in the 1980s and 1990s there was a geographical concentration of airline networks
around limited number of hub airports. Goetz and Sutton (1997) found that from 514 locations with one or
more regular connections in 1978, 167 locations lost these connections in the period until 1995. Only 26
new locations got regular connections, and connections to 77 locations were subsidized by the government.

8
Again, this implies that many passengers on long-haul or international flights necessarily fly on indirect
flights, resulting in relatively long flights.
14. The deregulation of the E.U. aviation market was far more gradual compared to the U.S. case.
But the outcomes are similar. Many European airlines were state companies with radial networks. The
potential for transfer existed, but airlines did not fully exploit the possibilities offered by transfer traffic
(Dennis, 1998). A shift from the radial network to the hub-spoke network by a better timing of flights to
allow for more convenient transfers allows for the exploitation of density effects. Airlines with hub-spoke
networks did not invade each other‟s networks, and also in the E.U. there was concentration: some airlines
went bankrupt (Swissair, Sabena), while other airlines entered alliance agreements (the Air France-KLM
merger being the most far reaching). In the most profitable international markets (between Europe and the
U.S.), concentration becomes apparent through the formation of various alliances. Airlines enter such
agreements to exploit density effects and reduce competition. For international passengers, alliances can be
beneficial. Before alliances were created, European airlines had restricted access to U.S. destinations.
Following an alliance agreement with a U.S. partner, European airlines could offer far more destinations to
its passengers within the U.S. Again, such international passengers more often than not fly indirectly. For
instance, about 65% of KLM‟s passengers are international passengers transferring at KLM‟s hub
(Amsterdam airport, Schiphol).2 Thus, alliance agreements led to growth in international markets,
measured in passengers and in passenger-kilometres due to longer distances.
15. A recent development is the agreement between the U.S. and the E.U. to form the Open Aviation
Area, which grants airlines from the U.S. access to E.U. markets, and vice versa. While it remains to be
seen whether there will be large scale entry by new competitors, it is evident that competition will increase
in certain markets where demand is very high (e.g. London-New York). American airlines are already
spending large sums of money to obtain landing slots at London Heathrow, where capacity is very scarce.
Other, less congested airports may be available, but such airports do not offer the status or extensive
number of connections and airlines offered by Heathrow. Furthermore, yields on flights from Heathrow are
on average higher than from alternative airports, because of the status of the airport, and the connections
with the City of London.
16. To summarize, the deregulation of aviation markets led to the adoption of hub-spoke networks by
full service carriers. Such networks, and the formation of alliances that followed this development, caused
concentration in aviation markets. This concentration implies that networks of major airlines are centred on
the major airports, which face a large amount of traffic. Many international passengers fly indirectly via
these hubs, so that travel times and distances are relatively long. In the Section 4, we discuss the
environmental effects.
3. Technological developments
17. Two major innovations in air transport were the introduction of jet engines, which considerably
shortened travel times, and the introduction of wide-bodied aircraft, which gave airlines the opportunity to
reduce the cost per seat. Both developments reduced the generalised cost of travel, so that they had a
positive impact on demand.
18. Jet engines allowed for much faster travel, although fuel consumption increased. When we only
consider the jet engines, the energy efficiency improved in recent decades (piston engines were more fuel
efficient compared to the early jet engines). IATA reports that fuel burn and CO2 emissions were reduced
by 70% per passenger-kilometre compared to 1970s (www.iata.org). The sector‟s goal for a 10%
improvement in fuel efficiency (and relative CO2 emissions) between 2000 and 2010 will most likely be
2 Source: www.klm.com.

9
met, while IATA forecasts a 25% reduction in fuel consumption per RTK between 2005 and 2020. Figure
2 shows that air transport may be as fuel efficient per kilometre as road traffic, as suggested by IATA. Two
remarks are in order, though. Firstly, aircraft emit CO2 and NOx at cruising altitude, which is close to the
tropopause (the transition between the troposphere and stratosphere). Depending on the cruising altitude,
emitted NOx can contribute to the production of the greenhouse gas ozone (troposphere) or the destruction
of ozone levels, which leads to increased UV radiation exposure (stratosphere) (Royal Commission on
Environmental Pollution, 2007).. IPCC reported that ozone increased at cruising altitudes for sub-sonic
aircraft, while predicted changes in UV-radiation are minimal (Royal Commission on Environmental
Pollution, 2007).
Figure 2 CO2 intensity of passenger transport
Source: Penner et al. (1999).
19. Secondly, air travel in most cases covers far longer distances than road travel. Although one can
argue that because of these longer distances, the environmental impact of aviation is bigger, we need to
look at total passenger-kilometres. IATA reports that all modes of transport together account for 23% of
global CO2 emissions (www.iata.org). Road traffic accounts for the vast majority, 74%, of the transport
sector‟s CO2 emissions because of the sheer magnitude of road use worldwide. Air transport accounts for
12% transport sector‟s CO2 emissions; or about 3 to 4% of global carbon emissions (Penner et al., 1999).
Even though the availability of international air travel at low prices (i.e. low-cost travel and indirect
flights) can cause an increase in CO2 emissions, the ever-increasing demand for short-haul car trips (e.g.
for commuting) apparently causes an even higher increase in CO2 emissions. Finally, as we have seen
above, the concentration in the aviation markets caused an increase in flight distance and the need for two
landing and take-off cycles, which have different fuel burn rates (Pejovic et al., 2008), for many
passengers. Fuel burn during the take-off and landing cycle is much higher than during climb, cruise and
descent cycle, so that network configurations with indirect travel have a relatively large environmental
impact. Globalization can lead to an increase in demand for international air travel, which causes
environmental damage. Globalization and the changes in international regulations also allow for the
formation of alliances, so that the concentration in the aviation sector as discussed above continues, and
can lead to further damage because of the need for indirect travel.
20. The environmental effects of growth in aviation may be mitigated by technological
developments, such as more efficient engines. In the literature, an increase in fuel efficiency of 70%

10
between 1960 and 2000 is often mentioned. Peeters et al. (2005) argue that the often cited 70%
improvement in fuel efficiency as reported by the IPCC (Penner et al., 1999) is somewhat optimistic
because it uses a De Havilland Comet 4 as the reference aircraft, while this aircraft was only used for a
brief period and gained little market share. If the successful Boeing 707 is used as the reference rather than
the De Havilland Comet 4, fuel efficiency improved by 55% rather than 70% over the same period.
Although the analysis of Peeters et al. (2005) confirms that jet aircraft fuel efficiency increased over time,
the authors also conclude that the research target for 2020 as mentioned by ATAG (2005), and based on an
annual reduction of fuel consumption per ASK on 3%, is probably too optimistic. Peeters et al. (2001)
point out that technological developments in the last decades were mostly made for small and medium
sized aircraft. Under the simple assumption that these aircraft are used in short to medium haul markets, it
then appears that in long-haul (international) markets there were relatively few gains. But newer aircraft
(the latest B777 and A380) now allow for gains to be made in international markets.
Figure 3 Fuel use per available tonne-kilometre
Source: adapted from Peeters et al., (2005).
21. When we consider the fuel burn per available tonne-kilometre of a number of popular aircraft
(Figure 3), then it appears that smaller aircraft (in terms of passengers carried) have higher energy use,
although the number of observations is too small to find a reliable statistical relation.
22. The adoption of hub-and-spoke networks meant that an increasing number of passengers was
concentrated on a relatively small number of links. Because larger aircraft are cheaper to operate per seat
(see Figure 4), airlines could reduce their cost. Moreover, if there are economies of scale in environmental
terms (see e.g. Schipper, 2004), meaning that an aircraft with 300 seats emits less noise or CO2 per seat
than two aircraft with 150 seats, as is suggested by Figure 3, larger aircraft also provide environmental
benefits.

11
Figure 4 Operating cost per seat
Source: adapted from Connekt, (2001).
23. Interestingly, the average plane size in the transatlantic markets peaked at about 320 seats in
1985, after which it rapidly decreased to about 260 seats in 1995. After 1995, there was a steady increase,
with an expected size of about 300 in 2010 (Penner et al., 1999). Brueckner and Zhang (1999) indicated
that the frequency of service in hub-and-spoke networks may be increased to attract additional traffic in the
face of competition. When a number of competitors offer a high frequency, this may create over capacity
in the market. Airlines can encounter this by using smaller aircraft. At a later stage, following the bilateral
agreements between the U.S. and various European countries, airlines used alliance agreements to
encounter over-capacity and to exploit density economies.
24. To summarize, we described two major innovations. The introduction of jet engines meant faster
travel, but also a decrease in fuel efficiency. The fuel efficiency of jet aircraft increased over the last
decades, although one can wonder whether the 70% improvement compared to the De Havilland Comet 4
(IPCC, IATA) provides useful information. If more successful early jet aircraft are used as the base for the
comparison, the efficiency improvement is less. The introduction of wide bodied aircraft meant that the
cost per seat decreased due to density economies, and that the environmental cost per seat could be reduced
due to economies of scale in environmental terms. The formation of hub-and-spoke networks concentrates
large passenger flows on a limited number of links, allowing for the use of relatively large aircraft. Hub-
and-spoke networks thus offer potential reductions in environmental damage per seat because of the
possibility to use larger aircraft. On the other hand, hub-and-spoke networks are centred on large airports,
12
which are often congested, while passengers travelling indirectly cause a relatively large amount of
pollution because of the detour, and more importantly, the double take-off.
4. Environmental effects of aviation
25. In the previous sections we reviewed recent developments in the aviation sector. In this section
we discuss the environmental effects. This will be done by reviewing the relevant literature. The literature
on this topic is quite diverse. In this section we first discuss the general relation between aviation and the
environment (section 4.1). In section 2 we discussed the relation between GDP growth and aviation
demand. Furthermore, we discussed the deregulation of aviation markets. What does this mean for the
environment? In section 4.2 we specifically consider hub-and-spoke networks. Finally, we discuss the local
effects of air travel in section 4.3, when we consider the relation between aviation noise and house prices.
4.1 Growth and the environment
26. In Section 2 we discussed the increasing demand for aviation services. It is expected that demand
for aviation services will continue to grow faster than GDP. De Haan (2007), based on GDP growth, speed
of maturation of aviation markets and network development, predicts that in the most pessimistic economic
scenario air travel in 2050 will have increased by a factor 2.5 in 2050, compared to 2004. In the most
optimistic economic scenario, air travel in 2050 has increased 9 times compared to 2004. De Haan (2008)
discusses potential reductions CO2 emissions due to technological developments. Reductions of 15-25%, or
even 50% for radically new designs, are not enough to compensate for the increased demand.
27. Table 2 shows past and expected trends in emissions in CO2 and NOx, as reported by Penner et
al. (1999). According to NASA‟s calculations, NOx emissions grew by 46% between 1976 and 1984, 41%
between 1984 and 1992. NOx emissions were expected to grow by 174% between 1992 and 2015. ANCAT
and DLR present somewhat more moderate expectations, with NOx emissions expected to grow by 111%
and 113% between 1192 and 2015. The expected growth in CO2 emissions reported by NASA is similar to
the growth reported by ANCAT and DLR: 121%, 118% and 120% respectively. These numbers show that
the growth in international aviation lead to increased environmental damage.
Table 2a: Calculated NOx Emission (Tg as NO2).
NASA 1976
NASA 1984
NASA 1992
ANCAT 1992
DLR 1992
NASA 2015
ANCAT 2015
DLR 2015
Civil Subtotal 0.70 1.02 1.44 1.60 1.60 3.95 3.37 3.41 Military 0.28 0.25 0.23 0.20 0.20 0.18 0.16 0.16 Global Total 0.98 1.28 1.67 1.81 1.80 4.12 3.53 3.57
Source: Penner et al. (1999). Tg = teragrams (tonnes*106)
Table 2b: Calculated CO2 Emissions (Tg C).
NASA 1976
NASA 1984
NASA 1992
ANCAT 1992
DLR 1992
NASA 2015
ANCAT 2015
DLR 2015
Civil Subtotal 55.36 74.44 97.91 98.22 96.52 247.72 234.21 232.63 Military 30.67 25.59 21.98 14.68 14.71 17.71 12.50 12.47 Global Total 86.03 100.03 119.89 112.92 111.23 265.43 246.71 245.10
Source: Penner et al. (1999). Tg = teragrams (tonnes*106)
28. Table 3 shows the expected growth in CO2 emissions between 2002 and 2030 in various
scenarios (Horton, 2006). Horton (2006) assesses the growth of CO2 emissions from civil aircraft to 2030.
An important aspect in this analysis is the effect of a carbon tax. The same growth in traffic was applied to
all cases, implying that the only effect of a carbon tax is an efficiency improvement. The study therefore
does not include the airlines‟ option of passing a carbon tax on to the passengers, so that demand is
influenced (reduced).
13
Table 3 CO2 emissions calculated for each case for years 2002 and 2030.
CO2 emissions 2002 (Tg) CO2 emissions 2030 (Tg)
Ratio of CO2 emissions to 2002
Case 1 489.29 1609.74 3.290 Case 2 489.29 1395.06 2.851 Case 3 489.29 1247.02 2.549 Case 4 489.29 1100.15 2.248 Case 5 489.29 969.96 1.982
Source: Horton (2006). Tg = teragrams (tonnes*106)
Case 1: No technology improvements to fuel efficiency Case2: 2005 and 2008 best available technology: Boeing 787/Airbus 350/Airbus 380 technology levels Case 3: Fuel efficiency improvements (1.3% per annum to 2010, 1.0% per annum to 2020, 0.5% per annum beyond) Case 4: Fuel efficiency improvements as in 3, with additional efficiency improvements driven by a $50 per tonne CO2
cost. Case 5: Fuel efficiency improvements as in 3, with additional efficiency improvements driven by a $100 per tonne CO2
cost.
29. Total distance covered by civil aviation aircraft is predicted to increase by 149% from 2002
to 2030, while the number of available seat-kilometres is predicted to increase by 229% over the same
period. These numbers imply that aircraft size is expected to increase. In the scenario which is best for the
environment (case 5), CO2 emissions in 2030 are 22% less than in the scenario which does not have
incentives for technological development (case 3). But even in this environmentally favourable scenario,
CO2 emissions are almost twice as high in 2030 compared to 2002. This confirms the claim by de Haan
(2008) that technological developments are not enough to compensate for the increased demand. Because
technological development is not enough to reduce the environmental impact of aviation, additional
measures are necessary, such as environmental charges or emission trading. In any case, aviation will
continue to cause environmental damage. Various studies tried to put a price on the environmental damage
caused by aviation.
30. Long term predictions of traffic demand and emissions are uncertain because of unpredictable
changes in demand patterns and technological innovations. For instance, some of the assumptions used for
IPCC-scenarios (Leggett et al., 1992), are that i) fuel prices will not increase significantly relative to other
costs; ii) infrastructure can accommodate all demand; and iii)_ there are no significant impacts from other
modes, such as high speed rail. Recent evidence shows that these assumptions are not met: fuel prices have
risen, airports are becoming more and more congested, and high speed rail may become a substitute for
aviation in short haul markets.3 The debate over the use of market exchange rates or purchasing power
parities in the IPCC scenarios also illustrates the difficulties in forming scenarios. However, to formulate
long term policy goals, it is necessary to use all currently available information to predict future demand
and emissions. Long term studies which are often cited are from ICAO‟s Forecasting and Economic
support group (FESG), The UK Department of Trade and Industry and (DTI) and the Environmental
Defense Fund. The results are summarised in Table 4 below.
31. FESG uses high (Fe) and low (FC) economic scenarios, combined with two different technology
scenarios. The Fe and Fc scenarios are based on the IPCC scenariosIS92e and IS92c used by EDF (Penner
et al., 1992). The technology scenarios assume that NOx reductions in aircraft emissions result from current
design philosophies (scenario 1); or that a more aggressive approach to NOx reductions result in smaller
fuel efficiency gains (scenario 2). DTI uses its own forecast models for traffic predictions, and
extrapolates Greene (1992) to obtain forecasts for fuel efficiency. The results reflect the strong
assumptions on reductions in NOx-emissions (assumed to be the result of technological developments
3 High speed rail captured a significant proportion of the London-Paris market, while airlines may also
substitute high speed rail for flights in short haul markets to avoid the relatively high cost of such short
flights.

14
induced by regulations). EDF specifically accounts for demand growth in developing countries, and uses
IPCC scenarios for developments in economic indicators and emissions. Base level and high demand
scenarios are used. Fuel efficiency is extrapolated from Greene (1992), while NOx-emissions are
extrapolated from NASA numbers. Penner et al. (1999) report that the emission index for NOx indicates
that emissions reflect an ultra-low technology regime. Roughly speaking, DTI and EDF seem to have
comparable expectations on trends in NOx emissions. The differences in emission levels are then mainly
caused by fuel use levels.
Table 4 Long term emissions from aviation, Tg, excluding military
FESG FC1 2050
FESG FE2 2050
DTI 2050 EDF IS92c 1990
EDF IS92c 2050
EDF IS92e 1990
EDF IS92e 2050
Fuel use (Tg) 253.8 757.7 633.2 179 837 179 2297 CO2 218.2 651.6 154 720 154 1975 NOx 3.9 8.7 4.45 1.96 5.77 1.96 15.84
Source: Penner et al. (1999).
32. Table 5 shows the average external costs of transport in the EU 17 countries as reported by
INFRAS (Schreyer et al., 2004). Scheyer et al. (2004) provide an extensive report about external costs
(total, average and marginal) of transport: road (passenger and freight), rail (passenger and freight), air
(passenger and freight) and waterborne (freight) transport. In this report almost all cost categories are
discussed: accidents, noise, air pollution, climate change, costs for nature and landscape, additional costs in
urban areas, up- and downstream processes and congestion costs. For the accident costs a value of a
statistical (1.5 million euro) life approach is used, using ICAO database to determine fatalities per
passenger-kilometre. For noise costs, a willingness to pay procedure (for disturbed persons only) is used,
using a database from OECD (OECD, 1993). These costs also include the valuation of health risks and
medical costs. Marginal costs of air transport are based on the available road and railway noise models. For
road and rail advanced models exist to accurately predict noise emissions. For aviation such models do not
exists, so that Scheyer et al. (2004) use insights from road and rail models to determine the marginal cost
of aviation.
33. The costs of air pollution are determined using a top-down approach, based on willingness to pay
surveys. In this approach, existing estimates are used, and transferred to other countries (correcting for
various indicators). Climate change costs are determined as follows. Greenhouse gases emissions at global
scale are included. Costs of CO2 emissions are calculated by multiplying the amount emitted by a cost
factor. This cost factor is the shadow price in currency per tonne CO2. They use, based on literature review,
140 euro per tonne as upper value, and 20 euro per tonne as a lower value. Costs for nature and landscape
use an expert valuation approach. The state of nature in 1950 is seen as sustainable by experts; any damage
since then needs to be compensated. To determine the compensation for aviation, Schreyer et al. (2004)
look at airport surface. The surface of the airport (aviation infrastructure) is the main cost component in
this category.

15
Table 5 Average external costs of transport in the EU17 countries in 2000
[Euro / 1000 pkm for passengers and Euro / 1000 tkm for freight].
Road Passengers
Rail Passengers
Aviation Passengers
Road Freight
Rail Freight
Aviation Freight
Accidents 32.4 0.8 0.4 7.6 0.0 0.0 Noise 5.1 3.9 1.8 7.4 3.2 8.9 Air Pollution 13.2 6.9 2.4 42.8 8.3 15.6 Climate change high 16.5 6.2 46.2 16.9 3.2 235.7 (Climate change low) (2.4) (0.9) (6.6) (2.4) (0.5) (33.7) Nature & Landscape 2.6 0.6 0.8 2.9 0.3 3.8 Up- and down stream 5.0 3.4 1.0 8.8 2.4 7.4 Urban Effects 1.5 1.3 0.0 1.5 0.5 0.0
Source: INFRAS/IWW (Scheyer et al., 2004).
34. The average external cost per passenger-kilometre using the high climatic impact scenario is
about 5 €-cent. With the low climatic impact scenario, the average external cost per passenger-kilometre is
less than 2€-cent.
35. Dings et al. (2003) quantify “the external costs of air transport, and in particular the costs of
climate change, air pollution and noise”, and “to provide insight into the principal factors determining
these external costs”. No policy recommendations are provided. Also risks are not accounted for as an
external effect. Apart from environmental costs which are not (directly) paid for by airports, airlines ort
passengers, aviation also may cause accident costs, for instance due to fatalities. These costs are not
included by Dings et al. (2003). The report estimates shadow prices based on damage and abatement costs
(direct costs approach, WTA approach, WTP approach and prevention costs approach). It defines the costs
at the level of airplane type (number of passengers and flight distance). It uses existing databases to come
up with these numbers. Table 6 report the average external costs (per passenger-kilometre) for different
aircraft types, distances and climatic impacts. These numbers are of the same order of magnitude as the
numbers reported by INFRAS.
Table 6 Average external costs.
Shadow price for climatic impact of per tonne CO2-equivalent
€ 10 € 30 € 50 Fleet–average technology, in € cent per passenger-kilometre 50 seats, 200 km 5.7 6.4 7.0 100 seats, 500 km 1.8 3.0 4.2 200 seats, 1500 km 0.7 1.5 2.2 400 seats, 6000 km 0.3 0.7 1.1 State–of–the–art technology, in € cent per passenger-kilometre 50 seats, 200 km 2.8 3.3 3.9 100 seats, 500 km 1.2 2.2 3.3 200 seats, 1500 km 0.5 1.1 1.8 400 seats, 6000 km 0.2 0.5 0.9
Source: Based on Dings et al. (2003)
36. The empirical studies mentioned above determine the environmental cost of aviation. More
theoretical (simulation) studies are also available in the literature. The deregulation of aviation markets led
to lower real fares (see e.g. Kahn, 1988). Lower fares cause an increase in demand, so that deregulation
may lead to increased environmental damage. In this case, the welfare gains of deregulation have to be
balanced against the welfare (environmental) damage of increased demand. Schipper et al. (2007) conduct
an equilibrium analysis in a spatial competition model. In the equilibrium analysis the environmental
external costs are dependent only on total flight frequency in the total market. Given a constant marginal
16
environmental flight cost, aggregate environmental costs can be determined in the analysis.4 Using
empirically calibrated parameters, Schipper et al. (2007) shown in a simulation exercise that the
liberalization of the European airline markets resulted in:
Frequency increases (welfare +)
Fare decreases (welfare +)
Lower profits (welfare -)
Increase environmental costs (welfare -)
37. Consumer welfare gains exceed (environmental) welfare losses. Because welfare increased, but
at the expense of airline profits and the environment, (part of) the increase in welfare can be used to
compensate airlines and the population for their losses. Compensation regulation in a liberated market can
therefore become a useful policy instrument, particularly around airports in densely populated areas. For
instance, noise surcharges can be used to compensate home owners for noise damage. The simulation
exercise uses empirical inputs from Schipper (2004). Schipper (2004) estimates the environmental costs in
European airline markets in 1990. The following costs are included:
Noise (hedonic pricing and contingent valuation methods are used to determine noise
annoyance). In hedonic pricing methods, the price of, for instance, a dwelling is related to all
kinds of neighbourhood characteristics, including aviation noise. Using contingent valuation
methods, people are asked what they are willing to pay to experience less aviation noise. Both
methods are used to put a price on aviation noise.
Emissions (Marginal Damage Functions for global warming and Value of Statistical Life [VOSL]
for local emissions (mortality)). Several methods can be used to determine the cost of local air
pollution, e.g. damage to human health, damage to buildings, reduced visibility, damage to
forests, crops and fisheries etc. Schipper (2004) values air pollution emissions using the health
damage pathway, which is identified as a dominant cost effect of air pollution. Using available
information on how emissions may lead to increased fatalities and a statistical value of life, the
cost of emissions is determined.
Accident risks (again VOSL)
38. It appears that environmental costs are only a small fraction of total internal costs as measured by
the ticket price (2.5%). Because prices have decreased since 1990, this may be an underestimate. Noise is
the dominant external effect (75% of the total external cost). This is probably due to the fact that noise
damage is experienced directly by the surrounding population, while the cost of emissions, calculated
using the marginal damage functions for global warming and value of statistical life, is only experienced
indirectly. This shows the difficulty of combining effects. The value of statistical life should include all
costs that are made to avoid a fatality. But difficulties in estimating this value can make the comparison
difficult. There are environmental economies of scale at the route level; environmental costs are decreasing
in aircraft size, and size is related to distances: large aircraft may be used on short distances, but it is not
always possible to use smaller aircraft on longer distances.
39. Scheelhaase and Grimme (2007) analyze the predicted growth of international air transportation
in relation to internationally coordinated instruments for the reduction of greenhouse gas emissions. Global
(Kyoto) and European emission trading schemes are mentioned. For European airlines, the European
system is more likely to be realized (the E.U. initiated the European emission trading scheme). Scheelhaase
and Grimme (2007) calculate the economic impacts for low cost carriers (Ryanair), full service
4 One may expect the external cost per flight to increase with the number of flights; e.g. a large number of
flights with small aircraft may result in higher environmental costs than a relatively small number of flights
with large aircraft. This makes the effects discussed below only stronger.

17
(Lufthansa), holiday (Condor) and regional airlines (Air Dolomiti) using the EU – ETS emissions trading
scheme. Different scenarios are analyzed, in which aviation allowances to emit 1 tonne of CO2 are needed
by airlines. Scenarios are favourable for airlines (€15 per allowance, allowances only needed for intra-E.U.
flights), or less favourable (€30 per allowance, allowances needed for all flights departing from or arriving
at E.U. airports). Following an initial allocation based on grandfathering rights, airlines need to purchase
allowances, and pass the cost on to the passengers. It is concluded that the introduction of such a scheme
generates competitive effects: the financial impact for low cost carriers and regional carriers (without hub-
spoke networks) is larger than network carriers, because airlines with hub-spoke networks have better
opportunities to pass the cost on to the passengers; the cost per passenger of an allowance is a relatively
small proportion of the ticket price on a long haul flight, so that given the price elasticity of demand, which
is relatively low in absolute value on long haul flights, airlines with large networks suffer „less‟. The
impact on intercontinental traffic can therefore be expected to be relatively low. The financial impacts for
airlines will be marginal: costs will increase approximately with 1 till 3 percent.
4.2 Hub-and-spoke networks
40. In section 2.2 hub-and-spoke networks were discussed. The concentration in aviation markets
means that airline networks are centred on major hubs, which handle a relatively large share of all flights.
Hub-and-spoke networks can lead to environmental benefits because of economies of scale in
environmental terms (section 2.3). Passengers are concentrated on a few routes, so that larger aircraft may
be used. But transfer passengers fly longer distances, and take-off twice, so that they have a relatively large
environmental impact. International (intercontinental) passengers can fly relatively cheap using indirect
tickets, so that this may stimulate demand, while these passengers often have a short haul flight, with
relatively high environmental costs, included in their long haul route. Moreover, the environmental
damage of aviation at the ground level is concentrated on a few airports and the surrounding areas. In
section 4.3 we look at the impact of aviation (noise) on house prices. In this section we consider the
environmental effects of hubbing.
41. Peeters et al. (2001) find that point-to-point networks have the lowest environmental impact,
even though larger aircraft may be used in hub-spoke networks. Furthermore, hubs have larger
environmental impacts than non-hub airports, and the number of hubs (in Europe) and the geographical
distribution have a strong influence on the environmental impact of the total network. It should be pointed
out that hubs are important for international traffic. Passengers from different origins in Europe are
collected at hubs, and then transported to their final international or intercontinental destination (and vice
versa). Collecting passenger from different origins on a single intercontinental flight may be beneficial for
the environment compared to different intercontinental flights, but the short-haul flights are relatively
damaging (see Figure 2). Interestingly, Peeters et al. (2001) find no environmental economies of scale
(contrary to Schipper, 2004). They point out that technological developments in the last decades were
mostly made for small and medium sized aircraft. Combining passenger flows from different origins may
lead to financial benefits for airlines (Figure 4), but if the fuel efficiency of such aircraft per passenger
kilometre did not really improve compared to smaller or medium sized aircraft, there may be little gain for
the environment. Peeters et al. (2001) mention that the results may change when technological progress is
made with large aircraft. Recently, new large aircraft emerged (such as the Airbus A380), which will
probably offer environmental economies of scale. But such aircraft can only be used between very large
airports (intercontinental hubs), so that demand will be relatively low compared to smaller aircraft.
Interestingly, Boeing chose not to develop such a large aircraft, focusing instead on a smaller aircraft, to be
used in point-to-point flights, rather than in a hub-and-spoke structure.
42. Morell and Lu (2007) examine noise disturbance and engine emissions in two network structures:
hub-spoke networks and hub-by-pass structures (i.e. networks in which passengers do not transfer at a
hub). The noise social cost model is based on HP methods; total aggregate noise disturbance is allocated to

18
individual flights based on real impact of noise nuisance (aircraft type etc). The (input for the) engine
emissions social cost model is based on literature review. Given the analyzed networks - using the airports
London Heathrow, Glasgow, Frankfurt, Hamburg, Chicago O‟Hara, San Diego, Dallas and Tokyo- it is
concluded that the hub-by-pass routes generate considerable savings in both noise and engine emissions
costs. This confirms the result of Peeters et al. (2001) that hub-and-spoke networks have a relatively high
environmental impact, compared to point-to-point networks. This means that also in long haul,
international markets, it may be better for the environment if direct flights are used, rather than the indirect
flights used by many passengers. Indirect flights may be cheap, because airlines use them to exploit density
economies, but are relatively speaking harmful for the environment.
43. Nero and Black (1998) find that hubbing increases external costs (congestion, aircraft noise and
emissions). The paper analyses the effects of introducing environmental costs on airport charges to
hubbing airlines by formulating a model based on Schmalensee‟s model, but adapted to allow for
monopolistic firms. After formulating that model, they perform a simulation exercise to show the optimal
level of environmental taxes from a welfare perspective. From this exercise, the authors conclude that the
hub-spoke network could be abandoned in favour of a fully connected network if the environmental tax is
relatively high. No real empirical evidence is present, but the „polluter pays principle‟ suggests that taxes
for indirect flights or for international passengers transferring at hubs should be relatively high, given the
observations made above. The results of Nero and Black (1998) then suggest that airlines will no longer
use such a network. Interestingly, the ticket tax implemented by a few European is only for origin-
destination passengers. Transfer passengers pay nothing, to safeguard the competitive position of the hub
airport as a transfer airport in international or intercontinental markets. But this is „bad‟ for the
environment. Carlsson (2002) extends the analysis by Nero and Black (1998) by relaxing symmetry
restrictions. An optimal charge is defined for two types of networks (fully connected and hub-and-spoke)
and for both a monopolistic and a duopolistic market situation. In this model, the environmental effects are
solely dependent on number of flights offered in the equilibrium outcome of each market. Again, no
empirical estimations are present.
4.3 The effect of aviation on house prices
44. It was already mentioned above that hub-spoke networks lead to relatively large noise (and other)
emissions around the hub airport. Various authors tried to determine the impact of airports on the
surrounding region by looking at property prices. Such studies do usually not consider CO2 and other
emissions, but only focus on the relation between property prices and noise.
45. Schipper et al. (1998) consider noise nuisance around airports. A comparison of hedonic pricing
(HP) and contingent valuation methods (CVM) to determine the cost of aviation noise shows that CVM
noise cost estimates are significantly higher than HP noise cost estimates. An explanation might be that HP
methods report only „use values‟, while VCM methods also uncover other value categories. Moreover, HP
methods do not use information on consumers not willing to consider properties because of noise nuisance.
Nineteen HP studies (related to property values), resulting in 30 noise depreciation indices (NDI), are
analyzed using meta-analytical techniques. The NDI gives the percentage change in property value due to a
decibel change in noise exposure. Wealth and other neighbourhood characteristics, such as accessibility,
have a positive impact on the NDI.
46. Morell and Lu (2000) provide an empirical case-study about the implicit social costs of aircraft
noise (via decline in property values) in the Amsterdam Schiphol area. Using a social cost of noise
function, based on hedonic pricing methods and the property values, and the belonging parameters for the
Amsterdam area (number of houses in noise contours etc.), the average social noise cost in 1999 is
calculated as €326.8 per landing. From this knowledge the marginal social cost function is obtained. The

19
authors claim that the figures are in line with previous related studies. It is concluded that the current noise
charges (€157.3 per landing) are too low to compensate the social noise costs.
47. Morrison et al. (1999) provide an economic assessment of the benefits (higher property values
for homeowners) and costs (airplane‟s reduced economical life) of the 1990 ANCA (Airport Noise and
Capacity Act). Under noise regulation the fleet of an airline operator has to be renewed faster than without
regulation. According to the authors, this accelerated (non-optimal) deprecation of the fleet is the source of
the costs of regulation. Benefits of the regulation are taken as the increase in housing values (based on
WTP). At the end, they come up with these figures: 5 billion (1995 dollars) benefits and 10 billion (1995
dollars) costs: therefore they are wondering if airplane noise regulation is justified from an efficiency
perspective.
5. Conclusion
48. In this paper we discussed the environmental impact of aviation. Aviation demand grew rapidly
in the past decades, and it is expected that this growth will continue (Boeing, 2007; de Haan, 2008; Horton,
2006). Expected technological innovations cannot prevent an increase in CO2 emissions from aviation due
to the increase in demand (de Haan, 2007). Depending on the technology and scenario used, the average
external cost of air travel is about 1-5 €-cent per passenger-kilometre.
49. The deregulation of the aviation markets had profound effects on network developments. Major
airlines use hub-and-spoke networks, which means that selected airports receive a relatively large share of
all take-offs and landings in the network. As a result, noise pollution in the surrounding area is relatively
high, and passengers travelling indirectly have to make a detour. But hub-and-spoke networks might also
have environmental benefits because of environmental economies of scale: larger aircraft, with lower
emissions per seat, can be used because passenger flows are concentrated on a few links. The literature
shows that negative environmental effects of hub-and-spoke networks exceed the positive effects.
Concentration is therefore bad for the environment. It is expected that the trend of concentration will
continue. For instance, when Ryanair celebrated the fact that it had flown 1 million passengers to
Bratislava (early November 2007), its CEO, Michael O‟Leary claimed that within 5 years there will be 4
major airlines left in Europe: British Airways, Air France, Lufthansa and Ryanair. If British Airways, Air
France and Lufthansa and their alliance partners will focus their networks on a few intercontinental hubs,
traffic levels will increase at these hubs due to the general expected increase in demand, but also because
more people need to make transfers.
50. The increasing consolidation of aviation markets, together with the continuing growth, means
that the environmental damage caused by aviation will continue to grow. As mentioned above,
technological development cannot prevent this. Therefore, new alternative policy measures are necessary.
A number of countries in Europe introduced ticket taxes. If such a ticket tax would approximate the
marginal external cost, this would be a sensible strategy. In this case one tries to influence the individual
passenger‟s travel behaviour. As long as passenger do not face the full cost of travel (i.e. including external
cost), demand will be too high. A ticket tax might fix this. It appears, however, that in some countries the
ticket tax is used to raise general funds, so that it is not necessarily true that the tax is equal to (or
approximates) the marginal external cost. If the tax is too low or too high, improper incentives are given.
For instance, if transfer passengers do not pay the tax, the ticket price is relatively low, and demand
relatively high. As a result, the environmental damage can also be relatively high. Moreover, other
countries have not introduced such a tax, and in most cases passengers travelling indirectly (and thus
causing relatively high external cost) are exempt from the tax. The E.U. will introduce emissions trading.
Scheelhaase and Grimme (2007) find that such a scheme will have only marginal effects on airline cost.

20
51. Air travel connects regions to the world economy, and gives individual travellers the opportunity
to explore the world. But as long as the full external cost is not covered by the ticket price, environmental
damage caused by aviation will continue to grow.

21
REFERENCES
Boeing Aircraft Company (2007), Current market outlook. Seattle: Boeing Aircraft Company.
Brueckner J. K. and Y. Zhang (2001), “A Model of Scheduling in Airline Networks: How a Hub-and-
Spoke System Affects Flight Frequency, Fares and Welfare”, Journal of Transport Economics and
Policy, 35, pp. 195-222.
Button, K. and Taylor, S., (2000), “International air transportation and economic development”. Journal of
Air Transport Management, 6, 209–222
Carlsson, Frederik (1999) “Incentive-based environmental regulation of domestic civil aviation in Sweden”
Transport Policy 6: 75-82.
Carlsson, Frederik (2002) “Environmental charges in airline markets”, Transportation Research Part D:
137-153.
Connekt (2001), Ontwikkeling van het hub-concept, Delft: Connekt.
Dennis, N.P.S., 1998. Competition between hub airports in Europe and a methodology for forecasting
connecting traffic. Paper presented at the World Conference for Transportation Research, Antwerp.
Dings, J.M.W., R.C.N. Wit, B.A. Leurs, M.D. Davidson, W. Fransen (2003), External costs of aviation,
Environmental research of the Federal Ministry of the Environment, Nature Conservation and
Nuclear Safety, Research Report 299 96 106, UBA-FB 000411.
Goetz, A. and Sutton, C., 1997. “The geography of deregulation in the US airline industry”. Annals of the
Association of American Geographers 87 2, pp. 238–263.
Greene, D.L. 1992, Energy efficiency improvement potential of commercial aircraft, in: Annual Review of
Energy and the Environment, eds. Hollander, J., J. Harte and R.H. Soccolow, Annual Reviews Inc.,
Palo Alto, CA, USA, pp. 537-574.
de Haan, A.R.C. (2008), “Limited possibilities to reduce CO2 emissions from aviation due to the growth in
aviation demand”, Aerlines, 40, 1-3.
de Haan, A.R.C. (2007), Aircraft technology’s contribution to sustainable development, Faculty of
Technology, Policy and Management, Delft University of Technology.
Horton, G. (2006), Forecasts of CO2 emissions from civil aircraft for IPCC, London: QinetiQ.
Kahn, A.E., (1988), “Surprises of airline deregulation”, American Economic Review. Papers and
Proceedings 78 2, pp. 316–322.
Lee, D.S. (2004), The impacts of aviation on climate, Issues in Environmental Science and Technology, 20,
1-23.

22
Morell, Peter and Cherie H. Y. Lu (2000) “Aircraft noise social cost and charge mechanisms – a case study
of Amsterdam Airport Schiphol” Transportation Research, Part D 5: 305-320.
Morell, Peter and Cherie H. Y. Lu (2007) “The environmental cost implication of hub-hub versus hub by-
pass flight networks” Transportation Research, Part D 12: 143-157.
Morrison, Steven A., Clifford Winston and Tara Watson (1999) “Fundamental flaws of social regulation:
the case of airplane noise”, Journal of Law and Economics, XLII: 723-743.
Nero, Giovanni and John A. Black (1998) “Hub-and-spoke networks and the inclusion of environmental
costs on airport pricing”, Transportation Research, Part D 3: 275-296.
OECD (1993), Environmental data compendium 1993, OECD, Paris.
Penner, J.E., D.H. Lister, D.J. Griggs, D.J. Dokker, and M. MacFarland (1999), Aviation and the global
atmosphere; a special report of IPCC working groups I and III, Cambridge University Press,
Cambridge. (www.grida.no/climate/ipcc/aviation/index.htm)
Peeters, P.M., J. Middel and A. Hoolhorst, “Fuel efficiency of commercial aircraft, an overview of
historical and future trends”, Peeters Advies and National Aerospace Laboratory.
Peeters, P.M., P. Rietveld and Y. Schipper (2001), Environmental impacts of hub-and-spoke networks in
Europe, Peeters Advies, Ede.
Royal Commission on Environmental Pollution (2007), The environmental effects of civil aircraft in flight.
Scheelhaase, Janina D. and Wolfgang G. Grimme (2007) “Emissions trading for international aviation – an
estimation of the economic impact on selected European airlines”, Journal of Air Transport
Management 13: 253-263.
Schreyer, C., Schneider, C., Maibach, M. Rothengatter, W., Doll, C. and Schmedding, D. (2004), External
Costs of Transport: Update Study. IWW, Universitaet Karlsruhe / INFRAS, Karlsruhe/Zurich
Schipper, Youdi (2004) “Environmental costs in European aviation”, Transport Policy 11: 141-154.
Schipper, Youdi, Peter Nijkamp and Piet Rietveld (1998) “Why do aircraft noise value estimates value
differ? A meta-analysis”, Journal of Air Transport Management 4: 117-124
Schipper, Youdi, Piet Rietveld and Peter Nijkamp (2007) “Frequency competition and environmental
costs: An application to European air transport liberalization”, Socio-Economic Planning Sciences
41: 208-223.
Zhang, A., 1996. “An analysis of fortress hubs in airline networks”. Journal of Transport Economics and
Policy 30, 3, 293–307.