increasing energy performance across the organization · 7 day energy over usage ... increasing...
TRANSCRIPT
October 22, 2003
Increasing Energy Performance Across
The Organization
About the Web ConferencesAbout the Web ConferencesAbout the Web Conferences
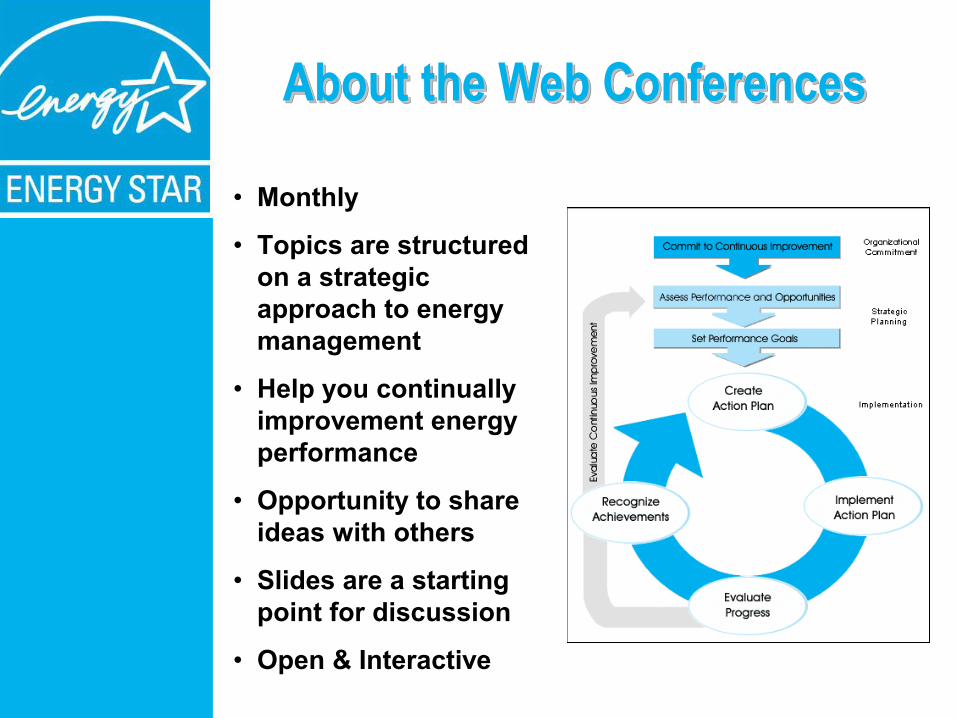
• Monthly
• Topics are structured on a strategic approach to energy management
• Help you continually improvement energy performance
• Opportunity to share ideas with others
• Slides are a starting point for discussion
• Open & Interactive
Web Conference TipsWeb Conference Tips
• Mute phone when listening! Improves sound quality for everyone.
• If slides are not advancing, hit refresh or close presentation window and press the re-launch button again.

Today’s Web ConferenceToday’s Web ConferenceToday’s Web Conference
• Welcome• Kathy Loftus – Shaw’s Supermarkets • Thomas Bean – Verizon• Questions & Discussion• Announcements
Managing Multiple FacilitiesManaging Multiple Facilities
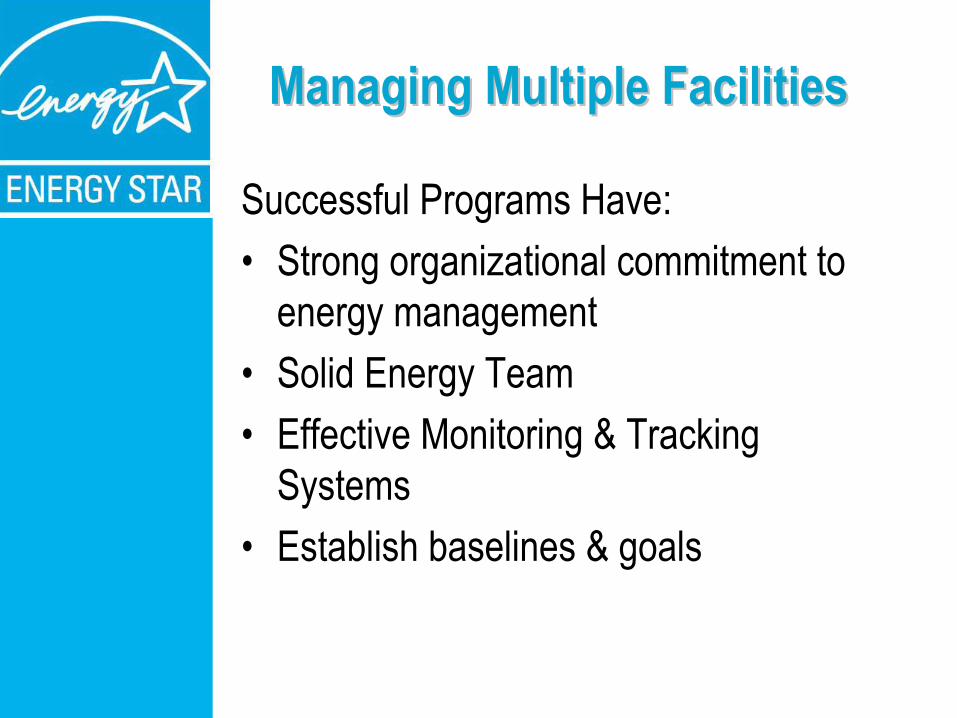
Successful Programs Have:• Strong organizational commitment to
energy management • Solid Energy Team• Effective Monitoring & Tracking
Systems • Establish baselines & goals
Energy and Environmental Management at Shaw’s
Supermarkets, Inc.
Kathy Loftus,Director of Energy and Environmental ManagementShaw’s Supermarkets, Inc.
Energy Star Networking Web ConferenceOctober 22, 2003
Shaw’s Environmental Policy
Shaw's Supermarkets is dedicated to reducing our environmental impact through strategic leadership and management in all areas of our business. As part of this commitment, we work closely with our suppliers, encouraging them to implement similar practices in their businessesWe are an EPA Energy Star Partner and Green Power Partner, as well as a Clean Air-Cool Planet partner.We are working with the USGBC’s Retail Committee for the LEED Program.

Shaw’s Supermarkets, Inc.
Shaw’s operates 191 stores and several distribution centers and offices in all New England States.Shaw’s employees over 29,000 associates.Shaw’s Energy Management structure is centralized, and Maintenance is mostly centralized with regional management (use in house technicians and outside contractors). however each store receives training, audits and has a local associate monitoring for energy efficiency.

How much do we spend?
Our current utilities bill is over $40M annually. (The industry spends $4B.)
How is it spent?
85-90% Electricity
10-15% Gas
45-50% Refrigeration20-25% Lighting
15-20% HVAC
Factors impacting energy performance
Age of equipment in storeGeographical locationSales volumesMaintenance programsUtility incentives for super efficient systems, etc.
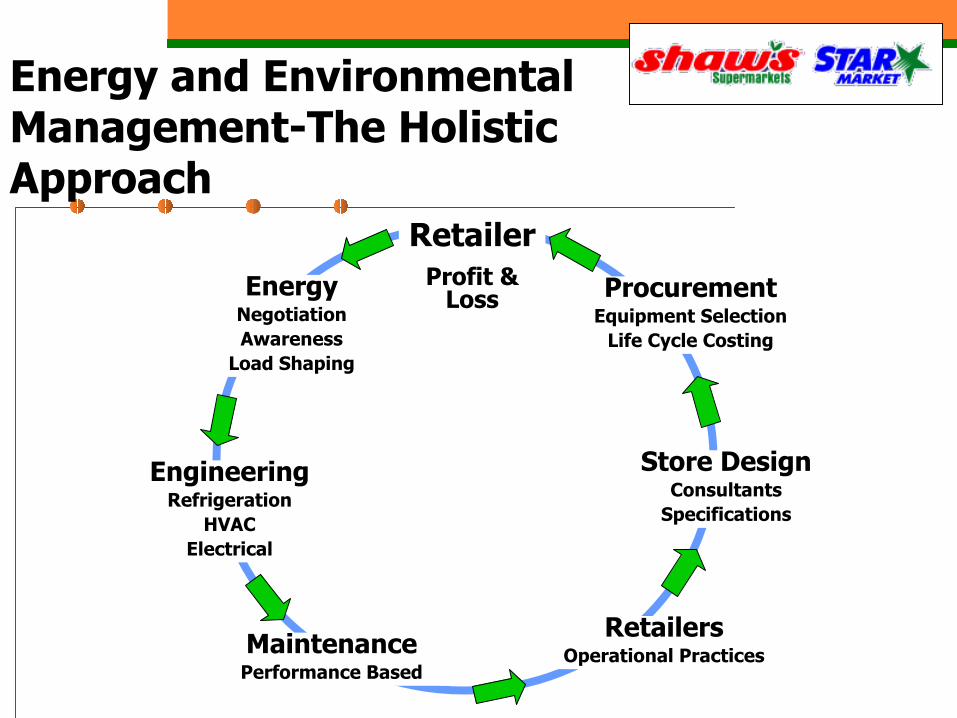
Energy and Environmental Management-The Holistic Approach
RetailerProfit &
LossEnergyNegotiationAwareness
Load Shaping
EngineeringRefrigeration
HVACElectrical
MaintenancePerformance Based
RetailersOperational Practices
Store DesignConsultants
Specifications
ProcurementEquipment Selection
Life Cycle Costing
Energy, Engineering, Maintenance, Construction, Purchasing, Buying and Marketing, Corporate Communications, Food Safety, Distribution and Operations
Consultants and Partners
Utility Account Managers
EPA Energy Star Program affiliates
Energy Service Providers
Creating a Team
Energy Management Systems
Energy Sub-metering and monitoring
Exception Reporting
PM and O&M; Commissioning and Re-commissioning
Benchmarking
Portfolio Manager
Energy Management Training
slide show, video, on-site, awards program, etc.
Strategies for Energy Conservation, load-management and savings sustainment
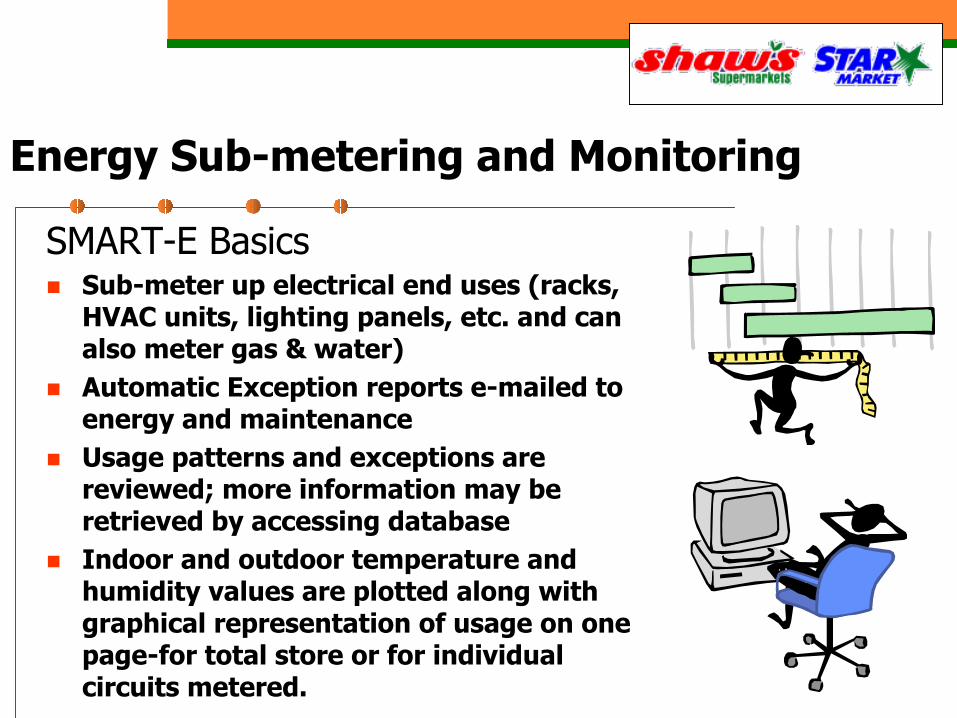
Energy Sub-metering and Monitoring
SMART-E BasicsSub-meter up electrical end uses (racks, HVAC units, lighting panels, etc. and can also meter gas & water)Automatic Exception reports e-mailed to energy and maintenanceUsage patterns and exceptions are reviewed; more information may be retrieved by accessing databaseIndoor and outdoor temperature and humidity values are plotted along with graphical representation of usage on one page-for total store or for individual circuits metered.
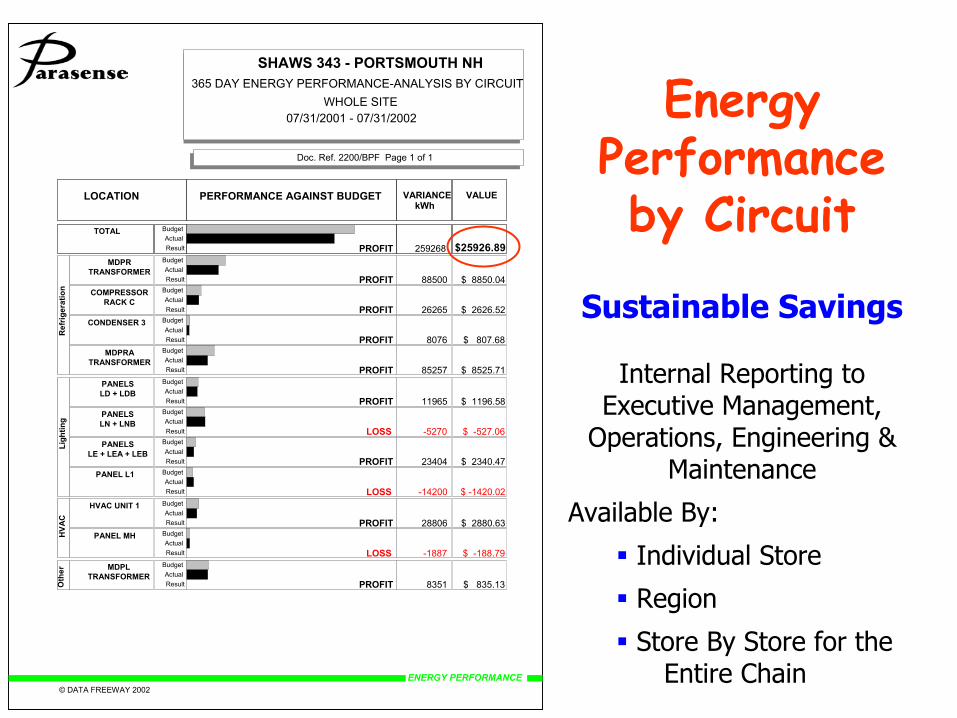
SHAWS 343 - PORTSMOUTH NH365 DAY ENERGY PERFORMANCE-ANALYSIS BY CIRCUIT
WHOLE SITE07/31/2001 - 07/31/2002
Doc. Ref. 2200/BPF Page 1 of 1
© DATA FREEWAY 2002 ENERGY PERFORMANCE
LOCATION PERFORMANCE AGAINST BUDGET VARIANCEkWh
VALUE
TOTAL BudgetActualResult PROFIT 259268 $25926.89
MDPRTRANSFORMER
BudgetActualResult PROFIT 88500 $ 8850.04
COMPRESSORRACK C
BudgetActualResult PROFIT 26265 $ 2626.52
CONDENSER 3 BudgetActualResult PROFIT 8076 $ 807.68
MDPRATRANSFORMER
BudgetActualResult PROFIT 85257 $ 8525.71
Ref
riger
atio
n
PANELSLD + LDB
BudgetActualResult PROFIT 11965 $ 1196.58
PANELSLN + LNB
BudgetActualResult LOSS -5270 $ -527.06
PANELSLE + LEA + LEB
BudgetActualResult PROFIT 23404 $ 2340.47
PANEL L1 BudgetActualResult LOSS -14200 $ -1420.02
Ligh
ting
HVAC UNIT 1 BudgetActualResult PROFIT 28806 $ 2880.63
PANEL MH BudgetActualResult LOSS -1887 $ -188.79
HVA
C
MDPLTRANSFORMER
BudgetActualResult PROFIT 8351 $ 835.13O
ther
Energy Performance by Circuit
Sustainable Savings
Internal Reporting toExecutive Management,
Operations, Engineering & Maintenance
Available By:
Individual Store
Region
Store By Store for the Entire Chain
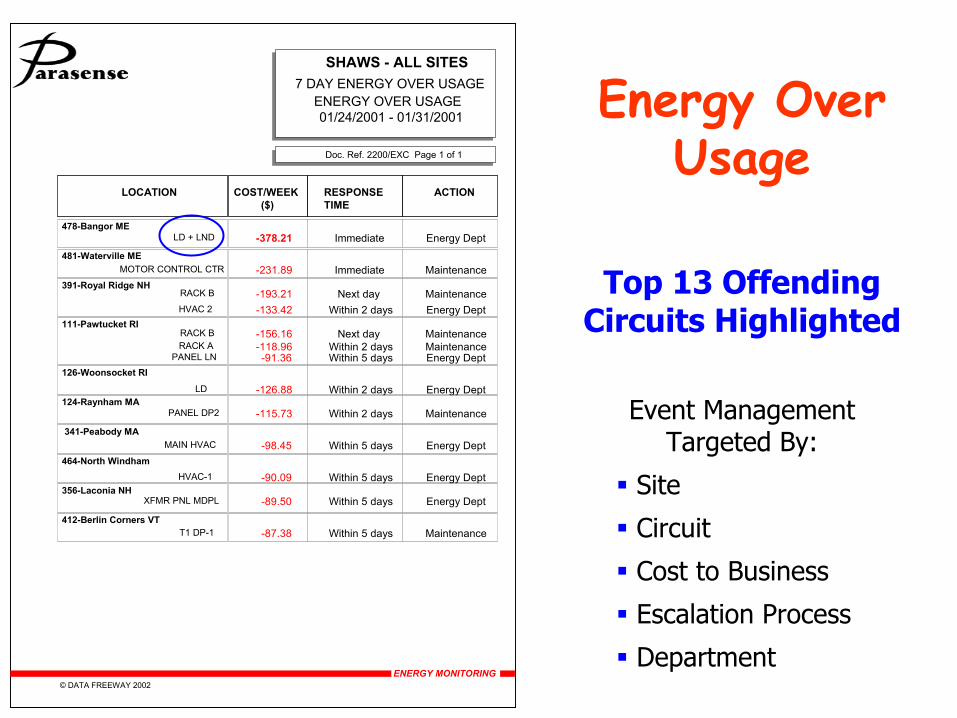
Energy Over Usage
Top 13 Offending Circuits Highlighted
Event Management Targeted By:
Site
Circuit
Cost to Business
Escalation Process
Department
SHAWS - ALL SITES7 DAY ENERGY OVER USAGE
ENERGY OVER USAGE01/24/2001 - 01/31/2001
Doc. Ref. 2200/EXC Page 1 of 1
© DATA FREEWAY 2002 ENERGY MONITORING
LOCATION COST/WEEK($)
RESPONSETIME
ACTION
478-Bangor MELD + LND -378.21 Immediate Energy Dept
481-Waterville MEMOTOR CONTROL CTR -231.89 Immediate Maintenance
391-Royal Ridge NHRACK B -193.21 Next day MaintenanceHVAC 2 -133.42 Within 2 days Energy Dept
111-Pawtucket RIRACK B -156.16 Next day MaintenanceRACK A -118.96 Within 2 days Maintenance
PANEL LN -91.36 Within 5 days Energy Dept126-Woonsocket RI
LD -126.88 Within 2 days Energy Dept124-Raynham MA
PANEL DP2 -115.73 Within 2 days Maintenance341-Peabody MA
MAIN HVAC -98.45 Within 5 days Energy Dept464-North Windham
HVAC-1 -90.09 Within 5 days Energy Dept356-Laconia NH
XFMR PNL MDPL -89.50 Within 5 days Energy Dept
412-Berlin Corners VTT1 DP-1 -87.38 Within 5 days Maintenance
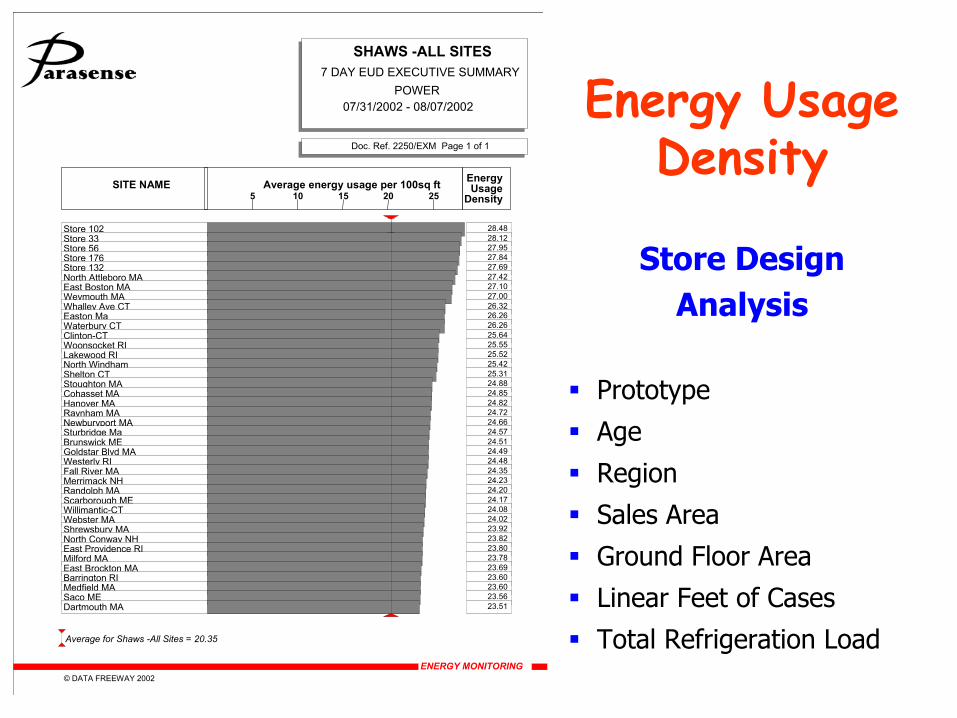
Energy Usage Density
Store DesignAnalysis
Prototype
Age
Region
Sales Area
Ground Floor Area
Linear Feet of Cases
Total Refrigeration Load
SHAWS -ALL SITES7 DAY EUD EXECUTIVE SUMMARY
POWER07/31/2002 - 08/07/2002
Doc. Ref. 2250/EXM Page 1 of 1
© DATA FREEWAY 2002 ENERGY MONITORING
SITE NAME Average energy usage per 100sq ft5 10 15 20 25
EnergyUsage
Density
Store 102 28.48Store 33 28.12Store 56 27.95Store 176 27.84Store 132 27.69North Attleboro MA 27.42East Boston MA 27.10Weymouth MA 27.00Whalley Ave CT 26.32Easton Ma 26.26Waterbury CT 26.26Clinton-CT 25.64Woonsocket RI 25.55Lakewood RI 25.52North Windham 25.42Shelton CT 25.31Stoughton MA 24.88Cohasset MA 24.85Hanover MA 24.82Raynham MA 24.72Newburyport MA 24.66Sturbridge Ma 24.57Brunswick ME 24.51Goldstar Blvd MA 24.49Westerly RI 24.48Fall River MA 24.35Merrimack NH 24.23Randolph MA 24.20Scarborough ME 24.17Willimantic-CT 24.08Webster MA 24.02Shrewsbury MA 23.92North Conway NH 23.82East Providence RI 23.80Milford MA 23.78East Brockton MA 23.69Barrington RI 23.60Medfield MA 23.60Saco ME 23.56Dartmouth MA 23.51
Average for Shaws -All Sites = 20.35
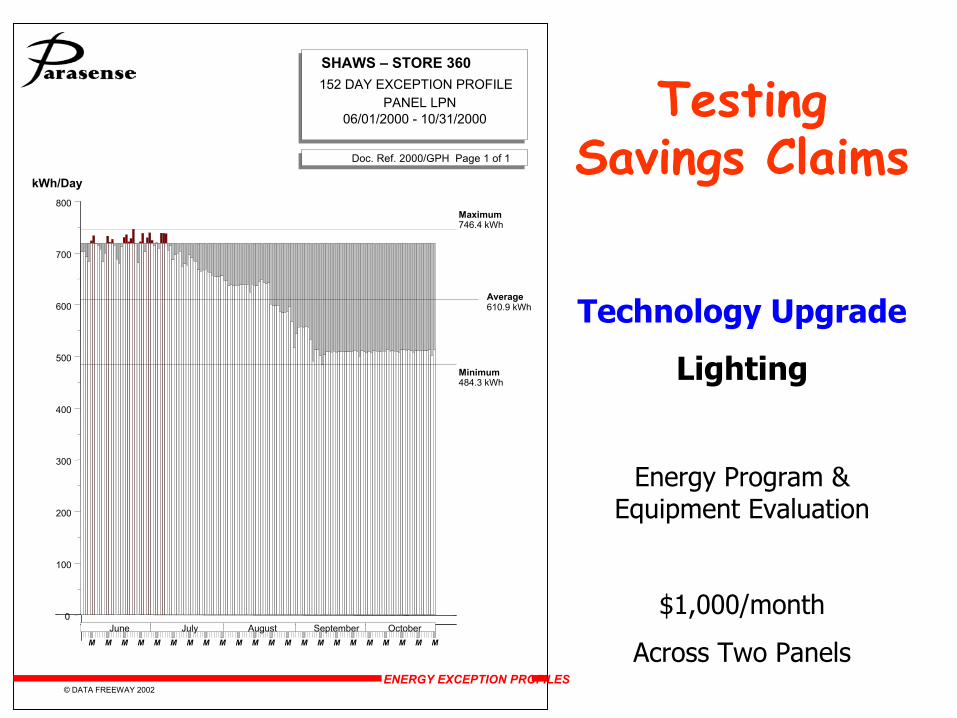
SHAWS – STORE 360152 DAY EXCEPTION PROFILE
PANEL LPN06/01/2000 - 10/31/2000
Doc. Ref. 2000/GPH Page 1 of 1
© DATA FREEWAY 2002 ENERGY EXCEPTION PROFILES
M M M M M M M M M M M M M M M M M M M M M M
June July August September October
kWh/Day
0
100
200
300
400
500
600
700
800Maximum746.4 kWh
Minimum484.3 kWh
Average610.9 kWh
Testing Savings Claims
Technology Upgrade
Lighting
Energy Program & Equipment Evaluation
$1,000/month
Across Two Panels
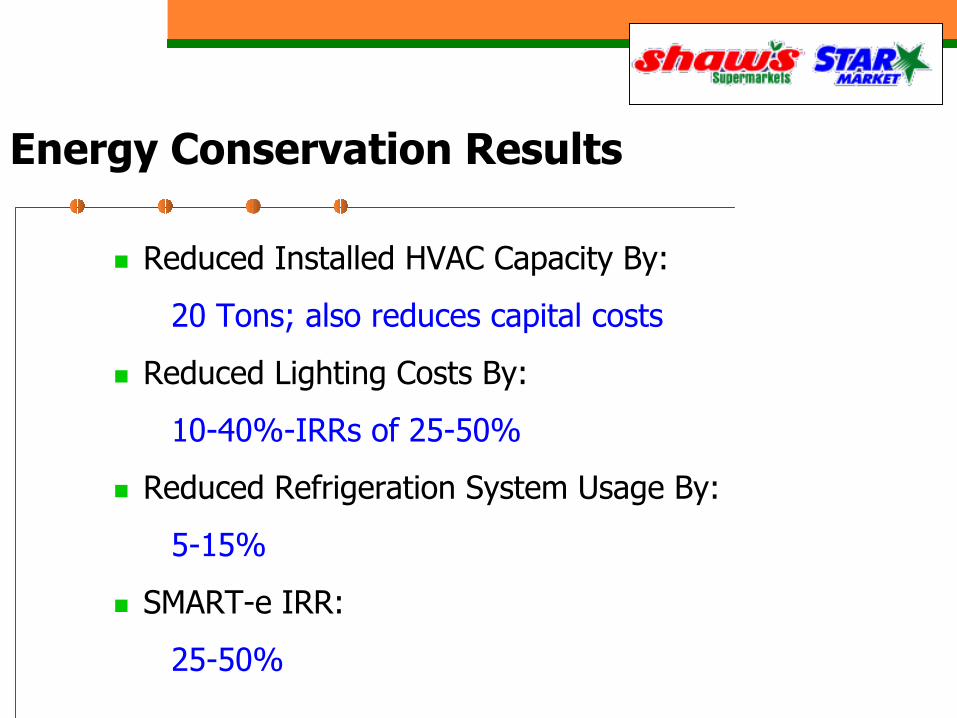
Energy Conservation Results
Reduced Installed HVAC Capacity By:
20 Tons; also reduces capital costs
Reduced Lighting Costs By:
10-40%-IRRs of 25-50%
Reduced Refrigeration System Usage By:
5-15%
SMART-e IRR:
25-50%
Energy Efficiency
Shaw’s has Energy Star Labels for 8 of its stores -at least 1 in every New England State and based on scores of those 8, we estimate at least 125 of the remaining stores are eligible for labels.
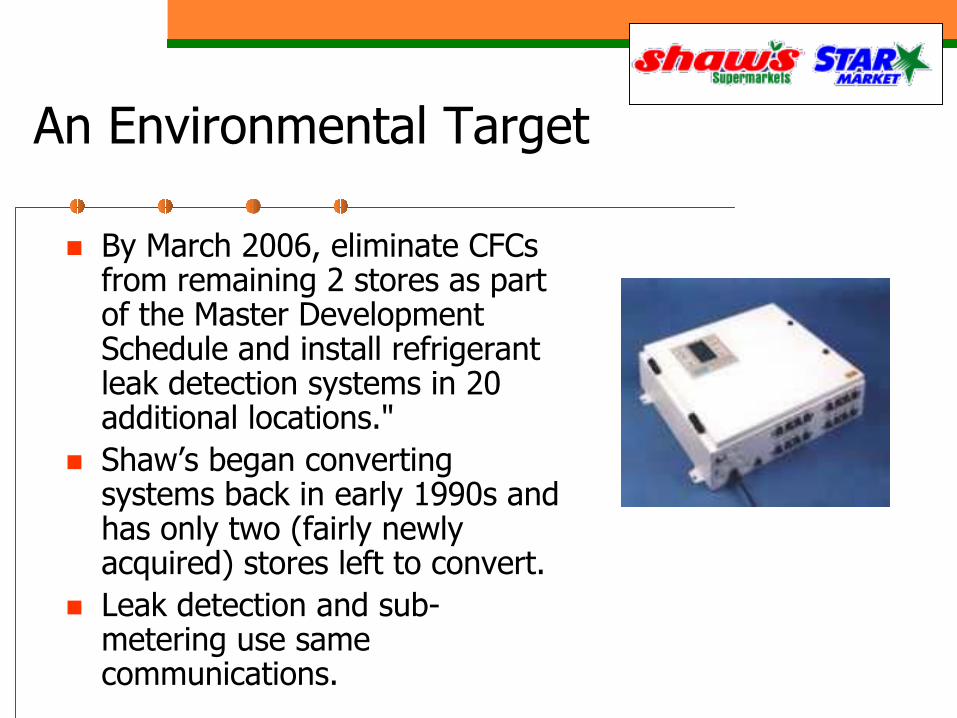
An Environmental Target
By March 2006, eliminate CFCs from remaining 2 stores as part of the Master Development Schedule and install refrigerant leak detection systems in 20 additional locations."Shaw’s began converting systems back in early 1990s and has only two (fairly newly acquired) stores left to convert.Leak detection and sub-metering use same communications.
An Environmental Target…
Reduce CO2/ft2 by
an additional 5% through 2005 from a baseline of 1996.
Renewable Energy Purchase
Shaw’s has a target that 5% of its energy requirements will be supplied from renewable resources by 2005, and 10% by 2010, providing feasible sources are available.

Rhode Island Green Power Challenge

Renewable Energy-Strategic Leadership Area
•We are working with the Mass Renewable Trust on several projects that will include solar power on the roof of at least one store and investigation into other alternative energy systems. A portion of these three stores’ energy requirements will be met through renewable resources.
•We are reviewing wind and solar energy REC purchases as well as evaluating assisting with developing farm methane power generation.
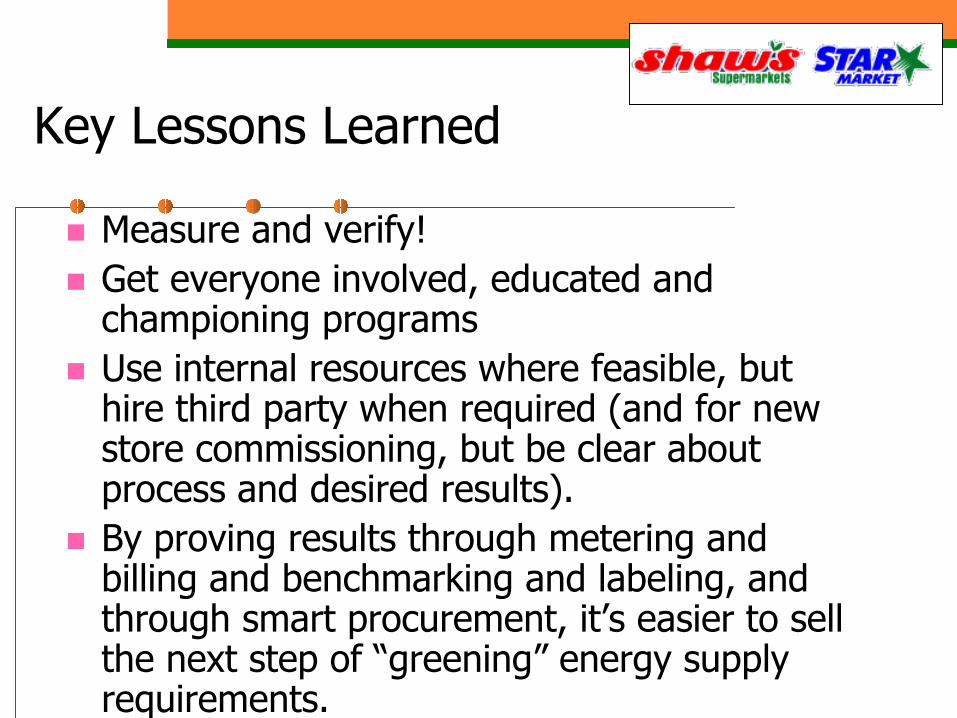
Key Lessons Learned
Measure and verify!Get everyone involved, educated and championing programsUse internal resources where feasible, but hire third party when required (and for new store commissioning, but be clear about process and desired results).By proving results through metering and billing and benchmarking and labeling, and through smart procurement, it’s easier to sell the next step of “greening” energy supply requirements.
1
Increasing Energy Performance
Across Verizon
ENERGY STAR Web Conference
Tom BeanManager- Team Energy
2
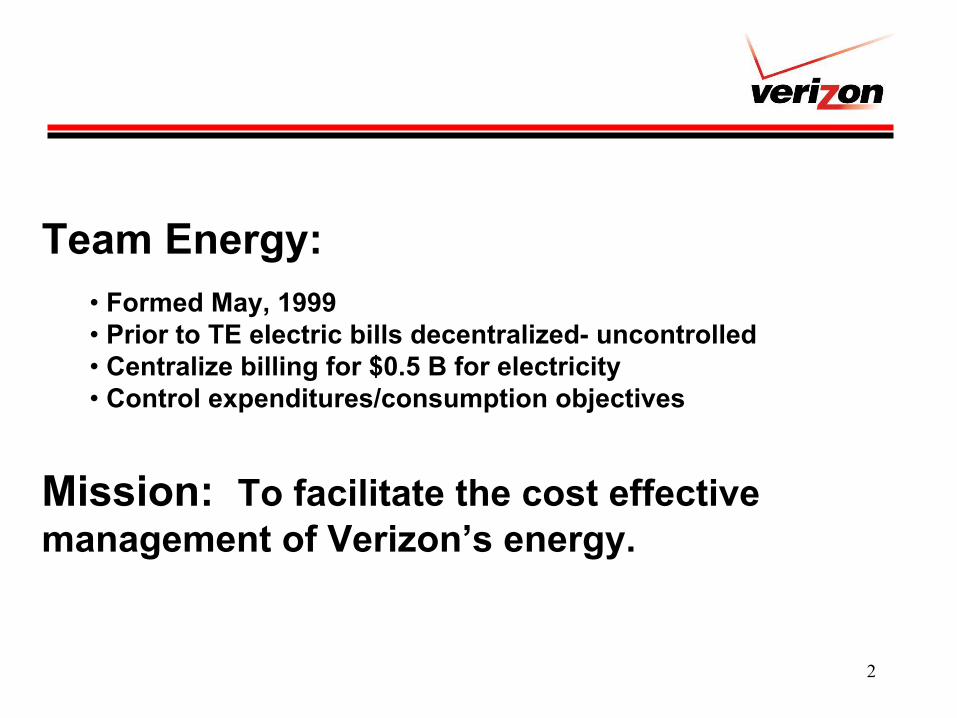
Team Energy:• Formed May, 1999• Prior to TE electric bills decentralized- uncontrolled• Centralize billing for $0.5 B for electricity• Control expenditures/consumption objectives
Mission: To facilitate the cost effective management of Verizon’s energy.
3
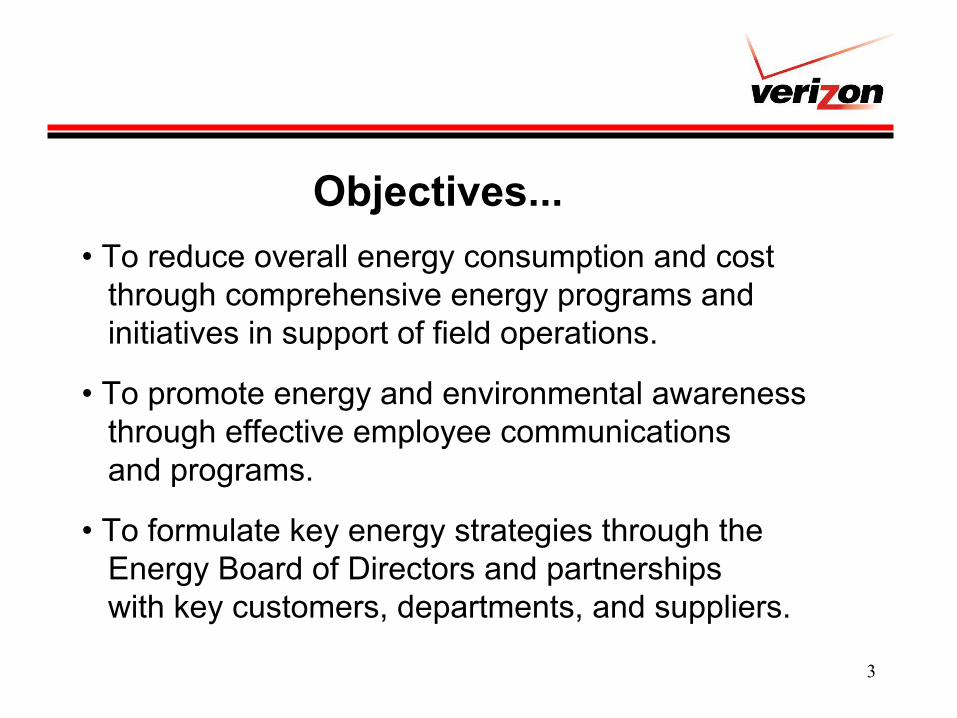
Objectives...• To reduce overall energy consumption and cost
through comprehensive energy programs andinitiatives in support of field operations.
• To promote energy and environmental awarenessthrough effective employee communicationsand programs.
• To formulate key energy strategies through theEnergy Board of Directors and partnershipswith key customers, departments, and suppliers.
4
• New Organizations Key - Focus GHG/Energy Reductions
• GHG/Consumption Reduction Objectives
5
9 /1 0 /0 3
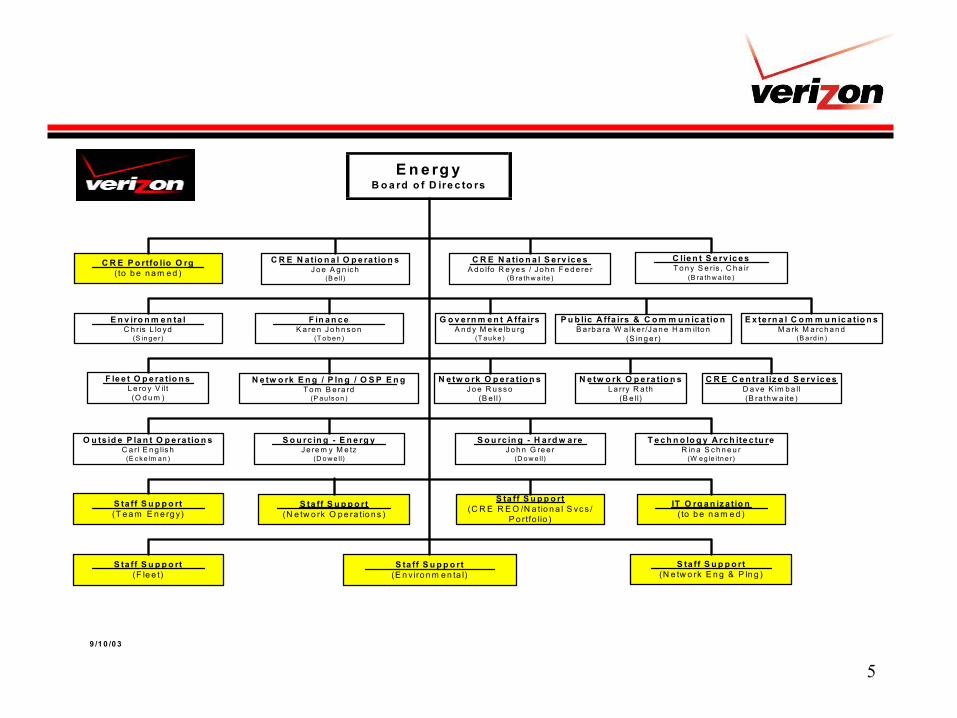
C R E P o rtfo lio O rg( to b e n a m e d )
G o v e rn m e n t A ffa irsA n d y M e k e lb u rg
(T a u k e )
F in a n c eK a re n J o h n s o n
(T o b e n )
C lie n t S e rv ic e sT o n y S e ris , C h a ir
(B ra th w a ite )
C R E N a tio n a l O p e ra tio n sJ o e A g n ic h
(B e ll)
N e tw o rk E n g / P ln g / O S P E n gT o m B e ra rd
(P a u lso n )
E n v iro n m e n ta lC h ris L lo yd
(S in g e r)
P u b lic A ffa irs & C o m m u n ic a tio nB a rb a ra W a lk e r/J a n e H a m ilto n
(S in g e r)
C R E N a tio n a l S e rv ic e sA d o lfo R e ye s / J o h n F e d e re r
(B ra th w a ite )
S ta ff S u p p o rt(E n v iro n m e n ta l)
S ta ff S u p p o rt(T e a m E n e rg y)
S ta ff S u p p o rt(N e tw o rk O p e ra tio n s )
IT O rg a n iz a tio n( to b e n a m e d )
S o u rc in g - H a rd w a reJ o h n G re e r
(D o w e ll)
S ta ff S u p p o rt(F le e t)
T e c h n o lo g y A rc h ite c tu reR in a S c h n e u r
(W e g le itn e r)
O u ts id e P la n t O p e ra tio n sC a rl E n g lis h
(E c k e lm a n )
S ta ff S u p p o rt(N e tw o rk E n g & P ln g )
E n e rg yB o a rd o f D ire c to rs
S o u rc in g - E n e rg yJ e re m y M e tz
(D o w e ll)
F le e t O p e ra tio n sL e ro y V ilt(O d u m )
N e tw o rk O p e ra tio n sJ o e R u s s o
(B e ll)
S ta ff S u p p o rt(C R E R E O /N a tio n a l S vc s /
P o rtfo lio )
C R E C e n tra liz e d S e rv ic e sD a ve K im b a ll(B ra th w a ite )
E x te rn a l C o m m u n ic a tio n sM a rk M a rc h a n d
(B a rd in )
N e tw o rk O p e ra tio n sL a rry R a th
(B e ll)
6
Operations...• Area Operations Advocates• Performance Measurement• Energy Audits• Energy Star Criteria/Certification• Target Buildings• No Cost/Low Cost Energy Reduction Initiatives• Identification of Energy Capital Projects (ECM)• Data Integrity (EDMS)• Standard Reports (EDMS)
7
Strategic...• Portfolio Work Flow Process - (Energy Considerations)• Standards Committee/SAC - (Energy Considerations)• Capital Planning-Energy Conservation Measures (ECM)• Advanced Energy Solutions Partnership (Energy Mgmt)• Sourcing, Public Policy & Energy Board Initiatives• New Technology/Alternative Fuels• Central Office Temperature Standardization• Enterprise Solution/DDC Optimization• GHG Emissions Reduction Initiatives
8
Awareness...
• Internal/External Communications
• Energy Champions• solicitation• training• recognition
• Team Energy website
• CRE Website
• Verizon Energy Board of Directors
9
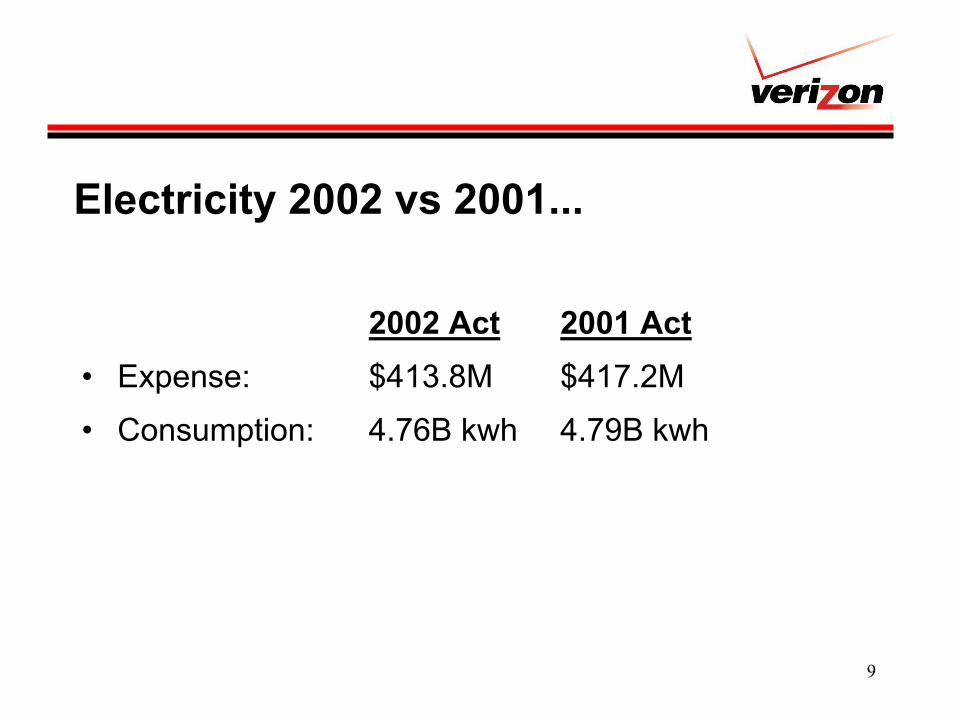
2002 Act 2001 Act• Expense: $413.8M $417.2M
• Consumption: 4.76B kwh 4.79B kwh
Electricity 2002 vs 2001...
10
Operational & Energy Management:• Energy Solutions Partnership• Field Energy Audits• Target Building Criteria• Capital Program Development (ECM)• SAC/Stds Cmt/Portfolio Work Process• DDC Optimization
Initiatives...
11
Strategic & New Technology:• GHG Emissions Reduction Surveys
• Sourcing Strategies
• Upward Pressure Analysis
• Central Office of the Future
• Fuel Cell Pilots
Initiatives...
12
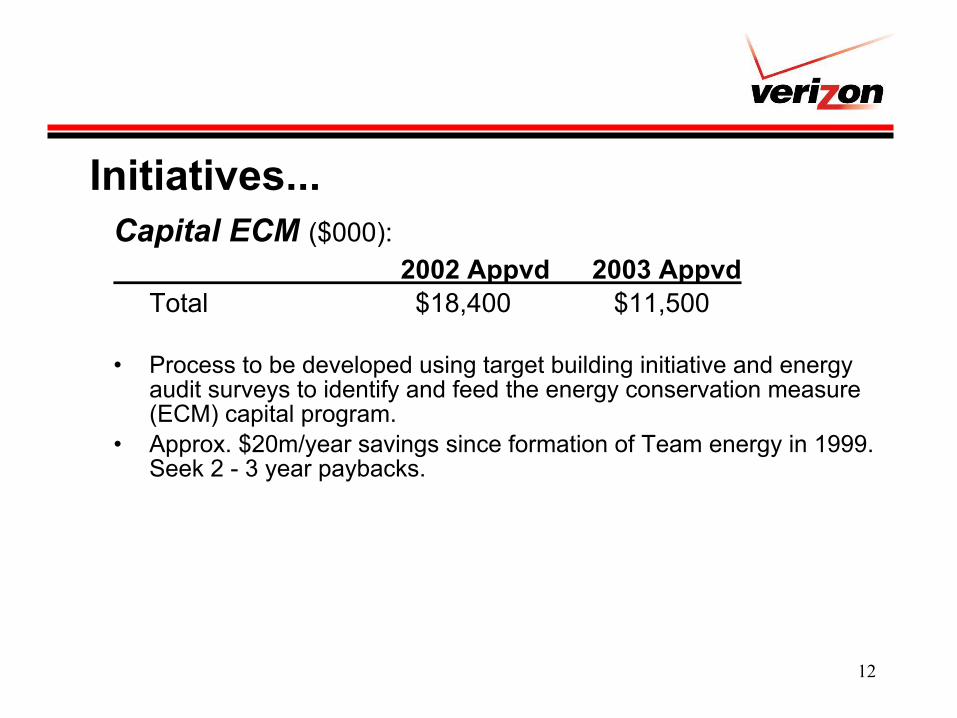
Capital ECM ($000):2002 Appvd 2003 Appvd
Total $18,400 $11,500
• Process to be developed using target building initiative and energy audit surveys to identify and feed the energy conservation measure (ECM) capital program.
• Approx. $20m/year savings since formation of Team energy in 1999. Seek 2 - 3 year paybacks.
Initiatives...
13
Energy Board of Directors:• RFP Power Consumption• C.O. Comprehensive Power Analysis• Network Equipment Removal• EPA Energy Star C.O. Benchmarking• Network Equip Flour Light Stds• Energy Scorecard & Benchmarking• Clean Engine Technologies• GHG Emissions Reduction Initiatives
Initiatives...
14
• Objective to reduce consumption by approx. $20M with initiatives implemented 2003
• 2,000 Target Buildings-Reduce Consumption 3% or 80M pounds GHG of CO2
• Network Advisory- Target Verizon’s Core DC power in switchrooms- 49M pounds of CO2
• Capital Energy Projects- 2 to 3 year paybacks-reduce 49M pounds CO2.
• Engine Block Heaters- Reduce block temperature- save 57M pounds CO2
2003 Specific Team Energy Initiatives...

15
• Question & Answer
• Thank you!
Upcoming Web ConferencesUpcoming Web ConferencesUpcoming Web Conferences
November 19, 2003 - Communicating To Financial Officers
January 21, 2004 – ENERGY STAR Update
2003 Networking Meeting2003 Networking Meeting2003 Networking Meeting
December 3, 2003
ENERGY STAR PartnershipNetworking Meeting
Washington, DC
www.energystar.gov/networking

Award ApplicationsAward Applications
• Due December 5th 2003• Applications available on web site• Note New ENERGY STAR Shipping
Address –• 1310 L St. NW, Washington DC 20005

Thank you for participating!