increasing enrollment: evaluating college-choice factors
TRANSCRIPT
Olivet Nazarene UniversityDigital Commons @ Olivet
Ed.D. Dissertations School of Graduate and Continuing Studies
5-2014
Increasing Enrollment: Evaluating College-ChoiceFactors at a Midwest Christian UniversityJeremy J. HayesOlivet Nazarene University
Follow this and additional works at: https://digitalcommons.olivet.edu/edd_diss
Part of the Advertising and Promotion Management Commons, Educational Assessment,Evaluation, and Research Commons, Higher Education Commons, Higher EducationAdministration Commons, Marketing Commons, and the Nonprofit Administration andManagement Commons
This Dissertation is brought to you for free and open access by the School of Graduate and Continuing Studies at Digital Commons @ Olivet. It hasbeen accepted for inclusion in Ed.D. Dissertations by an authorized administrator of Digital Commons @ Olivet. For more information, please [email protected].
Recommended CitationHayes, Jeremy J., "Increasing Enrollment: Evaluating College-Choice Factors at a Midwest Christian University" (2014). Ed.D.Dissertations. 70.https://digitalcommons.olivet.edu/edd_diss/70

INCREASING ENROLLMENT: EVALUATING COLLEGE-CHOICE FACTORS AT
A MIDWEST CHRISTIAN UNIVERSITY
by
Jeremy J. Hayes
Dissertation
Submitted to the Faculty of
Olivet Nazarene University
School of Graduate and Continuing Studies
In Partial Fulfillment of Requirements for
The Degree of
Doctor of Education
in
Ethical Leadership
May 2014

i
© 2014
Jeremy J. Hayes
All Rights Reserved

ii
ACKNOWLEDGEMENTS
First and foremost I would like to thank my advisor and friend Dr. Bert Jacobson
for all of your support and guidance throughout this entire process. I will never forget all
of those late night meetings we had, I learned so much from you about this process and
about life. I could not have done it without you.
I would also like to thank my reader Dr. Jonathon Bartling. Your feedback was
vital during this process and is much appreciated. Your advice always led to more
sleepless nights, but always resulted in a better finished product. Thank you.
In addition, I would like to thank my colleague and mentor Dr. Mike Cherry. You
put me on the right path to take this journey. Thanks for all of your tips and support
throughout the process. I look forward to working with you for years to come.
I would like to thank my wife Jennifer. I have been extremely busy over the last
few years and I am sure I could not have been the easiest person to deal with during this
time, thanks for picking up the slack. You made me take many much needed breaks to
enjoy life and always put a smile on my face. You always believed I could do it and
continue to be my inspiration to do big things. Thanks for you for all of your support. I
love you.
Finally, I would like to thank my son Jackson. You made the last part of this
process so much more difficult, yet so much more rewarding. You were my motivation
during the home stretch. I love you.

iii
DEDICATION
To my mom and dad, Nancy and Mark Hayes, thank you for all of your love,
words of encouragement, and unwavering support. You instilled the work ethic and
values in me that made this possible. Mom, you taught me how to work hard, and dad,
you taught me how to work smart. You guys were always a phone call away from helping
me with anything I ever needed throughout this entire process. You were the perfect role
models for me throughout the years and planted the seeds for this accomplishment.
Thanks for everything, you guys are the best.
iv
ABSTRACT
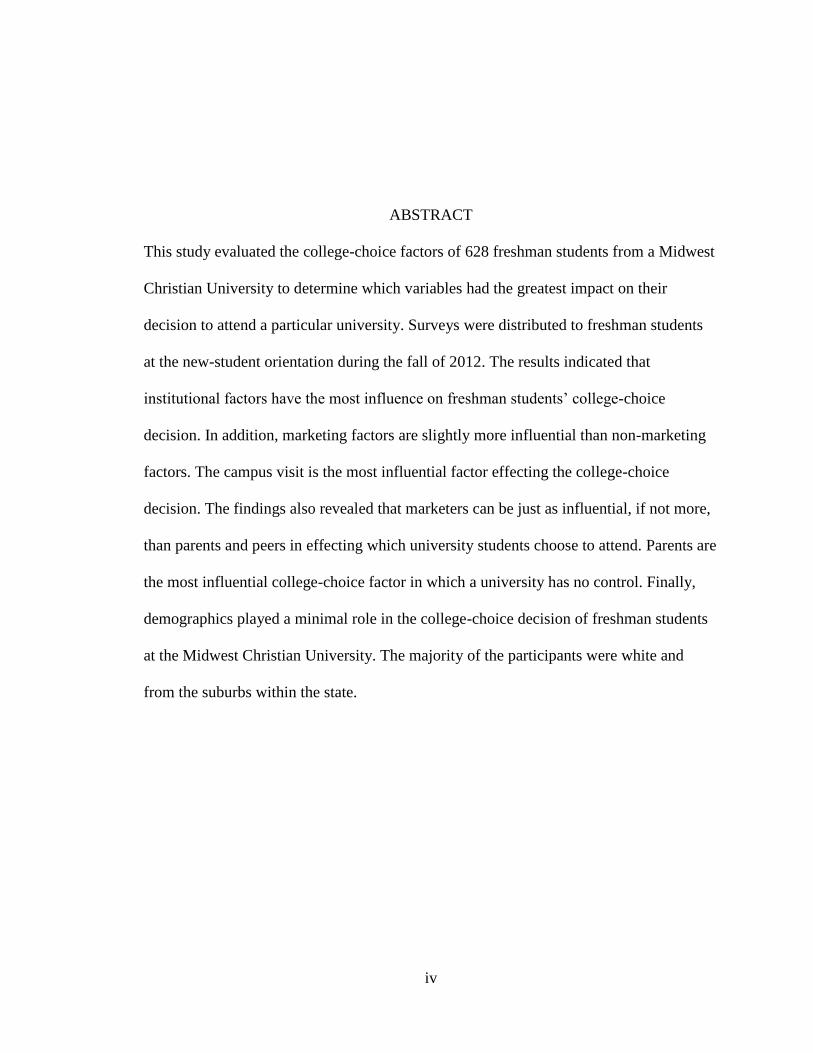
This study evaluated the college-choice factors of 628 freshman students from a Midwest
Christian University to determine which variables had the greatest impact on their
decision to attend a particular university. Surveys were distributed to freshman students
at the new-student orientation during the fall of 2012. The results indicated that
institutional factors have the most influence on freshman students’ college-choice
decision. In addition, marketing factors are slightly more influential than non-marketing
factors. The campus visit is the most influential factor effecting the college-choice
decision. The findings also revealed that marketers can be just as influential, if not more,
than parents and peers in effecting which university students choose to attend. Parents are
the most influential college-choice factor in which a university has no control. Finally,
demographics played a minimal role in the college-choice decision of freshman students
at the Midwest Christian University. The majority of the participants were white and
from the suburbs within the state.
v
TABLE OF CONTENTS
Chapter Page
I. INTRODUCTION ………………………………………………………. 1
Statement of the Problem ……………………………………………….. 2
Background ……………………………………………………………... 3
Research Questions ……………………………………………………... 21
Description of Terms ……………………………………………………. 21
Significance of the Study ……………………………………………….. 22
Process to Accomplish ………………………………………………….. 23
Summary ………………………………………………………………... 28
II. REVIEW OF THE LITERATURE …………………………………….. 29
Introduction ……………………………………………………………... 29
Demographics …………………………………………………………… 30
Marketing Factors ………………………………………………………. 36
Non-Marketing Factors …………………………………………………. 56
Summary ………………………………………………………………... 63
III. METHODOLOGY ……………………………………………………… 66
Introduction ……………………………………………………………... 66
Research Design ………………………………………………………… 67
Population ……………………………………………………………….. 72
vi
Chapter
Data Collection …………………………………………………………..
Page
73
Analytical Methods ……………………………………………………... 76
Limitations ……………………………………………………………… 78
Summary ………………………………………………………………... 79
IV. FINDINGS AND CONCLUSIONS ……………………………………. 80
Introduction …………………………………………………………….. 80
Findings …………………………………………………………………. 81
Conclusions ……………………………………………………………... 153
Implications and Recommendations ……………………………………. 162
Summary ………………………………………………………………... 164
REFERENCES ………………………………………………………….. 166
APPENDIXES
A. Orientation Announcement ………………………………………... 179
B. Informed Consent Form …………………………………………… 181
C. College Choice Survey ……………………………………............. 183
vii
LIST OF TABLES
Table Page
1. Evaluating the Influence of Individual Non-Marketing, Marketing,
and Institutional Factors …...………………………………………
82
2. Comparing the Influence of Non-Marketing and Marketing Factors …….. 84
3. Evaluating the Influence of Institutional Factors …………………………. 85
4. Rankings of Institutional Factors that Influenced the College Choice
Decision ……………………………………………………………
86
5. Student Perceptions of Statements Related to the Midwest Christian
University ……………………………………………………….....
88
6. Rankings of Marketing and Non-Marketing Factors that Influenced
the College-Choice Decision ………………………………………
90
7. Relationship Between Gender and Non-Marketing Factors ………………. 92
8. Relationship Between Gender and Marketing Factors ……………………. 93
9. Relationship Between Gender and Institutional Factors …………………. 95
10. Relationship Between Race and Non-Marketing Factors …………………. 97
11. Relationship Between Race and Marketing Factors ………………………. 99
12. Relationship Between Race and Institutional Factors …………………….. 101
13. Relationship Between Location and Non-Marketing Factors …………….. 105
14. Relationship Between Location and Marketing Factors …………………... 106
15. Relationship Between Location and Institutional Factors ……………….... 107
16. Relationship Between Community and Non-Marketing Factors …………. 110
viii
Table Page
17. Relationship Between Community and Marketing Factors ……………….. 112
18. Relationship Between Community and Institutional Factors ……………... 113
19. Relationship Between Religious Beliefs and Non-Marketing Factors ……. 115
20. Relationship Between Religious Beliefs and Marketing Factors …………. 116
21. Relationship Between Religious Beliefs and Institutional Factors ……….. 118
22. Relationship Between High School GPA and Non-Marketing Factors …... 120
23. Relationship Between High School GPA and Marketing Factors ………… 122
24. Relationship Between High School GPA and Institutional Factors ………. 124
25. Relationship Between Parents’ Highest Level of Education and Non-
Marketing Factors ………………………………………………….
127
26. Relationship Between Parents’ Highest Level of Education and
Marketing Factors ………………………………………………….
130
27. Relationship Between Parents’ Highest Level of Education and
Institutional Factors ………………………………………………..
132
28. Relationship Between Priority Choice to Attend MCU and Non-
Marketing Factors ………………………………………………….
134
29. Relationship Between Priority Choice to Attend MCU and Marketing
Factors ……………………………………………………………..
137
30. Relationship Between Priority Choice to Attend MCU and
Institutional Factors ………………………………………………..
139
31. Correlation Between Parents Educational Achievement and Non-
Marketing Factors ………………………………………………….
141
32. Correlation Between Parents Educational Achievement and Marketing
Factors ……………………………………………………………..
142
33. Correlation Between Parents Educational Achievement and
Institutional Factors ………………………………………………..
144
ix
Table
Page
34. Correlation Between High School GPA and Non-Marketing Factors ……. 146
35. Correlation Between High School GPA and Marketing Factors …………. 147
36. Correlation Between High School GPA and Institutional Factors ………... 148
37. Correlation Between College Priority Non-Marketing Factors …………… 150
38. Correlation Between College Priority and Marketing Factors ……………. 151
39. Correlation Between College Priority and Institutional Factors ………….. 152
1
CHAPTER I
INTRODUCTION
Prospective college students have many options to choose from when deciding
which higher education institution to attend. The options range from traditional public
and private four-year universities, to online colleges, to community colleges and more.
When making the college-choice decision, some potential students consider going to
various colleges and universities, while others quickly decide to enroll in a particular
school. What compels potential students to enroll in private universities as opposed to
other colleges and universities? College-choice has been defined as “the process through
which students decide whether and where to go to college” (Bergerson, 2009, p.2).
Factors that affect enrollment include: marketing, the admissions process,
financial aid, peer influence, and student advisors. For example, what roles do customer
service and university websites play on influencing potential undergraduate students to
enroll in universities? Prospective students have expectations of the information they can
find online from colleges. Students are seeking academic program details, a list of
degrees offered, and cost of attendance. If this information is difficult to find, unclear, or
is part of a poorly designed website, potential students will likely remove the college
from the list of potential institutions that they might attend (Noel-Levitz, 2010a).
In recent years, formalized marketing concepts have become important in the
decision- making process of college administrators. The introduction of senior-level
2
marketing positions in higher education institutions is evidence of an increased focus on
these efforts (Quatroache, 2004). Marketing offers countless benefits to colleges that can
harness their creative energy toward positive and long-term institutional enhancement
(Mitchell, 1980). The strengths of the student body are used as a marketing tool in
emphasizing the quality of the university and the ability to achieve rankings, and
encourage prospective students to enroll in the institution (Filter, 2010). Understanding
the factors that influence enrollment can help universities succeed in an increasingly
competitive marketplace for education. This study will review the factors that contributed
to students’ choice to enroll in a specific private university.
Statement of the Problem
Due to the challenges private universities face to increase enrollment, private
universities must modify their enrollment marketing strategies to increase undergraduate
enrollment while fulfilling their educational mission. Higher education is now facing
increasing competition from for-profit universities and reduced funding from typical
sources (McCoy, 2011). The purpose of this study is to identify and analyze the factors
that influence undergraduate students to enroll at a particular Midwest Christian
University as well as fill a void in the research of college-choice factors in private
universities. The analysis will aid the marketing strategies at private universities to
increase their enrollment. The goal of the researcher is to evaluate what compels potential
students to enroll in a specific university in order to uncover opportunities to improve
marketing strategies in efforts to increase enrollment.
There is no research on record that analyzes an entire population of incoming
freshman students at a private university by comparing the student-recruitment marketing
3
efforts controlled by an institution to the factors that impact college-choice over which an
institution has little or no control (Donnellan, 2002). This represents a significant gap in
research. While institutions can control their marketing mix factors including product,
price, promotion, and place, other environmental forces are beyond their control. These
environmental forces include social, economical, competitive, and technological forces.
By identifying trends related to each of these forces, institutions can develop and
maintain successful marketing plans (Kerin, Hartley, & Rudelius, 2011).
Background
Enrollment management is an imperative part of increasing enrollment and
managing the factors that affect the college-choice decision of potential students.
Enrollment management typically includes both an administrative structure and a
coordinated approach to achieving the optimum recruitment of students. By coordinating
efforts in marketing recruitment, admissions, financial aid, orientation, and retention
enrollment management influences the size and make-up of the student body (Hossler &
Kemerer, 1986). The field of enrollment management has embraced an approach to
understanding consumer behavior and college-choice through psychographic and
demographic data, and advanced marketing techniques (Posecznick, 2010). Enrollment of
students ensures fiscal solvency of colleges and universities through tuition dollars,
provides opportunities for the school to market themselves based on the demographics of
the population, and earns rankings on the selectivity of the admitted class (Morse &
Flanigan, 2008). Because most higher education institutions are tuition driven, the college
admissions landscape has taken on an exceedingly competitive nature (Barr, 2002). To
successfully recruit and enroll desired populations, it is essential for administrators to
4
understand why individuals choose to enroll at their particular institution of higher
education instead of at other schools (Filter, 2010). By understanding why the variables
that influence college-choice, administrators are able to assess the strength of their
enrollment management process in order to matriculate an incoming class that is large
enough to generate the necessary tuition revenue (Samuel, 2009).
Throughout the late 1970’s and early 1980’s colleges increasingly used more
advanced and aggressive marketing strategies to attract both students in general and high
performing students in particular (Duffy & Goldberg, 1998). In the last 20 years,
enrollment management has gone from a strategy practiced at a small number of private
universities to the standard procedure at most public and private institutions (Hossler,
2004). Within the previous 10 years, colleges had begun to approach comprehensive
enrollment management through the implementation of consumer-based knowledge when
recruiting qualified students. As a result of this approach, colleges have needed to spend
increasing amounts of their limited budget on marketing efforts to understand, manage,
and attract potential students. In 2004, private four-year universities spent an estimated
$2,167 to recruit a student, and admissions spent on average 58% of their time counseling
prospective students (Hawkins & Clinedinst, 2006). As the number of prospective
students continues to grow, colleges need to refine their marketing strategies to reduce
costs and maximize reach to optimize their return on investment.
The college-choice process occurs in three stages: predisposition, search, and
choice (Hossler & Gallagher, 1987). In reviewing the factors that lead to college-choice
of undergraduate students, many of the same principles that pertain to graduate and
international students apply. Across all levels of higher education peer influence,
5
customer service, marketing, recruitment, educational programs, and efforts from the
admissions office play a significant role in helping prospective students select where to
go to college. Understanding previous research on college-choice factors of graduate and
international students can be used to enhance the understanding of college choice factors
of undergraduate students.
In evaluating marketing strategies universities use to increase enrollment, the
background can be broken down into five sections that include studies that focus on
undergraduate students, community college students, high school students, graduate
students, and international students. These studies found various influences on college-
choice decisions of potential students including peer influence, various marketing efforts,
and the level of faculty involvement in recruiting efforts. While the purpose of this study
is to determine the college-choice factors of students in a private university, it is
important to identify the factors that contribute to a prospective students’ college choice,
regardless the institutional level. Understanding these factors will enhance a university’s
marketing plan to increase enrollment. The following studies will provide a background
on prospective students of various higher education institutions and the findings related to
their college-choice decision.
Undergraduate Students
The following studies focused on the college-choice factors of current and
prospective undergraduate students. Norwood (2009) distributed surveys to African
American freshman at predominately-white four-year universities to determine the
factors that influenced their choice of college. Norwood found that the top factor for
these African-American students’ choice of college was academic reputation of school,
6
followed by indications that graduates of the school received good jobs, and social
reputation. The least important factor of college choice of these African-American
students was advice received from a counselor. Norwood’s study indicated that African-
American students have very similar methods for choosing colleges at predominately-
white colleges. Race does not seem to be a significant factor in the choice of college in
this particular study.
Donnellan’s (2002) research reinforced Norwood’s (2009) findings that advice
received from counselors played little role in the college-choice decision-making process.
Donnellan distributed a survey to 453 freshmen at the University of Massachusetts to
determine whether marketing factors controlled by a university have a greater impact on
college choice than external environmental factors uncontrollable by a university.
Donnellan showed that non-marketing factors were more influential on the respondents'
college-choice decisions than marketing factors. The most influential non-marketing
factors were parents and friends. The most influential marketing factors to the
respondents were the campus visit and information provided about specific majors. Price
was the most influential institutional attribute on college choice. Donnellan’s study
reinforced that peers have a strong influence in the college choice of a potential student.
Marketing strategies may need to be focused on peers as well as potential students. This
study closely reflected the research that was conducted to evaluate college-choice factors
at the Midwest Christian University as Donellan’s survey instrument was adapted for this
study. While Donnellan used a case study at a public university, the research conducted at
the Midwest Christian University will be a case study at a private university. Donnellan’s
study also failed to represent the population from a demographics standpoint.
7
While Donnellan’s (2002) study focused on undergraduate students at a public
university, Sauder (2008) researched the college-choice factors of prospective students of
private universities. Sauder studied the views of Adventist college-bound students and the
factors that influenced their college choices. Sauder utilized a mixed method approach
that involved focus groups as well as a nationwide telephone survey of college-bound
Adventists. Sauder found that students not attending Adventist academies reported little
to no contact with Adventist college recruiters, and stated that academic program and
closeness to home were important motivators for college choice. Spirituality was also an
important motivator for students headed towards Adventist colleges. Sauder’s study
described religious factors that influenced potential college students’ decisions and the
lack of knowledge they received based on the kind of high school they attended.
Religious factors should be considered when marketing private universities.
While the previous studies focused on overall college-choice factors of
prospective students, Martin’s (2006) research focused on marketing to students through
university websites. Martin studied the presentation of information on university websites
through the Heuristic-Systematic Model (HSM) of information processing. Martin’s
HSM proposed that when people were presented with a message, they will either
cognitively process the information by carefully analyzing the message or draw
conclusions about the information based on personal theories triggered by an element of
the message. Martin evaluated college students in two experiments that assessed
information processing and its effect on attitude formation from university websites.
Martin’s first experiment included 281 participants where message elements on a
university website were changed to determine the effects on attitude of the students by
8
the inclusion, absence or combination of; a student photograph, a quote from a student,
and statistics about the university. Martin’s second experiment included 328 participants
and involved manipulating the amount of student testimonials on the site and language
type. Martin showed that both the type and amount of message elements presented on
college websites had an effect on the measures of attitude toward the university and
measures of intent to gain more information about the university. Martin’s study provided
insight into the importance of marketing universities through websites. Just a few
adjustments to some web pages gave students a different view about a college.
In a similar study, Pegoraro’s (2006) research compared the efficiency of several
university websites. Pegoraro studied the content of Canadian University websites and
compared the standard usability guidelines of websites established through previous
research. Pegoraro found the level of usability was fair to good, while the relationship
marketing content was only moderate to fair. Pegoraro assessed content for relationship
building capacity using previous research into student expectations for website content.
Pegoraro found a significant negative correlation between usability and relationship
marketing content where institutions performed well at one or the other aspect of their
websites, but not both. Pegoraro also found a significant correlation between website
usability and institutional size and operating budget. Pegoraro’s study described how the
internet should be a marketing equalizer among universities vying for enrollment and
website traffic; however, large universities have the edge in efficient websites due to
significantly larger operating budgets than smaller institutions. The Midwest Christian
University would be considered a smaller institution with a lower operating budget than
many larger institutions. However, if website marketing is found to play a diminished
9
role in college-choice factors of freshman students, the website marketing plan may need
to be reviewed for enhancement opportunities.
Whereas the previous studies focused on the factors that cause students to enroll
in a particular university, Thoene (2011) researched the factors that caused students to
enroll in particular courses. Thoene reported that college administrators and faculty
members at a Midwestern college were facing financial cutbacks and needed to justify
their program offerings; however, the college administrators and faculty who were
studied did not know what information sources students relied upon when choosing
courses. Thoene measured four factors that influence students to enroll in particular
courses: academic advisors, parents, peers, and RateMyProfessor.com. Through surveys
that were distributed to 467 students at this particular Midwestern college, Thoene
discovered that academic advisors had the highest influence in determining in which
classes students enrolled, followed by peers, parents, and RateMyProfessors.com. By
understanding the influences that each of these factors had on college students during
course selection, faculty members may be able to develop effective marketing strategies
to encourage more students to enroll in their courses. Thoene’s study provided insight
into factors that influenced college students’ decisions in course selection. Marketing
specific courses may be just as valuable as college’s marketing to increase enrollment.
The following study looked at how to improve a particular Associate in Arts
program within a university. Bacon (2010) reported that the enrollment and retention of
students in the Associate in Arts program at the University of Delaware were below the
University of Delaware’s expectations due to poor image issues associated with
community colleges, and the University of Delaware’s marketing mix of product, price,
10
place, and promotion. The University of Delaware established an Associate of Arts
Program to ensure that students at branch campuses were prepared for the challenges of
the University, however, enrollment numbers remained below expectations of the
University. Bacon’s study utilized surveys distributed to high school seniors and
guidance counselors in Delaware, Associate in Arts program faculty and staff, and both
enrolled students and students who graduated from the Associate in Arts program.
According to Bacon, the price of education at a university was an indicator of
product quality, status and prestige. Bacon indicated that a negative image impact of the
Associate in Arts program at the University of Delaware existed because the tuition was
set at comparable prices to community college rates and because university branch
campuses were located at community college sites. In addition, the University of
Delaware gave minimal attention to promotional events to launch the Associate in Arts
program, which contributed to enrollment numbers below the university’s expectations.
Bacon’s study provided insight about the challenges that universities face in
developing an image consistent with university standards. Educational programs, like
products, need to be promoted and have the right marketing strategy to succeed.
Tweaking a product’s image can give new life to that product and be the difference
between success and failure. As competition within higher education institutions
continues to grow, so do the number of branch campuses provided by private universities.
While many private universities require freshman students to take classes on the main
campus, Bacon’s findings on the University of Delaware’s unique program could be
applied to non-traditional students of private universities with college experience who are
allowed to take courses at branch campuses.
11
Community College Students
The subsequent studies focused on prospective students’ decisions to attend a
particular community college. Quatroache (2004) compared demographic and geographic
student groups in relation to both the promotional marketing methods to which they are
most receptive and their college-choice preferences. Quatroache distributed surveys to
753 freshmen at community colleges during student registration sessions. Quatroache
revealed that there were consistent similarities among demographic and geographic
groups’ first choices of promotional marketing activities and college-choice factors and
activities. While few differences existed among some of these geographic and
demographic segments, Quatroache stated that direct mail, brochures, and radio spots
were the most cost-effective methods of reaching the greatest number of students to
promote a community college's low cost and convenient location. Quatroache’s study
described how marketing to various geographic segments should be very similar given
the similar responses to his survey.
While Quatroache’s (2004) study found that marketing strategies to various
geographic segments should be similar, Romali’s (2011) research uncovered how
marketing strategies need to be adjusted when the marketing budget is reduced. Romali
studied several California community colleges and their changes in enrollment strategies
associated with a California Senate Bill that equalized funding to all of the state's
community colleges, paying each community college at the same rate per full-time
equivalent student. Prior to the Senate Bill passing in 2006, California community college
funding levels were disparate, with some colleges gaining significantly more funding per
student than other colleges. Romali explored how California community colleges

12
capitalized on enrollment growth strategies by conducting personal interviews with senior
academic and student services administrators from two colleges in the Pacific
Community College District. Romali used pattern coding to identify possible themes
across responses and found that institutions could improve enrollment by using
institutional research data, linking enrollment to budget, capitalizing on
marketing/outreach opportunities, and efficiently scheduling courses. Many private
universities continue to increase enrollment goals while budgets decrease, Romali’s study
illustrated how a college can be successful while having to adjust their marketing strategy
because of a limited budget.
Community colleges must continue to re-evaluate their marketing plans to see
what strategies work. Denton (2007) compared and evaluated television-viewing habits
of freshman at Meridian Community college and looked for the message that called them
to action to enroll. Denton distributed a survey to freshman, which included call-to-action
preferences, media preferences and habits, and perceived goals. In the end, Denton
identified television advertisement as the preferred message for encouraging further
interest in Meridian Community College; however, the impact of a positive reference by
family and friends was the leading influence to attend Meridian Community College.
Denton’s study described how, although television advertisement is a good way to
establish a brand image, peer references is still the leading decision factor for potential
students. Enhanced marketing plans may need to be developed for everyone involved in
the decision making process, not just the potential student.
Dickenson (2003) researched the marketing and enrollment management
strategies of newly-enrolled students at Southeast Technical Institute (STI), a two-year
13
college. Dickenson distributed surveys to 286 new students during orientation and
achieved a 100% response rate. Students answered questions relating to the factors that
affected their choice of college. While the actions of STI staff may have exerted some
influence during the college-choice process, students’ preconceived notions of what they
knew about the institute was much more influential than most other factors. Students felt
that printed material and personal campus visits were more influential than the use of
mass media. Students’ decisions to attend STI were mostly influenced by their friends.
Dickenson’s study gave a unique perspective about what influenced students to enroll
into college on their first day of school, as opposed to surveying students mid-year or
after graduation. Dickenson’s survey distribution method was highly effective in
receiving a 100% response rate and the research to be conducted at the Midwest Christian
University will use the same effective method of survey distribution.
Mayfield (2005) conducted a study to use social network analysis as a tool to
identify a target marketing audience for the vocational educational programs in a
southern California community college. Mayfield assessed students’ social networks
through means of measuring the influence of people in their lives. Mayfield found
parents, teachers, counselors, field professionals and peers as the most obvious people to
influence a potential student. Through a survey method, including questions about
demographics and a peer influences, Mayfield compared three vocational educational
programs at a southern California community college. Mayfield indicated that all three
vocational education programs drew unique individuals. Marketing to these individuals
was most effective if done through the internet, targeting parents of prospective students,
targeting students already on the community college campus, and making sure the

14
program’s initial contact person was warm and considerate. In addition, Mayfield
determined that the counselor was the weakest influence in the student’s decision for
career or program enrollment. Mayfield’s study found that marketing individual
programs was more effective than marketing the community college as a whole. It may
also be more effective to increase enrollment at a private university by marketing
individual programs rather than the university as a whole.
High School Students
The following studies involve college-choice factors of high school students. If
perceptions of recruiting efforts of high school students are known, then universities can
have a better idea where to focus their marketing efforts. Smith (2006) administered a
survey to approximately 1,700 Western New York high school students to study their
college selection process. Smith analyzed how students’ perceptions of different college
search resources varied according to their racial background, parents’ educational
backgrounds, academic ability, academic aspiration, and geographic focus of their
college searches. Smith revealed that academic ability, academic aspiration, and parental
education had no effect on how students rated the usefulness of any college selection
resources during the search and choice phases of the college selection process. Students
rated college websites as the most useful source during the college search stage. Finally,
students perceived campus tours as the most useful search resource while deciding which
college to attend. In Smith’s study, race, parents’ educational backgrounds, academic
ability, and academic inspiration did not affect the way high school students search for
colleges. Although these demographic factors were found not to have an effect on
college-choice factors of high school students in New York, they are worth evaluating in
15
students at the Midwest Christian University as perceptions of students change after they
have enrolled in a particular university.
McLeod (1990) compared the meaning of 15 photographs of various college
settings to high school seniors with the meaning of the same photographs to adult
participants in continuing education activities. McLeod projected slides to 76 adults and
75 high school students. To differentiate between the two groups’ perceptions of
photographs, McLeod used a semantic differential scale, a method of interpreting the
psychological meaning of a concept by use of what words mean to individuals. McLeod
found that the adult group saw the pictures as more positive than the high school group.
McLeod’s study described how the same college marketing photographs can invoke two
different sets of feelings for potential students of various age categories. Marketing
publications must be studied at all levels of educational institutions to establish which
demographic groups of people they will appeal to most.
Graduate Students
In reviewing the factors that cause graduate students to enroll at specific
universities, Andrignola (2010) studied the factors that lead working adults to enroll in
graduate programs. Through a qualitative interview process of 25 working adults enrolled
in graduate school, Andrignola revealed that students expect the same level of customer
service from institutions of higher education as they do when they purchase all other
goods and services. Andrignola’s results showed that educated consumers are well-
informed shoppers and are looking for points of differentiation to help them decide where
to buy. While many colleges look and act alike, the level of customer service will
ultimately set them apart. Andrignola’s study illustrated how similar the purchase
16
practices are between prospective college students and regular consumers. Customer
service is important in education and business, and is an integral part of attracting
potential students. Potential students at all levels have come to expect a high level of
customer service when entering a university at any level. If the customer service does not
meet their expectations, students are more likely to go elsewhere to receive an education.
While customer service was found to be an important factor in Andrignola’s
(2010) study, Stack (2010) found that the ability to balance work and school is also an
important college choice factor for graduate students. Stack identified college choice
factors that influenced working graduate students to enroll in an M.B.A. program at a
private university. Stack distributed surveys to 341 currently enrolled business graduate
students at the university. In the end, Stack found that the ability to balance work and
school most strongly influenced students’ decisions to enroll at the university. While the
enrollment factors for M.B.A students may be different from undergraduate students, the
overall study provided somewhat of an outline for researching enrollment factors of
undergraduate students. Similar instruments and methodologies can be used to determine
college-choice factors of prospective undergraduate students in private universities,
however, the outcomes of the studies may be different as undergraduate students are
generally not employed full-time.
Although identifying how to spend a marketing budget and how to provide a
balanced work life is important in recruiting graduate students, it is also important to
utilize faculty members in recruiting efforts. Woodhouse (2006) studied graduate faculty
involvement in graduate student recruitment at a research university to determine if
faculty were involved in enrollment strategies. Woodhouse surveyed 148 graduate faculty
17
members and found an overwhelming majority of the respondents indicated that graduate
student recruitment is not a required part of their job responsibilities, however, these
faculty members engage in day-to-day recruitment of students. Woodhouse described
how faculty members go beyond their scope of duties to increase enrollment at their
university. Having faculty members involved in recruitment efforts may be another cost-
effective way to increase enrollment at private universities.
International Students
Many of the factors that affect the college-choice decision of prospective
international students are similar to those of domestic undergraduate students. Buuck
(1996) studied the recruitment of international undergraduate students at 18 small private
colleges and universities in Wisconsin, consisting of fewer than 4,000 full-time
undergraduate students. Buuck conducted his study in four phases. In Phase I, Buuck sent
a survey to the colleges and universities to gain data on recruitment and retention
statistics. In Phase II, Buuck sent a survey to all international undergraduate students who
were currently enrolled in the surveyed institutions. In Phase III, Buuck conducted 11
interviews with administrators at three of the surveyed institutions. In Phase IV, Buuck
conducted 18 interviews with international undergraduate students at the same three
institutions. Buuck indicated that most international undergraduate students first heard
about their chosen college/university through friends and relatives. Most international
undergraduates chose to attend a college/university because it offered the academic major
they wished to pursue. Buuck’s study provided a large sample size that described how
international students made their college-choice decision. Peer influence was found to be
a significant factor in exposing international students to institutions of which they would
18
not otherwise have been aware. Peer influence may have a similar effect on domestic
students at private universities.
In addition to offering the right academic major, Kim (2001) found that academic
reputation is also an influential college-choice factor to international students. Kim
researched the effectiveness of institutional marketing and recruiting activities aimed at
attracting international undergraduate students, as well as the impact these have on the
college choice of such students at three universities in New York. Kim distributed
surveys to randomly selected international undergraduate students and school
administrators involved in international admissions and recruitment. Kim also conducted
interviews with the school administrators. The results of Kim’s study showed that
academic reputation and costs were the most influential factors in choosing to apply and
enroll in a school. Service-related factors, availability of international student services
and helpfulness of staff, as well as other school characteristics, campus location and
community size, were rated as low in importance. While college-choice factors of
international students will not be the focus in the research to be conducted at the Midwest
Christian University, Kim’s research could provide additional insight.
In a related study, Wang (2009) researched the institutional marketing and
recruitment strategies that two Canadian universities had developed to attract
international undergraduate students to study on campus. Wang collected data from the
universities through interviews with university leaders and international students, and an
on-line survey with international students. Wang determined that most international
students chose a university based on its reputation and program quality, followed by the
recognition of the degree in their home country, tuition and expenses, and the quick
19
response of the university. Wang’s study showed how international students have very
similar college-choice traits as domestic students. Marketing enrollment strategies for
international students may not be much different from marketing strategies for domestic
students.
Yang (2003) studied the strategies, rationales, and public policies at the
institutional, provincial, and federal levels concerning international student recruitment in
the 16 public colleges of Alberta, Canada. Yang distributed surveys to all of the Alberta
public colleges, conducted personal interviews with selected college personnel involved
with international student recruitment, and analyzed documentation. Yang discovered
that international students were recruited to enrich campus culture, generate revenue, and
internationalize the public college in Alberta. Yang also found that very few colleges had
specific strategic recruitment planning, rather, recruitment strategies relied on web
publications, brochures, advisors, and alumni. Most of the colleges in this study
developed websites and flyers and hoped students would show up, without having any
real recruitment strategy or analysis. Colleges in the United States and Canada should
have marketing plans in place to manage enrollment strategies to increase enrollment. If
it is uncovered that students surveyed have a wide range of factors that affected their
college-choice decision, then marketing efforts may need to be enhanced to target
specific demographics to improve marketing budget efficiencies.
Mallet (2007) investigated recruitment strategies that influenced international
undergraduate enrollment at 61 public and private institutions in the United States from
2003 to 2005. The universities that Mallet studied centered on undergraduate
instructional programs with an arts and sciences focus. Mallet examined various
20
international undergraduate recruitment practices, reasons why international students
chose to attend particular universities, and how these areas were recognized by lead
international admissions personnel. Mallet distributed surveys to undergraduate
admission personnel from 61 arts and science universities. Mallet noted that there were
no significant differences in international enrollment numbers between public and private
universities from 2003 to 2005, and Mallet’s study found that recruiting strategies geared
toward international students did not change between public and private universities over
that three-year time span.
The background research provides a brief overview of studies that focused on the
college-choice factors of undergraduate students, community college students, high
school students, graduate students, and international students. Understanding the factors
that contribute to a prospective students’ college-choice, no matter the institutional level,
will corroborate the findings of this study and enhance a private university’s marketing
plan to increase enrollment. This study addressed a void in the current research related to
sample size, lack of demographic information, and factors that an institution can control
versus those factors it cannot control. The research conducted at the Midwest Christian
University sampled nearly 100% of the incoming freshmen and determined the
differences in college-choice factors of students at a particular Midwest Christian
University.
21
Research Questions
The topic of this research sought to study the college-choice factors that
influenced undergraduate freshman students at a Midwest Christian University. With the
growing competition of higher education, how do private universities attract potential
students? It is evident that college student marketing concepts are needed to achieve
institutional enrollment goals (Whiteside, 2004).
This study sought to find:
1. What factors most influenced the enrollment decision of freshman students
currently enrolled at a Midwest Christian University?
2. What impact do demographic characteristics have on college-choice factors at a
Midwest Christian University?
3. What is the impact of marketing versus non-marketing factors on the college-
choice decision of freshman students at a Midwest Christian University?
Description of Terms
College-choice. “The process through which students decide whether and where
to go to college” (Bergerson, 2009, p.2).
Enrollment management. A campus-wide effort that includes the coordination of
related efforts to achieve the optimum recruitment, retention, and graduation of students
(Dolence, 1990).
Institutional factor. The characteristics of a college or university that are
appealing to applicants. The list includes location, price, and scholarships (Donnellan,
2002).
22
Marketing factor. An element of a college or university’s marketing strategy for
recruiting students controllable by the institution. The list includes course catalogs, open
houses, Facebook pages, and Websites (Donnellan, 2002).
Non-Marketing factor. Factors impacting college-choice that are not directly
controllable by an institution. The list includes parents, friends, alumni, and current
students (Donnellan, 2002).
Non-traditional students. Students who take a break longer than six months after
graduating high school prior to attending a college or university.
Prospect. A student who has not inquired about the college, but who is in a
potential pool of candidates who have been identified as having a possibility of enrolling.
An example of a prospect would be a student on a mailing list purchased from the
College Board who fits the parameters of a typical student (Lee, 2010).
Reach. The number of different people exposed to an advertisement (Kerin et al.,
2011).
Stealth applicants. Students whose applications for admission represent the first
recorded contact with the university (Dupaul, 2010).
Traditional students. Students who attend a college or university within six
months of graduating high school.
Significance of the Study
This study is significant given the increased competition among colleges to
increase enrollment. The research identified which factors had the greatest influence in
determining why freshman students chose a particular Midwest Christian University over
other higher educational institutions. Understanding how freshman students perceive pre-
23
enrollment interactions with universities can be important in determining how marketing
strategies can be improved in the future. This study can be used as a guide for admissions
staff at private universities to see which controllable and uncontrollable marketing factors
have the most influence in the college choice of potential students.
Process to Accomplish
The research will begin by administering paper-and-pencil surveys to incoming
freshman students at the Midwest Christian University during the freshman orientation.
Once the surveys were completed and collected, the results were tabulated to determine
what factors influenced the enrollment decision.
This study was conducted at a Midwestern Christian University. The population
of this study consisted of all incoming freshman students currently enrolled at the
Midwest Christian University. As of fall 2010, the Midwest Christian University
consisted of approximately 3,500 undergraduate students. Of these students, the freshman
class had nearly 750 students (“Education”, 2013). The Midwest Christian University is
described as:
The Midwest Christian University is a private, Christian, liberal arts university
that provides approximately 100 fields of study consisting of four schools and one
college. The School of Graduate and Continuing Studies offers a variety of
master's degrees in such fields as business, counseling, education, nursing,
ministry, as well as nontraditional adult degree completion programs and a Doctor
of Education degree. The Midwest Christian University believes in faith as an
integral part of education and has a nearly 100-year-old foundation dedicated to
Christian education (Olivet Nazarene University, 2012).
24
In an attempt to survey as many incoming freshman students as possible, a
purposive sample of freshman students from the Midwest Christian University was
surveyed during the freshman orientation held on August 27, 2012. It was anticipated that
if students are surveyed prior to the start of classes during new student orientation that
they will have a better recollection of why they chose to enroll at the particular private
university over other schools. This purposive sample will include both traditional and
non-traditional students across all subject majors. Data collection will be done in
cooperation with the admissions team from the Midwest Christian University.
Prior to the study, written permission was obtained from the Administration at the
Midwest Christian University to conduct research in their institution. Through an
informed consent form, participants were given a brief description of the study, and were
asked to voluntarily participate. To assure anonymity, students were not required to state
their names on the survey. Participants were not subjected to any physical harm and it
was anticipated that there was no mental harm associated with the study. Participants
were informed that they had the right to withdraw from the study at any time.
To begin the study, a cover letter was provided to the Midwest Christian
University employee in charge of making announcements at the orientation and a specific
introduction was read to all freshman students. University employees present at the
orientation passed out consent forms to each student and allow five minutes for
completion. University employees collected the consent forms and place them specific
labeled in envelopes. Next, surveys were passed out to the students. The participants were
given 10 minutes to complete the survey. Upon completion, students turned in their
surveys to the university employees. The university employees placed the completed

25
surveys in other specific labeled additional envelopes. Following the completion of
surveys, the researcher collected the envelopes containing the consent forms and the
completed surveys. The survey results were tabulated to determine the factors that
freshman students say contributed to their choice of which university to attend.
The survey has been adapted from Donnellan’s (2002) work, with the author’s
permission. The questionnaire included several four/five-point Likert scales, ranking
scales, and multiple-choice questions relating factors that led to their decision to attend a
particular Midwest Christian University. The data collected is a snapshot of the current
beliefs in the sample populations at a given time.
The adaptations to Donnellan’s (2002) survey are subtle, but essential to achieve
the results that are necessary to answer the research questions that pertain to college-
choice factors at private universities. It should be noted that Donnellan’s survey was
written for students at the University of Massachusetts (UMass). The modifications to
Donellan’s survey included:
Question one has been eliminated, which consisted of a five-point Likert scale
that asked “How influential were the following factors in your decision to attend
UMass?” The options for participants to circle included: TV ads featuring former
UMass graduates Rick Pitino and Jack Welch, Radio ads featuring former UMass
graduates Rick Pitino and Jack Welch, and TV news coverage about positive
things happening at UMass. This question does not pertain to the study at hand,
which consisted of students at private universities, as UMass has several
university advertisements specifically focused at two particular alumni.
26
Questions two and three have been changed from 5-point Likert scales to 4-point
Likert scales. Questions two and three related to how influential certain
people/factors were in one’s decision to attend a university. The choices included:
1. Not influential, 2. Somewhat Influential, 3. Moderately influential, 4. Very
influential, and 5. Not applicable. Converting these questions into 4-point Likert
reduces confusion in a not applicable answer and provides a weighted score in the
statistics.
A response to question three has been changed. Question three asked “How
influential were each of the following factors in your decision to attend UMass?”
An option for the participant to circle was changed from “UMass viewbook” to
“The MCU Facebook page”. With the growth of Facebook over the last few
years, this option is more relevant as a possible influence to college-choice than a
viewbook, therefore the information obtained from this option is more valued.
A response to question six has been inversely changed. Question six asked
“Please circle the rating that best reflects your agreement with the following
statements:”. The response that was changed stated “Academic preparation at
UMass is as good as prestigious private institutions”. This question has been
changed to “Academic preparation at MCU is as good as prestigious public
institutions”. UMass is a public school asking students feelings about private
schools, to ask this question inversely keeps the overall meaning of this response
intact.
In question seven, a UMass viewbook reference has been changed to MCU
Facebook page.
27
Question eight asked several questions to determine the demographics of the
students taking the survey. Within question eight, question two stated “My
present age is ___”. This question has been replaced with: “I categorize myself as
a:” a) Freshman (new student), b) Transfer student (previous time spent at another
college or university). Incoming transfer students are expected to be present
during the orientation. For this study, the focus is on differentiating college-
choice factors between freshman and transfer students rather than determining the
age of all the participants.
A question about religion status has also been added to the demographic area of
the survey. It is important to determine if the religion of the participants plays a
factor in their college-choice, especially in the case of a religious private
university. When determining what a private university can do to increase
enrollment, this is a factor that cannot be overlooked by a private university.
Upon completion of the surveys, the results were tabulated and evaluated through
a descriptive analysis to determine what factors influenced the enrollment decision of
students currently enrolled at a private university (Question one). A series of tables were
used to provide a summary of the data. Means and standard deviations were computed for
rankings of institutionally controlled influencers on college choice, the college-choice
influencers uncontrollable by the institution, and the institutional attributes (Donnellan,
2002).
Analyses of variance (ANOVAs) were conducted comparing demographic data
with the descriptive analysis to determine what demographic factors were present in the
enrollment decision of students (Question two). Demographic data consisted of gender,
28
race, location, previous educational experience, and religion. The demographic data was
evaluated to determine the impact demographic characteristics have on college-choice
factors.
Analyses of variance (ANOVAs) were conducted comparing demographic data
with institutionally controlled influencers and influencers not controlled by the institution
(Question three) (Donnellan, 2002). Institutionally controlled influencers consist of
university web sites and various recruitment materials. Bivariate correlations were
conducted to compare the rankings and ratings of institutionally controlled influencers,
influencers not controlled by the institution, and various demographic data (Donnellan).
The results of the study represented the factors that influenced undergraduate
students to enroll at a Midwest Christian University and fulfill a void in the research of
college-choice factors in private universities. The research findings will be able to be
applied to other private universities around the country. The results of the research should
enhance marketing strategies at private universities to increase undergraduate enrollment.
Summary
This chapter included an introduction to the study and research topic. The chapter
included a statement of the problem, a brief background, research questions, description
of terms, significance of the study, and process to accomplish. The next chapter will
provide a more in-depth review of the relevant research, the factors that influenced
undergraduate students to enroll in private four-year universities, and the other areas that
influenced the college-choice decision of freshman students.

29
CHAPTER II
REVIEW OF LITERATURE
Introduction
This chapter provides a review of literature as it relates to prospective students’
college-choice decision. The review is separated into three sections that directly correlate
to the research questions. The first section includes studies that primarily focus on student
demographics as they relate to college-choice factors. The second section discusses
institutional marketing factors and their effect on recruiting potential students. The third
section describes research on institutional non-marketing factors, which are
uncontrollable by an institution. Although most of the studies focus on one topical area,
some of the studies cross multiple sections (Donnellan, 2002). While the purpose of this
research is to determine the college-choice factors of students in a private university, it is
imperative to identify the various influences that contribute to a prospective students’
college-choice decision, regardless the institutional level. Understanding the previous
research conducted in these areas is important in fully comprehending college-choice
factors as they relate to a private university, as many of these findings have common
characteristics. This chapter will conclude with a summary of how these sections relate to
the research at hand.
30
Demographics
Comparing demographic data with the college-choice decision is an important
step in determining which demographic factors may have an impact on the enrollment
decision of potential students. Demographics is referred to as describing a population
according to selected characteristics age, gender, ethnicity, and occupation. The United
States continues to change its racial and ethnic population. Approximately one-third of
United States’ residents belong to the following racial or ethnic groups: African
American, Asian American, Native American or Alaskan American, or Native Hawaiian
or Pacific Islander. To adapt to this new marketplace, many businesses are developing
multicultural marketing programs that reflect unique attitudes, communication
preferences, and lifestyles of different races and ethnic groups. Knowing a student’s
previous educational experience or race could identify trends and provide insight into
their college-choice decision-making process that could be useful for colleges and
universities to develop multi-cultural marketing plans, marketing programs that reflect
unique aspects of various races, to increase enrollment (Kerin, Hartley, & Rudelius,
2013).
This section provides a review of research that had a primary focus of describing
demographic information while evaluating the college-choice decision-making process.
While marketing and non-marketing factors are present in this research, the key element
of these studies involves the findings of various demographic factors present in each
study. Demographic data evaluated in this section consists of gender, race, location,
previous educational experience, and religion. In reviewing research related to
demographics, the literature can be broken down into three sections that focus on high
31
school students, undergraduate students, and the admissions staff. Each one of these
groups, domestic or international, plays a role in providing a background of literature of
the college-choice decision-making process of prospective students. The studies
described in the following section have an emphasis on demographics and its effect on
the college-choice decision.
High School
Smith (2006) administered a survey to approximately 1,700 Western New York
high school students to study their college selection process. Smith analyzed how
students’ perceptions of different college search resources varied according to their racial
background, parents’ educational backgrounds, academic ability, academic aspiration,
and geographic focus of their college searches. Smith revealed that academic ability,
academic aspiration, and parental education had no effect on how students rated the
usefulness of any college selection resources during the search and choice phases of the
college selection process. Students rated college websites as the most useful source
during the college search stage. In addition, students perceived campus tours as the most
useful search resource during the choice phase. Smith found that race, parents’
educational backgrounds, academic ability, and academic inspiration do not affect the
way Western New York high school students search for colleges to enroll. This research
may reinforce the study at hand; however, it is worth exploring the demographics of
freshmen at a Midwest Christian University given the variance in backgrounds.
In a related study, Mozie-Ross (2011) conducted a quantitative study that
determined how high school graduates who identified teachers as influential in their
choice of college differed from graduates who did not, in terms of demographic and
32
academic characteristics and college-choice outcomes. Data was drawn from 17,734 high
school graduates, from 41 public and private four-year institutions, from their responses
to the 2006 Admitted Student Questionnaire, a market research tool developed by the
College Board that was administered by the participating institutions to admitted
students. Mozie-Ross’ results indicated that high school teachers were most influential to
students who were non-White, had lower grades and test scores, and came from lower
income backgrounds. In terms of college-choice outcomes, Mozie-Ross found that
teachers were most influential among students who attend institutions in their home state,
attended less competitive schools, and attended institutions where the perceived emphasis
was on quality of students' academic experience, including opportunities for student
involvement outside of the classroom. No differences were found among gender or type
of high school or college attended.
Tan (2009) conducted an international study where the researcher examined the
applicability of major United States college-choice factors to 226 high school seniors in
the Philippines. After an extensive review of literature, the researcher determined that
that the following categories were the main contributors to college-choice decisions of
students in the United States: student characteristics, institutional characteristics,
significant others, and institutional marketing. Tan’s results indicated that all of the major
U.S. college-choice factors were important, to some degree, to high school seniors in the
Philippines. Also, academic ability and demographics attributes were found to have
contributed similarly to the college-choice decision in the Philippines as compared to the
United States, while the educational level of parents did not appear to apply to college-
choice factors of Philippine students. While international students are not the focus of the
33
study conducted at the Midwest Christian University, it is important to note that
influences that affect college-choice decisions are similar throughout the world. With the
proper recruiting practices in place, these strategies can be applied to most universities.
Undergraduate
While the previous study focused on prospective college students in Asia, Kim
and Gasman (2011) conducted in-depth interviews with 14 Asian American first-year
college students at an elite private Northeastern U.S. university to determine the factors
that affected their college-choice process. The structured interviews typically lasted 1-2
hours and were recorded and transcribed for evaluation. The interview questions focused
on students' high school experiences, how the students made decisions about their college
opportunities, educational level of parents, and how expectations may have influenced
their decision-making processes. Kim and Gasman’s results showed that the participants
considered their social networks, especially family and peers, to be the most important
factor in the decision making process about where to apply and attend college. In
addition, external sources of information provided by various media outlets were found to
have played a lesser role in the students’ college-choice process. The study conducted at
the Midwest Christian University can provide direct supplemental information related to
Kim and Gasman’s study involving Asian American students. The survey used at the
Midwest Christian University asks students to classify themselves by race, including
Asian, and asks students how influential their parents and peers were in their college-
choice decision-making process.
In an effort to explore the demographic differences in high achieving students,
Brooks (2006) sought to determine if a model existed that significantly increased a
34
researcher's ability to explain the enrollment status of high-achieving freshmen based on
the influence of selected academic and demographic characteristics. The population
consisted of all high-achieving freshmen, ACT ≥ 28 and academic GPA ≥ 3.0, who were
admitted to a particular research-extensive university in the Southern region of the United
States in 2005. Independent variables were collected from the admissions and student aid
databases and included the student’s residency status, college entrance examination score
(ACT), gender, offer of admission to Honors College, academic high school GPA, as
well as several other variables. Through a discriminant analysis, Brooks identified a
statistically significant model that increased the ability to accurately explain the
enrollment status of high-achieving freshmen. The model correctly classified 65% of the
subjects, which was 30% improvement over chance. The variable that had the most
impact on enrollment was whether the student’s parent graduated from the institution.
While the study at the Midwest Christian University will not state which university the
student’s parents graduated from, the research will show how influential the parents were
in the student’s decision-making process. With findings of a strong influence from the
students’ parents, the study could further confirm Brooks’ results.
In other research related to above average performing students, Dale (2010)
conducted a case study to examine the college-choice process of high-achieving freshman
students at Arizona State University. The researcher obtained information by conducting
12 interviews, four focus groups with 3-5 students each, and reviewing the pre-
enrollment recruitment files on all of the participating honor-students. Dale’s results
showed that the people who influenced the students’ decision to attend Arizona State
University were their parents, peers, other family members, college representatives, and
35
high school teachers and counselors. The factors that influenced the participants’ college-
choice decision were location, opportunities, programs, The Honors College, social
aspect/fit, and the campus visit. Dale’s results also indicated that the participants
ultimately made their decision by settling for comfortable alternatives due to time and
resource limitations based on location/experience, programs/plans, familiarity with
Arizona State University, and Arizona State University as a springboard to future
opportunities.
Admissions
Due to the challenges of affirmative action in higher education admissions, Burns-
Wallace (2009) conducted a qualitative study that examined the experiences of 24 senior
undergraduate admission diversity officers in relation to legal, institutional, and personal
conditions that affect their success. Semi-structured interviews were conducted with each
of the admission officers at three different types of selective institutions: Elite Research,
Small Liberal Arts, and Public Flagship. During the analysis, six categories were
identified that captured the essence of the participants' shared experiences, which
included 1. Motivation, Identity, and Survival; 2. Realities and Legalities; 3. Context,
Value, and Race; 4. Philosophies and Partnerships for Success; 5. the Students and
Beyond; and (6) Unmet Needs. Burns-Wallace’s primary finding was that most senior
admission diversity officers felt a responsibility to give back to students with similar
personal paths, whether the students were minority, low-income, or first-generation
college-goers. The admission officers were found to have closely identified themselves
with the students they recruited and felt a need to stretch on allowing admission into the
institution, making college more possible for various minority populations. Do all
36
universities make exceptions to admission requirements to obtain diversity in the student
population? The survey distributed at the Midwest Christian University asked freshman
students to provide their race as well as categorize their high school grade point average.
While many factors are considered when admitting potential students into a university,
grade point average is an important factor. Within the study at the Midwest Christian
University, grade point average will be measured between all races to identify any trends.
Marketing Factors
The marketing factors discussed in this section focus on controllable elements of
higher educational institutions’ marketing strategy that are used to help recruit potential
students. Institutions can enhance these controllable marketing factors without much
difficulty to attract prospective students, such as making changes to course catalogs,
improving availability of open houses, and enhancing Facebook pages and Websites.
Many of these marketing factors directly affect the college-choice decision of potential
students and are controlled by the institution (Donnellan, 2002). Marketing is referred to
as the activity for creating offerings that benefit the organization, its stakeholders, and
society. Marketing involves far more than simply advertising or selling. In serving both
buyers and sellers, marketing looks to discover the needs and wants of prospective
customers, and to satisfy them. Institutions and organizations use controllable factors
such as the marketing mix, or the four P’s: product, price, place, promotion, to manage
various elements of the customer value proposition (Kerin, et al., 2013).
This section provided a review of studies that were found to have an emphasis on
controllable marketing factors within universities. Institutions reviewed in this section
have the ability to enhance their marketing plans to appeal to potential students. The

37
marketing factors discussed in this section involve doable changes to institutional
marketing plans to increase enrollment, such as changing the verbiage within a campus
tour or increased follow-up efforts on applicants. In reviewing the literature related to
marketing factors, the studies have been condensed into three sections that focus on
prospective students, undergraduate students, and the admission/recruiting staff. The
research described in the following section has an emphasis on controllable marketing
factors and their effect on the college-choice decision.
Prospective
In a study involving a cost-effective recruitment strategy, Damron (2011)
evaluated the impact of sharing academic success stories during campus tours on
prospective students’ perceptions of academic quality, speed of the application process,
and matriculation status. Campus tour guides provided 156 prospective students with
controlled and experimental tours; the experimental tours included sharing academic
success stories. Surveys were then administered to the participants after the tour to assess
student perceptions. Damron concluded that the sharing of academic success stories on
campus tours did not have an impact on student’s perceptions of academic quality, speed
of the application process, and matriculation status. Students participating in the study at
the Midwest Christian University will be asked to rate how influential a campus visit was
during their college-choice process. Scores in this section can be evaluated to determine
if any changes need to be made to the campus tour process.
In a related study, Morris (2009) evaluated time intervals between various
prospective student interactions with a university during the admissions process to
determine if these time intervals were useful in predicting enrollment. The sample
38
consisted of 4,098 applicants, of a possible population of 12,450 prospective students,
who applied for undergraduate admissions at a medium-sized, sectarian university
located in Southeast Virginia between January 1, 2005, and December 31, 2007. The time
related variables Morris used in the study were the inquiry date, application date,
submission of transcripts date, submission of writing assessment date, and the number of
days between students’ initiated contacts with the university. Morris’ results confirmed
that the time related variables were all significant in predicting enrollment. The variables
with the strongest predictive capabilities were both the number of days between the
students’ initial date of inquiry and date of application, and the number of days between
the date of application and the dates of various submissions of supplemental application
requirements. Essentially, as the number of days between student inquiry, submission of
application, and submission of various supplemental writing assessments decreased, the
likelihood of enrollment increased. College-choice was found to be more predictable
when the days between of the various contact points were minimal.
Undergraduate
Howard (2002) sought to find whether institutional rankings published by news
magazines played a role in the college decision-making process of potential students.
Surveys were distributed to 14,541 freshman students from 40 public and private ranked
and unranked institutions across 13 states. Howard’s results showed that the majority
(56.7%) of the students indicated that college rankings were either very important or
somewhat important in selecting their college or university. Students attending ranked
universities or colleges also deemed institutional rankings by news magazines
significantly more important in their college-choice process than students attending

39
unranked institutions. The study conducted at the Midwest Christian University will
further explore if the perceptions of others contribute to the college-choice decision-
making process. While institutional rankings are not directly measured in the study at the
Midwest Christian University, the survey asks students to rate their feelings related to
news coverage and perceived impressions of outsiders’ views of the university.
In researching the students’ views of universities marketing efforts, Dupaul
(2010) studied the ways in which stealth applicants searched for prospective colleges to
attend. In 2010, stealth applicants represented approximately 30% of college applications
(Noel-Levitz, 2010b). Dupaul’s qualitative case study included interviews with students
who were stealth applicants at a private, mid-sized university located in the southwest
United States. Dupaul found that stealth applicants used traditional search methods in
their college search. However, these students displayed high levels of skepticism and
mistrust of university marketing materials as well as stress and fear about college.
Technology was also found to facilitate stealth applicant’s anonymous search for
information about universities.
Armstrong (1997) conducted 10 focus groups involving randomly chosen
freshman students at the University of North Texas, a large metropolitan research
university located 30 minutes north of Dallas, to determine the factors that influenced
them to enroll into the University. Armstrong found that the factors that most influenced
freshman students to attend the University of North Texas were convenient location, low
cost, and the good reputation of the field of their study. Students were also found to
believe that the University had a very friendly campus and were pleased with the overall
academic environment. Finally, Armstrong found the participants were not greatly
40
influenced by the marketing materials used by the University to recruit students, such as a
university booklet, brochure, and videotape. Students provided feedback on how to
strengthen the marketing material including making the material more graphically
appealing and involving more easy-to-read information regarding the cost to attend the
University of North Texas.
On a related note, students surveyed at the Midwest Christian University were
asked to rate/rank the effectiveness of various university marketing materials and to what
extent price affected their college-choice decision. While students will not be asked to
provide feedback on how to improve marketing efforts, results will show how influential
certain marketing efforts are to freshman students. Results can be used to enhance
marketing efforts in areas that were rated as ineffective.
Anderson’s (2010) quantitative research study focused on freshman students’
decision-making processes among those who chose to major in business at a small
Midwest private college. Anderson described that, of the freshman students who were
surveyed, their major choice factors for attending the Midwest private college include:
getting a better job, making more money, and obtaining training for a specific career. In
addition, four variables that students used in their decision-making process include:
college’s good reputation, the offer of financial assistance, the belief that graduates get
good jobs, and a positive campus visit. Within the research, Anderson described the
challenges of college recruiting, which include: decreasing number of high school
graduates, more educational offerings, a tightening of the credit markets, and changing
college expectations of the millennial generation. These recruiting challenges are
common in colleges and universities across the country.
41
Tucciarone (2007) conducted three focus groups, involving 69 students enrolled
in advertising courses at a public four-year institution in St. Louis, Missouri, to determine
how advertising affects the college-choice process. In the end, the researcher found that
parents, siblings, friends, career aspirations, cost, scholarships, institutional reputation,
location, sports, high school counselors, and college visits played a larger role in the
college-choice process than advertising. Despite the numerous influencers that affected
college-choice, only the athletes and international students acknowledged the role of
advertising as a college-choice factor. Participants in the study rated the following
advertising strategies as the most influential in their college-choice process: college
recruiters, radio advertisements, billboards, campus visits, websites, and virtual tours.
Advertising may have triggered thoughts and attitudes, but overall, the participants
suggested that the college-choice process was largely based on word-of-mouth advice.
Tucciarone’s research showed that advertising initiatives by universities have the ability
to persuade prospective students if the university has conducted the research necessary to
understand and assess students' wants and needs. Influencers such as parents, siblings,
friends, and cost are considered more persuasive than advertising in the college-choice
process. However, if students express specific wants and needs, such as athletes or
international students identified by the university, then advertising has a greater effect on
search and college-choice. Therefore, universities that identify a key consumer insight
can develop specific advertising that can trigger specific outcomes (Tellis, 2004).
Cheong (2010) studied the relationship between psychological attributes and the
liking and use of interactive Website features. Cheong interviewed prospective and
freshman college students who were willing members of a fan page associated with
42
Rochester Institute of Technology, a higher education institution in Rochester, NY with
more than 16,000 students. Cheong’s results showed that price consciousness was related
to liking of Frequently Asked Questions and blogs and the use of tuition cost estimators.
The researcher also found that students who were active users of a social media Website,
Facebook, did not differ significantly in their use and liking of interactive features on
Websites of institutes of higher education than from students who were non-users of the
social media Website. While, Cheong took an in-depth look at the relationship between
participants’ use and liking of interactive features and their college-choice factors, the
study conducted at the Midwest Christian University will be an overview of the factors
that students’ consider influential in their college-choice process. Included in the research
at the Midwest Christian University are students’ rankings of the Midwest Christian
University’s Facebook page and Web page as influential. The research will determine if
there are any connections between student’s rankings of the Midwest Christian
University’s Facebook page and Web page with any other factors such as price or
demographics. If students are found to rate the Midwest Christian University’s Facebook
page and Web page as very influential in their college-choice process and the same
students also rate price as a very influential factor, potentially more could be done on
these sites in terms of clarifying pricing or financial aid options to attract prospective
students.
In a related study in evaluating social media as a recruitment tool, Parrot and
Tipton (2010) researched how prospective college students use social media in their
application process. The researchers conducted a national survey, through help of their
company Widmeyer Communications, of 500 freshman students at public and private
43
two- and four-year institutions, where students were asked about their college search
process over the previous year. In the end, Parrot and Tipton found that although it was
part of the information gathering process, social media constituted the least important
tool for obtaining information in advance of the application decision. The Web was found
to be the most integral part in the decision-making process and social networking could
be used as an extension of the digital strategy that an institution already has in place.
While students’ college-choice decision may not ultimately depend on the various social
media sites, these sites can enhance an institutions reach and frequency of a target market
that is exposed to a particular message at an inexpensive cost. Despite being a major
influence in the college-choice decision, it is worthwhile for universities to take
advantage of these methods of advertising.
Jenkins (2006) conducted a case study at Dallas Metropolitan College (DMC), a
small African-American liberal arts college in Texas, to uncover problems with
dwindling enrollment because of a shrinking amount minority applicants and competition
from other colleges. Jenkins’ study sought to establish the strengths and weaknesses of
the school’s prior recruitment campaigns and to identify the successful marketing
strategies utilized by the McDonald’s Corporation. Jenkins used three research methods,
which included a case study, historical analysis, and oral interviews, to make
recommendations for future recruitment at DMC. Jenkins’ research poses an innovative
spin on increasing enrollment by utilizing marketing practices from a successful
company. While most studies rely on uncovering marketing strategies at the college level,
Jenkins looked at what worked in corporate America and then applied it to the college
level. It may be useful to look at other corporate marketing strategies and try to apply
44
them to the college level. This research is useful in enhancing marketing efforts at
smaller colleges and universities as well as focusing on recruiting minorities. While
companies continue to build off each other’s marketing strategies, it may be useful for
institutions of higher learning to increase their research efforts in utilizing areas of their
competitors marketing strategies.
In researching the students and the admissions team, Furukawa (2011) studied
high-achieving student perceptions and the areas that may have influenced their choice of
college. Focus groups and interviews were conducted with freshman honor students at a
large, public, four-year public institution located in the Southwestern United States. Data
was also collected through interviews with admissions staff and a document analysis of
the university viewbook. Furukawa found that the students identified cost, institutional
characteristics, institutional communication, institutional fit, and family as the areas that
influenced their college-choice decision. The administration staff described their intent to
pursue target-marketing efforts toward high-achieving students, putting some emphasis
on outreach to parents.
In related research involving the admissions team and freshmen, Jennings (2008)
studied the perceptions of admissions staff and first-year students at four women’s
colleges to determine if there was a discrepancy between the two during the college-
choice process. Students and admissions members from Agnes Scott College, Mount
Holyoke College, Scripps College, and Stephens College participated in the study. Data
was collected by administering surveys to the admission staff and first-year students as
well as through a review of recruitment resources. The survey questions focused on the
perception of the features and benefits promoted by each college, recruitment resources
45
offered to applicants, and the external influences that played a role in the applicant’s
college-choice process. Jennings results found that the admissions staff and first-year
female students had very similar perceptions during the college-choice process. Both
groups indicated that resources involving in-person connections were very influential
during the recruitment process. Students and staff also agreed that academics and
scholarships were highly influential features and benefits of the colleges. In regards to
recruitment resources, both populations felt campus visits and feedback from current
students was very important. Both groups also felt that the external influence that played
the most prominent role was applicants' female caretakers. Finally, both groups agreed
that all of the printed and online content was less influential than the factors that focused
on personal interactions when determining choice of college. The main difference in
perceptions between the administrative staff and the students was that the staff tended to
be more positive than the students when asked to rank factors on a Likert scale.
Admissions/Recruiting
Vander Schee (2010) described how college enrollment officers have a positive
effect on admissions yield, first-year retention, and employee satisfaction at two small
colleges, four-year institutions consisting of less than 1,500 students, where the model of
relationship marketing and enrollment management theory were implemented.
Prospective college students frequently read in promotional literature that the college
experience is unique and personal to each individual. However, they often experience the
opposite. Small colleges can overcome this issue by utilizing a college enrollment officer,
who employs relationship marketing, seller expertise, and interaction frequency to meet
enrollment goals. Vander Schee’s research on enrollment officers provides detailed
46
information on the challenges colleges and admissions counselors experience in
recruiting new students. Vander Schee also described the positive impact enrollment
officers have on admissions yield. Participants in the study at the Midwest Christian
University will be asked whether they agree with the statement, “The recruitment
material that the Midwest Christian University uses to attract students portrays the
Midwest Christian University accurately”. It should be noted that if a unique and personal
college experience is an important college-choice factor, as found in Vander Schee’s
study, then enrollment officers should have a positive effect on the college-choice
decision of potential students and should be utilized at smaller universities to attract
potential students.
In reviewing literature related to the recruitment processes at the community
college-level Hart (2010) conducted case studies at three U.S. community colleges to
assess their enrollment management plans to determine what strategies have contributed
toward their enrollment growth. Data was collected by conducting various interviews and
focus groups with admissions, financial aid, and orientation staff, as well as college
faculty members. Enrollment management documents of the participating community
colleges were also reviewed. Hart found that these particular community colleges were
most successful at implementing enrollment strategies when there were high levels of
communication, collaboration, and institutional commitment to enrollment management.
Barriers to successful enrollment strategies included a lack of institutional commitment to
enrollment management as well as limited staffing, space, and financial resources.
The purpose of Harris’ (2010) study was to determine if characteristics existed
among enrollment management professionals (EMPs) that contribute to their influence to
47
increase enrollment of community college students. Harris’ significant findings included:
(a) EMPs with strong leadership skills were more effective in recruiting students; (b)
EMPs were actively involved in the college strategic planning process; and (c) strong
marketing, collaboration, and caring skills were found to have the strongest correlation
for EMPs and institutional effectiveness. Harris’ study provided a profile of enrollment
management professionals who are effective at managing and increasing enrollment.
Wright (2001) explored the marketing strategies used by two-year community
colleges in Western Pennsylvania. Surveys and follow-up interviews were conducted on
15 participants at five community colleges that were members of the Western
Pennsylvania Community College Resource Consortium. The respondents at each
community college included the President, the Director of Marketing or Public Relations
and the Director of Admissions. As a result of her research, Wright concluded the
following: 1. many inconsistencies reported within and among the colleges regarding the
marketing planning process; 2. inconsistencies in the marketing evaluation methods; 3.
underutilization of the information gathered from marketing research studies of the
community colleges; 4. plans to develop workforce training needs that were not
implemented; and 5. colleges should review the internal communication practices to
ensure that all staff who would be affected by the marketing planning process would have
a better understanding of why certain decisions are being made. Based on the findings
Wright believed, in an effort to attract potential students, that more time and effort should
be spent refining the college’s marketing plan, determine when the marketing plan should
be conducted, and identify who should be involved. Colleges should evaluate what
48
marketing activities are being used, and why they should or should not continue using to
enhance efforts to attract potential students.
Striegler (1991) investigated the roles of the admissions officers in marketing
higher education institutions. Leaders in the American Association of Collegiate
Registrars and Admissions Officers were asked to nominate people who they considered
to be experts in marketing in higher education. Fourteen individuals were then selected
and surveyed to determine their beliefs on the importance of marketing in higher
education by the year 2000. Striegler’s results indicated that by the year 2000, admissions
officers would be expected to have marketing backgrounds and work with top-level
administrators in developing the institution’s strategic goals. Marketing to prospective
students has become more popular than ever due to the increased competition from
traditional and for profit higher education institutions. Schools must now employ
marketing professionals to seek and battle for the enrollment of potential students.
In a later study, Clark (2000) provided a historical perspective of undergraduate
recruitment at Tennessee State University and addressed the impact that marketing has
had on enrollment. Clark utilized a historical method of research by reviewing minutes of
the Board of Regents, minutes from meetings of administrative committees, academic
affairs council and various committees of the University. Clark used published and
unpublished information to investigate events that impacted the growth and development
of the University's marketing strategies. In the end, Clark found that the following
recruitment practices were deemed effective and should be included in every institution’s
recruitment program: campus tours, informational brochures or view books, and high
school visits by college admissions representatives. Campus tours for interested students
49
ranked very highly in the recruitment of new students because prospective students were
found to have placed a great deal of emphasis on the opportunity to visit the campus and
gain insight into the character and culture of the institution. Informational brochures or
view books also ranked as one of the most important pieces in helping potential students
choose a college because prospective students were found to have been very interested in
obtaining such information and reviewing information about the institution, admission
requirements, and financial aid. Students were found to be especially interested in
brochures when they were bright and colorful. Finally, high school visits by admissions
representatives was also found to rank highly in recruiting high school students because
these students were found to have preferred the personal contact in the high school setting
as opposed to those contacts outside the school in the local community. This same
practice was found to be accurate for community college transfer students. While
fundamental marketing strategies of universities are similar, Clark’s research provides an
outline of what marketing strategies were shown to work over a ten-year period.
Having a fundamental marketing strategy is an invaluable part of recruiting
potential college students; however, these marketing plans must have support from
leadership to be successful. Hilpert (1985) surveyed presidents from 353 private
postsecondary institutions in 43 states and conducted interviews with 38 participants to
determine if presidential leadership perspectives had an effect on the enrollment success
or nonsuccess in private colleges and universities. Hilpert’s findings included: 1.
institutions with unsuccessful recent enrollment patterns used more resources than their
more successful counterparts to achieve adequate enrollments; 2. the effectiveness of
some marketing practices were significantly related to particular institutional
50
characteristics, while the effectiveness of other practices, including word-of-mouth
recruiting by alumni, were independent of institutional characteristics; 3. many
admissions activities commonly used by the institutions were not demonstrably effective
in enhancing the marketing efforts, including admissions personnel visits to high schools;
and 4. presidents were frequently uncertain about the causes of enrollment success. The
marketing practices discussed in the study include evaluating the effectiveness of current
marketing plans, maintaining flexibility, implementing the individuality of each
institution, affirming the president’s role, developing marketing professionals, and
evaluating the effects of adaptations. While the research conducted at the Midwest
Christian University will not require any input from the president of the university,
Hilpert’s results revealed that marketing to prospective students should be a strategic part
of institutional management.
As discussed in Hilpert’s (1985) study, inconsistencies in marketing strategies
within colleges and universities have been found to hinder marketing to potential
students. In a related study, Baron (1987) researched the types of recruitment strategies
used to recruit graduate schools to determine the effectiveness of these practices. Baron
distributed surveys to 366 members of the Council of Graduate Schools to determine
graduate student recruitment practices. The three recruiting strategies that were used most
often by graduate schools were: 1. providing financial assistance through scholarships or
grants; 2. developing and distributing a Graduate School publication describing the
School and the programs offered, and 3. developing and distributing promotional material
featuring specific programs, related research, and faculty and student achievements. The
four recruiting strategies that were found to be most effective were: 1. providing financial
51
assistance through scholarships or grants; 2. utilizing personal contact of the college staff
through phone calls and campus visits; 3. maintaining contact with colleagues at other
colleges to exchange referrals on prospective students; and 4. developing and distributing
promotional material featuring specific programs, related research, and faculty and
student achievements. Based on the results of the research, a model for graduate student
recruitment was developed to enhance the effectiveness of the recruitment efforts of
graduate students. The major steps in this model are assessment, develop recruitment
objectives, develop recruitment strategy, implement recruitment program, and monitor
and evaluate recruitment program. Baron found it was important to establish a supportive
relationship between the Graduate School and the academic departments for a successful
graduate student recruitment program.
In looking at religious factors that affect college-choice decisions, Liechty (2000)
conducted research at Goshen College, a small Mennonite liberal arts college, to study
the college’s relationship between its supporting denomination, the Mennonite church,
and the college’s denominational ties. Liechty surveyed and interviewed the faculty and
the administrative team at Goshen College regarding their attitudes toward the
relationship between the college and the denomination. According to previous research
on secularization of higher education institutions with religious ties, the consensus view
was that market pressures have forced religious colleges to disengage their
denominational ties, but this was not the case for Goshen College. Liechty’s results
indicated that the majority of administrators at Goshen College believed that parts of the
Mennonite church were secularizing, while educators at Goshen College were trying to
preserve the college’s religious tradition. The President of Goshen College worked

52
toward making the college more prestigious in order to appeal to a Mennonite market
increasingly interested in status, while at the same time seeking to make connections with
other religious markets that may be sympathetic to the mission of the college. Liechty’s
research described the marketing issues a private college goes through while attempting
to increase enrollment. For example, should a college market to a mass audience or stay
true to the college’s values to attract more students? Liechty also described the challenges
a university staff and president go through to market a college. The research at hand
involving the Midwest Christian University also has a known affiliation with specific
religion and faces similar challenges. While religion is not a focus in the study, students
surveyed will be asked to name the religion that closely resembles their religious beliefs.
It is worth exploring the relationship between religion and other college-choice factors at
the Midwest Christian University to determine if anything can be done to enhance
marketing efforts to specific religious groups of students.
Wuestenberg (2003) researched the admission policies for NCAA Division I-A
athletes. Eleven university admission directors from Division 1-A universities
participated in personal or phone interviews regarding their admission policies for student
athletes. Wuestenberg showed that recruited athletes received several benefits in the
admission process at NCAA Division I-A institutions. These benefits included a coded or
"marked" file, a preliminary review of documentation, sponsorship from the athletic
department, possible financial scholarships, support in the appeal process, and
occasionally, presidential involvement. Wuestenberg’s study indicated that admission
directors were aware of the benefits that NCAA Division I-A athletes received during the
admissions process. Student athletes with less than stellar academic performance had the
53
opportunity to attend and play for university’s they would otherwise not have the
opportunity to attend if it were not for their athletic ability, increasing their likelihood and
playing a factor in athletes’ decisions to attend such schools. Wuestenberg also described
the enrollment pressures that the admission directors face. While the college-choice
factors of athletes is not a focal point in the research conducted at the Midwest Christian
University, varsity sports as well as scholarships are components of the survey that
students have the opportunity to rate as influential factors to attend the Midwest Christian
University. Overall trends in students that rate varsity sports and scholarships very high
may merit additional investigation.
In a study that focused on recruiting minority students, Coiner (1990) sought to
find successful marketing strategies for the recruitment of Mexican-Americans into four-
year higher educational institutions. A survey was mailed to admissions directors of four-
year colleges and universities located in six southwestern states, including Arizona,
California, Colorado, Nevada, New Mexico, and Texas, to determine which programs
were found to be very successful and those which were to not be very successful in
recruiting Mexican-Americans. Coiner found that the most successful marketing
strategies to prospective Mexican-American students were: 1. on-campus programs and
activities, including support groups for Mexican-Americans, 2. off-campus programs and
activities, including career fair programs, 3. perceptions, including parent preference for
the institution close to home and current Mexican-American students promoting the
institution, and 4. reducing cost, including providing scholarships for Mexican-
Americans. The successful marketing strategies identified in this study may be used to
develop recruitment plans for Mexican-Americans at other four-year institutions.
54
Robison (2007) examined the experiences of international students recruited
through third-party agents to explore the ethical dimensions of institutions using these
outside agents. The researcher conducted interviews with recruiting officers and
international students, surveyed recruiting officers, and collected documents from a small
private four-year university and a small public four-year university located in one
Midwest state. Robison found that there was no conclusive answer to whether the
institutions examined were acting ethically by using outside agents third-party agents in
recruiting international students, however, suggestions were offered to assist in
preventing unethical behavior by outside agents. These suggestions included conducting
company profile research to establish criteria for selecting an agent, using a formal
contract developed by the university, meeting agents in person, making a concentrated
effort in communicating with potential students throughout the recruitment process; and
obtaining student feedback to evaluate the agent’s performance. In the survey distributed
at the Midwest Christian University, freshman students were asked whether they are from
in-state, out-of-state, or another country. While it is unknown if the Midwest Christian
University uses third party agents to recruit international students, these students will be
categorized to determine if any trends exist in their college-choice decision-making
process as compared to domestic students. Any outlying negative feedback from
international students may deem additional investigation.
Jivasantikarn (2003) studied the student enrollment recruiting practices of private
vocational institutions in Thailand to discover whether these schools used marketing
activities to enhance enrollment and to what extent they used them. A survey was
distributed to 367 admissions directors and officers at private vocational schools
55
throughout Thailand to assess the level of usage of 15 commonly used marketing
techniques, including advertising and target marketing. Jivasantikarn’s results showed
that the most used marketing technique was publicity, followed by target marketing. The
least used marketing technique was hiring a marketing director, followed by hiring a
marketing consultant. Schools of different sizes were found to use different levels of
advertising research and publicity to market their institutions. In the end, private
vocational institutions in Thailand used enrollment marketing, focused heavily on
promotion, to attract students and perceived it to be effective. The major marketing
activities that contributed to college-choice factors were various forms of advertising,
direct mail, and target marketing.
Finally, Hoover (2010) studied the post-admission recruitment process of college
students by universities. Hoover stated the importance of the yield, the ratio of the
number of students accepted by the college compared to the number of students enrolled,
and the yield’s effect on college ratings and rankings. According to Hoover, Lafayette
College used personalized recruitment processes. One example is that Lafayette College
used personalized admissions letters to refer to the prospective student’s high school and
subject of their application essay. Hoover’s study of Lafayette College’s post-admission
recruitment process also described the challenges of enrolling college students after they
were accepted. The research conducted at the Midwest Christian University will focus on
students that have been accepted and enrolled into the university. The personalized
recruitment effort measured in the study at the Midwest Christian University will be a
phone call from Admissions. If this personalized recruitment effort is found to be
significantly influential in students’ decision to attend the Midwest Christian University,

56
it may be worth exploring other ways to enhance the personalized recruitment efforts
within the University.
Non-Marketing Factors
While colleges and universities can control their marketing mix factors, there are
environmental forces, or uncontrollable social and economic forces, that affect the
decisions of potential students. These non-marketing factors consist of personal
influences relating to potential students’ college-choice decision, such as parents, friends,
alumni, current students, guidance councilors, current teachers and factors relating to cost
(Kerin, et al., 2013). These factors affect the college-choice decision of potential students
and are not directly controllable by an institution (Donnellan, 2002). While not directly
controlled by a college or university, it is important for institutions of higher learning to
understand these uncontrollable factors to determine what, if anything, can be done to
curb the opinions of potential students and their peers. In reviewing the research related
to non-marketing factors, the literature has been broken down into three sections that
focus on high school students, undergraduate students, and graduate students. The studies
in this section are related to non-marketing factors and their effect on the college-choice
decision.
High School
Streveler (1986) researched the extent to which South Dakota high school
students remain with their first choice of a post-secondary institution or their first career
choice between the end of their junior year and the end of their senior year. Five-
thousand two-hundred seventy-two high school juniors enrolled in a South Dakota high
school were surveyed in the spring of 1984 and then surveyed again as seniors in the
57
spring of 1985 to determine if the students had made changes in their institutional or
career choices. Students who had made a change in their first choice of an institution
were also asked to explain the reason for the change. Streveler’s results indicated that
65% of the students surveyed changed their selection of their first choice institution.
Streveler’s research also showed that students were more likely to change their selection
of a college or university to the same type of institution rather than changing to a
different type. Student interest in out-of-state institutions was relatively stable. Students
were also more likely to change their selection of a college or university over their
selection of a career. Finally, Streveler found that the students made their selection
changes mostly because of reasons related to institutional or program preferences, where
the originally selected institution did not match their current academic and career goals.
Students surveyed at the Midwest Christian University will be also be asked whether they
are from in-state or out-of-state and whether the selection to attend the Midwest Christian
University was their first choice. Students who express that the decision to attend the
Midwest Christian University was not their first institutional choice will be asked to
select a reason why they chose to attend the University in lieu of other institutions.
While Streveler’s (1986) study focused on traditional high school students, Henry
(2011) researched the college-choice process of Catholic homeschooled students by
interviewing 25 Catholic homeschooled students who applied to Benedictine College, a
small Liberal Arts college located in the Midwest. Henry’s results showed that the
primary college-choice influences included cost, location, academic programs, and
religion. Parents were also found to have played an important role in the college-choice
process for all of the participants, as well as family and friends. Finally, homeschooled
58
students were found to have gone through a college-choice process very similar to
traditionally-schooled students, however, participants often lacked guidance and support
from their peers and the colleges through the process. Many of the college-choice
influences discussed in Henry’s research are also components of the survey to be
distributed to students at the Midwest Christian University. While homeschooled versus
traditionally-schooled is not a component in the study to be conducted at the Midwest
Christian University, students will be asked to provide demographic information such as
what type of community they came from and high school grade point average. These
characteristics can then be broken down for evaluation of trends to improve target
marketing.
Briles (2009) surveyed 750 high school seniors from six New Jersey high schools,
three public and three Catholic, to determine which factors were most important to them
in their college selection process. Briles results indicated that availability of a major and
cost were the two most important college-choice factors for the high school seniors
surveyed. Other results showed that Catholic school males were found to be much less
concerned with taking out student loans as compared to Catholic school females or public
school students. Students surveyed were found to have valued the opinions of their
teachers more than their guidance counselors. In addition, students rated their parents as
the most important source of information in the college-choice decision process. Students
surveyed at the Midwest Christian University will be asked to rate the level of influence
guidance counselors and high school teachers had on their decision to attend that
particular university. This study could provide further support for Briles research.
59
In a similar study, Collins (2006) surveyed 1,533 graduating high school students
across the United States to determine why some students who were members of the
Church of Christ chose to attend a college or university affiliated with the Church of
Christ while others did not. The following college choice factors were examined between
the two groups: academic reputation, desired academic programs, cost, importance of
attending a Church of Christ higher educational institution, church involvement, family
influence, quality of facilities, reputation of graduates, and the importance of distance of
college from home. Collins results showed that the most significant difference among
students surveyed was that students who chose to attend a Church of Christ college or
university perceived the importance of attending a Church of Christ school. These
students also perceived Church of Christ colleges or universities to have better academic
quality, to offer more desired academic programs, and to be less expensive. These
students tended to be more involved in church activities, were more likely to have
immediate family members who had attended Church of Christ institutions, and were less
concerned about the distance of college from home. Religion also plays a role in the
survey to be distributed to students at the Midwest Christian University. Students will
also be asked to provide the religion that most closely resembles their beliefs. Various
religions can then be categorized to determine if religion plays a factor in the college-
choice decision-making process at the university.
Undergraduate
Schoenherr (2009) examined the differences in college-choice factors between
traditional high achieving freshman students who chose to attend higher-tiered
universities and traditional high achieving freshman students who chose to attend lower-
60
tiered universities. The researcher incorporated data gathered by the Higher Education
Research Institute (HERI) through the Cooperative Institutional Research Program
(CIRP) 2004 freshman survey. The sample included students from 97 universities who
scored in the 90th
percentile of the SATs and ACTs, lived 100 miles away from home,
and were attending their first choice college. Schoenherr’s results showed that the
availability of financial aid to be the most important factor in determining whether
students would attend a higher-tiered or lower-tiered university. Although university
expenses and academic reputation were found to be significant factors of the tier level of
university attended, they were of less important compared with the attention to financial
aid by high achieving students.
Irwin (2008) studied college freshman students’ perceptions of their own self-
efficiency, the confidence in one’s ability to be successful at a given task (Bandura,
1997), and the role it played in their college choice process. A mixed-methods approach
was used by surveying 278 first-year students from community colleges and four-year
universities, as well as conducting interviews with 30 students from the same sample.
Irwin found self-efficiency to be an influential part of the students’ college-choice
process, particularly in performance aspects of self-efficiency, such as high school GPA,
which mattered more to four-year university students than community college students.
Community college students’ college choices were found to be limited by their relatively
lower high school GPAs. Irwin’s results also indicated that community college students
conducted less extensive college searches compared to four-year university students.
In comparing two institutions, Kaczynski’s (2011) research explored how students
who followed a sibling to a university were influenced by their siblings during the
61
college-choice process. Semi-structured interviews were conducted with 12 participants
at two four-year universities in the United States. The participants were first-year college
students who had an older sibling that was currently enrolled at the university.
Kaczynski’s results showed that siblings played a role in the college choice process of the
students who followed their sibling to the same university. Participants were found to be
drawn to their siblings’ university because of their increased knowledge about the
university over other schools. In addition, the siblings’ experiences encouraged
participants to attend the university their sibling attended, regardless of whether the
experiences were positive or negative.
In a recent study, Ryan (2012) compared the college-choice factors that
influenced 84 freshman music majors from two public and two private universities
located in Illinois and Missouri. Data was collected by distributing surveys that focused
on the following areas: academic, financial, institutional, and personal/social, as well as a
follow-up interview. Ryan’s results showed that financial factors had the most influence
in these music majors’ choice to enroll in a specific university, followed by institutional,
academic, and personal/social attributes. Gender and GPA did not appear to have
influenced the decision of these students to enroll in a particular university. Findings at
the Midwest Christian University could further support this study on a larger scale. With
the exception of the follow-up interviews, the study at the Midwest Christian University
focuses on very similar college-choice areas and will be conducted with the entire
population of a freshman class, as opposed to a handful of students with the same major
from four different institutions. However, academic majors are not specified in the survey
to be distributed at the Midwest Christian University.
62
Stevenson (2011) conducted a qualitative study that investigated the college-
choice factors of students who chose to attend military junior colleges. Interviews were
conducted with 18 students enrolled in junior military colleges and their parents to
determine college-choice factors. Stevenson concluded that these students go through a
very similar search process as students from traditional colleges and consider factors such
as the school’s reputation, size and location. The students were found to have supportive
parents, influential peers, and concerns about paying for college. The students expressed
their desire to pay their way through college as they did not want to cause a financial
burden on their family. The parents also expressed concerns about how their child’s
education would be financed.
Abou-Nassif (2011) sought to identify and rate in order of importance the factors
that affected the college-choice decision of high school students entering college in
Lebanon. Surveys were distributed to approximately 720 students across six provinces
and twelve schools in Lebanon. Abou-Nassif’s results showed that the students ranked
the following college-choice factors from most to least important: parents, family,
income, cost of college, friends, residence location, and gender. The results of this study
involving the evaluation of college-choice factors of prospective students in Lebanon
supports results of previous research conducted in the United States.
Graduate
Kanyi’s (2009) mixed method research sought to understand why particular
students enrolled in Rowan University’s Doctor of Education in Ethical Leadership
program. The researcher conducted 30 telephone interviews and collected 172 surveys
from potential doctoral candidates as well as six interviews with current students. Data
63
was also collected using focus groups consisting of faculty, current students, and
potential students. Kanyi found that the prospective students chose to enroll in the
doctoral program because it was often a major goal in life and it broadened career
opportunities. K-12 Teachers were also found to be more likely than higher education
professionals to see the doctorate enhancing their career opportunities beyond their
current profession. Kanyi also concluded that prospective students believed the balance
of work and family life as well as logistical factors such as proximity, affordability,
availability of financial aid, admission requirements, program focus, and length were
important considerations in the enrollment process at Rowan University.
Summary
The literature reviewed in this section provided an overview of the research
conducted on the college-choice factors of prospective students. Various types of
institutions and research methods were included to provide a spectrum of influences
contributing to college-choice decisions on various levels. The review included research
that focused on demographics, institutional marketing, and non-marketing factors that
correlate with the research questions of the study. Understanding demographic data could
aid in identifying trends and provide insight into the college-choice process that could be
useful for institutions of higher education to develop multi-cultural marketing plans
(Kerin, et al., 2013). The review of the marketing factors provided an overview of the
current marketing strategies that were controllable by institutions and in place to attract
potential students. Finally, the review of studies involving non-marketing factors showed
that universities continue to face challenges in attracting students, as these studies
contained, for the most part, uncontrollable challenges in attracting potential students.
64
While the purpose of this research is to determine the college-choice factors of students
in a private university, it is necessary to identify the range of influences that contribute to
a prospective students’ college-choice decision, regardless the institutional level.
While universities cannot control all of the factors related to college-choice
decisions of potential students, it is important for institutions to understand these factors
to develop sound marketing plans in an effort to attract potential students. In reviewing
the literature, a few major themes occur throughout the literature. College-choice
influences seem to be consistent regardless of the institutional level or location. Gender
and race appear to play a less significant role than academic background in the college-
choice process. Finally, influence from parents and peers appear to play a significant role
in the college-choice decision-making process. Many of the findings in the previous
research appear to have common characteristics that help provide an understanding of
college-choice for a private university, and serve well as a foundation for this current
study.
The purpose of this study was to identify and analyze the factors that influence
undergraduate students to enroll at a Midwest Christian University as well as fill a void in
the research of college-choice factors in private universities. There is no research on
record that analyzes an entire population of incoming freshman students at a private
university by comparing the marketing and non-marketing factors of an institution
(Donnellan, 2002). This represents a significant gap in research. By identifying trends
related to various demographics and marketing and non-marketing factors, institutions
can develop and maintain successful marketing plans.
65
This chapter provided an in-depth review of various studies related to this
research. Chapter 3 will provide results related to the survey distributed to incoming
freshman students at a Midwest Christian University. The survey results will present
statistics on demographics, marketing factors, and non-marketing factors related to the
college-choice process.
66
CHAPTER III
METHODOLOGY
Introduction
The purpose of this study is to identify and analyze the factors that influence
undergraduate students to enroll at a Midwest Christian University as well as fill a void in
the research of college choice-factors in private universities. The research questions
illustrate and examine responses from freshman students entering a Midwest Christian
University. Understanding how freshman students perceive pre-enrollment interactions
with universities can be important in determining how marketing strategies can be
improved in the future. This section will discuss the research design, population, data
collection, analytical methods, and limitations of the research. In seeking to study the
college-choice factors that influenced undergraduate freshman students at a Midwest
Christian University, the researcher sought to find:
1. What factors most influenced the enrollment decision of freshman students
currently enrolled at a Midwest Christian University?
2. What impact do demographic characteristics have on college-choice factors at a
Midwest Christian University?
3. What is the impact of marketing versus non-marketing factors on the college-
choice decision of freshman students at a Midwest Christian University?
67
Research Design
A cross-sectional survey was completed by the participants prior to beginning
their first semester at a Midwest Christian University. The survey was conducted at a
single point in time and provided a snapshot of current attitudes and beliefs of incoming
freshman students (Gay, et al., 2009). The research questions focused on the college-
choice factors of freshman students. The quantitative data obtained from the survey was
analyzed to determine the college-choice factors that affected freshman students’ decision
to enroll in a particular university.
The survey was adapted from Donnellan’s (2002) work and was used with the
author’s permission. The questionnaire consisted of various structured items, including
several four/five-point Likert scales, ranking scales, and multiple-choice questions
relating factors that led to the participants’ decision to attend a particular Midwestern
Christian University (Gay, Mills, & Airaisian, 2009). The survey was divided into seven
sequentially numbered sections and each section included multiple sub-questions. The
data collected was a snapshot of the beliefs in the sample population at a given time
during the new-student orientation.
The first section asked the participants to rate the influence of various people on
their college-choice decision which was considered a non-controllable marketing factor
by the Midwestern Christian University. Previous research found the list of people
included in this section had an impact on college-choice decisions. The list of people
included:
Father
Mother
68
High-school guidance counselor
High-school teachers
Friends
Current University students
University Alumni
Participants were also given the option to add a person they may have considered
to be influential. Participants ranked the level of influence of each person using a four-
point Likert scale in which:
1 = not influential
2 = somewhat influential
3 = moderately influential
4 = very influential
In the second section, participants were asked to rate the level of influence of
college-choice factors that were considered to be controllable marketing factors by the
University. These factors incorporated a list of various student-recruitment tools that
universities often use to increase enrollment. The list recruitment tools included:
University Facebook page
University course catalog
Information about a major
Campus visit
Attending an open house
University Web page
Phone call from admissions
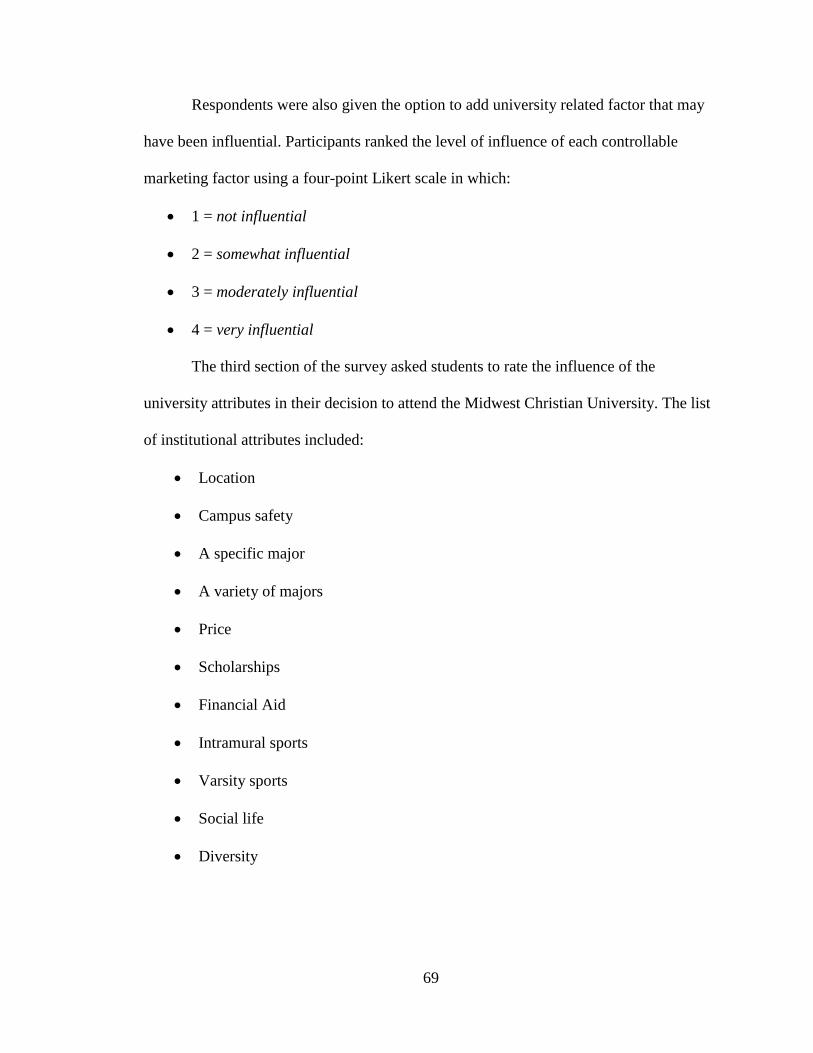
69
Respondents were also given the option to add university related factor that may
have been influential. Participants ranked the level of influence of each controllable
marketing factor using a four-point Likert scale in which:
1 = not influential
2 = somewhat influential
3 = moderately influential
4 = very influential
The third section of the survey asked students to rate the influence of the
university attributes in their decision to attend the Midwest Christian University. The list
of institutional attributes included:
Location
Campus safety
A specific major
A variety of majors
Price
Scholarships
Financial Aid
Intramural sports
Varsity sports
Social life
Diversity
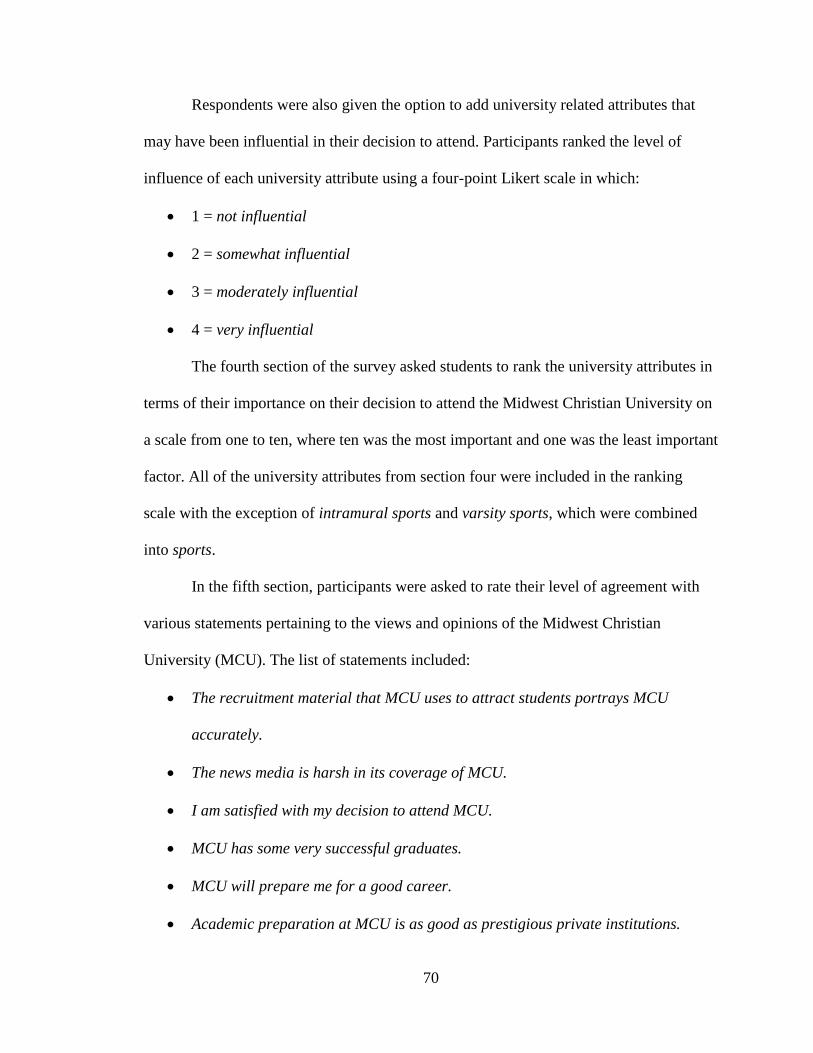
70
Respondents were also given the option to add university related attributes that
may have been influential in their decision to attend. Participants ranked the level of
influence of each university attribute using a four-point Likert scale in which:
1 = not influential
2 = somewhat influential
3 = moderately influential
4 = very influential
The fourth section of the survey asked students to rank the university attributes in
terms of their importance on their decision to attend the Midwest Christian University on
a scale from one to ten, where ten was the most important and one was the least important
factor. All of the university attributes from section four were included in the ranking
scale with the exception of intramural sports and varsity sports, which were combined
into sports.
In the fifth section, participants were asked to rate their level of agreement with
various statements pertaining to the views and opinions of the Midwest Christian
University (MCU). The list of statements included:
The recruitment material that MCU uses to attract students portrays MCU
accurately.
The news media is harsh in its coverage of MCU.
I am satisfied with my decision to attend MCU.
MCU has some very successful graduates.
MCU will prepare me for a good career.
Academic preparation at MCU is as good as prestigious private institutions.
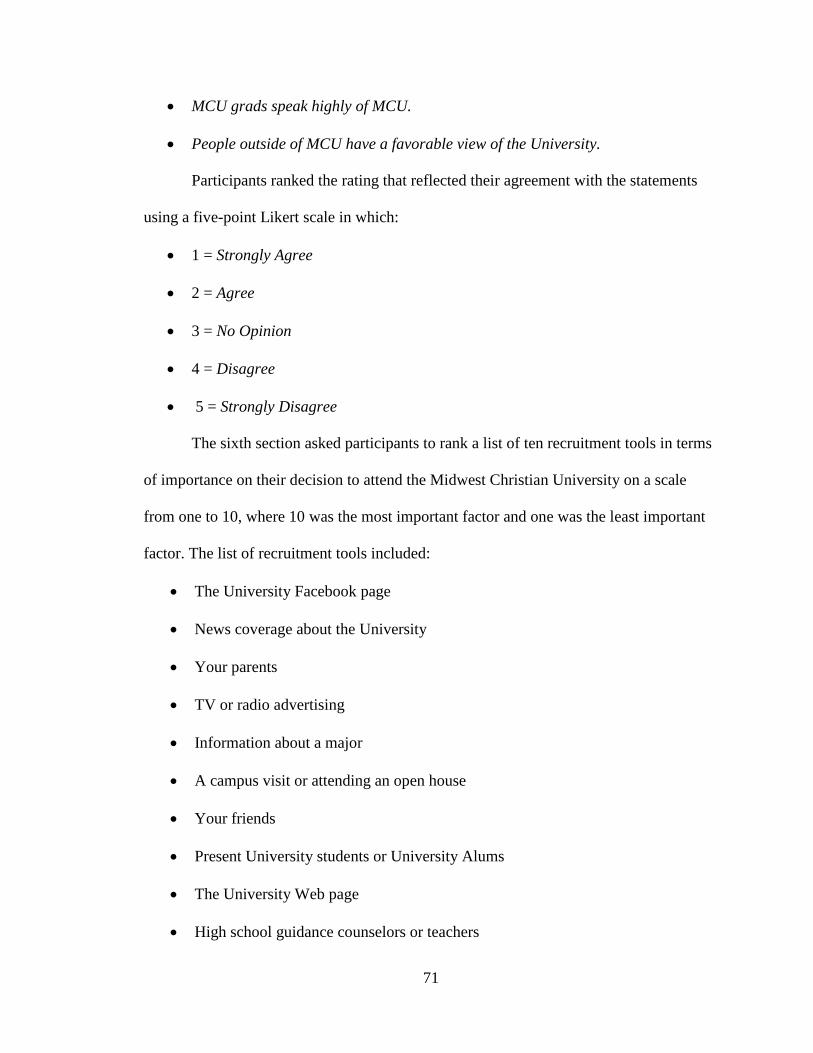
71
MCU grads speak highly of MCU.
People outside of MCU have a favorable view of the University.
Participants ranked the rating that reflected their agreement with the statements
using a five-point Likert scale in which:
1 = Strongly Agree
2 = Agree
3 = No Opinion
4 = Disagree
5 = Strongly Disagree
The sixth section asked participants to rank a list of ten recruitment tools in terms
of importance on their decision to attend the Midwest Christian University on a scale
from one to 10, where 10 was the most important factor and one was the least important
factor. The list of recruitment tools included:
The University Facebook page
News coverage about the University
Your parents
TV or radio advertising
Information about a major
A campus visit or attending an open house
Your friends
Present University students or University Alums
The University Web page
High school guidance counselors or teachers
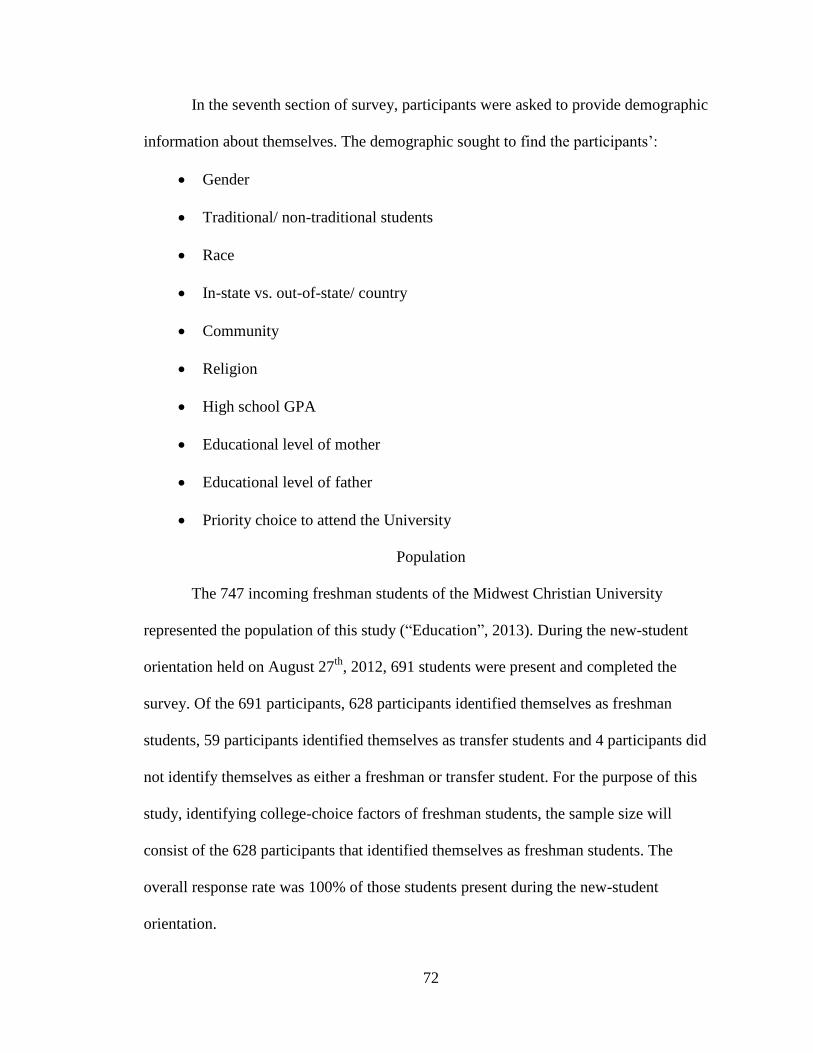
72
In the seventh section of survey, participants were asked to provide demographic
information about themselves. The demographic sought to find the participants’:
Gender
Traditional/ non-traditional students
Race
In-state vs. out-of-state/ country
Community
Religion
High school GPA
Educational level of mother
Educational level of father
Priority choice to attend the University
Population
The 747 incoming freshman students of the Midwest Christian University
represented the population of this study (“Education”, 2013). During the new-student
orientation held on August 27th
, 2012, 691 students were present and completed the
survey. Of the 691 participants, 628 participants identified themselves as freshman
students, 59 participants identified themselves as transfer students and 4 participants did
not identify themselves as either a freshman or transfer student. For the purpose of this
study, identifying college-choice factors of freshman students, the sample size will
consist of the 628 participants that identified themselves as freshman students. The
overall response rate was 100% of those students present during the new-student
orientation.
73
During the survey, the participants were asked to provide demographic
information about themselves. The demographics of the 628 participants, as described by
the participants, revealed the gender was 57.6% female and 42.4% male. Race consisted
of 85.2% white, 6.1% African American, 3.9% Latino, 1.3% Asian and 0.6% Native
American, 2.9% described as other. A location breakdown showed 57.1% from Illinois,
41.9% from out of state, and 1.0% from out of country. Communities in which the
students came from were 17.8% urban, 53.8% suburban, and 28.4% rural. Participants
classified their religious beliefs as 49.6% Protestant, 8.3% Catholic, 10.1% Unaffiliated,
and 31.9% other. A summary of the participants’ high school GPA included 0.6% less
than 2.0, 3.2% between 2.0-2.49, 11.4% between 2.5-2.99, 30.2% between 3.0-3.5, and
54.5% over 3.5. Respondents described the highest level of education attained by their
parents as 17.0% high school, 18.8% two-year college, 37.4% four year college, 26.8%
graduate school or beyond. Of the colleges to which the students applied, the Midwest
Christian University was the first choice for 67.2% of the students, second choice of
18.9%, third choice of 8.1%, and fourth choice of 5.8%.
Nearly every survey was fully completed by the participants. Duplicate and
unclear responses were omitted from the results. Questions from the participants
regarding the clarity of the survey were not answered during the completion of surveys.
Data Collection
In an attempt to survey as many incoming freshman students as possible, a
purposive sample of freshman students from the Midwest Christian University were
surveyed during the new-student orientation on August 27, 2012 (Gay et al., 2009). It was
anticipated that if students were surveyed prior to the start of classes during new student

74
orientation that they would have a better recollection of why they chose to enroll at the
particular university over other higher education institutions. This sample included both
traditional and non-traditional students across all subject majors. Data collection was
done in cooperation with the admissions team from the Midwest Christian University.
Obtaining Permission
Upon the review of research involving college-choice factors of incoming
freshman students, it was determined that a survey was needed to conduct the research at-
hand to capture the feedback of incoming students at a particular Midwest Christian
University. Donnellan’s (2002) survey sought to find similar answers to the research at
hand involving college-choice factors of freshman students. As a result, Donnellan was
contacted via email and he provided permission to use and adapt his survey as needed.
Setting-up
On the day of the new-student orientation, the researcher brought 800 consent
forms and 5-page surveys to the university auditorium, due to the estimated attendance as
described by the university administrative team. Prior to the orientation, the university
administrative team requested that consent forms and surveys be separated into piles of
30, as each university volunteer present during the orientation would be responsible for
the distribution and collection of the 30 consent forms and surveys.
The study was conducted at a pre-determined time during the middle of the
orientation. Following a break in the orientation, the researcher was notified that the
study would take place when the orientation resumed. Approximately 25 university
volunteers were each given 30 consent forms, 30 surveys, and two large manila
envelopes. Each volunteer was specifically instructed to distribute the consent forms first
75
and allow five minutes for completion. The volunteers then collected the completed
consent forms and placed them into a manila envelope. The volunteers then distributed
the surveys to the students that turned-in the consent forms and allowed 10 minutes for
completion. The volunteers then collected the surveys from the students and placed them
into the other manila envelope. Upon completion, the volunteers brought both envelopes
to the researcher just outside the auditorium along with any uncompleted consent forms
and surveys.
Distributing Surveys
After providing the university volunteers with the materials and instructions
necessary to conduct the study, an introduction letter was provided to the Midwest
Christian University employee in charge of making announcements at the orientation.
The introduction letter provided a brief overview of the study, informed students that the
study was voluntary, and provided the students with the directions for completing the
consent forms and surveys. The specific pre-written introduction was read to all new
students in-attendance at the orientation. University volunteers then distributed the
consent forms to the students and allowed five minutes for completion. The consent form
provided a brief description of the study and asked students to participate in a
questionnaire voluntarily. Participants were also informed that they had the right to
withdraw from the study at any time. University volunteers then collected the consent
forms and placed them into large manila envelopes.
Next, the university volunteers distributed the 5-page survey to the students. To
assure anonymity, students were not required to state their names on the survey. The
participants were given 10 minutes to complete the paper-pencil survey. Upon
76
completion, students remained stationed and turned-in their surveys to the nearby
university volunteers. The university volunteers then placed the completed surveys into
the additional manila envelopes. Following the completion of surveys, the researcher
collected and securely filed the envelopes containing the consent forms and the
completed surveys. The survey results were then tabulated to determine the factors that
freshman students identified as contributing toward their choice to attend a particular
Midwest Christian University.
Analytical Methods
Various analytical methods were used throughout the study to summarize the
results of the survey. The responses from the paper and pencil surveys were tabulated and
organized using a Microsoft Excel spreadsheet. Data was then transferred into a SPSS
spreadsheet to perform further analytics. Descriptive analyses were used to determine
which factors most influenced the enrollment decision of freshman students. Descriptive
analysis and analyses of variance (ANOVAs) were used to determine the impact
demographic characteristics had on college-choice factors. Descriptive analyses were also
used to compare the impact of marketing versus non-marketing factors on the college
choice decision of freshman students.
To answer research question number one, “What factors most influenced the
enrollment decision of freshman students currently enrolled at a Midwest Christian
University?”, descriptive analyses were used to determine the participants’ responses to
the surveys and discover the factors that most influenced the enrollment decision of
freshman students. The responses to each survey question, with the exception of question
seven, involving demographic information, were used to answer this research question.
77
The responses from each question were tabulated and organized using a Microsoft Excel
spreadsheet. The raw data was summarized using descriptive statistics, including mean
and modes, to determine the influential college-choice factors. The compiled data was
analyzed using bar graphs and frequency tables.
To answer research question number two, “What impact do demographic
characteristics have on college-choice factors at a Midwest Christian University?”,
descriptive analyses and analyses of variance (ANOVAs) were used to evaluate the
impact of demographic characteristics on college-choice factors. The responses to the
question seven, the demographic section, were applied to every question throughout the
survey. Means and standard deviations were computed for the ratings and rankings of the
controllable marketing influencers on college-choice, uncontrollable marketing
influencers on college-choice, and the university attributes. Data was analyzed using
frequency tables. Analyses of variance were then conducted to compare gender, race,
residence, community, and religion to the ratings and rankings of controllable marketing
influencers on college-choice, uncontrollable marketing influencers on college-choice,
and the university attributes. Frequency tables were used to analyze this data.
To answer research question number three, “What is the impact of marketing
versus non-marketing factors on the college-choice decision of freshman students at a
Midwest Christian University?”, descriptive analyses were used to determine the impact
of marketing versus non-marketing on the college-choice decision of freshman students.
The answers from survey question number one, “How influential were each of the
following people in your decision to attend the Midwest Christian University (mother,
father, etc.)?”, were compared to the answers from survey question number two, “How
78
influential were each of the following factors in your decision to attend the Midwest
Christian University (the university Facebook page, the university course catalog, etc)?”
Survey question number one was designed to identify the uncontrollable marketing
factors, while survey question number two was intended to identify the controllable
marketing factors. Each question was tabulated to determine the mean and modes of the
influential factors. Means and modes were then computed for the ratings of the
controllable marketing influencers on college-choice and uncontrollable marketing
influencers. Each section, controllable marketing factors and uncontrollable marketing
factors, was then tabulated and given an overall mean score to determine which section
had a greater impact on freshman students’ decision to attend a particular Midwest
Christian University. Frequency tables and bar charts were used to analyze this data.
Limitations
The primary limitation to this study was that it involved a single Midwestern
Christian University. Although the study used a large sample size of the incoming
freshman class, other universities could have been used to generalize the results. The
results of this study should not be generalized directly to all Christian universities
throughout the United States.
Another limitation was the diversity of the incoming freshman class at this
particular university. The sample consisted of predominately white students. The
university researched is a Christian University located in a predominately white
Midwestern suburb and therefore sampling does not reflect the diversity of students
found in universities across the country.
79
The final limitation of this study was that the surveys were distributed at a single
point in time prior to enrollment. While it was determined that distributing the surveys
during freshman orientation would be the most efficient way of capturing the largest
sample size and attaining students’ thoughts on college-choice factors prior to beginning
classes at the Midwest Christian University, other environmental factors could have
played a role in the students’ survey answers after enrollment, but prior to the freshman
orientation.
Summary
This chapter described the research design, population, data collection, analytical
methods, and limitations of the research. The study is guided by the research questions at
hand. The next chapter will provide a thorough description of the findings and
conclusions related to the factors that influenced undergraduate students to enroll in the
Midwest Christian University.

80
CHAPTER IV
FINDINGS AND CONCLUSIONS
Introduction
This study was conducted to aid the marketing strategies at private universities to
increase their enrollment. The focus of this research centered on student perceptions and
the degree in which they were influenced by various non-marketing and marketing
factors to attend a particular university. This chapter answers the following research
questions:
1. What factors most influenced the enrollment decision of freshman students
currently enrolled at a Midwest Christian University?
2. What impact do demographic characteristics have on college-choice factors at a
Midwest Christian University?
3. What is the impact of marketing versus non-marketing factors on the college-
choice decision of freshman students at a Midwest Christian University?
Quantitative data was collected from undergraduate students prior to beginning
their first semester at a Midwest Christian University through administering a survey.
The quantitative data obtained from the survey was analyzed to determine the college-
choice factors that affected freshman students’ decisions to enroll in a particular
university. This section presents the findings, conclusions, as well as implications and
recommendations of this research.
81
Findings
This section answers research question 1: What factors most influenced the enrollment
decision of freshman students currently enrolled at a Midwest Christian University?
Ratings for Factors that Influenced the College-Choice Decision
In questions one, two, and three of the survey, participants were asked to evaluate
the influence of various non-marketing, marketing, and institutional factors as they relate
to their decision to attend the Midwest Christian University. These survey questions
consisted of four-point Likert Scales; one was not influential, two was somewhat
influential, three was moderately influential and four was very influential. Descriptive
statistics were used to compute mean and standard deviation scores of each variable.
These findings are presented in Table 1.
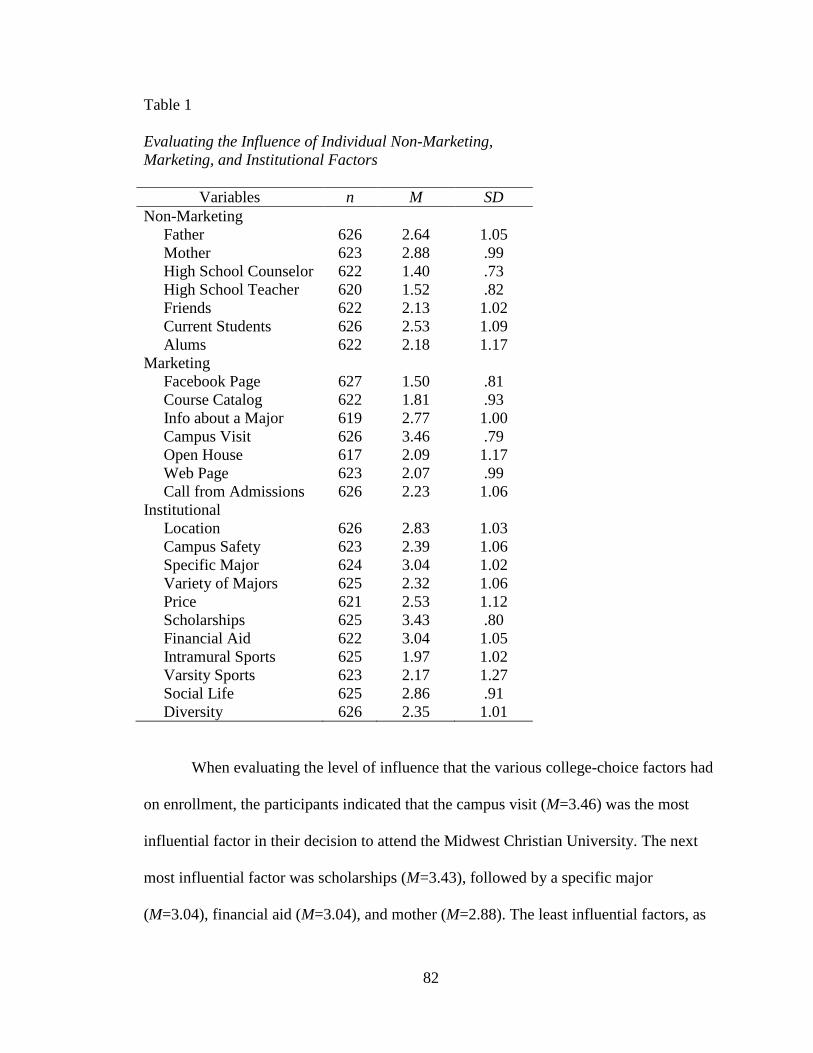
82
Table 1
Evaluating the Influence of Individual Non-Marketing,
Marketing, and Institutional Factors
Variables n M SD
Non-Marketing
Father 626 2.64 1.05
Mother 623 2.88 .99
High School Counselor 622 1.40 .73
High School Teacher 620 1.52 .82
Friends 622 2.13 1.02
Current Students 626 2.53 1.09
Alums 622 2.18 1.17
Marketing
Facebook Page 627 1.50 .81
Course Catalog 622 1.81 .93
Info about a Major 619 2.77 1.00
Campus Visit 626 3.46 .79
Open House 617 2.09 1.17
Web Page 623 2.07 .99
Call from Admissions 626 2.23 1.06
Institutional
Location 626 2.83 1.03
Campus Safety 623 2.39 1.06
Specific Major 624 3.04 1.02
Variety of Majors 625 2.32 1.06
Price 621 2.53 1.12
Scholarships 625 3.43 .80
Financial Aid 622 3.04 1.05
Intramural Sports 625 1.97 1.02
Varsity Sports 623 2.17 1.27
Social Life 625 2.86 .91
Diversity 626 2.35 1.01
When evaluating the level of influence that the various college-choice factors had
on enrollment, the participants indicated that the campus visit (M=3.46) was the most
influential factor in their decision to attend the Midwest Christian University. The next
most influential factor was scholarships (M=3.43), followed by a specific major
(M=3.04), financial aid (M=3.04), and mother (M=2.88). The least influential factors, as
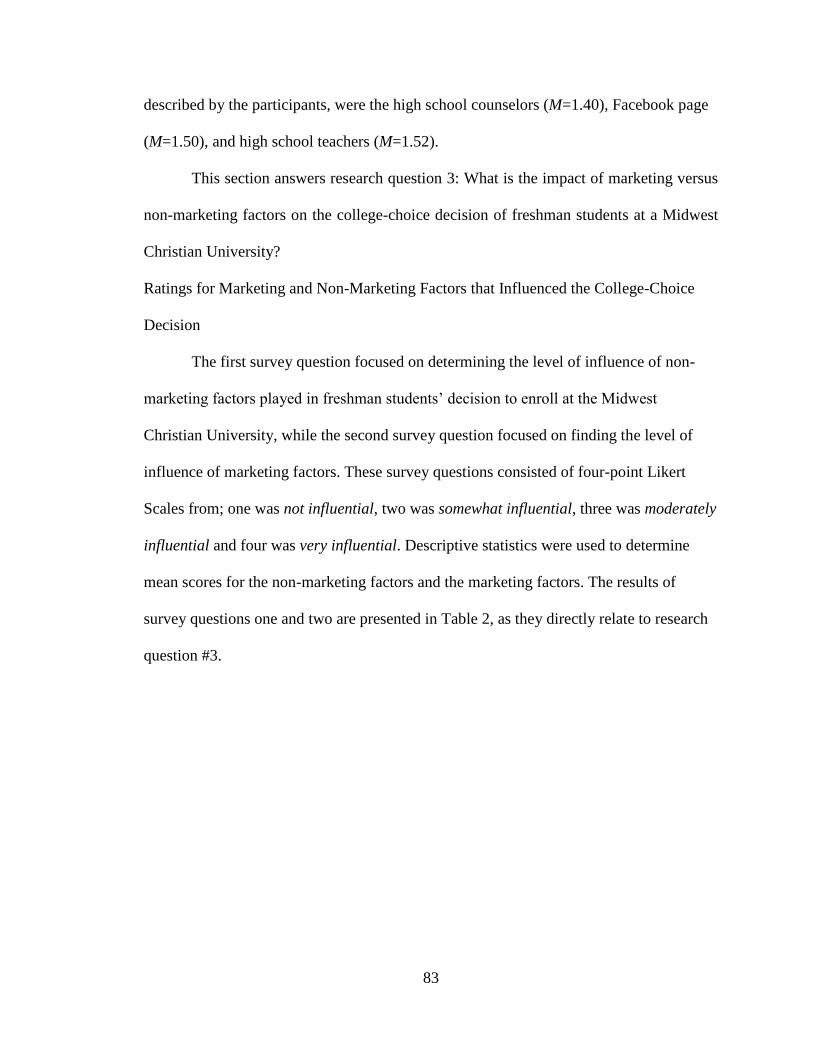
83
described by the participants, were the high school counselors (M=1.40), Facebook page
(M=1.50), and high school teachers (M=1.52).
This section answers research question 3: What is the impact of marketing versus
non-marketing factors on the college-choice decision of freshman students at a Midwest
Christian University?
Ratings for Marketing and Non-Marketing Factors that Influenced the College-Choice
Decision
The first survey question focused on determining the level of influence of non-
marketing factors played in freshman students’ decision to enroll at the Midwest
Christian University, while the second survey question focused on finding the level of
influence of marketing factors. These survey questions consisted of four-point Likert
Scales from; one was not influential, two was somewhat influential, three was moderately
influential and four was very influential. Descriptive statistics were used to determine
mean scores for the non-marketing factors and the marketing factors. The results of
survey questions one and two are presented in Table 2, as they directly relate to research
question #3.
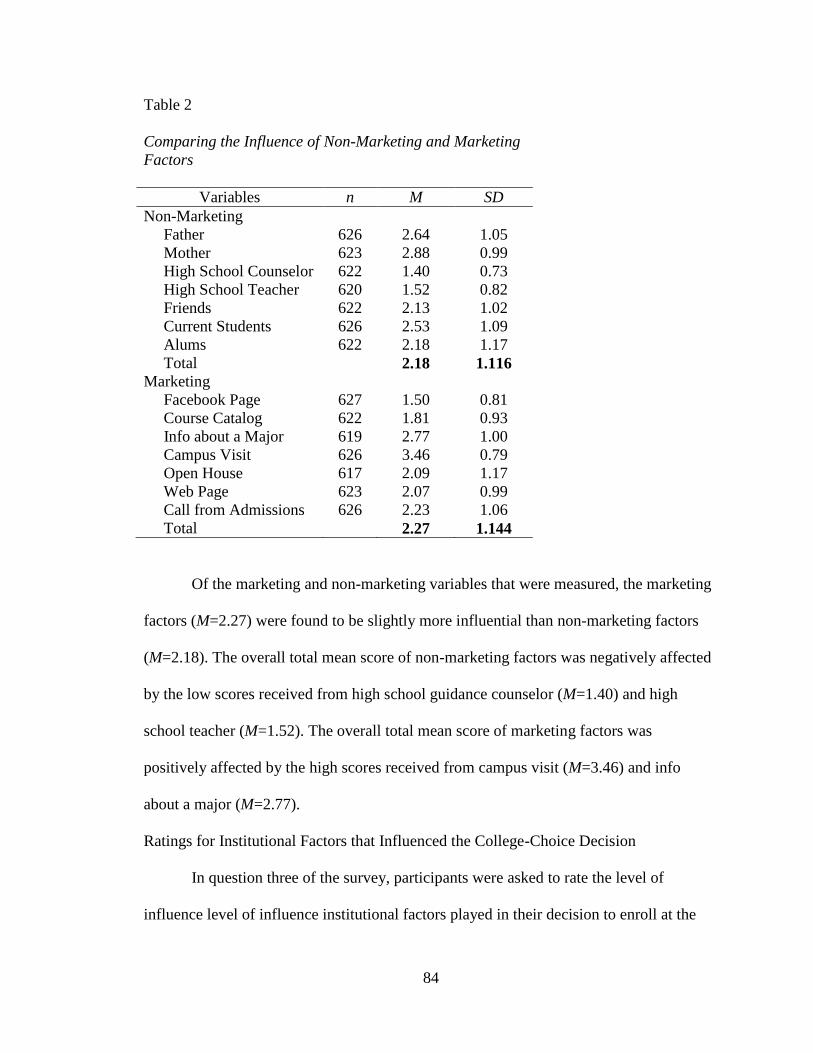
84
Table 2
Comparing the Influence of Non-Marketing and Marketing
Factors
Variables n M SD
Non-Marketing
Father 626 2.64 1.05
Mother 623 2.88 0.99
High School Counselor 622 1.40 0.73
High School Teacher 620 1.52 0.82
Friends 622 2.13 1.02
Current Students 626 2.53 1.09
Alums 622 2.18 1.17
Total 2.18 1.116
Marketing
Facebook Page 627 1.50 0.81
Course Catalog 622 1.81 0.93
Info about a Major 619 2.77 1.00
Campus Visit 626 3.46 0.79
Open House 617 2.09 1.17
Web Page 623 2.07 0.99
Call from Admissions 626 2.23 1.06
Total 2.27 1.144
Of the marketing and non-marketing variables that were measured, the marketing
factors (M=2.27) were found to be slightly more influential than non-marketing factors
(M=2.18). The overall total mean score of non-marketing factors was negatively affected
by the low scores received from high school guidance counselor (M=1.40) and high
school teacher (M=1.52). The overall total mean score of marketing factors was
positively affected by the high scores received from campus visit (M=3.46) and info
about a major (M=2.77).
Ratings for Institutional Factors that Influenced the College-Choice Decision
In question three of the survey, participants were asked to rate the level of
influence level of influence institutional factors played in their decision to enroll at the

85
Midwest Christian University. This survey question consisted of four-point Likert Scales
from; one was not influential, two was somewhat influential, three was moderately
influential and four was very influential. Although the research at hand focused on
determining the impact of marketing versus non-marketing factors on the college-choice
decision at the Midwest Christian University, it is important to note that Institutional
factors were identified as having played the largest role in influencing freshman students’
decision to attend the Midwest Christian University. Descriptive statistics were also used
to develop mean and standard deviation scores for the institutional factors. These findings
are presented in Table 3.
Table 3
Evaluating the Influence of Institutional Factors
Institutional Variables n M SD
Location 626 2.83 1.03
Campus Safety 623 2.39 1.06
Specific Major 624 3.04 1.02
Variety of Majors 625 2.32 1.06
Price 621 2.53 1.12
Scholarships 625 3.43 0.80
Financial Aid 622 3.04 1.05
Intramural Sports 625 1.97 1.02
Varsity Sports 623 2.17 1.27
Social Life 625 2.86 0.91
Diversity 626 2.35 1.01
Total 2.63 1.117
Of the institutional factors that were measured, the total overall mean score was
M=2.63. The institutional factors that played the largest role in influencing the college-
choice factors at the Midwestern Christian University were scholarships (M=3.43),
specific major (M=3.04), and financial aid (M=3.04). The institutional factors that played
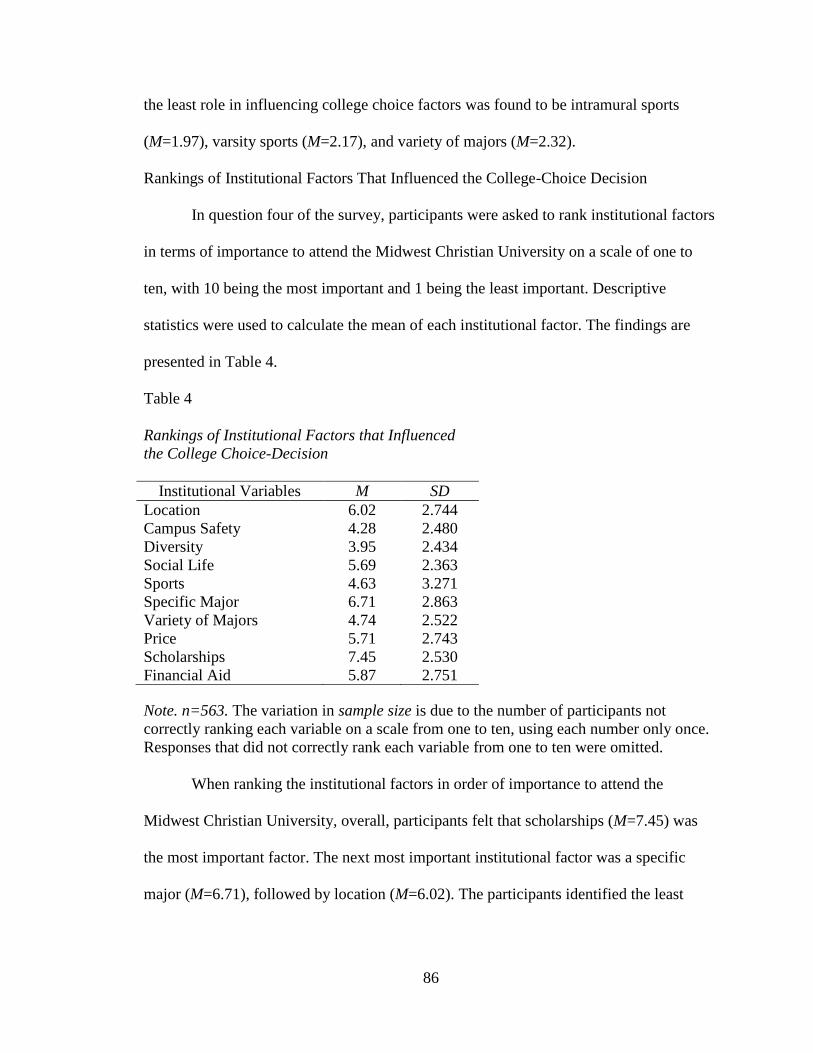
86
the least role in influencing college choice factors was found to be intramural sports
(M=1.97), varsity sports (M=2.17), and variety of majors (M=2.32).
Rankings of Institutional Factors That Influenced the College-Choice Decision
In question four of the survey, participants were asked to rank institutional factors
in terms of importance to attend the Midwest Christian University on a scale of one to
ten, with 10 being the most important and 1 being the least important. Descriptive
statistics were used to calculate the mean of each institutional factor. The findings are
presented in Table 4.
Note. n=563. The variation in sample size is due to the number of participants not
correctly ranking each variable on a scale from one to ten, using each number only once.
Responses that did not correctly rank each variable from one to ten were omitted.
When ranking the institutional factors in order of importance to attend the
Midwest Christian University, overall, participants felt that scholarships (M=7.45) was
the most important factor. The next most important institutional factor was a specific
major (M=6.71), followed by location (M=6.02). The participants identified the least
Table 4
Rankings of Institutional Factors that Influenced
the College Choice-Decision
Institutional Variables M SD
Location 6.02 2.744
Campus Safety 4.28 2.480
Diversity 3.95 2.434
Social Life 5.69 2.363
Sports 4.63 3.271
Specific Major 6.71 2.863
Variety of Majors 4.74 2.522
Price 5.71 2.743
Scholarships 7.45 2.530
Financial Aid 5.87 2.751
87
important institutional factor in their decision to attend the Midwest Christian University
was diversity (M=3.95), followed by campus safety (M=4.28), and sports (M=4.63).
Only responses that ranked each institutional factor from one to ten were included
in the results. This represented about 90% of the total respondents (n=563). While the
results of the ranking of institutional factors in Table 4 were fairly consistent with the
rating of institutional factors in Table 3, the difference in the number of respondents may
explain the slight variation in importance of institutional factors when comparing results
presented in Table 4 to Table 3 results.
Student Perceptions of Statements Related to the Midwest Christian University
In question five of the survey, participants were asked to rank their level of
agreement to various statements relating to their satisfaction with the Midwest Christian
University. The students were provided a five-point Likert scale, in which one was
strongly agree, two was agree, three was no opinion, four was disagree and five was
strongly disagree. Descriptive statistics were used to calculate the means of each
statement. The findings are presented in Table 5.
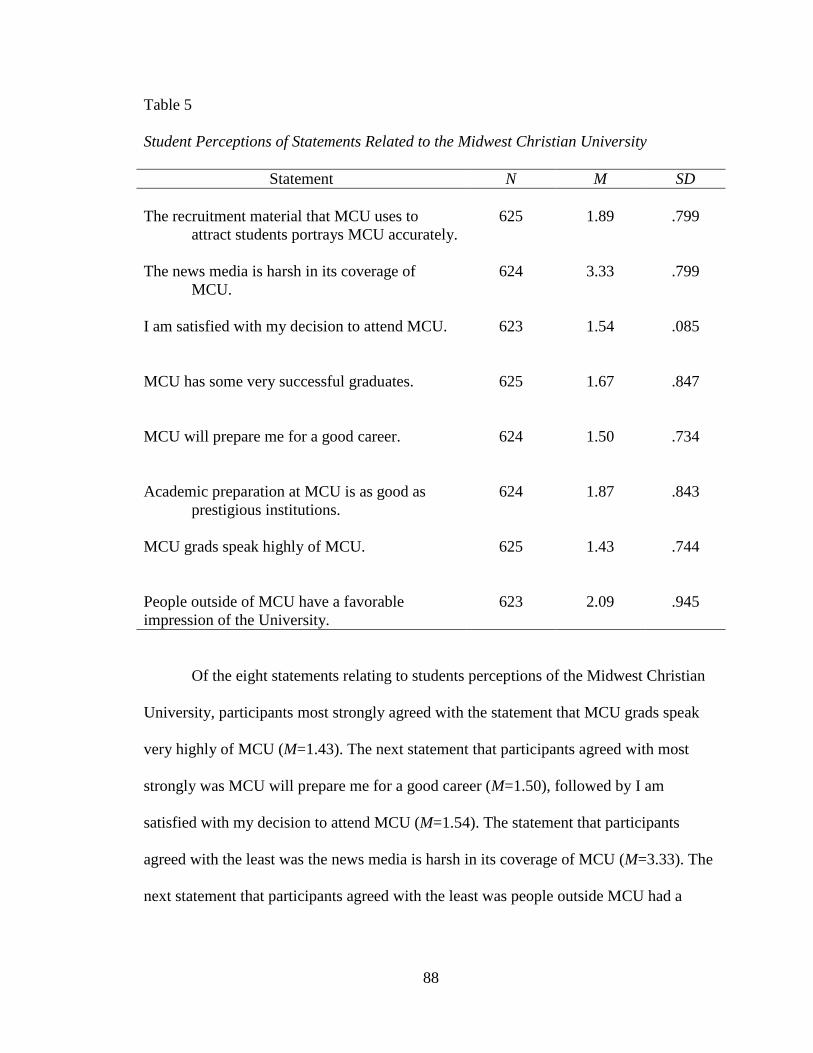
88
Table 5
Student Perceptions of Statements Related to the Midwest Christian University
Statement N M SD
The recruitment material that MCU uses to
attract students portrays MCU accurately.
625 1.89 .799
The news media is harsh in its coverage of
MCU.
624 3.33 .799
I am satisfied with my decision to attend MCU. 623 1.54 .085
MCU has some very successful graduates. 625 1.67 .847
MCU will prepare me for a good career. 624 1.50 .734
Academic preparation at MCU is as good as
prestigious institutions.
624 1.87 .843
MCU grads speak highly of MCU. 625 1.43 .744
People outside of MCU have a favorable
impression of the University.
623 2.09 .945
Of the eight statements relating to students perceptions of the Midwest Christian
University, participants most strongly agreed with the statement that MCU grads speak
very highly of MCU (M=1.43). The next statement that participants agreed with most
strongly was MCU will prepare me for a good career (M=1.50), followed by I am
satisfied with my decision to attend MCU (M=1.54). The statement that participants
agreed with the least was the news media is harsh in its coverage of MCU (M=3.33). The
next statement that participants agreed with the least was people outside MCU had a

89
favorable impression of MCU (M=2.09), followed by Academic preparation at MCU is as
good as prestigious private institutions (M=1.87).
Rankings of Marketing and Non-Marketing Factors That Influenced the College-Choice
Decision
In question six of the survey, participants were asked to rank marketing and non-
marketing factors in terms of importance to attend the Midwest Christian University on a
scale of one to ten, with 10 being the most important and 1 being the least important.
Descriptive statistics were used to calculate the mean of each institutional factor. The
findings are presented in Table 6.
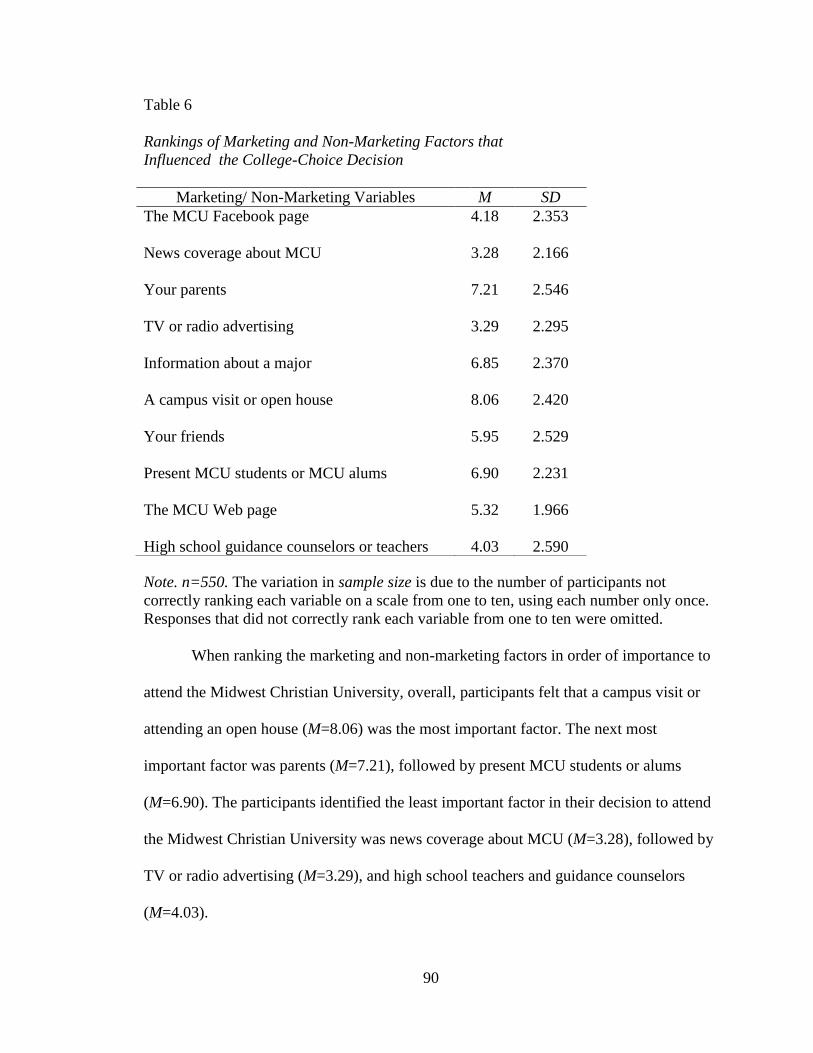
90
Note. n=550. The variation in sample size is due to the number of participants not
correctly ranking each variable on a scale from one to ten, using each number only once.
Responses that did not correctly rank each variable from one to ten were omitted.
When ranking the marketing and non-marketing factors in order of importance to
attend the Midwest Christian University, overall, participants felt that a campus visit or
attending an open house (M=8.06) was the most important factor. The next most
important factor was parents (M=7.21), followed by present MCU students or alums
(M=6.90). The participants identified the least important factor in their decision to attend
the Midwest Christian University was news coverage about MCU (M=3.28), followed by
TV or radio advertising (M=3.29), and high school teachers and guidance counselors
(M=4.03).
Table 6
Rankings of Marketing and Non-Marketing Factors that
Influenced the College-Choice Decision
Marketing/ Non-Marketing Variables M SD
The MCU Facebook page 4.18 2.353
News coverage about MCU 3.28 2.166
Your parents 7.21 2.546
TV or radio advertising 3.29 2.295
Information about a major 6.85 2.370
A campus visit or open house 8.06 2.420
Your friends 5.95 2.529
Present MCU students or MCU alums 6.90 2.231
The MCU Web page 5.32 1.966
High school guidance counselors or teachers 4.03 2.590
91
The next section answers research question 2: What impact do demographic
characteristics have on college-choice factors at a Midwest Christian University?
This section evaluates the impact of seven demographic characteristics on the
participant’s decision to attend a Midwest Christian University. Each demographic
characteristic is compared to the non-marketing, marketing, and institutional factors that
may have influenced their decision to attend MCU.
Relationship Between Gender and College-Choice Factors
ANOVAs were used to determine if there were significant differences among the
responses of males and females in regards to what influenced their college-choice
decision. ANOVAs were used to compare the relationship between gender and the ratings
of non-marketing factors, marketing factors, and institutional factors. The results of
gender compared to non-marketing factors are listed in Table 7.
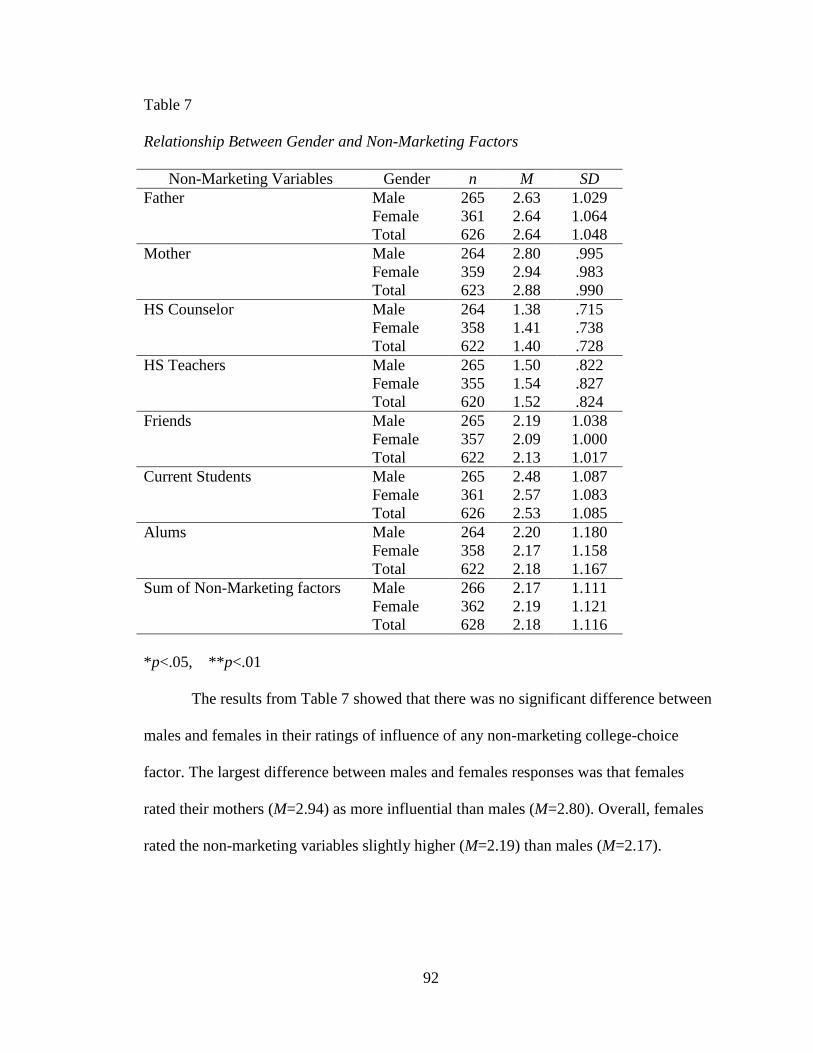
92
Table 7
Relationship Between Gender and Non-Marketing Factors
Non-Marketing Variables Gender n M SD
Father Male 265 2.63 1.029
Female 361 2.64 1.064
Total 626 2.64 1.048
Mother Male 264 2.80 .995
Female 359 2.94 .983
Total 623 2.88 .990
HS Counselor Male 264 1.38 .715
Female 358 1.41 .738
Total 622 1.40 .728
HS Teachers Male 265 1.50 .822
Female 355 1.54 .827
Total 620 1.52 .824
Friends Male 265 2.19 1.038
Female 357 2.09 1.000
Total 622 2.13 1.017
Current Students Male 265 2.48 1.087
Female 361 2.57 1.083
Total 626 2.53 1.085
Alums Male 264 2.20 1.180
Female 358 2.17 1.158
Total 622 2.18 1.167
Sum of Non-Marketing factors Male 266 2.17 1.111
Female 362 2.19 1.121
Total 628 2.18 1.116
*p<.05, **p<.01
The results from Table 7 showed that there was no significant difference between
males and females in their ratings of influence of any non-marketing college-choice
factor. The largest difference between males and females responses was that females
rated their mothers (M=2.94) as more influential than males (M=2.80). Overall, females
rated the non-marketing variables slightly higher (M=2.19) than males (M=2.17).
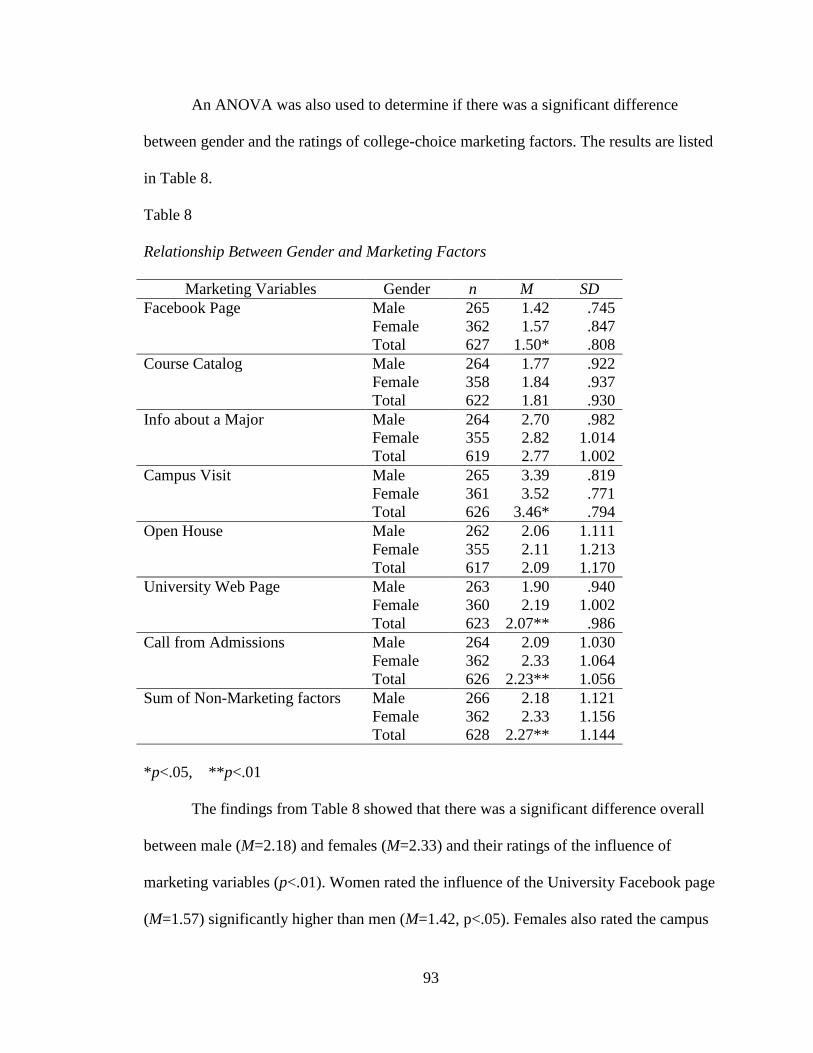
93
An ANOVA was also used to determine if there was a significant difference
between gender and the ratings of college-choice marketing factors. The results are listed
in Table 8.
Table 8
Relationship Between Gender and Marketing Factors
Marketing Variables Gender n M SD
Facebook Page Male 265 1.42 .745
Female 362 1.57 .847
Total 627 1.50* .808
Course Catalog Male 264 1.77 .922
Female 358 1.84 .937
Total 622 1.81 .930
Info about a Major Male 264 2.70 .982
Female 355 2.82 1.014
Total 619 2.77 1.002
Campus Visit Male 265 3.39 .819
Female 361 3.52 .771
Total 626 3.46* .794
Open House Male 262 2.06 1.111
Female 355 2.11 1.213
Total 617 2.09 1.170
University Web Page Male 263 1.90 .940
Female 360 2.19 1.002
Total 623 2.07** .986
Call from Admissions Male 264 2.09 1.030
Female 362 2.33 1.064
Total 626 2.23** 1.056
Sum of Non-Marketing factors Male 266 2.18 1.121
Female 362 2.33 1.156
Total 628 2.27** 1.144
*p<.05, **p<.01
The findings from Table 8 showed that there was a significant difference overall
between male (M=2.18) and females (M=2.33) and their ratings of the influence of
marketing variables (p<.01). Women rated the influence of the University Facebook page
(M=1.57) significantly higher than men (M=1.42, p<.05). Females also rated the campus
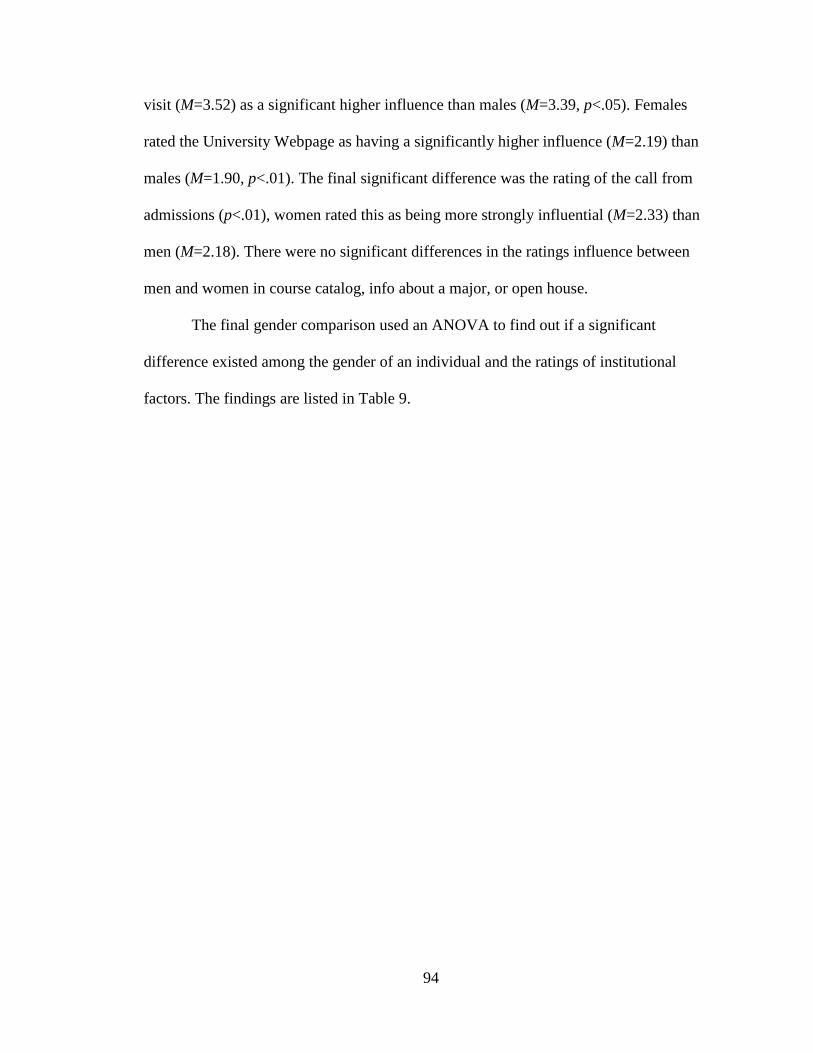
94
visit (M=3.52) as a significant higher influence than males (M=3.39, p<.05). Females
rated the University Webpage as having a significantly higher influence (M=2.19) than
males (M=1.90, p<.01). The final significant difference was the rating of the call from
admissions (p<.01), women rated this as being more strongly influential (M=2.33) than
men (M=2.18). There were no significant differences in the ratings influence between
men and women in course catalog, info about a major, or open house.
The final gender comparison used an ANOVA to find out if a significant
difference existed among the gender of an individual and the ratings of institutional
factors. The findings are listed in Table 9.
95
Table 9
Relationship Between Gender and Institutional Factors
Institutional Variables Gender n M SD
Location Male 265 2.71 1.071
Female 361 2.92 .986
Total 626 2.83* 1.027
Campus Safety Male 266 2.09 1.037
Female 357 2.61 1.021
Total 623 2.39** 1.059
Specific Major Male 265 2.94 1.021
Female 359 3.11 1.006
Total 624 3.04* 1.015
Variety of Majors Male 265 2.25 1.023
Female 360 2.38 1.085
Total 625 2.32 1.060
Price Male 264 2.39 1.121
Female 357 2.64 1.104
Total 621 2.53** 1.118
Scholarships Male 264 3.44 .747
Female 361 3.43 .837
Total 625 3.43 .800
Financial Aid Male 264 3.00 1.021
Female 358 3.07 1.075
Total 622 3.04 1.052
Intramural Sports Male 264 2.13 1.046
Female 361 1.86 .981
Total 625 1.97** 1.017
Varsity Sports Male 265 2.48 1.300
Female 358 1.95 1.198
Total 623 2.17** 1.269
Social Life Male 265 2.79 .920
Female 360 2.91 .901
Total 625 2.86 .910
Diversity Male 265 2.27 .989
Female 361 2.41 1.013
Total 626 2.35 1.005
Sum of Institutional Variables Male 266 2.59 1.116
Female 362 2.66 1.123
Total 628 2.63 1.117
*p<.05, **p<.01
96
Overall, females rated the influence of institutional ratings (M=2.66) higher than
males (M=2.59), although the results showed that there was not a significant difference.
However, females rated the influence of campus safety (M=2.61) significantly higher
than males (M=2.09, p<.01). Females also rated price (M=2.64) as significantly more
influential than males (M=2.39, p<.01). In addition, women listed a specific major
(M=3.11) as having a significantly higher impact than men (M=2.94, p<.05). Females
also rated the influence of location (M=2.92) significantly higher than males (M=2.71,
p<.05). On the other hand, males rated the influence of intramural sports (M=2.13)
significantly higher than females (M=1.86, p<.01) Men also rated varsity sports (M=2.48)
as having a significantly higher influence in their college-choice decision than women
(M=1.95, p<.01). There were no significant differences between males and females in
their ratings of variety of majors, scholarships, financial aid, social life, and diversity.
Relationship Between Race and College-Choice Factors
ANOVAs were also used to determine if there was a significant difference
between students’ race and what may have influenced their college-choice decision. In
Table 10, students’ race is compared to non-marketing college-choice factors.
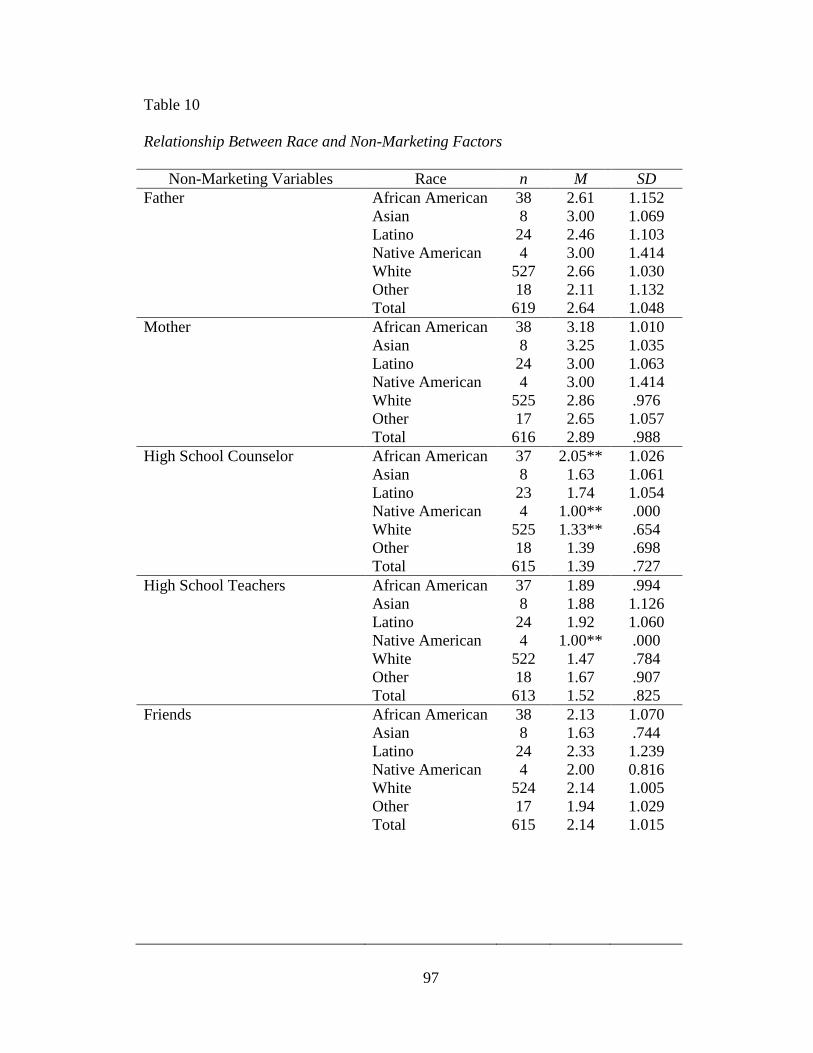
97
Table 10
Relationship Between Race and Non-Marketing Factors
Non-Marketing Variables Race n M SD
Father African American 38 2.61 1.152
Asian 8 3.00 1.069
Latino 24 2.46 1.103
Native American 4 3.00 1.414
White 527 2.66 1.030
Other 18 2.11 1.132
Total 619 2.64 1.048
Mother African American 38 3.18 1.010
Asian 8 3.25 1.035
Latino 24 3.00 1.063
Native American 4 3.00 1.414
White 525 2.86 .976
Other 17 2.65 1.057
Total 616 2.89 .988
High School Counselor African American 37 2.05** 1.026
Asian 8 1.63 1.061
Latino 23 1.74 1.054
Native American 4 1.00** .000
White 525 1.33** .654
Other 18 1.39 .698
Total 615 1.39 .727
High School Teachers African American 37 1.89 .994
Asian 8 1.88 1.126
Latino 24 1.92 1.060
Native American 4 1.00** .000
White 522 1.47 .784
Other 18 1.67 .907
Total 613 1.52 .825
Friends African American 38 2.13 1.070
Asian 8 1.63 .744
Latino 24 2.33 1.239
Native American 4 2.00 0.816
White 524 2.14 1.005
Other 17 1.94 1.029
Total 615 2.14 1.015
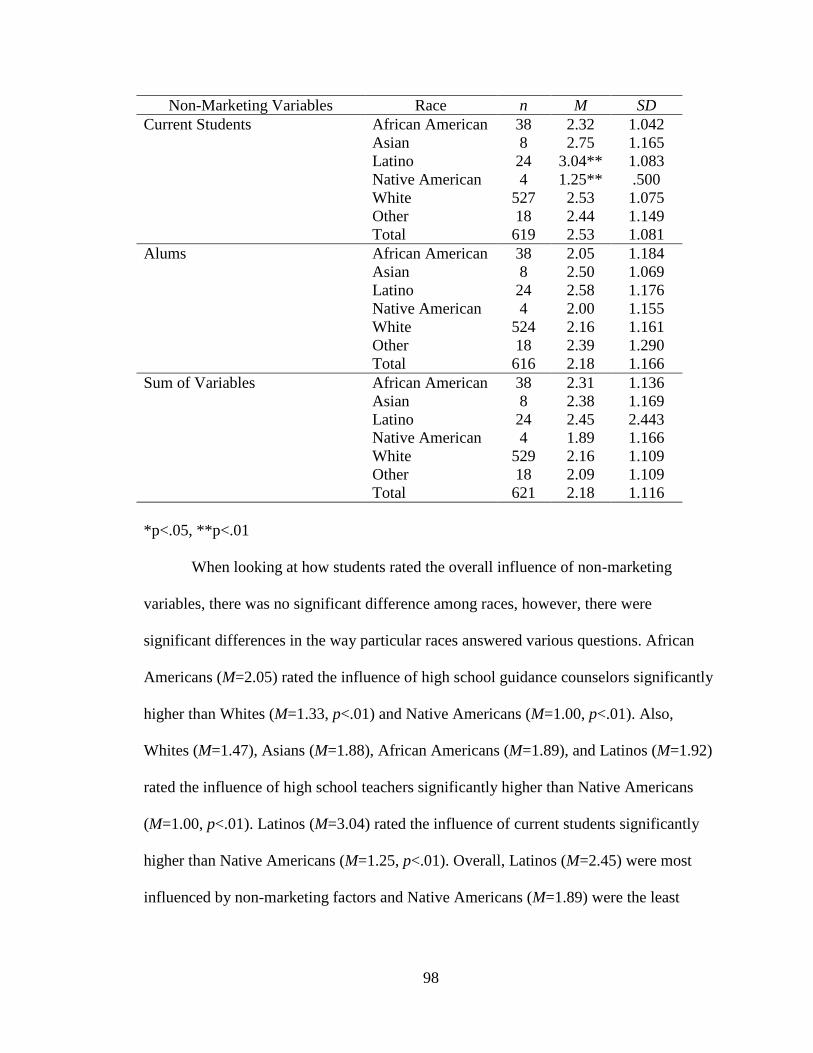
98
Non-Marketing Variables Race n M SD
Current Students African American 38 2.32 1.042
Asian 8 2.75 1.165
Latino 24 3.04** 1.083
Native American 4 1.25** .500
White 527 2.53 1.075
Other 18 2.44 1.149
Total 619 2.53 1.081
Alums African American 38 2.05 1.184
Asian 8 2.50 1.069
Latino 24 2.58 1.176
Native American 4 2.00 1.155
White 524 2.16 1.161
Other 18 2.39 1.290
Total 616 2.18 1.166
Sum of Variables African American 38 2.31 1.136
Asian 8 2.38 1.169
Latino 24 2.45 2.443
Native American 4 1.89 1.166
White 529 2.16 1.109
Other 18 2.09 1.109
Total 621 2.18 1.116
*p<.05, **p<.01
When looking at how students rated the overall influence of non-marketing
variables, there was no significant difference among races, however, there were
significant differences in the way particular races answered various questions. African
Americans (M=2.05) rated the influence of high school guidance counselors significantly
higher than Whites (M=1.33, p<.01) and Native Americans (M=1.00, p<.01). Also,
Whites (M=1.47), Asians (M=1.88), African Americans (M=1.89), and Latinos (M=1.92)
rated the influence of high school teachers significantly higher than Native Americans
(M=1.00, p<.01). Latinos (M=3.04) rated the influence of current students significantly
higher than Native Americans (M=1.25, p<.01). Overall, Latinos (M=2.45) were most
influenced by non-marketing factors and Native Americans (M=1.89) were the least
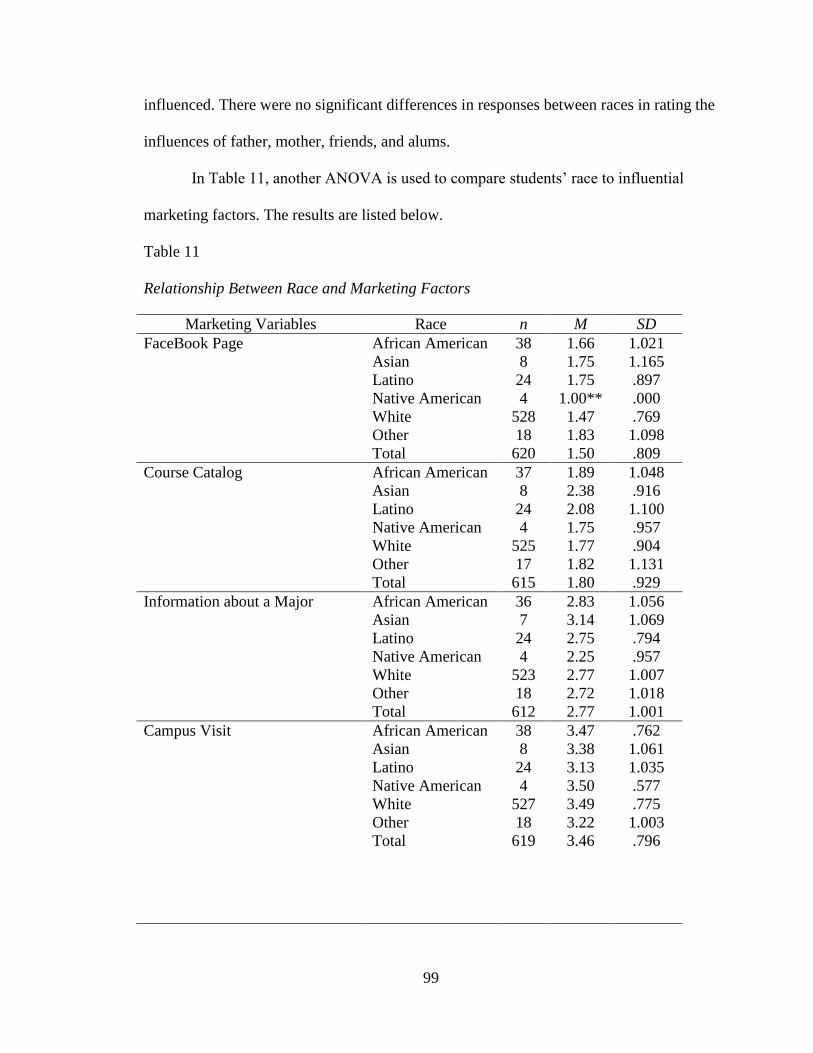
99
influenced. There were no significant differences in responses between races in rating the
influences of father, mother, friends, and alums.
In Table 11, another ANOVA is used to compare students’ race to influential
marketing factors. The results are listed below.
Table 11
Relationship Between Race and Marketing Factors
Marketing Variables Race n M SD
FaceBook Page African American 38 1.66 1.021
Asian 8 1.75 1.165
Latino 24 1.75 .897
Native American 4 1.00** .000
White 528 1.47 .769
Other 18 1.83 1.098
Total 620 1.50 .809
Course Catalog African American 37 1.89 1.048
Asian 8 2.38 .916
Latino 24 2.08 1.100
Native American 4 1.75 .957
White 525 1.77 .904
Other 17 1.82 1.131
Total 615 1.80 .929
Information about a Major African American 36 2.83 1.056
Asian 7 3.14 1.069
Latino 24 2.75 .794
Native American 4 2.25 .957
White 523 2.77 1.007
Other 18 2.72 1.018
Total 612 2.77 1.001
Campus Visit African American 38 3.47 .762
Asian 8 3.38 1.061
Latino 24 3.13 1.035
Native American 4 3.50 .577
White 527 3.49 .775
Other 18 3.22 1.003
Total 619 3.46 .796
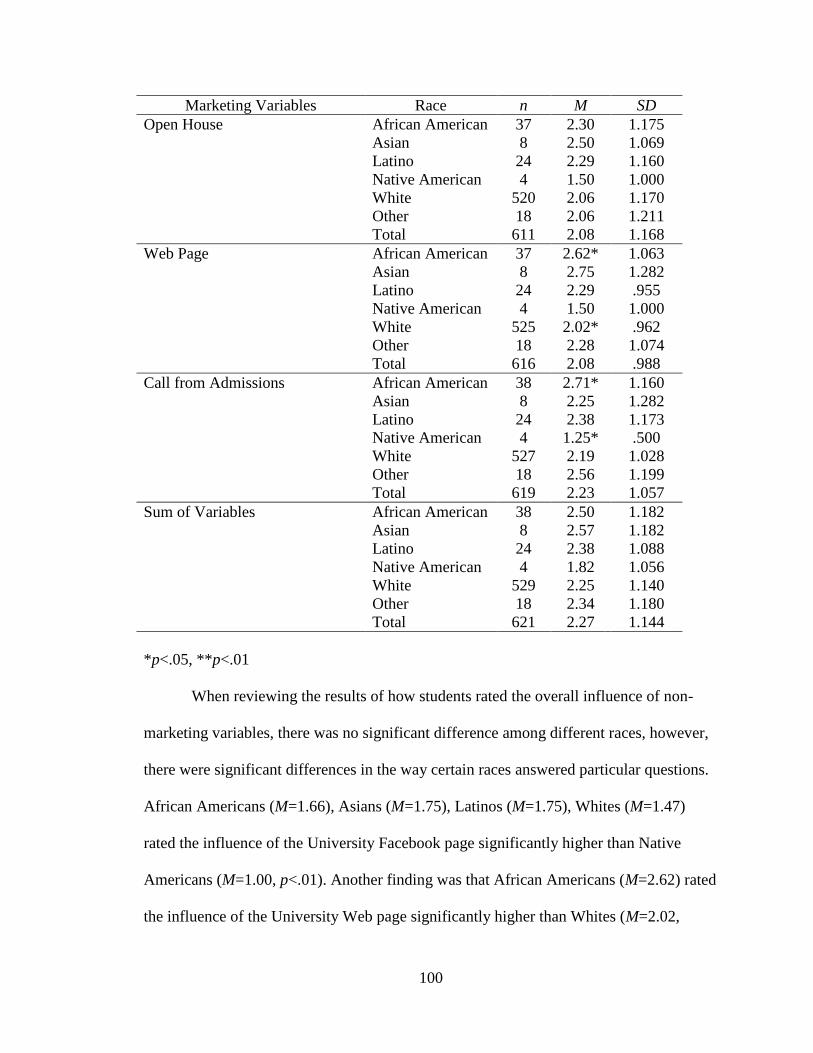
100
Marketing Variables Race n M SD
Open House African American 37 2.30 1.175
Asian 8 2.50 1.069
Latino 24 2.29 1.160
Native American 4 1.50 1.000
White 520 2.06 1.170
Other 18 2.06 1.211
Total 611 2.08 1.168
Web Page African American 37 2.62* 1.063
Asian 8 2.75 1.282
Latino 24 2.29 .955
Native American 4 1.50 1.000
White 525 2.02* .962
Other 18 2.28 1.074
Total 616 2.08 .988
Call from Admissions African American 38 2.71* 1.160
Asian 8 2.25 1.282
Latino 24 2.38 1.173
Native American 4 1.25* .500
White 527 2.19 1.028
Other 18 2.56 1.199
Total 619 2.23 1.057
Sum of Variables African American 38 2.50 1.182
Asian 8 2.57 1.182
Latino 24 2.38 1.088
Native American 4 1.82 1.056
White 529 2.25 1.140
Other 18 2.34 1.180
Total 621 2.27 1.144
*p<.05, **p<.01
When reviewing the results of how students rated the overall influence of non-
marketing variables, there was no significant difference among different races, however,
there were significant differences in the way certain races answered particular questions.
African Americans (M=1.66), Asians (M=1.75), Latinos (M=1.75), Whites (M=1.47)
rated the influence of the University Facebook page significantly higher than Native
Americans (M=1.00, p<.01). Another finding was that African Americans (M=2.62) rated
the influence of the University Web page significantly higher than Whites (M=2.02,
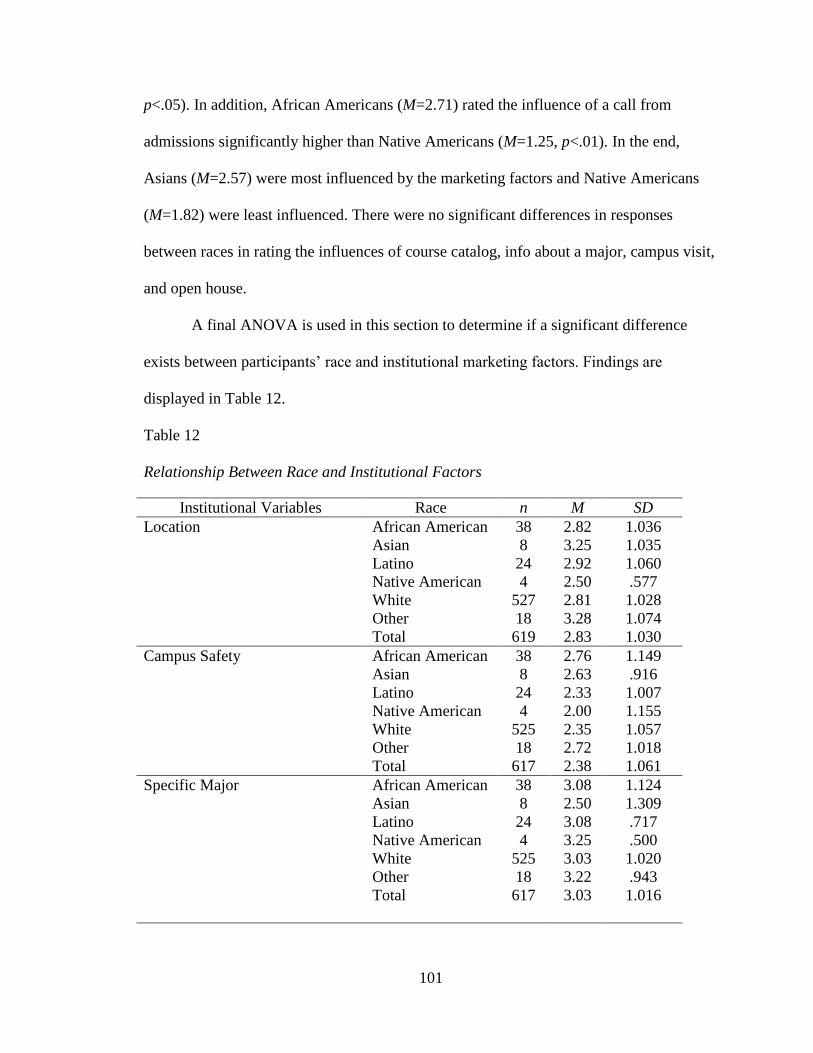
101
p<.05). In addition, African Americans (M=2.71) rated the influence of a call from
admissions significantly higher than Native Americans (M=1.25, p<.01). In the end,
Asians (M=2.57) were most influenced by the marketing factors and Native Americans
(M=1.82) were least influenced. There were no significant differences in responses
between races in rating the influences of course catalog, info about a major, campus visit,
and open house.
A final ANOVA is used in this section to determine if a significant difference
exists between participants’ race and institutional marketing factors. Findings are
displayed in Table 12.
Table 12
Relationship Between Race and Institutional Factors
Institutional Variables Race n M SD
Location African American 38 2.82 1.036
Asian 8 3.25 1.035
Latino 24 2.92 1.060
Native American 4 2.50 .577
White 527 2.81 1.028
Other 18 3.28 1.074
Total 619 2.83 1.030
Campus Safety African American 38 2.76 1.149
Asian 8 2.63 .916
Latino 24 2.33 1.007
Native American 4 2.00 1.155
White 525 2.35 1.057
Other 18 2.72 1.018
Total 617 2.38 1.061
Specific Major African American 38 3.08 1.124
Asian 8 2.50 1.309
Latino 24 3.08 .717
Native American 4 3.25 .500
White 525 3.03 1.020
Other 18 3.22 .943
Total 617 3.03 1.016
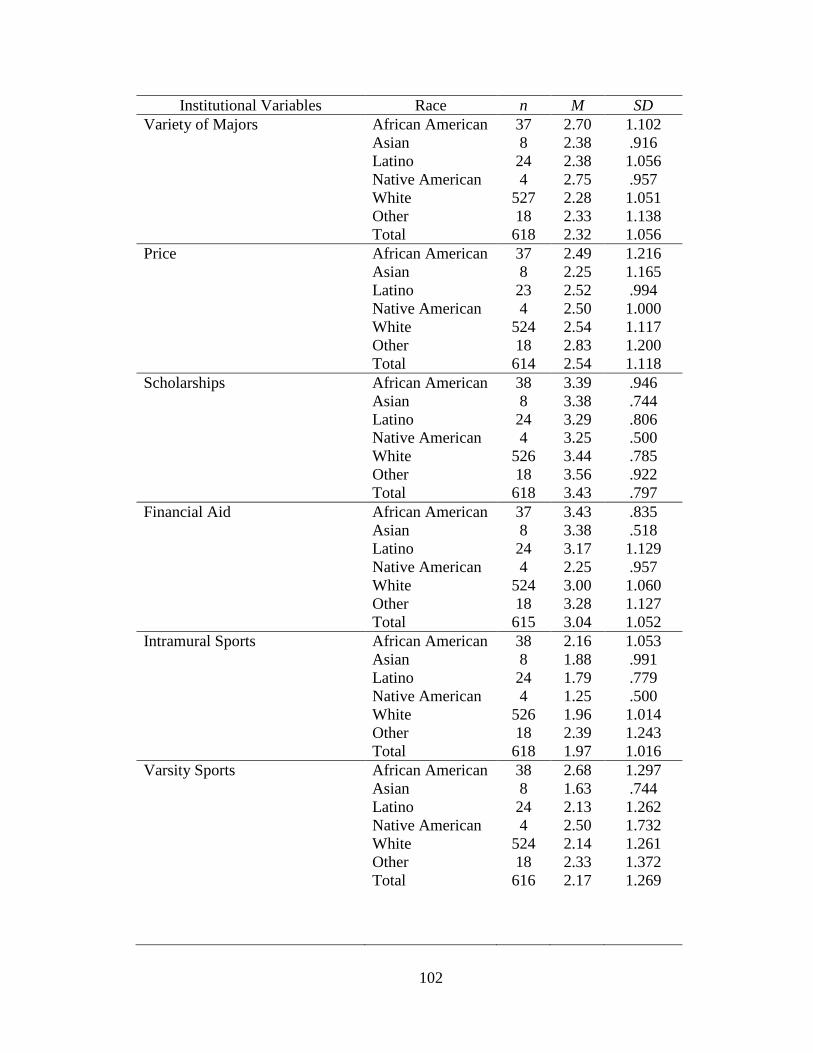
102
Institutional Variables Race n M SD
Variety of Majors African American 37 2.70 1.102
Asian 8 2.38 .916
Latino 24 2.38 1.056
Native American 4 2.75 .957
White 527 2.28 1.051
Other 18 2.33 1.138
Total 618 2.32 1.056
Price African American 37 2.49 1.216
Asian 8 2.25 1.165
Latino 23 2.52 .994
Native American 4 2.50 1.000
White 524 2.54 1.117
Other 18 2.83 1.200
Total 614 2.54 1.118
Scholarships African American 38 3.39 .946
Asian 8 3.38 .744
Latino 24 3.29 .806
Native American 4 3.25 .500
White 526 3.44 .785
Other 18 3.56 .922
Total 618 3.43 .797
Financial Aid African American 37 3.43 .835
Asian 8 3.38 .518
Latino 24 3.17 1.129
Native American 4 2.25 .957
White 524 3.00 1.060
Other 18 3.28 1.127
Total 615 3.04 1.052
Intramural Sports African American 38 2.16 1.053
Asian 8 1.88 .991
Latino 24 1.79 .779
Native American 4 1.25 .500
White 526 1.96 1.014
Other 18 2.39 1.243
Total 618 1.97 1.016
Varsity Sports African American 38 2.68 1.297
Asian 8 1.63 .744
Latino 24 2.13 1.262
Native American 4 2.50 1.732
White 524 2.14 1.261
Other 18 2.33 1.372
Total 616 2.17 1.269

103
Institutional Variables Race n M SD
Social Life African American 38 2.82 .982
Asian 8 2.38 .744
Latino 24 2.58 1.139
Native American 4 2.50 .577
White 526 2.88 .900
Other 18 3.11 .758
Total 618 2.86 .910
Diversity African American 38 2.61 1.054
Asian 8 2.25 .707
Latino 24 2.54 1.103
Native American 4 2.00 .816
White 527 2.31 .992
Other 18 2.89 1.079
Total 619 2.35 1.003
Sum of Variables African American 38 2.81 1.124
Asian 8 2.53 1.028
Latino 24 2.61 1.092
Native American 4 2.44 .974
White 529 2.61 1.117
Other 18 2.90 1.138
Total 621 2.63 1.117
*p<.05, **p<.01
There were no significant differences in responses between races in rating the
influences of any of the institutional variables.
Relationship Between Location and College-Choice Factors
ANOVAs were used to determine if there was a significant difference between
students’ location and what may have influenced their college-choice decision. In Table
13, students’ location is compared to non-marketing college-choice factors.
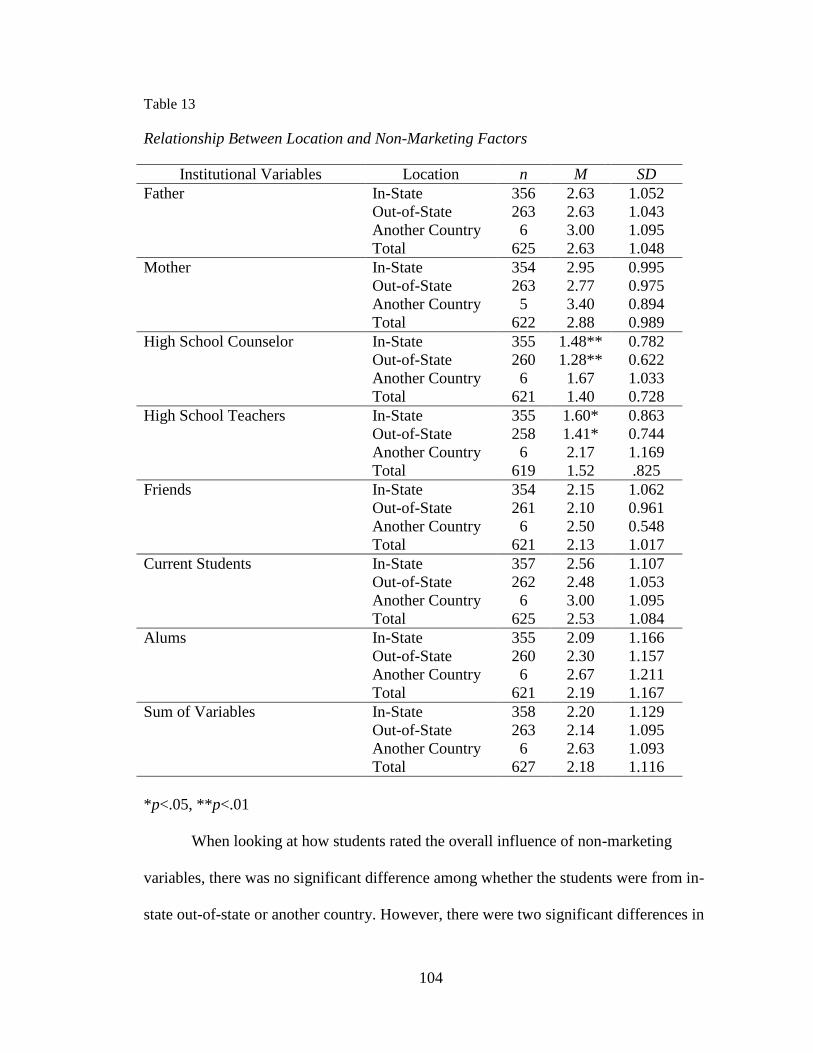
104
Table 13
Relationship Between Location and Non-Marketing Factors
Institutional Variables Location n M SD
Father In-State 356 2.63 1.052
Out-of-State 263 2.63 1.043
Another Country 6 3.00 1.095
Total 625 2.63 1.048
Mother In-State 354 2.95 0.995
Out-of-State 263 2.77 0.975
Another Country 5 3.40 0.894
Total 622 2.88 0.989
High School Counselor In-State 355 1.48** 0.782
Out-of-State 260 1.28** 0.622
Another Country 6 1.67 1.033
Total 621 1.40 0.728
High School Teachers In-State 355 1.60* 0.863
Out-of-State 258 1.41* 0.744
Another Country 6 2.17 1.169
Total 619 1.52 .825
Friends In-State 354 2.15 1.062
Out-of-State 261 2.10 0.961
Another Country 6 2.50 0.548
Total 621 2.13 1.017
Current Students In-State 357 2.56 1.107
Out-of-State 262 2.48 1.053
Another Country 6 3.00 1.095
Total 625 2.53 1.084
Alums In-State 355 2.09 1.166
Out-of-State 260 2.30 1.157
Another Country 6 2.67 1.211
Total 621 2.19 1.167
Sum of Variables In-State 358 2.20 1.129
Out-of-State 263 2.14 1.095
Another Country 6 2.63 1.093
Total 627 2.18 1.116
*p<.05, **p<.01
When looking at how students rated the overall influence of non-marketing
variables, there was no significant difference among whether the students were from in-
state out-of-state or another country. However, there were two significant differences in
105
the way students from different locations rated various influential non-marketing factors.
First, in-state students (M=1.48) rated the influence of high school counselors
significantly higher than out-of-state students (M=1.28, p<.01). Also, in-state students
(M=1.60) rated the influence of high school teachers significantly higher than out-of-state
students (M= 1.41, p<.05). Overall, students from another country (M=2.63) were most
influenced by the non-marketing factors while students from out-of state (M=2.14) were
least influenced by these factors.
The second ANOVA in this section was used to find out the relationship between
students’ location and the influence of marketing factors in their college-choice decision.
The results are listed in Table 14.
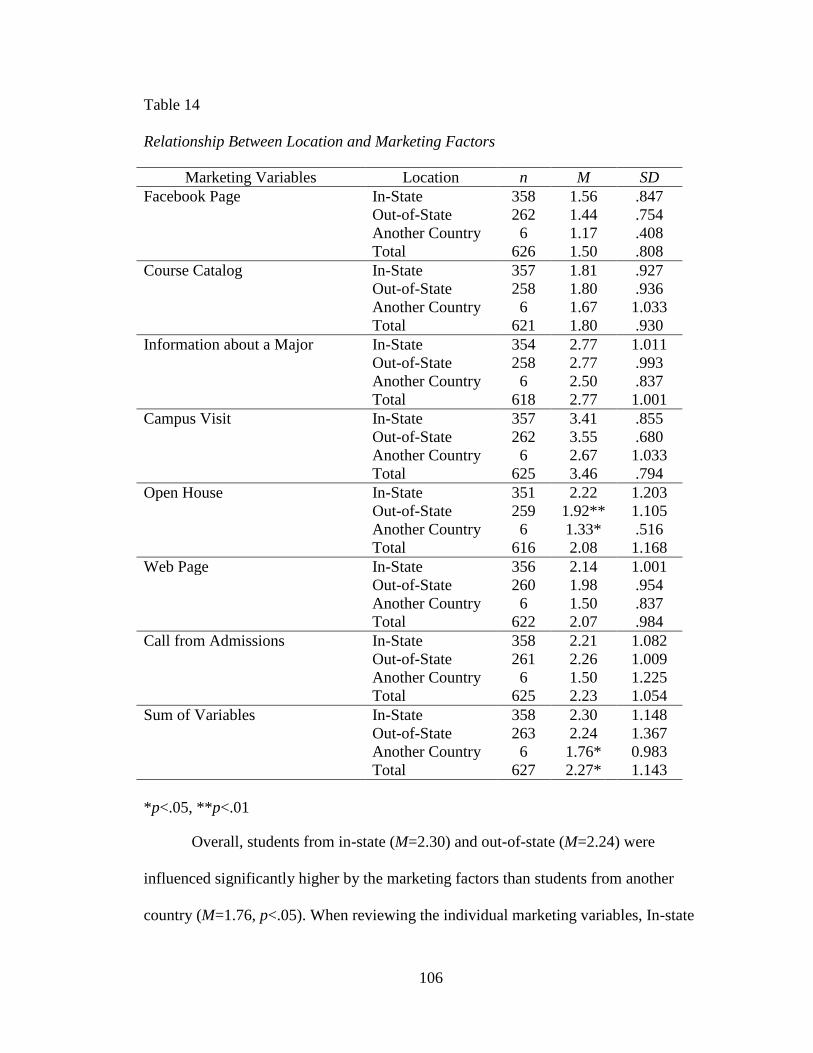
106
Table 14
Relationship Between Location and Marketing Factors
Marketing Variables Location n M SD
Facebook Page In-State 358 1.56 .847
Out-of-State 262 1.44 .754
Another Country 6 1.17 .408
Total 626 1.50 .808
Course Catalog In-State 357 1.81 .927
Out-of-State 258 1.80 .936
Another Country 6 1.67 1.033
Total 621 1.80 .930
Information about a Major In-State 354 2.77 1.011
Out-of-State 258 2.77 .993
Another Country 6 2.50 .837
Total 618 2.77 1.001
Campus Visit In-State 357 3.41 .855
Out-of-State 262 3.55 .680
Another Country 6 2.67 1.033
Total 625 3.46 .794
Open House In-State 351 2.22 1.203
Out-of-State 259 1.92** 1.105
Another Country 6 1.33* .516
Total 616 2.08 1.168
Web Page In-State 356 2.14 1.001
Out-of-State 260 1.98 .954
Another Country 6 1.50 .837
Total 622 2.07 .984
Call from Admissions In-State 358 2.21 1.082
Out-of-State 261 2.26 1.009
Another Country 6 1.50 1.225
Total 625 2.23 1.054
Sum of Variables In-State 358 2.30 1.148
Out-of-State 263 2.24 1.367
Another Country 6 1.76* 0.983
Total 627 2.27* 1.143
*p<.05, **p<.01
Overall, students from in-state (M=2.30) and out-of-state (M=2.24) were
influenced significantly higher by the marketing factors than students from another
country (M=1.76, p<.05). When reviewing the individual marketing variables, In-state
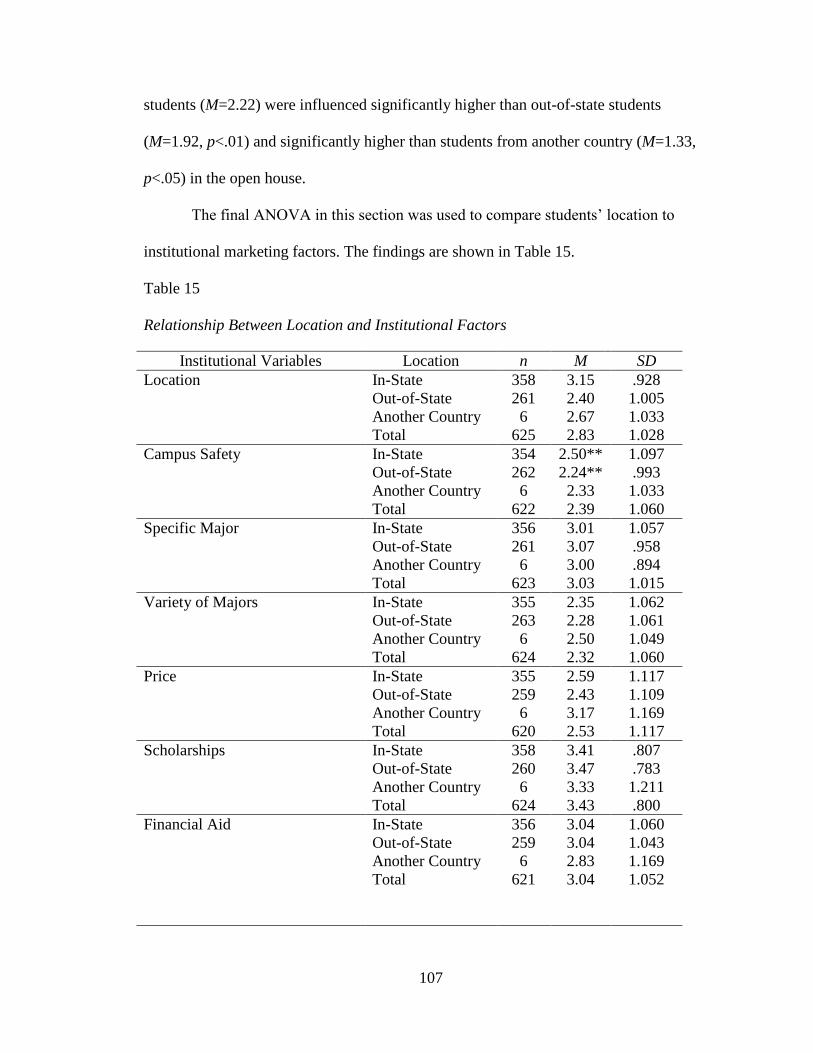
107
students (M=2.22) were influenced significantly higher than out-of-state students
(M=1.92, p<.01) and significantly higher than students from another country (M=1.33,
p<.05) in the open house.
The final ANOVA in this section was used to compare students’ location to
institutional marketing factors. The findings are shown in Table 15.
Table 15
Relationship Between Location and Institutional Factors
Institutional Variables Location n M SD
Location In-State 358 3.15 .928
Out-of-State 261 2.40 1.005
Another Country 6 2.67 1.033
Total 625 2.83 1.028
Campus Safety In-State 354 2.50** 1.097
Out-of-State 262 2.24** .993
Another Country 6 2.33 1.033
Total 622 2.39 1.060
Specific Major In-State 356 3.01 1.057
Out-of-State 261 3.07 .958
Another Country 6 3.00 .894
Total 623 3.03 1.015
Variety of Majors In-State 355 2.35 1.062
Out-of-State 263 2.28 1.061
Another Country 6 2.50 1.049
Total 624 2.32 1.060
Price In-State 355 2.59 1.117
Out-of-State 259 2.43 1.109
Another Country 6 3.17 1.169
Total 620 2.53 1.117
Scholarships In-State 358 3.41 .807
Out-of-State 260 3.47 .783
Another Country 6 3.33 1.211
Total 624 3.43 .800
Financial Aid In-State 356 3.04 1.060
Out-of-State 259 3.04 1.043
Another Country 6 2.83 1.169
Total 621 3.04 1.052
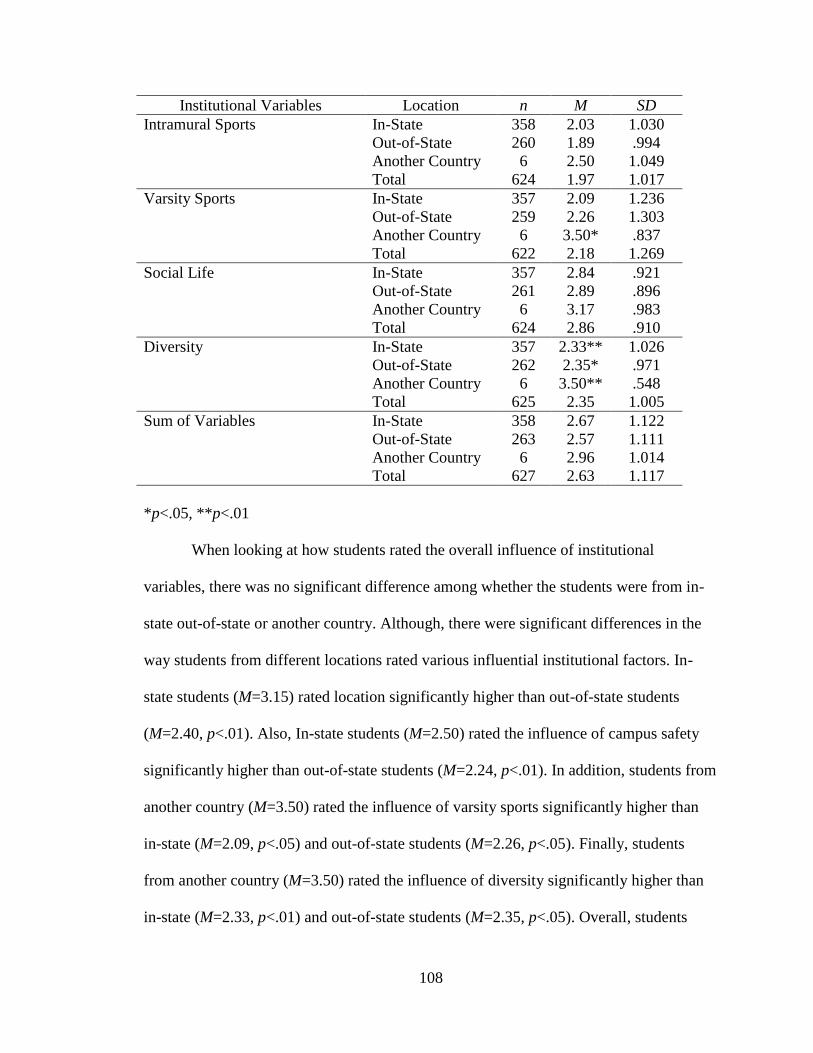
108
Institutional Variables Location n M SD
Intramural Sports In-State 358 2.03 1.030
Out-of-State 260 1.89 .994
Another Country 6 2.50 1.049
Total 624 1.97 1.017
Varsity Sports In-State 357 2.09 1.236
Out-of-State 259 2.26 1.303
Another Country 6 3.50* .837
Total 622 2.18 1.269
Social Life In-State 357 2.84 .921
Out-of-State 261 2.89 .896
Another Country 6 3.17 .983
Total 624 2.86 .910
Diversity In-State 357 2.33** 1.026
Out-of-State 262 2.35* .971
Another Country 6 3.50** .548
Total 625 2.35 1.005
Sum of Variables In-State 358 2.67 1.122
Out-of-State 263 2.57 1.111
Another Country 6 2.96 1.014
Total 627 2.63 1.117
*p<.05, **p<.01
When looking at how students rated the overall influence of institutional
variables, there was no significant difference among whether the students were from in-
state out-of-state or another country. Although, there were significant differences in the
way students from different locations rated various influential institutional factors. In-
state students (M=3.15) rated location significantly higher than out-of-state students
(M=2.40, p<.01). Also, In-state students (M=2.50) rated the influence of campus safety
significantly higher than out-of-state students (M=2.24, p<.01). In addition, students from
another country (M=3.50) rated the influence of varsity sports significantly higher than
in-state (M=2.09, p<.05) and out-of-state students (M=2.26, p<.05). Finally, students
from another country (M=3.50) rated the influence of diversity significantly higher than
in-state (M=2.33, p<.01) and out-of-state students (M=2.35, p<.05). Overall, students
109
from another country (M=2.96) were influenced the most by institutional factors, while
out-of-state students (M=2.57) were influenced the least by these factors.
Relationship Between Community and College-Choice Factors
ANOVAs were used to determine if there was a significant difference between
students’ community and what may have influenced their college-choice decision. In
Table 16, students’ community is compared to non-marketing college-choice factors.

110
Table 16
Relationship Between Community and Non-Marketing Factors
Non-Marketing Variables Community n M SD
Father Urban 109 2.77 1.006
Suburban 333 2.62 1.073
Rural 175 2.56 1.020
Total 617 2.63 1.047
Mother Urban 109 2.99 .928
Suburban 333 2.86 1.020
Rural 172 2.83 .974
Total 614 2.88 .991
High School Counselor Urban 108 1.47 .791
Suburban 332 1.38 .699
Rural 173 1.35 .713
Total 613 1.39 .720
High School Teachers Urban 108 1.61 .874
Suburban 329 1.47 .785
Rural 174 1.54 .830
Total 611 1.51 .814
Friends Urban 109 2.11 1.117
Suburban 330 2.13 .971
Rural 174 2.11 1.030
Total 613 2.12 1.013
Current Students Urban 108 2.65 1.088
Suburban 333 2.48 1.121
Rural 176 2.55 1.035
Total 617 2.53 1.091
Alums Urban 108 2.16 1.153
Suburban 331 2.15 1.185
Rural 174 2.25 1.145
Total 613 2.18 1.167
Sum of Variables Urban 110 2.25 1.133
Suburban 333 2.16 1.208
Rural 176 2.17 1.096
Total 619 2.18 1.116
*p<.05, **p<.01
111
Results of Table 16 revealed that there was no significant difference between the
community in which students grew up and their ratings of influence of any non-
marketing college-choice factor. Overall, students from urban communities (M=2.25)
rated the influence of non-marketing factors the highest and students from suburban
communities (M=2.16) rated the influence of non-marketing factors the lowest.
The next ANOVA in this section was used to find out the relationship between
students’ community and marketing college-choice factors. The results are listed in Table
17.
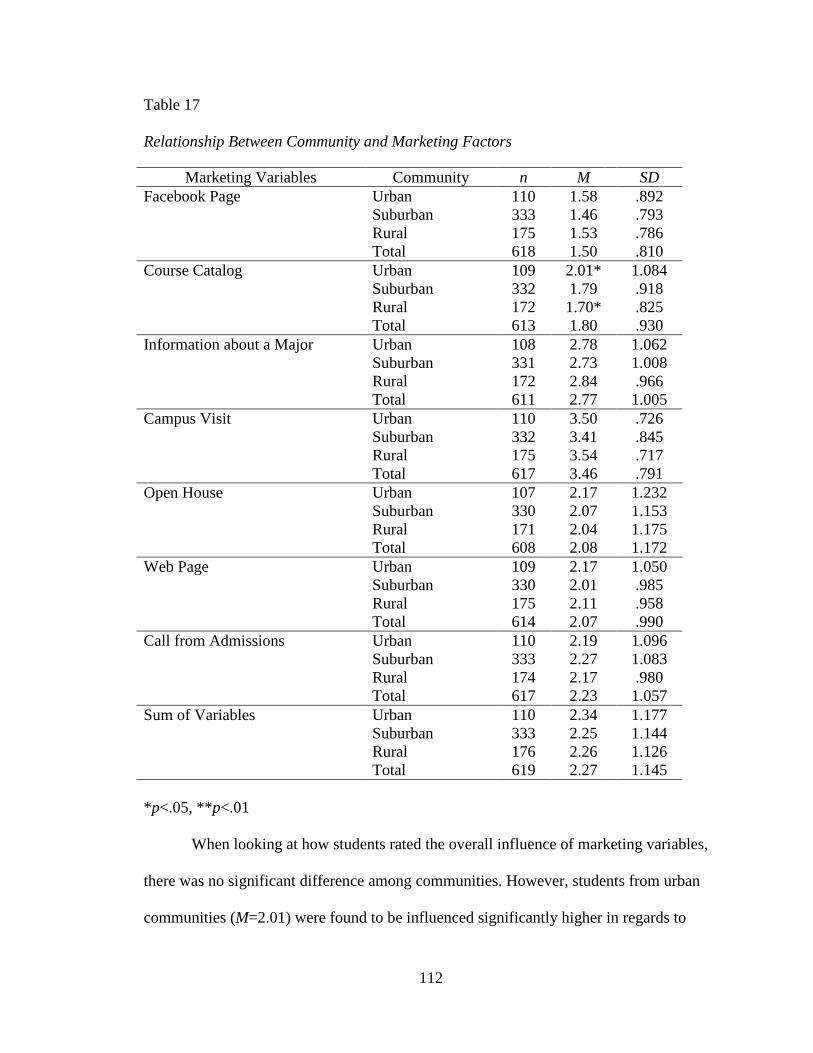
112
Table 17
Relationship Between Community and Marketing Factors
Marketing Variables Community n M SD
Facebook Page Urban 110 1.58 .892
Suburban 333 1.46 .793
Rural 175 1.53 .786
Total 618 1.50 .810
Course Catalog Urban 109 2.01* 1.084
Suburban 332 1.79 .918
Rural 172 1.70* .825
Total 613 1.80 .930
Information about a Major Urban 108 2.78 1.062
Suburban 331 2.73 1.008
Rural 172 2.84 .966
Total 611 2.77 1.005
Campus Visit Urban 110 3.50 .726
Suburban 332 3.41 .845
Rural 175 3.54 .717
Total 617 3.46 .791
Open House Urban 107 2.17 1.232
Suburban 330 2.07 1.153
Rural 171 2.04 1.175
Total 608 2.08 1.172
Web Page Urban 109 2.17 1.050
Suburban 330 2.01 .985
Rural 175 2.11 .958
Total 614 2.07 .990
Call from Admissions Urban 110 2.19 1.096
Suburban 333 2.27 1.083
Rural 174 2.17 .980
Total 617 2.23 1.057
Sum of Variables Urban 110 2.34 1.177
Suburban 333 2.25 1.144
Rural 176 2.26 1.126
Total 619 2.27 1.145
*p<.05, **p<.01
When looking at how students rated the overall influence of marketing variables,
there was no significant difference among communities. However, students from urban
communities (M=2.01) were found to be influenced significantly higher in regards to
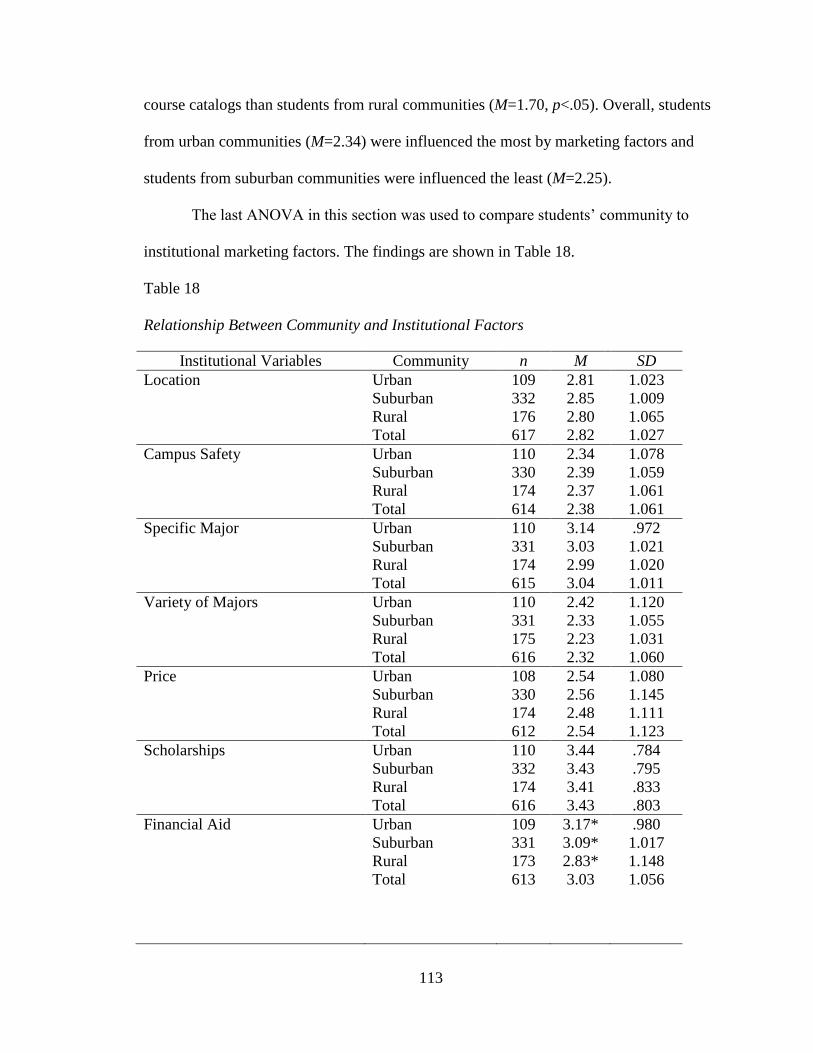
113
course catalogs than students from rural communities (M=1.70, p<.05). Overall, students
from urban communities (M=2.34) were influenced the most by marketing factors and
students from suburban communities were influenced the least (M=2.25).
The last ANOVA in this section was used to compare students’ community to
institutional marketing factors. The findings are shown in Table 18.
Table 18
Relationship Between Community and Institutional Factors
Institutional Variables Community n M SD
Location Urban 109 2.81 1.023
Suburban 332 2.85 1.009
Rural 176 2.80 1.065
Total 617 2.82 1.027
Campus Safety Urban 110 2.34 1.078
Suburban 330 2.39 1.059
Rural 174 2.37 1.061
Total 614 2.38 1.061
Specific Major Urban 110 3.14 .972
Suburban 331 3.03 1.021
Rural 174 2.99 1.020
Total 615 3.04 1.011
Variety of Majors Urban 110 2.42 1.120
Suburban 331 2.33 1.055
Rural 175 2.23 1.031
Total 616 2.32 1.060
Price Urban 108 2.54 1.080
Suburban 330 2.56 1.145
Rural 174 2.48 1.111
Total 612 2.54 1.123
Scholarships Urban 110 3.44 .784
Suburban 332 3.43 .795
Rural 174 3.41 .833
Total 616 3.43 .803
Financial Aid Urban 109 3.17* .980
Suburban 331 3.09* 1.017
Rural 173 2.83* 1.148
Total 613 3.03 1.056
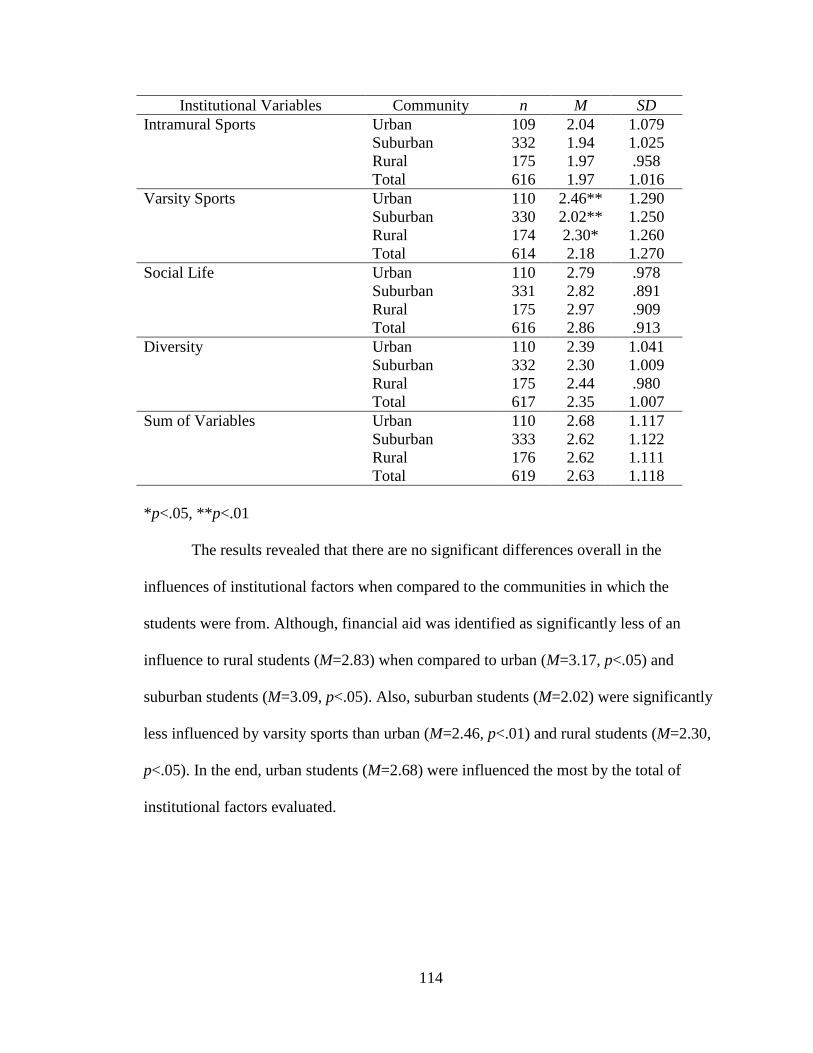
114
Institutional Variables Community n M SD
Intramural Sports Urban 109 2.04 1.079
Suburban 332 1.94 1.025
Rural 175 1.97 .958
Total 616 1.97 1.016
Varsity Sports Urban 110 2.46** 1.290
Suburban 330 2.02** 1.250
Rural 174 2.30* 1.260
Total 614 2.18 1.270
Social Life Urban 110 2.79 .978
Suburban 331 2.82 .891
Rural 175 2.97 .909
Total 616 2.86 .913
Diversity Urban 110 2.39 1.041
Suburban 332 2.30 1.009
Rural 175 2.44 .980
Total 617 2.35 1.007
Sum of Variables Urban 110 2.68 1.117
Suburban 333 2.62 1.122
Rural 176 2.62 1.111
Total 619 2.63 1.118
*p<.05, **p<.01
The results revealed that there are no significant differences overall in the
influences of institutional factors when compared to the communities in which the
students were from. Although, financial aid was identified as significantly less of an
influence to rural students (M=2.83) when compared to urban (M=3.17, p<.05) and
suburban students (M=3.09, p<.05). Also, suburban students (M=2.02) were significantly
less influenced by varsity sports than urban (M=2.46, p<.01) and rural students (M=2.30,
p<.05). In the end, urban students (M=2.68) were influenced the most by the total of
institutional factors evaluated.
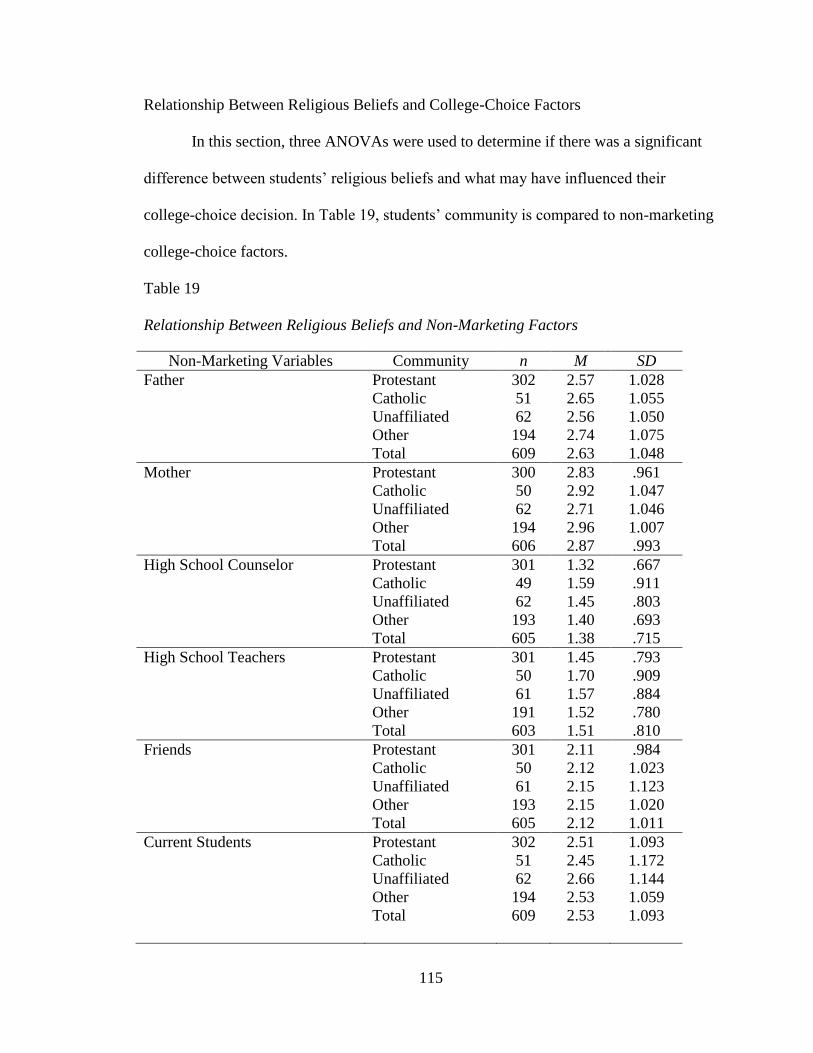
115
Relationship Between Religious Beliefs and College-Choice Factors
In this section, three ANOVAs were used to determine if there was a significant
difference between students’ religious beliefs and what may have influenced their
college-choice decision. In Table 19, students’ community is compared to non-marketing
college-choice factors.
Table 19
Relationship Between Religious Beliefs and Non-Marketing Factors
Non-Marketing Variables Community n M SD
Father Protestant 302 2.57 1.028
Catholic 51 2.65 1.055
Unaffiliated 62 2.56 1.050
Other 194 2.74 1.075
Total 609 2.63 1.048
Mother Protestant 300 2.83 .961
Catholic 50 2.92 1.047
Unaffiliated 62 2.71 1.046
Other 194 2.96 1.007
Total 606 2.87 .993
High School Counselor Protestant 301 1.32 .667
Catholic 49 1.59 .911
Unaffiliated 62 1.45 .803
Other 193 1.40 .693
Total 605 1.38 .715
High School Teachers Protestant 301 1.45 .793
Catholic 50 1.70 .909
Unaffiliated 61 1.57 .884
Other 191 1.52 .780
Total 603 1.51 .810
Friends Protestant 301 2.11 .984
Catholic 50 2.12 1.023
Unaffiliated 61 2.15 1.123
Other 193 2.15 1.020
Total 605 2.12 1.011
Current Students Protestant 302 2.51 1.093
Catholic 51 2.45 1.172
Unaffiliated 62 2.66 1.144
Other 194 2.53 1.059
Total 609 2.53 1.093
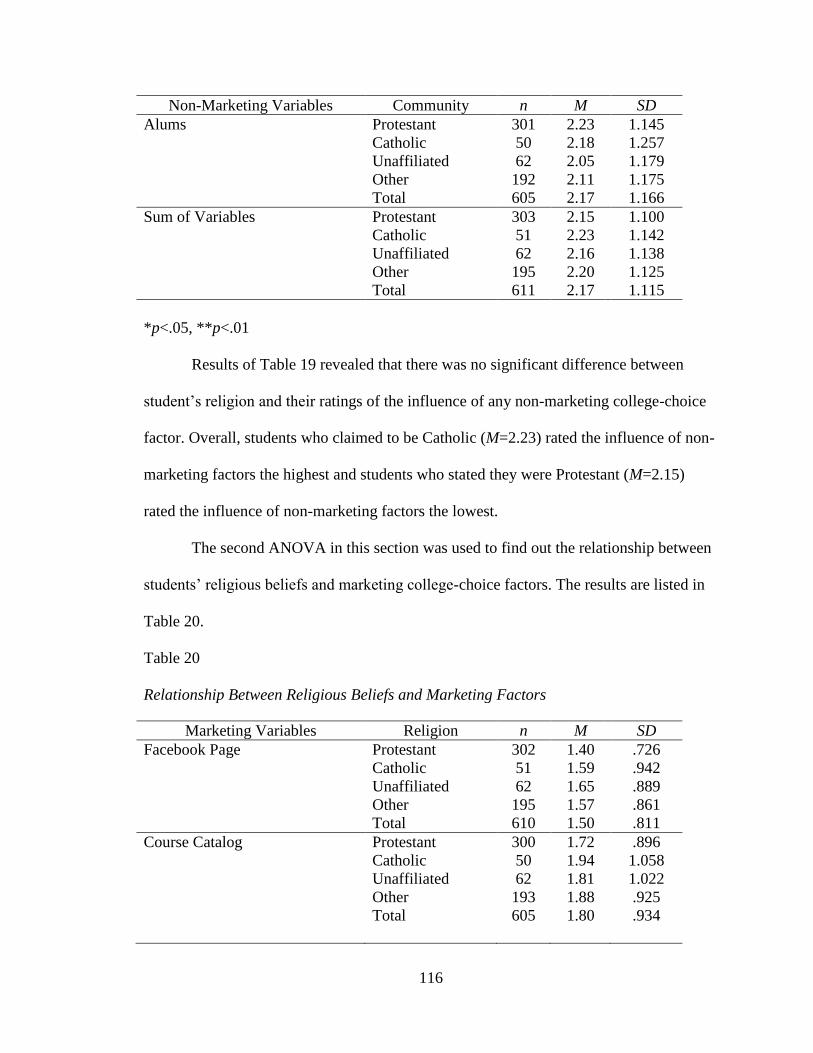
116
Non-Marketing Variables Community n M SD
Alums Protestant 301 2.23 1.145
Catholic 50 2.18 1.257
Unaffiliated 62 2.05 1.179
Other 192 2.11 1.175
Total 605 2.17 1.166
Sum of Variables Protestant 303 2.15 1.100
Catholic 51 2.23 1.142
Unaffiliated 62 2.16 1.138
Other 195 2.20 1.125
Total 611 2.17 1.115
*p<.05, **p<.01
Results of Table 19 revealed that there was no significant difference between
student’s religion and their ratings of the influence of any non-marketing college-choice
factor. Overall, students who claimed to be Catholic (M=2.23) rated the influence of non-
marketing factors the highest and students who stated they were Protestant (M=2.15)
rated the influence of non-marketing factors the lowest.
The second ANOVA in this section was used to find out the relationship between
students’ religious beliefs and marketing college-choice factors. The results are listed in
Table 20.
Table 20
Relationship Between Religious Beliefs and Marketing Factors
Marketing Variables Religion n M SD
Facebook Page Protestant 302 1.40 .726
Catholic 51 1.59 .942
Unaffiliated 62 1.65 .889
Other 195 1.57 .861
Total 610 1.50 .811
Course Catalog Protestant 300 1.72 .896
Catholic 50 1.94 1.058
Unaffiliated 62 1.81 1.022
Other 193 1.88 .925
Total 605 1.80 .934
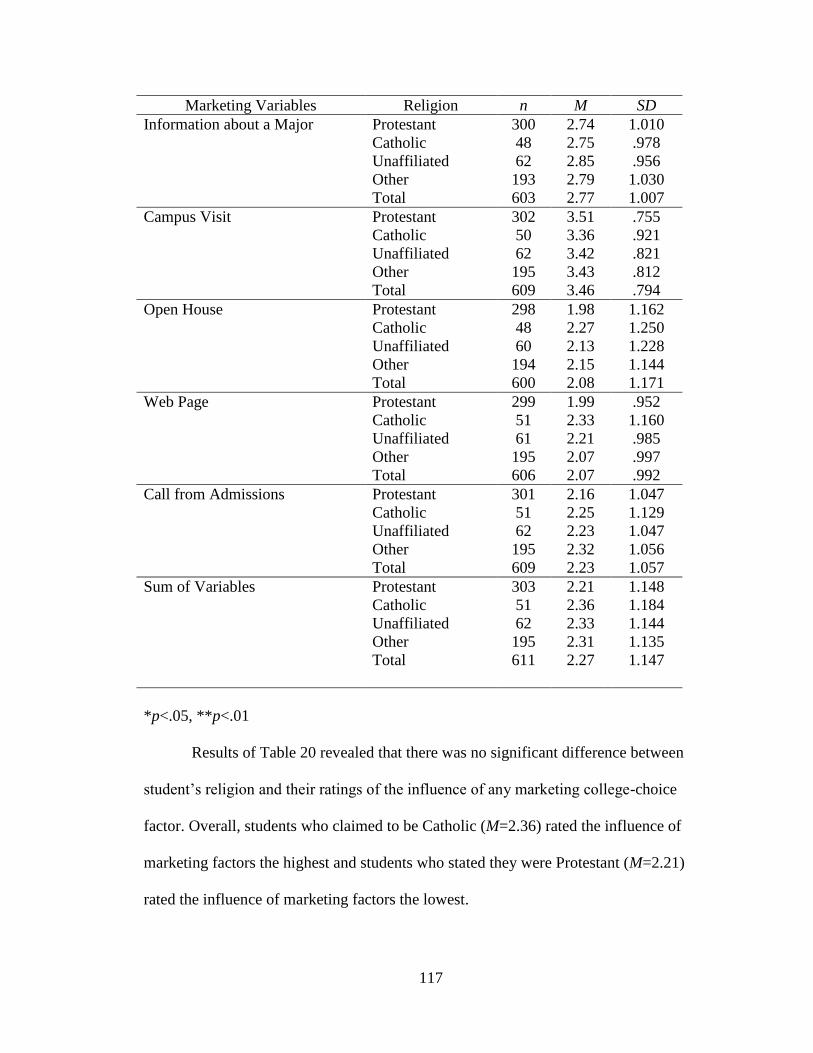
117
Marketing Variables Religion n M SD
Information about a Major Protestant 300 2.74 1.010
Catholic 48 2.75 .978
Unaffiliated 62 2.85 .956
Other 193 2.79 1.030
Total 603 2.77 1.007
Campus Visit Protestant 302 3.51 .755
Catholic 50 3.36 .921
Unaffiliated 62 3.42 .821
Other 195 3.43 .812
Total 609 3.46 .794
Open House Protestant 298 1.98 1.162
Catholic 48 2.27 1.250
Unaffiliated 60 2.13 1.228
Other 194 2.15 1.144
Total 600 2.08 1.171
Web Page Protestant 299 1.99 .952
Catholic 51 2.33 1.160
Unaffiliated 61 2.21 .985
Other 195 2.07 .997
Total 606 2.07 .992
Call from Admissions Protestant 301 2.16 1.047
Catholic 51 2.25 1.129
Unaffiliated 62 2.23 1.047
Other 195 2.32 1.056
Total 609 2.23 1.057
Sum of Variables Protestant 303 2.21 1.148
Catholic 51 2.36 1.184
Unaffiliated 62 2.33 1.144
Other 195 2.31 1.135
Total 611 2.27 1.147
*p<.05, **p<.01
Results of Table 20 revealed that there was no significant difference between
student’s religion and their ratings of the influence of any marketing college-choice
factor. Overall, students who claimed to be Catholic (M=2.36) rated the influence of
marketing factors the highest and students who stated they were Protestant (M=2.21)
rated the influence of marketing factors the lowest.
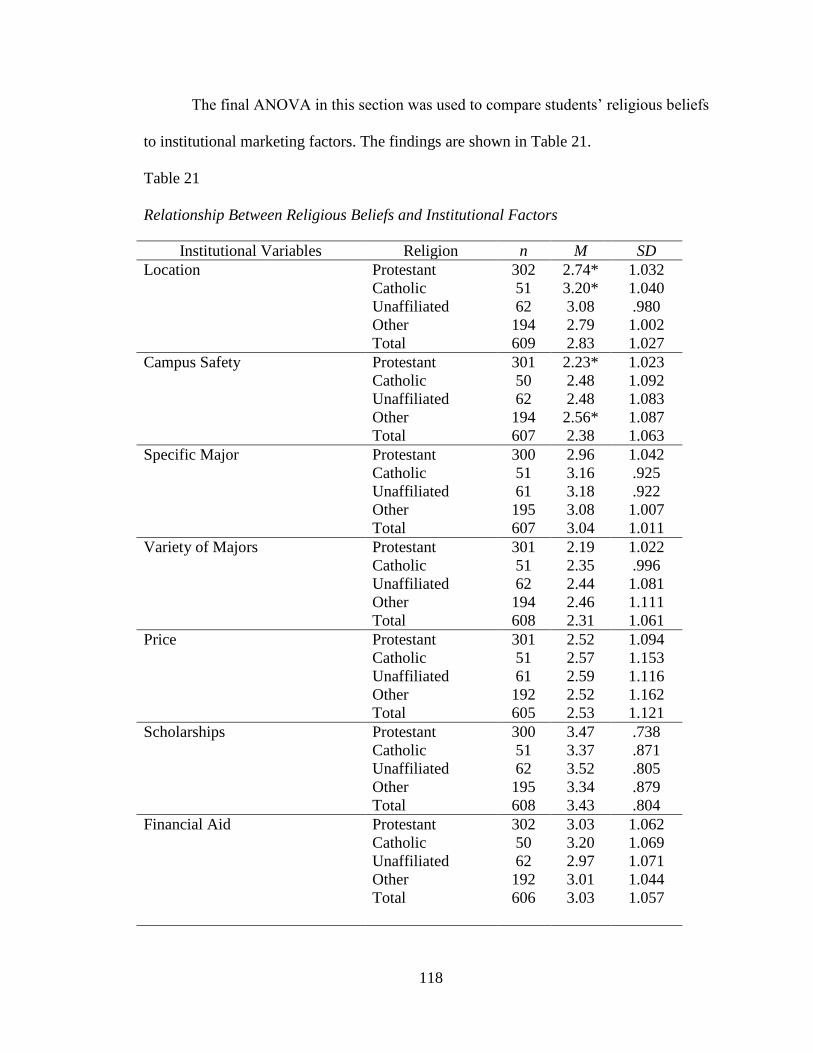
118
The final ANOVA in this section was used to compare students’ religious beliefs
to institutional marketing factors. The findings are shown in Table 21.
Table 21
Relationship Between Religious Beliefs and Institutional Factors
Institutional Variables Religion n M SD
Location Protestant 302 2.74* 1.032
Catholic 51 3.20* 1.040
Unaffiliated 62 3.08 .980
Other 194 2.79 1.002
Total 609 2.83 1.027
Campus Safety Protestant 301 2.23* 1.023
Catholic 50 2.48 1.092
Unaffiliated 62 2.48 1.083
Other 194 2.56* 1.087
Total 607 2.38 1.063
Specific Major Protestant 300 2.96 1.042
Catholic 51 3.16 .925
Unaffiliated 61 3.18 .922
Other 195 3.08 1.007
Total 607 3.04 1.011
Variety of Majors Protestant 301 2.19 1.022
Catholic 51 2.35 .996
Unaffiliated 62 2.44 1.081
Other 194 2.46 1.111
Total 608 2.31 1.061
Price Protestant 301 2.52 1.094
Catholic 51 2.57 1.153
Unaffiliated 61 2.59 1.116
Other 192 2.52 1.162
Total 605 2.53 1.121
Scholarships Protestant 300 3.47 .738
Catholic 51 3.37 .871
Unaffiliated 62 3.52 .805
Other 195 3.34 .879
Total 608 3.43 .804
Financial Aid Protestant 302 3.03 1.062
Catholic 50 3.20 1.069
Unaffiliated 62 2.97 1.071
Other 192 3.01 1.044
Total 606 3.03 1.057
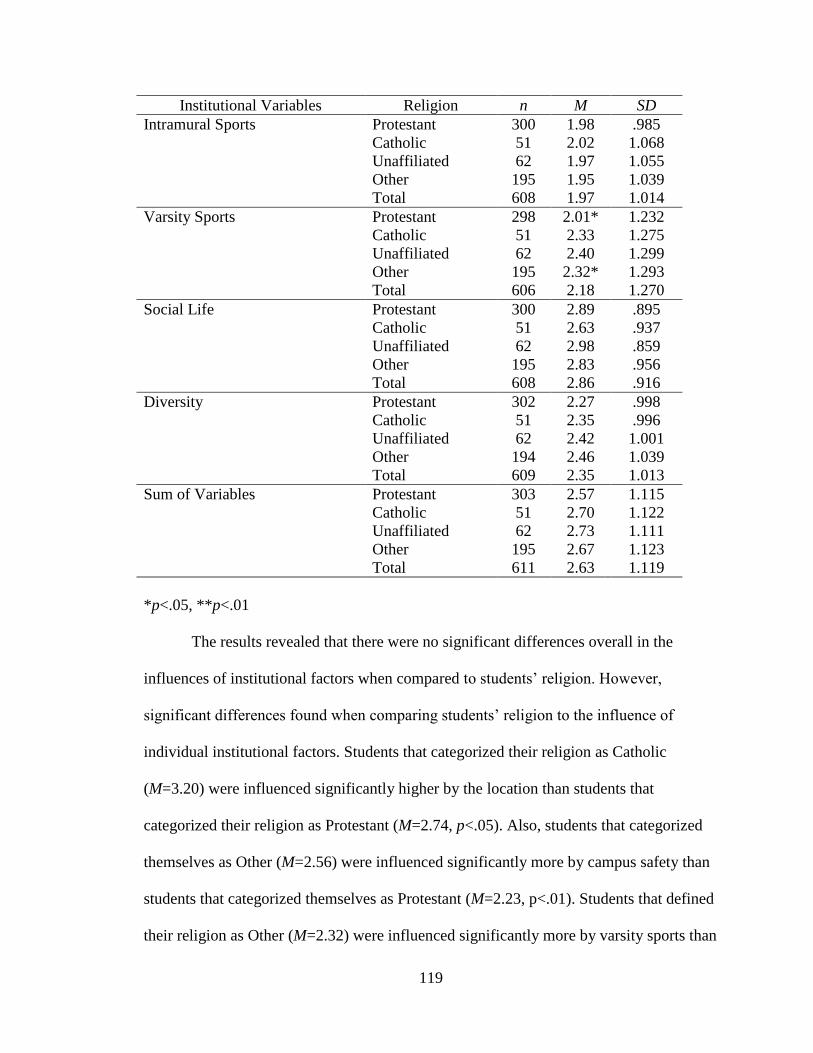
119
Institutional Variables Religion n M SD
Intramural Sports Protestant 300 1.98 .985
Catholic 51 2.02 1.068
Unaffiliated 62 1.97 1.055
Other 195 1.95 1.039
Total 608 1.97 1.014
Varsity Sports Protestant 298 2.01* 1.232
Catholic 51 2.33 1.275
Unaffiliated 62 2.40 1.299
Other 195 2.32* 1.293
Total 606 2.18 1.270
Social Life Protestant 300 2.89 .895
Catholic 51 2.63 .937
Unaffiliated 62 2.98 .859
Other 195 2.83 .956
Total 608 2.86 .916
Diversity Protestant 302 2.27 .998
Catholic 51 2.35 .996
Unaffiliated 62 2.42 1.001
Other 194 2.46 1.039
Total 609 2.35 1.013
Sum of Variables Protestant 303 2.57 1.115
Catholic 51 2.70 1.122
Unaffiliated 62 2.73 1.111
Other 195 2.67 1.123
Total 611 2.63 1.119
*p<.05, **p<.01
The results revealed that there were no significant differences overall in the
influences of institutional factors when compared to students’ religion. However,
significant differences found when comparing students’ religion to the influence of
individual institutional factors. Students that categorized their religion as Catholic
(M=3.20) were influenced significantly higher by the location than students that
categorized their religion as Protestant (M=2.74, p<.05). Also, students that categorized
themselves as Other (M=2.56) were influenced significantly more by campus safety than
students that categorized themselves as Protestant (M=2.23, p<.01). Students that defined
their religion as Other (M=2.32) were influenced significantly more by varsity sports than
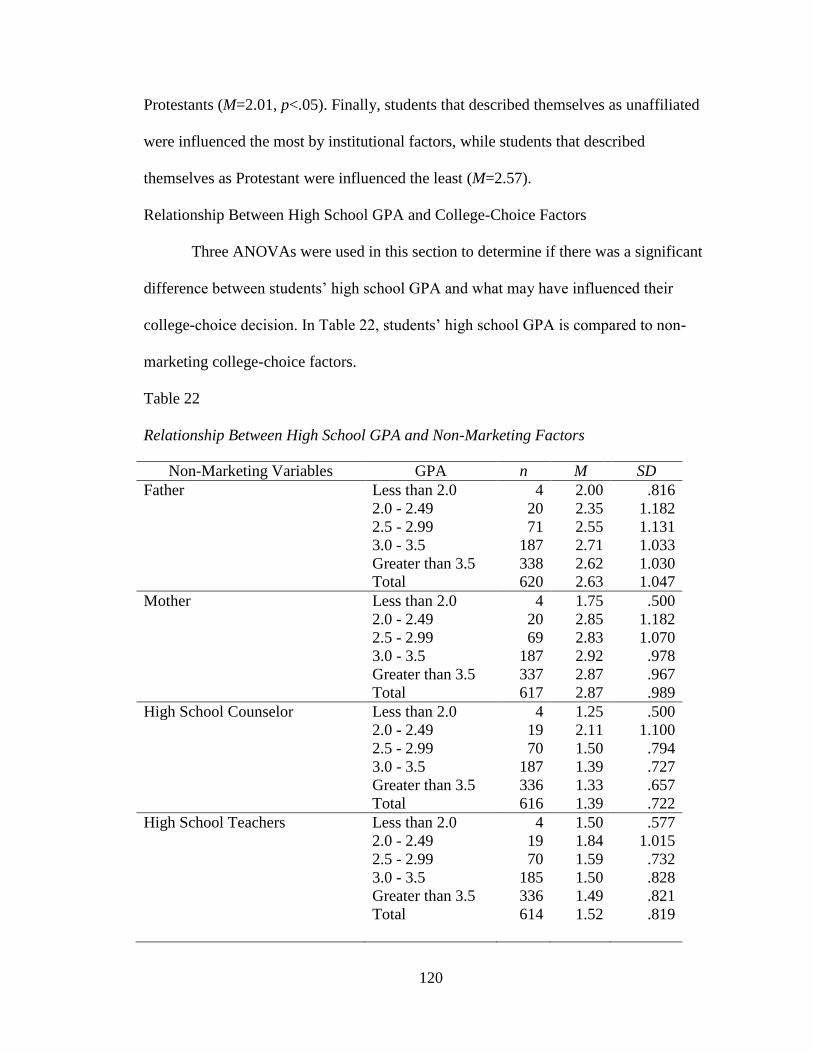
120
Protestants (M=2.01, p<.05). Finally, students that described themselves as unaffiliated
were influenced the most by institutional factors, while students that described
themselves as Protestant were influenced the least (M=2.57).
Relationship Between High School GPA and College-Choice Factors
Three ANOVAs were used in this section to determine if there was a significant
difference between students’ high school GPA and what may have influenced their
college-choice decision. In Table 22, students’ high school GPA is compared to non-
marketing college-choice factors.
Table 22
Relationship Between High School GPA and Non-Marketing Factors
Non-Marketing Variables GPA n M SD
Father Less than 2.0 4 2.00 .816
2.0 - 2.49 20 2.35 1.182
2.5 - 2.99 71 2.55 1.131
3.0 - 3.5 187 2.71 1.033
Greater than 3.5 338 2.62 1.030
Total 620 2.63 1.047
Mother Less than 2.0 4 1.75 .500
2.0 - 2.49 20 2.85 1.182
2.5 - 2.99 69 2.83 1.070
3.0 - 3.5 187 2.92 .978
Greater than 3.5 337 2.87 .967
Total 617 2.87 .989
High School Counselor Less than 2.0 4 1.25 .500
2.0 - 2.49 19 2.11 1.100
2.5 - 2.99 70 1.50 .794
3.0 - 3.5 187 1.39 .727
Greater than 3.5 336 1.33 .657
Total 616 1.39 .722
High School Teachers Less than 2.0 4 1.50 .577
2.0 - 2.49 19 1.84 1.015
2.5 - 2.99 70 1.59 .732
3.0 - 3.5 185 1.50 .828
Greater than 3.5 336 1.49 .821
Total 614 1.52 .819
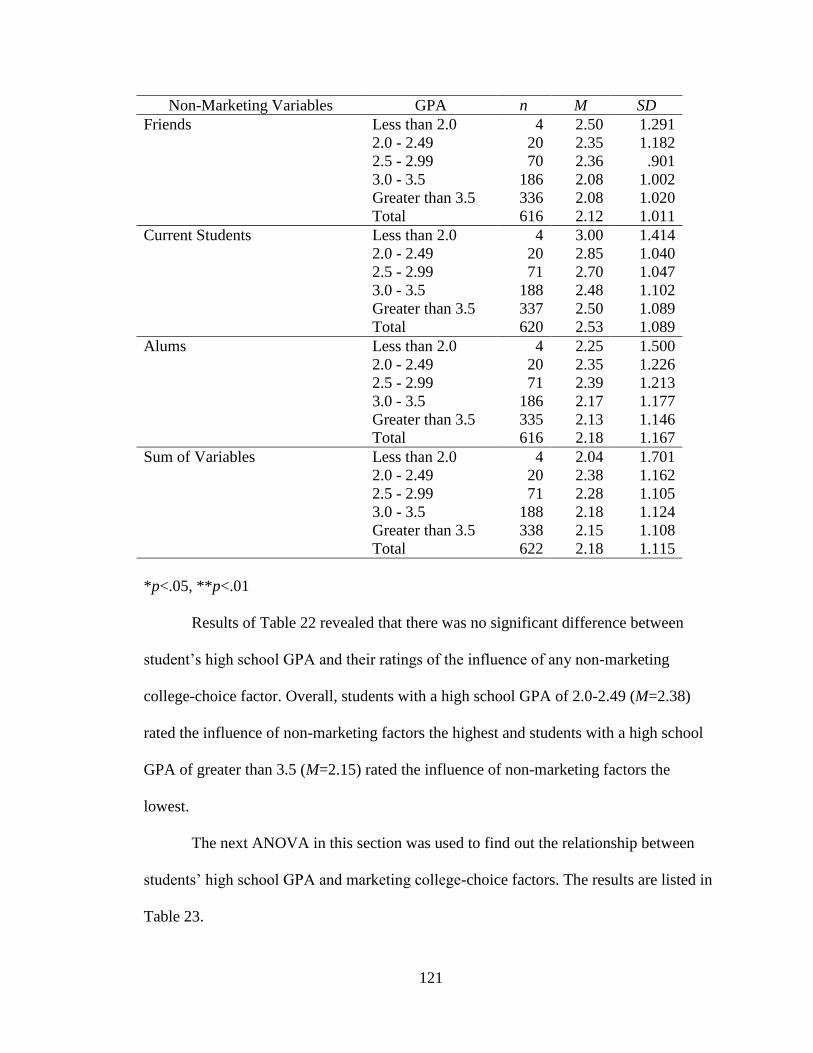
121
Non-Marketing Variables GPA n M SD
Friends Less than 2.0 4 2.50 1.291
2.0 - 2.49 20 2.35 1.182
2.5 - 2.99 70 2.36 .901
3.0 - 3.5 186 2.08 1.002
Greater than 3.5 336 2.08 1.020
Total 616 2.12 1.011
Current Students Less than 2.0 4 3.00 1.414
2.0 - 2.49 20 2.85 1.040
2.5 - 2.99 71 2.70 1.047
3.0 - 3.5 188 2.48 1.102
Greater than 3.5 337 2.50 1.089
Total 620 2.53 1.089
Alums Less than 2.0 4 2.25 1.500
2.0 - 2.49 20 2.35 1.226
2.5 - 2.99 71 2.39 1.213
3.0 - 3.5 186 2.17 1.177
Greater than 3.5 335 2.13 1.146
Total 616 2.18 1.167
Sum of Variables Less than 2.0 4 2.04 1.701
2.0 - 2.49 20 2.38 1.162
2.5 - 2.99 71 2.28 1.105
3.0 - 3.5 188 2.18 1.124
Greater than 3.5 338 2.15 1.108
Total 622 2.18 1.115
*p<.05, **p<.01
Results of Table 22 revealed that there was no significant difference between
student’s high school GPA and their ratings of the influence of any non-marketing
college-choice factor. Overall, students with a high school GPA of 2.0-2.49 (M=2.38)
rated the influence of non-marketing factors the highest and students with a high school
GPA of greater than 3.5 (M=2.15) rated the influence of non-marketing factors the
lowest.
The next ANOVA in this section was used to find out the relationship between
students’ high school GPA and marketing college-choice factors. The results are listed in
Table 23.
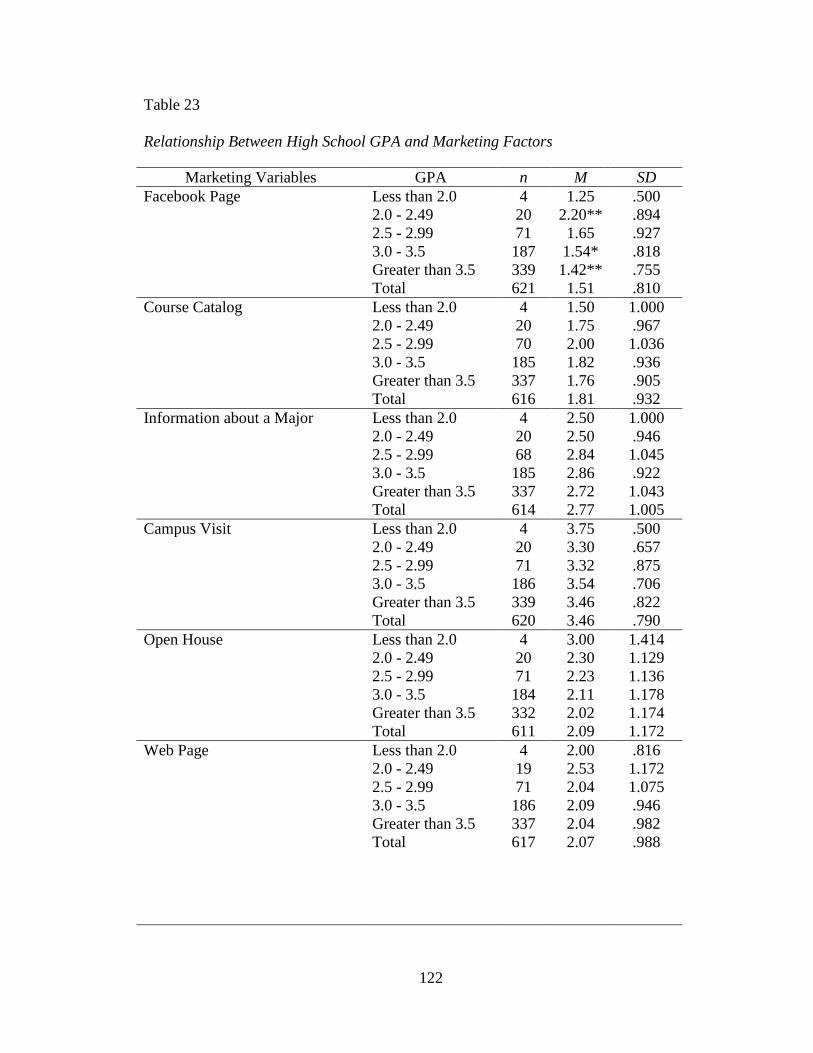
122
Table 23
Relationship Between High School GPA and Marketing Factors
Marketing Variables GPA n M SD
Facebook Page Less than 2.0 4 1.25 .500
2.0 - 2.49 20 2.20** .894
2.5 - 2.99 71 1.65 .927
3.0 - 3.5 187 1.54* .818
Greater than 3.5 339 1.42** .755
Total 621 1.51 .810
Course Catalog Less than 2.0 4 1.50 1.000
2.0 - 2.49 20 1.75 .967
2.5 - 2.99 70 2.00 1.036
3.0 - 3.5 185 1.82 .936
Greater than 3.5 337 1.76 .905
Total 616 1.81 .932
Information about a Major Less than 2.0 4 2.50 1.000
2.0 - 2.49 20 2.50 .946
2.5 - 2.99 68 2.84 1.045
3.0 - 3.5 185 2.86 .922
Greater than 3.5 337 2.72 1.043
Total 614 2.77 1.005
Campus Visit Less than 2.0 4 3.75 .500
2.0 - 2.49 20 3.30 .657
2.5 - 2.99 71 3.32 .875
3.0 - 3.5 186 3.54 .706
Greater than 3.5 339 3.46 .822
Total 620 3.46 .790
Open House Less than 2.0 4 3.00 1.414
2.0 - 2.49 20 2.30 1.129
2.5 - 2.99 71 2.23 1.136
3.0 - 3.5 184 2.11 1.178
Greater than 3.5 332 2.02 1.174
Total 611 2.09 1.172
Web Page Less than 2.0 4 2.00 .816
2.0 - 2.49 19 2.53 1.172
2.5 - 2.99 71 2.04 1.075
3.0 - 3.5 186 2.09 .946
Greater than 3.5 337 2.04 .982
Total 617 2.07 .988
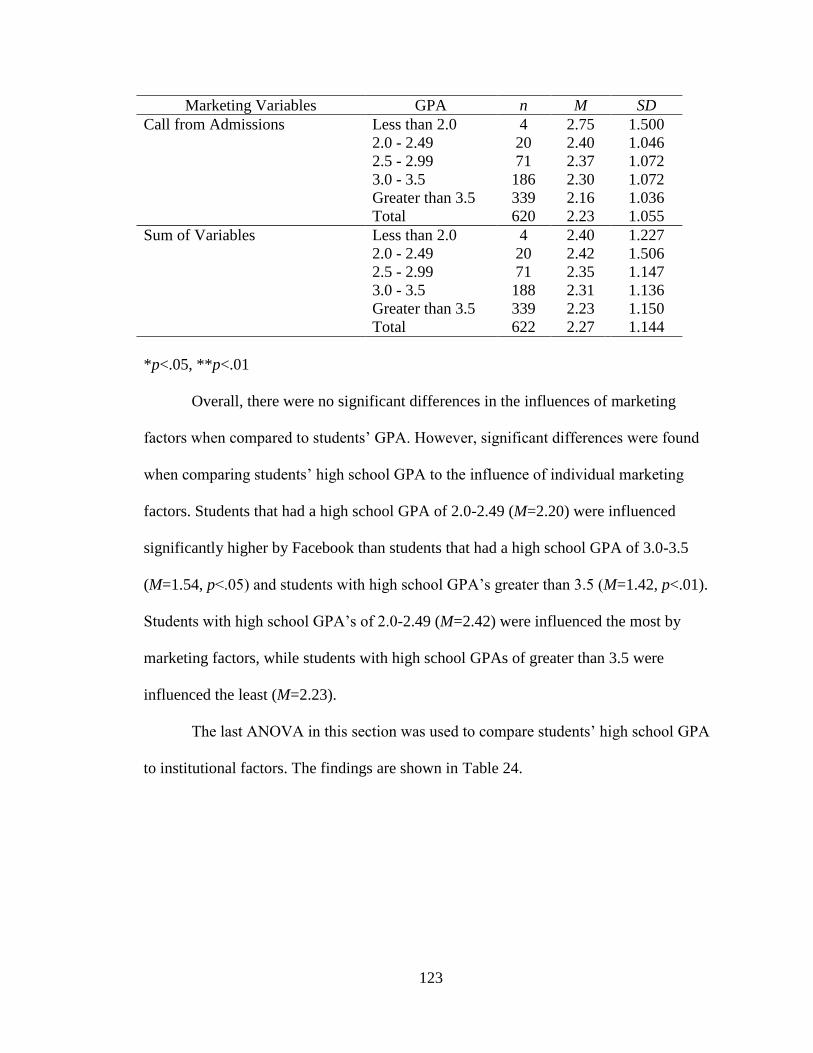
123
Marketing Variables GPA n M SD
Call from Admissions Less than 2.0 4 2.75 1.500
2.0 - 2.49 20 2.40 1.046
2.5 - 2.99 71 2.37 1.072
3.0 - 3.5 186 2.30 1.072
Greater than 3.5 339 2.16 1.036
Total 620 2.23 1.055
Sum of Variables Less than 2.0 4 2.40 1.227
2.0 - 2.49 20 2.42 1.506
2.5 - 2.99 71 2.35 1.147
3.0 - 3.5 188 2.31 1.136
Greater than 3.5 339 2.23 1.150
Total 622 2.27 1.144
*p<.05, **p<.01
Overall, there were no significant differences in the influences of marketing
factors when compared to students’ GPA. However, significant differences were found
when comparing students’ high school GPA to the influence of individual marketing
factors. Students that had a high school GPA of 2.0-2.49 (M=2.20) were influenced
significantly higher by Facebook than students that had a high school GPA of 3.0-3.5
(M=1.54, p<.05) and students with high school GPA’s greater than 3.5 (M=1.42, p<.01).
Students with high school GPA’s of 2.0-2.49 (M=2.42) were influenced the most by
marketing factors, while students with high school GPAs of greater than 3.5 were
influenced the least (M=2.23).
The last ANOVA in this section was used to compare students’ high school GPA
to institutional factors. The findings are shown in Table 24.

124
Table 24
Relationship Between High School GPA and Institutional Factors
Institutional Variables GPA n M SD
Location Less than 2.0 4 3.50 .577
2.0 - 2.49 20 3.15 .875
2.5 - 2.99 71 2.49* 1.054
3.0 - 3.5 186 2.81 1.027
Greater than 3.5 339 2.88* 1.015
Total 620 2.83 1.024
Campus Safety Less than 2.0 4 3.50 .577
2.0 - 2.49 20 2.40 1.046
2.5 - 2.99 69 2.42 1.143
3.0 - 3.5 187 2.43 1.111
Greater than 3.5 337 2.34 1.013
Total 617 2.38 1.060
Specific Major Less than 2.0 4 3.50 1.000
2.0 - 2.49 19 2.89 1.100
2.5 - 2.99 71 3.10 .973
3.0 - 3.5 187 3.09 .947
Greater than 3.5 337 3.00 1.049
Total 618 3.04 1.011
Variety of Majors Less than 2.0 4 3.00 1.155
2.0 - 2.49 18 2.56 1.199
2.5 - 2.99 71 2.48 1.080
3.0 - 3.5 188 2.26 1.045
Greater than 3.5 338 2.30 1.055
Total 619 2.32 1.060
Price Less than 2.0 4 1.75 1.500
2.0 - 2.49 20 2.45 1.191
2.5 - 2.99 69 2.13** 1.070
3.0 - 3.5 187 2.38** 1.098
Greater than 3.5 335 2.72** 1.101
Total 615 2.54 1.121
Scholarships Less than 2.0 4 2.50 1.291
2.0 - 2.49 20 2.95 .945
2.5 - 2.99 71 3.11** 1.076
3.0 - 3.5 187 3.32** .806
Greater than 3.5 337 3.59** .663
Total 619 3.42 .802
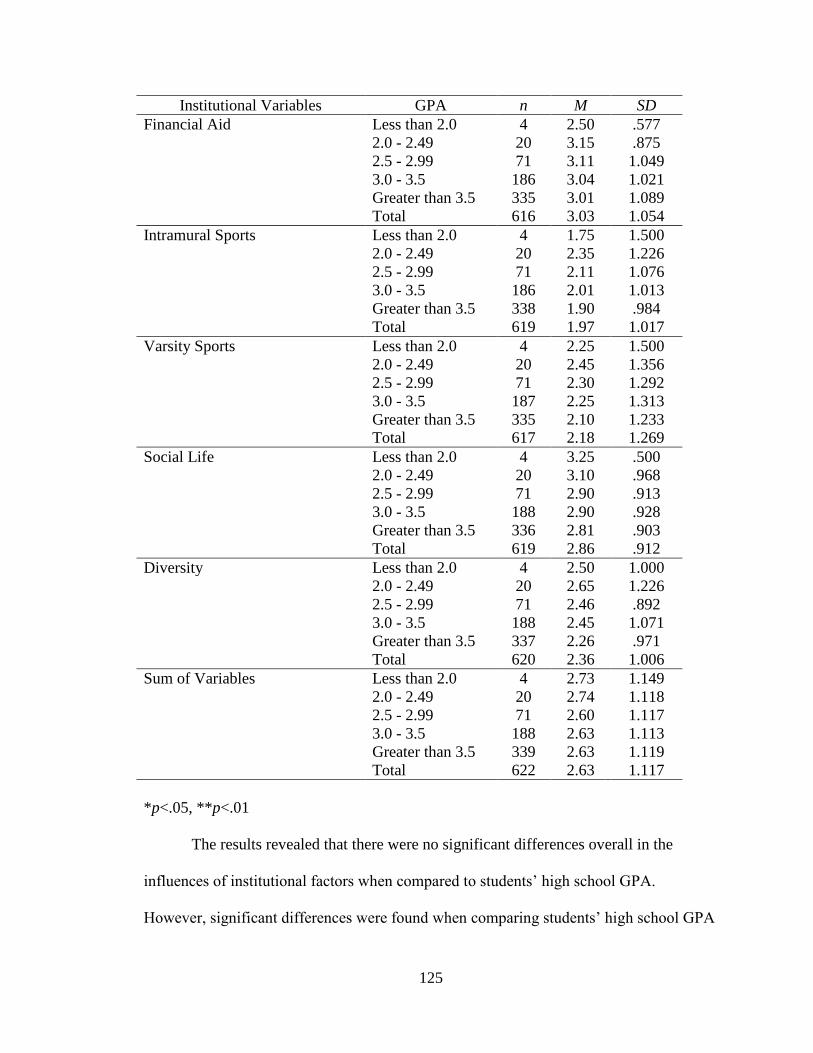
125
Institutional Variables GPA n M SD
Financial Aid Less than 2.0 4 2.50 .577
2.0 - 2.49 20 3.15 .875
2.5 - 2.99 71 3.11 1.049
3.0 - 3.5 186 3.04 1.021
Greater than 3.5 335 3.01 1.089
Total 616 3.03 1.054
Intramural Sports Less than 2.0 4 1.75 1.500
2.0 - 2.49 20 2.35 1.226
2.5 - 2.99 71 2.11 1.076
3.0 - 3.5 186 2.01 1.013
Greater than 3.5 338 1.90 .984
Total 619 1.97 1.017
Varsity Sports Less than 2.0 4 2.25 1.500
2.0 - 2.49 20 2.45 1.356
2.5 - 2.99 71 2.30 1.292
3.0 - 3.5 187 2.25 1.313
Greater than 3.5 335 2.10 1.233
Total 617 2.18 1.269
Social Life Less than 2.0 4 3.25 .500
2.0 - 2.49 20 3.10 .968
2.5 - 2.99 71 2.90 .913
3.0 - 3.5 188 2.90 .928
Greater than 3.5 336 2.81 .903
Total 619 2.86 .912
Diversity Less than 2.0 4 2.50 1.000
2.0 - 2.49 20 2.65 1.226
2.5 - 2.99 71 2.46 .892
3.0 - 3.5 188 2.45 1.071
Greater than 3.5 337 2.26 .971
Total 620 2.36 1.006
Sum of Variables Less than 2.0 4 2.73 1.149
2.0 - 2.49 20 2.74 1.118
2.5 - 2.99 71 2.60 1.117
3.0 - 3.5 188 2.63 1.113
Greater than 3.5 339 2.63 1.119
Total 622 2.63 1.117
*p<.05, **p<.01
The results revealed that there were no significant differences overall in the
influences of institutional factors when compared to students’ high school GPA.
However, significant differences were found when comparing students’ high school GPA
126
to the influence of individual institutional factors. Students with high school GPA’s
greater than 3.5 (M=2.72) were influenced significantly greater by price than students
with high school GPA’s between 2.5-2.99 (M=2.13, p<.01) and students with high school
GPA’s between 3.0-3.5 (M=2.38, p<.01). Students with high school GPAs of 3.5 or
greater (M=2.88) were influenced significantly higher by the location than students with a
high school GPA between 2.5-2.99 (M= 2.49, p<.05). Also, students with high school
GPA’s greater than 3.5 (M=3.59) were influenced significantly greater by scholarships
than students with high school GPAs between 2.5-2.99 (M=3.11, p<.01) and students
with high school GPAs between 3.0 and 3.5 (M=3.32, p<.01). Finally, students with high
school GPA’s between 2.0-2.49 (M=2.74) were influenced the most by institutional
factors, while students with high school GPA’s between 2.5-2.99 were influenced the
least (M=2.60).
Relationship Between Parents’ Highest Level of Education and College-Choice Factors
In this section, three ANOVAs were used to determine if there was a significant
difference between students’ parents’ highest level of education completed and what may
have influenced their college-choice decision. In Table 25, students’ parents’ highest
level of education completed is compared to non-marketing college-choice factors.
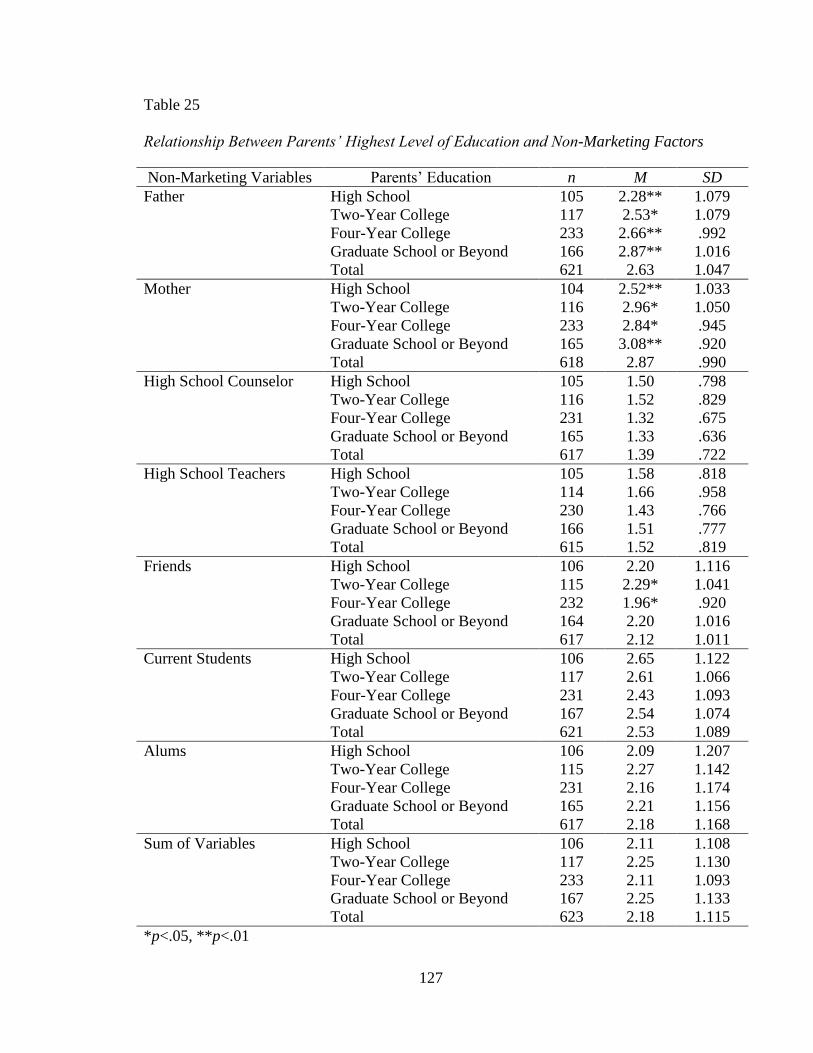
127
Table 25
Relationship Between Parents’ Highest Level of Education and Non-Marketing Factors
Non-Marketing Variables Parents’ Education n M SD
Father High School 105 2.28** 1.079
Two-Year College 117 2.53* 1.079
Four-Year College 233 2.66** .992
Graduate School or Beyond 166 2.87** 1.016
Total 621 2.63 1.047
Mother High School 104 2.52** 1.033
Two-Year College 116 2.96* 1.050
Four-Year College 233 2.84* .945
Graduate School or Beyond 165 3.08** .920
Total 618 2.87 .990
High School Counselor High School 105 1.50 .798
Two-Year College 116 1.52 .829
Four-Year College 231 1.32 .675
Graduate School or Beyond 165 1.33 .636
Total 617 1.39 .722
High School Teachers High School 105 1.58 .818
Two-Year College 114 1.66 .958
Four-Year College 230 1.43 .766
Graduate School or Beyond 166 1.51 .777
Total 615 1.52 .819
Friends High School 106 2.20 1.116
Two-Year College 115 2.29* 1.041
Four-Year College 232 1.96* .920
Graduate School or Beyond 164 2.20 1.016
Total 617 2.12 1.011
Current Students High School 106 2.65 1.122
Two-Year College 117 2.61 1.066
Four-Year College 231 2.43 1.093
Graduate School or Beyond 167 2.54 1.074
Total 621 2.53 1.089
Alums High School 106 2.09 1.207
Two-Year College 115 2.27 1.142
Four-Year College 231 2.16 1.174
Graduate School or Beyond 165 2.21 1.156
Total 617 2.18 1.168
Sum of Variables High School 106 2.11 1.108
Two-Year College 117 2.25 1.130
Four-Year College 233 2.11 1.093
Graduate School or Beyond 167 2.25 1.133
Total 623 2.18 1.115
*p<.05, **p<.01
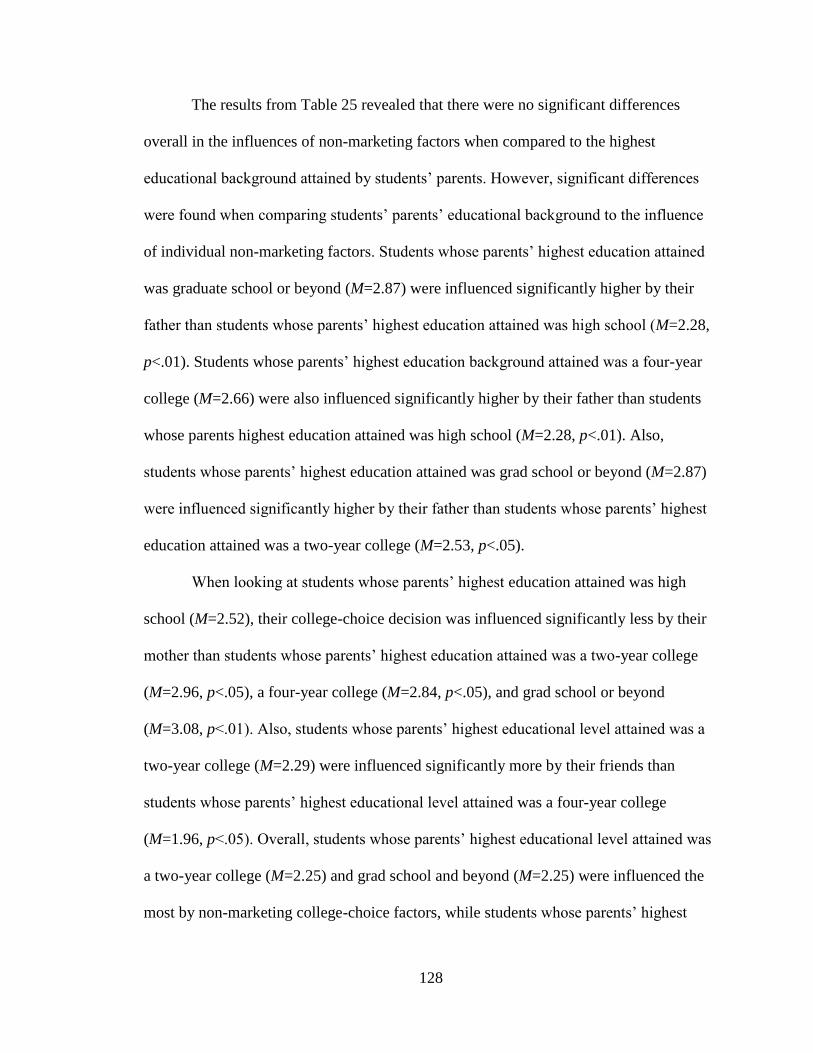
128
The results from Table 25 revealed that there were no significant differences
overall in the influences of non-marketing factors when compared to the highest
educational background attained by students’ parents. However, significant differences
were found when comparing students’ parents’ educational background to the influence
of individual non-marketing factors. Students whose parents’ highest education attained
was graduate school or beyond (M=2.87) were influenced significantly higher by their
father than students whose parents’ highest education attained was high school (M=2.28,
p<.01). Students whose parents’ highest education background attained was a four-year
college (M=2.66) were also influenced significantly higher by their father than students
whose parents highest education attained was high school (M=2.28, p<.01). Also,
students whose parents’ highest education attained was grad school or beyond (M=2.87)
were influenced significantly higher by their father than students whose parents’ highest
education attained was a two-year college (M=2.53, p<.05).
When looking at students whose parents’ highest education attained was high
school (M=2.52), their college-choice decision was influenced significantly less by their
mother than students whose parents’ highest education attained was a two-year college
(M=2.96, p<.05), a four-year college (M=2.84, p<.05), and grad school or beyond
(M=3.08, p<.01). Also, students whose parents’ highest educational level attained was a
two-year college (M=2.29) were influenced significantly more by their friends than
students whose parents’ highest educational level attained was a four-year college
(M=1.96, p<.05). Overall, students whose parents’ highest educational level attained was
a two-year college (M=2.25) and grad school and beyond (M=2.25) were influenced the
most by non-marketing college-choice factors, while students whose parents’ highest
129
educational level attained was high school (M=2.11) and a four-year college (M=2.11)
were influenced the least.
The second ANOVA in this section was used to find out the relationship between
students’ parents’ highest level of education completed and marketing college-choice
factors. The results are displayed in Table 26.
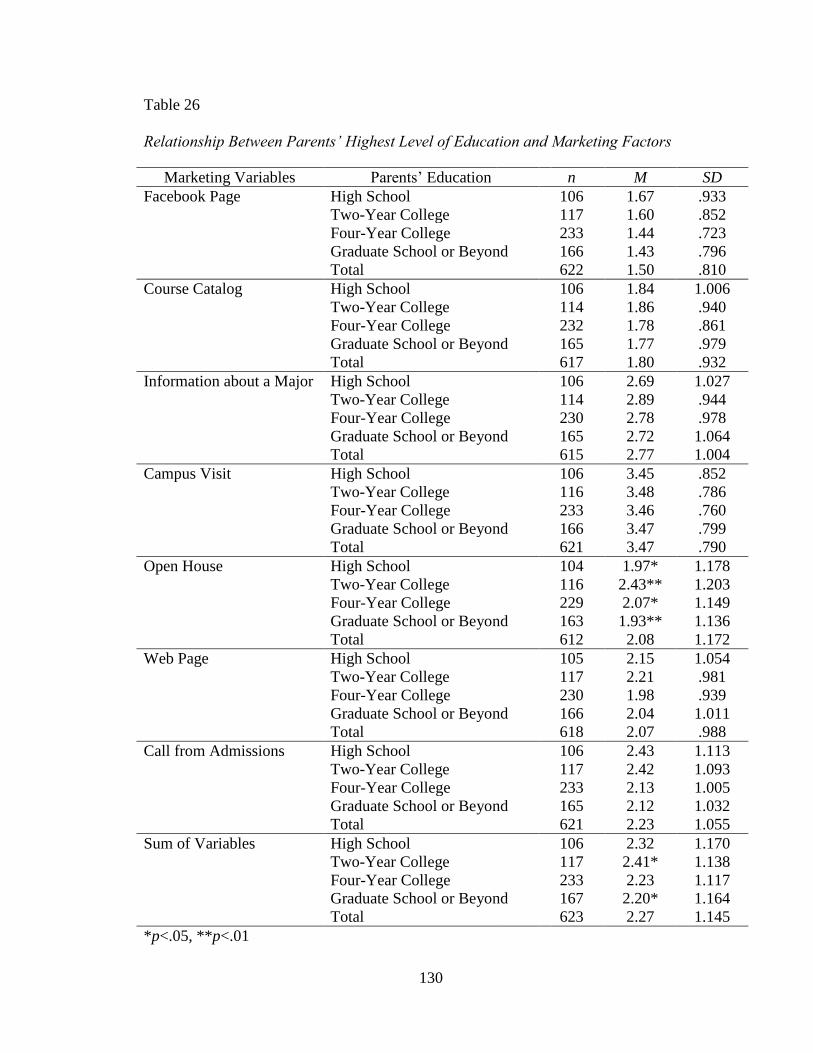
130
Table 26
Relationship Between Parents’ Highest Level of Education and Marketing Factors
Marketing Variables Parents’ Education n M SD
Facebook Page High School 106 1.67 .933
Two-Year College 117 1.60 .852
Four-Year College 233 1.44 .723
Graduate School or Beyond 166 1.43 .796
Total 622 1.50 .810
Course Catalog High School 106 1.84 1.006
Two-Year College 114 1.86 .940
Four-Year College 232 1.78 .861
Graduate School or Beyond 165 1.77 .979
Total 617 1.80 .932
Information about a Major High School 106 2.69 1.027
Two-Year College 114 2.89 .944
Four-Year College 230 2.78 .978
Graduate School or Beyond 165 2.72 1.064
Total 615 2.77 1.004
Campus Visit High School 106 3.45 .852
Two-Year College 116 3.48 .786
Four-Year College 233 3.46 .760
Graduate School or Beyond 166 3.47 .799
Total 621 3.47 .790
Open House High School 104 1.97* 1.178
Two-Year College 116 2.43** 1.203
Four-Year College 229 2.07* 1.149
Graduate School or Beyond 163 1.93** 1.136
Total 612 2.08 1.172
Web Page High School 105 2.15 1.054
Two-Year College 117 2.21 .981
Four-Year College 230 1.98 .939
Graduate School or Beyond 166 2.04 1.011
Total 618 2.07 .988
Call from Admissions High School 106 2.43 1.113
Two-Year College 117 2.42 1.093
Four-Year College 233 2.13 1.005
Graduate School or Beyond 165 2.12 1.032
Total 621 2.23 1.055
Sum of Variables High School 106 2.32 1.170
Two-Year College 117 2.41* 1.138
Four-Year College 233 2.23 1.117
Graduate School or Beyond 167 2.20* 1.164
Total 623 2.27 1.145
*p<.05, **p<.01
131
The results from Table 26 revealed that students whose parents’ highest education
attained was from a two-year college (M=2.41) were influenced significantly higher by
marketing factors than students whose parents’ highest educational background attained
was graduate school or beyond (M=2.20, p<.05). Significant differences were also found
when comparing students’ parents’ educational background to the influence of individual
marketing factors. Students whose parents’ highest education attained was a two-year
college (M=2.43) were influenced significantly higher by an open house than students
whose parents’ highest education attained was high school (M=1.97, p<.05), a four-year
college (M=2.07, p<.05), and grad school and beyond (M=1.93, p<.01).
The final ANOVA in this section was used to compare students’ parents’ highest
level of education completed to the influence of institutional factors. The findings are
listed in Table 27.
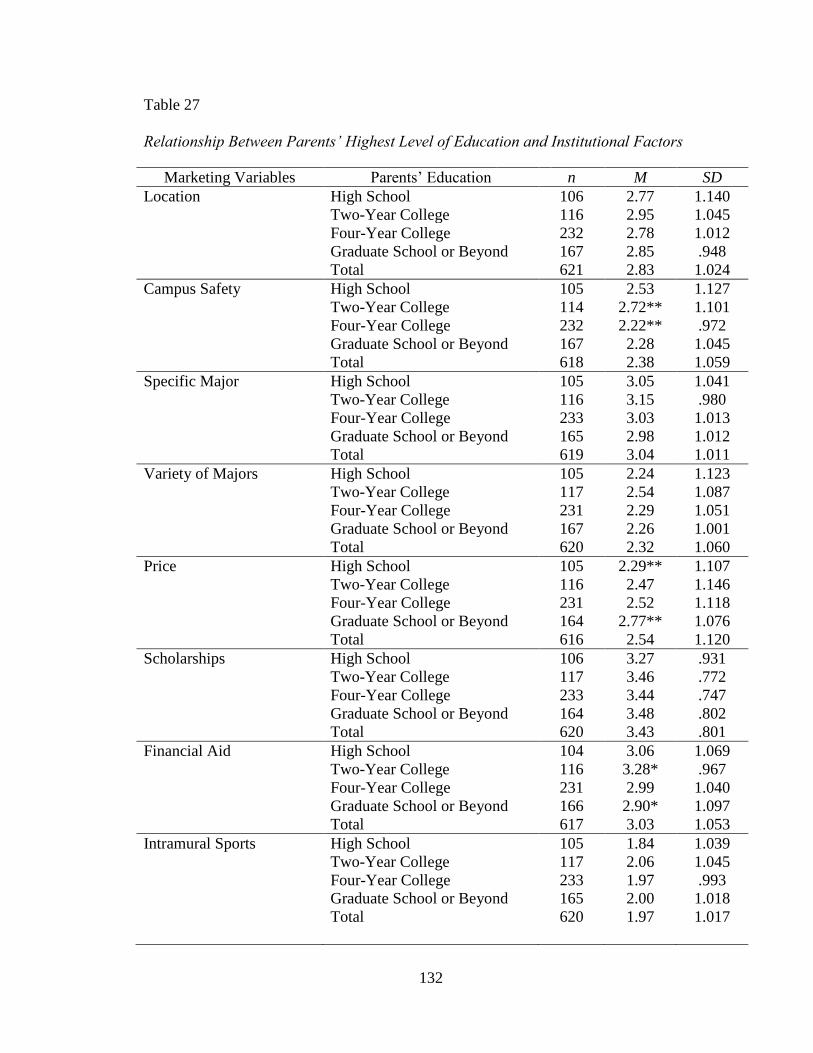
132
Table 27
Relationship Between Parents’ Highest Level of Education and Institutional Factors
Marketing Variables Parents’ Education n M SD
Location High School 106 2.77 1.140
Two-Year College 116 2.95 1.045
Four-Year College 232 2.78 1.012
Graduate School or Beyond 167 2.85 .948
Total 621 2.83 1.024
Campus Safety High School 105 2.53 1.127
Two-Year College 114 2.72** 1.101
Four-Year College 232 2.22** .972
Graduate School or Beyond 167 2.28 1.045
Total 618 2.38 1.059
Specific Major High School 105 3.05 1.041
Two-Year College 116 3.15 .980
Four-Year College 233 3.03 1.013
Graduate School or Beyond 165 2.98 1.012
Total 619 3.04 1.011
Variety of Majors High School 105 2.24 1.123
Two-Year College 117 2.54 1.087
Four-Year College 231 2.29 1.051
Graduate School or Beyond 167 2.26 1.001
Total 620 2.32 1.060
Price High School 105 2.29** 1.107
Two-Year College 116 2.47 1.146
Four-Year College 231 2.52 1.118
Graduate School or Beyond 164 2.77** 1.076
Total 616 2.54 1.120
Scholarships High School 106 3.27 .931
Two-Year College 117 3.46 .772
Four-Year College 233 3.44 .747
Graduate School or Beyond 164 3.48 .802
Total 620 3.43 .801
Financial Aid High School 104 3.06 1.069
Two-Year College 116 3.28* .967
Four-Year College 231 2.99 1.040
Graduate School or Beyond 166 2.90* 1.097
Total 617 3.03 1.053
Intramural Sports High School 105 1.84 1.039
Two-Year College 117 2.06 1.045
Four-Year College 233 1.97 .993
Graduate School or Beyond 165 2.00 1.018
Total 620 1.97 1.017
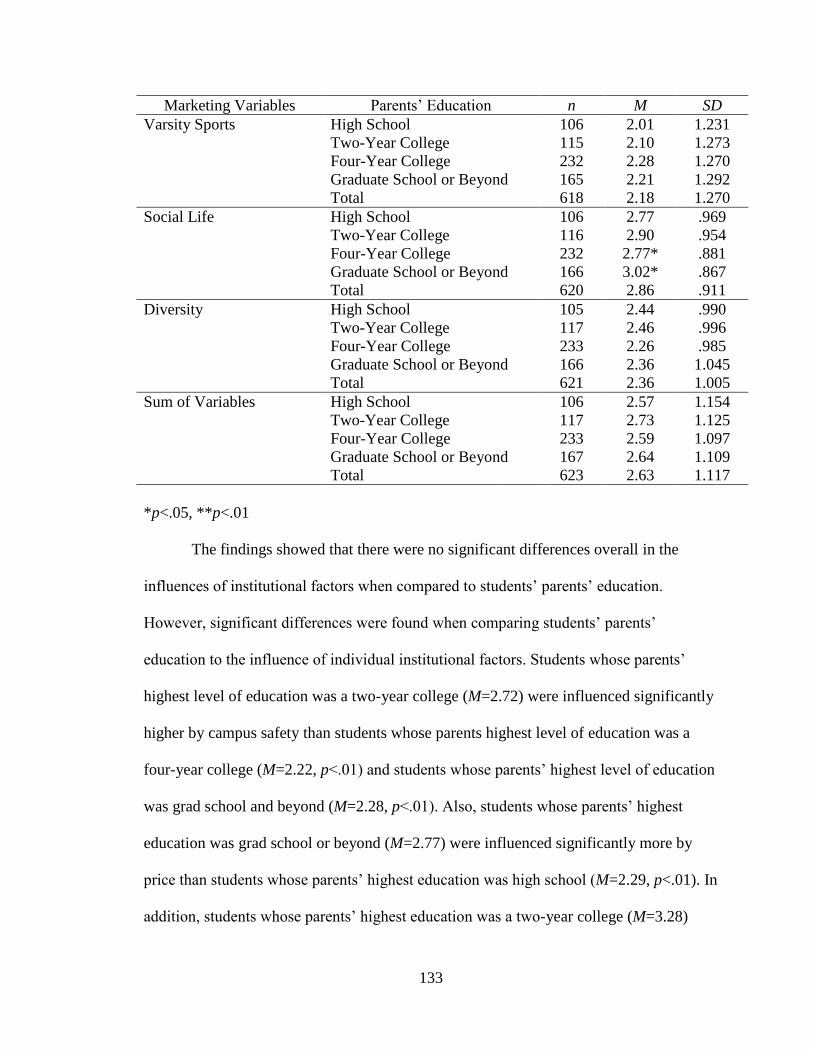
133
Marketing Variables Parents’ Education n M SD
Varsity Sports High School 106 2.01 1.231
Two-Year College 115 2.10 1.273
Four-Year College 232 2.28 1.270
Graduate School or Beyond 165 2.21 1.292
Total 618 2.18 1.270
Social Life High School 106 2.77 .969
Two-Year College 116 2.90 .954
Four-Year College 232 2.77* .881
Graduate School or Beyond 166 3.02* .867
Total 620 2.86 .911
Diversity High School 105 2.44 .990
Two-Year College 117 2.46 .996
Four-Year College 233 2.26 .985
Graduate School or Beyond 166 2.36 1.045
Total 621 2.36 1.005
Sum of Variables High School 106 2.57 1.154
Two-Year College 117 2.73 1.125
Four-Year College 233 2.59 1.097
Graduate School or Beyond 167 2.64 1.109
Total 623 2.63 1.117
*p<.05, **p<.01
The findings showed that there were no significant differences overall in the
influences of institutional factors when compared to students’ parents’ education.
However, significant differences were found when comparing students’ parents’
education to the influence of individual institutional factors. Students whose parents’
highest level of education was a two-year college (M=2.72) were influenced significantly
higher by campus safety than students whose parents highest level of education was a
four-year college (M=2.22, p<.01) and students whose parents’ highest level of education
was grad school and beyond (M=2.28, p<.01). Also, students whose parents’ highest
education was grad school or beyond (M=2.77) were influenced significantly more by
price than students whose parents’ highest education was high school (M=2.29, p<.01). In
addition, students whose parents’ highest education was a two-year college (M=3.28)
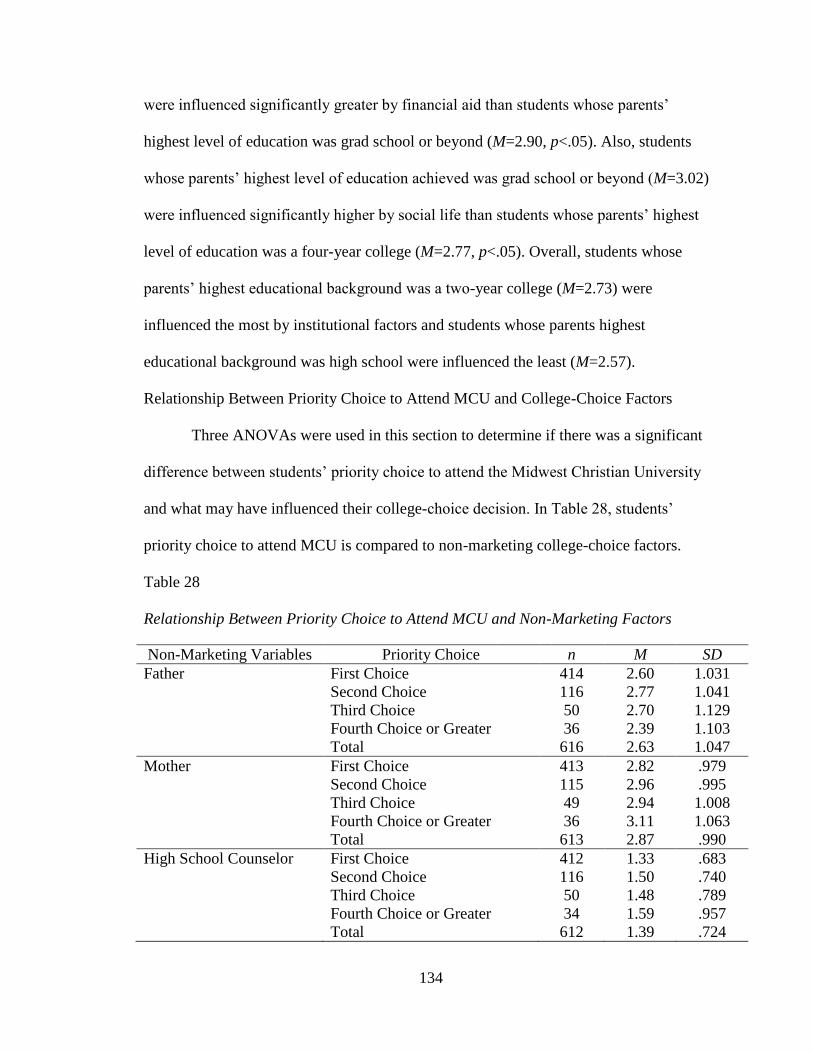
134
were influenced significantly greater by financial aid than students whose parents’
highest level of education was grad school or beyond (M=2.90, p<.05). Also, students
whose parents’ highest level of education achieved was grad school or beyond (M=3.02)
were influenced significantly higher by social life than students whose parents’ highest
level of education was a four-year college (M=2.77, p<.05). Overall, students whose
parents’ highest educational background was a two-year college (M=2.73) were
influenced the most by institutional factors and students whose parents highest
educational background was high school were influenced the least (M=2.57).
Relationship Between Priority Choice to Attend MCU and College-Choice Factors
Three ANOVAs were used in this section to determine if there was a significant
difference between students’ priority choice to attend the Midwest Christian University
and what may have influenced their college-choice decision. In Table 28, students’
priority choice to attend MCU is compared to non-marketing college-choice factors.
Table 28
Relationship Between Priority Choice to Attend MCU and Non-Marketing Factors
Non-Marketing Variables Priority Choice n M SD
Father First Choice 414 2.60 1.031
Second Choice 116 2.77 1.041
Third Choice 50 2.70 1.129
Fourth Choice or Greater 36 2.39 1.103
Total 616 2.63 1.047
Mother First Choice 413 2.82 .979
Second Choice 115 2.96 .995
Third Choice 49 2.94 1.008
Fourth Choice or Greater 36 3.11 1.063
Total 613 2.87 .990
High School Counselor First Choice 412 1.33 .683
Second Choice 116 1.50 .740
Third Choice 50 1.48 .789
Fourth Choice or Greater 34 1.59 .957
Total 612 1.39 .724
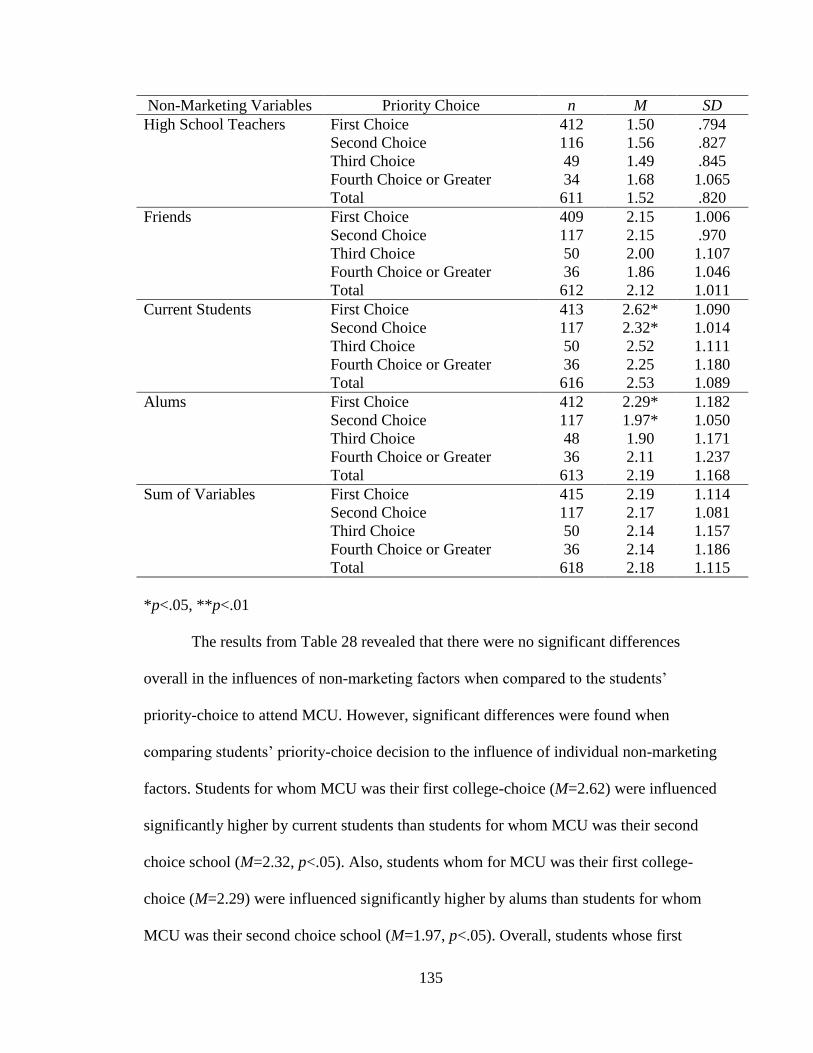
135
Non-Marketing Variables Priority Choice n M SD
High School Teachers First Choice 412 1.50 .794
Second Choice 116 1.56 .827
Third Choice 49 1.49 .845
Fourth Choice or Greater 34 1.68 1.065
Total 611 1.52 .820
Friends First Choice 409 2.15 1.006
Second Choice 117 2.15 .970
Third Choice 50 2.00 1.107
Fourth Choice or Greater 36 1.86 1.046
Total 612 2.12 1.011
Current Students First Choice 413 2.62* 1.090
Second Choice 117 2.32* 1.014
Third Choice 50 2.52 1.111
Fourth Choice or Greater 36 2.25 1.180
Total 616 2.53 1.089
Alums First Choice 412 2.29* 1.182
Second Choice 117 1.97* 1.050
Third Choice 48 1.90 1.171
Fourth Choice or Greater 36 2.11 1.237
Total 613 2.19 1.168
Sum of Variables First Choice 415 2.19 1.114
Second Choice 117 2.17 1.081
Third Choice 50 2.14 1.157
Fourth Choice or Greater 36 2.14 1.186
Total 618 2.18 1.115
*p<.05, **p<.01
The results from Table 28 revealed that there were no significant differences
overall in the influences of non-marketing factors when compared to the students’
priority-choice to attend MCU. However, significant differences were found when
comparing students’ priority-choice decision to the influence of individual non-marketing
factors. Students for whom MCU was their first college-choice (M=2.62) were influenced
significantly higher by current students than students for whom MCU was their second
choice school (M=2.32, p<.05). Also, students whom for MCU was their first college-
choice (M=2.29) were influenced significantly higher by alums than students for whom
MCU was their second choice school (M=1.97, p<.05). Overall, students whose first
136
priority choice to attend MCU (M=2.19) were influenced the most by non-marketing
factors, while students whose choice to attend MCU was their third choice (M=2.14) or
fourth choice or greater were influenced the least (M=2.14).
The next ANOVA in this section was used to find out the relationship between
students’ priority choice to attend MCU and marketing college-choice factors. The results
are listed in Table 29.
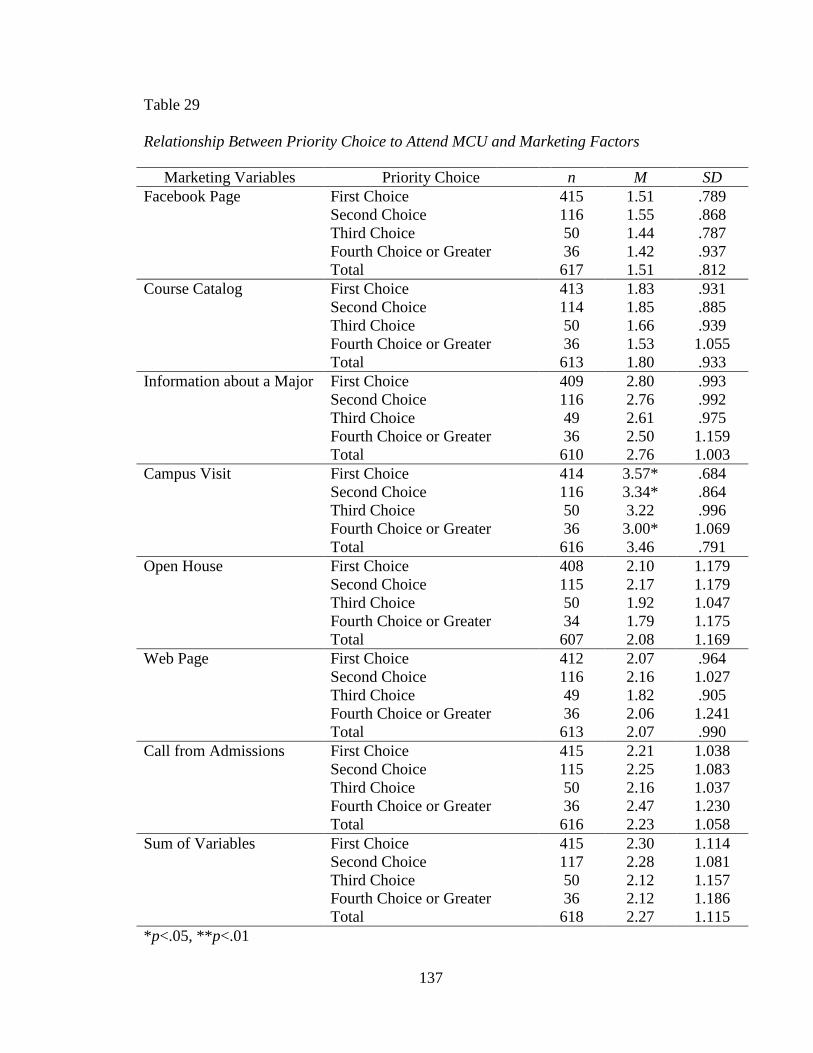
137
Table 29
Relationship Between Priority Choice to Attend MCU and Marketing Factors
Marketing Variables Priority Choice n M SD
Facebook Page First Choice 415 1.51 .789
Second Choice 116 1.55 .868
Third Choice 50 1.44 .787
Fourth Choice or Greater 36 1.42 .937
Total 617 1.51 .812
Course Catalog First Choice 413 1.83 .931
Second Choice 114 1.85 .885
Third Choice 50 1.66 .939
Fourth Choice or Greater 36 1.53 1.055
Total 613 1.80 .933
Information about a Major First Choice 409 2.80 .993
Second Choice 116 2.76 .992
Third Choice 49 2.61 .975
Fourth Choice or Greater 36 2.50 1.159
Total 610 2.76 1.003
Campus Visit First Choice 414 3.57* .684
Second Choice 116 3.34* .864
Third Choice 50 3.22 .996
Fourth Choice or Greater 36 3.00* 1.069
Total 616 3.46 .791
Open House First Choice 408 2.10 1.179
Second Choice 115 2.17 1.179
Third Choice 50 1.92 1.047
Fourth Choice or Greater 34 1.79 1.175
Total 607 2.08 1.169
Web Page First Choice 412 2.07 .964
Second Choice 116 2.16 1.027
Third Choice 49 1.82 .905
Fourth Choice or Greater 36 2.06 1.241
Total 613 2.07 .990
Call from Admissions First Choice 415 2.21 1.038
Second Choice 115 2.25 1.083
Third Choice 50 2.16 1.037
Fourth Choice or Greater 36 2.47 1.230
Total 616 2.23 1.058
Sum of Variables First Choice 415 2.30 1.114
Second Choice 117 2.28 1.081
Third Choice 50 2.12 1.157
Fourth Choice or Greater 36 2.12 1.186
Total 618 2.27 1.115
*p<.05, **p<.01

138
The findings showed that there were no significant differences overall in the
influences of marketing factors when compared to the students priority-choice to attend
MCU. However, significant differences were found when comparing students’ priority-
choice decision to the influence of individual marketing factors. Students for whom MCU
was their first college-choice (M=3.57) were influenced significantly higher by a campus
visit than students for whom MCU was their second choice school (M=3.34, p<.05) and
fourth choice or greater (M=3.0, p<.05). Overall, students whose first priority choice to
attend MCU (M=2.30) were influenced the most by marketing factors, while students
whose choice to attend MCU was their third choice (M=2.12) or fourth choice or greater
were influenced the least (M=2.12).
The last ANOVA in this section was used to compare students’ priority choice to
attend MCU to institutional factors. The findings are displayed in Table 30.
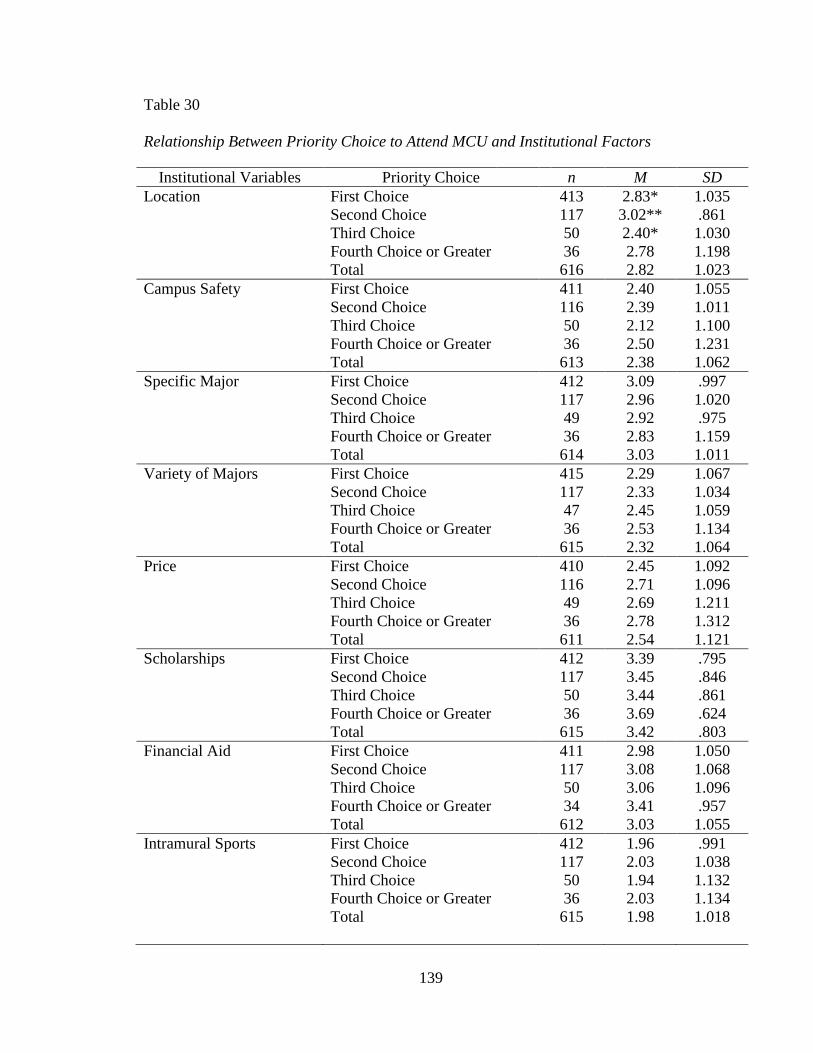
139
Table 30
Relationship Between Priority Choice to Attend MCU and Institutional Factors
Institutional Variables Priority Choice n M SD
Location First Choice 413 2.83* 1.035
Second Choice 117 3.02** .861
Third Choice 50 2.40* 1.030
Fourth Choice or Greater 36 2.78 1.198
Total 616 2.82 1.023
Campus Safety First Choice 411 2.40 1.055
Second Choice 116 2.39 1.011
Third Choice 50 2.12 1.100
Fourth Choice or Greater 36 2.50 1.231
Total 613 2.38 1.062
Specific Major First Choice 412 3.09 .997
Second Choice 117 2.96 1.020
Third Choice 49 2.92 .975
Fourth Choice or Greater 36 2.83 1.159
Total 614 3.03 1.011
Variety of Majors First Choice 415 2.29 1.067
Second Choice 117 2.33 1.034
Third Choice 47 2.45 1.059
Fourth Choice or Greater 36 2.53 1.134
Total 615 2.32 1.064
Price First Choice 410 2.45 1.092
Second Choice 116 2.71 1.096
Third Choice 49 2.69 1.211
Fourth Choice or Greater 36 2.78 1.312
Total 611 2.54 1.121
Scholarships First Choice 412 3.39 .795
Second Choice 117 3.45 .846
Third Choice 50 3.44 .861
Fourth Choice or Greater 36 3.69 .624
Total 615 3.42 .803
Financial Aid First Choice 411 2.98 1.050
Second Choice 117 3.08 1.068
Third Choice 50 3.06 1.096
Fourth Choice or Greater 34 3.41 .957
Total 612 3.03 1.055
Intramural Sports First Choice 412 1.96 .991
Second Choice 117 2.03 1.038
Third Choice 50 1.94 1.132
Fourth Choice or Greater 36 2.03 1.134
Total 615 1.98 1.018
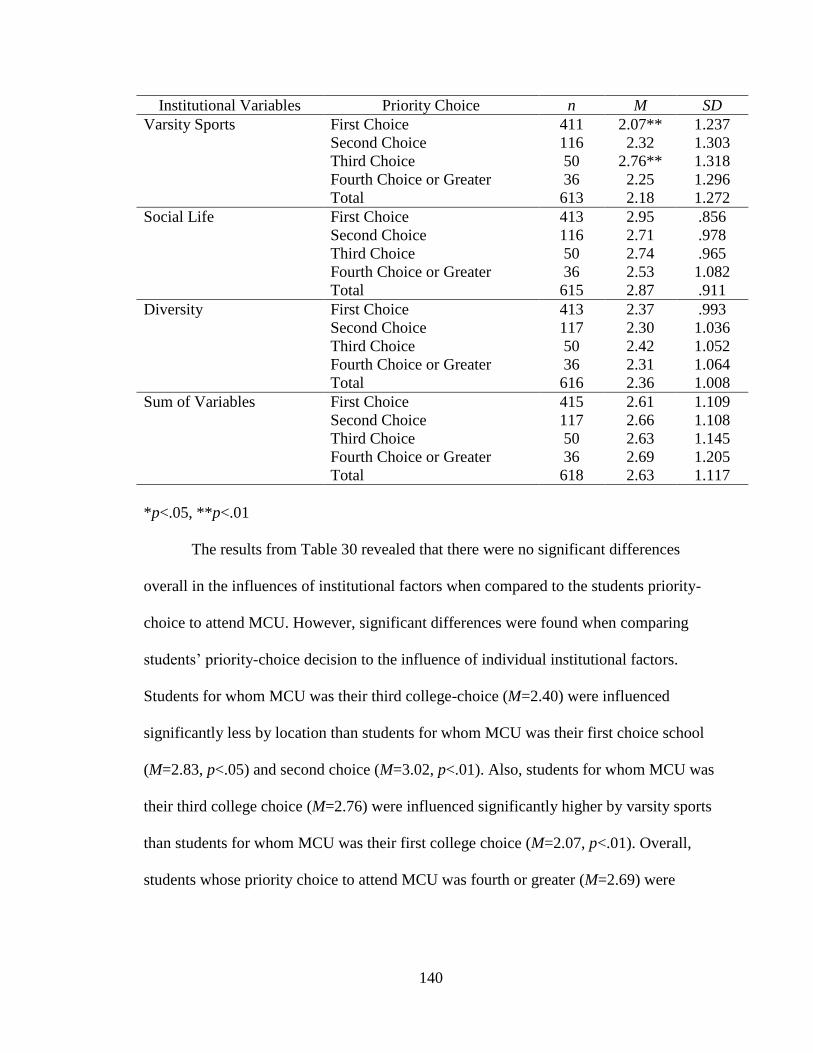
140
Institutional Variables Priority Choice n M SD
Varsity Sports First Choice 411 2.07** 1.237
Second Choice 116 2.32 1.303
Third Choice 50 2.76** 1.318
Fourth Choice or Greater 36 2.25 1.296
Total 613 2.18 1.272
Social Life First Choice 413 2.95 .856
Second Choice 116 2.71 .978
Third Choice 50 2.74 .965
Fourth Choice or Greater 36 2.53 1.082
Total 615 2.87 .911
Diversity First Choice 413 2.37 .993
Second Choice 117 2.30 1.036
Third Choice 50 2.42 1.052
Fourth Choice or Greater 36 2.31 1.064
Total 616 2.36 1.008
Sum of Variables First Choice 415 2.61 1.109
Second Choice 117 2.66 1.108
Third Choice 50 2.63 1.145
Fourth Choice or Greater 36 2.69 1.205
Total 618 2.63 1.117
*p<.05, **p<.01
The results from Table 30 revealed that there were no significant differences
overall in the influences of institutional factors when compared to the students priority-
choice to attend MCU. However, significant differences were found when comparing
students’ priority-choice decision to the influence of individual institutional factors.
Students for whom MCU was their third college-choice (M=2.40) were influenced
significantly less by location than students for whom MCU was their first choice school
(M=2.83, p<.05) and second choice (M=3.02, p<.01). Also, students for whom MCU was
their third college choice (M=2.76) were influenced significantly higher by varsity sports
than students for whom MCU was their first college choice (M=2.07, p<.01). Overall,
students whose priority choice to attend MCU was fourth or greater (M=2.69) were
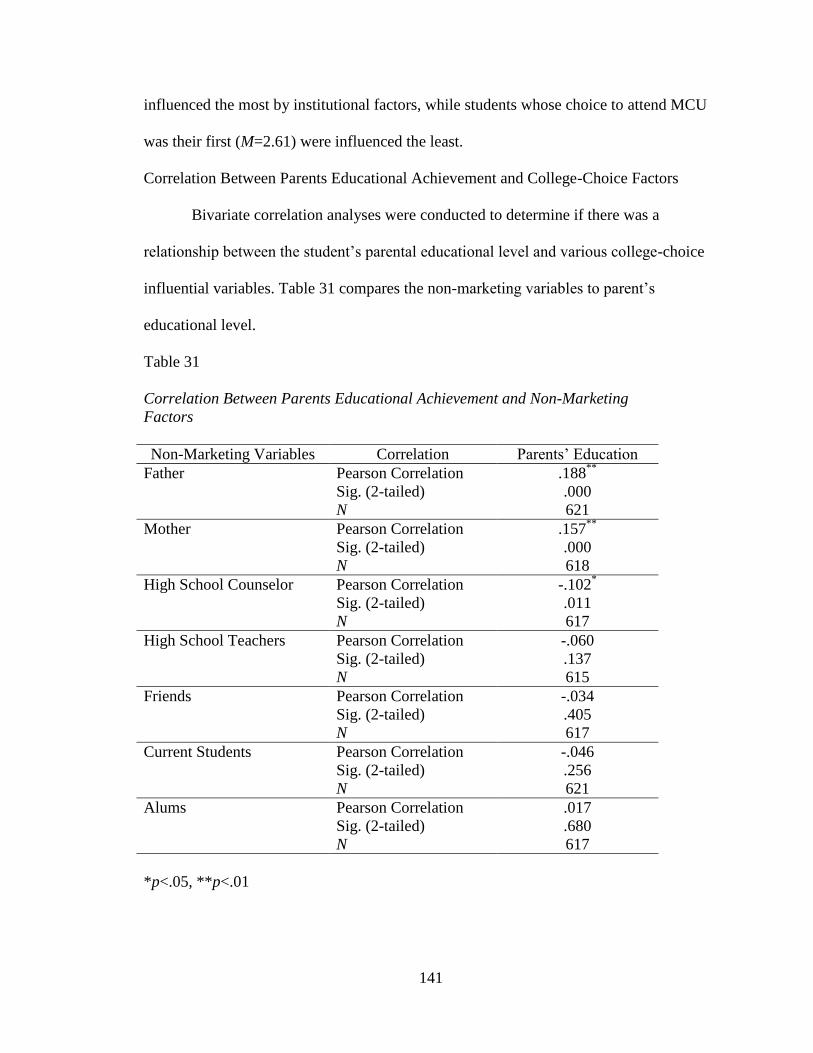
141
influenced the most by institutional factors, while students whose choice to attend MCU
was their first (M=2.61) were influenced the least.
Correlation Between Parents Educational Achievement and College-Choice Factors
Bivariate correlation analyses were conducted to determine if there was a
relationship between the student’s parental educational level and various college-choice
influential variables. Table 31 compares the non-marketing variables to parent’s
educational level.
Table 31
Correlation Between Parents Educational Achievement and Non-Marketing
Factors
Non-Marketing Variables Correlation Parents’ Education
Father Pearson Correlation .188**
Sig. (2-tailed) .000
N 621
Mother Pearson Correlation .157**
Sig. (2-tailed) .000
N 618
High School Counselor Pearson Correlation -.102*
Sig. (2-tailed) .011
N 617
High School Teachers Pearson Correlation -.060
Sig. (2-tailed) .137
N 615
Friends Pearson Correlation -.034
Sig. (2-tailed) .405
N 617
Current Students Pearson Correlation -.046
Sig. (2-tailed) .256
N 621
Alums Pearson Correlation .017
Sig. (2-tailed) .680
N 617
*p<.05, **p<.01
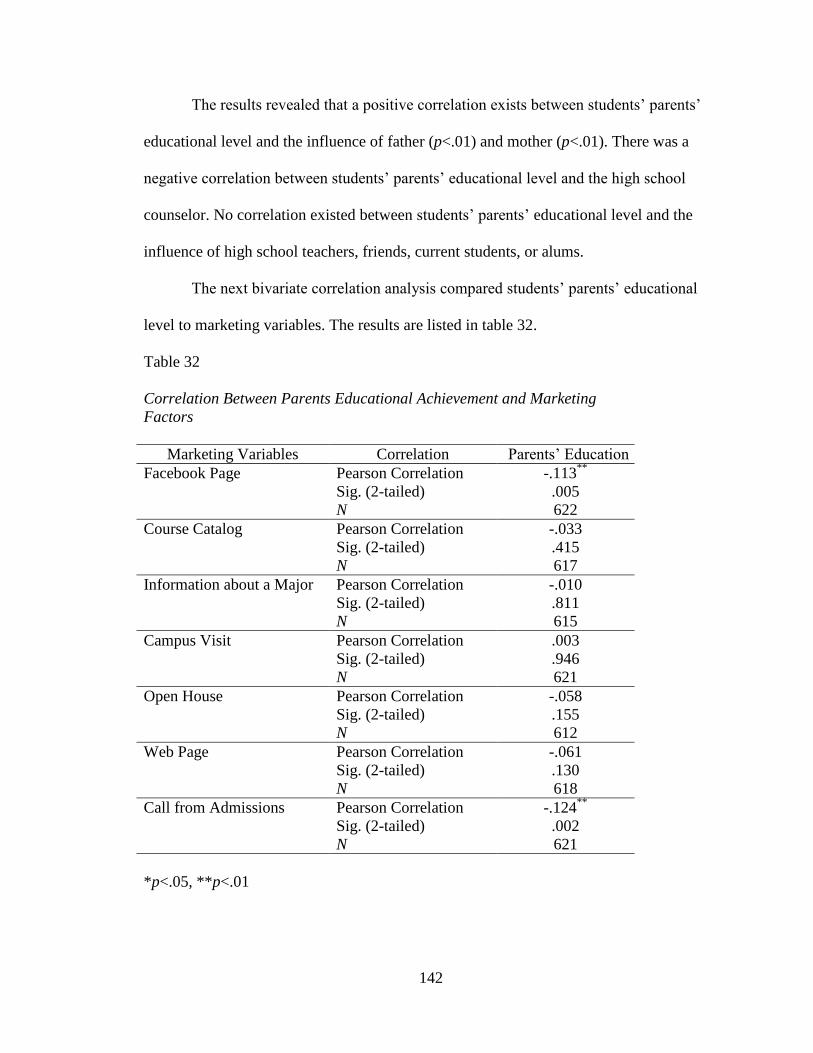
142
The results revealed that a positive correlation exists between students’ parents’
educational level and the influence of father (p<.01) and mother (p<.01). There was a
negative correlation between students’ parents’ educational level and the high school
counselor. No correlation existed between students’ parents’ educational level and the
influence of high school teachers, friends, current students, or alums.
The next bivariate correlation analysis compared students’ parents’ educational
level to marketing variables. The results are listed in table 32.
Table 32
Correlation Between Parents Educational Achievement and Marketing
Factors
Marketing Variables Correlation Parents’ Education
Facebook Page Pearson Correlation -.113**
Sig. (2-tailed) .005
N 622
Course Catalog Pearson Correlation -.033
Sig. (2-tailed) .415
N 617
Information about a Major Pearson Correlation -.010
Sig. (2-tailed) .811
N 615
Campus Visit Pearson Correlation .003
Sig. (2-tailed) .946
N 621
Open House Pearson Correlation -.058
Sig. (2-tailed) .155
N 612
Web Page Pearson Correlation -.061
Sig. (2-tailed) .130
N 618
Call from Admissions Pearson Correlation -.124**
Sig. (2-tailed) .002
N 621
*p<.05, **p<.01
143
The analysis revealed that a negative correlation exists between students’ parents’
educational level and the influence of the Facebook page (p<.01) and call from
admissions (p<.01). There was no correlation found when comparing students’ parents’
educational level and the influence of the course catalog, information about a major,
campus visit, open house, or Web page.
The final bivariate correlation analysis in this section compared students’ parents’
educational level to institutional variables. The results are displayed in table 33.

144
Table 33
Correlation Between Parents Educational Achievement and Institutional
Factors
Institutional Variables Correlation Parents’ Education
Location Pearson Correlation .002
Sig. (2-tailed) .962
n 621
Campus Safety Pearson Correlation -.130**
Sig. (2-tailed) .001
n 618
Specific Major Pearson Correlation -.038
Sig. (2-tailed) .340
n 619
Variety of Majors Pearson Correlation -.026
Sig. (2-tailed) .524
n 620
Price Pearson Correlation .139**
Sig. (2-tailed) .001
n 616
Scholarships Pearson Correlation .071
Sig. (2-tailed) .078
n 620
Financial Aid Pearson Correlation -.083*
Sig. (2-tailed) .038
n 617
Intramural Sports Pearson Correlation .035
Sig. (2-tailed) .388
n 620
Varsity Sports Pearson Correlation .062
Sig. (2-tailed) .123
n 618
Social Life Pearson Correlation .071
Sig. (2-tailed) .077
n 620
Diversity Pearson Correlation -.045
Sig. (2-tailed) .267
n 621
*p<.05 **p<.01
145
The findings revealed that a positive correlation exists between students’ parents’
educational level and the influence of price (p<.01). A negative correlation was found to
exist between students’ parents’ educational level and the influence of campus safety
(p<.05) and financial aid (p<.01). There was no correlation found when comparing
students’ parents’ educational level and the influence of the location, specific major,
variety of majors, scholarships, intramural sports, varsity sports, social life, or diversity.
Correlation Between High School GPA and College-Choice Factors
Bivariate correlation analyses were also conducted to determine if there was a
relationship between the student’s high school GPA and various college-choice
influential variables. Table 34 compares the non-marketing variables to student’s high
school GPA.
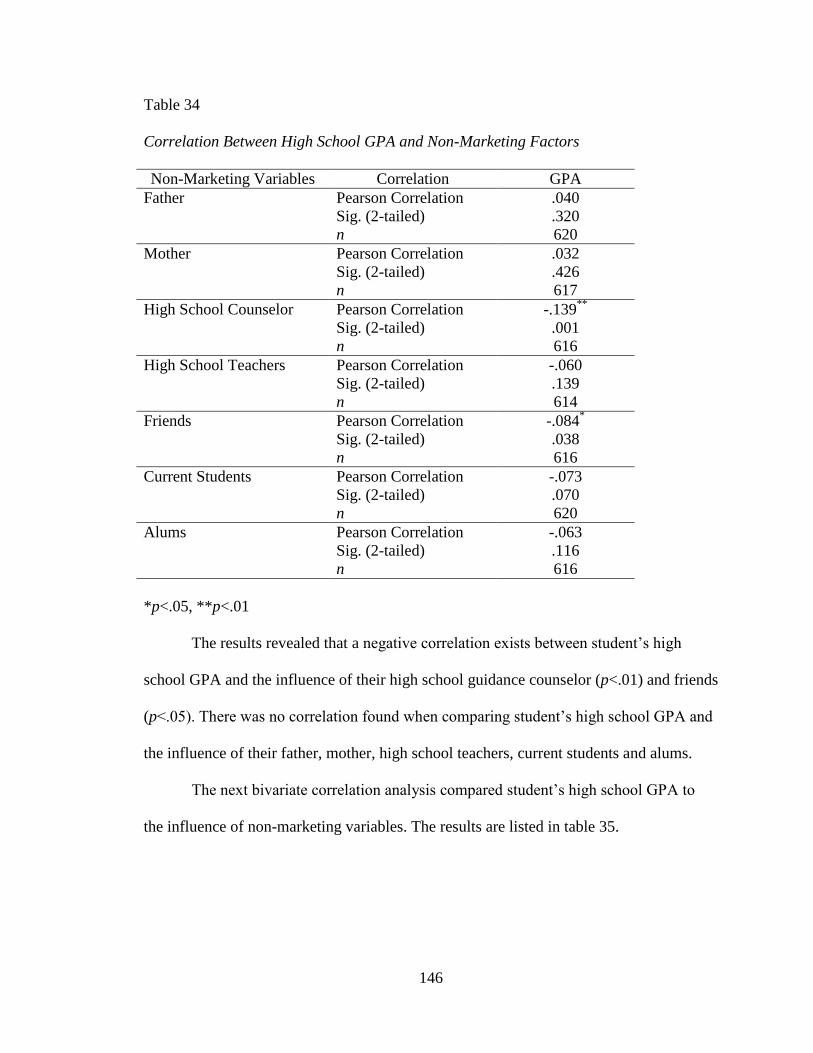
146
Table 34
Correlation Between High School GPA and Non-Marketing Factors
Non-Marketing Variables Correlation GPA
Father Pearson Correlation .040
Sig. (2-tailed) .320
n 620
Mother Pearson Correlation .032
Sig. (2-tailed) .426
n 617
High School Counselor Pearson Correlation -.139**
Sig. (2-tailed) .001
n 616
High School Teachers Pearson Correlation -.060
Sig. (2-tailed) .139
n 614
Friends Pearson Correlation -.084*
Sig. (2-tailed) .038
n 616
Current Students Pearson Correlation -.073
Sig. (2-tailed) .070
n 620
Alums Pearson Correlation -.063
Sig. (2-tailed) .116
n 616
*p<.05, **p<.01
The results revealed that a negative correlation exists between student’s high
school GPA and the influence of their high school guidance counselor (p<.01) and friends
(p<.05). There was no correlation found when comparing student’s high school GPA and
the influence of their father, mother, high school teachers, current students and alums.
The next bivariate correlation analysis compared student’s high school GPA to
the influence of non-marketing variables. The results are listed in table 35.
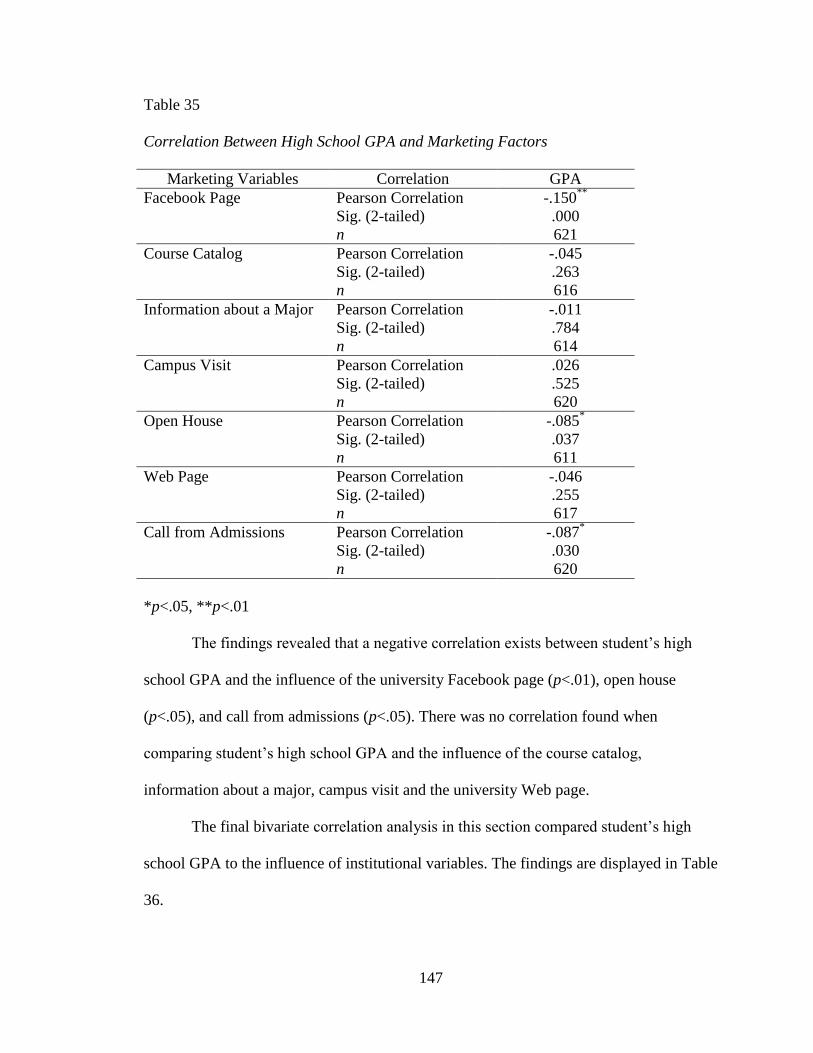
147
Table 35
Correlation Between High School GPA and Marketing Factors
Marketing Variables Correlation GPA
Facebook Page Pearson Correlation -.150**
Sig. (2-tailed) .000
n 621
Course Catalog Pearson Correlation -.045
Sig. (2-tailed) .263
n 616
Information about a Major Pearson Correlation -.011
Sig. (2-tailed) .784
n 614
Campus Visit Pearson Correlation .026
Sig. (2-tailed) .525
n 620
Open House Pearson Correlation -.085*
Sig. (2-tailed) .037
n 611
Web Page Pearson Correlation -.046
Sig. (2-tailed) .255
n 617
Call from Admissions Pearson Correlation -.087*
Sig. (2-tailed) .030
n 620
*p<.05, **p<.01
The findings revealed that a negative correlation exists between student’s high
school GPA and the influence of the university Facebook page (p<.01), open house
(p<.05), and call from admissions (p<.05). There was no correlation found when
comparing student’s high school GPA and the influence of the course catalog,
information about a major, campus visit and the university Web page.
The final bivariate correlation analysis in this section compared student’s high
school GPA to the influence of institutional variables. The findings are displayed in Table
36.
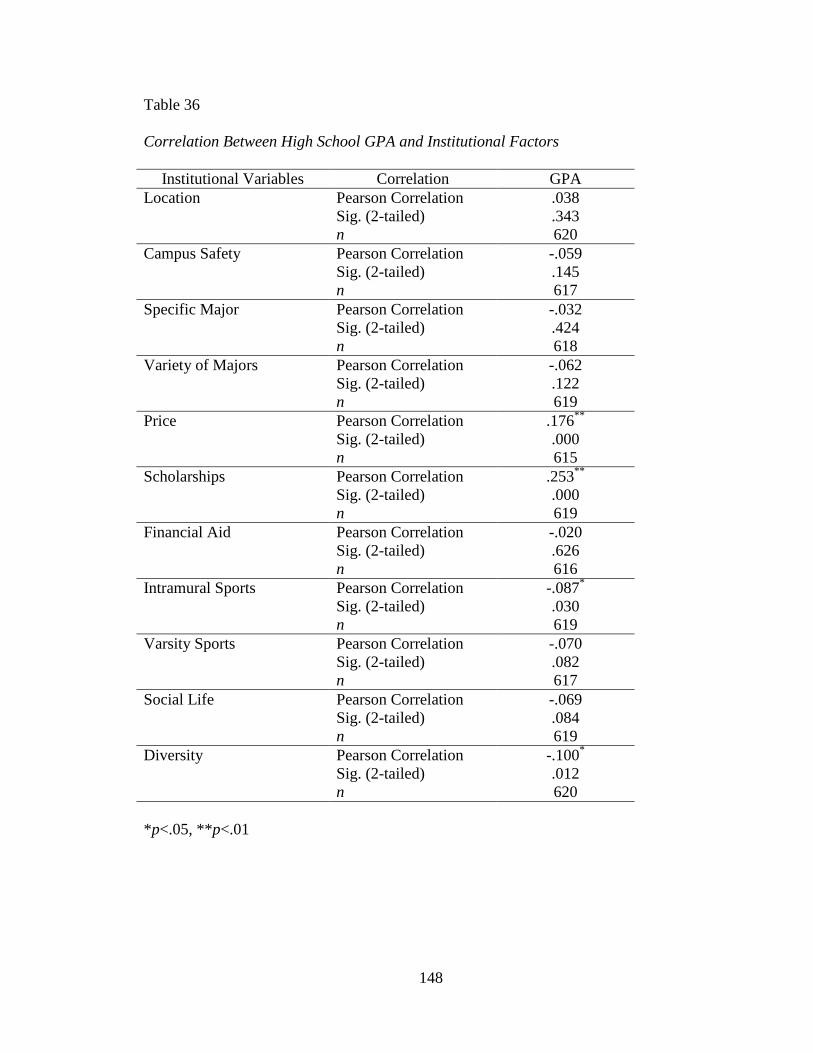
148
Table 36
Correlation Between High School GPA and Institutional Factors
Institutional Variables Correlation GPA
Location Pearson Correlation .038
Sig. (2-tailed) .343
n 620
Campus Safety Pearson Correlation -.059
Sig. (2-tailed) .145
n 617
Specific Major Pearson Correlation -.032
Sig. (2-tailed) .424
n 618
Variety of Majors Pearson Correlation -.062
Sig. (2-tailed) .122
n 619
Price Pearson Correlation .176**
Sig. (2-tailed) .000
n 615
Scholarships Pearson Correlation .253**
Sig. (2-tailed) .000
n 619
Financial Aid Pearson Correlation -.020
Sig. (2-tailed) .626
n 616
Intramural Sports Pearson Correlation -.087*
Sig. (2-tailed) .030
n 619
Varsity Sports Pearson Correlation -.070
Sig. (2-tailed) .082
n 617
Social Life Pearson Correlation -.069
Sig. (2-tailed) .084
n 619
Diversity Pearson Correlation -.100*
Sig. (2-tailed) .012
n 620
*p<.05, **p<.01
149
The results revealed that a positive correlation exists between student’s high
school GPA and the influence of the price (p<.01) and scholarships (p<.01). A negative
correlation was found to exist between student’s high school GPA and the influence of
intramural sports (p<.05) and diversity (p<.05). There was no correlation found when
comparing student’s high school GPA and the influence of the location, campus safety, a
specific major, the variety of majors, financial aid, varsity sports or social life.
Correlation Between College Priority and College-Choice Factors
Bivariate correlation analyses were conducted to determine if there was a
relationship between the student’s college priority and various college-choice influential
variables. Table 37 compares the non-marketing variables to student’s college choice
priority.
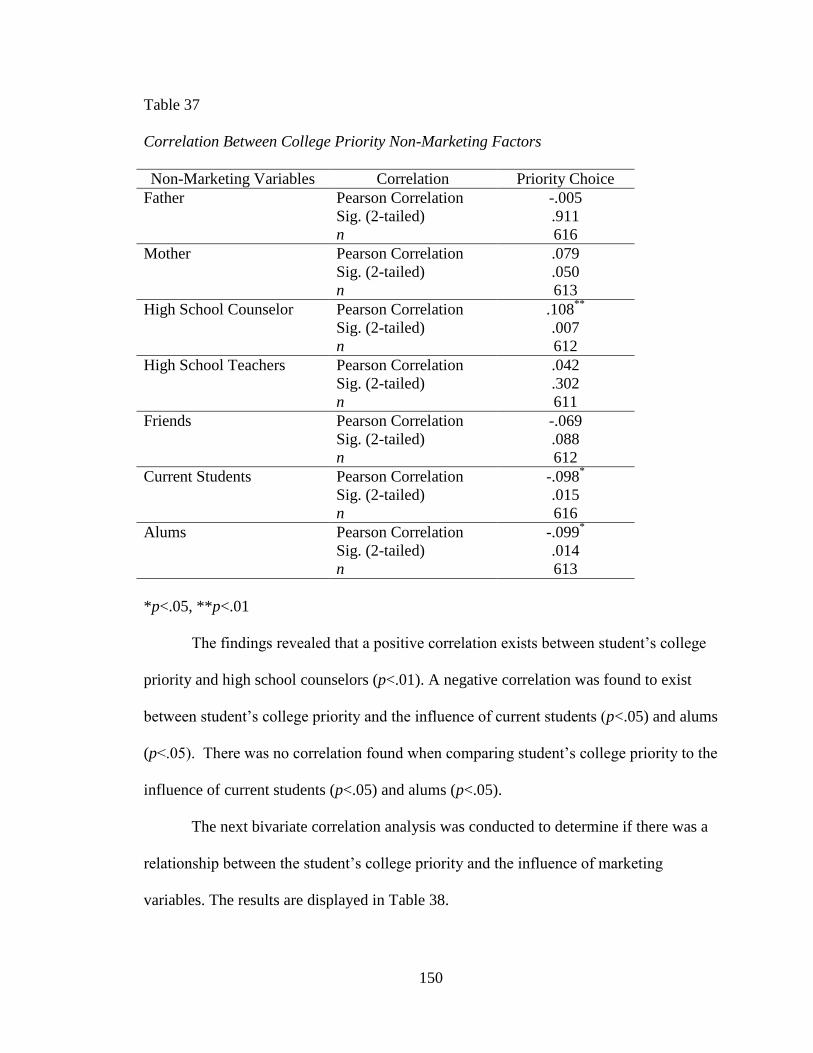
150
Table 37
Correlation Between College Priority Non-Marketing Factors
Non-Marketing Variables Correlation Priority Choice
Father Pearson Correlation -.005
Sig. (2-tailed) .911
n 616
Mother Pearson Correlation .079
Sig. (2-tailed) .050
n 613
High School Counselor Pearson Correlation .108**
Sig. (2-tailed) .007
n 612
High School Teachers Pearson Correlation .042
Sig. (2-tailed) .302
n 611
Friends Pearson Correlation -.069
Sig. (2-tailed) .088
n 612
Current Students Pearson Correlation -.098*
Sig. (2-tailed) .015
n 616
Alums Pearson Correlation -.099*
Sig. (2-tailed) .014
n 613
*p<.05, **p<.01
The findings revealed that a positive correlation exists between student’s college
priority and high school counselors (p<.01). A negative correlation was found to exist
between student’s college priority and the influence of current students (p<.05) and alums
(p<.05). There was no correlation found when comparing student’s college priority to the
influence of current students (p<.05) and alums (p<.05).
The next bivariate correlation analysis was conducted to determine if there was a
relationship between the student’s college priority and the influence of marketing
variables. The results are displayed in Table 38.
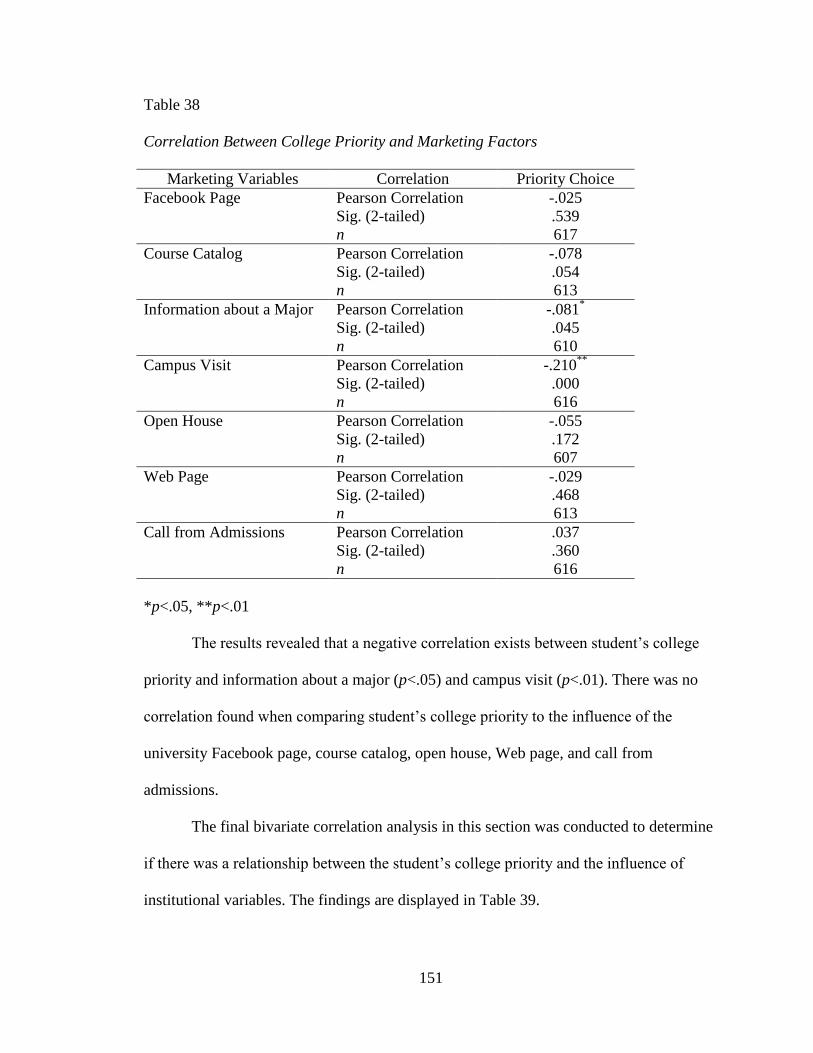
151
Table 38
Correlation Between College Priority and Marketing Factors
Marketing Variables Correlation Priority Choice
Facebook Page Pearson Correlation -.025
Sig. (2-tailed) .539
n 617
Course Catalog Pearson Correlation -.078
Sig. (2-tailed) .054
n 613
Information about a Major Pearson Correlation -.081*
Sig. (2-tailed) .045
n 610
Campus Visit Pearson Correlation -.210**
Sig. (2-tailed) .000
n 616
Open House Pearson Correlation -.055
Sig. (2-tailed) .172
n 607
Web Page Pearson Correlation -.029
Sig. (2-tailed) .468
n 613
Call from Admissions Pearson Correlation .037
Sig. (2-tailed) .360
n 616
*p<.05, **p<.01
The results revealed that a negative correlation exists between student’s college
priority and information about a major (p<.05) and campus visit (p<.01). There was no
correlation found when comparing student’s college priority to the influence of the
university Facebook page, course catalog, open house, Web page, and call from
admissions.
The final bivariate correlation analysis in this section was conducted to determine
if there was a relationship between the student’s college priority and the influence of
institutional variables. The findings are displayed in Table 39.
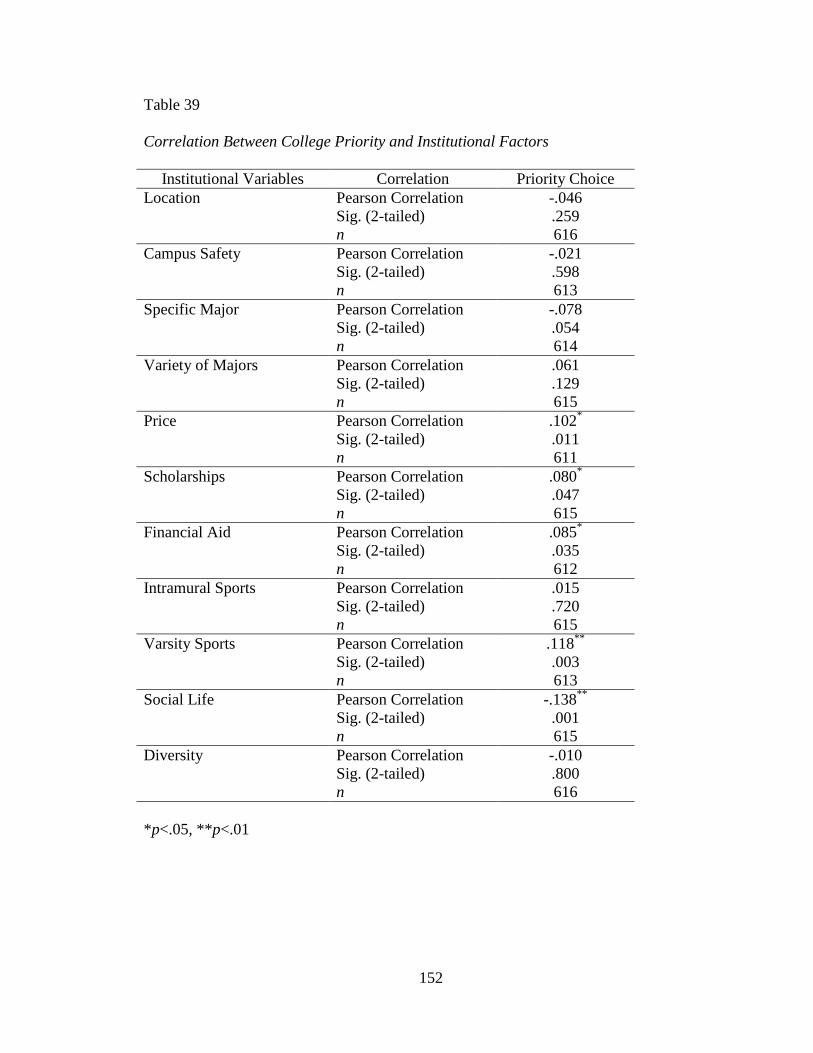
152
Table 39
Correlation Between College Priority and Institutional Factors
Institutional Variables Correlation Priority Choice
Location Pearson Correlation -.046
Sig. (2-tailed) .259
n 616
Campus Safety Pearson Correlation -.021
Sig. (2-tailed) .598
n 613
Specific Major Pearson Correlation -.078
Sig. (2-tailed) .054
n 614
Variety of Majors Pearson Correlation .061
Sig. (2-tailed) .129
n 615
Price Pearson Correlation .102*
Sig. (2-tailed) .011
n 611
Scholarships Pearson Correlation .080*
Sig. (2-tailed) .047
n 615
Financial Aid Pearson Correlation .085*
Sig. (2-tailed) .035
n 612
Intramural Sports Pearson Correlation .015
Sig. (2-tailed) .720
n 615
Varsity Sports Pearson Correlation .118**
Sig. (2-tailed) .003
n 613
Social Life Pearson Correlation -.138**
Sig. (2-tailed) .001
n 615
Diversity Pearson Correlation -.010
Sig. (2-tailed) .800
n 616
*p<.05, **p<.01
153
The findings revealed that a positive correlation exists between student’s college
priority and the influence of price (p<.05), scholarships (p<.05), financial aid (p<.05),
and varsity sports (p<.01). A negative correlation was found to exist between student’s
college priority and the influence of social life (p<.05). There was no correlation found
when comparing student’s college priority to the influence of location, campus safety,
specific major, variety of majors, intramural sports, and diversity.
Conclusions
The purpose of this study was to identify and analyze the factors that influenced
undergraduate students to enroll at a particular Midwest Christian University as well as
fill a void in the research of college-choice factors in private universities. This data was
intended to be used to evaluate what compels potential students to enroll in a specific
university in order to uncover opportunities to improve marketing strategies in efforts to
increase enrollment.
The total sample size consisted of 628 freshman students at a Midwest Christian
University. These students were surveyed in the fall of 2012, prior to beginning their first
semester at the Midwest Christian University. The quantitative data obtained from the
survey was analyzed to determine the college-choice factors that affected freshman
students’ decision to enroll in a particular university.
The survey was adapted from Donnellan’s (2002) work, with the author’s
permission. The survey consisted of various structured items, including several four- and
five-point Likert scales, ranking scales, and multiple-choice questions relating factors that
led to the participants’ decision to attend a particular Midwestern Christian University
154
(Gay, et al., 2009). The data collected was a snapshot of the beliefs in the sample
population at a given time during the new-student orientation.
The study was guided by the three research questions in an attempt to illustrate
and examine responses from freshman students entering a Midwest Christian University.
Understanding how freshman students perceive pre-enrollment interactions with
universities can be important in determining how marketing strategies can be improved in
the future.
Research Question 1: What factors most influenced the enrollment decision of freshman
students currently enrolled at a Midwest Christian University?
The students indicated that the campus visit (M=3.46) was the most influential
factor in their decision to attend the Midwest Christian University. The next most
influential factor was scholarships (M=3.43), followed by a specific major (M=3.06),
financial aid (M=3.01), and mother (M=2.88). The least influential factors were found to
be the high school counselor (M=1.40), Facebook page (M=1.50), and high school
teacher (M=1.53). Findings of this research are consistent with the work of Clark (2000),
Jennings (2008), Smith (2006), and Dickinson (2003) who found that campus visits were
highly influential in the college-choice process. Rating scholarships as a highly
influential college-choice factor was also consistent with the studies of Baron (1987),
Coiner (1990), and Jennings. Findings are also consistent with the research of Donnellan
(2002) and Norwood (2009), who also found that high school guidance counselors had
very little influence on the college-choice decision. Finally, the findings for this study
were consistent with Donnellan, the researcher from which the survey was adapted, in
155
that the campus visit was the most influential marketing factor and parents were the most
influential non-marketing factor.
Research Question 2: What impact do demographic characteristics have on college-
choice factors at a Midwest Christian University?
Gender
There were no significant differences among men (57.6%) and women (42.4%)
when evaluating the overall impact of marketing, non-marketing and institutional
variables. However, there were significant differences found between men and women in
the ratings of individual college-choice influential variables. The findings revealed that
women rated the following college-choice influencers significantly higher than men:
campus safety (p<.01), the university Facebook page (p<.05), campus visit (p<.05)
university Web page (p<.01) call from admissions (p<.01), location (p<.05), specific
major (p<.05), and price (p<.01). Men rated the influence of intramural sports (p<.01)
and varsity sports (p<.01) as having a significantly higher influence on their college-
choice decision than women.
Race
Race consisted of 85.2% white, 6.1% African American, 3.9% Latino, 1.3%
Asian and 0.6% Native American, 2.9% described as Other. There were no significant
differences among the various races when evaluating the overall impact of marketing,
non-marketing and institutional variables. However, there were significant differences
found between particular races in the ratings of individual college-choice influential
factors. African Americans rated the influence of the University Web page significantly
higher than Whites (p<.05). African Americans also rated the influence of a call from
156
admissions significantly higher than Native Americans (p<.01). African Americans rated
the influence of high school guidance counselors significantly higher than Whites (p<.01)
and Native Americans (p<.01). Whites, African Americans, and Latinos rated the
influence of high school teachers and the University Facebook page significantly higher
than Native Americans (p<.01). Finally, Latinos were found to have rated the influence of
current students significantly higher than Native Americans (p<.01).
Location
A location breakdown showed 57.1% of students were from Illinois, 41.9% from
out of state, and 1.0% from out of country. Overall, students from in-state and out-of-
state were influenced significantly higher by the marketing factors than students from
another country (p<.05). When reviewing the individual college-choice factors, in-state
students rated the influence of the following variables significantly higher than out-of-
state students: high school counselors (p<.01), high school teachers (p<.05), campus
safety (p<.01), and location (p<.01). Also, in-state students were influenced significantly
higher by the open house than out-of-state students (p<.01) and students from another
country (p<.05). Students from another country rated the influence of varsity sports
significantly higher than in-state (p<.05) and out-of-state students (p<.05). Finally,
students from another country also rated the influence of diversity significantly higher
than in-state (p<.01) and out-of-state students (p<.05).
Community
The communities in which the students came from were 17.8% urban, 53.8%
suburban, and 28.4% rural. There were no significant differences among the various
communities when evaluating the overall impact of marketing, non-marketing and
157
institutional variables. However, there were significant differences found between the
communities which students were from and the ratings of individual college-choice
influential variables. Students from urban communities were found to be influenced
significantly higher in regards to course catalogs than students from rural communities
(p<.05). Financial aid was identified as significantly less of an influence to rural students
when compared to urban (p<.05) and suburban students (p<.05). Also, suburban students
were influenced significantly less by varsity sports than urban (p<.01) and rural students
(p<.05).
Religion
Participants classified their religious beliefs as 49.6% Protestant, 8.3% Catholic,
10.1% Unaffiliated, and 31.9% Other. There were no significant differences within
religious beliefs when evaluating the overall influence of marketing, non-marketing and
institutional variables. However, significant differences were found when comparing
students’ religion to the influence of individual institutional factors. Students that
categorized their religion as Catholic were influenced significantly higher by the location
than students that categorized their religion as Protestant (p<.05). Also, students that
categorized themselves as Other were influenced significantly more than Protestants in
campus safety (p<.01) and varsity sports (p<.05).
High School GPA
A summary of the participants’ high school GPA included 0.6% less than 2.0,
3.2% between 2.0-2.49, 11.4% between 2.5-2.99, 30.2% between 3.0-3.5, and 54.5%
over 3.5.There were no significant differences overall in the influences of marketing,
non-marketing, and institutional factors when compared to students’ high school GPA.
158
However, significant differences were found when comparing students’ high school GPA
to the influence of individual variables. Students with high school GPA’s greater than 3.5
were influenced significantly greater than students with high school GPA’s between 2.5-
2.99 and students with high school GPA’s between 3.0-3.5 in respect to price (p<.01) and
scholarships (p<.01). Also, students with high school GPA’s greater than 3.5 were
influenced significantly higher by location than students with a high school GPA between
2.5-2.99 (p<.05). Students that had a high school GPA between 2.0-2.49 were influenced
significantly higher by Facebook than students that had a high school GPA between 3.0-
3.5 (p<.05) and students with high school GPA’s greater than 3.5 (p<.01).
Parents Educational Level
Respondents described the highest level of education attained by their parents as
17.0% high school, 18.8% two-year college, 37.4% four year college, 26.8% graduate
school or beyond. Overall, students whose parents highest education attained was from a
two-year college (M=2.41) were influenced significantly higher by marketing factors than
students whose parents highest educational background attained was graduate school or
beyond (M=2.20, p<.05). Significant differences were also found when comparing
students’ parents’ educational background to the influence of individual non-marketing,
marketing, and institutional factors. Students whom parents highest education attained
was graduate school or beyond were influenced significantly higher by their father than
students whom their parents highest education attained was high school (p<.01) and two-
year college (p<.05). Also, students whose parents highest education background attained
was a four-year college were also influenced significantly higher by their father than
students whose their parents highest education attained was high school (p<.01). In
159
addition, students whose parents highest education attained was high school were
influenced significantly less by their mother than students whose parents highest
education attained was a two-year college (p<.05), a four-year college (p<.05), and grad
school or beyond (p<.01).
Students whose parents highest educational level attained was a two-year college
were influenced significantly more by their friends than students whose parents highest
educational level attained was a four-year college (p<.05). Also, students whose parents
highest education attained was a two-year college were influenced significantly higher by
an open house than students whose parents highest education attained was high school
(p<.05), a four-year college (p<.05), and grad school and beyond (p<.01). In addition,
students whose parents highest level of education was a two-year college were influenced
significantly higher by campus safety than students whose parents highest level of
education was a four-year college (p<.01) and students whose parents highest level of
education was grad school and beyond (p<.01). In addition, students whose parents
highest education was a two-year college were influenced significantly greater by
financial aid than students whose parents highest level of education was grad school or
beyond (p<.05).
Students whose parents highest education was grad school or beyond were
influenced significantly more by price than students whose parents highest education was
high school (p<.01). Also, students whose parents highest level of education achieved
was grad school or beyond were influenced significantly greater by social life than
students whose parents highest level of education was a four-year college (p<.05).
Priority Choice

160
Of the colleges to which the students applied, the Midwest Christian University
was the first choice for 67.2% of the students, second choice of 18.9%, third choice of
8.1%, and fourth choice of 5.8%. There were no significant differences among the
priority university choice of students when evaluating the overall influence of marketing,
non-marketing and institutional variables. However, there were significant differences
found between the priority choice to attend the Midwest Christian University and the
ratings of individual college-choice influential variables. Students for whom MCU was
their first college-choice were influenced significantly greater by current students and
alums than students for whom MCU was their second choice school (p<.05). Also,
students for whom MCU was their first college-choice were influenced significantly
higher by a campus visit than students for whom MCU was their second choice school
(p<.05) and fourth choice or greater (p<.05). Students for whom MCU was their third
college choice were influenced significantly higher by varsity sports than students for
whom MCU was their first college choice (p<.01). In addition, students for whom MCU
was their third college-choice were influenced significantly less by location than students
for whom MCU was their first choice school (p<.05) and second choice (p<.01).
Findings for this research are consistent with the work of Norwood (2009), Smith
(2006), and Ryan (2012) who found that demographics played a minimal role in students’
decision to attend a particular college. Donnellan (2002), from whom the survey in this
study was adapted, found significant differences existed in various demographic groups.
He did not recommend developing unique marketing strategies for each demographic
segment, but did suggest modifying existing marketing strategies to meet the needs of the
various demographic segments. The findings of this study indicated that demographics
161
played a small role in freshman students’ college-choice decision, and did not impact the
college-choice decision of freshman students significantly.
Research Question 3: What is the impact of marketing versus non-marketing factors on
the college-choice decision of freshman students at a Midwest Christian University?
Of the marketing and non-marketing variables that were measured, the marketing
factors (M=2.26) were found to be slightly more influential than non-marketing factors
(M=2.19). The overall total mean score of marketing factors was positively affected by
the high scores received from campus visit (M=3.46) and info about a major (M=2.77).
The overall total mean score of non-marketing factors was negatively affected by the low
scores received from high school guidance counselor (M=1.40) and high school teacher
(M=1.53). However, it should be noted that institutional factors were identified as having
played the largest role (M=2.62) in influencing freshman students to attend the Midwest
Christian University compared to non-marketing factors and marketing factors. Findings
for this research are consistent with the work of Tan (2009) and Furukawa (2011), who
also found that institutional characteristics were a main contributor to college-choice
decisions of students. In the research at hand, the institutional factors that were most
influential were scholarships (M=3.43), specific major (M=3.04), and financial aid
(M=3.04). The institutional factors that were least influential were intramural sports
(M=1.97), varsity sports (M=2.17), and variety of majors (M=2.32).
The results of the influence of individual college-choice variables were consistent
with the findings of Donnellan (2002), the researcher from which the survey was adapted.
Donnellan revealed the most influential non-marketing factors were parents and friends,
which was consistent with the research at hand. In addition, Donnellan found the most
162
influential marketing factor for the students was the campus visit, which was also
consistent with the findings of this study. In contrast to the findings in this study,
Donnellan found that non-marketing factors were slightly more influential on students’
college-choice decision than marketing factors. Finally, the findings of the research at
hand revealed that institutional factors had the most influence on freshman students’
college-choice decision; However, Donnellan did not disclose the total mean score of
institutional factors.
Summary of Conclusions
Overall, three major conclusions were made from this findings of this research.
First, institutional factors (M=2.63) were found to be the most influential, followed by
marketing factors (M=2.27) and non-marketing factors (M=2.18). Second, demographics
had a minimal impact on the college-choice decision. Third, the most influential factors
were campus visits (M=3.46) and scholarships (M=3.43), while the most influential
people were parents (mother: M=2.88; father: M=2.64). The least influential factors were
the high school counselors (M=1.40), Facebook page (M=1.50), and high school teachers
(M=1.53).
Implications and Recommendations
This study is important because it added empirical evidence to the understanding
of college-choice influencers. Even though this study used a particular Midwest Christian
University with limited diversity, the research supported previous research findings. This
study advanced the understanding of the influence of college-choice factors as well as
filled a void in the research of college-choice factors in private universities. Several
implications can be made as a result of this research:
163
First, institutional factors have the most influence on freshman students’ college-
choice decision. While marketers cannot control the number of scholarships, social life,
or price of the university, marketers can put additional attention in their marketing
material highlighting various favorable institutional statistics as compared to competing
schools.
Second, the campus visit is the most influential factor effecting the college-choice
decision. Universities should put additional efforts into promoting campus visits for
potential students. Additional training can also be provided to campus tour guides to
ensure that potential students have a positive experience.
Third, marketing factors are slightly more influential than non-marketing factors.
Marketers can be just as influential, if not more, than parents and peers in effecting which
university students choose to attend. A campus visit, call from admissions, and
distributing information about a major are all marketing strategies that have been shown
to have a positive impact on students’ college-choice decision. Having the right
marketing team and strategy in place should put universities in a better place to increase
enrollment despite the influence from non-marketing factors.
Fourth, parents are the most influential college-choice factor in which a university
has no control. For this reason, marketing efforts should be targeted toward parents to
help recruit potential students. This finding and recommendation is supported by the
research of Donnellan (2002).
Fifth, demographics played a minimal role in the college-choice decision of
freshman students at the Midwest Christian University. The majority of the participants
were white and from the suburbs within the state. Marketers should not focus additional
164
efforts on appealing to a particular demographic; as evidence reflects that freshman
students at this predominately white university are influenced by very similar factors.
Suggestions for Future Research
The findings of this study are from one Midwest Christian University and should
not be generalized to all other institutions. Listed below are four suggestions for future
research.
1. Conduct similar comparison research at multiple universities.
2. Include the responses of traditional and non-traditional students.
3. Conduct similar research at a larger public institution that includes a more
diverse population.
4. Distribute the surveys closer to the students’ acceptance date into the
university to eliminate any potential environmental factors that could have
played a role in the students’ survey answers after enrollment, but prior to the
freshman orientation.
Summary
This research identified and analyzed the factors that influenced undergraduate
students to enroll at a Midwest Christian University as well as filled a void in the research
of college-choice factors in private universities. The researcher evaluated what compelled
potential students to enroll in a specific university in order to uncover opportunities to
improve marketing strategies in efforts to increase enrollment. Prior to this study, there
was research on record that analyzed an entire population of incoming freshman students
at a private university by comparing the student-recruitment marketing efforts controlled
by an institution to the factors that impact college choice over which an institution has

165
little or no control (Donnellan, 2002). While institutions can control their marketing mix
factors including product, price, promotion, and place, other environmental forces are
beyond their control. These environmental forces include social, economic, competitive,
and technological forces. By identifying trends related to each of these forces, institutions
can develop and maintain successful marketing plans (Kerin, et al., 2011), and increase
enrollment.
166
REFERENCES
Abou-Nassif, S. M. (2011). Self-reported factors that influence college-bound students in
Lebanon (Doctoral dissertation). Available from ProQuest Dissertations and
Theses database. (UMI No. 3444927)
Anderson, J. (2010). An examination of college selection factors used by business
students who chose to attend a small Midwestern private college (Doctoral
dissertation). Available from ProQuest Dissertations and Theses database. (UMI
No. 3438665)
Andrignola, M. N. (2010). Factors that affect initial enrollment of working adult,
graduate students (Doctoral dissertation). Available from ProQuest Dissertations
and Theses database. (UMI No. 3404316)
Armstrong, J. J. (1997). Factors influencing freshmen students’ college choice at the
University of North Texas: A focus group study (Doctoral dissertation). Available
from ProQuest Dissertations and Theses database. (UMI No. 9801361)
Bacon, J. R. (2010). Improving the enrollment and retention of students in the Associate
in Arts program at the University of Delaware (Doctoral dissertation). Available
from ProQuest Dissertations and Theses database. (UMI No. 3423301)
Bandura, A. (1997). Self efficiency: The exercise of control. New York, NY: W. H.
Freeman.
167
Baron, P. B. (1987). Graduate student recruitment practices (Doctoral dissertation).
Available from ProQuest Dissertations and Theses database. (UMI No. 8715275)
Barr, M. J. (2002). Academic administrator’s guide to budgets and financial
management. San Francisco, CA: Josey-Bass.
Bergerson, A. A. (2009). College choice and access to college: Moving policy, research,
and practice to the 21st century. AASHE Higher Education Report, 35(4), 1-141.
Briles, T. M. (2009). Factors most influential in southern New Jersey high school
seniors’ college selection processes (Doctoral dissertation). Available from
ProQuest Dissertations and Theses database. (UMI No. 3351896)
Brooks, R. C., Jr., (2006). Factors that influence traditional-age, high-achieving students
to enroll at a research-extensive university in the Southern region of the United
States (Doctoral dissertation). Available from ProQuest Dissertations and Theses
database. (UMI No. 3208146)
Burns-Wallace, D. J. (2009). Diversifying the ivory tower: Complexities of serving a
senior admissions diversity officer in an evolving affirmative action climate
(Doctoral dissertation). Available from ProQuest Dissertations and Theses
database. (UMI No. 3354338)
Buuck, S. J. (1996). The recruitment and retention of international undergraduate
students at selected colleges and universities in the state of Wisconsin (Doctoral
dissertation). Available from ProQuest Dissertations and Theses database. (UMI
No. 9719083)
168
Clark, G. A. (2000). A historical perspective of undergraduate recruitment at Tennessee
State University and the impact of marketing on enrollment from 1989-1999
(Doctoral dissertation). Available from ProQuest Dissertations and Theses
database. (UMI No. 3007574)
Coiner, C. G. (1990). Marketing higher education to Mexican-Americans: Identification
of successful marketing strategies and tactics (Doctoral dissertation). Available
from ProQuest Dissertations and Theses database. (UMI No. 9025211)
Cheong, N. (2010). Psychographic factors and prospective students’ use of interactive
features on admissions websites of institutes of higher education (Masters thesis).
Available from ProQuest Dissertations and Theses database. (UMI No. 1480216)
Collins, R. L. (2006). Selected correlates for college choice for Church of Christ colleges
and university students (Doctoral dissertation). Available from ProQuest
Dissertations and Theses database. (UMI No. 3225795)
Curtis, R. (2012). Factors influencing the college choice of music majors attending a
four-year institution: A comparative study (Doctoral dissertation). Available from
ProQuest Dissertations and Theses database. (UMI No. 3507423)
Dale, A. (2010). The college-choice process of high achieving freshmen: A comparative
case study (Doctoral dissertation). Available from ProQuest Dissertations and
Theses database. (UMI No. 3410693)
Damron, T. S. (2011). The impact of academic success stories on the effectiveness of the
campus tour (Doctoral dissertation). Available from ProQuest Dissertations and
Theses database. (UMI No. 3460550)
169
Denton, R. B. (2007). A study to identify the effects of community college student
recruitment marketing by television on prospective students (Doctoral
dissertation). Available from ProQuest Dissertations and Theses database. (UMI
No. 3296201)
Dickinson, B. B. (2003). Marketing and the student decision-making process in selecting
a technical institute (Doctoral dissertation). Available from ProQuest
Dissertations and Theses database. (UMI No. 3100581)
Dolence, M. G. (1990). Evaluation criteria for an enrollment management program.
Planning for higher education, 18(1), 1-14.
Donnellan, J. (2002). The impact of marketer-controlled factors on college-choice
decisions by students at a public research university (Doctoral dissertation).
Available from ProQuest Dissertations and Theses database. (UMI No. 3039351)
Duffy, E. A., & Goldberg, I. (1998). Crafting a class: College admissions and financial
aid. 1955-1994. Princeton, NJ: Princeton University Press.
Dupaul, D. (2010). Understanding the behaviors of stealth applicants in the college
search process (Doctoral dissertation). Available from ProQuest Dissertations and
Theses database. (UMI No. 3423014)
Education.com. (2013). Olivet Nazarene University. Retrieved from
http://www.education.com/college/olivet-nazarene-university/
Filter, S. (2010). The choice-of-college decision of academically talented students
(Doctoral dissertation). Available from ProQuest Dissertations and Theses
database. (UMI No. 3397600)
170
Furukawa, D. T. (2011). College choice influences among high-achieving students: An
exploratory case study of college freshmen (Doctoral dissertation). Available from
ProQuest Dissertations and Theses database. (UMI No. 3475421)
Gay, L. R., Mills, G. E., & Airasian, P. (2009). Educational research: Competencies for
analysis and applications. Upper Saddle River, NJ: Pearson Education.
Harris, T. A. (2010). Enrollment management professionals in community colleges: An
exploratory study of their influence on student recruitment and retention
(Doctoral dissertation). Available from Proquest Dissertations and Theses
database. (UMI No. 3397208)
Hart, K. H. (2010). Critical components of community college enrollment management
planning (Doctoral dissertation). Available from ProQuest Dissertations and
Theses database. (UMI No. 3441920)
Hawkins, D. A., & Clinedinst, M. (2006). State of college admissions 2006. New York,
NY: National Association for Admission Counseling.
Henry, L. M. (2012). Understanding the college choice process of Catholic
homeschooled students (Doctoral dissertation). Available from ProQuest
Dissertations and Theses database. (UMI No. 3503041)
Hilpert, J. M. (1985). Enrollment success in private postsecondary institutions
(presidents, admissions) (Doctoral dissertation). Available from ProQuest
Dissertations and Theses database. (UMI No. 8600455)
Hoover, E. (2010). The sweet and subtle science of wooing the admitted. Chronicle of
Higher Education, 56(33), A1-A19.
171
Hossler, D. (2004). How enrollment management has transformed - or ruined - higher
education. The Chronicle of Higher Education, 50(34), B3.
Hossler, D., & Gallagher, K. S. (1987). Studying college choice: A three-phase model
and the implications for policy makers. College and University Journal, 2(3),
425-451.
Hossler, D., & Kemerer, F. (1986). Enrollment management and its context. New
Directions for Higher Education, 53(1), 5-14.
Howard, M. M. (2002). Student use of rankings in national magazines in the college-
decision making process (Doctoral dissertation). Available from ProQuest
Dissertations and Theses database. (UMI No. 3086831)
Irwin, J. V. (2008). The influence of self-efficiency on the college choice process: A
comparative study of private four-year university, public four-year university, and
community college students (Doctoral dissertation). Available from ProQuest
Dissertations and Theses database. (UMI No. 3305789)
Jenkins, P. (2006). The efficacy of integrating corporate marketing strategies with
educational recruitment in a small Texas college (Doctoral dissertation).
Available from ProQuest Dissertations and Theses database. (UMI No. 3200709)
Jennings, L. R. (2008). Women and college choice: A comparison of staff and student
perceptions at four women’s colleges (Doctoral dissertation). Available from
ProQuest Dissertations and Theses database. (UMI No. 3335973)
Jivasantikarn, K. (2003). Marketing approaches used by private vocational schools in
Thailand (Doctoral dissertation). Available from ProQuest Dissertations and
Theses database. (UMI No. 3087868)
172
Kaczynski, K. M. (2011). Exploring the influence of siblings and their relationships on
the college choice process (Doctoral dissertation). Available from ProQuest
Dissertations and Theses database. (UMI No. 3449126)
Kanyi, T. K. (2009). Towards a marketing communication recruitment plan for Rowan
University Educational Leadership doctoral program (Doctoral dissertation).
Available from ProQuest Dissertations and Theses database. (UMI No. 3433016)
Kerin, R. A., Hartley, S. W., & Rudelius, W. (2011). Marketing: The core (4th
ed). New
York, NY: McGraw-Hill/Irwin.
Kerin, R. A., Hartley, S. W., & Rudelius, W. (2013). Marketing: The core (5th ed). New
York, NY: McGraw-Hill/Irwin.
Kim, Y. M. (2001) Impact of institutional marketing and recruiting activities on
international undergraduate student college choice: A comparative study of three
SUNY campuses (Doctoral dissertation). Available from ProQuest Dissertations
and Theses database. (UMI No. 3010838)
Kim, J. K., & Gasman, M. (2011). In search of a “good college”: Decisions and
determinations behind Asian American students’ college choice. Journal of
Student Development, 52(6), 706-728.
Lee, S. (2010). The implementation of enrollment management at two public universities
experiencing demographic and funding challenges (Doctoral dissertation).
Available from Proquest Dissertations and Theses database. (UMI No. 3403195)
Leedy, P. D., & Ormrod, J. E. (2010). Practical research: Planning and design (9th
ed).
Saddle River, NJ: Pearson Education.
173
Liechty, D. K. (2000). A delicate balance: Faith, status, and marketing at a Mennonite
liberal arts college (Doctoral dissertation). Available from ProQuest Dissertations
and Theses database. (UMI No. 3000579)
Mallet, W. M. (2007). Recruitment practices and college choice factors that influence
international undergraduate enrollment (Doctoral dissertation). Available from
ProQuest Dissertations and Theses database. (UMI No. 3255417)
Martin, T. J. (2006). Information processing and college choice: An examination of
recruitment information on higher education Web sites using the heuristic-
systematic model (Doctoral dissertation). Available from ProQuest Dissertations
and Theses database. (UMI No. 3216515)
Mayfield, D. (2005). Finding Martha: Social networks that influence student enrollment
into vocational education programs in the community college (Doctoral
dissertation). Available from ProQuest Dissertations and Theses database. (UMI
No. 3196853)
McCoy, J. C. (2011). A comparison of internet marketing methods utilized by higher
education institutions (Doctoral dissertation). Available from ProQuest
Dissertations and Theses database. (UMI No. 3469336)
McLeod, R. D. (1990). College recruitment and marketing photographs: A comparison
of the perceptions of fifteen selected images between college-bound high school
students and adults (Doctoral dissertation). Available from ProQuest
Dissertations and Theses database. (UMI No. 9025928)
174
Mitchell, P. T. (1980). Developing a marketing model for private two-year college
admissions (Doctoral dissertation). Available from ProQuest Dissertations and
Theses database. (UMI No. 8122610)
Morris, C. G. (2009). Prospective student interaction and engagement with the college:
Linking timeliness to enrollment likelihood (Doctoral dissertation). Available
from ProQuest Dissertation and Theses database. (UMI No. 3344793)
Morse, R., & Flanigan, S. (2008). How we calculate rankings. U.S. News and World
Report. Retrieved from
http://www.usnews.com/education/articles/2008/08/21/how-we-calculate-the-
rankings
Mozie-Ross, Y. D. (2011). An examination of high school graduates who identify
teachers as influential in their choice of college (Doctoral dissertation). Available
from ProQuest Dissertations and Theses database (UMI No. 3495401)
Noel-Levitz. (2010a). 2010 E-expectations report. Retrieved from
https://www.noellevitz.com/papers-research-higher-education/2010/2010-e-
expectations-report
Noel-Levitz. (2010b). 2010 E-recruiting practices and trends at four-year and two-year
institutions. Retrieved from https://www.noellevitz.com/benchmarkreports
Norwood, M. (2009). An examination of factors influencing African-American students'
choice to attend predominately white colleges and universities (Doctoral
dissertation). Available from ProQuest Dissertations and Theses database. (UMI
No. 3386218)
Olivet Nazarene University. (2012). About Olivet. Retrieved from http://www.olivet.edu
175
Parrot, T. V., & Tipton, S. (2010). Using social media “smartly” in the admission
process. College and University, 86(1), 51-53.
Pegoraro, A. (2006). Using university websites for student recruitment: A study of
Canadian university home pages examining relationship marketing tactics and
website usability (Doctoral dissertation). Available from ProQuest Dissertations
and Theses database. (UMI No. 3237484)
Posecznick, A. (2010). Admission in practice: On the ongoing production of an unranked
college (Doctoral dissertation). Available from ProQuest Dissertations and Theses
database. (UMI No. 3447927)
Quatroache, T. J., Jr. (2004). A study of promotional marketing methods of contact and
college-choice preferences among freshman community college students
(Doctoral dissertation). Available from ProQuest Dissertations and Theses
database. (UMI No. 3141304)
Robison, J. E. (2007). Ethical considerations in the use of commercial agents in
international student recruitment (Doctoral dissertation). Available from
ProQuest Dissertations and Theses database. (UMI No. 3322738)
Romali, R. F. (2011). Pacific Community College district's enrollment strategies
responding to California's funding mechanism changes (Doctoral dissertation).
Available from ProQuest Dissertations and Theses database. (UMI No. 3443954)
Ryan, C. (2012). Factors influencing the college choice of music majors attending a four
year institution: A comparative study (Doctoral dissertation). Available from
ProQuest Dissertations and Theses database. (UMI No. 3507423)
176
Samuel, K. (2009). College choice of natural science students: The factors and sources
that influence enrollment decisions (Doctoral dissertation). Available from
ProQuest Dissertations and Theses database. (UMI No. 3368577)
Sauder, V. (2008). Marketing Seventh-day Adventist higher education: College-choice
motivators and barriers (Doctoral dissertation). Available from ProQuest
Dissertations and Theses database. (UMI No. 3306672)
Schoenherr, H. J. (2009). Beyond academic reputation: Factors that influence the college
of first choice in high achieving students (Doctoral dissertation). Available from
ProQuest Dissertations and Theses database. (UMI No. 3394181)
Smith, S. P. (2006). An exploration of perceived usefulness of admissions advisors,
guidance counselors, family, friends, websites, campus tours, and print
publications during the search and choice phases of the college selection process
(Doctoral dissertation). Available from ProQuest Dissertations and Theses
database. (UMI No. 3213885)
Stack, S. J. (2010). Informing graduate enrollment management: Marketing and
admissions through students' perspectives (Doctoral dissertation). Available from
ProQuest Dissertations and Theses database. (UMI No. 3385179)
Stevenson, S. G. (2011). College choice process and perspectives of students who chose
to attend a military junior college: Voice from students and parents (Doctoral
dissertation). Available from ProQuest Dissertations and Theses database. (UMI
No. 3438844)

177
Striegler, H. R., Jr. (1991). The role of the admissions in marketing higher education by
the year 2000 (Doctoral dissertation). Available from ProQuest Dissertations and
Theses database. (UMI No. 9134007)
Streveler, T. I. (1986). Changes in the post-high school institutional selection of seniors
and the factors that influence selection changes (admissions, recruitment,
marketing, college choice) (Doctoral dissertation). Available from ProQuest
Dissertations and Theses database. (UMI No. 8616594)
Tan, C. J. (2009). College choice in the Philippines (Doctoral dissertation). Available
from ProQuest Dissertations and Theses database. (UMI No. 3381792)
Tellis, G. J. (2004). Effective Advertising: Understanding When, How, and Why
Advertising Works. Thousand Oaks: Sage.
Thoene, W. S. (2011). Exploring the role of word-of-mouth marketing in college course
selection (Doctoral dissertation). Available from ProQuest Dissertations and
Theses database. (UMI No. 3462960)
Tucciarone, K. (2007). Vying for attention: How does advertising affect search and
college choice? College and University, 83(1), 26-35.
Vander Schee, B. (2010). The small college enrollment officer: Relationship marketing at
work. Journal of Marketing for Higher Education, 20(1), 135-143.
doi:10.1080/08841241003788177
Wang, X. (2009). Institutional recruitment strategies and international undergraduate
student university choice at two Canadian universities (Doctoral dissertation).
Available from ProQuest Dissertations and Theses database. (UMI No. NR60882)
178
Whiteside, R. (2004). Student marketing for colleges and universities. Washington, DC:
American Association of Collegiate Registrars and Admissions Officers.
Woodhouse, S. (2006). Faculty involvement in graduate student recruitment:
Administrative directive or professional preference? Journal of College
Admission, 191, 26-32.
Wright, C. M. (2001). Marketing in western Pennsylvania community colleges (Doctoral
dissertation). Available from ProQuest Dissertations and Theses database. (UMI
No. 3038299)
Wuestenberg, P. J. (2003). Admission policies for athletes: A survey of NCAA Division I-
A admission directors (Doctoral dissertation). Available from ProQuest
Dissertations and Theses database. (UMI No. 3116263)
Yang, L. (2003). International student recruitment in Alberta public colleges (Doctoral
dissertation). Available from ProQuest Dissertations and Theses database. (UMI
No. NQ82186)

179
APPENDIX A
Orientation Announcement
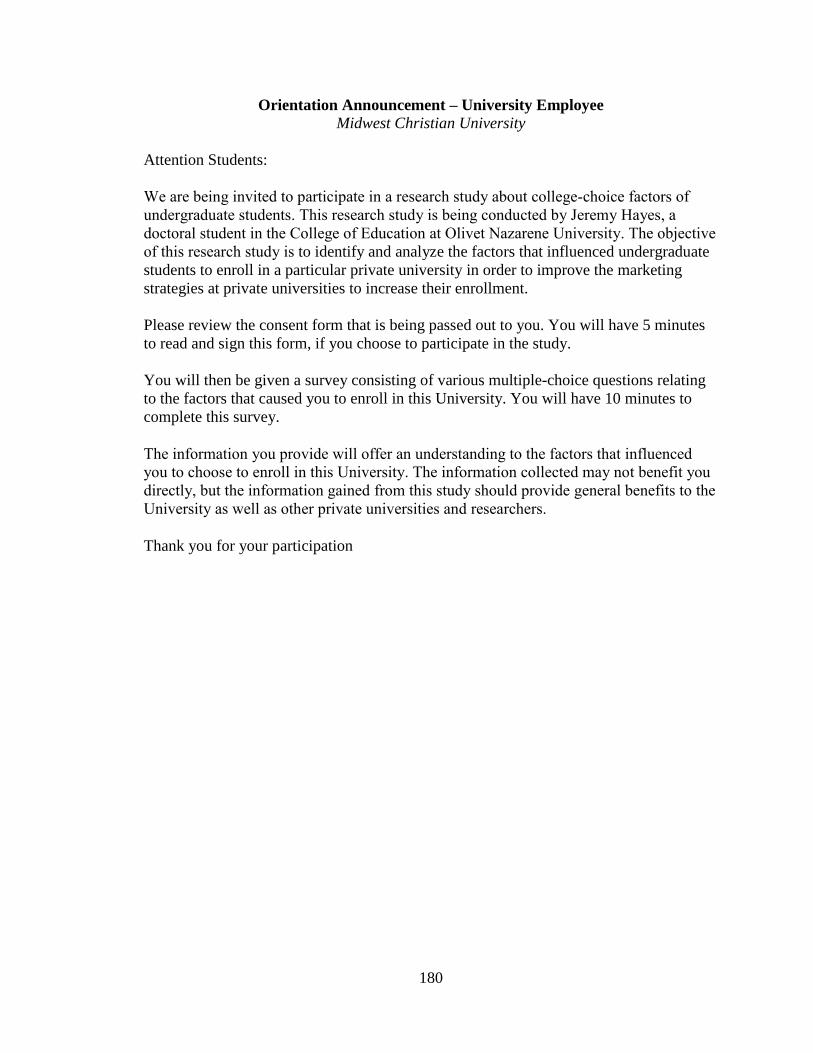
180
Orientation Announcement – University Employee
Midwest Christian University
Attention Students:
We are being invited to participate in a research study about college-choice factors of
undergraduate students. This research study is being conducted by Jeremy Hayes, a
doctoral student in the College of Education at Olivet Nazarene University. The objective
of this research study is to identify and analyze the factors that influenced undergraduate
students to enroll in a particular private university in order to improve the marketing
strategies at private universities to increase their enrollment.
Please review the consent form that is being passed out to you. You will have 5 minutes
to read and sign this form, if you choose to participate in the study.
You will then be given a survey consisting of various multiple-choice questions relating
to the factors that caused you to enroll in this University. You will have 10 minutes to
complete this survey.
The information you provide will offer an understanding to the factors that influenced
you to choose to enroll in this University. The information collected may not benefit you
directly, but the information gained from this study should provide general benefits to the
University as well as other private universities and researchers.
Thank you for your participation

181
APPENDIX B
Informed Consent Form
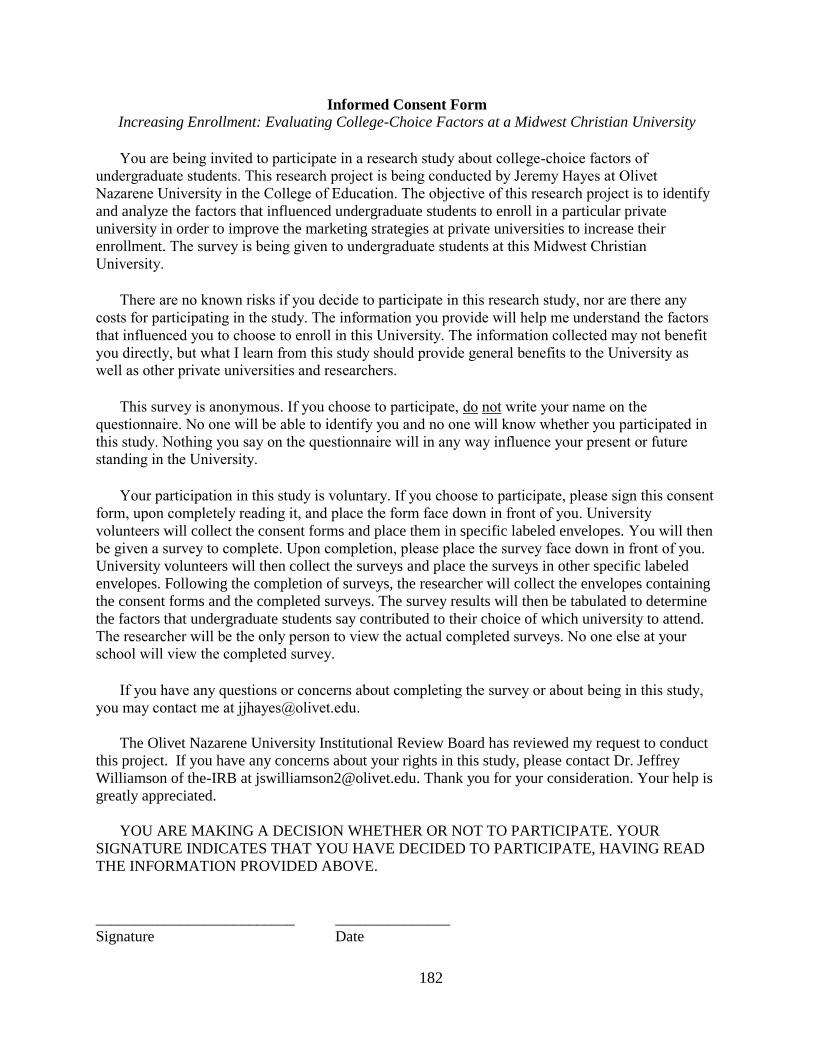
182
Informed Consent Form
Increasing Enrollment: Evaluating College-Choice Factors at a Midwest Christian University
You are being invited to participate in a research study about college-choice factors of
undergraduate students. This research project is being conducted by Jeremy Hayes at Olivet
Nazarene University in the College of Education. The objective of this research project is to identify
and analyze the factors that influenced undergraduate students to enroll in a particular private
university in order to improve the marketing strategies at private universities to increase their
enrollment. The survey is being given to undergraduate students at this Midwest Christian
University.
There are no known risks if you decide to participate in this research study, nor are there any
costs for participating in the study. The information you provide will help me understand the factors
that influenced you to choose to enroll in this University. The information collected may not benefit
you directly, but what I learn from this study should provide general benefits to the University as well as other private universities and researchers.
This survey is anonymous. If you choose to participate, do not write your name on the
questionnaire. No one will be able to identify you and no one will know whether you participated in
this study. Nothing you say on the questionnaire will in any way influence your present or future standing in the University.
Your participation in this study is voluntary. If you choose to participate, please sign this consent
form, upon completely reading it, and place the form face down in front of you. University
volunteers will collect the consent forms and place them in specific labeled envelopes. You will then
be given a survey to complete. Upon completion, please place the survey face down in front of you.
University volunteers will then collect the surveys and place the surveys in other specific labeled
envelopes. Following the completion of surveys, the researcher will collect the envelopes containing
the consent forms and the completed surveys. The survey results will then be tabulated to determine
the factors that undergraduate students say contributed to their choice of which university to attend.
The researcher will be the only person to view the actual completed surveys. No one else at your school will view the completed survey.
If you have any questions or concerns about completing the survey or about being in this study,
you may contact me at [email protected].
The Olivet Nazarene University Institutional Review Board has reviewed my request to conduct
this project. If you have any concerns about your rights in this study, please contact Dr. Jeffrey
Williamson of the-IRB at [email protected]. Thank you for your consideration. Your help is
greatly appreciated.
YOU ARE MAKING A DECISION WHETHER OR NOT TO PARTICIPATE. YOUR
SIGNATURE INDICATES THAT YOU HAVE DECIDED TO PARTICIPATE, HAVING READ
THE INFORMATION PROVIDED ABOVE.
__________________________ _______________
Signature Date

183
APPENDIX C
College Choice Survey
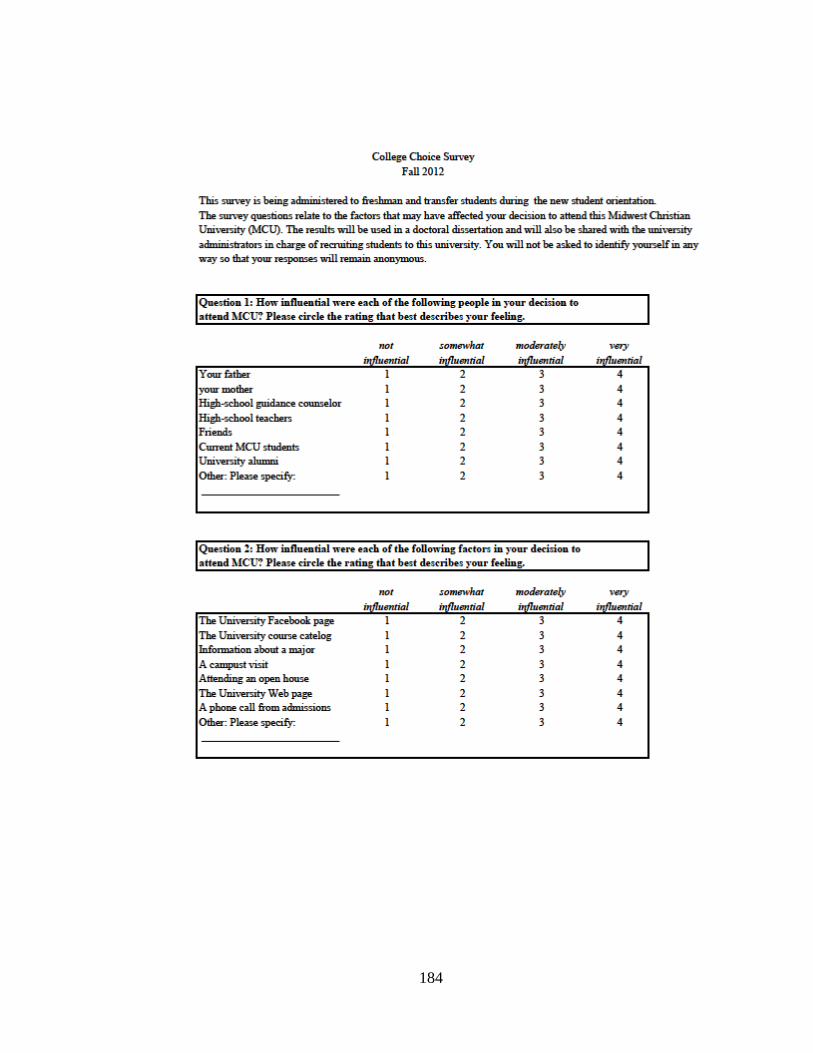
184
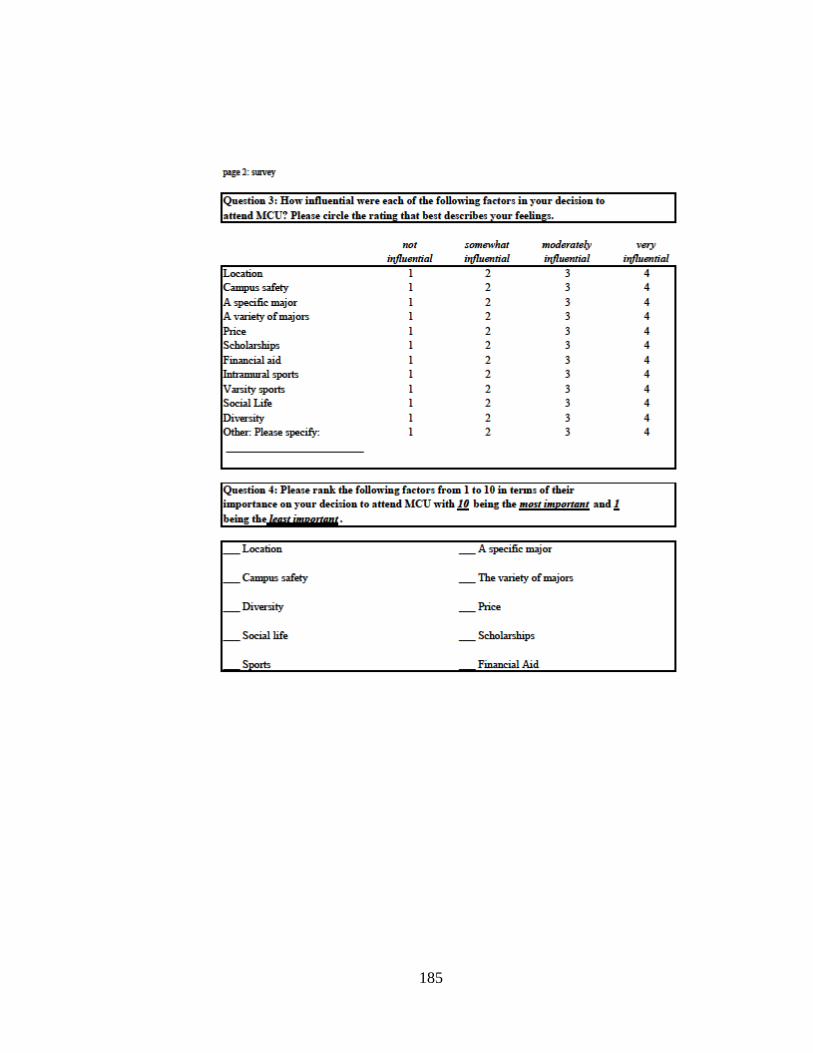
185
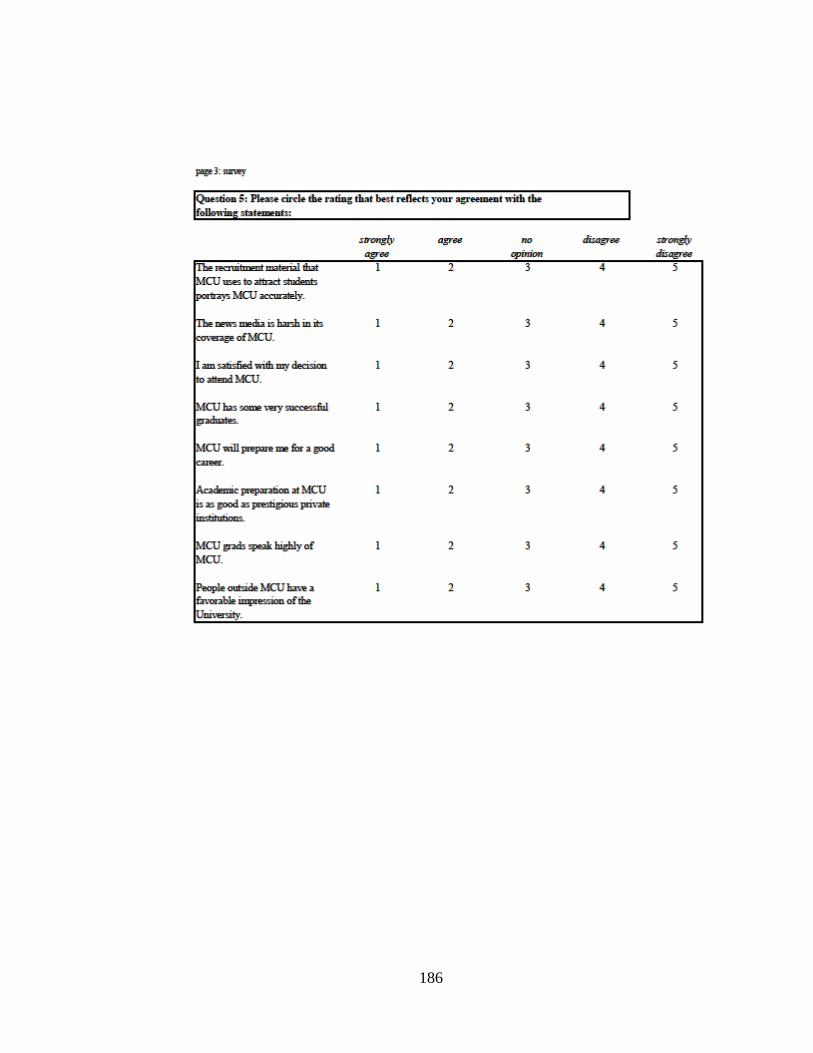
186

187
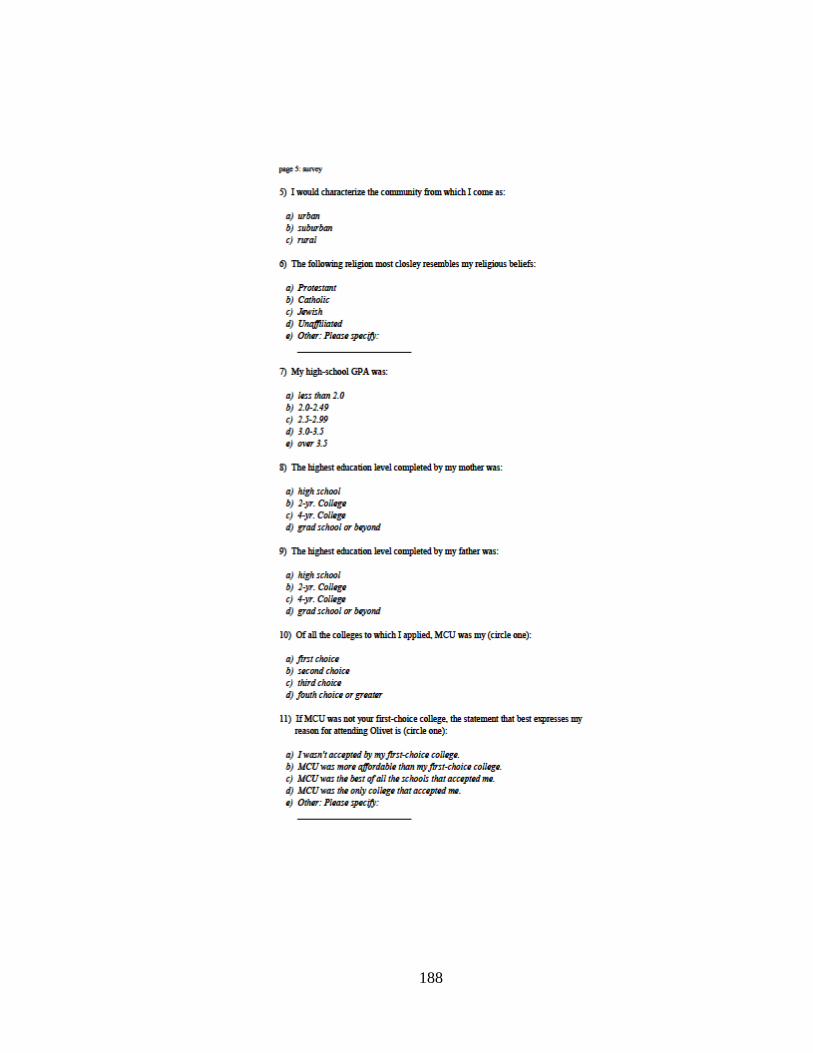
188