increasing food security: opportunities to grow chaffee...
TRANSCRIPT
1
Increasing Food Security: Opportunities to Grow Chaffee County’s Economy
Background In February 2011, LiveWell Chaffee County (LWCC) received a grant from the Colorado Health Foundation to conduct a food assessment to better understand access to healthy foods for food insecure populations in Chaffee County. This assessment uncovered a considerably sized, possibly “invisible” food insecure population and identified household budget constraints as a primary barrier to eating a healthy, balanced diet. This report specifically explores the County’s food insecure (households experiencing some degree of hunger) population.
Falling Through the Cracks: Who’s Hungry in Chaffee County? Several federal food assistance and community food assistance programs exist to help families with limited financial means get enough to eat. These include Supplemental Nutrition Assistance Program (SNAP, formerly food stamps), the Women, Infant & Children (WIC) Program, the Free and Reduced Lunch Program, as well as local, non-profit food assistance programs such as food pantries. State and national data on food security rates as well as use of food assistance programs provide some insight into the prevalence of hunger in Chaffee County: For 2012, 727 distinct cases, or about 10% of Chaffee County households, used SNAP
benefits at some time, averaged across months1. In October 2012, 42% of Salida students and 39% of Buena Vista students had been
approved for Free or Reduced Meals. In 2010, most of Chaffee County’s food insecure population (2,510 people, 14.3% of the
population) qualified for some form of food assistance, however, 929 people did not, meaning they may be going without adequate food or are relying on community assistance2.
1 in 5 children in the county are considered food insecure, but a quarter of these food insecure children do not qualify for federal assistance.
A large number of individuals and families that do qualify for federal food assistance programs are not using them, increasing the degree of hunger experienced.
According to state caseload data and American Community Survey income estimates, approximately 47% of Chaffee County’s eligible population actually participated in the SNAP program in 2011.3
Of students eligible for Free or Reduced Meals, 63% in Salida and 58.8% in Buena Vista ate a school lunch, on average, on any given day in school year 2011-20124.
1 Colorado Department of Human Services 2012 “SNAP 388” Reports 2 Mapping the Meal Gap, Feeding America 3 County and Sub-County Estimates of the Number of Persons Eligible but Not Enrolled in SNAP, 2011. The views expressed are those of the author and are not necessarily those of CDHS and any errors are those of the author alone. 4 No Kid Hungry Colorado
2 [Type the document title]
Opportunities to Increase Food Security and Grow the Local Economy Increasing food assistance program participation not only increases local food security and helps families; it also helps grow the local economy. According to the USDA, every $5 in new SNAP benefits generates $9.00 more in total community spending. A 5% increase in SNAP participation in Colorado would generate $19 million in additional economic activity. Participation rates in Free and Reduce Priced Meal programs (both breakfast and lunch) also have significant financial impacts on school districts. The percentage of eligible students in a district, and that district’s track record in getting them fed, determine what grant and funding opportunities districts might be eligible and competitive for. For the 2010-11 school year, Food Research and Action Center5 estimated that if participation in Free and Reduced Price Breakfasts alone (not including lunches) were to increase from 41% to 60% in Colorado, the state would bring in almost $11 million additional federal dollars.
Learn More Potential strategies and advocacy opportunities are detailed in LWCC’s complete food assessment report, as well as the attached full report, “Exploring Chaffee County’s Food Insecure Population”. Please contact Lisa Malde, the LWCC Director, at 530-2569 or [email protected] to discuss these opportunities more.
5 Food Research and Action Center, State of the States 2011
3
Full Report: Exploring Chaffee County’s Food Insecure Population
Introduction- Defining Food Security and Food Assistance Generally, food security is defined as “access by all to sufficient food for an active, healthy life.” The USDA defines several levels of food security, including the following: High food security- no reported indication of food access problems or limitations Marginal food security- one or two reported indications--typically of anxiety over food
sufficiency or shortage of food in the house. Little or no indication of changes in diets or food intake
Low food security- reports of reduced quality, variety, or desirability of diet. Little or no indication of reduced food intake.
Very low food security- reports of multiple indications of disrupted eating patterns and reduced food intake
Families experiencing low food security are plagued by anxiety and worry about what they will eat day in and day out, where it will come from, and how much it will cost given other household needs. For qualifying families, some assistance exists. These food assistance programs tend to fall into two categories- federally provided assistance and community provided assistance. Many food assistance programs are income-based, meaning that gross annual household income must fall below a certain threshold in order for a family to qualify for federal programs such as SNAP (130% of Federal Poverty Level) and Free and Reduced Lunch Program (130% and 185% of Federal Poverty Level, respectively). The specific income qualifications for 2012 are provided in Appendix A. In some communities, additional charitable food assistance programs may be available for families in need, regardless of income, while others are also income based. These community based food assistance programs are typically food pantries, soup kitchens, and church meals. Household income and food prices are not the only things that affect food security. In some areas, availability of food, variety and quality of food available, availability of transportation, and store locations can influence household food security. These issues are captured by a more encompassing term, called “food access”. Food access is more complex and has several technical definitions depending on the conversation. It is, however, generally agreed that it consists of the following factors:
Economic access: food options are available and affordable Physical access: residents live within a reasonable distance of an appropriate
food outlet Nutritional access: healthy, varied options are available and accommodate
various dietary restrictions Social/cultural access: familiar foods that are consistent with cultural traditions
are available
4 [Type the document title]
The terms food access and food security are often used interchangeably, but can also mean very different things. Food access is more thoroughly discussed in a report commissioned by LiveWell Chaffee County. This report can be requested through Lisa Malde, Director, LiveWell Chaffee County at 530-2569 or [email protected].
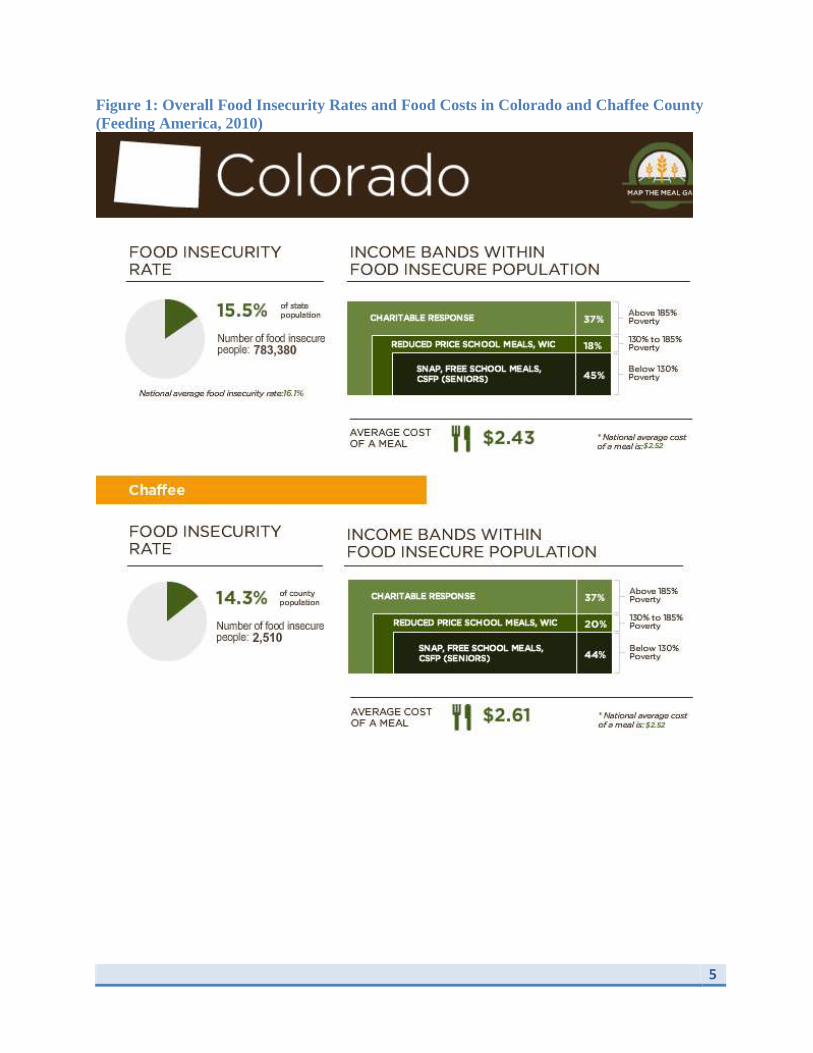
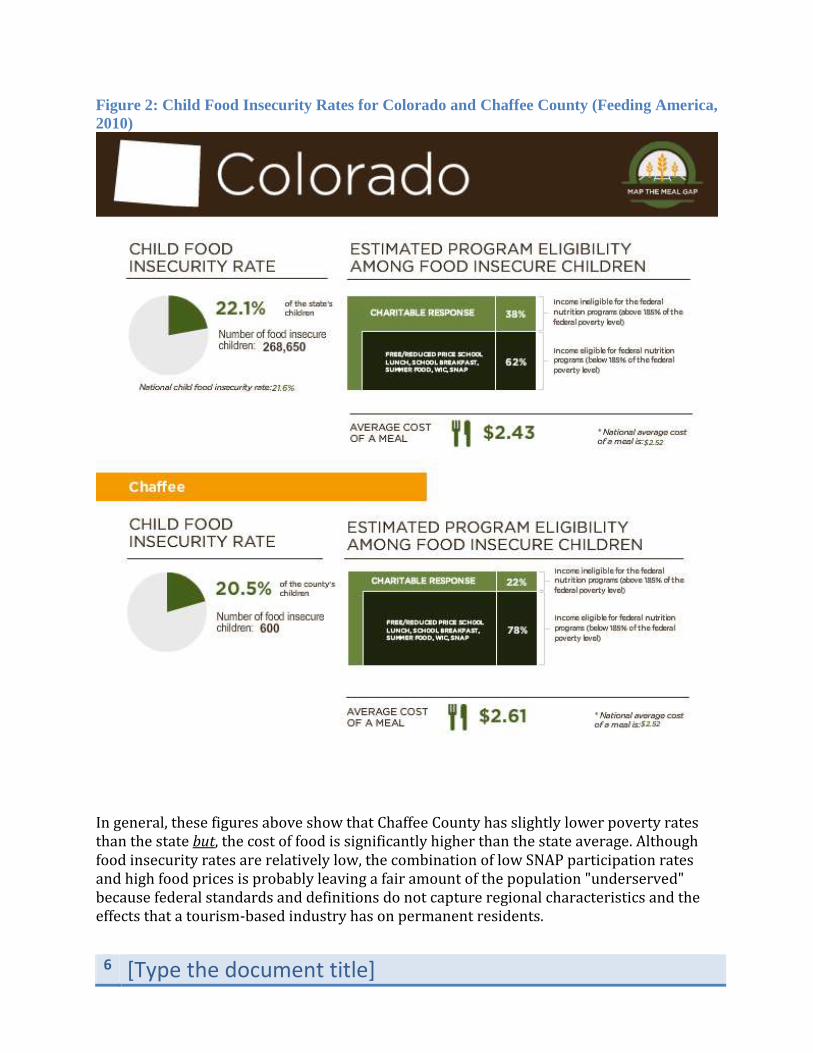
Food Insecurity in Chaffee County Not just the availability of food, but also food costs, availability of transportation, and the use of food assistance programs can all indicate whether or not a community is food secure. Figures 1, and 2, below, outline available data from Feeding America’s Map the Meal Gap6. This data describes Colorado’s and Chaffee County’s food insecure populations and provides average meal prices. Figures 1 and 2 specifically identify the percent of food insecure people who qualify for income-based programs. For example in Figure 1, 44% of the 2,510 food insecure people in Chaffee County qualify for SNAP and free school lunches, 20% qualify for reduced price lunches, and 37% of food insecure individuals do not qualify for any Federal food assistance programs. This means that 929 (37% of 2,510 food insecure individuals) people are struggling to get enough to eat, and must rely on family, friends, and charitable contributions to make ends meet. Similarly, Figure 2 shows that 132 children (22% of 600 children) do not qualify for food assistance programs such as the Free and Reduced Lunch program, and are potentially more insecure than children of lower income families because they are not being served by such programs. As Figure 2 shows, this gap (food insecure children who are not eligible for some programs) still exists even though more and more students are indeed eligible for Free and Reduced Meals (FRM). In addition to signifying how well a community is doing in providing consistent, healthy meals to students who need it most, participation rates in Free and Reduce Priced Meal programs (both breakfast and lunch) have significant financial impacts on school districts. The percentage of eligible students in a district, and that district’s track record in getting them fed, determine what grant and funding opportunities districts might be eligible and competitive for. For the 2010-11 school year, Food Research and Action Center7 estimated that if participation in Free and Reduced Price Breakfasts alone (not including lunches) were to increase from 41% to 60% in Colorado, the state would bring in almost $11 million additional federal dollars. Collectively, Figures 2 demonstrate a significant need to better understand the programs available to families with children and to maximize them to their utmost potential. As shown in Figures 1 and 2, the discrepancy between overall food insecurity rates for Chaffee County (14.3%) and the childhood food insecurity rate (20.5%) indicates that food assistance programs are underserving families with children.
6 More information available at: http://feedingamerica.org/hunger-in-america/hunger-studies/map-the-meal-gap.aspx 7 Food Research and Action Center, State of the States 2011, http://frac.org/wp-content/uploads/2010/07/co.pdf
5
Figure 1: Overall Food Insecurity Rates and Food Costs in Colorado and Chaffee County
(Feeding America, 2010)
6 [Type the document title]
Figure 2: Child Food Insecurity Rates for Colorado and Chaffee County (Feeding America,
2010)
In general, these figures above show that Chaffee County has slightly lower poverty rates than the state but, the cost of food is significantly higher than the state average. Although food insecurity rates are relatively low, the combination of low SNAP participation rates and high food prices is probably leaving a fair amount of the population "underserved" because federal standards and definitions do not capture regional characteristics and the effects that a tourism-based industry has on permanent residents.
7
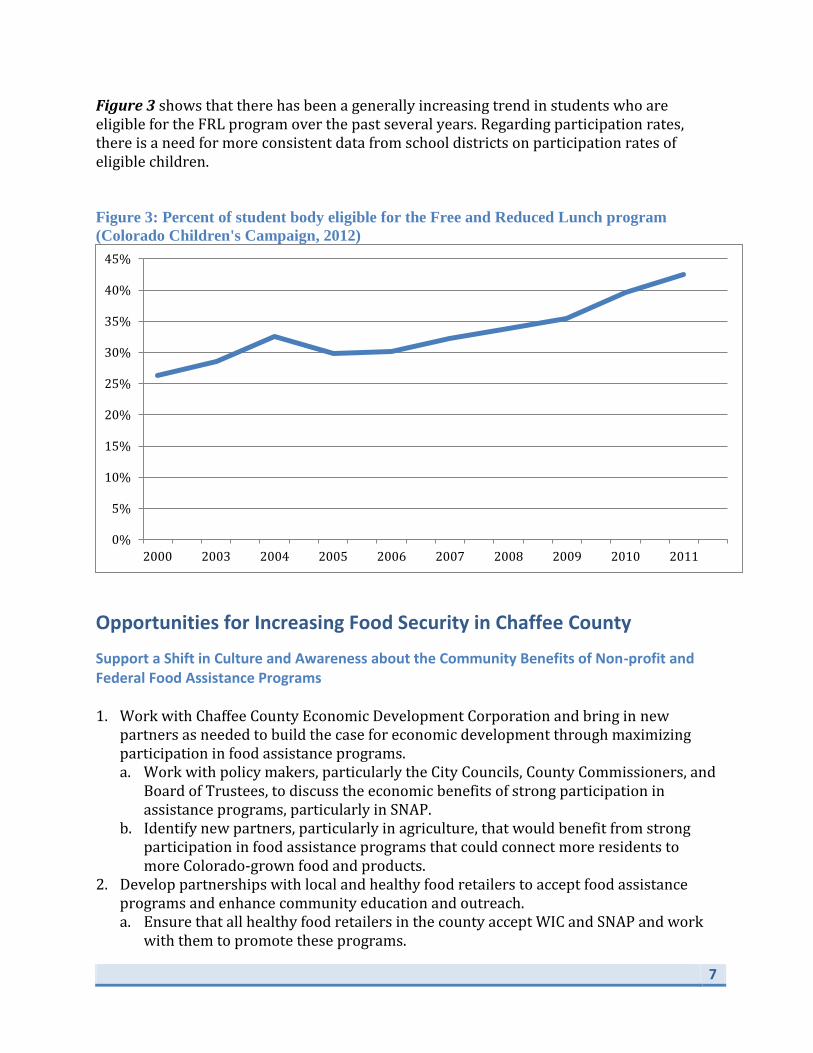
Figure 3 shows that there has been a generally increasing trend in students who are eligible for the FRL program over the past several years. Regarding participation rates, there is a need for more consistent data from school districts on participation rates of eligible children. Figure 3: Percent of student body eligible for the Free and Reduced Lunch program
(Colorado Children's Campaign, 2012)
Opportunities for Increasing Food Security in Chaffee County
Support a Shift in Culture and Awareness about the Community Benefits of Non-profit and Federal Food Assistance Programs 1. Work with Chaffee County Economic Development Corporation and bring in new
partners as needed to build the case for economic development through maximizing participation in food assistance programs. a. Work with policy makers, particularly the City Councils, County Commissioners, and
Board of Trustees, to discuss the economic benefits of strong participation in assistance programs, particularly in SNAP.
b. Identify new partners, particularly in agriculture, that would benefit from strong participation in food assistance programs that could connect more residents to more Colorado-grown food and products.
2. Develop partnerships with local and healthy food retailers to accept food assistance programs and enhance community education and outreach. a. Ensure that all healthy food retailers in the county accept WIC and SNAP and work
with them to promote these programs.
0%
5%
10%
15%
20%
25%
30%
35%
40%
45%
2000 2003 2004 2005 2006 2007 2008 2009 2010 2011
8 [Type the document title]
b. Strengthen community outreach and education of all the fresh, healthy retail options where residents can use food assistance benefits.
c. Advertise the ways residents can connect to local agriculture and local retail by using their food assistance.
3. Convene both food assistance providers as well as eligible recipients to strategize on stronger coordination and how to overcome barriers to participation. a. Convene all providers of food assistance programs and food assistance recipients to
discuss unique challenges and potential solutions to increasing participation, breaking down stigmas, and increasing acceptance for the need for food assistance programs.
b. Discuss and develop cross-promotional materials for food assistance organizations, federal food assistance programs, and other nutrition services (e.g., Free & Reduced Lunch school meal participation).
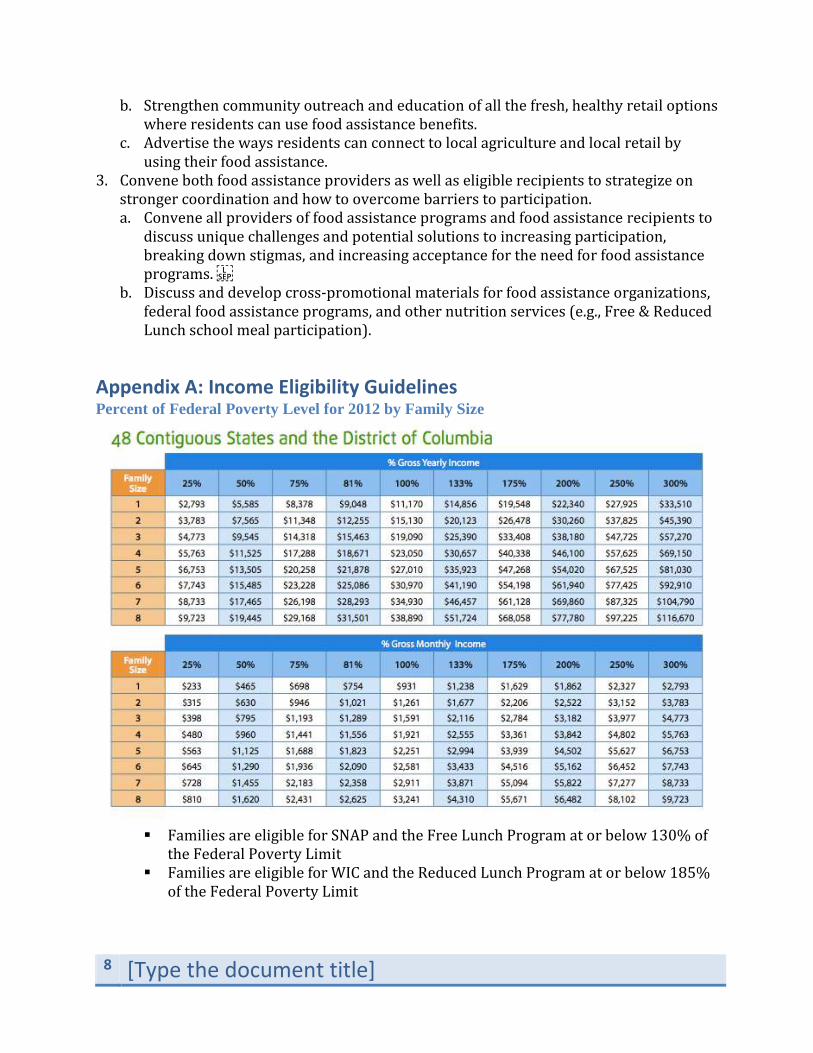
Appendix A: Income Eligibility Guidelines Percent of Federal Poverty Level for 2012 by Family Size
Families are eligible for SNAP and the Free Lunch Program at or below 130% of
the Federal Poverty Limit Families are eligible for WIC and the Reduced Lunch Program at or below 185%
of the Federal Poverty Limit