increasing politicization and homogeneity in scientific
TRANSCRIPT

1
Increasing Politicization and Homogeneity in Scientific
Funding: An Analysis of NSF Grants, 1990-2020
Leif Rasmussen*
Center for the Study of Partisanship and Ideology
Report No. 4
11/15/2021
* PhD Candidate at Northwestern University

2
Summary
1. The National Science Foundation (NSF) is the main governmental scientific grant
distributing body in the United States, with an annual budget of over $8 billion.
2. This report uses natural language processing to analyze the abstracts of successful
grants from 1990 to 2020 in the seven fields of Biological Sciences, Computer &
Information Science & Engineering, Education & Human Resources, Engineering,
Geosciences, Mathematical & Physical Sciences, and Social, Behavioral &
Economic Sciences.
3. The frequency of documents containing highly politicized terms has been increasing
consistently over the last three decades. These include words related to gender and
race, and terms like “equity” and “inclusion.” Many terms have seen exponential
growth in the past few years.
4. At the same time, abstracts in most directorates have been becoming more similar to
each other over time. This arguably shows that there is less diversity in the kinds of
ideas that are getting funded. This effect is particularly strong in the last few years,
but the trend is clear over the last three decades when a technique based on word
similarity, rather than the matching of exact terms, is used.
5. Taken together, the results imply that there has been a politicization of scientific
funding in the US in recent years and a decrease in the diversity of ideas supported,
indicating a possible decline in the quality of research and the potential for
decreased trust towards scientific institutions among the general public.
Introduction
Richard Feynman introduced a concept he called “cargo cult science” during a
commencement speech at Caltech in 1974.1 In the Second World War, Allied and Japanese
airbases sprung up on islands in the South Pacific that were home to pre-industrial cultures that
previously had little contact with the modern world. The soldiers on many of these bases would
trade manufactured clothing, medicine, canned food, and other goods with the natives, most of
which arrived by airdrop. After the war ended and the soldiers left, the native populations on
some of the islands began to create replicas of things like airstrips, airplanes, and flight control
towers. They even made mock radios and headphones out of coconuts and straw. The natives
believed that by recreating the conditions under which the airplanes came and dropped goods,
they could get the airdrops to resume.
There were entire areas of academic study that Feynman called “cargo cult science” –
mostly in the fields of social science and education. These areas of inquiry see the success that
the scientific method delivers in disciplines like physics, chemistry, and medicine, and produce
superficial replicas of scientific practices. They miss something essential, however, and as
Feynman says, “the planes never land.” So, what is this missing element in “cargo cult science?”
It is “a kind of scientific integrity, a principle of scientific thought that corresponds to a kind of
utter honesty.” Science requires a willingness to relentlessly assail one’s assumptions and a
capacity to bend over backwards to try and disprove ideas even if one passionately wants to
believe they are true. I would love to be able to revisit this critique of Feynman’s and have a
good laugh at how strange and backwards academic institutions and scientific agencies must
have been in the 1970s, but unfortunately, this critique feels as salient today as it must have
when Feynman first expressed it almost 60 years ago.

3
Ideally, the “cargo cult sciences” should start to recede as their practitioners start to
notice that “the planes aren't landing.” What if, however, we have in place institutions that have
degraded to a point where they subsidize and reward practices that are not actual science, but a
kind of science-like interpretive dance? Patrick Collison and Michael Nielsen find that there has
been a precipitous increase in the number of science publications, PhD students graduating in
STEM fields, and government spending on National Institute of Health (NIH) and National
Science Foundation (NSF) grants since the 1960s.2 Their same work, however, shows that when
scientists were surveyed about the importance of Nobel Prize winning discoveries between the
1920s and 1980s, results indicated anywhere from a decline to a general stagnation in the impact
of science over that time period – nothing anywhere near the output we might expect given the
tremendous amount of time and energy now invested. One theory posited by Collison, as well as
economist Tyler Cowen and others, is that science might just be getting harder; we have gotten
to all the low-hanging fruit and now are in the territory of diminishing returns.
Science may be getting harder, but it seems unlikely that this is the sole, or likely even
largest, cause of decreasing productivity. In addition to the previously mentioned increase in
funding to scientific research, the costs of many of the important inputs to research – such as
computing power, gene sequencing, and various types of lab equipment – have been declining
exponentially. With a rise in funding and a decline in the costs of many inputs, we might expect
to be able to generate increased scientific output despite potentially increasing difficulty.
Although a fuller explanation for technological and scientific stagnation is beyond the
scope of this work, here I analyze the abstracts of successful NSF applications and find two
reasons to believe that something has gone wrong with the culture of science, particularly in the
last few decades. The first of these is increasing politicization. If paying lip service to
fashionable political ideas becomes an important criterion for successful grant applications, this
will certainly detract from the importance of other more vital criteria – namely those related to
the quality and importance of the proposed research. When the process of deciding what research
projects get funded comes to be based on a political litmus test, the scientific endeavor suffers.
Additionally, the more that scientific institutions come to be viewed as conduits for promulgating
ideology, the less capable they will be of swaying public opinion on important issues. We may
be starting to see the harmful effects of this process in the current epistemic crisis regarding
public health. The growing view of science as a vehicle for activism detracts from its more vital
role of being a dispassionate referee that adjudicates the validity of empirical claims.
The second major result in this work is the constriction of the space of ideas within NSF
award abstracts. The number of NSF awards given, and the total amount of taxpayer money
spent by the NSF has increased consistently since 1990, and yet this work provides evidence
suggesting that the breadth of ideas within NSF award abstracts has been contracting. In different
contexts, bureaucracies can become positive feedback chambers reinforcing and amplifying
favored ideas while excluding others. Recent work by Johan Chu and James Evans supports this
view by showing that the larger a scientific field becomes, the more it tends to stagnate, with
more reliance on established works in citation patterns and fewer fundamental breakthroughs.3
The NSF is ostensibly an organization meant to stimulate scientific progress for the benefit of the
nation, but the way in which it has become entangled with academia and established institutions
may make it seem more like a professional guild representing the interests of its members. Such
factors could explain the stagnation we see in the ability of the NSF to identify and support
novelty.

4
NSF Awards
The NSF, an independent federal agency, has a stated mission “to promote the progress
of science; to advance the national health, prosperity, and welfare; to secure the national
defense.”4 It has an annual budget of around $8.5 billion and funds approximately a quarter of all
federally funded basic research at colleges and universities in the US. The NSF provides public
access to archives of awards granted in every fiscal year since 1967.5 The data available in these
archives do not include the full proposal texts, which are often lengthy and detailed documents,
but only the abstracts of the proposals that are generally only several hundred words in length.
Additionally, all awards prior to 1986 do not have abstracts, and most awards do not have
abstracts until 1988. Given these limitations of the data, this work only analyzes awards from
1990-2020. Other information provided in these archives for each grant are the identities and
institutions of the primary investigators, the award amount, the title of the proposal, and the NSF
directorate that granted the award. There are seven directorates that are responsible for dispersing
the majority of NSF funding: Biological Sciences; Computer & Information Science &
Engineering; Education & Human Resources; Engineering; Geosciences; Mathematical &
Physical Sciences; and Social, Behavioral & Economic Sciences. All analysis conducted in this
work is broken up by these seven directorates.
Methods
This section intends only to explain the processes used in analyzing the NSF award data
at a higher level. These processes are explained in greater depth in Appendix IV. Additionally,
the code used for the analyses in this work is publicly available to facilitate easy replication of
the results presented here.6
Term Counting
This method simply counts the number of documents containing some form of a given
term. For example, for “inclusion” terms we look for documents containing any of the following
forms: “inclusive,” “inclusivity,” and “inclusion.” Even if a document contains multiple
instances of different forms of a given term, it will only be counted once. The percentage of
documents containing a particular term over the total number of documents in each NSF
directorate in a given year is reported.
Word Frequency Average Cosine Distance
This method collects all the words from all the abstracts in a given directorate and year
and creates a list of each word and the frequency with which it occurs. The frequency
distributions of words in individual abstracts are then compared with the overall frequency
distribution of words in the directorate and year to which the abstract belongs. A mathematical
technique called cosine distance is used to determine how different these two distributions are. A
cosine distance of 0 means that the two distributions are exactly the same, whereas a cosine
distance of 1 means that the distributions are maximally different. The cosine distances of the
word distributions of every abstract from the distribution of its directorate and year are collected

5
and averaged. This average cosine distance for a directorate and year provides a measurement of
how similar or different from each other the abstracts in that group are based on word frequency.
Word Embedding Vectors Average Cosine Distance
Word frequency analysis only deals with language in a purely lexical sense. Using this
tool, we can say certain things about the amount of variety in a corpus of text in terms of word
frequency, but we cannot say anything definitive about the variety of ideas or meaning. It seems
reasonable to expect that variety of words correlates with variety of meaning and ideas, but there
may be certain cases where this does not hold true. In order to remedy this shortcoming of word
frequency analysis, a second related method is applied.
Word embedding vectors are numerical encodings of words or symbols meant to capture
their semantic and syntactic nature. Statistical machine learning techniques are used to generate
these encodings by processing a tremendous amount of text. If words have similar meanings and
are used similarly in natural language, then their word embedding vectors (numerical encodings)
should be very similar. The word embedding vectors used in this work consist of 300 numerical
values per token (word or symbol) to represent its semantic and syntactic properties. These
encodings were generated using machine learning algorithms that analyzed approximately 600
billion words of text.7
With these word embedding vectors, we can estimate the aggregate semantic and
syntactic properties of a corpus of text by simply adding together the vectors of all the words in
the corpus. We can then apply the same cosine distance technique to determine the difference (in
terms of semantic and syntactic properties of words) between abstracts in a given directorate and
year in the same way we have with the word frequency average cosine distance technique. This
method puts forth a way of reinforcing the results of the word frequency method by providing an
additional measure of document similarity.
Results
Politicization of Awards
The following figures demonstrate a considerable rise in the frequency of award abstracts
that contain selected politicized terms over the past 30 years. Additionally, the amount of
funding granted to awards containing any of these terms is shown. To supplement these results,
Appendix I gives general statistics on award abstracts, Appendix II offers a more detailed
breakdown in the increase in incidence of individual terms in abstracts, and Appendix III
provides data on the frequency of awards specifically containing two of the terms “diversity,”
“equity” and “inclusion.”
Note that word counts is a somewhat crude way of measuring politicization. Bias,
particularly in the social sciences, is often subtle, and can apply to the kinds of questions that get
asked and the standard of evidence used to accept or reject a hypothesis. Thus, the fact that today
across all directorates approximately 30% of grants contain terms that are in most contexts
clearly associated with left-wing political causes likely underestimates the degree of
politicization of science funding (Figure 2).

6
Figure 1
Figure 2

7
Figure 3
Figure 4

8
Figure 5
Measures of Document Similarity
The following figures demonstrate the decline in lexical and semantic distinctiveness of
award abstracts over time. The techniques used to obtain these results are detailed more precisely
in Appendix IV, along with the method for sampling words to correct for a correlation between
average cosine distance and average abstract length.
When word frequency measures are used (Figure 6 and Figure 7), we see an increase in
similarity between documents that is particularly pronounced beginning in 2017. When I use
word embedding vectors (Figure 8 and Figure 9), which consider different words with similar
meanings, the effect is present throughout the entire period of the dataset.

9
Figure 6
Figure 7

10
Figure 8
Figure 9

11
This report presents direct evidence that scientific funding at the federal level has become
more politicized and less supportive of novel ideas since 1990. While the findings do not allow
us to extrapolate back to periods of faster economic and scientific progress before the last few
decades of the twentieth century, they certainly are suggestive and may be the latest iterations of
longer-term trends. Future research should use other methods and datasets to measure the
politicization of the scientific establishment and how supportive it has been of novel research
ideas and approaches across time in order to provide more insights into the causes of scientific
and technological stagnation.

12
Appendix I: General Statistics
This section graphically explores general properties of the dataset of NSF Awards from
1990 to 2020 analyzed in this work.
Figure 10

13
Figure 11
Figure 12

14
Figure 13
Figure 14

15
Appendix II: Individual Term Counts
This section presents the frequency of documents containing a number of terms
associated with political activism.
Figure 15. Plot of the percentage of documents containing any of the words “diversity,” “diversify,” or
“diversification” in each NSF directorate each year.

16
Figure 16. Plot of the percentage of documents containing any of the words “diversity,” “diversify,” or
“diversification” in all NSF directorates each year.
Figure 17. Plot of the percentage of documents containing any of the words “equity” or “equitable” in
each NSF directorate each year.

17
Figure 18. Plot of the percentage of documents containing any of the words “equity” or “equitable” in
all NSF directorates each year.
Figure 19. Plot of the percentage of documents containing any of the words “inclusion,” “inclusive,” or
“inclusivity” in each NSF directorate each year.

18
Figure 20. Plot of the percentage of documents containing any of the words “inclusion,” “inclusive,” or
“inclusivity” in all NSF directorates each year.
Figure 21. Plot of the percentage of documents containing any of the words “underrepresented” or
“underrepresentation” in each NSF directorate each year.

19
Figure 22. Plot of the percentage of documents containing any of the words “underrepresented” or
“underrepresentation” in all NSF directorates each year.
Figure 23. Plot of the percentage of documents containing any of the words “intersectional” or
“intersectionality” in each NSF directorate each year.

20
Figure 24. Plot of the percentage of documents containing any of the words “intersectional” or
“intersectionality” in all NSF directorates each year.
Figure 25. Plot of the percentage of documents containing any of the words “gender,” “genders,” or
“gendered” in each NSF directorate each year.
21
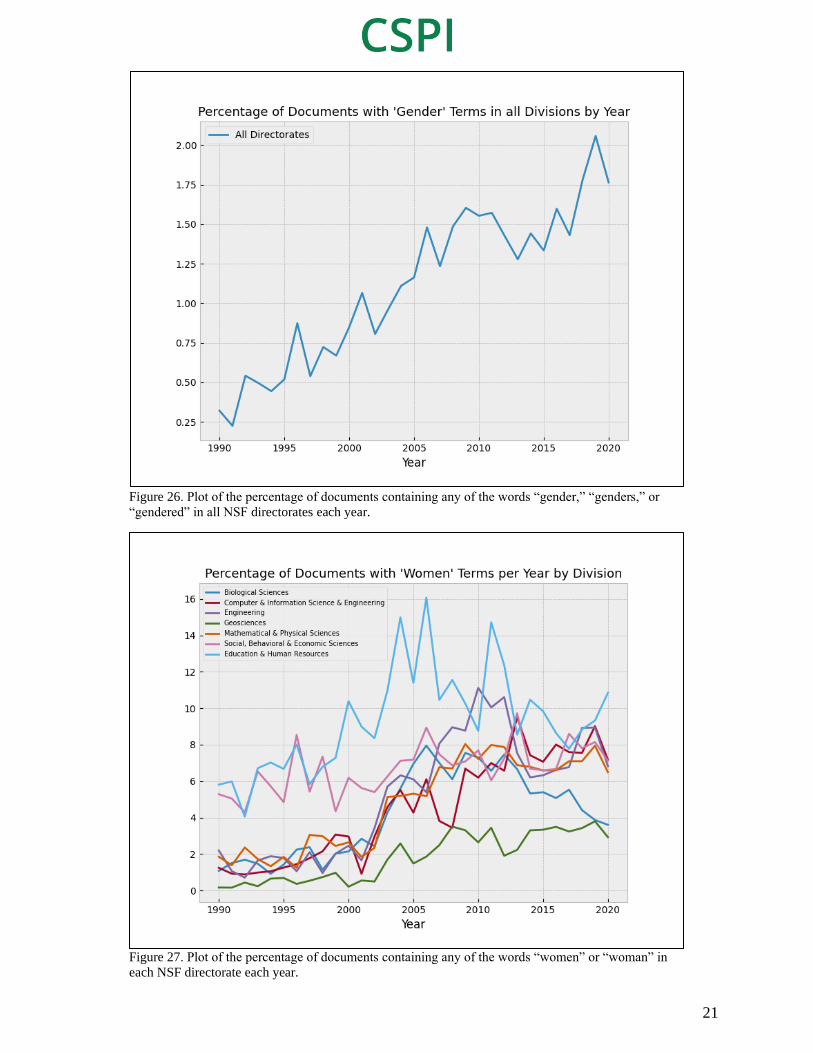
Figure 26. Plot of the percentage of documents containing any of the words “gender,” “genders,” or
“gendered” in all NSF directorates each year.
Figure 27. Plot of the percentage of documents containing any of the words “women” or “woman” in
each NSF directorate each year.
22
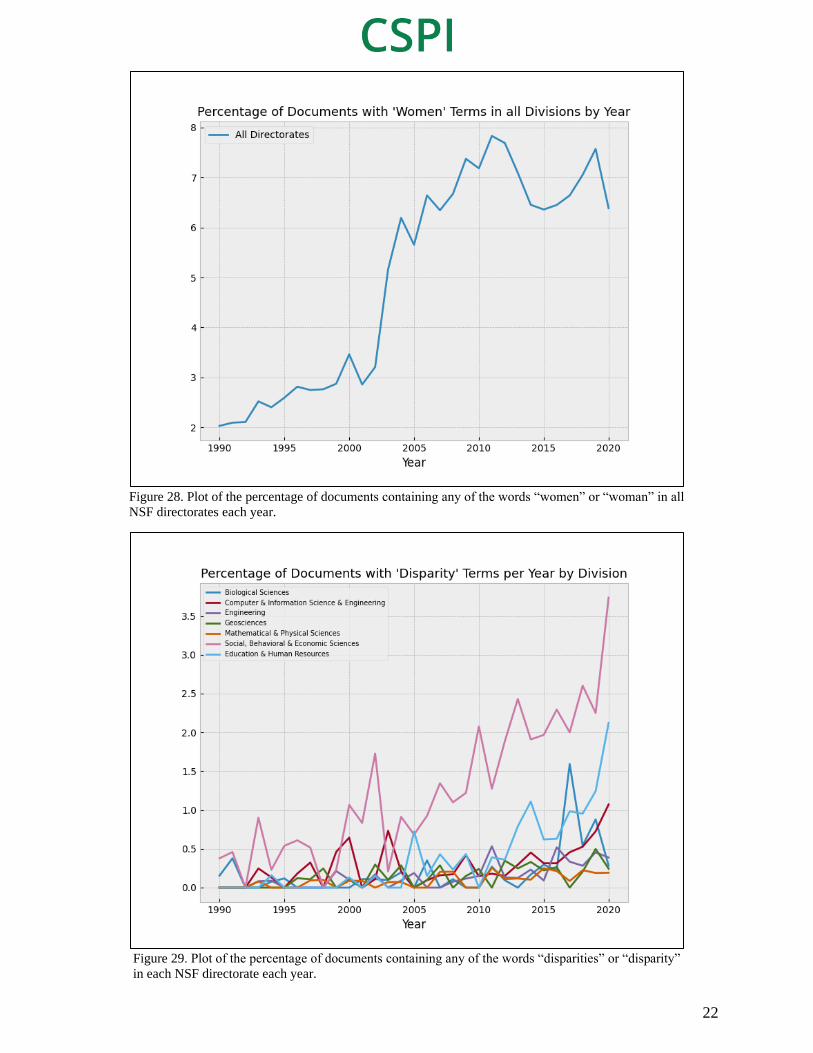
Figure 28. Plot of the percentage of documents containing any of the words “women” or “woman” in all
NSF directorates each year.
Figure 29. Plot of the percentage of documents containing any of the words “disparities” or “disparity”
in each NSF directorate each year.

23
Figure 30. Plot of the percentage of documents containing any of the words “disparities” or “disparity”
in all NSF directorates each year.
Figure 31. Plot of the percentage of documents containing any of the words “marginalize,”
“marginalization,” or “marginalized” in each NSF directorate each year.

24
Figure 32. Plot of the percentage of documents containing any of the words “marginalize,”
“marginalization,” or “marginalized” in all NSF directorates each year.
Figure 33

25
Figure 34
26
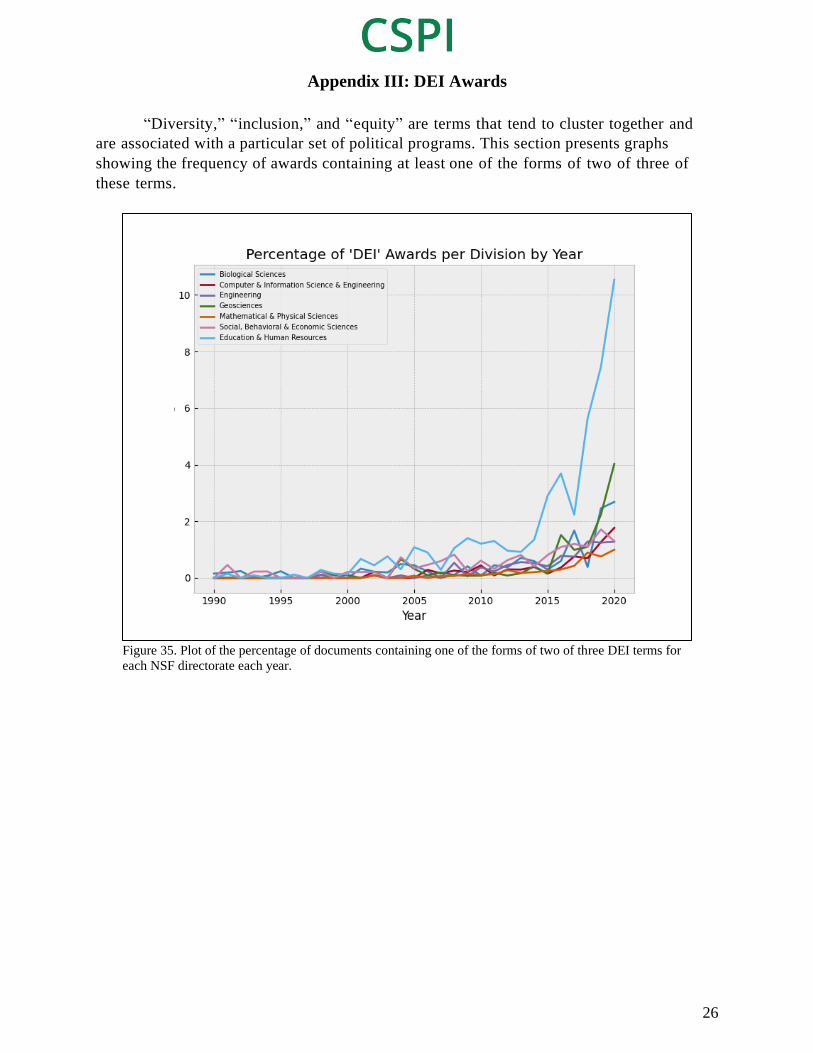
Appendix III: DEI Awards
“Diversity,” “inclusion,” and “equity” are terms that tend to cluster together and
are associated with a particular set of political programs. This section presents graphs
showing the frequency of awards containing at least one of the forms of two of three of
these terms.
Figure 35. Plot of the percentage of documents containing one of the forms of two of three DEI terms for
each NSF directorate each year.
27
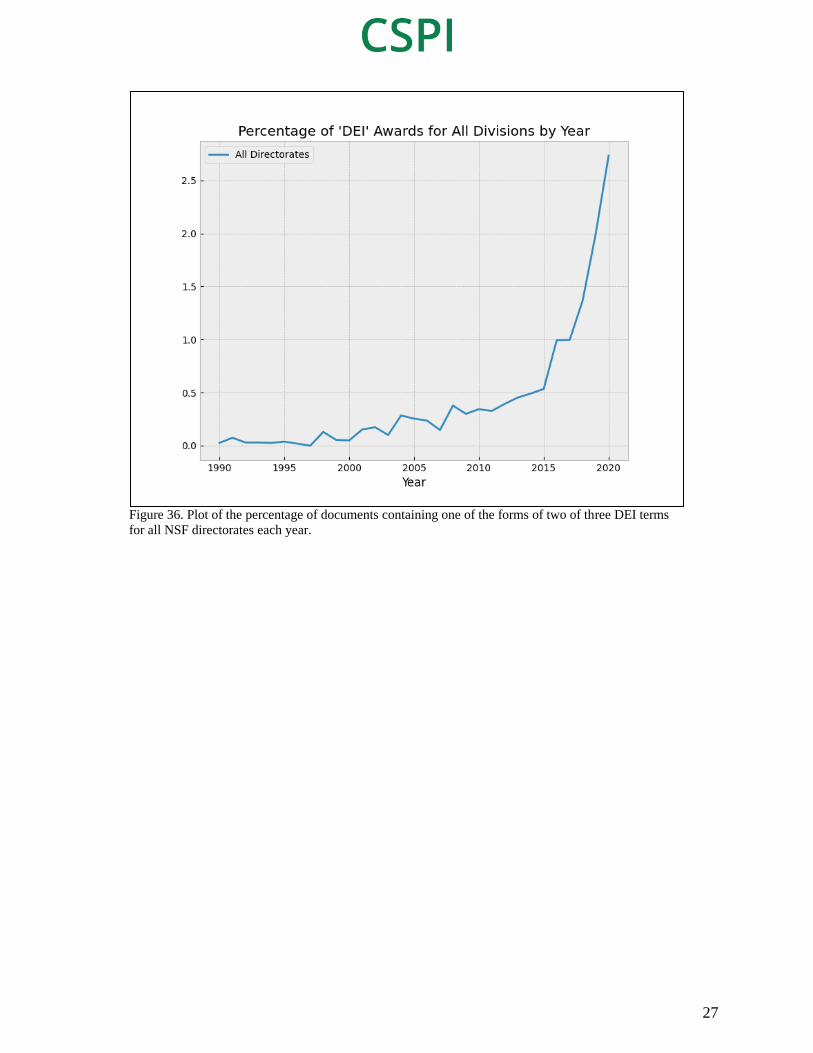
Figure 36. Plot of the percentage of documents containing one of the forms of two of three DEI terms
for all NSF directorates each year.

28
Figure 37. Plot of the amount of funding granted to awards containing one of the forms of two of three
DEI terms for each NSF directorate each year.

29
Figure 38. Plot of the amount of funding granted to awards containing one of the forms of two of three
DEI terms for all NSF directorates each year.

30
Appendix IV: Technical Details
Parsing: Individual award data is obtained in archives by year from the NSF website.8 The data
are available in XML format. The parser reads all of these and takes the award title, the award
ID, the abstract narration, the start date, the award amount, the NSF directorate, and the primary
investigator’s first name. The parser then repackages these data into large collections of award
data aggregated by year and directorate.
Stop Words: In natural language processing removing “stop words” is a commonly used
technique. Stop words are words that are very common in natural language but generally do not
carry much meaning. All the words from a commonly used stop word list are removed from
abstract titles and abstract narrations before any analysis is done.9
Stemming: Stemming is another technique used in natural language processing that reduces
words to their root form. This work uses NLTK (a publicly available natural language toolkit for
the Python programming language) to stem words in the abstract titles and narration text.
Stemming is used for word frequency distribution analysis but not for word embedding
analysis.10
Word Embeddings: Word embeddings are a way of representing individual words as vectors of
real numbers for use in text analysis in natural language processing applications. Word
embeddings are generally high dimensional vectors – the ones used in this work are 300
dimensions. If two words have a similar meaning, they will have vector encodings that are close
together (measured in Cartesian distance.) Word embeddings can be obtained through several
different machine learning techniques. A large amount of text will be used as input to a learning
algorithm that will find good high-dimensional numerical encodings for each word such that
words with similar meanings that are used similarly in writing will have similar encodings and
words that have different meanings and usages will have encodings that are more distant from
each other. This work uses a set of word embeddings that was trained on over 600 billion words
of English text scraped from the web.11
Word Frequency Cosine Difference Technique: To calculate the average cosine distance of
word frequency distributions of individual abstracts to the overall word frequency distribution of
all abstracts in the same year and directorate, the following method is used:
All stop words are removed from the title and abstract text of all awards. The remaining
words are stemmed using the NLTK stemmer. The total number of instances of individual word
stems in all awards in a given year and directorate are counted. Additionally, the total number of
tokens (word stems) that occur in all the award texts in a given year and directorate are counted.
The frequency of all individual stems is calculated by the ratio of occurrences of a given stem
over the total number of tokens in all awards in that year and directorate. This can be thought of
as a large vector of frequencies of words.
The word frequency distributions are similarly calculated for individual awards. The
frequency of an individual word stem is the number of times that stem appears in the award text
divided by the total number of words in the award text.

31
If A is the word frequency distribution for an award and D is the word frequency
distribution for the entire directorate the award belongs to, the cosine similarity is calculated by
the following formula:
𝑪𝒐𝒔𝒊𝒏𝒆 𝑺𝒊𝒎𝒊𝒍𝒂𝒓𝒊𝒕𝒚 = ∑𝐴𝑤 × 𝐷𝑤
‖𝐴‖‖𝐷‖𝑤 ∈ 𝐴
Because all the values of word frequencies are positive, Cosine Similarity can only have
a value between 0 and 1, and Cosine Distance is merely 1 - Cosine Similarity. The Average
Cosine Distance is then computed by taking the average of the computed Cosine Distance for
all articles in a given year and directorate.
Aggregate Word Embedding Cosine Distance Technique: The set of word embeddings
(Facebook Open Source, 2021) maps words to vectors of 300 real numbers. These vectors can be
summed up to represent the aggregate semantic content of all the text in an entire award or all of
the text in all awards in a given directorate in a given year.
The cosine distance of the aggregate word embedding vector of an individual award to
the aggregate word embedding vector of all the text in all awards in the directorate and year to
which it belongs can be calculated as follows:
𝑪𝒐𝒔𝒊𝒏𝒆 𝑫𝒊𝒔𝒕𝒂𝒏𝒄𝒆 = 1 − ∑𝐴𝑛 × 𝐷𝑛
‖𝐴‖‖𝐷‖
300
𝑛=0
The Average Cosine Distance of Aggregate Word Embeddings from the Mean is then
computed by taking the average of the computed Cosine Distance for all articles in a given year
and directorate.
There is a correlation coefficient of -0.49 between the average word length of award
abstracts and the average cosine distance of word frequency distributions within each directorate
and year. This effect occurs when all of the words in each individual award abstract are analyzed.
To correct for this effect (which made it seem like cosine distance was decreasing more
dramatically), instead of using all the words in the award text, 100 words were randomly
sampled from each award and these words were used in the processes described in this Appendix
to produce the document similarity findings shown in the Results section.

32
1 Feynman, Richard P. 1974. “Cargo Cult Science.” Engineering and Science (37): 10–13. 2 Collison, Patrick and Michael Nielsen. Nov. 16, 2018. “Science is Getting Less Bang for its
Buck.” The Atlantic. Available at
https://www.theatlantic.com/science/archive/2018/11/diminishing-returns-science/575665/. 3 Chu, Johan. S. G., and James Evans. 2021. “Slowed Canonical Progress in Large Fields of
Science.” Proceedings of the National Academy of Sciences (118). 4 “About the National Science Foundation.” 2021. National Science Foundation. Available at
https://www.nsf.gov/about/. 5 “NSF Awards Search: Download Awards by Year.” 2021. National Science Foundation.
Available at https://nsf.gov/awardsearch/download.jsp. 6 Code for this project available at https://github.com/Loafie/nsfAnalysis 7 “English Word Vectors.” 2021. Facebook Open Source. Available at
https://fasttext.cc/docs/en/english-vectors.html. 8 “NSF Awards Search: Download Awards by Year.” 2021. National Science Foundation. 9 “Stop Words List.” 2021. COUNTWORDSFREE. Available at
https://countwordsfree.com/stopwords. 10 “NLTK :: Natural Language Toolkit.” 2021. NLTK Project. Available at http://www.nltk.org/. 11 “CommonCrawl.” 2021. CommonCrawl Foundation. Available at https://commoncrawl.org/;
“English Word Vectors.” 2021. Facebook Open Source.