increasing security and reducing carbon emissions of the u ... · emissions of the u.s....
TRANSCRIPT

National Energy Technology Laboratory
Increasing Security and Reducing Carbon Emissions of the U.S. Transportation Sector: A Transformational Role for Coal with Biomass
This work was performed for the Department of Energy, National Energy Technology Laboratory and the
Department of Defense, Air Force
August 24, 2007
DOE/NETL-2007/1298

Increasing Security and Reducing Carbon
Emissions of the U.S. Transportation Sector: A Transformational Role for Coal with Biomass
DOE/NETL–2007/1298
August 24, 2007
NETL Contact:
Michael E. Reed
Senior Systems Analyst Office of Systems, Analyses, and Planning
Prepared by:
David Gray, Charles White, Glen Tomlinson (consultant) Noblis
Mark Ackiewicz
TMS
Ed Schmetz, John Winslow LTI
National Energy Technology Laboratory www.netl.doe.gov

i
Disclaimer
This report was prepared as an account of work sponsored by an agency of the United States
(U.S.) government. Neither the U.S., nor any agency thereof, nor any of their employees, nor
any of their contractors, subcontractors, or their employees makes any warranty, expressed or
implied, or assumes any legal liability or responsibility for the accuracy, completeness, or
usefulness of any information, apparatus, product, or process disclosed, or represents that its use
would not infringe privately owned rights. Reference herein to any specific commercial product,
process, or service by trade name, trademark, manufacturer, or otherwise does not necessarily
constitute or imply its endorsement, recommendation, or favoring by the U.S. government or any
agency thereof. The views and opinions of authors expressed herein do not necessarily state or
reflect those of the U.S. government or any agency thereof.

ii
Acknowledgements
This study was performed for DoD/AF and DOE under the technical direction of the National
Energy Technology Laboratory under contract NBCH-D-02-0039/0051. The authors are
especially grateful for the support and guidance provided by Greg Kawalkin, Michael Reed,
Julianne Klara, John Wimer, and Maria Vargas of the National Energy Technology Laboratory
as well as William Harrison of the Air Force.

iii
Table of Contents
1 Introduction........................................................................................................1
1.1 Background ...................................................................................................................... 1 1.2 Objectives and Scope ....................................................................................................... 2
2 Methodology.......................................................................................................3
2.1 Carbon Balances and Atmospheric CO2 Emissions......................................................... 3 2.2 Estimates for CO2 Emissions for FT Diesel..................................................................... 4 2.3 Naphtha Disposition......................................................................................................... 5 2.4 CO2 Apportionment from Refinery and CBTL Processing ............................................. 6 2.5 Baseline Emissions from Petroleum Refinery ................................................................. 6 2.6 Coal and Biomass to Liquids Process – Design Basis ..................................................... 7 2.7 Estimation of CO2 Emissions for FT Diesel from CBTL Process ................................... 9
3 CBTL Feedstock Assessment..........................................................................10
3.1 Illinois – Assessment of Regional Biomass Demand and Availability.......................... 10 3.2 Feedstock Production CO2 Emissions Results ............................................................... 14 3.3 Land Availability and CBTL Capacity .......................................................................... 15 3.4 Biomass Economics ....................................................................................................... 17
3.4.1 Biomass Feedstock Costs........................................................................................ 17 3.5 Feedstock Analyses ........................................................................................................ 19
4 Conceptual CBTL Plant Evaluation..............................................................21
4.1 CBTL Process Units....................................................................................................... 22 4.1.1 Feedstock Processing and Drying........................................................................... 22 4.1.2 The Air Separation Unit.......................................................................................... 24 4.1.3 Gasification ............................................................................................................. 24 4.1.4 Gas Cooling, Raw Water Gas Shift, Carbonyl Sulfide Hydrolysis, and Mercury
Removal.................................................................................................................. 24 4.1.5 Acid Gas Removal .................................................................................................. 24 4.1.6 Hydrogen Recovery ................................................................................................ 25 4.1.7 Sulfur Polishing ...................................................................................................... 25 4.1.8 Fischer-Tropsch Synthesis ...................................................................................... 25 4.1.9 FT Product Upgrading ............................................................................................ 26 4.1.10 Carbon Dioxide Removal in Recycle Loop ............................................................ 26 4.1.11 Power Generation Block ......................................................................................... 26 4.1.12 Balance of Plant (BOP) Units ................................................................................. 26
4.2 General Technical Plant Description of the Cases Analyzed......................................... 26 4.3 Case Details of Woody Biomass CBTL Plant Meeting 20 Percent Lower Carbon
Footprint Criteria than Petroleum Refining ................................................................... 28 4.4 Comparison with a Reference Petroleum Refinery........................................................ 34 4.5 Comparison of Petroleum Naphtha and FT Naphtha ..................................................... 41 4.6 Sensitivity to FT Product Specifications (Diesel versus Jet Fuel) ................................. 41

Table of Contents (Concluded)
Section Page
iv
4.7 Economic Analysis for Woody Biomass Cases ............................................................. 42 4.8 Case Details of Switchgrass and Corn Stover Biomass CBTL Plants Meeting 20 Percent
Lower Carbon Footprint Criteria than Petroleum Refining ........................................... 46 4.9 Economic Analysis for Switchgrass and Corn Stover Cases ......................................... 52
5 Roadmap for 100,000 BPD Industry .............................................................55
5.1 National Scope Resource Assessment............................................................................ 55 5.2 Analysis of Plant Capacity Feasibility ........................................................................... 55 5.3 Hypothetical Timelines for Target FT Diesel Production Level.................................... 57
6 Conclusions and Recommendations ..............................................................61
Acronyms and Abbreviations ...............................................................................64
Appendix A: GREET 1.7 Assumptions and Fuel Specifications.......................66
7 References.........................................................................................................68

v
List of Tables
Table Page
Table 1. CO2 Emissions Sources for Petroleum-Derived and Fischer-Tropsch Diesel ......... 3
Table 2. CO2 Emissions from Production, Transportation, and Refining Crude Oil Into Low-Sulfur Diesel Fuel and Naphtha and Transporting and Distributing the Fuel to the Station, from GREET 1.7 ............................................................................... 6
Table 3. Illinois Land Surface, Cropland, and Potential Energy Crop Area ........................ 11
Table 4. Potential Acreage of Land Available in Illinois for Energy Crop Production Based on Feedstock Farmgate (Production) Price ($2006)............................................... 11
Table 5. Estimated Collection Areas and Delivery Distances for Various Plant Sizes for Switchgrass, Poplar Trees, and Corn Stover .......................................................... 13
Table 6. Feedstock Production and Transport CO2 Emissions Estimates for Switchgrass, Poplar Trees, Corn Stover, and Coal ...................................................................... 16
Table 7. Range of Feedstock Production Costs from Various Studies ($2006)................... 17
Table 8. Illinois #6 Bituminous Coal Analysis .................................................................... 20
Table 9. Biomass Analysis, Dry Basis ................................................................................. 20
Table 10. Cases Analyzed in the Study .................................................................................. 21
Table 11. CBTL Plant Carbon Balance for 10 wt% Biomass ................................................ 31
Table 12. Input/Output Summary for CBTL Plant with Woody Biomass/Coal Feed (10 wt% Biomass) ................................................................................................................. 32
Table 13. Overall Carbon Credits and Debits Woody Biomass 10 wt% Case....................... 32
Table 14. Summary of CTL Only Plant ................................................................................. 37
Table 15. Input/Output Summary for CBTL Plant With Woody Biomass/Coal Feed (15 wt% Biomass) ................................................................................................................. 38
Table 16. Overall Carbon Credits and Debits 15 wt% (10 energy %) Woody Biomass Case.. ................................................................................................................................ 40
Table 17. Plant Equipment Costs for 15 wt% and 10 wt% Woody Biomass Cases ............. 42
Table 18. Additional Capital Costs for 15 wt% and 10 wt% Woody Biomass Cases (Millions Dec 2005 $) ............................................................................................................ 43
Table 19. Annual Operating Costs for 15% and 10% Woody Biomass Cases (Millions Dec 2005 $).................................................................................................................... 44
Table 20. Economic Summary for 15 wt% and 10 wt% Woody Biomass Cases .................. 45
Table 21. Economic Assumptions for DCF Analyses............................................................ 46

List of Tables (Concluded)
Table Page
vi
Table 22. Overall Carbon Credits and Debits 12 wt% Switchgrass Case ............................. 49
Table 23. Overall Carbon Credits and Debits for 12 wt% Corn Stover Case ....................... 51
Table 24. Plant Equipment Costs for 12% Switchgrass and 12% Corn Stover Cases .......... 52
Table 25. Additional Capital Costs for Switchgrass and Corn Stover Cases (MM Dec 2005 $) ................................................................................................................................ 53
Table 26. Annual Operating Costs for Switchgrass and Corn Stover Cases.......................... 54
Table 27. Economic Summary for 12% Switchgrass and 12% Corn Stover Cases ............... 54
Table 28. Hypothetical Timelines for Ramp-Up for CBTL Industry..................................... 58
vii
List of Figures
Figure Page
Figure 1. Transportation Cost for Corn Stover ...................................................................... 18
Figure 2. Delivered Cost of Biomass as a Function of CBTL Plant Biomass Demand ........ 19
Figure 3. Generic Block Flow Schematic of a CBTL Facility .............................................. 23
Figure 4. Block Flow Schematic of the 10 wt % (7 energy %) Woody Biomass Case......... 30
Figure 5. Block Flow Schematic of the Coal Only CTL Plant .............................................. 36
Figure 6. Block Flow Schematic of the 15 wt % (10 energy %) Woody Biomass Case....... 39
Figure 7. Schematic of Switchgrass and Corn Stover Prep System ...................................... 47
Figure 8. Block Flow Schematic of the 12 wt % (7 energy %) Switchgrass Case ................ 48
Figure 9. Block Flow Schematic of the 12 wt % (7 energy %) Corn Stover Case................ 50
Figure 10. Distribution of Cellulosic Feedstock from Crop Residues and Dedicated Energy Crops ...................................................................................................................... 56
Figure 11. Cumulative Diesel Production For Hypothetical CBTL Ramp-up Timelines ....... 59

viii
Executive Summary The Air Force has set a goal to supply fifty percent of its CONUS (lower 48 United States) fuel requirements from domestic synthetic sources by 2016. One option for doing this is the production of liquid fuels from coal via gasification and Fischer-Tropsch (FT) synthesis, a process known as coal-to-liquids (CTL). In addition, the Department of Defense (DoD) will require that providers of synthetic fuel practice carbon dioxide (CO2) emissions capture, sequestration or reuse/reform. Although CTL, when coupled with carbon capture and sequestration during fuel production, can limit CO2 emissions to a level approximately equivalent (+4% to -5%) to that of the existing petroleum-based fuel supply chain, the DoD wishes to explore options that will further improve its environmental performance by reducing the carbon footprint of the plant to be below that of a conventional petroleum refinery. The co-conversion of coal and biomass to liquid fuels (CBTL) has been recently proposed as a possible option to accomplish this. The option to use various process (including algae) for reuse/reform of CO2 emissions with CTL/CBTL process has been proposed, but is not in the scope of this report. This option will be considered in future research. CTL can produce high quality, zero sulfur, and paraffinic fuels from coal by gasifying the coal and then passing the clean coal-derived gas, essentially carbon monoxide and hydrogen, over Fischer-Tropsch catalysts. However, because of the energy used in the conversion process and the high carbon content of the coal feedstock, the carbon dioxide emissions, on a well-to-wheels basis, are 1.8 times more than petroleum. In order to obtain carbon dioxide emissions less than petroleum from a CTL process biomass can be co-processed with the coal. In this way carbon emissions can be significantly less than petroleum. The carbon contained in the biomass is not counted as a carbon input penalty because the biomass has recently removed this carbon from the atmosphere by photosynthesis. A portion of this biomass carbon is then subsequently captured and sequestered within the CBTL facility during the conversion process. In this way a double benefit accrues to the biomass carbon. This study had two primary objectives. The first was to develop a coal-biomass-to-liquids (CBTL) plant design that is potentially capable of co-gasifying mixtures of coal and biomass to produce a clean synthesis gas that can then be sent to Fischer-Tropsch units for synthesis of clean diesel, jet and naphtha liquid fuels. The goal of this CBTL plant was to determine the appropriate mixture of coal and biomass that would produce these fuels with a net carbon footprint twenty percent lower than would occur from the production of low sulfur diesel from an existing conventional petroleum refinery. The second objective of this study was to develop a CBTL pathway for diesel fuel production that has the potential for meeting the DoD goal of providing 100,000 BPD of synthetic fuel with the requirement that carbon dioxide emissions should be less than those from conventional petroleum. Three biomass types were selected for study: woody biomass, switchgrass, and corn stover. These biomass types are relatively abundant and their use will not directly affect food supplies.

ix
The comparison of CO2 emissions between petroleum-derived diesel and FT diesel was based on a limited well-to-wheel life cycle analysis. The analysis for each fuel included the major CO2 sources from the production and transportation of the feedstocks to the refinery/plant, the CO2 emitted during production, and the CO2 emissions resulting from transportation of the diesel product to the end user and the combustion of the product. Most of these CO2 emissions, apart from the combustion of the fuel itself, result from the energy used in each processing step. The major limit imposed on the life cycle analysis was that the CO2 emissions resulting from the construction of the CTL facility were not considered. To be conservative, no credit was taken for soil carbon storage by the biomass. Complete greenhouse gas (GHG) emissions were not considered. The study considered only emissions of carbon dioxide. Three types of biomass were examined in this study: switchgrass, poplar trees, and corn stover. In all cases, Illinois #6 bituminous coal was used. A conceptual process design was prepared for a CBTL facility capable of co-feeding coal and biomass into a gasifier to produce a syngas suitable for FT synthesis. The conceptual design estimated the performance, size, and cost of the major pieces of equipment and provided the basis for estimating the CO2 emissions associated with the synthesis of FT diesel. Most of the estimates for CO2 emissions associated with the production, transportation, and processing of feedstocks and end products were obtained from the Argonne National Laboratory (ANL) Greenhouse Gases, Regulated Emissions, and Energy Use in Transportation (GREET) Model version 1.7. GREET is a publicly available model that was sponsored by the DOE Office of Energy Efficiency and Renewable Energy and has been used to evaluate various fuel and vehicle systems for government and industry. It is a widely accepted model for estimating greenhouse gas emissions from fuels on a well-to-wheels basis. This study is a well-to-wheels carbon analysis and includes the carbon dioxide emitted in production of the feeds to the CBTL plant, the carbon dioxide emitted during conversion of the input coal and biomass to FT fuels, and the transportation and combustion of these fuels. Estimates for the CO2 emissions from a conventional refinery were obtained from multiple sources including GREET. A broad range of estimates were reported, depending on the assumed operating efficiency of the refinery. Conceptual CBTL designs were examined for all three types of biomass. In these conceptual designs coal and biomass are gasified in entrained flow gasifiers and the raw synthesis gas is cleaned of impurities. The clean synthesis gas is then sent to slurry phase FT reactors where the hydrocarbon fuels are produced. Slurry phase reactor technology is under development by several companies and Sasol is utilizing these reactors at their Oryx Gas-to-Liquids (GTL) plant in Qatar. Slurry reactors have excellent heat transfer characteristics and allow high conversions of synthesis gas per pass. However, there has not been much commercial experience with these reactors and there are issues relating to hydrodynamics and separation of the wax produced in the FT process from the fine catalyst. Wax is produced to maximize the distillate yield. The wax is hydrocracked to produce additional distillate product.

x
For each conceptual plant, estimates were made for the amount of biomass that would have to be co-fed with coal to attain the target 20% reduction in CO2 emissions. In these plant configurations about 88% of the carbon dioxide emissions resulting from the conversion of the coal to FT fuels are captured and compressed to 2,200 psi. After compression it is assumed that the carbon dioxide is piped from the CBTL plant boundary. In this analysis, except for one sensitivity case, no additional cost for sequestering or storing the carbon dioxide is included in the economics. In the sensitivity case a cost of $4.60 per metric tonne was added for carbon dioxide transportation, sequestering, and monitoring (TS&M). This increased the required selling price of the FT fuels by about 1.8 percent compared to cases with no costs for TS&M. However, if the carbon dioxide could be sold for enhanced oil recovery (EOR) operations or other reuse it would have a net positive value and be a credit in the economic analysis. The results of the study indicated that FT diesel can be produced at the target CO2 reduction level by co-gasifying coal with a relatively modest amount of biomass. For woody biomass, the CO2 reduction target could be attained using 10-15% woody biomass by weight (7-10% by energy) on an as-received basis. For switchgrass, the CO2 reduction target could be attained using 12-18% biomass by weight (7-10% by energy) and for corn stover the needed amount is 12-18% biomass by weight (7-11% by energy). As part of this study, a scoping level economic analysis was performed for the coal-only plant and the CBTL plants. Based on the economic parameters used in this study, the required selling price (RSP) of the diesel product was estimated to be about $71/barrel for a coal-only (CTL) plant. On a crude oil equivalent basis this would be about $55/bbl. For the woody biomass CBTL plants the RSP of the fuel is estimated to be about $76/barrel. On a crude oil equivalent basis, this is equivalent to $58-59/bbl or about seven percent higher than the coal-only case. For the corn stover and switchgrass plants the RSP of the fuel was estimated to be about $75/bbl. On a crude oil equivalent basis this is about $58/bbl. Some sources, including GREET, indicate that dedicated energy crops including short rotation woody biomass and switchgrass could further reduce the CO2 footprint of a CBTL plant. If the full soil carbon credit can be realized, it would be possible to meet the CO2 reduction goal with as little as 5-10% by weight woody biomass. However, whether or not soil carbon sequestration should be included and the amount of this credit is a controversial issue at present. To be conservative it was decided not to include this credit in this analysis. Because the percentage of biomass required is relatively low and within the range of the limited demonstration test data available for coal:biomass co-feeding to pressurized gasifiers, it is concluded that the proposed CBTL process is potentially feasible. A limited resource assessment was performed to determine if sufficient biomass can be harvested and transported to a CBTL facility of sufficient size to be economically practical. It was determined that the biomass availability would not be a major limiting factor for CBTL plants in the 7,500 BPD diesel capacity range. This size CBTL facility would require a sustainable annual supply of biomass of about 1,000 TPD. For switchgrass and poplar with dry yields per acre of

xi
about 5-6 tons, the total land area required would be about 1,440 square miles (a radius of about 22 miles). This assumes that only 8 percent of the land is available for production of the energy crops. For corn stover with a lower crop yield of about two dry tons per acre (half of the crop is left on the land for soil conditioning), the area required for sustained operations to produce 1000 TPD would be about 920 square miles (radius of about 17 miles) because the land available for production is assumed to be as high as 31 percent. While this study concludes that it is practical to attain the desired CO2 emissions reduction target it must be cautioned that, because the amount of actual field data available on gasification of biomass in pressurized entrained flow gasifiers is so limited, considerable RD&D will be needed to determine the pretreatment necessary and the optimum type of feed system needed to enable reliable feeding of these biomass types to these high pressure gasification systems. Biomass gasification using high temperature and pressure entrained flow gasifiers would be preferable to eliminate tar and methane formation from the biomass. Also the CBTL plants would be simpler and less costly if the same gasifier could be used to process both the coal and the biomass. Separate feed systems for coal and biomass may also be preferable so that, if there are problems with the biomass feed system, the gasifier can be kept in operation using coal. Another potential option is separate gasification of biomass. This option is out of the scope of this report but will be considered in future work. All three biomass types examined in this study showed nearly equivalent performance in the CBTL process. Regional land availability will be the most important determinant of which biomass type to use for a specific site. The reference plant studied was a 7,500 BPD diesel plant located in southern Illinois. This plant size was chosen based on a preliminary and highly approximate estimate for the amount of biomass that may be required. The report does not suggest that 7,500 BPD is either the maximum or optimum size for a CBTL plant. It was shown that larger plants of at least 30,000 BPD are feasible based on biomass resource availability. It is left as a recommendation for further work to perform a more detailed biomass resource and infrastructure assessment which would be needed to determine the maximum CBTL plant size that is technically feasible and to determine the optimum plant size for which economies of larger scale balance the increased cost of collecting larger quantities of biomass. Multiple scenarios were presented with timelines for the build up of a CBTL industry. In the most conservative scenario, the production goal of 100,000 BPD is not attained until 2026. Incentives could stimulate the development of the industry. An aggressive hypothetical production ramp-up was prepared for the construction of seven CBTL facilities that would meet the DoD goal of obtaining 100,000 BPD of synthetic fuel by 2016. The ramp-up assumes that the first two plants will be small 7,500 BPD facilities of the same design as the reference plant. These first plants will use corn stover since this type of biomass is currently available. It is assumed that over time, more plants will be constructed simultaneously; future plants will be larger in capacity (up to 22,500 BPD) and shake down periods for start-up will grow shorter. These later plants would use mixtures of switchgrass, corn stover, and woody biomass.

xii
Although specific plant locations were not proposed, a national biomass resource assessment has forecast that there will be abundant quantities of suitable biomass available in multiple geographic regions in the U.S. by 2016 and that the hypothetical ramp-up is feasible with respect to resource availability. Because biomass availability is often seasonal for some crops it is recommended that any CBTL plant have processing equipment on site that is suitable for several biomass types. Although this will increase capital cost, in that way when corn stover is available, after the corn harvest, the CBTL facility can utilize this crop predominately. When the switchgrass is available after harvesting, the facility could use this feed. The woody biomass should be available most of the time depending on the cutting cycle. The coal would act as the flywheel to keep the plant operating at a fairly constant output. The concept of using both coal and biomass together to produce high quality FT fuels via gasification should be advantageous to both coal and biomass to energy technologies. Co-processing biomass with coal can significantly reduce the carbon footprint of a CTL facility and the gasification route allows non-food product biomass-like cellulose and lignin to be used for energy production.

1
1 Introduction
1.1 Background
The Air Force is the largest energy consumer in the federal government and presently uses about 200,000 bbl/day of fuel1 with the majority of this used by tactical aircraft. Most of this fuel is derived from petroleum sources and, as with other segments of the US, the majority of this petroleum is imported. In recognition of the vulnerabilities associated with reliance on imported petroleum, the Office of the Secretary of Defense set forth the Assured Fuels Initiative to catalyze industry to produce fuels for the military from domestic energy sources without placing an undue burden on domestic oil supplies. The Air Force has also established goals for reducing the environmental impact of its energy use. Specifically, the Air Force has set a goal to use synthetic fuels that generate significantly lower levels of CO2 than diesel derived from petroleum. As recently expressed by the AF Secretary, the Air Force has set a goal to supply fifty percent of its CONUS fuel requirements from domestic synthetic sources by 20162. Many alternative fuel options are being pursued including biodiesel (B20), E85, and synthetic Fischer-Tropsch (FT) diesel derived from natural gas, coal, or biomass. FT diesel production from synthesis gas (mixture of carbon monoxide and hydrogen) is a mature technology that has been used at commercial scale for over sixty years. An advantage of FT diesel synthesis is that the synthesis gas feedstock can be obtained from many different sources that are domestically abundant, including coal and biomass.
Coal has advantages of great abundance, relatively low cost and high energy density. Furthermore, the production of synthesis gas from coal is a proven technology at commercial scale. Unfortunately, coal has a low hydrogen to carbon ratio and the production of FT diesel from coal produces approximately twice as much CO2 as does the refining of petroleum into diesel. This disadvantage can be managed by the capture and sequestration or reuse of the CO2 produced with FT diesel. When this is done, the CO2 produced with FT diesel is approximately the same as that from petroleum-refined diesel. If biomass is used as the source of the synthesis gas, the resulting FT diesel will have essentially no net impact on atmospheric CO2 levels because the carbon in the biomass that goes into the synthesis gas is generated from atmospheric CO2 by photosynthesis. Unfortunately, biomass has numerous disadvantages as a feedstock to produce synthesis gas including a low energy density and high moisture content leading to high production and processing costs. It is also difficult to reliably feed into a pressurized gasification reactor and there have been very few demonstrations of this technology at commercial scale.
An approach that may succeed in meeting all of the Air Fore goals is to use FT diesel derived from a combination of coal and biomass. The biomass component would act to reduce the net CO2 emissions associated with the production of FT diesel and if small enough amounts of biomass were required, it may work reliably with existing coal gasification equipment.
Because of the potential of this approach the Air Force (AF) and the National Energy Technology Laboratory (NETL) commissioned Noblis to undertake this analysis.

2
1.2 Objectives and Scope
The first objective of this study is to develop a coal-biomass-to-liquids (CBTL) plant design that is potentially capable of co-gasifying mixtures of coal and biomass to produce a clean synthesis gas that can then be sent to Fischer-Tropsch units for synthesis of clean diesel, jet and naphtha liquid fuels. The goal of this CBTL plant is to produce these fuels with a net carbon footprint 20 percent lower than would occur from the production of low sulfur diesel from an existing conventional petroleum refinery. This goal will be achieved by varying the quantity of biomass and coal feed to the CBTL plant so that the resultant mix will attain this 20 percent goal. The study examines three types of biomass: woody biomass, switchgrass, and corn stover. These biomass types were selected because of their relative abundance and because their use will not directly affect food supplies.
The second objective of this study is to develop a CBTL pathway for diesel fuel production that appears to have the potential for meeting the DoD goal of providing approximately 100,000 BPD of synthetic CBTL fuel by 2016 with the required carbon dioxide emissions reductions. The third objective is to formulate conclusions, identify assumptions and recommend steps forward.
This analysis is considered to be a first order scoping study and the level of detail given is considered appropriate for such a study.

3
2 Methodology
2.1 Carbon Balances and Atmospheric CO2 Emissions
The comparison of CO2 emissions between petroleum-derived diesel and Fischer-Tropsch (FT) diesel was based on a limited life cycle analysis. The analysis for each fuel included the major CO2 sources from the production and transportation of the feedstocks to the refinery/plant, the CO2 emitted during production, and the CO2 emissions resulting from transportation of the diesel product to the end user and the combustion of the fuels. This is, then, a limited well-to-wheels life cycle analysis (LCA) for carbon. Most of these CO2 emissions result from the energy used in each processing step. The major limit imposed on the life cycle analysis was that the CO2 emissions resulting from the construction of the CTL facility were not considered.
Table 1 following summarizes the major CO2 sources for the refinery-derived and FT synthesis routes for the production of diesel.
Table 1. CO2 Emissions Sources for Petroleum-Derived and Fischer-Tropsch Diesel
CO2 Generation Path Petroleum-derived low sulfur diesel
FT diesel
Crude oil: exploration, drilling, pumping, transportation to refinery
Coal: mining, collection, transportation to plant
Well-to-plant
Biomass: cultivation, growth, harvesting, initial preprocessing, transportation to plant
Plant operations Distillation, reforming, cracking, coking, hydrogen production
Final feedstock preprocessing, gasification, clean-up, FT synthesis, upgrading, CO2 compression and delivery
Plant-to-pump Transportation and piping to Air Force refueling facility
Transportation and piping to Air Force refueling facility
For the refinery-derived diesel, the CO2 emissions were assumed to be the emissions associated with the exploration, drilling, pumping, and delivery of crude oil to the refinery, plus the emissions associated with refinery operations required for the production of low-sulfur diesel, plus the emissions arising from the piping and transportation of the diesel product to an Air Force refueling depot and the combustion of the fuel.

4
For the FT diesel, the CO2 emissions were assumed to be those resulting from the mining and delivery of the coal, the cultivation, growth, harvesting, and delivery of the biomass to the plant, the emissions associated with the production of diesel from the CBTL facility including preprocessing of the biomass feedstock, plus the emissions arising from the piping and transportation of the diesel product to an Air Force refueling depot and the combustion of the fuel.
The reference point for the CO2 balance was the CO2 level in the atmosphere. Any processing step that increases atmospheric CO2 levels has a positive emissions value and any step that decreases atmospheric CO2 levels has a negative emissions value.
The CO2 emissions associated with the actual growth of the biomass are negative. It is assumed that all of the carbon in the gasified biomass is obtained via photosynthesis from atmospheric CO2. The CO2 uptake by the biomass is substantially larger than that contained in the harvested and gasified portion. Under certain circumstances, much of this additional carbon can lead to long term carbon storage in the soil. However, based on the assumptions given in the report on “Soil Carbon Changes for Bioenergy Crops”3 we have taken their conservative approach to this issue. Because of uncertainties and the lack of data, no net carbon sequestration benefit was assumed for land use changes resulting from soil carbon by cultivation of bioenergy crops. This approach was taken because it is unclear if there would be any net change in soil carbon storage compared to the existing land use soil carbon storage over the lifetime of the plant.
The comparison between the two diesel products was done on an equivalent energy replacement basis, rather than on a direct barrel per barrel basis. Because FT diesel has a lower density than petroleum-derived diesel, a greater amount of FT diesel is needed to replace a barrel of petroleum-derived diesel and this difference was accounted for in the analysis.
The CBTL plants considered in this study capture CO2 and are sequestration or reuse/reform ready. The plant designs, mass balances, and capital and operating costs all reflect a process that captures approximately 88% of the carbon in the feed and compresses it to 2,200 psia, a pressure suitable for sequestration in saline aquifers or for use in enhanced oil recovery. Because of the uncertainty of the value of the carbon dioxide, no costs associated with its disposal are included in this analysis. CTL processes are well-suited for carbon capture and storage because the removal of CO2 from the feed to the FT reactor is required for optimal operation of the FT reactors. The only additional processing requirements associated with sequestration are the costs and energy required to compress the CO2 and transport it to a sequestration site. In this study, the CO2 was compressed but not sequestered. However, the additional CO2 emissions associated with sequestration after the CO2 has been compressed are small. The petroleum refinery was assumed to operate without CO2 capture and storage.
2.2 Estimates for CO2 Emissions for FT Diesel
Most of the well-to-plant CO2 emissions estimates for the CBTL feedstocks were obtained using the Argonne National Laboratory (ANL) Greenhouse Gases, Regulated Emissions, and Energy Use in Transportation (GREET) Model version 1.7. GREET is a publicly available model that was sponsored by the DOE Office of Energy Efficiency and Renewable Energy and has been

5
used to evaluate various fuel and vehicle systems for government and industry, including General Motors. It includes over 100 fuel production pathways and over seventy vehicle/fuel systems, allowing users to evaluate various system pathways on a “well-to-wheels” basis.
GREET calculates the consumption of total energy, fossil energy, and petroleum, coal, and natural gas; emissions of carbon dioxide and other greenhouse gases; and emissions of criteria pollutants. It calculates these by using an iterative process that calculates the energy and emissions to produce the energy (and so forth for 100 steps) used to recover the feedstock, transport it, convert it into product, and finally consume the product in a vehicle.
GREET 1.7 does not contain a CBTL pathway for FT diesel and hence, estimates for the CO2 emissions from the CBTL plant operations were obtained by developing a conceptual level design of the CBTL facility and performing steady-state mass and energy balances around each of the processing units. The conceptual level process design does not attempt to perform a system optimization nor is there a rigorous heat exchanger design for the system heat integration. Hence there is some uncertainty in the estimates for process efficiency and CO2 emissions. With a more in depth study or more engineering data, this uncertainty could be reduced. However, the level of accuracy of the process model is well within the accuracy of the other life cycle CO2 emissions and is considered adequate for the objectives of this feasibility study.
Estimates for the plant-to-pump CO2 emissions were based on assumed distances for pipeline and tanker truck transport of the product diesel to an Air Force refueling station. These distances were estimated after a site was selected for the initial CBTL facility.
2.3 Naphtha Disposition Since the purpose of the study was to examine the feasibility of reducing CO2 emissions using FT diesel derived from a mixture of coal and biomass, two simplifications were introduced regarding the byproduct naphtha. First, the naphtha product from the CBTL plants is assumed to be used as a feedstock for ethylene production in a petroleum refinery and is assumed to have no significant impact on net refinery CO2 emissions compared to using petroleum-derived naphtha for the same application. Secondly, it is assumed that the secondary impacts of fuel substitution on the petroleum refinery industry product yields are negligible. Both of these assumptions are reasonable and valid for a feasibility study for a CBTL production capacity at the level considered in this study. Compared to the total amount of naphtha processed at petroleum refineries nation-wide, the amount generated by the CBTL plant is small and would not be expected to have significant impacts on either the overall refinery operations or CO2 emissions. U.S. refineries typically do not produce naphtha but convert it to gasoline. Some naphtha is fed to crackers to produce ethylene but the major feedstock is ethane or natural gas liquids (NGL). The U.S. produced about 29 million tons of ethylene in 2006. To manufacture a part of this ethylene the U.S. used about 500,000 BPD of naphtha of which about 55% was imported as feed to ethylene crackers. One 10,000 BPD CBTL plant produces about 3,500 BPD of naphtha therefore 10 of these plants would produce only 30,000 BPD of naphtha. This is only 6 % of the naphtha used for ethylene and would reduce imported naphtha.

6
2.4 CO2 Apportionment from Refinery and CBTL Processing
In this study, the comparison of CO2 between CBTL and refinery derived diesel focused on the diesel product and the portion of CO2 attributable to that product. In the case of the refinery, GREET estimates the energy required for the refinery processing steps leading to diesel production and assigns the diesel portion based on the weight fraction of diesel in the final product mix. In the case of CBTL, the CO2 emissions from the entire plant processes were estimated and those emissions were distributed between the diesel and naphtha products on a weight basis.
2.5 Baseline Emissions from Petroleum Refinery
The baseline from which the FT diesel was compared was the life cycle CO2 emissions resulting from the production of an equivalent amount of low sulfur diesel from a conventional petroleum refinery. Table 2 following gives the well-to-pump CO2 emissions estimates from a typical petroleum refinery for the production of low sulfur diesel. This data was obtained from GREET 1.7. The model assumptions used to generate this data are listed in Appendix A.
Table 2. CO2 Emissions from Production, Transportation, and Refining Crude Oil Into Low-Sulfur Diesel Fuel and Naphtha and Transporting and Distributing
the Fuel to the Station, from GREET 1.7
Crude Oil Production/
Transportation* Refining
Refining – Non-Combustion Emissions
Transportation and
Distribution Total
CO2 Emissions (lbs CO2/barrel diesel)
44.5 131.8 13.9 1.54 191.7
CO2 Emissions (lbs CO2/barrel naphtha)
49.0 78.8 8.7 1.54 138.0
*Includes multiple delivery methods and distances, such as ocean tankers, pipelines, and barges.
This data assumes that the refinery efficiency is approximately 85%. Since operations data from refineries is considered proprietary, this is an assumed value. Other sources have suggested that the operations efficiency for a typical refinery is higher, perhaps as high as 90%4. Because of the large range of estimates in the literature and the lack of definitive data from the refinery industry, a range was used for the estimate of CO2 emissions in this study. A recent publication from EPA (2007)5 reports that greenhouse gas emissions from a CTL process with sequestration are approximately 3% higher than from a conventional refinery. Using that as a reference point, a more optimistic estimate for total CO2 emissions from a petroleum refinery would be about 176 lbs of CO2/bbl low sulfur diesel. It should be noted that there is disagreement in the literature

7
concerning the exact amount of CO2 emissions that are attributed to diesel fuel production using existing commercial processes. The nature of background data, calculation methods, and allocation assumptions all contribute to different, but credible, outcomes. An independent NETL study places the CTL with sequestration process at -5% relative to conventional petroleum. However, the EPA ratio was used to keep the CBTL conceptual design on a conservative basis.
2.6 Coal and Biomass to Liquids Process – Design Basis
This section presents the basis for the conceptual design of the CBTL processes. The technical details and parameters for specific plant configurations are presented in Section 4 following. While many studies have been performed to evaluate the techno-economic performance of CTL processes, there are few published studies on the performance of such processes with co-gasification of coal and biomass. The major design issues for the CBTL process were sizing and site selection for the plants, selection of gasifier technology, design of feed systems, design of biomass preprocessing systems, choice between biomass preprocessing at the plant or at the harvest site and selection of FT reactor. Many of these design issues depend on the amount of biomass required which was an unknown that the study was to determine. Hence, a pre-screening level analysis was preformed to roughly estimate the amount of biomass required to meet the CO2 emissions target. Design basis decisions based on the estimated amount of biomass required were checked when the final value for the amount of biomass required was determined.
Since the carbon in the biomass does not contribute to atmospheric CO2 emissions and since almost 90% of the CO2 is captured in the standard CTL process configuration, it was estimated that roughly 10-18% biomass by weight would be required to meet the CO2 reduction target, given the range of CO2 emissions from a petroleum refinery.
Based on this preliminary estimate, it appeared likely that the amount of biomass needed would be relatively small compared to the coal required and that the gasification system design would be based primarily on the coal properties. Nevertheless, a literature review was performed on biomass gasifiers to identify design issues specific to biomass that may need to be addressed.
Although considerable research has been performed on biomass gasification, there has yet to be a large, commercial scale biomass gasification plant built. Most biomass gasification systems described in the literature are small scale, air-blown, low temperature, atmospheric pressure systems. Such gasifiers were deemed inappropriate for the application under study. For economic considerations, the gasification system must operate at elevated pressure. Unfortunately, there is very little data in the literature for high pressure biomass gasifiers. Because of the fibrous nature of most biomass sources, the material is very difficult to feed into a high pressure gasifier. Typical problems include clumping and bridging. However, there have been reports of successful pressurized biomass:coal co-feeding operations for mixtures containing up to 30% biomass by weight.
At the NUON plant in the Netherlands they successfully fed a mixture of 30 percent by weight of demolition wood and 70 percent coal to the Shell high pressure, entrained gasifier. Even though we are not sure of the size that was used, possibly it was sawdust, based on this experience we

8
have assumed that it is possible to feed small wood particles of 1 mm size to a pressurized entrained gasifier. This assumption is supported by ECN in their report on entrained flow gasification of biomass6.
Since the order of magnitude estimate for the amount of biomass required for a 20% reduction in CO2 emissions was within the range of demonstrated coal:biomass feed systems for pressurized gasifiers, it was assumed that existing technology was adequate for the proposed process. It was assumed that biomass dried to 10% moisture and reduced in size to approximately 1 mm diameter, can be reliably fed to pressurized gasifiers either co-mixed with the crushed coal or fed through a dedicated feed system. For the purposes of the plant cost estimate, a separate feed system was assumed. However, given the well documented challenges of feeding biomass to high pressure systems, further R&D will be necessary to be certain that this can be successfully achieved.
Because of the high methane content in syngas produced from low temperature gasifiers, it was decided to base the process design on a high-temperature dry feed, entrained flow, oxygen-blown gasifier. This system will also eliminate the tars associated with the low temperature gasification of biomass. A quench design was selected for the gasifier to help reduce capital costs. For the FT reactor, a low temperature slurry phase FT reactor with iron catalyst was selected. Low temperature FT slurry phase reactors were used in the study to produce a high net product of distillate rather than naphtha. Also slurry reactors give a higher conversion per pass because of the superior heat transfer characteristics. Iron is used as catalyst because it is cheaper than cobalt and readily obtained in the U.S.
Sizing and plant site selection were based on the order of magnitude estimate for biomass requirements, yield data for the three types of biomass, and a preliminary resource assessment for the biomass sources. Because of its lower density, biomass transportation costs were expected to be greater than those for coal and hence it was assumed that the optimal plant site would be in close proximity to the biomass source. There are considerations for the location of the facility including the expected volume of coal needed for large scale facilities. This topic will be the subject of future research. For this study, the site was assumed to be rural and based on the order of magnitude biomass feed requirement, it was decided to use a nominal capacity of 7,500 bpd diesel for the index CBTL plant. Because of its abundant coal resources, large agricultural industry, and proximity to potential CO2 sinks, the index plant was sited in southern Illinois also close to operating coal mines.
The choice of 7,500 bpd diesel as the reference plant size is not intended to imply that this is either the maximum or optimum size for a CBTL plant. It is likely that the maximum size for a CBTL plant will be limited by the maximum amount of biomass that can be economically collected and determining this will require an extensive and detailed biomass resource assessment which was beyond the scope of the present study. It is left as a recommendation for further work to determine the maximum CBTL plant size that is technically feasible and to determine the optimum plant size for which economies of larger scale balance the increased cost of collecting larger quantities of biomass.

9
2.7 Estimation of CO2 Emissions for FT Diesel from CBTL Process
The life cycle CO2 emissions for FT diesel were estimated as the sum of the CO2 emissions from the CBTL process, the life cycle CO2 emissions from the CBTL feedstocks, the total CO2 emissions attributed to the transportation and delivery of the FT diesel product, and the combustion of the fuel. The life cycle CO2 emissions from the CBTL feedstocks depend on the amounts required, the amount and type of preparation required, and the transportation distance to the plant. This data in turn depends on the nature of the biomass, its yields, and the frequency with which it can be harvested.
Section 3 following describes a resource assessment for the biomass (switch grass, corn stover, and short rotation woody biomass) feedstocks under consideration as well as coal. The assessment addresses resource requirements and availability, production cost, and life cycle CO2 emissions associated with production and delivery to the plant gate. This data was also used to determine the optimum biomass preprocessing steps.
The CO2 emissions associated with the mining, cleaning, and transport of the coal was estimated from GREET. For the most part, the default assumptions in GREET were used. The site specific assumptions used for the proposed CBTL plant are listed in Appendix A. The coal is assumed to be obtained from an underground mine located within 65 miles of the CBTL plant.
To estimate the CO2 emissions from the CBTL process, a conceptual level CBTL process design was developed using the design basis described in the previous section. Mass and energy balances were closed around each major process section using spreadsheet models validated against developer data. A detailed description of the CBTL process is provided in section 4.
The total CO2 emissions from the transportation and delivery of the FT diesel product were estimated from GREET using a scenario in which the product is assumed to be piped 300 miles and delivered by tanker truck for another 60 miles. This resulted in CO2 emissions for transportation/delivery of 1.54 lbs CO2/bbl FT diesel.

10
3 CBTL Feedstock Assessment
Substituting biomass for coal in a co-gasification, FT diesel production facility has both positive and negative impacts on the net CO2 emissions. As noted above, the CO2 from the gasification or combustion of carbon in the biomass does not introduce new CO2 into the atmosphere. However, biomass is a much poorer quality feedstock for FT diesel synthesis. Compared to coal, it has a lower heating value, a lower carbon content, and a higher moisture content. Furthermore, biomass has a much lower bulk density at the point of harvest. All of these factors act to decrease system performance and/or increase parasitic energy requirements. This leads to increased CO2 emissions and reduced process efficiency. At sufficiently high biomass moisture contents, sufficiently low net crop yields, and sufficiently large plant sizes, the net impact of using biomass could have a deleterious impact on overall atmospheric CO2 levels.
The key issues to be addressed in the biomass resource assessment are the availability of suitable lands for biomass cultivation, the net crop yields, and the energy costs and CO2 emissions associated with the cultivation, harvesting, transportation, and preprocessing of the biomass.
3.1 Illinois – Assessment of Regional Biomass Demand and Availability
Another concern regarding biomass resource availability is the regional impact on plant size. Due to varying climatic conditions throughout the United States, some areas of the United States will likely produce higher yields or have a greater percentage of land available for production of biomass feedstock than others which could influence both the size and number of CBTL plants.
This section details the steps required to calculate the biomass feedstock land requirements and delivery distances for the feedstock to understand the impact on CBTL plant size. The delivery distance will subsequently be used to calculate the energy and CO2 emissions associated with production and delivery of the biomass resources.
Table 3 shows the total land surface area in Illinois, the amount of cropland area, and the cropland area that is potentially suitable for poplar or switchgrass growth. Illinois has over 36 million acres of land surface area, about two-thirds of which (24 million acres) is used in crop production. Of the 24 million acres of cropland, 11.2 million acres are used for corn production, 10.1 million acres for soybean production, and 2.7 million acres for other crop production. Of these 24 million acres, almost 97 percent of it is potentially suitable for growing either poplar or switchgrass7.
The amount of crop residues or dedicated energy crops produced will ultimately depend on feedstock price. Typically, the higher the price, the more feedstock is potentially available. Table 4 shows the potential incremental amount of land that may be available in Illinois to produce poplars or switchgrass at various feedstock production levels based on ORNL8 analyses. It should be noted that the ORNL assessment estimates that the majority of energy crop production in Illinois will be from switchgrass because, in the near term, it has higher yields and lower production costs. However, this does not preclude woody biomass crops such as poplars from being grown on these areas, and therefore poplars should still be considered as a potential

11
resource in this analysis. Other factors regarding the feedstock such as plant operating conditions and additional equipment requirements may dictate feedstock selection beyond the actual feedstock price.
At a sufficiently high price for the energy crops, land use changes would occur that would potentially remove land from some food crop production. Therefore, the impact on other crop prices and food/commodity supplies would also need to be determined but that is beyond the scope of this analysis.
Table 3. Illinois Land Surface, Cropland, and Potential Energy Crop Area
Total Land Surface Area (million acres) 36.1
Current Cropland Area (million acres) 24.0
Corn 11.2
Soybeans 10.1
Other 2.7
Other land use (pasture, forest, urban areas, etc.) 12.1 Potential acreage of cropland in Illinois that could be suitable for poplar and/or switchgrass growth 23.2
Source: USDA Natural Resources Conservation Service (NRCS), Illinois NRCS
News Release, NRI Data Shows Progress in Illinois Soil Conservation Efforts, January 30, 2007.
Table 4. Potential Acreage of Land Available in Illinois for Energy Crop Production Based on Feedstock Farmgate (Production) Price ($2006)
Yield (ton/acre
/ year)
Acreage of Land with Farmgate
Price <$44/dry
ton
Incremental Acreage of
Land Added with Farmgate
Price $44-$51/dry ton
Incremental Acreage of
Land Added with Farmgate
Price $51-$59/dry ton
Incremental Acreage of
Land Added with Farmgate
Price $59-$66/dry ton
Poplars 5 0 0 0 0
Switchgrass 5.96 0 13,000 2,800,000 4,870,000
Source: ORNL, A National Assessment of Promising Areas for Switchgrass, Hybrid Poplar, or Willow Energy Crop Production, February 1999.

12
Corn stover acreage will depend on the amount of corn acreage available. For Illinois, the amount of corn acreage was previously shown in Table 2 (11.2 million acres) and thus is the amount of corn stover acreage available. To minimize soil degradation some of the corn stover must be left in the field. Typically only half the corn stover should be removed.
Table 5 shows the estimated land requirements and delivery distances for switchgrass, poplar trees, and corn stover at various CBTL plant biomass demand levels. As plant size increases, the collection area required for sustained operations and subsequently the delivery distance of the feedstock to the plant, also increase.
The total biomass collection area and the delivery distance to the plant are a function of the following key variables: the total annual amount of biomass required for the plant, the yield of the biomass per acre per year, percent of land available for feedstock production, and the harvest cycle. The total annual amount of biomass is the amount required to sustain plant operations, factoring in the plant capacity factor and any feedstock losses. Table 5 shows five CBTL plant biomass demand levels: 500, 1,000, 1,500, 2,000, and 2,500 tons per day. The plant capacity factor is assumed to be 90 percent and the biomass feedstock loss factor is 10 percent.
The resulting annual biomass demand (in tons) is then divided by the biomass yield (dry tons/acre/year) to arrive at the total annual area required to grow that particular amount of biomass feedstock. The yields used for switchgrass and poplars are based on ORNL assessments and are assumed to be six and five dry tons/acre/year, respectively, for Illinois. Most studies show that nationwide switchgrass yields can range from three to seven dry tons/acre/year and are also dependent upon location and other factors9,10,11. The situation for poplars is similar to that of switchgrass with the potential for some locations to reach levels of 8 to 10 dry tons/acre/year. The yield for corn stover is assumed to be 1.98 dry tons/acre/year and is the value calculated and used in GREET. Corn stover yield depends on corn yield and the corn stover collection rate which GREET assumes are 166 bushels/acre and fifty percent, respectively.
However, not all of the land is available around the plant to grow the feedstock because there will be other uses of land in the area such as other crop production, pasture, forest, and urban areas. Therefore, the percent of land available for feedstock production must also be considered when calculating the collection area. In Illinois, the percent of land available for switchgrass and poplar growth was assumed to be eight percent for this analysis. This was calculated by taking the amount of land available for switchgrass growth at a delivered cost of $51-59/dry ton from Table 3 and dividing by the total land surface area of Illinois. For corn stover, the percent of land available is 31 percent and is derived from the current amount of land in Illinois that is used to produce corn divided by the total land surface area of Illinois.

13
Table 5. Estimated Collection Areas and Delivery Distances for Various Plant Sizes for Switchgrass, Poplar Trees, and Corn Stover
Feedstock
Biomass required
(tons/day)
Biomass required
(tons/year)
Conversion plant
capacity factor
Biomass Storage
and handling
losses
Annual biomass demand (tons)
Yield (dry tons/
acre)
Total annual
area required (acres)
Total annual
area required
(sq miles)
Percent land avail
for production
Adjusted total area required
(sq miles)
Harvest cycle
(years)
Total area required
for sustained operations(sq miles)
Distance, radius (miles)
Winding factor
Actual delivery distance (miles)
500 182,500 90% 10% 180,675 6 30,113 47 8% 588 1.25 735 15 1.3 20
1,000 365,000 90% 10% 361,350 6 60,225 94 8% 1,176 1.25 1,470 22 1.3 28
1,500 547,500 90% 10% 542,025 6 90,338 141 8% 1,764 1.25 2,206 26 1.3 34
2,000 730,000 90% 10% 722,700 6 120,450 188 8% 2,353 1.25 2,941 31 1.3 40
Switchgrass 2,500 912,500 90% 10% 903,375 6 150,563 235 8% 2,941 1.25 3,676 34 1.3 44
500 182,500 90% 10% 180,675 5 36,135 56 8% 706 1 706 15 1.3 19
1,000 365,000 90% 10% 361,350 5 72,270 113 8% 1,412 1 1,412 21 1.3 28
1,500 547,500 90% 10% 542,025 5 108,405 169 8% 2,117 1 2,117 26 1.3 34
2,000 730,000 90% 10% 722,700 5 144,540 226 8% 2,823 1 2,823 30 1.3 39
Poplar trees 2,500 912,500 90% 10% 903,375 5 180,675 282 8% 3,529 1 3,529 34 1.3 44
500 182,500 90% 10% 180,675 1.98 91,250 143 31% 460 1 460 12 1.3 16
1,000 365,000 90% 10% 361,350 1.98 182,500 285 31% 920 1 920 17 1.3 22
1,500 547,500 90% 10% 542,025 1.98 273,750 428 31% 1,380 1 1,380 21 1.3 27
2,000 730,000 90% 10% 722,700 1.98 365,000 570 31% 1,840 1 1,840 24 1.3 31 Corn
Stover 2,500 912,500 90% 10% 903,375 1.98 456,250 713 31% 2,300 1 2,300 27 1.3 35
14
Another factor to consider is the harvest cycle. While the total land area does not depend directly on the harvest cycle, there is an indirect impact and the harvest cycle directly impacts the processing and transportation costs, storage requirements, and biomass losses. Corn stover can be harvested annually, so it has a harvest cycle of one year. A poplar stand can be harvested essentially continuously with any individual tree harvested on a seven year cycle.
Switchgrass is a perennial crop and can be harvested annually like corn, but analyses suggest that it will most likely be placed on ten-year crop rotations to allow introduction of newer, higher yielding varieties. Additionally, switchgrass typically requires a two-year establishment period prior to harvest to reach full potential. Based on this data, 25 percent additional capacity is required to continually sustain plant operations.
Once the total area required for sustained plant operations is determined, one can assume a circular area around the plant and calculate the radius of the collection area. This radius will be the straight-line distance to the plant. Roads to the plant will not follow a straight line, so to calculate the actual distance to the plant, a winding factor of 1.3 is assumed12,13. Multiplying the radius by the winding factor provides the actual delivery distance. It should be noted that this is a maximum delivery distance for the collection area and not an average delivery distance and thus is a conservative estimate. Table 5 estimates the collection areas and actual delivery distances for different plant sizes for each type of biomass reviewed in this analysis.
The data from Table 5 can be used to make assessments regarding potential constraints on plant size or number of plants due to feedstock availability at various CBTL plant demand levels. The delivery distance from Table 5 can also be used to calculate the CO2 emissions for biomass feedstock production and transport to the CBTL plant when inputted into GREET.
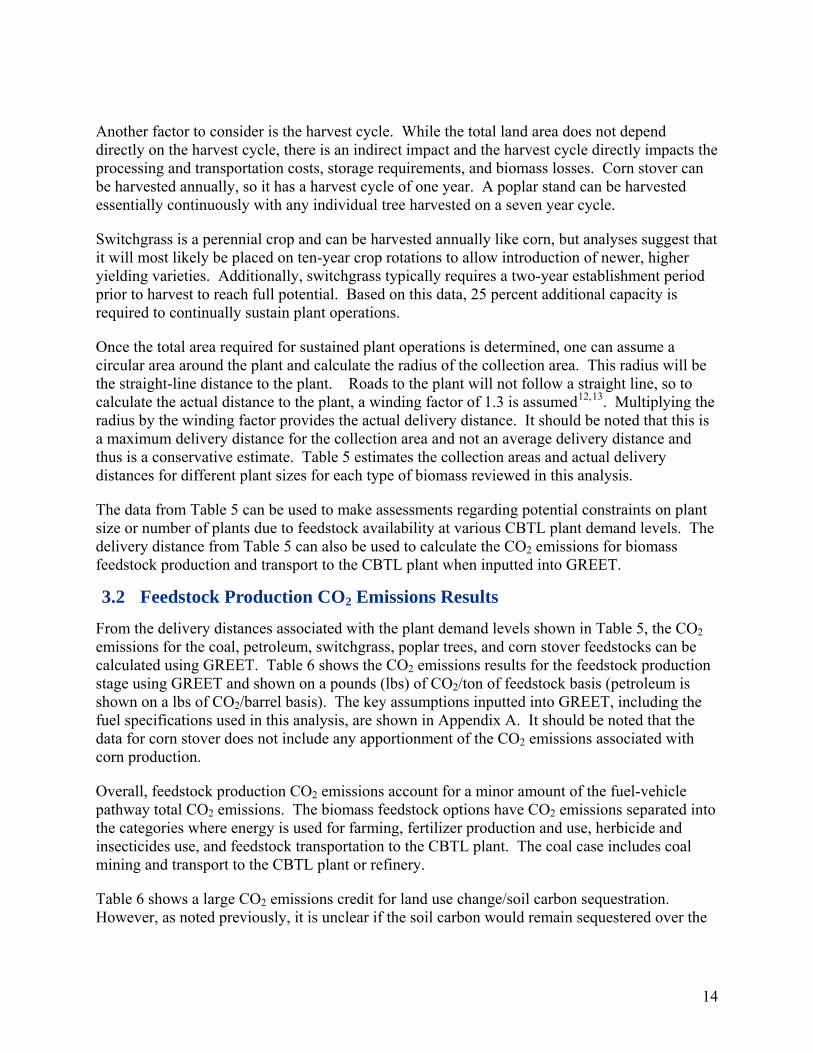
3.2 Feedstock Production CO2 Emissions Results
From the delivery distances associated with the plant demand levels shown in Table 5, the CO2 emissions for the coal, petroleum, switchgrass, poplar trees, and corn stover feedstocks can be calculated using GREET. Table 6 shows the CO2 emissions results for the feedstock production stage using GREET and shown on a pounds (lbs) of CO2/ton of feedstock basis (petroleum is shown on a lbs of CO2/barrel basis). The key assumptions inputted into GREET, including the fuel specifications used in this analysis, are shown in Appendix A. It should be noted that the data for corn stover does not include any apportionment of the CO2 emissions associated with corn production.
Overall, feedstock production CO2 emissions account for a minor amount of the fuel-vehicle pathway total CO2 emissions. The biomass feedstock options have CO2 emissions separated into the categories where energy is used for farming, fertilizer production and use, herbicide and insecticides use, and feedstock transportation to the CBTL plant. The coal case includes coal mining and transport to the CBTL plant or refinery.
Table 6 shows a large CO2 emissions credit for land use change/soil carbon sequestration. However, as noted previously, it is unclear if the soil carbon would remain sequestered over the

15
lifetime of the CBTL plant and hence to be conservative, this credit was not included in the total CO2 emissions from feedstock production.
3.3 Land Availability and CBTL Capacity
The analysis of switchgrass and poplar trees in Table 5 is based on 8 percent of the land in Illinois being available for switchgrass or poplar growth. This is 2,813,000 acres or approximately 4,400 square miles. Under this assumption, the range of biomass demand levels analyzed in Table 5 shows that demand levels greater than 1,500 dry tons/day would mean that only one plant could be supplied with enough biomass to sustain operations. The Southern States Energy Board Report The American Energy Security Study included analysis of two cases which co-fed coal and woody biomass (poplar trees), one with ten percent biomass by weight and the other with twenty percent. These plants had capacity for 10,000 barrels per day and required 560 and almost 1,200 tons of biomass per day respectively. At these biomass demand levels, approximately five and three 10,000 barrel per day plants respectively could be built that would have sufficient biomass supply under the assumptions used for the estimates in Table 5.
However, if higher yields or more land was available for biomass production, these could significantly impact both the number and size of the plants. With all other factors held constant, higher yields will result in more biomass available per acre and will shorten delivery distances or allow larger scale plants. For example, the recent report by the University of Tennessee used projected switchgrass yields of 7.8 dry tons/acre in 10 years and 9.6 dry tons/acre in 20 years in its analysis for the “Corn Belt” region (i.e., states of Ohio, Indiana, Illinois, Iowa, and Missouri)14. If these switchgrass yields were achieved, biomass availability could be increased to 2,750 dry tons/day and 3,250 dry tons/day respectively while maintaining the delivery distance required for the 2,000 dry tons/day plant under current yields. Alternatively, lower yields than those used in this analysis will result in larger collection areas, longer delivery distances, and negatively impact the scale and number of plants.
A second important factor is the percent of land available around the plant for switchgrass and poplar trees production. If the land available in Illinois for dedicated energy crop production was doubled from the current estimate of eight percent to sixteen percent, this would result in a doubling of the potential CBTL plant capacity that could be supported at current yields and delivery distances, significantly impacting the size and number of plants.
For corn stover, there are not expected to be dramatic deviations in the short or mid-term from the yield assumed in this analysis. However, the percentage of land available is a critical factor. Currently in Illinois, 31 percent of the land (11.2 million acres or about 17,500 square miles) is available for corn stover collection based on current levels of corn production as a percent of total Illinois land surface area (see Table 3). At this land availability percentage and the assumed yield of 1.98 dry tons/acre, corn stover has the potential to provide larger quantities of biomass and support larger plant sizes. For example, corn stover supply for a 2,500 dry ton/day plant requires about the same collection area needed to supply only 1,500 dry tons/day of biomass for the switchgrass and poplar tree cases.

16
Table 6. Feedstock Production and Transport CO2 Emissions Estimates for Switchgrass, Poplar Trees, Corn Stover, and Coal
Foss
il Fu
el
Prod
uctio
n or
B
iom
ass F
arm
ing
(lbs/
ton)
Biomass Farming Fertilizer Use (lbs/ton)
Biomass Farming Pesticide Use (lbs/ton) C
O2 c
redi
t fro
m la
nd
use
chan
ge/s
oil
carb
on (l
bs/to
n)
Foss
il Fu
el o
r B
iom
ass
Tra
nspo
rtat
ion
(lbs/
ton)
Tot
al F
eeds
tock
Pr
oduc
tion
and
Tra
nspo
rtat
ion
(lbs/
ton)
Feedstock
Biomass required
(tons/day)
Delivery distance (miles) Nitrogen P2O5 K2O Herbicide Insecticide
500 20 45.4 51.4 0.3 0.3 1.2 0.0 -106.8 10.2 2.0 1,000 28 45.4 51.4 0.3 0.3 1.2 0.0 -106.8 14.3 6.1 1,500 34 45.4 51.4 0.3 0.3 1.2 0.0 -106.8 17.4 9.2 2,000 40 45.4 51.4 0.3 0.3 1.2 0.0 -106.8 20.5 12.2 Switch-
grass 2,500 44 45.4 51.4 0.3 0.3 1.2 0.0 -106.8 22.5 14.3
500 19 48.1 3.4 0.4 0.5 1.0 0.1 -247.8 15.6 -178.7 1,000 28 48.1 3.4 0.4 0.5 1.0 0.1 -247.8 22.9 -171.4 1,500 34 48.1 3.4 0.4 0.5 1.0 0.1 -247.8 27.8 -166.5 2,000 39 48.1 3.4 0.4 0.5 1.0 0.1 -247.8 31.9 -162.4 Poplar
trees 2,500 44 48.1 3.4 0.4 0.5 1.0 0.1 -247.8 36.0 -158.3
500 16 46.3 15.4 3.3 11.5 0.0 0.0 0.0 8.2 84.7 1,000 22 46.3 15.4 3.3 11.5 0.0 0.0 0.0 11.3 87.8 1,500 27 46.3 15.4 3.3 11.5 0.0 0.0 0.0 13.8 90.4 2,000 31 46.3 15.4 3.3 11.5 0.0 0.0 0.0 15.9 92.4 Corn
stover 2,500 35 46.3 15.4 3.3 11.5 0.0 0.0 0.0 17.9 94.5
Coal* N/A 65 47.7 N/A N/A N/A N/A N/A N/A 3.9 51.5 *Coal delivery assumes fifty percent transport by railcar and fifty percent transport by conveyor over a 65 mile distance.

17
3.4 Biomass Economics
Biomass is similar to hydrocarbon resources in that higher price and improved technologies could make more resources economic. Currently, it is considered that dedicated biomass energy feedstocks such as switchgrass and poplars, and agricultural residues such as corn stover are technically “recoverable” but uneconomic at delivered prices less than $30/dry ton. However, as the price rises or technological advancements are made, resources may become available and economically attractive.
3.4.1 Biomass Feedstock Costs
There are two components to calculating the delivered biomass feedstock cost – the production cost and the transportation cost. Table 7 shows the range of feedstock production costs for switchgrass, poplars, and corn stover from various studies reviewed15,16,17. As shown in Table 7, the production cost for dedicated energy crops such as switchgrass and poplars cover a broad range. This is primarily due to lack of sufficient data since there are a limited number of field trials. Additionally, most of the studies are based on current agricultural technologies and practices and do not account for improved harvesting, collection, storage, pre-processing, or transportation methods.
Table 7. Range of Feedstock Production Costs from Various Studies ($2006)
Type of Biomass
Production Cost Range
($/dry ton)
Production Cost Range
($/MMBtu) (HHV)*
Switchgrass 20-70 1.28-4.49
Poplars 25-95 1.41-5.37
Corn Stover 20-40 1.34-2.67
*GREET Model 1.7 default fuel specifications use the following higher heating values: poplars – 17,703,170 Btu/ton, switchgrass – 15,582,870 Btu/ton, and corn stover – 14,974,460 Btu/ton. These values were used to convert $/dry ton to $/MMBtu.
Many factors influence the feedstock production cost, namely location and associated land costs, yields, labor, equipment and machinery, variable inputs such as fertilizers, seeds, and fuel, and other costs. A conservative estimate for switchgrass and poplar feedstock production costs would be in the $30/dry ton to $50/dry ton range. Recent data from two field tests of switchgrass – one by the University of Nebraska and the USDA Agricultural Research Service, and the other by Iowa State University – had production costs of $27/ton and $40/ton, respectively18.

18
For the present study, switchgrass is assumed to have a feedstock production cost of $40/dry ton ($2.57/MMBtu (HHV)). Poplars are assumed to have a higher feedstock cost on a dry ton basis compared to switchgrass due to lower yields and higher farming costs. Therefore, they are assumed to have a feedstock production cost of $45/dry ton ($2.54/MMBtu (HHV)). The assumed feedstock production cost for corn stover is $30/dry ton ($2.00/MMBtu (HHV)).
The second component of the delivered biomass feedstock cost is the transportation cost. Feedstock transportation costs typically account for $5-15/dry ton depending upon the hauling distance to the plant. Figure 1 shows the cost of corn stover delivery to the process facility and is based on data plotted from an ORNL study19. For this analysis, we assume that the equation in Figure 1 for corn stover is also applicable to assess the transportation costs for switchgrass and poplar.
Figure 1. Transportation Cost for Corn Stover
0.00
2.00
4.00
6.00
8.00
10.00
12.00
14.00
0 10 20 30 40 50 60 70 80Hauling Distance (Miles)
Tran
spor
t Cos
t ($/
dry
ton)
Transport Cost = 6.21 + 0.12 * Hauling Distance
Source: Perlack, Robert D., Turhollow, Anthony F., Oak Ridge National Laboratory (ORNL),
Assessment of Options for the Collection, Handling, and Transport of Corn Stover, September 2002. Assumed this study was in $2001 and estimated on $2006 basis.
Currently, DOE’s Biomass Program assesses the total delivered cost (production and transport) of biomass feedstock as $53/dry ton based on the 2004 state of technology. The program’s goal is to reduce the total delivered feedstock cost to $45/dry ton by 2010, $35/dry ton by 2015 and to less than $35/dry ton by 202020. For illustrative purposes, the total delivered cost assumed for each type of biomass versus the plant demand for biomass is shown in Figure 2. The delivered feedstock cost is calculated by adding the assumed production cost for each biomass type and then calculating the transportation cost based on the formula from Figure 1 for the hauling distances associated with the amount of biomass required to meet the CBTL facility demand.

19
The actual hauling distances for the biomass demand amounts in Figure 2 are calculated later in this section.
Figure 2. Delivered Cost of Biomass as a Function of CBTL Plant Biomass Demand
2.00
2.20
2.40
2.60
2.80
3.00
3.20
3.40
0 500 1,000 1,500 2,000 2,500 3,000
CBTL Plant Biomass Demand (dry ton/day)
Bio
mas
s D
eliv
ered
Cos
t ($/
MM
Btu
, HH
V)
Switchgrass
Poplar Trees
Corn Stover
Notes: Delivered Cost = Production Cost plus Transport Cost Assumptions: Switchgrass Production Cost = $40/dry ton; Poplar Trees Production Cost = $45/dry ton; Corn
Stover Production Cost = $30/dry ton 3.5 Feedstock Analyses
The analysis of the coal and biomass assumed in the study are given in Tables 8 and 9, respectively.

20
Table 8. Illinois #6 Bituminous Coal Analysis
Dry As Received
C 71.72 63.75
H 5.06 4.49
O 7.75 6.89
N 1.41 1.25
S 2.82 2.51
Cℓ 0.33 0.29
Total 89.09 79.18
Ash 10.91 9.70
Moisture 12.5 11.11
Total 112.5 100
HHV (Btu/lb) 13,126 11,667
Table 9. Biomass Analysis, Dry Basis
Corn Stover Poplar Switchgrass C 44.50 51.7 42.6 H 5.56 5.8 6.55 O 43.31 41.75 41.98 N 0.61 0 1.31 S 0.01 0 0.01 Cℓ 0.00 0.1 0.1 Total 93.99 99.35 92.55 Ash 6.01 0.65 7.45 Moisture 0.0 0.0 0.0 Total 100.00 100.00 100.00 HHV (MMBtu/ton) 15.06 17.70 15.58 HHV (Btu/lb) 7,528 8,855 7,787

21
4 Conceptual CBTL Plant Evaluation
This section presents the technical details and performance results for a CBTL plant designed to produce ultra clean transportation fuels from syngas produced by the gasification of mixtures of coal and biomass. The CBTL plant is designed to capture approximately 88 percent of the total carbon input to the plant which is not contained in the finished fuel. The carbon dioxide is captured and compressed to 2,200 psi for subsequent sequestration. The advantage of this approach is that the carbon in the biomass can essentially be captured twice. Once from the growing process where carbon is taken from the biosphere into the plant material by photosynthesis and this carbon is captured and sequestered or reused/reformed so that it is not released back into the biosphere. No value was attached to the captured carbon in this study. The carbon dioxide could have a positive value is used for enhanced oil recovery (EOR) or a negative value if it had to be pumped into a saline aquifer or disposed of in other ways.
In all, a total of five cases were analyzed in some detail in this study. The description of these cases is given in Table 10. This report considered three biomass types, hybrid poplar obtained from short rotation woody cropping (SRWC) plantations, switch grass and corn stover. A typical Illinois #6 bituminous coal was assumed in all cases.
Table 10. Cases Analyzed in the Study
1. A CBTL plant configuration feeding 10 wt. % (7 energy %) woody biomass (poplar) and 90% Illinois #6 coal
2. A CBTL plant configuration feeding 15 wt. % (10 energy %) woody biomass and 85% Illinois #6 coal
3. A CBTL plant configuration feeding 12 wt. % (7 energy %) switchgrass and 88% Illinois #6 coal
4. A CBTL plant configuration feeding 12 wt. % (7 energy %) corn stover and 88% Illinois #6 coal
5. A CTL coal only plant feeding 100% Illinois #6 coal
All plants are sized to produce about 7500 barrels per day of finished product in the diesel/jet fuel boiling range. In addition to this distillate product, about 3500 Bbl/day of paraffinic naphtha (about 30 percent of the total liquid product) boiling below 300 F is produced. All hydrocarbons C4 or lighter are consumed in the process mostly for on-site electric power generation or for fired heaters for drying the feed materials and for the FT product upgrading section of the plant.
Because all of the CBTL plants produce the same quantities of liquid products their land area requirements are about the same in all cases. Typically for this size CTL plant a land area of

22
approximately 150 acres is required. This includes key process units such as the gasification island, gas treatment, FT synthesis, and the power block as well as coal storage, transfer, and grinding. All offsites and utilities, exclusive of coal conveying to the plant, roads and water wells and piping are also accounted for.
The total land area requirement of the facility including coal conveying, rail spur for product shipment, roads, water wells, and pipelines to the plant is expected to be about 200 acres. This assumes that large quantities of biomass will not be stored at the plant site.
For a CTL plant the staffing is estimated to total about 190, we assume a similar number for a CBTL plant. This includes about 25 professionals and 115 operators, with the remainder being administrative, security, and maintenance labor. These CBTL plants will require varying quantities of coal depending on the ratio of coal to biomass used. The Illinois #6 coal input ranges from about 4,500 to 5,000 tons per day (TPD) for the plants analyzed. Because of the seasonal nature of biomass availability it would also be beneficial for a CBTL plant to have feedstock preparation facilities for a variety of different biomass feeds.
4.1 CBTL Process Units
Regardless of size, overall configuration, and feedstock, the CBTL conceptual plants analyzed in this study all have essentially the same process units in common. This is shown in the block flow diagram in Figure 3. The following describes the overall function of these individual process operations.
4.1.1 Feedstock Processing and Drying
The coal feedstock to the plant the coal must be reclaimed from the coal storage area, crushed and ground to a pulverized size distribution and dried to be suitable for feeding to the dry feed gasifier.
In this study it is assumed that the biomass is delivered to the plant gate in a state that is almost ready for gasification. For the woody poplar it is assumed that the delivered chipped wood is further dried and reduced in size to about 1 mm to minimize feeding problems to the high pressure gasifier. The caveat here is that there has been very little experience in feeding wood to high pressure gasification systems.
For the switch grass and corn stover it is assumed that these feedstocks are cut, field dried, and baled and then transported to the CBTL plant in rectangular bales in the size of approximately three feet by four feet by eight feet and weighing about 1,000 pounds. At the CBTL plant the biomass is sent to a de-baler where the bales are broken up into loose grass or loose cut stover. The grass is then reduced in size by grinding in a collision mill. To control dust a negative pressure is maintained on the mill and the ground grasses are collected in baghouse filters. It is assumed that the finely ground grass is conveyed by augers to a lock hopper system and then pneumatically conveyed into the gasifier.

23
Figure 3. Generic Block Flow Schematic of a CBTL Facility
COS Hyd Selexol
H2 Recovery Fuel Gas
HgRemoval
AGT
Sulfur Polish
FT Synthesis
Product Recovery/ Upgrading
SHIFT
Diesel
Naphtha
CO2RemovalTo CO2 Compression Steam
H2
BFW
BoilerST
CW System
Make-up Water
Stack Gas
Coal
Oxygen
ASUAir
To CO2 Compression
Gasification Quench
Feedstock Processing and Drying
Biomass
Biomass
Plant PowerNet Power
~
Coal
Air
Slag
CO2 Injection Gas

24
4.1.2 The Air Separation Unit
The oxygen for coal gasification is provided by an air separation unit (ASU). This design uses a conventional cryogenic ASU for production of 95 percent purity oxygen for coal gasification and for nitrogen for inert gas uses.
4.1.3 Gasification
In all cases, a single stage, dry feed gasifier with quench was used. This would be similar in concept to a Shell or a Siemens gasifier. It is an oxygen-blown entrained gasifier where a membrane wall with pressurized water or steam is used to cool the gasifier inside surface so that a constantly forming liquid slag layer from melting of the coal mineral matter forms the refractory lining. This is different from the other gasifier systems like GE/Texaco and E-Gas where a brick refractory lining is used. It is assumed that the coal and the biomass are fed through separate systems so that if there is plugging problems in the biomass feed system the gasifier can still be operated on coal. Entrained flow gasifiers have advantages in that they produce no tars and the solid waste is an inert slag. Also the synthesis gas is almost entirely carbon monoxide and hydrogen with little methane. Therefore the syngas is an excellent feed for the Fischer-Tropsch process. Gasification takes place at slagging temperatures, typically about 2,600 ºF and 450 psia. The carbon conversion in this gasifier is typically about 98 to 99 percent. The reactants which are fed to the gasifier are converted in the flame section. The oxygen to coal ratio is adjusted to keep the gasification temperature high enough to melt the mineral matter that then flows vertically downward in parallel with the synthesis gas and leaves the gasifier through the bottom discharge section. Depending on the intended use of the synthesis gas, a direct contact water quench spray system or an indirect cooling heat recovery steam generator system can be installed at the gasifier exit. In this study, it is assumed that the direct water quench system is used. The quench removes hydrogen chloride, cyanide, ammonia, and particulate matter before further processing of the syngas.
4.1.4 Gas Cooling, Raw Water Gas Shift, Carbonyl Sulfide Hydrolysis, and Mercury Removal
The treatment scheme for the syngas produced in all cases is the same. The synthesis gas stream leaving the gasifier quench section is split, and a portion of the stream is sent to a raw water gas shift reactor to adjust the hydrogen to carbon monoxide molar ratio to that required for the FT reactors. The other portion of the synthesis gas is sent to a carbonyl sulfide hydrolysis unit where the COS is hydrolyzed to hydrogen sulfide. The two streams, having a molar hydrogen to carbon monoxide ratio of about 1.0, are then combined and both streams are then cooled in gas coolers before being sent to activated carbon filtration for removal of mercury. This cooled gas is then sent to a two-stage Acid Gas Removal (AGR) unit for removal of hydrogen sulfide and carbon dioxide.
4.1.5 Acid Gas Removal
The raw synthesis gas at about 400 psi from mercury removal is sent to an AGR unit. The AGR unit selected is used for the selective removal of hydrogen sulfide and for bulk removal of carbon

25
dioxide. The acid gas produced by this selective absorption is suitable for feeding to a Claus-type unit for acid gas treatment (AGT) and recovery of elemental sulfur.
4.1.6 Hydrogen Recovery
A portion of the clean synthesis gas leaving the AGR unit is sent to the hydrogen recovery unit where sufficient hydrogen is separated and purified for use in the FT upgrading section of the plant. This hydrogen is required for hydrotreating and hydrocracking. The hydrogen separation system chosen for this study is a combination of membranes and Pressure Swing Adsorption (PSA). The membrane system is used to avoid a pressure drop in the main synthesis gas stream. The final purification of the hydrogen is achieved by sending the permeate stream from the membrane unit to a PSA unit. Here the hydrogen is produced at 99.99 percent purity. The hydrogen leaves the PSA at essentially feed pressure while the PSA purge gases leave at essentially atmospheric pressure.
4.1.7 Sulfur Polishing
Depending on operating conditions, the synthesis gas exiting the AGR unit still contains about 1-2 ppmv H2S. This quantity of H2S is still too great to feed to the sulfur sensitive iron-based catalysts in the Fischer-Tropsch synthesis process. To remove this residual H2S, zinc oxide polishing reactors are used. The zinc oxide reacts with the hydrogen sulfide to form solid zinc sulfide. The product gas leaving the polishing reactor contains less than 0.03 ppmv H2S.
4.1.8 Fischer-Tropsch Synthesis
The clean synthesis gas containing less than 0.03 ppmv H2S from the sulfur polishing reactor is sent to the FT section of the plant. At the required product production rates used in this study, multiple trains of slurry phase reactors are needed to process the clean synthesis gas. Low temperature slurry phase FT reactors are used to maximize distillate production via wax cracking. Iron catalysts are used because they are cheaper than cobalt catalysts and have water gas shift capability. The synthesis gas is heated to about 450 ºF and about 30 bar pressure and fed to the bottom of the FT reactors. The gas bubbles up through the reactors that are filled with liquid hydrocarbons in which are suspended fine iron-based catalyst particles. Reaction heat is removed via heat exchangers suspended in the reactors. The liquid medium enables rapid heat transfer to the heat exchangers which allows high synthesis gas conversions in a single pass through the reactor. Synthesis gas conversions of about 75 percent per pass can be obtained.
Volatile overhead product swept from the reactors is separated in hot and cold separators to recover liquid hydrocarbons. Complete conversion of the synthesis gas to hydrocarbons does not occur in one pass through the FT reactors. In the simple recycle configuration used in all cases in this study, the effluent from the FT reactors is cooled to recover the portion constituting liquid fuels and the unconverted synthesis gas is recycled back to the FT reactors to increase the conversion to fuels. The carbon dioxide produced during the synthesis process is removed in the recycle loop. Heavy product that is non-volatile under reaction conditions is removed from the reactor and separated from the catalyst. Slurry phase reactor technology is under development by several companies and Sasol is utilizing these reactors at their Oryx Gas-to-Liquids (GTL) plant in Qatar. Slurry reactors have excellent heat transfer characteristics and allow high

26
conversions of synthesis gas per pass. However, there has not been much commercial experience with these reactors and there are issues relating to hydrodynamics and separation of the wax produced in the FT process from the fine catalyst.
The raw FT products consisting of crude naphtha, crude middle distillate, and crude wax are sent directly to product upgrading. Fresh FT catalyst is activated in a separate catalyst activation reactor and then added on-line to the FT reactors to replace spent catalyst and to maintain overall activity. The catalyst replacement rate assumed in this study is 0.5 pounds per barrel of FT product.
4.1.9 FT Product Upgrading
The raw FT products need to be upgraded to produce naphtha and high quality diesel or jet fuel. The raw naphtha and middle distillate is sent to a hydrotreating unit to saturate the olefins that are produced in the FT process. The wax material is sent to a hydrocracker where the wax is converted into hydrocarbon gases, naphtha and diesel or jet fuel.
4.1.10 Carbon Dioxide Removal in Recycle Loop
The FT tail gas containing light hydrocarbon gases, unconverted hydrogen and carbon monoxide, some nitrogen, and carbon dioxide is split into two streams. One stream is recycled back to the FT unit to increase liquids yield and the other stream is sent to the power generation block. The recycled tail gas is processed in an amine unit to remove the carbon dioxide that is inert and takes up space in the slurry FT reactors. This is a standard MDEA unit with a single carbon dioxide absorber and solvent regenerator. An amine unit is used in this case because Selexol solvent would remove the light hydrocarbons from the FT tail gas.
4.1.11 Power Generation Block
The FT tail gas that is not recycled back to the FT reactors is sent to a boiler where high pressure steam is produced. This steam is used to drive a three stage steam turbine to generate the electric power for the plant. The steam turbine consists of a high pressure section (~1,800 psig, 1,050 ºF), an intermediate pressure section (~ 400 psig, 1,050 ºF), and a low pressure section. All three sections are connected mechanically to an electric power generator by a common shaft.
4.1.12 Balance of Plant (BOP) Units
The conceptual design included materials and equipment for product storage (storage tanks are on site for storing naphtha and diesel fuels), water systems (systems are provided for cooling towers, to prepare boiler feed water (BFW), waste water treating, storm water handling, and fire water systems), electrical transformers and plant power distribution facilities and unit operations instrumentation and control systems.
4.2 General Technical Plant Description of the Cases Analyzed
Figure 3 shows a generic block flow diagram for the cases analyzed in this study. The CBTL plant produces about 10,000 barrels per day on an equivalent diesel basis of naphtha and diesel

27
and jet fuel. It uses Illinois #6 coal and various quantities of biomass as feed material. These are fed to two trains of single stage, entrained flow, dry feed gasifiers. The Fischer-Tropsch (FT) configuration used is a simple recycle system where the unconverted synthesis gas and light hydrocarbon gases are recycled back to the FT reactor after removal of the carbon dioxide produced during the synthesis. The clean syngas is sent to four FT synthesis reactor trains. Each FT reactor produces about 2,500 BPD of product. These smaller FT units are used because of transportation issues involved with larger units. In rural areas the feasibility of transporting large pieces of equipment may well be a limiting factor on size. If the plants are located on water ways like the Mississippi or Ohio rivers then it would be possible to bring in larger reactors.
After feed preparation, the coal and biomass are fed to the two entrained gasifiers through separate feed systems where they are gasified with oxygen. The coal is assumed to be fed through a system of pressurized lock hoppers as is the usual practice with a Shell type gasifier. According to ECN6 they believe that due to the high reactivity of the biomass particles, the wood could be fed as large a 1 mm particles. The advantages of this are that torrefaction of the wood is not necessary and this direct size reduction only consumes about 0.01-0.02 kWe/kWth wood of energy. ECN also assumes that screw feeders would be preferred over lock hoppers for the biomass. ECN does not believe that pneumatic feeding will be successful for this type of biomass feed. It is assumed in this study that the gasifier design has to be modified to include the two separate feed systems and dedicated biomass burners. However, the Stamet∗ posimetric pump could well be an alternative possibility for co-feeding the woody biomass and the coal in a single feed system. Stamet received samples from NUON in the Netherlands that contained thirty percent wood sawdust and seventy percent by weight coal. This was the same feed material that was successfully gasified in the Shell gasifier at the NUON plant. According to Stamet21 they were able to successfully feed this mixed material up to pressures just under 500 psi. In fact the material was easier to feed than an all coal feed. However, one advantage of having separate feed systems would be that, if the biomass system becomes inoperable for a time because of plugging, the gasifier can still continue to operate on coal only. For the switchgrass and corn stover the ground biomass is assumed to be pneumatically transported into the high pressure gasifier through a series of lock hoppers. If this proves not to be successful then a similar feeding system to the woody biomass (screw feeders) may be necessary.
Carbon dioxide is used as the transport gas to move the pulverized coal into the lock hoppers and into the coal gasifier burners. Carbon dioxide is used because it can be recovered downstream in the AGR units. If nitrogen were used this would build up and dilute the stream making it difficult to achieve maximum carbon capture. Because the ash from biomass is rich in calcium oxide it is difficult to melt even at typical operating temperatures of entrained flow gasifiers. This fact may require the addition of fluxing agents to obtain acceptable slag properties. Addition of silica or clay could be used for this.
Simulation runs using various mixtures of biomass and coal were used to identify the ratio of coal to biomass that will achieve the twenty percent carbon footprint reduction compared to petroleum. The raw synthesis gas is water quenched and then split so that some of the gas is sent ∗ GE Energy recently announced in a June 15, 2007 news release that it has acquired high-pressure feeder pump technology from Stamet Inc.

28
to a water gas shift reactor for adjustment of the carbon monoxide to hydrogen ratio needed for the FT process. The other stream is sent to carbonyl sulfide hydrolysis to convert the COS and HCN to hydrogen sulfide and ammonia. After further cooling and scrubbing the syngas is sent to an activated carbon reactor to remove mercury. The cooled gas is then sent to a two stage acid gas removal (AGR) system where hydrogen sulfide is removed in one stage and bulk carbon dioxide removal occurs in the second stage.
A portion of the clean syngas stream is sent to hydrogen recovery for recovery of enough hydrogen for the hydrotreaters and hydrocracker in the raw product upgrading section. The syngas is then sent through a zinc oxide polishing reactor where the final sulfur level is reduced to around 0.03 ppmv to protect the sulfur sensitive FT catalyst.
The clean syngas is then sent through four slurry phase FT reactors for the synthesis of the hydrocarbon liquids. The effluent from the FT reactors is cooled and the condensable hydrocarbons separated from the gases. The wax is withdrawn from the reactors and sent to the wax hydrocracker where cracking and isomerization occurs to produce diesel and jet fuels. The raw FT distillate products are hydrotreated to remove olefins and the liquid product is distilled into naphtha and distillate fractions.
The unconverted synthesis gas together with the light hydrocarbon gases are recycled through an amine system to remove the carbon dioxide produced during the synthesis and sent back to the FT reactors to obtain greater conversion to liquid products.
A portion of the FT tail gas containing the light hydrocarbon gases and unconverted hydrogen and carbon monoxide is sent to boiler where high pressure steam is generated to provide the power needed for the plant. Any excess power can be sold.
Because these plants are configured to maximize capture of carbon dioxide, the carbon dioxide from both the AGR and the FT recycle are dehydrated and compressed to 2,200 psi for subsequent sequestration. The only carbon dioxide emitted to the atmosphere is from the boiler/superheater stack and the fired heaters in the upgrading section. Overall about 88 percent of the non fuel based carbon entering the plant can be captured. The other carbon is still contained in the FT hydrocarbon products that are shipped from the plant to the end user.
4.3 Case Details of Woody Biomass CBTL Plant Meeting 20 Percent Lower Carbon Footprint Criteria than Petroleum Refining
The Noblis in-house spreadsheet CTL computer simulation models were used to determine the ratio of woody biomass to coal needed to reduce the carbon footprint of the CBTL plant by twenty percent on a carbon basis compared to a petroleum refinery. Several cases were analyzed with varying quantities of poplar woody biomass added to the coal to determine the overall plant carbon balance. These overall plant carbon balances were then used to quantify the carbon associated with the production of FT diesel fuel. This was then compared to the carbon associated with the production of diesel fuel from a generic petroleum refinery.

29
Figure 4 shows a block flow diagram of a CBTL plant configuration that has the potential to reduce the carbon footprint to twenty percent below a petroleum refinery. In this plant Illinois #6 coal and chipped woody biomass are delivered to the plant gate. This plant consumes ninety weight percent coal on an as received basis and ten weight percent (seven energy percent) woody biomass poplar on an as-received basis. It is assumed that the coal has been delivered from a nearby mine and the woody biomass has been harvested from a short rotation woody cropping plantation where the poplar is grown, cut and chipped for transport to the plant. Although not specifically located, it can be assumed that the CBTL plant is in a rural agricultural area of Southern Illinois close to the coal.
In the feedstock processing and drying section of the plant both the as received woody biomass and coal are dried to ten percent moisture. It is assumed that the delivered chipped woody biomass can be reduced further in size to an average particle size of about 1 mm as suggested by ECN for feeding to the pressurized entrained gasifier.
Referring to Figure 4, 4,589 tons per day (TPD) of Illinois #6 coal and 510 TPD of woody biomass are delivered as received to the plant. The carbon contained in the coal is equivalent to 2,926 TPD and the carbon in the woody biomass is equivalent to 224 TPD. Total carbon input to the plant is therefore 3,150 TPD. Assuming a plant capacity factor of 90 percent (328.5 days per year) and a carbon loss of 1 percent during feed stock processing, the total carbon input to the plant is 1,024,381 tons per year (TPY).
The coal and biomass are co-gasified in dry feed, pressurized, entrained flow gasifiers with 95 percent purity oxygen from the cryogenic air separation unit (ASU). Carbon dioxide injection gas is used to entrain the pulverized coal into the gasifier burners. As mentioned above, it is assumed that a separate feed system is used to deliver the woody biomass to the gasifier; a screw feeder is assumed to be suitable for this. The gasifier would be modified to have separate burners for the coal and the biomass and some fluxing material (silica or clay) is added to reduce the biomass ash melting temperature.
A portion of the raw synthesis gas is shifted in the water gas shift reactors and the unshifted gas is sent to carbonyl sulfide hydrolysis. After cooling the combined gas stream is sent to activated carbon beds for mercury removal. The synthesis gas is then sent to the Selexol acid gas removal section of the plant where hydrogen sulfide and carbon dioxide are removed. The Selexol unit is assumed to remove about 95 percent of the carbon dioxide or 1,038 TPD of carbon. Some of this carbon dioxide is recycled to the gasifier for entrainment of the coal for feeding. The hydrogen sulfide stream is sent to the Acid Gas Treating (AGT) Claus plant where it is converted into elemental sulfur. Some of the cleaned synthesis gas is sent to the hydrogen recovery section where hydrogen is recovered from the gas for hydrotreating and hydrocracking the raw FT product. Let down from the hydrogen recovery unit produced fuel gas for various plant uses. The synthesis gas is then sent to a final zinc oxide polishing reactor where the total sulfur content of the gas is reduced to below 0.03 ppmv to protect the FT catalyst from sulfur poisoning.
The clean synthesis gas is then fed to the FT reactors where the synthesis of the hydrocarbons takes place. Because of the rural location of the CBTL plant it was decided to use smaller reactors of about fifteen feet in diameter so that these could be more readily transported to the

30
Figure 4. Block Flow Schematic of the 10 wt % (7 energy %) Woody Biomass Case
COS Hyd Selexol
H2 Recovery Fuel Gas (13 TPD C)
HgRemoval
AGT
Sulfur Polish
FT Synthesis(4 FT
Reactors)
Product Recovery/ Upgrading
SHIFT
Diesel7,500 BPD
Naphtha3,509 BPD
CO2RemovalTo CO2 Compression
(849 TPD Carbon)Steam
H2
BFW
BoilerST148.6 MW
CW System
Make-up Water
Stack Gas(222 TPD Carbon)
Coal4,589 TPD AR(2,926 Carbon)
Oxygen
ASUAir
(1,206 TPD Carbon)
To CO2 Compression(829 TPD Carbon)
Gasification Quench
(2 Gasifier Trains)
Poplar510 TPD AR(224 Carbon)
Slag(31 TPDCarbon)
138.5 MW Plant Power10.1 MW Net Power
~
CO2 Injection Gas (209 TPD Carbon)
BiomassCoal
Feedstock Processing and Drying
Air

31
proposed plant site. This size of slurry iron catalyzed FT reactor can produce about 2,500 barrels per day (BPD) of liquid fuels. The FT effluent is cooled and the liquid hydrocarbon products are recovered. The wax product is withdrawn from the reactors and sent to the wax hydrocracker to maximize the production of diesel and jet fuels. The naphtha product constituting about thirty percent of the total liquids is hydrotreated. It is assumed that this naphtha can be transported from the CBTL plant and sold either as a zero sulfur gasoline blending stock to a local refinery or used as a petrochemical feed for ethylene production.
A portion of the unconverted synthesis gas and the light hydrocarbon gases are recycled back to the FT reactors after passing through an amine unit for removal of the carbon dioxide formed during the synthesis process. In this case 849 TPD of carbon are removed in the carbon dioxide removal system. The FT tail gas not recycled is sent to a boiler for production of high pressure steam. This steam is used in a steam turbine to generate power for the CBTL plant. The carbon dioxide exiting the boiler and the upgrading section of the plant from use of fuel gas is equivalent to 235 TPD of carbon. This carbon is vented to the atmosphere. The diesel and naphtha liquid product contains 1,206 TPD of carbon in their hydrocarbon fuels. This carbon will remain until the fuels are combusted in end use applications after they are shipped from the CBTL plant.
Table 11 shows the overall carbon balance around this CBTL plant in TPD on a carbon basis. The carbon captured in the plant is 88 percent of the non-fuel carbon.
Table 11. CBTL Plant Carbon Balance for 10 wt% Biomass
Input Carbon (TPD) (TPD)
Coal 2926 Woody Biomass 224 Total 3150
Output Carbon (TPD) (TPD)
Selexol Carbon 829 Amine Carbon 849 Fuel Carbon 1206 Stack Gas & Fuel Gas 235 Slag Carbon 31 Total 3150

32
767,114557,58
Table 12 summarizes the inputs and outputs for the CBTL plant. From these the overall plant efficiency is estimated to be 51 percent.
Table 12. Input/Output Summary for CBTL Plant with Woody Biomass/Coal Feed (10 wt% Biomass)
TPD MMBtu/day
Inputs AR Illinois Coal (11667 Btu/#) 4589 107,094
AR Woody Biomass (7524 Btu/#) 510 7,673
Totals 114,767
BPD MMBtu/day
Outputs Naphtha (5.023 MMBtu/bbl) 3,509 17,626
Diesel (5.345 MMBtu/bbl) 7,500 40,088
Power (10 MW) 843
Total Fuels 11,009 58,557
Overall Thermal Efficiency = = 51% (HHV)
Table 13 summarizes the overall carbon debits and credits for the production and transportation of the biomass to the plant, the production and transport of the coal to the plant, and for the carbon conversions that occur within the plant. Referring to Table 13 the total carbon input to the plant is made up of the woody biomass and the coal and is 1,024,383 TPY of carbon. The carbon contained in the biomass is 72,871 TPY. Because this biomass has removed carbon from the biosphere during growth, this carbon can be credited to the system so that the effective input carbon is now 951,512 TPY.
Table 13. Overall Carbon Credits and Debits Woody Biomass 10 wt% Case
# Description Carbon (TPY)
1 Total Carbon In 1,024,383
2 Biomass Carbon 72,871
3 Biomass Production 1,222
4 Biomass Transport 370

33
5 Coal Prod & Transportation 10,588
6 Diesel Transportation 517
7 Power Credit 7,965
8 Sequestered 551,302
9 Total Effective Carbon 404,942
10 Diesel Effective Carbon 281,434
However the production of the biomass requires several operations. These are: planting the poplars, harvesting, fertilizing, irrigating, pesticide treatment, and biomass transportation from the energy crop farm to the CBTL plant. Each of these operations requires the use of fossil fuels and hence there is a carbon penalty associated with each. This was discussed in an earlier section of the report and tabulated in Table 6. The production of the woody biomass from the GREET analysis shows a penalty of 53.5 pounds of carbon dioxide per ton of woody biomass. This does not include the carbon penalty associated with the transportation of the biomass to the plant and does not include any credit for land use change and/or carbon sequestered in the soil.
For the 510 tons per day of woody biomass needed in the CBTL plant the carbon penalty for production is estimated to be 1,222 TPY. To transport this quantity of biomass from the field to the plant the average transportation distance is estimated to be about 22 miles. This is equivalent to 370 TPY of carbon as the transportation penalty.
GREET estimates that the carbon penalty for mining and transporting one ton of coal would be 51.5 pounds of carbon dioxide per ton. This is equivalent to 10,588 TPY for the CBTL coal feed rate of 4,589 TPD.
The estimate for the carbon penalty of transporting the diesel product from the refinery to the point of delivery is estimated to be 517 TPY.
The CBTL plant generates about 10 MW of electric power for sales. If this power were to be generated by using a natural gas combined cycle (NGCC) plant the carbon credit for that amount of power would be 7,965 TPY. Using NGCC as the reference to estimate a power credit is a very conservative approach. If the carbon emissions representing the average power generation mix were to be used, the carbon dioxide credit would be about 70 percent higher. However, this plant (like the others in this study) was designed to minimize export power and this carbon credit is very small compared to other credits and debits. Hence for this study, the reference used for carbon credit does not have a significantly impact the overall results and does not affect the conclusions of the study.
Referring to Figure 4, the carbon captured comes from the Selexol unit and the amine unit in the FT recycle loop. The sum of these carbon values are 1,887 TPD. The recycled carbon dioxide from the Selexol unit used to feed the coal into the gasifier is about 209 TPD. Therefore the total captured carbon per year is 551,302 tons (see Table 13).

34
The overall total effective carbon generated in producing the FT liquid fuels (diesel and naphtha) is then given by adding items 1, 3, 4, 5, and 6 in Table 13. These represent the carbon penalties in the input feed, the production and transporting of the biomass to the plant, the production and transport of the coal to the CBTL plant, and the transport of the liquid products from the plant. The carbon credits are then subtracted from this total. These are the carbon contained in the biomass (2), the carbon captured during the conversion at the plant that is assumed to be sequestered (8), and the electric power credit for the power sales. This gives the total effective carbon for fuels production and utilization from this plant as 404,942 TPY. The portion of this carbon associated with the diesel portion of the FT product is assumed to be equal to the ratio of the weights of the naphtha and diesel product. This is about 0.695. The total effective carbon generated as a result of producing and using the diesel fuel is then 281,434 TPY.
4.4 Comparison with a Reference Petroleum Refinery
Determining the actual carbon emissions from a petroleum refinery is a complex issue. This is because of the large variations in crude quality feedstock to a refinery and because of the different refinery operations in different refineries that produce different final product slates. In this study we did not attempt to independently determine what these carbon emissions would be, instead we relied on emissions results obtained from the current GREET model for diesel fuel produced in a typical refinery.
According to the estimate in the GREET model, the carbon dioxide associated with the production, refining and transportation of crude petroleum to low sulfur diesel is 191.7 pounds of carbon dioxide per barrel. Because of the difference in density, 7,500 BPD FT diesel is equivalent to about 6,896 BPD of petroleum diesel. Therefore the carbon associated with production, refining, and transporting this quantity of crude to diesel will be 59,285 TPY of carbon. The fuel carbon for this quantity of petroleum diesel is approximately equal to 292,540 TPY of carbon. The total diesel effective carbon for the well-to-wheels petroleum crude to diesel use will then be the sum of these, or 351,828 TPY.
Comparing this diesel effective carbon from petroleum with the diesel effective carbon calculated from the CBTL case described above where ten weight percent (seven energy percent) woody biomass is used, the ratio is 281,435/351,828 or eighty percent. Therefore co-processing ten weight percent of woody biomass with the coal at his generic CBTL plant would result in a reduction of twenty percent carbon dioxide compared to a petroleum refinery.
However, because of the uncertainties surrounding the actual carbon emissions from a petroleum refinery and the difficulties in ascribing those emissions relating to the diesel portion of the output we also used a more conservative approach. A recent EPA Emissions Fact Sheet 3 attempted to quantify the greenhouse impacts of renewable and alternative fuels on a standard petroleum refinery. According to the EPA, the analysis presented in chart form in this fact sheet represents the best available information on the impact of these fuels on lifecycle greenhouse emissions. From this analysis it is estimated that a coal-to-liquids plant with carbon capture and storage would have just over three percent more greenhouse gas emissions than the petroleum based fuel that is displaced.

35
In order to use this assumption it was first necessary to simulate a coal-to-liquids plant and estimate the effective diesel carbon associated with the production of the diesel fuel from this plant. This simulated CTL plant was sized to produce the same quantity of diesel fuel as the ten weight percent biomass CBTL plant described above. The CTL plant also had the same overall configuration as the CBTL plant. A summary of the characteristics of this CTL plant is shown in Table 14 and a block flow diagram of the CTL plant is shown in Figure 5. It was estimated that the diesel effective carbon produced from the CTL plant would be 331,778 TPY. Using the EPA assumption that a carbon captured CTL plant emits just over three percent more carbon dioxide than a petroleum refinery; this would make the diesel effective carbon for the petroleum refinery 321,800 TPY.
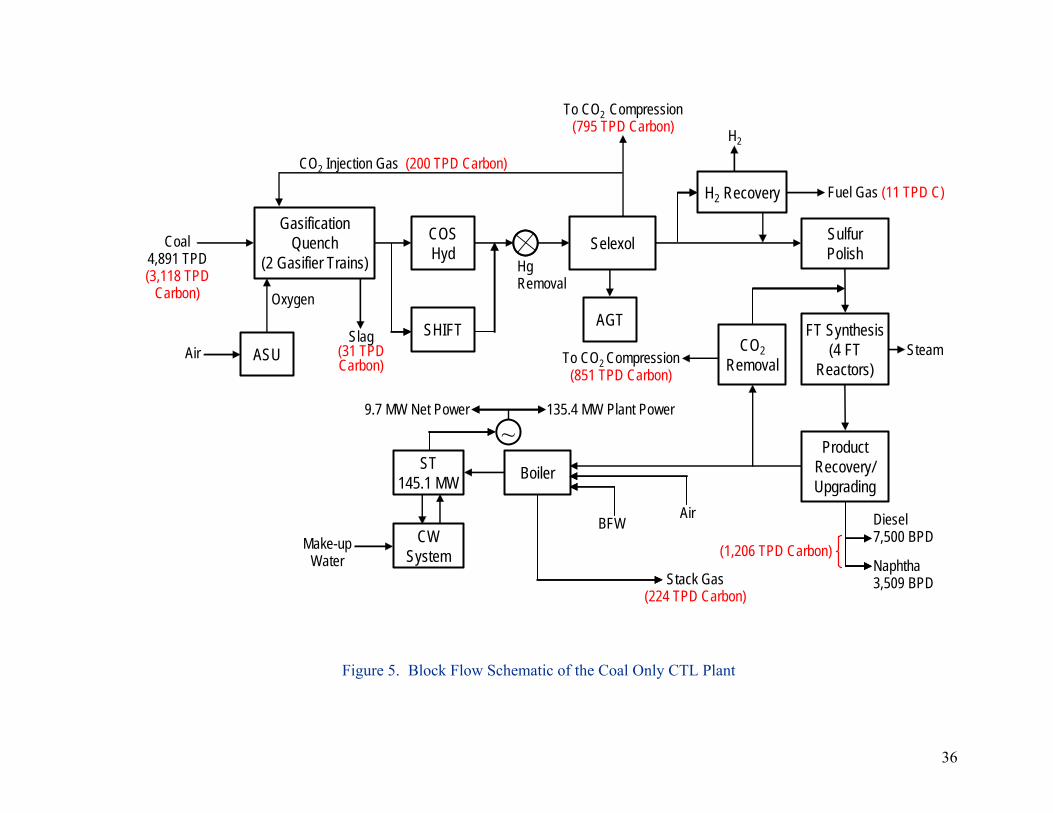
36
Figure 5. Block Flow Schematic of the Coal Only CTL Plant
COS Hyd Selexol
H2 Recovery Fuel Gas (11 TPD C)
HgRemoval
AGT
Sulfur Polish
FT Synthesis(4 FT
Reactors)
Product Recovery/ Upgrading
SHIFT
Diesel7,500 BPD
Naphtha3,509 BPD
CO2RemovalTo CO2 Compression
(851 TPD Carbon)Steam
H2
BFW
BoilerST145.1 MW
CW System
Make-up Water
Stack Gas(224 TPD Carbon)
Coal4,891 TPD (3,118 TPD
Carbon) Oxygen
ASUAir
(1,206 TPD Carbon)
To CO2 Compression(795 TPD Carbon)
Gasification Quench
(2 Gasifier Trains)
Slag(31 TPD Carbon)
135.4 MW Plant Power9.7 MW Net Power
~
CO2 Injection Gas (200 TPD Carbon)
Air

37
≡
≡≡
≡
Table 14. Summary of CTL Only Plant
Coal Input 4,891 TPD (AR) 114,132 MMBtu/day Outputs
Naphtha 3,509 BPD 17,626 MMBtu/day Diesel 7,500 BPD 40,088 MMBtu/day Electric Power 9.7 MW 794 MMBtu/day
58,507 MMBtu/day
Overall Thermal Efficiency =
= 51.26% (HHV)
Carbon Balance TPY
Carbon In 1,014,022 Coal Prod/Transport 11,283 Product Transport 517 Carbon Captured 540,761 Power Credit 7,680 Total Effective Carbon 477,380 Diesel Effective Carbon 331,778
Economic Summary for CTL Plant
Bare Erected Cost $694 MM Total Capital Cost $1,013 MM Capital Cost Per Daily Barrel $92,025 / DB RSP of Diesel $71.23 / bbl Crude Oil Equivalent Cost $54.80 / bbl
The GREET refinery model estimates that the diesel effective carbon refinery emissions associated with the production of petroleum diesel would be as high as 351,828 TPY. The conceptual carbon captured CTL plant in this analysis actually produces about five percent less carbon dioxide than this unsequestered GREET refinery. The reason for this may be because the CTL plant analyzed in this study uses a high efficiency configuration that includes a dry feed entrained flow gasification system with a cold gas efficiency of about eighty percent and advanced slurry phase FT reactors. The basis of the GREET CTL data is unknown.
Additional CBTL cases were then analyzed to determine the percent biomass needed to obtain the twenty percent carbon dioxide reduction goal if the diesel effective carbon for a refinery were to be 321,800 TPY instead of 351,828 TPY as was assumed in the ten weight percent woody
132,114507,58

38
110,115557,58
biomass case described above. For this assumption it was found that a woody biomass input of fifteen percent by weight (ten percent by energy) and 85 percent by weight of coal would give the desired goal of a twenty percent reduction in carbon dioxide compared to a petroleum refinery.
Figure 6 shows a block flow schematic of the fifteen weight percent (ten energy percent) woody biomass case. Referring to Figure 6, 4,429 tons per day (TPD) of Illinois #6 coal and 782 TPD of woody biomass are delivered as received to the plant. The carbon contained in the coal is equivalent to 2,823 TPD and the carbon in the woody biomass is equivalent to 343 TPD. Total carbon input to the plant is therefore 3,166 TPD. Assuming a plant capacity factor of ninety percent (328.5 days per year) and a carbon loss of one percent during feed stock processing, the total carbon input to the plant is 1,029,935 tons per year (TPY).
Table 15 is the input/output summary for this fifteen weight percent woody biomass case and Table 16 summarizes the overall carbon debits and credits for the production and transportation of the biomass to the plant, the production and transport of the coal to the plant, and for the carbon conversions that occur within the plant. The same methodology was used as for the previous ten weight percent (seven energy percent) woody biomass case.
Table 15. Input/Output Summary for CBTL Plant With Woody Biomass/Coal Feed (15 wt% Biomass)
TPD MMBtu/day
Inputs AR Illinois Coal (11,667 Btu/lb) 4429 103,349
AR Woody Biomass (7,524 Btu/lb) 781.6 11,762
Totals 115,111
BPD MMBtu/day
Outputs Naphtha (5.023 MMBtu/bbl) 3,509 17,626
Diesel (5.345 MMBtu/bbl) 7,500 40,088
Power (10 MW) 843
Total Fuels 11,009 58,557
Overall Thermal Efficiency = = 50.87% (HHV)

39
Figure 6. Block Flow Schematic of the 15 wt % (10 energy %) Woody Biomass Case
COS Hyd Selexol
H2 Recovery Fuel Gas (13 TPD C)
HgRemoval
AGT
Sulfur Polish
FT Synthesis(4 FT
Reactors)
Product Recovery/ Upgrading
SHIFT
Diesel7,500 BPD
Naphtha3,509 BPD
Amine CO2
RemovalTo CO2 Compression
(848 TPD Carbon)Steam
H2
BFW
BoilerST150 MW
CW System
Make-up Water
Stack Gas(220 TPD Carbon)
Coal4,429 TPD AR (2,823 Carbon)
Oxygen
ASUAir
(1,206 TPD Carbon)
To CO2 Compression(848 TPD Carbon)
Gasification Quench
(2 Gasifier Trains)
Poplar782 TPD AR (343 Carbon)
Slag(31 TPDCarbon)
140 MW Plant Power10 MW Net Power
~
BiomassCoal
Feedstock Processing and Drying
CO2 Injection Gas (213 TPD Carbon)
Air

40
Referring to Table 16 the total carbon input to the plant is made up of the woody biomass and the coal and is 1,029,936 TPY of carbon. The carbon contained in the biomass is 111,700 TPY. Because this biomass has removed carbon from the biosphere in growing this carbon can be credited to the system so that the effective input carbon is now 918,236 TPY.
For the 782 tons per day of woody biomass needed in the CBTL plant the carbon penalty for production is estimated to be 1,873 TPY. To transport this quantity of biomass from the field to the plant the average transportation distance is estimated to be about 22 miles. This is equivalent to 703 TPY of carbon as the transportation penalty.
GREET estimates that the carbon penalty for mining and transporting one ton of coal would be 51.5 pounds of carbon dioxide per ton. This is equivalent to 10,217 TPY for the CBTL coal feed rate of 4,429 TPD. The estimate for the carbon penalty of transporting the diesel product from the refinery to the point of delivery is estimated to be 517 TPY. The power credit is 8,125 TPY. The total captured carbon per year is 556,932 tons (see Table 16).
The overall total effective carbon generated in producing and using the FT liquid fuels (diesel and naphtha) is then given by adding items 1, 3, 4, 5, and 6 and subtracting 2, 7, and 8 in Table 16. This gives the total effective carbon for fuels production from this plant as 366,489 TPY.
Table 16. Overall Carbon Credits and Debits 15 wt% (10 energy %) Woody Biomass Case
# Description Carbon (TPY)
1 Total Carbon In 1,029,936
2 Biomass Carbon 111,700
3 Biomass Production 1,873
4 Biomass Transport 703
5 Coal Prod & Transportation 10,217
6 Diesel Transportation 517
7 Power Credit 8,125
8 Sequestered 556,932
9 Total Effective Carbon 366,489
10 Diesel Effective Carbon 254,709

41
The portion of this carbon associated with the diesel portion of the FT product is assumed to be equal to the ratio of the weights of the naphtha and diesel product. This is about 0.695. The total effective carbon generated as a result of producing the diesel fuel is then 254,709 TPY.
Comparing this diesel effective carbon from the CBTL plant to the petroleum refinery, that is 254,709/321,800, the reduction is 79.15 percent. This plant configuration with fifteen weight percent (ten energy percent) woody biomass would therefore meet the requirement for a twenty percent smaller well-to-wheels carbon footprint than a petroleum refinery under the assumption that the CTL coal only plant emits just over three percent more carbon dioxide than a conventional petroleum refinery.
4.5 Comparison of Petroleum Naphtha and FT Naphtha
From the carbon balance data in Figure 4 and Table 13, and assuming that the CO2 LCA emissions are apportioned between diesel and naphtha in proportion to product mass fraction, then the CO2 emissions associated with FT naphtha are approximately 788 lbs CO2/bbl. This assumes that the carbon in the FT naphtha is eventually released to the atmosphere. Using the LCA data for petroleum naphtha in Table 2 and correcting for the density difference between FT naphtha and petroleum naphtha, the estimated CO2 emissions associated with petroleum-derived naphtha are estimated as 881 lbs CO2/bbl equivalent FT naphtha. The CO2 footprint of FT naphtha is thus approximately 90% of that for petroleum derived naphtha. This means that the estimate for the required biomass to attain a twenty percent reduction in CO2 emissions is somewhat conservative because the overall reduction in CO2 emissions for all CBTL products is slightly lower than the target goal.
4.6 Sensitivity to FT Product Specifications (Diesel versus Jet Fuel)
The FT reactor model used in this study is based on the Anderson-Schulz-Flory yield model for FT chemistry and tuned using data provided by developers of this technology for reactors designed to produce primarily diesel and naphtha. With additional hydrocracking and greater recycle, the principle products could be jet fuel (e.g., JP-8) and naphtha. However, there are no published reports that show the net yields for these products. It is estimated, based on the differences in boiling fractions and chemical composition between diesel and JP-8 that the yields would be about 60% JP-8 and 40% naphtha. There would be slight increases in the amount of hydrogen required and the amount of auxiliary power for the plant but it would not substantially increase the CO2 emissions from the CTL/CBTL plant. However, there would be a moderate decrease in the CO2 emissions associated with producing JP-8 from a conventional petroleum refinery since there is less energy used in producing this product compared to diesel. However, GREET does not currently estimate GHG emissions for petroleum-derived jet fuel (or kerosene) nor does it have a coal to jet fuel pathway. An approximate sensitivity analysis on the product specification was performed for the 15 wt% woody biomass case. The CO2 emissions associated with the production of JP-8 were estimated as 84% of the CO2 emissions for the production of diesel. This was based on the relative energy requirements for processing kerosene and diesel as reported by Wang22. With the JP-8 yield

42
adjusted to sixty percent, the estimated amount of biomass needed to produce synthetic JP-8 with a 20% less CO2 footprint than petroleum-derived JP-8 was 13.3 wt%. This is a decrease of approximately eleven relative percent over the estimate for diesel fuel. Because of the uncertainties in the estimated properties of synthetic JP-8, the actual amount of biomass needed may be closer to 15%. To be conservative, it is assumed in this study that the amount of biomass needed to produce jet fuel with a 20% reduction in CO2 emissions would be the same as that required for diesel. 4.7 Economic Analysis for Woody Biomass Cases
Table 17 summarizes the capital equipment costs for both the ten and fifteen weight percent woody biomass cases analyzed in this study. For convenience the capital costs are disaggregated into major plant sections. Costs for most of the process units in this CBTL plant were derived from a recent study commissioned by the Southern States Energy Board23.
Table 17. Plant Equipment Costs for 15 wt% and 10 wt% Woody Biomass Cases
15 wt% Woody Biomass
10 wt% Woody Biomass
Coal/Biomass Handling 21 21
Coal & Biomass Prep and Feed 36 35
Plant Water Systems 45 45
Gasification 176 176
Air Separation 74 74
Syngas Cleaning & Shift 104 104
CO2 Removal & Compression 28 28
Ft Synthesis 106 106
Boiler 38 38
Steam Turbine 22 21
Ash/Spent Sorbent Handling 27 27
Accessory Electrical Plant 10 10
Instrumentation & Control 12 12
Site Improvements 12 12
Buildings & Structures 12 12
Bare Erected Cost (MM Dec 2005 $) 723 720

43
Coal and biomass handling and feeding refers to all equipment associated with the storage, reclaiming, conveying, crushing, preparation, drying, and sampling of coal and biomass feeds. The gasification section includes: the coal and biomass feed systems, the gasifiers, quench system, and slag removal. The air separation unit (ASU) is a standard cryogenic system for separation of oxygen and nitrogen. The syngas cleanup system contains several components that remove hydrogen sulfide, carbonyl sulfide, cyanide, ammonia, particulates, mercury, and carbon dioxide. It also includes acid gas treatment to remove hydrogen sulfide and bulk removal of carbon dioxide, sulfur recovery, hydrogen recovery and water gas shift. The carbon dioxide removal and compression includes the amine system for removal of the carbon dioxide in the FT recycle loop, dehydration, and compression of the carbon dioxide to 2,200 psi.
The FT synthesis section includes the FT slurry phase synthesis reactors, catalyst activation, FT product upgrading that includes wax hydrocracking, hydrotreating and product distillation, and hydrocarbon recovery. The power block includes a boiler for production of high pressure steam and a steam turbine. The plant water systems include cooling water systems, boiler feedwater systems, waste water treatment and other plant water treatment systems. The balance of plant includes product tankage, the plant electrical and distribution system, instrumentation and controls, site improvements, and buildings and structures.
Referring to Table 17 the bare erected cost of the ten weight percent (seven energy percent) woody biomass CBTL plant is estimated to be $720 million (MM) and for the fifteen weight percent (ten energy percent) woody biomass case $723 MM.
Table 18 summarizes the additional capital requirements for the plants.
Table 18. Additional Capital Costs for 15 wt% and 10 wt% Woody Biomass Cases (Millions Dec 2005 $)
15% Woody Biomass
10% Woody Biomass
Home Office 61 61
Process Contingency 72 72
Project Contingency 108 108
License Fees 25 25
Financing/Legal 25 25
Non-Depreciable Capital 41 40
Bare Erected Cost 723 720
Total Capital Requirement 1,055 1,051

44
This includes home office costs (mostly front end engineering and design, i.e.: FEED, and detailed engineering design), process contingency and an overall project contingency of fifteen percent of the bare erected cost, license, financing and legal fees, and non-depreciable capital. A large process contingency was applied to the gasification plant (33 percent) because of the modifications considered to be necessary for co-feeding the biomass. An overall project contingency of fifteen percent has been applied to the bare erected cost to reflect the level of project definition for this non-site specific feasibility analysis. With the addition of these costs, the total capital requirement for the ten weight percent (seven energy percent) woody biomass CBTL plant is estimated to be $1,051 MM and $1,055 MM for the fifteen weight percent (ten energy percent) woody biomass case.
Table 19 summarizes the annual operating costs for these CBTL cases. Fixed operating costs include royalties, labor and overhead, administrative labor, local taxes and insurance, and maintenance materials. Variable operating costs include coal and biomass feedstock costs considered to be $35/ton for the as-received Illinois and $70 per dry ton for the woody biomass, catalyst, water and chemicals, and other which is primarily solids disposal costs. The coal cost of $35 per ton is used because of the relative proximity of the CBTL plant to the coal mine and because it is a high sulfur coal. The by product credit refers to sales of recovered sulfur. Net annual operating costs are estimated to be $125 MM annually for the ten weight percent woody biomass case and $129 MM for the fifteen weight percent woody biomass case. There are no purchases of electricity because all power required is generated on site. The small quantities of natural gas required for start up are not included.
Table 19. Annual Operating Costs for 15% and 10% Woody Biomass Cases (Millions Dec 2005 $)
Plant Configuration 15 wt% Woody
Biomass 10 wt% Woody
Biomass Royalties 4 4 Coal 51 53 Catalyst/Chemicals 8 8 Labor/Overhead 20 20 Administrative 3 3 Local Tax & Insurance 20 20 Maintenance & Materials 8 8 Biomass 15 10 Other 3 2 Gross Annual Operating Cost 132 128 By Product Credits 3 3 Net Annual Operating Cost 129 125

45
Table 20 summarizes the economics for these cases. The capital cost of the ten weight percent woody biomass CBTL plant in terms of capital dollars per daily barrel (DB) of fuels produced is estimated to be about $95,486/DB and for the fifteen weight percent woody biomass case is $95,822/DB. The annual revenue required is the sum of the capital cost component, the operating and maintenance cost, and the feedstock costs. This amounts to $252 million for the ten weight percent biomass case and $257 million for the fifteen weight percent case. It is assumed that the value of the electric power is $35.6/MWH and that the naphtha is sold at 77% of the diesel price on a per barrel basis. The required selling price (RSP) of the FT diesel fuel is estimated to be about $75.19/bbl for the ten weight percent case and $76.58/bbl for the fifteen weight percent case. On a crude oil equivalent basis the cost is reduced to $57.84/bbl for the ten weight percent case and $58.91/bbl for the fifteen weight percent case. A factor of 1.3 is used to convert to crude oil equivalent based on an average price ratio of low sulfur CARB diesel to West Texas Intermediate crude oil. The RSPs were calculated using a discounted cash flow analysis with the economic assumptions shown in Table 21. For the ten weight percent woody biomass case a sensitivity case was analyzed to determine the impact on the cost of fuels of adding a cost of $4.60 per metric tonne for the transportation, sequestering, and monitoring of the captured carbon dioxide. The cost of $4.60 was estimated by NETL. When this cost is added the RSP on a COE basis increases from $57.84/barrel to $58.90/barrel; an increase of 1.8 percent. It is reasonable to believe that the costs of all the other cases will increase by a similar amount when accounting for this additional cost.
Table 20. Economic Summary for 15 wt% and 10 wt% Woody Biomass Cases
15 wt% 10 wt% Capital $/DB $ 95,822 $ 95,486 $/bbl Basis $/bbl Basis Capital ($MM/yr) 130.39 38.92 129.93 38.78 O&M ($MM/yr) 63.00 18.80 62.00 18.51 Biomass 15.00 4.48 9.80 2.93 Coal ($MM/yr) 51.00 15.22 53.00 15.82 Total ($MM/yr) 259.39 77.42 254.73 76.03 Power Credit ($MM/yr) 2.81 0.84 2.81 0.84 256.58 76.58 251.92 75.19 Annual Revenue Required
($MM/yr) 256.58 251.92
RSP Diesel ($/bbl) 76.58 75.19 EQ Diesel (bbl/yr) 3,350,372 3,350,372
RSP COE ($/bbl) 58.91 57.84

46
Table 21. Economic Assumptions for DCF Analyses
Return on Equity (ROE) 15%
Plant Life 25 years
Depreciation (DDB) 16 years
Debt 66%
Debt Interest 8%
Term 20 years
General Inflation 3%
Tax Rate 36%
4.8 Case Details of Switchgrass and Corn Stover Biomass CBTL Plants Meeting 20 Percent Lower Carbon Footprint Criteria than Petroleum Refining
The overall CBTL configuration for both the switchgrass and corn stover biomass cases are almost identical to the woody biomass configurations described in detail above. The only difference is in the front end processing of the biomass feeds. There is little if any actual experience in feeding these types of biomass feeds to high pressure entrained gasifiers. Therefore it is assumed in this study that successful feeding can be accomplished although it is expected that more R&D into this area will be needed.
A schematic of the proposed switchgrass and corn stover processing system is shown in Figure 7. This system was used at the Alliant Energy project for direct injection of switchgrass at the Ottumwa Generating station in Iowa. It is assumed that the switchgrass and corn stover are delivered to the plant in three foot by four foot by eight foot bales weighing about 1,000 pounds. These are stored in a covered building at the plant site to keep the feed dry. For gasifying, the bales are taken from storage and conveyed to a de-baler where the bales are broken up into loose grass and biomass stover. The grinding of the biomass is assumed to be accomplished in a commercially available collision mill called the eliminator. In the eliminator the biomass is reduced in size to less than 1 inch minus by colliding the biomass particles together in the mill. As the rate of biomass feed is increased to the mill the average size of the particles is reduced. A negative pressure is maintained on the mill to minimize release of dust. The ground biomass is collected in baghouses. An enclosed tube conveyer transports the processed biomass to a surge bin where screw feeders or augers move the biomass into a pneumatic transport system and then into the gasifier feed system. Carbon dioxide can be used as the transport gas.

47
Figure 7. Schematic of Switchgrass and Corn Stover Prep System
Simulations using the spreadsheet computer model identified a case where co-gasifying a mix of twelve weight percent (seven energy percent) switchgrass and 88 percent coal on an as-received basis would achieve the twenty percent carbon dioxide goal. That is, the carbon emissions are twenty percent lower than the GREET case petroleum refinery. Figure 8 shows a block flow schematic of this case. Apart from the front end biomass processing the CBTL plant configuration is identical to the previously described woody biomass cases.
The analysis methodology is identical to the woody biomass cases and will not be described again only the results will be given. Table 22 shows the overall carbon credits and debits for this case. The overall efficiency for this case is calculated to be 50.8 percent on an HHV basis.
Referring to Table 22 the total carbon input to the plant is made up of the switchgrass biomass and the coal and is 1,024,023 TPY of carbon. The carbon contained in the biomass is 73,610 TPY. For the 625 tons per day of switchgrass needed in the CBTL plant the carbon penalty for production is estimated to be 2,761 TPY. To transport this quantity of biomass from the field to the plant the average transportation distance is estimated to be about 22 miles. This is equivalent to 503 TPY of carbon as the transportation penalty. The carbon penalty for mining and transporting the coal is 10,575 TPY for the CBTL coal feed rate of 4,584 TPD.
The estimate for the carbon penalty of transporting the diesel product from the refinery to the point of delivery is estimated to be 517 TPY. The power credit is 8,298 TPY. The total captured carbon per year is 551,299 tons.
The overall total effective carbon generated in producing and using the FT liquid fuels (diesel and naphtha) is then given by adding items 1, 3, 4, 5, and 6 and subtracting 2, 7, and 8 in Table 22. This gives the total effective carbon for fuels production from this plant as 405,172 TPY. And the total effective carbon generated as a result of producing and using the diesel fuel is 281,590 TPY. Comparing this diesel effective carbon from the CBTL plant to the petroleum refinery, that is 281,590/351,840, the reduction is eighty percent. This plant configuration with the twelve weight percent (seven energy percent) switchgrass would therefore meet the requirement for a twenty percent smaller carbon footprint than the GREET baseline petroleum refinery.
Bales
De-Baler Eliminator
Transport Gas
BaghouseFilter
Blower
Surge Bin
to Gasifier Feed
Bales
De-Baler Eliminator
Transport Gas
BaghouseFilter
Blower
Surge Bin
to Gasifier Feed

48
Figure 8. Block Flow Schematic of the 12 wt % (7 energy %) Switchgrass Case
COS Hyd Selexol
H2 Recovery Fuel Gas (13 TPD C)
HgRemoval
AGT
Sulfur Polish
FT Synthesis(4 FT
Reactors)
Product Recovery/ Upgrading
SHIFT
Diesel7,500 BPD
Naphtha3,509 BPD
CO2RemovalTo CO2 Compression
(839 TPD Carbon)Steam
H2
BFW
BoilerST150.4 MW
CW System
Make-up Water
Stack Gas(219 TPD Carbon)
Coal4,584 TPD AR (2,922 Carbon)
Oxygen
ASUAir
(1,206 TPD Carbon)
To CO2 Compression(840 TPD Carbon)
Gasification Quench
(2 Gasifier Trains)
Switchgrass625 TPD AR(226 Carbon)
Slag(31 TPD Carbon)
140 MW Plant Power10.5 MW Net Power
~
BiomassCoalFeedstock
Processing
CO2 Injection Gas (213 TPD Carbon)
Air

49
Table 22. Overall Carbon Credits and Debits 12 wt% Switchgrass Case
# Description Carbon (TPY)
1 Total Carbon In 1,024,023
2 Biomass Carbon 73,610
3 Biomass Production 2,671
4 Biomass Transport 503
5 Coal Prod & Transportation 10,575
6 Diesel Transportation 517
7 Power Credit 8,298
8 Sequestered 551,299
9 Total Effective Carbon 405,172
10 Diesel Effective Carbon 281,594
11 Overall Efficiency 50.8% (HHV)
The case for corn stover is very similar to the switchgrass case. Figure 9 shows the block flow schematic for the twelve weight percent (seven energy percent) corn stover and 88 weight percent coal case on an as-received basis. Again it was determined from the computer simulation that this mix of corn stover biomass and coal would achieve the required twenty percent carbon footprint reduction compared to the GREET petroleum refinery case.
Again the analysis methodology is identical to that of the switchgrass and woody biomass cases and will not be described again. Only the results will be given. Table 23 shows the overall carbon credits and debits for this case. The overall efficiency for this case is calculated to be 50.9 percent on an HHV basis.
Referring to Table 23 the total carbon input to the plant is made up of the corn stover and the coal and is 1,029,499 TPY of carbon. The carbon contained in the biomass is 77,060 TPY. For the 626 tons per day of corn stover needed in the CBTL plant the carbon penalty for production is estimated to be 2,063 TPY. To transport this quantity of biomass from the field to the plant the average transportation distance is estimated to be about 22 miles. This is equivalent to 250 TPY of carbon as the transportation penalty. The carbon penalty for mining and transporting the coal is 10,598 TPY for the CBTL coal feed rate of 4,594 TPD.

50
Figure 9. Block Flow Schematic of the 12 wt % (7 energy %) Corn Stover Case
COS Hyd Selexol
H2 Recovery Fuel Gas (13 TPD C)
HgRemoval
AGT
Sulfur Polish
FT Synthesis(4 FT
Reactors)
Product Recovery/ Upgrading
SHIFT
Diesel7,495 BPD
Naphtha3,507 BPD
CO2Removal
To CO2 Compression(850 TPD Carbon)
Steam
H2
BFW
BoilerST151.3 MW
CW System
Make-up Water
Stack Gas(215 TPD Carbon)
Coal4,594 TPD AR (2,923 Caron)
Oxygen
ASUAir
(1,206 TPD Carbon)
To CO2 Compression(844 TPD Carbon)
Gasification Quench
(2 Gasifier Trains)
Corn Stover626 TPD AR (237 Carbon)
Slag(32 TPD Carbon)
140.2 MW Plant Power
~11.1 MW Net Power
CoalFeedstock Processing
Biomass
Air
CO2 Injection Gas (214 TPD Carbon)

51
The estimate for the carbon penalty of transporting the diesel product from the refinery to the point of delivery is estimated to be 517 TPY. The power credit is 8,829 TPY. The total captured carbon per year in the CBTL plant is 556,403 tons.
Table 23. Overall Carbon Credits and Debits for 12 wt% Corn Stover Case
# Description Carbon (TPY)
1 Total Carbon In 1,029,499
2 Biomass Carbon 77,060
3 Biomass Production 2,063
4 Biomass Transport 250
5 Coal Prod & Transportation 10,598
6 Diesel Transportation 517
7 Power Credit 8,829
8 Sequestered 556,403
9 Total Effective Carbon 400,635
10 Diesel Effective Carbon 278,441
11 Overall Efficiency 50.9% (HHV)
The overall total effective carbon generated in producing and using and using the FT liquid fuels (diesel and naphtha) is then given by adding items 1, 3, 4, 5, and 6 and subtracting 2, 7, and 8 in Table 23. This gives the total effective carbon for fuels production from this plant as 400,635 TPY. And the total effective carbon generated as a result of producing and using the diesel fuel is 278,440 TPY.
Comparing this diesel effective carbon from the CBTL plant to the petroleum refinery, that is 278,440/351,840, the reduction is 79 percent. This plant configuration with the twelve weight percent (seven energy percent) corn stover would therefore meet the requirement for a twenty percent smaller carbon footprint than the GREET baseline petroleum refinery.
The cases described above for the switchgrass and corn stover were compared to the GREET analysis petroleum refinery emissions of carbon dioxide. If they are compared to the more conservative refinery case where we assumed that the CTL coal only plant emitted just over three percent higher carbon dioxide than a petroleum refinery then the percentages of switchgrass required to achieve the twenty percent reduction goal would

52
be increased from twelve weight percent (seven energy percent) to seventeen weight percent (ten energy percent) of the feed. Similarly for the corn stover case the percentage would be increased from twelve weight percent (seven energy percent) to eighteen weight percent (eleven energy percent) to attain the reduction goal.
4.9 Economic Analysis for Switchgrass and Corn Stover Cases
Table 24 summarizes the capital equipment costs for both the twelve weight percent switchgrass and twelve weight percent corn stover cases. As before, for convenience the capital costs are disaggregated into major plant sections.
Referring to Table 24 the bare erected cost of the twelve weight percent switchgrass CBTL plant is estimated to be $725 million (MM) and for the twelve weight percent corn stover plant the estimate is also $725 MM.
Table 24. Plant Equipment Costs for 12% Switchgrass and 12% Corn Stover Cases
12 wt% Switchgrass
12 wt% Corn Stover
Coal/Biomass Handling 21 21
Coal & Biomass Prep and Feed 36 36
Plant Water Systems 45 45
Gasification 176 176
Air Separation 74 74
Syngas Cleaning & Shift 104 104
CO2 Removal & Compression 28 28
Ft Synthesis 106 106
Boiler 38 38
Steam Turbine 22 22
Ash/Spent Sorbent Handling 29 29
Accessory Electrical Plant 10 10
Instrumentation & Control 12 12
Site Improvements 12 12
Buildings & Structures 12 12
Bare Erected Cost (MM Dec 2005 $) 725 725

53
Table 25 summarizes the additional capital requirements for the plants. With the addition of these costs, the total capital requirement for both the twelve weight percent switchgrass CBTL plant and the twelve weight percent corn stover plant is $1,057 MM.
Table 25. Additional Capital Costs for Switchgrass and Corn Stover Cases (MM Dec 2005 $)
12% Switchgrass
12% Corn Stover
Home Office 61 61
Process Contingency 73 73
Project Contingency 108 108
License Fees 25 25
Financing/Legal 25 25
Non-Depreciable Capital 40 40
Bare Erected Cost 725 725
Total Capital Requirement 1,057 1,057
Table 26 summarizes the annual operating costs for these CBTL cases. Fixed operating costs include royalties, labor and overhead, administrative labor, local taxes and insurance, and maintenance materials. Variable operating costs include coal and biomass feedstock costs considered to be $35/ton for the Illinois #6 coal as received and $55 per dry ton for the switchgrass and $40 per ton dry for the corn stover, catalyst, water and chemicals, and other which is primarily solids disposal costs. The by product credit refers to sales of recovered sulfur. Net annual operating costs are estimated to be $124 MM annually for the twelve weight percent switchgrass case and $123 MM for the twelve weight percent corn stover case. Again there are no purchases of electricity because all power required is generated on site. The small quantities of natural gas required for start up are not included.
Table 27 summarizes the economics for these cases. The capital cost of the twelve weight percent switchgrass CBTL plant in terms of capital dollars per daily barrel (DB) of fuels produced is estimated to be about $96,080/DB and for the twelve weight percent corn stover case is $95,990/DB. The required selling price (RSP) of the FT diesel fuel is estimated to be $75.31/bbl for the twelve weight percent switchgrass case and $74.78/bbl for the twelve weight percent corn stover case. On a crude oil equivalent basis the cost is reduced to $57.93/bbl for the twelve weight percent switchgrass case and $57.52/bbl for the twelve weight percent corn stover case.

54
Table 26. Annual Operating Costs for Switchgrass and Corn Stover Cases
Plant Configuration 12% Switchgrass 12% Corn Stover
Royalties 4 4
Coal 53 53
Catalyst/Chemicals 8 8
Labor/Overhead 20 20
Administrative 3 3
Local Tax & Insurance 19 20
Maintenance & Materials 8 8
Biomass 9 7
Other 3 3
Gross Annual Operating Cost 127 126
By Product Credits 3 3
Net Annual Operating Cost 124 123
Table 27. Economic Summary for 12% Switchgrass and 12% Corn Stover Cases
12% Switchgrass 12% Corn Stover
Capital $/DB $ 96,080 $ 95,990
$/bbl Basis $/bbl Basis $/bbl Basis
Capital ($MM/yr) 130.74 39.02 130.61 38.99
O&M ($MM/yr) 62.00 18.51 63.00 18.80
Biomass 9.40 2.81 7.00 2.09
Coal ($MM/yr) 53.00 15.82 53.00 15.82
Total ($MM/yr) 255.14 76.15 253.61 75.70
Power Credit ($MM/yr) 2.81 0.84 3.09 0.92
252.33 75.31 250.53 74.78
Annual Revenue Required ($MM/yr) 252.33 250.53
RSP Diesel ($/bbl) 75.31 74.78
EQ Diesel (bbl/yr) 3,350,372 3,350,372
RSP COE ($/bbl) 57.93 57.52

55
5 Roadmap for 100,000 BPD Industry
5.1 National Scope Resource Assessment
On a national level, various assessments have been made regarding the amount of biomass that could be available for energy production. A joint study by DOE and the U.S. Department of Agriculture (USDA) in 200524 suggests that an annual biomass supply (including forestry and forest product residues, agriculture residues, urban wastes, and dedicated energy crops) of 1.3 billion dry tons is technically feasible. Approximately 256 million dry tons of which is corn stover and 377 million dry tons is energy crops such as switchgrass and poplars. Additionally, a 1999 study by ORNL25 suggests that over 500 million dry tons of biomass could potentially be available in the United States at delivered prices between $55 and $65/dry ton ($2006), over 330 million of which is agricultural residues or energy crops (i.e., switchgrass, poplars, or other).
More recently, the previously cited study by the University of Tennessee analyzed two scenarios where biomass plays a more significant role in the nation’s total energy future and results in 1-1.3 billion dry tons of biomass being available nationwide by 2025. Figure 10 shows one scenario of the quantity and location of crop residues (such as corn stover) and dedicated energy crops (such as switchgrass and poplar trees) that may be available throughout the nation between 2010 and 2025.
In the near-term (~2015), the greatest concentration of crop residues and dedicated energy crops are located in Illinois, Iowa, and other Midwestern states. For near-term applications, it is more likely that the central United States would be the site of first adoption for CBTL plants because of greater availability of biomass and close proximity to Illinois coal basins. Longer term (~2025), crop residues and dedicated energy crops are widely available throughout the United States with the highest concentrations located in the central, eastern, and southeastern sections of the country.
From these studies, one can conclude that a significant amount of biomass feedstock may exist and that, on a national level, the ability to produce 100,000 barrels/day of fuel should not be constrained by the availability of the biomass resource.
5.2 Analysis of Plant Capacity Feasibility
It is assumed that corn stover can be harvested wherever corn is grown and that there are no technical barriers to its collection. It is likely that if corn stover becomes a widely used energy feedstock, it will stimulate the development of harvesting machinery that will collect and bale the stover at the same time that the corn crop is harvested. Current practice requires a second collection pass over the corn fields. It is assumed that the limit for the amount of stover that can be economically collected is limited by the transportation costs. As the collection radius increases, the transportation cost increases but the plant size also increases (by the square of the collection radius) and there is a cost savings resulting from economies of scale. An economic limit for the collection radius would be the point at which the incremental transportation cost just equaled the cost savings from economies of scale.

56
Figure 10. Distribution of Cellulosic Feedstock from Crop Residues and Dedicated Energy Crops
Source: English, Burton C., et al., University of Tennessee Agricultural Economics, 25% Renewable Energy for the United States by 2025: Agricultural and Economic Impacts, November 2006. The figures shown are from the “All Energy” Scenario.

57
An approximation for the economies of scale can be obtained from the data in the SSEB report23 which gives the estimated required selling price for diesel at three plant capacities. Using the data in Table 5, the transportation cost function in Figure 1, the conservative estimate of the amount of corn stover needed to meet the CO2 emissions target (18 wt % or 11 energy % corn stover), and the economies of scale function derived from the SSEB data, the economic optimum transportation distance was calculated as 106 miles. The corresponding collection area could supply enough corn stover for a plant more than ten times larger than the reference plant. If a conservative transportation distance of 50 miles is used, based on the data in Table 5, this corresponds to a plant size of approximately 40,000 bpd diesel requiring approximately 5,000 tons/day of biomass and a collection area of 4,600 square miles for sustained operations. Up to three plants of this size could be built in Illinois. A similar analysis gives the economic optimum transportation distance as 109 miles and 108 miles for woody biomass and switchgrass, respectively. Again using the conservative limit of 50 miles for the transportation distance provides enough woody biomass or switchgrass for a 30,000 bpd diesel plant. One plant of that capacity could be built in Illinois. 5.3 Hypothetical Timelines for Target FT Diesel Production Level
Table 28 presents a set of four hypothetical timelines for the build-up of a CBTL industry capable of supplying 100,000 BPD of FT diesel. Each timeline shows an initial period dedicated to permitting and the design of the facility followed by a construction period and then plant operation. During plant operation, a ramp-up scenario is applied to the first 1-2 years of operation allowing for shakedown. The cumulative diesel production rate for each timeline is plotted on Figure 11.
The choice of biomass types is somewhat arbitrary but in each scenario the first plants are assumed to use corn stover as it is already available. The entry of CBTL plants that use switchgrass or woody biomass occurs in 2015 or later allowing sufficient time for cultivation and maturity of these crops.
The first hypothetical timeline is conservative and assumes that one developer will enter the market and begin the permitting and design process in 2008. Two years are allotted for this phase followed by a four year construction period. The plant begins producing product in 2014 with a first year capacity factor of 50% of maximum and a second year capacity factor of 90% of maximum followed by sustained operations at the rated plant capacity. As with all of the timelines, corn stover was selected as the biomass for the first of a kind plant.
After a full year of operation, work begins on the second generation plant of double the original capacity. The second generation plant is expected to require only one year for design and permitting and only three years for construction. It is assumed that a second developer will enter the market at the time that the first developer starts the second generation plant. This developer focuses on the two other biomass types.

58
Ramp-up to 100,000 BPD - Conservative RD&D Path
Feed Developer BPD 2008 2009 2010 2011 2012 2013 2014 2015 2016 2017 2018 2019 2020 2021 2022 2023 2024 2025 2026CS 1 7,500 3,750 6,750 7,500 7,500 7,500 7,500 7,500 7,500 7,500 7,500 7,500 7,500 7,500CS 1 15,000 13,500 15,000 15,000 15,000 15,000 15,000 15,000 15,000SG 2 15,000 7,500 13,500 15,000 15,000 15,000 15,000
SRWC 2 10,000 5,000 9,000 10,000 10,000 10,000 10,000CS 1 25,000 22,500SG 2 15,000 13,500
SRWC 2 20,000 18,0003,750 6,750 7,500 7,500 7,500 21,000 22,500 35,000 45,000 47,500 47,500 47,500 101,500
Ramp-up to 100,000 BPD - Accelerated Scale-up
Feed Developer BPD 2008 2009 2010 2011 2012 2013 2,014 2015 2016 2017 2018 2019 2020 2021 2022 2023 2024 2025 2026CS 1 7,500 3,750 6,750 7,500 7,500 7,500 7,500 7,500 7,500 7,500 7,500 7,500 7,500 7,500 7,500CS 2 15,000 7,500 13,500 15,000 15,000 15,000 15,000 15,000 15,000 15,000 15,000 15,000 15,000 15,000 15,000CS 3 15,000 7,500 13,500 15,000 15,000 15,000 15,000 15,000 15,000 15,000 15,000 15,000 15,000 15,000 15,000SG 1 15,000 7,500 13,500 15,000 15,000 15,000 15,000 15,000 15,000 15,000 15,000
SRWC 2 30,000 15,000 27,000 30,000 30,000 30,000 30,000 30,000 30,000CS 3 50,000 25,000 45,000 50,000 50,000 50,000 50,000 50,000
33,750 37,500 37,500 45,000 51,000 67,500 104,500 127,500 132,500 132,500 132,500 132,500 132,500
Ramp-up to 100,000 BPD - Accelerated Deployment
Feed Developer BPD 2008 2009 2010 2011 2012 2013 2014 2015 2016 2017 2018 2019 2020 2021 2022 2023 2024 2025 2026CS 1 7,500 3,750 6,750 7,500 7,500 7,500 7,500 7,500 7,500 7,500 7,500 7,500 7,500 7,500CS 2 7,500 3,750 6,750 7,500 7,500 7,500 7,500 7,500 7,500 7,500 7,500 7,500 7,500 7,500CS 3 7,500 3,750 6,750 7,500 7,500 7,500 7,500 7,500 7,500 7,500 7,500 7,500 7,500 7,500CS 1 15,000 7,500 13,500 15,000 15,000 15,000 15,000 15,000 15,000 15,000CS 2 15,000 7,500 13,500 15,000 15,000 15,000 15,000 15,000 15,000 15,000CS 3 22,500 11,250 20,250 22,500 22,500 22,500 22,500 22,500 22,500 22,500SG 1 7,500 3,750 6,750 7,500 7,500 7,500 7,500 7,500 7,500 7,500SG 2 7,500 3,750 6,750 7,500 7,500 7,500 7,500 7,500 7,500 7,500
SRWC 1 10,000 5,000 9,000 10,000 10,000 10,000 10,000 10,000 10,000 10,000SRWC 2 10,000 5,000 9,000 10,000 10,000 10,000 10,000 10,000 10,000 10,000
11,250 20,250 22,500 22,500 66,250 101,250 110,000 110,000 110,000 110,000 110,000 110,000 110,000
Ramp-up to 100,000 BPD - Compressed Schedule
Feed Developer BPD 2008 2009 2010 2011 2012 2013 2014 2015 2016 2017 2018 2019 2020 2021 2022 2023 2024 2025 2026CS 1 7,500 3,750 6,750 7,500 7,500 7,500 7,500 7,500 7,500 7,500 7,500 7,500 7,500 7,500 7,500 7,500CS 1 7,500 3,750 6,750 7,500 7,500 7,500 7,500 7,500 7,500 7,500 7,500 7,500 7,500 7,500 7,500 7,500CS 2 15,000 13,500 15,000 15,000 15,000 15,000 15,000 15,000 15,000 15,000 15,000 15,000 15,000SG 2 15,000 13,500 15,000 15,000 15,000 15,000 15,000 15,000 15,000 15,000 15,000 15,000 15,000SG 1 15,000 15,000 15,000 15,000 15,000 15,000 15,000 15,000 15,000 15,000 15,000 15,000CS 2 22,500 20,250 22,500 22,500 22,500 22,500 22,500 22,500 22,500 22,500 22,500 22,500
SRWC 2 22,500 20,250 22,500 22,500 22,500 22,500 22,500 22,500 22,500 22,500 22,500 22,5007,500 13,500 15,000 42,000 100,500 105,000 105,000 105,000 105,000 105,000 105,000 105,000 105,000 105,000 105,000
CS = Corn StoverSG = SwitchgrassSRWC = Short Rotation Woody Crops
operation
Total
Total
Total
Total
design and permittingconstruction
Table 28. Hypothetical Timelines for Ramp-Up for CBTL Industry

59
Figure 11. Cumulative Diesel Production For Hypothetical CBTL Ramp-up Timelines
0
20,000
40,000
60,000
80,000
100,000
120,000
140,000
2008 2010 2012 2014 2016 2018 2020 2022 2024 2026
Cum
ulat
ive
Die
sel P
rodu
ctio
n (B
PD)
Conservative PathRapid Scale-upRapid DeploymentRapid DevelopmentTarget
After these new plants have been in operation for a year, work begins on a set of third generation plants beginning in 2022 which come on-line in 2026. This scenario represents a conservative view to the build-up of the CBTL industry but it is a reasonable one barring a steep escalation in the crude oil price or the implementation of any incentive programs by the government. Under this scenario, the Air Force target goal of 100,000 BPD of domestic synthetic fuels will not be met using CBTL technology until 2026.
In order to meet the target production rate of 100,000 BPD diesel, the ramp-up will have to be substantially accelerated and this will likely require one or more incentive programs from the government. The second and third timelines in Table 28 and Figure 11 represent accelerated scenarios that come much closer to meeting the target production goal by 2016. In scenario 2, the movement to large scale plants occurs rapidly. Large capacity plants have significant economies of scale, at least up to the size of 80,000 BPD total product but still require extremely large capital investments. The likelihood of this scenario could be increased through loan guarantee incentives. In scenario 3, the deployment of the technology occurs rapidly. This can occur by having more developers enter the market or by having developers build a greater number of plants. The likelihood of this scenario could be increased through incentives that guarantee a floor price and/or market for the product diesel. Scenario 2 attains only 23% of the target production by 2016 but meets the target level a year earlier than scenario 3, in 2019.

60
Scenario 3 attains 38% of the target production by 2016 and meets the target level by 2020.
In order to meet the target production level of 100,000 BPD diesel by 2016, an even more aggressive development timeline will be needed. This could be accomplished by either a combination of the accelerated deployment and accelerated scale-up scenarios or by compressing the design and construction timelines and elimination of the learning period between the completion of one plant and the beginning of construction of the next plant. Such a hypothetical scenario is shown as the fourth timeline in Table 28 and Figure 11. The likelihood of this scenario could be increased through time-limited diesel floor price guarantees.

61
6 Conclusions and Recommendations
The primary conclusion of this report is it is feasible to use the CBTL process to produce diesel fuel and meet the Air Force goal of production with 20% less CO2 emissions than equivalent fuel derived from a conventional petroleum refinery. Specifically, it was found that the CO2 emissions goal could be attained using a mixture containing 10-15 wt% (7-10 energy %) woody biomass, or 12-18 wt% (7-10 energy %) switchgrass or 12-18 wt% (7-11 energy %) corn stover. These three biomass types are advantageous in that their use does not directly affect the food supply.
As part of this study, a scoping level economic analysis was performed for the coal-only plant and the CBTL plants. Based on the economic parameters used in this study, the required selling price (RSP) of the diesel product was estimated to be about $71/barrel for the coal-only plant. On a crude oil equivalent basis this would be about $55/bbl. For the woody biomass CBTL plants the RSP, on a crude oil equivalent basis was estimated to be $58-59/bbl or about seven percent higher than the coal-only case. For the corn stover and switchgrass plants the RSP on a crude oil equivalent basis was estimated to be about $58/bbl.
Some sources, including GREET, indicate that dedicated energy crops including short rotation woody biomass and switchgrass could further reduce the CO2 footprint of a CBTL plant. If the full soil carbon credit can be realized, it would be possible to meet the CO2 reduction goal with as little as 5-10% by weight woody biomass.
All three biomass types examined in this study showed nearly equivalent performance in the CBTL process. Regional land availability will be the most important determinant of which biomass type to use for a specific site.
The reference plant studied was a 7,500 BPD diesel plant located in southern Illinois. This plant size was chosen somewhat arbitrarily based on a preliminary and highly approximate estimate for the amount of biomass that may be required. The report does not suggest that 7,500 BPD is either the maximum or optimum size for a CBTL plant. It was shown that larger plants of at least 30,000 BPD are feasible based on biomass resource availability. It is left as a recommendation for further work to perform a more detailed biomass resource and infrastructure assessment which would be needed to determine the maximum CBTL plant size that is technically feasible and to determine the optimum plant size for which economies of larger scale balance the increased cost of collecting larger quantities of biomass.
Multiple scenarios were presented with timelines for the build up of a CBTL industry. In the most conservative scenario, the production goal of 100,000 BPD is not attained until 2026. Incentives could stimulate the development of the industry. An aggressive hypothetical production ramp-up was prepared for the construction of seven CBTL facilities that would meet the DoD goal of obtaining 100,000 BPD of synthetic fuel by 2016. The ramp-up assumes that the first two plants will be small 7,500 BPD facilities of the same design as the reference plant. These first plants will use corn stover since this

62
type of biomass is currently available. It is assumed that over time, more plants will be constructed simultaneously; future plants will be larger in capacity (up to 22,500 BPD) and shake down periods for start-up will grow shorter. These later plants would use mixtures of switchgrass, corn stover, and woody biomass. Although specific plant locations were not proposed, a national biomass resource assessment has forecast that there will be abundant quantities of suitable biomass available in multiple geographic regions in the U.S. by 2016 and that the hypothetical ramp-up is feasible with respect to resource availability.
The concept of using both coal and biomass together to produce high quality FT fuels via gasification should be advantageous to both coal and biomass to energy technologies. Co-processing biomass with coal can significantly reduce the carbon footprint of a CTL facility and the gasification route allows non-food product biomass like cellulose and lignin to be used for energy production. The use of coal with biomass significantly improves the economies of scale compared to a BTL facility and also dampens the impact of biomass supply fluctuations.
However, it must be cautioned that there is very little actual field data available on pressurized gasification of biomass in entrained systems. Because of this, considerable RD&D will be needed to determine the pretreatment and optimum type of feed system needed to enable reliable feeding of these biomass types to high pressure gasification systems. Biomass gasification using high temperature and pressure entrained flow gasifiers would be preferable to lower temperature gasification systems to eliminate tar and methane formation from the biomass. Also the CBTL plants would be simpler and less costly if the same gasifier could be used to process both the coal and the biomass. Separate feed systems for coal and biomass may also be preferable so that, if there are problems with the biomass feed system, the gasifier can be kept operating using coal.
Clearly RD&D should be undertaken to prove the viability of the concept of coal/biomass co-gasification in pressurized entrained flow of transport type gasifiers. Issues that should be investigated include the necessary preparation of the biomass, the optimum feeding techniques for biomass and coal to pressurized gasifiers, and the impact of the biomass on the gasification process.
To demonstrate commercial feasibility of the CBTL concept it is recommended that commercial scale prototype plants be constructed. These should be of sufficient size to prove the commercial scale operation of the gasifiers and to produce sufficient fuels for testing. The plants should be used to investigate the performance on different coals and different biomass types.
Because biomass availability is often seasonal for some crops it is recommended that any CBTL plant have processing equipment on site that is suitable for several biomass types. In that way when corn stover is available, after the corn harvest, the CBTL facility can utilize this crop predominately. When the switchgrass is available after harvesting the facility could use this feed. The woody biomass should be available most of the time depending on the cutting cycle. The coal would act as the flywheel to keep the plant operating at a fairly constant output.

63
This study examined the feasibility of producing FT diesel with a CO2 footprint 20% less than low sulfur diesel from a conventional petroleum refinery and found that a small amount of biomass was sufficient. The reference refinery used in this study did not capture or sequester CO2. However, some of the non-combustion CO2 emissions arising from a petroleum refinery are due to processes that produce CO2 streams that could be captured and sequestered relatively easily. An example would be hydrogen production by the steam reforming of methane. It would be of interest to determine the CO2 footprint reduction attained by the cases presented in this study when compared to a partially sequestering petroleum refinery that captures and sequesters those CO2 emissions that are amenable to conventional CO2 capture technologies. It would be of further interest to determine the amount of biomass needed to produce FT diesel having a CO2 footprint 20% less than such a partially sequestering refinery.
This study examined a limited range of CBTL processes all using less than twenty weight percent biomass. It would be worthwhile to conduct a more comprehensive study to quantify the CO2 emissions benefits of CBTL plants that use larger proportions of biomass, including the limiting case of using 100% biomass.
It is also recommended that a more rigorous and systematic analysis be undertaken to determine the availability of biomass energy crops in other regions of the country and to determine the impact of CBTL plant size and biomass transportation distance on overall economics.

64
Acronyms and Abbreviations ANL Argonne National Laboratory AF As Fed AGR Acid Gas Removal AGT Acid Gas Treatment AR As Received ASU Air Separation Unit bbl Barrel CW Cooling Water DB Daily Barrel BFW Boiler Feed Water BPD Barrels per Day BTL Biomass to Liquids CBTL Coal and Biomass to Liquids CTL Coal to Liquids DDB Double-Declining Balance DoD Department of Defense DOE Department of Energy ECN Energy research Centre of the Netherlands EOR Enhanced Oil Recovery EPA Environmental Protection Agency FEED Front End Engineering and Design FT Fischer-Tropsch GHG Greenhouse Gas GREET Greenhouse Gases, Regulated Emissions, and Energy Use in Transportation GTL Gas to Liquids HHV Higher Heating Value kWe kilowatt electric kWth kilowatt thermal lbs pounds LCA Life Cycle Analysis MDEA Methyl Diethanolamine MM Million MMBtu Million Btus MW Megawatt MWH Megawatt Hour NETL National Energy Technology Laboratory NGCC Natural Gas Combined Cycle NGL Natural Gas Liquids NRCS Natural Resources Conservation Service ORNL Oak Ridge National Laboratory ppmv parts per million, volume basis PSA Pressure Swing Adsorption

65
psi pounds per square inch psia pounds per square inch absolute R&D Research & Development RD&D Research, Development & Demonstration ROE Return on Equity RSP Required Selling Price SRWC Short Rotation Woody Crop SSEB Southern States Energy Board ST Steam Turbine TPD Ton per Day TPY Ton per Year TS&M Transportation, Sequestering, and Monitoring USDA United States Department of Agriculture wt % weight percent

66
Appendix A: GREET 1.7 Assumptions and Fuel Specifications These are the key assumptions that have been inputted, or used to calculate key assumptions that were inputted, into GREET Model 1.7. Assumptions for Coal Mining and Transportation to the Plant
• 100 percent underground mining
• fifty percent of coal transported by conveyor and fifty percent by rail
• Coal transported a distance of 65 miles Assumptions for Petroleum Extraction and Transportation to Refinery
• Assumes conventional crude oil only. Oil sands-derived crude oil is not included.
• Crude oil transportation is greater than 100 percent because multiple methods are sometimes used to deliver the crude oil to the refinery. For example, ocean tankers carrying crude oil reach the port, unload, and ship the crude oil through a pipeline to the refinery.
• 57 percent transport by ocean tanker at a one-way distance of 5,080 miles
• one percent barge transport at a one-way distance of 500 miles
• 100 percent pipeline transport at a one-way distance of 750 miles Assumptions for Conventional Oil Refining to Diesel Fuel and Transport and Distribution of the Fuel to the Station
• Assumes 87 percent refining efficiency.
• Diesel transportation (greater than 100 percent because multiple methods are sometimes used to transport low-sulfur diesel product) - 16 percent ocean tanker at a one-way distance of 1,450 miles - six percent barge at a one-way distance of 520 miles - 75 percent pipeline at a one-way distance of 400 miles - seven percent rail at a one-way distance of 800 miles
• Diesel distribution
- 100 percent truck delivery at a one-way distance of 30 miles Assumptions for Biomass Feedstock Production and Transport to the Plant
• Moisture content of delivered biomass - Switchgrass = 15 percent - Poplar trees = 25 percent - Corn stover = 15 percent

67
• Biomass yields - Switchgrass = 6 dry tons/acre/year - Poplar trees = 5 dry tons/acre/year - Corn stover = 1.98 dry tons/acre/year
• Corn stover collection rate = fifty percent
• Corn yield = 166 bushels/acre
• Delivery Truck Payloads/Capacity - Corn stover and switchgrass – 24 tons - Poplar trees – 17 tons
Table A-1 provides the feedstock fuel specifications that were used in this analysis.
Table A-1: Fuel Specifications
Feedstock Heat content
(HHV) density (lbs/gallon)
% weight carbon
Liquid Fuels Btu/gallon
Crude oil 138,350 7.06 85.3
Low-sulfur diesel fuel 138,490 7.06 87.1
F-T diesel 127,347 6.21 ~85
Solid fuels MMBtu/ton
Illinois #6 bituminous coal 23.45 N/A 75.5
Poplar trees 17.70 N/A 51.7
Switchgrass 15.58 N/A 42.6
Corn stover 14.97 N/A 44.5

68
7 References 1 Remarks to the Air Force Energy Forum, Arlington, Virginia, March 8, 2007 by Secretary of the Air Force Michael Wynne. 2 Defense Energy Support Center (DESC) Fact Book for 2006. 3 David Andress & Associates, Inc. Soil Carbon Changes for Bioenergy Crops, September 18, 2002. 4 John Marano and Jared Ciferno, Life-Cycle Greenhouse Gas Emissions Inventory for Fischer-Tropsch Fuels, June 2001. 5 EPA Fact Sheet, EPA 420-F-07-035, Greenhouse Gas Impacts of Expanded Renewable and Alternative Fuel Use, April 2007. 6 A. van der Drift, H. Boerrigter, B. Coda, M.K. Cieplik, and K.Hemmes, ECN, Entrained Flow Gasification of Biomass, ECN-C-04-039, April 2004. 7 USDA Natural Resources Conservation Service (NRCS), Illinois NRCS News Release, NRI Data Shows Progress in Illinois Soil Conservation Efforts, January 30, 2007. 8 ORNL, A National Assessment of Promising Areas for Switchgrass, Hybrid Poplar, or Willow Energy Crop Production, February 1999. 9 USDA, Economic Impacts of Bioenergy Crop Production on U.S. Agriculture, February 2003. 10 Kszos, Lynn and Walsh, Marie, ORNL; McLaughlin, Samuel B., University of Tennessee, Bioenergy from Switchgrass: Reducing Production Costs by Improving Yield and Optimizing Crop Management. 11 Haq, Zia, Energy Information Administration, Biomass for Electricity Generation, 2002. 12 ORNL, Assessment of Options for the Collection, Handling, and Transportation of Corn Stover, September 2002. 13 National Renewable Energy Laboratory (NREL), Lifecycle Assessment of a Biomass Gasification Combined Cycle System, December 1997. 14 ORNL, Assessment of Options for the Collection, Handling, and Transportation of Corn Stover, September 2002. 15 English, Burton C., et al., University of Tennessee Agricultural Economics, 25% Renewable Energy for the United States by 2025: Agricultural and Economic Impacts, November 2006. 16 Kszos, ORNL, Tools for Evaluating Economic Impacts of Yield and Management – BIOCOST and POLYSYS. 17 Walsh, Marie, ORNL, Production Costs and Supply of Biomass by U.S. Region, October 1994. 18 Collins, Keith, USDA, The New World of Biofuels: Implications for Agriculture and Energy, EIA Annual Energy Outlook Conference 2007, March 28, 2007. 19 Perlack, Robert D., Turhollow, Anthony F., Oak Ridge National Laboratory (ORNL), Assessment of Options for the Collection, Handling, and Transport of Corn Stover, September 2002.

69
20 DOE Office of the Biomass Program, Multi-Year Program Plan 2007-2012, August 2005. 21 Tim Saunders, Stamet, Personnel Communication May 2007. 22 Wang, M., Lee, H., and J. Molburg, Allocation of Energy Use in Petroleum Refineries to Petroleum Products, Int J LCA, vol 9, p34, 2004. 23 SSEB, American Energy Security, Building a Bridge to Energy Independence and to a Sustainable Energy Future, Report July 2006. 24 U.S. Department of Energy (DOE) and U.S. Department of Agriculture (USDA), Biomass as Feedstock for a Bioenergy and Bioproducts Industry: The Technical Feasibility of a Billion-Ton Annual Supply, April 2005. 25 Oak Ridge National Laboratory (ORNL), University of Tennessee, Science Applications International Corporation (SAIC), Biomass Feedstock Availability in the United States: 1999 State Level Analysis, January 2000.

National Energy Technology Laboratory 1450 Queen Avenue SW Albany, OR 97321-2198 541-967-5892 2175 University Avenue South, Suite 201 Fairbanks, AK 99709 907-452-2559 3610 Collins Ferry Road P.O. Box 880 Morgantown, WV 26507-0880 304-285-4764 626 Cochrans Mill Road P.O. Box 10940 Pittsburgh, PA 15236-0940 412-386-4687 One West Third Street, Suite 1400 Tulsa, OK 74103-3519 918-699-2000 Visit the NETL website at: www.netl.doe.gov Customer Service: 1-800-553-7681 U.S. Department of Energy Office of Fossil Energy Printed in the United States on recycled paper August 2007