indexes & databasesacta.fih.upt.ro/pdf/archive/acta-2017-3.pdf · dan ludovic lemle, university...
TRANSCRIPT


INDEXES & DATABASES We are very pleased to inform that our international scientific journal ACTA TECHNICA CORVINIENSIS Bulletin of Engineering completed its nine years of publication successfully [2008–2016, Tome I–IX]. In a very short period the ACTA TECHNICA CORVINIENSIS Bulletin of Engineering has acquired global presence and scholars from all over the world have taken it with great enthusiasm. We are extremely grateful and heartily acknowledge the kind of support and encouragement from all contributors and all collaborators! ACTA TECHNICA CORVINIENSIS Bulletin of Engineering is accredited and ranked in the “B+” CATEGORY Journal by CNCSIS – The National University Research Council’s Classification of Romanian Journals, positionno. 940 (http://cncsis.gov.ro/). ACTA TECHNICA CORVINIENSIS Bulletin of Engineering is a part of the SCIPIO - The Romanian Editorial Platform (http://www.scipio.ro/). ACTA TECHNICA CORVINIENSIS Bulletin of Engineering is indexed, abstracted and covered in the world-known bibliographical databases and directories including: INDEX COPERNICUS – JOURNAL MASTER LIST http://journals.indexcopernicus.com/ GENAMICSJOURNALSEEK Database http://journalseek.net/ DOAJ – Directory of Open Access Journals http://www.doaj.org/ EVISA Database http://www.speciation.net/ CHEMICAL ABSTRACTS SERVICE (CAS) http://www.cas.org/ EBSCO Publishing http://www.ebscohost.com/ GOOGLE SCHOLAR http://scholar.google.com SCIRUS - Elsevier http://www.scirus.com/ ULRICHSweb – Global serials directory http://ulrichsweb.serialssolutions.com getCITED http://www.getcited.org BASE - Bielefeld Academic Search Engine http://www.base-search.net Electronic Journals Library http://rzblx1.uni-regensburg.de Open J-Gate http://www.openj-gate.com ProQUEST Research Library http://www.proquest.com Directory of Research Journals Indexing http://www.drji.org/ Directory Indexing of International Research Journals http://www.citefactor.org/
ACTA TECHNICA CORVINIENSIS Bulletin of Engineering is also indexed in the digital libraries of the following world's universities and research centers:
WorldCat – the world's largest library catalog https://www.worldcat.org/
National Lybrary of Australia http://trove.nla.gov.au/
University Library of Regensburg – GIGA German Institute of Global and Area Studies http://opac.giga-hamburg.de/ezb/
Simon Fraser University – Electronic Journals Library http://cufts2.lib.sfu.ca/
University of Wisconsin-Madison Libraries http://library.wisc.edu/
University of Toronto Libraries http://search.library.utoronto.ca/
The University of Queensland https://www.library.uq.edu.au/
The New York Public Library http://nypl.bibliocommons.com/ State Library of New South Wales
http://library.sl.nsw.gov.au/ University of Alberta Libraries - University of Alberta
http://www.library.ualberta.ca/ The University of Hong Kong Libraries
http://sunzi.lib.hku.hk/ The University Library - The University of California
http://harvest.lib.ucdavis.edu/
copyright © University POLITEHNICA Timisoara,
Faculty of Engineering Hunedoara, 5, Revolutiei, 331128, Hunedoara, ROMANIA
http://acta.fih.upt.ro
ISSN:2067-3809

© copyright Faculty of Engineering – Hunedoara, University POLITEHNICA Timisoara
ACTA TECHNICA CORVINIENSIS – Bulletin of Engineering Tome X [2017] Fascicule 3 [July – September] ISSN: 2067 – 3809
ASSOCIATE EDITORS AND REGIONAL COLLABORATORS
Manager & Chairman ROMANIA
Imre KISS, University Politehnica TIMISOARA, Faculty of Engineering HUNEDOARA, Department of Engineering & Management, General Association of Romanian Engineers (AGIR) – branch HUNEDOARA
Editors from: ROMANIA
Vasile ALEXA, University Politehnica TIMIŞOARA – HUNEDOARA Sorin Aurel RAŢIU, University Politehnica TIMIŞOARA – HUNEDOARA Vasile George CIOATĂ, University Politehnica TIMIŞOARA – HUNEDOARA Simona DZIŢAC, University of Oradea – ORADEA Valentin VLĂDUŢ, Institute of Research-Development for Machines & Installations – BUCUREŞTI Valentina POMAZAN, University “Ovidius” CONSTANŢA – CONSTANŢA Dan Ludovic LEMLE, University Politehnica TIMIŞOARA – HUNEDOARA Sorin Ștefan BIRIȘ, University Politehnica BUCURESTI – BUCURESTI Mihai G. MATACHE, Institute of Research-Development for Machines & Installations – BUCUREŞTI Adrian DĂNILĂ, “Transilvania” University of BRASOV – BRASOV Bogdan LUNGU, “Horia Hulubei” National Institute of Phisics & Nuclear Engineering – MĂGURELE Dan GLĂVAN, University “Aurel Vlaicu” ARAD – ARAD
Regional Editors from: SLOVAKIA
Juraj ŠPALEK, University of ŽILINA – ŽILINA Peter KOŠTÁL, Slovak University of Technology in BRATISLAVA – TRNAVA Otakav BOKŮVKA, University of ŽILINA – ŽILINA Tibor KRENICKÝ, Technical University of KOŠICE – PREŠOV Beata HRICOVÁ, Technical University of KOŠICE – KOŠICE Peter KRIŽAN, Slovak University of Technology in BRATISLAVA – BRATISLAVA
HUNGARY
Tamás HARTVÁNYI, Széchenyi István University in GYŐR – GYŐR Arpád FERENCZ, Pallasz Athéné University – KECSKEMÉT József SÁROSI, University of SZEGED – SZEGED Attila BARCZI, Szent István University – GÖDÖLLÓ György KOVÁCS, University of MISKOLC – MISKOLC Zsolt Csaba JOHANYÁK, Pallasz Athéné University – KECSKEMÉT Gergely DEZSŐ, College of NYÍREGYHÁZA – NYÍREGYHÁZA Krisztián LAMÁR, Óbuda University BUDAPEST – BUDAPEST Loránt KOVÁCS, Pallasz Athéné University – KECSKEMÉT Valeria NAGY, University of SZEGED – SZEGED Sándor BESZÉDES, University of SZEGED – SZEGED
POLAND
Jarosław ZUBRZYCKI, LUBLIN University of Technology – LUBLIN Maciej BIELECKI, Technical University of LODZ – LODZ Bożena GAJDZIK, The Silesian University of Technology – KATOWICE
CROATIA
Gordana BARIC, University of ZAGREB – ZAGREB Goran DUKIC, University of ZAGREB – ZAGREB
BULGARIA
Krasimir Ivanov TUJAROV, “Angel Kanchev” University of ROUSSE – ROUSSE Ognyan ALIPIEV, “Angel Kanchev” University of ROUSSE – ROUSSE Ivanka ZHELEVA, “Angel Kanchev” University of ROUSSE – ROUSSE Atanas ATANASOV, “Angel Kanchev” University of ROUSSE – ROUSSE

ACTA TECHNICA CORVINIENSIS – Bulletin of Engineering
4 | F a s c i c u l e 3
SERBIA
Zoran ANIŠIC, University of NOVI SAD – NOVI SAD Milan RACKOV, University of NOVI SAD – NOVI SAD Igor FÜRSTNER, SUBOTICA Tech – SUBOTICA Eleonora DESNICA, University of NOVI SAD – ZRENJANIN Aleksander MILTENOVIC, University of NIŠ – NIŠ Milan BANIC, University of NIŠ – NIŠ Slobodan STEFANOVIĆ, Graduate School of Applied Professional Studies – VRANJE Sinisa BIKIĆ, University of NOVI SAD – NOVI SAD László GOGOLÁK, SUBOTICA Tech – SUBOTICA Ana LANGOVIC MILICEVIC, University of KRAGUJEVAC – VRNJAČKA BANJA Imre NEMEDI, SUBOTICA Tech – SUBOTICA Masa BUKUROV, University of NOVI SAD – NOVI SAD Živko PAVLOVIĆ, University of NOVI SAD – NOVI SAD Blaža STOJANOVIĆ, University of KRAGUJEVAC – KRAGUJEVAC
BOSNIA & HERZEGOVINA
Tihomir LATINOVIC, University in BANJA LUKA – BANJA LUKA Sabahudin JASAREVIC, University of ZENICA – ZENICA Šefket GOLETIĆ, University of ZENICA – ZENICA
TURKEY
Önder KABAŞ, Akdeniz University – KONYAAALTI/Antalya
CHINA
Yiwen JIANG, Military Economic Academy – WUHAN
The Editor and editorial board members do not receive any remuneration. These positions are voluntary. The members of the Editorial Board may serve as scientific reviewers. We are very pleased to inform that our journal ACTA TECHNICA CORVINIENSIS – Bulletin of Engineering is going to complete its eight years of publication successfully. In a very short period it has acquired global presence and scholars from all over the world have taken it with great enthusiasm. We are extremely grateful and heartily acknowledge the kind of support and encouragement from you. ACTA TECHNICA CORVINIENSIS – Bulletin of Engineering seeking qualified researchers as members of the editorial team. Like our other journals, ACTA TECHNICA CORVINIENSIS – Bulletin of Engineering will serve as a great resource for researchers and students across the globe. We ask you to support this initiative by joining our editorial team. If you are interested in serving as a member of the editorial team, kindly send us your resume to [email protected].
copyright ©University POLITEHNICA Timisoara,
Faculty of Engineering Hunedoara, 5, Revolutiei, 331128, Hunedoara, ROMANIA
http://acta.fih.upt.ro
ISSN:2067-3809

© copyright Faculty of Engineering – Hunedoara, University POLITEHNICA Timisoara
ACTA TECHNICA CORVINIENSIS – Bulletin of Engineering Tome X [2017] Fascicule 3 [July – September] ISSN: 2067 – 3809
INTERNATIONAL SCIENTIFIC COMMITTEE MEMBERS AND SCIENTIFIC REVIEWERS
Manager & Chairman
ROMANIA
Imre KISS, University Politehnica TIMISOARA, Faculty of Engineering HUNEDOARA, Department of Engineering & Management, General Association of Romanian Engineers (AGIR) – branch HUNEDOARA
International Scientific Committee Members & Scientific Reviewers from:
SLOVAKIA
Štefan NIZNIK, Technical University of KOŠICE – KOŠICE Karol VELIŠEK, Slovak University of Technology BRATISLAVA – TRNAVA Juraj ŠPALEK, University of ŽILINA – ŽILINA Ľubomir ŠOOŠ, Slovak University of Technology in BRATISLAVA – BRATISLAVA Miroslav BADIDA, Technical University of KOŠICE – KOŠICE Ervin LUMNITZER, Technical University of KOŠICE – KOŠICE Ladislav GULAN, Slovak University of Technology – BRATISLAVA Milan DADO, University of ŽILINA – ŽILINA Miroslav VEREŠ, Slovak University of Technology in BRATISLAVA – BRATISLAVA Milan SAGA, University of ŽILINA – ŽILINA Imrich KISS, Institute of Economic & Environmental Security – KOŠICE Michal CEHLÁR, Technical University KOSICE – KOSICE Pavel NEČAS, Armed Forces Academy of General Milan Rastislav Stefanik – LIPTOVSKÝ MIKULÁŠ Vladimir MODRAK, Technical University of KOSICE – PRESOV Michal HAVRILA, Technical University of KOSICE – PRESOV Dušan HUSKA, Slovak Agricultural University – NITRA
ROMANIA
Teodor HEPUŢ, University Politehnica TIMIŞOARA – HUNEDOARA Caius PĂNOIU, University Politehnica TIMIŞOARA – HUNEDOARA Carmen ALIC, University Politehnica TIMIŞOARA – HUNEDOARA Iulian RIPOŞAN, University Politehnica BUCUREŞTI – BUCUREŞTI Ioan MĂRGINEAN, University Politehnica BUCUREŞTI – BUCUREŞTI Victor BUDĂU, University Politehnica TIMIŞOARA – TIMIŞOARA Liviu MIHON, University Politehnica TIMIŞOARA – TIMIŞOARA Mircea BEJAN, Tehnical University of CLUJ-NAPOCA – CLUJ-NAPOCA Ioan VIDA-SIMITI, Technical University of CLUJ-NAPOCA – CLUJ-NAPOCA Csaba GYENGE, Technical University of CLUJ-NAPOCA – CLUJ-NAPOCA Laurenţiu POPPER, University of ORADEA – ORADEA Sava IANICI, “Eftimie Murgu” University of REŞIŢA – REŞIŢA Ioan SZÁVA, “Transilvania” University of BRASOV – BRASOV Ioan DZITAC, Agora University of ORADEA – ORADEA Liviu NISTOR, Technical University of CLUJ-NAPOCA – CLUJ-NAPOCA Sorin VLASE, “Transilvania” University of BRASOV – BRASOV Horatiu TEODORESCU DRĂGHICESCU,“Transilvania” University of BRASOV – BRASOV Maria Luminita SCUTARU,“Transilvania” University of BRASOV – BRASOV
ITALY
Alessandro GASPARETTO, University of UDINE – UDINE Alessandro RUGGIERO, University of SALERNO– SALERNO Adolfo SENATORE, University of SALERNO– SALERNO Enrico LORENZINI, University of BOLOGNA – BOLOGNA
ACTA TECHNICA CORVINIENSIS – Bulletin of Engineering
6 | F a s c i c u l e 3
HUNGARY
Imre DEKÁNY, University of SZEGED – SZEGED Béla ILLÉS, University of MISKOLC – MISKOLC Imre RUDAS, Óbuda University of BUDAPEST – BUDAPEST Tamás KISS, University of SZEGED – SZEGED Cecilia HODÚR, University of SZEGED – SZEGED Arpád FERENCZ, Pallasz Athéné University – KECSKEMÉT Imre TIMÁR, University of Pannonia – VESZPRÉM Kristóf KOVÁCS, University of Pannonia – VESZPRÉM Károly JÁRMAI, University of MISKOLC – MISKOLC Gyula MESTER, University of SZEGED – SZEGED Ádám DÖBRÖCZÖNI, University of MISKOLC – MISKOLC György SZEIDL, University of MISKOLC – MISKOLC István PÁCZELT, University of Miskolc – MISKOLC – BUDAPEST István JÓRI, BUDAPEST University of Technology & Economics – BUDAPEST Miklós TISZA, University of MISKOLC – MISKOLC Attila BARCZI, Szent István University – GÖDÖLLÓ István BIRÓ, University of SZEGED – SZEGED Gyula VARGA, University of MISKOLC – MISKOLC József GÁL, University of SZEGED – SZEGED Ferenc FARKAS, University of SZEGED – SZEGED Géza HUSI, University of DEBRECEN– DEBRECEN Ferenc SZIGETI, College of NYÍREGYHÁZA – NYÍREGYHÁZA Zoltán KOVÁCS, College of NYÍREGYHÁZA – NYÍREGYHÁZA
CROATIA
Drazan KOZAK, Josip Juraj Strossmayer University of OSIJEK – SLAVONKI BROD Predrag COSIC, University of ZAGREB – ZAGREB Milan KLJAJIN, Josip Juraj Strossmayer University of OSIJEK – SLAVONKI BROD Miroslav CAR, University of ZAGREB – ZAGREB Antun STOIĆ, Josip Juraj Strossmayer University of OSIJEK – SLAVONKI BROD Ivo ALFIREVIĆ, University of ZAGREB – ZAGREB
PORTUGAL
João Paulo DAVIM, University of AVEIRO – AVEIRO Paulo BÁRTOLO, Polytechnique Institute – LEIRIA José MENDES MACHADO, University of MINHO – GUIMARÃES
SERBIA
Sinisa KUZMANOVIC, University of NOVI SAD – NOVI SAD Mirjana VOJINOVIĆ MILORADOV, University of NOVI SAD – NOVI SAD Miroslav PLANČAK, University of NOVI SAD – NOVI SAD Milosav GEORGIJEVIC, University of NOVI SAD – NOVI SAD Vojislav MILTENOVIC, University of NIŠ – NIŠ Aleksandar RODIĆ, “Mihajlo Pupin” Institute – BELGRADE Milan PAVLOVIC, University of NOVI SAD – ZRENJANIN Zoran ANIŠIC, University of NOVI SAD – NOVI SAD Radomir SLAVKOVIĆ, University of KRAGUJEVAC, Technical Faculty – CACAK Zvonimir JUGOVIĆ, University of KRAGUJEVAC, Technical Faculty – CACAK Branimir JUGOVIĆ, Institute of Technical Science of Serbian Academy of Science & Arts – BELGRAD Miomir JOVANOVIC, University of NIŠ – NIŠ Vidosav MAJSTOROVIC, University of BELGRADE – BELGRAD Predrag DAŠIĆ, Production Engineering and Computer Science – TRSTENIK Lidija MANČIĆ, Institute of Technical Sciences of Serbian Academy of Sciences & Arts – BELGRAD Vlastimir NIKOLIĆ, University of NIŠ – NIŠ Nenad PAVLOVIĆ, University of NIŠ – NIŠ
GREECE
Nicolaos VAXEVANIDIS, University of THESSALY – VOLOS
BOSNIA & HERZEGOVINA
Tihomir LATINOVIC, University of BANJA LUKA – BANJA LUKA Safet BRDAREVIĆ, University of ZENICA – ZENICA Ranko ANTUNOVIC, University of EAST SARAJEVO – East SARAJEVO Isak KARABEGOVIĆ, University of BIHAĆ – BIHAĆ
SLOVENIA
Janez GRUM, University of LJUBLJANA – LJUBLJANA Štefan BOJNEC, University of Primorska – KOPER
AUSTRIA
Branko KATALINIC, VIENNA University of Technology – VIENNA
ACTA TECHNICA CORVINIENSIS – Bulletin of Engineering
7 | F a s c i c u l e 2
BULGARIA
Kliment Blagoev HADJOV, University of Chemical Technology and Metallurgy – SOFIA Nikolay MIHAILOV, “Anghel Kanchev” University of ROUSSE – ROUSSE Krassimir GEORGIEV, Institute of Mechanics, Bulgarian Academy of Sciences – SOFIA Stefan STEFANOV, University of Food Technologies – PLOVDIV
POLAND
Leszek DOBRZANSKI, Silesian University of Technology – GLIWICE Stanisław LEGUTKO, Polytechnic University – POZNAN Andrzej WYCISLIK, Silesian University of Technology – KATOWICE Antoni ŚWIĆ, University of Technology – LUBLIN Marian Marek JANCZAREK, University of Technology – LUBLIN Michał WIECZOROWSKI, POZNAN University of Technology – POZNAN Jarosław ZUBRZYCKI, LUBLIN University of Technology – LUBLIN Aleksander SŁADKOWSKI, Silesian University of Technology – KATOWICE Tadeusz SAWIK, Akademia Górniczo–Hutnicza University of Science & Technology – CRACOW
ARGENTINA
Gregorio PERICHINSKY, University of BUENOS AIRES – BUENOS AIRES Atilio GALLITELLI, Institute of Technology – BUENOS AIRES Carlos F. MOSQUERA, University of BUENOS AIRES – BUENOS AIRES Elizabeth Myriam JIMENEZ REY, University of BUENOS AIRES – BUENOS AIRES Arturo Carlos SERVETTO, University of BUENOS AIRES – BUENOS AIRES
MACEDONIA
Valentina GECEVSKA, University “St. Cyril and Methodius” SKOPJE – SKOPJE Zoran PANDILOV, University “St. Cyril and Methodius” SKOPJE – SKOPJE Robert MINOVSKI, University “St. Cyril and Methodius” SKOPJE – SKOPJE
SPAIN
Patricio FRANCO, Universidad Politecnica of CARTAGENA – CARTAGENA Luis Norberto LOPEZ De LACALLE, University of Basque Country – BILBAO Aitzol Lamikiz MENTXAKA, University of Basque Country – BILBAO Carolina Senabre BLANES, Universidad Miguel Hernández – ELCHE
CUBA
Norge I. COELLO MACHADO, Universidad Central “Marta Abreu” LAS VILLAS – SANTA CLARA José Roberto Marty DELGADO, Universidad Central “Marta Abreu” LAS VILLAS – SANTA CLARA
FRANCE
Bernard GRUZZA, Universite Blaise Pascal – CLERMONT-FERRAND Abdelhamid BOUCHAIR, Universite Blaise Pascal – CLERMONT-FERRAND Khalil EL KHAMLICHI DRISSI, Universite Blaise Pascal – CLERMONT-FERRAND Mohamed GUEDDA, Université de Picardie Jules Verne – AMIENS Ahmed RACHID, Université de Picardie Jules Verne – AMIENS Yves DELMAS, University of REIMS – REIMS Jean GRENIER GODARD, L’ecole Superieure des Technologies et des Affaires – BELFORT Jean–Jacques WAGNER, Universite de Franche-Comte – BELFORT
INDIA
Sugata SANYAL, Tata Consultancy Services – MUMBAI Siby ABRAHAM, University of MUMBAI – MUMBAI Anjan KUMAR KUNDU, University of CALCUTTA – KOLKATA
CZECH REPUBLIC
Ivo SCHINDLER, Technical University of OSTRAVA – OSTRAVA Jan VIMMR, University of West Bohemia – PILSEN Vladimir ZEMAN, University of West Bohemia – PILSEN
MOROCCO
Saad BAKKALI, Abdelmalek Essaâdi University, Faculty of Sciences and Techniques – TANGIER Mahacine AMRANI, Abdelmalek Essaâdi University, Faculty of Sciences and Techniques – TANGIER
USA
David HUI, University of NEW ORLEANS – NEW ORLEANS
SWEEDEN
Ingvar L. SVENSSON, JÖNKÖPING University – JÖNKÖPING
ISRAEL
Abraham TAL, University TEL-AVIV, Space & Remote Sensing Division – TEL-AVIV Amnon EINAV, University TEL-AVIV, Space & Remote Sensing Division – TEL-AVIV
FINLAND
Antti Samuli KORHONEN, University of Technology – HELSINKI Pentti KARJALAINEN, University of OULU – OULU
NORWAY
Trygve THOMESSEN, Norwegian University of Science and Technology – TRONDHEIM Gábor SZIEBIG, Narvik University College – NARVIK Terje Kristofer LIEN, Norwegian University of Science and Technology – TRONDHEIM Bjoern SOLVANG, Narvik University College – NARVIK

ACTA TECHNICA CORVINIENSIS – Bulletin of Engineering
8 | F a s c i c u l e 3
BRAZIL
Alexandro Mendes ABRÃO, Universidade Federal de MINAS GERAIS – BELO HORIZONTE Márcio Bacci da SILVA, Universidade Federal de UBERLÂNDIA – UBERLÂNDIA Sergio Tonini BUTTON, Universidade Estadual de CAMPINAS – CAMPINAS Leonardo Roberto da SILVA,Centro Federal de Educação Tecnológica – BELO HORIZONTE Juan Campos RUBIO, Universidade Federal de MINAS GERAIS – BELO HORIZONTE
UKRAINE
Sergiy G. DZHURA, Donetsk National Technical University – DONETSK Alexander N. MIKHAILOV, DONETSK National Technical University – DONETSK Heorhiy SULYM, Ivan Franko National University of LVIV – LVIV Yevhen CHAPLYA, Ukrainian National Academy of Sciences – LVIV
TURKEY
Ali Naci CELIK, Abant Izzet Baysal University – BOLU Önder KABAŞ, Akdeniz University –KONYAAALTI/Antalya
CHINA
Wenjing LI, Military Economic Academy – WUHAN Zhonghou GUO, Military Economic Academy – WUHAN
LITHUANIA
Egidijus ŠARAUSKIS, Aleksandras Stulginskis University – KAUNAS Zita KRIAUČIŪNIENĖ, Experimental Station of Aleksandras Stulginskis University – KAUNAS
The Scientific Committee members and Reviewers do not receive any remuneration. These positions are voluntary. We are extremely grateful and heartily acknowledge the kind of support and encouragement from all contributors and all collaborators! ACTA TECHNICA CORVINIENSIS – Bulletin of Engineering is dedicated to publishing material of the highest engineering interest, and to this end we have assembled a distinguished Editorial Board and Scientific Committee of academics, professors and researchers. ACTA TECHNICA CORVINIENSIS – Bulletin of Engineering publishes invited review papers covering the full spectrum of engineering. The reviews, both experimental and theoretical, provide general background information as well as a critical assessment on topics in a state of flux. We are primarily interested in those contributions which bring new insights, and papers will be selected on the basis of the importance of the new knowledge they provide. ACTA TECHNICA CORVINIENSIS – Bulletin of Engineering encourages the submission of comments on papers published particularly in our journal. The journal publishes articles focused on topics of current interest within the scope of the journal and coordinated by invited guest editors. Interested authors are invited to contact one of the Editors for further details. ACTA TECHNICA CORVINIENSIS – Bulletin of Engineering accept for publication unpublished manuscripts on the understanding that the same manuscript is not under simultaneous consideration of other journals. Publication of a part of the data as the abstract of conference proceedings is exempted. Manuscripts submitted (original articles, technical notes, brief communications and case studies) will be subject to peer review by the members of the Editorial Board or by qualified outside reviewers. Only papers of high scientific quality will be accepted for publication. Manuscripts are accepted for review only when they report unpublished work that is not being considered for publication elsewhere. The evaluated paper may be recommended for: Acceptance without any changes – in that case the
authors will be asked to send the paper electronically in
the required .doc format according to authors’ instructions;
Acceptance with minor changes – if the authors follow the conditions imposed by referees the paper will be sent in the required .doc format;
Acceptance with major changes – if the authors follow completely the conditions imposed by referees the paper will be sent in the required .doc format;
Rejection – in that case the reasons for rejection will be transmitted to authors along with some suggestions for future improvements (if that will be considered necessary).
The manuscript accepted for publication will be published in the next issue of ACTA TECHNICA CORVINIENSIS – Bulletin of Engineering after the acceptance date. All rights are reserved by ACTA TECHNICA CORVINIENSIS – Bulletin of Engineering. The publication, reproduction or dissemination of the published paper is permitted only be written consent of one of the Managing Editors. All the authors and the corresponding author in particular take the responsibility to ensure that the text of the article does not contain portions copied from any other published material which amounts to plagiarism. We also request the authors to familiarize themselves with the good publication ethics principles before finalizing their manuscripts.
copyright ©University POLITEHNICA Timisoara,
Faculty of Engineering Hunedoara, 5, Revolutiei, 331128, Hunedoara, ROMANIA
http://acta.fih.upt.ro
ISSN:2067-3809

© copyright Faculty of Engineering – Hunedoara, University POLITEHNICA Timisoara
ACTA TECHNICA CORVINIENSIS – Bulletin of Engineering Tome X [2017] Fascicule 3 [July – September] ISSN: 2067 – 3809
TABLE of CONTENTS
ACTA TECHNICA CORVINIENSIS – Bulletin of Engineering Tome X [2017], Fascicule 3 [July – September]
1. Marko VLAHOVIĆ, Mila KAVALIĆ, Ljiljana RADOVANOVIĆ, Darko BAĐOK, Arben LUNJIĆ – SERBIA CHECKING THE TIRES AS MEASURE OF EFFICIENCY INCREASE AND REDUCING WORKING COSTS OF FORKLIFTS – CASE STUDY OF COMPANY MERCATOR-S
17 Abstract: By integrating companies IDEA and Mercator-S management of the new integrated company found itself facing the challenge of optimizing business activities in all aspects of work. One of the challenges was also in the field of logistics and administration in the field of transport within the warehouses. In order to try to reduce the cost of tires and increase transport efficiency within their logistics and distribution centers, the company Mercator-S has made an internal decision on additional quality control measures. The company has decided that every 15 days performs tire pressure checks and tread depth checks. Optimal rotation of the tire and adding pressure in those where it was necessary during the audit, the company Mercator-S is for only 2 years, in 2016, compared to 2014, according to the number of kilometers traveled on the fleet of 120 vehicles, increase the efficiency of their forklifts by 10% and reduce the cost of replacement tires by 29%. Keywords: cost reduction, logistics, quality control, transport efficiency, tires
2. Dávid TÓTH, Andrea MUDRIKOVÁ, Peter KOŠŤÁL – SLOVAKIA THE ROLE OF STEP-NC IN DRAWINGLESS ENVIRONMENT
23
Abstract: Modern manufacturing enterprises are built from facilities spread around the globe, which contain equipment from hundreds of different manufacturers. Immense volumes of product information must be transferred between the various facilities and machines. Today’s digital communications standards have solved the problem of reliably transferring information across global networks. For mechanical parts, the description of product data has been standardized by ISO10303 (STEP). This leads to the possibility of using standard data throughout the entire process chain in the manufacturing enterprise. Barriers to realizing this principle are the data formats used at the machine level. Most computer numerical control (CNC) machines are programmed in the ISO 6983 G-code language. Programs are typically generated by computer-aided manufacturing (CAM) systems that use computer-aided design (CAD) information. However, G-code limits program portability for three reasons. First, the language focuses on programming the tool center path with respect to machine axes, rather than the machining process with respect to the part. Second, the standard defines the syntax of program statements, but in most cases leaves the semantics ambiguous. Third, vendors usually supplement the language with extensions that are not covered in the limited scope of G-code. The replacement for G-code is so-called STEP-NC, the name STEP-NC meaning the STEP standard extended for NC. STEP-NC is a new model of data transfer between CAD/CAM systems and CNC machines. It remedies the shortcomings of G-code by specifying machining processes rather than machine tool motion, using the concept of working steps. Working steps correspond to high-level machining features and associated process parameters. CNCs are responsible for translating working steps to axis motion and tool operation. Keywords: STEP, CNC, G-code, production system, CAD, CAM

ACTA TECHNICA CORVINIENSIS – Bulletin of Engineering
10 | F a s c i c u l e 3
3. Dinara SOBOLA, Pavel TOMÁNEK – CZECH REPUBLIC Ştefan ŢĂLU – ROMANIA SURFACE CONDITION OF GAAS SOLAR CELLS
27 Abstract: This study is devoted to the description of GaAs solar cells topography and choice substitution of the method for surface study. It is in the attention because the surface condition can predefine the behavior of the heterojunction and efficiency of the device in common. The impact made to description of solar cells surface by atomic force microscopy and scanning electron microscopy. The sizes and shapes of surface morphology play an essential role in behavior and properties of materials in micro and nano-scale. The right choice of microcopy technique for morphology characterization is important for obtaining valuable data. Keywords: Solar cells, topography, microscopy, fractal analysis
4. Valery Gomdje HAMBATE, Sophie NGOUADJIO, Lemankreo DAÏ-YANG – CAMEROON Andrew Edwin OFUDJE – NIGERIA Mbadcam Joseph KETCHA, Benoît LOURA – CAMEROON CHEMICAL TREATMENT OF SUGARCANE BAGASSE FOR THE PRODUCTION OF CELLULOSIC FIBERS
33 Abstract: The extraction of cellulosic fibers from sugarcane bagasse and the characterization of these fibers are carried out in this study. Sugarcane bagasse was treated with an alkaline solution in order to get cellulosic fibers. Sugarcane bagasse were analyzed by X-ray diffraction, Fourier transformed infra-red, Scanning electronic microscopic, Transmission electronic microscopic and differential thermal analysis/thermo-gravimetric analysis in nitrogen gas. Influence of the temperature and the mass of the fiber are studied, the temperature has an effect on the color of the fiber and the concentration of sodium hydroxide used, and more the soaking time increases the fiber mass decreases. It is found that the extraction yield of the fibers decreases as soaking time increases, the highest extraction yield is obtained at a temperature of 60°C with a concentration of sodium hydroxide of 0.1mol/L and the moisture content is 31.1%. The results obtained show that the process of extracting the fiber and controlling certain parameters such as temperature, concentration of sodium hydroxide and soaking time have an effect on the quality of the fiber obtained. Keywords: Extraction; Sugarcane bagasse; cellulosic fibers; soaking time
5. Aleksandar SKULIĆ, Dejan KRSMANOVIĆ, Saša RADOSAVLJEVIĆ, Lozica IVANOVIĆ, Blaža STOJANOVIĆ – SERBIA POWER LOSSES OF WORM GEAR PAIRS
39 Abstract: In this paper are presented the power losses and sources of their occurrence in worm gear boxes. These are the losses that occur in the coupling of worm teeth and worm gear, losses in bearings, seals and oil churning power losses in the transmission. When the operation of worm gearing is characterized by line contact of coupled elements which is accompanied by significant sliding, the highest value have the power losses in the worm and worm gear coupling compared to other losses in gearing. Among other things, in the paper also presents the expressions that are used for calculation of individual power losses and efficiency of the gearing. The size of the losses primarily depends on the type of coupled material and geometry of worm pair, circumferential velocity (input rotational speed), the type and viscosity of lubricating oil, load, worm shape, and temperature and so on. The paper also deals with the influence of different factors on power losses and efficiency. As the efficiency of the worm pair is significantly lower compared to other types of gear pairs, the appropriate combination of geometric parameters and materials of worm and worm gear, lubrication and working conditions can significantly affect its increase. Keywords: power losses, efficiency, worm gearing
6. Ján ĎURECH, Mária FRANEKOVÁ, Peter LÜLEY, Emília BUBENÍKOVÁ – SLOVAKIA SAFETY ASPECTS OF PKI ARCHITECTURE WITHIN C-ITS AND THEIR MODELLING
47
Abstract: The authors of this contribution focus on analysis of C2C communication in Cooperative - Intelligent Transportation Systems (C-ITS). In paper is proposed PKI (Public Key Infrastructure) secure architecture on the base of ECDSA (Elliptic Curve Digital Signature Algorithm) for several EC types. The experimental part is focused on worst case scenario of C2C communications for four-lane intersection, which model was realized via OPNET MODELER with OpenSSL libraries. From obtained results the influence of used elliptic curve and size of message to performance of the VANET network was analyzed. Keywords: VANET; cooperative-intelligent transportation system; C2C; authentication protocols, traffic scenario, modelling
7. Richárd PETŐ – HUNGARY SOME SAFETY AND SECURITY ISSUES OF UAVS
55
Abstract: UAV or drone technology has become easily available, and the drone has grown into an affordable and effective device for some commercial and business sectors. These sectors quickly realised that drones are cost- and time-effective therefore they quickly adopted them. Unfortunately, drones are favoured by criminals too. In the following, the article discusses the construction and operation of UAVs in connection with safety and security requirements. The article focuses on the main processes only without providing any details of previous documents or

ACTA TECHNICA CORVINIENSIS – Bulletin of Engineering
11 | F a s c i c u l e 3
information on processes of obtaining such document. In order to do the eligible development required by law, first a step-by-step risk analysis has to be carried out. The process must be systematic because the risks, aspects and settings continuously change. In the last three-four years, the usage of UAVs generated a huge and significant chaos worldwide. Everything started with package delivery, illegal observation of private sphere, and recordings. Each factors, processes, and tasks need to be in harmony with the relevant legal regulations. Keywords: UAV, drone, RC, safety and security, terrorism, explosive devices
8. I.O.OLADELE, B. A.ISOLA, S.FALODUN, E. OGBU – NIGERIA COMPARATIVE INVESTIGATION OF THE INFLUENCE OF MERCERIZATION TREATMENT ON WHITE AND YELLOW MAIZE CORNCOBS REINFORCED EPOXY COMPOSITES
61
Abstract: Agricultural wastes have significant potential in composite developments due to its high strength, environmentally friendly nature, low cost, availability and sustainability. An investigation was performed on the effect of chemical treatment on the reinforcement efficiency of white and yellow maize corncobs reinforced epoxy matrix composites. Epoxy resin composites reinforced with treated alkali solutions of NaOH and KOH as well as untreated yellow and white corncob particles were produced using the open moulding technique. The reinforcement was varied from 2-6 wt.% at intervals of 2 wt.% followed by mechanical and wear properties investigations. The results revealed that chemical treatment with alkali solutions enhanced the mechanical properties of the developed composites. It was observed that the flexural properties were enhanced in 2 wt. % W-NaOH and Y-KOH while tensile properties were enhanced in 2 wt. % Y-KOH corncob reinforced epoxy composites, respectively. However, 6 wt.% U-White corncob reinforced epoxy composite showed the optimum wear resistance. Keywords: corncob; epoxy; agricultural waste; alkali treatment; mechanical properties; wear resistance
9. Nadia A. ALI – IRAQ EFFECT OF POLYETHYLENE TERPHALET (PET) ON MECHANICAL AND OPTICAL PROPERTIES OF POLYLACTIC ACID (PLA) FOR PACKAGING APPLICATION
67
Abstract: Blends of polyethylene terphalet (PET) with polylactic acid (PLA) were investigated to study the influence of the additive of PET on (tear, impact strength) and (transparency, color). The compositions were prepared in wt (20/80), (50/50), (80/20). Mechanical properties like tear strength and Impact Izod, and optical properties like colors and transparency were also reported. Polyethylene terphaletee decrease the tear strength when additive PET and Impact Izod strength of PLA was increased when additive PET when tested in the machine directions. Optical property such as colors was increased and the value of transparency was decreased as the loading of PET increased. Keywords: PET, PLA, tear strength, impact strength, color and Transparency 10. Gabriel CIBIRA – SLOVAKIA
DYNAMIC INTERNATIONAL OPTICAL NETWORK BY FUZZY ROUTING
71 Abstract: Optical communications transmit large amount of data, operating from local to transoceanic distances. Wave division multiplexing WDM is crucial point for achieving reliable real-time data transmission over precise fiber-optic cables and nodes technology. This paper brings novel method for optical links evaluation used for optimal path finding when data transmitting over dynamically loaded international optical network. Middle-European NRENs and pan-European GÉANT are implemented to the simulation model. For efficient links’ assessment, several parameters are taken into account. They are employed by fuzzy logic subsystem to estimate their relationships and, each link quality and utilization judgment. Composed simulation model demonstrates routing (i.e. path finding) flexibility and utilization balancing over existing optical links. Keywords: fuzzy routing, dynamic optical network 11. Vlado MEDAKOVIĆ, Bogdan MARIĆ – BOSNIA & HERZEGOVINA
ORGANIZATION AND CHARACTERISTICS OF BUSINESS ZONES
79 Abstract: The paper presents general organization and characteristics business zones. One of the modern ways of support to small newly established enterprises and entrepreneurs, which are in a development life phase, is the system of technological infrastructure: entrepreneurial incubators, technology centers, science parks and business zones. Those are different organizations which help entrepreneurs to develop their business ideas and to overcome more easily the initial problems in business, for which, in a wider context, the term business incubators is used, and also the clusters related to entrepreneurs who are in an advanced phase of entrepreneurship. Keywords: SMEs, entrepreneurial, entrepreneurial infrastructure, business zones 12. A. D. ADEWOYIN, M. A. OLOPADE – NIGERIA
AN INVESTIGATION OF THE CHARGE-DISCHARGE CHARACTERISTICS OF AN ULTRACAPACITOR IN COMPARISON WITH CONVENTIONAL BATTERIES USING PSCAD-1D
85 Abstract: The charging and discharging of ultra-capacitors have been studied in this research. An equivalent circuit was used to describe the electrical behavior of the ultra-capacitors. The equivalent circuit was implemented in Power System Computer Aided Design (PSCAD-1D) software for simulations. Maxwell 350F ultra-capacitors were used in the basic model. Simulation results of this model in a stable charge/discharge procedure showed excellent agreement with results obtained from experiments. The charging of the ultra-capacitor took approximately 50 seconds. The

ACTA TECHNICA CORVINIENSIS – Bulletin of Engineering
12 | F a s c i c u l e 3
ultra-capacitor shows a nearly constant energy storage capacity. Also, the time constant for the full charging phase is 63% while the discharge phase is 37%. The graph of the discharge phase is exponential. A discharge efficiency of 85% at all charge/discharge current was determined and its specific power is relatively high. Keywords: ultra-capacitor, charging, discharging, efficiency and power 13. Andor ZSEMBERI, Zoltán Károly SIMÉNFALVI, Árpád Bence PALOTÁS – HUNGARY
ANALYSIS OF A THERMO-CATALYTIC CRACKING
89 Abstract: The core topic of the current research is composed of chemical raw materials to be produced from renewable and waste sources, out of which the most significant future representative can be the so-called thermo-catalytic cracking process in combined material flow. The thermo-chemical conversion of biomass and/or plastic waste(s) is a process, by means of which base materials for the chemical industry or energy carriers can be manufactured. If one considers the conventional, purely thermal not catalytic cracking of biomass only, the quality indicators of the so-called bio oil to be produced such as heating value, viscosity, oxygen content etc. are fairly poor. Today’s research investigates thermo-catalytic cracking performed in combined material flow (biomass and synthetic polymer waste) gaining popularity, by means of which one can efficiently attain quality improvement during the process from the aspect of liquid products to be produced. The liquid product obtained from thermo-catalytic thermal cracking of pure biomass was a brownish-black pitchy fraction. By adding 50 wt% PS (polystyrene) waste, a considerable qualitative and quantitative improvement could be achieved during the combined thermo-catalytic cracking. The aromatic hydrocarbon content of the liquid product increased considerably. In addition, the quantity of solid chark and carbonised fraction remaining in the reactor body dropped by 36% on average in favour of the liquid and gas products, which may significantly promote the technical-economic viability of the technology. Keywords: cracking, biomass, recycling of plastic waste, aromatic hydrocarbons 14. Tihomir G. VASILEV – BULGARIA
ANALYSIS OF THE DEFORMATIONS IN „DELTA WIRED 3D PRINTER”
93 Abstract: With the use of 3D printing technology, layer by layer extrusion is possible printing of concrete building objects, but printers represent a large size and mobility limited metal construction. In a new 3D printer construction, called "Delta Wired 3D Printer", the large stress created from bending moments are transformed in normal stress from tension. After we have calculates the loads on individual elements we can determine their dimensions and deformation. The loads are different in any point of workspace coordinate system this creation of different deflections for any point, which will increases dimension errors of printed object. In this paper are theoretically calculated total extruder deflections as a function of tensile in wires, bending in pillars taking into account changes in forces for any coordinate points. Keywords: delta wired 3d printer, printing of building objects, mobile 3d printer, reconstructions of 3d printer 15. Fatai O. ARAMIDE, Idris B. AKINTUNDE – NIGERIA
EFFECTS OF SILICON CARBIDE AND SINTERING TEMPERATURE ON THE PROPERTIES OF SINTERED MULLITE-CARBON COMPOSITE SYNTHESIZED FROM OKPELLA KAOLIN
99
Abstract: The effects of the addition of silicon carbide and sintering temperatures on the physical and mechanical properties of sintered ceramic composite produced from kaolin and graphite was investigated. The kaolin and graphite of known mineralogical composition were thoroughly blended with 4 and 8 (vol.) % silicon carbide. From the homogeneous mixture of kaolin, graphite and silicon carbide, standard samples were prepared via uniaxial compaction. The test samples produced were subjected to firing (sintering) at 1300˚C, 1400˚C and 1500˚C. It was observed that increase in sintering temperature beyond 1400°C generally lead to reduced porosity of the samples; high contents of silicon carbide especially at temperature from and above 1400°C lead to higher porosity; cold crushing strength of samples with 4% SiC is seen to be better than those of samples with 8% SiC within sintering the temperature range of 1400°C and 1500°C; modulus of elasticity of both samples reached the maxima values at 1400°C but those of samples with 8% SiC is seen to be higher within the sintering temperature range of 1400°C and 1500°C; absorbed energy of both samples generally increased with increased sintering temperature; oxidation indices for both samples reach the maxima at the temperature of 1400°C but the resistance to oxidation is better for samples with 4% SiC within the sintering temperature range of 1400°C and 1500°C. It was concluded that samples with 4% SiC at the sintering temperature of 1400°C exhibit better property and is considered to be optimum. Keywords: silicon carbide; mullite; graphite; sintering temperatures; phases 16. Milan BUKVIĆ, Blaža STOJANOVIĆ, Lozica IVANOVIĆ, Saša MILOJEVIĆ – SERBIA
RECYCLING OF THE HYBRID AND ELECTRIC VEHICLES 107
Abstract: Modern research in the field of motor vehicles covered by a cycle of product development and components to production and exploitation of vehicles in traffic, all the way to retirement and recycling. In this way is decreasing negative impact of motor vehicles on the environment. Application of hybrid and electric vehicles to reduce or eliminate emissions of toxic and harmful gases are emitted into the environment during use of vehicles with conventional drive systems on gasoline or diesel fuel. In parallel with the implementation of such vehicles, it is necessary to set up and solve the problems in more detail their exploitation, as well as problems that precede the use

ACTA TECHNICA CORVINIENSIS – Bulletin of Engineering
13 | F a s c i c u l e 3
of vehicles (quarrying and raw materials, energy production, and everything is built into a vehicle), and partly to problems that come later (after exploitation period). This particularly applies to the treatment of waste batteries and electrical and electronic circuits that are typical for this kind of vehicle. Requirements for zero emission of waste materials at all stages of the service life of hybrid and electric vehicles are a complex task for researchers, especially in the field of development and application of new materials and advanced and secure technologies in the process of production and application. That way, manufacturers are demands for easy dismantling and recycling of vehicles at the end of life service and safety classification of the material, which is accompanied by certain problems. A particular problem is the lack of specific policies and procedures that can be applied in such vehicles. To meet these requirements it is necessary to develop new materials and equipment to be installed in a vehicle, as well as the development of new manufacturing technologies and processes for recycling. This paper describes the procedures for the retirements of such vehicles, as well as the recycling of specific parts of electrical installations and electronic circuits. Keywords: hybrid and electric vehicles, recycling, ecology, materials, waste 17. I.O. OLADELE, O.G. AGBABIAKA, A.O. ADEYEMI – NIGERIA
MECHANICAL PROPERTIES OF CHEMICALLY TREATED SISAL FIBER REINFORCED LOW DENSITY POLYETHYLENE COMPOSITES
115 Abstract: This research investigates the effect of chemical treatment on the mechanical properties of sisal fiber reinforced low density polyethylene (SFR-LDPE) composites. The sisal fiber was sourced from its plantation and was extracted by soil retting process. In order to study the effect of chemical treatments on the resultant properties of the SFR-LDPE composites, NaOH, KOH, NaCl and KCl were used to modify the fibers in a shaker water bath at 50ºC for 4 hours. The treated fibers were cut into 10 mm lengths and were used for the production of randomly dispersed short fiber/LDPE composites in predetermined proportions. Tensile and flexural tests were carried out on the developed SFR-LDPE composites from where it was observed that, alkali treated SFR-LDPE composite samples gave the best flexural and tensile properties compared to composites developed from chloride salts. Keywords: Sisal fiber, composite, chemical treatment, mechanical properties, water absorption properties 18. Viktor József VOJNICH – HUNGARY
CULTIVATION POSSIBILITIES OF IN VITRO PROPAGATED Lobelia Inflata IN THE AGRICULTURE
121 Abstract: Lobelia inflata L. is a medicinally important species of the Lobeliaceae family. It is native to North America and contains numerous piperidine alkaloids. It is important to increase the biomass and lobeline content of in vitro plant by nitrogen and magnesium treatments. The ammonium/nitrate ratio controls the pH of growth media, stimulates morphogenesis and embryogenesis, and thus it is important in inducing callus formation in many woody plant cultures. However, all the aforementioned effects of the culture medium differ from one species to another and from one compound to another. Several previous experiments examined the influence of macroelements on growth and alkaloid production of hairy roots. The aim of this research was to examine the effect of MgSO4 and NH4NO3 fertilization on biomass and on lobeline content of in vitro propagated L. inflata. Keywords: Lobelia inflata, in vitro, propagated, cultivation, agriculture 19. Ayyakannu Palamalai VIJAYAKUMAR, N.Ramakrishnan DEVI – INDIA
ANALYSIS, SIMULATION AND EXPERIMENTAL RESULTS OF SMPS SYSTEM USING FORWARD CONVERTER WITH RCD SNUBBER
127
Abstract: A Closed loop controlled DC to DC forward converter is a requisite for the server SMPS system. High efficiency, Isolation, Steady state voltage, Transient response, High switching frequency, reduced noises and range of steady state are all necessary requirements for the forward converter. In this paper, a 40 V forward converter system with RCD snubber is used for charging the battery of server SMPS is proposed. The proposed converter consists of a snubber circuit on the primary side and an isolation transformer and a rectifier structure on the secondary side. This paper proposed the simulation results of the forward converter with RCD snubber and it is implemented with PIC microcontroller. From comparison of performance against the simulation model with the experimental model, a suitable converter is proposed for the sever SMPS system. A 40 V proposed circuit is designed as experimental model to verify and compare it with the simulation and experimental results. This paper proposed the simulation and experimental results of the forward converter system. Keywords: Embedded microcontroller, Zero voltage switching, Zero current switching, Reset voltage, Clamping diode and Voltage stress 20. Ruslans SMIGINS – LATVIA
EXPERIMENTAL EVALUATION OF LOW LEVEL BIOETHANOL-GASOLINE BLENDS ON ENGINE PERFORMANCE AND EMISSIONS
133 Abstract: The paper presents the results of experimental research of two low level bioethanol-gasoline blends E5 (5% bioethanol, 95% gasoline) and E10 (10% bioethanol, 90% gasoline) tested on Toyota Corolla vehicle on chassis dynamometer. The analysis of obtained results has showed that the increase of engine power and fuel consumption is slightly higher for both blends compared to gasoline, showing better perspectives for E5 than E10. Emission tests have
ACTA TECHNICA CORVINIENSIS – Bulletin of Engineering
14 | F a s c i c u l e 3
shown increase of CO2 and NOx emissions for all mentioned fuels and testing conditions, as also decrease of CO and HC. The addition of bioethanol has left a positive impact on unregulated emissions, showing better reduction than for regulated emissions. Keywords: bioethanol, gasoline, emissions, power, fuel consumption 21. A.G.F. ALABI, F.I. ALUKO, J.O. AWEDA – NIGERIA
INFLUENCE OF FERROSILICON MANGANESE ON THE SULPHUR CONTENT AND MICROSTRUCTURE IN THE PRODUCTION OF AUSTEMPERED DUCTILE IRON (ADI)
139 Abstract: This study considers the effect of ferrosilicon manganese addition to austempered ductile iron, (ADI) in order to reduce its sulphur level for improved engineering applications of the material. The cast samples were austenitised in a mixture of potassium chloride, sodium chloride and barium chloride solutions and austempered in sodium nitrate and potassium nitrate solutions. Ferro-silicon-manganese was added to ADI in various amounts ranging from between 47 to326 g. The study revealed that the sulphur level retained in ADI decreased from 0.088 wt % for as-cast to 0.027 wt% when 93 g of ferro-silicon-manganese was added. Below this amount of ferro-silicon-manganese addition, there was no significant reduction in the sulphur level recorded in ADI. The microstructure of the metal revealed bigger graphite nodules scattered in ferrite solutions for the situation when the sulphur level was 0.027 wt. %. From the study, it was discovered that addition of small amount of ferrosilicon manganese was required to produce ADI of low level sulphur content to make the metal more acceptable for other engineering applications. Keywords: Ductile iron, ADI, sulphur, austempering, nodularizer, ferrosilicon 22. Iulia GĂGEANU, Gheorghe VOICU, Valentin VLĂDUȚ,
I. VOICEA, I. DUMITRU, I.L. CABA – ROMANIA CONSIDERATIONS ON OBTAINING BIOMASS PELLETS
145 Abstract: The field of producing solid fuels from biomass has registered a considerable increase, due to the existence of important quantities of biomass that represent an important source of renewable energy. Pellets are one of the most common solid biofuels, being used for both household use and for producing energy. The production of pellets, also called granules, from grinded biomass is spread in the field of renewable sources of energy as innovative techniques for environmental protection, especially in Europe. Due to global warming, a phenomenon affecting the entire worldwide population, industries were forced to accelerate and cheapen the large production of pellets used as solid biofuel, by identifying new innovative technical solutions in the field of pelleting machinery. The article presents considerations on the production of pellets from various types of biomass using specially designed equipment and a series of considerations for the best parameters to be used for producing these types of pellets. Keywords: biomass, pellets, compression, force, renewable energy 23. Ervin LUMNITZER, Beata HRICOVÁ – SLOVAKIA
RAILWAY NOISE AND ITS PSYCHOACOUSTIC PARAMETERS
151 Abstract: Psychoacoustics is relatively a new branch of science studying acoustics and psychology. It examines the effects of sound on the human psyche. Unlike conventional physical quantities of acoustics, psychoacoustics has no limit values. It is because every person has a different perception and thus it is impossible to determine the action values. Sound can be analyzed and measured on the basis of physical conditions. The complete psychoacoustic analysis depends on the relationship between a person and his/ her perception. Noise can be assessed and analyzed using a multidimensional approach that takes into account the physical aspects of sound, its composition, frequency, psychoacoustic parameters (e.g. volume, sharpness, roughness, fluctuations strength) and the relationship between the listener and the sound source, information value of sound and cultural background. The quality of the acoustic environment is a term that is becoming more and more prominent. How to assess it, what descriptors and what criteria to use? The article deals with the issue of railway noise in terms of its psychoacoustic perception. The article does not aim to bring forward a complete solution to the issue but to present the issue as such. Keywords: psychoacoustics, railway noise, descriptors 24. J.A. IGE, M.A. ANIFOWOSE, M.O. OYELEKE, S.B. BAKARE, T.F. AKINJOBI – NIGERIA
PHYSIO-CHEMICAL ASSESSMENT OF GROUNDNUT SHELL ASH (GSA) BLENDED CALCIUM CHLORIDE (CACl2) AS SUPPLEMENTARY CEMENTING MATERIAL
155 Abstract: This study examine the effect of groundnut shell ash (GSA) blended calcium chloride (CaCl2) as supplementary cementing materials. The replacement levels of OPC with groundnut shell ash (GSA) were 0%, 5%, 10%, 15% and 20%. 1% of calcium chloride was blended with OPC/GSA in all experimental work. The following physical properties were determine on OPC and GSA; fineness test and specific gravity test while standard consistency and setting time test were conducted on OPC/GSA and OPC/GSA/CaCl2. The chemical composition of OPC and GSA was also determined. The result of the standard consistency revealed that as the percentage replacement increases, the consistency also increases for both OPC/GSA and OPC/GSA/CaCl2 respectively. However, the initial and final setting time shows that OPC/GSA/CaCl2 set faster than OPC/GSA. Keywords: Groundnut Shell (GS), Groundnut Shell Ash (GSA), Calcium Chloride (CaCl2), Cement (OPC)
ACTA TECHNICA CORVINIENSIS – Bulletin of Engineering
15 | F a s c i c u l e 3
25. Ján ZBOJOVSKÝ, Iraida KOLCUNOVÁ, Marek PAVLÍK, Marek ČEŠKOVIČ, František ADAMČÍK, Martin KRCHŇÁK – SLOVAKIA MODEL OF ANECHOIC CHAMBER FOR EVALUATING THE SHIELDING EFFECTIVENESS OF ELECTROMAGNETIC FIELD
159 Abstract: Over the last years occurred a rapid growth in the utilization of technology, in which is creating electromagnetic radiation of different frequencies. At first it was the high-voltage lines, transformers and electrical installations in houses. To these sources of field had been included also wireless network to the internet, telecommunications and navigation connection. Due to this it is necessary to pay attention and research it, while modeling belongs to a fundamental ways of developing and analyzes the propagation of field through various materials. This paper deals with model of anechoic chamber created in ANSYS HFSS. Model is created for evaluating the shielding effectiveness of materials with different properties. In that case it is possible to optimize the shielding effectiveness of materials with changing of its properties. Model works for frequency range from 1 to 10 GHz. Keywords: shielding effectiveness, electromagnetic field, frequency, anechoic chamber, ANSYS *** MANUSCRIPT PREPARATION – GENERAL GUIDELINES 163
The ACTA TECHNICA CORVINIENSIS – Bulletin of Engineering, Tome X [2017], Fascicule 3 [July – September] includes original papers submitted to the Editorial Board, directly by authors or by the regional collaborators of the Journal. Also, the ACTA TECHNICA CORVINIENSIS – Bulletin of Engineering, Tome X [2017], Fascicule 3 [July – September], includes scientific papers presented in the sections of: » The 11th International Conference ELEKTRO 2016,
organized by University of Žilina, Faculty of Electrical Engineering, in Štrbské Pleso – High Tatras, SLOVAKIA, May 16–18, 2016. The current identification numbers of the papers are the #6 and #10, according to the present contents list.
» The International Conference on Agricultural and Mechanical Engineering (ISB-INMA-TEH2016), organized by the National Institute of Research-Development for Machines and Installations Designed to Agriculture and Food Industry – INMA Bucharest and Biotechnical Systems Engineering – ISB Bucharest, in Bucharest, ROMANIA, 27–29 October 2016. The current identification number of the papers are the #20 and #22, according to the present contents list.
copyright ©University POLITEHNICA Timisoara,
Faculty of Engineering Hunedoara, 5, Revolutiei, 331128, Hunedoara, ROMANIA
http://acta.fih.upt.ro
ISSN:2067-3809

ACTA TECHNICA CORVINIENSIS – Bulletin of Engineering
16 | F a s c i c u l e 3
We are very pleased to inform that our international and interdisciplinary journal ACTA TECHNICA CORVINIENSIS Bulletin of Engineering completed its nine years of publication successfully [issues of years 2008 –2016, Tome I–IX]. In a very short period it has acquired global presence and scholars from all over the world have taken it with great enthusiasm.
Every year, in four online issues (fascicules 1 – 4), ACTA TECHNICA CORVINIENSIS Bulletin of Engineering [e-ISSN: 2067-3809] publishes a series of reviews covering the most exciting and developing fields of science and technology. Each issue contains papers reviewed by international researchers who are experts in their fields. The result is a journal that gives the scientists and engineers the opportunity to keep informed of all the current developments in their own, and related, areas of research, ensuring the new ideas across an increasingly the interdisciplinary field. Now, when will celebrate the tenth years anniversary of ACTA TECHNICA CORVINIENSIS Bulletin of Engineering, we are extremely grateful and heartily acknowledge the kind of support and encouragement from all contributors and all collaborators!
On behalf of the Editorial Board and Scientific Committees of ACTA TECHNICA CORVINIENSIS Bulletin of Engineering, we would like to thank the many people who helped make this journal successful. We thank all authors who submitted their work to ACTA TECHNICA CORVINIENSIS Bulletin of Engineering.
copyright © University POLITEHNICA Timisoara,
Faculty of Engineering Hunedoara, 5, Revolutiei, 331128, Hunedoara, ROMANIA
http://acta.fih.upt.ro
© copyright Faculty of Engineering – Hunedoara, University POLITEHNICA Timisoara
ACTA TECHNICA CORVINIENSIS – Bulletin of Engineering Tome X [2017] Fascicule 3 [July – September] ISSN: 2067 – 3809
1.Marko VLAHOVIĆ, 2.Mila KAVALIĆ, 3.Ljiljana RADOVANOVIĆ, 4.Darko BAĐOK, 5.Arben LUNJIĆ
CHECKING THE TIRES AS MEASURE OF EFFICIENCY INCREASE AND REDUCING WORKING COSTS OF FORKLIFTS - CASE STUDY OF COMPANY MERCATOR-S 1-5. University of Novi Sad, Technical faculty „Mihajlo Pupin”, Zrenjanin, SERBIA Abstract: By integrating companies IDEA and Mercator-S management of the new integrated company found itself facing the challenge of optimizing business activities in all aspects of work. One of the challenges was also in the field of logistics and administration in the field of transport within the warehouses. In order to try to reduce the cost of tires and increase transport efficiency within their logistics and distribution centers, the company Mercator-S has made an internal decision on additional quality control measures. The company has decided that every 15 days performs tire pressure checks and tread depth checks. Optimal rotation of the tire and adding pressure in those where it was necessary during the audit, the company Mercator-S is for only 2 years, in 2016, compared to 2014, according to the number of kilometers traveled on the fleet of 120 vehicles, increase the efficiency of their forklifts by 10% and reduce the cost of replacement tires by 29%. Keywords: cost reduction, logistics, quality control, transport efficiency, tires INTRODUCTION Restructuring of the company is related to a wide range of activities starting from the reorganization of business units, product lines or divisions to mergers, acquisitions, joint investments, spin-off and the curve-out activities. These activities represent forms of radical restructuring of companies in order to increase efficiency and profitability in the context of increased competition in markets. Corporate restructuring is can be divided into operational and financial restructuring processes. Operational restructuring refers to those changes in the structure of companies that are registered on the asset side of the balance of the company. Financial restructuring is related to activities which change the structure of the debt and equity of the company, relating to the changes registered on the liabilities side of the balance of the company. Mergers, acquisitions, decomposing company’s programs, LBO and MBO programs are used in practice in order to effect the restructuring of companies. What is common in all these programs is that there is a change in the ownership
structure, and therefore a change in corporate control. Usually these changes in corporate control are related with changes in the business strategies of companies[13]. In theory it is considered that mergers (fusion) are forms a negotiated integration of two or more firms that maintain an equal relationship in the newly-composed firms. But these genuine mergers in practice are very little because there was always one side dominant. Merger of equal is in the case when participants of mergers comparable in size, competitive position, profitability and market capitalization [8]. Gaughan alleges that the merger is a combination of two corporations, where one is surviving, and one that was merged cease to exist. The company which has a dominant role in the merger takes over the assets and liabilities of the other company[4]. Retail development through the integration, all large companies started with developing the concept of a central repository and central product distribution to the stores. This concept has become topical because of the efficiency which provides better inventory control

ACTA TECHNICA CORVINIENSIS – Bulletin of Engineering
18 | F a s c i c u l e 3
and timely delivery of all necessary products to all stores in the retail network. Trade, respectively retail consumer goods is very dynamic economic sector whose results, respectively sales of products and timely complement to inventories of retail sales objects largely depend on the optimal inventory control. The essence of one logistics and distribution center is to do timely reception of required goods, to adequately handle it within the warehouse and, in moment when it is necessary, deliver goods to the stores where it's necessary. Some selected management tools and logistics tools to improve processes are being presented. The starting points are classification procedures. The classification has positive effects on the planning and controlling of logistics processes. It simplifies the use of items and increases the transparency in summary. The combination of the Value, Rarity, Imitability and Organization (VRIO) model, the identification of technologies types and the characterization of resources allow the definition of logistics strategies, standard procedures and sets of logistics activities [5]. Management of goods within the warehouse by optimization of forklift work, will be the topic of this paper. In the following part of the paper will be presented how and how much the company Mercator-S in Serbia managed to reduce costs and increase the efficiency of logistics and distribution center. TEORETICAL FRAMEWORK AND BACKGROUND OF RESEARCH Pokrajac at al (2015) believes that reindustrialization is necessary and possible only in those industries that have considerable potential for growth of competitiveness on the international market. The key assumptions for this are constant growth of innovation and productivity, as well as other factors that essentially rely on new knowledge and new technology. This development trend is present in all advanced economies, including the European Union, to which Serbia aspires. In recent years, reindustrialization has become an increasingly dominant development strategy on a global scale. It involves a very ambitious plan related to the development of modern and sophisticated, environmentally responsible and energy-efficient industries, especially manufacturing sectors, which employ highly professional workers and foster close cooperation with universities and research institutes. In this context, governments, rather than the markets, are becoming the main change drivers, as they can contribute to creating the necessary industrial “state of mind”, which implies new redistribution of tasks and effects of labor among the key stakeholders in the process of creating new values: employees, owners, government, science, education, etc. [16]. Creating new value for the company should be a priority action of all
sectors. Operation and objectives should be focused on increasing efficiency and reducing costs at all levels. Today, as the experience of developed countries show, multiple sources of innovation are advisable to be developed in addition to the traditional linear model of innovation process [14]. Innovation of the process of functioning of certain sectors is a key link in achieving the productivity goals of enterprises, which is very important because each process innovate adequately and thus can improve the operations of the entire company. In turbulent commerce which characterizes all its branches, quality represents one of the rare tools that for companies provide possibility for diversification and separation from (dis)loyal competition. In order to achieve the competitiveness of the company, the first to be made such processes within each sector that may affect the profitability of the company. The profitability of distribution center in retail chains represents one of the key objectives and this goal should be followed by innovation and to implement changes for better business productivity. In distribution centers, maintenance and improvement of work of transport resources is crucial for the effectiveness of the sector. Transport resources that are commonly used in storage facilities are rack cranes and forklifts. Depending on the storage system, method of loading transport units from a truck in the warehouse, as well as finance, depends the choice of the machinery equipment. The choice of transportation means usually depends on the weight of the transport unit to be stored, the width of the corridor between racks and lifting height[15]. A contact between a vehicle and a surface on which it travels is maintained through its wheels i.e. tires [6;18]. Because of that, the characteristics of tires and their contact area with the surface and the physical processes that are developing there all have a major impact on vehicle’s handling and tire wear [1;2]. Tire wear is influenced by a variety of factors, among others being a driving style, which is often neglected. A driving style is determined by the three major factors, firstly the way a vehicle is accelerated from the standing position, secondly the intensity of braking and finally, the velocity during negotiating road bends and curves. Apart from the other factors, a tire wear is primarily dependent on energy absorbed within the tire grip area during braking or during vehicle acceleration [7]. A modern tire merges up to 300 different chemical elements, both organic and inorganic, natural and synthetic. During manufacturing, various processes are present such as mixing, calendering and extrusion, forming dozens of individual parts. Then, moulding and vulcanization inside special moulds provides the tire its final shape. Since the surface quality of moulds strongly affects the quality of tire, mould cleaning is a

ACTA TECHNICA CORVINIENSIS – Bulletin of Engineering
19 | F a s c i c u l e 3
fundamental aspect of the whole tire production and cleaning techniques are in continuous development [3]. Maximum availability of cost intensive machinery is highly dependent of minimizing downtime caused by maintenance. Permanent monitoring of a machine guarantees a reliable detection of most faults. An interactive diagnosis system can guide the maintenance staff to accomplish their tasks. A system architecture which supports permanent monitoring, interactive diagnosis as well as repair at site needs knowledge representation techniques which are specifically designed for these tasks [17]. RESEARCH METHODOLOGY – OBJECT AND RESEARCH PROBLEM The research problems in this paper represent increase efficiency and reduce labor costs of forklifts. The problem is also reflected in the fact that the quality control of tire does not work often enough. Due to the integration that has resulted in the increased number of retail outlets, and therefore a greater flow of goods through the warehouse, was followed by a greater utilization of forklifts. The subject of this paper is to analyze the company Mercator-S forklift work through the measurement of the costs and efficiency of forklifts in warehouses through the procedure of necessary tire checks and tire tread depth checks. » Objectives of research and main questions The scientific objective of this research is to identify some of the possible factors for assessing the quality that significantly affect the increase of work efficiency and reduce costs, while the social objective of the research is a recognition of all that in practice contributes to the development of logistics, optimal inventory management and internal transport. Based on the need to distribution and logistics center is managed effectively and efficiently, it is necessary to consider the use of transport vehicles, in this case forklifts. Based on of this stemmed the following research questions: RQ1: Does control and timely complement to the tire
pressure affects on greater efficiency and exploitation period?
RQ2: Does check of the tire tread depth affects on forklifts greater efficiency and on exploitation period?
R Q3: Does timely complement of pressures and check of the tire tread depth affects on cost reduction of forklift tire?
» Methods and organization of research When selecting methods and organization of this research, it was decided that from existing reports can get all the necessary data that could show whether the application of these procedures contribute to greater efficiency and / or reduce total cost of tire maintenance. All data were analyzed using the base index and the data obtained for 2015 and 2016 were compared with the year 2014, which, in this case, we observe as the base. The total number of these vehicles is increasing from year to year, but the cost unit per vehicle or kilometer is able to clearly demonstrate that Is there any reduction in costs. In 2014, the fleet consisted of 120 forklifts, 2015, 133, and in 2016 had a fleet of 144 vehicles available. Besides the changes of interannual total cost we have implemented and the method of calculation "Like for Like", in which we observed the total cost so that the total increase in the number of vehicles does not affect the overall value of cost unit. That is, everything is based on the number of 120 vehicles how many there were in 2014. RESULTS AND DISCUSSION OF RESEARCH Until the moment of integration, the company IDEA and Mercator-S were two separate companies whose logistics sectors had a task to supply their supermarkets on daily basis. Until the moment of integration IDEA 191 is supplied 191 store, and Mercator-S its 126 stores. After integration, that is merger, which was completed in November 2014, the company Mercator-S had on the market 317 shops that were needed to supply. Portfolio retail network before and after the integration is shown in Figure 1. Due to the optimization of storage space, there was a great need to rationalize costs and increase efficiency, and one of the segment which has been paid special attention were forklifts. Because of a permanent price increase of construction land, rationalization and optimization of costs, there was a need for better use of expensive storage space. In order to make transport more efficient in the warehouses, the company Mercator-S has decided that besides regular procedures implement and emergency procedures for checking the quality. All drivers who are in the warehouses were instructed to check every 15 days the tire pressure and tire tread depth. If the tire pressure is less than the one defined then approach to supplement the pressure, and if the tread on the tires is reduced to less than the prescribed measure, then access to the rotation of the tire. Rotation of the tire is the tire moving from one axle to another, in order to achieve their equal consumption, and performance durability of the vehicle. Tire rotation depends on the type of vehicle and drive of vehicle. The distribution of weight on the front and rear axles is

ACTA TECHNICA CORVINIENSIS – Bulletin of Engineering
20 | F a s c i c u l e 3
different for every vehicle. Also, the tire wear on different axles is uneven because usually the drive is on one axle, except for vehicles with all-wheel drive. This means that, depending on the drive, the tires wear unevenly.
Figure 1 – Overview: The portfolio of retail network
before and after integration Source: Mercator-S (2017)
To confirm that the rotation of the tire and check the pressure in them can give results, in the company Mercator-S is conducted a case study. Movement of the total cost, the number of kilometers traveled and the number of vehicles will undoubtedly show that the above-mentioned activities produce results. In Figure 2 we can see the movement of the total cost over the past 3 years. By applying the methods of the base index can be seen that the costs are in a significant decline. Interannual change in costs shows that, despite the growing number of vehicles, the overall height of the
tire and maintenance costs in 2015 and 2016, is significantly lower than the observed 2014. Besides the inter-annual total cost changes we applied and the method of calculation "Like for Like", where we looked at the total cost so that the total increase in the number of vehicles does not affect the overall value of the costs. That is, everything is based on the number of 120 vehicles how many were in 2014. According to that criterion, the maintenance costs of tires in 2015 were lower by 20% and in 2016 by 40% compared to 2014, which we consider as the base year for this analysis.
Figure 2 - Overview: The total cost for tire of forklifts in
warehouses. Source: Mercator-S (2017).
Figure 3 - Display: The cost per kilometer.
Source: Mercator-S (2017) However, in addition to the above analysis, in which the level of overall results proved claim of reducing costs, we started another analysis. In Figure 3 we can see the ratio of the total number of kilometers traveled, the number of vehicles and the cost per kilometer. On this figure, using basic index clearly shows that the number of vehicles and the number of kilometers traveled in 2015 and 2016 compared to 2014 increased, while the cost per kilometer recorded a significant drop in cost. The cost of one kilometer of distance traveled in 2016 was lower by 46% compared to the cost of one kilometer of distance traveled in 2014.

ACTA TECHNICA CORVINIENSIS – Bulletin of Engineering
21 | F a s c i c u l e 3
Quality control of pneumatics from all of the above, is undoubtedly prove that it can be a significant impact on reducing the cost of maintaining them. However, in addition, this measure of quality control has influenced the efficiency of the vehicle. Figure 4 shows the number of kilometers traveled per vehicle in 2015 compared to 2014, despite a reduction in costs, increased by slightly more than 3%, while in 2016 increased by more than 10 percent.
Figure 4 – Display: Number of kilometers traveled per
vehicle. Source: Mercator-S (2017). CONCLUSIONS Retail development through the integration all large companies started with the concept of developing a more central warehouse and central distribution of products to the stores, for reasons of efficiency to achieve a better control of inventory and timely delivery of all necessary products to all stores in the retail network. Management of goods within the warehouse was intended to reduce costs and increase efficiency as in this study confirmed. According to all of the above, we can conclude that the control of tires on forklifts is important for two reasons. First, because it impact on reducing the total cost which is shown by examples in Figure 2 and Figure 3, which clearly shows that maintenance costs of pneumatics are reduced in every aspect. Another reason is that with the reduced costs efficiency of the vehicle is increased. Figure 3 clearly shows that the number of kilometers traveled per vehicle, despite a reduction in costs in 2015 compared to 2014 was increased by slightly more than 3%, while in 2016 compared to 2014 increased by more than 10 percent. These figures are a clear indication that the economy and efficiency of logistics and transportation within a warehouse can be achieved by various quality control measures which, even in this domain, is necessary to apply.
References [1.] Bakker, E., Nyborg, L., and Pacejka, H., "Tyre
Modelling for Use in Vehicle Dynamics Studies," SAE Technical Paper 870421, 1987, doi: 10.4271/870421.
[2.] Danon, G., (1988) Tire adhesion during vehicle braking on a straight line (in Serbian) (PhD thesis), Belgrade: Faculty of Mechanical Engineering. doi:10.5937/jaes13-8700 Paper number: 13(2015)3, 321, 137 - 140
[3.] Fragassa, C. Ippoliti, M. (2016) “Technology assessment of tire mould cleaning systems and quality finishing”, International Journal for Quality Research 10(3), 2016, pp.523–54.
[4.] Gaughan, P., (2002). Mergers, Acquisitions, and Corporate Restructurings, Third Edition, John Wiley & Sons, Inc., New York, 2002, pp.7.
[5.] Glistau, E., Schenk M., & Coello, N.I., (2016) “Machado tools for improving logistics processes”, ANNALS of Faculty Engineering Hunedoara – International Journal of Engineering Tome XIV., ISSN: 1584-2665., pp.2015.
[6.] Janićijević, N., (1992) „Quality implications on the business of logistic companies“, Automatic control in motor vehicles (Serbian), Belgrade: Faculty, 13(2015)2, 316, pp.87 – 92.
[7.] Janićijević, N., (2015) „TYRE WEAR DURING BRAKING “Journal of Applied Engineering Science,
[8.] Mašić, S., (2009). Merdžeri i akvizicije u evropskom bankarstvu (Doctoral dissertation), Univerzitet Singidunum, 2009, pp. 27.
[9.] Mercator-S (2017), Internal date: „ The portfolio of retail network before and after integration“
[10.] Mercator-S (2017), Internal date: „The total cost for tire of forklifts in warehouses “
[11.] Mercator-S (2017), Internal date: „Number of kilometers traveled per vehicle“.
[12.] Mercator-S (2017), Internal date: „The cost per kilometer “.
[13.] Michael E.S. Frankel, (2005). Mergers and Acquisitions Basics: The Key steps of Acquisitions, Divestitures and Investments, John Wiley & Sons, Inc., Hoboken, New Jersey, ISBN: 978-0-471-67518-1., pp. 1
[14.] Nikolayevna Ryapukhina, V., Emiliya Viktorovna Suprun, E., Anatolievich Doroshenko Y., Miroslavovna Bukhonova S., Vladimirovna Somina I, “Strategy of effective management for small businesses at different stages of innovation activity“, Journal of Applied Engineering Science., ISSN: 1451-4117., E-ISSN: 1821-3197., DOI: 10.5937/jaes13-8116., pp. 117-125.
ACTA TECHNICA CORVINIENSIS – Bulletin of Engineering
22 | F a s c i c u l e 3
[15.] Pavlović, V. (2015), “Projektovanje regalnih skladišta uz primenu simulacija kao metoda za optimizaciju”, Zbornik radova Fakultet tehničkih nauka, Novi Sad, 10/2015, pp. 694-169.
[16.] Pokrajac, S., Nikolić, M., Filipović, M., Filipović, M., Josipović, S., Vasić, M., (2016): „Industrial competitiveness as a basis of Serbian reindustrialization, “Journal of Applied Engineering Science., doi:10.5937/jaes14-10442.,14(2016)2, 377, pp.248
[17.] Unbehend, C, (1994), “Small businesses at different stages of innovation activity“, Intelligent Systems Engineering', Second International Conference on `Intelligent Systems Engineering, 1994, pp. 448 – 454.
[18.] Wong, J.Y., (2008) Theory of ground vehicles (4th ed), New York: John Wiley & Sons.
copyright ©
University POLITEHNICA Timisoara, Faculty of Engineering Hunedoara,
5, Revolutiei, 331128, Hunedoara, ROMANIA http://acta.fih.upt.ro

© copyright Faculty of Engineering – Hunedoara, University POLITEHNICA Timisoara
ACTA TECHNICA CORVINIENSIS – Bulletin of Engineering Tome X [2017] Fascicule 3 [July – September] ISSN: 2067 – 3809
1.Dávid TÓTH, 2.Andrea MUDRIKOVÁ, 3.Peter KOŠŤÁL
THE ROLE OF STEP-NC IN DRAWINGLESS ENVIRONMENT 1-3. Slovak University of Technology, Faculty of Material Science and Technology, Institute of Production Technologies, J.Bottu 25, 91724 Trnava, SLOVAKIA Abstract: Modern manufacturing enterprises are built from facilities spread around the globe, which contain equipment from hundreds of different manufacturers. Immense volumes of product information must be transferred between the various facilities and machines. Today’s digital communications standards have solved the problem of reliably transferring information across global networks. For mechanical parts, the description of product data has been standardized by ISO10303 (STEP). This leads to the possibility of using standard data throughout the entire process chain in the manufacturing enterprise. Barriers to realizing this principle are the data formats used at the machine level. Most computer numerical control (CNC) machines are programmed in the ISO 6983 G-code language. Programs are typically generated by computer-aided manufacturing (CAM) systems that use computer-aided design (CAD) information. However, G-code limits program portability for three reasons. First, the language focuses on programming the tool center path with respect to machine axes, rather than the machining process with respect to the part. Second, the standard defines the syntax of program statements, but in most cases leaves the semantics ambiguous. Third, vendors usually supplement the language with extensions that are not covered in the limited scope of G-code. The replacement for G-code is so-called STEP-NC, the name STEP-NC meaning the STEP standard extended for NC. STEP-NC is a new model of data transfer between CAD/CAM systems and CNC machines. It remedies the shortcomings of G-code by specifying machining processes rather than machine tool motion, using the concept of working steps. Working steps correspond to high-level machining features and associated process parameters. CNCs are responsible for translating working steps to axis motion and tool operation. Keywords: STEP, CNC, G-code, production system, CAD, CAM INTRODUCTION Virtual Enterprise (VE) is a temporary alliance of enterprises that come together to share skills and resources in order to attend a business opportunity and whose cooperation is supported by computer network. STEP is a standard used in data transfer between these enterprises. SADT is a graphical representation and in a VE is used to elaborate diagrams to improve VE management and STEP performances. PDM can be defined as: electronic handling and control of product information throughout the whole product life cycle across system and organization boundaries by means of vaulting, workflow, and product structures. The goal of this paper is to elaborate the SADT diagrams for the product information and transfer used in VE. Virtual Reality (VR) technology uses digital computers and other special hardware and software to generate a simulation of an alternate world that is believable as real by the user. Engineers have been using computers for
years to create models of physical parts, devices and systems and simulate their operations, but the present CAD/CAM (Computer Aided Design / Computer Aided Manufacturing) systems lack the realism and interactive capability provided by an immersive VR environment. The implementation of a supporting infrastructure for Virtual Enterprise (VE) can be based on a number of component technologies and paradigms: » Interoperability and integration of standards – STEP,
EDI, TCP/IP, etc. » Integration of Workflow Management Systems; » Integration of advanced Information Management
Systems – PDM. » Integration of Safety and authentication mechanisms
– digital signature, etc. » Integration of MAS development environments; » Integration of legacy systems – PPC/MRP, CAD, CAM,
CAE, etc.

ACTA TECHNICA CORVINIENSIS – Bulletin of Engineering
24 | F a s c i c u l e 3
» Infrastructures – Internet/Intranet/Extranet, CORBA, Java, etc.
Virtual Enterprise challenges the way manufacturing systems are planned and managed. Shared virtual environments can allow engineers from different locations to work together and in the same time. These environments give engineers and designers a better understanding of the product, improve quality, reduce time to market and ensure that designs are right from the first time, reducing the need for expensive reworking later in the process. Collaboration can be extended outside a company by sharing virtual product information with suppliers and partners, creating a closer relationship in product development. The biggest change in recent times for the CAD/CAM industry lies with the term “integration” Integration plays a very important role in the future of CAD/CAM products. There have been big workstation-based integrated CAD/CAM systems around for many years. They provide CAD and CAM integration by providing all pieces from the same company. But now there is a new group of products touting integration as a key issue. They pursue integration through other means than single brand products. ENGINEERING DATA MANAGING Engineering data is difficult to manage because: » there is a lot of it (with more being created each day); » it is on many media (e.g. paper and magnetic disks); » it is used by many people in different functions (often
at different sites); » it is used by many computer programs (often on
different computers); » it often has several (different) definitions; » it exists in many different versions; » it has multiple relationships and meanings; » it may need to be maintained for many years (e.g. fifty
years). PDM systems treat engineering information as an important resource that is used by many functions in a company. They allow companies to get control of engineering information, and to manage activities in several departments. In the long term, PDM systems will allow companies to get control of all their engineering information, and manage the overall engineering process. These characteristics set them apart from systems such as CAD that aim to improve the productivity of individual tasks in one functional area. Viewed as data processing systems, EDM/PDM systems go beyond individual application programs such as CAD and NC. Viewed as organizational tools, they go beyond individual approaches such as DFA (Design for Assembly) and project management systems. PDM systems provide a backbone for the controlled flow of engineering information throughout the product life cycle. Other systems using engineering data, such as
CAD, NC, process planning, MRP and field service will be integrated to this backbone. For CAD/CAM integration and data transfer between different Integrated Design Systems from one enterprise to another we used STEP Standard in our study. It is the aim of the STEP architecture to standardize the exchange of product model data across three levels: description methods, integrated resources and application protocols (AP). The development and standardization of an AP, is really the development of a standard for the exchange of product data in a given domain. To do this, several intermediate models are set up: the “application activity model” (AAM), the “application reference model” (ARM) and finally the “application interpreted model” (AIM). SADT is a graphical representation which can transpose in programming language used in AAM (Application Activity Model) defined in norm ISO 10303 (STEP). This standard is utilized in data transfer between different Integrated Design Systems. The SADT methods has been exploited in order to structure the research oriented towards the realization of the directory scheme, for a better definition of the existing situation and for detaching the functional specifications of the projected system, which has to meet an analysis of the needs. We choose the actigramm as tools of shaping in our analysis. We understand to call “actigram” those diagrams of the model, which are graphically represented as boxes designated by verbs, sometimes accompanied by complementary data are represented by arrows and designated by names. This representation allows a description of the series or parallel activities, as well as of feedback. The model is hierarchically constructed. At its most general interpretation, the system is perceived as a simple box. I can therefore expand and decompose this box, thus creating a first diagram, which can provide wider information in the field. The boxes of this diagram can be deconstructed in their turn, and can create new diagrams, and so on and so forth, until we reach the proper level of detail. The first diagram is presented in Figure 1.
Figure 1. Diagram A-0: The data transfer
modeling by using STEP format The purpose of this SADT diagram is to optimize data transfer between different IDS software. At this case
ACTA TECHNICA CORVINIENSIS – Bulletin of Engineering
25 | F a s c i c u l e 3
study we work from last year and we don’t finish yet but we made some progress from last published paper. We develop this SADT until the “Generating the 2D or 3D parts/assemblies in CAD Module” activity. There are two ways to elaborate the parts/assemblies in IDS: The first one is to design the parts/assemblies directly in actual IDS and the second one is to import the parts/assemblies model realized in previous IDS. When the parts/assemblies 2D and 3D are generate from another IDS we must take account about transferring standards (STEP, IGES, and DWG/DXF) and make the adaptation of the part/assembly in the actual CAD. Whichever are the ways to elaborate the 2D and 3D assembly the final drawings and 3D parts are validating in the present IDS by project director? At the end of this stage the virtual prototype is realized and validated. Technical and functional data, part/assembly geometry are inputs. REASONS OF PDM SYSTEMS DESIGNING The SADT/STEP/PDM plays a major role in VE. PDM systems are designed to: » reduce engineering costs by at least 10%; » reduce the product development cycle by at least
20%; » reduce engineering change handling time by at least
30%; » reduce the number of engineering changes by at least
40%; » store, control, managed documents and other
information about products; » enable engineering teams to share information on
products and processes quickly and with consistent accuracy
» permit the integration of techniques such as CAD/CAM (Computer Aided Design/Computer Aided Manufacturing) into coherent business systems across an entire enterprise.
PDM addresses issues such as control, quality, reuse, security and availability of engineering data. PDM offers important new functions for the engineering environment. It will help solve many of the problems that beset today’s engineering environment, and for those who master it, will offer new strategic opportunities. The advantages of PDM used in Virtual Enterprises are: » reduce the time to introduce new products; » reduce the cost of developing new products; » reduce the cost of new products; » improve the quality of products and services; » improving design and manufacturing accuracy; » have a strong effect on competitively, market share
and revenues. All these benefits are achievable only if in the PDM systems are used the STEP Standard for data transfer
between enterprise and implicitly is very important to improve this data exchange by using SADT technique. DATA TRANSFER BETWEEN DIFFERENT INTEGRATED SYSTEMS IN VE The biggest problem in virtual industries is the need to work with the same IDS, in order to keep the historic of each piece of an assembly. This is nowadays one of the criteria of choosing the partners. If the IDS used by the designer is different by the one used by the programmer, the last one will use an imported model with no historic. If there is a revision of the model made by the designer, all the programs for the machining will be lost, just because the model used has no historic and it is like a read only model. In most of the companies there are lots of stories about this transfer issue, all of them with time, money lose. The compatibility of CAD / CAM / CAE is similar to that used to justify any technology-based improvement in manufacturing. It grows out of a need to continually improve productivity, quality and competitiveness. There are also other reasons why a company might make a conversion from manual processes to CAD/CAM: increased productivity, common database with manufacturing, better quality, better communication between posts, common database with manufacturing, reduced prototype construction costs, faster response to clients/partners. All these issues would disappear if the parts/assembly transfers between different IDS with historic would be possible. This is the reason why a transfer solution is searched for so many people. Starting from the similarity of design commands in any IDS, Shaft, Revolved Protusion, Revolve, Revolved Body and Pocket, Cut Extrude, Cutout, is a needed to be created the UML 2.0 architectures for shafts designed in CATIA, SOLID EDGE, UNIGRAPHICS and SOLID WORKS in order to transpose the UML in C++ Programming language and to obtain the agent source which can be transformed in import/export software by a programmer. After that the users of different IDS will be able to work on the part with full historic. The main idea of this architecture is to be the start point of the future professional software that will improve CAD/CAM/CAE communication between any software. This software is going to be able to read the steps made by the designer in the IDS that he is using and to actually redesign the part in the destination IDS, making the same moves like the designer, but using the other IDS commands. This way the part will be editable after each transfer. CONCLUSIONS Numerical Control (NC) machines were first introduced in the early 1950s and sparked the research and development of Computer Aided Manufacturing (CAM). In industry, CAD techniques are extensively used to
ACTA TECHNICA CORVINIENSIS – Bulletin of Engineering
26 | F a s c i c u l e 3
design products, and CAM techniques are used to manufacture the products. Special languages were developed to translate the shape information from the drawing into computer-controlled machine tools. Current NC programming is based on ISO 6983, called G-code, where the cutter motion is mainly specified in terms of position and the feed rate of axes. Even though G-code is a well-accepted standard world-wide it is in fact a bottleneck for today’s CNC production chain. Programming with G-code results huge programs which are difficult to handle; last-minute changes or correction of machining problems on the shop floor are hardly possible and control of program execution at the machine is severely limited. Even worse, due to many different dialects and vendor-specific additions to the programming language, part programs are not interchangeable between different controls. As a result, porting programs between machines is difficult. STEP is considered only a way to transfer data between different CAD-systems, but STEP has also developed towards manufacturing information management, the STEP-NC concept. STEP-NC provides not only a full description of the part, but the manufacturing process as well annotating CAD design data with manufacturing information about the stock, its cutting characteristics, and tool requirements. STEP-NC defines data representing working steps, a library of specific machining operations performed at the CNC, so that any controller will be able to calculate the tool path based on definitions contained in formatted routines integrated within the controller itself. STEP-NC is a new model of data transfer between CAD/CAM systems and CNC machines, which replaces G-code. It remedies the shortcomings of G-code by specifying machining processes rather than machine tool motion. Working steps correspond to high-level machining features and associated process parameters. CNCs are responsible for translating working steps to axis motion and tool operation. Basically, the standard is the smooth and seamless exchange of part information between CAD, CAM, and NC programming. At the moment STEP-NC standardization is in ISO/DIS phase (Draft International Standard) and international development work continues in many countries. Many end users have started their pilot-projects concerning utilization of STEP-NC and also CAD/CAM software vendors have made implementations for research projects. Acknowledgment: Institutional Project MTF 2016/002 – Flexible manufacturing systems in drawingless production References [1.] A. Nassehi, S. T. Newman, and R. D. Allen, “STEP-NC
compliant process planning as an enabler for adaptive global manufacturing,” 15th Int. Conf. Flex. Autom. Intell. Manuf. Int. Conf. Flex. Autom. Intell. Manuf., vol. 22, no. 5–6, pp. 456–467, Oct. 2006.
[2.] M. Rauch, R. Laguionie, J.-Y. Hascoet, and S.-H. Suh, “An advanced STEP-NC controller for intelligent machining processes,” Robot. Comput.-Integr. Manuf., vol. 28, no. 3, pp. 375–384, Jun. 2012.
[3.] P. Kostal and A. Mudrikova, “Laboratory of Flexible Manufacturing System,” AMR, no. 429, pp. 31–36, 2012.
[4.] X. W. Xu, L. Wang, and Y. Rong, “STEP-NC and function blocks for interoperable manufacturing,” IEEE Trans. Autom. Sci. Eng., vol. 3, no. 3, pp. 297–308, Jul. 2006.
[5.] G. Varga and J. Kundrak, “Effect of Environmentally Conscious Machining on Machined Surface Quality,” AMM, vol. 309, pp. 35–42, Feb. 2013.
[6.] F. Ridwan and X. Xu, “Advanced CNC system with in-process feed-rate optimisation,” Ext. Pap. Sel. FAIM 2011, vol. 29, no. 3, pp. 12–20, Jun. 2013.
[7.] P. Kosťal, D. R. Delgado Sobrino, R. Holubek, and R. Ruzarovsky, “Laboratory of Flexible Manufacturing System for Drawingless Manufacturing,” Appl. Mech. Mater., vol. 693, pp. 3–8, Dec. 2014.
[8.] R. Holubek, R. Ruzarovsky, and K. Velısek, “New Approach in Design of Automated Assembly Station for Disassembly Process,” Appl. Mech. Mater., vol. 421, pp. 595–600, 2013.
[9.] P. Tamas, B. Illes, and S. Tollar, “Simulation Of A Flexible Manufacturing System,” Adv. Logist. Syst., vol. 6, no. 1, pp. 25–32, 2012.
[10.] Y Shibata, N Takahashi, M Watanabe, “Approach of 2D Drawing Less and Automated Process in Structural Machining of Stamping Die,” Subaru Tech. Rev., no. 33, pp. 146–153, 2006.
[11.] P. Tamas, “Application of Value Stream Mapping at Flexible Manufacturing Systems,” Key Eng. Mater., vol. 686, pp. 168–173, 2016.
[12.] G. Bohacs and B. Kulcsar, “Comparison of three different methods in the prediction of the material flow in a material handling system,” Period. Polytech. Transp. Eng., vol. 27, no. 1–2, pp. 113–119, 1999.
copyright © University POLITEHNICA Timisoara,
Faculty of Engineering Hunedoara, 5, Revolutiei, 331128, Hunedoara, ROMANIA
http://acta.fih.upt.ro
© copyright Faculty of Engineering – Hunedoara, University POLITEHNICA Timisoara
ACTA TECHNICA CORVINIENSIS – Bulletin of Engineering Tome X [2017] Fascicule 3 [July – September] ISSN: 2067 – 3809
1,2.Dinara SOBOLA, 3.Ştefan ŢĂLU, 1.Pavel TOMÁNEK
SURFACE CONDITION OF GAAS SOLAR CELLS 1.Department of Physics, Faculty of Electrical Engineering and Communication, Brno University of Technology, Brno, CZECH REPUBLIC 2.CEITEC – Central European Institute of Technology, Brno University of Technology, Brno, CZECH REPUBLIC 3. Department of Automotive Engineering and Transportation, Faculty of Mechanical Engineering, Technical University of Cluj-Napoca, Cluj-Napoca, ROMANIA Abstract: This study is devoted to the description of GaAs solar cells topography and choice substitution of the method for surface study. It is in the attention because the surface condition can predefine the behavior of the heterojunction and efficiency of the device in common. The impact made to description of solar cells surface by atomic force microscopy and scanning electron microscopy. The sizes and shapes of surface morphology play an essential role in behavior and properties of materials in micro and nano-scale. The right choice of microcopy technique for morphology characterization is important for obtaining valuable data. Keywords: Solar cells, topography, microscopy, fractal analysis INTRODUCTION For optoelectronic device fabrication it is necessary to study every layer at heterostructure preparation. Study [1] emphasizes that the quality of surfaces and interfaces is a key problem in solar cell manufacturing process. Hence, efforts towards increasing of surface absorption within active layers, improving light scattering at the interfaces, reducing of losses, should include more detailed study of texture [1], [2]. Based on the research of Bruzzone et al [3] the place of characterization could be described by scheme (Figure 1) which reveals each step of the device preparation. Therefore, a combination of characterization methods allows gathering more information on the subject. Surface texturing (roughness) is often used to minimize reflection and is important for solar cells. Performance of solar cells demands improvements [5]: only the texturing reduces a reflectance of silicon solar cells from 35% to 11% [6]. Demand of texturing layers causes a lot of studies in this field, both theoretical and experimental. Light losses are huge when the optical system comprises elements with high reflective indexes. Also measured photocurrent depends on texturation, and was theoretically and experimentally proved [7].
Figure 1: Presence of characterization in the surfaces-
dependent devices [3] There are a number of textural factors that influence solar cells performance: interface of different layers, grain bounders, point defects of production belong to these factors. Topography influence also the contact
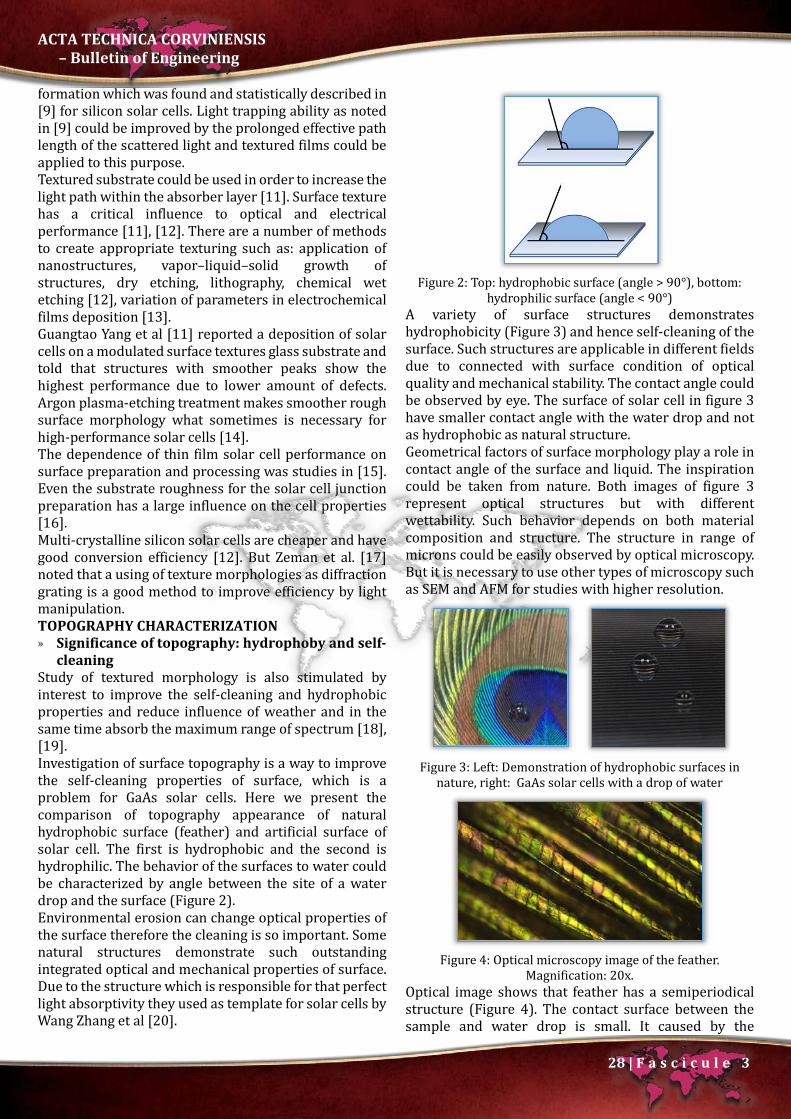
ACTA TECHNICA CORVINIENSIS – Bulletin of Engineering
28 | F a s c i c u l e 3
formation which was found and statistically described in [9] for silicon solar cells. Light trapping ability as noted in [9] could be improved by the prolonged effective path length of the scattered light and textured films could be applied to this purpose. Textured substrate could be used in order to increase the light path within the absorber layer [11]. Surface texture has a critical influence to optical and electrical performance [11], [12]. There are a number of methods to create appropriate texturing such as: application of nanostructures, vapor–liquid–solid growth of structures, dry etching, lithography, chemical wet etching [12], variation of parameters in electrochemical films deposition [13]. Guangtao Yang et al [11] reported a deposition of solar cells on a modulated surface textures glass substrate and told that structures with smoother peaks show the highest performance due to lower amount of defects. Argon plasma-etching treatment makes smoother rough surface morphology what sometimes is necessary for high-performance solar cells [14]. The dependence of thin film solar cell performance on surface preparation and processing was studies in [15]. Even the substrate roughness for the solar cell junction preparation has a large influence on the cell properties [16]. Multi-crystalline silicon solar cells are cheaper and have good conversion efficiency [12]. But Zeman et al. [17] noted that a using of texture morphologies as diffraction grating is a good method to improve efficiency by light manipulation. TOPOGRAPHY CHARACTERIZATION » Significance of topography: hydrophoby and self-
cleaning Study of textured morphology is also stimulated by interest to improve the self-cleaning and hydrophobic properties and reduce influence of weather and in the same time absorb the maximum range of spectrum [18], [19]. Investigation of surface topography is a way to improve the self-cleaning properties of surface, which is a problem for GaAs solar cells. Here we present the comparison of topography appearance of natural hydrophobic surface (feather) and artificial surface of solar cell. The first is hydrophobic and the second is hydrophilic. The behavior of the surfaces to water could be characterized by angle between the site of a water drop and the surface (Figure 2). Environmental erosion can change optical properties of the surface therefore the cleaning is so important. Some natural structures demonstrate such outstanding integrated optical and mechanical properties of surface. Due to the structure which is responsible for that perfect light absorptivity they used as template for solar cells by Wang Zhang et al [20].
Figure 2: Top: hydrophobic surface (angle > 90°), bottom:
hydrophilic surface (angle < 90°) A variety of surface structures demonstrates hydrophobicity (Figure 3) and hence self-cleaning of the surface. Such structures are applicable in different fields due to connected with surface condition of optical quality and mechanical stability. The contact angle could be observed by eye. The surface of solar cell in figure 3 have smaller contact angle with the water drop and not as hydrophobic as natural structure. Geometrical factors of surface morphology play a role in contact angle of the surface and liquid. The inspiration could be taken from nature. Both images of figure 3 represent optical structures but with different wettability. Such behavior depends on both material composition and structure. The structure in range of microns could be easily observed by optical microscopy. But it is necessary to use other types of microscopy such as SEM and AFM for studies with higher resolution.
Figure 3: Left: Demonstration of hydrophobic surfaces in
nature, right: GaAs solar cells with a drop of water
Figure 4: Optical microscopy image of the feather.
Magnification: 20x. Optical image shows that feather has a semiperiodical structure (Figure 4). The contact surface between the sample and water drop is small. It caused by the

ACTA TECHNICA CORVINIENSIS – Bulletin of Engineering
29 | F a s c i c u l e 3
structure, and particularly by spaces full of air between the sample surface and water drop. A water drop touches the surface only in some places. But image of the GaAs sample solar cell (even at five time large magnification) don’t show presence of organized surface structuration (Figure 5). The area of contact with water drop of the GaAs solar cell surface is larger than for the feather surface. Besides difference of materials, the large difference exists between the topography of hydrophobic and hydrophilic surfaces.
Figure 5: Optical microscopy image of the GaAs surface.
Magnification: 100x. This is one of the examples why deeper study of topography is essential. A lot of properties and functional characteristics are defined by the appearance of the surface. And it is necessary to make a right choice of the microscopy technique to study the nano-topography of the samples. Two types of microscopy, scanning electron microscopy (SEM) and atomic force microscopy (AFM) was used for evaluation of surface micro- and nano-geometry. SEM allows studying large areas of the solar cells with considerable surface roughness (more than 10 m) and AFM was carry out on a certain relatively smooth area but by truly 3D measurement. Actual probes methods are more comfortable for studying of solid materials surfaces. » Atomic force microscopy AFM is a 3D surface morphology technique that provides quantitative information about surface, and defines roughness of the surface, sizes of features [21].
Figure 6: AFM 3D-image of GaAs solar cell
Numerical characterization of the morphology allows estimating the roughness. Even own software (we use Nova, NTMDT) provides a lot of possibilities of data
processing. Being quite limited in range of heights, AFM allows precise measurements of surface nano-asperities in XYZ coordinates. The sizes of islands could be found by cross-section (Figure 7).
Figure 7: AFM image (left) and its: cross-section (right)
So, AFM gives quantitative data about the whole topography (Figure 7) and its local features (Figure 8). Qualitative data include the distribution of the values at the surface and quantitative their precise values.
Figure 8: Distribution of peaks for the topography in figure 6
Figure 8 show that the topography has the large amount of peaks in the range from 50 to 200 nm. The surface is relatively smooth. The features are smaller than visible light wavelength. Watershed segmentation is helpful when it is necessary to divide and to count the texture features. This is a really interesting method when surface elements are barely recognized, for example in the case where image quality is lacking. This method receives its’ name because of lines which divide topography elements. They look like the channels where water trickles down from the peaks of features.
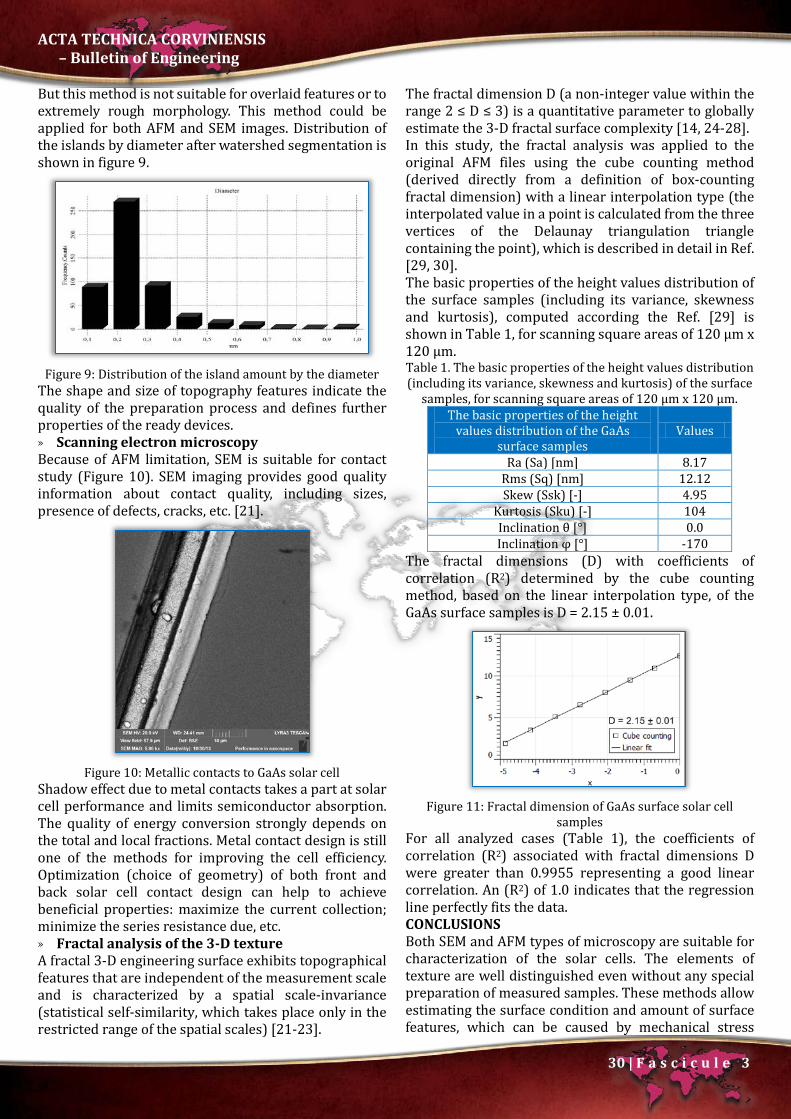
ACTA TECHNICA CORVINIENSIS – Bulletin of Engineering
30 | F a s c i c u l e 3
But this method is not suitable for overlaid features or to extremely rough morphology. This method could be applied for both AFM and SEM images. Distribution of the islands by diameter after watershed segmentation is shown in figure 9.
Figure 9: Distribution of the island amount by the diameter
The shape and size of topography features indicate the quality of the preparation process and defines further properties of the ready devices. » Scanning electron microscopy Because of AFM limitation, SEM is suitable for contact study (Figure 10). SEM imaging provides good quality information about contact quality, including sizes, presence of defects, cracks, etc. [21].
Figure 10: Metallic contacts to GaAs solar cell
Shadow effect due to metal contacts takes a part at solar cell performance and limits semiconductor absorption. The quality of energy conversion strongly depends on the total and local fractions. Metal contact design is still one of the methods for improving the cell efficiency. Optimization (choice of geometry) of both front and back solar cell contact design can help to achieve beneficial properties: maximize the current collection; minimize the series resistance due, etc. » Fractal analysis of the 3-D texture A fractal 3-D engineering surface exhibits topographical features that are independent of the measurement scale and is characterized by a spatial scale-invariance (statistical self-similarity, which takes place only in the restricted range of the spatial scales) [21-23].
The fractal dimension D (a non-integer value within the range 2 ≤ D ≤ 3) is a quantitative parameter to globally estimate the 3-D fractal surface complexity [14, 24-28]. In this study, the fractal analysis was applied to the original AFM files using the cube counting method (derived directly from a definition of box-counting fractal dimension) with a linear interpolation type (the interpolated value in a point is calculated from the three vertices of the Delaunay triangulation triangle containing the point), which is described in detail in Ref. [29, 30]. The basic properties of the height values distribution of the surface samples (including its variance, skewness and kurtosis), computed according the Ref. [29] is shown in Table 1, for scanning square areas of 120 µm x 120 μm. Table 1. The basic properties of the height values distribution (including its variance, skewness and kurtosis) of the surface
samples, for scanning square areas of 120 µm x 120 μm. The basic properties of the height
values distribution of the GaAs surface samples
Values
Ra (Sa) [nm] 8.17
Rms (Sq) [nm] 12.12 Skew (Ssk) [-] 4.95
Kurtosis (Sku) [-] 104 Inclination θ [°] 0.0 Inclination φ [°] -170
The fractal dimensions (D) with coefficients of correlation (R2) determined by the cube counting method, based on the linear interpolation type, of the GaAs surface samples is D = 2.15 ± 0.01.
Figure 11: Fractal dimension of GaAs surface solar cell
samples For all analyzed cases (Table 1), the coefficients of correlation (R2) associated with fractal dimensions D were greater than 0.9955 representing a good linear correlation. An (R2) of 1.0 indicates that the regression line perfectly fits the data. CONCLUSIONS Both SEM and AFM types of microscopy are suitable for characterization of the solar cells. The elements of texture are well distinguished even without any special preparation of measured samples. These methods allow estimating the surface condition and amount of surface features, which can be caused by mechanical stress
ACTA TECHNICA CORVINIENSIS – Bulletin of Engineering
31 | F a s c i c u l e 3
between layers of the solar cells. This affects electron mobility and diffusion length, band structure, surface passivation. It is possible to measure both quality and quantity data of surface by these well-known microscopy methods. Texture shows the measure of surface roughness. There are also numbers of data processing techniques for roughness estimation. And every method gives its own unique information about the surface. Our results suggest that AFM, the statistical surface roughness parameters and fractal analysis may provide additional insight for characterization of the solar cells. All these parameters can be included in a mathematical model to compute micro/nanotopography of the surfaces (surface texture) in describing surface contact and wear both theoretically and experimentally and could become essential in designing of new GaAs solar cells. Acknowledgements Research described in the paper was financially supported by the Ministry of Education, Youth and Sports of the Czech Republic under the project CEITEC 2020 (LQ1601), by project Sensor, Information and Communication Systems SIX CZ.1.05/2.1.00/03.0072 and by the Grant Agency of the Czech Republic under no. GAEÈ R 15-05259S. Appendix The basic properties of the height values distribution, including its variance, skewness and kurtosis, computed according the Ref. [29] is defined as follows: RMS value of the height irregularities: this quantity is
computed from data variance. Ra value of the height irregularities: this quantity is
similar to RMS value with the only difference in exponent (power) within the data variance sum. As for the RMS this exponent is q = 2, the Ra value is computed with exponent q = 1 and absolute values of the data (zero mean).
Height distribution skewness: computed from 3rd central moment of data values.
Height distribution kurtosis: computed from 4th central moment of data values.
Mean inclination of facets in area: computed by averaging normalized facet direction vectors.
Variation, which is calculated as the integral of the absolute value of the local gradient.
Declaration of interest: The authors claim to have no financial interest, either directly or indirectly, in the products or information listed in the article. The authors alone are responsible for the content and writing of the paper. References [1.] Sever, M., J. Krc, M. Topic. Prediction of defective
regions in optimisation of surface textures in thin-film silicon solar cells using combined model of layer growth. Thin Solid Films. 2014, vol. 573, pp. 176–184.
[2.] Magnin, V., J. Harari, M. Halbwax, S. Bastide, D. Cherfi,
J.P. Vilcot. Angle-dependent ray tracing simulations of reflections on pyramidal textures for silicon solar cells. Solar Energy. 2014, vol. 110, pp. 378–385
[3.] Bruzzone, A. A. G, H. L. Costa, P. M. Lonardo, D. A. Lucca. Advances in engineered surfaces for functional performance. CIRP Annals - Manufacturing Technology. 2008, vol. 57, pp. 750–769
[4.] Roughness of solar cells. Available at: http://www.nanosurf.com/upload/appnote/100539_an00288_solar_cell_roughness.pdf
[5.] Topic, M., M. Sever, B. Lipovsek, A. CČampa, J. Krc. Approaches and challenges in optical modelling and simulation of thin-film solar cells. Solar Energy Materials & Solar Cells. 2015, vol. 135, pp. 57-66
[6.] Ultrafast Laser Texturing for Enhanced Solar Cell Performance and Lower Cost. Available at: http://sionyx.com/pdf/solarcellperformancewhitepaper.pdf
[7.] Dmitruk, N. L., O. Y. Borkovskaya, I. N. Dmitruk, I. B. Mamontova. Analysis of thin film surface barrier solar cells with a microrelief interface. Solar Energy Materials & Solar Cells. 2003, vol. 76, pp. 625–635
[8.] SČkarvada, P., P. Tomanek, P. Koktavy, R. Macku, J. SČ icner, M. Vondra, D. Dallaeva, S. Smith, L. Grmela. A variety of microstructural defects in crystalline silicon solar cells. Applied Surface Science. 2014, vol. 312, pp. 50-56
[9.] Khanna, A., P. K. Basu, A. Filipovic, V. Shanmugam, C. Schmiga, A. G. Aberle, T. Mueller. Influence of random pyramid surface texture on silver screen-printed contact formation for monocrystalline silicon wafer solar cells. Solar Energy Materials & Solar Cells. 2015, vol. 132, pp. 589–596
[10.] Jiang, Q., J. Lu, J. Zhang, Y. Yuan, H. Cai, Ch. Wu, R. Sun, B. Lu, X. Pan, Z. Ye. Texture surfaces and etching mechanism of ZnO:Al films by a neutral agent for solar cells. Solar Energy Materials & Solar Cells. 2014, vol. 130, pp.264–271
[11.] Yang, G., R. A. C. M. M. Van Swaaij, H. Tan, I. Olindo, M. Zeman. Modulated surface textured glass as substrate for high efficiency microcrystalline silicon solar cells. Solar Energy Materials & Solar Cells. 2015, vol. 133, pp.156–162
[12.] Dou, B., R. Jia, H. Li, C. Chen, Y. Sun, Y. Zhang, W. Ding, Y. Meng, X. Liu, T. Ye. Fabrication of ultra-small texture arrays on multicrystalline silicon surface for solar cell application. Solar Energy. 2013, vol.91, pp. 145–151.
[13.] Ren, X. W. Zi, Q. Ma, F. Xiao, F. Gao, S. Hu, Y. Zhou, S. Liu. Topology and texture controlled ZnO thin film electro deposition for superior solar cell efficiency. Solar Energy Materials & Solar Cells. 2015, vol. 134, pp. 54–59
[14.] Ding, L., L.Fanni, D. Messerschmidt, S. Zabihzadeh, M. Morales-Masis, S. Nicolay, C. Ballif. Tailoring the surface morphology of zinc oxide films for high-performance micromorph solar cells. Solar Energy

ACTA TECHNICA CORVINIENSIS – Bulletin of Engineering
32 | F a s c i c u l e 3
Materials & Solar Cells. 2014, vol. 128, pp. 378–385 [15.] Erayerkan, M., V. Chawla, I. Repins, M. A. Scarpulla.
Interplay between surface preparation and device performance in CZTSSe solar cells: Effects of KCN and NH4OH etching. Solar Energy Materials & Solar Cells. 2015, vol. 136, pp. 78–85.
[16.] Li, H. B. T., R. H. Franken, J. K. Rath, R. E. I. Schropp. Structural defects caused by a rough substrate and their influence on the performance of hydrogenated nano-crystalline silicon n–i–p solar cells. Solar Energy Materials & Solar Cells. 2009, vol. 93, pp. 338–349
[17.] Zeman, M., O. Isabella, S. Solntsev, K. Jager. Modelling of thin-film silicon solar cells. Solar Energy Materials & Solar Cells. 2013, vol. 119, pp. 94–111.
[18.] Mugica-Vidal, R. F. Alba-Elıas, E. Sainz-Garcıa, J. Ordieres-Mere. Atmospheric plasma-polymerization of hydrophobic and wear-resistant coatings on glass substrates. Surface & Coatings Technology. 2014, vol. 259, pp. 374–385.
[19.] Roppolob, I., N. Shahzad, A. Sacco, E.Tresso, M. Sangermano. Multifunctional NIR-reflective and self-cleaning UV-cured coating for solar cell applications based on cycloaliphatic epoxy resin. Progress in Organic Coatings. 2014, vol. 77, pp. 458– 462.
[20.] Zhang, W., D. Zhang, T. Fan, J. Gu, J. Ding, H. Wang, Q. Guo, H. Ogawa. Novel Photoanode Structure Templated from Butterfly Wing Scales. Chemistry of Materials. 2009, vol. 21, pp. 33–40.
[21.] Ţalu, Ş., Micro and nanoscale characterization of three dimensional surfaces. Basics and applications. Napoca Star Publishing House, Cluj-Napoca, Romania, 2015
[22.] Dallaeva, D., Ţalu, Ş., Stach, S., SČkarvada, P., Tomanek, P., Grmela L., AFM imaging and fractal analysis of surface roughness of AlN epilayers on sapphire substrates. Applied Surface Science. 2014, vol. 312, pp. 81-86
[23.] Stach, S., Dallaeva, D., Ţalu, Ş., Kaspar, P., Tomanek, P., Giovanzana, S., Grmela, L. Morphological features in aluminum nitride epilayers prepared by magnetron sputtering. Materials Science-Poland. 2015, vol. 33(1), pp. 175-184
[24.] Ramazanov, S., Ţalu, Ş., Sobola, D., Stach, S., Ramazanov, G. Epitaxy of silicon carbide on silicon: Micromorphological analysis of growth surface evolution. Superlattices and Microstructures. 2015, vol. 86, pp. 395-402.
[25.] Ţalu, Ş., Stach, S., Zaharieva, J., Milanova, M., Todorovsky, D., Giovanzana, S. Surface roughness characterization of poly(methylmethacrylate) films with immobilized Eu(III) β-Diketonates by fractal analysis. Int J Polym Anal Ch. 2014, vol. 19(5), pp. 404-421
[26.] Ţalu, Ş., Stach, S., Ikram, M., Pathak, D., Wagner, T., Nunzi, J.M., Surface roughness characterization of ZnO: TiO2 - organic blended solar cells layers by atomic force microscopy and fractal analysis.
International Journal of Nanoscience, 2014, vol. 13, no. 3, pp. 1450020-1
[27.] Arman, A., Ţalu, Ş., Luna, C., Ahmadpourian, A., Naseri, M., Molamohammadi, M., Micromorphology characterization of copper thin films by AFM and fractal analysis. J Mater Sci: Mater Electron. 2015, vol. 26, no. 12, pp. 9630-9639
[28.] Ţalu, Ş., Ghazai, A.J., Stach, S., Hassan, A., Hassan, Z., Ţalu, M., Characterization of surface roughness of Pt Schottky contacts on quaternary n-Al0.08In0.08Ga0.84N thin film assessed by atomic force microscopy and fractal analysis. J. Mater. Sci. Mater. El., 2014, vol. 25, no. 1, pp. 466–477
[29.] Gwyddion 2.37 software (Copyright © 2004-2007, 2009-2014 Petr Klapetek, David Necas, Christopher Anderson). Available from: http://gwyddion.net (last accessed March 20th, 2017).
[30.] Douketis, C., Wang, Z., Haslett, T.L., Moskovits, M. Fractal character of cold-deposited silver films determined by low-temperature scanning tunneling microscopy. Phys. Rev. B., 1995, vol. 51, pp. 11022–11032.
copyright © University POLITEHNICA Timisoara,
Faculty of Engineering Hunedoara, 5, Revolutiei, 331128, Hunedoara, ROMANIA
http://acta.fih.upt.ro

© copyright Faculty of Engineering – Hunedoara, University POLITEHNICA Timisoara
ACTA TECHNICA CORVINIENSIS – Bulletin of Engineering Tome X [2017] Fascicule 3 [July – September] ISSN: 2067 – 3809
1.Valery Gomdje HAMBATE, 1.Sophie NGOUADJIO, 1.Lemankreo DAÏ-YANG, 2.Andrew Edwin OFUDJE, 3.Mbadcam Joseph KETCHA, 1.Benoît LOURA
CHEMICAL TREATMENT OF SUGARCANE BAGASSE FOR THE PRODUCTION OF CELLULOSIC FIBERS 1.Department of Textile and Leather Engineering, The Higher Institute of the Sahel, University of Maroua, CAMEROON 2.Department of Chemical Sciences, McPherson University, Ogun State, NIGERIA 3.Laboratory of Physical &Theoritical Chemistry, Department of Inorganic Chemistry, University of Yaounde, CAMEROON Abstract: The extraction of cellulosic fibers from sugarcane bagasse and the characterization of these fibers are carried out in this study. Sugarcane bagasse was treated with an alkaline solution in order to get cellulosic fibers. Sugarcane bagasse were analyzed by X-ray diffraction, Fourier transformed infra-red, Scanning electronic microscopic, Transmission electronic microscopic and differential thermal analysis/thermogravimetric analysis in nitrogen gas. Influence of the temperature and the mass of the fiber are studied, the temperature has an effect on the color of the fiber and the concentration of sodium hydroxide used, and more the soaking time increases the fiber mass decreases. It is found that the extraction yield of the fibers decreases as soaking time increases, the highest extraction yield is obtained at a temperature of 60°C with a concentration of sodium hydroxide of 0.1mol/L and the moisture content is 31.1%. The results obtained show that the process of extracting the fiber and controlling certain parameters such as temperature, concentration of sodium hydroxide and soaking time have an effect on the quality of the fiber obtained. Keywords: Extraction; Sugarcane bagasse; cellulosic fibers; soaking time INTRODUCTION Waste from sugarcane is a real problem in the sugar industry in its management and valorization, yet the applications of sugarcane bagasse is no longer to be demonstrated in the paper industries by the production of paper pulp and energy fields by the production of bio fuel [1]. Natural cellulose fibers are often extracted from lignocellulosic substances using biochemical and chemical methods. Sometimes traditional methods are used to extract natural cellulose fiber using microorganisms but they have limitations [2,3]. Although atmospheric retting provides better quality fibers, it requires relatively longer duration and it is difficult to control the fiber quality. Chemical extraction is recognized as effective in view of the convincing results obtained by the separation of lignin from cellulose. Alkaline treatment with sodium hydroxide has shown its effectiveness and several studies have been reported [4,5], delignification methods with sodium hypochlorite are frequently used
[6]. The cellulose from sugarcane bagasse can be easily obtained by acid hydrolysis followed by an alkaline pulping process. During the hydrolysis, the reagents acts on the lignin, breaking the macromolecule into units of low molecular weight, which are soluble in the liquor [7]. However this reaction is not strong enough to eliminate all lignin and hemicelluloses residues; therefore an additional process can be used. The bleaching treatment can be made with sodium chloride, which can result in cellulose degradation [8], and different properties and characteristics of cellulose arise. Chemical concentration, temperature and duration of treatment are the main factors determining the quality of chemically extracted fibers [9]. Cellulose is a main component of plant cell walls, including wood, cotton, jute, hemp, cereal straw, etc. It is constantly being renewed by photosynthesis. Its presence in plant tissues makes them compounds of vital importance and opens up new perspectives for research. It’s a macromolecular component, made by the linking of smaller molecules. The links in the cellulose
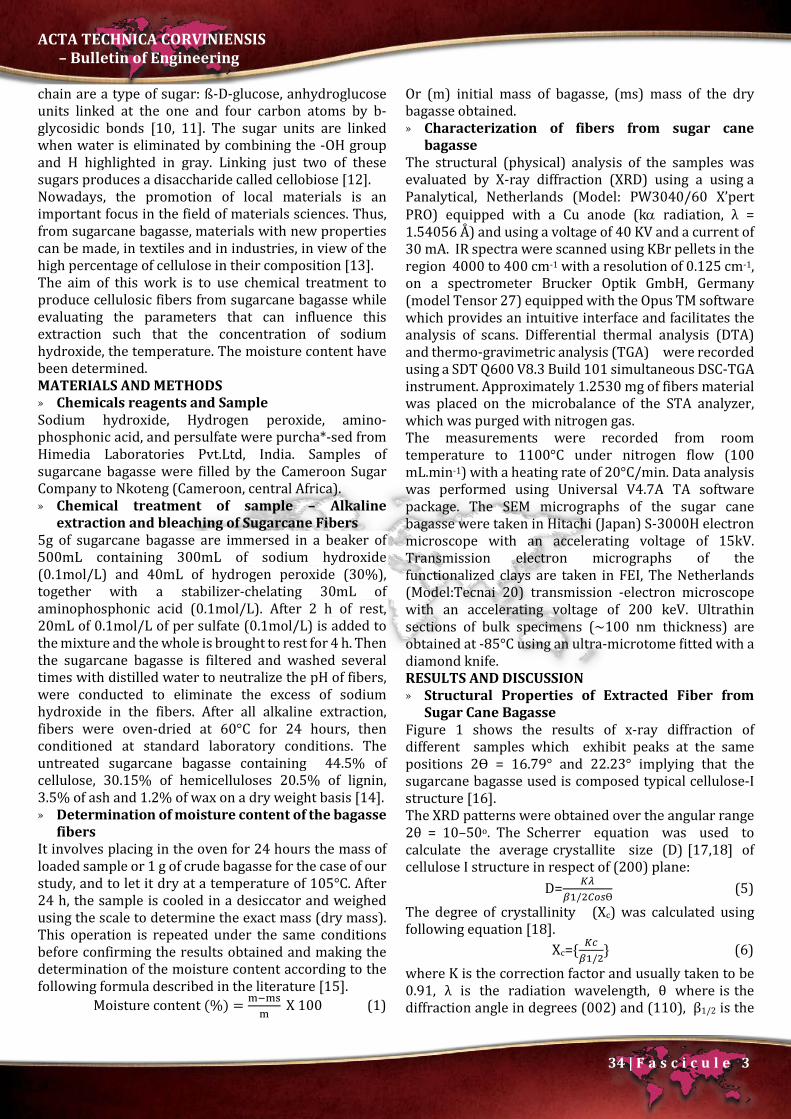
ACTA TECHNICA CORVINIENSIS – Bulletin of Engineering
34 | F a s c i c u l e 3
chain are a type of sugar: ß-D-glucose, anhydroglucose units linked at the one and four carbon atoms by b-glycosidic bonds [10, 11]. The sugar units are linked when water is eliminated by combining the -OH group and H highlighted in gray. Linking just two of these sugars produces a disaccharide called cellobiose [12]. Nowadays, the promotion of local materials is an important focus in the field of materials sciences. Thus, from sugarcane bagasse, materials with new properties can be made, in textiles and in industries, in view of the high percentage of cellulose in their composition [13]. The aim of this work is to use chemical treatment to produce cellulosic fibers from sugarcane bagasse while evaluating the parameters that can influence this extraction such that the concentration of sodium hydroxide, the temperature. The moisture content have been determined. MATERIALS AND METHODS » Chemicals reagents and Sample Sodium hydroxide, Hydrogen peroxide, amino-phosphonic acid, and persulfate were purcha*-sed from Himedia Laboratories Pvt.Ltd, India. Samples of sugarcane bagasse were filled by the Cameroon Sugar Company to Nkoteng (Cameroon, central Africa). » Chemical treatment of sample – Alkaline
extraction and bleaching of Sugarcane Fibers 5g of sugarcane bagasse are immersed in a beaker of 500mL containing 300mL of sodium hydroxide (0.1mol/L) and 40mL of hydrogen peroxide (30%), together with a stabilizer-chelating 30mL of aminophosphonic acid (0.1mol/L). After 2 h of rest, 20mL of 0.1mol/L of per sulfate (0.1mol/L) is added to the mixture and the whole is brought to rest for 4 h. Then the sugarcane bagasse is filtered and washed several times with distilled water to neutralize the pH of fibers, were conducted to eliminate the excess of sodium hydroxide in the fibers. After all alkaline extraction, fibers were oven-dried at 60°C for 24 hours, then conditioned at standard laboratory conditions. The untreated sugarcane bagasse containing 44.5% of cellulose, 30.15% of hemicelluloses 20.5% of lignin, 3.5% of ash and 1.2% of wax on a dry weight basis [14]. » Determination of moisture content of the bagasse
fibers It involves placing in the oven for 24 hours the mass of loaded sample or 1 g of crude bagasse for the case of our study, and to let it dry at a temperature of 105°C. After 24 h, the sample is cooled in a desiccator and weighed using the scale to determine the exact mass (dry mass). This operation is repeated under the same conditions before confirming the results obtained and making the determination of the moisture content according to the following formula described in the literature [15].
Moisture content (%) = m−msm
X 100 (1)
Or (m) initial mass of bagasse, (ms) mass of the dry bagasse obtained. » Characterization of fibers from sugar cane
bagasse The structural (physical) analysis of the samples was evaluated by X-ray diffraction (XRD) using a using a Panalytical, Netherlands (Model: PW3040/60 X’pert PRO) equipped with a Cu anode (kα radiation, λ = 1.54056 Å) and using a voltage of 40 KV and a current of 30 mA. IR spectra were scanned using KBr pellets in the region 4000 to 400 cm-1 with a resolution of 0.125 cm-1, on a spectrometer Brucker Optik GmbH, Germany (model Tensor 27) equipped with the Opus TM software which provides an intuitive interface and facilitates the analysis of scans. Differential thermal analysis (DTA) and thermo-gravimetric analysis (TGA) were recorded using a SDT Q600 V8.3 Build 101 simultaneous DSC-TGA instrument. Approximately 1.2530 mg of fibers material was placed on the microbalance of the STA analyzer, which was purged with nitrogen gas. The measurements were recorded from room temperature to 1100°C under nitrogen flow (100 mL.min-1) with a heating rate of 20°C/min. Data analysis was performed using Universal V4.7A TA software package. The SEM micrographs of the sugar cane bagasse were taken in Hitachi (Japan) S-3000H electron microscope with an accelerating voltage of 15kV. Transmission electron micrographs of the functionalized clays are taken in FEI, The Netherlands (Model:Tecnai 20) transmission -electron microscope with an accelerating voltage of 200 keV. Ultrathin sections of bulk specimens (~100 nm thickness) are obtained at -85°C using an ultra-microtome fitted with a diamond knife. RESULTS AND DISCUSSION » Structural Properties of Extracted Fiber from
Sugar Cane Bagasse Figure 1 shows the results of x-ray diffraction of different samples which exhibit peaks at the same positions 2Ɵ = 16.79° and 22.23° implying that the sugarcane bagasse used is composed typical cellulose-I structure [16]. The XRD patterns were obtained over the angular range 2θ = 10–50o. The Scherrer equation was used to calculate the average crystallite size (D) [17,18] of cellulose I structure in respect of (200) plane:
D= 𝐾𝐾𝐾𝐾𝛽𝛽1/2𝐶𝐶𝐶𝐶𝐶𝐶Ɵ
(5) The degree of crystallinity (Χc) was calculated using following equation [18].
Χc= 𝐾𝐾𝐾𝐾𝛽𝛽1/2
(6) where K is the correction factor and usually taken to be 0.91, λ is the radiation wavelength, θ where is the diffraction angle in degrees (002) and (110), β1/2 is the
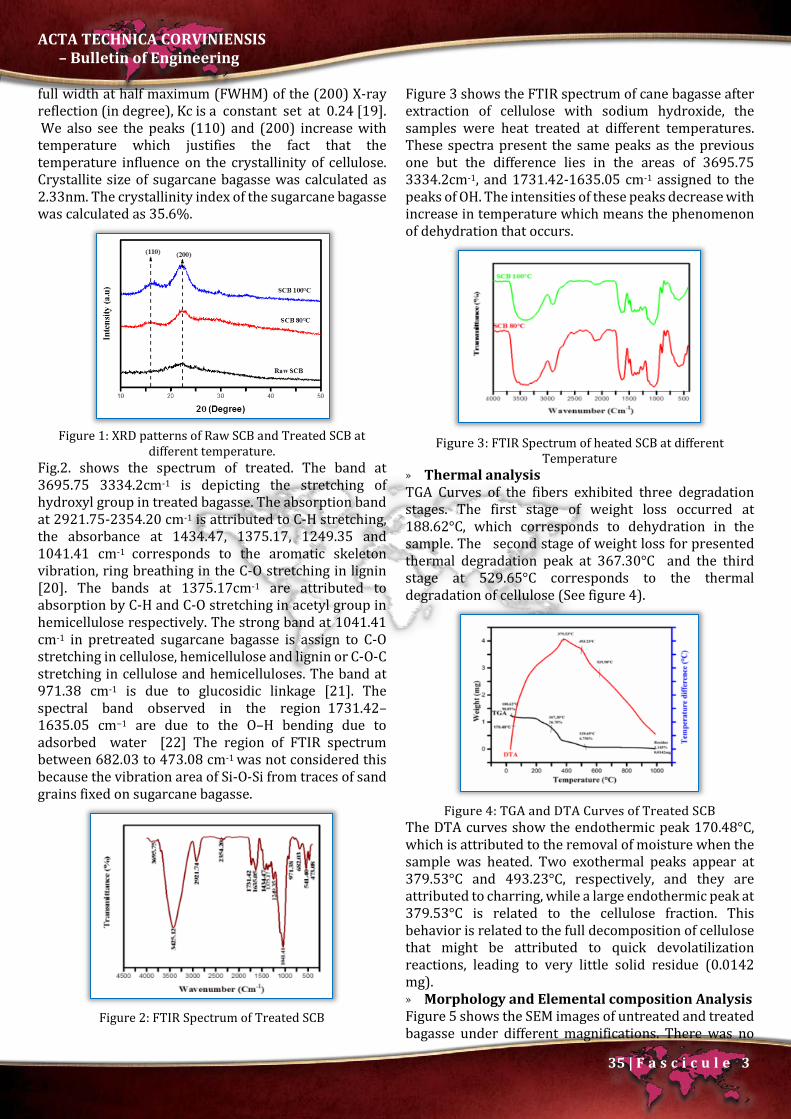
ACTA TECHNICA CORVINIENSIS – Bulletin of Engineering
35 | F a s c i c u l e 3
full width at half maximum (FWHM) of the (200) X-ray reflection (in degree), Kc is a constant set at 0.24 [19]. We also see the peaks (110) and (200) increase with temperature which justifies the fact that the temperature influence on the crystallinity of cellulose. Crystallite size of sugarcane bagasse was calculated as 2.33nm. The crystallinity index of the sugarcane bagasse was calculated as 35.6%.
Figure 1: XRD patterns of Raw SCB and Treated SCB at
different temperature. Fig.2. shows the spectrum of treated. The band at 3695.75 3334.2cm-1 is depicting the stretching of hydroxyl group in treated bagasse. The absorption band at 2921.75-2354.20 cm-1 is attributed to C-H stretching, the absorbance at 1434.47, 1375.17, 1249.35 and 1041.41 cm-1 corresponds to the aromatic skeleton vibration, ring breathing in the C-O stretching in lignin [20]. The bands at 1375.17cm-1 are attributed to absorption by C-H and C-O stretching in acetyl group in hemicellulose respectively. The strong band at 1041.41 cm-1 in pretreated sugarcane bagasse is assign to C-O stretching in cellulose, hemicellulose and lignin or C-O-C stretching in cellulose and hemicelluloses. The band at 971.38 cm-1 is due to glucosidic linkage [21]. The spectral band observed in the region 1731.42–1635.05 cm−1 are due to the O–H bending due to adsorbed water [22] The region of FTIR spectrum between 682.03 to 473.08 cm-1 was not considered this because the vibration area of Si-O-Si from traces of sand grains fixed on sugarcane bagasse.
Figure 2: FTIR Spectrum of Treated SCB
Figure 3 shows the FTIR spectrum of cane bagasse after extraction of cellulose with sodium hydroxide, the samples were heat treated at different temperatures. These spectra present the same peaks as the previous one but the difference lies in the areas of 3695.75 3334.2cm-1, and 1731.42-1635.05 cm-1 assigned to the peaks of OH. The intensities of these peaks decrease with increase in temperature which means the phenomenon of dehydration that occurs.
Figure 3: FTIR Spectrum of heated SCB at different
Temperature » Thermal analysis TGA Curves of the fibers exhibited three degradation stages. The first stage of weight loss occurred at 188.62°C, which corresponds to dehydration in the sample. The second stage of weight loss for presented thermal degradation peak at 367.30°C and the third stage at 529.65°C corresponds to the thermal degradation of cellulose (See figure 4).
Figure 4: TGA and DTA Curves of Treated SCB
The DTA curves show the endothermic peak 170.48°C, which is attributed to the removal of moisture when the sample was heated. Two exothermal peaks appear at 379.53°C and 493.23°C, respectively, and they are attributed to charring, while a large endothermic peak at 379.53°C is related to the cellulose fraction. This behavior is related to the full decomposition of cellulose that might be attributed to quick devolatilization reactions, leading to very little solid residue (0.0142 mg). » Morphology and Elemental composition Analysis Figure 5 shows the SEM images of untreated and treated bagasse under different magnifications. There was no
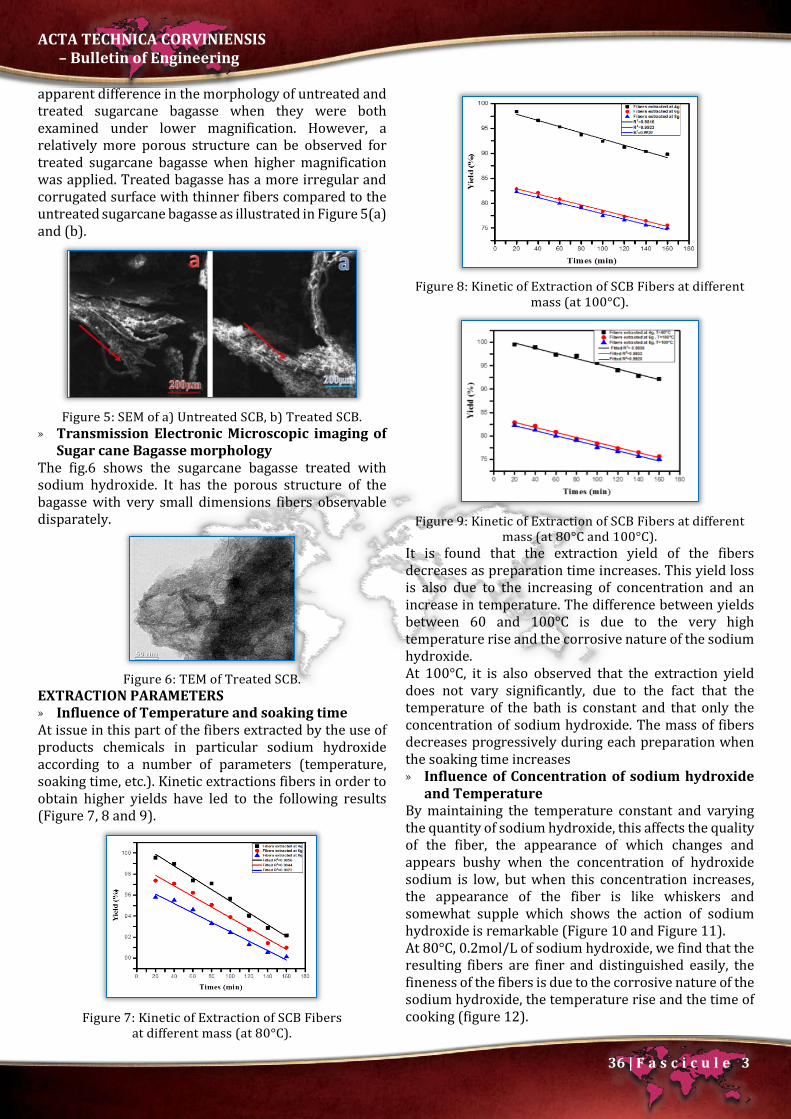
ACTA TECHNICA CORVINIENSIS – Bulletin of Engineering
36 | F a s c i c u l e 3
apparent difference in the morphology of untreated and treated sugarcane bagasse when they were both examined under lower magnification. However, a relatively more porous structure can be observed for treated sugarcane bagasse when higher magnification was applied. Treated bagasse has a more irregular and corrugated surface with thinner fibers compared to the untreated sugarcane bagasse as illustrated in Figure 5(a) and (b).
Figure 5: SEM of a) Untreated SCB, b) Treated SCB.
» Transmission Electronic Microscopic imaging of Sugar cane Bagasse morphology
The fig.6 shows the sugarcane bagasse treated with sodium hydroxide. It has the porous structure of the bagasse with very small dimensions fibers observable disparately.
Figure 6: TEM of Treated SCB.
EXTRACTION PARAMETERS » Influence of Temperature and soaking time At issue in this part of the fibers extracted by the use of products chemicals in particular sodium hydroxide according to a number of parameters (temperature, soaking time, etc.). Kinetic extractions fibers in order to obtain higher yields have led to the following results (Figure 7, 8 and 9).
Figure 7: Kinetic of Extraction of SCB Fibers
at different mass (at 80°C).
Figure 8: Kinetic of Extraction of SCB Fibers at different
mass (at 100°C).
Figure 9: Kinetic of Extraction of SCB Fibers at different
mass (at 80°C and 100°C). It is found that the extraction yield of the fibers decreases as preparation time increases. This yield loss is also due to the increasing of concentration and an increase in temperature. The difference between yields between 60 and 100°C is due to the very high temperature rise and the corrosive nature of the sodium hydroxide. At 100°C, it is also observed that the extraction yield does not vary significantly, due to the fact that the temperature of the bath is constant and that only the concentration of sodium hydroxide. The mass of fibers decreases progressively during each preparation when the soaking time increases » Influence of Concentration of sodium hydroxide
and Temperature By maintaining the temperature constant and varying the quantity of sodium hydroxide, this affects the quality of the fiber, the appearance of which changes and appears bushy when the concentration of hydroxide sodium is low, but when this concentration increases, the appearance of the fiber is like whiskers and somewhat supple which shows the action of sodium hydroxide is remarkable (Figure 10 and Figure 11). At 80°C, 0.2mol/L of sodium hydroxide, we find that the resulting fibers are finer and distinguished easily, the fineness of the fibers is due to the corrosive nature of the sodium hydroxide, the temperature rise and the time of cooking (figure 12).

ACTA TECHNICA CORVINIENSIS – Bulletin of Engineering
37 | F a s c i c u l e 3
Figure 10: Fibers extracted at 60°C for 0.1mol/L
of sodium hydroxide.
Figure 11: Fibers extracted at 60°C for 0.2mol/L
of sodium hydroxide
Figure 12: Fibers extracted at 80 ° C for 0.2mol/L
of sodium hydroxide. At 100°C, we find that the resulting fibers change shape and become pasty, and the yield drops considerably. This is due to the increase in the concentration of the extraction bath, the elevation of the temperature and cooking time.
Figure 13: Fibers extracted at 100 ° C for 0.3mol/L of
sodium hydroxide. » Moisture content of the fiber Using the formula above, the calculation of the content moisture is 31.1%. CONCLUSION Fiber bundles were chemically extracted from raw bagasse of sugarcane. The alkaline extraction was the
best and most efficient way to remove lignin since the solution was more concentrated. The kinetics of extraction of sugarcane fibers chemically extracted at different concentration of sodium hydroxide showed that the mass of the sample extracted fibers decreases with time, and with the rise in bath temperature. Acknowledgements This work was financially supported by The World Academy of Sciences for the Advancement of Science in developing countries (TWAS) and the Council of Scientific and Industrial Research (CSIR). We thank also Dr.Vijayamohanan K Pillai, Director of Central Electrochemical Research Instiute (CECRI) of Karaikudi, Tamilnadu (India) who gave us all the facilities to carry out our research. References [1.] Simkovic I., Mlynar J., Alfoldi, J., and Micko M.M., New
aspects in cationization of lignocellulose materials. XI. Modification of bagasse with quaternary ammonium groups. Holzforschung, 44, 113–116, 1990.
[2.] Mukherjee J.J., Long vegetable fibres. Textile Progress 4, 8–9, 1972.
[3.] Henriksson G., Akin D.E. Hanlin R.T., Rodriguez C., Archibald D.D., Rigsby L.L., and Eriksson K.L., Identification and retting efficiencies of fungi isolated from dew-retted flax in the United States and Europe. Appl. Environ. Microb., 63, 3950–3956, 1997.
[4.] Suna J.X., Suna X.F., Zhaoa H., and Sun R.C. Isolation and characterization of cellulose from sugarcane bagasse. Polymer Degradation and Stability, 84, 331-339, 2004.
[5.] Eliangela de Morais T., Thalita J.B., Kelcilene Bruna R.T., Ana C.C., José Manoel M., and Luiz Henrique C.M., Sugarcane bagasse whiskers: Extraction and characterizations. Industrial Crops and Products, 33, 63–66, 2011.
[6.] Green JW. In: Whistler RL, editor. Methods of carbohydrate chemistry, III. New York: Academic Press; 9, 1963.
[7.] Luz S.M., and Gonçalves A. Ealuation of soda/AQ pulping for sugarcane bagasse and staw, Proceeding of 7th Brazilian Symposium on the Chemistry of Lignins and other Wood Comonents, Minas Gerais, Brazil, 131-136, 2001.
[8.] Saheb D.N., and Jog, J.P., Natural fiber polymer composites: A review, Advances Polym.Technol., 18, 351-363, 1999.
[9.] Doraiswamy I., and Chellamani P., Pineapple-leaf fibers. Textile Progress 24, 1, 1–25, 1993.
[10.] Dorée C. The Methods of Cellulose Chemistry. Chapman & Hall, London, 1947.
[11.] Kadla J.F., and Gilbert R.D., Cellulose structure: A review. Cellulose. Chem. Technol., 34, 197–216, 2000.
[12.] Rahway N.J., The Merck Index, 8th ed., Merck & Co, 1960.

ACTA TECHNICA CORVINIENSIS – Bulletin of Engineering
38 | F a s c i c u l e 3
[13.] Luz S.M., Gonçallves A.R. Ferrao, P.M.C., Freitas M.J.M., Leao A.L., and Del Arco Jr. A.P., Water absorption studies of vegetable fibers reinforced polypropylene composites, In: Proceedings of 6th International Symposium on Natural Polymers and Composites, 2007.
[14.] Sun J.X., Sun X.F., Zhao H., and Sun R.C., Isolation and characterization of cellulose from sugarcane bagasse. Polym. Degrad. Stabil. 84, 331–339, 2004.
[15.] Okon O., Ubong E., and Aniekeme-Abasi I., Characterization and phytochemical screening of coconut (Cocos nucifera L.) Coir dust as a low cost adsorbent for waste water treatment. Elixir Appl. Chem., 47, 8961-8968, 2012.
[16.] Anuj K., Yuvraj S.N., Veena C., and Nishi K.B., Characterization of Cellulose Nanocrystals Produced by Acid-Hydrolysis from Sugarcane Bagasse as Agro-Waste Journal of Materials Physics and Chemistry, 2, 1-8, 2014.
[17.] El-Tantawy F., Al-Hazmi F., Alnowaiser F., Al-Ghamdi A. A., Al-Ghamdi A.A., Aly M.M., and Al-Tuwirqi, R.M, A new large – Scale synthesis ofmagnesium oxide nanowires:Structural and antibacterial properties. Superlattices and Microstructures, 52, 200-209, 2012.
[18.] El-Tantawy F., Beall G.W., El-Shazly M.D., Al-Hazmi F., and Al-Ghamdi A.A., Rapid fabrication of nanostructured magnesium hydroxide and hydromagnesite via microwave-assisted technique. Powder Technology, 234, 26-31, 2013.
[19.] Kaygili O., and Tatar C. The investigation of some physical properties and microstructure of Zn-doped hydroxyapatite bioceramics prepared by sol–gel method, J Sol-Gel Sci Technol, 61, 296–309, 2012.
[20.] Sun J.X., Sun X.F., Sun R.C., Fowler P., and Baird M.S., In homogenties in the chemical structure of sugarcane bagasse lignin. J Agri. Food chem., 51, 6719-6725, 2003.
[21.] Liu C.F., Sun R.C., Qin M.H., Zhang A.P., Ren J.L., Xu F., Ye J., and Wu S.B.. Chemical modification of ultrasound pretreated sugarcane bagasse with maleic anhydride. Ind Crop Prod., 26, 212-219, 2007.
[22.] Eronen P., Ruokolainen J., and Laukkanen A. Health and environmental safety aspects of friction grinding and spray drying of microfibrillated cellulose. Cellulose, 18, 775-786, 2011
copyright ©
University POLITEHNICA Timisoara, Faculty of Engineering Hunedoara,
5, Revolutiei, 331128, Hunedoara, ROMANIA http://acta.fih.upt.ro

© copyright Faculty of Engineering – Hunedoara, University POLITEHNICA Timisoara
ACTA TECHNICA CORVINIENSIS – Bulletin of Engineering Tome X [2017] Fascicule 3 [July – September] ISSN: 2067 – 3809
1.Aleksandar SKULIĆ,2.Dejan KRSMANOVIĆ, 3.Saša RADOSAVLJEVIĆ, 4.Lozica IVANOVIĆ, 5.Blaža STOJANOVIĆ
POWER LOSSES OF WORM GEAR PAIRS 1-5. University of Kragujevac, Faculty of Engineering, Kragujevac, SERBIA Abstract: In this paper are presented the power losses and sources of their occurrence in worm gear boxes. These are the losses that occur in the coupling of worm teeth and worm gear, losses in bearings, seals and oil churning power losses in the transmission. When the operation of worm gearing is characterized by line contact of coupled elements which is accompanied by significant sliding, the highest value have the power losses in the worm and worm gear coupling compared to other losses in gearing. Among other things, in the paper also presents the expressions that are used for calculation of individual power losses and efficiency of the gearing. The size of the losses primarily depends on the type of coupled material and geometry of worm pair, circumferential velocity (input rotational speed), the type and viscosity of lubricating oil, load, worm shape, and temperature and so on. The paper also deals with the influence of different factors on power losses and efficiency. As the efficiency of the worm pair is significantly lower compared to other types of gear pairs, the appropriate combination of geometric parameters and materials of worm and worm gear, lubrication and working conditions can significantly affect its increase. Keywords: power losses, efficiency, worm gearing INTRODUCTION Gear boxes present the most widespread and the most important group of mechanical transmissions by which the movement, that is torque is transmitted from one shaft to another and transforms by direct touching of teeth. Gear boxes are formed by different connection of gear pairs. [1] These are the most often used power transmissions that can be used for different positions of the input and output shaft, as well as for the very wide range of power, rotational speed and transmission ratios. [1] Worm gearing as hyperboloid gear pairs whose axes intersect are characterized by the line contact of the worm and worm gear. The line contact is accompanied by the relatively high sliding friction between coupled elements and forming of satisfactory lubricating layer. Apart from sliding friction in worm and worm gear mesh, friction occurs in the bearings, between the gear and oil, in sealing and so on. The consequences of the friction at worm gearing are power losses, lower efficiency, scuffing and damaging of gearing elements, gearing heating and so on. [2]. The highest friction losses occur in worm gear and worm gearing mesh and their
size can be significantly affected by selection of parameters that define the gear pairs. The higher friction coefficients mean higher power losses and thus the lower efficiency values of worm gearing. The worm gearing efficiency has lower value compared to the other types of gear boxes. If they are applied as multipliers the efficiency is less than 50%, while as applied as redactors, with appropriate design it is possible to achieve the efficiency above 90% [1]. A number of authors have researched the influence of different factors on power losses in worm gearings. Magyar and Sauer [3] from Kaiserslautern University have developed a technology for calculation of power losses in worm gearing and have determined that average losses value in worm gear and worm gearing mesh is three times higher compared to losses in gearings (four rolling bearings) which were second in size in total power loss. Niemann and Winter [4] especially emphasize the influence of worm pair geometry on the efficiency where they showed that by reducing the ratio of mean diameter and centre distance ( )ad 1m and at lower transmission ratios the higher efficiency values are obtained. For

ACTA TECHNICA CORVINIENSIS – Bulletin of Engineering
40 | F a s c i c u l e 3
example, at transmission ratio 5i = and input rotational speed 1
1 min1500n −= the measured efficiency value was 96=η %. On the other hand, according to Budynas and
Nisbett [5], the increase of worm lead angle ( mγ ) was followed by higher efficiency values. Stockman et al. [6] using the specially designed equipment have tested the efficiencies of thirteen different gear boxes and found that at lower transmission ratios and higher input torques the higher efficiency values are obtained. They compared the obtained values to catalogue manufacturer’s values and found significant discrepancies, because in catalogue usually is cited only one efficiency value for a wide range of transmission ratios, powers and manufacturing technologies. Mautner et al. [7] have tested the influence of viscosity and type of the oil on efficiency of a large sized worm gearing with center distance mm315a = using FZG equipment. By using the high viscosity synthetic polyglycol oil (ISO VG 460) the measured efficiency values were higher for approximately 1% compared to lower viscosity synthetic oil (ISO VG 220) and for 3% compared to mineral oil. Muminovic et al. [8] and Hermann [9] in their papers have also emphasized the advantages of the usage of synthetic oils compared to mineral oils where the higher efficiency values were obtained. Among other things, Hermann [9] also researched the influence of different synthetic oils and found that high-performance synthetic oil produced by "Klüber Lubrication" (Klübersynth GH 6-460) provides significantly less scuffing, less heating of gearing and higher efficiency compared to standard synthetic oils which are used for lubrication of worm gearing defined in DIN 3996 Standard. Miltenovic et al. [10] have researched the worm gearing efficiency for the extreme working conditions where they used high-quality synthetic oil (high viscosity oil Klübersynth GH 6-1500) and high-quality material for manufacture of worm pair (hardened bronze/hardened and grounded steel). The measured efficiency values ranged in the interval 71.052.0 ÷=η , where the higher values were found at higher loads. EFFICIENCY OF WORM GEARING Efficiency of machines and mechanisms is determined as the ratio of useful and input energy and presents parameter for estimation of technical systems to preserve transported energy. At the same time, it is one of the most important criteria for evaluation of validity of given construction. At power transmission the efficiency is defined as the ratio of output power toward input power, i.e. resulting toward input work [1]:
1PP1
PPP
PP
in
G
in
Gin
in
out <−=−
==η , (1)
where are: inP – input power [W]; outP – output power [W]; and GP – total power loss [W]. Output power is equal to input power reduced for power which loses in transmission in various resistances ( GP ) and which is mostly converted into heat. Ratio between power losses and input power inG PP presents the level of losses and if this ratio is smaller the gearing efficiency is higher and vice versa. If 1P denotes power on the worm and 2P denotes the power on worm gear then the efficiency of worm gearing can be determined as follows [1]: - for the case that the worm is driving element:
G2
2
1
G1p PP
PP
PP+
=−
=η , (2)
- for the case that worm gear is driving element:
G1
1
2
G2,p PP
PP
PP+
=−
=η . (3)
The efficiency of worm pair can be determined through the worm lead angle in the central cylinder mγ and friction angle 1ϕ using the following expression [12]:
)qz(q)zq(z
)tan(tan
11
111
1m
m
µ+µ−
=ϕ+γ
γ=η , (4)
where are: 1z – the number of worm teeth, 1µ – friction coefficient between meshed gear teeth and
m1 tan/zq γ= – worm number. The higher efficiency η is obtained for higher values of the angle mγ that is at multipath worms but at the same time lower transmission ratios are obtained. As the efficiency of worm gear pair depends on numerous parameters its values range in the interval 95.05.0 ÷=η% [13]. Efficiency values in relation to the worm lead angle for values of friction coefficient 05.01 =µ and pressure angle 0
n 20=α are presented in Table 1 [5]. Table 1: Efficiency values depending on the lead angle [5]
Lead angle mγ , [°] Efficiencyη , [%] 1.0 25.2 2.5 45.7 5.0 62.0 7.5 71.3
10.0 76.6 15.0 82.7 20.0 85.9 30.0 89.1
POWER LOSSES IN WORM GEARING During the meshing between flanks of worm gear and worm gearing the certain corresponding normal force is transmitted, leading to significant surface pressures. In
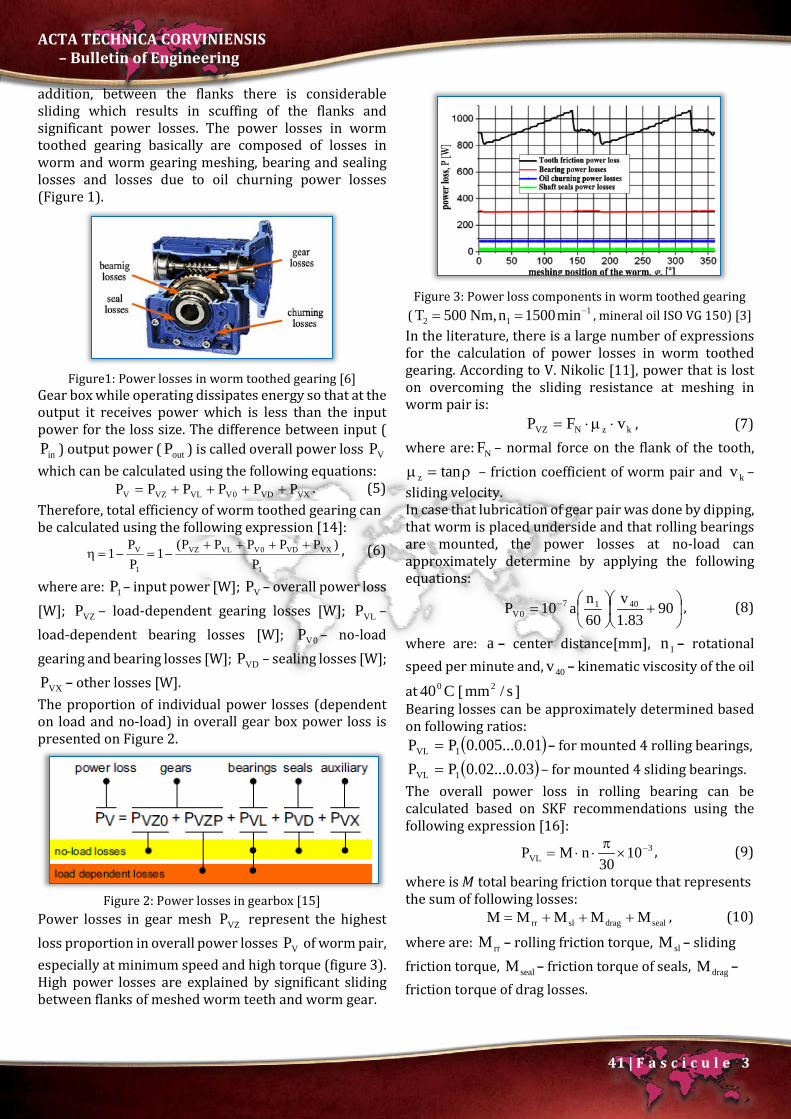
ACTA TECHNICA CORVINIENSIS – Bulletin of Engineering
41 | F a s c i c u l e 3
addition, between the flanks there is considerable sliding which results in scuffing of the flanks and significant power losses. The power losses in worm toothed gearing basically are composed of losses in worm and worm gearing meshing, bearing and sealing losses and losses due to oil churning power losses (Figure 1).
Figure1: Power losses in worm toothed gearing [6]
Gear box while operating dissipates energy so that at the output it receives power which is less than the input power for the loss size. The difference between input (
inP ) output power ( outP ) is called overall power loss VP which can be calculated using the following equations: VXVD0VVLVZV PPPPPP ++++= . (5) Therefore, total efficiency of worm toothed gearing can be calculated using the following expression [14]:
1
VXVD0VVLVZ
1
V
P)PPPPP(
1PP
1++++
−=−=η , (6)
where are: 1P – input power [W]; VP – overall power loss [W]; VZP – load-dependent gearing losses [W]; VLP – load-dependent bearing losses [W]; 0VP – no-load gearing and bearing losses [W]; VDP – sealing losses [W];
VXP – other losses [W]. The proportion of individual power losses (dependent on load and no-load) in overall gear box power loss is presented on Figure 2.
Figure 2: Power losses in gearbox [15]
Power losses in gear mesh VZP represent the highest loss proportion in overall power losses VP of worm pair, especially at minimum speed and high torque (figure 3). High power losses are explained by significant sliding between flanks of meshed worm teeth and worm gear.
Figure 3: Power loss components in worm toothed gearing
( 112 min1500n,Nm 500T −== , mineral oil ISO VG 150) [3]
In the literature, there is a large number of expressions for the calculation of power losses in worm toothed gearing. According to V. Nikolic [11], power that is lost on overcoming the sliding resistance at meshing in worm pair is: kzNVZ vFP ⋅µ⋅= , (7) where are: NF – normal force on the flank of the tooth,
ρ=µ tanz – friction coefficient of worm pair and kv – sliding velocity. In case that lubrication of gear pair was done by dipping, that worm is placed underside and that rolling bearings are mounted, the power losses at no-load can approximately determine by applying the following equations:
+
= − 90
83.1v
60na10P 4017
0V , (8)
where are: a – center distance[mm], 1n – rotational speed per minute and, 40v – kinematic viscosity of the oil
at C400 [ s/mm2 ] Bearing losses can be approximately determined based on following ratios:
( )01.0...005.0PP 1VL = – for mounted 4 rolling bearings, ( )03.0...02.0PP 1VL = – for mounted 4 sliding bearings.
The overall power loss in rolling bearing can be calculated based on SKF recommendations using the following expression [16]:
3VL 10
30nMP −×
π⋅⋅= , (9)
where is 𝑀𝑀 total bearing friction torque that represents the sum of following losses: sealdragslrr MMMMM +++= , (10)
where are: rrM – rolling friction torque, slM – sliding friction torque, sealM – friction torque of seals, dragM – friction torque of drag losses.
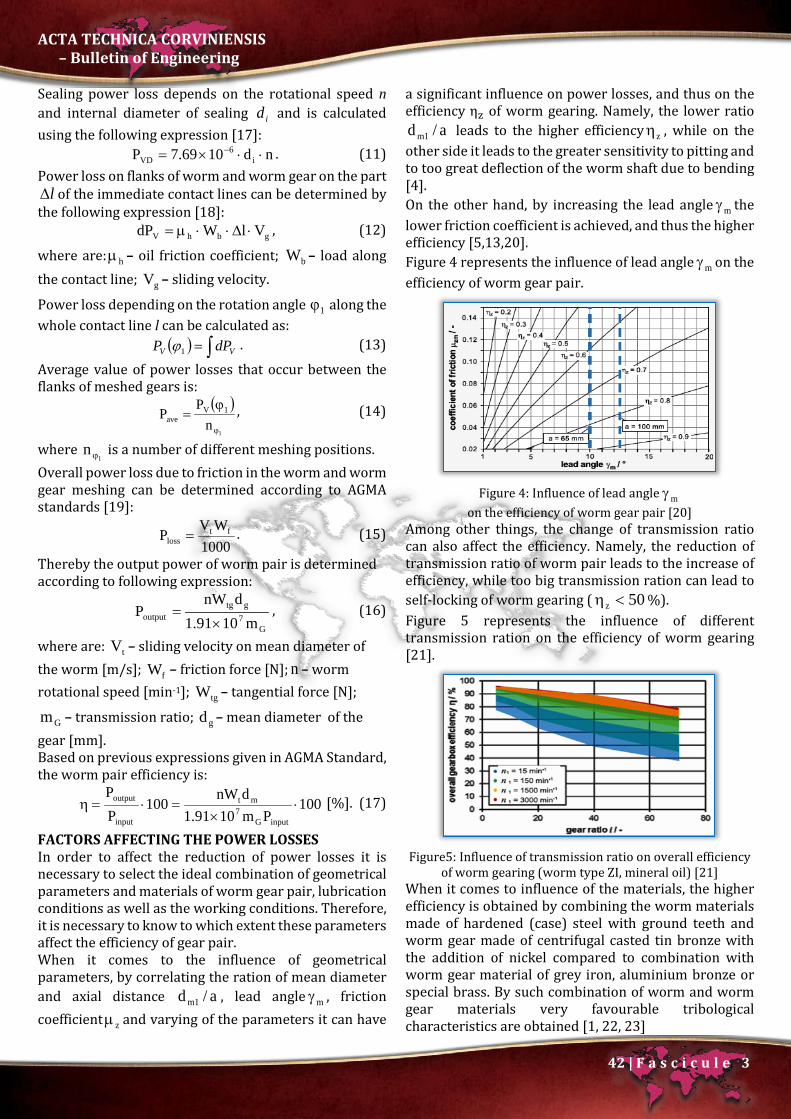
ACTA TECHNICA CORVINIENSIS – Bulletin of Engineering
42 | F a s c i c u l e 3
Sealing power loss depends on the rotational speed n and internal diameter of sealing id and is calculated using the following expression [17]: nd1069.7P i
6VD ⋅⋅×= − . (11)
Power loss on flanks of worm and worm gear on the part l∆ of the immediate contact lines can be determined by
the following expression [18]: gbhV VlWdP ⋅∆⋅⋅µ= , (12)
where are: hµ – oil friction coefficient; bW – load along the contact line; gV – sliding velocity.
Power loss depending on the rotation angle 1ϕ along the whole contact line l can be calculated as: ( ) ∫= VV dPP 1ϕ . (13)
Average value of power losses that occur between the flanks of meshed gears is:
( )1
nP
P 1Vave
ϕ
ϕ= , (14)
where 1
n ϕ is a number of different meshing positions. Overall power loss due to friction in the worm and worm gear meshing can be determined according to AGMA standards [19]:
1000
WVP ft
loss = . (15)
Thereby the output power of worm pair is determined according to following expression:
G
7gtg
output m1091.1dnW
P×
= , (16)
where are: tV – sliding velocity on mean diameter of the worm [m/s]; fW – friction force [N]; n – worm rotational speed [min-1]; tgW – tangential force [N];
Gm – transmission ratio; gd – mean diameter of the gear [mm]. Based on previous expressions given in AGMA Standard, the worm pair efficiency is:
100Pm1091.1
dnW100
PP
inputG7
mt
input
output ⋅×
=⋅=η [%]. (17)
FACTORS AFFECTING THE POWER LOSSES In order to affect the reduction of power losses it is necessary to select the ideal combination of geometrical parameters and materials of worm gear pair, lubrication conditions as well as the working conditions. Therefore, it is necessary to know to which extent these parameters affect the efficiency of gear pair. When it comes to the influence of geometrical parameters, by correlating the ration of mean diameter and axial distance a/d 1m , lead angle mγ , friction coefficient zµ and varying of the parameters it can have
a significant influence on power losses, and thus on the efficiency ηz of worm gearing. Namely, the lower ratio
a/d 1m leads to the higher efficiency zη , while on the other side it leads to the greater sensitivity to pitting and to too great deflection of the worm shaft due to bending [4]. On the other hand, by increasing the lead angle mγ the lower friction coefficient is achieved, and thus the higher efficiency [5,13,20]. Figure 4 represents the influence of lead angle mγ on the efficiency of worm gear pair.
Figure 4: Influence of lead angle mγ
on the efficiency of worm gear pair [20] Among other things, the change of transmission ratio can also affect the efficiency. Namely, the reduction of transmission ratio of worm pair leads to the increase of efficiency, while too big transmission ration can lead to self-locking of worm gearing ( 50z <η %). Figure 5 represents the influence of different transmission ration on the efficiency of worm gearing [21].
Figure5: Influence of transmission ratio on overall efficiency
of worm gearing (worm type ZI, mineral oil) [21] When it comes to influence of the materials, the higher efficiency is obtained by combining the worm materials made of hardened (case) steel with ground teeth and worm gear made of centrifugal casted tin bronze with the addition of nickel compared to combination with worm gear material of grey iron, aluminium bronze or special brass. By such combination of worm and worm gear materials very favourable tribological characteristics are obtained [1, 22, 23]

ACTA TECHNICA CORVINIENSIS – Bulletin of Engineering
43 | F a s c i c u l e 3
Figure 6 represents the influence of materials on the degree of losses for worm gear made of bronze CuSn12Ni and grey iron GJS 400 according to DIN3996.
Figure 6: Influence of the worm gear material on the degree
of loss 1V PP of worm pair [14] The lower values of friction coefficient in the toothed gearing lead to the lower power losses. The diagram (figure 7) represents the values of friction coefficient for different types of materials out of which the worm and worm gear are manufactured for the conditions of hydrodynamic lubrications. Curve B represents the values of friction coefficient for worm gear made of phosphor bronze and for the worm made of case hardening steel, while curve A represents the values of friction coefficients for worm pair made of cast iron [5].
Figure 7: Coefficient of friction for different types of worm
and worm gear materials [5] The value of coefficients of friction differs for almost 20% which mainly depends on the type of worm gear pair material, quality of fine machining and lubrication. The surfaces of the worm and worm gear, in general, should have less roughness to reduce coefficient of friction and thus the power loss in gearing. The results of experimental research [14] show that the degree of power losses is less for lower values of arithmetic mean profile deviation from the mean line of the profile aR . Dependence of power losses from the roughness of machined surface, expressed by parameter of arithmetic mean deviation of the profile aR , is presented in Figure8. Conditions of lubrications, type and viscosity of oil have a significant influence on power losses. Studies have shown that the use of higher viscosity oils (polyglycol ISO VG 460) increases the efficiency by 1 to 2%
compared to lower viscosity oil (polyglycol ISO VG 220) and by 3% compared to mineral oil [7]. Higher viscosity oils lead to higher losses in no-load, and generally lead to lower power losses of gearings due to better forming of oil film between the contact surfaces of gear teeth. In general, synthetic oils (polyglycol, polyalphaolefin, ester oils) lead to a reduction of coefficient of friction between the gear teeth compared to mineral oils, which leads to the lower power losses in gearing thus increasing the efficiency [8,9].
Figure 8: Influence of the arithmetic mean deviation of the
profile aR on the degree of power losses 1V PP for gear box [14]
By using synthetic high viscosity oil (ISO VG 460) for lubrication of large size warm gearing, for good lubrication conditions), the measured total efficiency was 96=η %, especially at higher rotational speed and output torques [7]. The influence of working conditions on worm gearings efficiency is shown in Figure 9. The results were collected during the testing of steel/bronze worm gear pairs with center distance a = 65, 100, 160 and 315 mm on FZG device. For all tests the synthetic oils polyglycol with gradations ISO VG 220 and ISO VG 460 were used. Experiments have shown that the change in working conditions can significantly influence the efficiency. During the testing the values of efficiency were measured depending on the values of input rotation speed 1n and output torque 2T , where was established that they move in the interval 9584 ÷=η % [7,23,24].
Figure 9: Results of tests of overall efficiency [7, 24, 25]

ACTA TECHNICA CORVINIENSIS – Bulletin of Engineering
44 | F a s c i c u l e 3
Based on the experimental research it can be concluded that by increasing the value of input rotational speed and at higher values of output torques the level of power losses 1V PP decreases by which the higher efficiency values are obtained. CONCLUSIONS Power losses in gear box vary from 0.5% to over 80% , so that more attention is paid to ways for their reductions in order to influence the increase of the gearing efficiency. The losses are under great influence of the number of parameters, and one of the most important is the type of material out of which the worm and worm gear are made of. The best tribological properties has a combination of materials of worm gearing made of tin bronze and worm made of hardened and grounded steel. The influence of gear geometry is also a very important parameter. Namely, by reducing the ratio of mean diameter and center distance to a certain extent, lower transmission ratios as well as the increase of lead angle of the warm can have a significant influence to the increase of worm pair efficiency. The type and viscosity of the lubricating oils have a significant influence on efficiency. Numerous experimental research have shown that, basically, higher viscosity synthetic oils lead to lower power losses (in some cases up to 35%), and thus to higher efficiencies compared to mineral oils. On the other hand, synthetic oils are more expensive than mineral, but during the short time period become cost effective because of numerous advantages comparing to mineral oils. Different working conditions of worm gearing lead to different efficiency values. Higher efficiency values were measured at hither input rotational speeds and output torques. With the increase of circumferential velocity the oil film between the meshed flanks of the warm and warm gear crates more easily thus increasing the efficiency level. As the absolute efficiency (100%) cannot exist even in the theoretical considerations and regarding the increasing value and importance of the energy, the task of the constructors/designers is to minimize power losses in the transmission to the extent possible by applying different design solutions and by varying of the parameters that define the work gear pairs. Acknowledgment This paper presents the research results obtained within the framework of the projects TR-35021 and TR-35033 financially supported by the Ministry of Education, Science and Technological Development of the Republic of Serbia. References [1] Miltenovic, V.: Mechanical elements - form,
calculation, implementation, Faculty of
Mechanical Engineering, University of Nis, Nis, 2009.
[2] Marjanovic, N.: Optimization of gear power transmitters-Monograph, Faculty of Mechanical Engineering, Kragujevac, 2007.
[3] Magyar, B., and Sauer, B.: Calculation of the Efficiency of Worm Gear Drives, Power Transmission Engineering, pp. 52-57, 2015.
[4] Niemann, G. and Winter, H.: Maschinenelemente: Schraubrad, Kegelrad, Schnecken, Ketten, Riemen, Reibradgetriebe, Kupplungen, Bremsen, Freiläufe, Springer Verlag, Berlin Heidelberg, Germany, Volume 3, Edition 2, 1983.
[5] Budynas, R.G., Nisbett J.K.: Mechanical Engineering Design, Tenth edition, McGraw-Hill Education, New York, 2015.
[6] Stockman, K., Dereyne, S., Defreyne, P., Algoet, E., and Derammelaere, S.: Efficiency measurement campaign on gearboxes, In Energy efficiency in motor driven systems, EEMODS 2015.
[7] Mautner, E. M., Sigmund, W., Stemplinger, J. P., and Stahl, K.: Efficiency of worm gearboxes, Proceedings of the Institution of Mechanical Engineers, Part C: Journal of Mechanical Engineering Science, 230(16), 2952-2956, 2016.
[8] Muminovic, A., Repcic, N., and Žeželj, D.: The efficiency of worm gears lubricated with oils of mineral and synthetic bases, Transactions of FAMENA, 37(4), 65-72, 2014.
[9] Hermann, S.: Worm Gears - Higher Energy Efficiency and Less Strain on Resources, Gear technology, May 2011.
[10] Miltenovic, Đ., Banic M., Miltenovic A., and Tica M.: Power losses and efficiency of worm gears in extreme operating conditions, 3th international scientific conference on Mechanical Enginering Technologies and Applications, Jahorina, 7-9 December, 2016.
[11] Nikolic, V.: Mechanical elements, Faculty of Mechanical Engineering, Kragujevac, 2004.
[12] Alexandru, A. T.: Worm gears with optimized main geometrical parameters and their efficiency, Mechanics, 81(1), 62-65. 2015.
[13] Lewis, M.: Worm-gear reducers reach new heights: Design enhancements improve efficiency and eliminate leaks, Machine design, 76(11), 80-84, 2004.
[14] DIN 3996: Tragfähigkeitsberechnung von Zylinder-Schneckengetrieben mit sich rechtwinklig kreuzenden Achsen. Deutsches Institut für Normung e. V., Beuth Verlag, 2012.
[15] Höhn, B. R., Michaelis, K., and Hinterstoißer, M.: Optimization of gearbox efficiency, Goriva i maziva, 48(4), 462, 2009.

ACTA TECHNICA CORVINIENSIS – Bulletin of Engineering
45 | F a s c i c u l e 3
[16] SKF General Catalogue 6000 EN, SKF; November 2005.
[17] Martins, R., Seabra, J., Brito, A., Seyfert, C., Luther, R., and Igartua, A.: Friction coefficient in FZG gears lubricated with industrial gear oils: biodegradable ester vs. mineral oil, Tribology international, 39(6), 512-521, 2006.
[18] Bercsey, T., Horák P.: Calculation of the efficiency of zta-type worm gear drives on the base of the ethd lubrication theory, 5th international meeting of the carpathian region specialists in the field of gears, Budapest, 13 May, 2014.
[19] AGMA Design manual for cylindrical wormgearing. ANSI/AGMA Standard 6022-C93. Reaffirmed 2008.
[20] Monz A. Tragfähigkeit und Wirkungsgrad von Schneckengetrieben bei Fettschmierung. Forschungsvereinigung Antriebstechnik e.V., Frankfurt, FVA 522/I, Heft 931, 2010.
[21] Dubbel: Taschenbuch für den Maschinenbau. Springer Verlag, Berlin Heidelberg, Germany, Edition 23, 2011.
[22] Fontanari, V., Benedetti, M., Straffelini, G., Girardi, C., and Giordanino, L. Tribological behavior of the bronze–steel pair for worm gearing, Wear, 302(1), 1520-1527, 2013.
[23] Fontanari, V., Benedetti, M., Girardi, C., and Giordanino, L.: Investigation of the lubricated wear behavior of ductile cast iron and quenched and tempered alloy steel for possible use in worm gearing, Wear, 350, 68-73, 2016.
[24] Rank, B.: Untersuchungen zur Grübchenbildung bei Zylinder-Schneckengetrieben, Dissertation, FZG TU München, Germany, 1996.
[25] Weisel, C. Verschleiß-und Grübchentragfähigkeit von großen Zylinderschneckengetrieben mit optimierter Radbronze, Forschungsvereinigung Antriebstechnik e.V., Frankfurt, FVA 503/I, Heft 892, 2009.
copyright ©
University POLITEHNICA Timisoara, Faculty of Engineering Hunedoara,
5, Revolutiei, 331128, Hunedoara, ROMANIA http://acta.fih.upt.ro

ACTA TECHNICA CORVINIENSIS – Bulletin of Engineering
46 | F a s c i c u l e 3
We are very pleased to inform that our international and interdisciplinary journal ACTA TECHNICA CORVINIENSIS Bulletin of Engineering completed its nine years of publication successfully [issues of years 2008 –2016, Tome I–IX]. In a very short period it has acquired global presence and scholars from all over the world have taken it with great enthusiasm.
Every year, in four online issues (fascicules 1 – 4), ACTA TECHNICA CORVINIENSIS Bulletin of Engineering [e-ISSN: 2067-3809] publishes a series of reviews covering the most exciting and developing fields of science and technology. Each issue contains papers reviewed by international researchers who are experts in their fields. The result is a journal that gives the scientists and engineers the opportunity to keep informed of all the current developments in their own, and related, areas of research, ensuring the new ideas across an increasingly the interdisciplinary field. Now, when will celebrate the tenth years anniversary of ACTA TECHNICA CORVINIENSIS Bulletin of Engineering, we are extremely grateful and heartily acknowledge the kind of support and encouragement from all contributors and all collaborators!
On behalf of the Editorial Board and Scientific Committees of ACTA TECHNICA CORVINIENSIS Bulletin of Engineering, we would like to thank the many people who helped make this journal successful. We thank all authors who submitted their work to ACTA TECHNICA CORVINIENSIS Bulletin of Engineering.
copyright © University POLITEHNICA Timisoara,
Faculty of Engineering Hunedoara, 5, Revolutiei, 331128, Hunedoara, ROMANIA
http://acta.fih.upt.ro

© copyright Faculty of Engineering – Hunedoara, University POLITEHNICA Timisoara
ACTA TECHNICA CORVINIENSIS – Bulletin of Engineering Tome X [2017] Fascicule 3 [July – September] ISSN: 2067 – 3809
1.Ján ĎURECH, 2.Mária FRANEKOVÁ, 3.Peter LÜLEY, 4.Emília BUBENÍKOVÁ
SAFETY ASPECTS OF PKI ARCHITECTURE WITHIN C-ITS AND THEIR MODELLING 1-4. Department of Control and Information Systems, University of Žilina, 010 26 Žilina, SLOVAKIA Abstract: The authors of this contribution focus on analysis of C2C communication in Cooperative - Intelligent Transportation Systems (C-ITS). In paper is proposed PKI (Public Key Infrastructure) secure architecture on the base of ECDSA (Elliptic Curve Digital Signature Algorithm) for several EC types. The experimental part is focused on worst case scenario of C2C communications for four-lane intersection, which model was realized via OPNET MODELER with OpenSSL libraries. From obtained results the influence of used elliptic curve and size of message to performance of the VANET network was analyzed. Keywords: VANET; cooperative-intelligent transportation system; C2C; authentication protocols, traffic scenario, modelling INTRODUCTION The key aspect of cooperative intelligent transport systems (C-ITS) implementation to the real operation is the communication safety therefor it attracts the attention of research teams for long-time [1], [2]. C-ITS systems mostly use the wireless short-range communication through open transmission channel (so-called VANET network). This communication is introduced in order to improve the road safety by increasing the situation awareness of drivers. Vehicles communicate among themselves and with static units placed alongside infrastructure by critical and non-critical messages. These messages may contain data on vehicle location, its direction, speed, acceleration and other information such as special events that can occur during real traffic. Development of C-ITS applications, which are using data obtained from vehicles and nodes placed alongside car to car, car to infrastructure respectively car to X communication (C2C, C2I or C2X), is supported by states around the world with links to car industry. Nowadays, there are within the EU an increasing number of projects dealing with C-ITS applications [3]. The most important applications for C-ITS are addressing the safety which uses VANET communication among surrounding entities (vehicles, road
infrastructure) in order to reduce the number of accidents and also applications for the drivers and pedestrians protection against various dangers. Messages transmitted between vehicles can be repeated periodically (awareness messages) - so-called CAM (Cooperative Awareness Messages) or the messages are generated only when triggered by particular event (event driven messages) - so-called DENM (Decentralized Environmental Notification Messages). Nowadays, based on outputs from various research projects in the EU and USA [4], [5], [6] are the C-ITS applications addressing safety divided in many categories respectively classes. All these applications are designed to trigger alert before an accident (crash type). The immediate reaction performed by the driver after receipt of unauthorized or altered (in any way) message can have negative impact on formation of traffic collisions. Therefore it is necessary to transmit messages of these applications secured by modern, computationally secure cryptographic algorithms. Providers of service (confidentiality, integrity and authorization) must guarantee the credibility of received messages and fulfillment of the application requirements (throughput respectively total network delay) even in the most unfavorable conditions (traffic-jam).

ACTA TECHNICA CORVINIENSIS – Bulletin of Engineering
48 | F a s c i c u l e 3
These services are in most cases realized by the cryptographic techniques and mostly with the link to asymmetric systems and Public Key Infrastructure (PKI) in connection with Certificate Authority (CA). In the Figure 1 is shown the overview of digital signature cryptographic operations (only generation and verification part) respectively encryption in network or transport layer of communication protocol.
Figure 1. Safety ensured by the use of cryptographic
mechanisms in the communication protocol
Aim of this article is to examine cryptographic safety solutions of Elliptic Curve Digital Signature Algorithm (ECDSA) digital signature scheme (for various algebraic structures a various types of Elliptic Curve (EC)) by modelling in the software tool OPNET Modeler in combination with open source cryptographic libraries and by the use of mathematical calculations. These solutions can be used in C-ITS. Secondary aim is to compare how these solutions meet the requirements on the secure communication in VANET network (for critical scenarios – e.g. traffic jam at the intersection) depending on actual risks and potential safety incidents during the communication among mobile nodes. RECOMMENDED CONCEPT OF PKI ARCHITECTURE AND ECDSA DIGITAL SIGNATURE SCHEMES There exist several proposals of safety architectures for C2C, C2I communication through VANET networks [7], [8]. There are some deviations in countries of EU (represented mostly by C2C organization) and in countries of USA (represented for example by National Highway Traffic Safety Administration (NHTSA) [9], [10]. The common element is the conception based on PKI architecture with asymmetric cryptographic system in connection with certificate authorities. In the Figure 2 is shown the proposal of PKI architecture [7].
Figure 2. Recommended concept of PKI architecture
In the Figure 2 is shown general concept of PKI architecture. This concept can differ from actual implementation especially on the beginning when the number of vehicles equipped with on-borad unit (OBU) will be small (some levels of certificate authorities can be merged together). Proposed concept includes following parts: Security Credentials Management System (SCMS) –
the highest control system which manages all iterations among components based on the machine to machine principle. These processes are performed automatically.
Root Certificate Authority (RCA) – the highest authority on which is built the confidentiality of the PKI system. RCA signs certificates for itself therefor these certificates do not contain ID of signatory. Private key created by RCA is used to sign the certificates of other CAs or certificates of other parts of PKI. It is likely that RCA will work offline because compromising this authority can affect the safety of whole system.
Intermediate Certificate Authority (ICA) – extension of RCA. Communication with ICA is protected against direct access to the internet (for example by Virtual Private Network (VPN) tunnel). Intermediate CAs can certify other subject and provide the system flexibility because they remove the need to establish connection between highly protected RCA and all other subjects.
Misbehavior Authority (MA) – processes erroneous messages and develops/publish the list of cancelled certificates Certificate Revocation List (CRL).
Pseudonym Certificate Authority (PCA) – issues short-term certificates to ensure the user privacy. Pseudonyms lifetime is variable but it is in minutes. Variability ensures worse predictability and more difficult vehicle tracking.
Registration Authority (RA) – receives requests for pseudonyms allocation from OBUs and sends those requests to PCA. To ensure the privacy the RA mixes the requests from various OBUs to prevent creation of links between the user ID and certificates. RA also creates and manages blacklist of certificates.

ACTA TECHNICA CORVINIENSIS – Bulletin of Engineering
49 | F a s c i c u l e 3
Enrolment Certificate Authority (ECA) – performs the initial enrolment. It connects OBU and SCMS by providing OBU with long-term key. Enrolment can be performed during vehicle production.
In order to ensure the message transmission credibility in C-ITS applications addressing safety there are recommended signature schemes which have simple key distribution among mobile nodes and fast message verification process either on demand or on a periodic basis (including the certificate generation by CAs). Another requirement is short cryptographic header which is in C2C communication added to transmitted messages (important role has the length of generated digital signature attached to the messages from various CAs – see Figure 2). PKI objects shown in Figure 2 are creating following cryptographic outputs. One of the main delays reason in the C2C communication (C2I) is the cryptographic header and therefore it is very important to select effective digital signature schemes in order to guarantee signatures verification from multiple sources in one vehicle (broadcast message type). The processing time of cryptographic safety header and cryptographic tailer THT(M), which are attached to the message M (see Figure2), consists of the time needed to generate the signature, time needed to sign the message (including the attachment of timestamp Tsign(M), time needed to transfer signed message including addition of certification data from appropriate CA Ttx(SignPrKv[M]) and time needed to verify one message Tverify (M) (respectively more messages). This processing time is defined as follows:
THT(M) = Tsign(M) + Ttx(SignPrKv[M])
+Tverify(M) (1)
From this point of view are group digital signature schemes an important part of the PKI architecture because it is possible to verify within the C2C respectively C2I communication the signatures of several unique private keys within the particular group of nodes SK1, SK2,..., SKn by just one private key (of the group) PKG. Digital Signature Algorithm (DSA) signature scheme with modified El Gamal algorithm or ECDSA signature scheme with Elliptic Curve Cryptosystem (ECC) algorithm can be included in the group digital signature schemes. Short key lengths (compared to RSA (Rivest Shamir Adleman) or DSA schemes) and related small computational complexity makes ECDSA cryptographic schemes ideal for the use in devices with limited computational capacity and limited memory, where are included also C-ITS applications. Safety elements of ECDSA scheme There exist several recommended standards of ECDSA schemes in the field of automotive industry [11], [12] but there is still an ongoing development in the process of finding new modification of ECDSA in various groups GF(2m) respectively GF(p). It is a preferred trend in
cryptography with better results (in many parameters) than commonly used asymmetric schemes (e.g. RSA). The main advantage of elliptic cryptosystems is the speed and small hardware and software demand which is very useful in ad-hoc vehicles networks. Development is currently focused on the implementation of ECDSA algorithm and mostly deal with implementation of ECDSA algorithm of chosen EC on the parallel solving of discrete logarithm problem in additive group because the discrete logarithm is the fundamental safety part of ECC algorithms. Solution of this problem depends on the effective implementation of arithmetic in the group of EC points. For the development and effective implementation of curve arithmetic is needed mainly knowledge from the finite fields theory. There exist more algorithms which solve the Elliptic Curve Discrete Logarithm Problem (ECDLP) problem (with various efficiency). The most used is the Pollard’s rho method [13] with complexity (π. n/2)1/2 steps. If n=256 bits it makes approximately 2128 steps what is approximately the safety level of symmetric block cipher AES-128 (Advanced Encryption Standard) which is currently unsolvable problem. If the discrete logarithm problem (DLP) task is performed in parallel on N processors we
get complexity (πn/2)12
N , what is for large r still difficult
task. To better understand the DLP problem we describe the process of key generation, message signing and message verification. All this operations are performed in OBU in special co-processor which performs cryptographic operations and key management independently from other tasks. Built-in computers in vehicles have processors with limited processing performance and memory. For example OBU from company Savari [17] uses 500MHz processor, 256MB main memory and 512MB data storage. Public and private keys of the vehicle are certified by relevant CA. Private keys are stored in HSM (Hardware Security Module) safety module of the vehicle which also provides secure time base for the digital signature timestamps. HSM module manages all cryptographic operations with private keys. In case of threats this module should be erased. HSM is not a part of OBU. It is using the Short Term Identity (STI) in order to ensure the user anonymity. STI is an anonymous key pair derived from ELP (Electronic License Plate) parameters with shorter lifetime. Short-term vehicle identification is carried out by pseudonyms. To obtain a pseudonym the car Ci generates the set of key pairs SK1v, PK1v,..., SKnv, PKnv and sends the public keys to corresponding CA through a secure communication channel. Vehicle uses its long-term identification for authentication within the CA. CA then signs all public keys PKnv and generates a set of pseudonyms for

ACTA TECHNICA CORVINIENSIS – Bulletin of Engineering
50 | F a s c i c u l e 3
mentioned vehicle. Each pseudonym contains CA identifier, information on the pseudonym lifetime, public key and the CA signature. It does not contain any information about the vehicle identity. The frequency of pseudonyms change is irregular and depends on the vehicle protection degree, on input parameters (position, speed) and on the system settings. To obtain next pseudonyms are used so-called sets of pseudonyms. These pseudonyms are periodically supplemented by CA. After the node moves from the set of pseudonyms 1 to the set of pseudonyms 2 it can no longer use any pseudonym from the set 1. The process of message signing (message is generated by vehicle Ci) is be mathematically expressed as:
Ci →∗: M, HT, SignSKVi[(M, HT)|T], CertPKVi (2)
Where: M represents safety-related message, HT represents the cryptographic header and tailer of the message, SKVi is the secret (private) key of vehicle Ci, PKVi is public key of vehicle Vi, T is timestamp, Cert is certificate valid for the vehicle Ci (signed by anonymous public key PKVi) and * represents number of receivers (in case the message was sent to more vehicles). Current certificate of Vi vehicle signed in point of time j by anonymous public key of vehicle Ci (PKi) contains:
CertCiPKj = PKjSignSK−CAPKVjIDCA, (3)
where: SignSK−CA represents corresponding CA certificate signature based on its private key SK − CA and IDCA represents unique identification number of particular CA.. Implementation of the signature based on EC in
C-ITS It must be noted that ECDSA scheme of digital signature is just a curvilinear domain of DSA signature scheme therefore their signature generation and signature verification phases are nearly identical. For C-ITS are recommended the elliptic curves E over the group GF(p), where p is a large prime number [14]. Elliptic curves over these algebraic structure are defined by the set of pointsPxp, yp, where xp, yp are coordinates of GF(p)and by distinguished point O (at infinity). Elliptic curve Ep(a, b) constructed over GF(p) must satisfy the equation:
y2 ≡ x3 + ax + b (modp), (4)
where a, b are coefficients (constants) of elliptic curve Ep(a, b), p is prime number and x, y are coordinates. Calculation of individual operations of ECDSA algorithm is performed on the set of parameters known as system parameters. These system parameters are: type of elliptic curve Ep(a, b), point on elliptic curve which is order of prime number n for which is valid n. P = O.
Note: various point on the curve, which is satisfying the equation (4), have different order (it is so-called infinite loop operation when by multiplying the point is the infinity achieved for the first time in the GF(p). For practical application is currently preferred p =224 or256 bits [14] where is the order of EC high what is used for DLP problem. In the next step is in the particular HSM module of the vehicle Ci selected random number d from the interval (1, n − 1) and on the elliptic curve Ep(a, b) is calculated new point Q:
Q = d. P, (5) where d is private key of the vehicle Ci. Points P and Q can be disclosed. Then the private and public keys of particular vehicle Ci using the ECDSA scheme with Ep(a, b) are:
PKCi = Ep(a,b), n, P, Q SKCi = d. (6)
After key pair PKCi and SKCi generation is in the HSM module of the Ci vehicle realized the calculation of digital signature and signed message using generated random number k (since it is a stochastic scheme of digital signature). For each message M is generated new random number. ECDSA digital signature consists of the calculation of two parameters r and s as mathematically expressed in equations (7) and (8).
k. P = (x1, y1); r = x1mod n, (7)
s = k−1(H(M) + d ∗ r)mod n. (8)
Note: H(M) is the hash code of selected computationally secure hash function (e.g. SHA-256). In the Ci vehicle (respectively in all vehicles in the range) is performed verification of the signature attached to message M’ which was created using the ECDSA scheme. It means there are verified received cryptographic signatures r’ and s’ attached to the message. This is realized by calculation of auxiliary variables w, u1, u2 and v as it is mathematically expressed in equations (9) to (11).
w = (s´)−1mod n and H(M´), (9)
u1 = (H(M´). w)mod n; u2 = r´. w mod n, (10)
u1. P + u2. Q = (x0, y0); v = x0mod n. (11) If v=r´ the message verification was performed and the message is considered as credible. PRACTICAL PART In the practical part we compared the amount of verified messages received within the period of 1s for different types of elliptic curves in ECDSA cryptographic scheme. Experiment was conducted using the OPEN SSL library

ACTA TECHNICA CORVINIENSIS – Bulletin of Engineering
51 | F a s c i c u l e 3
on two different computes. One computer equipped with processor Pentium Dual-Core E5500 2,8GHz, second computer equipped with processor i5-2500 3,3GHz. Let’s assume the worst case scenario (traffic-jam) on a four-lane intersection as shown in Figure 3. Furthermore let’s assume that all vehicles shown in Figure 3 are equipped with C-ITS applications and contain communication module for C2C communication with ECDSA digital signature scheme messages authorization. We analysed the amount of verified CAM messages within the defined time period (1s) from the point of view of the vehicle 𝑉𝑉𝑖𝑖. The vehicle is receiving all messages in the range. For the 300m range (what is the usual range according to IEEE 802.11p [14]) it represents for the defined scenario reception and verification of messages from up to 800 vehicles. We assume that the CAM messages are generated every 300ms (according to ETSI TS 102 637-2 [15]). It means that the vehicle 𝑉𝑉𝑖𝑖 must verify each second 2400 messages.
Figure 3. Analyzed scenario of intersection
In order to evaluate the secure transmission effectiveness as well as to evaluate the real possibilities of verification of the amount of safety-critical messages we follow the recommendations in standard IEEE 1609.2 for the elliptic curve type selection for the ECDSA scheme which recommends the use of NID_secp224r1 (where the value 224 bits represents the size of selected prime number in ECDSA scheme). According to realized experiments the message length do not affect the signature verification time. Verifications were performed for messages with lengths 100B, 300B and 1024B and the verification time was identical. Results of realized experiment with the use of OPEN SSL (Secure Sockets Layer) cryptographic library and processor Pentium Dual-Core E5500 2,8GHz has shown
the verification time of 2400 messages for selected elliptic curve 2.66s. It means that the vehicle can verify during one second only 902 messages what represents only 37,5% of all received messages. Results indicate overloaded communication what could adversely affect the reaction of the driver which is needed in real time (within 100ms). If we use the same scenario with ECDSA scheme and NID_secp160r2 curve (with shorter key) the vehicle 𝑉𝑉𝑖𝑖 would manage to verify 60% or received messages. With the reduction of the EC key length is the percentage of verified messages increasing (for example for the NID_secp128r2 it would be 83%) but the transmission safety is decreasing. During the selection of appropriate key length of ECDSA scheme is necessary to follow the recommendations for computational safety in the process of solving discrete logarithm as mentioned in the theoretical part of this article (the recommended curve length is greater than 160B). We also conducted experiment in order to examine the ability of the vehicle 𝑉𝑉𝑖𝑖 to verify messages for a selected period of time and we determined the amount of verified messages during 1s for different types of elliptic curves (Figure 4). Experiment was conducted for the same length of useful message (payload) 300B.
Figure 4. Comparison of the amount of verified
messages for different EC curves (processor Pentium Dual-Core E5500 2,8GHz)
The results of experiment realized for the worst case of “crowded intersection” indicate that the network throughput must be addressed by additional measures. One solution could be dynamic implementation of different EC based on monitored load for example by the use the received messages counter in the vehicle. After the critical amount of received messages is reached the safety can be switched to weaker. In order to maintain suitable level of safety there are needed OBU units with higher performance. We performed the same experiments with the same curves on better computer equipped with processor i5-2500 3,3GHz and the performance increased by 50%. The

ACTA TECHNICA CORVINIENSIS – Bulletin of Engineering
52 | F a s c i c u l e 3
amount of verified messages increased from 902 to 1307 (for the curve NID_secp224r1). Performance of currently manufactured OBUs [16, 17] is not sufficient. The solution could be the use of supercomputer for intelligent vehicles Drive PX2 which was presented by company Nvidia on the CES 2016. Computing performance of this supercomputer is 24 TOPS (300x more powerful than computer used for our experiments). With this computer could be used for the same scenario EC with longer key, e.g. NID_secp521r1. We realized the C2C communication model (Figure 5) for the same scenario of four-lane intersection in the SW tool OPNET Modeler [19] and investigated additional parameters such as network delay and network throughput for 800 vehicles.
Figure 5. Model of vehicles communication
without authentication
The node consists of four processors. The first one is the “source” which simulates the data transferred from higher layers. It is a simple source which generates packets with certain length and frequency and records statistics such as the length of generated packet and generation time which are used at the end of the simulation to calculate the total network delay, throughput and other parameters. Source will generate packets with length of 300 bytes and sends them with frequency 1 to 10 messages per second. Generated data are sent to next processor “wlan_mac_intf”. This serves as interface between higher layers and MAC (Medium Access Control) layer. Its task is to send packets from the source to the “wireless_lan_mac” processor and to send packets received from this processor to “sink” processor which throws away packets from other nodes and makes statistics in order to allow calculation of network
properties. It also inserts the addresses (in our case broadcast) in order to simulate the CAM messages exchange. The “wireless_lan_mac” processor is used to simulate the MAC layer. It produces the frames and sends them to transmitting module “wlan_port_tx0” respectively to compose the message received from “wlan_port_rx0” module. There is implemented access method CSMA/CA (Carrier Sense Multiple Access with Collision Avoidance). The node model also contains modules for data transmission respectively data receipt “wlan_port_tx0” and “wlan_port_rx0” which simulate the channel settings for transmission and receipt and contain methods to calculate the number of erroneous bits, the noise impact and so on. The receiving module also informs the processor “wireless_lan_mac” on the state of the media which is necessary for implementation of the access method. The last module is antenna. In our case we used isotropic antenna. Results of delay and throughput in VANET network are shown in Figure 6.
Figure 6. Delay in VANET network (model
“four-lane intersection“)
The results of the simulation indicate the average transmission delay of 300B long messages on the value of 0,5 ms while the load is 2,5Mbs. This delay does not include the time needed for signing and verification. The total delay of one message transmission when used recommended elliptic curve NID_secp224r1 can be calculated according to the equation (1), where:
Tsign(M) = 0,969 ms, Ttx(SignPrKv[M]) = 0,5 ms,
Tverify(M) = 1,109 ms
Than: THT(M) = 2,758 ms
We calculated the average delay of one message from its creation up to the receipt on the value of 2,758ms what is in line with requirement for a maximum delay in safety-critical applications which is 100ms. We also examined the impact of message length on total message delay (in the same scenario). Results are presented in Figure 7.

ACTA TECHNICA CORVINIENSIS – Bulletin of Engineering
53 | F a s c i c u l e 3
In case of RSA signature scheme, which has greater key length, is the average delay of message transmission between nodes increased to 450ms. Such delay would have a great impact on the overall safety.
Figure 7. The impact of message size to the delay in
transmission
CONCLUSIONS Authors in the contribution present how type of elliptic curve and length of message influence performance of the network. In detail they are concentred of describing of PKI and ECDSA algorithm. The accrued situation leads to generation and sending an authorised warning message to the surrounding vehicles signed by a digital signature within vehicular networks. We analysed four lane overloaded intersection, where we found that it is necessary to making demands on OBU performance. In practical part, the authors analysed how performance of OBU influence number of verified messages and how the length of message influence the performance of network. We compared two different common computer, where was 50% different in performance. Also with increasing of message length is delay in network increasing from 0,5ms (300B message) to 450ms in (2kb message). Such a delay would have a major impact on the overall safety. Acknowledgment This work has been supported by the Educational Grant Agency of the Slovak Republic (KEGA) Number: 008ŽU-4/2015: Innovation of HW and SW tools and methods of laboratory education focused on safety aspects of ICT within safety critical applications of processes control. References [1] E. B. Hamida, H. Noura and W. Znaidi, “Securtiy of
cooperative intelligent transport systems: standards, Threats analysis and cryptographic countermeasures“, in Electronics 2015 vol 4, pp. 380-423, ISSN: 20799292.
[2] S. Bhoi, P. Khilar, “Vehicular communication: A
survey“, in. IET Netw. 2014 vol 3, pp. 204–217. [3] M. A. Lebre, F.L. Mouel, E. Menard, J. Dillschneider
and R. Denis, “VANET applications: Hot use cases”, in Technical Report hal-01024271; 2014, p. 1–36.
[4] http://www.preciosa-project.org [5] http://www.evita-project.org [6] G. Popov, M. Hristova and Hr. Hristov, “Method of
increasing reliability of semi-ergatic systems in extreme situations”, in: Latest Trends in Applied Informatics and Computing, 3rd International Conference on Applied Informatics and Computing Theory (AICT '12), Barcelona, Spain, (2012), ISBN: 978-1-61804-130-2, pp 225 – 231.
[7] J. Harding, “Vehicle-to-vehicle communications. Rediness of V2V technology for applications”, Report No DOT HD 812 014, Washingtnon, DC, National Highway Traffic Administration, 2014, in: http://www.nhtsa.gov.
[8] J. Ďurech, P. Holečko, E. Bubeníková and M. Franeková: “Performance analysis of authentication protocols used within Cooperative - Intelligent Transportation Systems with focus on security”, in: International conference TST 2015, Wroclaw, Poľsko. Selected paper in: CCIS (Communications in Computer and Information Science) 531 proceedings. Springer- Verlag, 2015, pp: 231-240, ISBN 978-3-319-24576-8
[9] J. Ďurech, M. Franeková, P. Holečko, “VANET throughput model scenarios for authorized V2V communication”,in: IEEE conference INES 2015, 3.- 5. 9. 2015, Bratislava, pp.129-133, ISBN 978-1-4673-7938-0.
[10] S. Vaudenay, “A classical introduction to cryptography”, Springer, ISBN 0-387-25880-9.
[11] N. W. Wang, Y. M. Huang and W. M Chen, “A novel secure communication scheme in vehicular adhoc networks” in: Computer Communications, 2008, 31, 2827–2837., cit 11/2015, http://www.sciencedirect.com/science/article/pii/S0140366407005178.
[12] N. Varshney, T. Roy and N. Chaudhary, “Security protocol for VANET by using digital certification to provide security with low bandwidth”, in: Proceedings of the 2014 International Conference on Communications and Signal Processing (ICCSP), Melmaruvathur, India, 3–5 April 2014, pp. 768–772, 11/2015, cit.:11/2015, http://ieeexplore.ieee.org/xpls/abs_all.jsp?arnumber=6949947
[13] V. Klima and T. Rosa, “Kryptologie pro praxi-DSA, ECDSA”, in: Chip 8/2002, p. 135-136.

ACTA TECHNICA CORVINIENSIS – Bulletin of Engineering
54 | F a s c i c u l e 3
[14] FIPS 186-3. The Elliptic Curve Digital Signature
Algorithm, nIST publication, 2010. [15] IEEE 802.11p [16] ETSI TS 102 637-2 [17] Savari networks: “MobiWAVE – on board unit”, in:
http://www.savarinetworks.com/files/MobiWAVE
[18] Unex “OBU-201U”, in: http://unex.com.tw/product/obu-201u
[19] Opnet Modeler 17.5 Documentation, 2013.
copyright ©
University POLITEHNICA Timisoara, Faculty of Engineering Hunedoara,
5, Revolutiei, 331128, Hunedoara, ROMANIA http://acta.fih.upt.ro

© copyright Faculty of Engineering – Hunedoara, University POLITEHNICA Timisoara
ACTA TECHNICA CORVINIENSIS – Bulletin of Engineering Tome X [2017] Fascicule 3 [July – September] ISSN: 2067 – 3809
1.Richárd PETŐ
SOME SAFETY AND SECURITY ISSUES OF UAVS 1. Óbuda University, Doctoral School, Budapest, HUNGARY Abstract: UAV or drone technology has become easily available, and the drone has grown into an affordable and effective device for some commercial and business sectors. These sectors quickly realised that drones are cost- and time-effective therefore they quickly adopted them. Unfortunately, drones are favoured by criminals too. In the following, the article discusses the construction and operation of UAVs in connection with safety and security requirements. The article focuses on the main processes only without providing any details of previous documents or information on processes of obtaining such document. Keywords: UAV, drone, RC, safety and security, terrorism, explosive devices SAFETY AND SECURITY REGULATIONS OF UAVs The supreme law of Hungary is the Fundamental Law, the highest level of legal regulation in Hungary. It contains and comprises the most important regulation related to the structure and functioning of the State. It determines social, political, and economic segments, and also it contains rights and obligations of people. It sets forth in Articles XVII and XX that: [1] 1. Every employee shall have the right to working
conditions which respect his or her health, safety and dignity.[1]
2. Everyone shall have the right to physical and mental health. [1]
3. Hungary shall promote the effective application of the right referred to in Paragraph (1) by an agriculture free of genetically modified organisms, by ensuring access to healthy food and drinking water, by organising safety at work and healthcare provision, by supporting sports and regular physical exercise, as well as by ensuring the protection of the environment. [1]
Act XCIII of 1993 on Occupational Safety and Health (OSH) makes provisions on the necessary factors of safe and healthy working. It precisely determines the roles of the State, and those of employers and employees – “the three roles” – including their rights and obligations. However, it does not provide a factual solution, although it contains the main objectives, established by the Fundamental Law.
The Act orders that employers need to ensure safe and healthy working conditions. An employer needs to make a risk analysis and own working regulation. The employee sector needs to follow the working regulations of the employer, and the International Labour Office surveys both employees and employers how they fulfil the requirements. In Hungary the National Transport Authority (NTA), as the central institution of transportation, manages independently [2]: road transport; civil, state aviation; road; railways; shipping and others. The main objective of the Authority is to maintain a high level of transport safety in accordance with the goals set forth by the European Union in this field. The Aviation Authority (part of the NTA) provides civil and military aviation management tasks. Presently it does not have an operative regulation for drones yet, although the Authority made a regulation plan whose estimated time of entering force is June 2017. SAFETY REQUIREMENTS The state, employee, and employer have their own tasks to realize safe and health working conditions set forth by the OSH. Conventional risk analysis First of all, before launching a working process the employer has to create safety documents and do training for employees. The types of safety documents depend on the activities of the employer. The OSH requires a risk analysis document as well.

ACTA TECHNICA CORVINIENSIS – Bulletin of Engineering
56 | F a s c i c u l e 3
It is a fundamental safety document that every employer needs to create. Risk analysis is useful in many situations [3]: - It anticipates and “neutralizes” potential problems; - It helps to prepare for events, such as equipment or
technology failure, staff- environment accident, a broad range of crimes, natural disaster;
- It assists when need to make a decision whether or not to do something. This allows the management to be able to make better strategic decisions;
- It provides good possibility and background assistances to staff training;
- It increases teamwork by increasing openness, honesty and understanding within the project team;
- It helps to manage cost commitments and profit forecasts which will be accurately stated for each level of risk.
Risk analysis is divided in two parts [3]: Risk assessment
This part of the document identifies, evaluates, and measures the probability and severity of risks. The aim of risk description is to display the identified risks in a structured format. The widespread schema is the table form where the use of a well-designed structure is necessary to ensure a widespread risk identification, description and assessment process. The consequence and probability of each of the risks set out in the table should allow the prioritization of the key risks that need to be analysed in more details. Risk estimation can be quantitative, semi-quantitative or qualitative. Using risk assessment techniques to obtain (more) realistic estimates will result in a more attainable plan. It fully discloses the sensitivity of the work, process or project to its participants in order to ensure that all threats are fully understood. Although, at times new risks appear, for that reason risk assessment techniques must be reconsidered. Risk management [4], [5]
Standards have been developed by several organizations, such as the International Organization for Standardization (ISO), Institute of Risk Management (IRM), the Association of Insurance and Risk Management (AIRMIC), and the Public Risk Management Association (PRIMA). This part of document helps to decide what to do about risks. It summarizes the possible and chosen solutions in a short form considering cost-effective approaches. Suggested methods of the OHS are: [6] - Elimination and substitution One of the best solutions is to remove a hazard from the workplace, or substitute (replace) hazardous materials or machines with less hazardous ones. Removing the hazard from the workplace results in the elimination of a threat. Using the same chemical but in different form is
the other type of substitution. It is important that one hazard should not be traded for another one. Example: Dry, dusty powder may be a significant inhalation hazard, but if this material is available and usable as pellets or crystal, there may be less exposure. - Engineering Controls It includes designs or modifications to plants, safety equipment, or system (such as ventilation systems, motion detector, etc.) processes that reduce the source of exposure. A preventer system of human and technology errors is also included. Examples: » Process control. Changing the way a process, or a job
activity is done in order to reduce the risk. (Using automation results in a lower level of human risk.)
» Enclosure and Isolation. These methods aim to physically separate a hazard from humans or environment. (Manipulate hazardous material in glove box, a.k.a. sealed container.)
» Ventilation. This method controls air rate, is able to add and remove air in the work environment. (Smoke-exhauster removes smokes from work environment.)
- Administrative Controls [7] [8] These are controls that define the way the work is done. Administrative controls include timing of work, employer rules and law, personal responsibilities, work practices, such as standards, operating procedures (including training, education, management, equipment maintenance, and personal hygiene practices) emergency preparedness and previous experience. » Working time, scheduling Job-rotation limits the amount of time a worker is exposed to a substance. Work/rest schedules limit the length of time a worker is exposed to a hazard. When few workers are employed in a working environment it is suggested to schedule the maintenance and high exposure operation. » Work practices, experience It is based on previous human and technical errors of working and on lessons learned from “How do not do that/ How do that” experience. » Education and training Several processes and equipment require specific qualification. Education and training help to minimize risks and they give a possibility to ensure that workers understand hazards, risks and they are able to do cooperative and safe work. » Housekeeping The housekeeping training helps understand the risks stemming from disorder set in a workplace. Measures taken decrease risks of being hit by falling down objects, of slipping on greasy surfaces, of cutting or puncturing the skin and body.
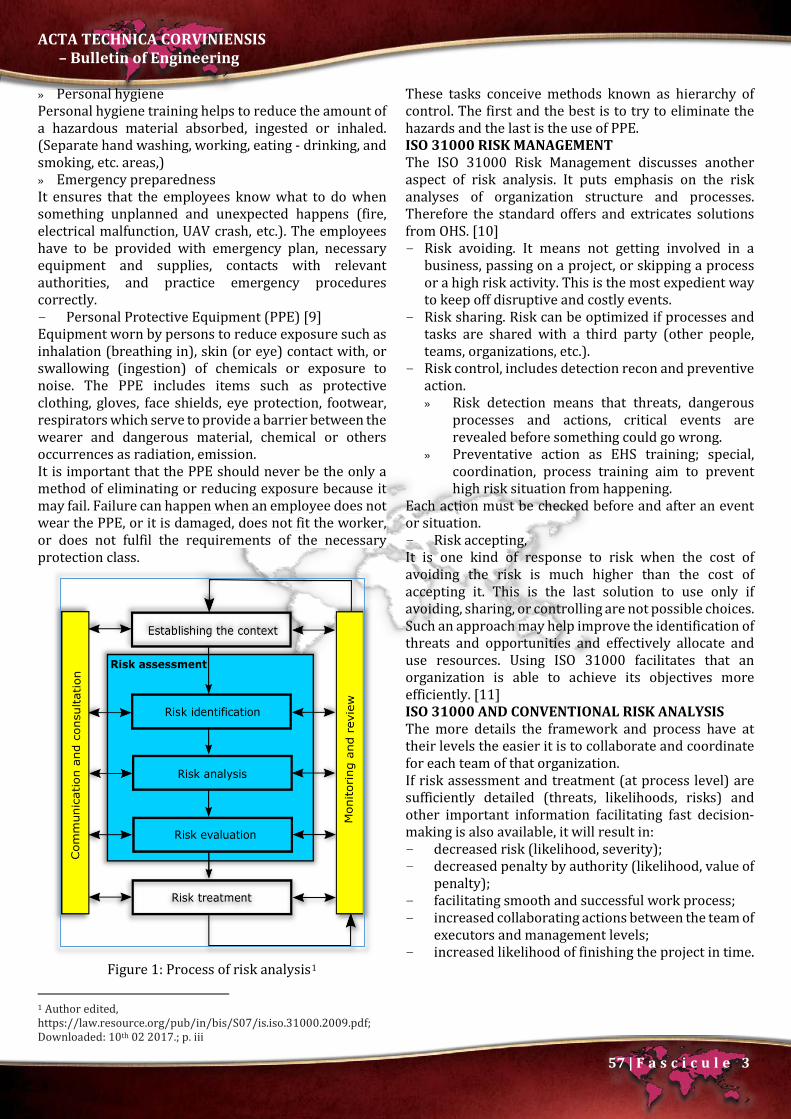
ACTA TECHNICA CORVINIENSIS – Bulletin of Engineering
57 | F a s c i c u l e 3
» Personal hygiene Personal hygiene training helps to reduce the amount of a hazardous material absorbed, ingested or inhaled. (Separate hand washing, working, eating - drinking, and smoking, etc. areas,) » Emergency preparedness It ensures that the employees know what to do when something unplanned and unexpected happens (fire, electrical malfunction, UAV crash, etc.). The employees have to be provided with emergency plan, necessary equipment and supplies, contacts with relevant authorities, and practice emergency procedures correctly. - Personal Protective Equipment (PPE) [9] Equipment worn by persons to reduce exposure such as inhalation (breathing in), skin (or eye) contact with, or swallowing (ingestion) of chemicals or exposure to noise. The PPE includes items such as protective clothing, gloves, face shields, eye protection, footwear, respirators which serve to provide a barrier between the wearer and dangerous material, chemical or others occurrences as radiation, emission. It is important that the PPE should never be the only a method of eliminating or reducing exposure because it may fail. Failure can happen when an employee does not wear the PPE, or it is damaged, does not fit the worker, or does not fulfil the requirements of the necessary protection class.
Figure 1: Process of risk analysis1
1 Author edited, https://law.resource.org/pub/in/bis/S07/is.iso.31000.2009.pdf; Downloaded: 10th 02 2017.; p. iii
These tasks conceive methods known as hierarchy of control. The first and the best is to try to eliminate the hazards and the last is the use of PPE. ISO 31000 RISK MANAGEMENT The ISO 31000 Risk Management discusses another aspect of risk analysis. It puts emphasis on the risk analyses of organization structure and processes. Therefore the standard offers and extricates solutions from OHS. [10] - Risk avoiding. It means not getting involved in a
business, passing on a project, or skipping a process or a high risk activity. This is the most expedient way to keep off disruptive and costly events.
- Risk sharing. Risk can be optimized if processes and tasks are shared with a third party (other people, teams, organizations, etc.).
- Risk control, includes detection recon and preventive action. » Risk detection means that threats, dangerous
processes and actions, critical events are revealed before something could go wrong.
» Preventative action as EHS training; special, coordination, process training aim to prevent high risk situation from happening.
Each action must be checked before and after an event or situation. - Risk accepting, It is one kind of response to risk when the cost of avoiding the risk is much higher than the cost of accepting it. This is the last solution to use only if avoiding, sharing, or controlling are not possible choices. Such an approach may help improve the identification of threats and opportunities and effectively allocate and use resources. Using ISO 31000 facilitates that an organization is able to achieve its objectives more efficiently. [11] ISO 31000 AND CONVENTIONAL RISK ANALYSIS The more details the framework and process have at their levels the easier it is to collaborate and coordinate for each team of that organization. If risk assessment and treatment (at process level) are sufficiently detailed (threats, likelihoods, risks) and other important information facilitating fast decision-making is also available, it will result in: - decreased risk (likelihood, severity); - decreased penalty by authority (likelihood, value of
penalty); - facilitating smooth and successful work process; - increased collaborating actions between the team of
executors and management levels; - increased likelihood of finishing the project in time.

ACTA TECHNICA CORVINIENSIS – Bulletin of Engineering
58 | F a s c i c u l e 3
If the previous requirements are partly or not realized a lower efficiency of work process can occur. If final work is not completed in time the possible disadvantages are: - increased overall costs, - financial loss, - no new projects can be undertaken (if resources
are limited).
Figure 2: Relationship between the risk management
principles, framework and process2
The more details the framework and process have at their levels the easier it is to collaborate and coordinate for each team of that organization. If risk assessment and treatment (at process level) are sufficiently detailed (threats, likelihoods, risks) and other important information facilitating fast decision-making is also available, it will result in: - decreased risk (likelihood, severity); - decreased penalty by authority (likelihood, value
of penalty); - facilitating smooth and successful work process; - increased collaborating actions between the team
of executors and management levels; - increased likelihood of finishing the project in
time. If the previous requirements are partly or not realized a lower efficiency of work process can occur. If final work is not completed in time the possible disadvantages are:
2 Author edited, https://law.resource.org/pub/in/bis/S07/is.iso.31000.2009.pdf; Downloaded: 10th 02 2017.; p. iii
- increased overall costs, - financial loss, - no new projects can be undertaken (if resources
are limited). HARMONY BETWEEN COMPANY ACTIVITIES AND OCCUPATIONAL SAFETY AND HEALTH REQUIREMENTS The manufacturing of a UAV is the most complex if the UAV’s hardware and software elements are designed, produced and programmed by one company. In this case the company first needs to get an operating licence and evolve conditions of workplaces fitting the function. In the following chapter the construction and operation of UAVs will be discussed in connection with safety and security requirements. The article discusses only the main processes and does not provide any details of previous documents or on the processes of obtaining such documents. Therefore the activities are divided into two sections:
1. Evolving workplaces; 2. Producing UAVs.
The figure below shows the main rooms of a factory, and the main process of evolving requirements at the management’s levels.
Figure 3: The main process of safety requirements in a
factory3 The figure above shows the main rooms of a factory: – Administrative office: » sales management and administrative tasks; – Hygiene and lunch rooms: » lavatory; » lunch room; » dressing room; – Factory workspaces: » dirty workspaces (painting, assembly, soldering,
etc.) » clean workspaces (programming, minor testing,
etc.)
3 It is not a complete overview.

ACTA TECHNICA CORVINIENSIS – Bulletin of Engineering
59 | F a s c i c u l e 3
In order to do the eligible development required by law, first a step-by-step risk analysis has to be carried out. The process must be systematic because the risks, aspects and settings continuously change. The next figure shows the tasks of a UAV factor. The UAV factor includes planning, constructing and testing processes of UAVs and of other equipment of UAV, such as sensors, cameras, telecommunication systems.
Figure 4: The main process of UAV manufacturing
and operation4 All equipment (UAV, UAV controller, sensors, telecommunication systems, etc.) needs to go through a procedure as:
1. (Re)Planning; 2. Construction; 3. Testing.
If the equipment must be upgraded, or result of tests is not eligible, the process stars again with step one: re-planning. Some testing and construction methods can be done both inside and outside the factory. Each factors, processes, and tasks need to be in harmony with the relevant legal regulations. UAV-RELATED RISKS The previous chapter of this article describes some OHS, NTA requirements, and risk analyses in connection with UAV’s safety. What about UAV-related risks? In the last three-four years, the usage of UAVs generated a huge and significant chaos worldwide. Everything started with package delivery, illegal observation of private sphere, and recordings. [12] The observation and making illegal recordings of private sphere or secured objects (army bases, embassies, etc.) are critical points of UAV use, because a lot more information can be gathered immediately by UAVs as with the use of other methods. If an
4 It is not a complete review. 5 https://www.offiziere.ch/wp-content/uploads-001/2016/10/Screenshot-2016-10-04-16.20.19-e1479065908334.png; Downloaded: 28th 02 2017. 6 Iraqi Counter Terrorism Service solider in Mosul examines an ISIS drone modified to carry a 40mm rifle grenade in the attached plastic tube. Grenade is dropped when the drone is over Iraqi forces. (Mitch
unauthorised person gathers confidential information, this fact increases the risks of that particular facility. The law provides for data protection and operating UAVs very strictly, but legal prohibitions do not deter criminals from conducting unlawful activities. SkyJack is the name of the drone hacking program which is able seek out and hack other Parrot drones through their wireless network. A SkyJack pilot has the ability to control and view the camera sources of the affected drone. [13]
Figure 5: Illegal observation and recording5
Figure 6: A UAV that carried a 40mm rifle grenade6
Figure 7: Homemade kamikaze UAV7
Utterback); https://017qndpynh-flywheel.netdna-ssl.com/wp-content/uploads/2017/02/Drone-Cup-holders-2-Mitch-Utterback.jpg; Downloaded: 28th 02 2017. 7 http://u0v052dm9wl3gxo0y3lx0u44wz.wpengine.netdna-cdn.com/wp-content/uploads/2016/04/Armed-Drone-RPG-ISIS.jpg; Download: 2017.02.28.

ACTA TECHNICA CORVINIENSIS – Bulletin of Engineering
60 | F a s c i c u l e 3
Unfortunately, these problems are not commensurate with risks of UAV usage by terrorists. Nowadays, on the radio, television and the internet more and more news report that terrorist use UAVs to ambush military forces and attack civilians. [14] Most of the modified drones carry some kind of weapons, such as a gun or explosive charges. The latter one is particularly dangerous. [15] The explosion and fragments are able to cause serious injuries or even death in a large radius if they hit or reach human body. Public places where large numbers of people gather at a time are primary targets. Acknowledgement:
„ Supported BY the ÚNKP-16-3/IV. NEW NATIONAL EXCELLENCE PROGRAM OF THE MINISTRY OF HUMAN CAPACITIES” References [1.] The Fundamental Law of Hungary,
http://www.kormany.hu/download/e/02/00000/The%20New%20Fundamental%20Law%20of%20Hungary.pdf, 2017
[2.] Ministry of National Development –Transport Authority: Rationality, national interest, lawfulness, https://www.nkh.gov.hu/en/web/english/; Download: 2017.01.29.
[3.] Oracle: The benefits or risk assessment for projects, portfolios, and businesses; June 2009; http://www.oracle.com/us/products/applications/042743.pdf; Download: 2017.01.30
[4.] Institute of Risk Management: Risk management standards; https://www.theirm.org/knowledge-and-resources/risk-management-standards/; Download: 2017.01.30.
[5.] MindTools: Risk analysis and risk management – Evaluating and Managing Risks, https://www.mindtools.com/pages/article/newTMC_07.htm ; Download: 2017.02.06.
[6.] Canadian Center for Occupation Health and Safety (CCOHS) – Hazard control; http://www.ccohs.ca/oshanswers/hsprograms/hazard_control.html; Download: 2017.02.09.
[7.] Canadian Center for Occupation Health and Safety (CCOHS) – Workplace housekeeping - basic guide; http://www.ccohs.ca/oshanswers/hsprograms/house.html; Download: 2017.02.10.
[8.] Canadian Center for Occupation Health and Safety (CCOHS) – Emergency planning; http://www.ccohs.ca/oshanswers/hsprograms/planning.html; Download: 2017.02.10.
[9.] Canadian Centre for Occupational Health and Safety: How workplace chemicals enter the body; Download: 2017.02.08.
[10.] ISO 31000 – Risk management; http://www.iso.org/iso/home/standards/iso31000.htm; Download: 2017.02.09.
[11.] ISO 31000 Risk management – principles and guidelines;
https://law.resource.org/pub/in/bis/S07/is.iso.31000.2009.pdf; Download: 2017.02.10.
[12.] Pető Richárd: UAV alkalmazásában rejlő lehetőségek és veszélyek; Műszaki Katonai Közlöny XXIV. évfolyam, 2014. 3. szám; ISSN 1219-4166; pp 105-115.;
[13.] SkyJack; https://samy.pl/skyjack/; Download: 2017.02.08.
[14.] Paul Harper: Terror drones ISIS terrorists using deadly hobby drones to drop grenades on innocent civilians and troops in Mosul; https://www.thesun.co.uk/news/2616584/isis-using-hobby-drones-to-drop-grenades-on-civilians-and-troops-advancing-on-stronghold-mosul/; The Sun; 14th January 2017
[15.] Mitch Utterback: How ISIS is turning commercial drones into weapons in the battle for Mosul; http://www.foxnews.com/tech/2017/01/25/how-isis-is-turning-commercial-drones-into-weapons-in-battle-for-mosul.html; Fox News Tech; January 25, 2017
copyright © University POLITEHNICA Timisoara,
Faculty of Engineering Hunedoara, 5, Revolutiei, 331128, Hunedoara, ROMANIA
http://acta.fih.upt.ro

© copyright Faculty of Engineering – Hunedoara, University POLITEHNICA Timisoara
ACTA TECHNICA CORVINIENSIS – Bulletin of Engineering Tome X [2017] Fascicule 3 [July – September] ISSN: 2067 – 3809
1. I.O.OLADELE, 1,2. B. A.ISOLA, 1. S.FALODUN, 1. E. OGBU
COMPARATIVE INVESTIGATION OF THE INFLUENCE OF MERCERIZATION TREATMENT ON WHITE AND YELLOW MAIZE CORNCOBS REINFORCED EPOXY COMPOSITES 1.Department of Metallurgical and Materials Engineering, Federal University of Technology, Akure, NIGERIA 2.Department of Mechanical Engineering, Elizade University, Ilara-Mokin, NIGERIA Abstract: Agricultural wastes have significant potential in composite developments due to its high strength, environmentally friendly nature, low cost, availability and sustainability. An investigation was performed on the effect of chemical treatment on the reinforcement efficiency of white and yellow maize corncobs reinforced epoxy matrix composites. Epoxy resin composites reinforced with treated alkali solutions of NaOH and KOH as well as untreated yellow and white corncob particles were produced using the open moulding technique. The reinforcement was varied from 2-6 wt.% at intervals of 2 wt.% followed by mechanical and wear properties investigations. The results revealed that chemical treatment with alkali solutions enhanced the mechanical properties of the developed composites. It was observed that the flexural properties were enhanced in 2 wt. % W-NaOH and Y-KOH while tensile properties were enhanced in 2 wt. % Y-KOH corncob reinforced epoxy composites, respectively. However, 6 wt.% U-White corncob reinforced epoxy composite showed the optimum wear resistance. Keywords: corncob; epoxy; agricultural waste; alkali treatment; mechanical properties; wear resistance
INTRODUCTION Agricultural waste is the most abundant form of natural fibers [1] and applied in many spheres of modern industries. The utilization of such resources will not only provide sustainable and less expensive material but at the same time will contribute to waste disposal management as well as overcoming environmental problems [2]. Nowadays, natural fibers reinforced composites exhibit the superior mechanical properties than synthetic fiber reinforced polymer composites due to its inherent properties. Natural fiber reinforced composites are renewable, biodegradable, environment friendly and light weight material when compared to the synthetic fiber reinforced composites [3]. Several authors have reported recent progresses in the use of natural fibers (rice husk (RH), bagasse, bread-fruit, coconut shell and coir, etc.) in composites [4]. Corncob is the agricultural waste product obtained from maize which is one of the most important types of cereal
crop in Sub-Saharan Africa. When harvested, corn wastes namely corncobs and stovers are either left to dry on the farm after which they are burnt off or found littering the streets of market places. This practice does not help in building an eco-friendly economy. A better approach to this is to convert them to more useful energy products by the use of thermochemical technologies [5]. Corncob contains approximately 39.1% cellulose, 42.1% hemicellulose, 9.1%lignin, 1.7% protein and 1.2% ash [6]. Hemi-cellulose found in natural fibers is believed to be a compatibilizer between cellulose and lignin [7]. The mechanical properties of fibers directly relates to their elemental composition, components, structure and internal defects. The percentage of cellulose influences the structure and properties of fibers such as tensile strength, electrical resistivity, density, modulus, and crystallinity. However, it should not be generalized to all kinds of fibers. Those with higher cellulose content and higher degree of polymerization of cellulose have better

ACTA TECHNICA CORVINIENSIS – Bulletin of Engineering
62 | F a s c i c u l e 3
mechanical properties [8]. It is important to note that the properties of these fibers have been strongly influenced by their growing environments for example temperature, humidity, soil composition air and many more. All these affect the strength, height and density of the fibers. Polymeric materials are favored by materials designers due to its light weight, easy forming, resistance to corrosion, resilience and so on. In view of the many advantages polymer has it also has its own disadvantages; its low strength limits its application especially for structural purposes so the need for reinforcement to make it stronger and meet the necessary required specification for structural applications. Polymeric materials are non-biodegradable i.e. they do not decompose on time. Incorporation of corn cob in polymer could have economic advantages and low environment impact [9]. Kiran et al., [10] carried out a study on Mechanical Properties of Corn Cob Particle and E-Glass Fiber Reinforced Hybrid Polymer Composites. From the experimental results, it was observed that the corn cob particles and E-Glass fibers reinforced hybrid epoxy composites exhibited superior properties and thus can be used as an alternate material for synthetic fiber reinforced composite materials. Salmah et al., [11] carried out a research to study the effect of corn cob content and maleic anhydride polypropylene (MAPP) as a compatibilizer on tensile properties and morphology of Polypropylene (PP)/Corn cob (CC) bio composites. It was observed that the tensile strength and elongation at break of PP/CC bio-composites decreased with increasing corn cob loading while modulus of elasticity increased. The compatibilized bio-composites have higher tensile strength and modulus of elasticity compared to the uncompatibilized bio-composites. The incorporation of compatibilizer proved to be effective in enhancing the compatibility of a system comprising of hydrophilic corn cob filler and hydrophobic polypropylene. The morphology study indicates that the interfacial adhesion between corn cob and PP matrix was enhanced with MAPP as compatibilizer. Natural filler do not well disperse easily in polymer. Due to strong intermolecular hydrogen bonding between natural filler, they tend to agglomerate during compounding process with the matrix polymer. The low compatibility and interfacial adhesion of bio-composites lead to low mechanical properties of final product [12-14]. Therefore, study of ways to improve the interfacial adhesion between natural filler and matrix polymer is very important for the application of composites in industrial application. In recent years, the various methods that have been studied to improve the interfacial adhesion of composites, by modifying the natural filler surface have included the use of
compatibilizer such as maleic anhydride-grafted polypropylene (MAPP) [15], addition of silane coupling agent [16], chemical modification on natural filler [17-18], grafting polymer matrix with hydrophilic functional group [12] and plasma treatment on surface of natural filler [19] to the reinforced polymeric composites. Alkali treatment which is also known as mercerization is one of the most used chemical treatments on natural fibers. It is an effective low cost process to modify the fiber surface by disrupting the internal hydrogen bonding, which increases the surface roughness. Alkali treatment on natural fibers changes the crystallinity, unit cell structure and orientation of fibrils [20]. The treatment removes a certain amount of lignin, wax and oils covering the external surface of the fiber cell wall, partly depolymerizes cellulose and exposes short length crystallites [21]. It also removes hemicellulose and increases the amount of cellulose exposed on the fiber surface, thus increasing the number of possible reaction sites. The aim of this research is to study the effect of chemical treatment (mercerization) on the reinforcement efficiency of white and yellow corncobs reinforced epoxy matrix composites. MATERIALS AND EXPERIMENTAL PROCEDURE » Materials The materials used for the investigation includes Corncobs as shown in Figures 1 and 2 which serves as the reinforcement, Epoxy and hardener which serves as the matrix phase, Sodium hydroxide (NaOH) and Potassium Hydroxide (KOH) which was used as alkali or mercerizing agents.
Figure 1: White corn cob
Figure 2: Yellow corn cob
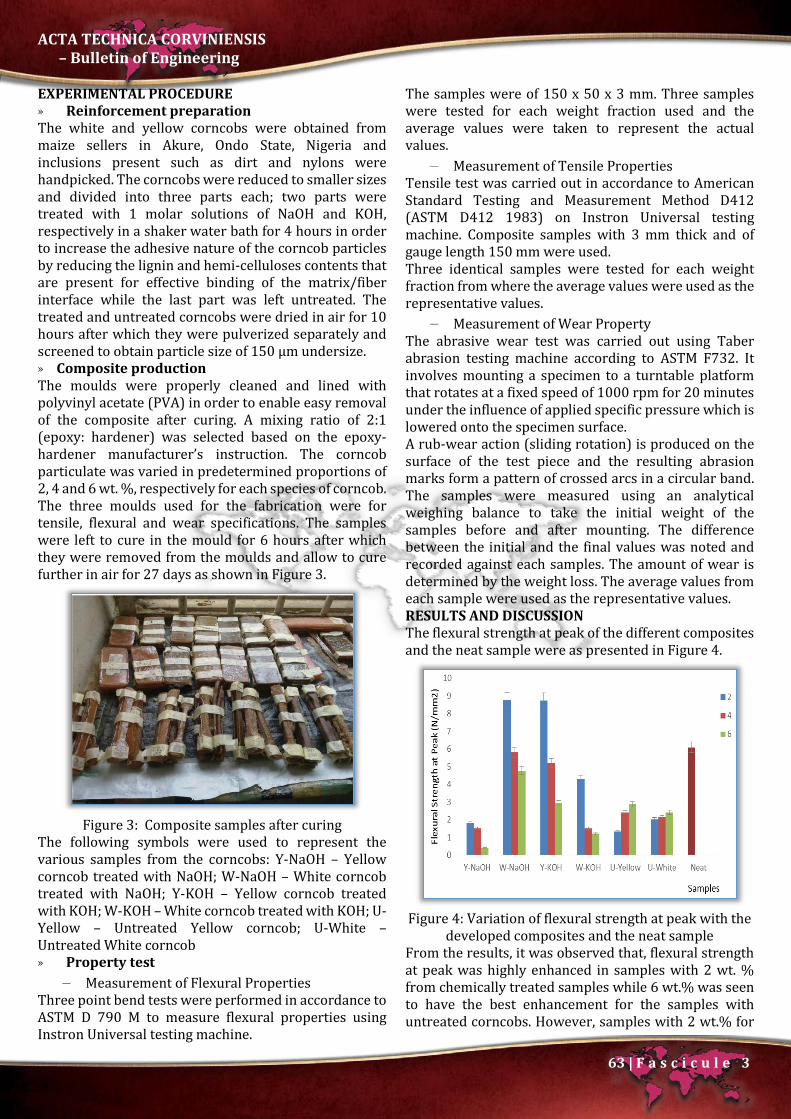
ACTA TECHNICA CORVINIENSIS – Bulletin of Engineering
63 | F a s c i c u l e 3
EXPERIMENTAL PROCEDURE » Reinforcement preparation The white and yellow corncobs were obtained from maize sellers in Akure, Ondo State, Nigeria and inclusions present such as dirt and nylons were handpicked. The corncobs were reduced to smaller sizes and divided into three parts each; two parts were treated with 1 molar solutions of NaOH and KOH, respectively in a shaker water bath for 4 hours in order to increase the adhesive nature of the corncob particles by reducing the lignin and hemi-celluloses contents that are present for effective binding of the matrix/fiber interface while the last part was left untreated. The treated and untreated corncobs were dried in air for 10 hours after which they were pulverized separately and screened to obtain particle size of 150 µm undersize. » Composite production The moulds were properly cleaned and lined with polyvinyl acetate (PVA) in order to enable easy removal of the composite after curing. A mixing ratio of 2:1 (epoxy: hardener) was selected based on the epoxy-hardener manufacturer’s instruction. The corncob particulate was varied in predetermined proportions of 2, 4 and 6 wt. %, respectively for each species of corncob. The three moulds used for the fabrication were for tensile, flexural and wear specifications. The samples were left to cure in the mould for 6 hours after which they were removed from the moulds and allow to cure further in air for 27 days as shown in Figure 3.
Figure 3: Composite samples after curing
The following symbols were used to represent the various samples from the corncobs: Y-NaOH – Yellow corncob treated with NaOH; W-NaOH – White corncob treated with NaOH; Y-KOH – Yellow corncob treated with KOH; W-KOH – White corncob treated with KOH; U-Yellow – Untreated Yellow corncob; U-White – Untreated White corncob » Property test
Measurement of Flexural Properties Three point bend tests were performed in accordance to ASTM D 790 M to measure flexural properties using Instron Universal testing machine.
The samples were of 150 x 50 x 3 mm. Three samples were tested for each weight fraction used and the average values were taken to represent the actual values.
Measurement of Tensile Properties Tensile test was carried out in accordance to American Standard Testing and Measurement Method D412 (ASTM D412 1983) on Instron Universal testing machine. Composite samples with 3 mm thick and of gauge length 150 mm were used. Three identical samples were tested for each weight fraction from where the average values were used as the representative values.
Measurement of Wear Property The abrasive wear test was carried out using Taber abrasion testing machine according to ASTM F732. It involves mounting a specimen to a turntable platform that rotates at a fixed speed of 1000 rpm for 20 minutes under the influence of applied specific pressure which is lowered onto the specimen surface. A rub-wear action (sliding rotation) is produced on the surface of the test piece and the resulting abrasion marks form a pattern of crossed arcs in a circular band. The samples were measured using an analytical weighing balance to take the initial weight of the samples before and after mounting. The difference between the initial and the final values was noted and recorded against each samples. The amount of wear is determined by the weight loss. The average values from each sample were used as the representative values. RESULTS AND DISCUSSION The flexural strength at peak of the different composites and the neat sample were as presented in Figure 4.
Figure 4: Variation of flexural strength at peak with the
developed composites and the neat sample From the results, it was observed that, flexural strength at peak was highly enhanced in samples with 2 wt. % from chemically treated samples while 6 wt.% was seen to have the best enhancement for the samples with untreated corncobs. However, samples with 2 wt.% for
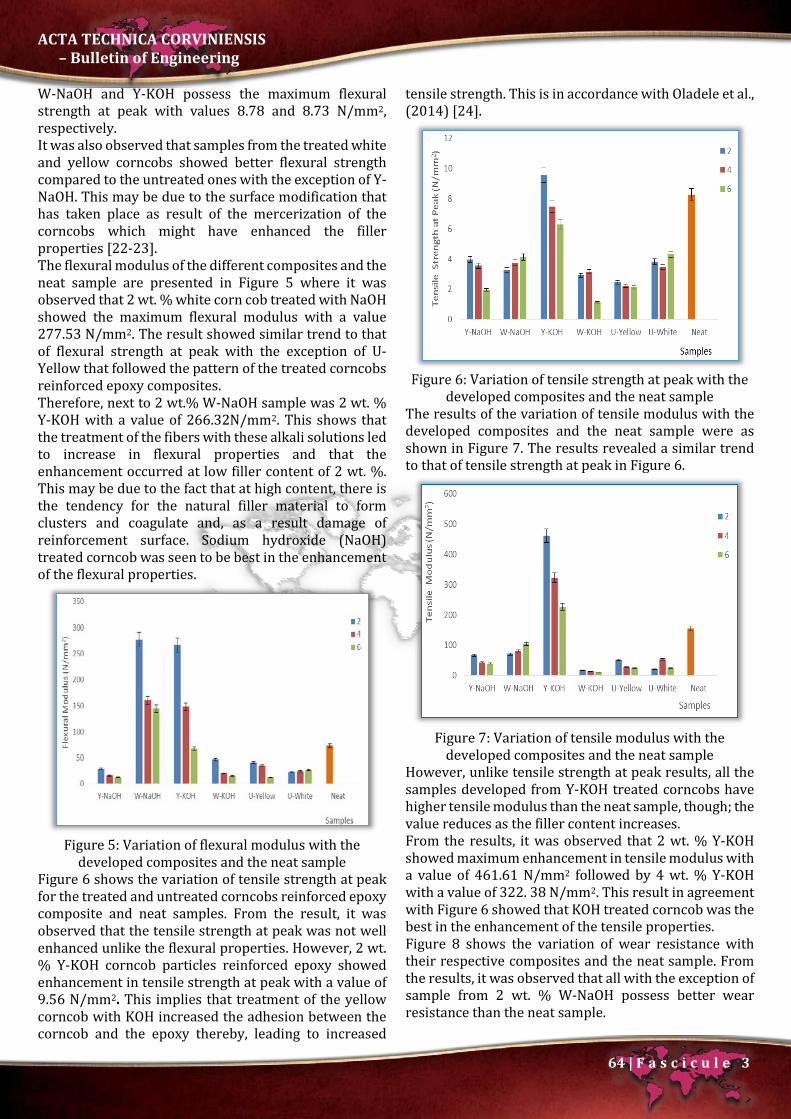
ACTA TECHNICA CORVINIENSIS – Bulletin of Engineering
64 | F a s c i c u l e 3
W-NaOH and Y-KOH possess the maximum flexural strength at peak with values 8.78 and 8.73 N/mm2, respectively. It was also observed that samples from the treated white and yellow corncobs showed better flexural strength compared to the untreated ones with the exception of Y-NaOH. This may be due to the surface modification that has taken place as result of the mercerization of the corncobs which might have enhanced the filler properties [22-23]. The flexural modulus of the different composites and the neat sample are presented in Figure 5 where it was observed that 2 wt. % white corn cob treated with NaOH showed the maximum flexural modulus with a value 277.53 N/mm2. The result showed similar trend to that of flexural strength at peak with the exception of U-Yellow that followed the pattern of the treated corncobs reinforced epoxy composites. Therefore, next to 2 wt.% W-NaOH sample was 2 wt. % Y-KOH with a value of 266.32N/mm2. This shows that the treatment of the fibers with these alkali solutions led to increase in flexural properties and that the enhancement occurred at low filler content of 2 wt. %. This may be due to the fact that at high content, there is the tendency for the natural filler material to form clusters and coagulate and, as a result damage of reinforcement surface. Sodium hydroxide (NaOH) treated corncob was seen to be best in the enhancement of the flexural properties.
Figure 5: Variation of flexural modulus with the
developed composites and the neat sample Figure 6 shows the variation of tensile strength at peak for the treated and untreated corncobs reinforced epoxy composite and neat samples. From the result, it was observed that the tensile strength at peak was not well enhanced unlike the flexural properties. However, 2 wt. % Y-KOH corncob particles reinforced epoxy showed enhancement in tensile strength at peak with a value of 9.56 N/mm2. This implies that treatment of the yellow corncob with KOH increased the adhesion between the corncob and the epoxy thereby, leading to increased
tensile strength. This is in accordance with Oladele et al., (2014) [24].
Figure 6: Variation of tensile strength at peak with the
developed composites and the neat sample The results of the variation of tensile modulus with the developed composites and the neat sample were as shown in Figure 7. The results revealed a similar trend to that of tensile strength at peak in Figure 6.
Figure 7: Variation of tensile modulus with the
developed composites and the neat sample However, unlike tensile strength at peak results, all the samples developed from Y-KOH treated corncobs have higher tensile modulus than the neat sample, though; the value reduces as the filler content increases. From the results, it was observed that 2 wt. % Y-KOH showed maximum enhancement in tensile modulus with a value of 461.61 N/mm2 followed by 4 wt. % Y-KOH with a value of 322. 38 N/mm2. This result in agreement with Figure 6 showed that KOH treated corncob was the best in the enhancement of the tensile properties. Figure 8 shows the variation of wear resistance with their respective composites and the neat sample. From the results, it was observed that all with the exception of sample from 2 wt. % W-NaOH possess better wear resistance than the neat sample.

ACTA TECHNICA CORVINIENSIS – Bulletin of Engineering
65 | F a s c i c u l e 3
Also, the wear resistances were seen to increase as the filler content increases in all the developed composites. It was again detected that untreated white corncob reinforced epoxy composites possess the optimum wear resistance compared to others. The best was obtained from 6 wt.% U-White corncob reinforced epoxy composites with a value of 0.00605 g. The high wear resistance obtained with the untreated corncob may be due to the presence of the entire filler constituent as a natural composite.
Figure 8: Variation of wear resistance with the
developed composites and the neat sample CONCLUSION The results of this investigation revealed that: » Flexural properties of the developed composites
were enhanced after treating the corncobs with NaOH and KOH, respectively. White corncob treated with NaOH was observed to be the best in this respect followed by yellow corncob treated with KOH both at 2 wt. % filler content.
» The tensile properties were enhanced in the composite sample containing 2 wt. % of Y-KOH treated corncob. This showed that only KOH treatment aid the enhancement of the tensile properties.
» The wear resistance was enhanced by untreated white corncob that was reinforced with 6 wt.% which showed that higher filler content was responsible for good wear resistance.
» Low filler content was responsible for high enhancement of the mechanical properties for the developed composites due to constant emergence of 2 wt. % filler content as the sample with optimum performance in all the mechanical properties examined.
References [1.] Doree C., The Methods of Cellulose Chemistry:
Including Methods for the Investigation of Substances Associated with Cellulose in Plant
Tissues, 2nd ed., Van Nostrand Co., New York, pp. 543, 1947.
[2.] Dittenber D. B., GangaRao H.V.S., Critical review of recent publications on use of natural composite in infrastructure, Compos. Part A: Applied Sci. Manuf., 2012, 43, pp. 1419-1429.
[3.] Boopalan M., Niranjana M. and Umapathy M. J., Study on the mechanical properties and thermal properties of jute and banana fiber reinforced epoxy hybrid composites, Composites: Part B, 2013, pp. 51: 54–57.
[4.] Joshi S. V., Drzal L., Mohanty A. and Arora S., Are natural fiber composites environmentally superior to glass fiber reinforced composites? Compos Part A: Appl. Sci. Manuf., 2004, 35, pp. 371–376.
[5.] Solantausta Y. and Oasmaa A. Fast pyrolysis of forestry residues and sawdust: production and fuel oil quality, International Nordic Bioenergy Conference, 2003, pp. 1-3.
[6.] Barl B., Biliaderis C., Murray E. and Macgregor A., Combined chemical and enzymatic treatments of corn husks lignocellulosics. J. Sci. Food Agric., 1991, 56, pp.195–214.
[7.] Thomas S., Paul S. A., Pothan L. A. and Deepa B., Natural Fibers: Structure, Properties and Applications. In: Cellulose Fibers: Bio- and Nano-Polymer Composites, Kalia, S., Kaith BS, Kaur I (Eds.).Springer, Berlin, Heidelberg, 3-42, 2011.
[8.] Lodha P. and Netravali A. N., Characterization of interfacial and mechanical properties of ‘‘green’’ composites with soy protein isolate and ramie fiber, J. Mater.Sci., 2002, 37, pp. 3657–3665.
[9.] Yeng C. M., Salmah H. and Sam S. T., Corn cob filled chitosan biocomposites films by cross-linking with glutaraldehyde, Bioresoures, 2013a, 8(2), pp. 2910-2922.
[10.] Kiran R.,Garadimani R. G.U. and Kodancha K. G., Study on Mechanical Properties of Corn Cob Particle and E-Glass Fiber Reinforced Hybrid Polymer Composites, American Journal of Materials Science, 2015, 5(3C), pp. 86-91.
[11.] Salmah H., Marliza M. Z. and Selvi E. Biocomposites from Polypropylene and Corn Cob: Effect Maleic Anhydride Polypropylene. The 2014 World Congress on Advances in Civil, Environmental and Materials Research (ACEM14) Busan, Korea, August 24-28, 2014.
[12.] Wu C. S., Improving polylactide/starch biocomposites by grafting polylactide with acrylic acid-characterization and biodegradability assessment. Macromol,Biosci., 2005, 5, pp. 352-361.
[13.] Aziz S. H., Ansell M. P., Clarke S. J., Panteny S. R., Modified polyester resins for natural fiber

ACTA TECHNICA CORVINIENSIS – Bulletin of Engineering
66 | F a s c i c u l e 3
composites, Compos. Sci. Technol., 2005, 65, pp. 525-535.
[14.] Acha B. A., Aranguren M. I. and Marcovich N. E., Composites from PMMA modified thermoset and chemically treated woodflour, Polym. Eng. Sci., 2003, 43(3), pp. 999-1010.
[15.] Yang H. S., Kim H. J., Park H. J., Lee B. J. and Hwang T. S., Effect of compatibilizing agents on rice-husk flour reinforced polypropylene composites, Comp. Struct., 2007, 77, pp. 45-55.
[16.] Ferrer M. F., Vilaplana F., Ribes G. A., Benedito B. A. and Sanz B. C., Flour rice husk as filler in block copolymer polypropylene: effect of different coupling agents, J.Appl. Polym. Sci., 2005, 99, pp. 1823-1831.
[17.] Tserki V., Matzinos P. and Panayiotou C., Novel biodegradable composites based on treated lignocellulosic waste flour as filler, Part II. Development of biodegradable composites using treated and compatibilized waste flour. Compos.Part A, 2006, 37, pp. 1231-1238.
[18.] Yeng C. M., Salmah H. and Sam S. T., Modified corn cob filled chitosan biocomposites Films, Polm.Plast. Technol. Eng., 2013b, 52(14), pp. 1496-1502.
[19.] Yuan X., Jayaraman K. and Bhattacharyya D., Effects of plasma treatment in enhancing the performance of wood fiber-polypropylene composites. Compos. Part A, 2004, 35, pp. 1363-1374.
[20.] Colom X. and Carrillo F., Crystallinity changes in lyocell and viscose-type fibers by caustic treatment. European Polymer Journal, 2002, 38(11), pp. 2225-2230.
[21.] Mohanty A. K., Misra M. and Drzal L. T., Surface modifications of natural fibers and performance of the resulting biocomposites: an overview, Composite Interfaces, 2001, 8(5), pp. 313-343.
[22.] Syed H. I. and Morsyleide F. R., Bor-sen C.,Eliton S.M., Delilah F. W.,Tina G. W., Mattoso H. C. and William J. O., Effect of fiber treatments on tensile and thermal properties of starch/ethylenevinyl alcohol copolymers/coir bio composites, Elsevier Biores. Tech., 2009, 100, pp. 5196–5202.
[23.] Cervalho K. C., Mulinari D. R., Voorwald H. J. and Coiffi M. O., Chemical modification effect on the mechanical properties of HIPS/Coconut fiber reinforced composites, BioRes., 2010, 5(2), pp. 1143-1155.
[24.] Oladele IO, Daramola OO, FasootoS (2014) Effect of Chemical Treatment on the Mechanical Properties of Sisal Fiber Reinforced Polyester composites, Leonardo Electronic Journal of Practices and Technologies ISSN 1583-1078 Issue 24: 1-12.
copyright ©
University POLITEHNICA Timisoara, Faculty of Engineering Hunedoara,
5, Revolutiei, 331128, Hunedoara, ROMANIA http://acta.fih.upt.ro

© copyright Faculty of Engineering – Hunedoara, University POLITEHNICA Timisoara
ACTA TECHNICA CORVINIENSIS – Bulletin of Engineering Tome X [2017] Fascicule 3 [July – September] ISSN: 2067 – 3809
1.Nadia A. ALI
EFFECT OF POLYETHYLENE TERPHALET (PET) ON MECHANICAL AND OPTICAL PROPERTIES OF POLYLACTIC ACID (PLA) FOR PACKAGING APPLICATION 1. Physics Department, University of Baghdad, College of Science, IRAQ Abstract: Blends of polyethylene terphalet (PET) with polylactic acid (PLA) were investigated to study the influence of the additive of PET on (tear, impact strength) and (transparency, color). The compositions were prepared in wt (20/80), (50/50), (80/20). Mechanical properties like tear strength and Impact Izod, and optical properties like colors and transparency were also reported. Polyethylene terphaletee decrease the tear strength when additive PET and Impact Izod strength of PLA was increased when additive PET when tested in the machine directions. Optical property such as colors was increased and the value of transparency was decreased as the loading of PET increased. Keywords: PET, PLA, tear strength, impact strength, color and Transparency INTRODUCTION Poly(lactic acid) (PLA) is known a biodegradable to be a useful material in substituting the conventional petroleum-based polymer used in packaging, due to its biodegradability and used as alternatives polymers for conventional plastics such as polyethylene PE), polypropylene (PP), and polyethylene terephthalate (PET). Because biodegradable plastics used for manufacturing packagings application are predominantly made from renewable raw materials such as, starch-based plastics, polylactide (PLA) [1]. Poly(lactic acid),is a linear aliphatic polyester, are made from lactic acid monomers produced by condensation polymerisation of lactic acid. Ultimately made from lactose (or milk sugar) derived from renewable plant sources, such as starch and sugar. The building block of PLA is lactic acid (2-hydroxypropionic acid) which can exist as optically active D- or L-enantiomers. PLA has found many applications in the packaging, medical and automotive industries. PLA possesses high strength, good crease-retention, grease and oil resistance and excellent aroma barrier properties [2]. From packaging field PLA is used for food trays, water bottles and flexible packaging and also applications for PLA are constantly being identified, and the automotive industry has begun
producing interior and exterior car parts from biodegradable polymers [3]. PLA is biomaterials and composted to water and CO2 that useful in future with the potential to replace conventional petrochemical-based plastics such as polyethylene terephthalate (PET) that used in packaging. PLA stiffness is similar to that of PET but major limitations of PLA are due to its high brittleness, low toughness and low tensile elongation (because that percentage elongation at break (6- 10%). There is very limited available information on the mechanical properties such as tear resistance test, elongation and impact strength of PLA [4]. PLA will degrade approximately six weeks or one year’s this is advantages of PLA when compared to PET. PLA has a tensile modulus of about 2-3 GPa, which is considerably higher. PLA products are more brittle compared with PET or PVC packaging and low impact resistance therefore PLA may be more brittle than desired is some applications [5]. Polyethylene terphalate (PET) is being widely used in packaging applications. PET is a linear thermoplastic made from ethylene glycol and terephthalic acid, or ethylene glycol and dimethyl terephthalate [5]. PET is used in many rigid food and beverage containers due to a good balance of physical and mechanical properties,

ACTA TECHNICA CORVINIENSIS – Bulletin of Engineering
68 | F a s c i c u l e 3
barrier properties, processibility and formability, toxicological and ecological, and economics [6,7].Its excellent mechanical strength and, consequently and transmission is one of the most abundant plastics in solid urban waste. In order to minimize the huge environmental problem created by this non-biodegradable plastic waste [8]. Most of the physical and mechanical properties of PET improve as the molecular weight increases is a hard, stiff and strong material with a decent resistance to degradation upon exposure to chemicals PET. Some of the polymer blend approaches show promise, the options become limited when the biomaterials carbon content and comptability of the blend are deemed important [9]. Tear strength is one of the most important properties for the packaging application films. Tear resistance as determined is a measure of the force necessary to primitive e tearing in materials films tapes. This is contrasted with other methods which measure the force necessary to propagate a tear after it has been initiated. Tear resistance in plastic film tapes indicates how well-integrated the material will remain when it is used to conform to irregular shapes under tensions which vary across the width of the applied strip [9, 10]. Tear strength measured by the ASTM D-412 method (as a same used measure the tensile strength, modulus and elongation of plastics materials), that mean measure the resistance to the formation of a tear (tear primitive ) and the resistance to the expansion of a tear (tear sperated) on films. In any case of which of these two is being measured, the sample is caught between two holders and a uniform pulling be force applied until the aforementioned deformation occurs. Tear strength is then calculated by dividing the force applied by the thickness of the material. Impact strength is defined as the absorbing of energy before failure or is a measure of the work done to break a test specimen. When the striker impacts the specimen, the specimen will absorb energy in KJ until it yields. At this point, the specimen will begin to undergo plastic deformation at the notch. The test specimen continues to absorb energy and work hardens at the plastic zone at the notch. When the specimen can absorb no more energy, fracture occurs that test vary important in packaging application. In this research, PET was chosen as a polymer for rapprochement with PLA as its visibility ease of processing and favorable mechanical properties make it one of the most widely used polymers in the food packaging industry parallel, with PET the main damage, of PLA with respect to material properties are primarily associated with its brittleness. Goal is to improve tear resistance and impact strength has been developed
impact resistance agents, compatible with the same PLA blend with PET. MATERIALS AND METHODS » Materials Lactic acid (99.9%), Tin chloride dehydrated (SnCl2.2H2O) P-toluene sulfonic acid (TSA), were purchased from Fluka. Methylene Chloride was purchased from Sigma-Aldrich » Preparation of pure Polylactic acid The reaction was conducted in 250ml, two necked flask reactor armed with a magnetic stirrer and a reflux condenser .200 gm of aqueous solution of lactic acid acid was mixed with methylene chloride for 8hrs at refluxed temperature without any catalyst .After the removal of water of the condenser , the reaction vessel was cooled at 60°C, the required amount of catalyst SnCl2.2H2O (0.5wt%), TSA(0.4wt%) were add and this was followed by slow heating of the reaction blend to the refluxing temperature of the solvent under mild stirring with the help of magnetic stirring bar. The temperature gradually increased to 140°C in 2 hrs, and the reaction mixture was stirred continuously. Polymerizations are done at 120-160°C for 5hrs. At the end of the reaction, the flask was cooled, and the product was dissolved in chloroform and subsequently precipitated in methanol. The resulting solid was filtered and dried under vacuum at 60°C under vacuum at 24hrs. Powder PLA weighted grade (1wt%) by using electronic balance of four digits type (Sartorius H51) and then dissolved in chloroform to obtain 20 wt% solution of PLA grade by slowly in 60°C for 3 hours warming until the solution become viscous using magnetic stirrer hot plate, then cast into petri dish at field temperature for 24 hour to ensure perfect solvent removal. » Preperation of Polyethylene terphatalete
/Polylactic acid blend PLA was dehydrated in an oven at 70 °C for 4 hours to reduce humidity. All blends of each PET/PLA(20/80) (50/50), (80/20) blends were mixed using an internal mixer (Hakke Rheomix, 3000p) at temperature of 170°C with a rotor speed of 60 rpm for 10 min. Compression molding (LabTech, LP20- B) were used to set up the samples. The fusion temperature of 165 °C and form temperature of 25 °C were used. » Tear Test Tear intensity of films was calculated on the same Universal Electronic Dinamometer above indicated. The test was load out according to ASTM D-1922 standard, using the trouser tear method. The sample size was 100 mm long and 40 mm wide having a cut of 50 mm at the center of one end. The experiments were made at 180 mm/min extension rate. A pendulum impact tester is used to measure the force wanted to propagate slit a stable distance to the end of the test model. One use of
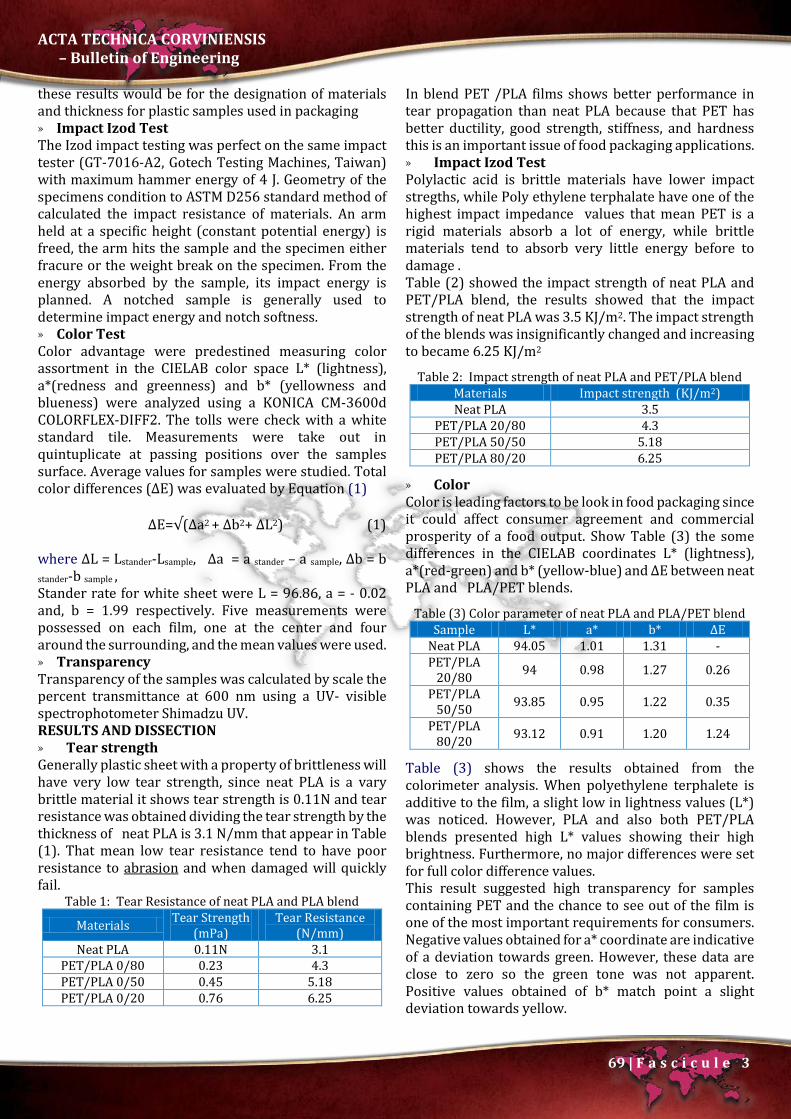
ACTA TECHNICA CORVINIENSIS – Bulletin of Engineering
69 | F a s c i c u l e 3
these results would be for the designation of materials and thickness for plastic samples used in packaging » Impact Izod Test The Izod impact testing was perfect on the same impact tester (GT-7016-A2, Gotech Testing Machines, Taiwan) with maximum hammer energy of 4 J. Geometry of the specimens condition to ASTM D256 standard method of calculated the impact resistance of materials. An arm held at a specific height (constant potential energy) is freed, the arm hits the sample and the specimen either fracure or the weight break on the specimen. From the energy absorbed by the sample, its impact energy is planned. A notched sample is generally used to determine impact energy and notch softness. » Color Test Color advantage were predestined measuring color assortment in the CIELAB color space L* (lightness), a*(redness and greenness) and b* (yellowness and blueness) were analyzed using a KONICA CM-3600d COLORFLEX-DIFF2. The tolls were check with a white standard tile. Measurements were take out in quintuplicate at passing positions over the samples surface. Average values for samples were studied. Total color differences (ΔE) was evaluated by Equation (1)
ΔE=√(Δa2 + Δb2+ ΔL2) (1) where ΔL = Lstander-Lsample, Δa = a stander – a sample, Δb = b stander-b sample , Stander rate for white sheet were L = 96.86, a = - 0.02 and, b = 1.99 respectively. Five measurements were possessed on each film, one at the center and four around the surrounding, and the mean values were used. » Transparency Transparency of the samples was calculated by scale the percent transmittance at 600 nm using a UV- visible spectrophotometer Shimadzu UV. RESULTS AND DISSECTION » Tear strength Generally plastic sheet with a property of brittleness will have very low tear strength, since neat PLA is a vary brittle material it shows tear strength is 0.11N and tear resistance was obtained dividing the tear strength by the thickness of neat PLA is 3.1 N/mm that appear in Table (1). That mean low tear resistance tend to have poor resistance to abrasion and when damaged will quickly fail.
Table 1: Tear Resistance of neat PLA and PLA blend
Materials Tear Strength (mPa)
Tear Resistance (N/mm)
Neat PLA 0.11N 3.1 PET/PLA 0/80 0.23 4.3 PET/PLA 0/50 0.45 5.18 PET/PLA 0/20 0.76 6.25
In blend PET /PLA films shows better performance in tear propagation than neat PLA because that PET has better ductility, good strength, stiffness, and hardness this is an important issue of food packaging applications. » Impact Izod Test Polylactic acid is brittle materials have lower impact stregths, while Poly ethylene terphalate have one of the highest impact impedance values that mean PET is a rigid materials absorb a lot of energy, while brittle materials tend to absorb very little energy before to damage . Table (2) showed the impact strength of neat PLA and PET/PLA blend, the results showed that the impact strength of neat PLA was 3.5 KJ/m2. The impact strength of the blends was insignificantly changed and increasing to became 6.25 KJ/m2
Table 2: Impact strength of neat PLA and PET/PLA blend Materials Impact strength (KJ/m2) Neat PLA 3.5
PET/PLA 20/80 4.3 PET/PLA 50/50 5.18 PET/PLA 80/20 6.25
» Color Color is leading factors to be look in food packaging since it could affect consumer agreement and commercial prosperity of a food output. Show Table (3) the some differences in the CIELAB coordinates L* (lightness), a*(red-green) and b* (yellow-blue) and ΔE between neat PLA and PLA/PET blends.
Table (3) Color parameter of neat PLA and PLA/PET blend Sample L* a* b* ΔE
Neat PLA 94.05 1.01 1.31 - PET/PLA
20/80 94 0.98 1.27 0.26
PET/PLA 50/50 93.85 0.95 1.22 0.35
PET/PLA 80/20 93.12 0.91 1.20 1.24
Table (3) shows the results obtained from the colorimeter analysis. When polyethylene terphalete is additive to the film, a slight low in lightness values (L*) was noticed. However, PLA and also both PET/PLA blends presented high L* values showing their high brightness. Furthermore, no major differences were set for full color difference values. This result suggested high transparency for samples containing PET and the chance to see out of the film is one of the most important requirements for consumers. Negative values obtained for a* coordinate are indicative of a deviation towards green. However, these data are close to zero so the green tone was not apparent. Positive values obtained of b* match point a slight deviation towards yellow.

ACTA TECHNICA CORVINIENSIS – Bulletin of Engineering
70 | F a s c i c u l e 3
» Transparency Transparency is an important property of Packaging films used in food application. Transparency was calculated by equation (2)
Transparency = A600/ t (2) Where A600 Absorbance at 600 nm and t thickness at mm of samples.
Table (4). Transparency of neat PLA and PLA/PET blend Sample T %
Neat PLA 80 PET/PLA 20/80 78 PET/PLA 50/50 75 PET/PLA 80/20 74
Neat PLA showed the maximum transparency specific of the high brightness of PLA films. The additive of PET no significant differences between PET and PLA were observed. CONCLUSIONS PLA is a promising biodegradable polymer for use in food packaging .However, because of its inherent brittle behavior need to be blended with PET for some specific applications in particular production of films .In the present have shown a good improvement in tear and impact strength to make them useful for this particular application. The PLA has been receiving a great deal of attention, essentially due to its degradability and biomaterials. With this environmental-friendly property, along with a highly transparent appearance similar to that of polyethylene terephthalate (PET), PLA has undoubtedly become one of the most promising alternatives to non-biodegradable synthetic polymers conventionally derived from petroleum-based chemicals. References [1.] Edmonds, Neil Ra ., Plimmer, Peter N.b , Tanner,
Chrisc , 2015“High Melt Strength, Tear Resistant Blown Film Based on Poly(lactic acid”, Proceedings of PPS-30 AIP Conf. Proc. 1664, 090002-1–090002-4; doi: 10.1063/1.4918465 AIP Publishing LLC 978-0-7354-1309-2/$30.00
[2.] R. Auras, S. Singh and J. Singh,2006” Performance evaluation of PLA against existing PET and PS containers, J. of test. and eval., Vol. 34 , 530-536
[3.] ShashiPankaj,shashi.pankaj,Luke.oneill,misra.nrusimhanath,2013 “Characterization of Polylactic Acid Films for Food Packaging as Affected by Dielectric Barrier Discharge Atmospheric Plasma” Dublin Institute of Technology ARROW@DIT
[4.] Jamshidian, M., Tehrany, E. A., Imran, M., Jacquot, M., & Desobry, S. 2010. Poly-Lactic Acid: Production, Applications, Nanocomposites, and Release Studies. Comprehensive Reviews in Food Science and Food Safety, 9(5), 552-571.
[5.] B.Imre, B.Pukánszky 2013“Compatibilization in bio-based and biodegradable polymer blends, European Polymer Journl, Volume 49, Issue 6, Pages 1215–1233
[6.] V. Tanrattanakul, P. Bunkaew 2014 “Effect of different plasticizers on the properties of bio-based thermoplastic elastomer containing poly(lactic acid) and natural rubber” eXPRESS Polymer Letters Vol.8, No.6 387–396.
[7.] Burgos, N., Martino, V. P., & Jiménez, A. 2013. Characterization and ageing study of poly (lactic acid) films plasticized with oligomeric lactic acid. Polymer Degradation and Stability, 98(2), 651-658
[8.] Buong Woei Chieng, Nor Azowa Ibrahim , Wan Md Zin Wan Yunus and Mohd Zobir Hussein, 2014” Poly(lactic acid)/Poly(ethylene glycol) Polymer Nanocomposites: Effects of Graphene Nanoplatelets” Polymers, 6, 93-104; doi:10.3390/polym6010093
[9.] R. K. Krishnaswamy,2010“Toughening Polylactic Acid with Polyhydroxyalkanoates”, United States Patent Application
[10.] Doris Ribitsch, Enrique Herrero Acero, Katrin Greimel, Anita Dellacher, Sabine Zitzenbacher, Annemarie Marold, Rosario Diaz Rodriguez, Georg Steinkellner, Karl Gruber, HelmutSchwab and Georg M. Guebitz“polymers Article A New Esterase from Thermobifida halotolerans Hydrolyses Polyethylene Terephthalate (PET)and Polylactic Acid(PLA” Polymers2012,4,617-629; doi:10.3390/polym4010617
copyright ©
University POLITEHNICA Timisoara, Faculty of Engineering Hunedoara,
5, Revolutiei, 331128, Hunedoara, ROMANIA http://acta.fih.upt.ro

© copyright Faculty of Engineering – Hunedoara, University POLITEHNICA Timisoara
ACTA TECHNICA CORVINIENSIS – Bulletin of Engineering Tome X [2017] Fascicule 3 [July – September] ISSN: 2067 – 3809
1.Gabriel CIBIRA
DYNAMIC INTERNATIONAL OPTICAL NETWORK BY FUZZY ROUTING 1. Institute of Aurel Stodola, Faculty of Electrical Engineering, University of Zilina, Liptovsky Mikulas, SLOVAKIA Abstract: Optical communications transmit large amount of data, operating from local to transoceanic distances. Wave division multiplexing WDM is crucial point for achieving reliable real-time data transmission over precise fiber-optic cables and nodes technology. This paper brings novel method for optical links evaluation used for optimal path finding when data transmitting over dynamically loaded international optical network. Middle-European NRENs and pan-European GÉANT are implemented to the simulation model. For efficient links’ assessment, several parameters are taken into account. They are employed by fuzzy logic subsystem to estimate their relationships and, each link quality and utilization judgment. Composed simulation model demonstrates routing (i.e. path finding) flexibility and utilization balancing over existing optical links. Keywords: fuzzy routing, dynamic optical network INTRODUCTION Optical networks provide node-to-node connections over long distances. Routing in wavelength division multiplex (WDM) optical networks has been widely discussed for different types of optical networks. Current approaches and solutions are based on an output parameter evaluation, mostly eye diagram (Q-factor) or, power and spectrum dissipation. In WDM systems, optical bandwidth is met by employing multiple carrier wavelength channels over a fiber. It respects transmission limits [1], depending on route components [2], modulation methods, transport protocols, operational modes and wavelength routing control abilities. Dynamic flexible control approaches bring better bandwidth agility [3-9]. The most used routing and wavelength assignment algorithms implement various methods to improve overall throughput: a shortest path choosing within user-specified or network-specified constraints, alternate routing creation, etc. Modern optical network systems embrace highly sophisticated automated processes to improve overall throughput. They apply numbers of methods for optimal re-routing, advanced modulations [10], [11], wavelength optimization [7], [9], [12-16], backup
linking etc. Cognitive light path optimization by OSNR may be used, [17], [18]. Of course, such an important parameter must be considered during fiber optics planning process [19], [20]. Fuzzy controlled mesh networks can provide functions like fuzzy-measures defined wavelength reconfiguration [5], [8], [21], routes updating [22] and utilization balancing, even close to transmission limits. This paper focuses on data transmission routing optimization in WDM optical network. Data transmission is considered via several transfer nodes and paths, deliberating the path parameters triplet: optical signal-to-noise ratio (OSNR), bit error rate (BER) and output power (Power). Near future links’ status is estimated over real network. The paper illustrates data routing process by implemented fuzzy logic, statistical evaluation and decision processing methods. Not only is the proposed system applicable to solve re-routing when data traffic demand increase during peak traffic hours, but also it meets degradation factors impact etc. GÉANT NETWORK GÉANT, the pan-European and worldwide data network, interconnects research, education and innovation

ACTA TECHNICA CORVINIENSIS – Bulletin of Engineering
72 | F a s c i c u l e 3
communities, with secure, high-bandwidth and high-capacity networks. It spans over 50,000 km and connects over 50 million users, including 38 European National Research and Education Networks (NRENs). As from [23], the GÉANT topology covers most European countries yet, providing high-speed interconnection at 1-9 Gbps, multiples of 10 Gbps or multiples of 100 Gbps. In the simulations, a simplified topology is composed, Figure 1, comprising middle-European plus neighboring countries GÉANT links between them.
Figure 1. Simplified middle-European GÉANT
interconnections NRENS A NREN represents an internet service provider dedicated to support research and education communities in a country. A NREN is usually distinguished by support for a high-speed backbone network, often offering dedicated channels for individual research projects. Often, many services, internet data transfer protocols, applications etc. are available. [24] In this manner, overall transport capacity continuously increases in accordance with the needs and real traffic through the individual nodes. Thus, each of NRENs owns or rents backbone network at different speed, technology and geographically-dependent structure. Backbone networks mostly interconnect universities, academic and research institutions. As a GÉANT members, NRENs dispose of cross-border backbone interconnections. Besides, some neighboring NRENs apply direct interconnection by extra optical fiber. A brief overview of current NRENs deployed in middle-European region is provided in this section, due to papers’ focus on GÉANT plus NRENs gained from their territorial cooperating effect. As presented in the next subsections, cross-border links usually provide speed of multiples of 10 Gbps.
The simplified model in Figure 2 represents cross-border direct links between middle-European and neighboring NRENs. These are introduced below.
Figure 2. Simplified middle-European NRENs
interconnections A. DFN - Germany The German (DE) Deutsches ForschungNetz (DFN) is a national backbone network for science, research and education. It connects German universities and research institutions by up to 100 Gbps and a multi-Tbps core network, spanning about 60 core location sites. Functionality of Dense Wavelength Division Multiplex (DWDM) infrastructure and Quality of Services (QoS) is supervised by eight fundamental measurement sites connected mostly in triangle structure corners. Comprising about 10,000 km dark optical fibre in several rings, it is one of the most powerful communication network in the world. The fibre platform is connected to GÉANT in Frankfurt as well as to neighboring NRENs by super core fibres with upstream speed of 10 Gbps. [25] B. CESNET - Czech Republic The core of the Czech (CZ) Education and Scientific NETwork (CESNET) is formed by DWDM infrastructure with tens of 100 Gbps, 10 Gbps, and small amount of 1 Gbps transmission channels. A combination of commercial devices and optical elements of own design (the CzechLight series) is used. The speed of network core was upgraded to 100 Gbps in 2013. Other backbone circuits are based on the 100 Gbps, 10 Gbps and Gigabit Ethernet and the POS (Packet over SONET) technology with at the speed of 2.5 Gbps. The network topology consists of several rings connecting limited number of sites (optimally less than five city sites in a single ring). The CESNET offers international connectivity, too. Individual 10 Gbps cross-border optical fibers cooperate with neighboring NRENs SANET (Slovakia), ACONET (Austria), PIONIER (Poland). Other optical

ACTA TECHNICA CORVINIENSIS – Bulletin of Engineering
73 | F a s c i c u l e 3
interconnections operate directly to Netherland, USA, Google, each at speed of 10 Gbps. [26] C. PIONIER - Poland The Polish (PL) Optical Internet PIONIER NREN connects 21 Academic Network Centers of Metropolitan Area Networks (MANs) and 5 High Performance Computing (HPC) centers with own fiber connections spread about 6,000 km. MANs operate dark optical fibre at the data speed of 2x10 Gbps with DWDM technology. There are 80 separate fibre pair channels between MANs as well as cross-border links. Cross-border connections lead to GÉANT, to Germany (continuing to GLIF, Surfnet and Nordunet), DFN (Germany, three nodes), CESNET (Czech Republic), SANET (Slovakia), UARNET and URAN (Ukraine), Belarus, Lithuania and Russia. [27] D. ACOnet - Austria The Austrian (AT) Academic COmputer NETwork (ACOnet) backbone provides a powerful network infrastructure among 12 locations connected in a redundant manner (six of locations are doubled sites thus there are 18 points of presence), to provide a stable and failsafe network. ACOnet operates 10 Gbps Ethernet backbone network and transparent fiber optic internet with DWDM technology at speed of multi-10 Gbps. Cross-border fiber optic links lead to GÉANT, CESNET (Czech Republic), SANET (Slovak Republic) and PIONIER (Poland). [28] E. SANET – Slovak Republic The Slovak (SK) Academic NETwork SANET connects 13 western academic sites in a ring structure and four eastern academic sites in a line structure, all operating at the backbone data speed of multi-100 Gbps. Other 20 sites are arranged in a ring or line structures at the data speed of 10 Gbps. SANET general two-ring structure provides full redundancy. The network infrastructure is based on leased dark fibers terminated by Cisco Catalyst switches. The national connectivity is realized by Slovak Peering Center SIX. The cross-border connectivity is achieved by leased dark fibre at the speed of 20 Gbps to ACOnet (Austria), CESNET (Czech Republic), and 10 Gbps to PIONIER (Poland) and GÉANT. [29] F. NIIF - Hungary The Hungarian (HU) Nemzeti Információs Infrastruktúra Fejlesztési Intézet (NIIFI) and HUNGARNET association of its users fulfil role of NREN. The NIIFI/HUNGARNET backbone HBONE+ based on dark fibre optics with DWDM systems consists of robust core and regional centre routers connected to core routers (directly or indirectly). There are 13 rings in meshed network structure, connecting 28 regional centers by 9 NIIFI sites. The HBONE+ main country links, Budapest links and international links operate 10, 40 or 100 wavelength channels per each of optical fibre, each channel achieving speed of 10 Gbps. Only small amount of local
link connections achieve the data speed about 1 Gbps. The cross-border connectivity is enabled by the GÉANT at the data speed of 30 Gbps. [30] G. ARNES - Slovenia The Slovenian (SL) Academic and Research Network of Slovenia (ARNES) supports research and education communities. Next, it fulfils additional internet connection role for other commercial users essential to the operation of the Internet of Slovenia. NREN structure creates Ljubljana – centered loops. Based on leased optical fibres with hybrid DWDM or Coarse WDM (CWDM) systems, the technology supports four 1 Gbps or sixteen 10 Gbps simultaneous data transmissions within an Ethernet point-to-point connections. The cross-border connectivity is enabled by the GÉANT at the data speed of 30 Gbps. [31] H. CARNet - Croatia The Croatian (HR) Academic and Research NETwork uses cables leased from telecommunication providers. The largest university centers operate high-speed connections at 155 Mbps to 1 Gbps while smaller centers operate at the speed of 2 Mbps to 200 Mbps. Local institutional networks in two biggest centers operate at higher speeds using optical cables technology. NREN connections lead in star-centered shapes from three most important centers. The cross-border connectivity is enabled by the GÉANT at the data speed of 10 Gbps. [32] I. RoEduNet - Romania The ROmanian (RO) EDUcational NETwork is administrated by the Agency for Administration of the National IT Network for Education and Research (AARNIEC). It offers high-speed connections for 7 largest university centers and 34 points of presence. The cross-border connectivity is enabled by the GÉANT to Austria and Hungaria, each at the data speed of 10 Gbps. [33] J. BREN - Bulgaria The Bulgarian (BG) Research and Educational Network offers 1 Gbps connections to largest university centers via 13 backbone switches: Ethernet over SDH, dark fibre optics or MAN in Sophia. Some institutions are connected via 100 Mbps MAN. The cross-border connectivity is enabled by the GÉANT at the data speed of 10 Gbps. [34] MERGED NETWORK MODEL At the beginning of simulations, the topology of the main network is created, comprising principal nodes and links between them. Corresponding link speeds are set to multiples of 10 Gbps by NRENs and 100 Gbps by GÉANT links. The map merges cross-border links of both GÉANT and NRENs, see Figure 3. Here, some nodes are connected by several links (combination of GÉANT + NRENs). A link represents the shortest connection between two neighboring nodes, containing at least one

ACTA TECHNICA CORVINIENSIS – Bulletin of Engineering
74 | F a s c i c u l e 3
fiber. A path is the connection between starting and output nodes, comprising one or more links.
Figure 3. Network model comprising GÉANT and
NRENs interconnections All above mentioned link speeds represent their theoretical maximum capacity. In real data transmission conditions, external influences decrease this parameter. When simulating data routing in the merged network model, following link parameters triplet is considered: K. Optical Signal – to – Noise Ratio (OSNR) The OSNR is measured in each of data channel by an optical spectrum analyzer, comparing channel output power during non- active and active intervals. L. Bit Error Rate (BER) Data loss is mostly caused by signal loss / damping, frequency bandwidth changes, inter-channel interferences, or link-degradation processes. Depending on channel coding methods, BER measurement, error detection, correction algorithms or automatic data repeating are performed at the binary channel output to improve channel quality. M. Output Power (Power) The channel optical power dissipation (at wavelength, per cable longitude) is caused by damping characteristics of the link, optical signal spectrum dispersion, channel power matching, amplification setup, link-degradation processes etc. Dispersion compensation methods are used to reduce such optical power loss. The Power parameter defines signal power level at the link output terminal. NETWORK CONTROL SYSTEM Merged network control system processes OSNR, BER and Power triplet parameters’ values, for each of modeled links, see Figure 4. However, the next two more link parameters must be entered when simulating real rooting in merged network model: i. the maximum capacity (or wavelength channels) that
represents the maximum transmission speed of a link (Gbps, see previous paragraphs),
ii. the current utilization that represents current link exploitation (in percentage). Simulation output parameter, a link (or wavelength channels) quality Q, is calculated for each link by fuzzy logic subsystem, using predefined fuzzy rules. For given link, the Q parameter represents weighted probability of near-future reliable data transmission (in percentage).
After obtaining Q, control system produces output cost for each link and available capacity Cavailable of a link, by Equation 1.
Figure 4. Link cost calculation algorithm
Q*)U1(*CC maxavailable −= (1)
where: » Cavailable is available link transport capacity [Gbps], » Cmax is maximum link capacity [Gbps], » U is current link utilization, 0 to 1 [-], » Q is link quality, 0 to 1 [-] or [%]. In WDM networks, evaluating of several wavelength channels must be done in each of link, so available capacity should be calculated for each wavelength channel. Thus, links capacity can be periodically obtained to get optimal routing topology in a dynamic changing utilization, quality and data transmission demands. In case of some emergency, traffic is flexibly rerouted using less faulty links to output node by proposed control system. In addition to the fastest path choice, alternative paths can be obtained. Very important additional goal of proposed approach is to avoid optical-electrical-optical conversion as much as possible (due to significant data transfer delay) when switching is performed. Such conversion is usually performed when switching among different wavelength channels. Omitting optical-electrical-optical conversion thus routing via optical-optical conversion only may increase overall traffic throughput. [35] Proposed complex optimization algorithm contains several steps to find the most appropriate path between chosen starting and destination nodes, among transport links involved in list. Control system processes input data in three steps. Firstly, OSNR, BER and Power triplet parameters are measured for each link or wavelength channel.
Link quality Q BER
OSNR
Power
Fuzzy logic
Link cost calculation
GEANT + NRENs
Maximum capacity
Current utilization
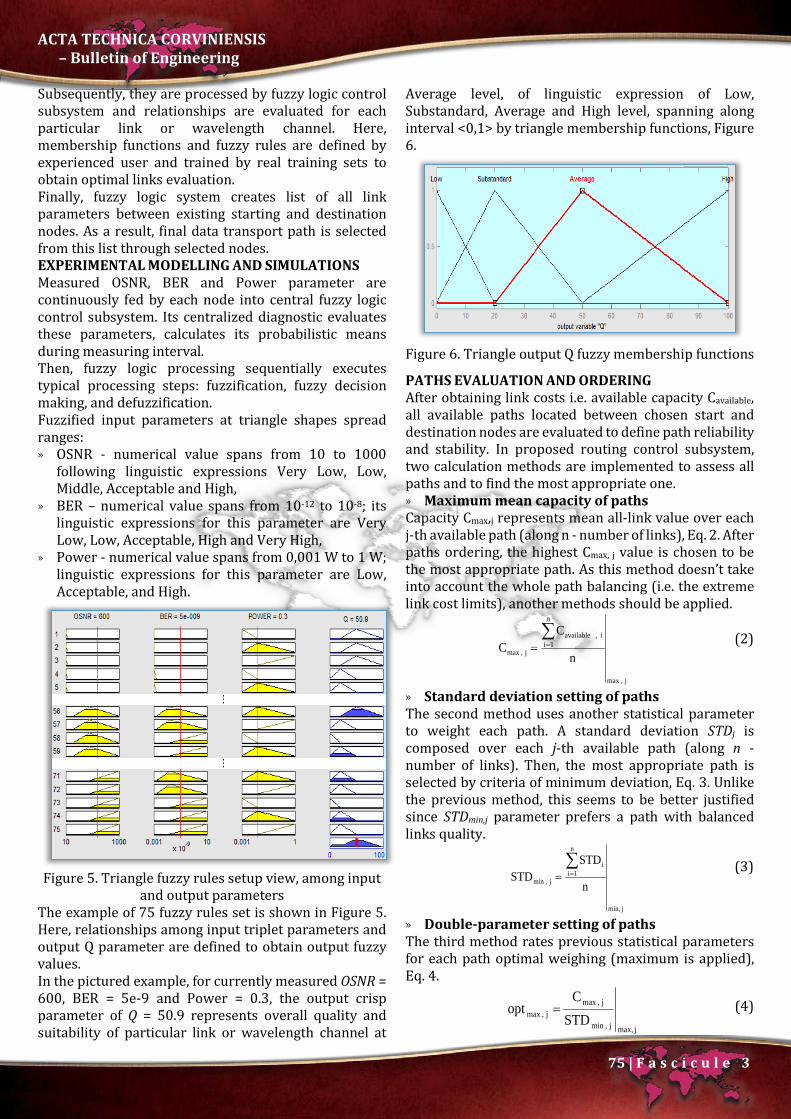
ACTA TECHNICA CORVINIENSIS – Bulletin of Engineering
75 | F a s c i c u l e 3
Subsequently, they are processed by fuzzy logic control subsystem and relationships are evaluated for each particular link or wavelength channel. Here, membership functions and fuzzy rules are defined by experienced user and trained by real training sets to obtain optimal links evaluation. Finally, fuzzy logic system creates list of all link parameters between existing starting and destination nodes. As a result, final data transport path is selected from this list through selected nodes. EXPERIMENTAL MODELLING AND SIMULATIONS Measured OSNR, BER and Power parameter are continuously fed by each node into central fuzzy logic control subsystem. Its centralized diagnostic evaluates these parameters, calculates its probabilistic means during measuring interval. Then, fuzzy logic processing sequentially executes typical processing steps: fuzzification, fuzzy decision making, and defuzzification. Fuzzified input parameters at triangle shapes spread ranges: » OSNR - numerical value spans from 10 to 1000
following linguistic expressions Very Low, Low, Middle, Acceptable and High,
» BER – numerical value spans from 10-12 to 10-8; its linguistic expressions for this parameter are Very Low, Low, Acceptable, High and Very High,
» Power - numerical value spans from 0,001 W to 1 W; linguistic expressions for this parameter are Low, Acceptable, and High.
Figure 5. Triangle fuzzy rules setup view, among input
and output parameters The example of 75 fuzzy rules set is shown in Figure 5. Here, relationships among input triplet parameters and output Q parameter are defined to obtain output fuzzy values. In the pictured example, for currently measured OSNR = 600, BER = 5e-9 and Power = 0.3, the output crisp parameter of Q = 50.9 represents overall quality and suitability of particular link or wavelength channel at
Average level, of linguistic expression of Low, Substandard, Average and High level, spanning along interval <0,1> by triangle membership functions, Figure 6.
Figure 6. Triangle output Q fuzzy membership functions
PATHS EVALUATION AND ORDERING After obtaining link costs i.e. available capacity Cavailable, all available paths located between chosen start and destination nodes are evaluated to define path reliability and stability. In proposed routing control subsystem, two calculation methods are implemented to assess all paths and to find the most appropriate one. » Maximum mean capacity of paths Capacity Cmax,j represents mean all-link value over each j-th available path (along n - number of links), Eq. 2. After paths ordering, the highest Cmax, j value is chosen to be the most appropriate path. As this method doesn’t take into account the whole path balancing (i.e. the extreme link cost limits), another methods should be applied.
j,max
n
1ii,available
j,max n
CC
∑==
(2)
» Standard deviation setting of paths The second method uses another statistical parameter to weight each path. A standard deviation STDj is composed over each j-th available path (along n - number of links). Then, the most appropriate path is selected by criteria of minimum deviation, Eq. 3. Unlike the previous method, this seems to be better justified since STDmin,j parameter prefers a path with balanced links quality.
jmin,
n
1ii
j,min n
STDSTD
∑==
(3)
» Double-parameter setting of paths The third method rates previous statistical parameters for each path optimal weighing (maximum is applied), Eq. 4.
jmax,j,min
j,maxj,max STD
Copt = (4)

ACTA TECHNICA CORVINIENSIS – Bulletin of Engineering
76 | F a s c i c u l e 3
EXPERIMENTS AND DISCUSSIONS In following experimental routing scenarios, above mentioned 17 GÉANT and 8 NRENs cross-border links are used. The parameters OSNR, BER, Power, U and Cmax for each of them represent current links states. They are set either by sliders or typed via Graphical User Interface (GUI), see left area and top chart in Figure 7. The merged network topology and nodes names are shown in the diagram placed in the middle in Figure 7 (high-speed GÉANT in green, low-speed GÉANT in dashed green, NRENs in orange). This model generates 132 total number of available routing paths. Above mentioned fuzzy control and statistical weighing algorithms are provided by Matlab and Simulink software.
Figure 7. Simulation model and network topology
As a result of parameters settings and control mechanism calculations, available capacity Cavailable is obtained for each of paths, see right-down chart and diagram in Figure 7. As a novel data transmission demand, the input BG and output PL nodes are chosen. Applying Equation 2, the blue line shows the path of maximum available capacity from starting node, via AT-SL-HR-HU-DE GÉANT links. Here, the DE-PL link with the lowest cost along this path might delay overall throughput. Unlikely, following the Equation 3, the red line shows better balanced BG-AT-PL path for the same starting and destination nodes via two GÉANT and NRENs low-speed links only. Despite of lower links cost, this path is the shortest one and, it is better balanced than the blue one. Applying Equation 4, the green line represents the path of maximum available capacity with respect to path balancing via AT-HR-HU-CZ nodes. It represents low-speed GÉANT links, except for last CZ-PL NRENs link. To conclude achieved experimental results, the blue path is applicable for huge data bulks transmission in short period; the red one is more suitable for medium and small data bulks transmission; the green path fits to long-time data transfers.
CONCLUSIONS Proposed middle-European plus neighboring merged network model comprehensively evaluates overall topology, comprising number of GÉANT and NRENs optical WDM links. To improve overall data transmission efficiency, reliability, stability and better utilization distribution over exploited links, the permanent link monitoring is necessary. When implementing algorithm in merged networks, more precise evaluation is needed for each link. In standard routing algorithms, usually the only path is obtained to setup the most appropriate path for data transmission, by the decision algorithm in a control system. Moreover, standard routing algorithms provide simple assessment only. It might not be sufficient when network loading or utilization dynamically changes. In proposed solution, based on Cmax capacity, each link is scored by fuzzy logic control subsystem, using several link parameters like OSNR, BER and Power. Consequently, link quality Q is obtained. Finally, routing control subsystem calculates overall links cost using current parameters like maximum available capacity and utilization. In this way, all available paths weighed quality is obtained. The most appropriate path can be chosen with respect to either maximum available capacity, minimum utilization fluctuations or maximum path balancing. In case of an emergency situation, control system can recalculate link parameters and efficiently reroute existing links and thus recover into fully-operational state, excluding faulty links. This advantage designates it to be implemented quickly and seamlessly. Acknowledgment This paper was elaborated under project 2016et017 Frequency management control of 5G communication networks, supported by Tatra Banka Fund. References [1] ESSIAMBRE, René-Jean, TKACH, Robert W. Capacity
trends and limits of optical communication networks. Proceedings of the IEEE. May 2012, vol. 100, No. 5, pp. 1035-1055. ISSN 0018-9219.
[2] LEUTHOLD, Juerg, KOOS, Christian, FREUDE, Wolfgang, ALLOATTI, Luca, PALMER, Robert, KORN, Dietmar, PFEIFLE, Joerg, LAUERMANN, Matthias, DINU, Raluca, WEHRLI, Silvan, JAZBINSEK, Mojca, GUNTER, Peter, WALDOW, Michael, WAHLBRINK, Thorsten, BOLTEN, Jens, KURZ, Heinrich, FOURNIER, Maryse, FEDELI, Jean-Marc, YU, Hui, BOGAERTS, Wim. Silicon-organic hybrid electro-optical devices. Journal of Selected Topics in Quantum Electronics. November/December 2013, Vol. 19, No. 6, p. 13. ISSN 1077-260X.
[3] ZAPATA-BEGHELLI, Alejandra, BAYVEL, Polina. Dynamic versus static wavelength–routed optical networks. Journal of Lightwave Technology. 15 October 2008, vol. 26, No. 20, pp. 3403-3415. ISSN 1558-2213.

ACTA TECHNICA CORVINIENSIS – Bulletin of Engineering
77 | F a s c i c u l e 3
[4] GRINGERI, Steven, BASCH, Bert, SHUKLA, Vishnu, EGOROV, Roman, XIA, Tiejun J. Flexible architectures for optical transport nodes and networks. IEEE Communications Magazine. July 2010, Vol. 48, Iss. 7, pp. 40-50. ISSN 0163-6804.
[5] GANDHI, S. Indira, VAIDEHI, V., FERNANDO, Xavier. Modified dynamic online routing algorithm and regenerator placement in WDM networks. Journal on Communication Technology. March 2011, Vol. 2, Issue 1, pp. 246-254. ISSN 2229 – 6948.
[6] LEIVA, A. L., MACHUCA, C. Mas, BEGHELLI, A. Z. Upgrading cost modelling of capacity-exhausted static WDM networks. 16th International Conference on Optical Network Design and Modeling. 17-20 April 2012, Colchester, UK, p. 6. ISBN 978-1-4673-1441-1.
[7] ELBERS, J.-P., AUTENRIETH, A. From static to software-defined optical networks. 16th International Conference on Optical Network Design and Modeling. 17-20 April 2012, Colchester, UK, p. 4. ISBN 978-1-4673-1441-1.
[8] ZHAO, Yongli, LI, Xin, LI, Huadong, WANG, Xinbo, ZHANG, Jie, HUANG, Shanguo. Multi-link faults localization and restoration based on fuzzy fault set for dynamic optical networks. Optics express. 28 January 2013, Vol. 21, No. 2, pp. 1496-1511. ISSN 1094-4087.
[9] WANG, Meiqian, LI, Shuo, WONG, Eric W. M., ZUKERMAN, Moshe. Performance analysis of circuit switched multi-service multi-rate networks with alternative routing. Journal of Lightwave Technology. 15. January 2014, vol. 32, No. 2, pp. 179-200. ISSN 1558-2213.
[10] VON LINDEINER, J. B., INGHAM, J. D., WONFOR, A., ZHU, J., PENTY, R. V., WHITE, I. H. 100 Gb/s uncooled DWDM using orthogonal coding for low-cost data communication links. Optical Fiber Communications Conference and Exhibition. 9-13 March 2014, San Francisco, CA, p. 3. ISBN 978-1-5575-2994-7.
[11] WEI, Jinlong, CHENG, Qixiang, CUNNINGHAM, David G., PENTY, Richard V.,WHITE, Ian H. 100-Gb/s hybrid multiband CAP/QAM signal transmission over a single Wavelength. Journal of Lightwave Technology. 15. January, 2015, Vol. 33, No. 2, pp. 415-423. ISSN 1558-2213.
[12] FRISKEN, Steven, POOLE, Simon B., BAXTER, Glenn W. Wavelength-selective reconfiguration in transparent agile optical networks. Proceedings of the IEEE. May 2012, Vol. 100, No. 5, pp. 1056-1064. ISSN 0018-9219.
[13] KOONEN, A.M.J., CHEN, H.S., SLEIFFER, V.A.J.M., VAN UDEN, R.G.H., OKONKWO, C.M. Compact integrated solutions for mode (demultiplexing).
[14] CHOU, Jerry, LIN, Bill. Adaptive re-routing over circuits: An architecture for an optical backbone network. Conference on Computer Communications. 15-19 March 2010, San Diego, CA, p. 5. ISBN 78-1-4244-6739-6.
[15] WANG, Sheng-Wei, WEN, Chin-Yen. Lightpath-level active rerouting algorithms in all-optical WDM networks with alternate routing and traffic grooming. International Conference on Information Networking. 1-3 February 2012, Bali, Indonesia, pp. 42-46. ISBN 978-1-4673-0250-0.
[16] KAMAMURA, Shohei, SHIMAZAKI, Daisaku, MORI, Hiroki, SASAYAMA, Koji, KOIZUMI, Yuki, ARAKAWA, Shinichi, MURATA, Masayuki. Optimization of light-path configuration order in IP over WDM networks using fast traffic matrix estimation. Optical Fiber Communications Conference and Exhibition. 9-13 March 2014, San Francisco, CA, p. 3. ISBN 978-1-5575-2994-7.
[17] BORKOWSKI, Robert, CABALLERO, Antonio, ARLUNNO, Valeria, ZIBAR, Darko, MONROY, Idelfonso Tafur. Robust cognitive-GN BER estimator for dynamic WDM networks. European Conference on Optical Communications.21 - 25 September 2014, Cannes, France, p. 607-609. ISBN 978-1- 4799-3066-1.
[18] JIMÉNEZ, Tamara, AGUADO, Juan Carlos, DE MIGUEL, Ignacio, DURÁN, Ramón J., ANGELOU, Marianna, MERAYO, Noemí, FERNÁNDEZ, Patricia, LORENZO, Rubén M., TOMKOS, Ioannis, ABRIL, Evaristo J. A cognitive quality of transmission estimator for core optical networks. Journal of Lightwave Technology. 15. March 2013, vol. 31, No. 6, pp. 942-951. ISSN 1558-2213.
[19] FREUDE, Wolfgang, SCHMOGROW, René, NEBENDAHL, Bernd, WINTER, Marcus, JOSTEN, Arne, HILLERKUSS, David, KOENIG, Swen, MEYER, Joachim, DRESCHMANN, Michael, HUEBNER, Michael, KOOS, Christian, BECKER, Juergen, LEUTHOLD, Juerg. Quality metrics for optical signals: eye diagram, Q-factor, OSNR, EVM and BER. 14th International Conference on Transparent Optical Networks. July 2–5, 2012, Coventry, England, p. 4.
[20] PASTORELLI, R., BOSCO, G., NESPOLA, A., PICIACCIA, S., FORGHIERI, F. Network Planning Strategies for Next-Generation Flexible Optical Networks. Optical Fiber Communications Conference and Exhibition. 9-13 March 2014, San Francisco, CA, p. 4. ISBN 978-1-5575-2994-7.
[21] BHARDWAJ, Nimisha, GUPTA, Neena. A novel technique to minimize gain-transient time of cascaded EDFA using fuzzy logic controller. International Journal of Emerging Technologies in Computational and Applied Sciences. 2012, Vol. 1, No. 4, pp. 569-573 ISSN 2279-0055.
[22] SARDAR, Abdur Rahaman, SING, J. K., SARKAR, Subir Kumar. Fuzzy logic based alternate routing scheme for the minimization of connection set up time and blocking rate in WDM optical network. International Journal of Soft Computing and Engineering (IJSCE). March 2013, Volume 3, Issue 1, pp. 222-228. ISSN 2231-2307.

ACTA TECHNICA CORVINIENSIS – Bulletin of Engineering
78 | F a s c i c u l e 3
[23] GEANT-network: http://www.geant.org/Resources/Documents/GEANT_topology_map_jan2017.pdf#search=topology%20map
[24] NREN services: https://compendium.geant.org/reports/nrens_services
[25] Deutsche Forschungsnetz: https://www.dfn.de/ [26] CESNET – an association of universities of the Czech
Republic and the Czech Academy of Sciences - https://www.cesnet.cz
[27] PIONIER - Polish Optical Internet - a nationwide broadband optical network for e-science - http://www.pionier.net.pl/online/
[28] ACOnet - The Austrian Academic Computer Network (NREN) - http://www.aco.net/technologie.html?&L=1
[29] SANET – Slovak Academic Network - www.sanet.sk [30] The National Information Infrastructure
Development (NIIF) Program - http://www.niif.hu/ [31] Academic and Research Network of Slovenia:
http://www.arnes.si/ [32] Croatian Academic and Research Network:
http://www.carnet.hr/ [33] Romanian Education Network: www.nren.ro,
http://webdevel.iasi.roedu.net/default.php?t=site&pgid=7
[34] Bulgarian Research and Educational Network: http://www.bren.bg/
[35] Gregory N. Nielson, Michael J. Shaw, Olga B. Spahn, Gregory R. Bogart, Michael R. Watts, Roy H. Olsson III, Paul Resnick, David Luck, Steven Brewer, Chris Tigges, Grant Grossetete: High-Speed, Sub-Pull-In Voltage MEMS Switching. SANDIA REPORT SAND2008-0211 Unlimited Release. Printed in January 2008.
copyright ©
University POLITEHNICA Timisoara, Faculty of Engineering Hunedoara,
5, Revolutiei, 331128, Hunedoara, ROMANIA http://acta.fih.upt.ro

© copyright Faculty of Engineering – Hunedoara, University POLITEHNICA Timisoara
ACTA TECHNICA CORVINIENSIS – Bulletin of Engineering Tome X [2017] Fascicule 3 [July – September] ISSN: 2067 – 3809
1.Vlado MEDAKOVIĆ, 2.Bogdan MARIĆ
ORGANIZATION AND CHARACTERISTICS OF BUSINESS ZONES 1.University of East Sarajevo, Faculty of Mechanical Engineering East Sarajevo, East Sarajevo, BOSNIA & HERZEGOVINA 2.University of East Sarajevo, Faculty of Education Bijeljina, Bijeljina, BOSNIA & HERZEGOVINA Abstract: The paper presents general organization and characteristics business zones. One of the modern ways of support to small newly established enterprises and entrepreneurs, which are in a development life phase, is the system of technological infrastructure: entrepreneurial incubators, technology centers, science parks and business zones. Those are different organizations which help entrepreneurs to develop their business ideas and to overcome more easily the initial problems in business, for which, in a wider context, the term business incubators is used, and also the clusters related to entrepreneurs who are in an advanced phase of entrepreneurship. Keywords: SMEs, entrepreneurial, entrepreneurial infrastructure, business zones
INTRODUCTION The beginning of the nineties, characterized by the breakdown of the former state, the outbreak of civil war, especially at the territory of B&H, stopped not only the development of entrepreneurship but also the fundamental economic activities. The support to the development of small and medium-sized enterprises in the Republic of Srpska had gained in importance in 2002, with the adoption of the Program of Small Business Development, and after that the Law on Stimulating the Development of Small and Medium-sized Companies was adopted. The adopting of the Law has created the basis for legislative, institutional and financial help to this area. On the basis of the Law, during 2004, there were formed: Department for SMEs and Production Craftsmanship at the Ministry of Economy, Energy and Development of the Republic of Srpska and the Republic Agency for the Development of Small and Medium-sized Enterprises. At the same time, on a local level, local agencies for the development of SMEs were being established. The support to the development of SMEs at a local level is also given by municipal development departments which, together with the above mentioned institutions, make support network for the development of SMEs.
Infrastructure is important for entrepreneurial activities [3] and may have different forms and functions. As first, the development of trade and industrial growth require physical infrastructure, road and railway traffic and transportation etc. After the World War 2, when the state had nationalized private property [4], the spirit of entrepreneurship at the territory of former SFRY, including B&H as well, was cut at the roots. The economic philosophy of a new economic system was based on the criticism of all the aspects of capitalism such as individualism, private ownership over the means for production, entrepreneurship in a wider sense etc. Entrepreneurship was identified with private ownership. In the beginning [1] that had been small business. However, with further breakthrough and propagation of small business, the term private entrepreneurship occurred, which, as such, was accepted in official frameworks. Namely, in the economic structure of the SFRY, especially after 1976, after the Law on Associated Labour had been adopted, a significant number of labour organisations (enterprises) emerged, of combine type, in the field of mining, metallurgy, metal processing industry, military industry, wood processing industry, with a great number of basic organizations of associated

ACTA TECHNICA CORVINIENSIS – Bulletin of Engineering
80 | F a s c i c u l e 3
labour and complex organizations of associated labour, which had the disregard of market laws as a common feature. Such enterprises, being labour-intensive, were oriented to the employment of a great number of people. The society propagated the need of full employment. There was general safety, especially once when a state job had been got. No one thought about a great individual engagement in the area of entrepreneurship. The structure of individual sector consisted of agriculture, then of independent forms of production, service and construction craftsmanship and independent catering, independent car-transportation activity and independent trading activity. In the SFRY, the percentage of the employed, as stated by [1], in small enterprises from 7 to 100 employees was only 2.4%, and in enterprises with 1 to 6 employees was 5.6%. The number of employees was limited to 10. In the process of building socialism, the private sector was called small business, and it operated under numerous limitations in terms of what it could deal with, with whom and how many employees it could employ. Such conditions are a phenomenon which is characteristic for all former socialist countries, and which is related to a lack of small and medium sized enterprises in the an economic structure, and, by means of that, to the absence of creating an entrepreneurial infrastructure. In all developed Western countries and in many developing countries, entrepreneurship and small enterprises as a whole are supported by the state, state institutions and nongovernmental organizations in many ways [4]. Such an orientation of a market-developed countries has deep roots, regarding the fact that the capitalism has tried many development models as opposed to one-dimensional models of economic flows control which have been practiced more-less for decades in the countries of socialist and similar socio-economic systems. Similarly to the leading countries of the West, many small countries which started with the implementation of market-capitalistic principles in the development of economy three to five decades ago, have reached an enviable level of development today [4] exactly due to the development of small enterprises. The determinations of Bosnia and Herzegovina [1] related to the SMEs development sector rely on the recommendations of the European Charter and the Act on Small Business. The Law on Ministries and Other Control Bodies of Bosnia and Herzegovina has also defined the institutional framework in the field of issues in the sector of SMEs whose difficulties reflect, above all, in: approaches in defining policies, development strategies and goals in the sector of SMEs, competences, way of work a harmonized monitoring of the results in this area,
mutual cooperation and profitability and excessive administration. At the level of the Republic of Srpska, within the Ministry of Economy, Energy and Development, there is a department for small and medium-sized enterprises, the head of which is an assistant minister with the responsibilities in the work fields:
» development of entrepreneurship and craftsmanship,
» making of medium-term and long-term development plans, and
» making of the development strategies of SMEs and entrepreneurial activity.
Pursuant to the (Law on Enterprises of the RS 2006), an enterprise is a legal person which performs the activity to gain profit, and an entrepreneur is a physical person who performs the activity to get profit and the activity of free profession, while an individual agriculturist is not an entrepreneur. The Law does not know the notion of small and medium-sized enterprise, and because of that the same provisions apply to them as to the other enterprises. The new (Law on Business Companies 2008) is a modern regulation, greatly harmonizes with the directives of the European Union company law and as such should contribute to the creation of a legal framework complementary the internal market of the European Union. The Law on Business Companies of the Republic of Srpska [5] is based on the best solutions of modern national law of the surrounding countries, and also of some countries from Europe and the USA (Illinois), the Statute of the European Company from 2001, OECD Principles of Corporate Governance from 1998 etc. Entrepreneurship, in the sense of the (Law on Development of SMEs of the RS, 2013), is an innovative process of creation and development of business ventures or activities and of creation of business success at market. Entrepreneurial infrastructure presents spatial-technical forms for toe support of entrepreneurship development, with a special emphasis on establishing and development of SMEs. In recent time [2], there is a greater emphasis in the commercialization of university research, especially through the creation of spin-off enterprises. They emphasize inhomogeneity of the concept of university spin-off enterprises and point out their heterogeneous properties. The suggestions of [2] for the classification of university spin-off enterprises are:
» independent spin-off enterprises, » connected spin-off enterprises, with joint
investment, and » as organizational units of universities.

ACTA TECHNICA CORVINIENSIS – Bulletin of Engineering
81 | F a s c i c u l e 3
Three key approaches are used for differentiating the types of university spin-off enterprises: researchers as entrepreneurs of spin-off enterprises, by the nature of knowledge transfer and the participation of external partners in a new company. These different criteria make the phenomena contained by the concept of university spin-off enterprises. BUSINESS ZONES AS ENTREPRENEURIAL INFRASTRUCTURE Formation and development of business zones is a long-term, planned activity directed to stimulation of economic development and employment at the territory of a local community, with the use of adequate equipped space and other instruments of support, which enable a more efficient and faster economic and spatial development of enterprises which operate in a zone. Business zones (the Law on Development of SMEs of the RS 2013) are a form of entrepreneurial infrastructure which presents a constructionally arranged and communally equipped space, intended for a harmonized and planned use by a greater number of enterprises and entrepreneurs, where the planned and harmonized approach enables a joint use of the space, as well as of communal, administrative, financial, technical and other services, thus realizing lower costs of business. The terms of entrepreneurial infrastructure and business infrastructure often have multiple meanings, because the development terminology mostly has not been set, because of its complexity, by a legislation, and the fact that those are relative new development mechanisms. The notion of business zones can define the widest notion of zones in general, which presents a certain area of an infrastructurally equipped building lot which is regulated by spatial-planning documentation, intended for business, i.e. the creation of added value. Pursuant to the first classification [4], the zones can be classified into four groups: Specialized zones: incubators, technology centers, technology parks, centers for transfer of technologies and zones specialized for certain activities; Industrial zones, present the areas with a great concentration of industry, predominated by big enterprises; Entrepreneurial – craft zones, present the areas with a great concentration of small enterprises and entrepreneurs; Agricultural zones are the zones founded on soil which is not intended for building and is used for agricultural production. Pursuant to another classification, business zones can be classified in the following four categories: Industrial zones are larger zones mostly oriented towards bigger industrial enterprises from similar agricultural sectors, but also the small and medium-sized enterprises (SMEs) related on the principle of subcontracting with bigger enterprises. A special category of industrial zones are so-
called industrial parks, whose specificity is to have a company as the operator which manages the zone on behalf of one or more owners. In developed countries, the operator can be in public property (public communal enterprises and/or municipality and sate), can be a public – private partnership or in private ownership. The aim of creating this form is a more efficient management of the zone and better planning of its development. Entrepreneurial zones are smaller zones primarily intended for SMEs and entrepreneurs, which have a more favorable support treatment with the aim of faster development, i.e. to invest in equipment, human resources and working assets, and less in the business premises. Business centers are business tones where business, trading and logistical centers oriented to service activities are grouped most often. The building of business centers is most frequently a private or public-private initiative. Technology parks are the zones directed to high technologies and usually emerge near universities (with technical faculties and institutes). Located in technology parks, there are usually small, micro and medium-sized enterprises based on high technologies, application of new knowledge and introduction of new practices to economy. Besides the named classifications [4], on the basis of strategic importance, industrial zones could be divided into zones of strategic interest defined pursuant to different criteria, as projects of special interests, and emerge by an initiative of Government towards he realization bearers, which can be of different levels and legal status (from top to bottom) and local zones of municipal or regional importance and oriented towards smaller industrial capacities. Their size is from 10 to 60 ha, depending on the needs and possibilities of the organizer. The initiatives for the development of such zones originate from one or more municipalities (initiative from bottom to top). Business zones present special organized business units in which, at one location, well connected with communications, the types of production and service activity on the principles of cluster organization are developed, with the use of developed infrastructure and accompanying services which have their specific industrial features. Basically, business zones secure the competitiveness for businesses in two aspects. The first of them is related to the possibility of using the effects of integration of similar and related businesses within a zone, resulting in the making of competitive advantages for downstream activities within the zone by means of: » access to different inputs in raw materials,
components, packaging and services;

ACTA TECHNICA CORVINIENSIS – Bulletin of Engineering
82 | F a s c i c u l e 3
» lower transaction costs, because the locations of providers and producers are identical;
» efficient coordination based on availability and constant exchange of information among the buyers and suppliers in the zone;
» improvement of innovation process on the basis of good knowledge of the consumers’ needs and of joint work in solving problems; specialization and efficiency rising and the application of new technologies in a strategic partnership of enterprises in the zone;
» firmer integration of providers and related industries in the chain of values of enterprises in the zone, especially in cases when downstream activities are orientated towards international markers; partnership with related industries in cases when they can service a few enterprises, for example when distributive enterprises in the zone can distribute the products of a few producers.
The second aspect is related to efficiency offered by the location of the zone for its members by means of: » decrease of investment costs for production and
business objects; » decrease of operational costs of functioning,
transportation, maintenance and safety of an object, and the services organized in the zone;
» joint use of certain objects (laboratory, copy-room, energy sources etc.).
Business zones appear under different names. The terms also in use are: industrial park, economic zone, business zone, industrial possession, business zone, artisanal zone, eco-industrial park and some other, but basically they denote what has been stated under the notion of a business zone. Regardless of how we name them[4], all of them have two characteristics in common: » common location of enterprises oriented to a
mutual business cooperation, and » common structure of management. They vary one from the other in the sense of type and size. They are most often divided due to the type of investment, i.e. the preparedness for investment, to green field and brown field. In the first case, green field, we talk about the creation of business zones at completely new locations, while in the second case, a brown field zone has been created from already used ground and objects in industrial centers. From the aspect of Bosnia and Herzegovina, especially significant is the use, or reactivation, of infrastructural capacities of former state enterprises, whose value gets rapidly destroyed by the lack of use. In cases when the reconstruction of existing capacities is more expensive then the construction of new ones – the advantage is given to the first option.
Business zones have certain specifies in relation to free zones which are, in many countries, one of the instruments for conduction of trading policies. Namely, free zones are specially denoted and arranged areas of one state, where business activities take place under special conditions, mostly with certain benefits related to freeing of duties and taxes for activities directed towards export. So, free zones are basically the means of export promotion and of promotion of direct foreign investments to some countries. Besides the stated differences, business zones and free zones also have some similarities, in the sense that both forms of organizations are directed towards the building of competitiveness by means of creating a competitive advantages of a certain location of production. Moreover, the free zones in industrially developed countries have lost significantly in their primary meaning of economic oases based on the advantages of a duty-free area and the avoidance of taxation, and they get more importance in creating the competitive advantages from the fundamentals of a quality infrastructure of a free zone, high technologies applied in the zone, advantages of specialization, innovations and low transactional costs and other advantages created by the business zones in a narrower sense. Business zones should be observed as one of instruments in realization of new industrial policies which promote many important economic goals. Among the goals, the following ones stand out: restructuring of production, growth of employment, rising of productivity and efficiency in economy, improvement of the technological level of production and business in general, improvement of export and export competitiveness and development of small and medium-sized enterprises (SMEs). Building of competitiveness in a small country, especially in the conditions of responsibility for regional and local development, is related to the growing role of small and medium-sized enterprises. Specificity of a development based on the promotion of SMEs is related primarily to the need of creating a business environment in which the enterprises will have the conditions for building of sustainable competitive advantages. In many elements, the business environment of SMEs exhibits specificities. The enterprises do not have the strength to act independently at big markets because of their fragmentation, so it is logical that in the business environment they start to build a partnership and develop cooperation in horizontal and vertical dimension and to promote the cluster-type cooperation. Namely, what cannot be secured as a desirable business environment in economy in general, is often achieved within business zones, so that they become attractive for the location of productions which mean the entering into

ACTA TECHNICA CORVINIENSIS – Bulletin of Engineering
83 | F a s c i c u l e 3
a higher phase of competitiveness or mean a greater efficiency within the stadium of competitiveness which marks an economy guided by factors of development. Some of the goals[4] for founding of business zones can be the following ones: securing of long-term conditions for development of small and medium-sized entrepreneurship and production craftsmanship, long-term decrease and alleviation of the trend of unemployment and support to entrepreneurs to open new job positions, especially within the production activities, stimulation of growth and development of entrepreneurs, especially in terms of development of new products, application of new technologies and support to export, facilitating of communication and support of cooperation among the entrepreneurs within a zone, especially the support for association in realization of concrete entrepreneurial and development projects, creation of conditions for transfer of a part of production activities from a narrower town center to use that space for more adequate and profitable contents. Economic development of an area is greatly determined by available potentials, i.e. resources, at one side, and certain factors, i.e. the measures which create a favorable ambient and support to development, at the other side. Available resources for an economic development of a region, contained in: infrastructural capacities (roads, railway), natural potentials, power sources, installed economic capacities, personnel, with the geographic position, present a relatively solid basis for a future designed development of the Region. CONCLUSIONS Every local community or a set of local communities which are connected geographically, to attract a larger number of enterprises to their territory, the territory of the Region, takes various activities to improve the conditions of work of SMEs. Local community plays a very significant role, whiles the task of the country, or the government, is to activate the inner resources, as additional development impulses. A prudent activity of local communities with the aim of developing own infrastructure and entrepreneurial potential and attracting of investments can be a concept of regional development. Local community must develop an attractive environment for capital and enterprises. The establishment of business zones accelerates and simplifies the placement of spatial resources in the function of economic development, investments, growth and employment. Everywhere in the world, business zones present a significant instrument for the stimulation and development of entrepreneurship and general economic growth of a certain area. They are established on the basis of a clearly expressed interest between the businessman and bodies of local and regional government, with the support of higher levels
of government and research-educational organizations, universities and institutes. REFERENCES [1] Cvijić M., Istraživanje uslova i mogućnosti za razvoj
preduzetništva u procesu tranzicije. doktorska disertacija. Novi Sad, 2007.
[2] Garmendia B.M., Castellanos R.A., Types of spin-offs in a university context: a classification proposal. Cuadernos de Gestión Vol. 12 - N.º 1. pp. 39-57 ISSN: 1131 – 6837, 2012.
[3] Heger D., at al., The Effect of Broadband Infrastructure on Entrepreneurial Activities: The Case of Germany. Centre for European Economic Research (ZEW). Discus si on Paper No. 11-081. http://ftp.zew.de/pub/zew-docs/dp/dp11081.pdf, 2011.
[4] Medaković V., Research of conditions for development of small and micro enterprises and development of entrepreneurial infrastructure model. Doctoral thesis. Faculty of Mechanical Engineering. East Sarajevo, 2012,
[5] Rajčević M., Zakon o privrednim društvima RS. Materijali sa savjetovanja. Banja Luka, 2009.
[6] Zakon o preduzećima RS, Sl. glasnik RS. broj 24/98. 62/02. 38/03. 97/04 i 34/06, 2006.
[7] Zakon o privrednim društvima RS, 01-1882/08. NSRS Sl. glasnik RS. broj 127/08, 2008.
[8] Zakon o razvoju MSP-a RS, 01-916/13, NSRS, 2013.
copyright ©
University POLITEHNICA Timisoara, Faculty of Engineering Hunedoara,
5, Revolutiei, 331128, Hunedoara, ROMANIA http://acta.fih.upt.ro

ACTA TECHNICA CORVINIENSIS – Bulletin of Engineering
84 | F a s c i c u l e 3
We are very pleased to inform that our international and interdisciplinary journal ACTA TECHNICA CORVINIENSIS Bulletin of Engineering completed its nine years of publication successfully [issues of years 2008 –2016, Tome I–IX]. In a very short period it has acquired global presence and scholars from all over the world have taken it with great enthusiasm.
Every year, in four online issues (fascicules 1 – 4), ACTA TECHNICA CORVINIENSIS Bulletin of Engineering [e-ISSN: 2067-3809] publishes a series of reviews covering the most exciting and developing fields of science and technology. Each issue contains papers reviewed by international researchers who are experts in their fields. The result is a journal that gives the scientists and engineers the opportunity to keep informed of all the current developments in their own, and related, areas of research, ensuring the new ideas across an increasingly the interdisciplinary field. Now, when will celebrate the tenth years anniversary of ACTA TECHNICA CORVINIENSIS Bulletin of Engineering, we are extremely grateful and heartily acknowledge the kind of support and encouragement from all contributors and all collaborators!
On behalf of the Editorial Board and Scientific Committees of ACTA TECHNICA CORVINIENSIS Bulletin of Engineering, we would like to thank the many people who helped make this journal successful. We thank all authors who submitted their work to ACTA TECHNICA CORVINIENSIS Bulletin of Engineering.
copyright © University POLITEHNICA Timisoara,
Faculty of Engineering Hunedoara, 5, Revolutiei, 331128, Hunedoara, ROMANIA
http://acta.fih.upt.ro

© copyright Faculty of Engineering – Hunedoara, University POLITEHNICA Timisoara
ACTA TECHNICA CORVINIENSIS – Bulletin of Engineering Tome X [2017] Fascicule 3 [July – September] ISSN: 2067 – 3809
1.A. D. ADEWOYIN, 2.M. A. OLOPADE
AN INVESTIGATION OF THE CHARGE-DISCHARGE CHARACTERISTICS OF AN ULTRACAPACITOR IN COMPARISON WITH CONVENTIONAL BATTERIES USING PSCAD-1D 1, 2. Department of Physics, University of Lagos, Lagos, NIGERIA Abstract: The charging and discharging of ultra-capacitors have been studied in this research. An equivalent circuit was used to describe the electrical behavior of the ultra-capacitors. The equivalent circuit was implemented in Power System Computer Aided Design (PSCAD-1D) software for simulations. Maxwell 350F ultra-capacitors were used in the basic model. Simulation results of this model in a stable charge/discharge procedure showed excellent agreement with results obtained from experiments. The charging of the ultra-capacitor took approximately 50seconds. The ultra-capacitor shows a nearly constant energy storage capacity. Also, the time constant for the full charging phase is 63% while the discharge phase is 37%. The graph of the discharge phase is exponential. A discharge efficiency of 85% at all charge/discharge current was determined and its specific power is relatively high. Keywords: ultra-capacitor, charging, discharging, efficiency and power INTRODUCTION The ultra-capacitor is a promising energy storage device with behavior between traditional capacitor and rechargeable battery. The ultra-capacitor possesses outstanding unique features that could possibly give it an edge over the existing energy storage system. It can be charged and discharged quickly like a capacitor, but still exhibits 20-200 times greater capacitance than conventional capacitors (Conway B.E., 1999). The full charging and discharging time can take only few seconds without damaging the cell. Ultra-capacitors are also known as super-capacitors. Ultra-capacitors with capacitances ranged from several hundreds to over a thousand Farads are produced on large scale for transportation applications [(Kim Y., 2003), (Pay, S. and Y. Baghzouz, 2003)]. The charging and discharging processes of ultra-capacitors are highly reversible and does not require any intermediate stages. Also, the power density of ultra-capacitors is higher than those of normal batteries, although the energy density is lower. The difference is due to different mechanism of energy storage (Conway B.E., 1999). These unique features of ultra-capacitors
allow its use in a wide variety of applications in the backup power sources, auxiliary sources, for instantaneous power compensation, for peak power or simply as energy storage element. Although, super-capacitors have clear advantages over conventional use of batteries as energy storage medium, there are still obstacles to its wider use such as low energy density and a very high discharging rate. This study aims at studying the intricacies of the charging and discharging mechanisms of the super-capacitors with a view to providing insight to the dynamics of its operation. This will be achieved through the modelling and simulation of the model using PSCAD-1D software. DEVICE STRUCTURE AND MODELING Ultra-capacitors store energy electrostatically through a process known as non-faradaic electrical energy storage. Testing any simulation program involves an initial building of a model. Some models have been developed in literatures which permit the determination of some of the super-capacitors parameters [Conway B.E., 1999 and Camara, M., 2007].

ACTA TECHNICA CORVINIENSIS – Bulletin of Engineering
86 | F a s c i c u l e 3
The ultra-capacitor cell modeled in this paper was based on 2.7V cell. A series of measures for Maxwell 350F super-capacitor was tested in this study. The basic model used for this study is shown in figure 1 and the analyses given below.
Figure 1: The basic circuit model
of the Maxwell 350F super-capacitor Figure 1 above shows a super-capacitor modelled containing standard circuit components. A similar circuit design was presented in the data sheet for the super-capacitor from European Phase Change Ovonic Science (EPCOS) (Data Sheet, EPCOS). This circuit consists of the essential parts used in the basic model.
Table 1: General technical data provided by the manufacturer (Product guide, 1.2)
Product BCAP0350 Dimensions L = 61.5mm D = 33.3
Mass 60g Rated capacitance 350F
Minimum capacitance 350F Maximum ESR 3.2mΩ Rated voltage 2.70V
Maximum voltage 2.85V Maximum current 170A
Specific energy 5.9Wh/kg Stored energy 0.35Wh
The two variable capacitors are nonlinearly varying with the voltage that is applied across the circuit, according to the relation found in the measurement data. The capacitance C is responsible for the control of the charging processes of the super-capacitor. The capacitance value determines the amount of energy stored and the rate of energy level variations. The capacitance C determines amount of energy stored and Cp is taken as one thirteenth of C, as its impact is very small.
The self-discharge effect is handled by resistance R2 that is connected in parallel with the capacitor while the R1 connected in series resistance signifies the losses during charging and discharging processes. These losses are presumed to occur since the connection is not ideal and therefore the conducting element in the super-capacitor has a resistance. The resistance R3 offers excess voltage protection. The switch next to R3 prevents damage that could occur to the capacitor elements by balancing the voltage levels. This difference in voltage can occur if a cell has a smaller capacitance than the other, which is reflected in the amount of stored energy [6]. Resistance Rp and R2 are included in the circuit to show the fast-dynamic processes in the behavior of the super-capacitor. The values of the circuit component used in the implementation of the model in the PSCAD software are: R1 = 6 mΩ, R2 = 18 kΩ, R3 = 52Ω, Rp = 3mΩ, C = 350F, Cp = 27F. The technical data of the ultra-capacitor used for the model as specified by the manufacturer is given in table 1. RESULTS AND DISCUSSION
» Charging Stage The values of all the components are varied to optimize the circuit to a practical model. To characterize this ultra-capacitor, a constant current discharge/recharge test was used. The charging phase shows the following variations of voltage with time as shown in figure 2.
Figure 2: Voltage variation with time
The precise current control of ultra-capacitor is not required for the simulation since, it can accept a wide range of charging current. Thus, the criterion for terminating charging is the maximum rated voltage of the ultra-capacitor (Marco et. al., 2015). In this work, the ultra-capacitor used is fully charged to its rated value in approximately 50 seconds. Figure 2 shows that the charging voltage is approximately 2.8V which is in agreement with the value of the technical data used.

ACTA TECHNICA CORVINIENSIS – Bulletin of Engineering
87 | F a s c i c u l e 3
This gives it a better advantage over the conventional batteries that takes several minutes to hours to charge. In addition to this, the charging can start from 0V without any damage to the ultra-capacitor. It has a very long term time constant of approximately one second. The available charges at any time is a function of the output voltage. Thus, when the charging current is varied, the ultra-capacitor shows a nearly constant energy storage capacity. For an ultra-capacitor, experimental results reveal that the energy storage capacity is nearly constant under different rates of charging. In practical situations, a voltage comparator is employed for charging termination of the ultra-capacitor as soon as it reaches its rated value (Marco et. al., 2015).
» Discharging Stage The time constant of ultra-capacitors is approximately one second (Ultra-capacitor Product guide 1.2). For the ultra-capacitor under consideration, the time constant is given as τ = RsC = 0.90. Rs is the ultra-capacitor internal resistance and C is the capacitance. The time constant for the full charging phase is 63% while the discharge phase is 37% (figure 3). This is in agreement with BCAP0350 specification data.
Figure 3: Current variation with time
The discharge phase was determined from the values of current with their corresponding time interval from the PSCAD software used for the simulation of the super-capacitor. Microsoft Excel Program was used to plot the graph of the data obtained from the simulator as shown in the Figure 4. The test starts from fully charged status with an open circuit voltage (OCV) = 2.8V. The following observations were deduced from the simulation as shown in the graph of figure 4. The discharge phase is exponential (figure 4). Hence, a non-purely resistive short term behaviour during the first few seconds.
In practical applications, direct short circuit is not a problem. This gives it a better advantage over conventional batteries.
Figure 4: Current-time graph of the discharge phase
» Discharge Efficiency (ηd) The discharged efficiency ηd of the BCAP0350 is determined from the time constant τ as follows.
ηd = 1 − 2 τTd (1)
The constant total current discharge time 𝑇𝑇𝑑𝑑 to fully deplete the stored energy in the ultracapacitor is 12 seconds (figure 4). Therefore, the discharge efficiency of the ultra-capacitors is approximately 85%. The graph of figure 4 shows that ultra-capacitors exhibit non-linear behavior as soon as the charging stops. CONCLUSIONS A dynamic modelling technique for power conversion is important in terms of domestic and commercial needs for a fast storage, conversion and supply of a quantity of energy. Ultra-capacitor module of (350F) was characterized and analyzed in this report. It shows good and stable performance under all operating conditions during testing. Its efficiency is about 85% at all charge/discharge current and its specific power is relatively high compared to Lithium ion batteries. It is however recommended that the optimization of the model can improve the model performance. References [1.] Conway B.E.: Electrochemical Supercapacitors:
Scientific Fundamentals and Technological Applications, Kluwer Academic Publishers/Plenum Publisher, New York, 11-15 (1999).
[2.] Kim, Y.: Ultracapacitor technology powers electronic circuits. Power Electronics Technology, 29, 34-39 (2003).
[3.] Pay, S., and Baghzouz, Y.: Effectiveness of battery-supercapacitor combination in electric vehicles.
Main : Graphs
TIME(S) 0 10 20 30 40 50 60 70 80 90 100
0.0
5.0
10.0
15.0
20.0
25.0
30.0
CU
RR
EN
T (
A)

ACTA TECHNICA CORVINIENSIS – Bulletin of Engineering
88 | F a s c i c u l e 3
In Power Tech Conference Proceedings, 2003 IEEE Bologna (Vol. 3, pp. 6-pp). IEEE (2003).
[4.] Camara, M. B. C.: Supercondensateurs pour échange dynamique d'énergie à bord du véhicule électrique hybride: modélisation, étude des convertisseurs et commande (Doctoral dissertation, Université de Franche-Comté) (2007).
[5.] Data sheet for supercapacitor from EPCOS with Part No: B48621-S0203-Q288.
[6.] Chan, M. S., Chau, K. T., and Chan, C. C.: Effective charging method for ultracapacitors. Journal of Asian Electric Vehicles, 3, 771-776 (2007).
[7.] Ultracapacitor product guide 1.2, Maxwell Technologies.
copyright ©
University POLITEHNICA Timisoara, Faculty of Engineering Hunedoara,
5, Revolutiei, 331128, Hunedoara, ROMANIA http://acta.fih.upt.ro
© copyright Faculty of Engineering – Hunedoara, University POLITEHNICA Timisoara
ACTA TECHNICA CORVINIENSIS – Bulletin of Engineering Tome X [2017] Fascicule 3 [July – September] ISSN: 2067 – 3809
1.Andor ZSEMBERI, 2.Zoltán Károly SIMÉNFALVI, 3.Árpád Bence PALOTÁS
ANALYSIS OF A THERMO-CATALYTIC CRACKING 1-2.University of Miskolc, Institute of Energy Engineering and Chemical Machinery, HUNGARY 3., University of Miskolc, Institute of Energy and Quality Affairs, Department of Combustion Technology, HUNGARY Abstract: The core topic of the current research is composed of chemical raw materials to be produced from renewable and waste sources, out of which the most significant future representative can be the so-called thermo-catalytic cracking process in combined material flow. The thermo-chemical conversion of biomass and/or plastic waste(s) is a process, by means of which base materials for the chemical industry or energy carriers can be manufactured. If one considers the conventional, purely thermal not catalytic cracking of biomass only, the quality indicators of the so-called bio oil to be produced such as heating value, viscosity, oxygen content etc. are fairly poor. Today’s research investigates thermo-catalytic cracking performed in combined material flow (biomass and synthetic polymer waste) gaining popularity, by means of which one can efficiently attain quality improvement during the process from the aspect of liquid products to be produced. The liquid product obtained from thermo-catalytic thermal cracking of pure biomass was a brownish-black pitchy fraction. By adding 50 wt% PS (polystyrene) waste, a considerable qualitative and quantitative improvement could be achieved during the combined thermo-catalytic cracking. The aromatic hydrocarbon content of the liquid product increased considerably. In addition, the quantity of solid chark and carbonised fraction remaining in the reactor body dropped by 36% on average in favour of the liquid and gas products, which may significantly promote the technical-economic viability of the technology. Keywords: cracking, biomass, recycling of plastic waste, aromatic hydrocarbons INTRODUCTION The line of main direction of research is the optimisation of conversion possibilities of lignocellulose-based biomass into a valuable chemical raw material. Tests were performed using maize stalk and manmade difficult-to-recycle synthetic polymer waste. The use of the developed experimental process can be a considerable alternative application and/or recycling option for both components against deposit of waste or controlled/uncontrolled incineration. The purpose is to optimise operational parameters of the thermo-catalytic thermal cracking chemical process in combined material flow, which is based on the enrichment of aromatic hydrocarbon content in the produced liquid products. Aromatic hydrocarbons are unsaturated ring carbon compounds that can all be derived from benzene of the empirical formula C6H6 in terms of their structure. Benzene, toluene and ethyl benzene are main base materials for the important and a large number of intermediates that are used to manufacture synthetic fibres (polyester, nylon, etc.), resins, artificial rubbers, explosives, pesticides, detergents, paints and many base
materials indispensable for the industry. Approximately 35 million tons are manufactured from these compounds globally. The main decision factors in the selection of raw materials for manufacture are their availability and chemical composition. Currently the largest quantities of benzene, toluene and xylene are produced from crude oil or coal [1]. Due to the depletion of fossil energy carriers and the increasing demand for the aromatic hydrocarbons, research gains importance in future for possible alternative base material sources. CHARACTERISTICS OF THE RAW MATERIALS As a renewable energy source to be used, biomass has an increasing significance since it contributes to global CO2 emission levels to a much lower extent – via the closed carbon cycle. One of the raw material for the research was maze stalk, which is an agricultural by-product generated at the highest quantities in Hungary [2]. The cellulose-containing biomass, jointly called lignocelluloses contain cellulose, hemicellulose as well as lignin in different quantities depending on the type and advanced state of the plant in question, which

ACTA TECHNICA CORVINIENSIS – Bulletin of Engineering
90 | F a s c i c u l e 3
natural polymers make up 85 to 90% of dry matter [3]. A general fact is that biomass can be converted directly into gas and liquid products as well via biomass thermal cracking. However, because of the structure of its raw material, the liquid fraction obtained from cracking pure biomass has a high oxygen content [4-5], therefore its usability is restrained strongly. Nowadays it is an area of intensified research, the quality of target fractions by combined degradations of plastic wastes rich in hydrogen to what extent exactly and under which operational as well as raw material combinations can be improved or carried out. Artificial polymer derivatives have become the most important structural materials of mankind. The use of plastics has risen significantly in the last 100 years and the various types of polymers are increasingly prevalent in the resulted waste. The various plastic materials are produced globally in large quantities and their manufacturing capacity rises by an average 10% yearly since the 1950s [6]. Due to the mentioned relevant causes, the other raw material in the subject matter of examinations is polystyrene whose annual production capacity reaches 16 million tons globally and the plastic type in the most widespread use in Hungary. Once it loses its utilisation function, however, its is harmful to environment, being a not readily biodegradable waste, whose treatment is a relevant environmental issue, moreover, a real logistic challenge in the case of foamed PS (polystyrene) at the same time. The real trouble is that the majority of PS is not used as a durable product, thus, it appears in a high proportion in municipal waste such as a disposable dish, glass, cutlery etc. contaminated with foodstuff, whose recycling is still at an embryonic stage [7]. The structure of polystyrene is depicted in Figure 1.
Figure 1. Structure of polystyrene
Figure 1 reveals that PS is purely composed of hydrocarbon, which is particularly beneficial for cracking processes because the releasing hydrocarbon saturates the unsaturated carbon-chains, which can lead to a qualitative improvement.
CHALLENGES OF TECHNOLOGY The future viability for processes processing biomass and plastic waste in a combined way has many crucial points. Because of the uncertain composition of waste and biomasses, the input material flow is uncertain, which is a large deviation to the general chemical processes. On top of that, it is also particularly important in the design that special properties of raw materials in question must be taken into account such as the polymer structural properties, low heat conductivity and visco-elastic behaviour [7]. Furthermore, it should be highlighted that it is indispensable to know the kinetics of thermal decomposition, reaction mechanism and quite significant interaction of heterogeneous components for the design of the process working at the proper efficiency and economy. All in all, it can be said that thermo-catalytic cracking in combined material flow can be one of the future’s significant viable alternative to manufacturing base materials for the chemical industry. At present, the improvement in the qualitative indicators of hydrocarbons produced so are faced with major difficulties and keeps raising many unanswered questions. PROCESS CHARACTERISTICS The fundamental difference between thermal and thermo-catalytic thermal cracking (cracking, pyrolysis) resides in the fact that no catalyst is used in the former. A joint feature is that polymers with long carbon-chains degrade during the process into smaller molecules, which means actually the basis of recycling. Another essential feature of the technology is that the process takes place in an inert atmosphere (oxygen-free), at near atmospheric pressure. The great advantage of thermo-catalytic cracking over purely thermal cracking is the following: Smaller reaction temperature, which results in lower
energy consumption; Cracking reactions occur faster allowing for shorter
residence time and lower reactor volume; The yield of various more valuable components can
be optimised by selecting an appropriate catalyst; The ring, branched and aromatic hydrocarbon
contents in the product fraction increase by thermo-catalytic cracking of polyolefins, which raises the economic potential of the process [8].
Thanks to its many positive literature and industrial references, the well-known and widely used catalyst ZSM-5 was employed in our examinations. EXPERIMENTAL EQUIPMENT The implemented laboratory-scale thermo-catalytic equipment is illustrated in Figures 2 and 3 from side and top views.
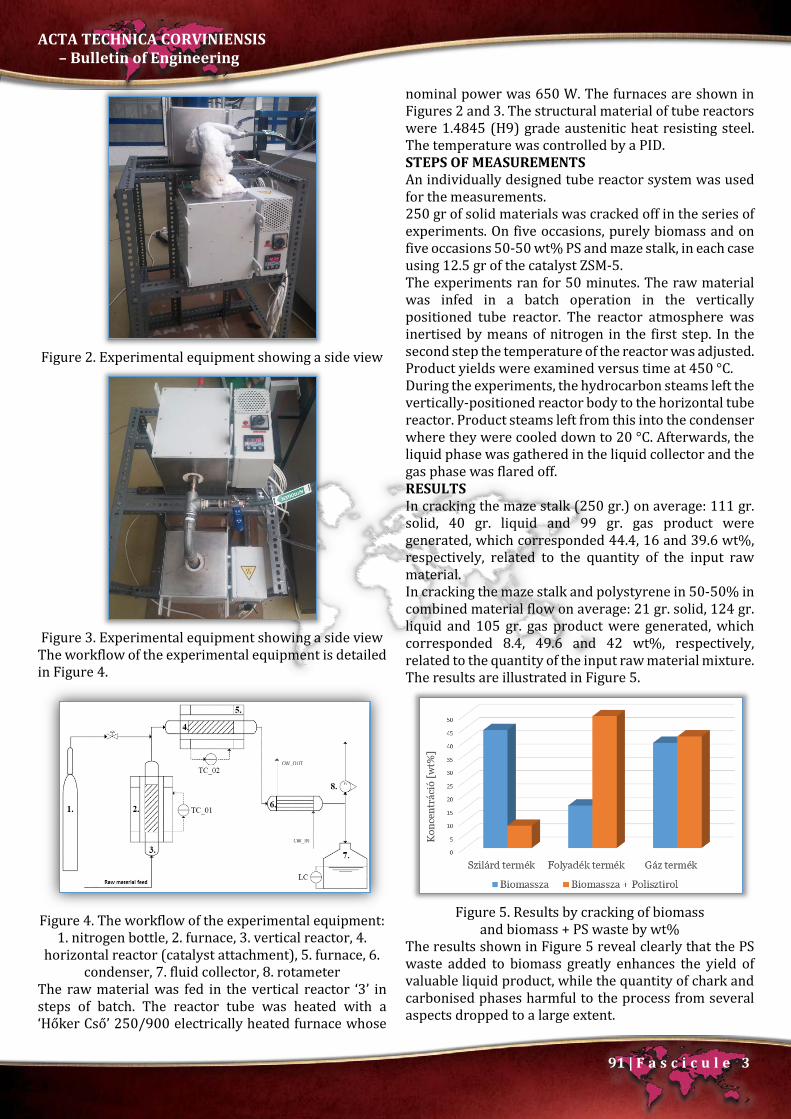
ACTA TECHNICA CORVINIENSIS – Bulletin of Engineering
91 | F a s c i c u l e 3
Figure 2. Experimental equipment showing a side view
Figure 3. Experimental equipment showing a side view
The workflow of the experimental equipment is detailed in Figure 4.
Figure 4. The workflow of the experimental equipment:
1. nitrogen bottle, 2. furnace, 3. vertical reactor, 4. horizontal reactor (catalyst attachment), 5. furnace, 6.
condenser, 7. fluid collector, 8. rotameter The raw material was fed in the vertical reactor ‘3’ in steps of batch. The reactor tube was heated with a ‘Hőker Cső’ 250/900 electrically heated furnace whose
nominal power was 650 W. The furnaces are shown in Figures 2 and 3. The structural material of tube reactors were 1.4845 (H9) grade austenitic heat resisting steel. The temperature was controlled by a PID. STEPS OF MEASUREMENTS An individually designed tube reactor system was used for the measurements. 250 gr of solid materials was cracked off in the series of experiments. On five occasions, purely biomass and on five occasions 50-50 wt% PS and maze stalk, in each case using 12.5 gr of the catalyst ZSM-5. The experiments ran for 50 minutes. The raw material was infed in a batch operation in the vertically positioned tube reactor. The reactor atmosphere was inertised by means of nitrogen in the first step. In the second step the temperature of the reactor was adjusted. Product yields were examined versus time at 450 °C. During the experiments, the hydrocarbon steams left the vertically-positioned reactor body to the horizontal tube reactor. Product steams left from this into the condenser where they were cooled down to 20 °C. Afterwards, the liquid phase was gathered in the liquid collector and the gas phase was flared off. RESULTS In cracking the maze stalk (250 gr.) on average: 111 gr. solid, 40 gr. liquid and 99 gr. gas product were generated, which corresponded 44.4, 16 and 39.6 wt%, respectively, related to the quantity of the input raw material. In cracking the maze stalk and polystyrene in 50-50% in combined material flow on average: 21 gr. solid, 124 gr. liquid and 105 gr. gas product were generated, which corresponded 8.4, 49.6 and 42 wt%, respectively, related to the quantity of the input raw material mixture. The results are illustrated in Figure 5.
Figure 5. Results by cracking of biomass
and biomass + PS waste by wt% The results shown in Figure 5 reveal clearly that the PS waste added to biomass greatly enhances the yield of valuable liquid product, while the quantity of chark and carbonised phases harmful to the process from several aspects dropped to a large extent.
ACTA TECHNICA CORVINIENSIS – Bulletin of Engineering
92 | F a s c i c u l e 3
The produced liquid products were analysed qualitatively as well. The tests were carried out according to MSZ (Hungarian standard) 1448-4:1198 volatile aromatic hydrocarbons. The results are summarised in Table 1.
Table 1. Concentrations of aromatic components [mg/l].
Component Biomass [mg/l]
Biomass and polystyrene
[mg/l] benzene 12 954 toluene 345 45322
ethyl benzene 234 30444 m+p xylene 154 19876
o xylene 432 280021 In total 1177 376617
Table 1 shows that the quantities of aromatic hydrocarbons reach the value of 376 gr/l on average in cracking in combined material flow, which indicates a serious qualitative improvement in relation to the purely biomass raw material. CONCLUSIONS The results absolutely support the advantage of process in combined material flow over the cracking purely maze stack as the quantity of valuable liquid product jumped significantly, by 33.6 wt% on average. The quantity of carbonised phase and char fraction harmful to the process dropped (on average by 36%). These results are due to the fact that a considerable quantity of hydrogen was released from the thermo-catalytic degradation of PS, which saturates the carbon-chains of the hydrocarbon steams forming from the biomass during the process, in the presence of the catalyst ZSM-5. There was no significant difference for the gas products. Due to its structure, PS can produce a significant amount of aromatic hydrocarbon of liquid state 450°C, which was demonstrated clearly during the measurements as a concentration of 376 gr/l was gathered on average. It is visible based on the measurement results that more valuable and larger quantities of chemical raw material can be produced by thermo-catalytic cracking in combined material flow of maze stalk and PS waste, which can shift in the focus of attention increasingly in future because of diminishing crude oil reserves. References [1.] I. C. Lewis and J. W. Newman, Industrial Aromatic
Chemistry, vol. 27. (1989) [2.] FVM. Vidékfejlesztési, Mezőgazdasági hulladékokból
történő megújuló energia - termelés és felhasználás lehetőségei az agrárium területén, CKSZI/188/2008, Green Capital-4/2008, (2008)
[3.] R. Istvánné Cs. Katalin, Lignocellulózok biofinomítása és konverziója második generációs
üzemanyagalkohollás, MTA doktori értekezés, Budapesti Műszaki és Gazdaságtudományi Egyetem Alkalmazott Biotechnológia és Élelmiszertudományi Tanszék, (2012)
[4.] K. Fairouz, M. Guillain, S. R. Mar, F. Monique, and L. Jacques, Attrition-free pyrolysis to produce bio-oil and char, Bioresour. Technol., vol. 100, no. 23, pp. 6069–6075, (2009)
[5.] a.V. Bridgwater, D. Meier, and D. Radlein, An overview of fast pyrolysis of biomass, Org. Geochem., vol. 30, no. 12, pp. 1479–1493, (1999)
[6.] D. K. Mishra, A. K. Panda and R. K. Singh, Thermolysis of waste plastics to liquid fuel. A suitable method for plastic waste management and manufacture of value added products-A world prospective, Renew. Sustain. Energy Rev., vol. 14, no. 1, pp. 233–248, (2010)
[7.] A. András, Műanyagok újrahasznosítása, Pannon Egyetem, p. 53, (2012)
[8.] M. Blazs´o and E. Jakab, Effect of metals, metal oxides, and carboxylates on the thermal decomposition processes of poly-(vinyl chloride), J. Anal. Appl. Pyrolysis 49, 125 (1999).
copyright ©
University POLITEHNICA Timisoara, Faculty of Engineering Hunedoara,
5, Revolutiei, 331128, Hunedoara, ROMANIA http://acta.fih.upt.ro

© copyright Faculty of Engineering – Hunedoara, University POLITEHNICA Timisoara
ACTA TECHNICA CORVINIENSIS – Bulletin of Engineering Tome X [2017] Fascicule 3 [July – September] ISSN: 2067 – 3809
1.Tihomir G. VASILEV
ANALYSIS OF THE DEFORMATIONS IN „DELTA WIRED 3D PRINTER” 1. Nikola Vaptsarov Naval Academy, Varna, BULGARY Abstract: With the use of 3D printing technology, layer by layer extrusion is possible printing of concrete building objects, but printers represent a large size and mobility limited metal construction. In a new 3D printer construction, called "Delta Wired 3D Printer", the large stress created from bending moments are transformed in normal stress from tension. After we have calculates the loads on individual elements we can determine their dimensions and deformation. The loads are different in any point of workspace coordinate system this creation of different deflections for any point, which will increases dimension errors of printed object. In this paper are theoretically calculated total extruder deflections as a function of tensile in wires, bending in pillars taking into account changes in forces for any coordinate points. Keywords: delta wired 3d printer, printing of building objects, mobile 3d printer, reconstructions of 3d printer
INTRODUCTION By using Cramer’s formulas in article [1] for solving a system of linear equations corresponding to the balance of the mechanical system is achieved by clearly defining efforts in supporting ropes and their change depending on the coordinates of the wires intersection point. These decisions represent the initial data to calculate deformations in the individual elements and total deformation in extruder. The scheme of „Delta Wired 3d Printer” is represented in Figure1.
Figure 1. Conceptual design of
"delta 3D wired printer" [2]
BODY OF THE PAPER In order to determine the deflection of the extruder it is necessary to consider the following calculation scheme, shown in Figure 2. With next equations we can determine of distortion bending in pillars [3], where:
I.E.3
d).cos(.Q.K
I.E.3
d).cos(.Fala
3aZFa
3aZ
bendα
=α
=∆ ;
I.E.3
d).cos(.Q.K
I.E.3
d).cos(.Fblb
3bZFb
3bZ
bend.β
=β
=∆ ;
I.E.3
d).cos(.Q.K
I.E.3
d).cos(.Fclc
3cZFc
3cZ
bendγ
=γ
=∆ ; (1)
where: E – modulus of elasticity for pillars material, Pa; I –moment of inertia for cross section of pillars, m4; Fa, Fb and Fc – tensile force in wires A, B and C, N; Q – weight of extruder, kgf; KFa, KFb and KFc – coefficients define force value; αZ, βZ and γZ – angles between horizontal plane and wires, deg;

ACTA TECHNICA CORVINIENSIS – Bulletin of Engineering
94 | F a s c i c u l e 3
Figure 2. Estimated scheme for determining the
deformations of one of the bearing clones ∆la bend – distortion by bending pillar А, m; ∆la bend’ –
deflection of extruder from bending of pillar А, m; ∆la comp – deformation of compression in pillarА, m; Δla tens.w
– deformation from tensile in wire of pillar A, m; la – length of wire in clone А, m; Δla – total deflection of
extruder, m; da – height of pillar A, m. For determination of tensile deformation in wires are used the following equations [4]:
ww
Fa
wwtens.w A.E
la.Q.K
A.E
la.Fala ==∆ ;
ww
Fb
wwtens.w A.E
lb.Q.K
A.E
lb.Fblb ==∆ ;
ww
Fc
www tens. A.E
lc.Q.K
A.E
lc.Fclc ==∆ (2)
where: Ew – Modulus of elasticity for wires material, Pa; Aw – Cross section area for wires, m2; By analogy to deformations of compression in the pillars can write:
p
aZFa
p
aZcomp A.E
d).sin(.Q.K
A.E
d).sin(.Fala
α=
α=∆ ;
p
bZFb
p
bZcomp A.E
d).sin(.Q.K
A.E
d).sin(.Fblb
β=
β=∆ ;
p
cZFc
p
cZcomp A.E
d).sin(.Q.K
A.E
d).sin(.Fclc
γ=
γ=∆ ; (3)
where: Ap – Cross section area for pillars, m2; If we consider the two right triangles in Figure 2 and using the geometric relationships leads to the equation that for clone A was as follows:
)sin(.la
) la)cos(.la()lala(
'l
Z
2bendZ
2tens.w
bend
α−
∆−α−∆+
=∆ а
(4)
To the resulting deformation taking into account the deflection in pillars and tension in the wire may be added the deformation of compression in pillar, equation for full deformation in clone A that will occur as a result of the force Fa is:
compZ
2bendZ
2tens.w
compbend
la)sin(.la
) la)cos(.la()lala(
la 'lla
∆+α−
∆−α−∆+
=∆+∆=∆ а
(5)
For clones B and C the equations are:
compZ
2bendZ
2tens.w
compbend
lb)sin(.lb
)lb)cos(.lb()lblb(
lb'lblb
∆+β−
∆−β−∆+
=∆+∆=∆
(6)
compZ
2bendZ
2tens.w
compbend
lc)sin(.lc
)lc)cos(.lc()lclc(
lc'lclc
∆+γ−
∆−γ−∆+
=∆+∆=∆
(7)
For total deformation obtained as a result of the forces in the three different clones using the principle of superposition can be written:
cΔlΔlbΔlaΔl ++= (8)
To make the moment of inertia of the cross section of the pillars same for each direction of bending is required, it is a circle or tube wherein:
» for tube: const64
)dD(II
4p
4p
pypx =−π
== ;
» for round section: const32
DII
4p
pypx =π
== ;
In addition is necessary the cross-sections of the pillars must be uniform along the entire length of the tube to be valid relationship for determining the bending deformation. The values of the modulus of elasticity and the cross sections of the wires and the pillars are also constants, which results in the following functional equation of the full deflection of the deflection of the load:
);df(lc;Fc;);df(lb;Fb;);df(la;Fa;α
ΔlcΔlbΔlaΔl
cZbZaZ γ+β+=++= (9)
where for Δla, Δlb and Δlc we can write:
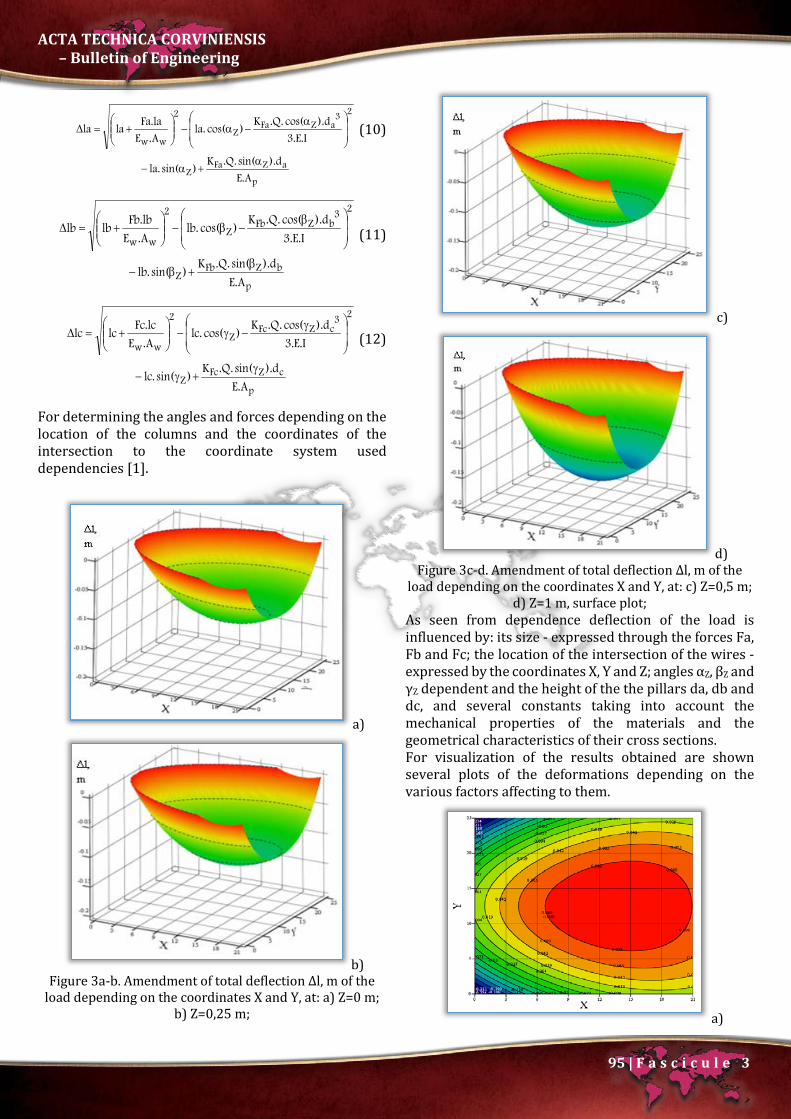
ACTA TECHNICA CORVINIENSIS – Bulletin of Engineering
95 | F a s c i c u l e 3
p
aZFaZ
23aZFa
Z
2
ww
A.E
d).sin(.Q.K)sin(.la
I.E.3
d).cos(.Q.K)cos(.la
A.E
la.Falala
α+α−
α−α−
+=∆ (10)
p
bZFbZ
23bZFb
Z
2
ww
A.E
d).sin(.Q.K)sin(.lb
I.E.3
d).cos(.Q.K)cos(.lb
A.E
lb.Fblblb
β+β−
β−β−
+=∆ (11)
p
cZFcZ
23cZFc
Z
2
ww
A.E
d).sin(.Q.K)sin(.lc
I.E.3
d).cos(.Q.K)cos(.lc
A.E
lc.Fclclc
γ+γ−
γ−γ−
+=∆ (12)
For determining the angles and forces depending on the location of the columns and the coordinates of the intersection to the coordinate system used dependencies [1].
a)
b) Figure 3a-b. Amendment of total deflection ∆l, m of the
load depending on the coordinates X and Y, at: a) Z=0 m; b) Z=0,25 m;
c)
d) Figure 3c-d. Amendment of total deflection ∆l, m of the
load depending on the coordinates X and Y, at: c) Z=0,5 m; d) Z=1 m, surface plot;
As seen from dependence deflection of the load is influenced by: its size - expressed through the forces Fa, Fb and Fc; the location of the intersection of the wires - expressed by the coordinates X, Y and Z; angles αZ, βZ and γZ dependent and the height of the the pillars da, db and dc, and several constants taking into account the mechanical properties of the materials and the geometrical characteristics of their cross sections. For visualization of the results obtained are shown several plots of the deformations depending on the various factors affecting to them.
a)

ACTA TECHNICA CORVINIENSIS – Bulletin of Engineering
96 | F a s c i c u l e 3
b)
c)
d) Figure 4. Amendment of total deflection ∆l, m of the load
depending on the coordinates X and Y, at: a) Z=0 m; b) Z=0,25 m; c) Z=0,5 m; d) Z=1 m, contour plot;
a)
b)
c)
d)
e)

ACTA TECHNICA CORVINIENSIS – Bulletin of Engineering
97 | F a s c i c u l e 3
f)
g)
h) Figure 5. Amendment of total deflection ∆l, m of the load depending on the coordinates X and Y, at wires diameter:
a-b) dw=10 mm; c-d) dw=20 mm; e-f) dw=30 mm; g-h) dw=40 mm, surface and contour plot;
a)
b)
c)
d)

ACTA TECHNICA CORVINIENSIS – Bulletin of Engineering
98 | F a s c i c u l e 3
e)
f) Figure 6. Amendment of total deflection ∆l, m of the load depending on the coordinates X and Y, at pillars moment of inertia Ipx = Ipx: a-b) 3000 mm4; c-d) 6000
mm4; e-f) 9000 mm4, surface and contour plot; CONCLUSIONS From the analysis of the results can be made the following important findings and conclusions: ― The deflection of the load (extruder) depends on:
the structural parameters of the individual elements – height of the pillars; the material of wires and the pillars; geometrical characteristics of the cross sections of the wires and the pillars; coordinates of the intersection between the three wires of working space;
― The increase of the diameter of the supporting rope (wires) reduces the deflection of the load visible in Figure 5;
― The increasing of moment of inertia for the pillars cross section of leads to a reduction of deflection of the extruder Figure 6;
― For increasing the coordinate Z (the distance between the intersection point between wires and the horizontal plane) have increasing deflection of load;
― If the intersection point of the wires moves by contour graphics trajectory in the workspace showing of Figure 3 to the Figure 6, deflection will be equally. The extruder will move in one plane in the event that the weight of the load Q is constant.
For future studies should be determined the weight of the extruder, weight required for a transition mixture which will form the design calculation of the diameter of the wires and the size of the pillars. References [1.] Vasilev, T., Sabeva V., Ivanova, E., Distribution Of
Force Load In Wires Of „Delta Wired 3D Printer”, Mechanics, Transport, Communications - Academic Journal, 1/2017, p. VII.1-VII.6
[2.] Vasilev, T., Optimization of Construction of 3D Printer For Building Objects, Mechanical Engineering & Science, Year XII, 1, 2017, p.105-109
[3.] Budynas, R. G., Nisbett,J. K., Shigley's Mechanical Engineering Design, Ninth Edition, Budynas Nisbett, 2008
[4.] Shigley, J. E.,Mischke, C. R., standard handbook of machine design, Second Edition, McGraw-Hill, 1996
[5.] Milcov, V., Съпротивление на материалите (теория, задачи и софтуер), Второ коригирано и актуализирано издание, Технически университет – Varna, 2008, 201 с.
copyright ©
University POLITEHNICA Timisoara, Faculty of Engineering Hunedoara,
5, Revolutiei, 331128, Hunedoara, ROMANIA http://acta.fih.upt.ro

© copyright Faculty of Engineering – Hunedoara, University POLITEHNICA Timisoara
ACTA TECHNICA CORVINIENSIS – Bulletin of Engineering Tome X [2017] Fascicule 3 [July – September] ISSN: 2067 – 3809
1, 2 Fatai O. ARAMIDE, 1. Idris B. AKINTUNDE
EFFECTS OF SILICON CARBIDE AND SINTERING TEMPERATURE ON THE PROPERTIES OF SINTERED MULLITE-CARBON COMPOSITE SYNTHESIZED FROM OKPELLA KAOLIN 1. Department of Metallurgical and Materials Engineering, Federal University of Technology, Akure, NIGERIA 2. African Materials Science and Engineering Network, (AMSEN) a Subsidiary of Regional Initiative for Science Education (RISE) Abstract: The effects of the addition of silicon carbide and sintering temperatures on the physical and mechanical properties of sintered ceramic composite produced from kaolin and graphite was investigated. The kaolin and graphite of known mineralogical composition were thoroughly blended with 4 and 8 (vol.) % silicon carbide. From the homogeneous mixture of kaolin, graphite and silicon carbide, standard samples were prepared via uniaxial compaction. The test samples produced were subjected to firing (sintering) at 1300˚C, 1400˚C and 1500˚C. It was observed that increase in sintering temperature beyond 1400°C generally lead to reduced porosity of the samples; high contents of silicon carbide especially at temperature from and above 1400°C lead to higher porosity; cold crushing strength of samples with 4% SiC is seen to be better than those of samples with 8% SiC within sintering the temperature range of 1400°C and 1500°C; modulus of elasticity of both samples reached the maxima values at 1400°C but those of samples with 8% SiC is seen to be higher within the sintering temperature range of 1400°C and 1500°C; absorbed energy of both samples generally increased with increased sintering temperature; oxidation indices for both samples reach the maxima at the temperature of 1400°C but the resistance to oxidation is better for samples with 4% SiC within the sintering temperature range of 1400°C and 1500°C. It was concluded that samples with 4% SiC at the sintering temperature of 1400°C exhibit better property and is considered to be optimum. Keywords: silicon carbide; mullite; graphite; sintering temperatures; phases INTRODUCTION Mullite is an important aluminum silicate ceramics; it is the only stable intermediate specie in the system SiO2-Al2O3, which has the composition of 3Al2O3.2SiO2, corresponding to 71.8wt%. Its importance in technology together with its rareness in nature necessitates its synthesis. (Schneider et al. 2008; Schneider & Komarneni, 2005, Vieira et al. 2007) [1-3]. Many researchers have worked on mullite based ceramic composite. Aramide et al. (2014) [4] reported on high temperature synthesis of zircon-mullite-zirconia refractory ceramic composite from clay based materials. They synthesized mullite within the matrix of zirconia using kaolinitic clay sourced from southwest Nigeria.
The zircon component of the ceramic composite was formed through solid state reaction of silica content of the clay/excess silica from the process of mullitization. Moreover, Aramide et al. (2015) [5] reported on the in-situ synthesis of mullite fibers reinforced zircon-zirconia refractory ceramic composite from clay based materials. They investigated the effects of yttria and niobium oxide on the phase changes and mechanical properties of the samples they worked on. They concluded that the improved mechanical property of their samples was due to strengthening by both mullite fibers reinforcement and phase transformation strengthening. Other researchers have also worked elaborately and reported their findings on mullite based/reinforced ceramic composites [6-8].

ACTA TECHNICA CORVINIENSIS – Bulletin of Engineering
100 | F a s c i c u l e 3
Zum Gahr [9] reported that if the microstructure is modified it could lead to reduction of the friction and the wear of alumina. Moreover, in 1996, he showed that by reducing the grain size of alumina and zirconia it will significantly decrease the wear [10]. Furthermore Dong et al [11], reported on the effects of additives like MgO, SiO2, Fe2O3 and ZrO2 on the mechanical and thermal properties of aluminum titanate ceramics. They concluded that the combined additives of MgO and Fe2O3 have an excellent improvement on the stability of aluminum titanate. Ebadzadeh and Ghasemi [12], reported that the addition of TiO2 to mullite-ZrO2 composites results into change of reaction sintering, densification and microstructure which alter the formation temperature and retention of t-ZrO2 phase in these composites. Moya et al. [13] also reported that the microstructure of mullite-zirconia and alumina-zirconia composites can be modified by additives like CaO and MgO. Aramide et al. [14] had synthesized mullite-carbon composite from the same materials without any additive. The objective of the present work is to examine the effects of sintering temperature and addition of silicon carbide on the phase evolutions of ceramic composite produced from kaolin and graphite. MATERIALS AND METHODS » Raw Materials Clay sample used for this study (as mine Kaolin sample) was sourced from Okpella, Edo State southern part of Nigeria, Graphite and silicon carbide (SiC) were sourced from (Pascal Chemicals, Akure), this were used to maintain the granulometry of the mixture. » Method Processing of raw materials (Graphite & Kaolin) The raw materials (graphite and kaolin) were crushed into a coarse particle size, of about 10 mm for graphite and less than 2mm for kaolin; the crushed samples were further reduced by grinding using Herzog rod mill. The powdered samples were sieved using 600μm sizes aperture according to ASTM standards in an electric sieve shaker. The undersize that passed through the 600μm sieve aperture were used in the samples making. Phase and Mineralogical Composition of Raw
kaolin and Graphite Electrode The kaolin clay and graphite samples were carefully prepared for these analyses by digesting in reagents as described by Nabil and Barbara, (2012)[15]. The mineralogical phases present in the samples were determined using X-ray diffractometry (XRD). The phases are reported in Table 1. » Experimental Procedure Composition calculation using the Rule of
Mixtures Technique Rule of Mixtures is a method of approach to approximate estimation of composite material properties, based on
an assumption that a composite property is the volume weighed average of the phases (matrix and dispersed phase). According to Rule of Mixtures [Surappa, (2003)][15] the density of composite materials are estimated as follows:
ρmixture = Wtf kaolin × ρ kaolin + Wtf.graphite × ρgraphite (1)
Mmixture = ρmixture × vol. mould. (2)
Where: ρmixture represent density of the mixture, Mmixture is the mass of the mixture, Wtf. kaolin is the weight fraction of kaolin, ρkaolin is the density of kaolin, Wtf.graphite is the weight fraction of graphite, ρgraphite is the density of graphite and vol.mould is volume of mould. Composites Production The raw materials in the samples making were 3:2 vol. % of kaolin and graphite respectively with the addition of 4 and 8 (vol.) % silicon carbide respectively. The mixture were blended thoroughly for proper distribution of constituents materials in a ball mill for 3 hours at a speed of 72 rev/min after weighing via electronic weighing balance in accordance with the composition calculation initially prepared [Aramide et al. (2014); Aramide, (2015)][17, 18]. The resulting blended compositions were mixed with 10% water of kaolin content in each composition; this was in order to enhance the plasticity of the mixture during compaction. The mixed samples were subjected to uniaxial compaction, which was carried out mechanically under pressure. The moulded materials were fired at varying temperatures (1300˚C, 1400˚C and 1500˚C). After which the samples were subjected to various test, to examine the phase analysis, evaluate their physical and mechanical properties. » Testing Shrinkage Measurement The shrinkage properties of the pressed samples were determined by measuring both the green and fired dimensions, using a digital vernier caliper. The thickness and diameters were measured for evaluation and computation of the shrinkage [Aramide, (2015)][18].
% linear shrinkage = (Lg−Lf)(Lg)
x 100 (3)
% volumetric shrinkage = (Vg−Vf)(Vg)
x 100 (4)
where: Lg represent the green length and Lf represent the fired length; Vg represent the green volume and Vf represent the fired Volume Apparent porosity (AP) Test samples from each of the ceramic composite samples were dried out for 12 hours at 110˚C. The dry weight of each fired sample was taken and recorded as D. Each sample was immersed in water for 6 hours to
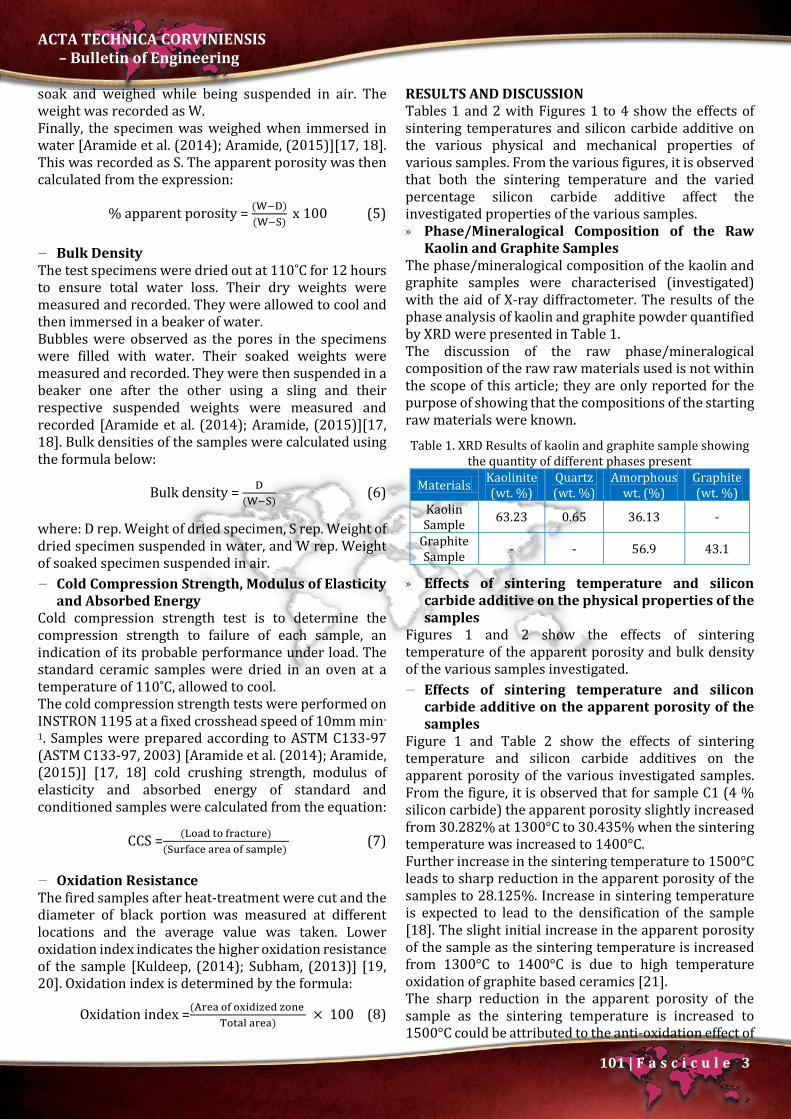
ACTA TECHNICA CORVINIENSIS – Bulletin of Engineering
101 | F a s c i c u l e 3
soak and weighed while being suspended in air. The weight was recorded as W. Finally, the specimen was weighed when immersed in water [Aramide et al. (2014); Aramide, (2015)][17, 18]. This was recorded as S. The apparent porosity was then calculated from the expression:
% apparent porosity = (W−D)(W−S)
x 100 (5)
Bulk Density The test specimens were dried out at 110˚C for 12 hours to ensure total water loss. Their dry weights were measured and recorded. They were allowed to cool and then immersed in a beaker of water. Bubbles were observed as the pores in the specimens were filled with water. Their soaked weights were measured and recorded. They were then suspended in a beaker one after the other using a sling and their respective suspended weights were measured and recorded [Aramide et al. (2014); Aramide, (2015)][17, 18]. Bulk densities of the samples were calculated using the formula below:
Bulk density = D(W−S)
(6)
where: D rep. Weight of dried specimen, S rep. Weight of dried specimen suspended in water, and W rep. Weight of soaked specimen suspended in air. Cold Compression Strength, Modulus of Elasticity
and Absorbed Energy Cold compression strength test is to determine the compression strength to failure of each sample, an indication of its probable performance under load. The standard ceramic samples were dried in an oven at a temperature of 110˚C, allowed to cool. The cold compression strength tests were performed on INSTRON 1195 at a fixed crosshead speed of 10mm min-
1. Samples were prepared according to ASTM C133-97 (ASTM C133-97, 2003) [Aramide et al. (2014); Aramide, (2015)] [17, 18] cold crushing strength, modulus of elasticity and absorbed energy of standard and conditioned samples were calculated from the equation:
CCS = (Load to fracture)(Surface area of sample)
(7)
Oxidation Resistance The fired samples after heat-treatment were cut and the diameter of black portion was measured at different locations and the average value was taken. Lower oxidation index indicates the higher oxidation resistance of the sample [Kuldeep, (2014); Subham, (2013)] [19, 20]. Oxidation index is determined by the formula:
Oxidation index =(Area of oxidized zone Total area)
× 100 (8)
RESULTS AND DISCUSSION Tables 1 and 2 with Figures 1 to 4 show the effects of sintering temperatures and silicon carbide additive on the various physical and mechanical properties of various samples. From the various figures, it is observed that both the sintering temperature and the varied percentage silicon carbide additive affect the investigated properties of the various samples. » Phase/Mineralogical Composition of the Raw
Kaolin and Graphite Samples The phase/mineralogical composition of the kaolin and graphite samples were characterised (investigated) with the aid of X-ray diffractometer. The results of the phase analysis of kaolin and graphite powder quantified by XRD were presented in Table 1. The discussion of the raw phase/mineralogical composition of the raw raw materials used is not within the scope of this article; they are only reported for the purpose of showing that the compositions of the starting raw materials were known.
Table 1. XRD Results of kaolin and graphite sample showing the quantity of different phases present
Materials Kaolinite (wt. %)
Quartz (wt. %)
Amorphous wt. (%)
Graphite (wt. %)
Kaolin Sample 63.23 0.65 36.13 -
Graphite Sample - - 56.9 43.1
» Effects of sintering temperature and silicon carbide additive on the physical properties of the samples
Figures 1 and 2 show the effects of sintering temperature of the apparent porosity and bulk density of the various samples investigated. Effects of sintering temperature and silicon
carbide additive on the apparent porosity of the samples
Figure 1 and Table 2 show the effects of sintering temperature and silicon carbide additives on the apparent porosity of the various investigated samples. From the figure, it is observed that for sample C1 (4 % silicon carbide) the apparent porosity slightly increased from 30.282% at 1300°C to 30.435% when the sintering temperature was increased to 1400°C. Further increase in the sintering temperature to 1500°C leads to sharp reduction in the apparent porosity of the samples to 28.125%. Increase in sintering temperature is expected to lead to the densification of the sample [18]. The slight initial increase in the apparent porosity of the sample as the sintering temperature is increased from 1300°C to 1400°C is due to high temperature oxidation of graphite based ceramics [21]. The sharp reduction in the apparent porosity of the sample as the sintering temperature is increased to 1500°C could be attributed to the anti-oxidation effect of
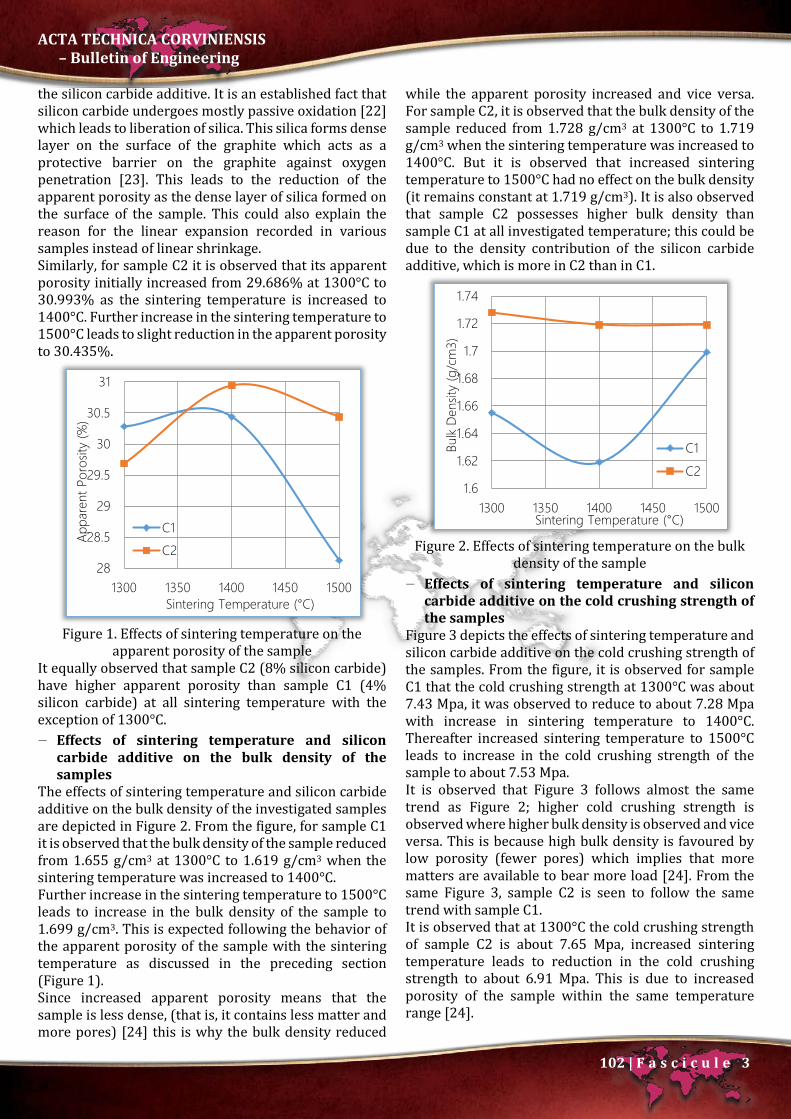
ACTA TECHNICA CORVINIENSIS – Bulletin of Engineering
102 | F a s c i c u l e 3
the silicon carbide additive. It is an established fact that silicon carbide undergoes mostly passive oxidation [22] which leads to liberation of silica. This silica forms dense layer on the surface of the graphite which acts as a protective barrier on the graphite against oxygen penetration [23]. This leads to the reduction of the apparent porosity as the dense layer of silica formed on the surface of the sample. This could also explain the reason for the linear expansion recorded in various samples instead of linear shrinkage. Similarly, for sample C2 it is observed that its apparent porosity initially increased from 29.686% at 1300°C to 30.993% as the sintering temperature is increased to 1400°C. Further increase in the sintering temperature to 1500°C leads to slight reduction in the apparent porosity to 30.435%.
Figure 1. Effects of sintering temperature on the
apparent porosity of the sample It equally observed that sample C2 (8% silicon carbide) have higher apparent porosity than sample C1 (4% silicon carbide) at all sintering temperature with the exception of 1300°C. Effects of sintering temperature and silicon
carbide additive on the bulk density of the samples
The effects of sintering temperature and silicon carbide additive on the bulk density of the investigated samples are depicted in Figure 2. From the figure, for sample C1 it is observed that the bulk density of the sample reduced from 1.655 g/cm3 at 1300°C to 1.619 g/cm3 when the sintering temperature was increased to 1400°C. Further increase in the sintering temperature to 1500°C leads to increase in the bulk density of the sample to 1.699 g/cm3. This is expected following the behavior of the apparent porosity of the sample with the sintering temperature as discussed in the preceding section (Figure 1). Since increased apparent porosity means that the sample is less dense, (that is, it contains less matter and more pores) [24] this is why the bulk density reduced
while the apparent porosity increased and vice versa. For sample C2, it is observed that the bulk density of the sample reduced from 1.728 g/cm3 at 1300°C to 1.719 g/cm3 when the sintering temperature was increased to 1400°C. But it is observed that increased sintering temperature to 1500°C had no effect on the bulk density (it remains constant at 1.719 g/cm3). It is also observed that sample C2 possesses higher bulk density than sample C1 at all investigated temperature; this could be due to the density contribution of the silicon carbide additive, which is more in C2 than in C1.
Figure 2. Effects of sintering temperature on the bulk
density of the sample Effects of sintering temperature and silicon
carbide additive on the cold crushing strength of the samples
Figure 3 depicts the effects of sintering temperature and silicon carbide additive on the cold crushing strength of the samples. From the figure, it is observed for sample C1 that the cold crushing strength at 1300°C was about 7.43 Mpa, it was observed to reduce to about 7.28 Mpa with increase in sintering temperature to 1400°C. Thereafter increased sintering temperature to 1500°C leads to increase in the cold crushing strength of the sample to about 7.53 Mpa. It is observed that Figure 3 follows almost the same trend as Figure 2; higher cold crushing strength is observed where higher bulk density is observed and vice versa. This is because high bulk density is favoured by low porosity (fewer pores) which implies that more matters are available to bear more load [24]. From the same Figure 3, sample C2 is seen to follow the same trend with sample C1. It is observed that at 1300°C the cold crushing strength of sample C2 is about 7.65 Mpa, increased sintering temperature leads to reduction in the cold crushing strength to about 6.91 Mpa. This is due to increased porosity of the sample within the same temperature range [24].
28
28.5
29
29.5
30
30.5
31
1300 1350 1400 1450 1500
Appa
rent
Por
osity
(%)
Sintering Temperature (°C)
C1C2
1.6
1.62
1.64
1.66
1.68
1.7
1.72
1.74
1300 1350 1400 1450 1500
Bulk
Dens
ity (g
/cm
3)
Sintering Temperature (°C)
C1C2

ACTA TECHNICA CORVINIENSIS – Bulletin of Engineering
103 | F a s c i c u l e 3
Figure 3. Effects of sintering temperature on the cold
crushing strength of the samples Effects of sintering temperature and silicon
carbide additive on the modulus of elasticity of the samples
Figure 4 shows the effects of sintering temperature and silicon carbide additive on the Young’s modulus of elasticity of the investigated samples.
Figure 4. Effects of sintering temperature on the
Young’s modulus of elasticity of the samples From the figure, it is observed that for sample C1 the modulus of elasticity of the sample initially at 1300°C is about 11.04 Mpa, it increased to about 11.81 Mpa (at 1400°C) with increased sintering temperature. The modulus of elasticity is observed to reduce to about 8.19 Mpa with further increased sintering temperature to 1500°C. Sample C2 is observed to follow the same trend with sample C1. The modulus of elasticity of sample C2 at 1300°C was initially observed to be about 10.22 Mpa, it then increased to about 13.87 Mpa as the sintering temperature was increased to 1400°C. It is the observed to reduce to about 10.12 Mpa as the sintering temperature was further increased to 1500°C. Similar trend has been earlier reported by other researchers
[25, 26] where it was reported that graphite does not improve the rigidity of refractory ceramic. Effects of sintering temperature and silicon
carbide additive on the absorbed energy of the samples
Figure 5 depicts the effects of sintering temperature and silicon carbide additive on the absorbed energy of the investigated samples.
Figure 5. Effects of sintering temperature on the
absorbed energy of the samples From the figure, it is observed for sample C1 that the absorbed energy at 1300°C was about 5.65 J, this is seen to reduce slightly to about 5.61 J as the sintering temperature was increased to 1400°C; further increase in the sintering temperature to 1500°C leads to increase in the absorbed energy of the sample to about 6.38 J. Furthermore, it is observed from the figure that for sample C2, the absorbed energy’s behavior with sintering temperature follows the same trend with that of sample C1 as earlier discussed. Both samples having minima values for absorbed energy at 1400°C (as it was the case for both bulk density and cold crushing strength). Comparing this with Figure 1, it is observed that both samples C1 and C2 have their maxima values for apparent porosity at 1400°C. It is also observed that the absorbed energy of the sample C2 is greater than that of the sample C1 at all sintering temperatures. Effects of sintering temperature and silicon
carbide additive on the linear expansion of the samples
The effect of sintering temperature and silicon carbide additive on the linear expansion of the investigated samples is depicted in Figure 6. It is observed for both samples C1 and C2 that the linear expansion increased from its lowest (for each of the investigated samples) at 1300°C to its maximum at 1400°C. It then reduced slightly with further increase in the sintering temperature to 1500°C. What is commonly observed in most ceramic is linear shrinkage, but contrary to the
6.86.9
77.17.27.37.47.57.67.7
1300 1350 1400 1450 1500
Cod
Crus
hing
Stre
ngth
(Mpa
)
Sintering Temperature (°C)
C1C2
8
9
10
11
12
13
14
1300 1350 1400 1450 1500
Mod
ulus
of E
lastic
ity (M
pa)
Sintering Temperature (°C)
C1
C2
5.4
5.6
5.8
6
6.2
6.4
6.6
1300 1350 1400 1450 1500Ab
sorb
ed E
nerg
y (J)
Sintering Temperature (°C)
C1C2

ACTA TECHNICA CORVINIENSIS – Bulletin of Engineering
104 | F a s c i c u l e 3
common linear shrinkage in the investigated samples, what is observed is linear expansion. This is due to the excess silica liberated during the process of mullitization on one hand, and the liberation of silica by the ‘passive oxidation’ of silicon carbide on the samples. The silica forms dense layer on the surface of the samples which increased the length (diameter) of the samples [22]. It will be observed that the linear expansion values for sample C2 at 1300°C and 1400°C were greater than those of sample C1 at the same sintering temperature. This is because sample C2 contains 8 vol % of silicon carbide while sample C1 contains 4 vol % silicon carbide. On the contrary the linear expansion value of sample C1 at 1500°C is greater than that of sample C2. It equally observed that maxima linear expansion values both samples C1 and C2 are at 1400°C.
Figure 6. Effects of sintering temperature on the linear
expansion on the samples Effects of sintering temperature and silicon
carbide additive on the volumetric shrinkage of the samples
Figure 7 clearly depicts the effects of sintering temperature and silicon carbide on the volumetric shrinkage of the samples. From the figure it is observed that the volumetric shrinkages of both samples C1 and C2 initially reduced as the sintering temperature increased from 1300°C to 1400°C, reached the minima values at 1400°C and then increased with further increase in the sintering temperature to 1500°C. It is not a coincidence that both the minima volumetric shrinkage values and the maxima linear expansion values of both samples were observed at 1400°C. The silica that was liberated on the samples that lead to linear expansion was generated in situ and since matter can neither be created nor be destroyed, but can be transformed from one form to another. This means that the samples expand in two directions while they shrink in the third direction. This is why the volumetric shrinkage is observed in the samples.
Figure 7. Effects of sintering temperature on the
volumetric shrinkage of the samples
Figure 8. Effects of sintering temperature on the
oxidation indices of the samples Effects of sintering temperature and silicon
carbide additive on the oxidation indices of the samples
Figure 8 shows the effects of sintering temperature and silicon carbide additive on the oxidation indices of the samples. From the Figure, it is observed that the oxidation indices of the samples initially increased with increase in the sintering temperature from 1300°C to 1400°C. The oxidation index reached its maximum at 1400°C, further increase in the sintering temperature to 1500°C resulted into reduction in the oxidation indices for both samples C1 and C2. It has been earlier discussed that the reduction in the porosity of the samples as the sintering temperature is increased from 1400°C to 1500°C was due to the deposition of silica on the surface of the samples when silicon carbide was oxidized to form silica and carbon (graphite) [22, 23]. The silica formed filled up some of the pores. This shows that the silicon carbide acts as anti-oxidant for the graphite contents of the samples.
1.1
1.3
1.5
1.7
1.9
2.1
2.3
2.5
1300 1350 1400 1450 1500
Linea
r Exp
ansio
n (%
)
Sintering Temperature (°C)
C1C2
1
1.5
2
2.5
3
3.5
1300 1350 1400 1450 1500
Volu
met
ric S
hrin
kage
(%)
Sintering Temperature (°C)
C1
C2
17.818
18.218.418.618.8
1919.219.419.6
1300 1350 1400 1450 1500
Oxid
atio
n In
dex
(%)
Sintering Temperature (°C)
C1
C2

ACTA TECHNICA CORVINIENSIS – Bulletin of Engineering
105 | F a s c i c u l e 3
CONCLUSIONS From the discussion of the data generated it is concluded that; » increase in sintering temperature beyond 1400°C
generally lead to reduced porosity of the samples; » high contents of silicon carbide especially at
temperature from and above 1400°C lead to higher porosity;
» high contents of silicon carbide lead to production of dense samples;
» cold crushing strength of sample C1 (4% SiC) is seen to be better than those of sample C2 (8% SiC) within sintering the temperature range of 1400°C and 1500°C;
» modulus of elasticity of both samples reached the maxima values at 1400°C but those of sample C2 (8% SiC) is to be higher within the sintering temperature range of 1400°C and 1500°C;
» absorbed energy of both samples generally increased with increased sintering temperature;
» oxidation indices for both samples reach the maxima at the temperature of 1400°C but the resistance to oxidation is better for sample C1 (4% SiC) within the sintering temperature range of 1400°C and 1500°C;
» sample C1 (4% SiC) at the sintering temperature of 1400°C is considered to exhibit better property and is considered to be optimum.
Acknowledgments The authors acknowledge the Science Initiative Group (SIG), based at the Institute for Advanced Study in Princeton, for the support of this research work through the Competitive Fund for RISE Graduates Phase I (Round 1 and 3). Without this fund, it would have been extremely difficult to achieve the objectives of this research work. Reference [1.] Schneider H., Komanerni S. (2005) Mullite. Federal
Republic of Germany. [2.] chneider H., Schreuer J., Hildmann B. Structure and
properties of mullite – A review, Journal European Ceramic Society, 2008, 28, 329-344.
[3.] Vieira S.C., Ramos A.S., Vieira M.T. Mullitization kinetics from silica and alumina-rich wastes. Ceramic international, 2007, 33, 59-66.
[4.] Aramide F.O., Alaneme K.K., Olubambi P.A., Borode J.O., High Temperature Synthesis of Zircon-Mullite-Zirconia Refractory Ceramic Composite from Clay Based Materials, in Volume 5 - Composite, Ceramic, Quasi-crystals, Nanomaterials & Coatings: 2014 – Sustainable Industrial Processing Summit & Exhibition/Shechtman International Symposium, held from 29 June - 04 July 2014, Fiesta Americana Condesa Cancun All Inclusive Resort, Cancun, Mexico, 2014, 155-176
[5.] Aramide F. O., Alaneme K. K., Olubambi P. A., Borode J. O., In-Situ Synthesis of Mullite Fibers Reinforced Zircon-Zirconia Refractory Ceramic Composite from
Clay Based Materials, International Journal of Materials and Chemistry 2015; 5(6); 127-139.
[6.] Wen-Chang J. Wei, H. C. KaO and M. H. Lo, "Phase Transformation and Grain Coarsening of Zirconia-Mullite Composites" J. Europ. Ceram. Soc., 1996, 16, 239-247.
[7.] Maitra S., Pal S., Nath S, Pandey A., and Lodha R., "Role of MgO and Cr2O3 Additives on the Properties of Zirconia-Mullite Composites" Ceramics International, 2002, 28, 819-826.
[8.] Claussen N. and Ruhle M. "Design of Transformation-Toughned Ceramics" In. Science and Technology of Zirconia III, Advances in Ceramics, vol. 24, American Ceramics Society, OH, 1988, 137.
[9.] Zum Gahr, K.-H. Effect of grain size on friction and sliding wear of oxide ceramics, Wear 162–164, (1993) 269–279.
[10.] Zum Gahr, K.-H. Modeling and microstructural modification of alumina ceramic for improved tribological properties, Wear 200 (1996) 215–224.
[11.] Dong Xiu-zhen, Wang Yi-ming, Li Yue. Additives’ effect on aluminium titanate ceramics [J]. China Ceramics, 2008, 44(1): 7−10.
[12.] Ebadzadeh, T. and Ghasemi, E. Effect of TiO2 addition on the stability of t-ZrO2 in mullite-ZrO2 composites prepared from various starting materials, Ceramics International, 2002, 28, 447–450.
[13.] Moya, J.S; Miranzo, P. and Osendi, M.I. Influence of additives on the microstructural development of mullite-ZrO2 and alumina-ZrO2, Materials Science and Engineering, 1989, AI09, 139-145.
[14.] Aramide F.O., Akintunde I.B., Oyetunji A.,. Insitu Synthesis and Characterization of Mullite-Carbon Refractory Ceramic Composite from Okpella Kaolin and Graphite, Usak University Journal of Material Sciences, 2016, 25-42
[15.] Nabil, R. B. and Barbara, Z., Sample Preparation for Atomic Spectrometric Analysis: An overview. Advances in Applied science research, 2012; 3 (3); 1733-1737
[16.] Surappa, M.K., Aluminium Matrix Composites: Challenges and Opportunities; Sadhana, 28, Parts 1 & 2, 2003; 319-334.
[17.] Aramide F.O., Alaneme K.K., Olubambi P.A., Borode J.O., Effects of 0.2Y-9.8ZrO2 Addition on the Mechanical Properties and Phase Development of Sintered Ceramic Produced from Ipetumodu Clay, ANNALS of Faculty Engineering Hunedoara – International Journal of Engineering, 2014; 7(4); 343-352.
[18.] Aramide, F. O., Effects of sintering temperature on the phase developments and mechanical properties ifon clay. Leonardo Journal of Sciences 2015; Issue 26; 67-82.
[19.] Singh, K., Specially Treated Graphite Fortified Alumina-Silicon Carbide-Carbon Refractories: Fabrication and Properties, Master of Technology

ACTA TECHNICA CORVINIENSIS – Bulletin of Engineering
106 | F a s c i c u l e 3
Thesis, Department of Ceramic Engineering National Institute of technology Rourkela, 2014; 17-40.
[20.] Mahato, S., Expanded graphite fortified magnesia-carbon refractories: fabrication and Properties, Master of Technology Thesis, Department of Ceramic Engineering National Institute of technology Rourkela, 2013; 11-24.
[21.] Zhang H.Y., Wang H.Q., Chen G.H., A New Kind of Conducting Filler- Graphite Nano sheets, Plastics, 2006; 35(4): 42-50.
[22.] Roy J., Chandra S., Das S., Maitra S., Oxidation Behaviour of Silicon Carbide- A Review, Rev. Adv. Mater. Sci. 2014; 38, 29-39.
[23.] Auweter-Kurtz M., Hilfer G., Habiger H., Yamawaki K., Yoshinaka T., Speckmann H.D. Investigation of oxidation protected C/C heat shield material in different plasma wind tunnels, Acta Astronau. 1999; 45, 93.
[24.] Aramide F. O., Production and Characterization of Porous Insulating Fired Bricks from Ifon Clay with Varied Sawdust Admixture, Journal of Minerals and Materials Characterization and Engineering, 2012, 11, 970-975
[25.] Aramide F. O. and Oke S. R. Production and characterization of clay bonded carbon refractory from carbonized palm kernel shell, Acta Tehnica Corviniensis – Bulletin of Engineering, 2014, Tome VII, Fascicule 4, 133-140.
[26.] Oke S.R., Talabi H.K., Olorunniwo O.E., Atanda P.O., Aramide F.O., Production and Characterization of Clay Bonded Carbon Refractory from Ifon Clay and Spent Graphite Electrode. International Journal of Metallurgical Engineering, 2015, 4(2): 33-39
copyright ©
University POLITEHNICA Timisoara, Faculty of Engineering Hunedoara,
5, Revolutiei, 331128, Hunedoara, ROMANIA http://acta.fih.upt.ro

© copyright Faculty of Engineering – Hunedoara, University POLITEHNICA Timisoara
ACTA TECHNICA CORVINIENSIS – Bulletin of Engineering Tome X [2017] Fascicule 3 [July – September] ISSN: 2067 – 3809
1.Milan BUKVIĆ, 2.Blaža STOJANOVIĆ, 3.Lozica IVANOVIĆ, 4.Saša MILOJEVIĆ
RECYCLING OF THE HYBRID AND ELECTRIC VEHICLES 1-4. University of Kragujevac, Faculty of Engineering, Kragujevac, SERBIA Abstract: Modern research in the field of motor vehicles covered by a cycle of product development and components to production and exploitation of vehicles in traffic, all the way to retirement and recycling. In this way is decreasing negative impact of motor vehicles on the environment. Application of hybrid and electric vehicles to reduce or eliminate emissions of toxic and harmful gases are emitted into the environment during use of vehicles with conventional drive systems on gasoline or diesel fuel. In parallel with the implementation of such vehicles, it is necessary to set up and solve the problems in more detail their exploitation, as well as problems that precede the use of vehicles (quarrying and raw materials, energy production, and everything is built into a vehicle), and partly to problems that come later (after exploitation period). This particularly applies to the treatment of waste batteries and electrical and electronic circuits that are typical for this kind of vehicle. Requirements for zero emission of waste materials at all stages of the service life of hybrid and electric vehicles are a complex task for researchers, especially in the field of development and application of new materials and advanced and secure technologies in the process of production and application. That way, manufacturers are demands for easy dismantling and recycling of vehicles at the end of life service and safety classification of the material, which is accompanied by certain problems. A particular problem is the lack of specific policies and procedures that can be applied in such vehicles. To meet these requirements it is necessary to develop new materials and equipment to be installed in a vehicle, as well as the development of new manufacturing technologies and processes for recycling. This paper describes the procedures for the retirements of such vehicles, as well as the recycling of specific parts of electrical installations and electronic circuits. Keywords: hybrid and electric vehicles, recycling, ecology, materials, waste INTRODUCTION More intensive use of hybrid and electric vehicles inevitably creates the need for recycling these types of vehicles, which requires certain changes in the existing methods of recycling. From the point of recycling are especially important components of electric and hybrid vehicles which do not exist are underrepresented in vehicles with conventional drive exclusively internal combustion engines (IC engines). These components are generally messy traction batteries, electric motors and generators, as well as other types of electrical devices and on-board equipment, as example in modern vehicles with alternative propulsion systems with hydrogen as the fuel cell. The introduction of hybrid and electric vehicles is due to the specificity of their devices and equipment enormous challenge. Under pressure, not only companies engaged in recycling of vehicles, due to the requirement for more modern facilities, such as recycling plant for batteries, but also manufacturers of vehicles, parts and equipment
suppliers, service centers, as well as the state administration and legislature. Challenges originating, inter alia, from insufficiently developed infrastructure for recycling of such vehicles, the complexity of their assemblies, due to the application of new and more modern materials (more composites and some extremely rare and very valuable metals), and the absence of legislation in this area [1]. However, in the case of mass use of hybrid and electric vehicles, sophisticated recycling technology is very important, not only for the environment but also for reasons of securing long-term supply of necessary raw materials. Advanced technologies of recycling are primarily focused on lithium, nickel and cobalt in the lithium-ion batteries, neodymium and rare metals in electric motors, as well as precious metals, and the tantalum and tin in electronics [2]. Therefore, in recent years, a significant number of initiatives, particularly in developed countries, aimed at encouraging private and public sectors of society in the

ACTA TECHNICA CORVINIENSIS – Bulletin of Engineering
108 | F a s c i c u l e 3
recycling of electric and hybrid vehicles. The aim of this paper is to present current developments and challenges in the field of recycling of components for hybrid and electric vehicles, a primarily electric motors and power electronics elements. BASIC COMPONENTS OF HYBRID AND ELECTRIC VEHICLES ON ASPECT OF RECYCLING The basic components, which are the holder of functionality, energy potential and sustainability, which are also the kind of specificity of electric and hybrid vehicles, particularly in terms of recycling are:
» battery as the dominant source of energy; » electric motors; and » electrical and electronic equipment.
The batteries to power hybrid and electric vehicles are predominantly used in the form of nickel-metal hydride (Ni-MH) and lithium batteries. Because of the higher-capacity, lithium-ion batteries more suppress the (Ni-MH) batteries that are still in use in power-drive systems of some modern electric and hybrid vehicles [1]. Power batteries, depending on their use in HEV (hybrid electric vehicle), PHEV (hybrid electric vehicles with external charging) or EV (electric vehicles); exist in a wide range of design solutions, size, weight, capacity, power and energy. Traction batteries also differ according to the number of modules, cells, according to the number of charge and discharge cycles, and the autonomy or the radius of movement of vehicles on a single charge with the same battery. The characteristics of the available types of batteries, as well as adequate conception of the vehicle are shown in Figure 1.
Figure 1. Contemporary concepts of hybrid and
electric vehicles and characteristics of their battery (original equipment manufacturers) [2]
By comparison, hybrid vehicles such as the Toyota Prius and require auxiliary batteries that are necessary for additional power during acceleration of the vehicle and which complement the braking energy recuperation. Therefore, the provision of additional forces for the hybrid vehicle from the auxiliary battery is not required a large amount of energy, and they represent an additional source of power hybrid vehicles. In this way,
the hybrid vehicles achieved the ratio of power and energy of about (20:1) or more and are functional at a very low charge level or the capacity of the battery. On average, it is possible to more than 300,000 cycles of charging and discharging the battery during the service of a vehicle. In contrast to hybrid vehicles, electric vehicles require much larger battery power. The relationship between power and energy of an electric vehicle is in average (4:1) or less. Batteries operate at about 90% of the total battery capacity, and it is possible to achieve from 3000 up to 4000 cycle of charging and discharging cycles during battery service period [1, 3, 4]. The electric motors are one of the key elements (aggregates) in all HEV and EV, as the primary purpose of converting electrical energy into mechanical energy. Due to the different design solutions, operating conditions, purposes, and the concept of the drive block and finally making materials, a multitude of different electric motors developed for hybrid and electric vehicles [1, 2]. The most common types of electric motors in hybrid and electric vehicles are electric motors, induction motors (also known as asynchronous motors) and synchronous motors, each of these types of electric motor carries a number of advantages and disadvantages [5]. DC electric motors with permanent magnets characterized by high efficiency, good ability to control speed and torque, but on the other hand more complex and expensive to manufacture and maintain. The advantage is that they are cheaper and asynchronous motors do not require the use of expensive elements for making and complex electronic blocks for the management of this kind of electric motors [5, 6]. However, due to limited space in hybrid and electric vehicles, as well as the existence of effective software management mode of operation, in these vehicles is the dominant application of DC electric motors with permanent magnets, which employs the largest number of the world's vehicle manufacturers. In order to continue the analysis of each component of hybrid and electric vehicles, it is necessary to remind ourselves of their basic concepts. There are two basic configurations of hybrid vehicles: serial and parallel. In addition, there is a combined series-parallel hybrid vehicle concepts, which combines all the advantages of basic concepts of hybrid vehicles. Concepts of hybrid vehicles are shown in the Figure 2. In serial hybrid vehicle IC engine drives a generator that supplies the electric power electricity and supplement batteries. IC engine is used in the optimal mode; a speed control is achieved by electric motor. The existence of the battery and electric motor provides a reversible (engine) braking, thus increasing vehicle efficiency. Parallel hybrid vehicles are designed so that the drive shaft and driven by an electric motor and IC engine-

ACTA TECHNICA CORVINIENSIS – Bulletin of Engineering
109 | F a s c i c u l e 3
generator. IC engine with this concept vehicle runs in optimal mode, where the electric machine operates as a generator and supplements the battery, when the movement of the lower power output of IC engines, and when you need more power, then electric machine operates as an electric motor using energy from the battery. The point of introducing this concept of hybrid vehicles can be found in the fact that the installed power is less electric machines, which reduced the weight of the vehicle. Instead of separate motors and generators, is used here only one electric machine, whose power is less than the power of the electric motor with the serial hybrid vehicle size. When serial - parallel hybrid vehicle, there are electric motor and generator, or lower power than the pure serial hybrid concept vehicle. According to the needs it is possible to drive IC motor runs only generator or with an electric motor driven drive shaft, and the generator idle [7].
(a) (b)
(c)
Figure 2. Concepts vehicles with serial (a), parallel (b) and serial - parallel (c) hybrid drive [7]
Fully electric vehicles are vehicles that for their movements using electrical energy stored in batteries or the battery is obtained from a fuel cell. The drive of the vehicle consists of the following subsystems: batteries, inverter power electronics, and electric motor and usually, mechanical force transmission system. The electric motor is the only electric machine installed in the towing vehicle subsystem and its strength is equal to the force required to propel the vehicle. Schematic
representation of an electric vehicle with all its subsystems is shown in Figure 3 [7].
Figure 3. Schematic view of the electric vehicle [7]
Electrical and electronic equipment have the task of electrical energy from the battery to the required values and with the least losses is delivered to the drive electric machines. That equipment is one of the key components of electric and hybrid vehicles and has a high impact on the overall energy efficiency of the powertrain. In order to optimize the flow of energy transformation in these vehicles, electronic blocks for power have several functions performed thanks to its sub-components [8]: » inverter that converts the direct current from the
battery into alternating current for electric machines; » DC power converter, which provides low-voltage DC
power supply for consumers, most of which are located on the dashboard of the vehicle;
» some concept of vehicles provide for an additional inverter that converts the DC current at the output from the battery into electricity higher voltage, before the same is converted into alternating current to power the electric motor. This conversion into electricity higher voltage is performed in order to reduce losses in the transmission of electricity;
» elements of the power electronics, which comprise, inter alia, of the printed circuit board with controllers and other control components; and
» built-in charger and (AC-DC) converter is used in electric and hybrid vehicles as a link between the external electrical network for power supply with battery.
PROCEDURE FOR RECYCLING OF HYBRID AND ELECTRIC VEHICLES With the introduction of the Directive on recycling vehicles from 2006 in the European Union [9] are intended to wastewater treatment system sales in Europe as much homogenize and standardize. Figure 4 shows a novel method for recycling vehicles, which is expected this Directive by the European Commission, which aims to make this area more standardized, but also to unify the individual elements of the process, to the final end products of this process back into production as many countries across the European Union and beyond.
Battery
Digital controller
Static converter
Electric motor
Differential
Drive wheels

ACTA TECHNICA CORVINIENSIS – Bulletin of Engineering
110 | F a s c i c u l e 3
Figure 4. The recycling process of the end
of the service of the vehicle [2] Recycling is mainly composed of purification, dismantling, cutting and grinding, additional grinding and sorting. The first treatment is carried out in dedicated installations, in order to isolate potentially hazardous components and toxic substances such as exploitation of liquid, air bags and batteries. In addition, some parts are dismantled usually for the following reasons: due to the material values of their components (such as catalysts), reuse (engines, tires, electronics) or inefficient recycling process in the following stages of the process [9-12]. After dismantling, usually most of the vehicles crushed by cutting and processing a magnetic separator (iron-based concentrates), current separators (non concentrates) and fluid separators-solutions (for plastics, dust of various materials, light materials). For a long time, the detailed separation allocate parts of the vehicle that cut and grind, given that up to 20% of the total weight of modern vehicles are potentially dangerous waste for the environment [9, 10]. RECYCLING OF ELECTRIC MOTORS OF ELECTRIC AND HYBRID ELECTRIC VEHICLES Within the recycling of conventional pretreatment vehicle IC engines are usually extracted, separated, and specifically treat their component parts. Separation of IC engine components for their reuse is difficult because in IC engines are represented different kinds of materials, different values in terms of raw material, but also different levels of harm to the environment. If all these materials are chopped and by crushing, they are diluted, insufficient purity or lost, which leads not only to lower wages in the recycling process, but also to the inability of protection against the harmful effects of hazardous and harmful substances. In principle, the same treatment applies to the electric motors used on hybrid and electric vehicles, although recycling of this type of powertrain is not heavily researched and widespread, and the scarce information on the value of certain parts of electric motors, as well as the justification of allocations and the extent to which the
performs disassembly of certain components. However, the integration of the components of electric motors with new design concepts, as well as the tendency towards miniaturization of parts could lead to major difficulties in dismantling assemblies and inevitably increasing costs. However, because the electric motors and hybrid vehicles contain relatively high concentrations of precious metals (in the form of copper wires and NdFeB-neodymium iron boride magnets) which have low efficiency of recycling during processing, grinding and crushing, dismantling will have a very important role. In fact, very rare and valuable elements in the permanent magnets are lost during processing by cutting and crushing iron to melt fractions and later [13]. Therefore, such a worthy assemblies, primarily the rotors of electric motors must be separated as much as possible on the finer parts during disassembly. For example Research Project: Recycling of Strategic Metals and Components of the Drive Motors [14], process several scenarios for dismantling electric motors with permanent magnets with electric and hybrid vehicles at the end of a century of service, up to the component parts of the rotor and stator. The economic side of the recycling process, dismantling parts of the electric motor is very profitable, mainly because of the content of large amounts of copper, as well as non-ferrous metal prices high, even if very few materials are separated and not recycled in the process. From the standpoint of obtaining very rare metals from waste electrical circuits, recycling activities are specifically aimed at the recycling of permanent magnets, as an integral part of each electric motor. The problem of recycling of permanent magnets electric motors is particularly studied by the Institute for Factory Automation and Production Systems of the Friedrich Alexander University Erlangen Nuremberg (MORE Project). Magnets are either embedded on the surface of the rotor (squirrel cage) or grooves close to the surface of the rotor (a rotor with salient poles), and therefore require different techniques of separation. If necessary, the magnets must be removed before the shell of its construction. In Figures 5 and 6 are shown the complete rotor and the rotor segments separated by individual electric motors [15]. Within MORE projects developed different approaches to dismantling. Those are designed, constructed and tested two prototypes of machines for mechanical and electric bed. Wherein the magnetic losses under (1%). Magnets should not be demagnetized before dismantling. In essence, in the cage of the rotor, the thermal treatment may result in damage of the magnet [16-18].
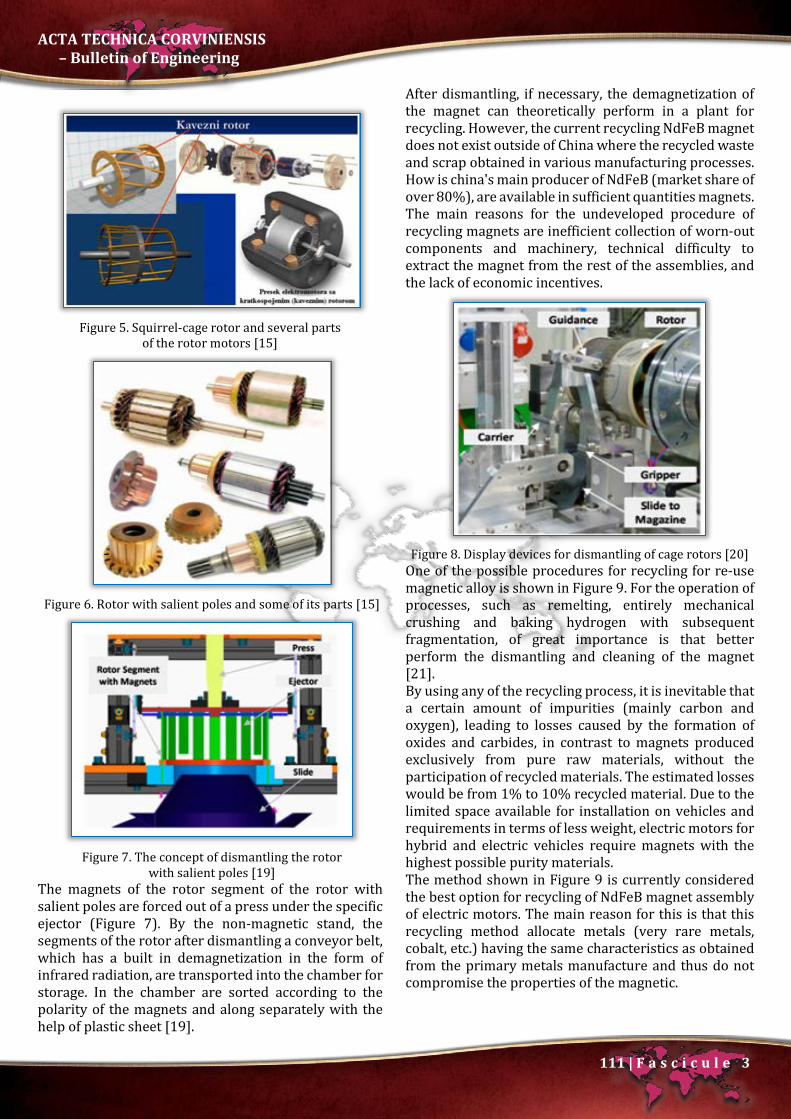
ACTA TECHNICA CORVINIENSIS – Bulletin of Engineering
111 | F a s c i c u l e 3
Figure 5. Squirrel-cage rotor and several parts
of the rotor motors [15]
Figure 6. Rotor with salient poles and some of its parts [15]
Figure 7. The concept of dismantling the rotor
with salient poles [19] The magnets of the rotor segment of the rotor with salient poles are forced out of a press under the specific ejector (Figure 7). By the non-magnetic stand, the segments of the rotor after dismantling a conveyor belt, which has a built in demagnetization in the form of infrared radiation, are transported into the chamber for storage. In the chamber are sorted according to the polarity of the magnets and along separately with the help of plastic sheet [19].
After dismantling, if necessary, the demagnetization of the magnet can theoretically perform in a plant for recycling. However, the current recycling NdFeB magnet does not exist outside of China where the recycled waste and scrap obtained in various manufacturing processes. How is china's main producer of NdFeB (market share of over 80%), are available in sufficient quantities magnets. The main reasons for the undeveloped procedure of recycling magnets are inefficient collection of worn-out components and machinery, technical difficulty to extract the magnet from the rest of the assemblies, and the lack of economic incentives.
Figure 8. Display devices for dismantling of cage rotors [20]
One of the possible procedures for recycling for re-use magnetic alloy is shown in Figure 9. For the operation of processes, such as remelting, entirely mechanical crushing and baking hydrogen with subsequent fragmentation, of great importance is that better perform the dismantling and cleaning of the magnet [21]. By using any of the recycling process, it is inevitable that a certain amount of impurities (mainly carbon and oxygen), leading to losses caused by the formation of oxides and carbides, in contrast to magnets produced exclusively from pure raw materials, without the participation of recycled materials. The estimated losses would be from 1% to 10% recycled material. Due to the limited space available for installation on vehicles and requirements in terms of less weight, electric motors for hybrid and electric vehicles require magnets with the highest possible purity materials. The method shown in Figure 9 is currently considered the best option for recycling of NdFeB magnet assembly of electric motors. The main reason for this is that this recycling method allocate metals (very rare metals, cobalt, etc.) having the same characteristics as obtained from the primary metals manufacture and thus do not compromise the properties of the magnetic.
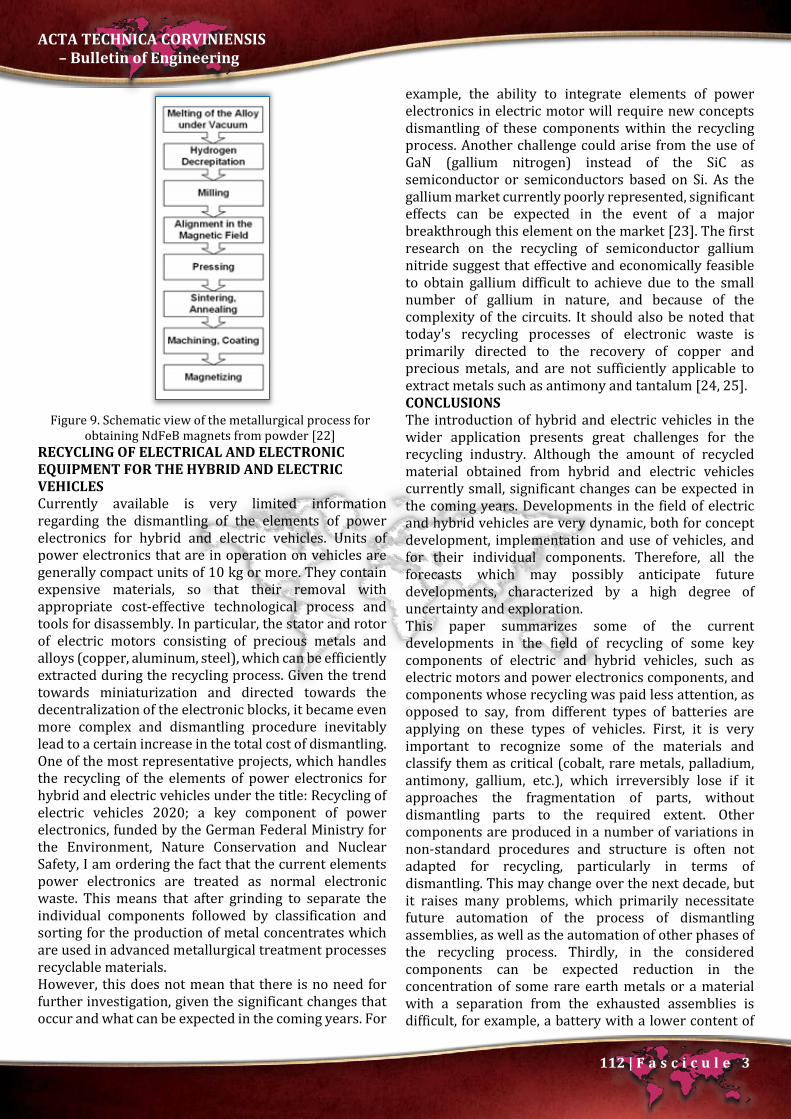
ACTA TECHNICA CORVINIENSIS – Bulletin of Engineering
112 | F a s c i c u l e 3
Figure 9. Schematic view of the metallurgical process for
obtaining NdFeB magnets from powder [22] RECYCLING OF ELECTRICAL AND ELECTRONIC EQUIPMENT FOR THE HYBRID AND ELECTRIC VEHICLES Currently available is very limited information regarding the dismantling of the elements of power electronics for hybrid and electric vehicles. Units of power electronics that are in operation on vehicles are generally compact units of 10 kg or more. They contain expensive materials, so that their removal with appropriate cost-effective technological process and tools for disassembly. In particular, the stator and rotor of electric motors consisting of precious metals and alloys (copper, aluminum, steel), which can be efficiently extracted during the recycling process. Given the trend towards miniaturization and directed towards the decentralization of the electronic blocks, it became even more complex and dismantling procedure inevitably lead to a certain increase in the total cost of dismantling. One of the most representative projects, which handles the recycling of the elements of power electronics for hybrid and electric vehicles under the title: Recycling of electric vehicles 2020; a key component of power electronics, funded by the German Federal Ministry for the Environment, Nature Conservation and Nuclear Safety, I am ordering the fact that the current elements power electronics are treated as normal electronic waste. This means that after grinding to separate the individual components followed by classification and sorting for the production of metal concentrates which are used in advanced metallurgical treatment processes recyclable materials. However, this does not mean that there is no need for further investigation, given the significant changes that occur and what can be expected in the coming years. For
example, the ability to integrate elements of power electronics in electric motor will require new concepts dismantling of these components within the recycling process. Another challenge could arise from the use of GaN (gallium nitrogen) instead of the SiC as semiconductor or semiconductors based on Si. As the gallium market currently poorly represented, significant effects can be expected in the event of a major breakthrough this element on the market [23]. The first research on the recycling of semiconductor gallium nitride suggest that effective and economically feasible to obtain gallium difficult to achieve due to the small number of gallium in nature, and because of the complexity of the circuits. It should also be noted that today's recycling processes of electronic waste is primarily directed to the recovery of copper and precious metals, and are not sufficiently applicable to extract metals such as antimony and tantalum [24, 25]. CONCLUSIONS The introduction of hybrid and electric vehicles in the wider application presents great challenges for the recycling industry. Although the amount of recycled material obtained from hybrid and electric vehicles currently small, significant changes can be expected in the coming years. Developments in the field of electric and hybrid vehicles are very dynamic, both for concept development, implementation and use of vehicles, and for their individual components. Therefore, all the forecasts which may possibly anticipate future developments, characterized by a high degree of uncertainty and exploration. This paper summarizes some of the current developments in the field of recycling of some key components of electric and hybrid vehicles, such as electric motors and power electronics components, and components whose recycling was paid less attention, as opposed to say, from different types of batteries are applying on these types of vehicles. First, it is very important to recognize some of the materials and classify them as critical (cobalt, rare metals, palladium, antimony, gallium, etc.), which irreversibly lose if it approaches the fragmentation of parts, without dismantling parts to the required extent. Other components are produced in a number of variations in non-standard procedures and structure is often not adapted for recycling, particularly in terms of dismantling. This may change over the next decade, but it raises many problems, which primarily necessitate future automation of the process of dismantling assemblies, as well as the automation of other phases of the recycling process. Thirdly, in the considered components can be expected reduction in the concentration of some rare earth metals or a material with a separation from the exhausted assemblies is difficult, for example, a battery with a lower content of
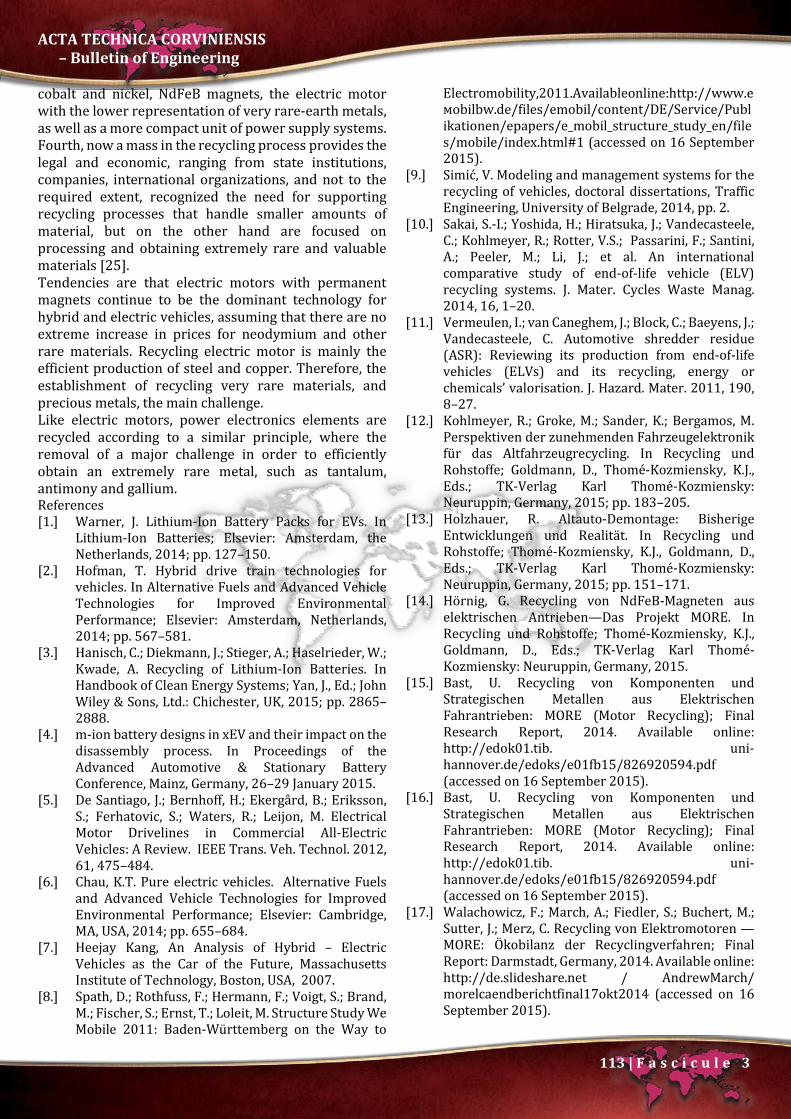
ACTA TECHNICA CORVINIENSIS – Bulletin of Engineering
113 | F a s c i c u l e 3
cobalt and nickel, NdFeB magnets, the electric motor with the lower representation of very rare-earth metals, as well as a more compact unit of power supply systems. Fourth, now a mass in the recycling process provides the legal and economic, ranging from state institutions, companies, international organizations, and not to the required extent, recognized the need for supporting recycling processes that handle smaller amounts of material, but on the other hand are focused on processing and obtaining extremely rare and valuable materials [25]. Tendencies are that electric motors with permanent magnets continue to be the dominant technology for hybrid and electric vehicles, assuming that there are no extreme increase in prices for neodymium and other rare materials. Recycling electric motor is mainly the efficient production of steel and copper. Therefore, the establishment of recycling very rare materials, and precious metals, the main challenge. Like electric motors, power electronics elements are recycled according to a similar principle, where the removal of a major challenge in order to efficiently obtain an extremely rare metal, such as tantalum, antimony and gallium. References [1.] Warner, J. Lithium-Ion Battery Packs for EVs. In
Lithium-Ion Batteries; Elsevier: Amsterdam, the Netherlands, 2014; pp. 127–150.
[2.] Hofman, T. Hybrid drive train technologies for vehicles. In Alternative Fuels and Advanced Vehicle Technologies for Improved Environmental Performance; Elsevier: Amsterdam, Netherlands, 2014; pp. 567–581.
[3.] Hanisch, C.; Diekmann, J.; Stieger, A.; Haselrieder, W.; Kwade, A. Recycling of Lithium-Ion Batteries. In Handbook of Clean Energy Systems; Yan, J., Ed.; John Wiley & Sons, Ltd.: Chichester, UK, 2015; pp. 2865–2888.
[4.] m-ion battery designs in xEV and their impact on the disassembly process. In Proceedings of the Advanced Automotive & Stationary Battery Conference, Mainz, Germany, 26–29 January 2015.
[5.] De Santiago, J.; Bernhoff, H.; Ekergård, B.; Eriksson, S.; Ferhatovic, S.; Waters, R.; Leijon, M. Electrical Motor Drivelines in Commercial All-Electric Vehicles: A Review. IEEE Trans. Veh. Technol. 2012, 61, 475–484.
[6.] Chau, K.T. Pure electric vehicles. Alternative Fuels and Advanced Vehicle Technologies for Improved Environmental Performance; Elsevier: Cambridge, MA, USA, 2014; pp. 655–684.
[7.] Heejay Kang, An Analysis of Hybrid – Electric Vehicles as the Car of the Future, Massachusetts Institute of Technology, Boston, USA, 2007.
[8.] Spath, D.; Rothfuss, F.; Hermann, F.; Voigt, S.; Brand, M.; Fischer, S.; Ernst, T.; Loleit, M. Structure Study We Mobile 2011: Baden-Württemberg on the Way to
Electromobility,2011.Availableonline:http://www.eмоbilbw.de/files/emobil/content/DE/Service/Publikationen/epapers/e_mobil_structure_study_en/files/mobile/index.html#1 (accessed on 16 September 2015).
[9.] Simić, V. Modeling and management systems for the recycling of vehicles, doctoral dissertations, Traffic Engineering, University of Belgrade, 2014, pp. 2.
[10.] Sakai, S.-I.; Yoshida, H.; Hiratsuka, J.; Vandecasteele, C.; Kohlmeyer, R.; Rotter, V.S.; Passarini, F.; Santini, A.; Peeler, M.; Li, J.; et al. An international comparative study of end-of-life vehicle (ELV) recycling systems. J. Mater. Cycles Waste Manag. 2014, 16, 1–20.
[11.] Vermeulen, I.; van Caneghem, J.; Block, C.; Baeyens, J.; Vandecasteele, C. Automotive shredder residue (ASR): Reviewing its production from end-of-life vehicles (ELVs) and its recycling, energy or chemicals’ valorisation. J. Hazard. Mater. 2011, 190, 8–27.
[12.] Kohlmeyer, R.; Groke, M.; Sander, K.; Bergamos, M. Perspektiven der zunehmenden Fahrzeugelektronik für das Altfahrzeugrecycling. In Recycling und Rohstoffe; Goldmann, D., Thomé-Kozmiensky, K.J., Eds.; TK-Verlag Karl Thomé-Kozmiensky: Neuruppin, Germany, 2015; pp. 183–205.
[13.] Holzhauer, R. Altauto-Demontage: Bisherige Entwicklungen und Realität. In Recycling und Rohstoffe; Thomé-Kozmiensky, K.J., Goldmann, D., Eds.; TK-Verlag Karl Thomé-Kozmiensky: Neuruppin, Germany, 2015; pp. 151–171.
[14.] Hörnig, G. Recycling von NdFeB-Magneten aus elektrischen Antrieben—Das Projekt MORE. In Recycling und Rohstoffe; Thomé-Kozmiensky, K.J., Goldmann, D., Eds.; TK-Verlag Karl Thomé-Kozmiensky: Neuruppin, Germany, 2015.
[15.] Bast, U. Recycling von Komponenten und Strategischen Metallen aus Elektrischen Fahrantrieben: MORE (Motor Recycling); Final Research Report, 2014. Available online: http://edok01.tib. uni-hannover.de/edoks/e01fb15/826920594.pdf (accessed on 16 September 2015).
[16.] Bast, U. Recycling von Komponenten und Strategischen Metallen aus Elektrischen Fahrantrieben: MORE (Motor Recycling); Final Research Report, 2014. Available online: http://edok01.tib. uni-hannover.de/edoks/e01fb15/826920594.pdf (accessed on 16 September 2015).
[17.] Walachowicz, F.; March, A.; Fiedler, S.; Buchert, M.; Sutter, J.; Merz, C. Recycling von Elektromotoren — MORE: Ökobilanz der Recyclingverfahren; Final Report: Darmstadt, Germany, 2014. Available online: http://de.slideshare.net / AndrewMarch/ morelcaendberichtfinal17okt2014 (accessed on 16 September 2015).

ACTA TECHNICA CORVINIENSIS – Bulletin of Engineering
114 | F a s c i c u l e 3
[18.] Klier, T.; Risch, F.; Franke, J. Disassembly strategies for recovering valuable magnet material of electric drives. In Proceedings of the 2013 3rd International Electric Drives Production Conference (EDPC), Nürnberg, Germany, 29–30 October 2013; pp. 1–3.
[19.] Klier, T.; Risch, F.; Franke, J. Disassembly, recycling, and reuse of magnet material of electric drives. In Proceedings of the 2013 IEEE International Symposium on Assembly and Manufacturing (ISAM), Xi’an, China, 30 July 30–2 August 2013; pp. 88–90.
[20.] MORE Consortium. “MORE”—A Project on Recycling of Components and Strategic Metals of Electric Drive Motors; Final Presentation of the Research Project; MORE Consortium: München, Germany, 2015.
[21.] Miladinović, S.; Ivanović, L.; Blagojević M.; Stojanović B. The Development of Magnetic Gears for Transportation Applications, Mobility and Vehicle Mechanics, Vol. 43, No. 1, pp. 39-55, 2017.
[22.] Walachowicz, F.; March, A.; Fiedler, S.; Buchert, M.; Sutter, J.; Merz, C. Recycling von Elektromotoren — MORE: Ökobilanz der Recyclingverfahren; Final Report: Darmstadt, Germany, 2014. Available online: http:// de.slideshare.net/ AndrewMarch/ morelcaendberichtfinal17okt2014 (accessed on 16 September 2015).
[23.] Katter, M. Entwicklungstrends bei Pulvermetallurgisch Hergestellten Seltenerd-Dauermagneten. In Proceedings of the Workshop Magnetwerkstoffe—Vom Design bis zum Recycling, Bremen, Germany, 19–20 May 2015
[24.] Öko-Institut e.V.; Institut für sozial-ökologische Forschung. OPTUM: Optimierung der Umweltentlastungspotenziale von Elektrofahrzeugen: Integrierte Betrachtung von Fahrzeugnutzung und Energiewirtschaft; Final Report: Berlin, Germany, 2011. Available online: http://www.oeko.de/oekodoc/1342/2011–004-de.pdf (accessed on 16 September 2015).
[25.] Van Schaik, A.; Reuter, M.A. Material-Centric (Aluminum and Copper) and Product-Centric (Cars, WEEE, TV, Lamps, Batteries, Catalysts) Recycling and DfR Rules. In Handbook of Recycling: State-of-the-Art for Practitioners, Analysts, and Scientists; Worrell, E., Reuter, M., Eds.; Elsevier: Waltham, UK, 2014; pp. 307–378).
copyright ©
University POLITEHNICA Timisoara, Faculty of Engineering Hunedoara,
5, Revolutiei, 331128, Hunedoara, ROMANIA http://acta.fih.upt.ro

© copyright Faculty of Engineering – Hunedoara, University POLITEHNICA Timisoara
ACTA TECHNICA CORVINIENSIS – Bulletin of Engineering Tome X [2017] Fascicule 3 [July – September] ISSN: 2067 – 3809
1.I.O. OLADELE, 2.O.G. AGBABIAKA, 3.A.O. ADEYEMI
MECHANICAL PROPERTIES OF CHEMICALLY TREATED SISAL FIBER REINFORCED LOW DENSITY POLYETHYLENE COMPOSITES 1-3.Department Metallurgical and Materials Engineering, Federal University of Technology, Akure, NIGERIA Abstract: This research investigates the effect of chemical treatment on the mechanical properties of sisal fiber reinforced low density polyethylene (SFR-LDPE) composites. The sisal fiber was sourced from its plantation and was extracted by soil retting process. In order to study the effect of chemical treatments on the resultant properties of the SFR-LDPE composites, NaOH, KOH, NaCl and KCl were used to modify the fibers in a shaker water bath at 50 ºC for 4 hours. The treated fibers were cut into 10 mm lengths and were used for the production of randomly dispersed short fiber/LDPE composites in predetermined proportions. Tensile and flexural tests were carried out on the developed SFR-LDPE composites from where it was observed that, alkali treated SFR-LDPE composite samples gave the best flexural and tensile properties compared to composites developed from chloride salts. Keywords: Sisal fiber, composite, chemical treatment, mechanical properties, water absorption properties INTRODUCTION The interest in natural fiber reinforced polymer composites is growing rapidly due to significant processing advantage of been eco-friendly, low production cost as well as low density [1-3]. Natural fibers are renewable resources, cheap, pose no health hazards and as well provide solution to environmental pollution by finding new uses for waste materials [4-6]. Besides, natural fiber reinforced polymer composites form a new class of materials that can possibly be used as a substitute for scarce wood and wood based materials in structural applications. However, it has been predicted that by the beginning of next century wood will be scarce for the whole world due to its increasing demand [7]. The choice of sisal fiber for this research was informed by its availability and good strength. Sisal fiber is a member of the agavaceae family. It is biodegradable and environment friendly. Research is ongoing using sisal fiber as reinforcement in different polymers like; low-density polyethylene, polyester, epoxy, polypropylene, urea-formaldehyde phenol-formaldehyde, polyvinyl-acetate, and starch-based polymers [8-13]. It is generally
accepted that the mechanical properties of fiber reinforced polymer composites are controlled by factors such as nature of matrix, fiber-matrix interface, fiber weight fraction and aspect ratio [14]. Plant fibers comprised of three major chemical components, namely cellulose, lignin, and hemicelluloses. The pre-treatment of fibers changes the composition and ultimately changes not only its properties but also the properties of composites. The treatments usually enhanced the properties of fibers but occasionally, its effects on the fibers may not be favorable to the fiber properties if the operating conditions are not properly monitored. The treatments tend to aid interfacial adhesion between the fibers and polymer matrix. Commonly used methods for the enhancement of interfacial adhesion between fiber and matrix are maleated coupling agents, acrylation, acetylation and benzoylation [1, 15]. In this study, comparative investigation of the influence of alkali and saline treatments were examined. Chemicals that were used for sisal fiber treatment are potassium hydroxide (KOH), sodium hydroxide (NaOH), sodium chloride (NaCl) and potassium chloride (KCl). In

ACTA TECHNICA CORVINIENSIS – Bulletin of Engineering
116 | F a s c i c u l e 3
agreement with previous work [11, 16], this research investigated the best chemical treatment for soil retted sisal fibers targeted for improving the mechanical properties of the developed composites. Soil retting was used as process route for the extraction of sisal fiber since it has been employed in the extraction of other natural fiber where the needed resources; land and water are readily available. The process is expected to yield fiber with better tensile properties as it eliminates the mechanical beaten that characterized mechanical decortication process in which the fiber tensile properties may likely to be low due to induced stress. The stress is as a result of the compressive force that is being applied during the extraction. The process is also environmentally friendly as it eradicates dusts that are associated with decortication process. A lot of works on decorticated sisal fibers are available in the literature but not much have been reported on soil retted sisal fibers which is one of the reasons for carrying out this research.Low density polyethylene (LDPE) was used as matrix while sisal fibers serve as reinforcement to produce the sisal fiber reinforced low density polyethylene composites (SFR-LDPE). MATERIALS AND METHODS » Materials Low density polyethylene granules with melt flow index of 2.25 g/min and density of 0.923 g/cm3 was used as the matrix while sisal fiber from the plant leaves wasused as the reinforcement. Potassium hydroxide (KOH), sodium hydroxide (NaOH), hydrochloric acid (HCl), sodium chloride (NaCl) and distilled water were used for the treatments of the fiber. » Sisal Fiber Extraction and Treatment The sisal fiber was obtained from sisal plant and was extracted by soil retting process. In soil retting process, the green leaves were buried in the soil for 3 weeks. During this period, water was used to wet the buried sisal leaves. The fermented leaves were exhumed, washed in flowing water to remove sand and dirt. It was then sun dried for 5 days as shown in Figure 1.
Figure 1: Extracted Sisal Fibers
The dried fibers were divided into 4 portions of equal weights. Each of the portions was treated with 1 molar solution of NaOH, KOH, NaCl and KCl, respectively in a shaker water bath at a temperature of 50 ºC for 4 hours. Afterwards, the fibers were washed with ordinary water before washing them with distilled water to ensure neutralization status and then sun dried for 5 days. The dried fibers were cut into 10 mm lengths. The average value of the sisal fiber diameter was 0.09 mm before the treatment and, hence, the aspect ratio value for the used sisal fiber was 111.11. » Composites Production Sisal fiber reinforced LDPE composites were produced via heating compression moulding machine. Randomly dispersed fiber orientation was used with varied fiber content of: 2, 4, 6, 8 and 10 wt%. The treated sisal fibers were mixed with low density polyethylene (LDPE) in the mould before transferring to heating compression moulding machine. The mixture was placed in the compression moulding machine maintained at 170 ºC for 10 minutes. The composites were formed in flexural and tensile moulds separately and were allowed to cool before detaching them from the moulds. The flexural mould has a dimension of 150 x 50 x 3 mm while the tensile mould has a dog-bone shape and 3 mm thick. Three samples each were produced from the representative samples that were considered. » Mechanical testing Tensile test Tensile test was performed on universal testing machine (INSTRON 3369 model) with a maximum load cell capacity of 50 KN at a fixed crosshead speed of 10 mm/min. All Samples were prepared in accordance to ASTM D3039-14 [17], standard test methods for tensile properties of polymer matrix composite materials. Three samples were tested for each representative samples from where the average values for the test samples was used as illustrative value. Flexural test Flexural test was carried out according to ASTM D 790-98 [18], standard test method for flexural properties of polymer matrix composite materials. The flexural test was performed at a span length of 100 mm and at a crosshead speed of 2 mm/minon an INSTRON machine. Three samples were tested for each representative samples from where the average values for the test samples were used as the illustrative values. RESULTS AND DISCUSSION Flexural Test Figure 2 revealed the variation of flexural strength at peak against for the various samples. Flexural strength at peak is the strength at a particular cross section and not the load carrying capability of the overall beam. From the graph, it was observed NaOH treated sisal fiber reinforced LDPE composites in all the percentage

ACTA TECHNICA CORVINIENSIS – Bulletin of Engineering
117 | F a s c i c u l e 3
composition used gave better strength than the unreinforced LDPE matrix that serves as control except at 4 % where they both have the same value. This was followed by NaCl treatment in which all except 6 % reinforcement gave better results, KOH treated samples followed with less values at 6 and 8 %.
Figure 2: Charts for the variation of flexural strength at
peak for the developed composites and the control sample
However, all the KCl treated samples possess less value than the control which implies that this treatment has not improved the condition of the fiber for the expected enhancement. Hence, all the developed composites from the chemically modified fibers with the exception of KCl displayed promising potentials for the treatment of sisal fiber for polymer composite development. Composite developed from 2 and 6 % NaOH treated fiber were with the highest bending strength at peak with values 29.27 and 19.32 N/mm2, respectively. It was also observed from the result that, sample with the best fiber content from both KOH and NaCl treatments were from 2 and 4 %, respectively. It therefore, follows that 2 – 6 % of the fibers are the range of values for optimum production. The treatment has made the sisal fiber to become stronger, thereby, able to withstand stress transfer from the LDPE matrix effectively [16]. This essentially results in improved flexural strength of the composites. Mechanical properties of composites depend on many parameters like the properties of matrix and fiber, volume fraction of fiber, geometry and orientation of fiber, adhesion between matrix and fiber, fiber agglomeration and fiber breakage. Therefore, the observed results are the effects of the combinations of the listed factors. Hence, the use of NaOH treated shortsisal fiber that is randomly dispersed in LDPE for the development of polymer composites gave the best surface modification required for good interfacial adhesion between the fiber and the matrix which resulted in 61 % enhancement in flexural strength of the developed composites.
Figure 3: Charts of the variation of flexural modulus for
the developed composites and the control sample
The flexural modulus for the various samples was as shown in Figure 3. Flexural modulus is also known as bending modulus and it is a measure of the stiffness of a material when subjected to bending test. The result showed that NaOH treated sisal fiber reinforced samples possesses better modulus than the control in all the fiber content used. From the graph, it was observed that composite with 6 % NaOH treated sisal fiber has the highest flexural modulus of about 935 N/mm2 followed by sample with 2 % KOH which has a value of about 833 N/mm2. Also, it was realized that composites produced from NaOH and KOH treated sisal fibers within the range of 2 - 6 % gave the best reinforcement with respect to other chemically treated sisal fiber reinforced LDPE composites and unreinforced LDPE. This corroborates the result in Figure 2 in which the same fiber content range gave the best flexural strength at peak results. Since the alkali treated samples emerges as the best in flexural properties, it therefore, follows that, the alkali treatments aid the removal of intra-matrix (hemicellulose and lignin) thereby, improving the interfacial adhesion between the sisal fiber and LDPE matrix. NaOH and KOH treatments were discovered to have led to about 55 and 50 % increment in the bending modulus, respectively. This feat was possible because the fiber strength has been enhanced by the alkali treatments [16]. The flexural properties from Figures 2-3 showed that, the properties tend to decrease as the fiber content increases from 8-10 %.This may be due to the effect of fiber volume fraction and improper adhesion between the fiber and the matrix that causes inadequate transfer of stress from the matrix to the fiber. The results revealed that better effects were obtained between 2-6 % fibers loading. This was in agreement with the work of [10] where it was deduced that low fiber content
0
5
10
15
20
25
30
35
2% 4% 6% 8% 10%CS
Flexu
ral S
treng
th a
t Pea
k N
/mm
2
Samples
NaOH KOHNaCl KClControl
0
200
400
600
800
1000
1200
2% 4% 6% 8% 10%CS
Flexu
ral M
odul
us N
/mm
2
Samples
NaOH KOHNaCl KClControl

ACTA TECHNICA CORVINIENSIS – Bulletin of Engineering
118 | F a s c i c u l e 3
yielded the optimum properties for the developed composites. Tensile Test Figure 4 shows the tensile strength at peak for the various test samples. Strength at peak is the maximum stress the material can withstand before it fractures.
Figure 4: Charts of the Variation of Tensile Strength at
Peak for the Developed Composite and the Control Sample
The responses of the developed composites show a different trend from that of flexural properties. Here, KOH and NaCl treated fiber reinforced samples gave the best performance which means that, these treatments can be tailored for usage when tensile strength property is to be enhanced. While the tensile strength at peak for KOH treated sisal fiber reinforced samples tends to increase as fiber content increases from 2-10 %, the same thing is applicable to that of NaCl which also tends to increase but reach optimum at 6 %. Though, chemical treatments are primarily to enhance interfacial adhesion between fiber and matrix, however, the treatments usually led to different reactions with the fiber constituents. Different chemical treatments tends to modified the fiber constituents; cellulose, hemicelluloses and lignin in diverse ways. The final products of these reactions may therefore alter the way they respond in service. From the graph, it was observed that composite developed with 10 and 8 % KOH has the highest tensile strength at peak with values; 21.28 and 18.67 N/mm2, respectively. CONCLUSIONS The research outcome revealed that alkali (NaOH and KOH) treatments of sisal fiber are more suitable for the enhancement of flexural and tensile properties of the developed composites than the chloride salts. From the results, it was observed that NaOH gave the best enhancement for flexural properties while KOH gave best enhancement for tensile strength at peak.
Low fiber content of between 2-6 % gave the best flexural results while high fiber content of between 8-10 % gave the best tensile strength at peak. References [1.] Agbabiaka O.G, Isiaka I.O, Olorunleye P.O.
Investigating the Influence of Alkalization on the Mechanical and Water Absorption Properties of Coconut and Sponge Fibers Reinforced Polypropylene Composites, Leonardo Electronic Journal of Practices and Technology 25: p. 223-231. 2014.
[2.] Sahari M, Sapuan S. M. Natural Fiber Reinforced Biodegradable Composites. Reviews on Advanced Materials Science 30: p. 166-170. 2011.
[3.] Aart V. V. Natural fiber composite; Recent development. Technological Advisor Composite Materials Sirris, Katholieke Universiteit Leuven p. 1-32. 2008.
[4.] Bledzki A, Gassan J. Composites Reinforced with Cellulose Based Fibers, Progress in Polymer Science24: 221-274. 1999.
[5.] Amar K.M, Manjusri M, Lawrence T.D. Natural Fibers, Biopolymers, and Bio-composites, CRC Press, Tailor & Francis, p. 1-3. 2005.
[6.] Singh S. P. Agro-Industrial Wastes and their Utilization. Proceedings of National Seminar on Building Materials and their Science and Technology, Roorkee 15: p. 111. 1982.
[7.] Oladele I.O, Omotoyinbo J.A, Borisade M.P. Mechanical Properties of Mahogany (Swietenia Macrophylla) and Araba (Ceiba Pentandra) Dusts Reinforced PolyesterComposites, Leonardo Electronic Journal of Practices and Technologies, 23(12): 1-18.2013.
[8.] Veluraja K, Ayyalnarayanasubbu R. S, Paul R. Preparation of Gum from Tamarind Seed and its Application in the Preparation of Composite Material with Sisal Fiber. Carbohydrate Polymers, Oxford 34 (4): p. 377- 379. 1997.
[9.] Pavithran C, Mukherjee P. S., Brahmakumar M., Damodaran A. D. Impact Performance of Sisal – Polyester Composites. Journal of Materials Science Letters, London 7: p. 825-826. 1988.
[10.] Oladele I.O, Omotoyinbo J.A, Adewuyi B.O, Kavishe F.P.L. The Effects of Production Processes on the Mechanical Properties of Sisal Fiber Reinforced Polypropylene Composites. Philippine Journal of Science. 142 (2): p.189-198. 2013.
[11.] Oladele I.O, Agbabiaka O.G. Investigating the Influence of Mercerization Treatment on the Mechanical Properties of Sisal Fiber Reinforced Polypropylene Composite and Modeling of the Properties, Fiber and Polymer Journal 16 (3): p. 650-656. 2015.
0
5
10
15
20
25
2% 4% 6% 8% 10%CS
Tens
ile S
treng
th a
t pea
k N
/mm
2
Samples
NaOH KOH NaCl
KCl Control

ACTA TECHNICA CORVINIENSIS – Bulletin of Engineering
119 | F a s c i c u l e 3
[12.] Pavithran C, Mukherjee P. S, Brahmakumar M, Damodaran A. D. Impact Properties of Natural Fiber Composites. Journal of Materials Science Letters, London 6: p. 882-884.1987.
[13.] Kalaprasad G, Joseph K, Thomas S, Pavithran C. Theoretical Modeling of TensileProperties of Short Sisal Fiber-Reinforced Low-Density Polyethylene Composites. Journal of Materials Science 32: p. 4261–4267. 1997.
[14.] Pal S, Mukhopadhayay D, Sanyal S, Mukherjea R. Studies on Process Variables for Natural Fiber Composites effects of Peapas Interfacial Agent. Journal of Applied Polymer Science 35: p. 973–985. 1998.
[15.] Ghali L, Aloui M, Zidi M, Bendaly H, M'sahli S, Sakli F. Effect of Chemical Modification of Luffa Cylindrica Fibers on the Mechanical and Hygrothermal Behaviours of Polyester/Luffa Composite, BioResources 6(4): p. 3836-3849. 2011.
[16.] Oladele,I. O, Omotoyinbo, J. A, Adewara J.O.T. Investigating the Effect of Chemical Treatment on the Constituents and Tensile Properties of Sisal Fibre. Journal of Minerals and Materials Characterization and Engineering. 9(6): p. 569- 582. 2010.
[17.] ASTM D3039.Standard Test Methods for Tensile Properties of Polymer Matrix Composite Materials. 2014.
[18.] ASTM D790. Standard Test Methods for Flexural Properties of Polymer Matrix Composite Materials. 1998.
[19.] Amuthakkannan P, Manikandan V, Winowlin J. J. T and Marimuthu U. Effect of Moisture Absorption Behavior on Mechanical Properties of Basalt Fiber Reinforced Polymer Matrix Composites, Hindawi Publishing Corporation, Journal of Composites, 8 pages.2014.
[20.] Alomayri T, Assaedi H, Shaikh F.U. A, Low I.M. Effect of Water Absorption on the Mechanical Properties of Cotton Fabric-Reinforced Geopolymer Composites, Journal of Asian Ceramic Societies, 2(3): p. 223–230. 2014.
[21.] Azim S. Effects of Water Absorption on Mechanical Properties of Hemp Fiber Composites, Polymer Composites, 33(1): p. 120–128. 2012.
copyright ©
University POLITEHNICA Timisoara, Faculty of Engineering Hunedoara,
5, Revolutiei, 331128, Hunedoara, ROMANIA http://acta.fih.upt.ro

ACTA TECHNICA CORVINIENSIS – Bulletin of Engineering
120 | F a s c i c u l e 3
We are very pleased to inform that our international and interdisciplinary journal ACTA TECHNICA CORVINIENSIS Bulletin of Engineering completed its nine years of publication successfully [issues of years 2008 –2016, Tome I–IX]. In a very short period it has acquired global presence and scholars from all over the world have taken it with great enthusiasm.
Every year, in four online issues (fascicules 1 – 4), ACTA TECHNICA CORVINIENSIS Bulletin of Engineering [e-ISSN: 2067-3809] publishes a series of reviews covering the most exciting and developing fields of science and technology. Each issue contains papers reviewed by international researchers who are experts in their fields. The result is a journal that gives the scientists and engineers the opportunity to keep informed of all the current developments in their own, and related, areas of research, ensuring the new ideas across an increasingly the interdisciplinary field. Now, when will celebrate the tenth years anniversary of ACTA TECHNICA CORVINIENSIS Bulletin of Engineering, we are extremely grateful and heartily acknowledge the kind of support and encouragement from all contributors and all collaborators!
On behalf of the Editorial Board and Scientific Committees of ACTA TECHNICA CORVINIENSIS Bulletin of Engineering, we would like to thank the many people who helped make this journal successful. We thank all authors who submitted their work to ACTA TECHNICA CORVINIENSIS Bulletin of Engineering.
copyright © University POLITEHNICA Timisoara,
Faculty of Engineering Hunedoara, 5, Revolutiei, 331128, Hunedoara, ROMANIA
http://acta.fih.upt.ro

© copyright Faculty of Engineering – Hunedoara, University POLITEHNICA Timisoara
ACTA TECHNICA CORVINIENSIS – Bulletin of Engineering Tome X [2017] Fascicule 3 [July – September] ISSN: 2067 – 3809
1.Viktor József VOJNICH
CULTIVATION POSSIBILITIES OF IN VITRO PROPAGATED Lobelia Inflata IN THE AGRICULTURE 1. Pallasz Athena University, Faculty of Horticulture and Rural Development, Kecskemét, HUNGARY Abstract: Lobelia inflata L. is a medicinally important species of the Lobeliaceae family. It is native to North America and contains numerous piperidine alkaloids. It is important to increase the biomass and lobeline content of in vitro plant by nitrogen and magnesium treatments. The aim of this research was to examine the effect of MgSO4 and NH4NO3 fertilization on biomass and on lobeline content of in vitro propagated L. inflata. Keywords: Lobelia inflata, in vitro, propagated, cultivation, agriculture INTRODUCTION Lobelia inflata L. (Indian tobacco) is a traditional medicinal plant native to North America. The plant can be introduced in Hungary. It is mainly an annual plant [19], [35], [41], but its biennial populations can also be found [13]. Lobelia inflata belongs to the order Campanulales, to the family Lobeliaceae [10]. The herba contains several piperidine skeleton alkaloids [16], [23], [24]. Its main alkaloid is the lobeline, which due to its stimulating effect on the respiratory centre is used in cases of gas- and narcotic poisoning [17], [40]. Recently, significant amounts of polyacetylene compounds have been isolated from above ground organs of the plant (lobetyol, lobetolin and lobetyolin) [3], [16]. Recently, the species has come into the limelight due to research on CNS, drug abuse and multidrug resistance [1], [7], [8], [14], [28], [30]. Dwoskin and Crooks [14] described a novel mechanism of action and potential use of lobeline as a treatment for psychostimulant abuse. It is important to increase the biomass and lobeline content of the plant by nitrogen and magnesium treatments in vitro [3], [36], [37] in open field [42], [43], [44], [45], [46]. There was a favourable effect of NH4+ and NO3- on the biomass formation of in vitro cultures [11], [21], [38], and aquatic cultures [15], [31]. Britto and Kronzucker [12] described the inhibitory effect of ammonia on growth in open field conditions. Nitrogen regulates the expression of specific proteins through mechanisms affecting transcription and/or mRNA stability [27], [34]. Nitrogen is incorporated into amino
acids and may also serve as a reprogramming signal for the metabolism of nitrogen and carbon, resource allocation, and root development [47]. Nitrogen sources are important for secondary product synthesis of compounds such as alkaloids [49], anthocyanins, and shikonin from cell suspension cultures [20]. Interestingly, the NH4+-to-NO3- ratio in the medium affects not only the growth of plant cell cultures [39], but also the production of secondary compounds [33]. The ammonium/nitrate ratio controls the pH of growth media, stimulates morphogenesis and embryogenesis, and thus it is important in inducing callus formation in many woody plant cultures. However, all the aforementioned effects of the culture medium differ from one species to another and from one compound to another [2], [9], [32]. Therefore, it is necessary to establish a reproducible externally applied NO3-/NH4+ ratio for the stable production of large quantities of special metabolites. Several previous experiments examined the influence of macroelements on growth and alkaloid production of hairy roots [4], [6]. The aim of this research was to study the effects of MgSO4 and NH4NO3 fertilisation on biomass and alkaloid/lobeline production of in vitro cultivated L. inflata in Hungary. MATERIAL AND METHODS Open field description The open field trials were carried out in 2011 in Mosonmagyaróvár, University of West-Hungary (My
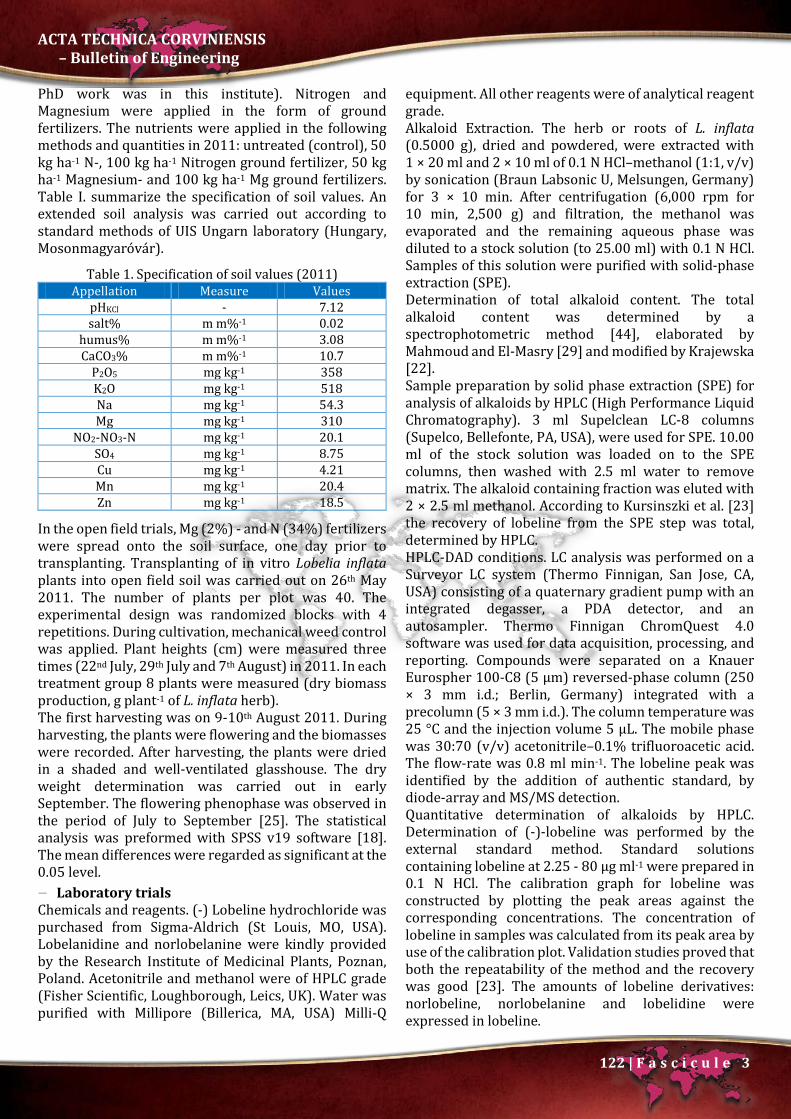
ACTA TECHNICA CORVINIENSIS – Bulletin of Engineering
122 | F a s c i c u l e 3
PhD work was in this institute). Nitrogen and Magnesium were applied in the form of ground fertilizers. The nutrients were applied in the following methods and quantities in 2011: untreated (control), 50 kg ha-1 N-, 100 kg ha-1 Nitrogen ground fertilizer, 50 kg ha-1 Magnesium- and 100 kg ha-1 Mg ground fertilizers. Table I. summarize the specification of soil values. An extended soil analysis was carried out according to standard methods of UIS Ungarn laboratory (Hungary, Mosonmagyaróvár).
Table 1. Specification of soil values (2011) Appellation Measure Values
pHKCl - 7.12 salt% m m%-1 0.02
humus% m m%-1 3.08 CaCO3% m m%-1 10.7
P2O5 mg kg-1 358 K2O mg kg-1 518 Na mg kg-1 54.3 Mg mg kg-1 310
NO2-NO3-N mg kg-1 20.1 SO4 mg kg-1 8.75 Cu mg kg-1 4.21 Mn mg kg-1 20.4 Zn mg kg-1 18.5
In the open field trials, Mg (2%) - and N (34%) fertilizers were spread onto the soil surface, one day prior to transplanting. Transplanting of in vitro Lobelia inflata plants into open field soil was carried out on 26th May 2011. The number of plants per plot was 40. The experimental design was randomized blocks with 4 repetitions. During cultivation, mechanical weed control was applied. Plant heights (cm) were measured three times (22nd July, 29th July and 7th August) in 2011. In each treatment group 8 plants were measured (dry biomass production, g plant-1 of L. inflata herb). The first harvesting was on 9-10th August 2011. During harvesting, the plants were flowering and the biomasses were recorded. After harvesting, the plants were dried in a shaded and well-ventilated glasshouse. The dry weight determination was carried out in early September. The flowering phenophase was observed in the period of July to September [25]. The statistical analysis was preformed with SPSS v19 software [18]. The mean differences were regarded as significant at the 0.05 level. Laboratory trials Chemicals and reagents. (-) Lobeline hydrochloride was purchased from Sigma-Aldrich (St Louis, MO, USA). Lobelanidine and norlobelanine were kindly provided by the Research Institute of Medicinal Plants, Poznan, Poland. Acetonitrile and methanol were of HPLC grade (Fisher Scientific, Loughborough, Leics, UK). Water was purified with Millipore (Billerica, MA, USA) Milli-Q
equipment. All other reagents were of analytical reagent grade. Alkaloid Extraction. The herb or roots of L. inflata (0.5000 g), dried and powdered, were extracted with 1 × 20 ml and 2 × 10 ml of 0.1 N HCl–methanol (1:1, v/v) by sonication (Braun Labsonic U, Melsungen, Germany) for 3 × 10 min. After centrifugation (6,000 rpm for 10 min, 2,500 g) and filtration, the methanol was evaporated and the remaining aqueous phase was diluted to a stock solution (to 25.00 ml) with 0.1 N HCl. Samples of this solution were purified with solid-phase extraction (SPE). Determination of total alkaloid content. The total alkaloid content was determined by a spectrophotometric method [44], elaborated by Mahmoud and El-Masry [29] and modified by Krajewska [22]. Sample preparation by solid phase extraction (SPE) for analysis of alkaloids by HPLC (High Performance Liquid Chromatography). 3 ml Supelclean LC-8 columns (Supelco, Bellefonte, PA, USA), were used for SPE. 10.00 ml of the stock solution was loaded on to the SPE columns, then washed with 2.5 ml water to remove matrix. The alkaloid containing fraction was eluted with 2 × 2.5 ml methanol. According to Kursinszki et al. [23] the recovery of lobeline from the SPE step was total, determined by HPLC. HPLC-DAD conditions. LC analysis was performed on a Surveyor LC system (Thermo Finnigan, San Jose, CA, USA) consisting of a quaternary gradient pump with an integrated degasser, a PDA detector, and an autosampler. Thermo Finnigan ChromQuest 4.0 software was used for data acquisition, processing, and reporting. Compounds were separated on a Knauer Eurospher 100-C8 (5 µm) reversed-phase column (250 × 3 mm i.d.; Berlin, Germany) integrated with a precolumn (5 × 3 mm i.d.). The column temperature was 25 °C and the injection volume 5 µL. The mobile phase was 30:70 (v/v) acetonitrile–0.1% trifluoroacetic acid. The flow-rate was 0.8 ml min-1. The lobeline peak was identified by the addition of authentic standard, by diode-array and MS/MS detection. Quantitative determination of alkaloids by HPLC. Determination of (-)-lobeline was performed by the external standard method. Standard solutions containing lobeline at 2.25 - 80 µg ml-1 were prepared in 0.1 N HCl. The calibration graph for lobeline was constructed by plotting the peak areas against the corresponding concentrations. The concentration of lobeline in samples was calculated from its peak area by use of the calibration plot. Validation studies proved that both the repeatability of the method and the recovery was good [23]. The amounts of lobeline derivatives: norlobeline, norlobelanine and lobelidine were expressed in lobeline.
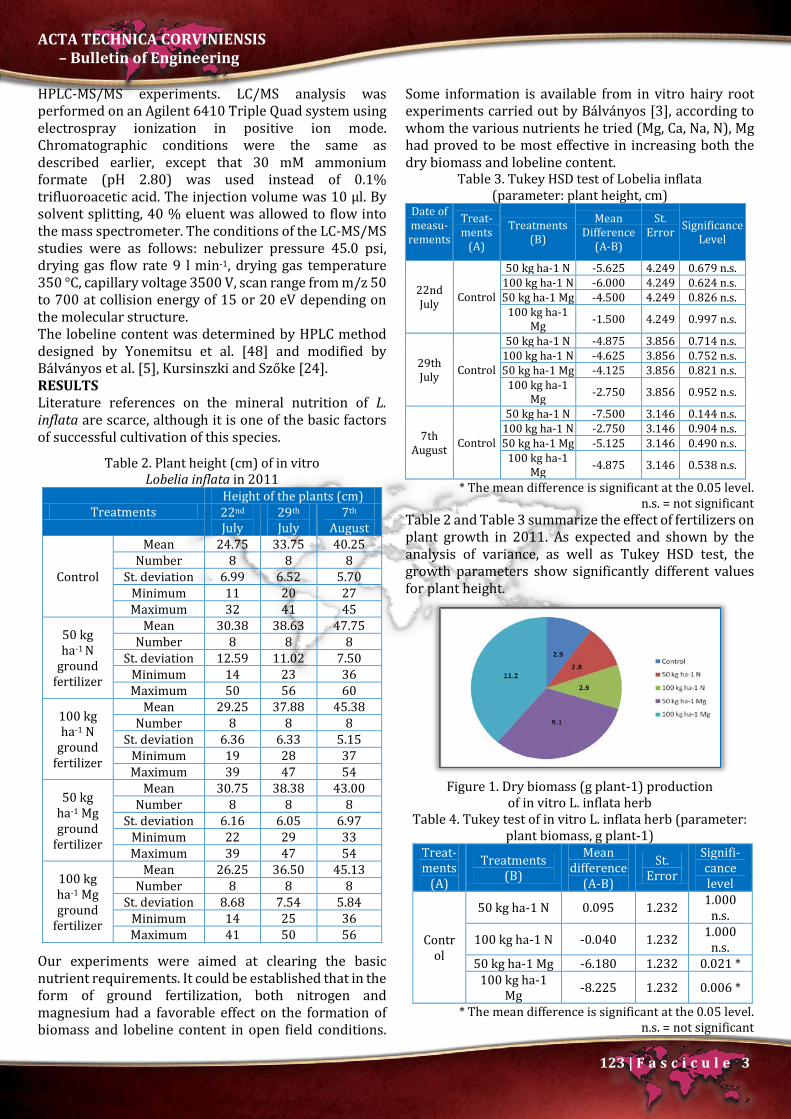
ACTA TECHNICA CORVINIENSIS – Bulletin of Engineering
123 | F a s c i c u l e 3
HPLC-MS/MS experiments. LC/MS analysis was performed on an Agilent 6410 Triple Quad system using electrospray ionization in positive ion mode. Chromatographic conditions were the same as described earlier, except that 30 mM ammonium formate (pH 2.80) was used instead of 0.1% trifluoroacetic acid. The injection volume was 10 μl. By solvent splitting, 40 % eluent was allowed to flow into the mass spectrometer. The conditions of the LC-MS/MS studies were as follows: nebulizer pressure 45.0 psi, drying gas flow rate 9 l min-1, drying gas temperature 350 °C, capillary voltage 3500 V, scan range from m/z 50 to 700 at collision energy of 15 or 20 eV depending on the molecular structure. The lobeline content was determined by HPLC method designed by Yonemitsu et al. [48] and modified by Bálványos et al. [5], Kursinszki and Szőke [24]. RESULTS Literature references on the mineral nutrition of L. inflata are scarce, although it is one of the basic factors of successful cultivation of this species.
Table 2. Plant height (cm) of in vitro Lobelia inflata in 2011
Treatments Height of the plants (cm) 22nd July
29th July
7th August
Control
Mean 24.75 33.75 40.25 Number 8 8 8
St. deviation 6.99 6.52 5.70 Minimum 11 20 27 Maximum 32 41 45
50 kg ha-1 N
ground fertilizer
Mean 30.38 38.63 47.75 Number 8 8 8
St. deviation 12.59 11.02 7.50 Minimum 14 23 36 Maximum 50 56 60
100 kg ha-1 N
ground fertilizer
Mean 29.25 37.88 45.38 Number 8 8 8
St. deviation 6.36 6.33 5.15 Minimum 19 28 37 Maximum 39 47 54
50 kg ha-1 Mg ground
fertilizer
Mean 30.75 38.38 43.00 Number 8 8 8
St. deviation 6.16 6.05 6.97 Minimum 22 29 33 Maximum 39 47 54
100 kg ha-1 Mg ground
fertilizer
Mean 26.25 36.50 45.13 Number 8 8 8
St. deviation 8.68 7.54 5.84 Minimum 14 25 36 Maximum 41 50 56
Our experiments were aimed at clearing the basic nutrient requirements. It could be established that in the form of ground fertilization, both nitrogen and magnesium had a favorable effect on the formation of biomass and lobeline content in open field conditions.
Some information is available from in vitro hairy root experiments carried out by Bálványos [3], according to whom the various nutrients he tried (Mg, Ca, Na, N), Mg had proved to be most effective in increasing both the dry biomass and lobeline content.
Table 3. Tukey HSD test of Lobelia inflata (parameter: plant height, cm)
Date of measu-rements
Treat- ments
(A)
Treatments (B)
Mean Difference
(A-B)
St. Error
Significance Level
22nd July Control
50 kg ha-1 N -5.625 4.249 0.679 n.s. 100 kg ha-1 N -6.000 4.249 0.624 n.s. 50 kg ha-1 Mg -4.500 4.249 0.826 n.s.
100 kg ha-1 Mg -1.500 4.249 0.997 n.s.
29th July Control
50 kg ha-1 N -4.875 3.856 0.714 n.s. 100 kg ha-1 N -4.625 3.856 0.752 n.s. 50 kg ha-1 Mg -4.125 3.856 0.821 n.s.
100 kg ha-1 Mg -2.750 3.856 0.952 n.s.
7th August Control
50 kg ha-1 N -7.500 3.146 0.144 n.s. 100 kg ha-1 N -2.750 3.146 0.904 n.s. 50 kg ha-1 Mg -5.125 3.146 0.490 n.s.
100 kg ha-1 Mg -4.875 3.146 0.538 n.s.
* The mean difference is significant at the 0.05 level. n.s. = not significant
Table 2 and Table 3 summarize the effect of fertilizers on plant growth in 2011. As expected and shown by the analysis of variance, as well as Tukey HSD test, the growth parameters show significantly different values for plant height.
Figure 1. Dry biomass (g plant-1) production
of in vitro L. inflata herb Table 4. Tukey test of in vitro L. inflata herb (parameter:
plant biomass, g plant-1) Treat-ments
(A)
Treatments (B)
Mean difference
(A-B)
St. Error
Signifi-cance level
Control
50 kg ha-1 N 0.095 1.232 1.000 n.s.
100 kg ha-1 N -0.040 1.232 1.000 n.s.
50 kg ha-1 Mg -6.180 1.232 0.021 * 100 kg ha-1
Mg -8.225 1.232 0.006 *
* The mean difference is significant at the 0.05 level. n.s. = not significant

ACTA TECHNICA CORVINIENSIS – Bulletin of Engineering
124 | F a s c i c u l e 3
Figure 1 and Table 4 illustrates the dry biomass values recorded for herbs during growing seasons. The highest value was 11.2 g plant-1 in the 100 kg ha-1 Magnesium treatment groups. The control values were 2.9 g plant-1. Figure 2 and Table 5 shows lobeline content of herbs. The herb was also favourably influenced by the Magnesium fertilization. The lowest values were recorded in the 100 kg ha-1 N ground fertilizer (336 μg g-
1) group. The highest value was in the 100 kg ha-1 Mg fertilizer treatment group (635 μg g-1).
Figure 2. Lobeline content (μg g-1) of Lobelia inflata herb
Table 5. Tukey test of in vitro L. inflata herb (parameter: plant lobeline content, μg g-1)
Treat-ments
(A)
Treatments (B)
Mean difference
(A-B)
St. Error
Signifi-cance level
Control
50 kg ha-1 N -50.250 58.422 0.900
n.s. 100 kg ha-1
N 151.500 58.422 0.207 n.s.
50 kg ha-1 Mg -66.750 58.422 0.781
n.s. 100 kg ha-1
Mg -147.800 58.422 0.221 n.s.
* The mean difference is significant at the 0.05 level. n.s. = not significant
Figure 3 and Table 6 presentation the total alkaloid content of herbs. The lowest values were recorded in the 100 kg ha-1 N ground fertilizer (355 mg 100 g-1) group. The highest value was in the 50 kg ha-1 Mg fertilizer treatment group (514 mg 100 g-1). The control values were 388 mg 100 g-1.
Figure 3. Total alkaloid content (mg 100 g-1)
of Lobelia inflata herb
Table 6. Tukey test of in vitro L. inflata herb (parameter: plant total alkaloid content, mg 100 g-1)
Treat-ments
(A)
Treatments (B)
Mean difference
(A-B)
St. Error
Signifi-cance level
Control
50 kg ha-1 N -65.950 39.446 0.519 n.s.
100 kg ha-1 N 32.400 39.446 0.913
n.s. 50 kg ha-1
Mg -126.650 39.446 0.109 n.s.
100 kg ha-1 Mg -110.850 39.446 0.165
n.s. * The mean difference is significant at the 0.05 level.
n.s. = not significant Table 7 illustrates calculated price for the lobeline content derived from open field cultivated Lobelia inflata plants of different treatment groups, based on yield and price in 2012. The Lobelia herb selling price was $5.6 per 100 capsules (42.5 g) in 2012 [50]. 100 kg ha-1 Mg treatment means a yield of 1,638 kg of dried plant material per hectare. 1% of total plant material was the lobeline content. The 16.38 kg lobeline content price was $ 2,158 per hectare.
Table 7. Calculated price for lobeline in 2012 (parameter: lobeline price ha-1, $)
Treat-ments
Herb dry
mass (g)
Lobeline content (µg g-1)
Plant m2-
1
Lobeline content
ha-1 (µg)
Lobeline price
ha-1 ($)
Control 2.9 487 18 254.21 33.49 50 kg
ha-1 N 2.8 537 18 270.65 35.66
100 kg ha-1 N 2.9 336 18 175.39 23.11
50 kg ha-1 Mg
9.1 554 18 907.45 119.57
100 kg ha-1 Mg
11.2 635 18 1,280 168.66
CONCLUSIONS The results in 2011 indicate that N and Mg fertilization increased growth (height in cm) to 47.75 cm (in the 50 kg ha-1 N fertilization group) compared to 40.25 cm of control. The value measured in the 50 kg ha-1 Mg treatment group was 43.0 cm. The highest dry biomass production (g plant-1) of herb was 11.2 g plant-1 (in the 100 kg ha-1 Mg treatment group). The 50 kg ha-1 Mg ground fertilizer group's value was 9.1 g plant-1. The biomass values were significant in the 50 - and the 100 kg ha-1 Mg treatments. The control value was equal to the value measured in the 100 kg ha-1 N treatment group (2.9 g plant-1). The highest lobeline content (μg g-1) of herb was 635 μg g-1 (in the 100 kg ha-1 Mg treatment group). The value of the control was 487 μg g-1. The 50 kg ha-1 Mg treatment resulted in 554 μg g-1,

ACTA TECHNICA CORVINIENSIS – Bulletin of Engineering
125 | F a s c i c u l e 3
and the 50 kg ha-1 N fertilizer resulted 537 μg g-1 lobeline. There were several economy experiments on lobeline content in the 1970s in the United States. 1% of the dry matter content was lobeline. In the 1970s, selling prices ranged from $0.25 to $0.80 per pound (1 pound = 453 g), which means that a yield of 1,700 pounds (770 kg) of dried plant material would gross $425.00 to $1,360.00 per acre (1 acre = 4,047 m2) [26]. The conclusions of the experiments is, that open field conditions the MgSO4+ and the NH4NO3 treatments were successful for the lobeline production of Lobelia inflata. Acknowledgment This work was supported by the University of West-Hungary, Department of Environmental Science in Mosonmagyaróvár. Thanks for Antal Péter, the botany research worker. The authors want to tank Professor Éva Szőke and Assistant lecturer Péter Bányai (Semmelweis University, Budapest). This work was supported by the Semmelweis University, Department of Pharmacognosy in Budapest. Thanks for Lenke Tóth, the laboratory research worker. This research is supported by EFOP-3.6.1-16-2016-00006 "The development and enhancement of the research potential at Pallasz Athena University" project. The Project is supported by the Hungarian Government and co-financed by the European Social Fund. References [1.] A. Anand, N. Srivastava, H. Raj, V. K. Vijayan, “Influence
codeine on lobeline-induced respiratory reflex and sensations and on ventilation with expertise in healthy subjects,” Respir Physiol Neurol 175:169-175, 2011.
[2.] T. Aoki, H. Matsumoto, Y. Asako, Y. Matsunaga, K. Shimomura, “Variation of alkaloid productivity among several clones of hairy roots and regenerated plants of Atropa belladonna transformed with Agrobacterium rhizogenes,” Plant Cell Rep 16:282–286, 1997.
[3.] I. Bálványos, “Studies on the growth and secondary metabolite production of Lobelia inflata L. hairy root cultures,” PhD theses, Semmelweis University, Budapest, 2002.
[4.] I. Bálványos, É. Szőke, L. Kursinszki, “Effect of magnesium on the growth and alkaloid production of Lobelia inflata L. hairy root cultures. In: Kiss SA (ed) Magnesium and interaction of magnesium with trace elements,” Hung Chem Soc, Budapest, pp 358–361, 1998.
[5.] I. Bálványos, L. Kursinszki, É. Szőke, “The effect of plant growth regulators on biomass formation and lobeline production of Lobelia inflata L. hairy root cultures,” Kluwer Academic Publishers, Printed in the Netherlands, Plant Growth Regulation, 34:339-345, 2001.
[6.] I. Bálványos, É. Szőke, L. Kursinszki, “Effect of macroelements on the growth and lobeline production of Lobelia inflata L. hairy root cultures,” Acta Horticult., 597:245–251, 2003.
[7.] J. S. Beckmann, K. B. Siripurapu, J. R. Nickell, D. B. Horton, E. D. Denehy, A. Vartak, P. A. Crooks, L. P. Dwoskin, M. T. Bardo, “The novel pyrrolidine nor-lobelane analog UKCP-110 [cis-2,5-di-(2-phenethyl)-
pyrrolidine hydrochloride] inhibits VMAT2 function, methamphetamine-evoked dopamine release, and methamphetamine self-administration in rats,” J Pharmacol Exp Ther 335:841-851, 2010.
[8.] R. L. Bell, B. J. Eiler II., J. B. Cook, S. Rahman, “Nicotinic receptor ligands reduce ethanol intake by high alcohol-drinking HAD-2 rats,” Alcohol 43:581-592, 2009.
[9.] L. Bensaddek, F. Gillet, J. Edmundo, N. Saucedo, M. A. Fliniaux, “The effect of nitrate and ammonium concentrations on growth and alkaloid accumulation of Atropa belladonna hairy roots,“ J Biotechnol 85:35-40, 2001.
[10.] B. Bremer, K. Bremer, M. W. Chase, M. F. Fay, J. L. Reveal, D. E. Soltis, P. S. Soltis, P. F. Stevens, ”An update of the Angiosperm Phylogeny Group classification for the orders and families of flowering plants: APG III,” J Linn Soc Bot 161:105-121, 2009.
[11.] H. Breteler, M. Siegerist,” Effect of ammonium on nitrate utilization by roots of dwarf bean,” Plant Physiol 75:1099-1103, 1984.
[12.] D. T. Britto, H. J. Kronzucker, “NH4+ toxicity in higher plants: a critical review,” J Plant Physiol 159:567-584, 2002.
[13.] W. M. Bowden, “Phylogenetic relationships of twenty-one species of Lobelia L. Section Lobelia,” Bull Torrey Bot Club 86:94-108, 1959.
[14.] L. P. Dwoskin, P. A. Crooks, “A novel mechanism of action and potential use for lobeline as a treatment for psychostimulant abuse,” Biochem Pharmacol 63:89-98, 2002.
[15.] L. J. M. Eerden, “Toxicity of ammonia to plants,” Agric Environ 7:223-235, 1982.
[16.] F-X. Felpin, J. Lebreton, “History, chemistry and biology of alkaloids from Lobelia inflata,” Tetrahedron 60:10127-10153, 2004.
[17.] D. Glover, J. M. Rath, E. Sharma, P. N. Glover, M. Laflin, P. Tonnesen, L. Repsher, J. Quiring, “A Multicenter Phase 3 Trial of Lobeline Sulfate for Smoking Cessation,” Am J Health Behav 34:101-109, 2010.
[18.] L. Huzsvai,” Biometric methods in SPSS. Textbook,” University of Debrecen, Faculty of Agriculture, Debrecen, pp 65-66, 2004.
[19.] C. A. Kelly, “Reproductive phenologies in Lobelia inflata (Lobeliaceae) and their environmental control,” Am J Bot 79:1126-1133, 1992.
[20.] D. J. Kim, H. N. Chang, “Enhanced shikonin production from Lithospemum erythrorhizon by in situ extraction and calcium alginate immobilization,” Biotechnol Bioeng 36:460-466, 1990.
[21.] M. Kino-Oka, M. Taya, S. Tone, “Evaluation of inhibitory effect of ammonium ion on cultures of plant hairy roots,” J Chem Eng Jpn 26:578-580, 1993.
[22.] A. Krajewska, “The effect of new type of growth regulators on the Lobelia inflata L. tissue cultures (in Hungarian),” PhD theses, Semmelweis University, Budapest, 1986.
[23.] L. Kursinszki, K. Ludányi, É. Szőke, “LC-DAD and LC-MS-MS Analysis of Piperidine Alkaloids of Lobelia inflata L. (In Vitro and In Vivo),” Chromatographia 68:27-33, 2008.

ACTA TECHNICA CORVINIENSIS – Bulletin of Engineering
126 | F a s c i c u l e 3
[24.] L. Kursinszki, É. Szőke, “HPLC-ESI-MS/MS of brain neurotransmitter modulator lobeline and related piperidine alkaloid sin Lobelia inflata L,” J Mass Spectrom 50:727-733, 2015.
[25.] A. Krochmal, L. Wilken, M. Chien, “Lobeline Content of Lobelia inflata: Structural, Environmental and Developmental Effects. U.S.D.A. Forest Service Research Paper NE- 178,” Northeastern Forest Experiment Station, Upper Darby, PA. Forest Service, U.S. Department of Agriculture, 1970.
[26.] A. Krochmal, L. Wilken, M. Chien, “Plant and Lobeline harvest of Lobelia inflata L. Respectively Principal Economic Botanist, Southeastern Forest Experimental Station, Forest Service, U.S.D.A., Auburn University,” Auburn, Alabama. pp. 216-220, 1971.
[27.] Y. Lee, D-E. Lee, H-S. Lee, S-K. Kim, W. S. Lee, S-H. Kim, M-W. Kim, “Influence of auxins, cytokinins, and nitrogen on production of rutin from callus and adventitious roots of the white mulberry tree (Morus alba L.),” Plant Cell Tiss Organ Cult 105:9-19, 2011.
[28.] Y. Ma, M. Wink, “Lobeline, a piperidine alkaloid from Lobelia can reverse P-gp dependent multidrug resistance in tumor cells,” Phytomedicine 15:754-758, 2008.
[29.] Z. F. Mahmoud, S. El-Masry, “Colorimetric determination of lobeline and total alkaloids in Lobelia and its preparations,” Sci Pharm 48:365-369, 1980.
[30.] D. K. Miller, J. R. Lever, K. R. Rodvelt, J. A. Baskett, M. J. Will, G. R. Kracke, “Lobeline, a potential pharmacotherapy for drug addiction, binds to μ opioid receptors and diminishes the effects of opioid receptor agonists,” Drug Alcohol Depend 89:282-291, 2007.
[31.] L. Murray, W. C. Dennison, W. M. Kemp, “Nitrogen versus phosphorus limitation for growth of an estuarine population of eelgrass (Zostera marina L.),” Aquat Bot 44:83-100, 1992.
[32.] P. Nussbaumer, I. Kapétanidis, P. Christen, “Hairy roots of Datura candida x D. aurea: effect of culture medium composition on growth and alkaloid biosynthesis,” Plant Cell Reports 17:405-409, 1998.
[33.] I. Smetanska, “Production of secondary metabolites using plant cell cultures,” Adv Biochem Eng Biotechnol 111:197-228, 2008.
[34.] B. Sugiharto, T. Sugiyama, “Effects of nitrate and ammonium on gene expression of phosphoenolpyruvate carboxylase and nitrogen metabolism in maize leaf tissue during recovery from nitrogen stress,” Plant Physiol 98:1403-1408, 1992.
[35.] L. Szabó, “Herbs and plant foods,” Melius scholarship p 113, 2009.
[36.] É. Szőke, Á. Máthé, “GVOP 3.1.1.-2004-05-0309/3.0 report of research,” NKTH, Budapest, 2007.
[37.] M. Takács-Hájos, L. Szabó, I-né. Rácz, Á. Máthé, É. Szőke, “The effect of Mg-leaf fertilization on Quality parameters of some horticultural species,” Cereal Res Commun 35:1181-1184, 2007.
[38.] M. Taya, M. Kino-Oka, S. Tone, T. Kobayashi, “A kinetic model of branching growth of plant hairy roots,” J Chem Eng Jpn 22:698-700, 1989.
[39.] I. A. Veliky, D. Rose, “Nitrate and ammonium as nitrogen nutrients for plant cell culture,” Can J Bot 51:1834-1844, 1973.
[40.] F. Vermeulen, “Concordant Materia Médica,” Merlijn Publishers, Haarlem, 1994.
[41.] V. J. Vojnich, Á. Máthé, R. Gaál, Sz. Tüű, “Botanical and chemical variability of Indian tobacco (Lobelia inflata L.),” Acta Agronomica Óváriensis 53:37-48, 2011.
[42.] V. J. Vojnich, Á. Máthé, É. Szőke, “Comparison of the production of Indian tobacco (Lobelia inflata L.) propagated in vitro and in vivo,” 34th Óvári Science Day, Mosonmagyaróvár, Hungary, pp 537-542, 2012a.
[43.] V. J. Vojnich, Á. Máthé, É. Szőke, R. Gaál, “Effect of Mg treatment on the production of Indian tobacco (Lobelia inflata L.),” Acta Hort 955:125-128, 2012b.
[44.] V. J. Vojnich, Á. Máthé, É. Szőke, P. Bányai, F. Kajdi, R. Gaál, “Effect of nitrogen and magnesium nutrition on Indian tobacco (Lobelia inflata L.),” J Cent Eur Agric 14:77-85,2013.
[45.] V. J. Vojnich, “Study of the Indian tobacco (Lobelia inflata L.) productions, specifically the plant grows in Hungary,” PhD theses, University of West-Hungary, Mosonmagyaróvár, 2014.
[46.] J. Pető, A. Hüvely, V. J. Vojnich, I. Cserni, “Effect of nitrogen on the growth and ingredients of celery,” TEAM 2016. 8th International Scientific and Expert Conference, Trnava, Slovakia, pp. 312-316, 2016.
[47.] R. C. Wang, K. Guegler, S. T. La Brie, N. M. Crawford, “Genomic analysis of a nutrient response in Arabidopsis reveals diverse expression patterns and novel metabolic and potential regulatory genes induced by nitrate,” Plant Cell 12:1491-1509, 2000.
[48.] H. Yonemitsu, K. Shimomura, M. Satake, S. Mochida, M. Tanaka, T. Endo, A. Kaji, “Lobeline production by hairy root culture of Lobelia inflata L.,” Plant Cell Rep 9:307-310, 1990.
[49.] J. J. Zhong, “Biochemical engineering of the production of plant-specific secondary metabolites by cell suspension cultures,” Adv Biochem Eng Biotechnol 72:1-26, 2001.
[50.] http://www.amazon.com/Natures-Way-Lobelia-HerbCapsules/dp/B000I4AIDM/ref=cm_cr_pr_product_top (2012)
copyright ©
University POLITEHNICA Timisoara, Faculty of Engineering Hunedoara,
5, Revolutiei, 331128, Hunedoara, ROMANIA http://acta.fih.upt.ro

© copyright Faculty of Engineering – Hunedoara, University POLITEHNICA Timisoara
ACTA TECHNICA CORVINIENSIS – Bulletin of Engineering Tome X [2017] Fascicule 3 [July – September] ISSN: 2067 – 3809
1.Ayyakannu Palamalai VIJAYAKUMAR, 2.N.Ramakrishnan DEVI ANALYSIS, SIMULATION AND EXPERIMENTAL RESULTS OF SMPS SYSTEM USING FORWARD CONVERTER WITH RCD SNUBBER 1. Department of Electrical and Electronics Engineering, JNT University. Telangana, Hyderabad, INDIA 2. Department of Computer Science and Engineering, Panimalar Engineering College, Chennai, INDIA Abstract: A Closed loop controlled DC to DC forward converter is a requisite for the server SMPS system. High efficiency, Isolation, Steady state voltage, Transient response, High switching frequency, reduced noises and range of steady state are all necessary requirements for the forward converter. In this paper, a 40 V forward converter system with RCD snubber is used for charging the battery of server SMPS is proposed. The proposed converter consists of a snubber circuit on the primary side and an isolation transformer and a rectifier structure on the secondary side. This paper proposed the simulation results of the forward converter with RCD snubber and it is implemented with PIC microcontroller. From comparison of performance against the simulation model with the experimental model, a suitable converter is proposed for the sever SMPS system. A 40 V proposed circuit is designed as experimental model to verify and compare it with the simulation and experimental results. This paper proposed the simulation and experimental results of the forward converter system. Keywords: Embedded microcontroller, Zero voltage switching, Zero current switching, Reset voltage, Clamping diode and Voltage stress INTRODUCTION In recent years, the switching mode power supply (SMPS) system has been achieved with high power density and high performances by using power semiconductor devices such as IGBT, MOS-FET and SiC. However, using the switching power semiconductor in the SMPS system, the problem of the switching loss and EMI/RFI noises has been closed up. This course produced the EMC limitation like the International Special Committee on Radio Interference (CISPR) and the limitation of harmonics for the International standard is Electro technical Commission (IEC). For keeping up with the limitation, the SMPS system must add its system to the noise filter and the metal and magnetic component shield for the EMI/RFI noises and to the PFC converter circuit and the large input filter for the input harmonic current. On the other hand, the power semiconductor device technology development can achieve the high frequency switching operation in the SMPS system. The increases of the switching losses have occurred by this high frequency switching operation. The inductor and transformer size has been reduced by the high frequency switching, while the size
of cooling fan could be huge because of the increase of the switching losses. Our research target is to reduce the ripple and the switching losses in the SMPS system. One method is the soft switching technique and the other method is by proper choosing of filter circuit. This technique can minimize the switching power losses of the power semiconductor devices, and reduce their electrical dynamic and peak stresses, voltage and current surge-related EMI/RFI noises under high frequency switching strategy. Thus, a new conceptual circuit configuration of the double forward type DC - DC converter circuit is presented in this paper with its operating principle. In addition, it’s fundamental operation and its performance characteristics of the proposed forward type DC-DC double forward converter treated here are evaluated on the basis of experimental results. A New Controller scheme for Photo voltaics power generation system is presented in [1]. The design and implementation of an adaptive tuning system based on desired phase margin for digitally controlled DC to DC Converters is given in [2]. Integration of frequency response measurement capabilities in digital controllers for DC to DC Converters

ACTA TECHNICA CORVINIENSIS – Bulletin of Engineering
128 | F a s c i c u l e 3
is given in [3]. A New single stage, single phase, full bridge converter is presented in [4]. The Electronic ballast control IC with digital phase control and lamp current regulation is given in [5]. A New soft-switched PFC Boost rectifier/inverter is presented in [6]. Design of Single-Inductor Multiple-Output DC-DC Buck Converters is presented in [7]. Boost Converter with Improved Performance through RHP Zero Elimination is given by [8]. High-efficiency dc-dc converter with high voltage gain and reduced switch stress is given in [9]. Snubber design for noise reduction is given in [10].Comparison of active clamp ZVT techniques applied to tapped inductor DC-DC converter is given in [11].The multiple output AC/DC Converter with an internal DC UPS is given in [12].The Bi-directional isolated DC-DC Converter for next generation power distribution –comparison of converters using Si and Sic devices is given in [13]. The simulation and the experimental method of analysis are done for the low noise SMPS system which is demonstrated in [14]. Investigations on forward converter using different types of filters and experimental method of analysis for the forward converters are done, which is to compare it with the conventional circuit are clearly mentioned in [15]. Different types of filters which are utilized in the forward converters and its performance are given in [16]. Forward converter with RCD snubber using the PI controller, fuzzy controller and artificial neural network (ANN) controller are analyzed and compared to get the better performance in [17]. Analysis and reduction of voltage ripple in forward converter using a three different filters and based on the comparison, the Bi-quad high frequency filter gives better performance is illustrated in [18]. The above literature does not deal with the comparison of forward converter with RCD snubber and its experimental work implemented with PIC microcontroller. The above cited papers do not deal also with the modeling of SMPS system and do not identify a converter suitable for SMPS system. This work aims to develop simulink models for the forward converter system with RCD snubber and it is implemented with PIC microcontroller. The simulation and experimental results are compared to determine the deterministic value. A comparison is also done to find the circuit suitable for the server SMPS system. SMPS SYSTEM This section introduces the circuit diagram of a SMPS system which is illustrated in Figure 1. SMPS produces DC voltage required by the chips of a digital computer. The size of the converter in SMPS can be reduced by using high frequency converters. In this configuration an investigations on forward converter based DC to DC converter. The obtained DC voltage from the boost chopper circuit is converted into AC by the high
frequency switching. The high frequency AC voltage is induced in the transformer primary and the scaled down voltage appears across the transformer secondary. The obtained low frequency AC voltage from the secondary of the transformer is converted into DC by the half – bridge rectifier circuit, and the power is filtered by the LC-filter, π-filter, high frequency cascaded filter and transferred to the load. The target of the research is to do investigations on the forward converter to develop an efficient SMPS system and it is implemented with PIC microcontroller. The simulation and experimental results are compared to determine the deterministic value. A comparison is also done to find the circuit suitable for the server SMPS system.
Figure 1. Circuit diagram of a SMPS system
SIMULATION PARAMETERS The simulation parameters for the forward converter with RCD snubber is shown in Table 1. From the given parameters, the system is modeled using MATLAB-Simulink and simulated which is to check the performance of the system.
Table 1. Simulation Parameters for the forward converter with RCD snubber
S.No: Parameters [Unit] Values & Items 1 Input voltage [V] 100 2 Output voltage [V] 38.8 3 Switching frequency [kHz] 20 4 Transformer ratio [Vrms] 2:1 5 Snubber capacitance [µf] 5000e-6 6 Snubber resistance [Ω] 10
DESIGN OF THE CONVERTER CIRCUIT The necessary specifications assumed for the forward converter with RCD snubber are Input voltage Vin =100 V, Inductance (Lf) =10e-6, Capacitance (Cf2) =10e-6, Snubber capacitance (C) =5000e-6, snubber resistance (R) =10 Ω and RL=10 Ω. By using the relation, f=1/T, Given time=50 µs, then f=20 kHz, By using the formula, E1 = 4.44 f ΦmN1 Volt, then N1=100 turns and by using the relation N2= (E2/E1) N1, then N2= 88 turns. The transformer voltage ratio k=E2/E1 = 0.9 and by using the relation, I0=VO/R=3.88 Amps. The voltage across the main switch during turn off, MVDS= VRST+Vg=Vg/1-D, by using the primary voltage=90.49 with the ratio of (1-frequency=20*10^3), then the MVDS= -4.523*10-03.

ACTA TECHNICA CORVINIENSIS – Bulletin of Engineering
129 | F a s c i c u l e 3
SIMULATION RESULTS The SMPS system is modeled and simulated using the blocks of MATLAB SIMULINK. The simulation parameters for the forward converter with RCD snubber is given in Table 1. The forward converter with RCD snubber is shown in Figure 2.a. DC input voltage is shown in Figure 2.b. Driving pulses for the main switch M is shown in Figure 2.c. Primary and secondary voltages of the transformer are shown in Figure 2.d and Figure 2.e. DC output voltage is shown in Figure 2.f. The output current is shown in Figure 2.g. Variation of efficiency with the input voltage is shown in Figure 2.h. Forward converter with RCD snubber at variable load and variable frequency are given in Table 2.
Figure 2.a. Converter with RCD snubber
Figure 2.b. DC input voltage
Figure 2.c. Driving pulses for switch M
Figure 2.d. Transformer primary voltage
Figure 2.e Transformer secondary voltage
Figure 2.f DC output voltage
Figure 2.g. Output current
Figure 2.h Variation of efficiency with input voltage

ACTA TECHNICA CORVINIENSIS – Bulletin of Engineering
130 | F a s c i c u l e 3
Table.2: Forward converter with RCD snubber at variable load with frequency
S.No: Load
Resistance R
L (Ω)
Output Voltage
VO
(Volts) Frequency
(kHz)
Load Current
IL (Amps)
1 10 38.8 5 3.13 2 20 39.11 10 2.84 3 30 39.22 15 2.80 4 40 39.27 20 2.63 5 50 39.31 25 2.52
HARDWARE PARAMETERS The hardware parameters for the forward converter with RCD snubber is shown in Table 3. From the given parameters, the system is designed and modeled using PIC-Microcontroller which is to check the performance of the system.
Table 3: Hardware Parameters for the forward converter with RCD snubber
No: Parameters [Unit] Values and Items
1. Input Voltage [V] 100 2. Load Resistance [Ω] 10 3. Output Voltage Vo [V] 40 4. Switching frequency [KHZ] 20 5. Smoothing Capacitor C1,Cf [µf] 90e-6, 90e-6 6. Smoothing Inductor L [mH] 10e-6
7. Capacitance of Snubber circuit 5000e-6 8. Resistance of Snubber circuit 10 ohm 9. Power MOSFET IRF 840
10. Power Diode IN4007
EXPERIMENTAL RESULTS Experimental set-up of a forward converter with RCD snubber circuit is developed using PIC microcontroller. The PIC microcontroller PIC16F84A is used to generate the driving pulses for the main switch, to turn on and off to process and the experimental results are obtained. The low noise SMPS System with forward type switching with RCD snubber circuit is designed and the hardware module is shown in Figure 5.a.
Figure 5.a. Hardware model of forward converter
using microcontroller
Figure 5.b. Driving pulses for the main switch M
The PIC Microcontroller 16F84A is used to generate the driving pulses for the main switch ‘M’ is shown in the oscillogram of Figure 5.b. Primary and the secondary voltages of the transformer are shown in the oscillogram of Figure 5.c and Figure 5.d. The DC output voltage is shown in the oscillogram of Figure 5.e., and the output voltage across 50 ohm resistance is shown in Figure 5.f. Hardware parameter for the forward converter system is given in Table 3. The experimental results are obtained for forward converter with RCD snubber at variable load and variable frequency are given in Table 4. The comparison between simulation and experimental results are given in Table 5.
Figure 5.c. Primary voltage of the transformer
Figure 5.d. Secondary voltage of the transformer

ACTA TECHNICA CORVINIENSIS – Bulletin of Engineering
131 | F a s c i c u l e 3
Figure 5.e. DC output voltage
Figure 5.f. DC output voltage across the variable
load resistance
Table 4: Experimental results for converter with RCD snubber at variable load with frequency
No: Load
Resistance R
L (Ω)
Output Voltage
VO
(Volts)
Frequency (kHz)
Load Current
IL (Amps)
1 10 37.3 5 3.10 2 20 37.6 10 2.76 3 30 38.0 15 2.70 4 40 38.3 20 2.53 5 50 38.9 25 2.49
Table 5: Comparison between the simulation results of the converter and the experimental results of the converters at
variable load
No. Load
Resistance R
L(Ω)
Output Voltage VO(Volts)
Simulation Results
Experiment Results
1 10 38.8 37.3 2 20 39.11 37.6 3 30 39.22 38.0 4 40 39.27 38.3 5 50 39.31 38.9
CONCLUSION Forward converter with RCD snubber system is simulated using the blocks of MATLABSIMULINK. This system is designed and implemented as hardware model and tested in the laboratory and the results are obtained. The simulation results and the experimental results of the forward converter system with RCD snubber are compared. The forward converter system has reduced the noise in the output. From the results, it is observed that the forward converter is suitable for the SMPS System. From the results, it is observed that the experimental results closely agree with the simulation results. References: [1.] Tamer T.N. Khabib, Azah Mohamed, Nowshad
Admin, A New Controller Scheme for Photo voltaics power generation system, European journal of scientific research, vol.33, No.3, 2009, pp.515-524
[2.] J. Morroni, R. Zane, D. Maksimovic, Design and Implementation of an adaptive tuning system based on desired phase margin for digitally controlled DC-DC Converters, IEEE Trans. Power Electron, vol.24, no.2, 2009, pp.559-564
[3.] M. Shirazi, J. Morroni, A. Dolgov, R. Zane, D. Maksimovic, Integration of frequency response measurement capabilities in digital controllers for DC-DC Converters, IEEE Trans. Power Electron., vol.23, no.5, 2008, pp.2524-2535,
[4.] Hugo Ribeiro, Beatriz V. Borges, New single stage, single phase, full Bridge Converter, submitted for appreciation to the Technical committee of IEEE ECCE-Energy conversion congress and exhibition, 2009.
[5.] [5]. Y.Yin, M.Shirazi, R.Zane,”Electronic Ballast control IC with digital phase control and lamp current regulation, ”IEEE Trans. Power Electron., vol. 23, no.1, 2008, pp.11-18,
[6.] [6]. Yungtaek Jang, David L.Dillman and Milan M. Javanovie, A New soft-switched PFC Boost Rectifier with Integrated Flyback Converter for stand–by Power, IEEE Trans. on Power Electronics, 2006, No.1. pp. 66-72
[7.] M. Belloni, E. Bonizzoni, and F. Maloberti, “On the Design of Single-Inductor Multiple-Output DC-DC Buck Converters”, Proc. of 2008 International Symposium on Circuit and Systems (ISCAS), pp. 3049-3052,May 2008.
[8.] S.Kapat, A. Patra, and S. Banerjee, “A Current Controlled Tri-State Boost Converter with Improved Performance through RHP Zero Elimination”, IEEE Transactions on Power Electronics, Vol. 24, No.3, pp. 776-786, March 2009.
[9.] R.J. Wai, C. Lin and Y. Chang, “High-efficiency dc-dc converter with high voltage gain and reduced switch stress”, IEEE Transactions on Power Electronics, vol. 54, no.1, Feb,. 2007.
ACTA TECHNICA CORVINIENSIS – Bulletin of Engineering
132 | F a s c i c u l e 3
[10.] S.Havanur, “Snubber design for noise reduction in switching circuits, ”Alpha & Omega Semiconductor, Tech. Rep., 2007.
[11.] S.Abe, T. Ninomiya, Comparison of Active-Clamp and ZVT Techniques Applied to Tapped-Inductor DC-DC Converter with Low Voltage and High Current, Journal of Power Electronics, Vol.2, No.3, pp.199-205, 2002.
[12.] Arturo Fernandez, Javier sebastin, Maria Hernando, Multiple output AC/DC Converter with an Internal DCUPS, IEEE Trans on Industrial Electronics, vol.53.no.1, 2006.
[13.] Aggeler, D, Inove, S., Akagi, H., Kolar, J.W, Bidirectional isolated DC to DC Converter for next generation power distribution-comparison of converters using Si and SiC devices, Power conversion conference-agoya, 07, 2007 pp. 510-517.
[14.] Vijayakumar P, Rama Reddy S, Simulation and Experimental Results of Low Noise SMPS System using Forward Converter” in the Asian Power Electronics Journals (APEJ), Vol.9, No.1, 2015, pp. 1-7.
[15.] Palamalai Vijayakumar A, Ramakrishnan Devi, Simulation and experimental analysis of forward converters” LAP-Lambert Academic Publishing, Germany, 2016, pp. 121
[16.] Palamalai VijayaKumar A, Ramakrishnan Devi, Investigations on forward converters using LC, PI and Bi-quad high frequency filters, LAP-Lambert Academic Publishing, Germany, 2016, pp. 149,
[17.] Vijayakumar P, Devi.R, Closed loop controlled forward converter with RCD Snubber using PI, fuzzy logic and artificial neural network controller, Annals of “DUNAREA DE JOS” University of Galati, Fascicle III, 2016, Vol.39, No.2
[18.] P.Vijayakumar and Ramakrishnan Devi, Analysis and reduction of voltage ripple in forward converter using a bi-quad HF filter, ANNALS of Faculty Engineering Hunedoara – International Journal of Engineering, Tome XV [2017] – Fascicule 1 [February], pp. 97-102
copyright ©
University POLITEHNICA Timisoara, Faculty of Engineering Hunedoara,
5, Revolutiei, 331128, Hunedoara, ROMANIA http://acta.fih.upt.ro

© copyright Faculty of Engineering – Hunedoara, University POLITEHNICA Timisoara
ACTA TECHNICA CORVINIENSIS – Bulletin of Engineering Tome X [2017] Fascicule 3 [July – September] ISSN: 2067 – 3809
1.Ruslans SMIGINS
EXPERIMENTAL EVALUATION OF LOW LEVEL BIOETHANOL-GASOLINE BLENDS ON ENGINE PERFORMANCE AND EMISSIONS 1. Latvia University of Agriculture, Faculty of Engineering, LATVIA Abstract: The paper presents the results of experimental research of two low level bioethanol-gasoline blends E5 (5% bioethanol, 95% gasoline) and E10 (10% bioethanol, 90% gasoline) tested on Toyota Corolla vehicle on chassis dynamometer. The analysis of obtained results has showed that the increase of engine power and fuel consumption is slightly higher for both blends compared to gasoline, showing better perspectives for E5 than E10. Emission tests have shown increase of CO2 and NOx emissions for all mentioned fuels and testing conditions, as also decrease of CO and HC. The addition of bioethanol has left a positive impact on unregulated emissions, showing better reduction than for regulated emissions. Keywords: bioethanol, gasoline, emissions, power, fuel consumption INTRODUCTION The use of ethanol as a transport fuel has a large history. Firstly it was used as a fuel for German’s inventor Nicholas Otto prototype of today’s well known four stroke Otto-cycle internal combustion engine, but the largest popularity it gets after the use in Henry Ford’s model T in 1908, and also in other designed automobiles for ethanol use in 1920-s, which were designed to use corn alcohol. Different ethanol-gasoline mixtures were popular between World War I (WWI) and WWII and were used as an octane booster and were also in demand during WWII due to a fuel shortage. One of the most popular blends, which were used in last century and is also used nowadays, is E10 or also known as ”gasohol”, which is a fuel mixture of 10% anhydrous ethanol and 90% gasoline and practically can be used also in modern SI engines without any modification of the engine or fuel system. Therefore, nowadays it is also used in more than 20 countries around the world. Other well-known blends are E5 and E7. First one is widely used around the Europe as it is introduced as mandate blend in many EU countries, even in Latvia, to increase the share of biofuels in the conventional gasoline and fulfil Biofuels Directive (Directive 2003/30/EC). Despite of that, new increase could be possible in the future to
achieve Renewable Energy Directive (Directive 2009/28/EC) target reaching 10% share of renewable energy in transport till year 2020, which is also outlined in National Action Plans of EU Member States. In previous period reaching of outlined plans was not realized fully therefore EU Member States have to find a way how to increase biofuel consumption in their countries based on a new Directive. There are different solutions on how it could be realized: expanding the use of biofuels in non-road transport, applying high blends in road transport in niche application or increase the current blending limits till 10% (Kampman et al, 2013). The last one option is most promising, but performing it still has some barriers (Smigins and Shipkovs, 2014), especially those ones connected with customers – drivers usually are looking cautiously on any new fuel (like, E10) despite of slightly lower price, explaining it with fears to damage engines resulting the loss of the warranty on the car. In any case introduction of such type of fuel could help to increase the market for bioethanol, but only in combination with a reduction of the price. It is known that E10 practically does not leave any damage to the fuel system and can be used in largest part of vehicles
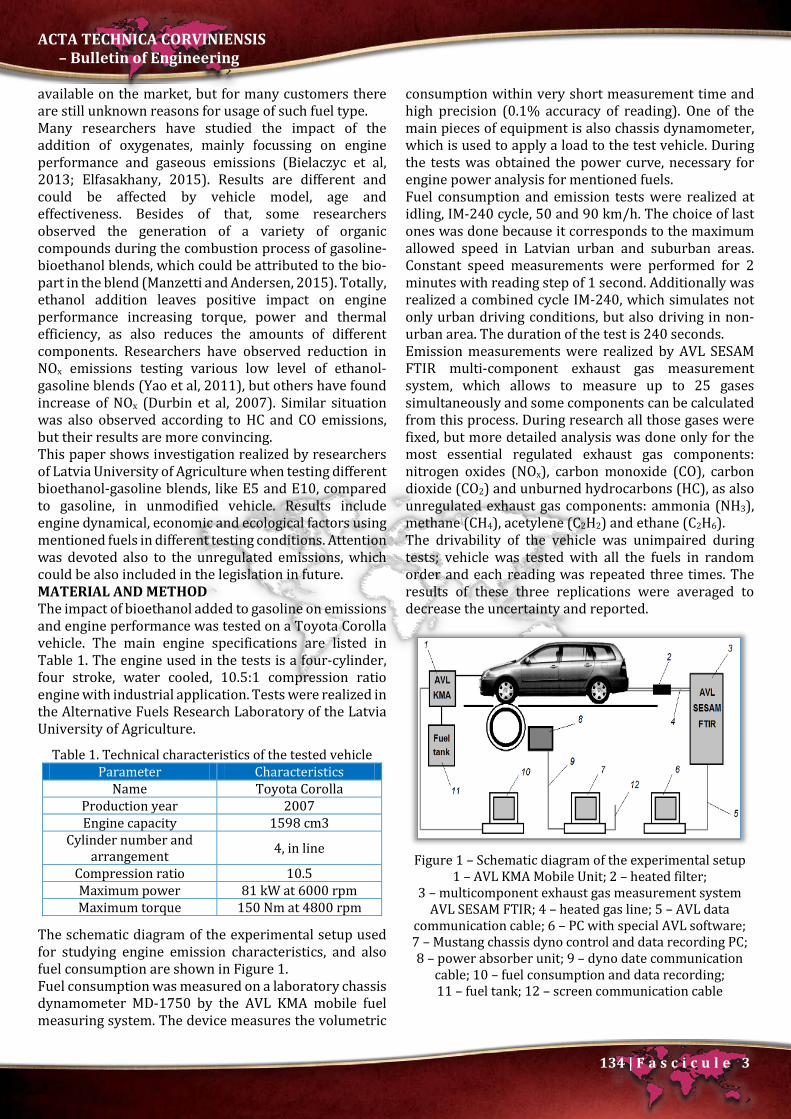
ACTA TECHNICA CORVINIENSIS – Bulletin of Engineering
134 | F a s c i c u l e 3
available on the market, but for many customers there are still unknown reasons for usage of such fuel type. Many researchers have studied the impact of the addition of oxygenates, mainly focussing on engine performance and gaseous emissions (Bielaczyc et al, 2013; Elfasakhany, 2015). Results are different and could be affected by vehicle model, age and effectiveness. Besides of that, some researchers observed the generation of a variety of organic compounds during the combustion process of gasoline-bioethanol blends, which could be attributed to the bio-part in the blend (Manzetti and Andersen, 2015). Totally, ethanol addition leaves positive impact on engine performance increasing torque, power and thermal efficiency, as also reduces the amounts of different components. Researchers have observed reduction in NOx emissions testing various low level of ethanol-gasoline blends (Yao et al, 2011), but others have found increase of NOx (Durbin et al, 2007). Similar situation was also observed according to HC and CO emissions, but their results are more convincing. This paper shows investigation realized by researchers of Latvia University of Agriculture when testing different bioethanol-gasoline blends, like E5 and E10, compared to gasoline, in unmodified vehicle. Results include engine dynamical, economic and ecological factors using mentioned fuels in different testing conditions. Attention was devoted also to the unregulated emissions, which could be also included in the legislation in future. MATERIAL AND METHOD The impact of bioethanol added to gasoline on emissions and engine performance was tested on a Toyota Corolla vehicle. The main engine specifications are listed in Table 1. The engine used in the tests is a four-cylinder, four stroke, water cooled, 10.5:1 compression ratio engine with industrial application. Tests were realized in the Alternative Fuels Research Laboratory of the Latvia University of Agriculture.
Table 1. Technical characteristics of the tested vehicle Parameter Characteristics
Name Toyota Corolla Production year 2007 Engine capacity 1598 cm3
Cylinder number and arrangement 4, in line
Compression ratio 10.5 Maximum power 81 kW at 6000 rpm Maximum torque 150 Nm at 4800 rpm
The schematic diagram of the experimental setup used for studying engine emission characteristics, and also fuel consumption are shown in Figure 1. Fuel consumption was measured on a laboratory chassis dynamometer MD-1750 by the AVL KMA mobile fuel measuring system. The device measures the volumetric
consumption within very short measurement time and high precision (0.1% accuracy of reading). One of the main pieces of equipment is also chassis dynamometer, which is used to apply a load to the test vehicle. During the tests was obtained the power curve, necessary for engine power analysis for mentioned fuels. Fuel consumption and emission tests were realized at idling, IM-240 cycle, 50 and 90 km/h. The choice of last ones was done because it corresponds to the maximum allowed speed in Latvian urban and suburban areas. Constant speed measurements were performed for 2 minutes with reading step of 1 second. Additionally was realized a combined cycle IM-240, which simulates not only urban driving conditions, but also driving in non-urban area. The duration of the test is 240 seconds. Emission measurements were realized by AVL SESAM FTIR multi-component exhaust gas measurement system, which allows to measure up to 25 gases simultaneously and some components can be calculated from this process. During research all those gases were fixed, but more detailed analysis was done only for the most essential regulated exhaust gas components: nitrogen oxides (NOx), carbon monoxide (CO), carbon dioxide (CO2) and unburned hydrocarbons (HC), as also unregulated exhaust gas components: ammonia (NH3), methane (CH4), acetylene (C2H2) and ethane (C2H6). The drivability of the vehicle was unimpaired during tests; vehicle was tested with all the fuels in random order and each reading was repeated three times. The results of these three replications were averaged to decrease the uncertainty and reported.
Figure 1 – Schematic diagram of the experimental setup
1 – AVL KMA Mobile Unit; 2 – heated filter; 3 – multicomponent exhaust gas measurement system
AVL SESAM FTIR; 4 – heated gas line; 5 – AVL data communication cable; 6 – PC with special AVL software; 7 – Mustang chassis dyno control and data recording PC; 8 – power absorber unit; 9 – dyno date communication
cable; 10 – fuel consumption and data recording; 11 – fuel tank; 12 – screen communication cable

ACTA TECHNICA CORVINIENSIS – Bulletin of Engineering
135 | F a s c i c u l e 3
The engine was operated on the gasoline (E0), meeting EN 228:2004 standard, and two blends containing: » 5% (v/v) of bioethanol with 95% (v/v) of gasoline
(mixture code: E5); » 10% (v/v) of bioethanol with 90% (v/v) of gasoline
(mixture code: E10). Tested blends were prepared just before the experiments by splashing mixing technique in the proportions mentioned before. RESULTS The experimental data which characterize the variation of engine dynamical, economic and ecological factors using different fuels could be seen in figure below. According to test results, it could be seen increase in power with the addition of bioethanol, which could be explained by the density of the mixture and the engine volumetric efficiency, which increases based on the concentration of bioethanol increase and resulting in engine power increase. In current research it was observed the largest increase in power in range of 2000 till 3000 rpm, which is 5.2% at 2000 rpm for E5 and 5.6% at 3000 rpm for E10 (see Figure 2). There was not observed significant increase in engine power in other speed ranges.
Figure 2 – Power curves for different fuels
Based on the fuel consumption data obtained in experiments and presented in Figure 3, it was observed an increase in fuel consumption with the addition of bioethanol in all testing conditions. Results for E5 were slightly similar comparing to gasoline and have not shown such rapid increase as E10. Largest differences were observed during idling – increase by 0.53% for E5 compared to E0 and by 1.42% for E10 compared to E0 – and during operation in 50 km/h: increase by 0.55% for E5 compared to E0 and by 1.38% for E10 compared to E0. Increase of fuel consumption could be explained by lower heating value of each additional bioethanol-gasoline blend instead of gasoline.
Figure 3 – Fuel consumption results
in different testing conditions » regulated emissions Positive effect of bioethanol addition firstly could be observed according to emission reduction due to its oxygen content, which favours the further improvement of gasoline combustion.
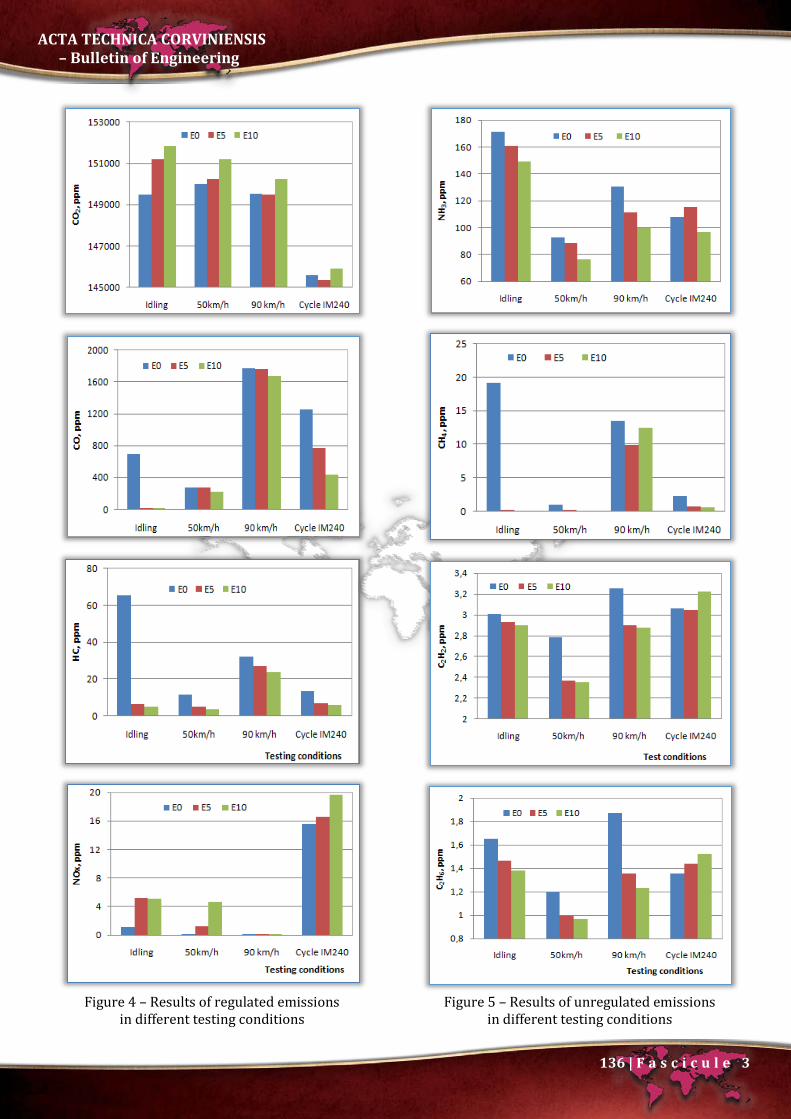
ACTA TECHNICA CORVINIENSIS – Bulletin of Engineering
136 | F a s c i c u l e 3
Figure 4 – Results of regulated emissions
in different testing conditions
Figure 5 – Results of unregulated emissions
in different testing conditions

ACTA TECHNICA CORVINIENSIS – Bulletin of Engineering
137 | F a s c i c u l e 3
This is observed also in current tests, where was found considerable decrease of CO and HC emissions in all testing conditions. Largest reduction of CO was observed in idling almost by 98% adding even 5% of bioethanol to gasoline. Largest values for almost all tested fuels were registered at 90 km/h, and, at the same time, impact of bioethanol addition was insignificant and results were similar to gasoline. The same situation was observed also with HC emissions showing reduction in all testing conditions. Oxygen content in blends results with opposite effect on CO2 emissions opposed to CO – slight increase of CO2 was fixed for almost all testing conditions for E5 and E10 compared to E0. Largest increase of CO2 was found for E10 in idling (by 1.55%). There was also observed increase of NOx emissions for all mentioned fuels and testing conditions. Largest increase was observed during idling and 50 km/h. Such increase in NOx emissions could be explained by previously mentioned increase of the oxygen content in the blend resulted in increase in oxygen-to-fuel ratio in the fuel rich regions (Masum et al, 2013). This stimulates more complete combustion and increase of in-cylinder temperature, which affects increase of NOx and decrease of HC. Additional factor is also higher flame speed of bioethanol, which also assists in completing combustion. » Unregulated emissions The addition of bioethanol has left a positive impact to unregulated emissions, like ammonia (NH3), methane (CH4), acetylene (C2H2) and ethane (C2H6). Figure 5 shows that all mentioned emissions decrease with the increasing bioethanol proportion in the fuel. It is positive as ammonia is a toxic compound and a precursor in the formation of atmospheric secondary aerosols, classified under the European dangerous substances directive (67/548/EEC), and vehicles with internal combustion engines are considered as main source of NH3 in the urban environment (Suarez-Bertoa et al., 2014). All other dominating hydrocarbons (methane, acetylene, ethan) presented in emissions showed great reduction for all blends. CONCLUSIONS The main objective of this experimental study was to analyze if the bioethanol addition of 5% and 10% into gasoline would have a positive effect on engine performance and emissions. The results showed positive tendency in bioethanol addition, but it also confirmed that E10 did not offer some essential advantages over the E5 in case of engine performance and regulated emissions. Most promising results were observed according to unregulated emissions. Totally, it should be noted that only certain components showed good results in tests, which were done with one vehicle.
Further testing with larger number of vehicles is required, as also more detailed research in case of bioethanol-gasoline blends must be provided instead of ethanol-gasoline blends, as it emission profiles may differ in concentrations and types of emission products (Manzetti and Andersen, 2015). References [1.] Bielaczyc P., Woodburn J., Klimkiewicz D.,
Pajdowski P., Szczotka A., (2013), An examination of the effect of ethanol-gasoline blends’ physico-chemical properties on emissions from a light-duty spark ignition engine. Fuel Processing Technology, (107), pp. 50-63;
[2.] Directive 2003/30/EC of the European Parliament and of the Council of 8 May 2003 on the promotion of the use of biofuels or other renewable fuels for transport, (2003), Brussels/Belgium;
[3.] Directive 2009/28/EC of the European Parliament and of the Council of 23 April 2009 on the promotion of the use of energy from renewable energy sources and amending and subsequently repealing Directives 2001/77/EC and 2003/30/EC (2009), Brussels/Belgium;
[4.] Durbin T.D., Miller J.W., Younglove T., Huai T., Cocker K., (2007), Effects of fuel ethanol content and volatility on regulated and unregulated exhaust emissions for the latest technology gasoline vehicles. Environmental Science and Technology, 41(11), pp. 4059–4064;
[5.] Elfasakhany A., (2015), Investigations on the effects of ethanol-methanol-gasoline blends in a spark ignition engine: Performance and emissions analysis. Engineering Science and Technology, an International Journal, 18, pp. 713-719.
[6.] Kampman B., Verbeek R., Van Grinsven A., Van Mensch P., Croezen H., Patuleia A., (2013), Options to increase EU biofuels volumes beyond the current blending limits. Report. 210 p., Delft/Netherlands;
[7.] Manzetti S., Andersen O., (2015), A review of emission products from bioethanol and its blends with gasoline. Background for new guidelines for emission control. Fuel, 140, pp. 293-301;
[8.] Masum B.M., Masjuki H.H., Kalam M.A., Rizwanul Fattah I.M., Palash S.M., Abedin M.J., (2013), Effect of ethanol-gasoline blend on NOx emission in SI engine. Renewable and Sustainable Energy Reviews, 24, pp. 209-222;
[9.] Smigins R., Shipkovs P., (2014), Biofuels in transport sector of Latvia: experience, current status and barriers. Latvian Journal of Physics and Technical Sciences, No. 1, Vol. 51, pp. 32-43. ISSN 0868-8257, Riga/Latvia;
[10.] Suarez-Bertoa R., Zardini A.A., Astorga C., (2014), Ammonia exhaust emissions from spark ignition

ACTA TECHNICA CORVINIENSIS – Bulletin of Engineering
138 | F a s c i c u l e 3
vehicles over the New European Driving Cycle. Atmospheric Environment, 97, pp. 43-53;
[11.] Yao Y.C., Tsai J.H., Chou H.H., (2011), Air pollutant emission abatement using application of various ethanol-gasoline blends in high-mileage vehicles. Aerosol and Air Quality Research, 11(5), pp. 547–559.
copyright ©
University POLITEHNICA Timisoara, Faculty of Engineering Hunedoara,
5, Revolutiei, 331128, Hunedoara, ROMANIA http://acta.fih.upt.ro

© copyright Faculty of Engineering – Hunedoara, University POLITEHNICA Timisoara
ACTA TECHNICA CORVINIENSIS – Bulletin of Engineering Tome X [2017] Fascicule 3 [July – September] ISSN: 2067 – 3809
1.A.G.F. ALABI, 2.F.I. ALUKO, 3.J.O. AWEDA
INFLUENCE OF FERROSILICON MANGANESE ON THE SULPHUR CONTENT AND MICROSTRUCTURE IN THE PRODUCTION OF AUSTEMPERED DUCTILE IRON (ADI) 1.Department of Material Science and Engineering, College of Engineering & Technology, Kwara State University, Malete, NIGERIA 2.Department of Mechanical Engineering, School of Engineering, The Federal Polytechnic, Ado-Ekiti, NIGERIA 3.Department of Mechanical Engineering, Faculty of Engineering & Technology, University of Ilorin, Ilorin, NIGERIA Abstract: This study considers the effect of ferrosilicon manganese addition to austempered ductile iron, (ADI)in order to reduce its sulphur level for improved engineering applications of the material. The cast samples were austenitised in a mixture of potassium chloride, sodium chloride and barium chloride solutions and austempered in sodium nitrate and potassium nitrate solutions. Ferro-silicon-manganese was added to ADI in various amounts ranging from between 47 to326 g. The study revealed that the sulphur level retained in ADI decreased from 0.088 wt % for as-cast to 0.027 wt% when 93 g of ferro-silicon-manganese was added. Below this amount of ferro-silicon-manganese addition, there was no significant reduction in the sulphur level recorded in ADI. The microstructure of the metal revealed bigger graphite nodules scattered in ferrite solutions for the situation when the sulphur level was 0.027 wt. %. From the study, it was discovered that addition of small amount of ferrosilicon manganese was required to produce ADI of low level sulphur content to make the metal more acceptable for other engineering applications. Keywords: Ductile iron, ADI, sulphur, austempering, nodularizer, ferrosilicon INTRODUCTION Discovering new materials with improved mechanical properties meeting the required applications has engaged the attention of researchers worldwide. In recent years, Austempered Ductile Iron (ADI), obtained from ductile iron, has attracted considerable applications because of its good mechanical properties. Such properties include resistance to fatigue [1-4], good wear resistance [5, 6], high strength with good ductility [7-9] and good rolling contact resistance [10]. The density of ADI is lower than steel [8, 12] which makes it more applicable in the areas of production of engine blocks and other engineering components. ADI is used in the production of swivel pins, rail brakes and pressure pipes in the oil industry [13-16]. Thus, ADI has been found to have higher specific strength than steel [6, 17-21]. Austempered ductile iron products are used in the automobile and textile industries as crank shafts, cam shafts, gearwheels and thin wall castings reinforced parts [10, 16, 18, 26]. The production of ADI is cheaper
when compared with forged steel by 20 % [27, 28]. Compared to steel, ADI exhibits improved properties in terms of machinability, tool life and machining speeds, surface finish, improved safeguard against failure (due to the lubricating effect provided by graphite) [17, 22], good ballistic properties [26], good resistance to bending fatigue [1], good damping capacity (better noise attenuation), amenability to heat treatment [6, 21, 24, 25], good corrosion resistance [24]. Therefore, ADI is considered as an economical substitute for wrought or forged steel in several structural applications [2, 3]. The metal loses less of its toughness than steel at sub-zero temperature. Austempered ductile iron usually work-hardens when stressed and has good vibration damping capability and heat transfer than other ferrous and non-ferrous alloys [18, 22, 26]. Liu [26] in his work suggested that an improved structure of ADI could be obtained by controlling the heat treatment process of nodular cast iron. The microstructure and mechanical properties of ADI can be
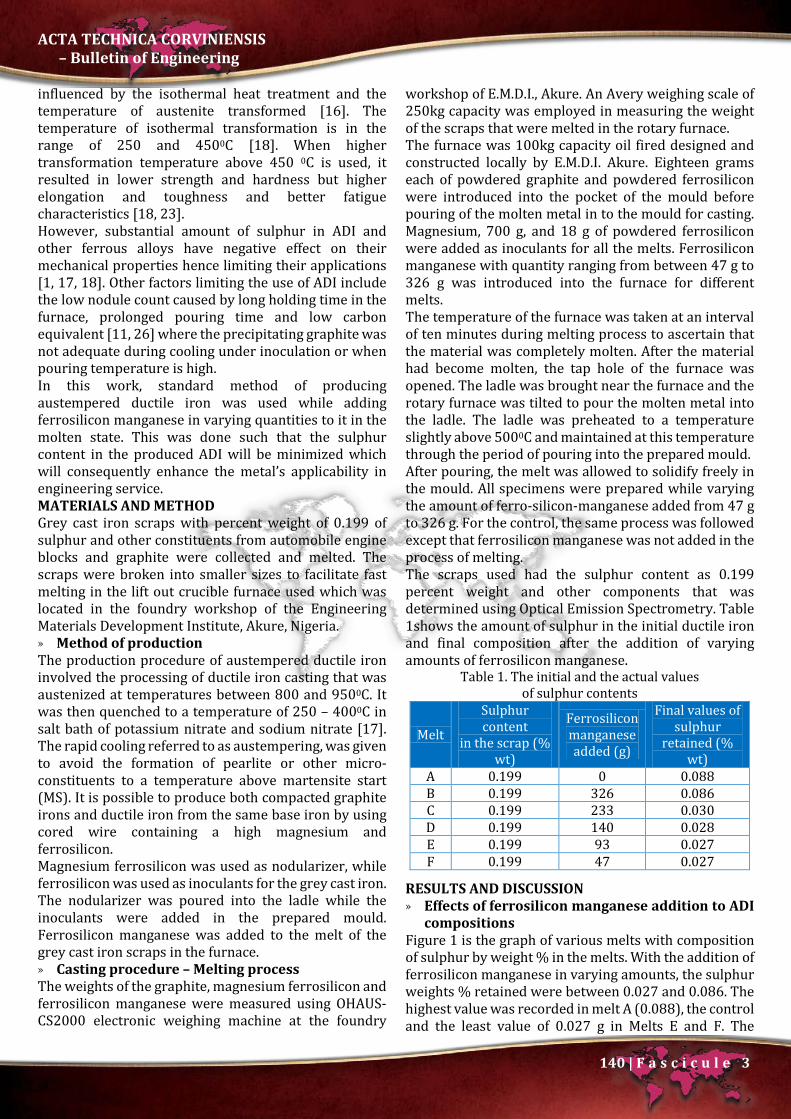
ACTA TECHNICA CORVINIENSIS – Bulletin of Engineering
140 | F a s c i c u l e 3
influenced by the isothermal heat treatment and the temperature of austenite transformed [16]. The temperature of isothermal transformation is in the range of 250 and 4500C [18]. When higher transformation temperature above 450 0C is used, it resulted in lower strength and hardness but higher elongation and toughness and better fatigue characteristics [18, 23]. However, substantial amount of sulphur in ADI and other ferrous alloys have negative effect on their mechanical properties hence limiting their applications [1, 17, 18]. Other factors limiting the use of ADI include the low nodule count caused by long holding time in the furnace, prolonged pouring time and low carbon equivalent [11, 26] where the precipitating graphite was not adequate during cooling under inoculation or when pouring temperature is high. In this work, standard method of producing austempered ductile iron was used while adding ferrosilicon manganese in varying quantities to it in the molten state. This was done such that the sulphur content in the produced ADI will be minimized which will consequently enhance the metal’s applicability in engineering service. MATERIALS AND METHOD Grey cast iron scraps with percent weight of 0.199 of sulphur and other constituents from automobile engine blocks and graphite were collected and melted. The scraps were broken into smaller sizes to facilitate fast melting in the lift out crucible furnace used which was located in the foundry workshop of the Engineering Materials Development Institute, Akure, Nigeria. » Method of production The production procedure of austempered ductile iron involved the processing of ductile iron casting that was austenized at temperatures between 800 and 9500C. It was then quenched to a temperature of 250 – 4000C in salt bath of potassium nitrate and sodium nitrate [17]. The rapid cooling referred to as austempering, was given to avoid the formation of pearlite or other micro-constituents to a temperature above martensite start (MS). It is possible to produce both compacted graphite irons and ductile iron from the same base iron by using cored wire containing a high magnesium and ferrosilicon. Magnesium ferrosilicon was used as nodularizer, while ferrosilicon was used as inoculants for the grey cast iron. The nodularizer was poured into the ladle while the inoculants were added in the prepared mould. Ferrosilicon manganese was added to the melt of the grey cast iron scraps in the furnace. » Casting procedure – Melting process The weights of the graphite, magnesium ferrosilicon and ferrosilicon manganese were measured using OHAUS-CS2000 electronic weighing machine at the foundry
workshop of E.M.D.I., Akure. An Avery weighing scale of 250kg capacity was employed in measuring the weight of the scraps that were melted in the rotary furnace. The furnace was 100kg capacity oil fired designed and constructed locally by E.M.D.I. Akure. Eighteen grams each of powdered graphite and powdered ferrosilicon were introduced into the pocket of the mould before pouring of the molten metal in to the mould for casting. Magnesium, 700 g, and 18 g of powdered ferrosilicon were added as inoculants for all the melts. Ferrosilicon manganese with quantity ranging from between 47 g to 326 g was introduced into the furnace for different melts. The temperature of the furnace was taken at an interval of ten minutes during melting process to ascertain that the material was completely molten. After the material had become molten, the tap hole of the furnace was opened. The ladle was brought near the furnace and the rotary furnace was tilted to pour the molten metal into the ladle. The ladle was preheated to a temperature slightly above 5000C and maintained at this temperature through the period of pouring into the prepared mould. After pouring, the melt was allowed to solidify freely in the mould. All specimens were prepared while varying the amount of ferro-silicon-manganese added from 47 g to 326 g. For the control, the same process was followed except that ferrosilicon manganese was not added in the process of melting. The scraps used had the sulphur content as 0.199 percent weight and other components that was determined using Optical Emission Spectrometry. Table 1shows the amount of sulphur in the initial ductile iron and final composition after the addition of varying amounts of ferrosilicon manganese.
Table 1. The initial and the actual values of sulphur contents
Melt
Sulphur content
in the scrap (% wt)
Ferrosilicon manganese added (g)
Final values of sulphur
retained (% wt)
A 0.199 0 0.088 B 0.199 326 0.086 C 0.199 233 0.030 D 0.199 140 0.028 E 0.199 93 0.027 F 0.199 47 0.027
RESULTS AND DISCUSSION » Effects of ferrosilicon manganese addition to ADI
compositions Figure 1 is the graph of various melts with composition of sulphur by weight % in the melts. With the addition of ferrosilicon manganese in varying amounts, the sulphur weights % retained were between 0.027 and 0.086. The highest value was recorded in melt A (0.088), the control and the least value of 0.027 g in Melts E and F. The
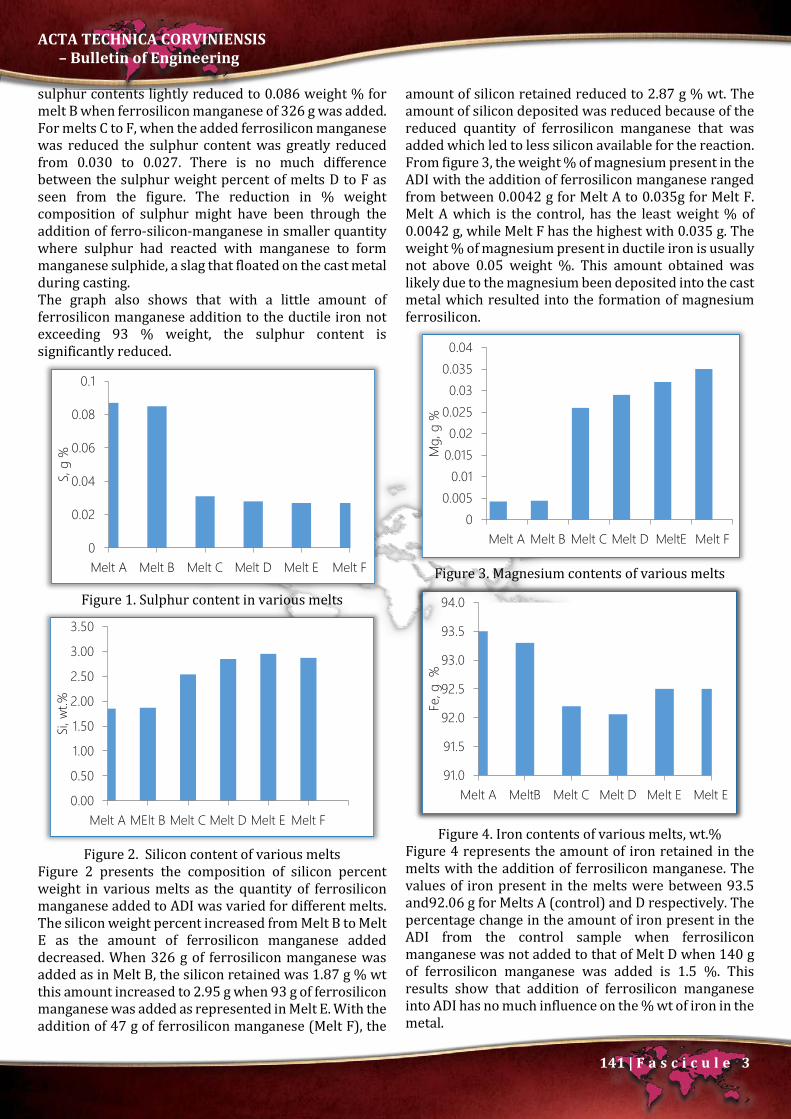
ACTA TECHNICA CORVINIENSIS – Bulletin of Engineering
141 | F a s c i c u l e 3
sulphur contents lightly reduced to 0.086 weight % for melt B when ferrosilicon manganese of 326 g was added. For melts C to F, when the added ferrosilicon manganese was reduced the sulphur content was greatly reduced from 0.030 to 0.027. There is no much difference between the sulphur weight percent of melts D to F as seen from the figure. The reduction in % weight composition of sulphur might have been through the addition of ferro-silicon-manganese in smaller quantity where sulphur had reacted with manganese to form manganese sulphide, a slag that floated on the cast metal during casting. The graph also shows that with a little amount of ferrosilicon manganese addition to the ductile iron not exceeding 93 % weight, the sulphur content is significantly reduced.
Figure 1. Sulphur content in various melts
Figure 2. Silicon content of various melts
Figure 2 presents the composition of silicon percent weight in various melts as the quantity of ferrosilicon manganese added to ADI was varied for different melts. The silicon weight percent increased from Melt B to Melt E as the amount of ferrosilicon manganese added decreased. When 326 g of ferrosilicon manganese was added as in Melt B, the silicon retained was 1.87 g % wt this amount increased to 2.95 g when 93 g of ferrosilicon manganese was added as represented in Melt E. With the addition of 47 g of ferrosilicon manganese (Melt F), the
amount of silicon retained reduced to 2.87 g % wt. The amount of silicon deposited was reduced because of the reduced quantity of ferrosilicon manganese that was added which led to less silicon available for the reaction. From figure 3, the weight % of magnesium present in the ADI with the addition of ferrosilicon manganese ranged from between 0.0042 g for Melt A to 0.035g for Melt F. Melt A which is the control, has the least weight % of 0.0042 g, while Melt F has the highest with 0.035 g. The weight % of magnesium present in ductile iron is usually not above 0.05 weight %. This amount obtained was likely due to the magnesium been deposited into the cast metal which resulted into the formation of magnesium ferrosilicon.
Figure 3. Magnesium contents of various melts
Figure 4. Iron contents of various melts, wt.%
Figure 4 represents the amount of iron retained in the melts with the addition of ferrosilicon manganese. The values of iron present in the melts were between 93.5 and92.06 g for Melts A (control) and D respectively. The percentage change in the amount of iron present in the ADI from the control sample when ferrosilicon manganese was not added to that of Melt D when 140 g of ferrosilicon manganese was added is 1.5 %. This results show that addition of ferrosilicon manganese into ADI has no much influence on the % wt of iron in the metal.
0
0.02
0.04
0.06
0.08
0.1
Melt A Melt B Melt C Melt D Melt E Melt F
S, g
%
0.00
0.50
1.00
1.50
2.00
2.50
3.00
3.50
Melt A MElt B Melt C Melt D Melt E Melt F
Si, w
t.%
00.005
0.010.0150.02
0.0250.03
0.0350.04
Melt A Melt B Melt C Melt D MeltE Melt F
Mg,
g %
91.0
91.5
92.0
92.5
93.0
93.5
94.0
Melt A MeltB Melt C Melt D Melt E Melt E
Fe, g
%

ACTA TECHNICA CORVINIENSIS – Bulletin of Engineering
142 | F a s c i c u l e 3
The weight % of manganese present in the metal decreased from0.510 to 0.419 g as shown in figure 5. The amount of manganese retained after the casting was reduced from Melts B to F as the amount of ferrosilicon manganese added was reduced. Even though no ferro-silicon-manganese was added to Melt A, about 0.488 weight % of manganese was recorded in the cast metal. The reason for the low manganese content in Melts B to F may be ascribed to the reactions that took place within the furnace where manganese and sulphur reacted to form manganese sulphide.
Figure 5. Manganese contents of various melts, wt. %
Figure 6. Carbon contents in various Melts, wt %
Figure 6 depicts the carbon weight % of the sample which falls between 3.41 and 4.1 wt% percent with ferrosilicon addition in varying amounts. Melt D has the highest weight percent of 4.1 g, while Melt E has the least, 3.41 g as reflected in the figure. Melts B and C have 3.87 and 3.84 weight % respectively. The control, Melt A grey cast iron has 3.68 weight %. This lower value may be an indication that some carbon might have reacted with oxygen to form carbon monoxide which would have diffused into the air. Melt D with highest carbon content may likely show improved mechanical properties.
» Effect of ferrosilicon manganese on microstructures
Figure 7a is the micrograph of Melt A when no ferrosilicon manganese was added to ADI. The microstructure revealed long graphite flakes within ferrite which probably is an indication that the metal will be soft and easy to machine.
Figure 7.a. Micrograph of Melt A [X250]
Figure 7.b. Micrograph of Melt B [X250]
Figure 7b represents the micrograph of the metal with the addition of 326 g of ferrosilicon manganese where the graphite stripes turned to graphite nodules. The graphite nodules form lumps and are surounded by ferrite within the matrix. The lumpednodules are seen scatered within ferrite. This formation implies that the material is ductile iron.The silicon resulting from the added ferrosilicon has shown its potency for ferrite formation in the ductile iron.
Figure 7.c. Micrograph of Melt D [X250]
Figure 7c is the microstructure of Melt D when 140 g of ferrosilicon manganese was added to ADI. The micrograph shows the presence of high concentration of graphite nodules within ferrites. Figure 7d represents the microgrph of Melt E when 93 g of ferrosilicon
0
0.1
0.2
0.3
0.4
0.5
0.6
Melt A MeltB Melt CMelt DMelt E Melt F
Mn,
g %
0.00.51.01.52.02.53.03.54.04.5
MELT A MELTB MELT C MELT D MELT E MELT F
Carb
on, g
.%

ACTA TECHNICA CORVINIENSIS – Bulletin of Engineering
143 | F a s c i c u l e 3
manganese was added showing bigger graphite nodules than that obtained for Melt D and relatively scattered all over the surface within ferrite confirming the results obtained by Alasoluyi et al;[12].
Figure 7.d. Micrograph of Melt E [X250]
Figure 7.e. Micrograph of Melt F [X250]
Figure 7e is the situation when 47 g of ferrosilicon manganese was added to ADI. The microstructure as shown on the figure contained very few but big graphite nodules with ferrites fairly scatered all over the surface.This similar effect was also observed by Alasoluyi et al [6] in their work. The silicon from the ferrosilicon is seen to initiate the formation of the ferrite and tends to be slightly forming in the pearlite of the matrix. This also promotes the precipitation of the graphite nodules in pearlite matrix with little ferrite in existence. The figure reveals that the presence of ferrite is been usurped by the appearance of pearlite within the metal. CONCLUSIONS Austempered ductile iron was produced by casting process through the addition of varying amount of ferrosilicon manganese in the ranges of 47, 93, 140, 233, 326 wt. % using lift out crucible furnace. The compositional analysis and microstructural examinations of the products were evaluated and compared with the as-cast. The following conclusions are made from the study; » Austempering of ductile iron in a lift out crucible
furnace was successfully carried out. » Addition of ferrosilicon manganese to ADI has
influence on the amount of sulphur and other constituent elements retained in the metal.
» Addition of 47 g % wt. of ferrosilicon manganese to ADI shows significant lowering of sulphur retained in the metal after casting.
» The microstructural examinations revealed that the graphite nodules were well distributed in the ADI.
Acknowledgement The permission granted by the authority of the Engineering Materials Development Institute, E.M.D.I., Akure, Nigeria to carry out the experimental works of this research in their workshop is highly appreciated. References [1.] M. Yamanaka, R. Tamura, K. Inoue and Y. Narita,
“Bending fatigue strength of austempered ductile iron spur gears.” Journal of Advanced Mechanical Design, Systems and Manufacturing, vol. 3(3), pp. 203-211, 2009.
[2.] S.B. Hassan, “Austempered Ductile cast Iron–An Alternative to steel and Aluminiums in Automotive Applications,” Nigerian Mining Journal, 5(1), pp. 32-39, 2007.
[3.] B.O. Adewuyi, A.A. Afonja, and C.O. Adegoke, “Effects of Isothermal Transformation on Fatigue strength of Austempered Ductile Iron.” Botswana Journal of Technology, vol. 14 No 2 pp. 21-25, 2005.
[4.] F.I. Aluko, “Effect of Heat Treatment on Corrosion Properties of Gray Cast Iron in Paper making industries.” Nigerian Journal of Engineering Management, Besade Publishing press. Ondo, 5(1), pp. 31-33, 2004.
[5.] N. Rebasa, R. Dommarco, and J. Sikora, ‘‘Wear Resistance of High Nodule Count Ductile Iron.” (T-8),Hokongghub, Elsevier Science, vol. 253, pp. 855-861, 2002.
[6.] J.O. Alasoluyi, J.A. Omotoyinbo, S.O.O. Olusunle and O.O. Adewuyi, “Investigation of Mechanical Properties of Ductile Iron Produced from Hybrid Innoculants using Rotary Furnace.” International Journal of Science and Engineering, vol. 2(5), pp. 338-393, 2013.
[7.] J.R. Keough and K.L. Hayrynen, “Designing with austempering ductile iron (ADI).” American Foundry Society, pp1-15, 2010.
[8.] S.B. Hassan, “The Effect of Chromium Additions on Microstructure and Mechanical Properties of Nodular Cast Iron.” N.S.E. Technical Transaction, 41(3), pp. 33-41, 2006.
[9.] M. Behmani, R. Elliot and N. Varehan, “Austempered Ductile Iron: A Competitive Alternative for Forged Induction–Hardened Steel Crankshafts.” International Journal of Cast Metals Research, vol. 9, pp. 249-257, 1997.
[10.] A. Nofal, “Advances in the metallurgy and applications of ADI.” Journal of Metallurgical Engineering (ME), vol. 2(1), pp. 1-18, 2013.
[11.] T. Shiokara, “Effect of Graphite Nodules on Crack Growth Behavior of Austempered Ductile Cast Iron (ADI).” 59th Japan Ductile Cast Iron. Association Conference, Tokyo, Japan, pp. 138-150, 1978.

ACTA TECHNICA CORVINIENSIS – Bulletin of Engineering
144 | F a s c i c u l e 3
[12.] J.O. Alasoluyi, J.A. Omotoyinbo, J.A. Borode, S. O.O. Olusunle and O.O. Adewuyi, “Influence of Secondary Introduction of Carbon and Ferrosilicon on the Microstructure of Rotary Furnace Produced Ductile Iron.” International Journal of Science and Engineering, vol. 2(2), pp. 211-217, 2013.
[13.] S. Vechet, J. Kohout, L. Klakurkova, “Fatigue Properties of Austempered Ductile Iron in Dependence Transformation Temperature.” Material Science (Medziagotyra), 14(4), pp. 324-327, 2008.
[14.] A. Trudel and A. Gagne, “Effect of Composition and Heat Treatment Parameters on the Characteristics of ADI.” Canadian Metallurgical, pp. 289-298, 1998.
[15.] S.B. Hassan and L.A. Isah, “A study of relationship between Tensile Properties and Microstructure of low Alloy Austempered Ductile Iron Using Khaya Senegalensis Seed Oil as Quenchant.” Journal of Metallurgy and Materials Engineering, 5 (2), pp. 14–21, 2010.
[16.] N. Bhople, S. Pahl, M. Harne, and S. Dhande, “Austempering parameters and machinability of austempering ductile iron: A comprehensive review on effective parameters.” International Journal of Innovative Research in Science, Engineering and Technology, vol. 5(2), pp. 1197-1211, 2016.
[17.] M. Myszka and W. Presz, “Microstructure transformations in austempered ductile iron during deformation by dynamic hardness test.” Computer methods in Materials Science, vol. 12(4), pp. 259-263, 2012.
[18.] J. Sikora, and R. Boeri, “Advances in ductile iron research: New metallurgical understanding and its Technological Significance.” Archives of Foundry, vol. 5(15), pp. 354-360, 2005.
[19.] M. Kaczorowski and A. Krzynska, “Mechanical Properties and Structure of Austempered Ductile Iron-ADI.” Archives of Foundry Engineering, Publications of Foundry Commission of the Polish Academy, vol. 7, pp. 161-166, 2007.
[20.] B. Uma, “Influence of composition and austempering temperature on machinability of austempered ductile iron.” International Journal of chemical, nuclear, Metallurgical and Materials Engineering, 7 (2), pp. 116-121, 2013.
[21.] D.S. Yawas, “Corrosion Characteristics of Mild Steel and Ductile Cast Iron Exposed to Different Media”, N.S.E. Technical Transaction vol. 41 (3), pp. 125-134, 2006.
[22.] V. Bela and Sr. Kovas, “Autempered ductile iron: Facts and Friction.” Modern Casting, pp. 38-41, 1990.
[23.] O.O. Daramola, B.O. Adewuyi, and I.O. Oladele, ”Effect of Heat Treatment on the Mechanical properties of Rolled Medium Carbon Steel.”, Journal of Minerals and Materials Characterization and Engineering, vol. 8, pp. 693–708, 2010.
[24.] B. Kovacs, “The Effects of alloying Elements and their Segregation in ADI’ Proceedings of International Conference on Austempered Ductile Iron, vol.1. New York, USA, pp. 241-252, 1991.
[25.] D. Mszka, “Austenite-martensite transformation in aus-tempered ductile iron.” Archives of Metallurgy and Materials, vol. 52, pp. 475-480, 2007.
[26.] J. Liu, “Unique microstructure and excellent mechanical properties of ADI.” 8th International Symposium on Science and Processing of Cast Iron, Tsinghua University, (October), vol. 3 (4), pp. 253-257, 2006.
[27.] S. Balos, I. Radisavljevic, D. Rajnovic, M. Draicanin, S. Tabakovic, O. Eric-Cekic and L. Sidjanin, “Geometry, mechanical and ballistic properties of ADI material perforated plates.” Materials and Design, Elevier Series, vol. 83, pp. 66-74, 2015.
[28.] D. Myszka, L. Olejnik, and M. Klebizyk, “Microstructure transformation during plastic deformation of the austempered ductile iron.” Archives of Foundry Engineering, Publication of Foundry Commission of the Polish Academy of Sciences, vol. 9, pp. 169-174, 2009.
copyright ©
University POLITEHNICA Timisoara, Faculty of Engineering Hunedoara,
5, Revolutiei, 331128, Hunedoara, ROMANIA http://acta.fih.upt.ro

© copyright Faculty of Engineering – Hunedoara, University POLITEHNICA Timisoara
ACTA TECHNICA CORVINIENSIS – Bulletin of Engineering Tome X [2017] Fascicule 3 [July – September] ISSN: 2067 – 3809
1,2.Iulia GĂGEANU, 2.Gheorghe VOICU, 1.Valentin VLĂDUȚ, 1.I. VOICEA, 3.I. DUMITRU, 4.I.L. CABA
CONSIDERATIONS ON OBTAINING BIOMASS PELLETS 1.INMA Bucharest, ROMANIA 2.University Politehnica of Bucharest, ROMANIA 3.Power Group International S.R.L., ROMANIA 4.S.C. Munax S.R.L., ROMANIA Abstract: The field of producing solid fuels from biomass has registered a considerable increase, due to the existence of important quantities of biomass that represent an important source of renewable energy. Pellets are one of the most common solid biofuels, being used for both household use and for producing energy. The article presents considerations on the production of pellets from various types of biomass using specially designed equipment and a series of considerations for the best parameters to be used for producing these types of pellets. Keywords: biomass, pellets, compression, force, renewable energy INTRODUCTION The production of pellets, also called granules, from grinded biomass is spread in the field of renewable sources of energy as innovative techniques for environmental protection, especially in Europe. Due to global warming, a phenomenon affecting the entire worldwide population, industries were forced to accelerate and cheapen the large production of pellets used as solid biofuel, by identifying new innovative technical solutions in the field of pelleting machinery (Tumuluru et al., 2010; Voicea et al., 2014). Pellets represent the biofuel produced from wood or agricultural waste. They are cylindrical granules of standard sizes between Ø-5...8mm (sometimes even up 30 mm) with variable length of approximately 20-50 mm. They have increased mechanical resistance and good combustion characteristics. The pelleting process offers a real possibility of valorising wood waste. Pellets are produced from waste resulted from wood processing, agricultural residues or from energetic plants. Pellets are a non-polluting fuel, because from their combustion, there are no harmful emissions. The mass of one m3 of pellets weighs approximately 650-700 kg and produces around 3250 kWh of energy. The process of producing pellets is not a complicated one, but it is still complex (Stelte et al., 2012). It is important that the biofuels are framed by regulation in order to facilitate commercial exchanges of energetic biomass. They refer to terminology, classification,
sampling, determining the combustion power, determining particle size distribution and content of chlorine and sulphur. Currently, there are various testing methods for certifying the quality of solid biofuels as well as various practices for characterizing the parameters of these products. The biggest challenge in the case of biomass based fuels refers to the fact that they are not homogenous. Biomass properties differ depending on the raw material. The main advantages of densifying wood biomass are: » increasing the density of compressed material (from
80-150 kg / m3 for straws or 200 kg / m3 for sawdust to up to 600-700 kg / m3 for final products);
» a higher calorific value and a homogeneous structure of densified products;
» a low moisture content (lower than 10%); » improved storage characteristics; » extending the usage period of biomass materials. MATERIAL AND METHOD Pellets are produced from industrial dry and untreated wood based waste such as: wood chips, wood dust, saw dust, wood shavings, etc. Wood material can be used from resinous and deciduous trees, from both xylem and bark, and due to the fact that deciduous trees have lower lignin content, they might require additives. Pellets are compact, uniform, easy to store and handle, can be used in automated heating systems, stoves or boilers (Mediavilla et al., 2012; Mani et el., 2006; Kazuei et al.).

ACTA TECHNICA CORVINIENSIS – Bulletin of Engineering
146 | F a s c i c u l e 3
Figure 1. Example of pellets obtained
through the densification process Pellets are produced by grinding sawdust, wood chips, branches, tree bark or parts of agricultural biomass and pressing the material obtained through a die at high pressures. The heat resulted due to friction is enough to soften the lignin in the biomass. When is cooled, lignin becomes rigid and binds the material. The compressed material has the shape on noodles, their section being identical in shape to the one of the pressing channels (Samuelsson et al., 2012; Kaliyan et al., 2010). The actual densification practically has two stages: » Compacting the woody material under pressure, in
order to reduce its volume and to aggregate the particles of material;
» In the second stage, the lignin is activated by the high pressure and the increased temperature and “glues” the wood particles, thus creating the final product.
The material is pressed in a special die. Due to the high pressure (800-900 bars) and the high temperature that appears during compaction, lignin, the natural binder in wood is melted and helps forming the pellets at the same exact size and shape as the channels in the die. Good quality pellets are produced at adequate pressure and temperature, so it is important to monitor those parameters very carefully.
a) b) Figure 2. Operating principle of pellet mills
(a – flat die; b – ring die) [2] The two main types of pelleting equipment are: with flat die or with ring die. In the first case, we have a perforated disk on which two or more rollers rotate, compressing the raw material. In the second case, we have a perforated ring (figure 2–a), and the pressing rollers are situated in the interior of ring (figure 2–b). WORKING PRINCIPLE OF THE FLAT DIE RING PELLETING MACHINE The flat die ring pelleting machine was the first pellet press designed at the beginning of the 20th Century,
based on flat dies. Generally, there are two types of flat dies machines on the market, the one with rotating die and the one with rotating rollers. The first type has a stationary roller and the second type has a stationary die. Adopting the vertical principle, the raw material falls due to its own weight in the pelleting room where it is compressed between the rollers and the matrix, forming pellets when passing through the die channels. WORKING PRINCIPLE OF THE RING DIE RING PELLETING MACHINE Pelleting machines with ring die are based on a simple operation where the material is distributed on the interior surface of a perforated ring die, in front of each pressing roller, which compresses the material and forces it to pass through the die channels, thus forming pellets. The actual forming of pellets takes places in “the contact line” between the rollers and the die. All other activities connected to this operation, such as conditioning, cooling, etc. support and enhance the action in that moment in the system. In order to understand the process and to improve transition, quality and aspect, one should have a profound understanding on what happens in the locking point. The pressing chamber has the shape of channels, the length of a channel being equal to the length of the wall of the die, which is set by its mechanical resistance. As a result of the action of the pressing body, the powdery material, which was previously homogenised and wetted, is forced to pass through the calibrated orifices of the die (is extruded). Characteristic for this densification method is the fact that in the tight space between the working bodies, the material reaches the flowing limit and slides through the die orifices (channels).
a) b) Figure 3 – Examples of dies and pressing rolls
(a – flat die, b – cylindrical die) [2, 15] The pressing rollers, as the dies, are cylindrical parts that are normally built of tungsten carbide particles or are built as a grooved roller. Rollers can have cylindrical or cone shape. Roller surfaces can be riffled or can have various shaped imprints. During movement, rollers press the material in the matrix orifices, each channel being active only when it is positioned next to a pressing roller. The main purpose of rollers is to help the material pass through the die orifices, therefore the shape and the construction of rollers is designed to prevent material

ACTA TECHNICA CORVINIENSIS – Bulletin of Engineering
147 | F a s c i c u l e 3
from sliding and to offer a roughened surface for a better traction. A pelleting press usually has two or three pressing rollers in its construction. For obtaining biomass pellets, various types of raw material can be used, such as energy willow, miscanthus, sawdust, etc. These materials are suitable for compaction, because they have a high content of lignin, which is very important for the resistance of pellets in time, lignin acting as a binder when the material is subjected to compression forces within the pressing channels at increased temperatures. Material properties necessary for densification: » capacity of flowing and cohesion; » particle size (if the particles are too fine, it translates
in high cohesion, but in reduced flowing; if the particles are too large, the cohesion decreases, but the capacity to flow increases);
» superficial adhesion forces (important for agglomeration and resistance);
» adhesiveness (capacity to adhere); RESULTS The process of forming pellets consists in subjecting biomass to high pressures, period when particles are forced to agglomerate. The compression process is usually obtained in three distinct stages. In the first stage, particles rearrange under the action of a low pressure, forming agglomerations. Particles maintain most of their original properties, although the energy is dissipated due to the friction between particles and the machine wall. During the second stage takes place the plastic and elastic deformation of particles allowing them to flow in smaller spaces, thus increasing the contact surface between particles and, as a result, appear the van der Waals binding forces. Fragile particles can break under pressures leading to mechanical interlocking. In the final stage, under the high pressures applied in stage two, compression continues until the density of particles is reached. In this stage, particles can reach their melting point and form solid bridges when cooling down. Figure 4 shows the mechanical deformations of biomass during compression.
Figure 4 - Deformation mechanisms of powder particles
under compression [12] Understanding some of the major chemical changes that take place during processing of biomass can be useful in
understanding their compaction behaviour. As the densification of biomass is coupled with process variables like temperature, pressure, die geometry and mechanisms of densification, changes in these variables will bring about significant changes in the chemical composition of the biomass by the mechanisms known as interaction reactions. In table 1 are shown the recommended values of some of the most important parameters of the densification process.
Table 1. Recommended values for the parameters of the densification process
Parameter Biomass type Recommended value Die
Temperature woody 80-90o
agricultural 80-90o
Moisture woody 6-12% agricultural 10-20%
Granulation woody 0.5-5 mm agricultural 0.5-6 mm
Percentage of fines
woody 10-20 agricultural 10-12
The quality of densified biomass is given partly by the type of raw material and partly by the process variables. Process variables refer to those parameters inherent to the pelleting machine, respectively: temperature, pressure, die size, die speed, the distance between the die and pressing roller, etc. Temperature – quality attributes such as durability
and bulk density are significantly influenced by die temperature. A higher die temperature can reduce the pressure needed to compress the material and will also increase the durability of pellets.
Pressure – pressure play a very important part in the quality of pellets. It is necessary to find an optimal pressure depending on the type of material used for compression. A pressure higher than the optimal one can cause breaks in the final product due to a sudden expansion immediately after the pellets exit the die. Also, after a certain value, an increase of pressure will not offer any significant gain in the cohesion (binding) of pellets and it would only increase the production costs.
Applying high enough temperatures and pressures during densification can develop solid bridges through the diffusion of molecule from one particle to another in the contact points, thus increasing density and resistance.
Die geometry and speed – die geometry refers to its sizes and shape. These attributes can affect both the quantity of material that can pelleted, but also the energy necessary for compression and influences the properties of the final product, such as moisture, bulk density and durability.
Pelleting machines are built of a die characterized by the length / diameter ratio (L/D). Length refers to

ACTA TECHNICA CORVINIENSIS – Bulletin of Engineering
148 | F a s c i c u l e 3
depth of the die (the length of channels in the die) and the diameter refers to the diameter of the perforations (orifices, channels) in the die. Usually, durability increases along with increasing the L/D ration, due to the increase of friction forces caused by the increased friction between the material and die. However, a ration that is to big will block the die and will strangle the pelleting machine.
Distance between pressing rollers and the die – the distances between the pressing rollers and the die refers to the space between the die and the roller that forces the material to pass through the die. Usually, the distance should be between 1.5 and 2.5 mm. increasing the distance would lead to a significantly reduced resistance and durability of pellets.
A very important structural parameter is represented by the conicalness of the pressing channels. The conicalness has a significant impact on the final quality of the product obtained by pressing, but also on the construction of pressing machines.
Geometry of the pressing chamber - each geometry has its specific shape that affects the distribution of pressures in the pressing chamber and also the final quality of pellets. Each shape of the pressing chamber is suited for certain types of materials. Therefore, it is necessary to research the influence of the construction parameters of pressing chambers on the biomass densification process and on the quality of products resulted. The research and optimizing of the pressing chamber for biomass compaction will allow designing a compaction process that is energetically efficient, leading to obtaining high quality products (Križan et al., 2012).
Additives - besides the variables of the process, the use of an additive for the particles of biomass could have a positive effect on the resistance of pellets. Starch, proteins, fibres, fat / oil, lignosulfonate, bentonite and modified cellulose have proven to positively influence the durability of densified products (Byoung et al., 2014).
CONCLUSIONS The densification of biomass offers a real alternative to the use of fossil fuels. Also, it represents a method of using all the biomass materials that otherwise would go to waste. Densification is a relatively new method of processing biomass and still requires research and improvement. Biomass densification can be achieved by using two types of equipment: » Flat fie pelleting machine; » Ring die pelleting machine. Both types have their advantages. The flat die pelleting machine is recommended for smaller producers as it has smaller capacities, smaller size and weight, is very compact and has low energy consumption. The ring die
machine is recommended for large scale producers because they have higher capacities, experience low wear and are very effective in term of energy use. The field of producing biomass pellets still offers a multitude of possibilities for improvement and optimizing, both regarding the construction of equipment, but also for the composition of biomass mixes prepared for pelleting. References [1] Byoung Jun Ahn, Hee-sun Chang, Soo Min Lee, Don
Ha Choi, Seong Taek Cho, Gyu-seong Han, In Yang – Effect of binders on the durability of wood pellets fabricated from Larix kaemferi C. and Liriodendron tulipifera L. sawdust, Renewable Energy 62 (2014) 18–23;
[2] Guide for bio-fuel providers. Energy and biomass project in Moldova, 2012;
[3] Kaliyan N., Morey R. V. – Natural binders and solid bridge type binding mechanisms in briquettes and pellets made from corn stover and switchgrass, Bioresource Technology 101 (2010) 1082–1090;
[4] Kazuei I., Toru F.- Influence of moisture content, particle size and forming temperature on productivity and quality of rice straw pellets, Waste Management 34 (2014) pg. 2621–2626;
[5] Križan P., Matúš M. Kers J., Vukeli D. – Change of Pressing Chamber Conicalness at Briquetting Process in Briquetting Machine Pressing Chamber, Acta Polytechnica Vol. 52 No. 3/2012;
[6] Križan P., Matůš M. - Impact of pressing chamber conicalness on the quality of briquetts produced from biofuels in briquetting machines, FUELS 4 (2012), 4, S. 122 – 127;
[7] Križan P., Šooš L., Matúš M. – Optimalisation of Briquetting Machine Pressing Chamber Geometry;
[8] Mani S., Tabil Lope G., Sokhansanj Shahab - Effects Of Compressive Force, Particle Size And Moisture Content On Mechanical Properties Of Biomass Pellets From Grasses, Biomass and Bioenergy 30 (2006) 648–654, www.elsevier.com/locate/biombioe;
[9] Mediavilla I., Esteban L. S., Fernandez M. J. – “Optimisation of pelletisation conditions for poplar energy crop,” Fuel Processing Technology Journal, vol. 104, pp. 7–15, 2012;
[10] Samuelsson R., Larsson S. H., Thyrel M., Lestander T. A. – Moisture content and storage time influence the binding mechanisms in biofuel wood pellets, Applied Energy 99 (2012), pg.109–115;
[11] Stelte W., Sanadi A. R., Shang L., Holm J. K., Ahrenfeldt J.r, Henriksen U. B. – Recent developments in biomass palletization – A review, BioResources 7(3), 2012, pp. 4451-4490;
[12] Tumuluru Jaya Shankar, Wright Christopher T., Kenny Kevin L., HessJ. Richard – A Review on Biomass Densification Technologies for Energy Application, Idaho National Laboratory Biofuels and Renewable Energy Technologies Department Energy

ACTA TECHNICA CORVINIENSIS – Bulletin of Engineering
149 | F a s c i c u l e 3
Systems and Technologies DivisionIdaho Falls, Idaho, August 2010;
[13] Voicea I., Vladut V., Matache M., Danciu A., Voicu Gh. - Influence of the agricultural and forestry biomass physical characteristics on the compaction/pelleting, Proceedings of the 42nd International Symposium on Agricultural Eengineering, ISSN 1848-4425, 2014, Opatija – Croatia;
[14] Voicea I., Vladut V., Cardei P., Matache M., Gageanu I., Voicu Gh., Popescu C., Paraschiv G., Kabas O. - Compacting process and mathematical analysis of miscanthus briquettes expansion, Proceedings of the 43rd International Symposium on Agricultural Engineering, ISSN 1848-4425, 2015, Opatija – Croatia.
[15] http://www.akgbioguide.com/ring_die.html
copyright ©
University POLITEHNICA Timisoara, Faculty of Engineering Hunedoara,
5, Revolutiei, 331128, Hunedoara, ROMANIA http://acta.fih.upt.ro

ACTA TECHNICA CORVINIENSIS – Bulletin of Engineering
150 | F a s c i c u l e 3
We are very pleased to inform that our international and interdisciplinary journal ACTA TECHNICA CORVINIENSIS Bulletin of Engineering completed its nine years of publication successfully [issues of years 2008 –2016, Tome I–IX]. In a very short period it has acquired global presence and scholars from all over the world have taken it with great enthusiasm.
Every year, in four online issues (fascicules 1 – 4), ACTA TECHNICA CORVINIENSIS Bulletin of Engineering [e-ISSN: 2067-3809] publishes a series of reviews covering the most exciting and developing fields of science and technology. Each issue contains papers reviewed by international researchers who are experts in their fields. The result is a journal that gives the scientists and engineers the opportunity to keep informed of all the current developments in their own, and related, areas of research, ensuring the new ideas across an increasingly the interdisciplinary field. Now, when will celebrate the tenth years anniversary of ACTA TECHNICA CORVINIENSIS Bulletin of Engineering, we are extremely grateful and heartily acknowledge the kind of support and encouragement from all contributors and all collaborators!
On behalf of the Editorial Board and Scientific Committees of ACTA TECHNICA CORVINIENSIS Bulletin of Engineering, we would like to thank the many people who helped make this journal successful. We thank all authors who submitted their work to ACTA TECHNICA CORVINIENSIS Bulletin of Engineering.
copyright © University POLITEHNICA Timisoara,
Faculty of Engineering Hunedoara, 5, Revolutiei, 331128, Hunedoara, ROMANIA
http://acta.fih.upt.ro
© copyright Faculty of Engineering – Hunedoara, University POLITEHNICA Timisoara
ACTA TECHNICA CORVINIENSIS – Bulletin of Engineering Tome X [2017] Fascicule 3 [July – September] ISSN: 2067 – 3809
1.Ervin LUMNITZER, 2.Beata HRICOVÁ
RAILWAY NOISE AND ITS PSYCHOACOUSTIC PARAMETERS 1-2. Technical University of Kosice, Faculty of Mechanical Engineering, Department of Environmental Engineering, Košice, SLOVAKIA Abstract: Noise can be assessed and analyzed using a multidimensional approach that takes into account the physical aspects of sound, its composition, frequency, psychoacoustic parameters (e.g. volume, sharpness, roughness, fluctuations strength) and the relationship between the listener and the sound source, information value of sound and cultural background. The quality of the acoustic environment is a term that is becoming more and more prominent. How to assess it, what descriptors and what criteria to use? The article deals with the issue of railway noise in terms of its psychoacoustic perception. The article does not aim to bring forward a complete solution to the issue but to present the issue as such. Keywords: psychoacoustics, railway noise, descriptors INTRODUCTION Psychoacoustics is relatively a new branch of science studying acoustics and psychology. It examines the effects of sound on the human psyche. Unlike conventional physical quantities of acoustics, psychoacoustics has no limit values. It is because every person has a different perception and thus it is impossible to determine the action values. Sound can be analyzed and measured on the basis of physical conditions. The complete psychoacoustic analysis depends on the relationship between a person and his/ her perception. Noise can be assessed and analyzed using a multidimensional approach that takes into account the physical aspects of sound, its composition, frequency, psychoacoustic parameters (e.g. volume, sharpness, roughness, fluctuations strength) and the relationship between the listener and the sound source, information value of sound and cultural background. Sound annoyance depends on the sensitivity and subjective qualities, social and cultural background, and influences people's subjective approach to the sound source. Thus, the evaluation of the noise depends on the physical characteristics of the sound phenomenon, the psychoacoustic characteristics of the human ear and the psychological and social aspects.
DESIGNING THE EXPERIMENT The experiment was carried out using a device used for binaural perception of sound. Binaural perception is the perception of sound with both ears. The size of human skull changes the perception of sound, thus allowing people to hear binaural sounds. The maximum deflection occurs at a frequency of about 1.500 Hz. The perception of phase differences between the ears is the innate ability of the brain that allows the perception of binaural sounds. People are able to perceive phase differences when two continuous sounds of very similar frequency (up to 1.500 Hz) act on the auditory organs and the brain registers the phase differences between those sounds. Phase differences provide a listener with controlled information. The brain combines and creates the sensation of the third - binaural sound - if such sound is mediated through stereo headphones or speakers. Most models based on Zwicker and Stevens’ procedures for calculating the loudness of continuous sound have been implemented in the software installed in the measuring devices intended for the acoustic measurement. MEASUREMENTS The psychoacoustic engineering uses specialized measuring equipment (hardware and software). The hardware usually includes HSU – Head Shoulder Unit,

ACTA TECHNICA CORVINIENSIS – Bulletin of Engineering
152 | F a s c i c u l e 3
HMS – Head Measurement System (Figure 1), binaural equalizer BEQ and digital programmable equalizer PEQ. Software usually includes software for recording, analyzing and evaluating measured data. We used software AremiS SUITE by the German company Head Acoustics.
Figure 1 . Psychoacoustic head HMS
QUALITY OF SOUND The term “sound quality“ is understood as the sum of all individual sound properties. In general, we can say that the sound quality is negative if the sound phenomena are perceived as unpleasant and disruptive, produce negative associations or are not typical for the given product. Similarly, the sound quality is positive if the sound phenomena are not perceived as intrusive but create pleasant auditory impressions or produce positive associations with regard to the product. Figure 2 shows all important parameters of sound quality in the environment. [1,2,5]
Figure 2. Parameters affecting the sound quality
Evaluation of environmental sounds is carried out by processing sound signals using audio – equivalent measurements and technical analyzes (mostly used in the automotive industry). MEASUREMENT METHOD Measurements were performed on a straight stretch of railway track at two measuring points - 7,5 m and 46 m
from the track at the height of 1,5 m above the ground level. The place of measurement M1 is shown in Figure 3 together with the necessary technical equipment.
Figure 3. The place of measurement M1
The analysis of the results of the case study During the measurements we recorded sound of more than 30 passing trains (passenger train, freight train, express train, IC, locomotive trains and others). Due to large result sets the following pages will present only a small demonstration of the evaluation methods. The evaluation took into account the following psychoacoustic parameters:
» loudness, » sharpness, » roughness, » fluctuation strength.
Passenger train Passenger train no. 2 with 13 coaches coming from the right side at the distance of 7.5 m (Figure 4).
Figure 4. Psychoacoustic head turned toward
the passing train Figure 5 shows that the artificial head was turned facing the approaching train with its left ear facing the track. Perception of noise by left ear is marked in green. Then, by turning the head (continuous rotation) toward the
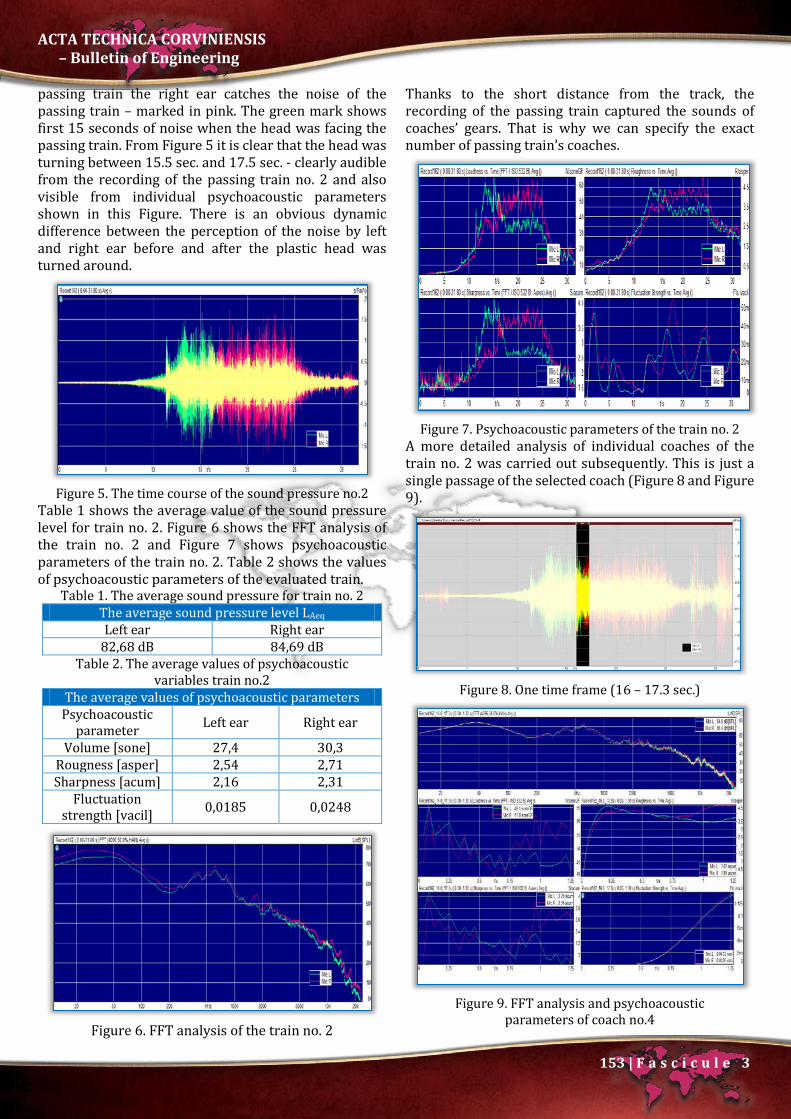
ACTA TECHNICA CORVINIENSIS – Bulletin of Engineering
153 | F a s c i c u l e 3
passing train the right ear catches the noise of the passing train – marked in pink. The green mark shows first 15 seconds of noise when the head was facing the passing train. From Figure 5 it is clear that the head was turning between 15.5 sec. and 17.5 sec. - clearly audible from the recording of the passing train no. 2 and also visible from individual psychoacoustic parameters shown in this Figure. There is an obvious dynamic difference between the perception of the noise by left and right ear before and after the plastic head was turned around.
Figure 5. The time course of the sound pressure no.2
Table 1 shows the average value of the sound pressure level for train no. 2. Figure 6 shows the FFT analysis of the train no. 2 and Figure 7 shows psychoacoustic parameters of the train no. 2. Table 2 shows the values of psychoacoustic parameters of the evaluated train.
Table 1. The average sound pressure for train no. 2 The average sound pressure level LAeq Left ear Right ear
82,68 dB 84,69 dB Table 2. The average values of psychoacoustic
variables train no.2 The average values of psychoacoustic parameters Psychoacoustic
parameter Left ear Right ear
Volume [sone] 27,4 30,3 Rougness [asper] 2,54 2,71 Sharpness [acum] 2,16 2,31
Fluctuation strength [vacil] 0,0185 0,0248
Figure 6. FFT analysis of the train no. 2
Thanks to the short distance from the track, the recording of the passing train captured the sounds of coaches’ gears. That is why we can specify the exact number of passing train’s coaches.
Figure 7. Psychoacoustic parameters of the train no. 2
A more detailed analysis of individual coaches of the train no. 2 was carried out subsequently. This is just a single passage of the selected coach (Figure 8 and Figure 9).
Figure 8. One time frame (16 – 17.3 sec.)
Figure 9. FFT analysis and psychoacoustic
parameters of coach no.4

ACTA TECHNICA CORVINIENSIS – Bulletin of Engineering
154 | F a s c i c u l e 3
CONCLUSION S Based on the measurements taken so far, their evaluation and further analysis, we can state the following: » The binaural recording of sound showed there is
difference between a stationary position of the acoustic head perpendicular to the track and when rotating the head smoothly towards the passing train.
» Not all recordings, especially those recorded with longer trains, recorded audible sounds of individual gears.
» This finding may mark the beginning of a detailed study of sounds made by gearing. This would help us in future to estimate some of the other properties of trains, especially the mechanical nature of coaches.
This knowledge about the properties of gears could improve some properties of trains with regard to their environmental impact. SPECIAL THANKS This article was written as an outcome of the project APVV 0432-12 and KEGA 039 TUKE-4/2015. Bibliography [1] Fastl, H. – Zwicker, E.: Psychoacoustics. Facts and
models. Third edition. Springer, Berlin, 2006. 474 p. [2] Lumnitzer, E. - Badida, M. - Polačeková, J.: Akustika -
Základy psychoakustiky, Elfa, 2012 [3] Lumnitzer, E. – Biľová, M. – Polačeková, J:
Psychoacoustic analysis of traffic noise 2012. In: SGEM 2012: 12th International Multidisciplinary Scientific GeoConference: conference proceedings: Volume 5: 17-23 June, 2012, Albena, Bulgaria. - Sofia: STEF92 Technology Ltd., 2012 P. 649-653
[4] Melka, A.: Základy experimentální psychoakustiky. Praha: ERMAT Praha, 2005. 327 s. ISBN 80-7331-043-0.
[5] Havelock, D. – Kuwano, S. – Vorländer, M.: Handbook of Signal Processing in Acoustics. Volume 1. Springer, New York. 2008. 927 p..
[6] Zwicker, E. – Fastl, H.: On the development of the critical band. J. Acoust. Soc. Amer. 52, 1972, 699-702 ISO 690-2: 1997.
[7] Lumnitzer, E. – Badida, M. – Polačeková. J.: Objektivizácia a hodnotenie faktorov prostredia. Základy psychoakustiky. Košice: Elfa - 2012. 121 p
copyright ©
University POLITEHNICA Timisoara, Faculty of Engineering Hunedoara,
5, Revolutiei, 331128, Hunedoara, ROMANIA http://acta.fih.upt.ro
© copyright Faculty of Engineering – Hunedoara, University POLITEHNICA Timisoara
ACTA TECHNICA CORVINIENSIS – Bulletin of Engineering Tome X [2017] Fascicule 3 [July – September] ISSN: 2067 – 3809
1.J.A. IGE, 2.M.A. ANIFOWOSE, 3.M.O. OYELEKE, 4.S.B. BAKARE, 5.T.F. AKINJOBI
PHYSIO-CHEMICAL ASSESSMENT OF GROUNDNUT SHELL ASH (GSA) BLENDED CALCIUM CHLORIDE (CACl2) AS SUPPLEMENTARY CEMENTING MATERIAL 1. Department of Civil Engineering, Ladoke Akintola University of Technology, Ogbomoso, NIGERIA 2-5. Department of Civil Engineering, Federal Polytechnic, Offa, NIGERIA Abstract: This study examine the effect of groundnut shell ash (GSA) blended calcium chloride (CaCl2) as supplementary cementing materials. The replacement levels of OPC with groundnut shell ash (GSA) were 0%, 5%, 10%, 15% and 20%. 1% of calcium chloride was blended with OPC/GSA in all experimental work. The following physical properties were determine on OPC and GSA; fineness test and specific gravity test while standard consistency and setting time test were conducted on OPC/GSA and OPC/GSA/CaCl2. The chemical composition of OPC and GSA was also determined. The result of the standard consistency revealed that as the percentage replacement increases, the consistency also increases for both OPC/GSA and OPC/GSA/CaCl2 respectively. However, the initial and final setting time shows that OPC/GSA/CaCl2 set faster than OPC/GSA. Keywords: Groundnut Shell (GS), Groundnut Shell Ash (GSA), Calcium Chloride (CaCl2), Cement (OPC) INTRODUCTION Nigeria is a major producer of groundnut in the world with an average annual production of about one million tons. Groundnut production generates large amount of process residues such as groundnut shell (Ajobo, 2014). Groundnut shell is a by-product groundnut pod which is usually burnt, dumped or left to decay naturally. It constitutes about 25 % of the total pod (husk and seeds) mass. Due to the growing environmental concern and the need to conserve energy and resources, efforts have been made to properly burn the shell to ash and to examine the ash with a view to utilizing it for useful purposes (Egbe – Ngun et. al., 2014). In Lafia, the capital of Nasarawa State of Nigeria, the shell is abundantly available from October to May (Alu et. al., 2012). The shells can also be found in large quantity in Kwara state (Tsaragi, Lafiaji, Kaima and Pategi), Niger state (Bida) and many parts in Nigeria. Groundnut Shell Ash (GSA) is obtained by the combustion of groundnut shell. MATERIALS AND METHODS Materials » Ordinary Portland cement (OPC) – Dangote cement
brands 42.5R was used.
» Distilled water was used throughout this study. » Calcium Chloride Anhydrous (CaCl2, 95% Assay),
which conformed to ASTM C494 (1999) were used. » The groundnut shells (locally available materials)
were collected from a milling store at Tsaragi, Edu Local Government of Kwara State. The groundnut shells were burnt to ashes at a temperature of 6500C by Thermolyne Furnace at Foundry and Forging Workshop, Mechanical Engineering Department Federal Polytechnic Offa. The ashes were further grounded to a require level of finer particles with milling machine and allow to pass through sieve No.200 (75 µm). The groundnut shell, groundnut shell ash and grinded groundnut shell ash are shown in Figure 1. a, b and c respectively.
Methods The experimental program was designed to examine the effect of groundnut shell ash (GSA) blended calcium chloride (CaCl2) as supplementary cementing materials. The replacement levels of OPC with groundnut shell ash (GSA) were 0%, 5%, 10%, 15% and 20%. 1% of calcium chloride was blended with OPC/GSA in all experimental work.

ACTA TECHNICA CORVINIENSIS – Bulletin of Engineering
156 | F a s c i c u l e 3
The following physical properties were determine on OPC and GSA; Fineness test and Specific Gravity test while Standard Consistency and Setting Time test were conducted on OPC/GSA and OPC/GSA/CaCl2. The chemical compositions of OPC and GSA were determined at SMO Laboratory, Joyce ‘B’ Road, off Mobil-Ring Road, Ibadan, Nigeria.
Figure 1: (a) Groundnut Shell, (b) Groundnut Shell Ash
and (c) Grinded Groundnut Shell Ash RESULTS AND DISCUSSION Chemical (Oxides) Composition of OPC and GSA The results of oxides composition of OPC and GSA tested are shown in Table 1.
Table 1: Oxides Composition of OPC and GSA OXIDES (%) OPC GSA
SiO2 19.63 19.69 Al2O3 5.84 0.95 Fe2O3 3.98 0.68 CaO 57.75 1.23 MgO 1.44 0.59 K2O 0.16 1.67
Na2O 0.27 1.77 SO3 0.13 0.08
Loss on Ignition (LOI) 1.64 14.36
Comparison of Oxides Composition of OPC The comparison of the OPC (Dangote Brand) tested with standard and other research work is shown in Table 2. From the comparison in Table 2, the values of SiO2, Al2O3, Fe2O3, and MgO fell within the limit specified by SP:23 (1982) but the value of CaO is below the required limit. However, the value of SiO2, Al2O3, Fe2O3, CaO and MgO corresponds with that of Faleye et al., (2009). Comparison of Oxides Composition of GSA The comparison of the groundnut shell ash (GSA) tested with previous research work is shown in Table 3.
Table 2: Comparison of Oxides Composition of OPC
Oxides (%)
OPC (Tested)
SP 23 (1982) Indian
Standard
Faleye, et al., (2009)
Dangote Brand SiO2 19.63 19 – 24 20.62
Al2O3 5.84 3 – 6 6.01 Fe2O3 3.98 1 – 4 3.22 CaO 57.75 59 – 64 59.6 MgO 1.44 0.5 – 4 3.65 K2O 0.16 - -
Na2O 0.27 - 0.71 SO3 0.13 - 2.46 LOI 1.64 - -
Table 3: Comparison of Oxides Composition of GSA
OXIDES (%) GSA (Tested)
Alabadan et. al. (2006)
Buhari et. al. (2013)
SiO2 19.69 15.92 16.21 Al2O3 0.95 6.73 5.93 Fe2O3 0.68 1.93 1.80 CaO 1.23 8.66 8.69 MgO 0.59 6.12 6.74 K2O 1.67 - 15.73
Na2O 1.77 - 9.02 SO3 0.08 - 6.21 LOI 14.36 - 4.80
ASTM C-618 (2005) specifies that the sum of SiO2, Al2O3, and Fe2O3 of a pozzolanic material should not be less than 70%. The sum of SiO2, Al2O3, and Fe2O3 of the groundnut shell ash (GSA) tested is 21.32% which is low to that of Alabadan et. al. (2006), Buhari et. al. (2013) and 70% specified by ASTM C-618 (2005). However, the result of the groundnut shell ash (GSA) tested shows that silicon dioxide (SiO2) have the highest percentage of oxide composition. The result also shows that the chemical composition of the groundnut shell ash compared varies from each other. Fineness of OPC and GSA The fineness of the cement was conducted by sieve method using sieve size 90microns. The results of the fineness test are shown in Table 4.
Table 4: Fineness of OPC and GSA S/No. Test Samples Fineness (%)
1. OPC 2.5 2. GSA 3.0
The results of the fineness test shows that both OPC and GSA are less than 10% of the total weight of sample (100g) used for conducting the test. Specific Gravity of OPC and GSA The results of specific gravity of the selected brands of cement are shown in Table 5.
Table 5: Specific gravity of OPC and GSA S/No. Test Samples Specific Gravity
1. OPC 3.13 2. RHA 1.74

ACTA TECHNICA CORVINIENSIS – Bulletin of Engineering
157 | F a s c i c u l e 3
Typical values for specific gravity of Portland cement as specified by Chen et. al. (2003) lie within the range of 3.1 to 3.2. The results of specific gravity of the cement tested as shown in Table 5 fells within the acceptable limits. The result of the specific gravity of GSA is low to that of OPC but the value is higher than the one reported by Raheem et. al., 2013 (1.54) and Buhari et. al., 2013 (1.54) Standard Consistency of OPC/GSA and OPC/GSA/CaCl2 The Standard Consistency test conformed with IS 4031-4 (1988).
Table 6: Standard Consistency of OPC/GSA and OPC/GSA/CaCl2
S/No. Replacement of OPC with GSA (%)
Consistency (%)
1 0% 27
2 5% GSA 30 5 GSA%, 1% CaCl2 29
3 10% GSA 33 10 GSA%, 1% CaCl2 32.5
4 15% GSA 36 15 GSA%, 1% CaCl2 35
5 20% GSA 36.5 20 GSA%, 1% CaCl2 35.5
Figure 2: Bar Chart of Consistency against GSA-
Replacement
Figure 3: Graph of Consistency against
GSA-Replacement The results from Table 6 above shows that 20% groundnut shell ash (GSA) replacement have the highest consistency (amount of water required to give a paste) while 0% have the lowest consistency.
However, as the percentage replacement increases, the consistency also increases for both OPC/GSA and OPC/GSA/CaCl2. The results are represented in Figure 2 and 3 respectively. Setting Time of OPC/RHA and OPC/RHA/CaCl2 The Setting Time test conformed with IS 4031-5 (1988).
Table 7: Setting Time of OPC/GSA and OPC/GSA/CaCl2
S/No. Replacement of OPC with GSA (%)
Setting time (Mins.) Initial Final
1 0% 81 141
2 5% GSA 110 200 5 GSA%, 1% CaCl2 95 185
3 10% GSA 125 215 10 GSA%, 1% CaCl2 110 185
4 15% GSA 95 200 15 GSA%, 1% CaCl2 80 170
5 20% GSA 80 170 20 GSA%, 1% CaCl2 65 155
Figure 4: Bar Chart of Setting Time against GSA-
Replacement American Standard ASTM C 150-07 prescribes a minimum time for the initial set of 45 minutes and final set of 375 minutes while IS 269 (2013) and IS 12269 (2013) prescribes a minimum time for the initial set of 30 minutes and maximum final set of 600 minutes.
Figure 5: Graph of Setting Time against
GSA-Replacement The result of the setting time shows that all percentage replacement (OPC/GSA and OPC/GSA/CaCl2) conformed to the minimum initial time and maximum final time specified by ASTM C 150-07, IS 269 (2013) and IS 12269
ACTA TECHNICA CORVINIENSIS – Bulletin of Engineering
158 | F a s c i c u l e 3
(2013). However, the initial and final setting time shows that OPC/GSA/CaCl2 set faster than OPC/GSA. The results are further represented in Figure 4 and 5 respectively. CONCLUSIONS From the investigation and analysis of results, the following conclusions can be drawn from this present study: The value of calcium oxide (CaO) of cement is below
the required limit. However, the value of SiO2, Al2O3, Fe2O3, CaO and MgO corresponds with that of Faleye et al., (2009).
The chemical composition of the groundnut shell ash (GSA) shows that silicon dioxide (SiO2) have the highest percentage of oxide composition. However, the chemical composition of the groundnut shell ash (GSA) compared varies from each other.
The specific gravity of cement (OPC) falls within the acceptable limits. However, the result of the specific gravity of GSA is low to that of OPC but the value is higher than the one reported by Raheem et. al., 2013 (1.54) and Buhari et. al., 2013 (1.54).
The standard consistency shows that 20% groundnut shell ash (GSA) replacement have the highest consistency (amount of water required to give a paste) while 0% have the lowest consistency. However, as the percentage replacement increases, the consistency also increases for both OPC/GSA and OPC/GSA/CaCl2.
The setting time shows that all percentage replacement (OPC/GSA and OPC/GSA/CaCl2) conformed to the minimum initial time and maximum final time specified by ASTM C 150-07, IS 269 (2013) and IS 12269 (2013). However, the initial and final setting time shows that OPC/GSA/CaCl2 set faster than OPC/GSA.
References [1.] Ajobo, J.A.: Densification Characteristics of
Groundnut Shell. International Journal of Mechanical and Industrial Technology, Vol. 2, Issue 1, 150-154, (2014).
[2.] Alu, S.E; Adua, M.M; Damulak, H.I; Umar, R.S; Abubakar, A.D; and Matthew, U.D.: Growth rate and nutrient digestibility by broiler birds fed alkali-treated groundnut (Arachis hypogea) shell meal-based diets, Scholarly Journal of Agricultural Science Vol. 2(10), 231-237, (2012).
[3.] ASTM C494-99: Standard Specification for Chemical Admixtures for Concrete, American Society for Testing and Materials (ASTM International), 100 Barr Harbor Drive, PO Box C700, West Conshohocken, PA 19428-2959, United States, (1999).
[4.] ASTM C 618-05: Specifications for Coal Fly Ash and Raw or Calcined Natural Pozzolan for Use in
Concrete, American Society for Testing and Materials (ASTM International), 100 Barr Harbor Drive, PO Box C700, West Conshohocken, PA 19428-2959, United States, (2005).
[5.] ASTM C 150-07: Standard Specification for Portland Cement, American Society for Testing and Materials (ASTM International), 100 Barr Harbor Drive, PO Box C700, West Conshohocken, PA 19428-2959, United States, 467-471, (2007).
[6.] Chen, W.F. and Richard, J.Y: The Civil Engineering Handbook, 2nd Edition, (Chp. 40, Section 40.2), 2000 N.W. Corporate Blvd., Boca Raton, Florida 33431, CRC Press LLC, (2003).
[7.] Egbe – Ngu, N.O. and Okorie A.U.: Effect of Particle Size of Groundnut Husk Ash (GHA) in Cement Paste and Mortar, International Journal on Recent and Innovation Trends in Computing and Communication, Volume 2, Issue 9, 2764-2769, (2014).
[8.] Faleye, F. J., Ogunnubi, S. and Olaofe, O.: Chemical and Physical Analyses of Selected Cement Samples in Nigerian Market, Bangladesh Journal of scientific And Industrial research, 44(1), 41-50, (2009).
[9.] IS 269: Indian Standard Specification for Ordinary Portland Cement, 33 Grade, Bureau of Indian Standards, New Delhi 110002, 5th Revision, pp.1-5, March 2013.
[10.] IS 4031-4: Indian Standard Methods of Physical Tests for Hydraulic Cement, Part 4, Determination of Consistency of Standard Cement Paste, Bureau of Indian Standards, New Delhi 110002, pp.1-2, (1988), 1st Revision, 3rd Reprint October, 1997.
[11.] IS 4031-5: Indian Standard Methods of physical tests for hydraulic cement, Part 5, Determination of initial and final setting times, Bureau of Indian Standards, New Delhi 110002, pp.1-2, 1st Revision, 1988, (Reaffirmed 2000).
[12.] IS 12269: Indian Standard Specification for Ordinary Portland Cement, 53 Grade”: Bureau of Indian Standards, New Delhi 110002, pp.1-6, 1st Revision, March 2013.
[13.] SP 23: Handbook on Concrete Mixes”: Based On Indian Standards. Bureau of Indian Standards, New Delhi 110002, (1982) 6th Reprint, November 2001.
copyright © University POLITEHNICA Timisoara,
Faculty of Engineering Hunedoara, 5, Revolutiei, 331128, Hunedoara, ROMANIA
http://acta.fih.upt.ro
© copyright Faculty of Engineering – Hunedoara, University POLITEHNICA Timisoara
ACTA TECHNICA CORVINIENSIS – Bulletin of Engineering Tome X [2017] Fascicule 3 [July – September] ISSN: 2067 – 3809
1. Ján ZBOJOVSKÝ, 2.Iraida KOLCUNOVÁ, 2Marek PAVLÍK, 1.Marek ČEŠKOVIČ, 1.František ADAMČÍK, 1.Martin KRCHŇÁK
MODEL OF ANECHOIC CHAMBER FOR EVALUATING THE SHIELDING EFFECTIVENESS OF ELECTROMAGNETIC FIELD 1. Technical University of Košice, Faculty of Aeronautics, Department of Avionics, Kosice, SLOVAKIA 2. Technical University of Košice, Faculty of Electrical Engineering and Informatics, Department of Electric Power Engineering, Košice, SLOVAKIA Abstract: Over the last years occurred a rapid growth in the utilization of technology, in which is creating electromagnetic radiation of different frequencies. At first it was the high-voltage lines, transformers and electrical installations in houses. To these sources of field had been included also wireless network to the internet, telecommunications and navigation connection. Due to this it is necessary to pay attention and research it, while modeling belongs to a fundamental ways of developing and analyzes the propagation of field through various materials. This paper deals with model of anechoic chamber created in ANSYS HFSS. Model is created for evaluating the shielding effectiveness of materials with different properties. In that case it is possible to optimize the shielding effectiveness of materials with changing of its properties. Model works for frequency range from 1 to 10 GHz. Keywords: shielding effectiveness, electromagnetic field, frequency, anechoic chamber, ANSYS INTRODUCTION Over the last century occurred a huge technological development in the world. Over time, humanity passed through the creation of simple devices and equipments to creating a variety of innovative devices, which are higher quality and technically complicated as previously. This caused an increase of sources of electromagnetic field, and it is almost impossible to avoid their activity at the present. Electromagnetic field is created either from natural radiation, or is artificially created from electrical devices. Some devices are used directly in order to form of this field, while in some devices is formed as by-product of their operation. At first it was the high-voltage lines, transformers and electrical installations in houses. To these sources of field had been included also wireless network to the internet, telecommunications and navigation connection. [1][2] Due to this it is necessary to pay attention and research it, while modeling belongs to a fundamental ways of
developing and analyzes the propagation of field through various materials. [3][4] IMPACT OF ELECTROMAGNETIC FIELD TO THE BIOLOGICAL ORGANISM Electromagnetic field can be described by Maxwell's equations:
rot H = J + ∂D∂t
(1)
rot 𝐄𝐄 = −∂𝐁𝐁∂t
(2)
div 𝐃𝐃 = ρ div 𝐃𝐃 = ρ (3) ED HB ε=µ= (4)
Over the last years occurred a rapid growth in the utilization of technology, in which is creating electromagnetic radiation of different frequencies. Besides the positive results arising the impact of electromagnetic field are also negative. Is much more difficult to determine it, since the testing on the human organism is not possible and thus cannot be exactly determined and discuss about diseases

ACTA TECHNICA CORVINIENSIS – Bulletin of Engineering
160 | F a s c i c u l e 3
caused primary by these field. But electromagnetic field can have a negative impact on individual from its state of health, thus worsening of its condition, or outbreaks of the disease. The discovery, that the electromagnetic field could have direct negative impact on the emergence of diseases like a cancer, organ damage etc., could negatively affect the contemporary lifestyle dependent on electricity. Various organizations are working to research and tests, which are trying to find impact of electromagnetic field on living organisms. In Slovakia, the protection of population currently provides decree of Healthcare Ministry of the Slovak Republic number 534/2007 Z.z. (Collections of laws) about details and requirements on sources of electromagnetic radiation and limits of exposure of the population to electromagnetic radiation in the environment. [2][5] CALCULATION OF SHIELDING EFFECTIVENESS As it was mentioned above, one of the ways of protection against the harmful effects is the shielding. Shielding effectiveness can be expressed by the following equations, these equations is for case, if the value of the transmitted signal is set in logarithmic unit:
𝑆𝑆𝑆𝑆 = |𝑆𝑆1| − |𝑆𝑆2| (5)
𝑆𝑆𝑆𝑆 = |𝐻𝐻1|− |𝐻𝐻2| (6)
where E1, H1, represents the magnitude of electric and magnetic field impinging on a shielding material (barrier) and E2, H2 represents the magnitude of electric and magnetic field at some specific point of shielded area. [7] MODEL OF THE ANECHOIC CHAMBER The frequency-dependent simulation of electro-magnetic field is created in the program HFSS (high frequency structural simulator).
Figure 1. Model of anechoic chamber
The created model is an anechoic chamber, located at the Department of Electric Power Engineering at the Technical University of Košice. Frequency range is from 1 GHz to 10 GHz. The following figure shows the model of chamber, for evaluate of shielding effectiveness material “brick” was chosen. [9] [10] Figure 2 shows the propagation of electromagnetic wave in chamber. In the middle material "brick" is located. It can be seen the deformation of the waves at the interface of the materials.
Figure 2. The wave propagation inside the model
RESULTS Obtained from simulations were then calculated shielding effectiveness. With increasing frequency we had a better values of shielding effectiveness. The maximum value reached at a frequency of 5.8 GHz, and it was 7.165436254 dB. In the following table is a comparison of the shielding effectiveness for the frequencies used in the range of 1-10 GHz.
Table 1. The shielding effectiveness for compared frequencies
Freq [GHz] Utilization Shielding effectiveness
[dB]
1,8 Mobile network (2G) 2,719510795
2,1 Mobile network (3G) 3,89742965
2,4 WiFi 4,759421802
2,6 Mobile network (4G LTE) 4,31603198
5 WiFi 6,636557869
5,8 Satelite signal (VSAT) 7,165436254
6,7 Satelite signal (VSAT) 7,092218711
7 Analog TV 7,056538597

ACTA TECHNICA CORVINIENSIS – Bulletin of Engineering
161 | F a s c i c u l e 3
CONCLUSION Humanity is almost exposed to electromagnetic field radiation. Given that the electromagnetic field is not observed by human eye, people do not realize that they are constantly exposed to its action. Organizations such as the World Health Organization or the European Union are making efforts on research into the impact of electromagnetic fields. Problem occurs also in ensuring proper functioning of electrical equipment, which are sensitive to electromagnetic fields. The paper was aimed to create conditions and get closer in simulation of electromagnetic field to the fair values obtained from measurements performed in an anechoic chamber at the Department of Electric Power Engineering FEI TU Košice. The advantage of simulation compared to measurement is the possibility of modeling the material which reports adequate shielding effectiveness by a suitable choice of its electrical properties. At same it is possible to further optimize the model according to the characteristics of an anechoic chamber at the Department of Avionics, Faculty of Aeronautics TU, and perform comparative measurements and simulations. Acknowledgements This work is the result of the project implementation: Protection of the population of the Slovak Republic from the effects of electromagnetic fields, ITMS: 26220220145, Activity 2.1 supported by the Research & Development Operational Programme funded by the ERDF. This work was supported by project VEGA SR No.1/0132/15. This work was supported by project: Convergence, Regional Competitiveness and Employment ITMS: 26210120002, 26230120002.
References [1] VECCHIA P, et al: Exposure to high frequency
elektromagnetic fields, biological effects and health consequences (100 kHz to 300 GHz), INCIRP 16/2009
[2] Dolník, B.: Electromagnetic compatibility. (Elektromagnetická kompatibilita). TU of Košice, dec. 2013, monography. ISBN 978-80-8086-221-3.
[3] Liptai, P.: Meranie elektromagnetického tienenia kombinovaného materiálu a možnosti jeho využitia. Fyzikálne faktory prostredia. Roč. 5, č. 2 (2015), s. 45-48. ISSN 1338-3922.
[4] YOSHINO, Y., SHOTA, I., MICHIHIKO, K., MASAO, T., Assessment of human exposure to electromagnetic field from an intra-body communication device using intermediate frequency electric field, International Symposium on Electromagnetic Compatibility
[5] Liptai, P.: Metodika merania a hodnotenia vysokofrekvenčných elektromagnetických polí základňových staníc mobilných operátorov v
obývaných oblastiach. Ukraine – EU. Modern Technology, Business and Law. Chernihiv National University of Technology, 2016 pp. 306-309. ISBN 978-966-7496-71-5.
[6] LORRAIN, Paul et al.: Electromagnetic fields and waves. Third edition New York City 1988. 754s. ISBN 0-716-71823-5
[7] Űnal, E. - Gőkcen, A. - Kutlu, Y.: Effective Electromagnetic Shielding, IEEE Microwave magazine, 2006 s. 48 – 54. ISSN 1527-3342
[8] Celozzi, S. - Araneo, R. - Lovat, G.: Electromagnetic Shielding, Electrical Engineering Department La Sapienza University Rome, Italy, IEEE Press.
[9] CUINAS I., SÁNCHEZ GARCÍA M.: Permittivity and Conductivity Measurements of Building Materials at 5.8 GHz and 41.5 GHz, Wireless Personal Communications 20, 2002, 93-100s
[10] Whamid Al-Shabib: Simulation vs. measurement of polyaniline for electromagnetic interference shielding. School of Engineering, Edith Cowan University, Western Australia, 2014. ISBN 978-1-4799-3351-8/14
copyright ©
University POLITEHNICA Timisoara, Faculty of Engineering Hunedoara,
5, Revolutiei, 331128, Hunedoara, ROMANIA http://acta.fih.upt.ro

ACTA TECHNICA CORVINIENSIS – Bulletin of Engineering
162 | F a s c i c u l e 3
We are very pleased to inform that our international and interdisciplinary journal ACTA TECHNICA CORVINIENSIS Bulletin of Engineering completed its nine years of publication successfully [issues of years 2008 –2016, Tome I–IX]. In a very short period it has acquired global presence and scholars from all over the world have taken it with great enthusiasm.
Every year, in four online issues (fascicules 1 – 4), ACTA TECHNICA CORVINIENSIS Bulletin of Engineering [e-ISSN: 2067-3809] publishes a series of reviews covering the most exciting and developing fields of science and technology. Each issue contains papers reviewed by international researchers who are experts in their fields. The result is a journal that gives the scientists and engineers the opportunity to keep informed of all the current developments in their own, and related, areas of research, ensuring the new ideas across an increasingly the interdisciplinary field. Now, when will celebrate the tenth years anniversary of ACTA TECHNICA CORVINIENSIS Bulletin of Engineering, we are extremely grateful and heartily acknowledge the kind of support and encouragement from all contributors and all collaborators!
On behalf of the Editorial Board and Scientific Committees of ACTA TECHNICA CORVINIENSIS Bulletin of Engineering, we would like to thank the many people who helped make this journal successful. We thank all authors who submitted their work to ACTA TECHNICA CORVINIENSIS Bulletin of Engineering.
copyright © University POLITEHNICA Timisoara,
Faculty of Engineering Hunedoara, 5, Revolutiei, 331128, Hunedoara, ROMANIA
http://acta.fih.upt.ro
© copyright Faculty of Engineering – Hunedoara, University POLITEHNICA Timisoara
ACTA TECHNICA CORVINIENSIS – Bulletin of Engineering Tome X [2017] Fascicule 3 [July – September] ISSN: 2067 – 3809
MANUSCRIPT PREPARATION – GENERAL GUIDELINES
Manuscripts submitted for consideration to ACTA TECHNICA CORVINIENSIS – Bulletin of Engineering must conform to the following requirements that will facilitate preparation of the article for publication. These instructions are written in a form that satisfies all of the formatting requirements for the author manuscript. Please use them as a template in preparing your manuscript. Authors must take special care to follow these instructions concerning margins. INVITATION We are looking forward to a fruitful collaboration and we welcome you to publish in our ACTA TECHNICA CORVINIENSIS – Bulletin of Engineering. You are invited to contribute review or research papers as well as opinion in the fields of science and technology including engineering. We accept contributions (full papers) in the fields of applied sciences and technology including all branches of engineering and management. ACTA TECHNICA CORVINIENSIS – Bulletin of Engineering publishes invited review papers covering the full spectrum of engineering and management. The reviews, both experimental and theoretical, provide general background information as well as a critical assessment on topics in a state of flux. We are primarily interested in those contributions which bring new insights, and papers will be selected on the basis of the importance of the new knowledge they provide. Submission of a paper implies that the work described has not been published previously (except in the form of an abstract or as part of a published lecture or academic thesis) that it is not under consideration for publication elsewhere. It is not accepted to submit materials which in any way violate copyrights of third persons or law rights. An author is fully responsible ethically and legally for breaking given conditions or misleading the Editor or the Publisher. ACTA TECHNICA CORVINIENSIS – Bulletin of Engineering is an international and interdisciplinary journal which reports on scientific and technical contributions. Every year, in four online issues (fascicules 1 – 4), ACTA TECHNICA CORVINIENSIS –
Bulletin of Engineering [e-ISSN: 2067-3809] publishes a series of reviews covering the most exciting and developing areas of engineering. Each issue contains papers reviewed by international researchers who are experts in their fields. The result is a journal that gives the scientists and engineers the opportunity to keep informed of all the current developments in their own, and related, areas of research, ensuring the new ideas across an increasingly the interdisciplinary field. Topical reviews in materials science and engineering, each including: surveys of work accomplished to date current trends in research and applications future prospects.
As an open-access journal ACTA TECHNICA CORVINIENSIS – Bulletin of Engineering will serve the whole engineering research community, offering a stimulating combination of the following: Research Papers – concise, high impact original
research articles, Scientific Papers – concise, high impact original
theoretical articles, Perspectives – commissioned commentaries
highlighting the impact and wider implications of research appearing in the journal.
ACTA TECHNICA CORVINIENSIS – Bulletin of Engineering encourages the submission of comments on papers published particularly in our journal. The journal publishes articles focused on topics of current interest within the scope of the journal and coordinated by invited guest editors. Interested authors are invited to contact one of the Editors for further details.

ACTA TECHNICA CORVINIENSIS – Bulletin of Engineering
164 | F a s c i c u l e 3
BASIC INSTRUCTIONS AND MANUSCRIPT REQUIREMENTS The basic instructions and manuscript requirements are simple: » Manuscript shall be formatted for an A4 size page. » The all margins (top, bottom, left, and right) shall be
25 mm. » The text shall have both the left and right margins
justified. » Single-spaced text, tables, and references, written
with 11 or 12-point Georgia or Times Roman typeface.
» No Line numbering on any pages and no page numbers.
» Manuscript length must not exceed 15 pages (including text and references).
» Number of figures and tables combined must not exceed 20.
» Manuscripts that exceed these guidelines will be subject to reductions in length.
The original of the technical paper will be sent through e-mail as attached document (*.doc, Windows 95 or higher). Manuscripts should be submitted to e-mail: [email protected], with mention “for ACTA TECHNICA CORVINIENSIS – Bull. of Eng.”. STRUCTURE The manuscript should be organized in the following order: Title of the paper, Authors' names and affiliation, Abstract, Key Words, Introduction, Body of the paper (in sequential headings), Discussion & Results, Conclusion or Concluding Remarks, Acknowledgements (where applicable), References, and Appendices (where applicable). THE TITLE The title is centered on the page and is CAPITALIZED AND SET IN BOLDFACE (font size 14 pt). It should adequately describe the content of the paper. An abbreviated title of less than 60 characters (including spaces) should also be suggested. Maximum length of title: 20 words. AUTHOR’S NAME AND AFFILIATION The author's name(s) follows the title and is also centered on the page (font size 11 pt). A blank line is required between the title and the author's name(s). Last names should be spelled out in full and succeeded by author's initials. The author's affiliation (in font size 11 pt) is provided below. Phone and fax numbers do not appear. ABSTRACT State the paper's purpose, methods or procedures presentation, new results, and conclusions are presented. A nonmathematical abstract, not exceeding 200 words, is required for all papers. It should be an abbreviated, accurate presentation of the contents of the paper. It should contain sufficient information to
enable readers to decide whether they should obtain and read the entire paper. Do not cite references in the abstract. KEY WORDS The author should provide a list of three to five key words that clearly describe the subject matter of the paper. TEXT LAYOUT The manuscript must be typed single spacing. Use extra line spacing between equations, illustrations, figures and tables. The body of the text should be prepared using Georgia or Times New Roman. The font size used for preparation of the manuscript must be 11 or 12 points. The first paragraph following a heading should not be indented. The following paragraphs must be indented 10 mm. Note that there is no line spacing between paragraphs unless a subheading is used. Symbols for physical quantities in the text should be written in italics. Conclude the text with a summary or conclusion section. Spell out all initials, acronyms, or abbreviations (not units of measure) at first use. Put the initials or abbreviation in parentheses after the spelled-out version. The manuscript must be writing in the third person (“the author concludes... ”). FIGURES AND TABLES Figures (diagrams and photographs) should be numbered consecutively using Arabic numbers. They should be placed in the text soon after the point where they are referenced. Figures should be centered in a column and should have a figure caption placed underneath. Captions should be centered in the column, in the format “Figure 1” and are in upper and lower case letters. When referring to a figure in the body of the text, the abbreviation “Figure” is used Illustrations must be submitted in digital format, with a good resolution. Table captions appear centered above the table in upper and lower case letters. When referring to a table in the text, “Table” with the proper number is used. Captions should be centered in the column, in the format “Table 1” and are in upper and lower case letters. Tables are numbered consecutively and independently of any figures. All figures and tables must be incorporated into the text. EQUATIONS & MATHEMATICAL EXPRESSIONS Place equations on separate lines, centered, and numbered in parentheses at the right margin. Equation numbers should appear in parentheses and be numbered consecutively. All equation numbers must appear on the right-hand side of the equation and should be referred to within the text. CONCLUSIONS A conclusion section must be included and should indicate clearly the advantages, limitations and possible applications of the paper. Discuss about future work.

ACTA TECHNICA CORVINIENSIS – Bulletin of Engineering
165 | F a s c i c u l e 3
Acknowledgements An acknowledgement section may be presented after the conclusion, if desired. Individuals or units other than authors who were of direct help in the work could be acknowledged by a brief statement following the text. The acknowledgment should give essential credits, but its length should be kept to a minimum; word count should be <100 words. References References should be listed together at the end of the paper in alphabetical order by author’s surname. List of references indent 10 mm from the second line of each references. Personal communications and unpublished data are not acceptable references. Journal Papers: Surname 1, Initials; Surname 2, Initials and Surname 3, Initials: Title, Journal Name, volume (number), pages, year. Books: Surname 1, Initials and Surname 2, Initials: Title, Edition (if existent), Place of publication, Publisher, year. Proceedings Papers: Surname 1, Initials; Surname 2, Initials and Surname 3, Initials: Paper title, Proceedings title, pages, year. ACTA TECHNICA CORVINIENSIS – Bulletin of Engineering is an international and interdisciplinary journal which reports on scientific and technical contributions. The ACTA TECHNICA CORVINIENSIS – Bulletin of Engineering advances the understanding of both the fundamentals of engineering science and its application to the solution of challenges and problems in engineering and management, dedicated to the publication of high quality papers on all aspects of the engineering sciences and the management. You are invited to contribute review or research papers as well as opinion in the fields of science and technology including engineering. We accept contributions (full papers) in the fields of applied sciences and technology including all branches of engineering and management. Submission of a paper implies that the work described has not been published previously (except in the form of an abstract or as part of a published lecture or academic thesis) that it is not under consideration for publication elsewhere. It is not accepted to submit materials which in any way violate copyrights of third persons or law rights. An author is fully responsible ethically and legally for breaking given conditions or misleading the Editor or the Publisher. The Editor reserves the right to return papers that do not conform to the instructions for paper preparation and template as well as papers that do not fit the scope of the journal, prior to refereeing. The Editor reserves the right not to accept the paper for print in the case of a negative review made by reviewers and also in the case of not paying the required fees if such will be fixed
and in the case time of waiting for the publication of the paper would extend the period fixed by the Editor as a result of too big number of papers waiting for print. The decision of the Editor in that matter is irrevocable and their aim is care about the high content-related level of that journal. The mission of the ACTA TECHNICA CORVINIENSIS – Bulletin of Engineering is to disseminate academic knowledge across the scientific realms and to provide applied research knowledge to the appropriate stakeholders. We are keen to receive original contributions from researchers representing any Science related field. We strongly believe that the open access model will spur research across the world especially as researchers gain unrestricted access to high quality research articles. Being an Open Access Publisher, Academic Journals does not receive payment for subscription as the journals are freely accessible over the internet. GENERAL TOPICS ENGINEERING Mechanical Engineering Metallurgical Engineering Agricultural Engineering Control Engineering Electrical Engineering Civil Engineering Biomedical Engineering Transport Engineering Nanoengineering CHEMISTRY General Chemistry Analytical Chemistry Inorganic Chemistry Materials Science & Metallography Polymer Chemistry Spectroscopy Thermo-chemistry ECONOMICS Agricultural Economics Development Economics Environmental Economics Industrial Organization Mathematical Economics Monetary Economics Resource Economics Transport Economics General Management Managerial Economics Logistics AGRICULTURE Agricultural & Biological Engineering Food Science & Engineering Horticulture

ACTA TECHNICA CORVINIENSIS – Bulletin of Engineering
166 | F a s c i c u l e 3
INFORMATION SCIENCES Computer Science Information Science EARTH SCIENCES Geodesy Geology Hydrology Seismology Soil science ENVIRONMENTAL Environmental Chemistry Environmental Science & Ecology Environmental Soil Science Environmental Health BIOTECHNOLOGY Biomechanics Biotechnology Biomaterials MATHEMATICS Applied mathematics Modeling & Optimization Foundations & Methods ACTA TECHNICA CORVINIENSIS – Bulletin of Engineering has been published since 2008, as an online supplement of the ANNALS of FACULTY ENGINEERING HUNEDOARA – International Journal of Engineering. Now, the ACTA TECHNICA CORVINIENSIS – Bulletin of Engineering is a free-access, online, international and multidisciplinary publication of the Faculty of Engineering Hunedoara. ACTA TECHNICA CORVINIENSIS – Bulletin of Engineering exchange similar publications with similar institutions of our country and from abroad.
copyright © University POLITEHNICA Timisoara,
Faculty of Engineering Hunedoara, 5, Revolutiei, 331128, Hunedoara, ROMANIA
http://acta.fih.upt.ro
ISSN:2067-3809

Edited by:
FACULTY OF ENGINEERING HUNEDOARA UNIVERSITY POLITEHNICA TIMISOARA
with kindly supported by:
THE GENERAL ASSOCIATION OF ROMANIAN ENGINEERS (AGIR)
– branch of HUNEDOARA
Editor / Technical preparation / Cover design:
Assoc. Prof. Eng. KISS Imre, PhD. UNIVERSITY POLITEHNICA TIMISOARA,
FACULTY OF ENGINEERING HUNEDOARA
Commenced publication year: 2008

copyright © University POLITEHNICA Timisoara, Faculty of Engineering Hunedoara,
5, Revolutiei, 331128, Hunedoara, ROMANIA http://acta.fih.upt.ro