india and china: past trade liberalization and future ... · pdf fileindia and china: past...
TRANSCRIPT

India and China: Past Trade Liberalization and Future Challenges
Arvind Panagariya*
February 4, 2007
* The author is a Professor of Economics and Jagdish Bhagwati Professor of Indian Political Economy at the School of Public and International Affairs at Columbia University. He gratefully acknowledges financial support from Nomura Research Institute, Ltd. in writing this paper.
1

Contents
1 Introduction................................................................................................................. 1
2 Recent Performance .................................................................................................... 3
3 The Pattern of Trade ................................................................................................... 7
3.1 Merchandise Exports .......................................................................................... 8
3.2 Service Exports ................................................................................................. 14
3.3 Merchandise Imports ........................................................................................ 15
4 Foreign Investment ................................................................................................... 16
5 Trade and Foreign Investment Liberalization........................................................... 18
6 Looking Ahead.......................................................................................................... 24
6.1 National Trade Policies..................................................................................... 24
6.2 Preferential Trade Area (PTA) Arrangements.................................................. 27
6.3 The Doha Round............................................................................................... 32
7 Summary ................................................................................................................... 34
2

External Liberalization by India and China: Recent Experience and Future
Challenges
Arvind Panagariya*
1 Introduction
India and China are widely seen as changing the face of the global economy.
Depending on which estimates are used, China has been growing at rates between 8 and
10 percent per annum since the early 1980s. As conventionally measured, India has been
growing at 6 percent since the late 1980s and has recently shifted up to 8 percent. In
current dollars, India grew 16.3 percent during the three years ending with the fiscal year
2005-06.1 Allowing for 3 percent inflation in the U.S., this implies a growth rate of 13.3
percent in real dollars.
The GDP of China in current dollars was $2,228 billion and that of India $785
billion in 2005. Together, the two countries had a GDP of $3 trillion at the market
exchange rate.2 Given that the currency of neither country is likely to depreciate in a
major way in the forthcoming years and their inflation rates are likely to exceed that in
the U.S., we can scarcely rule out a 10 percent per annum growth in constant dollars in
their combined GDP. Under this assumption, the combined GDP of the two countries
would reach $7.8 trillion (at 2005 prices) in ten years. If the U.S. manages to sustain a
* The author is a Professor of Economics and Jagdish Bhagwati Professor of Indian Political Economy at the School of Public and International Affairs at Columbia University. He gratefully acknowledges financial support from Nomura Research Institute, Ltd. in writing this paper. 1 In India, fiscal year runs from April 1 to March 31. Therefore, 2005-06 refers to the period beginning April 1, 2005 and ending March 31, 2006. 2 Unlike many, I choose the measure of the GDP at the market exchange rate because if we are to judge the impact of a country on the global economy (rather than the living standard of its citizenry), this is a better measure than the GDP at the Purchasing Power Parity (PPP).

growth rate of 4 percent in real terms over the next ten years, its GDP will rise from
$12.5 trillion in 2005 to $18.5 trillion ten years later. Such a change will represent a
dramatic shift in the composition of the world income. The likely shift is perhaps even
bigger since the prospects of the U.S. growing at 4 percent per year for ten years are low.
It is against this background that I study the role of outward-oriented trade and
foreign investment policies in stimulating growth in China and India. An important
difference between the two countries I stress in the paper is that while both Indian and
China have achieved sustained rapid growth under progressive opening up of the
economy, the response of trade and foreign investment in the former has been much more
muted. I hypothesize that this has been largely the result of slower growth of
manufacturing in India, which is in turn the result of a set of domestic-policy constraints,
most notably labor-market inflexibilities and infrastructure bottlenecks.
In the paper, I also discuss the future course of trade policy reform, especially in
India. Here I argue that the recent attention paid to preferential trade area agreements is
largely a diversion and both India and China stand to contribute more to the well being of
their populations and to the world economy by devoting greater attention to national and
multilateral tracks of trade liberalization. In particular, India must take cue from its
recent successful liberalization experience in the area of industrial goods and give greater
consideration to liberalization in agriculture.
The remainder of the paper is divided into six sections. In Section 2, I describe some
dramatic developments in the Indian economy in the last two years and argue that the
trend growth rate in India has now shifted from 6 percent to 8 percent. In Section 3, I
review some of the key developments in the flows of exports, imports and foreign
2

investment in India and compare them to China. In Section 4, I consider the relationship
of these developments to the policy changes undertaken by the two countries. In Section
5, I consider the trade policy changes facing India and China with special attention to
preferential trade area arrangements. In Section 6, I conclude the paper.
2 Recent Performance
After growing at the modest rate of 3.6 percent per annum from 1951-52 to 1980-81,
the Indian economy experienced an upward shift in the growth rate to 4.8 percent
between 1981-82 and 1987-88.3 In the late 1980s, the growth rate shifted up further with
the average annual growth reaching 6.1 percent between 1988-89 and 2004-05. This rate
is substantially below that achieved by China, which has grown between 9 and 10 percent
in the last two and half decades, but it is still impressive when evaluated against India’s
own past performance and that of virtually all other countries outside Asia.
Indeed, the developments during the last three years strongly suggest that India has
now shifted to an even higher growth rate of 8 percent, which is not far from the rates
achieved by many fast-growing East Asian economies at their peak. In principle, this
shift may merely represent an unusually strong upswing in the business cycle, propelled
by a very strong performance of the world economy. But the weight of the evidence
favors the hypothesis that the current spurt represents a shift in the trend growth rate.
Thus, consider the following facts documented in greater detail in Panagariya (2006a):
3 A period such as 1951-52 begins April 1, 1951 and ends on March 31, 1952 and relates to India’s fiscal year.
3

• In current dollar, the GDP grew 16.3 percent per annum during 2003-06. 4
Allowing for 3 percent inflation in the United States, this represents a 13.3
percent annual growth in real dollars. This is entirely unprecedented.
• Exports have grown dramatically during this period. For example, merchandise
exports in 1990-91 were $18.1 billion. In 2005-06, growth in exports over
exports in 2004-05 exceeded this amount. Put another way, exports in 1990-91
doubled for the first time in 1999-00. In the recent period, they doubled in just
three years: from $52.7 billion to $102.7 billion.
• Services exports have doubled in just two years: from $26.9 billion in 2003-04 to
$60.6 billion in 2005-06.
• India’s share in the world merchandise exports grew from 0.5 percent in 1990-91
to 0.7 percent in 1999-00 and to 1.0 percent in 2005-06. In services exports, the
share has grown to a respectable 2.5 percent in 2005-06.
• These change have greatly increased the integration of India into the world
economy. The exports of goods and services as a proportion of the GDP, which
grew rather gradually from 7.2 percent in 1990-91 to 11.6 percent in 1999-00,
shot up to 20.5 percent in 2005-06. The proportion of total trade (exports plus
imports of goods and services) to the GDP rose from 15.9 percent in 1990-91 to
25.2 percent in 1999-00 and then to 43.1 percent in 2005-06.
4 Unless otherwise stated, a period such as 2003-06 represents the years from 2003-04 to 2005-06 with endpoint years included.
4

• The total foreign investment has risen from $6 billion in 2002-03 to $20.2 billion
in 2005-06 though the growth in the direct foreign investment (DFI) from $5
billion to $7.8 billion over the same period has been less impressive.
• Remittances have risen from $17.2 billion in 2002-03 to $24.6 billion in 2005-06.
If we add the remittances and foreign investment, the flow of foreign resources at
$44.8 billion begins to look comparable to the DFI into China.
• In 1990-91, India had approximately 5 million phone lines in total. Currently,
India is adding more than 5 million phone lines per month. By July 31, 2006,
India had a total of 185 million phone lines.
• The total turnover of the automobile sector rose from $12.3 billion in 2002-03 to
$19 billion in 2004-05. The sales of passenger vehicles have risen from 707,000
in 2002-03 to 1.14 million in 2005-06.
Three factors support the view that this growth is likely to sustain rather than prove a
temporary business cycle effect. First, the last three years have seen India integrate into
the world economy as in no prior period. The total trade in goods and services reached
43 percent of the GDP in the year 2005-06. Even merchandise trade to GDP ratio was a
respectable 31 percent this past fiscal year. Likewise, remittances and foreign investment
together add to almost $45 billion. These developments have changed the initial
conditions for future growth for good. Second, given the large stock of foreign exchange
reserves of $165 billion on August 11, 2006, prospects of a large depreciation of the
rupee are low. This means the expansion in the dollar value of the GDP achieved will
sustain. Finally, the last major spurt in growth India saw was between 1993-94 and
1996-97. During these years, the GDP grew a little more than 7 percent per annum. But
5

the growth rate then plummet to 4.8 percent in 1997-98. The current phase has so far
shown no sign of slowing down. According to all available projections, despite natural
calamities and therefore very low agricultural growth, the GDP growth in 2006-07 is
expected to hit the 8 percent mark. In the debate on growth between optimists (e.g.,
Kelkar 2004) and skeptics (e.g., Acharya 2004), these factors persuade me to come on the
side of the former.5
This said, it is important to note that there remains much vulnerability in the Indian
growth process mandating caution against an overly optimistic view at this point. Some
of the vulnerabilities reflect themselves in the patterns of trade that I shall discuss in the
next section. Presently, let me point out that contrary to many overly optimistic
assessments, the evidence so far does not support the view that India will even catch up
with the per-capita income of China in the next two decades let alone significantly
surpass. In terms of virtually all indicators, India is likely to remain behind China in the
next two decades. To get an idea of where China stands, consider the following facts:
• The GDP in China was approximately equal to that in India in 1982. But by 2004,
it was 2.8 times the GDP in the latter.
• Per-capita income in China rose from 0.9 times that in India in 1982 to 2.5 times
in 2004.
• Trade in goods and services as a proportion of the GDP in China rose from 21
percent in 1982 to 65 percent in 2004.
5 In an article entitled “My Millennium Wish: Double Digit Growth” published in January 2000, (Panagariya 2000) I had concluded that though the reforms were getting into rough territory, a double-digit growth was “within the grasp of the country.”
6

• China’s share in the world goods and services exports rose from 2.6 percent in
1994 to 5.8 percent in 2004
• If we restrict ourselves to the world merchandise exports, China’s share rose from
2.8 percent in 1984 to 6.5 percent in 2004.
• In 2004 and the preceding two years, the increase in China’s merchandise exports
was larger than India’s absolute level of exports. This may have changed in the
last two years but I do not have the data to verify it.
3 The Pattern of Trade
I have recently compared the patterns of exports and imports of India and China in
great detail in Panagariya (2006b). This comparison offers some useful clues to the
question why despite considerable opening up, India’s trade and GDP have grown much
more slowly than those of China and why India continues to lag far behind it as the
recipient of direct foreign investment (DFI).
The key conclusion that emerges from the trade pattern is that India has been largely
unsuccessful in exploiting its comparative advantage in the unskilled-labor-intensive
goods. Based on the vast abundance of unskilled labor relative to capital as well as
skilled labor, we would expect India to export unskilled-labor-intensive goods and import
capital and skilled-labor-intensive goods. But the data reveal the opposite: India does
well in capital and skilled-labor-intensive products in the world markets than in
unskilled-labor-intensive products. This “perverse” pattern of trade limits India’s ability
to penetrate the world markets in a big way and therefore also its ability to effectively
exploit its vast pool of unskilled labor force. Unsurprisingly, India’s exports have grown
rather slowly except in the last three years.
7

In contrast, following the initial opening up in the late seventies and early eighties,
China could quickly reorient its export basket in favor of unskilled-labor-intensive
products. This reorientation was a key factor behind the substantial presence in the world
markets China acquired within a matter of a decade. Over time, as its labor force became
more skilled, China transitioned into products using semi-skilled labor. The evidence
presented below will demonstrate that the facility and rapidity with which China has
shifted into these new products is breathtaking.
3.1 Merchandise Exports
To see the differences between India and China in the area of foreign trade, consider
first the pattern of exports. For each of India and China, Table 1 presents all SITC
(Standard International Trade Classification) two-digit products that accounted for two
percent or more of their respective exports on the average during 2001-04. For each
product, the table provides the average share in exports during three adjacent time
periods: 1984-90, 1991-00 and 2001-04.
The key point to note is that among the top six exports of India, the only product that
is unambiguously unskilled-labor intensive is apparel. In addition, some of the products
in the miscellaneous manufactures category may be unskilled-labor intensive. Of the
remaining four items, three—textiles; iron and steel; and petroleum—are capital intensive
and one—non-metallic mineral manufactures consisting of principally gems and
jewelry—is semi-skilled-labor intensive. Unskilled-labor-intensive products such as
apparel, toys, footwear and other light manufactures that China exported in large volume
in the 1980s and 1990s have not done well in India. In contrast, products such as apparel,
toys, footwear, travel goods, handbags and sporting goods played an important role in the
8

growth of exports from China during the 1980s and 1990s. In the 2000s, as skill levels in
China rose, these products went into the background with office machinery and automatic
data processing machinery; telecommunications and sound recording equipment; and
electrical machinery, apparatus and appliances gaining in importance.
Table 1 also suggests much greater export dynamism in China than India. Non-
metallic mineral manufactures have continued to be the most important export from India
since the mid-1980. Based on factor endowments, apparel should have expanded far
more rapidly and become the most important export from India as happened in China in
the 1990s. But the share of apparel in the total exports of India declined in the 2000s.
Instead, it is such capital-intensive products as petroleum and iron and steel that have
gained in share. In contrast, in China, as its labor force has become more skilled, it has
shifted away from textiles and to some degree even from apparel. Instead, office
machinery and automatic data processing machinery; telecommunications and sound
recording equipment; and electrical machinery, apparatus and appliances have gained in
importance.
Table 2 reports the composition of India’s exports for the three most recent years:
2003-04 to 2005-06. Product classification in this table does not fully match that in Table
1 so that the two tables are not directly comparable. But this table strongly reinforces the
picture emerging from Table 1. Perhaps the most disturbing feature of the table is that it
shows a sharply declining share of manufacturing exports in the total exports: from 76
percent in 2003-04 to just 70 percent in 2005-06. The product that has taken its place is
petroleum, which has exactly doubled its share from 5.6 percent to 11.2 percent over the
same period. Even within manufacturing, textiles and apparel have suffered greatly,
9

declining from 20 percent in 2003-04 to 15.6 percent in 2005-06. Apparel exports,
represented by readymade garments in Table 2, have declined from 9.8 percent in 2003-
04 to 8.2 percent in 2005-06. On the other hand, engineering goods have risen in share
from 19.4 percent to 21 percent despite an overall decline in the share of manufacturing
products.
In order to bring out the sharp differences in the performance of the Indian and
Chinese exports, it is useful to consider the evolution of some of their major export items.
Figures 1 and 2 show the evolution of the top six exports of India and China, respectively,
as indicated by their exports in 2004. As I noted earlier, gems and jewelry (non-metallic
mineral manufactures) emerged as India’s larges export in the mid 1980s and have kept
their lead. Textiles and apparel, which have been running neck-to-neck, are close second
and third. With occasional switching, this ranking has been preserved over the last two
decades. Among the next three items, petroleum is known to shows an erratic pattern.
The other two—iron and steel and miscellaneous manufactures—have risen from
relatively low levels until at least the mid 1990s.
China’s exports present a more dramatic picture. In the mid to late 1980s, textiles
and apparel in that order led the way. Then apparel began to expand extremely rapidly,
becoming the dominant export in the mid 1990s.6 But from mid 1990s, textiles rapidly
declined in importance and replaced by miscellaneous manufactures as the second most
important export by the second half of the 1990s. More importantly, three categories of
new exports began to takeoff in a major way in the second half of the 1990s: office
6 The movements in the export shares of China and India in the world markets for textiles and apparel shown in Srinivasan (2006, Table 8) exhibit much greater dynamism of China’s exports relative to India.
10

machinery and automatic data processing machinery; telecommunications and sound
recording equipment; and electrical machinery, apparatus and appliances. By 2004, these
items had become China’s dominant exports.
Figure 1: Top Six Exports of India
0.0
2000.0
4000.0
6000.0
8000.0
10000.0
12000.0
14000.0
1980
1982
1984
1986
1988
1990
1992
1994
1996
1998
2000
2002
2004
66 Non-metallic mineralmanufactures, n.e.s.
65 Textile yarn,fabrics,made-uparticles, n.e.s. and relatedproducts84 Articles of apparel andclothing accessories
33 Petroleum,petroleumproducts and related material
89 Miscellaneousmanufactured articles
67 Iron and steel
11

Figure 2: Top six exports of China
0
10000
20000
30000
40000
50000
60000
70000
80000
90000
100000
1984
1986
1988
1990
1992
1994
1996
1998
2000
2002
2004
75 Office machines & automaticdata processing machines
76 Telecommunications & soundrecording and reproducingapparatus and equipment77 Electrical machinery,apparatus & appliances
84 Articles of apparel and clothingaccessories
89 Miscellaneous manufacturedarticles
65 Textile yarn,fabrics,made-uparticles, n.e.s., and relatedproducts
Figures 1 and 2 do not fully bring out the difference in the scale of exports between
India and China. It is possible to guess this difference by noting that as we move up the
horizontal gridlines, we climb only $2 billion in Figure 1 in contrast to $10 billion in
Figure 2 and that the gridlines are closer together on the latter graph. But the true
difference in the magnitudes becomes apparent only when we put the exports of the two
countries on the same graph. This is done for the top two exports of the two countries in
Figure 3. Clearly, India and China are in different leagues in so far as merchandise
exports are concerned.
12

Figure 3: Top two exports of each of India and China
0
10000
20000
30000
40000
50000
60000
70000
80000
90000
100000
1984
1986
1988
1990
1992
1994
1996
1998
2000
2002
2004
75 Office machines &automatic data processsingmachines (China)
76 Telecommunications &sound recording andreproducing apparatus andequipment (China)66 Non-metallic mineralmanufactures, n.e.s. (India)
65 Textile yarn,fabrics,made-uparticles, n.e.s. and relatedproducts (India)
A final dramatic point relating to the differences between the patterns of
merchandise exports of India and China is due to Martin (2006). Using the SITC six-
digit export data for the year 2004, he compiles the lists of top 25 exports of the two
countries. These 25 items account for 38.4 and 58.4 percent of the total merchandise
exports of China and India, respectively. Given the similarity of the factor endowments
of India and China, we would predict a large overlap between the top 25 export items of
the two countries. But it turns out that except for one common item, these lists are
entirely mutually exclusive. And the only common item is petroleum oils (excluding
crude) (SITC 271000) whose exports ands imports are not related to the factor
endowments as conventionally defined.
13

3.2 Service Exports
A key difference between the patterns of exports of India and China is that services
form a much larger proportion of the total exports of India than China. This has resulted
from both a slower growth of merchandise exports and faster growth of services exports
in India than China. In 2005-06, merchandise and services exports of India were $102.7
billion and $60.6 billion, which makes the latter 37 percent of total exports of goods and
services. In China, this ratio was 9.6 percent in 2003, the latest year for which the data
are available. In the same year, the share in India was 28.3 percent.
Figure 4 shows the evolution of the services exports of India since 1990-91. The
upper line shows the total services exports and the lower one the category labeled
“miscellaneous” in the Indian balance of payments statistics and consisting of software
exports as a major item beginning the mid 1990s. Two other major items included in the
services exports are travel and transportioan. A key feature of Figure 4 is the sharp
expansion of services exports in the last three years. From just $20 billion in 2002-03,
they have tripled to $60 billion in 2005-06.
Table 3 offers some details specific to software exports, which accounted for 39
percent of the total services exports in 2005-06. The growth rate of total software exports
has averaged 31 percent between 2001-02 and 2005-06. If we include the earlier years,
the growth rate is even higher. Likewise, the growth rate during the last three years has
averaged 35 percent. If the current growth rate is sustained for another five years, we
will see this sector match the performance of the top two or three merchandise products
of China. But there are some doubts as to whether this growth can be sustained. There
14

remain question regarding the ability of the Indian higher education system to continue to
Software exports are divided into information technology (IT) and
produce high quality graduates required to maintain the current momentum.
information
techn
3.3 Merchandise Imports
Before I turn to the direct foreign investment, let me briefly note just one important
difference between the patterns of merchandise imports of India and China. In 2004, the
ology enabled services (ITES). The latter are also referred to as the Business
Process Outsourcing (BPO). Between IT and ITES, IT exports currently account for the
bulk of the software exports. In the last four years, the share has been between 26 and 28
percent. It would seem that the scope of expansion in the ITES is greater than in the IT
but at least in the last four years, the two components have grown at approximately the
same pace.
Figure 4: Services Exports of India
0.0
10.0
20.0
30.0
40.0
50.0
60.0
70.0
1990
-91
1992
-93
1994
-95
1996
-97
1998
-99
2000
-01
2002
-03
2004
-05PR
Total ($Billion)Miscellaneous ($Billion)
15

latest year for which comparable data are available, China incurred 46 percent of its
impor
The phenomenal success of China in attracting direct foreign investment (DFI) is
well known. To some degree, this success has been one of the inspirations behind
g the DFI regime in India. But India has achieved only limited
succ
matching the Chinese performance would
mea
t expenditures on one-digit SITC category 7 entitled machinery and transport
equipment. The corresponding expenditure by India was only 19 percent. This
reinforces the point made earlier: for its needs, India is far more specialized in the capital
goods industries than China. The difference between India and China looks even more
impressive when we consider the absolute levels of their expenditures on the SITC 7
imports: $253 billion by China versus just $22 billion by India.
4 Foreign Investment
pro ressive opening up of
ess in attracting DFI. Instead, it has been more successful in attracting portfolio
investment, especially in the last three years.
Figure 5 shows the DFI for India and China and the total (DFI plus portfolio)
investment for India. Even if we trace the liberalization of the DFI regime in China to the
early 1980s and of India to the early 1990s,
n for India to achieve the DFI level China achieved in the mid 1990s. But this has
not happened since by mid 1990s, China was receiving in excess of $30 billion. In the
same vein, even if we assume that the Chinese numbers are artificially inflated on
account of round-tripping by as much as 20 percent, India remains far behind along this
dimension.
16

Figure 5: Foreign Investment ($Billion)
0.0
10.0
20.0
30.0
40.0
50.0
60.0
1990
-91
1991
-92
1992
-93
1993
-94
1994
-95
1995
-96
1996
-97
1997
-98
1998
-99
1999
-00
2000
-01
2001
-02
2002
-03
2003
-04
2004
-05
2005
-06P
China (DFI)India (Total Foreign Invesment)India (DFI)
Quite apart from the quantitative dimension, the DFI into China shows much
greater complementarity with exports and hence trade in general than that of India. This
is a point forcefully made by Prasad and Wei (2006) with reference to the inflows from
largest identifiable share has consistently gone to electronics
1998 to 2004 as follows:
“Table 2 shows that about two-thirds of these flows have been going into
manufacturing, with real estate accounting for about another 10 percent. Within
manufacturing, the
and communication equipment. The share of manufacturing has risen by almost
15 percentage points since 1998, largely at the expense of the shares of utilities,
construction, transport and telecommunication services, and real estate. Since the
industries with declining FDI shares are largely focused on non-traded goods, the
evolution of this pattern of FDI seems to be consistent with the notion that these
inflows have been stimulated by China’s increasing access (both actual and
17

anticipated) to world export markets following its accession to the World Trade
Organization (WTO) in 2001.”
Table 4 shows the composition of the FDI into India between August 1991 and
ber 2005. While there is some connection of the inflows to exports, the link is
than in China. At the top end
Decem
weaker of the table, most investments in the electrical
equipm
5 Trade and Foreign Investment Liberalization
Technically, trade liberalization in India and China began almost simultaneously in
the late 1970s. But the liberalization was faster and became systematic much earlier in
much earlier in the late 1970s to
the
be satisfied by the importer for each six-month period. As a rule consumer
goo
ent, transportation industry and telecommunications investments are aimed at the
domestic market. Textiles industry, which figures prominently on the export front, has
received only 1.32 percent of the DFI.
7
China than India. In foreign investment, China began
early 1980s compared with India’s beginning in the early 1990s. But in recent years,
India has nearly caught up with China on both trade policy in industrial goods and
services and foreign investment policy. India remains more protected than China only in
agriculture.
In the mid 1970s, all imports in India were subject to licensing with an import policy
issued every six months. That policy listed permitted imports, their quantities and the
conditions to
ds imports were not permitted. All essential consumer goods imports were
“canalized” through a designated governmental agency. Only the actual user could apply
7 The discussion in this section relies principally on Lardy (2002) and Panagariya (1993) for China and Panagariya (2004, 2006b) for India. An excellent additional source on India is Srinivasan and Tendulkar (2003).
18

for a license and had to demonstrate that the product sought was domestically unavailable.
Total imports depended on the quantum of foreign exchange available.
Beginning in 1976, India introduced an Open General Licensing (OGL) list, which
was gradually expanded, especially in the second half of the 1980s. A reduction in the
need for canalized imports such as food grains and petroleum, foreign b
orrowing and the
expa
pt
of s
a. In
agri
investment policy. Foreign investment regime now operates on the “negative list”
nsion on exports following the expansion of several export incentives and
depreciation of the rupee helped relax the foreign exchange constraint. Pursell (1992)
estimates that by 1987-88, almost 30 percent of the total imports came under the OGL.
More systematic liberalization in India began following the 1991 balance of
payments crisis. With minor exceptions, India did away with import licensing on capital
goods and intermediate inputs though it continued to ban consumer goods imports exce
ome specific ones that were permitted under a special license issued in limited
quantities to large exporters. This ban ended only on April 1, 2001 following a World
Trade Organization (WTO) ruling. In the meantime, India kept moving ahead with the
liberalization of tariffs and foreign investment. With respect to the latter, India began to
open its market to both direct and portfolio investment starting in the early 1990s.
Currently, with a handful of exceptions applying to the auto sector, the highest
industrial tariff in India is 12.5 percent. In 2005-06, custom duty as a proportion of the
total merchandise imports was 4.9 percent compared with 3 percent in Chin
culture, India remains more protected with its tariffs averaging 30 percent compared
with 15 percent in China.
India has also liberalized services imports as a part of the liberalization of the foreign
19

approach such that absent specific restrictions spelt out in the foreign direct investment
(FDI) policy and subject to the sectoral rules and regulations, up to 100 percent foreign
inve
f of their central
coun
se
stment is permitted under the automatic route. Exceptions include retail trading
where no foreign investment is allowed (except single brand product retailing where
foreign investment up to 51 percent is allowed) and insurance, defense and publishing of
newspapers and periodicals dealing with current affairs where foreign investment is
limited to 26 percent. Foreign Institutional Investors (FII) are allowed to invest relatively
freely in the Indian capital market with forward cover available on all investments.
In the mid 1970s, the so-called Foreign Trade Corporations (FTCs), controlled by the
Ministry of Foreign Trade (MFT) and organized along product lines such as iron and
steel and textiles and clothing, conducted all trade. Each FTC had branch offices in the
main provinces that produced export products or used imported inputs.
Liberalization in China took the form of decentralization of trade beginning in the
late 1970s. At the center, line ministries created their own FTCs. In the provinces and at
the local levels, branch offices of central FTCs were allowed to trade on their own in
addition to fulfilling their traditional role of carrying out trade on behal
terparts. Provinces also created their own FTCs for special needs. The government
also gave foreign-invested enterprises, whether wholly foreign owned or just joint
ventures (with 25 percent or more foreign capital), the right to conduct their own trade.
In 1984, China freed up the FTCs from their administrative departments and gave
them freedom to carry out the day-to-day operations related to trade. In 1988, the
government also began to confer trading rights on large enterprises. Provinces also got
the authority to confer these rights subject to certain conditions. The result of teh
20

refo
continued with the exchanger ate reaching
RM
utory tariff rose from
negl
rms was that from just 12 FTCs with monopoly rights on trade in 1978, the number
of FTCs rose to 800 in 1985 and to more than 5000 in 1988. The number of
manufacturing enterprises with trading rights also expanded though remained small in
relation to the total number of such firms.8
China added further export incentives through foreign exchange retention rights to
exporters and through depreciation of the domestic currency, renminbi (RMB). The
currency was devalued from RMB1.5 per dollar to RMB2.8 per dollar in 1984 and to
RMB3.7 per dollar in 1986. This trend
B8.3 per dollar in 1995. Taking all changes together, the Chinese currency
depreciated a little more than 80 percent between 1978 and 1995.9
Decentralize of trade was by China was accompanied by the introduction of import
licensing, canalization of certain imports and increased tariffs to retain partial control on
the imports. According to Lardy (2002, p. 39), at its peak in the late 1980s, the share of
all imports under licensing was 46 percent. The average stat
igible levels in the pre-reform era to 56 percent in 1982. There was a major overhaul
of the tariff regime in 1985, which brought the average tariff down to 43 percent. The
system remained intact, however, for the rest of the 1990s (Lardy 2002, Table 2-1).
In 1992, the share of imports subject to licensing fell to 18 percent. Towards the
end of the decade, this proportion fell to 8.45 percent with only 4 percent of the tariff
lines subject to licensing. In 2001, as a part of its WTO entry conditions, it agreed to
8 See Lardy (2002, Table 2-3, pp. 40-45). 9 See Lardy (2002, p. 49).
21

elimin
agreed to lower the average industrial tariff to 9 percent and average
agricu
India. In banking, China
agreed
nsurance companies. China
permits
ate all import quotas, licensing requirements and other non-tariff barriers by the
end of 2005.
The average tariff in China fell from 43 percent at the end of the 1980s to 40
percent in 1993, 23 percent in 1996 and 15 percent in 2001. As a part of its WTO entry
conditions, it
ltural tariff to 15 percent by 2005. China also agreed to bind all its tariffs with the
WTO. It further undertook to limit its agricultural subsidies to 8.5 percent of the value of
production. This is below the de minimis limit of 10 percent applicable to the developing
countries under the Uruguay Round Agreement on Agriculture.
China has undertaken the bulk of the liberalization in services as result of its
WTO entry conditions. Under these conditions, it has opened telecommunications and
the Internet services but on a limited basis, falling well short of
to lift all geographical limits and numerical limits on foreign banks providing
domestic currency services by January 2005. China’s central bank is now committed to
license all applicants that meet the prudential norms. Two years after their entry, foreign
banks can conduct domestic currency business with the Chinese firms and three years
after entry they can transact with individuals in the local currency. Five years after
accession, foreign banks will enjoy full national treatment.
In insurance, China now allows foreign companies to offer property and casualty
insurance on a nationwide basis. Within three years after the accession, China was to lift
all geographic restrictions on the operation of foreign i
foreign equity share up to 50 percent in life insurance and 51 percent in non-life-
insurance companies.
22

China also agreed to open its distribution sector to foreign suppliers. It was to
eliminate all geographical restrictions on retailing within three years of accession. It
permits majority equity in foreign companies engaged in retail trade. Joint ventures
engag
more muted in India than China. On the
surfac
t domestic policy
const
ed in the provision of wholesale services have been permitted since the accession.
Within five years of accession, China was to allow foreign companies to retail and
wholesale all products except salt and tobacco.
Comparing India and China, the trade and foreign investment regime India is less
open than China but not by much. This implies that the response of both trade and
foreign investment to opening up has been far
e, this difference is rooted in the much poorer performance of the organized, large-
scale manufacturing sector in India. The ability of a developing country to export
services on a large scale or of its services sector to absorb foreign investment or imports
is limited. Without a rapid growth in modern, formal-sector manufacturing, which can
absorb both foreign investment and imports in greater volumes than services, rapid
growth in either foreign trade or direct foreign investment is difficult.10
If one accepts this hypothesis, we are confronted with the question why the
organized sector, large-scale manufacturing has done poorly in India. This is a question I
have discussed in great detail in Panagariya (2006a). I argue tha
raints, most notably very stringent labor markets and infrastructure bottlenecks, are
behind this phenomenon. The former factor has been particularly responsible for pushing
firms into either capital-intensive or skilled-labor-intensive sectors and away from
unskilled-labor-intensive sectors.
10 I had originally advanced this hypothesis in Panagariya (2002) and elaborated upon it in Panagariya (2004). Subsequently, Joshi (2004) and Kochhar et al. (2006) have embraced it.
23

6 Looking Ahead
Looking ahead, three policy issues deserve careful consideration: trade policies at the
national level; preferential trade area (PTA) agreements; and multilateral trade
onsider each of them in turn.
6.1
ould be brought further
12.5 percent to the 7-8 percent range in the next year.
India is not vulnerable to a balance of payments crisis and has a flexible exchange rate in
place. As such, further tariff reductions complemented by exchange rate adjustment are
entirely politically feasible and desirable.
India must also tackle the problem of high tariffs in some specific sectors, most
notably automobiles, which are subject to custom duties nearing 100 percent. Even more
important is to bring down the prohibitive duties on used cars. Used small cars, available
at relatively low prices from Japan, offer a cost effective substitutes for the old, polluting
cars currently on the road and for two wheelers that are clearly risky for the
transportation of a family of four. High duties on both new and old cars serve the
singular purpose of protecting the domestic car and two wheeler industries at the expense
of the consumer.
negotiations at the Doha Round. I c
National Trade Policies
On industrial products, India has made good progress but it must continue on the
current path of progressive tariff reductions. The top tariff rate sh
down from its current level of
24

Figure 6: Anti-dumping Initiations
0
50
100
150
200
250
300
350
400
450
India United States EuropeanCommunity
Argentina South Africa Australia Canada China, P.R. Brazil Turkey
Time is also ripe for at least a beginning on agricultural liberalization. It is a pity that
liberalization in this sector has now become hostage to the Doha negotiations since any
unilateral move in this area is seen to have an adverse effect on the bargaining power.
But additionally, the leadership in India has also taken the wrongheaded view that any
agricultural liberalization in this sector by India will hurt the farmers, especially the
marginal and landless ones. I will return to this issue below as a part of the discussion of
the multilateral negotiations.
Finally, both India and China have taken to using the anti-dumping measures in a
big way. India began earlier and quickly became their top user in the world. In the
recent years, it has shown some restraint but is still among the heavy users. The number
of cases initiated by China rose rapidly at the end of the 1990s and the beginning of the
2000s but have hovered around 25 in the last three years. Figures 6 depicts the total
25

number of cases initiated by the major anti-dumping players and Figure 7 offers the
Evidence provided by Aggarwal (2002) points to stron
evolution of the initiations in the three largest players and China.
g protectionist motive
behind
Figure 7: Annual Anti-dumping Initiations: Top Three and China
0
10
20
30
40
50
60
70
80
90
1995 1996 1997 1998 1999 2000 2001 2002 2003 2004 2005
IndiaUnited StatesEuropean CommunityChina, P.R.
many of the anti-dumping cases initiated by India. She analyzes the anti-dumping
cases initiated by India between 1993 and 2001. She finds that in 76 of these cases,
imports accounted for less than 25 percent of the total demand. Within these cases, 33
were those with less than 5 percent import share and another 24 with less than 10 percent
import share. In principle, we cannot rule out the possibility of injury to the domestic
industry by imports even when the initial import share is low since the injury depends on
the expansion at the margin rather than the existing share. Nevertheless, the likelihood
that this would happen is low since even a large proportionate expansion over a small
base is going to be small in absolute terms.
26

6.2 Preferential Trade Area (PTA) Arrangements
In the 1990s, while the rest of the world including the United States and the EU
aggressively pursued the PTAs, the countries in Asia stayed largely away from these
arrangements. This has now changed: recognizing that the trade blocs in North America
and Europe have resulted in their exclusion from these markets on the margin, the
countries in Asia are now catching up, forming PTAs of their own.
Table 5 lists three categories of PTAs currently on the Indian plate: those it has
already concluded and is implementing; those under negotiation; and those under
discussion. India has three FTA agreements in place: those with Sri Lanka, Thailand and
Singapore. The last of these extends to services and cooperation in other areas including
investment. India also has in place agreements for partial exchange of trade preferences
on a limited set of commodities with Chile, Mauritius and member countries of the South
Asian Association for Regional Cooperation (SAARC). A framework agreement for the
negotiation of a comprehensive economic cooperation agreement with the Association of
Southeast Asian Nations (ASEAN) exists but the actual agreement is still under
negotiation. A South Asian Free Trade Agreement (SAFTA) has been signed though the
list of sectoral exceptions and the rules of origin remain to be negotiated. An agreement
for partial trade preferences with the Mercosur (Argentina, Brazil, Uruguay and
Paraguay) has also been singed though not implemented. Finally, agreements under
consideration include those with China, South African Customs Union SACU), Malaysia,
South Korea and Japan.
Like India, China has also been pursuing PTAs with a number of countries. It has
signed agreements with two countries to exchange partial preferences: Thailand and
27

Pakistan. It has a framework agreement to negotiate an FTA with the ASEAN. Among
the countries with which China is negotiating or contemplating negotiations for
preferential trade arrangements are India, Pakistan, Japan, Singapore, South Korea, EU,
Iceland, Gulf Cooperation Council, South African Customs Union, Australia and New
Zealand.
There is now widespread skepticism towards the wisdom of PTAs as vehicles of
trade liberalization. There are few trade economists who are not critical of them. The
view among many enthusiasts in the early 1990s that these arrangements were a
complement to multilateral liberalization has now given way to the realization that they
have now fragmented the trading system through the creation of the “spaghetti bowl” of
tariffs and are a nuisance with which one must live.
In this context, the PTAs being concluded by India and China are doubly
problematic. India’s agreements with Chile, Mauritius and member countries of South
Asian Association for Regional Cooperation (SAARC) are explicitly limited to the
exchange of partial preferences on a handful of commodities. The agreement signed with
Mercosur but not yet implemented falls into the same category (see Table 5). But even
the agreements formally termed as FTA agreements have long lists of sectoral exclusions
and very strict rules of origin. These exceptions and rules of origin are designed to keep
out products that are likely to threaten inefficient domestic producers and to give
preferential entry when they are likely to displace more efficient outside suppliers.
28

For example, consider the India-Sri Lanka FTA, which came into force in March
2000.11 This agreement makes generous use of sectoral exceptions. For example, the top
20 exports of Sri Lanka to the world at the 6-digit HS (Harmonized System) level
accounted for 46 percent of its total exports in 1999. India subjects as many as 15 of
these products to either a tariff rate quota (meaning the tariff preference was applies only
up to a pre-specified quantity of imports) or negative-list exception. Thus, the
exclusionary policies apply with potency to products in which Sri Lanka showed the
greatest comparative advantage.
The rules of origin further restricted the exports of Sri Lanka. For example, apparel
exports from Sri Lanka are not only subject to the tariff rate quota of 8 million pieces but
at least 6 million of these pieces should be manufactured from fabrics of Indian origin
exported to Sri Lanka from India. Likewise, exports of tea from Sri Lanka at the
preferential tariff are not to exceed 12.5 million kilograms within a calendar year. Both
products are also subject to a uniquely South Asian restriction we may call the rule of
destination: the preference applies only if the products enter through specific Indian ports.
Similar observations apply to preferences given by Sri Lanka to India. Weerakoon
(2001) points out that at the time the lists of concessions were finalized, of the 319 items
on which Sri Lanka offered zero duty to India, the latter exported only three to the former.
Looked another way, of the 2,907 products exported by India to Sri Lanka, only 21
percent received any tariff preference at all. Conversely, of the 1,351 items in the zero-
tariff list of India, Sri Lanka exported only 68 items to the former. Of the 380 items
exported by Sri Lanka to India, 50 were on the Indian negative list, 44 received a 25
11 I base the following discussion of the India-Sri Lank agreement on Baysan, Panagariya, and Pitigala (2006).
29

percent tariff preference, 218 received a 90 percent preference (expanded to 100 percent
as of March 1, 2003) and 68 received a 100 percent preference.
The India-Singapore FTA likewise contains very stringent rules of origin. It
requires that at least 40 percent of the value added be from within union and that the
four-digit SITC classification of the product be different from that of every intermediate
input imported from outside the union to produce it. In many cases, the application of
both of these criteria would likely result in a 100 percent within-union value added for
the grant of the preference. On top of this stringency of the rules of origin, India placed
5,099 tariff lines out of the total 11,650 tariff lines at the 8-digit HS level (i.e., 44 per cent
of the total tariff lines) on the negative list. Such a large exclusion hardly meets the
condition of liberalization in substantially all products stipulated in Article XXIV of the
General Agreement on Tariffs and Trade (GATT) even though, ironically, the agreement
has been informed to the WTO under Article XXIV.
The agreements signed to-date by China have a similar flavor. For example, its
agreement with Thailand is limited to the elimination of duties on 188 fruits and
vegetables. Likewise, its agreement with Pakistan involves an exchange of preferences
whereby Pakistani mangos and oranges enter duty free into China in return for zero duty
on the Chinese textile machinery and organic chemicals entering Pakistan. From the
available accounts, the agreement with Chile is also partial: China will lift tariffs on
2,834 products imported from Chile in return for duty free status by Chile to 5,891 items
from China. But China will maintain tariffs on 7,391 products imported from Chile and
Chile on 7,750 items imported from China. China has a framework agreement for
30

negotiating FTA with the ASEAN but to-date the negotiations have not made any
significant progress.
This accounts raises serious questions about the wisdom of the PTAs being sought
by India and China. Even when a clean approach is take as in the case of the North
American Free Trade Agreement (NAFTA), which is a full-fledged FTA, such
arrangements are problematic, as is now widely accepted. The partial-PTA approach
India and China have taken is even worse. When countries pick and choose the products
subject to trade preferences, trade diversion dominates. This is because domestic
producer lobbies ensure preferences are applied to imports that would displace imports
from third countries.
I do not endorse the pursuit of PTAs by the countries but if they must do it, the
best starting point is a genuine Article XXIV compatible FTA between them. Allowing
for the fact that full implementation of such an agreement would take minimally 10 years
and the fact that the two countries together have a good chance of growing at 10 percent
per year in constant dollars, by the time the FTA is a reality, the combined market would
be close to $8 trillion in 2005 dollars. Given both countries have considerably liberalized
the external tariffs, the damage from trade diversion will be limited. In addition, the
prospects that other countries in the region would join and, thus, help create an Asia-wide
bloc are excellent. In that event, the region may also acquire a strategic advantage in
getting the North American and European markets that currently discriminate against it
opened up.12
12 I elaborate on the India-China FTA in Panagariya (2005).
31

6.3 The Doha Round
Negotiations for the Doha Round are currently suspended. With the Democrats
having taken both the House and the Senate in the United States, the mood on the trade
front is gloomy. All indications at the moment are that the new Congress is unlikely to
renew the Trade Promotion Authority (TPA) of President Bush. If this prediction turns
true, the Doha negotiations will go in hibernation for some years until the atmosphere
changes.
But this scenario is gloomier than reality warrants. If the rest of the world
continues to run after the PTAs at its current speed, it is unlikely that the United States
will withdraw from the race. Under such circumstances, even the Democratic Congress
will be compelled to rethink its opposition to the TPA. Moreover, once the dust settles
and Democrats begin to govern, they too will have to take into consideration the long-
term interest of the United States in opening the world markets.
From the viewpoint of this paper, the important question is what strategy India (and
China) should follow in case the United States and the EU are able to muster the political
courage to move the negotiations forward. At present, India’s position is that it is willing
to undertake liberalization as per July 2004 Framework Agreement in industrial products
and services. But it has taken a much harder line on agriculture. I think this aspect of
India’s position needs rethinking. Two points must be considered.
First, despite the presence of large subsidies in developed countries and large
inefficiencies in the domestic agriculture, India enjoys a greater share in the world
agricultural exports than in non-agricultural exports. Indian agriculture is not
32

uncompetitive. If India introduces domestic agricultural reforms as it opens externally, it
stands to expand its share in the world agricultural market rather than lose it.
Second, India’s own experience in the past two decades contradicts the argument
often made by the policy makers that opening up would injure Indian agriculture and
undermine the livelihood of marginal and landless farmers. In the last fifteen years, India
has gone from strict licensing and an extremely high tariff wall to total elimination of
licensing and a maximum tariff of 12.5 percent in industrial goods. At the time the
liberalization was initiated, many had expressed the same fears with respect to industry.
Yet, the Indian industry is far more competitive and efficient today than prior to the
liberalization. We should expect similar results in agriculture. Indeed, the experience of
Chile, which has greatly expanded its agricultural exports while liberalizing that sector,
reinforces this argument. The opening up will allow efficient agricultural sectors to
expand and create high-wage employment opportunities for landless workers. The
current employment in agriculture is often based on employment on farms that are
themselves barely profitable and therefore unable to pay high wages. Moreover, the
pressure to become competitive in a more open economy will also speed up agricultural
reforms in other areas that are long overdue. For example, the absence of land titles has
been in the way of the consolidation of smallholdings as well the creation of larger farms
that would be able to offer better wages to farm workers.
The implication of these arguments is that India needs to consider extending its
national trade liberalization program to agriculture as well as taking a more flexible
position in this sector in the Doha talks. The latter is an especially attractive option since
liberalization in the multilateral context will also bring the barriers currently prevailing in
33

the rich countries down. Through liberalization and internal reforms, India can position
itself to capture a substantial share of the expanded world markets that would emerge out
of a Doha agreement.
7 Summary
In this paper, I begin by arguing that the recent rise in India’s growth rate represents
a shift in the trend growth rate rather than just a business cycle effect. If this reading is
correct, India is one step closer to bridging the gap with China. Nevertheless, roadblocks
remain.
To substantiate this latter argument, I briefly review the process and extent of
liberalization of trade and foreign investment by India and China and its impact on the
respective economies. My discussion leads me to conclude that though technically India
initiated the process of liberalization around the same time as China, it was much slower
to move. As a result, by the end of the 1980s, China was far more open than India. But
since then, India has bridged much of the gap in industrial products and services—though
China still keeps a small lead—except in agriculture.
Both India and China have been handsomely rewarded for their liberalization
through increased integration into the world economy and higher growth rates. Yet, the
response of trade and foreign investment in India has been far more muted than in China.
Given the similarity of factor endowments between India and China, this seems puzzling
on the surface. But the answer lies in the labor-market inflexibilities and considerably
poorer infrastructure in India. Unless future reforms tackle these crucial areas, unskilled-
labor-intensive products such as apparel, toys, footwear and sports goods will continue to
perform poorly in India.
34

In the final substantive section of the paper, I consider future trade policy challenges
facing India. Here I offer four main suggestions. First, India must continue to liberalize
industrial tariffs and eliminate the tariff peaks applying with potency to automobile
imports—both new and used. Second, India must restrain the use of anti-dumping. From
its total absence, India has emerged as by far the largest user of this highly self-
destructive weapon in the last ten years. Third, in so far as PTAs are concerned, it will be
best not to pursue them. But if it must do so for their political appeal, the current
approach of exchanging preferences on a small number of countries with small countries
is virtually the worst way to go about promoting these arrangements. Instead, India
should go after China, a large and highly competitive country, and forge a genuine free
trade area with it. Together, India and China not only contain almost one third of the
world population but will also represent a $8 trillion market in ten years time, which is
two thirds of the current U.S. GDP. An India-China FTA will also open the door to an
Asia wide FTA.
35

References
Acharya, Shankar, 2004, “India’s Growth Prospects Revisited,” Economic and Political
Weekly, October 8.
Baysan, Tercan, Arvind Panagariya, and Nihal Pitigala, 2006, "Preferential Trading in
South Asia," WPS 3813, Washington DC: World Bank.
Joshi, Vijay, 2004, “Myth of India’s Outsouricng Boom,” Financial Times, November 16.
Kelkar, Vijay, 2004, “India on the Growth Turnpike,” K.R. Narayanan Oration,
Australian National University, 27th April.
Kochhar, Kalpana, Raghuram Rajan, Arvind Subramanian and Ioannis Tokatlidis, 2006,
“India’s Pattern of Development: What Happened, What Follows,” NBER
Working Paper No. 12023.
Lardy, Nicholas, 2002, Integrating China into the Global Economy, Washington, D.C.:
Brookings Institution Press.
Panagariya, Arvind, 1993, "Unraveling the Mysteries of China's Foreign Trade Regime,”
World Economy 16, 51-68.
Panagariya, Arvind, 2002, “Why India Lags behind China,” Economic Times, May 22.
Panagariya, Arvind, 2004, “India’s Trade Reform,” India Policy Forum 1, 1-57.
Panagariya, Arvind, 2005, “An India-China Free Trade Area?” April 20.
Panagariya, Arvind, 2006a, “Transforming India,” presented at the conference “India: An
Emerging Giant” held at Columbia University, October 13-15, 2006.
Panagariya, Arvind, 2006b, “India and China: Trade and Foreign Investment,” presented
at the “Pan Asia 2006” Conference, Stanford Center for International
Development, June 1-3, 2006.
36

Prasad, Eswar and Shang-Jin Wei, 2006, “Understanding the Structure of Cross-border
Capital Flows: The Case of China,” presented at the conference, “China at
Crossroads: FX and Capital Markets Policies for the Coming Decade,” held at the
Columbia University on February 2-3, 2006.
Srinivasan, T.N., 2006, “China, India and the World Economy,” mimeo., Yale University,
Department of Economics.
Srinivasan, T.N. and S. Tendulkar, 2003, Reintegrating India with the World Economy,
Washington DC: Institute for International Economics.
Weerakoon, Dushni. 2001. “Indio-Sri Lanka Free Trade Agreement: How Free is It?” Economic
and Political Weekly, February 24, 627-29.
37

Table 1: SITC two-digit products with export shares exceeding 2 percent during 2001-04
SITC
Code 1984-90 1991-00 2001-04
India
66 Non-metallic mineral manufactures, n.e.s. 16.4 15.9 14.9
65 Textile yarn, fabrics, made-up articles, n.e.s 12.0 14.0 10.6
84 Articles of apparel and clothing accessories 11.9 13.6 10.4
33 Petroleum, petroleum products and related materials 4.7 1.7 6.3
89 Miscellaneous manufactured articles 2.0 3.7 5.2
67 Iron and steel 1.1 3.1 5.0
43 Animal or vegetable fats and oils, processed 0.0 0.1 3.6
53 Dyeing, tanning and coloring material 1.1 1.3 3.1
28 Metalliferous ores and metal scrap 4.8 1.9 3.0
69 Manufactures of metal, n.e.s. 1.7 2.2 2.7
04 Cereals and cereal preparations 1.9 2.8 2.7
78 Road vehicles (incl. air cushion vehicles) 1.6 2.3 2.4
03 Fish, crustaceans, mollusks and aquatic
invertebrates, and preparations thereof 3.2 3.3 2.2
77 Electrical machinery, apparatus & appliances 1.5 1.5 2.1
China
75 Office machines & automatic data-processing
machines 0.4 4.8 12.9
84 Articles of apparel and clothing accessories 14.3 16.8 11.8
76 Telecommunications & sound recording and
reproducing apparatus and equipment 2.9 6.1 10.4
77 Electrical machinery, apparatus & appliances 1.2 7.2 10.1
89 Miscellaneous manufactured articles 4.9 9.3 7.3
38

65 Textile yarn, fabrics, made-up articles, n.e.s. 13.8 8.1 6.1
69 Manufactures of metal, n.e.s. 2.0 3.1 3.4
85 Footwear 2.0 4.4 2.9
74 General industrial machinery & equipment 0.6 1.4 2.7
78 Road vehicles (incl. air cushion vehicles) 4.0 2.1 2.6
82 Furniture and parts thereof; bedding, mattresses,
mattress supports, cushions and similar stuffed
furnishings 0.5 1.4 2.1
Source: UN Commodity Trade Statistics
39

Table 2: Composition of Exports of India: 2003-04 to 2005-06
Item 2003-04 2004-05 2005-06P
I. Primary products 15.5 16.2 16.0
A. Agriculture and products 11.8 10.1 9.9
B. Ores and minerals 3.7 6.1 6.0
II. Manufactured goods 76.0 72.7 69.9
A. Leather and manufactures 3.4 2.9 2.6
B. Chemicals and related products 14.8 14.9 14.1
C. Engineering goods 19.4 20.8 21.0
1. Iron & steel 3.9 4.7 3.4
2. Manufacture of metals 3.8 4.1 4.1
3. Machinery and instruments 4.3 4.5 4.7
4. Transport equipment 3.1 3.4 4.4
5. Electronic goods 2.7 2.2 2.1
6. Others 1.6 2.0 2.3
D. Textile and textile products 20.0 16.2 15.6
1. Cotton yarn, fabrics, made-ups, etc. 5.3 4.1 3.8
2. Natural silk yarn, fabrics, made-ups, etc. 0.6 0.5 0.4
3. Manmade yarn, fabrics, made-ups, etc. 2.8 2.3 1.9
4. Manmade staple fiber 0.1 0.1 0.1
5. Woolen yarn, fabrics, made-ups, etc. 0.1 0.1 0.1
6. Readymade garments 9.8 7.9 8.2
7. Jute & jute manufactures 0.4 0.3 0.3
8. Coir & coir manufactures 0.1 0.1 0.1
9. Carpets 0.9 0.8 0.8
E. Gems and jewelry 16.6 16.5 15.1
F. Handicrafts (excluding handmade carpets) 0.8 0.5 0.4
G. Other manufactured goods 1.0 1.0 1.1
III. Petroleum products 5.6 8.4 11.2
IV. Others 2.9 2.7 2.9
Total exports 100 100 100
Source: Directorate General of Commercial Intelligence and Statistics
40

Table 3: Software Exports of India
Year IT Services ITES-BPO Total Software
1 2 3 4 (=2+3)
1995-96 0.8 0.8
1996-97 1.1 1.1
1997-98 1.8 1.8
1998-99 2.6 2.6
1999-00 3.4 0.6 4.0
2000-01 5.3 0.9 6.2
2001-02 6.2 1.5 7.6
2002-03 7.0 2.5 9.5
2003-04 9.2 3.6 12.8
2004-05 13.1 4.6 17.7
2005-06 17.3 6.3 23.6
Source: RBI Annual Reports (2004, Table 6.5 and 2006, Table 1.71)
41

Table 4: Sectoral composition of FDI Flows into India: August 1991 to December 2005
Rank Sector $Million Percent of total
1 Electrical Equipments (including computer software) 4885.9 16.0
2 Transportation Industry 3143.1 10.3
3 Services Sector 2971.7 9.8
4 Telecommunications 2890.1 9.5
5 Fuels (Power & Oil Refinery) 2521.5 8.3
6 Chemicals (Other than Fertilizers) 1889.5 6.2
7 Food Processing Industries 1173.2 3.9
8 Drugs and Pharmaceuticals 948.5 3.1
9 Cement and Gypsum Products 746.8 2.5
10 Metallurgical Industries 627.3 2.1
11 Consultancy Services 444.5 1.5
12 Miscellaneous Mechanical & Engineering 491.5 1.6
13 Textiles (Including Dyed, Printed) 430.1 1.4
14 Trading 374.2 1.2
15 Paper and Pulp including paper product 363.5 1.2
16 Hotel & Tourism 308.5 1.0
17 Glass 255.6 0.8
18 Rubber Goods 233.3 0.8
19 Commercial, Office & Household Equipment 231.7 0.8
20 Industrial Machinery 204.8 0.7
21 Machine Tools 155.4 0.5
22 Other* 5162.0 17.0
23 Total 30452.6 100.0
*Each individual sector aggregated into this category accounts for less than 0.5 percent of the total DFI. Source: Foreign Direct Investment Policy, Ministry of Commerce and Industry, Government of India, April 2006.
42
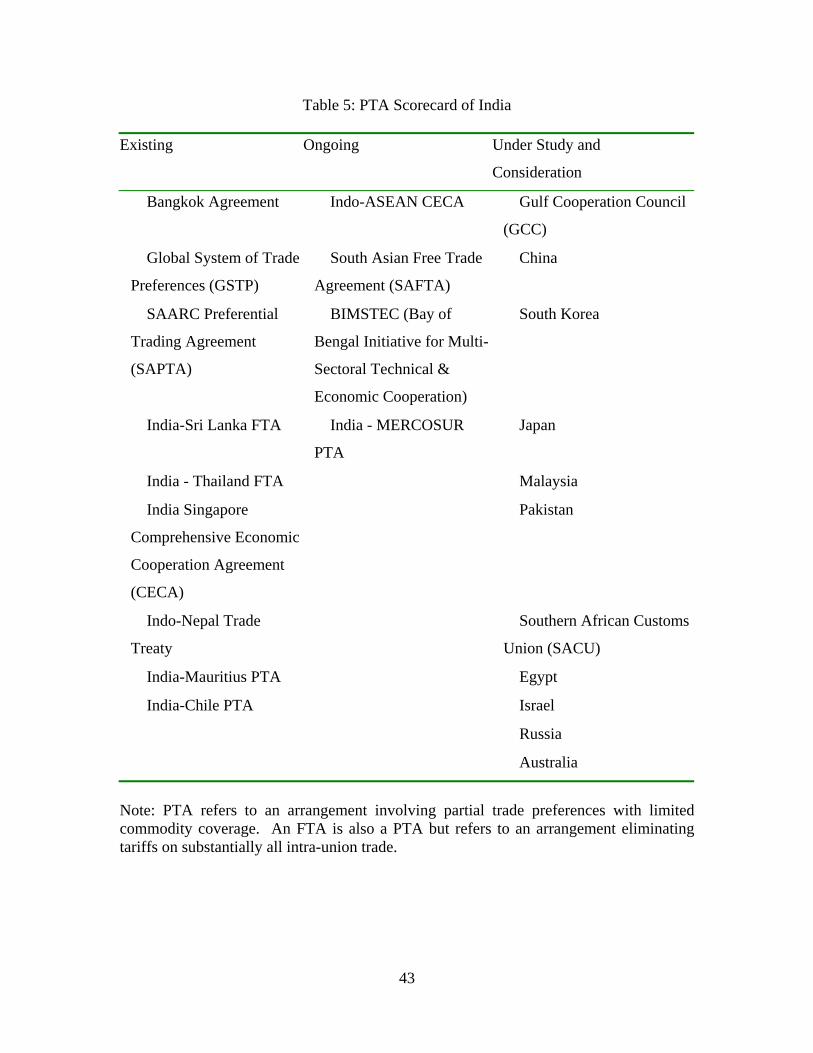
Table 5: PTA Scorecard of India Existing Ongoing Under Study and
Consideration
Bangkok Agreement Indo-ASEAN CECA Gulf Cooperation Council
(GCC)
Global System of Trade
Preferences (GSTP)
South Asian Free Trade
Agreement (SAFTA)
China
SAARC Preferential
Trading Agreement
(SAPTA)
BIMSTEC (Bay of
Bengal Initiative for Multi-
Sectoral Technical &
Economic Cooperation)
South Korea
India-Sri Lanka FTA India - MERCOSUR
PTA
Japan
India - Thailand FTA Malaysia
India Singapore
Comprehensive Economic
Cooperation Agreement
(CECA)
Pakistan
Indo-Nepal Trade
Treaty
Southern African Customs
Union (SACU)
India-Mauritius PTA Egypt
India-Chile PTA Israel
Russia
Australia
Note: PTA refers to an arrangement involving partial trade preferences with limited commodity coverage. An FTA is also a PTA but refers to an arrangement eliminating tariffs on substantially all intra-union trade.
43