india infrastructure report.pdf
TRANSCRIPT

Q1 2012www.businessmonitor.com
infrastructure report
issn 1752-5403published by Business Monitor international Ltd.
inDia INCLUDES BMI'S FORECASTS

Business Monitor International Senator House 85 Queen Victoria Street London EC4V 4AB United Kingdom Tel: +44 (0) 20 7248 0468 Fax: +44 (0) 20 7248 0467 Email: [email protected] Web: http://www.businessmonitor.com
© 2011 Business Monitor International. All rights reserved. All information contained in this publication is copyrighted in the name of Business Monitor International, and as such no part of this publication may be reproduced, repackaged, redistributed, resold in whole or in any part, or used in any form or by any means graphic, electronic or mechanical, including photocopying, recording, taping, or by information storage or retrieval, or by any other means, without the express written consent of the publisher.
DISCLAIMER All information contained in this publication has been researched and compiled from sources believed to be accurate and reliable at the time of publishing. However, in view of the natural scope for human and/or mechanical error, either at source or during production, Business Monitor International accepts no liability whatsoever for any loss or damage resulting from errors, inaccuracies or omissions affecting any part of the publication. All information is provided without warranty, and Business Monitor International makes no representation of warranty of any kind as to the accuracy or completeness of any information hereto contained.
INDIA INFRASTRUCTURE REPORT Q1 2012 INCLUDING 5-YEAR INDUSTRY FORECASTS BY BMI
Part of BMI's Industry Report & Forecasts Series
Published by: Business Monitor International
Copy deadline: November 2011

India Infrastructure Report Q1 2012
© Business Monitor International Ltd Page 2

India Infrastructure Report Q1 2012
© Business Monitor International Ltd Page 3
CONTENTS
Executive Summary ......................................................................................................................................... 5
SWOT Analysis ................................................................................................................................................. 6 India Infrastructure Industry SWOT ...................................................................................................................................................................... 6
Market Overview ............................................................................................................................................... 7 India............................................................................................................................................................................................................................ 7
Building Materials .......................................................................................................................................... 14 Global ....................................................................................................................................................................................................................... 14
Industry Trend Analysis - Building Materials: China To Remain Demand Driver; Developed Markets Offer Little Support .............................. 14 Asia ...................................................................................................................................................................................................................... 20 Industry Trend Analysis - Building Materials: China Still Leading The Charge As Competition Heats Up ........................................................ 20
Industry Forecast Scenario ........................................................................................................................... 26 Table: India Construction And Infrastructure Industry Data ............................................................................................................................... 26 Table: India Construction And Infrastructure Industry Data ............................................................................................................................... 28
Construction and Infrastructure Forecast Scenario .................................................................................................................................................. 30
Transport Infrastructure ................................................................................................................................ 35 Table: India Transport Infrastructure Industry Data ........................................................................................................................................... 35 Table: India Transport Infrastructure Industry Data ........................................................................................................................................... 38 Transport Infrastructure – Forecast Scenario ..................................................................................................................................................... 41 Transport Infrastructure Overview ...................................................................................................................................................................... 43 Table: Competitiveness Of India's Infrastructure ................................................................................................................................................ 43 Major Projects Table – Transport ....................................................................................................................................................................... 55 Table: Major Projects - Transport ....................................................................................................................................................................... 55
Energy and Utilities Infrastructure ............................................................................................................... 72 Table: India Energy and Utilities Infrastructure Industry Data ........................................................................................................................... 72 Table: India Energy and Utilities Infrastructure Industry Data ........................................................................................................................... 74 Energy and Utilities Infrastructure Forecast Scenario ........................................................................................................................................ 78
India Electricity Generation Capacity Mix, 2011e .................................................................................................................................................. 79 Energy and Utilities Infrastructure Overview ...................................................................................................................................................... 79 Major Projects Table – Energy And Utilities ....................................................................................................................................................... 94 Table: Major Projects – Energy And Utilities...................................................................................................................................................... 94 Residential/Non-Residential Construction and Social Infrastructure .................................................................................................................114 Table: India Residential and Non-residential Building Industry Data ................................................................................................................114 Table: India Residential and Non-residential Building Industry Data ................................................................................................................114 Residential/Non-Residential Construction Forecast Scenario ............................................................................................................................116
Residential/Non-Residential Construction and Social Infrastructure Overview.......................................................................................................118 Table: World Bank ‘Doing Business’ Report: Global Rankings 2010 ................................................................................................................122 Major Projects Table – Residential/Non-Residential Construction and Social Infrastructure ............................................................................124 Table: Major Projects – Construction And Social infrastructure .......................................................................................................................124
Business Environment ................................................................................................................................ 128 India Business Environment................................................................................................................................................................................128 Rewards ..............................................................................................................................................................................................................128 Risks ...................................................................................................................................................................................................................128
Regional Overview ...................................................................................................................................................................................................130 Asia Pacific Infrastructure Business Environment Ratings ......................................................................................................................................130

India Infrastructure Report Q1 2012
© Business Monitor International Ltd Page 4
Table: Regional Infrastructure Business Environment Ratings...........................................................................................................................136
Company Monitor ......................................................................................................................................... 137 Gammon India Ltd. .............................................................................................................................................................................................137 Reliance Infrastructure .......................................................................................................................................................................................139 Larsen & Toubro ................................................................................................................................................................................................142
Global Overview ........................................................................................................................................... 145
Methodology ................................................................................................................................................. 152 Industry Forecasts ...................................................................................................................................................................................................152
Construction Industry .........................................................................................................................................................................................153 Data Methodology ..............................................................................................................................................................................................153 New Infrastructure Data Sub-sectors ..................................................................................................................................................................153 Construction .......................................................................................................................................................................................................154 Capital Investment ..............................................................................................................................................................................................155 Construction Sector Employment ........................................................................................................................................................................156
Infrastructure Business Environment Rating ...........................................................................................................................................................157 Table: Infrastructure Business Environment Indicators .....................................................................................................................................158

India Infrastructure Report Q1 2012
© Business Monitor International Ltd Page 5
Executive Summary
BMI View: Construction activity for the first quarter of FY2011/12 (April-June) was weak, with inflation
and interest rates in India remaining at elevated levels. As such, we continue to hold fast our view of a
prolonged soft patch for the Indian construction sector in FY2011/12, with real growth forecast to reach
4.0% during the fiscal year. Looking further ahead, however, the sector's fortunes are likely to pick up in
FY2012/13, as the government is gearing up for the 12th Five-Year Plan, releasing new infrastructure
projects and addressing concerns about access to long-term financing and land acquisition.
Key drivers affecting growth include:
In October 2011, it launched an INR166bn (US$3.35bn) highways building plan under the
National Highways Development Programme, reports News Resources International. The
plan covers the construction of six-lane highways totalling 6,500km, four-lane highways
totalling 24,700km and the expansion of other highways. The programme is to be funded
through public-private partnerships (PPPs). Under the plan, four expressway construction
projects have already been given the go-ahead, while the country's PPP appraisal committee
has approved 10 roadwork projects, worth a total of US$1.1bn.
In July 2011, GMR won the contract to construct the 555.5km Ahmedabad-Udaipur-
Kishangarh expressway-widening project - the single largest highway project in the country,
both in terms of value and length. It is the first of nine similar highway projects.
In September 2011, three state-run financial institutions - the Indian Infrastructure Finance
Company Limited (IIFCL), Life Insurance Corporation of India (LIC) and India
Development Finance Corporation (IDFC) - signed a memorandum of understanding to
boost the application of takeout financing in India. The MOU would allow the three
companies to take out up to 50% of an infrastructure project's debt, potentially unlocking
about INR300bn (US$6.2bn) in bank debts, which could be used to finance other projects
and speed up the pace of India’s infrastructure development. This enhancement in takeout
financing is critical, as it could mitigate the lack of size and sophistication in India's financial
markets by boosting the liquidity and risk transfer opportunities for Indian banks.
We are forecasting Indian construction industry real growth to reach 6.0% in FY2012/13 and 7.5% in
FY2013/14. These relatively high growth figures indicate that there are still significant opportunities for
greenfield projects in India and is reflected in BMI's key projects database, which shows that there are
more than US$400bn in projects either under construction or in the pipeline in the country's infrastructure
sector.

India Infrastructure Report Q1 2012
© Business Monitor International Ltd Page 6
SWOT Analysis
India Infrastructure Industry SWOT
Strengths Proliferating domestic and offshore infrastructure funds target the Indian infrastructure market, driven by strong demand from the transport, power, urban infrastructure and irrigation segments.
India’s government is keen to facilitate private sector participation in infrastructure. Growing private sector investment in infrastructure – 38 infrastructure PE funds are
currently looking at assets in India, with nine more to be launched in 2011, as cited by Livemint.
Application of takeout financing boosted in India, potentially unlocking around INR300bn (US$6.2bn) in bank debts, which could be used to finance infrastructure developments in India.
Weaknesses Lack of a structured regulatory and policy framework, or well-defined operating and financing regulations – PPP framework and regulations are inconsistent and lack transparency.
The country is overly bureaucratic – this delays the absorption of funds and deters investors.
Project delays, caused by issues with land clearance, and a nebulous bureaucratic system, continue to be a significant problem, with roughly half of planned projects running behind schedule in FY2009/10.
There are low levels of domestic expertise, stemming from a shortage of skilled project managers and engineers.
There is low mechanisation and limited use of modern technological equipment. Downgrades to investment targets under the 11th Five-Year Plan, especially in
transport infrastructure, which has been revised down by 20% in value terms. Limited long-term borrowing capability on the domestic banking sector – immature
bond market.
Opportunities Opportunities for greenfield projects across all infrastructure sub-sectors. There is the opportunity for the domestic industry to become more organised, with the
creation of more large firms through organic growth and acquisitions. This would improve overall construction quality.
Strong population growth and a growing economy is fuelling demand for infrastructure. The government is looking to attract private companies to invest in infrastructure
through public-private partnerships (PPPs). 12th Five-Year Investment plan targeting US$1trn in investment, with 50% to come
from the private sector. Significant investment in electricity generating capacity with ambitious targets,
including 470GW of nuclear power by 2050, 20GW of solar power by 2022 and 20GW of wind capacity by 2020.
Threats India may prove unable to cope with its burgeoning population, which has passed the 1bn mark, posing a major threat to the economy and political situation.
Destructive flooding affects productivity. Obstacles such as red tape, lack of transparency and bureaucratic complexities will
threaten five-year plan implementation. Land clearance issues cause major delays to infrastructure and construction projects.
An inadequate system for compensation and environmental approvals is slowing investments and, in some cases, preventing projects from progressing.

India Infrastructure Report Q1 2012
© Business Monitor International Ltd Page 7
Market Overview
India
Five-Year Plans Overview
Following a conference organised by India's Planning Commission, which included presenting the
findings of the Mid-Term Appraisal (MTA) of the 11th Five-Year Plan (2007/08- 20011/12), India's Prime
Minister Manmohan Singh, has revised down growth targets for the period. However, at the same time,
Singh has announced ambitious targets for the 12th Five-Year Plan, which will run from 2012/13 to
2016/17.
The 11th Five-Year Plan
India's 11th Five-Year Plan (2007/08-2011/12) originally targeted investment of INR20,562bn in
infrastructure, including utilities and transport infrastructure, as well as telecoms and irrigation. However,
based on revised estimates announced in the MTA, as detailed by Daily News & Analysis (DNA) India,
investment is likely to reach INR20,542bn (US$453,856mn) – a difference of around US$430mn.
Although this is very close to target, especially taking into account the difficult economic environment,
investments have been bolstered by better-than-expected interest in the telecoms sector, with transport
infrastructure falling far below expectations. Indeed, investment in telecoms is expected to be 1.59 times
the targeted amount, with 82% of this having come from private sector financing.
A
t
t
h
e
s
a
m
e
t
i
m
e
The 11th Five-Year Plan, Original and Revised Investment Targets, INRbn
Source: Planning Commission

India Infrastructure Report Q1 2012
© Business Monitor International Ltd Page 8
At the same time, Singh has downgraded real GDP growth forecasts for the 11th Five-Year Plan Period,
stating that average growth is expected to come in at around 8% per year between 2007/08 and 2011/12.
This is down from the 9% targeted for the period and has been in response to around 7% year-on-year (y-
o-y) growth seen over the past 18-24 months. Singh attributes this to a difficult economic environment,
exacerbated by lower food production, which has been caused by below-normal rains in the 2009
monsoon. Although BMI's Asia Country Risk analysts are positive about India, especially in the context
of the global economic situation, the fiscal situation is tempering growth expectations at below 8% y-o-y.
With high levels of public debt pushing interest rates up, this will impact the price of loans within the
country. This in turn will affect private sector access to financing within India, impacting potential
investors as they attempt to raise funding for infrastructure projects.
Indeed, levels of private sector financing have fluctuated considerably over the first half of the 11th Five-
Year Plan, according to the MTA. On the whole, investment from the private sector has fallen below
expectations. Projections for private sector investment have been reduced by 50-80% in some sectors,
such as roads and railways, according DNA India.
Ports
There has been high private sector investment in ports, with 80% of the sector's total investment in the
ongoing plan coming from private sources. This is hardly surprising; the port sector has seen some of the
highest levels of private sector participation. A large number of port terminals are operated by the private
sector, meaning expansion plans are supported by private finance. At the same time, a number of
concessions for terminals have been awarded over recent years.
Airports
Airports have also seen a substantial amount of private sector investment, according to the appraisal,
accounting for around 64% of investment. Once again, this is not a shock, as a number of larger airports
in the country are being operated under concessions. Indira Gandhi International Airport in Delhi is being
run by a GMR-led consortium under a 30-year concession, for example.
Roads And Railways
Despite successes in the port and airport sectors, roads and railways have underperformed in terms of
private sector investment. According to the MTA, just 16% of investment in roads has come from the
private sector and a paltry 4% in the railways sector. In terms of railways, the entire Indian railway
network is run by state-owned Indian Railways, meaning private investors will find it very difficult to
make any gains; however, in the recent 2010/11 budget, plans were put in place to incorporate public-
private partnerships (PPPs) into investment plans.
India Infrastructure Report Q1 2012
© Business Monitor International Ltd Page 9
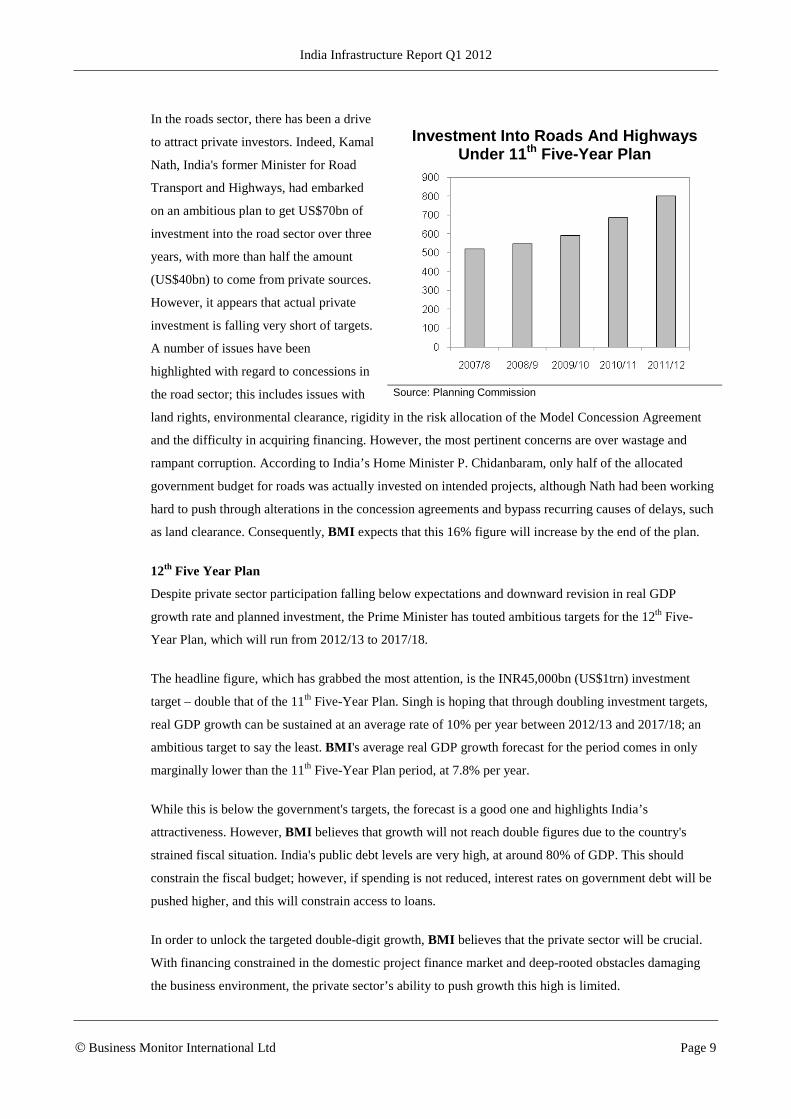
In the roads sector, there has been a drive
to attract private investors. Indeed, Kamal
Nath, India's former Minister for Road
Transport and Highways, had embarked
on an ambitious plan to get US$70bn of
investment into the road sector over three
years, with more than half the amount
(US$40bn) to come from private sources.
However, it appears that actual private
investment is falling very short of targets.
A number of issues have been
highlighted with regard to concessions in
the road sector; this includes issues with
land rights, environmental clearance, rigidity in the risk allocation of the Model Concession Agreement
and the difficulty in acquiring financing. However, the most pertinent concerns are over wastage and
rampant corruption. According to India’s Home Minister P. Chidanbaram, only half of the allocated
government budget for roads was actually invested on intended projects, although Nath had been working
hard to push through alterations in the concession agreements and bypass recurring causes of delays, such
as land clearance. Consequently, BMI expects that this 16% figure will increase by the end of the plan.
12th Five Year Plan
Despite private sector participation falling below expectations and downward revision in real GDP
growth rate and planned investment, the Prime Minister has touted ambitious targets for the 12th Five-
Year Plan, which will run from 2012/13 to 2017/18.
The headline figure, which has grabbed the most attention, is the INR45,000bn (US$1trn) investment
target – double that of the 11th Five-Year Plan. Singh is hoping that through doubling investment targets,
real GDP growth can be sustained at an average rate of 10% per year between 2012/13 and 2017/18; an
ambitious target to say the least. BMI's average real GDP growth forecast for the period comes in only
marginally lower than the 11th Five-Year Plan period, at 7.8% per year.
While this is below the government's targets, the forecast is a good one and highlights India’s
attractiveness. However, BMI believes that growth will not reach double figures due to the country's
strained fiscal situation. India's public debt levels are very high, at around 80% of GDP. This should
constrain the fiscal budget; however, if spending is not reduced, interest rates on government debt will be
pushed higher, and this will constrain access to loans.
In order to unlock the targeted double-digit growth, BMI believes that the private sector will be crucial.
With financing constrained in the domestic project finance market and deep-rooted obstacles damaging
the business environment, the private sector’s ability to push growth this high is limited.
Investment Into Roads And Highways Under 11th Five-Year Plan
Source: Planning Commission

India Infrastructure Report Q1 2012
© Business Monitor International Ltd Page 10
During the 12th Five-Year Plan, the government is targeting 50% of investment to come from the private
sector, equal to US$500bn. BMI notes that while India remains an attractive market for infrastructure
investors – driven by the strong fundamentals of economic and population growth – this target is an
ambitious one.
Project Finance Concerns
The biggest concern is access to finance, with local bank capacity not really up to providing the sort of
long-term financing needed to support infrastructure projects. Due to the long-term nature of most
projects, loans need to have a term of more than 10 years. However, local banks are unable to provide this
type of financing due to the underdeveloped nature of Indian capital markets, a lack of precedent for long-
term loans, limited liquidity and the fact that banks' funds mature over the medium-term.
In order to get round this problem, in 2006, the government set up the Indian Infrastructure Finance
Company, a government-owned company which provides long-term financing for infrastructure projects.
The company has been very successful, with disbursements having reached US$2bn by the end of March
2010; these were expected to increase significantly by the end of March 2011, to US$4.4bn.
Other ways of increasing financing options have been pursued. The FY2011/12 union budget saw the
Indian government reaffirm its commitment to financing infrastructure, and outlined plans to release
23.3% more funding to the sector than in FY2010/11 – reaching INR2,140bn (US$48bn) in FY2011/12;
this is equal to 17% of total budgetary expenditure. Meanwhile, government authorities involved in
infrastructure development have been allowed to issue tax free bonds, amounting to a total of INR300bn
(US$6.7bn). This includes: the Indian Railway Finance Corporation – INR100bn (US$2.2bn); the
National Highway Authority of India – INR100bn (US$2.2bn); the Housing and Urban Development
Corporation – INR50bn (US$1.1bn); and Ports – INR50bn (US$1.1bn).
In addition, the FY2011/12 budget will provide the government-owned India Infrastructure Finance
Company Limited (IIFCL) with an additional INR5bn (US$1.1bn) for its takeout financing scheme. In
takeout financing, a long-term financing institution such as IIFCL will agree to take an existing loan
(possibly short- to medium-term) off a bank's balance sheet for a price, thus boosting the liquidity and
risk transfer opportunities for Indian banks. This scheme, along with the refinancing services provided by
IIFCL, are essential for the successful implementation of India's 12th Five-Year Plan (2012/13- 2016/17)
due to the lack of size and sophistication in India's financial markets. In August 2011, it was reported that
the IIFCL will take over the management of more than US$131.1bn in loans from the IDBI Bank.
The Indian government has recognised the effectiveness of takeout financing for infrastructure
development and has boosted the scope of the scheme. In September 2011, three state-run financial
institutions - the Indian Infrastructure Finance Company Limited (IIFCL), Life Insurance Corporation of
India (LIC) and India Development Finance Corporation (IDFC) - signed a memorandum of
understanding to boost the application of takeout financing in India. The MOU would allow the three

India Infrastructure Report Q1 2012
© Business Monitor International Ltd Page 11
companies to take out up to 50% of an infrastructure project's debt, in the ratio of 20:20:10 respectively.
According to Indian Finance Minister Pranab Mukherjee, this takeout financing agreement is expected to
unlock around INR300bn (US$6.2bn) in bank debts, allowing banks to finance other projects and speed
up the pace of infrastructure development in India. Originally, the takeout financing scheme is only
carried out by IIFCL for up to 20% of a project's total cost.
Restrictions on foreign institutions and investors (FIIs), which previously hindered investment in
infrastructure-related bonds, have also been relaxed – another positive move to improve long-term
financing given FIIs' access to deeper and more varied pools of funding. FIIs are now able to invest up to
US$25bn on bonds issued by infrastructure companies, an increase from an original US$5bn. FIIs are also
allowed to invest in unlisted bonds from special purpose vehicles (SPVs) belonging to infrastructure
companies, while new infrastructure debt funds that are exempt from taxes will be created to attract
foreign funds for financing of infrastructure.
In June 2011, the Indian government indicated that the structure for the SPVs for infrastructure financing
– commonly known as infrastructure debt funds (IDFs) – is now in place. The newly-designed IDFs,
which were proposed by Finance Minister Pranab Mukherjee in the Union Budget for 2011/12 (April-
March) and are expected to have a combined value of INR500bn (US$11bn), are aimed at accelerating
and enhancing the flow of long-term debt for infrastructure financing. The government hopes that these
IDFs will entice domestic and overseas institutional investors to commit long-term funding to
infrastructure projects across the country. These investors would most likely include insurance and
pension funds, as their long-term financial obligations make them well suited for financing infrastructure.
As of October 2011, Indian officials are already promoting these IDFs to overseas investors. Economic
Affairs Secretary R Gopalan was in discussion with investors in Singapore and had announced that the
first IDF is set to be launched in the coming two months. The fund is expected to attract US$3bn in
investment, and is currently undergoing the initial process of establishment.
To date, insurance and pension funds have so far played a limited role in India's infrastructure sector. To
boost the investment grade rating of these SPVs and IDFs, the government has launched a new financing
tool known as credit enhancement. According to the Economic Times, the proposal, which was reviewed
by the finance ministry in August 2011, envisages a guarantee by the IIFCL which will subscribe to 25-50
% of the bonds being issued by the infrastructure company. This will be backed by insurance cover from
the Asian Development Bank (ADB) to the tune of 50% of IIFCL's exposure, which in any case enjoys
sovereign guarantee. For example, if a SPV floated by a company for infrastructure development is
raising INR40bn debt through bond issuance, and is approved for credit enhancement, IIFCL will
subscribe to the bonds amounting to INR10bn, with half of these purchased bonds insured by ADB and
the other half enjoying a government guarantee provided by IIFCL. This would boost the SPV’s rating
from BBB to AA, making it investment grade for long-term players such as pension and infrastructure
companies, who are required to invest in bonds with a minimum rating of AA. Credit enhancement will

India Infrastructure Report Q1 2012
© Business Monitor International Ltd Page 12
therefore help long-term lenders to finance infrastructure projects, while freeing up banks to make
investment that will match their liabilities, which are typically short-term deposits.
The initial phase for credit enhancement is expected to provide funding support for around INR150bn and
has since been expected to direct and indirect equity holders. In Sep 20111, it was reported by Reuters
that the Reserve Bank of India further eased external commercial borrowing policy for the infrastructure
sector by allowing direct and indirect equity holders to provide credit enhancement for domestic debt
raised by Indian infrastructure companies and infrastructure finance companies. The direct foreign equity
holder should have a minimum of 25% of paid-up capital in the debt issuing firm while the in direct
foreign equity holder needs to have at 51%%..
These measures are meant to boost foreign investment – particularly from private equity funds – into
India’s infrastructure sector, and they appear to be proving successful. Over recent years, the private
equity (PE) funds focusing on India's infrastructure sector have increased in number. Perhaps the biggest
is the Macquarie-SBI fund, which is currently in the process of raising US$1.5bn following its first close
in April 2009. Other funds include the US$1.2bn 3i India Infrastructure Fund (the international private
equity company plans to launch a second infrastructure fund of US$1.5bn) and ICICI Venture's US$1bn
India Infrastructure Advantage Fund. More recently, in March 2011, Nomura Securities, Japan's leading
securities company and subsidiary of financial conglomerate Nomura Group, announced plans to raise
US$500mn from Japanese investors for an Indian infrastructure fund. These funds have made an impact
on India’s infrastructure development. Between May and September 2011, six notable PE groups - 3i
Infrastructure , Morgan Stanley , Kohlberg Kravis Roberts , Blackstone Group and JP Morgan
Chase - invested a total of US$1.05bn into Indian companies or infrastructure projects.
According to PE research house Preqin, there are 38 infrastructure PE funds currently looking at assets in
India, with nine more to be launched in 2011, according to Livemint. In total, Preqin notes that the funds
have raised US$9.5bn for investment in India's infrastructure sector and are seeking a further US$7.3bn.
During 2010, 28 deals worth a combined US$2bn were made in India's infrastructure sector, compared to
just 18 deals worth US$333mn in 2009, according to VCCircle research, also cited by Livemint.
PE funds have seen some success, typically investing in a company or an established infrastructure asset.
Indeed, brownfield opportunities are the most popular amongst the PE infrastructure funds, as the level of
risk inherent in existing assets is significantly reduced.
Reform Momentum Can Only Improve
Policy reform, while still sluggish, is starting to move forward, following a virtual standstill in the last
two parliamentary sessions. A key reform is the introduction of a new land bill to repeal the obsolete
Land Acquisition Act of 1894 and replace it with a fresh National Land Acquisition and Rehabilitation &
Resettlement Bill 2011. With the 2012 elections looming large, the land reform bill remains a hot political
topic, with the Indian public still very much against the bill. This is in spite of the unfavourable terms for

India Infrastructure Report Q1 2012
© Business Monitor International Ltd Page 13
investors, as the financial cost of land purchases is expected to rise significantly under the current
proposals. Construction companies would need to pay twice the market value for urban land and six times
for rural development. In addition, 80% of the families involved will have to give approval for
acquisitions to take place, and the bill would be implemented retrospectively.
Nevertheless, if approved in FY2011/12, as we believe it will be, the legislation could bring much-needed
speed and clarity in a process that has long been cumbersome and incoherent. Indeed, the savings on
approval/litigation/execution cost factors are likely to make the bill a net positive for investors. Project
delays have been a considerable drawback for India's business climate, and any improvements on this
front will certainly help to re-ignite investor enthusiasm.
In Conclusion...
All of these moves and announcements show that the government is moving in the right direction, and is
looking at innovative ways of increasing access to financing for private investors looking to invest in
India's infrastructure market. In order to capitalise on India’s potential, these plans need to be
implemented in a timely manner. At the same time, the issue of transparency and an over-intrusive
bureaucracy needs to be addressed in order to attract investors into the market. The government appears
serious about addressing these issues, and, in order to achieve its ambitious targets in the 12th Five-Year
Plan, it needs to be.

India Infrastructure Report Q1 2012
© Business Monitor International Ltd Page 14
Building Materials
Global
Industry Trend Analysis - Building Materials: China To Remain Demand Driver; Developed Markets Offer Little Support
BMI View: The recent downturn in investor sentiment sparked by growing uncertainty over the US
economic recovery and the ongoing fiscal situation in the eurozone reinforces our core view that demand
for building materials will remain broadly muted in developed economies s through 2011 and into 2012.
With persistent weakness in developed markets and political headwinds still weighing on growth in the
Middle East and North Africa (MENA), demand in China will remain the key factor in determining the
levels of growth in the global consumption of cement and steel over the coming quarters. Meanwhile,
elevated raw material and energy prices will continue to weigh on producer margins across the globe.
Key views for 2011:
• Asia and Latin America to outperform globally: emerging Markets (EM) demand for building materials
to hit new highs in 2011 driven by robust economic growth.
• Europe/North America: cement production to remain depressed but stable; still below pre-crisis levels -
persistent market weakness driving asset sell-offs and increasing EM focus.
• The impact of the crisis in Middle East and North Africa (MENA) will lead to muted consumption
growth in 2011, but this will rebound in 2012.
• Saudi Arabia and Indonesia to be global outperformers in terms of cement consumption growth.
• Steel prices to trend steadily higher through 2011 and 2012; Chinese overcapacity to alleviate some
upside pressure.
Risks:
• Elevated energy and raw materials costs represent a continued threat to producer margins and
consumers.
• China to remain the key growth driver of cement and steel demand; though monetary tightening
measures present downside risk to the demand outlook.
• Inflationary pressures a key concern for the sector across much of Asia.
India Infrastructure Report Q1 2012
© Business Monitor International Ltd Page 15
Asia Pulling Away
Rising per capita income, demographic growth, urbanisation and industrialisation are the key growth
drivers behind Asia's building materials consumption story. Indeed, while base effects, China's cooling
measures and continued weakness in developed markets will likely see a moderation in cement and steel
consumption in 2011, demand growth will remain robust. Across much of Asia and other key emerging
markets, notably Brazil, the rate of cement and steel consumption will accelerate. Indeed, surging demand
in Asia, particularly China, saw global cement and steel consumption increase by 8% and 13%
respectively in 2010, offsetting an uncertain and broadly muted recovery in Europe and North America.
Asian Outperformance Basket Of Four Largest Global And Asian Cement Firms By Market Capitalisation (Rebased Jan-
10)
Source: Bloomberg.
Having accounted for the lion's share of growth in global cement sales, and two thirds of global steel
production in 2010, we expect key Asian markets such as China, India, Indonesia and the Philippines to
further boost the region's share of the total in 2011. Moreover, Asia will be the key driver behind a steady
shift in global steel consumption over the coming years, away from developed economies and towards
emerging/developing economies. This will see emerging markets account for 72% of global steel
consumption in 2012 (from 61% in 2007); while steel use in the developed world will still be 14% below
the 2007 level, according to World Steel Association (WSA) forecasts.

India Infrastructure Report Q1 2012
© Business Monitor International Ltd Page 16
Of these markets, Indonesia, Asia's third most populous country, alongside the Philippines, Thailand and
Vietnam, continue to drive the rampant consumption of building materials in the region, with residential
construction, in particular, continuing to exert strong upward pressure on cement prices. We expect
Indonesia to be a regional outperformer over the next couple of years, having recorded a 14.8% rise in
cement sales in H111. Given its size and positive demographic and macroeconomic fundamentals, there is
huge growth potential within the market, particularly in the cement sector where sales are soaring and
capacity is still insufficient.
India To Outperform China
Although we expect demand to remain relatively robust in China, the raft of monetary tightening
measures introduced over the last 12 months should see the growth in consumption of cement and steel in
India outpace that of its fellow giant. However, despite the anticipated moderation in construction activity
in China, we expect demand for building materials to be relatively well supported due to China's huge
affordable housing programme, as well as extensive infrastructure projects.
India, Asia's other giant, will see demand for building materials accelerate in 2011. Indeed, according to
the WSA, demand for steel in the country is expected to grow by 13.6% year-on-year (y-o-y) in 2011 and
14.3% in 2012, as the country's insatiable demand for housing and infrastructure projects drives
consumption of the metal.
Demand for cement will also rise, although whether this will exert any upward pressure on prices is
uncertain, as capacity is high and India's cement producers are able to absorb rising costs. However, there
are significant risks to this outlook, notably those arising from the well- publicised shortcomings within
India's business environment.
Rising Input Costs And Inflation To Squeeze Margins
Over the last 12 months inflationary pressures and the high cost of key raw materials (notably fuel and
iron ore) have been, and remain, a key concern for the construction industry. Driven by strong demand in
Asia and perpetuated by the ongoing unrest in the Middle East, rising input costs have put pressure on
companies' operating margins and in many cases served to offset improving sales growth. These effects
have weighed particularly heavily on the building materials industry given its energy and resource-
intensive nature. Moreover, with input costs likely to remain elevated over the coming months, margins
will be squeezed further, as well as the increased likelihood that these costs will be passed on to the
consumer.

India Infrastructure Report Q1 2012
© Business Monitor International Ltd Page 17
Still Eroding Profits Brent Crude, Newcastle Coal And Chinese Iron Import Price Index (Rebased Jan-2010)
Source: Bloomberg.
However, the decidedly negative turn in investor sentiment through recent weeks has seen the price of a
barrel of oil fall significantly. This is broadly in line with BMI's view that there will be a correction in oil
prices in H211 and should help alleviate operating cost pressures for cement and steel producers.
In South East Asia, such issues regarding negative turns in investor sentiment are accentuated by the
constant threat of inflation, which remains a key concern for a number of countries in the region in 2011,
particularly Indonesia and Vietnam. Although local supply-demand dynamics can drive up prices in a
particular market on a short-term basis; factors such as transport and distribution costs, as well as
uncertain electricity supply, also remain notable constraints for the building materials sector in many
emerging markets. These heightened operating costs can serve to substantially erode positive sales
growth.
This latter issue is an especially pertinent one in sub-Saharan Africa (SSA), where the biggest obstacle
facing large cement producers is the huge infrastructure deficit. This often makes the manufacturing and
transport of building materials from country to country - a highly energy-intensive process at the best of
times - often impossible. While encouraging efforts to ramp up capacity in countries such as Nigeria,
Kenya, Angola and Zimbabwe have been seen over recent quarters, the price of key materials such as
cement will remain highly vulnerable to price volatility for the foreseeable future.

India Infrastructure Report Q1 2012
© Business Monitor International Ltd Page 18
Developed Markets Trailing
With weak economic data from the US continuing to erode confidence in the country's fragile recovery
and the ongoing eurozone debt crisis, the outlook for the global cement majors with heavy exposure to
these regions remains a subdued one. Indeed, high debt burdens and economic uncertainty led to a string
of asset sell offs in the first half of 2011 as firms sought to reduce exposure to these struggling markets.
Lafarge is a case in point, having sold off 'non-core' assets in the US and Europe as it bids to reduce its
substantial debt pile. While uncertainty persists, the worst appears to be over for the European building
materials market and we anticipate volumes and prices of building materials to stabilise in 2012. Even in
the US, the latest figures support our view that residential construction has bottomed (adding 0.08% to
overall GDP growth in Q211) which is positive news for the sector as a whole.
Developed Economies With Declining Share Cement Production (thousand tonnes), 2010
Source: USGS.
Steel: Demand To Grow, With Moderate Price Rises
Following a contraction of 6.6% in 2009, apparent steel use (i.e. steel consumption) increased by 13.1%
in 2010 to 1,272 million metric tonnes (mmt), according to WSA estimates. It is forecast by the WSA that
growth will moderate in 2011, but still rise by 5.3% to reach an all time high of 1,340mmt. This
moderation in growth is due to factors such as base effects as well as China's raft of measures aimed at
curbing its rampant property and construction sectors. Moreover, much of the growth seen in developed
markets in H110 reflected inventory restocking and stimulus measures that have now unwound.

India Infrastructure Report Q1 2012
© Business Monitor International Ltd Page 19
Global Steel Growth Outlook Steel Consumption Growth Forecast (%)
Source: WSA.
Although 2011 will likely see a relative slowdown in Chinese demand for the metal, global steel
consumption will continue to be driven by the Asian giant. Indeed, China's construction and automobiles
industries - two major steel consuming sectors - are forecast to expand by 9% and 15.8% respectively.
China Steel The Driving Force Asia And China Steel Production (Thousand Metric Tonnes)
Source: WSA.
India Infrastructure Report Q1 2012
© Business Monitor International Ltd Page 20
Over the next two years we expect steel prices to rise steadily. Three-month LME steel billet prices will
average US$580/tonne in 2011 and US$620/tonne in 2012, according to BMI's commodities team,
though this is still a long way off pre-crisis peak levels. Over the coming quarter we expect the metal to
trade between US$500/tonne and US$600/tonne, with a number of factors combining to prevent any
potential price surge. One notable issue is that of significant overcapacity in China, which, along with the
Chinese government's concerted efforts to cool industrial production,; reduce the likelihood of any
supply-side constraints.
While we believe that overcapacity will play a key role in curbing potential gains in steel prices there are
a number of dynamics that could precipitate upward price pressure over the coming months. Indeed, cost
pressures arising from the high cost of raw materials have continued to mount in recent months, forcing
steel producers to increase prices as margins came under pressure.
Asia
Industry Trend Analysis - Building Materials: China Still Leading The Charge As Competition Heats Up
BMI View: Attractive macroeconomic and demographic fundamentals across key Asian markets continue
to underpin our positive outlook for global building materials consumption in 2011 and 2012, as well as
over the longer-term. While China's belt tightening measures may conceivably see some softening in the
region's cement and steel consumption growth over the coming quarters, heavy investment in
infrastructure and social housing should ensure that demand levels are well-supported. Indeed, across
the region, rising demand is driving robust sales growth which, in turn, is fuelling capacity expansion
and increasing overseas investment.
Key views:
• Inflationary pressures to remain a concern until end-2011, particularly in Indonesia and Vietnam -
high costs to continue to erode profit and drive market consolidation
• Strong domestic sales driving overseas expansion for a number of large regional cement producers -
competition intensifying in Indonesia
• Robust economic growth across region to drive global consumption of building materials in 2011/2012
and beyond - driven by demand for infrastructure and housing
• High cost of energy and raw materials to continue to weigh on the industry over the short-term, at
least - squeezing margins and exerting upward price pressure

India Infrastructure Report Q1 2012
© Business Monitor International Ltd Page 21
• China's cooling measures present demand side risk through 2011 and 2012
• ...but sizeable social housing and infrastructure projects to provide significant respite - steel output
proved to be robust through H111
Robust Fundamentals Drive Growth in 2011 and Beyond
Rising per capita income, demographic growth, urbanisation and industrialisation are the key drivers of
growth behind Asia's building materials consumption story. Indeed, we expect the strong demand for
housing and infrastructure in large dynamic Asian markets, such as India, China, Indonesia and
Philippines, to underpin robust growth in the sector over the medium- to long-term. This trend is
highlighted in the outperformance of Asian cement companies relative to their global, Western-based
competitors.
In contrast to global cement majors such as Lafarge and Holcim who, despite a growing presence in
emerging markets, have faced substantial headwinds over the last 18 months, Asian cement majors, such
as China-based Anhui Conch, Thailand's Siam Cement and Indonesian firm Indocement, have
performed strongly. Indeed, with Asia accounting for an expanding slice of the world's cement output -
China and India are the world's largest and second largest consumers of the building material by some
distance - there is huge potential growth and consolidation within these markets over the coming years.
Strong Sales Growth, But Costs Weigh On Margins
Asian Cement Firms (Rebased As Of 02/08/2010)
Source: Bloomberg

India Infrastructure Report Q1 2012
© Business Monitor International Ltd Page 22
Steel production in the region grew by 11.8% year-on-year (y-o-y) in 2010, increasing its proportion of
the global total from 63.5% to 65.5%, according to the World Steel Association (WSA). Indeed, the
region's insatiable demand for the metal has seen the price of iron ore soar over the last 18 months,
symptomatic of the steady shift in steel consumption away from developed economies and towards
emerging/developing economies. Moreover, despite the Chinese government's efforts to cool the
economy, steel production reached a record high in June 2011, with apparent steel consumption for the
period January to June up by nearly 9% compared to the same period in 2010. Furthermore, with steel
rebar - most commonly used in building construction - the single largest product in the country's steel
mix, the construction sector, remains a key driver behind this resilient growth.
BMI notes that, while our expectation that fixed-asset investment in China will moderate significantly
from 2011 onwards, in line with monetary tightening measures, the sheer size of the planned investments
in social housing and infrastructure should help sustain solid growth levels and capacity utilisation rates.
Meanwhile, over the short-term, we expect elevated input costs to continue to squeeze the margins of
cement and steel producers over the coming months.
Ramping Up Capacity
As China's consumption growth moderates over the next couple of years, India, Asia's other giant, will
see the demand for building materials accelerate in 2011 and beyond. According to the WSA, demand for
steel in the country is expected to grow by 13.6% y-o-y in 2011 and 14.3% in 2012, as the country's
insatiable demand for housing and infrastructure projects drives consumption of the metal. Demand for
cement will also rise, although whether this will exert any upward pressure on prices is uncertain, as
capacity is high and India's cement producers are able to absorb rising costs. There are significant risks to
this outlook; however, it is noted that these arise from the well-publicised shortcomings within India's
business environment.
These shortcomings have manifested themselves in costly delays to major planned steel and mining
projects in the country, inhibiting production levels and leaving investors wary. However, the Indian
building materials industry received a major boost in May 2011, when the Environment Ministry finally
granted final approval for a US$12bn steel mill to be operated by South Korea's POSCO, following years
of delays. While this does little to paper over the major fissures still present within India's business
environment, it is nonetheless a positive development for the sector.
Dynamic and Increasingly Competitive
Indonesia - the continent's third most populous country -, the Philippines, Thailand and Vietnam will be
key growth markets for the consumption of building materials in the region over the coming years.
India Infrastructure Report Q1 2012
© Business Monitor International Ltd Page 23
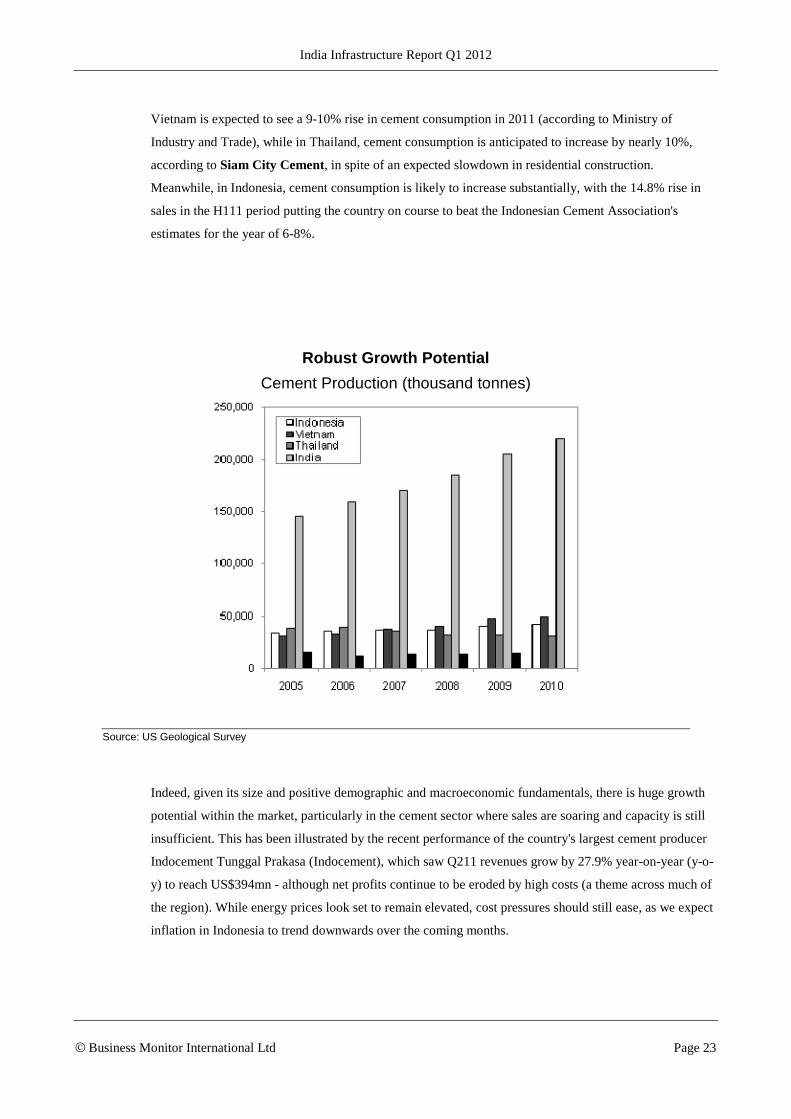
Vietnam is expected to see a 9-10% rise in cement consumption in 2011 (according to Ministry of
Industry and Trade), while in Thailand, cement consumption is anticipated to increase by nearly 10%,
according to Siam City Cement, in spite of an expected slowdown in residential construction.
Meanwhile, in Indonesia, cement consumption is likely to increase substantially, with the 14.8% rise in
sales in the H111 period putting the country on course to beat the Indonesian Cement Association's
estimates for the year of 6-8%.
Robust Growth Potential
Cement Production (thousand tonnes)
Source: US Geological Survey
Indeed, given its size and positive demographic and macroeconomic fundamentals, there is huge growth
potential within the market, particularly in the cement sector where sales are soaring and capacity is still
insufficient. This has been illustrated by the recent performance of the country's largest cement producer
Indocement Tunggal Prakasa (Indocement), which saw Q211 revenues grow by 27.9% year-on-year (y-o-
y) to reach US$394mn - although net profits continue to be eroded by high costs (a theme across much of
the region). While energy prices look set to remain elevated, cost pressures should still ease, as we expect
inflation in Indonesia to trend downwards over the coming months.

India Infrastructure Report Q1 2012
© Business Monitor International Ltd Page 24
Riding High With The Komodo Dragon
Indocement Q2 Revenues, Net Profits And Operating Margin
Source: Indocement, Bloomberg
This robust growth potential has not gone unnoticed and is attracting the attention of foreign cement
companies from within the region. In July 2011, Thailand cement maker Siam Cement announced plans
to spend US$219mn on developing its ceramic and construction material businesses in Indonesia, while
China's Anhui Conch is also planning to invest US$2.35bn in the construction of four new cement plants
in the country. These investments will bring welcome new capacity online for the country, as well as
stimulating increased competition within a market which holds significant potential for consolidation over
the coming years. Vietnam is another market that looks set for increasing consolidation. Indeed, despite
our positive long-term outlook for the sector, over-supply and high energy and transport costs will put
increasing pressure on less-competitive companies.
China Cools Regional Outlook, But Risks Remain Upside
Apparent steel consumption in China for the period January to June 2011 grew by nearly 9% compared to
2010, despite indicators that the government's monetary tightening measures are beginning to take an
effect on manufacturing and other industries, including residential construction. Indeed, steel production
in the country averaged a record high of approximately 2mn tonnes in June 2011, according to the WSA,
driven by strong demand from China's mass affordable housing programme and infrastructure projects.
The key role of the construction sector in this resilient growth is reflected in the sizeable contribution -
16% - of steel rebar (used primarily in building construction) in the country's steel mix.

India Infrastructure Report Q1 2012
© Business Monitor International Ltd Page 25
China Steel The Driving Force
Asia And China Steel Production (Thousand Metric Tonnes)
Source: WSA
With a greater number of affordable homes due to be built over the second half of 2011, and in the years
to follow, we expect steel and cement output in the country to be well-supported in the face of a wider
softening in demand, as tightening measures take effect.
A breakdown of WSA estimates shows that they expect China's apparent steel use in 2011 to increase by
5.0% to 605mnt, following 5.1% growth in 2010. Moreover, the given the pace of steel production in the
first half of 2011, Chinese steel use could be even higher than expectations. However, given that
utilisation rates remain below pre-crisis levels, we see few immediate risks from supply side constraints.
Overcapacity therefore remains an issue in the country, coupled with high input costs, which are
squeezing the margins of some of the country's main producers.

India Infrastructure Report Q1 2012
© Business Monitor International Ltd Page 26
Industry Forecast Scenario
Table: India Construction And Infrastructure Industry Data
2008/09 2009/10 2010/11 2011/12f 2012/13f 2013/14f 2014/15f 2015/16f 2016/17f
Construction Industry Value, INRbn 4,514.1 5,017.1 5,918.6 6,699.4 7,667.9 8,874.7 10,316.3 11,859.8 13,590.3
Construction Industry Value, US$bn 103.7 103.6 129.5 145.6 163.1 194.0 237.2 287.5 339.8
Construction Industry Real Growth, % chg y-o-y 5.4 7.0 8.1 4.0 6.0 7.5 7.7 7.0 6.6
Construction Industry, % of GDP 8.1 7.7 7.5 7.3 7.4 7.5 7.6 7.7 7.8
Total Capital Investment, INRbn 19,735.3 23,441.8 27,383.1 31,143.0 35,338.0 40,904.5 47,145.1 53,731.8 61,039.2
Total Capital Investment, US$bn 428.4 496.3 601.5 673.4 821.8 997.7 1,193.5 1,395.6 1,606.3
Total Capital Investment, % of GDP 35.4 35.8 34.8 34.1 34.0 34.4 34.7 34.9 34.9
Capital Investment Per Capita, US$ 359.8 410.9 491.2 542.4 653.1 782.4 924.0 1,066.8 1,212.8
Real Capital Investment Growth, % y-o-y 1.5 7.3 9.0 6.5 7.5 11.0 10.0 9.0 8.5
Construction Industry Employment, '000 #N/A #N/A #N/A #N/A #N/A #N/A #N/A #N/A #N/A
Construction Industry Employment, % y-o-y #N/A #N/A #N/A #N/A #N/A #N/A #N/A #N/A #N/A
Total Workforce, '000 759,958.6 774,780.9 789,749.6 803,769.7 818,273.7 832,851.9 847,141.0 860,948.4 873,803.4
Construction Industry Employees as % of total labour force #N/A #N/A #N/A #N/A #N/A #N/A #N/A #N/A #N/A

India Infrastructure Report Q1 2012
© Business Monitor International Ltd Page 27
Table: India Construction And Infrastructure Industry Data
2008/09 2009/10 2010/11 2011/12f 2012/13f 2013/14f 2014/15f 2015/16f 2016/17f
Infrastructure Industry Value As % of Total Construction 45.7 46.5 47.0 47.8 48.5 49.7 50.4 51.1 51.6
Infrastructure Industry Value, INRbn 2,063.3 2,332.9 2,781.8 3,200.3 3,722.7 4,413.3 5,204.3 6,059.4 7,016.8
Infrastructure Industry Value, US$bn 47.4 48.2 60.8 69.6 79.2 96.5 119.6 146.9 175.4
Infrastructure Industry Value Real Growth, % chg y-o-y 12.8 11.1 8.7 5.9 7.8 10.3 9.4 8.4 7.8
Infrastructure Industry Value as % of GDP 3.7 3.6 3.5 3.5 3.6 3.7 3.8 3.9 4.0
Residential and Non-Residential Building Industry Value As % of Total Construction 54.3 53.5 53.0 52.2 51.5 50.3 49.6 48.9 48.4
Residential and Non-Residential Building Industry Value, INRbn 2,450.9 2,684.1 3,136.9 3,499.1 3,945.2 4,461.4 5,112.0 5,800.4 6,573.6
Residential and Non-Residential Building Industry Value, US$bn 56.3 55.4 68.6 76.1 83.9 97.5 117.5 140.6 164.3
Residential and Non-Residential Building Industry Value Real Growth, % chg y-o-y -2.5 7.5 6.3 2.4 4.2 4.8 6.1 5.5 5.3
Residential and Non-Residential Building Industry Value as % of GDP 4.4 4.1 4.0 3.8 3.8 3.8 3.8 3.8 3.8
f = BMI forecasts. Sources: Census and Statistics Department/ILO

India Infrastructure Report Q1 2012
© Business Monitor International Ltd Page 28
Table: India Construction And Infrastructure Industry Data
2013/14f 2014/15f 2015/16f 2016/17f 2017/18f 2018/19f 2019/20f 2020/21f 2021/22f
Construction Industry Value, INRbn 8,874.7 10,316.3 11,859.8 13,590.3 15,472.0 17,565.5 19,917.4 22,500.2 25,425.3
Construction Industry Value, US$bn 194.0 237.2 287.5 339.8 396.7 462.2 524.1 592.1 669.1
Construction Industry Real Growth, % chg y-o-y 7.5 7.7 7.0 6.6 5.8 5.5 5.4 5.0 5.0
Construction Industry, % of GDP 7.5 7.6 7.7 7.8 7.8 7.8 7.8 7.8 7.8
Total Capital Investment, INRbn 40,904.5 47,145.1 53,731.8 61,039.2 68,884.0 77,519.9 87,128.3 97,559.2 109,270.3
Total Capital Investment, US$bn 997.7 1,193.5 1,395.6 1,606.3 1,812.7 2,040.0 2,292.9 2,567.3 2,875.5
Total Capital Investment, % of GDP 34.4 34.7 34.9 34.9 34.7 34.5 34.2 33.8 33.5
Capital Investment Per Capita, US$ 782.4 924.0 1,066.8 1,212.8 1,352.4 1,504.2 1,671.6 1,851.1 2,051.2
Real Capital Investment Growth, % chg y-o-y 11.0 10.0 9.0 8.5 7.6 7.2 7.0 6.5 6.5
Construction Industry Employment, '000 #N/A #N/A #N/A #N/A #N/A #N/A #N/A #N/A #N/A
Construction Industry Employment, % y-o-y #N/A #N/A #N/A #N/A #N/A #N/A #N/A #N/A #N/A
Total Workforce, '000 832,851.9 847,141.0 860,948.4 873,803.4 886,229.8 898,389.5 910,552.4 922,846.1 934,482.0
Construction Industry Employees as % of total labour force #N/A #N/A #N/A #N/A #N/A #N/A #N/A #N/A #N/A
Infrastructure Industry Value As % of Total Construction 49.7 50.4 51.1 51.6 52.1 52.4 52.7 53.0 53.2

India Infrastructure Report Q1 2012
© Business Monitor International Ltd Page 29
Table: India Construction And Infrastructure Industry Data
2013/14f 2014/15f 2015/16f 2016/17f 2017/18f 2018/19f 2019/20f 2020/21f 2021/22f
Infrastructure Industry Value, INRbn 4,413.3 5,204.3 6,059.4 7,016.8 8,055.7 9,210.0 10,504.9 11,924.6 13,530.5
Infrastructure Industry Value, US$bn 96.5 119.6 146.9 175.4 206.6 242.4 276.4 313.8 356.1
Infrastructure Industry Value Real Growth, % chg y-o-y 10.3 9.4 8.4 7.8 6.8 6.3 6.1 5.5 5.5
Infrastructure Industry Value as % of GDP 3.7 3.8 3.9 4.0 4.1 4.1 4.1 4.1 4.1
Residential and Non-Residential Building Industry Value As % of Total Construction 50.3 49.6 48.9 48.4 47.9 47.6 47.3 47.0 46.8
Residential and Non-Residential Building Industry Value, INRbn 4,461.4 5,112.0 5,800.4 6,573.6 7,416.2 8,355.5 9,412.5 10,575.6 11,894.7
Residential and Non-Residential Building Industry Value, US$bn 97.5 117.5 140.6 164.3 190.2 219.9 247.7 278.3 313.0
Residential and Non-Residential Building Industry Value Real Growth, % chg y-o-y 4.8 6.1 5.5 5.3 4.8 4.7 4.7 4.4 4.5
Residential and Non-Residential Building Industry Value as % of GDP 3.8 3.8 3.8 3.8 3.7 3.7 3.7 3.7 3.6
f = BMI forecasts. Sources: Census and Statistics Department/ILO

India Infrastructure Report Q1 2012
© Business Monitor International Ltd Page 30
Construction and Infrastructure Forecast Scenario
A slowdown in India's
infrastructure sector continues
to unfold in FY2011/12 (April-
March). The latest statistical
data from India's Ministry of
Statistics and Programme
Implementation (MOSPI)
showed that real growth for the
Indian construction industry
came in at just 1.2% year-on-
year (y-o-y) for the first quarter
of FY2011/12 (April-June),
compared to 7.7% y-o-y in the
same period in FY2010/11.
For the rest of FY11/12, we
remain bearish towards India's
construction sector due to
adverse monetary conditions. Inflation persists at an elevated 9.7% y-o-y in September 2011, despite 11
rate hikes since March 2010. This is placing pressure on the Indian central bank, the Reserve Bank of
India (RBI), to initiate further rate hikes to cut inflation. The RBI raised the policy repo rate by 25 basis
points to 8.50% on October 25 2011.
Meanwhile, global external conditions are turning for the worse in recent months, and we believe this
further sets the stage for weak construction growth throughout the remainder of FY2011/12. The
combination of costly debt levels and high raw material prices will deter or prevent construction
companies operating in India from carrying out large-scale projects, due to a lack of adequate financing.
We do, however, believe that this cyclical downtrend in construction has bottomed out, with inflation
already at its peak. Although rate cuts are unlikely to take place until mid-2012, the RBI has expressed a
clear desire to pause monetary tightening, and this should provide a measure of certainty to infrastructure
investors in search of financing. As such, we believe that construction activity could improve at the tail-
end of FY2011/12, and we have only revised down our real growth forecast for the Indian construction
industry for FY2011/12 to 4.0% (previously 7.3%).
Infrastructure Moving Centre Stage
Construction Industry Value And Infrastructure Share
BMI f=forecast, Source: BMI, BMI Calculation

India Infrastructure Report Q1 2012
© Business Monitor International Ltd Page 31
Activity To Bound Back In 2012/13
Looking further ahead, we are confident that the sector's fortunes will start to improve in FY2012/13. The
Indian government is making serious attempts to kick-start infrastructure development for the 12th Five-
Year Plan (FY2012/13-FY2016/17), approving major infrastructure projects and pushing forward plans to
accelerate and enhance the flow of long-term financing.
In June 2011, India's Ministry of Railways announced that it will conduct the sale of INR100bn
(US$2.2bn) of tax-free bonds in India by September 2011, while other ministries involved in roads, ports
and urban development will also be conducting their bond issuances during FY11/12.
In September 2011, three state-run financial institutions - the Indian Infrastructure Finance Company
Limited (IIFCL), Life Insurance Corporation of India (LIC) and India Development Finance Corporation
(IDFC) - signed a memorandum of understanding to boost the application of takeout financing in India.
The MOU would allow the three companies to take out up to 50% of an infrastructure project's debt,
potentially unlocking around INR300bn (US$6.2bn) in bank debts, which could be used to finance other
projects and speed up the pace of infrastructure development in India. This enhancement in takeout
financing is critical, as it could mitigate the lack of size and sophistication in India's financial markets by
boosting the liquidity and risk transfer opportunities for Indian banks.
Meanwhile, special purpose vehicles developed by India for infrastructure financing - commonly known
as infrastructure debt funds (IDFs) - are being promoted by Indian officials to overseas investors. In
October 2011, India's Economic Affairs Secretary R Gopalan was in discussion with investors in
Singapore and had announced that the first IDF is set to be launched in the coming two months. The fund
is expected to attract US$3bn in investments and is currently undergoing the initial process of
establishment.
Investments from foreign sources also accelerated at the start of FY2011/12, as the high cost of domestic
financing has made Indian infrastructure companies more receptive to capital investments from overseas
companies. Between May and September 2011, six notable private equity groups - 3i Infrastructure ,
Morgan Stanley , Kohlberg Kravis Roberts , Blackstone Group and JP Morgan Chase - invested a
total of US$1.05bn into Indian companies or infrastructure projects.

India Infrastructure Report Q1 2012
© Business Monitor International Ltd Page 32
Boosting The Pipeline
Besides greater access to financing, another indication of a rebound in construction activity is the growing
number of infrastructure projects being implemented and announced by the Indian government. BMI 's
Key Projects Database has once again seen an increase in project backlogs for several infrastructure
sectors over the past quarter, with the value of total projects (particularly power projects) under
construction or in the pipeline in India's infrastructure sector growing from US$400bn as of August 2011
to around US$430bn as of October 2011. This does not include projects that have not provided cost
estimates, which would make the actual value of infrastructure projects available in India even higher.
Value Of Key Infrastructure Projects in India*
Source: WSA
The road sector is a key example of this increase in pipeline projects. In October 2011, the Indian
government launched an INR166bn (US$3.35bn) highways building plan under the National Highways
Development Programme, covering the construction of six-lane highways totalling 6,500km, four-lane
highways totalling 24,700km and the expansion of other highways. Under the plan, the government has
already approved four expressway construction projects, while the country's public-private partnership
appraisal committee has approved 10 roadworks projects, worth a total of US$1.1bn.
Therefore, we expected several infrastructure projects to be awarded at the start of FY2012/13 and begin
construction in late-2012 or 2013. This view is reflected in our forecasts, with real growth for India's
construction sector to reach 6.0% in FY2012/13 and 7.5% in FY2013/14. This also supports our view that
India Infrastructure Report Q1 2012
© Business Monitor International Ltd Page 33
infrastructure (one of the two sub-sectors which form the construction industry value, according to BMI 's
definition) will continue to be the main driver of construction industry value, substantially outperforming
its counterpart - the residential and non-residential building sector.
However, these growth rates are still lower than the double-digit figures seen in the early 2000s, and far
below potential growth levels. Our forecast is motivated by a number of factors:
India's business environment continues to be plagued by a convoluted and incoherent legal
framework, rampant corruption and an environmental ministry that is over-zealous in
prosecuting infringements, but slow in implementing policies. Unclear and ineffective land
clearance regulations are delaying projects, and complex and convoluted bureaucracy is slowing
down planning and tendering processes These issues have led to lengthy delays, with the latest
figures from the Ministry of Statistics and Programme Installation (MOSPI) showing that 284
out of 496 construction projects in India were delayed as of December 2010.
A downgrade of investment targets in the 11th Five-Year Plan (2007/07-2011/12), announced in
March 2010 – due to lower than expected investment in the transport infrastructure sector – was
the first sign that investment targets were not eventuating at the rate anticipated.
Foreign Direct Investment (FDI) is being thwarted by the need to partner with a local player,
meaning only those who are able to form local partnerships can follow through on intentions to
invest.
Risks In Reforms
We believe that the success of the 12th Five-Year Plan is still dependent on the level of regulatory
reforms carried out by the government to facilitate infrastructure development. Structural weaknesses in
India's business environment remain considerable and could still significantly delay projects that have
reached financial closure. At present, it remains to be seen if reforms that are conducive for construction
companies will be carried out.
A key reform is the introduction of a new land bill to repeal the obsolete Land Acquisition Act of 1894
and replace it with a fresh National Land Acquisition and Rehabilitation & Resettlement Bill for 2011.
With the 2012 elections looming large, the land reform bill remains a hot political topic, with the Indian
public still very much against the bill. This is in spite of the unfavourable terms for investors, as the
financial cost of land purchases is expected to rise significantly under current proposals. Construction
companies would need to pay twice the market value for urban land and six times for rural development.
In addition, 80% of the families involved will have to give approval for acquisitions to take place, and the
bill would be implemented retrospectively.
India Infrastructure Report Q1 2012
© Business Monitor International Ltd Page 34
Nevertheless, if approved in FY2011/12 as we believe it will be, the legislation could bring much-needed
speed and clarity in a process that has long been cumbersome and incoherent. Construction companies
continue to face lengthy delays due to hold-ups in land acquisition. Larsen & Toubro , one of the largest
construction companies in India, is currently thinking of re-evaluating the viability of its US$2.8bn
railway project in Hyderabad because it has only been about to acquire 50% of the land for the 71.2km
project. On balance, we believe that the Bill would be a net positive for the industry, and potentially help
galvanise construction sector activity over the medium-term.
(Note: Over Q2 2010 we aligned our data with the Indian standard of using financial year from April 1 to
March 31. Furthermore, in Q111 we extended our forecasts to 2010, as such we are now forecasting from
FY2010/11 to FY2020/21. This brings infrastructure data in line with BMI’s Country Risk team, which
also uses the financial year rather than the calendar year.)
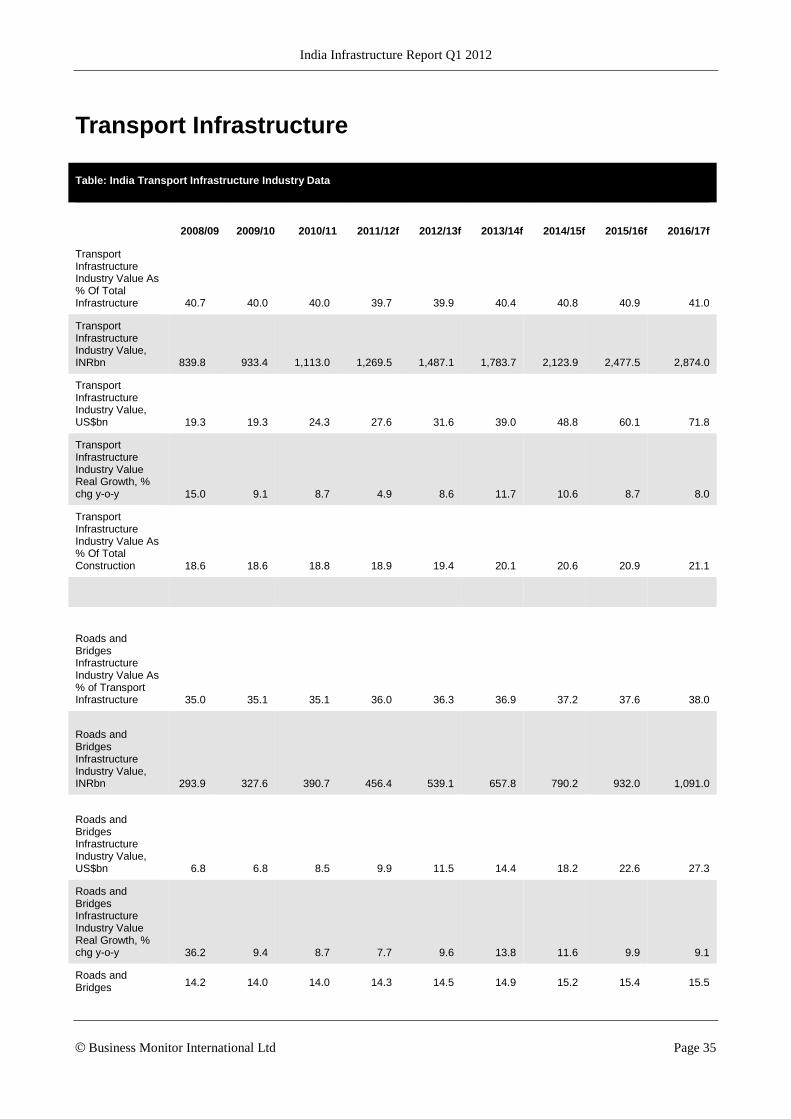
India Infrastructure Report Q1 2012
© Business Monitor International Ltd Page 35
Transport Infrastructure
Table: India Transport Infrastructure Industry Data
2008/09 2009/10 2010/11 2011/12f 2012/13f 2013/14f 2014/15f 2015/16f 2016/17f
Transport Infrastructure Industry Value As % Of Total Infrastructure 40.7 40.0 40.0 39.7 39.9 40.4 40.8 40.9 41.0
Transport Infrastructure Industry Value, INRbn 839.8 933.4 1,113.0 1,269.5 1,487.1 1,783.7 2,123.9 2,477.5 2,874.0
Transport Infrastructure Industry Value, US$bn 19.3 19.3 24.3 27.6 31.6 39.0 48.8 60.1 71.8
Transport Infrastructure Industry Value Real Growth, % chg y-o-y 15.0 9.1 8.7 4.9 8.6 11.7 10.6 8.7 8.0
Transport Infrastructure Industry Value As % Of Total Construction 18.6 18.6 18.8 18.9 19.4 20.1 20.6 20.9 21.1
Roads and Bridges Infrastructure Industry Value As % of Transport Infrastructure 35.0 35.1 35.1 36.0 36.3 36.9 37.2 37.6 38.0
Roads and Bridges Infrastructure Industry Value, INRbn 293.9 327.6 390.7 456.4 539.1 657.8 790.2 932.0 1,091.0
Roads and Bridges Infrastructure Industry Value, US$bn 6.8 6.8 8.5 9.9 11.5 14.4 18.2 22.6 27.3
Roads and Bridges Infrastructure Industry Value Real Growth, % chg y-o-y 36.2 9.4 8.7 7.7 9.6 13.8 11.6 9.9 9.1
Roads and Bridges 14.2 14.0 14.0 14.3 14.5 14.9 15.2 15.4 15.5
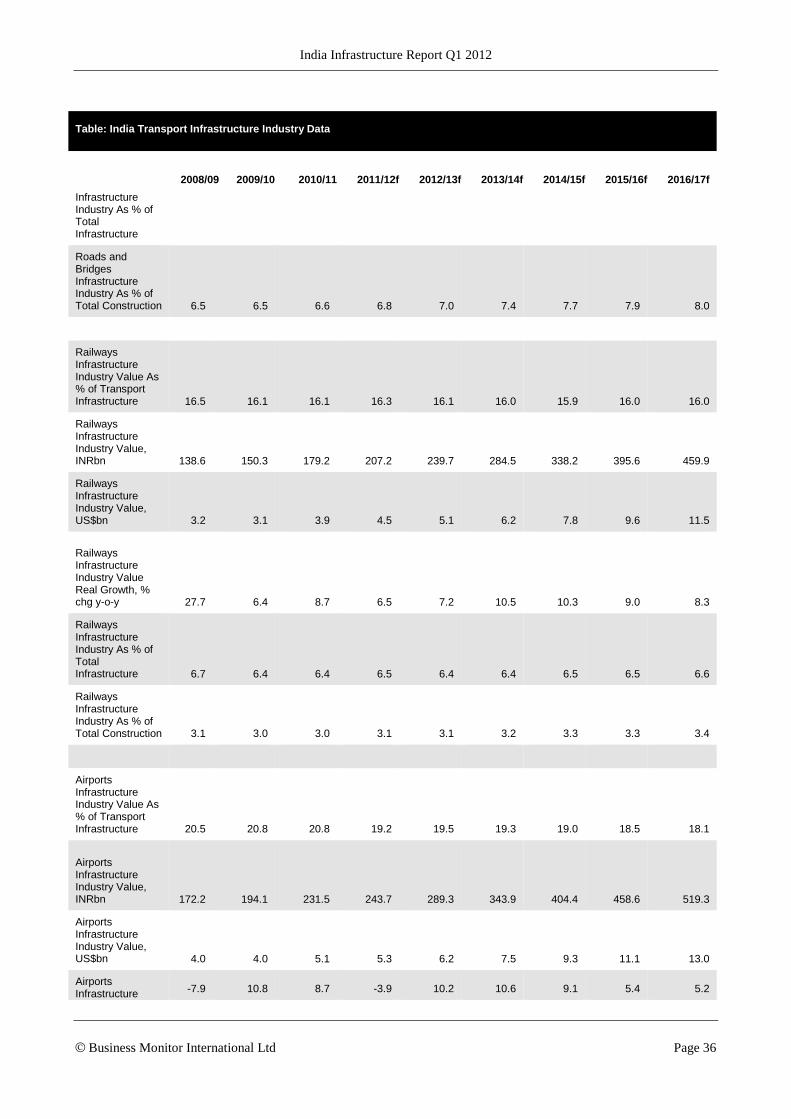
India Infrastructure Report Q1 2012
© Business Monitor International Ltd Page 36
Table: India Transport Infrastructure Industry Data
2008/09 2009/10 2010/11 2011/12f 2012/13f 2013/14f 2014/15f 2015/16f 2016/17f
Infrastructure Industry As % of Total Infrastructure
Roads and Bridges Infrastructure Industry As % of Total Construction 6.5 6.5 6.6 6.8 7.0 7.4 7.7 7.9 8.0
Railways Infrastructure Industry Value As % of Transport Infrastructure 16.5 16.1 16.1 16.3 16.1 16.0 15.9 16.0 16.0
Railways Infrastructure Industry Value, INRbn 138.6 150.3 179.2 207.2 239.7 284.5 338.2 395.6 459.9
Railways Infrastructure Industry Value, US$bn 3.2 3.1 3.9 4.5 5.1 6.2 7.8 9.6 11.5
Railways Infrastructure Industry Value Real Growth, % chg y-o-y 27.7 6.4 8.7 6.5 7.2 10.5 10.3 9.0 8.3
Railways Infrastructure Industry As % of Total Infrastructure 6.7 6.4 6.4 6.5 6.4 6.4 6.5 6.5 6.6
Railways Infrastructure Industry As % of Total Construction 3.1 3.0 3.0 3.1 3.1 3.2 3.3 3.3 3.4
Airports Infrastructure Industry Value As % of Transport Infrastructure 20.5 20.8 20.8 19.2 19.5 19.3 19.0 18.5 18.1
Airports Infrastructure Industry Value, INRbn 172.2 194.1 231.5 243.7 289.3 343.9 404.4 458.6 519.3
Airports Infrastructure Industry Value, US$bn 4.0 4.0 5.1 5.3 6.2 7.5 9.3 11.1 13.0
Airports Infrastructure -7.9 10.8 8.7 -3.9 10.2 10.6 9.1 5.4 5.2
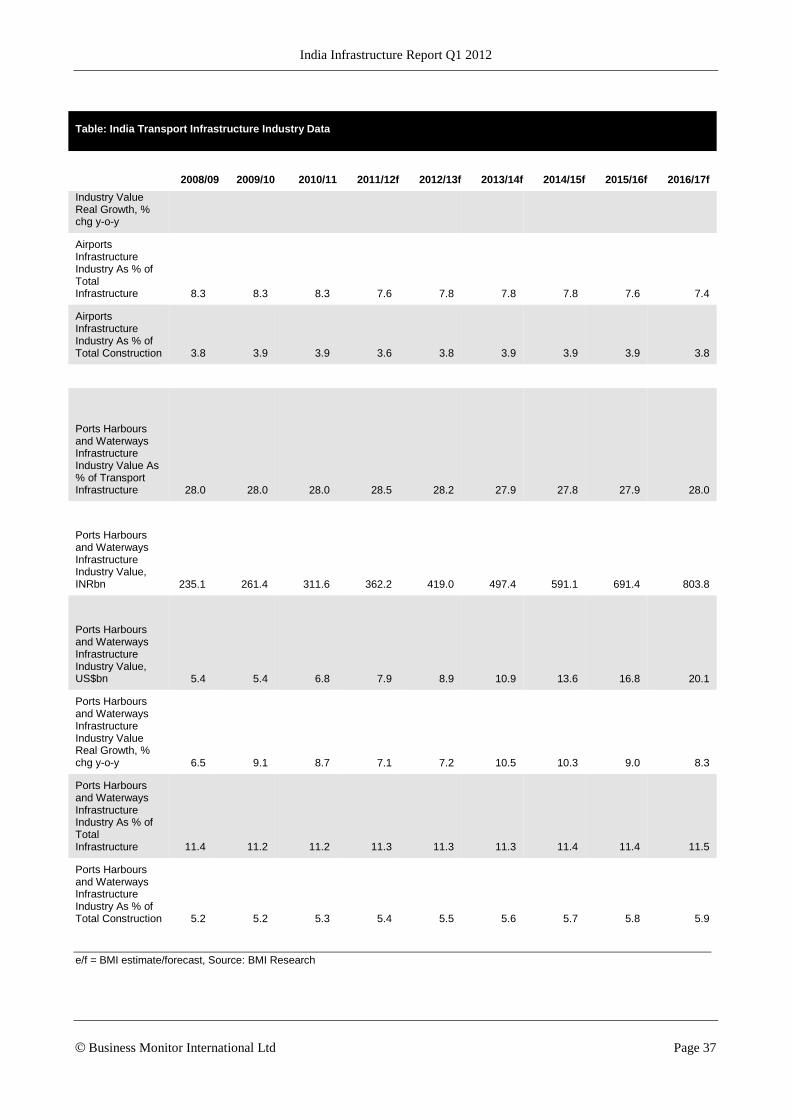
India Infrastructure Report Q1 2012
© Business Monitor International Ltd Page 37
Table: India Transport Infrastructure Industry Data
2008/09 2009/10 2010/11 2011/12f 2012/13f 2013/14f 2014/15f 2015/16f 2016/17f
Industry Value Real Growth, % chg y-o-y
Airports Infrastructure Industry As % of Total Infrastructure 8.3 8.3 8.3 7.6 7.8 7.8 7.8 7.6 7.4
Airports Infrastructure Industry As % of Total Construction 3.8 3.9 3.9 3.6 3.8 3.9 3.9 3.9 3.8
Ports Harbours and Waterways Infrastructure Industry Value As % of Transport Infrastructure 28.0 28.0 28.0 28.5 28.2 27.9 27.8 27.9 28.0
Ports Harbours and Waterways Infrastructure Industry Value, INRbn 235.1 261.4 311.6 362.2 419.0 497.4 591.1 691.4 803.8
Ports Harbours and Waterways Infrastructure Industry Value, US$bn 5.4 5.4 6.8 7.9 8.9 10.9 13.6 16.8 20.1
Ports Harbours and Waterways Infrastructure Industry Value Real Growth, % chg y-o-y 6.5 9.1 8.7 7.1 7.2 10.5 10.3 9.0 8.3
Ports Harbours and Waterways Infrastructure Industry As % of Total Infrastructure 11.4 11.2 11.2 11.3 11.3 11.3 11.4 11.4 11.5
Ports Harbours and Waterways Infrastructure Industry As % of Total Construction 5.2 5.2 5.3 5.4 5.5 5.6 5.7 5.8 5.9
e/f = BMI estimate/forecast, Source: BMI Research
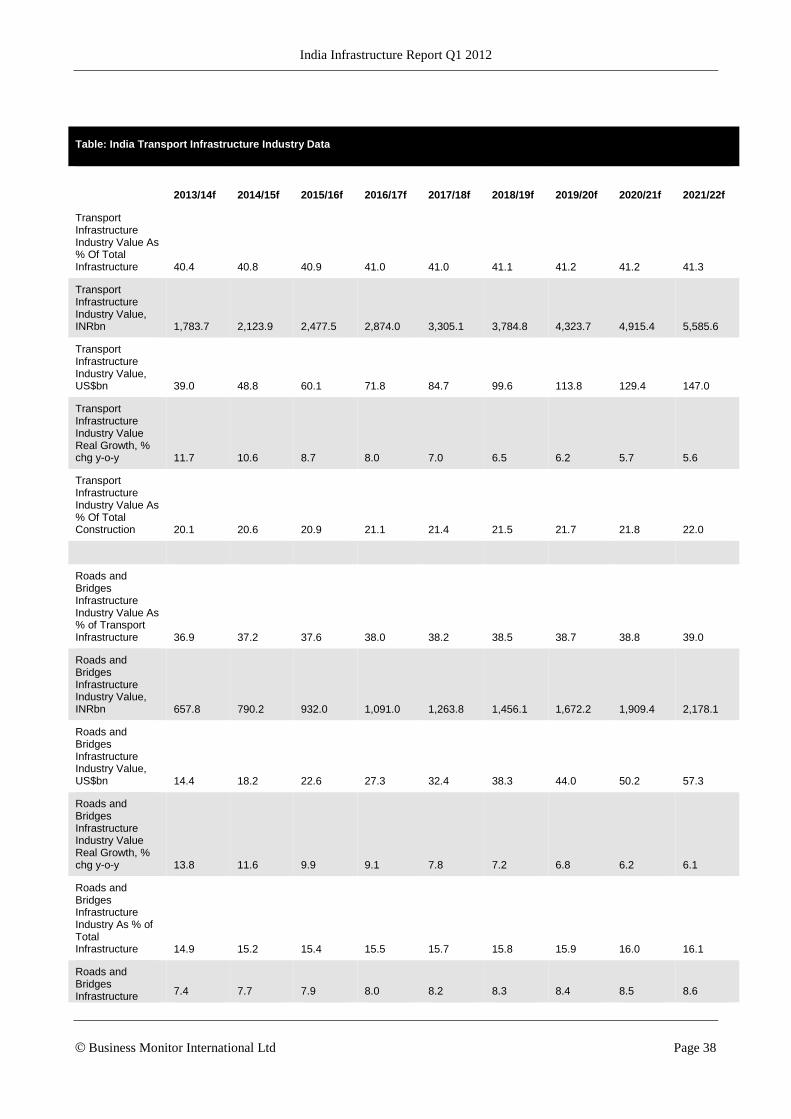
India Infrastructure Report Q1 2012
© Business Monitor International Ltd Page 38
Table: India Transport Infrastructure Industry Data
2013/14f 2014/15f 2015/16f 2016/17f 2017/18f 2018/19f 2019/20f 2020/21f 2021/22f
Transport Infrastructure Industry Value As % Of Total Infrastructure 40.4 40.8 40.9 41.0 41.0 41.1 41.2 41.2 41.3
Transport Infrastructure Industry Value, INRbn 1,783.7 2,123.9 2,477.5 2,874.0 3,305.1 3,784.8 4,323.7 4,915.4 5,585.6
Transport Infrastructure Industry Value, US$bn 39.0 48.8 60.1 71.8 84.7 99.6 113.8 129.4 147.0
Transport Infrastructure Industry Value Real Growth, % chg y-o-y 11.7 10.6 8.7 8.0 7.0 6.5 6.2 5.7 5.6
Transport Infrastructure Industry Value As % Of Total Construction 20.1 20.6 20.9 21.1 21.4 21.5 21.7 21.8 22.0
Roads and Bridges Infrastructure Industry Value As % of Transport Infrastructure 36.9 37.2 37.6 38.0 38.2 38.5 38.7 38.8 39.0
Roads and Bridges Infrastructure Industry Value, INRbn 657.8 790.2 932.0 1,091.0 1,263.8 1,456.1 1,672.2 1,909.4 2,178.1
Roads and Bridges Infrastructure Industry Value, US$bn 14.4 18.2 22.6 27.3 32.4 38.3 44.0 50.2 57.3
Roads and Bridges Infrastructure Industry Value Real Growth, % chg y-o-y 13.8 11.6 9.9 9.1 7.8 7.2 6.8 6.2 6.1
Roads and Bridges Infrastructure Industry As % of Total Infrastructure 14.9 15.2 15.4 15.5 15.7 15.8 15.9 16.0 16.1
Roads and Bridges Infrastructure 7.4 7.7 7.9 8.0 8.2 8.3 8.4 8.5 8.6
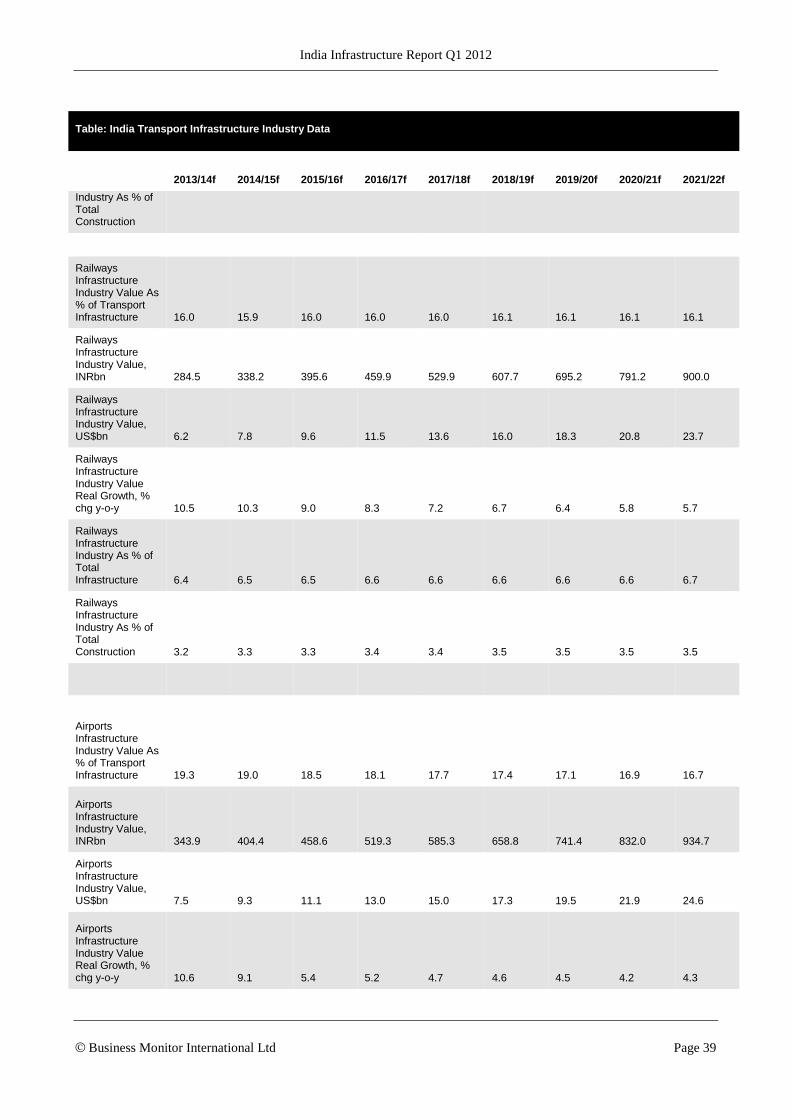
India Infrastructure Report Q1 2012
© Business Monitor International Ltd Page 39
Table: India Transport Infrastructure Industry Data
2013/14f 2014/15f 2015/16f 2016/17f 2017/18f 2018/19f 2019/20f 2020/21f 2021/22f
Industry As % of Total Construction
Railways Infrastructure Industry Value As % of Transport Infrastructure 16.0 15.9 16.0 16.0 16.0 16.1 16.1 16.1 16.1
Railways Infrastructure Industry Value, INRbn 284.5 338.2 395.6 459.9 529.9 607.7 695.2 791.2 900.0
Railways Infrastructure Industry Value, US$bn 6.2 7.8 9.6 11.5 13.6 16.0 18.3 20.8 23.7
Railways Infrastructure Industry Value Real Growth, % chg y-o-y 10.5 10.3 9.0 8.3 7.2 6.7 6.4 5.8 5.7
Railways Infrastructure Industry As % of Total Infrastructure 6.4 6.5 6.5 6.6 6.6 6.6 6.6 6.6 6.7
Railways Infrastructure Industry As % of Total Construction 3.2 3.3 3.3 3.4 3.4 3.5 3.5 3.5 3.5
Airports Infrastructure Industry Value As % of Transport Infrastructure 19.3 19.0 18.5 18.1 17.7 17.4 17.1 16.9 16.7
Airports Infrastructure Industry Value, INRbn 343.9 404.4 458.6 519.3 585.3 658.8 741.4 832.0 934.7
Airports Infrastructure Industry Value, US$bn 7.5 9.3 11.1 13.0 15.0 17.3 19.5 21.9 24.6
Airports Infrastructure Industry Value Real Growth, % chg y-o-y 10.6 9.1 5.4 5.2 4.7 4.6 4.5 4.2 4.3

India Infrastructure Report Q1 2012
© Business Monitor International Ltd Page 40
Table: India Transport Infrastructure Industry Data
2013/14f 2014/15f 2015/16f 2016/17f 2017/18f 2018/19f 2019/20f 2020/21f 2021/22f
Airports Infrastructure Industry As % of Total Infrastructure 7.8 7.8 7.6 7.4 7.3 7.2 7.1 7.0 6.9
Airports Infrastructure Industry As % of Total Construction 3.9 3.9 3.9 3.8 3.8 3.8 3.7 3.7 3.7
Ports Harbours and Waterways Infrastructure Industry Value As % of Transport Infrastructure 27.9 27.8 27.9 28.0 28.0 28.1 28.1 28.1 28.2
Ports Harbours and Waterways Infrastructure Industry Value, HKDbn 497.4 591.1 691.4 803.8 926.1 1,062.1 1,214.9 1,382.7 1,572.7
Ports Harbours and Waterways Infrastructure Industry Value, US$bn 10.9 13.6 16.8 20.1 23.7 27.9 32.0 36.4 41.4
Ports Harbours and Waterways Infrastructure Industry Value Real Growth, % chg y-o-y 10.5 10.3 9.0 8.3 7.2 6.7 6.4 5.8 5.7
Ports Harbours and Waterways Infrastructure Industry As % of Total Infrastructure 11.3 11.4 11.4 11.5 11.5 11.5 11.6 11.6 11.6
Ports Harbours and Waterways Infrastructure Industry As % of Total Construction 5.6 5.7 5.8 5.9 6.0 6.0 6.1 6.1 6.2
e/f = BMI estimate/forecast, Source: BMI Research
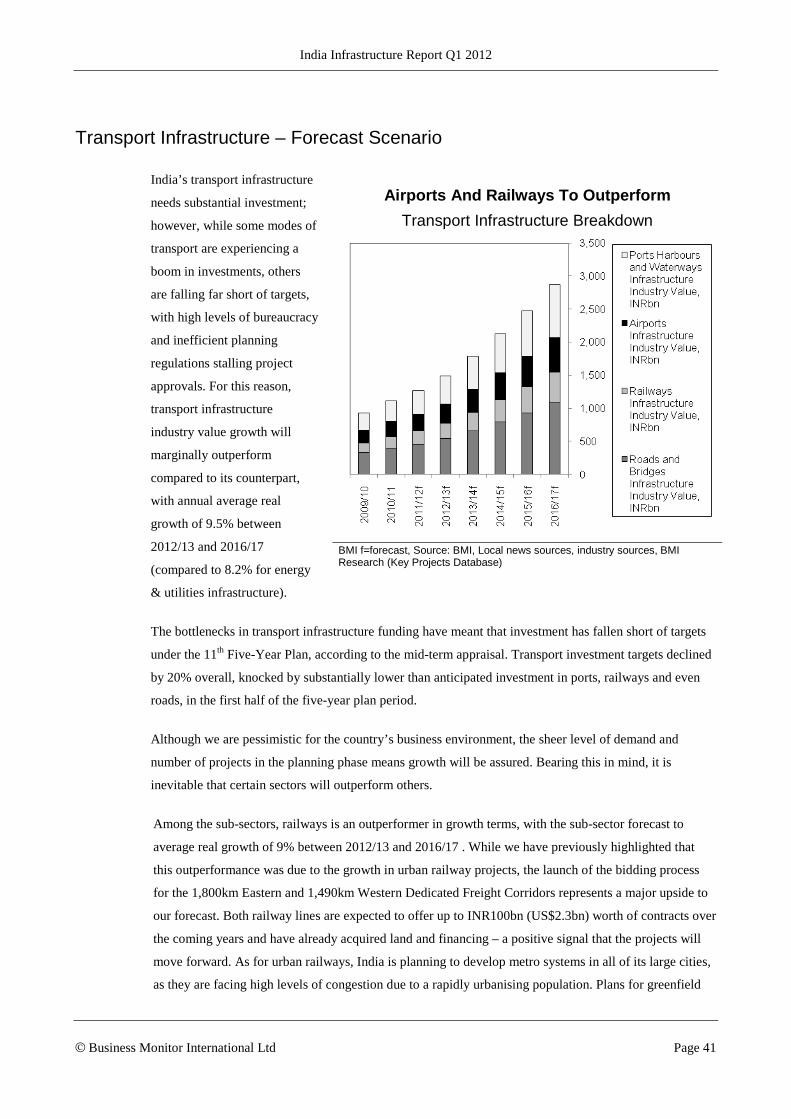
India Infrastructure Report Q1 2012
© Business Monitor International Ltd Page 41
Transport Infrastructure – Forecast Scenario
India’s transport infrastructure
needs substantial investment;
however, while some modes of
transport are experiencing a
boom in investments, others
are falling far short of targets,
with high levels of bureaucracy
and inefficient planning
regulations stalling project
approvals. For this reason,
transport infrastructure
industry value growth will
marginally outperform
compared to its counterpart,
with annual average real
growth of 9.5% between
2012/13 and 2016/17
(compared to 8.2% for energy
& utilities infrastructure).
The bottlenecks in transport infrastructure funding have meant that investment has fallen short of targets
under the 11th Five-Year Plan, according to the mid-term appraisal. Transport investment targets declined
by 20% overall, knocked by substantially lower than anticipated investment in ports, railways and even
roads, in the first half of the five-year plan period.
Although we are pessimistic for the country’s business environment, the sheer level of demand and
number of projects in the planning phase means growth will be assured. Bearing this in mind, it is
inevitable that certain sectors will outperform others.
Among the sub-sectors, railways is an outperformer in growth terms, with the sub-sector forecast to
average real growth of 9% between 2012/13 and 2016/17 . While we have previously highlighted that
this outperformance was due to the growth in urban railway projects, the launch of the bidding process
for the 1,800km Eastern and 1,490km Western Dedicated Freight Corridors represents a major upside to
our forecast. Both railway lines are expected to offer up to INR100bn (US$2.3bn) worth of contracts over
the coming years and have already acquired land and financing – a positive signal that the projects will
move forward. As for urban railways, India is planning to develop metro systems in all of its large cities,
as they are facing high levels of congestion due to a rapidly urbanising population. Plans for greenfield
Airports And Railways To Outperform
Transport Infrastructure Breakdown
BMI f=forecast, Source: BMI, Local news sources, industry sources, BMI Research (Key Projects Database)
India Infrastructure Report Q1 2012
© Business Monitor International Ltd Page 42
and brownfield urban railway projects are moving forward in cities like Mumbai, Delhi, Bangalore,
Chennai and Hyderabad.
Roads on the other hand, which account for the largest portion of transport infrastructure industry value
and have received the greatest attention in investment plans, are likely to fall short of targets. The sub-
sector has been most afflicted by poor project execution issue, and in December 2010, only 10 out of 145
road projects in India were on schedule, while around 135 projects were delayed or faced additional
delays, according to MOSPI. Nevertheless, given the sheer pipeline of projects and robust interest from
foreign participation, the roads sector retains significant growth potential. We are forecasting real growth
for the sector to average 10.8% per annum between 2012/13 and 2016/7.
Ports, harbours and waterway infrastructure industry value accounts for the second-largest share of
transport infrastructure value – 28.2% – equal to INR419bn (US$8.9bn) in 2012/13. Despite undeniable
opportunities in India’s port sector, bureaucratic inconsistencies and issues with competitiveness are
presenting a number of deep-rooted obstacles in the country’s port sector. This has meant the sector has
failed to unlock or live-up to potential. Although projects are being delayed, a number of investments are
going ahead and this will eventually translated into industry value, albeit at a slower pace than its
potential would suggest.
While the airports sub-sector is expected to see negative growth in 2011/12, we believe that there is
significant potential for further upside. This is driven by a strong project pipeline for both regional and
international airports, and investor confidence in India’s aviation sector. Airports were one of the few
sectors to have investment targets revised upwards following the mid-term appraisal of the 11th Five-
Year Plan (2007/08 - 2010/11), up from INR310bn (US$6.8bn) to INR361bn (US$7.9bn). This is a clear
indication that funding is flowing into the sector, perhaps due to better planning procedures, but also
because of the private sector’s willingness to invest. We are forecasting real growth for the airport sector
to average 8.1% per annum between 2012/13 and 2016/17.

India Infrastructure Report Q1 2012
© Business Monitor International Ltd Page 43
Transport Infrastructure Overview
India’s transport infrastructure must cater for a booming population, a growing economy and a
demanding import and export sector. India’s population is expected to expand rapidly over BMI’s
medium-term forecast period, from an estimated 1.26bn in 20121/13 to 1.32bn by 2016/17. The country’s
economy is also expanding rapidly, with average real growth of 7.7% y-o-y between 2012/13 and
2016/17 forecast.
Table: Competitiveness Of India's Infrastructure
Rank/133 in 2009/10* Rank/139 in 2010/11** Rank/142 in 2011/12***
Quality of Roads 89 90 85
Quality of Railroad Infrastructure 20 23 24
Quality of Port Infrastructure 90 83 82
Quality of Air Transport Infrastructure 65 71 67
Quality of Overall Infrastructure 89 91 86
*Rank out of 133 countries in 2009/10. ** Rank out of 139 countries in 2010/11. *** Rank out of 142 countries in 2011/12. Source: World Economic Forum, Global Competitiveness Report 2009/10, 2010/11 and 2011/12
Roads
India boasts the third-largest road network in the world after the US and China, with a total of
3,320,410km of roadways, of which 1,517,000km (45%) is paved. The majority of the country’s freight is
transported by road, with around 65% of total cargo carried via this method.
India still has a relatively low vehicle density (2.5 vehicles per km²) compared with other developing
countries (4.06 in Brazil) and with developed economies (46.5 in the US, 101.4 in the UK). However, the
vehicle fleet circulates in tightly defined high-density corridors. Roughly one-quarter of state and national
highways are heavily congested. Partly as a result of this, average truck and bus speeds are only 30-40km
per hour (km/h), in comparison with more developed countries, where they could be expected to be
double that level.
In some respects, India's road network is better than China's, a country of similar population and larger
size; this is due to India having a larger road network. Geographic coverage of India's road network, at
0.66km of highway per km2, is comparable to that of the US (0.65) and four times greater than China's
(0.16). On the other hand, many of China's highways were built in the last 10 years and consist of modern
four- to six-lane expressways linking major cities.

India Infrastructure Report Q1 2012
© Business Monitor International Ltd Page 44
India, in contrast, has few direct links between key cities and most of its highways have two lanes or
fewer. Additionally, there is widespread overloading of older rigid two-axle trucks, which leads to
significant road damage. India also has a poor road safety record, with an average of 75,000 deaths on the
road every year. It can take four to five days for a truck to travel from Delhi to Kolkata, a distance of
1,500km, and about a quarter of the total travel time will be spent at state border checkpoints. A modern
expressway system is clearly needed.
Aware of this deficiency in the highway
system, the government has been
supporting the construction of roads, and
India's road building plan has been one of
the flagship aspects of the country's road
map for infrastructure. The 20km target
has been one of the most oft-cited when
illustrating the potential opportunities in
India's infrastructure sector. In July 2009,
the previous Minister for Road Transport
and Highways, Kamal Nath, aimed to
build 20km of roads per day, but failed to
hit the much-touted target, which had to
be lowered to 12-13km per day, substantiating our earlier fears that the private sector will not participate
to the level required. Issues with land clearance, the complexity of regulations, the high level of
bureaucracy and the collection of toll revenues have deterred potential investors, despite the government
allowing 100% foreign direct investment (FDI) in the sector. Although targets are being downgraded, the
scale of infrastructure development is still considerable, relative to other emerging markets. Building 12-
13km of roads per day is still a sizeable target, which, if achieved, will drive growth in industry value
over our forecast period.
This target looks increasingly unlikely to be met, as the sub-sector continues to be heavily affected by
poor project execution issues. In December 2010, only 10 out of 145 road projects in India were on
schedule, while around 135 projects were delayed or faced additional delays, according to MOSPI. This
problem of projects delays was highlighted by a top official at the National Highways Authority of India,
J.N Singh, where in June 2011, he stated (cited from the Economic Times) that around 20-25% of current
road projects under construction have been delayed by months or years, often due to land acquisition
problems.
The government has, however, made attempts to resolve these execution issues. On May 5 2011, an
empowered group of Indian ministers (EGOM) decided that 95% of roads projects in 2011 should be
awarded through a build-operate-transfer (BOT) model, rather than on an engineering, procurement and
Investment Into Roads And Highways Under 11th Five-Year Plan
0
100
200
300
400
500
600
700
800
900
2007/8 2008/9 2009/10 2010/11 2011/12
Source: Planning Commission

India Infrastructure Report Q1 2012
© Business Monitor International Ltd Page 45
construction (EPC) basis (these contracts will now be limited to just 5% of all road projects). They
believe that the BOT model will incentivise companies to complete road projects quickly and efficiently,
and then encourage them to maintain the roads – keeping them in pristine condition – once they are
finished. Furthermore, the move will reduce the expense to the Indian government, as private investors
will be expected to generate their returns through a self-funding toll road system.
The announcement comes after a number of measures have already been implemented to improve the
tendering process in the road sector. On May 3 2011, India's Transport Minister CP Joshi announced that
from January 1 2012, the Ministry would use an e-tendering process to introduce greater transparency. .
The Ministry has also introduced an annual pre-qualification process for project bidders to speed up the
tendering process and reduce delays to road projects, while tweaking the building contract rules to give
more flexibility to companies wishing to sell their project to another developer. The Road Ministry has
also set monthly targets for road construction works to ensure greater accountability.Previously, the
ministry, under Joshi's predecessor Kamal Nath, only reviewed the status of projects using yearly targets
– a strategy that may have potentially contributed to project delays. Projects will now be monitored
through the use of satellite imagery, according to Joshi.
Consequently, we believe improved transparency will send out a positive signal, which will attract private
investors – particularly foreign private equity funds – and encourage investment in road projects, under a
private-public partnership (PPP) framework. The National Highways Authority of India (NHAI) plans to
award 59 road contracts, with a combined length of 7994km and a total cost of INR600bn in 2011/12,
thus reaching its previously unattained goal of constructing 20km of roads per day. We expect the bulk of
these projects to be BOT projects, with 60% of them to be toll-based and 30% to be paid by the
government through annuity payments. Over the 12th Five-Year Plan (2012-17), the Ministry is looking to
invest over INR2.64trn in the highways sector, with INR1.77trn (65%) to come from the private sector.
This will aid India in reaching its target of 35,000 new roads by 2014.This plan to aggressively expand
India’s roads was reiterated by the government, where, in October 2011, it launched an INR166bn
(US$3.35bn) highways building plan under the National Highways Development Programme, reports
News Resources International. The plan covers the construction of six-lane highways totalling 6,500km,
four-lane highways totalling 24,700km and the expansion of other highways. The programme is to be
funded through PPPs. The government has since approved four expressway construction projects in late-
October 2011, reports News Resources International. The construction projects comprise the Vadodara-
Mumbai, Delhi-Meerut, Bangalore-Chennai, and Kolkata-Dhanbad expressways. PPPs are to be used to
raise funding.
The country’s PPP Appraisal Committee (PPPAC) has also approved several road projects. In August
2011, the PPPAC approved 10 roadworks projects, worth a total of US$1.1bn, according to INFRAnews.
The proposals approved include two-laning the road connecting Bikaner to Suratgarh and four-laning the
road between Vijayawada and Machlipatnam, on a BOT basis. In September 2011, the PPPAC approved
five road and highway infrastructure projects, worth a total of INR70bn (US$1.41bn). The road projects,

India Infrastructure Report Q1 2012
© Business Monitor International Ltd Page 46
which have secured approval, encompassed the Agra-Etawah, Rampur-Kathgodam and Raipur-Bilaspur
highway projects. The PPP Approval Committee, chaired by Economic Affairs Secretary R Gopalan, has
also directed the relevant ministries and departments to update status reports on various PPP
infrastructure projects that were approved by the panel in earlier sittings.
A key road project tendered in 2011 is the 555.5km Ahmedabad-Udaipur-Kishangarh expressway-
widening project, a key part of the Golden Quadrilateral, a 5,846km expressway network that links India's
four largest cities – Delhi, Mumbai, Chennai and Kolkata. In July 2011, GMR won the contract to
construct the road-widening project, which will stretch from the city of Kishangarah in Rajasthan to the
city of Ahmedabad in Gujarat via the city of Udaipar. It will be completed through a PPP and is estimated
to cost around INR57bn (US$1.26bn). More than 40,000 vehicles are believed to travel on this section,
making the 26-year concession a lucrative one for the successful bidder, according to the Economic
Times. The Ahmedabad-Udaipur-Kishangarh expressway-widening project is the single-largest highway
project released so far by NHAI, both in terms of value and length, and is the first of nine such planned
highway projects.
This strong project pipeline is positive for the sector, as overseas private funds continue to show a great
appetite for investing in India’s roads. In May 2011, Spanish-based Isolux Corsan and Morgan Stanley
Infrastructure formed a US$400mn joint venture (JV) to target road projects in India. Both parties will
invest US$200mn and Isolux will incorporate three of its previous BOT road concessions, worth a
combined US$1.6bn. The three projects have secured financing and are expected to be completed in
2012/13, with an 18 to 30-year concession period. In June 2011, Indian financial services firm
Infrastructure Development Finance Company (IDFC) and Malaysian state investment company
Khazanah announced that they were set to form an infrastructure development JV, with an emphasis on
road projects in India. The JV's first investment will be in Jetpur Somnath Tollways , a special purpose
vehicle (SPV) that holds the concession to add four lanes to the Jetpur-Somnath section of the National
Highway-8D in Gujarat.
Ports
A major element of transport infrastructure within India – and an area that is expected to grow
considerably – is India’s ports. The country has 13 major ports and 187 minor ports along its extensive
coastlines. The 13 major ports account for about 67% of the country's external sea trade and 569.9mn
tonnes of cargo for the year ending March 2011.
The most important ports are located at Chennai (Madras), Kochi (Cochin), Jawaharal Nehru, Kandla,
Kolkata (Calcutta), Mumbai (Bombay), Sikka and Vishakhapatnam. The major ports are operated by port
trusts set up by central governments, while the minor ports tend to be operated by state authorities.
Efficiency levels at Indian ports are relatively low. While the total number of berths appears to be
adequate to deal with current cargo turnover, the use of mechanised equipment for loading and unloading

India Infrastructure Report Q1 2012
© Business Monitor International Ltd Page 47
operations is limited, meaning that turnaround times are quite high and handling costs for general cargo
and for containers are also high.
India's rapidly expanding trade requirements are expected to put immense strain on the country's existing
port infrastructure, with India's Planning Commission predicting tonnage throughput at 12 major ports to
double to 1bn tonnes by 2012, according to Bloomberg. Meanwhile, India's largest government-
controlled east- and west-coast container ports, Kolkata and Jawarhalal Nehru - which serves Mumbai -
have experienced congestion in recent weeks. This congestion puts India's businesses at a disadvantage
compared with regional competitors in countries such as China. M Unnikrishnan, Managing Director of
Thermax, a power-equipment maker, is quoted by Bloomberg as saying: 'It takes 45 days transportation
for incoming cargo for me and a similar time when I send it to my customers overseas. The Chinese can
possibly do it in seven days.'
The private sector is being targeted to provide much of this investment, and in June 2011, the government
announced plans to award contracts for 24 projects across the country, with a combined capacity of
232mn tonnes per annum. According to Bloomberg, India is aiming to invest US$60bn into its ports by
2020 as part of Prime Minister Manmohan Singh's wider US$1tn investment in the country's choked
transport and power networks. The aim is that the investment will help India's ports' handling capability
grow from 963mn tonnes in 2010 to 3.1bn tonnes in 2020.
Despite undeniable opportunities in India’s port sector, bureaucratic inconsistencies and issues related to
competitiveness are presenting a number of deep-rooted obstacles in the country’s port sector. In late
2009, two container terminal auctions were dropped, both of which had encountered problems with
companies that were dissatisfied with the reasons given for their ejection from the tender process and
subsequently took the respective port trusts to court.
Issues related to competitiveness arose again in 2011, with regard to a 30-year concession to develop the
fourth container terminal at the Jawaharlal Nehru Port, India's largest port in terms of box throughput.
The INR67bn (US$1.5bn) BOT project, which is managed by the Jawaharlal Nehru Port Trust (JNPT),
originally received government go-ahead in January 2010, but has since suffered numerous delays due to
a number of legal hurdles.
The project first faced a legal challenge mounted by the world's third-largest container terminal operator,
APM Terminals (APMT), which sought to be allowed to bid for the project – the company was initially
barred as it already operates a terminal at the port. Although APMT was finally allowed to bid in May
2011, it announced in June that it was pulling out of the process. It has since announced that once it was
qualified to bid and allowed to see the tender documents, it became apparent to the company that the
fourth terminal would be 'financially unviable'.
Following the APMT saga, the project faced another legal challenge, when the Adani Group, the
operator of the port of Mundra, was also excluded from the initial bidding for undisclosed security

India Infrastructure Report Q1 2012
© Business Monitor International Ltd Page 48
reasons. The company, through the Mundra Port Special Economic Zone (MPSEZ) company, is
challenging this in the courts. A petition against the decision could have significantly delayed the project
as the validity of the existing bids from five different parties was due to expire on June 30 2011.
However, not wishing to lose any more time, the JNPT went to the Mumbai High Court, seeking to open
the bids early. As the MPSEZ was not the highest bidder, it is now seeking permission to award the
contract to ABG and PSA.
Another example which highlights the problems in India ports sector is the exclusion of certain countries
from bidding on projects based on national security concerns. Since 1997, Chinese firms, or groups with
Chinese connections, have been banned from participating in Indian port projects, according to Mint. In
February 2009, Mint reported that firms from the UAE had also been banned. However, according to
Mint, this regulation is enforced inconsistently, as some companies are allowed to participate and others
are not. In addition, certain ports such as the proposed Vizhinjam International Seaport and Container
Transhipment Terminal are subjected to India's strict cabotage rules, which only allow domestic shipping
companies to operate along the country's coastline.
A further threat to India's port sector comes from bureaucratic inconsistency. In August 2009, India's
Ministry of Environment and Forestry imposed a three-month moratorium on proposals for new ports and
harbours unless they were expansions of existing projects. The moratorium is in place until the ministry
develops a policy for assessing the impact of new port projects on the country's coastline. However, at the
same time, the Shipping Ministry is pushing to get clearance for port projects, and the Finance Ministry
has requested that it stick to the original model concession agreement for ports, according to the
Economic Times.
Another issue that is dampening investor interest in the sector is the lack of sophistication in its policy
framework. In June 2011, India's Planning Commission and Shipping Ministry started talks to revise the
model concession agreement (MCA) for PPPs in port projects, as the framework, which was originally
based on the MCA for the roads sector, was found to be unfeasible and unattractive to investors. The
dialogue to alter the PPP policy for port projects comes after private investors pulled out of a project to
build a new container terminal at the Mangalore Port. As a result, the New Mangalore Port Trust, the
corporate entity in charge of the project, will have to finance and implement the civil infrastructure for the
terminal through public funds, which is contrary to the government's original plan to use the PPP model
for all new port projects. According to India's Shipping Secretary, K Mohandas, the Mangalore port
project was affected by 'unrealistic tariff structures' fixed by the Tariff Authority for Major Ports. He
latter stated that only 'minor changes' have been proposed to the MCA and it is unlikely to lead to a
complete overhaul of the policy.
The port sector also faces stiff financing practices implemented by the banks due to substantial risks.
According to the joint secretary in India's Shipping Ministry, loans made to port projects typically have a
clause that allow banks to revise interest rates after the first two years, thus creating significant financial

India Infrastructure Report Q1 2012
© Business Monitor International Ltd Page 49
risks for investors as port projects typically take years to be implemented. Port projects or project
developers are also unable to get a credit rating for the first few years of the project, which results in a
penalty of an additional 1% of interest to be paid for loans. Lastly, unlike roads, port projects don't get
any viability gap funding from the government, thus private developers need to raise the initial capital
expenditure for the project on their own.
In October 2011, it was reported by the Economic Times that the union government's proposal to come
out with the Indian Ports Bill for replacing the existent Indian Port Act, 1908 and the Major Port Trusts
Act, 1963 in order to corporatise the port sector, faced opposition from various stakeholders, including
maritime states. The maritime states are concerned that the Bill would not only curtail the state's right
over the ports under their territorial limits, but also adversely affect the port and fishing development
activities.
While these issues do not detract from the opportunities in India’s port sector, they highlight that
investors should be aware of the risks related to India's immature PPP framework and the inconsistencies
associated with bureaucracy and legal regulations.
The Indian government is also looking to attract more cruise ships to Indian ports. In October 2011, it was
reported by the Economic Times that the Ministry of Shipping has set up a steering committee to looking
into this issue. The Ministry has identified five ports – Mumbai, Mangalore, Kochi, Chennai and
Tuticorin – as potential cruise ship destinations, and are working on plans to attract investments to
improve the facilities in these ports. However, one key stumbling block is the high port charges for
passenger ships, where, according to Anand Sharma, Director at Mantrana Maritime Advisory, port
charges for passenger ships are very high because they have a higher tonnage as compared with other
vessels. The India government had set a target of 1mn cruise passenger landings for 2010, but local media
sources state that almost no landings took place, according to PortWorld.
Railways
India has railways totalling a length of 64,015km, of which approximately 82% is broad gauge
(52,808km). About 28% of the total railway system is electrified. India has the world’s fourth-largest rail
network after the US, Russia and China, and the second-largest under single management.
India’s railway sector has suffered from underinvestment (only around 6,500 miles of new track were laid
in over 50 years) and the Ministry has a poor track record of completing projects on time and within
budget. According to figures (December 2010) from India's Ministry of Statistics and Programme
Implementation, 24 railway projects are proceeding on schedule, while 26 projects are delayed. At the
same time, 85 out of 147 railway projects suffer from cost overruns.
There is, however, positive news for the sector, with the Indian Ministry of Railways having announced
in June 2011 that it planned to conduct the sale of INR100bn (US$2.2bn) of tax-free bonds in India. This
was due to occur by September 2011, and it is hoped that the move that could go a long way towards

India Infrastructure Report Q1 2012
© Business Monitor International Ltd Page 50
addressing the perennial problem of financing in the railway sector. The offering will be conducted by the
Ministry's financing arm, Indian Railway Finance Corporation (IRFC), and will be divided between a
private placement and a subsequent tranche for retail investors. The funds raised from the sale will be
used to expand and modernise India's railway network, with some of the expenditure plans including
INR53bn (US$1.2bn) to be spent on new railway lines, INR21bn (US$468mn) on widening tracks and
INR8.5bn (US$189mn) on railway electrification.
Meanwhile, multilateral financial institutions have shown an interest in helping India to develop its
railway network. In September 2011, the Asian Development Bank (ADB) will provide US$500mn to
Indian Railways (IR), the state-run organisation responsible for most of India's rail transport, The loan
will help IR in its aim to add 15,000 miles of new lines to the existing network over the coming decade,
and will be issued in a number of tranches, the first being US$150mn with a 25-year term. According to a
statement from the ADB, the funding will be targeted at routes between the major Indian cities of
Chennai, Kolkata, Mumbai and New Delhi. It will go towards new lines, the installation of new
signalling, and the electrification of existing track.
In June 2011, India's long-delayed national freight railway project, the Dedicated Freight Corridor
(DFC), finally entered the tendering process. The Dedicated Freight Corridor Corporation of India
(DFCCIL), the special purpose vehicle in charge of the US$17bn dedicated freight railway corridor
project, has decided that the project's 1,490km western section will be implemented by a JV between
Indian and Japanese infrastructure companies. Prospective developers for the US$6.7bn project, also
known as the Western Corridor, will be selected through a bidding process, where pre-qualification bids
for the first phase – a 1000km stretch from Rewari in Haryana to Vadodara in Gujarat – were to be
accepted starting in mid-June. The Western Corridor, which is funded by Japan's Overseas Development
Assistance coordinator Japan International Cooperation Agency (JICA), is expected to begin
construction in March 2012 and should be completed by December 2016.
The DFC consists of six freight corridors (railway lines), but only two corridors will be launched initially.
They are the 1,800km Eastern Corridor, which will run from Ludhiana in Punjab to Dankuni in West
Bengal, and the 1,490km Western Corridor, which will run from Tughlakhabad in New Delhi to the Navi
Mumbai port in Maharashtra. The two freight corridors are estimated to be worth INR770.0bn
(US$17.4bn) and would involve the construction of high-speed tracks, which could transport goods at up
to 100km/h. The initial contracts on offer would involve engineering works for 650km of the Western
Corridor and 350km of the Eastern Corridor. The DFCCIL was expected to invite pre-qualification bids
for the Western Corridor in May 2011, while pre-qualification bids for the Eastern Corridor are currently
being evaluated (there are 27 bidders for the Eastern Corridor, according to latest documents from
DFCCIL). Both freight corridors are expected to be completed by December 2016.
The benefits of the DFC are undeniable. The demand for additional rail freight capacity in India has
surged over the past few years, due to the rapid growth in the Indian economy. The country's current

India Infrastructure Report Q1 2012
© Business Monitor International Ltd Page 51
freight transport system is straining under this surge in demand, and the construction of the DFC will
alleviate these demand pressures and provide a fast and efficient means of moving freight between
different states. Furthermore, many of these infrastructure companies such as Tata and Reliance have
steel production and petrochemicals operations throughout India. These operations need an efficient
freight railway system to ensure raw materials and finished goods are delivered within a specified
timeframe.
While there are compelling factors driving the need for the DFC – i.e. India’s rapid economic growth and
the need for a fast and efficient means of moving freight between different states – it has been the
perennial problems associated with raising the necessary funds and acquiring land that have stalled the
project. The land acquisition process for the DFC started in 2008 and the project was originally slated for
completion by 2013. India secured a INR300bn (US$6.8bn) loan from JICA for the Western Corridor in
March 2011, while the World Bank is expected to lend about US$2.4bn for the Eastern Corridor, having
provided US$975mn in June 2011. Meanwhile, the DFCCIL has reported that 90% and 50% of the land
needed for the first phase of the Western and Eastern corridors respectively has been acquired.
Another important railway line is the connection between India and Bangladesh. In September 2011, the
Indian government approved a INR2.6bn (US$53mn) rail link to Bangladesh, reports News Resources
International. The 15km line will link Agartala in India to Akhaurah in Bangladesh, which has links to the
Chittagong international sea port. The line, which could potentially facilitate the transportation of India
exports, is due to be completed by 2014
Urban Railways
Urban railways are also expected to experience significant growth over the long term as India’s
population continues to urbanise and demand for public transportation services grows. According to UN
data, the urban/rural split in India was 28% urban to 72% rural in 2000; by 2011, BMI estimated that the
urban population reached around 30% of the total, meaning that 376mn people now live in India's cities.
This trend is set to continue through 2020 (33.5% of the population) and 2030 (38%), while India’s
finance ministry believes that over 500mn people will be expected to live in urban areas by 2020.
India's rapid economic growth has significantly increased the size of its middle-class and their demand for
car ownership. Delhi in particular is suffering from severe traffic congestion because it has the highest
number of vehicles per square kilometre in India, with more vehicles than Mumbai, Kolkata and Chennai
combined. Therefore, in order to match this urbanisation rate and to keep the economy functioning in
India's cities, we believe that investment in urban transport such as commuter railways and monorails will
be crucial to improving traffic conditions. The appointment of Kamal Nath as Urban Development
Minister is an indication of a change in the government's attitude towards private sector involvement in
this sector. Indeed, Nath was widely credited with harnessing greater private sector involvement in his
previous post at the Road Transport Ministry.
India Infrastructure Report Q1 2012
© Business Monitor International Ltd Page 52
In July 2011, the Finance Ministry was readying a blueprint on financing of urban transport systems,
favouring a new PPP approach as opposed to the existing model of joint development by the Planning
Commission and states, which often lead to cost overruns and projects delays, due to lack of coordination
and oversight. The PPP approach is also favoured because the Planning Commission and Urban
Development Ministry has limited fiscal strength to meet the necessary investment. A recent study by
Wilbur Smith Associates for the Ministry (cited by the Economic Times) estimated that the total funding
required for transport projects in 87 cities in India by 2030 is INR4354bn, approximately INR230bn a
year. India’s fiscal budget for 2011/12 has only allocated INR80bn to the Urban Development Ministry.
There has been significant progress in the development of urban railway systems in several major Indian
cities in the second half of 2011. In August 2011, the Indian government approved the third-phase
expansion of the Delhi Metro, according to Railway-Technology. The latest phase of the project has been
budgeted at US$7.7bn, and will service 67 stations and 15 interchange points across its lines. By 2016,
the Delhi Metro is projected to have capacity for 3.9mn passengers, which will almost double to 6.5mn by
2031.
In September 2011, it was announced that the first phase of construction of the Mumbai Metro rail line
was set to be completed by the end of 2012, reports News Resources International. The Mumbai
Metropolitan Region Development Authority has said that the US$510mn project is 80% complete.
Construction is being led by Indian utilities company Reliance Infrastructure. The entire line will total
146.5km, and is projected to cost US$4.3bn.
In October 2011, the first metro line (6.7km) in Bangalore, known as the Namma Metro, became
operational, reports Yahoo. The project begun in 2006, but suffered delays and budget problems. The
remaining 42.3km network is set for completion by March 2013 and has received several loans for the
project. India's Housing and Urban Development Corporation (HUDCO) has approved an INR7bn
(US$139mn) loan for the project in October 2011, while the Asian Development Bank provided a
US$250mn loan in April. The project has also obtained INR6.83bn (US$138mn) from the Karnataka
government from the 2011-12 budget, while, Bangalore Metro Rail Corporation (BMRCL) has already
invested INR40bn (US$814mn) in the project.
Airports
The country has been developing its airport sub-sector, not only for the transport of goods, but also to
accommodate the growing numbers of international business travellers and tourists. India currently has
352 airports, of which 249 have paved runways.
Investment in airports has been a clear outperformer in the transport sector, and this is driven by a strong
project pipeline and investor confidence. Airports were one of the few sub-sectors to have investment
targets revised upwards following the mid-term appraisal of the 11th Five-Year Plan (2007/08-2010/11).
While transport investment targets declined by 20% overall, conversely, investment targets for airports

India Infrastructure Report Q1 2012
© Business Monitor International Ltd Page 53
were raised from INR310bn (US$6.8bn) to INR361bn (US$7.9bn). This is a clear indication that funding
is flowing into the sub-sector, perhaps due to better planning procedures, but also because of the
willingness of the private sector to invest.
Airport infrastructure is being upgraded to support both international air travel and domestic travel. An
expansion in the number of International Airports in Tier I cities has been seen, including a new airport in
Navi Mumbai, the satellite city of Mumbai, as well as expansions at existing airports. As for Tier II and
Tier III cities, demand for air infrastructure is also on the rise as these cities grow in wealth and
population. However, it remains to be seen if there is sufficient air traffic to support private investment or
create financially viable PPPs.
In May 2011, momentum for the construction of the Navi Mumbai international airport took a big leap
forward, with the project steering committee – comprising civil aviation and state government officials –
granting final approval of the airport's draft master plan. The approval means that the state urban
development authority, the City and Industrial Development Corporation of Maharashtra (CIDCO), can
start the bidding process for the INR87.2bn (US$1.9bn) project. The tendering process was expected to
start in July 2011, but was postponed after delays to land acquisition. Construction of the airport will be
carried over four phases, with the first phase to begin in 2012 and be completed by 2014. The Navi
Mumbai airport is proposed to be developed through public-private participation, in which the CIDCO
and the Airports Authority of India will each hold a 13% stake in the airport and the rest is to be held by
the private developer. The airport is expected to have two runways and will be designed to accommodate
new extra-large aircraft.
The proposed airport is necessary due to the growing size of Mumbai and its satellite cities in the
neighbouring Thane district (the Navi Mumbai city, located just 10km away from Mumbai, is one such
city). The city and suburban districts of Mumbai have a combined population of 12.4mn people and have
one airport, the Chhatrapati Shivaji International Airport (CSIA), to meet its air traffic demands – this
airport is currently able to handle 25mn passengers a year and is expected to reach its saturation mark of
40mn passengers a year by 2016. While the latest data from the Indian government shows that the
Mumbai urban area grew at a moderate rate over the past decade (the Mumbai suburban district grew by
8% in 2001-2011), the Thane district grew by 35.9% to reach a population of 11.0mn over the same
period. This suggests that the Mumbai urban area could be reaching saturation level and the city's
growing population is moving towards the satellite cities in the Thane district. This trend is likely to
continue over the next decade, making the construction of a new airport in Navi Mumbai – the largest of
Mumbai's satellite cites – a logical decision. As Mumbai's population become increasingly affluent, air
transport will gradually become the preferred means of travel and the growth in aviation facilities needs
to keep pace to meet this demand.

India Infrastructure Report Q1 2012
© Business Monitor International Ltd Page 54
The Navi Mumbai airport project is expected to be fiercely contested, as it is the largest greenfield airport
project in India since the privatisation of the airport sector in 2006. Although the existing operators of the
CSIA, a consortium led by India-based GVK, have first right of refusal, this clause does not guarantee
GVK will win the bid, as its offer cannot be less than 10% of the highest bid received. We expect bidders
to not only include established players such as GVK, Reliance and GMR, but also domestic companies
that are not heavily exposed to the industry, but are eager to capitalise on India's booming aviation sector.
These companies include HCC, Gammon and infrastructure financier Infrastructure Leasing &
Financial Services. A number of international airport operators, such as Singapore-based Changi
Airport and France-based Aeroports De Paris, have also expressed interest in the Navi Mumbai airport
project, but we believe that the project will likely go to a domestic player or at least a domestic-led
consortium.
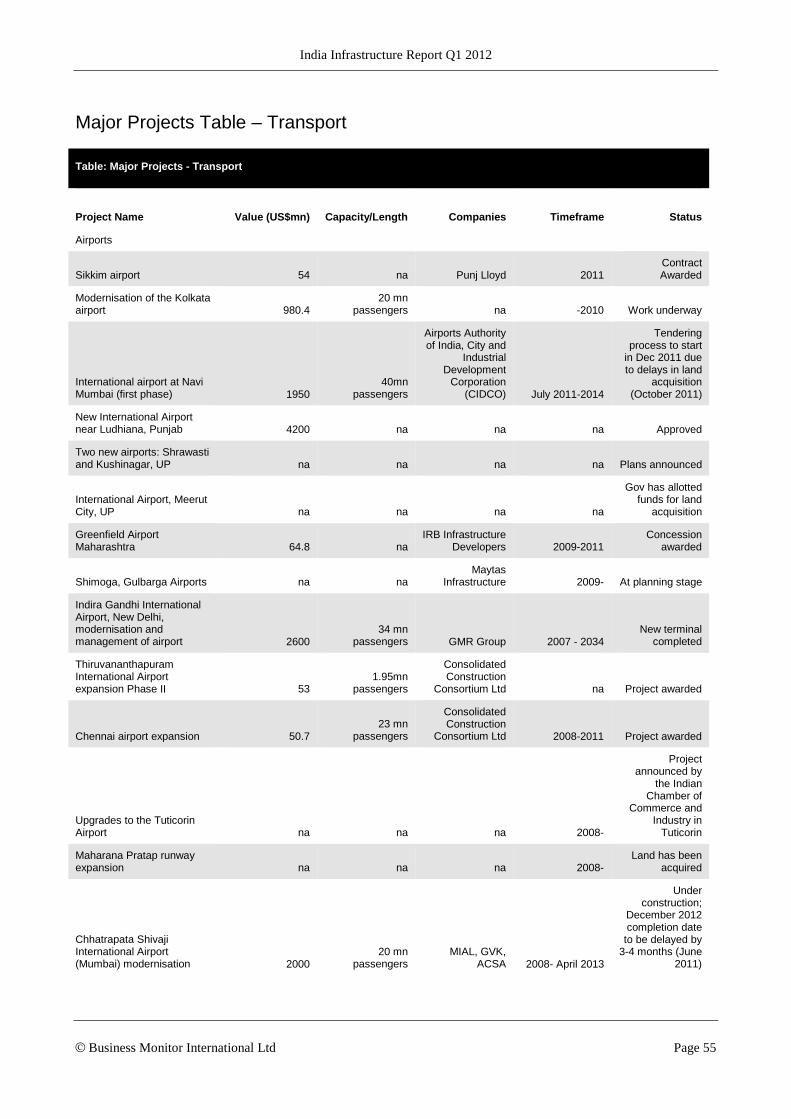
India Infrastructure Report Q1 2012
© Business Monitor International Ltd Page 55
Major Projects Table – Transport
Table: Major Projects - Transport
Project Name Value (US$mn) Capacity/Length Companies Timeframe Status
Airports
Sikkim airport 54 na Punj Lloyd 2011 Contract Awarded
Modernisation of the Kolkata airport 980.4
20 mn passengers na -2010 Work underway
International airport at Navi Mumbai (first phase) 1950
40mn passengers
Airports Authority of India, City and
Industrial Development
Corporation (CIDCO) July 2011-2014
Tendering process to start
in Dec 2011 due to delays in land
acquisition (October 2011)
New International Airport near Ludhiana, Punjab 4200 na na na Approved
Two new airports: Shrawasti and Kushinagar, UP na na na na Plans announced
International Airport, Meerut City, UP na na na na
Gov has allotted funds for land
acquisition
Greenfield Airport Maharashtra 64.8 na
IRB Infrastructure Developers 2009-2011
Concession awarded
Shimoga, Gulbarga Airports na na Maytas
Infrastructure 2009- At planning stage
Indira Gandhi International Airport, New Delhi, modernisation and management of airport 2600
34 mn passengers GMR Group 2007 - 2034
New terminal completed
Thiruvananthapuram International Airport expansion Phase II 53
1.95mn passengers
Consolidated Construction
Consortium Ltd na Project awarded
Chennai airport expansion 50.7 23 mn
passengers
Consolidated Construction
Consortium Ltd 2008-2011 Project awarded
Upgrades to the Tuticorin Airport na na na 2008-
Project announced by
the Indian Chamber of
Commerce and Industry in
Tuticorin
Maharana Pratap runway expansion na na na 2008-
Land has been acquired
Chhatrapata Shivaji International Airport (Mumbai) modernisation 2000
20 mn passengers
MIAL, GVK, ACSA 2008- April 2013
Under construction;
December 2012 completion date
to be delayed by 3-4 months (June
2011)
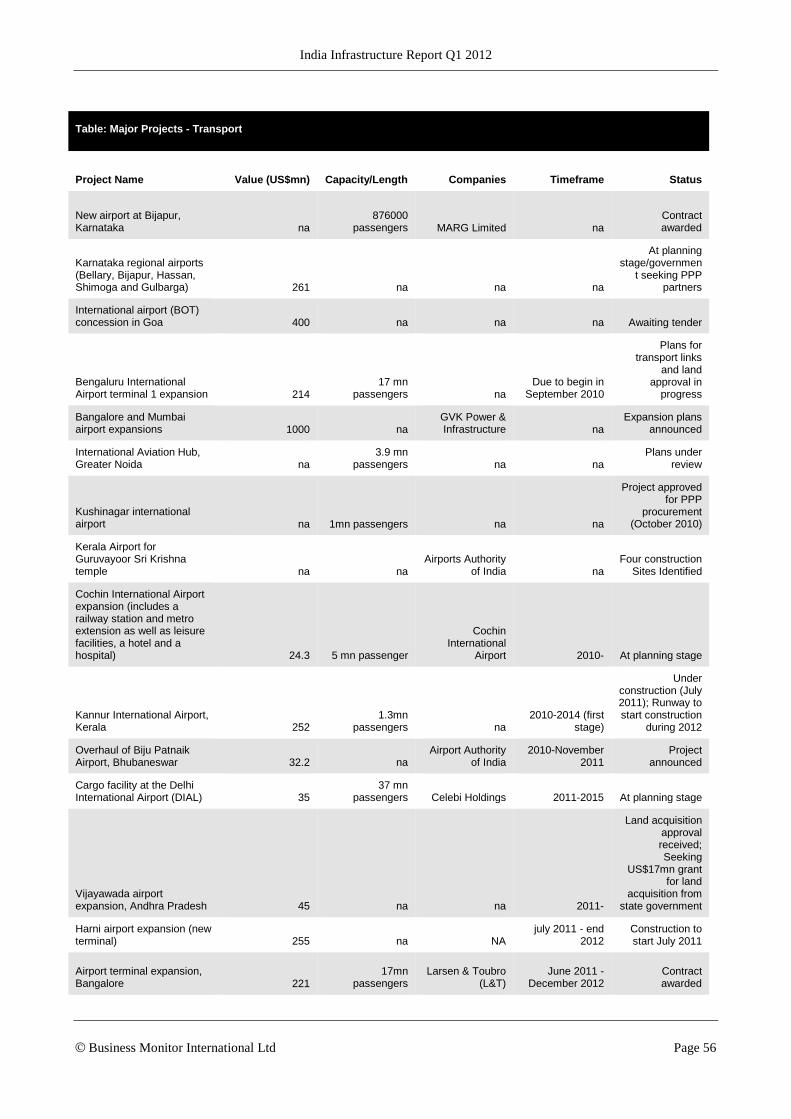
India Infrastructure Report Q1 2012
© Business Monitor International Ltd Page 56
Table: Major Projects - Transport
Project Name Value (US$mn) Capacity/Length Companies Timeframe Status
New airport at Bijapur, Karnataka na
876000 passengers MARG Limited na
Contract awarded
Karnataka regional airports (Bellary, Bijapur, Hassan, Shimoga and Gulbarga) 261 na na na
At planning stage/governmen
t seeking PPP partners
International airport (BOT) concession in Goa 400 na na na Awaiting tender
Bengaluru International Airport terminal 1 expansion 214
17 mn passengers na
Due to begin in September 2010
Plans for transport links
and land approval in
progress
Bangalore and Mumbai airport expansions 1000 na
GVK Power & Infrastructure na
Expansion plans announced
International Aviation Hub, Greater Noida na
3.9 mn passengers na na
Plans under review
Kushinagar international airport na 1mn passengers na na
Project approved for PPP
procurement (October 2010)
Kerala Airport for Guruvayoor Sri Krishna temple na na
Airports Authority of India na
Four construction Sites Identified
Cochin International Airport expansion (includes a railway station and metro extension as well as leisure facilities, a hotel and a hospital) 24.3 5 mn passenger
Cochin International
Airport 2010- At planning stage
Kannur International Airport, Kerala 252
1.3mn passengers na
2010-2014 (first stage)
Under construction (July 2011); Runway to start construction
during 2012
Overhaul of Biju Patnaik Airport, Bhubaneswar 32.2 na
Airport Authority of India
2010-November 2011
Project announced
Cargo facility at the Delhi International Airport (DIAL) 35
37 mn passengers Celebi Holdings 2011-2015 At planning stage
Vijayawada airport expansion, Andhra Pradesh 45 na na 2011-
Land acquisition approval received; Seeking
US$17mn grant for land
acquisition from state government
Harni airport expansion (new terminal) 255 na NA
july 2011 - end 2012
Construction to start July 2011
Airport terminal expansion, Bangalore 221
17mn passengers
Larsen & Toubro (L&T)
June 2011 - December 2012
Contract awarded

India Infrastructure Report Q1 2012
© Business Monitor International Ltd Page 57
Table: Major Projects - Transport
Project Name Value (US$mn) Capacity/Length Companies Timeframe Status
Jharsuguda airport, Orissa na na AirPort Authority
of India June 2011 -
Construction to start (June 2011); 191 acres of land
allocated
Air Traffic Control tower complex, part of Delhi International Airport 77.7 na na
July 2011 - November 2013
Inviting bids for contract (July
2011);
Ports
LPG import terminal at Ennore 57 800000 tonnes Punj Lloyd na
Contract awarded
Tuticorin Port expansion project, Tamil Nadu 225 600000TEU
Tuticorin Port Trust
2010- March 2011
Under construction; On
schedule to increase capacity
to 55mn tonnes
Coal berth at Paradip Port 98 16mn tonnes
Essar Shipping Ports and Logisitics 2009-2012
Construction awarded
Jawaharlal Nehru Port 4th container concession 1500 6mn TEU
PSA International,
ABG Shipyard Limited,
Jawaharlal Nehru Port Trust (JNPT) July 2011 -
Concession awarded (July
2011)
Gangavaram port expansion 147 26 mn tonnes na 2009-2011
Plans to secure a loan for the
project
Krishnapatnam port 161 100 mn tonnes 3i 30 year
concession na
Sea port in Bhadrak 322 3 mn tonnes Aditya Birla
Group na MoU signed
Dharam Port in Orissa 505.5 100mn tonnes Tata Steel,
Larsen & Toubro -April 2010 Construction
underway
Mega terminal and Chennai Port 800 4 mn TEU na
2010- (Seven years)
Plans confirmed by Indian
government; 30 year concession
offered
Vizhinjam International Container Terminal, Kerala 1120 4.1mn TEUs
Vizhinjam International
Seaport, Shipping
Corporation of India 2012 - 2015
At the tendering stage; Bidding
deadline extended to Aug
2011; Environmental
study completed by 2012
Hazira Port cargo berthing facilities 400-500 na
Hazira Port Private Ltd. na At planning stage
International Container Transhipment Terminal - Vallarpadam, Kerala 500 5.5mn TEU DP World 2005-2010
Under Construction/
Possibly to open in August 2010

India Infrastructure Report Q1 2012
© Business Monitor International Ltd Page 58
Table: Major Projects - Transport
Project Name Value (US$mn) Capacity/Length Companies Timeframe Status
Coal terminal at Mormugao, Goa na 6.5 mn tonnes Mundra Port 2009-2012
Concession Awarded
Paradip port new deep draught na na
Blue Water Iron Ore Terminal na
concession agreement
signed in July 2009
Dredging of Kandla Port na 93 mn tonnes na 2008- Project awarded
Machilipatnam Deep Water Port 343 17 mn Tonnes
Maytas Infra Ltd, Nagarjuna
Consortium Company, SREI
Infrastructure, Sarat Chatterjee 2008-
Construction underway
All Weather Port Project 299.82 54 mn tonnes
Punjab National Bank/ Bank of
India/ State Bank of India/ State
Bank of Travancore/ Dena Bank/
Oriental Bank of Commerce/
Union Bank/ Indian Bank and
UCO Bank 2010 - 2011 Loan secured
Ennore Port Container Terminal 312 1.5 mn TEU
Grup MarAtim TCB, ObrascA3n
Huarte Lain (OHL), Lanco
Infratech, Eredene Capital 2010-2013
BOT contract awarded (June
2010)
Mundra port expansion and SEZ 1200 30 mn tonnes Adani Group 2010-2015
Project announced in August 2010
Kattupalli Container Terminal na 1 mn TEU
Larsen and Toubro (L&T)
Scheduled to be completed by
December 2011/January
2012
Operation and maintenance
contractor to be chosen near end
of 2010/early 2011
New Mangalore Port Trust new container terminal 63 2500 TEU
New Mangalore Port Trust 2011 -
Civil infrastructure
financed by public funds;
Seeking private investors for
handling equipment
Ennore Port dredging na 34 mn tonnes
Dredging Corporation of
India 2010-2012
Contract awarded
(October 2010)
Indian Machilipatnam Port na na na na At land
acquisition stage

India Infrastructure Report Q1 2012
© Business Monitor International Ltd Page 59
Table: Major Projects - Transport
Project Name Value (US$mn) Capacity/Length Companies Timeframe Status
Ponnani port expansion 171 na High Valley Infra
Projects na
At the bidding stage (High Valley Infra
Projects sole bidder)
Azhikkal port, Kannur 104 180000 tonnes na 2011-
Mundra Port withdraw bid;
Tender process to be relaunched
Dhamra Port Project na 100 mn tonnes Tata Steel,
Larsen & Toubro - 2011
Completion date delayed till
January 2011
Visakhapatnam port na 63.9 mn tonnes
Coal India, Port of
Visakhapatnam 2010-
Partnership formed to expand
coal import capacity
Six ports in Kerala, Tamil Nadu, Andhra Pradesh and Orissa na 200mn tonnes Adani Group 2011-2015
At planning stage; Holding
negotiations with state
governments
Expansion of four ports (Jawaharlal Nehru port, Kochi port, Chennai port, Visakhapatnam port) 63000 na na 2010-2020
Earmarked by Indian ministry of
shipping
57km Kutch Canal Construction Project 75 na
SardarSarovar Narmada Nigam,
Hindustan Construction January 2013
Construction and five years
maintenance contract awarded
International Container Transhipment Terminal, Vallarpadam Island na 4mn TEU na 2011-
First phase (1mn TEUs per year)
completed
Iron ore export terminal 159.57 46 mn tonnes Mormugao Port
Trust (MPT) August 2011 -
March 2014 14 bids received (February 2011)
Gopalpur Port expansion (0.7mn tonnes to 12mn tonnes) 282 4.3 mn tonnes na 2011-2013
Received government
approval; Have plans to expand to 60mn tonnes
of cargo by 2022
Beypore port, Kerala 36.9 100000 tonnes na 2011-
Tendering process
relaunched
Nargol Port tender 391 na
Adani Group, HCC, GVK, GMR
and ABG Shipping
Gujarat Maritime Board intends to
sign a letter of intent (LoI) by
July 2011
18 qualified bidders
shortlisted
Indian Haldia Dock II construction project 289 16mn tonne
Kolkata Port Trust 2011-
Kolkata Port Trust seeking
private partners; Construction include four berths (4mn

India Infrastructure Report Q1 2012
© Business Monitor International Ltd Page 60
Table: Major Projects - Transport
Project Name Value (US$mn) Capacity/Length Companies Timeframe Status
tonne each)
New box terminal, Diamond Harbour, Kolkata Port na 20mn TEU na 2011 -
Set to invite bids (June 2011)
Kuda port project, Gujarat 337.2 na Indian Potash July 2011 -
To seek government
approval and port clearance for port
project (July 2011)
Rail
Delhi Metro Extension 32 na KMB, Era Infra
Engineering 2008-September
2010 Completed
Chennai Metro project 3500 8.6km
Delhi Metro Rail Corporation
(principal advisor) 2009-2015
First phase under construction/
Japan loan agreed for Phase
II
Delhi-Gurgaon Metro 209 6.1km
DLF, IL&FS, ITNL ENSO Rail
Systems 2009-2013
Achieved financial closure
(June 2010)
Indore-Dahod broad-gauge railway line 230.62 na na na
Approval granted by the Planning
Commission
Hyderabad Metro rail PPP 2630 71.16 km
Larsen and Toubro; L&T
Hyderabad Metro Rail June 2011-
Construction to start; Financing
fully secured; Rolling stock
contract awarded in September
2011
Leh to Bilaspur rail project, Himachal Pradesh 520 498 km na 2011-
Feasibility report finalised
Mumbai Metro Line-1 (first phase), Versova (west Andheri) - Ghatkopar 510 11.1km
Anil Ambani Group, Veolia
Transport, Reliance
Infrastructure 2008- end-2012
80% completed (Sep 2011);
Operational by end-2012
Six railway lines and gauge conversion across India 681.03 na na 2013 At planning stage
Mumbai Metro Line-2 (first phase), Charkop-Bandra-Mankhurd 2300 31.8km
Reliance Infrastructure,
SNC Lavalin 2011-2016
Preliminary survey
completed; Construction to start in Q12011
Namma Metro, first phase (involves a 4.9km underground section and a 6.5km viaduct section), Bangalore, Karnataka province 2190 35.6km
Bangalore Metro Rail Corp. (BMRCL)
2006- March 2013
US$250mn loan from ADB,
US$814mn from BMRCL,
US$139mn from HUDCO (Oct
2011)

India Infrastructure Report Q1 2012
© Business Monitor International Ltd Page 61
Table: Major Projects - Transport
Project Name Value (US$mn) Capacity/Length Companies Timeframe Status
High-speed freight railway line, Western Dedicated Freight Corridor from Mumbai to Delhi 9390 (6700) 1490km
Japan International Cooperation
Agency (JICA), Dedicated
Freight Corridor Corporation of
India (DFCCIL), Indian Railways
March 2012- December 2016
First phase (1000km)
undergoing tendering
process; JICA to loan US$6.64bn;
90% of land acquired
Freight rail linking Pakistan and Bangladesh via New Delhi na 14km na 2010-
Plans being discussed
Kochi Metro rail extension 654 na Delhi Metro Rail
Corporation na Preliminary
works underway
Rail bridge linking International Container Terminal at Vallarpadam Island with mainland Kochi na 4.62 km na -Nov 2009
Construction underway
Kadapa- Bangalore railway na 174km na 2008- Project
announced
Chennai Egmore- Madurai line electrification na 222 km na 2008-2011
Construction to begin on
Villapuram and Dindigal stretch
Delhi Metro Airport Express Line (Six stations), linking Indira Gandhi International Airport 580 22.7 km
Reliance Infrastructure,
CAS - 2011
Operational with four stations; Due to be inaugurated
in September 2011
Bangalore (Namma) Metro, 2nd Phase, Karnataka province 3960 70km
Bangalore Metro Rail Corp., Delhi Metro Rail Corp. January 2011-
Preliminary work underway; Type
of railway line (underground or
elevated) undecided
Eastern Dedicated Freight Corridor from Ludhiana in Punjab to Dankuni in West Bengal 8000 1800km
Dedicated Freight Corridor
Corporation of India (DFCCIL), Indian Railways
October 2011-2016
343km Khurja-Kanpur first
phase to start tendering process;
US$975mn loan approved from
World Bank (
North Front Railway tunnel 67.3 na
Hindustan Construction,
Coastal Projects na Contract awarded
Delhi Metro Phase II Expansion 4200 100 km na
Completion date was extended to September 2010
Small section of track still not
open; 2.57km Anand Vihar-Vaishali line
operational July 2011
Metro rail connection 666.7 na Cidco, Mumbai 2010- At planning stage

India Infrastructure Report Q1 2012
© Business Monitor International Ltd Page 62
Table: Major Projects - Transport
Project Name Value (US$mn) Capacity/Length Companies Timeframe Status
between Mumbai and Navi Mumbai
Metropolitan Region
Development Authority
Delhi Metro link, part of its 65km Phase III extension plans 178.5 3.2km Delhi Metro 2011-2014
Awaiting final clearance
Construction of rail track and upgrading of existing rail facilities from power plants located in Maithon, Rajpura, Korba and Jharsugud 246.8 34km Larsen & Toubro 2011-
Contract awarded
Chennai Metro Rail project (track work on corridors I and II), Tamil Nadu 98 105km
Larsen & Toubro (L&T), Alstom
Transport, Alstom Projects
India 2011-2015
Under construction;
First phase involves 21km of
elevated track due by end-2013
Delhi Metro Phase III Extension
6750 (include taxes and duties) 108km na 2011-2016
Revised plan approved by
India government;
Allocated US$158mn from India's 2011/12
budget
Part of the Chennai metro system (include two stations) 567 5.5km
Afcons, Transtonnelstroy
February 2011-April 2015
Contracted awarded
Rail and road project for Sagar Island port, Kolkata 438 40 km
Indian Railways, Kolkata Port
Trust 2011-
Feasibility study to start in H1
2011
Pune metro expansion 507 70 km na na
Waiting for central
government approval
Kanchrapara rail project, West Bengal 331.7 na na 2011-
At tendering stage; Eight companies shortlisted
Railway link between Tripura state capital Agartala with Gangasagar in Bangladesh 54
15km (10km in Bangladesh) na
October 2012 - 2014
Funding provided by India and Bangladesh;
Plans approved (Sep 2011)
Navi Mumbai Metro (first phase from Belapur to Pendhar) 996 11.5km na
May 2011 to 2016
First phase to start work (May 2011); Phase 2 and 3 to start in
2015-16 and end 2030

India Infrastructure Report Q1 2012
© Business Monitor International Ltd Page 63
Table: Major Projects - Transport
Project Name Value (US$mn) Capacity/Length Companies Timeframe Status
Electrification system for east-west metro railway line (First phase, 5.77km with 6 stations; Second phase, 8.9km underground section with 6 stations), Kolkata state na 14.67km Siemens
2011- end 2013 (first phase), end
2014 (second phase)
Contract awarded by
Kolkata Metro Rail Corporation
(KMRC)
Electrification of Shoranur-Kannur line, Malabar 6.6 na KEC International
May 2011 - May 2013
Contract awarded
2 sections (Janpath to Mandi House; Janpath to Central Secretariat) of underground twin tunnels for Metro Phase III project 103 na
Pratibha CRFG JV, Pratibha
Industries, China Rail First Group June 2011 -
Contract awarded (June
2011)
Jammu-Udhampur-Katra-Qazigund-Baramulla railway line project, Kashmir valley 4120 345km Indian Railways
2011 - December 2017
Under construction; Construction include 11km Qazigund to
Banihal tunnel
Railway line from Dhamra Port to Jamshedpur steel plant na 62km na - June 2011
First line completed under
the Railways Infrastructure for Industry Initiative
& funded by private J
Monorail between the Dwarka metro station and Baprola, New Delhi na 4.5km
Delhi State Industrial and Infrastructure Development
Corporation (DSIIDC), Rail
India Technical & Economic
Services (RITES) June 2011 -
Awaiting approval from
state government (June 2011);
RITES to conduct feasibility study
60km-Bangalore monorail project (first phase) 500 16km
ITNL Enso Rail System (IERSL), Scomi-Geodesic June 2011 -
Deal agreed (July 2011); 74% financed by
IERSL, 26% by Scomi-Geodesic
Light railway line extension project (Sikanderpur Metro station to Golf Course Road), Gurgaon 488.5 7km
Rapid MetroRail Gurgaon (RMG),
ITNL Enso Rail Systems (IERS),
DLF Metro July 2011 -
January 2013
Feasibility study concluded (July 2011); Awaiting
government approval (July
2011)
Railway line linking the Hazaribagh railway station with Shivpur in Chatra, Madhya Prades na 49km
Indian Railway Ministry July 2011 -
Preliminary work underway (July
2011)
Ahmedabad-Mumbai-Pune railway PPP project 12720 634km na 2011 - 2021
Feasibility study completed (July
2011)
Monorail system running na 28 Km na na Preparation of a
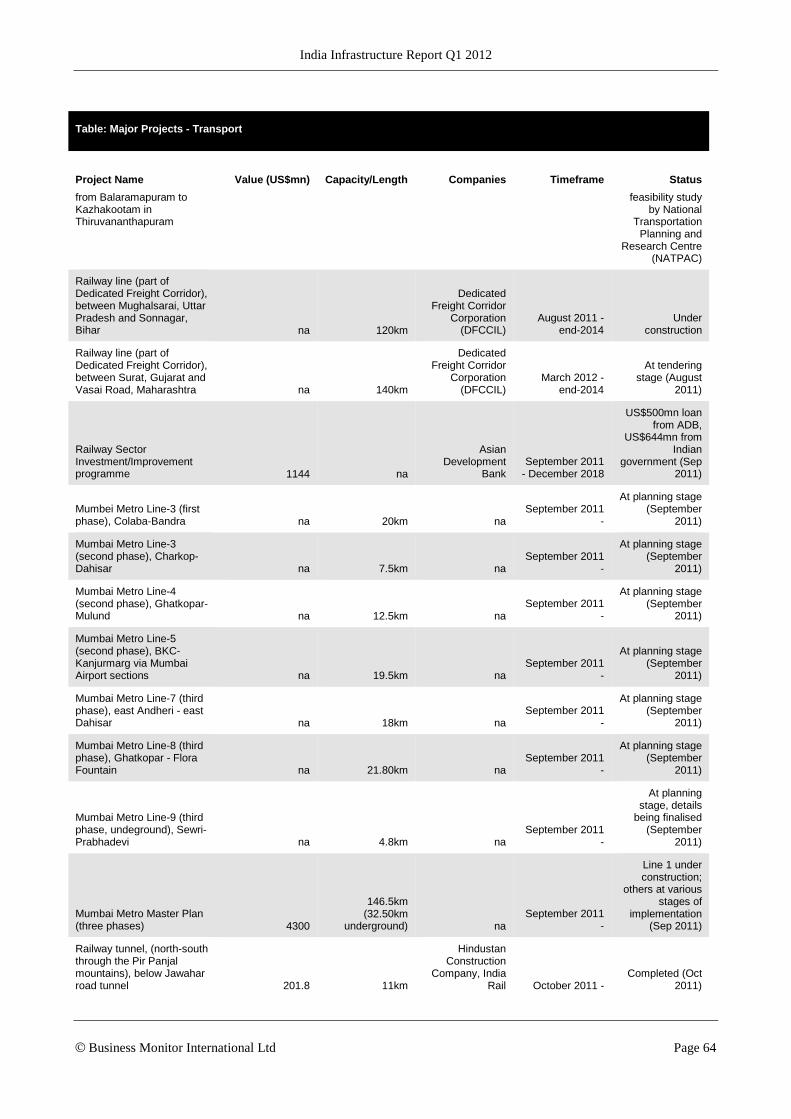
India Infrastructure Report Q1 2012
© Business Monitor International Ltd Page 64
Table: Major Projects - Transport
Project Name Value (US$mn) Capacity/Length Companies Timeframe Status
from Balaramapuram to Kazhakootam in Thiruvananthapuram
feasibility study by National
Transportation Planning and
Research Centre (NATPAC)
Railway line (part of Dedicated Freight Corridor), between Mughalsarai, Uttar Pradesh and Sonnagar, Bihar na 120km
Dedicated Freight Corridor
Corporation (DFCCIL)
August 2011 - end-2014
Under construction
Railway line (part of Dedicated Freight Corridor), between Surat, Gujarat and Vasai Road, Maharashtra na 140km
Dedicated Freight Corridor
Corporation (DFCCIL)
March 2012 - end-2014
At tendering stage (August
2011)
Railway Sector Investment/Improvement programme 1144 na
Asian Development
Bank September 2011
- December 2018
US$500mn loan from ADB,
US$644mn from Indian
government (Sep 2011)
Mumbei Metro Line-3 (first phase), Colaba-Bandra na 20km na
September 2011 -
At planning stage (September
2011)
Mumbai Metro Line-3 (second phase), Charkop-Dahisar na 7.5km na
September 2011 -
At planning stage (September
2011)
Mumbai Metro Line-4 (second phase), Ghatkopar-Mulund na 12.5km na
September 2011 -
At planning stage (September
2011)
Mumbai Metro Line-5 (second phase), BKC-Kanjurmarg via Mumbai Airport sections na 19.5km na
September 2011 -
At planning stage (September
2011)
Mumbai Metro Line-7 (third phase), east Andheri - east Dahisar na 18km na
September 2011 -
At planning stage (September
2011)
Mumbai Metro Line-8 (third phase), Ghatkopar - Flora Fountain na 21.80km na
September 2011 -
At planning stage (September
2011)
Mumbai Metro Line-9 (third phase, undeground), Sewri-Prabhadevi na 4.8km na
September 2011 -
At planning stage, details
being finalised (September
2011)
Mumbai Metro Master Plan (three phases) 4300
146.5km (32.50km
underground) na September 2011
-
Line 1 under construction;
others at various stages of
implementation (Sep 2011)
Railway tunnel, (north-south through the Pir Panjal mountains), below Jawahar road tunnel 201.8 11km
Hindustan Construction
Company, India Rail October 2011 -
Completed (Oct 2011)

India Infrastructure Report Q1 2012
© Business Monitor International Ltd Page 65
Table: Major Projects - Transport
Project Name Value (US$mn) Capacity/Length Companies Timeframe Status
Namma Metro first phase (Reach-1), part of the 18.1km east-west metro line, Bangalore, Karnataka province na 6.7km
Bangalore Metro Rail Corporation
2006 - September 2011 Completed
Nerul-Belapur-Seawood-Uran railway line, Mumbai, Maharashtra state 285 27km na
November 2011 - 2015
Under construction, Financed by
MOR and Industrial
Development Corporation of
Maharashtra (Nov 2011)
Roads & Bridges
Upgrading Maharashtra-Goa and Goa-Karnataka road 4.31 122.87km na na Project approved
Road project, Mumbai 10.2 na PBA
Infrastructure na Contract awarded
Roads of the Thane district 60 na na na At planning stage
Elevated road in Kolkata city 67.86 8.14km Hindustan
Construction 2009-2012 Contract awarded
Four lane highway Maharashtra 94.29 336 km
IJM Corporation Berhad 2009-2012
Contract Awarded
Expanding road linking Hyderabad and Yadgiri 106.06 54km
Sadbhav Engineering na
Contract awarded
road project in Rajasthan 128 53km Reliance
Infrastructure 2009-2011 Contract awarded
54 Bridges in Maharashtra and Gujarat 130 200 Km Soma Enterprise na na
Ranchi-Hazaribagh stretch of NH-33 highway 135 71km
IL&FS Transportation,
Punj Lloyd 2009-2012 Contract awarded
Four lane highway from Haridwar to Dehradun 142.56 414.8km
Era Infra Engineering
Limited na Contract awarded
Road construction in Assam, Madhya Pradesh and Chattisgarh 146.21 na
Indian Telecommunicati
on Consultant India na
Contracts secured
Highway NH9 linking Pune and Sholapur 160 104.6km
Mytas Infra and IL&FS
Transportation Network 2009-2011
Contract awarded
Godavari River Bridge 180 2.7 km Rajahmundry
Godavari Bridge na At planning stage
National Highway 47 in Bihar 182.6 63.17km
Gammon Infrastructure 2009-2012
Contract awarded
Muzaffarnagar to Haridwar road 220.17 80 Km
Era Infra Engineering na
Contract awarded

India Infrastructure Report Q1 2012
© Business Monitor International Ltd Page 66
Table: Major Projects - Transport
Project Name Value (US$mn) Capacity/Length Companies Timeframe Status
Limited
Chennai Outer Ring Road 227.3 29.65km GMR
Infrastructure 2010- 2013 Under
Construction
Road development project (construction of around 1,000km of new roads, and the strengthening of 5,000km of existing road structures), Jharkhand 1100 1000km na
August 2011 - 2014
US$240mn loan from ADB;
Construction to start (August
2011)
Road linking Indore and Ahmedabad 339.31 155km
IVRCL Infrastructure &
Projects na na
Highway project Maharashtra 340 265km
Sadbhav Engineering,
Hindustan Construction,
Laing -2011 Contract awarded
West Bengal to Gangtok in Sikkim Highway 361 na na 2008-2011
Star Universal Resource Company
interested in the project
Renovation and automation of border check posts in Maharashtra 370 na
Sadbhav-Srei-Srei Sahaj na
Contract awarded
Construction of a six lane highway linking Pune and Satara 373 140 km
Reliance Infrastructure 2009-2012
Contract awarded
Hyderabad - Vijayawada road, Andhra Pradesh 497.05 181 km
GMR Infrastructure 2009 -
BOT contract awarded in June
2009
Road linking India and Nepal (Kathmandu to Birgunj, Terai plains) 900 na na 2009-2012
Reliance Infrastructure,
Landmark Worldwide shortlisted
Three road projects in Rajasthan, Maharashtra and Gujurat 937.9 na na na
Projects approved
Gujarat/Maharashtra Border-Surat-Hazira Port highway expansion na 133 km
Isolux-Soma Consortium na
Contract awarded in May
2009
NH-9 highway, Pune-Solapur section expansion na 110km
Navinya Buildcon and Atlantia na
Contract awarded in May
2009
Bangalore Ring Road na 62 km na 2008-
Tenders launching in
December 2008
Mumbai-Ramji Nagar Road na na na 2008- Tenders invited in October 2008
Chennai inner ring road na 5km na 2008- Project
announced

India Infrastructure Report Q1 2012
© Business Monitor International Ltd Page 67
Table: Major Projects - Transport
Project Name Value (US$mn) Capacity/Length Companies Timeframe Status
Surat-Dahisar Road na 239 km IRB Developers, Deutsche Bank 2008- Project awarded
Chilkaluripet-Vijaywada Road na 82.50 km
IJM Corporation Berhad, IDFC Ltd 2008- Project awarded
Chennai-Tada Road na 43.4 km Larsen & Toubro 2008- Project awarded
Gurgaon Kotputli-Jaipur highway na 225.6 km
Emirates Trading Agency LCC,
KMC 2008 Work to start by
2009
Deoli-Kota section of the National Highway No. 12, Rajasthan 182.5 83.04Km
GVK Developmental
Projects na
Contract awarded on BOT
basis
Delhi-Agra highway concession 626 180 km
Reliance Infrastructure
2010-2036 (including
construction period)
Concession awarded
Orissa BOT highway 194 88km Ashoka Buildcon na
Contract awarded in June
2010
NH-4 BOT expansion 102 79.36 km Ashoka Buildcon na Contract Awarded
Bakhtiarpur - Tajpur bridge 322 5.575 km na 2010-2015 Final BOT tender
phase
Bihar State Highways II Project 424 356 km ADB na
ADB loan for US$300mn
awarded
NH-1A road upgrade between Chenani and Nashri in Jammu and Kashmir province 548.9 41km
IL&FS Transportation
Networks 2011-2015 Contract awarded
Improvements on the Mizoram State Roads Projects 13 480km World Bank 2010-
Financing approved
Expansion of the Srinagar-Banihal highway, Jammu and Kashmir 225 67.76km
Ramky Infrastructure,
Jiangsu Provincial
Transportation Engineering 2010-
Contract awarded
highway project, Andhra Pradesh 362 188km
KMC Constructions,
SNC-Lavalin na At planning stage
Highway Project in Tamil Nadu 249.7 29.65 km
National Highways
Authority of India 2010-
Open for international
tender
27 roads along the Chinese border na 804km na 2010- At planning stage
Karnataka Highway Improvement Project 463 615km
Asian Development 2010-2014
US$315mn loan provided by ADB;

India Infrastructure Report Q1 2012
© Business Monitor International Ltd Page 68
Table: Major Projects - Transport
Project Name Value (US$mn) Capacity/Length Companies Timeframe Status
Bank
Bagodara-Wataman-Tarapur-Vasad road extension 223.03 101.9km
Gujarat State Road
Development Corporation,
GVK Power & Infrastructure
(GVKPIL) Construction
period 2.5 years GVKPIL named preferred bidder
Road development project, Chhattisgarh 498.9 1500km
Asian Development
Bank (ADB) December 2011-
332.6 loan provided by ADB;
US$166.3mn provided by the
state government
Three road widening projects (122.8km Barwa Adda-Panagarh section on National Highway (NH)-2, Jharkhand; Barasat-Krishnagar Section of the NH-34, West Bengal; Ambala-Kaithal section of the NH-65, Haryana) 800 na na
2010- (30 months)
Received government
approval
highway construction projects 5000 1000km na 2010-
MoU signed with Malaysian
government
Mumbai Trans Harbour Link (MTHL) project (eight-lane bridge), between Sevri and Nhava Sheva, Maharashtra 1670 22km
Mumbai Metropolitan
Region Development
Authority 2012-2017
Construction tender to start in
2012; In discussion with
World Bank about financing
(Nov 2011)
road linking Agartala, India, to Ashuganj river port, Bangladesh 5.52 50km
Oil and Natural Gas Corporation
(ONGC) 2010- At planning stage
expressway between Sanauta Bridge to Purkazi, Upper Ganga Canal, 1800 212km na 2011-2014
Awaiting concession
proposals from six companies
Road Projects 769 na C&C
Constructions na Under
construction
Development of rural roads, West Bengal 34.9 na na 2011-
US$34.9mn aid from Indian
Union Ministry of Rural
Development as part of Phase VII road construction
Eight railway overbridges, Jaipur na na Irfan 2011-
Undergo preliminary
construction; Funded by Jaipur
Development Authority & North Western Railway
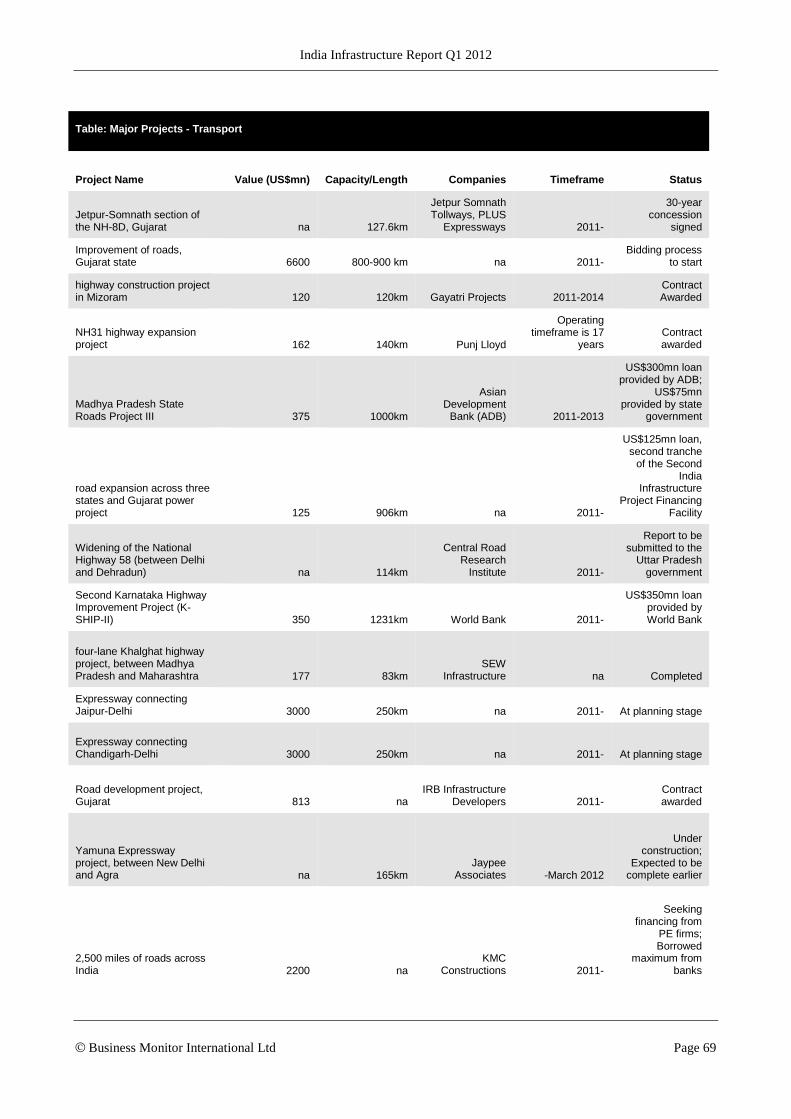
India Infrastructure Report Q1 2012
© Business Monitor International Ltd Page 69
Table: Major Projects - Transport
Project Name Value (US$mn) Capacity/Length Companies Timeframe Status
Jetpur-Somnath section of the NH-8D, Gujarat na 127.6km
Jetpur Somnath Tollways, PLUS
Expressways 2011-
30-year concession
signed
Improvement of roads, Gujarat state 6600 800-900 km na 2011-
Bidding process to start
highway construction project in Mizoram 120 120km Gayatri Projects 2011-2014
Contract Awarded
NH31 highway expansion project 162 140km Punj Lloyd
Operating timeframe is 17
years Contract awarded
Madhya Pradesh State Roads Project III 375 1000km
Asian Development
Bank (ADB) 2011-2013
US$300mn loan provided by ADB;
US$75mn provided by state
government
road expansion across three states and Gujarat power project 125 906km na 2011-
US$125mn loan, second tranche
of the Second India
Infrastructure Project Financing
Facility
Widening of the National Highway 58 (between Delhi and Dehradun) na 114km
Central Road Research
Institute 2011-
Report to be submitted to the
Uttar Pradesh government
Second Karnataka Highway Improvement Project (K-SHIP-II) 350 1231km World Bank 2011-
US$350mn loan provided by World Bank
four-lane Khalghat highway project, between Madhya Pradesh and Maharashtra 177 83km
SEW Infrastructure na Completed
Expressway connecting Jaipur-Delhi 3000 250km na 2011- At planning stage
Expressway connecting Chandigarh-Delhi 3000 250km na 2011- At planning stage
Road development project, Gujarat 813 na
IRB Infrastructure Developers 2011-
Contract awarded
Yamuna Expressway project, between New Delhi and Agra na 165km
Jaypee Associates -March 2012
Under construction;
Expected to be complete earlier
2,500 miles of roads across India 2200 na
KMC Constructions 2011-
Seeking financing from
PE firms; Borrowed
maximum from banks

India Infrastructure Report Q1 2012
© Business Monitor International Ltd Page 70
Table: Major Projects - Transport
Project Name Value (US$mn) Capacity/Length Companies Timeframe Status
Road construction project, Rajasthan 128 53km
Reliance Infrastructure 2011 -
Contract awarded (June
2011)
Six lane Ahmedabad-Udaipur-Kishangarh expressway-widening project (include new bypass in Udaipar), from Gujarat to Rajasthan 1260 555.5km
GMR Infrastructure
September 2011 -
26-year concession
awarded (July 2011)
Concessionary agreement
signed in Sep 2011
4-lane highway widening project between Jabalpur and Lakhanadone, Madhya Pradesh 237 81km na June 2011 -
Gannon Dunkerley & Co
(GDCL) made lowest bid for contract (July
2011)
Adityapur to Jamshedpur PPP toll bridge, Kharkai river na 2.22km
Tata Steel , Adityapur Area
Authority July 2011 Completed
Two road widening projects (four-laning of national highways in Orissa and Madhya Pradesh) 790 na na July 2011 -
Received government
approval (July 2011)
Road widening project (four-laning of Lucknow Sultanpur section in Uttar Pradesh) 219 na Essar-Atlanta
September 2011 -
Contract signed with National
Highways Authority of India
(Sep 2011)
93km Ahmedabad-Vadodara section of the 120km NH-8 816.6 93km
IRB Ahmedabad-Vadodara Super
Express, IRB Infrastructure
Investors July 2011 -2014
Deal signed with Indian National
Highways Authority (July
2011)
North Eastern State Roads Investment Programme - upgrade 433.7km of roads in Assam (137.6km), Manipur (93.2km), Meghalaya (93.4km), Mizoram (55km), Sikkim (34.2km), Tripura (20.3km) 285 433.7km
Asian Development
Bank July 2011 - 2016
US$192mn loan from ADB;
US$94mn from Indian
government (July 2011)
Shivpuri-Dewas national highway project, Madhya Pradesh 633 330km
GVK Power and Infrastructure
(GVKPIL) August 2011 -
30-year BOT concession
awarded (August 2011)
2 state highway PPP projects (Delhi-Saharanapur-Yamunotri road and the Bareilly-Almora-Bagheshwar road), Uttar Pradesh 466.8 na
SEW-Prasad Consortium,
PNC-Infratech August 2011 -
PPP contract awarded (August
2011)
Two-laning the road na na na August 2011 - Received

India Infrastructure Report Q1 2012
© Business Monitor International Ltd Page 71
Table: Major Projects - Transport
Project Name Value (US$mn) Capacity/Length Companies Timeframe Status
widening project, Bikaner to Suratgarh
approval from PPP Appraisal
Committee (August 2011)
Four-laning road widening project, between Vijayawada and Machlipatnam na na na August 2011 -
BOT contract received
approval from PPP Appraisal
Committee (August 2011)
NH-7 motorway – four-laning project 434.11 na
Indian Cabinet Committee on Infrastructure na
Approved by Indian Cabinet Committee on Infrastructure
(CCI)
Two-lane road tunnel project between Chennai and Nashri, Udhampur district, Jammu and Kashmir province 809.5 9km
Leighton Welspun
Contractors September 2011
- 2016
Under construction (September
2011)
Eight-lane highway project, between Mumbai and Jawaharlal Nehru port 478 na na
September 2011 -
Project announced by
NHAI (Sep 2011)
Maharashtra-Amravati-Gujarat highway project 1000 na na
September 2011 -
Project announced by
NHAI (Sep 2011)
5 PPP road projects (include Agra-Etawah, Uttar Pradesh; Rampur-Kathgodam, Uttarakhand; Raipur-Bilaspur, Chhattisgarh) 1400 na na
September 2011 -
Projects approved by Indian PPP
approval committee (Sep
2011)
Four-lane National Highway No. 3 (Mumbai-Agra) expansion na 332km
GVK Power & Infrastructure October 2011 -
BOT contract awarded to NHAI
(September 2011)
Jaipur ring road, Rajasthan state 210 47km
Sanjose, Supreme Oct 2011 -
28-year contract awarded (Oct
2011)
Hungund - Hospet road project, Karnataka 365.36 99km
GMR Infrastructure
(GMR), Oriental Structural
Engineers (OSE) February 2010 -
BOT contract awarded (Feb
2010)
Road project between NH-8 at Kotputli (Rajasthan) to NH-1 at Ambala (Haryana) 275 151km
IVRCL Assets & Holding November 2011 -
DBFOT agreement
awarded (Nov 2011)
Source: BMI. na=not available.

India Infrastructure Report Q1 2012
© Business Monitor International Ltd Page 72
Energy and Utilities Infrastructure
Table: India Energy and Utilities Infrastructure Industry Data
2008/09 2009/10 2010/11 2011/12f 2012/13f 2013/14f 2014/15f 2015/16f 2016/17f
Energy and Utilities Infrastructure Industry Value As % Of Total Infrastructure 59.3 60.0 60.0 60.3 60.1 59.6 59.2 59.1 59.0
Energy And Utilities Infrastructure Industry Value, INRbn 1,223.5 1,399.5 1,668.8 1,930.8 2,235.6 2,629.6 3,080.4 3,581.9 4,142.8
Energy and Utilities Infrastructure Industry Value, US$bn 28.1 28.9 36.5 42.0 47.6 57.5 70.8 86.8 103.6
Energy and Utilities Infrastructure Industry Value Real Growth, % chg y-o-y 11.4 12.4 8.7 6.6 7.3 9.4 8.6 8.3 7.7
Energy and Utilities Infrastructure Industry Value As Percent Of Total Construction (%) 27.1 27.9 28.2 28.8 29.2 29.6 29.9 30.2 30.5
Power Plants and Transmission Grids Infrastructure Industry Value As % Of Total Energy and Utilities 58.0 60.1 60.1 61.0 62.3 63.7 65.3 66.2 67.0
Power Plants and Transmission Grids Infrastructure Industry Value, INRbn 709.6 841.4 1,003.3 1,177.9 1,393.7 1,674.9 2,010.8 2,370.5 2,773.8
Power Plants and Transmission Grids Infrastructure Industry Value, US$bn 16.3 17.4 21.9 25.6 29.7 36.6 46.2 57.5 69.3

India Infrastructure Report Q1 2012
© Business Monitor International Ltd Page 73
Table: India Energy and Utilities Infrastructure Industry Data
2008/09 2009/10 2010/11 2011/12f 2012/13f 2013/14f 2014/15f 2015/16f 2016/17f
Power Plants and Transmission Grids Infrastructure Industry Value Real Growth, % chg y-o-y 28.3 16.6 8.7 8.3 9.8 11.9 11.6 9.9 9.0
Power Plants and Transmission Grids Infrastructure Industry Value As % of Total Infrastructure 34.4 36.1 36.1 36.8 37.4 38.0 38.6 39.1 39.5
Power Plants and Transmission Grids Infrastructure Industry Value As % of Total Construction 15.7 16.8 17.0 17.6 18.2 18.9 19.5 20.0 20.4
Oil and Gas Pipelines Infrastructure Industry Value As % Of Total Energy and Utilities 36.0 34.9 34.9 34.4 33.4 32.3 30.8 30.1 29.4
Oil and Gas Pipelines Infrastructure Industry Value, INRbn 440.5 487.7 581.6 664.9 746.6 848.2 949.8 1,077.4 1,219.1
Oil and Gas Pipelines Infrastructure Industry Value, US$bn 10.1 10.1 12.7 14.5 15.9 18.5 21.8 26.1 30.5
Oil and Gas Pipelines Infrastructure Industry Value Real Growth, % chg y-o-y -6.3 8.7 8.7 5.2 3.8 5.4 3.5 5.4 5.1
Oil and Gas Pipelines Infrastructure Industry As % of Total Infrastructure 21.3 20.9 20.9 20.8 20.1 19.2 18.3 17.8 17.4
Oil and Gas Pipelines Infrastructure Industry As % of Total Construction 9.8 9.7 9.8 9.9 9.7 9.6 9.2 9.1 9.0

India Infrastructure Report Q1 2012
© Business Monitor International Ltd Page 74
Table: India Energy and Utilities Infrastructure Industry Data
2008/09 2009/10 2010/11 2011/12f 2012/13f 2013/14f 2014/15f 2015/16f 2016/17f
Water Infrastructure Industry Value As % Of Total Energy and Utilities 6.0 5.0 5.0 4.6 4.3 4.0 3.9 3.7 3.6
Water Infrastructure Industry Value, INRbn 73.4 70.4 83.9 88.0 95.4 106.5 119.8 134.0 149.9
Water Infrastructure Industry Value, US$bn 1.7 1.5 1.8 1.9 2.0 2.3 2.8 3.2 3.7
Water Infrastructure Industry Value Real Growth, % chg y-o-y -6.3 -6.1 8.7 -4.3 -0.2 3.4 4.0 3.9 3.9
Water Infrastructure Industry As % of Total Infrastructure 3.6 3.0 3.0 2.8 2.6 2.4 2.3 2.2 2.1
Water Infrastructure Industry As % of Total Construction 1.6 1.4 1.4 1.3 1.2 1.2 1.2 1.1 1.1
e/f = BMI estimate/forecast, Source: BMI Research
Table: India Energy and Utilities Infrastructure Industry Data
2013/14f 2014/15f 2015/16f 2016/17f 2017/18f 2018/19f 2019/20f 2020/21f 2021/22f
Energy and Utilities Infrastructure Industry Value As % Of Total Infrastructure 59.6 59.2 59.1 59.0 59.0 58.9 58.8 58.8 58.7
Energy And Utilities Infrastructure Industry Value, INRbn 2,629.6 3,080.4 3,581.9 4,142.8 4,750.6 5,425.2 6,181.2 7,009.2 7,944.9
Energy and Utilities Infrastructure Industry Value, US$bn 57.5 70.8 86.8 103.6 121.8 142.8 162.7 184.5 209.1

India Infrastructure Report Q1 2012
© Business Monitor International Ltd Page 75
Table: India Energy and Utilities Infrastructure Industry Data
2013/14f 2014/15f 2015/16f 2016/17f 2017/18f 2018/19f 2019/20f 2020/21f 2021/22f
Energy and Utilities Infrastructure Industry Value Real Growth, % chg y-o-y 9.4 8.6 8.3 7.7 6.7 6.2 5.9 5.4 5.3
Energy and Utilities Infrastructure Industry Value As Percent Of Total Construction (%) 29.6 29.9 30.2 30.5 30.7 30.9 31.0 31.2 31.2
Power Plants and Transmission Grids Infrastructure Industry Value As % Of Total Energy and Utilities 63.7 65.3 66.2 67.0 67.6 68.2 68.7 69.2 69.6
Power Plants and Transmission Grids Infrastructure Industry Value, INRbn 1,674.9 2,010.8 2,370.5 2,773.8 3,212.3 3,700.1 4,248.2 4,850.0 5,531.7
Power Plants and Transmission Grids Infrastructure Industry Value, US$bn 36.6 46.2 57.5 69.3 82.4 97.4 111.8 127.6 145.6
Power Plants and Transmission Grids Infrastructure Industry Value Real Growth, % chg y-o-y 11.9 11.6 9.9 9.0 7.8 7.2 6.8 6.2 6.1
Power Plants and Transmission Grids Infrastructure Industry Value As % of Total Infrastructure 38.0 38.6 39.1 39.5 39.9 40.2 40.4 40.7 40.9
Power Plants and Transmission Grids Infrastructure Industry Value As % of Total Construction 18.9 19.5 20.0 20.4 20.8 21.1 21.3 21.6 21.8

India Infrastructure Report Q1 2012
© Business Monitor International Ltd Page 76
Table: India Energy and Utilities Infrastructure Industry Data
2013/14f 2014/15f 2015/16f 2016/17f 2017/18f 2018/19f 2019/20f 2020/21f 2021/22f
Oil and Gas Pipelines Infrastructure Industry Value As % Of Total Energy and Utilities 32.3 30.8 30.1 29.4 28.9 28.4 27.9 27.5 27.1
Oil and Gas Pipelines Infrastructure Industry Value, INRbn 848.2 949.8 1,077.4 1,219.1 1,371.1 1,538.5 1,724.9 1,927.2 2,154.3
Oil and Gas Pipelines Infrastructure Industry Value, US$bn 18.5 21.8 26.1 30.5 35.2 40.5 45.4 50.7 56.7
Oil and Gas Pipelines Infrastructure Industry Value Real Growth, % chg y-o-y 5.4 3.5 5.4 5.1 4.5 4.2 4.1 3.7 3.8
Oil and Gas Pipelines Infrastructure Industry As % of Total Infrastructure 19.2 18.3 17.8 17.4 17.0 16.7 16.4 16.2 15.9
Oil and Gas Pipelines Infrastructure Industry As % of Total Construction 9.6 9.2 9.1 9.0 8.9 8.8 8.7 8.6 8.5
Water Infrastructure Industry Value As % Of Total Energy and Utilities 4.0 3.9 3.7 3.6 3.5 3.4 3.4 3.3 3.3
Water Infrastructure Industry Value, INRbn 106.5 119.8 134.0 149.9 167.2 186.5 208.2 232.0 258.9
Water Infrastructure Industry Value, US$bn 2.3 2.8 3.2 3.7 4.3 4.9 5.5 6.1 6.8
Water Infrastructure Industry Value Real Growth, % chg y-o-y 3.4 4.0 3.9 3.9 3.6 3.5 3.6 3.4 3.6

India Infrastructure Report Q1 2012
© Business Monitor International Ltd Page 77
Table: India Energy and Utilities Infrastructure Industry Data
2013/14f 2014/15f 2015/16f 2016/17f 2017/18f 2018/19f 2019/20f 2020/21f 2021/22f
Water Infrastructure Industry As % of Total Infrastructure 2.4 2.3 2.2 2.1 2.1 2.0 2.0 1.9 1.9
Water Infrastructure Industry As % of Total Construction 1.2 1.2 1.1 1.1 1.1 1.1 1.0 1.0 1.0
e/f = BMI estimate/forecast, Source: BMI Research

India Infrastructure Report Q1 2012
© Business Monitor International Ltd Page 78
Energy and Utilities Infrastructure Forecast Scenario
In 2009/10 energy and utilities
infrastructure accounted for
60% of total infrastructure
industry value, equal to
INR1.4trn (US$29bn). Over
the forecast period, the sector’s
share is expected to remain
stable as substantial industry
value is created from
investments in power plants,
transmission grids, fuel
pipelines and water
infrastructure. By 2015/16, the
industry is expected to be
worth INR3.6trn (US$87bn)
following a substantial build
up in the provision of utilities
and energy infrastructure.
Expanding electricity
generating capacity will be the main driver of growth in the wider energy and utilities infrastructure
sector. In order to realise economic growth potential and meet demand from an ever-expanding demand
base, a reliable electricity supply is crucial. This has led to ambitious targets for electricity generation,
including 470GW of nuclear power by 2050, 20GW of solar power by 2022 and 20GW of wind capacity
by 2020. While we do not expect all of these targets to be met, achieving even 50% would present
massive opportunities for companies associated with the industry. There is also a substantial build-up of
coal and gas-fired power plants.
According to BMI's Key Projects Database there is in excess of US$212bn worth of projects either under
construction or in the pipeline in the Indian power plants and transmission grids sector. This is guiding
our optimistic forecasts for the sub-sector's industry value, which we believe will grow by an average of
10.3% per annum between FY11/12 and FY15/16 , from INR1.2trn (US$26bn) in FY11/12 to INR2.4trn
(US$57.5bn) in 2015/16.
A total of INR6.7trn (US$150bn) was slated to be invested in the sector in the 11th Five-Year Plan
(2007/08-2011/12), and the government is largely on target to meet this goal, having fallen just 1% short
at the time of the mid-term appraisal. During the 11th Five-Year plan it is hoped that 78GW of additional
capacity will come online, with a further 100GW of capacity planned in the 12th Five-Year Plan period.
Powering Forward
Infrastructure Industry Value And Energy & Utilities Share
BMI f=forecast, Source: BMI, Local news sources, industry sources, BMI Research (Key Projects Database)

India Infrastructure Report Q1 2012
© Business Monitor International Ltd Page 79
Energy and Utilities Infrastructure Overview
India’s electricity sector
is insufficient to cope with
demand, which has been
growing at a
significant pace,
fuelled by rapid
population growth and
continued high levels of
economic growth. This
is set to continue over
coming years and
presents a major
obstacle to the
country's business
environment and
economic
development. It also
cements existing
regional variances in development.
In order to realise the country's economic growth potential and meet demand from an ever-expanding
demand base, a reliable electricity supply is crucial. Massive energy investment is required to achieve
targeted economic expansion and the Indian government has set very ambitious targets for electricity
generation, including 470GW of nuclear power by 2050, 20GW of solar power by 2022 and 20GW of
wind capacity by 2020. In May 2011, the Indian Ministry of Power estimated that about INR11.2trn
(US$252bn) would be required to sustain the power sector during the 12th Five-Year Plan (2012-17).
Nearly half of this funding, INR5.1trn, would be required for the development of 100GW worth of
electricity generation capacity, while another INR2.1trn and INR4.0bn would be required for the
transmission and distribution of electricity. The expansion of coal, hydro and nuclear power forms the
basis of the short-term capacity growth, and the medium-term focus will shift towards gas.
Funding needs, existing regional variances in development as well as bureaucratic red-tape are among the
principal downside risks to this plan. Latest data from the Ministry of Statistics and Programme
Implementation show that 34 power projects in India were on schedule in December 2010, but 43 were
delayed, while a further 12 faced additional delays. Furthermore, India will miss its target of adding
78.6GW of power generation capacity in the five years to March 2012 by almost a quarter, due to a
India Electricity Generation Capacity Mix, 2011e
e/f= BMI estimate/forecast, Source: UN Data, BMI

India Infrastructure Report Q1 2012
© Business Monitor International Ltd Page 80
shortage of fuels such as coal and gas needed to fire electricity plants, according to Power Secretary H.S.
Brahma. Nevertheless, it appears that the country is making strides to address this deficit in electricity,
with a recent announcement from the Indian Power Minister, Sushil Kumar Shinde, stating that the
country suffered from a 6.6% deficit in power supply during the first quarter of FY2011/12 (April -
June), an improvement from a 11.1% power deficit in Q1 FY2008/09.
Private capital forms a significant part of the financing jigsaw for the power generation sector. A
consortium of global investors has acquired a 44% stake in Asian Genco Pte Ltd (AGPL), an
infrastructure company with a focus on the Indian power sector. The deal is the largest equity transaction
to date in the Indian power sector and is an endorsement of the sector’s potential. APGL is domiciled in
Singapore, but its entire power generation portfolio is located in India.
The consortium of global investors is led by Morgan Stanley Infrastructure Partners and also includes
General Atlantic, Goldman Sachs Investment Management, Norwest Venture Partners, Everstone
Capital and PTC India Financial Services. Together the investors have committed US$425mn to AGPL
in order to boost its presence and market share in the Indian power sector. The company has targets to put
1,350MW of capacity into operation, as well as plans to develop a project pipeline exceeding 10,000MW,
by 2012.
Thermal Sources to Fire
According to BMI estimates, thermal sources accounted for around 71% of total electricity generation
capacity in India in 2011, with coal alone contributing the bulk. We expect thermal to remain dominant in
the country over the forecast period, with coal seeing its market share declining as more gas power plants
are introduced. However, although many forecasters suggest that gas will see the greatest percentage rise
in installed electricity generation capacity over the next decade, coal is expected to show a substantial
increase in absolute terms. India has significant coal reserves, and coal projects tend to be much cheaper
than gas or other sources. Oil will remain a relatively insignificant part of the Indian power generation
mix, and its market share is expected to decline during the forecast period, with few new facilities being
built.
This focus on coal is exemplified by the government’s focus on developing ultra-mega power plants
(UMPP), which have a coal-based generation capacity of 4000MW each. In August 2011, the Indian
government had chosen two sites on which to build two new ultra-mega power projects, according to
Yahoo! News India. The locations identified were in the states of Tamil Nadu and Andhra Pradesh.
Following consultations with local regional authorities, a further seven power generation projects are due
to be given the go ahead. Currently, four coal-based ultra-mega power projects are in various stages of
development across the country.
These UMPPs are primarily developed by Indian power producers, but foreign companies remain
interested. In August 2011, South Korean energy company Korea East-West Power had formed a

India Infrastructure Report Q1 2012
© Business Monitor International Ltd Page 81
partnership with India's Sahara India Power, according to The Times of India. Under the deal, the two
firms will establish plants with a total capacity of 6,000MW, and will jointly engage in tariff-based
bidding for UMPPs.
India has significant coal resources. According to the Ministry of Coal, India has total coal resources of
256bnt (billion tonnes), of which 33bnt are coking coal assets. Despite its sizeable coal reserves, India is
facing supply shortages in coal and is still heavy reliant on coal imports to meet its electricity demand,
with Indonesia and Australia accounting for around 55% of India’s coal imports, according to the
Economic Times. This dependence is expected to grow exponentially over the coming years, particularly
from Indonesia. According to the Indonesian Coal Mining Association in May 2011, India will surpass
Japan as the leading buyer of Indonesian coal in 2011, importing up to 60mn tonnes, increasing to 90mn
tonnes by 2013. This dependence is because mining projects in India continue to face delays in project
approvals. The country's bureaucracy remains inefficient in issuing statutory land and environmental
clearances for coal mining, as well as in resolving regulatory disagreements between various ministries,
particularly between the country's Ministry of Environment and Forests and the Department of Mines.
Between 2008 and July 2011, the Indian government received a total of 1,258 applications to mine coal,
but only around 158 applications received approval.
However, this overseas reliance has left India’s power generation sector heavily exposed to regulatory
and political risks from Indonesia and Australia. In mid-2011, Indonesia reaffirmed its commitment to
ban all raw mineral exports (including coal) from the country by 2014 while launching a major plan to
increase its domestic coal power generation capacity. These moves could reduce the supply of coal
available for exports in Indonesia, putting more upside pressure on global coal prices. In addition, new
Indonesian mining laws require the annual alignment of coal prices with international rates, where
previously, Indonesian coal mines had the freedom to bilaterally agree on coal prices with buyers. This
new Indonesian law would see coal costs soar to almost double, from $26 a tonne to $60 at current
international prices.
Meanwhile, Australia's coal mining industry, still reeling from the effects of the Queensland floods, is
facing further taxation – the carbon tax and the Mineral Resource Rent Tax – from the government; this
introduces additional political risks to the industry, potentially raising the cost of coal production in the
country. According to the Ashok Khurana, Director General of the Indian Association of Power
Producers (a group of 13 private companies), these new taxes are expected to push coal prices up by
US$20-25 a tonne.
These regulatory changes in Indonesia and Australia could have serious ramifications with regard to the
financial viability of coal power plants in India, as current contractual framework does not protect power
companies from coal price changes triggered by any change in law in the exporting country.
India Infrastructure Report Q1 2012
© Business Monitor International Ltd Page 82
As a result, some companies are putting their plans for coal plants on hold until there is some clarity on
the issue of imported coal. In August 2011, JSW Energy said it had put its Ratnagiri expansion plans on
hold due to costly imported coal, while Reliance Power’s 4,000MW Krishnapatnam coal-fired power
plant , which relies on coal imported from three Indonesian mines owned by Reliance, is expected to face
viability issues – as the Andhra Pradesh government is likely to refuse the company’s suggestion for a
tariff rise, according to the Business Standard.
Saying that, many Indian independent power producers still hold fast to goals of tripling their existing
capacity within the next five years. In October 2011, Essar Power, part of energy developer Essar
Group, has announced plans to invest US$8bn in the construction of new thermal power plants
throughout India over the next three years. Similarly, in September 2011, GVK Power And
Infrastructure announced plans to reach a 7,500MW thermal power generation capacity by 2016/17 (the
company currently has a gas-based capacity of 901MW), while Reliance Power announced that it
expects to reach a capacity of 5000MW by end-2012, with nearly 30,000MW under various stages of
development. Indian state-owned coal mining and power producer Neyveli Lignite Corporation (NLC)
has announced plans to invest INR402bn in boosting the company's power generation capacity by
7,500MW - the company's existing capacity is currently 2,740MW.
A key trend among Indian independent power producers is the vertical integration of their operations,
where large coal-reliant utilities look to purchasing coal assets in India and in overseas markets, such as
Indonesia and Australia. While it is a necessity for the private sector to diversify into India’s coal mining
sector (coal mined from captive mines in India must be used for an attached power, steel or cement plant),
the purchase of overseas coal assets is to hedge against price volatility and ensure the security of supply.
However, it remains to be seen if this strategy would work given the political and regulatory risks
highlighted earlier in these countries.
In August 2011, Lanco Infratech was successfully selected as the Mine Developer and Operator for the
Gare Pelma II coal block in Raigarh, Chhattishgarh. The company is planning to invest INR130bn
(US$2.9bn) in the project, with the bulk of the funds - INR120bn (US$2.7bn) - allocated for the power
project. This project, along with Lanco's recent acquisition of the Griffin coal mine in Australia, could be
crucial in reducing the company's exposure to price volatilities in coal (the Gare Pelma II coal block
boosts the company's coal reserves to over 2bn tonnes).
In August 2011, GMR Energy announced plans to acquire a 30% stake in PT Golden Energy Mines, a
subsidiary of Indonesian conglomerate Sinar Mas Group. The agreement, which is expected to cost
between US$450-550mn, includes a 25-year off-take agreement to supply GMR's coal-fired power plants
(80% still in construction phase) in India, with GMR eventually receiving 10mn tonnes per annum (tpa)
from the Golden Energy Mines. According to Reuters, Golden Energy mines have recoverable coal
reserves (i.e. recoverable coal at current prices) of 860mn tonnes and resources (i.e. total estimated coal

India Infrastructure Report Q1 2012
© Business Monitor International Ltd Page 83
available at the mine) of 1.9bn tonnes. The agreement is expected to be finalised by the end of 2011,
provided conditions laid out in the definitive agreement are met.
In September 2011, GVK Coal Developers (Singapore), a member of the GVK Group which includes
power plant operator GVK Power & Infrastructure (GVKPIL), had reached an agreement with
Australia-based mining company Hancock Prospecting to pay US$1.26bn for a majority stake in the
company's coal assets in Queensland, Australia. The conclusion of the deal means that GVK will acquire:
A 79% stake in the Alpha and Alpha West coal mining project in the Galilee Basin;
A 100% stake in the Kevin's Corner coal mining project in the Galilee Basin;
And a 100% stake in the 400km rail and port project connecting the above coal mining projects to the port of
Abbot Point and its planned T3 terminal.
GVK will pay an initial sum of US$500mn for the acquisition, followed by another US$200mn a year
from now. The remaining US$560mn will be paid on financial close of the project, which is expected to
be in 2012. The first phase of production for the entire coal development project is scheduled to start in
2014, at a rate of 30mn tonnes of thermal coal per annum.
As part of GVK's plan to pay for the
purchase and project developments costs,
it would raise US$1bn by selling
minority stakes in GVK Coal Developers,
while taking on US$1bn in bank loans
through the assistance of its bankers -
ICICI Bank and Standard Chartered.
GVK was also holding discussions with
Indonesia-based miner Kideco Jaya
Agung, as well as with several parties to
sell a part of its majority stake in
Hancock’s coal assets. Although coal-
based power projects dominate the
thermal generation sector, there are
opportunities for natural gas. In September 2011, Indian energy company Haryana Power Generation
Corporation Ltd was reported by the New Kerala to be close to securing environmental clearance for its
proposed 1,500MW energy generation project. The project will be the company's first gas-fired plant, and
a possible site has been identified in the villages of Arwa and Mothuka in Haryana region. The Union
Ministry of Environment and Forests is in the process of approving the project's Environment
Management Plan and preparing an Environmental Impact Assessment report.
Nuclear Capacity Build-Up
2007-2018
0
5,000
10,000
15,000
20,000
25,000
2007
-08
2008
-09
2009
-10
2010
-11
2011
-12
2012
-13
2013
-14
2014
-15
2015
-16
2016
-17
2017
-18
With International Cooperation, MWhWithout International Cooperation, MWh
Source: Nuclear Power Corporation of India Ltd.

India Infrastructure Report Q1 2012
© Business Monitor International Ltd Page 84
Nuclear Waiting to Take Off
India’s nuclear power sector continues to attract the attention of major international players, as it
promises to unlock investments worth hundreds of billions of dollars.
In December 2010, a landmark agreement on nuclear cooperation was signed between France's Areva
and Nuclear Power Corporation of India Limited (NPCIL). The agreement was for the construction of
two 1,650MW EPR reactors at Jaitapur in Maharashtra state, estimated to be worth around US$10bn. The
reactors are part of a series of six and the agreement also includes fuel supply for 25 years. Studies on the
project were due to start in early 2011, with the first reactor expected to come online in eight years.
The Indian government is keen to pursue nuclear as an answer to rapidly growing demand for electricity.
Currently, nuclear power is estimated to account for less than 3% of India’ electricity capacity but the
country hopes to increase the supply of nuclear sources to 25% by 2050.
In late September 2009, India's Prime Minister Manmohan Singh, announced plans for the largest
expansion of nuclear power capacity in the world, stating that by 2050 India could generate up to 470
gigawatts (GW) of nuclear power if the country executes its strategy effectively. India currently has
4,423MW of nuclear power generating capacity from six nuclear power complexes containing 20
reactors; a further 5,300MW are under construction. This strategy would see a more than 11,000%
increase in capacity by 2050.
According to Singh, who made the announcement in a speech at an atomic energy conference in Delhi,
the plans to significantly expand nuclear capacity in the country will increase electricity access, reduce
dependence on fossil fuels and contribute to global efforts to combat climate change. Singh also noted
that the plan would provide numerous opportunities for the global nuclear industry.
No details were mentioned relating to the cost of the plan or how it would be funded. India's nuclear
power sector is not open to foreign direct investment (FDI), with the country's then Atomic Energy Chief,
Anil Kakodkar, ruling that option out in August 2009, according to India's Economic Times. However,
Kakodkar did note that there were still opportunities for private companies to get involved, although
protecting the technological competence of Indian companies was crucial, he said.
Since the lifting of the nuclear trade ban on India in 2008, the sector has seen a rush of activity. All the
major international nuclear companies are keen to get involved in the sector, with France, Russia and the
US all having signed contracts with the country. Companies from these countries have since been
partnering up with Indian firms in order to gain access to the industry, as, according to India's Atomic
Energy Act, technology suppliers can only participate in India's nuclear sector through a JV with a
government-owned company.

India Infrastructure Report Q1 2012
© Business Monitor International Ltd Page 85
The freeing up of India’s nuclear power sector is thought to potentially open up US$150bn of investment,
according to India’s Economic Times. A letter of intent has been written for the construction of
10,000MW of new nuclear power technology, and 60,000MW of planned additional capacity by 2032.
The country was banned from trading in nuclear technology because of its refusal to sign the Treaty on
the Non-Proliferation of Nuclear Weapons (NPT) in 1968, and because of its subsequent testing of an
atomic weapon in 1974. Following the signing of the nuclear power co-operation agreement between the
US and India in October 2008, the country also signed agreements with the other two nuclear power
majors, Russia and France. As a result of this, India’s nuclear power sector is set for a rapid expansion,
and the international competition is lining up to get a slice of India’s nuclear pie.
It should be noted that, despite a huge pipeline of nuclear projects approved in recent years, funding
represents a significant downside risk to this extremely ambitious plan. Furthermore, the Fukushima
nuclear crisis in Japan has led to an adverse public reaction towards nuclear power. We have already seen
local civilian protests against the development of the country's largest nuclear power complex at Jaitapur
escalate violently. In April 2011, clashes between protestors and local police left one protestor dead and
at least 50 people injured. France-based Areva has also concluded in an internal report that the recent
Fukushima nuclear crisis in Japan could lead to a delay in the development of Jaitapur nuclear power
complex, due to a re-assessment of the safety standards at the site. In March 2011, India's Prime Minister
Manmohan Singh said that India's nuclear power programme was on track, with more stringent safety
controls to be implemented following the Fukushima crisis.
India's nuclear power sector also presents a political conundrum for the current incumbent party, the
Indian National Congress. A recent WikiLeaks cable published in March 2011 alleged that the party
bribed lawmakers, offering them US$2.2mn each, to secure their support for a crucial 2008 vote over a
nuclear deal with the United States, which was passed, according to the Economic Times. The nuclear
deal, known as the 123 Agreement, is vital to the growth of India's civil nuclear sector because it allows
the country to take part in international nuclear commerce, while authorising Indian scientists to
participate in international nuclear research activities.
While Prime Minister Singh has said that no government members were involved in vote-buying, it is
possible that the drive for nuclear power in India could take a backseat, as the government seeks to sooth
anti-nuclear sentiment, in the short-term at least. This means a potential delay to existing nuclear power
projects in India, where, according to the latest data from the World Nuclear Association and NPCIL,
there are seven nuclear reactors under construction and 24 nuclear reactors planned or firmly proposed.
However, BMI believes that if policy makers decide to take a cautious stance towards new nuclear new
builds (essentially an indefinite wait and see approach) following the Fukushima accident, it would mean
ignoring crucial factors that differentiate Japan's nuclear power industry – and specifically the Fukushima
reactor – from new generation plants. It should be noted that nuclear industry experts have been pointing

India Infrastructure Report Q1 2012
© Business Monitor International Ltd Page 86
out since the first reactor collapsed that the design for new builds, mainly in Europe, has much more
advanced safety features than the older generation plants commissioned in the 1970s and 1980s.
Consequently, the proposed Jaitapur nuclear power plant should be similarly advanced. It had, prior to
the Fukushima crisis, received clearance from the Indian environmental ministry, imposing 35 conditions
for the clearance.
Growing Increasingly Confident On Renewables
India is increasingly looking towards renewable as an alternative source of electricity. In January 2011,
India's Ministry of New & Renewable Energy announced that it raised the country's renewable energy
targets fourfold to 72,400MW by 2022. We believe this increase in renewable energy targets stems from
high interest in India's solar projects, and the country's growing energy security concerns. We further note
that this ambitious target has a long and uncertain path to realisation.
The revised renewable energy target includes the existing solar power initiative – the Jawaharlal Nehru
National Solar Mission, a three-stage plan to generate 22,000MW of solar power, 2000MW of which will
come from off-grid distributed solar capacity – in addition to the construction of 20mn square metres (m2)
of solar thermal projects by 2022. Besides raising renewable energy targets, India has also stated that it
hopes to reduce emissions intensity (carbon emissions per unit of GDP) by 20%-25% of 2005 levels by
2020. Renewable energy sources recognised by India's renewable ministry include solar, wind and small
hydropower plants, but not large hydropower projects, according to the Wall Street Journal.
We believe that the immediate reason for this latest increase in renewable energy targets is due to the
overwhelming private-sector interest in India's first major solar auction, launched at the end of 2010.
India's plans for the installation of more than 100MW of solar capacity in 2011 was more than 10 times
over-subscribed. This has boosted India's confidence in meeting its renewable energy targets and it is now
fast-tracking its solar plans to capitalise on this strong interest. Contracts for a further 620MW of installed
solar capacity have since been awarded by India and tenders for an additional 300MW were expected to
be launched in January 2011.
Another contributing factor to this increase in renewable energy targets is energy security concerns,
particularly with regard to coal supplies. India currently generates about 65% of its electricity supply
from coal sources. With growing electricity demand due to robust economic growth, we believe that
India's coal consumption and imports are likely to rise rapidly over the medium term. According to BMI's
forecasts, India's coal consumption will grow from 360mn tonnes in 2010 to 411mn tonnes in 2015 (up
14%), while Wood Mackenzie forecasts show that India might overtake China by 2019 as the largest
thermal coal buyer, with purchases of 182m tonnes. This means that India will be increasingly exposed to
coal price hikes and a greater reliance on renewable energy sources for electricity supply could therefore
offset some of this exposure to price fluctuations.
India Infrastructure Report Q1 2012
© Business Monitor International Ltd Page 87
While we are encouraged by the country's commitment to the implementation of renewable energy
sources, there are significant risks that are derailing such an ambitious plan. The fierce competition at
India's first solar auction has resulted in many companies offering deep discounts to secure these
contracts, significantly increasing the risk of project failure and delays. Many of India's renewable energy
policies are also incoherent, with state governments free to determine their own renewable energy
policies. While India's renewable ministry has introduced renewable energy certificates to encourage state
distribution utilities to purchase a specified minimum percentage of renewable power, this trading scheme
has yet to gain favour with utility companies. These factors, combined with India's nebulous bureaucratic
system, means that there are still significant hurdles to overcome before meeting its ambitious target.
Hydropower
Hydropower accounts for a significant proportion of India’s electricity generating capacity. In 2011, it
accounted for around 20% of India's total installed generating capacity, and India aims to develop its
hydro potential even further. There is a large amount of hydroelectric capacity, both large- and small-
scale projects, in the construction and planning stages, according to the Indian government. The
Brahmaputra river basin in eastern India is expected to result in several large power plants, which could
add nearly 30GW to capacity. A major policy initiative in the sector was announced in January 2008, with
hydropower initiated into the ultra-mega power project (UMPP). The average size of hydro projects is
expected to be 500MW.
One of the largest hydropower plants being developed in India is the 9500MW Siang Upper hydropower
project. In August 2011, the India state-owned power producer National Thermal Power Corporation
(NTPC) announced that it would invest about INR1.0trn (US$22bn) to develop the hydropower project in
the state of Arunachal Pradesh. The Siang Upper project would be India's largest hydropower plant if
completed, and one of the largest in the world - the largest operational hydropower plant in India is
currently the 1,500MW Nathpa Jhakri project. NTPC is currently in discussions with the state
government about the project, while conducting field studies in preparation for a detailed report. NTPC
also plans to commission its 800MW Koldam project in Himachal Pradesh in 2012.
While this project, if completed, will have a major impact in meeting electricity demand in the
surrounding region, we note that hydropower plants, particularly large-scale ones, typically face
significant opposition from the local populace, due to perceived lack of compensation for
displacement, as well as environmental concerns due to the large swathes of land which are flooded and
the disruption to the natural ecosystems. A recent example is the stiff public opposition for the INR26bn
Sinodol hydropower project in the state of Orissa. The Sinodol hydropower plant is located at three sites
across the Mahanadi river in the western part of the Orissa state, and is likely to affect farming in the
region. This is the major gripe among the local populace and as a result of this public pressure against the
project, the Orissa government has decided to conduct public hearings before launching the 320MW
Sinodol hydropower project, delaying its implementation. Given that the Siang Upper hydropower project
is much larger, we believe that the project could face similar problems.
India Infrastructure Report Q1 2012
© Business Monitor International Ltd Page 88
Meanwhile, a total of 636 hydro projects, with capacity of less than 25 MW each, are expected to be
commissioned by India during the 12th Five-Year Plan (2012-2017). These projects were allotted by the
state governments and are due to receive environment and forest clearances by Ministry of Environment
and Forests regional offices within a short period of time.
Come Wind......
Wind has being targeted as an important element of the country’s future power mix. By 2022, the
government is planning to have more than 20,000MW of wind generating capacity, according to the
Minister for New and Renewable Energy, Farooq Abdullah, as reported by the Economic Times. Current
wind capacity in India is 13,065MW. It is presently one of the largest sources of renewable electricity in
the country, accounting for 70% of current installed capacity from renewable sources. However, the
country has the potential for 49.1GW of installed capacity. In order to increase the speed of wind power
development, India is in the process of changing the structure of its incentives for wind power.
Previously, subsidies supported investment in turbines, allowing companies to claim 80% depreciation on
equipment costs in the first year, according to Bloomberg. This incentive served to turn India into a hub
for wind turbine manufacture, and helped India's Suzlon Energy to become one of the top five turbine
manufacturers in the world.
In December 2009, India's Ministry of New and Renewable Energy announced that it would move to
generation-based incentives, in order to reduce the cost of purchasing electricity generated by wind,
making it a more affordable (and therefore realistic) source of electricity. The proposal includes an
incentive of INR0.50 (US$0.0107) for electricity generators per unit of wind energy produced, though it
remains unclear at this point what form this incentive will take. The old incentives will be phased out by
the end of the 11th Five-Year Plan, 2012, with the new plans taking over. Under the new system, the
government will spend around INR3.8bn (US$81mn) on subsidies, according to the Wall Street Journal.
This follows on from the decision by the Central Electricity Regulatory Commission to guarantee a 19%
pre-tax return on investment in renewable energy for the first 10 years of operation. These incentives are
targeted at wind-power, solar, biomass and small hydro projects. Critics claim that government support
for renewable energy is so extensive in India that the sector is essentially unviable as a standalone
industry. However, with the government looking to commit to long-term renewable energy incentives by
the time state support is removed, the technological capability of the sector may have improved to the
extent that it can compete with thermal sources of power in terms of price. The Indian market is also
emerging as one of the major manufacturing hubs for wind turbines in Asia, and according to the Global
Wind Energy Council, there are currently seventeen manufacturers with an annual production capacity of
7,500MW.
This potential for growth has captured the interest of international investors. In September 2011, ReNew
Wind Power announced that the private equity (PE) division of Goldman Sachs Group will invest up to
INR10bn (US$204mn) in the Indian wind power producer. The investment means that Goldman Sachs
India Infrastructure Report Q1 2012
© Business Monitor International Ltd Page 89
will likely acquire a majority stake in the company, which was founded by Sumant Sinha, a former Chief
Operating Officer of India's largest wind turbine manufacturer Suzlon Energy. ReNew is expected to use
the funds to meet its generation capacity targets, where the company plans to develop up to 200 to 300
megawatts (MW) of wind power capacity per annum, reaching a total wind power capacity of 1000MW
by 2015. Besides Goldman Sachs, ReNew had signed agreements with Suzlon, Germany-based Kenersys
GmbH and India-based Regen Powertech to implement wind farms throughout India. At present,
ReNew is currently developing a 25MW and 60MW wind farm in the Indian states of Gujarat and
Maharashtra respectively.
In August 2011, Indian power producer Reliance Power (R Power) announced plans to make a INR15bn
(US$333.2mn) investment in a 200MW wind power plant project in Vashpet, Maharashtra. The plant,
which is scheduled to start operations in September 2012, will have 80 wind electric generators supplied
by German wind turbine supplier Fuhrländer. A long-term power purchase agreement (PPA), already
sanctioned by the Maharashtra State Electricity Regulatory Commission, has been signed with Indian
construction company Reliance Infrastructure (RInfra) at a rate of INR5.37 (US$0.12) per unit. The
plant's generation capacity will eventually increase to 400MW. The project will be entitled to receive
3.7mn certified emission reductions (CERs) during the first 10 years, which is likely to generate
additional revenue of INR3bn (US$66.6mn) for the project.
...........Or Shine
India also has vast potential for solar power. The country receives 5,000trn kilowatt-hours (KWh) a year
of solar energy equivalent, compared to its projected total energy consumption in 2010 of only 848bn
KWh, according to India's Ministry of New and Renewable Energy. In light of existing challenges in
meeting India's growing energy needs, the government is looking to harness this solar potential, launching
the Jawaharlal Nehru National Solar Mission in November 2009 and announcing favourable incentives to
attract investors. The plan has been scaled down from the draft proposal, but is still ambitious,
considering the country's current near-zero capacity. The solar plan will be executed in three phases, with
a final target of 20,000MW by 2022. The initial phase, from 2010 to 2013, plans to add 1,100MW of
solar capacity. Initial investment will be US$935mn, and it is estimated that the full proposal will cost
around US$19bn.
The Mission aims to create a conducive environment for solar technology penetration, both at a
centralised and decentralised level. The first phase will focus on:
• Capturing the low-hanging options in solar thermal;
• Promoting off-grid systems to serve populations without access to commercial energy; and
• Favouring modest capacity addition in grid-based systems.
India Infrastructure Report Q1 2012
© Business Monitor International Ltd Page 90
Banking on newly acquired experience, the second phase will focus on an aggressive increase in capacity,
with a view to creating the conditions for up-scaled and competitive solar energy penetration in the
country.
The project is one of 40 schemes that are planned to transform the area of desert land which makes up the
India/Pakistan border, into a solar power hub, with Gujarat at the centre.
This combination of vast growth potential and favourable government policies has attracted a large
number of companies to these projects. In November 2010, the Indian government received bids to
generate 1,740MW of solar photovoltaic (PV) power; however, it only plans to allocate 150MW of solar
PV projects. This fierce competition for the projects has also lead to aggressive cost undercutting. For
example, international solar manufacturer Moser Baer has won a solar project in Maharashtra state at
INR120mn (US$2.63mn) per MW, while government projections for the project were estimated at
INR170mn per MW, according to reports by Forbes India. India's Ministry of New and Renewable
Energy approved 802MW of grid-connected solar projects in 2010 alone.
BMI is concerned about such aggressive undercutting measures, as they heighten the level of risk of
project delays, cost overruns and future profitability. Many of the estimated costs for these projects are
based on projections of future earnings that have no precedent. Furthermore, it is unclear if these earnings
projections have taken into account the difficulties associated with the construction of these specific solar
projects. For instance, many of the projects are located in areas with limited access to water – a necessary
resource in the solar power generation process and in keeping the panels clean – and it is unclear if the
government is able to provide the necessary quantities of water.
Another problem is access to financing. In March 2011, the government stated that it plans to provide
additional funds of up to INR15bn (US$333mn) to banks and finance solar energy projects. These funds
will be provided interest free to the lenders by the Indian Renewable Energy Development Agency
(IREDA), a non-banking financial institution that belongs to the Indian renewable energy ministry and
provides term loans to renewable energy projects. The funds will then be loaned to companies that are
establishing small solar projects – amounting to a total capacity of 200MW – at an interest rate of 5%,
significantly lower than the State Bank of India's prime lending rate of 11.75%. These projects are part of
Phase 1 of the Jawaharlal Nehru National Solar Mission.
The Indian government's ambitious plans and strong support for renewables is creating significant
opportunities for solar power companies, many of whom competed fiercely for projects during India's
first major solar auction in 2010 – As of July 2011, the country had so far issued licences for seven solar-
thermal plants - totalling 770MW (according to data from Bloomberg) - to companies such as Reliance
Power , Lanco and Godawari Power & Ispat. This keen interest from the private sector has encouraged
the Indian government to increase its renewable energy targets fourfold to 72,400MW by 2022 and boost
funding for renewable energy projects. India's New and Renewable Energy Ministry has seen its allocated
India Infrastructure Report Q1 2012
© Business Monitor International Ltd Page 91
budget rise by 20% to INR12.1bn (US$269.5mn) for 2011, from INR1.0bn (US$224mn) in 2010. The
government has also allocated INR6.6bn (US$148mn) for grid-interactive and distributed renewable
energy, while INR1.8bn (US$39mn) has been assigned to develop renewable power for rural applications
in 2011. However, we believe that providing greater access to financing is insufficient if the significant
regulatory and operational risks inherent in India's solar power sector are not tackled. Many of India's
renewable energy policies are still incoherent, with state governments free to determine their own
renewable energy schemes. While India's renewable ministry has introduced renewable energy
certificates to encourage state distribution utilities to purchase a specified minimum percentage of
renewable power, this trading scheme has yet to gain favour with utility companies, the main purchasers
of electricity. Investment in India's grid infrastructure is also lagging the development of power plants,
thus a bulk of the electricity generated from these solar power plants could be wasted.
In October 2011, in an attempt to prevent further delays to project implementation in its power sector,
India had granted developers of large solar-thermal power plants exemptions from having to obtain
environmental clearances. This move was initiated by the government as an attempt to shield Indian
power companies from the obstacles faced by other energy and mining companies, which face the risk of
missing output targets in 2011 and 2012 because of delays in obtaining environmental clearances.
Although developers must still demonstrate that they are not using protected land and have applied for
water permits, broader exemptions should ease construction delays for companies. We believe that this
move is short-sighted, even though the decision might speed-up the commissioning process in the early
stages of project development. India needs to streamline its regulatory procedures; yet the removal of a
priori environmental-permit requirements is hardly a solution. Such a move will simply introduce new
risks to projects during the construction phase and might easily lead to their suspension and/or
cancellation in the later stages of the project life-cycle.
Transmitting Power
The overall length of India’s power grid is almost 6.5mn km. The annual loss of power through the
system is estimated at more than 30%. As of 2006, about three-quarters of India’s villages received an
electricity supply, but only 43% of rural households had been provided with a permanent supply.
According to the Planning Commission of India, 600mn people are not connected to the power grid.
State-owned Power Grid Corporation of India (PGCIL), which transmits 51% of the generated power
across India and has approximately 22.4-gigawatt of interregional capacity, is developing an integrated
national grid, in a phased manner, for strengthening the five regional grids. Inter-regional power transfer
capacity of 9.5GW at the end of 2005 is expected to be enhanced to 30GW by 2012. About US$16bn is
required for the central transmission sector.
The Asian Development Bank is also keen to aid the PGCIL in developing India’s transmission network,
announcing in October 2011 that it will be providing PGCIL with a US$750mn loan for a national grid
upgrading project. The project involves the construction of a 1,300km interregional transmission line,
India Infrastructure Report Q1 2012
© Business Monitor International Ltd Page 92
using 800 kV high-voltage direct-current (HVDC) technology. According to the ADB, the upgrade would
allow the grid system to transfer three gigawatts (GW) of electricity from independent power producers in
the western state of Chhattisgarh to regions of high demand in the north, including the national capital
territory of Delhi. The ADB loan will consist of a US$500mn sovereign-guaranteed loan and a
US$250mn non-sovereign corporate loan.
The project could make a material impact in addressing the electricity demand in India's northern states.
The Chhattisgarh state is one of the three states that hold almost all of India's coal deposits, and it is
attempting to use these resources for electricity generation on a large scale. According to BMI 's Key
Projects Database, there are currently around nine coal-based power plants, with a capacity of more than
1GW under various stages of development in the Chhattisgarh state.
India’s transmission grids sector is showing significant growth potential for private investors in 2011. The
sector is undergoing a process of liberalisation, requiring state-run companies such as PGCIL to compete
with private sector companies for electricity transmission projects. This is opening up significant
opportunities for private sector companies throughout India, with a US$1.1bn high-voltage transmission
contract recently awarded to Isolux Corsan in August 2011 and another two transmission contracts – a
INR13bn (US$293mn) project in the state of Andhra Pradesh and a INR10.3bn (US$231mn) project
connecting the two states of Tamil Nadu and Karnataka – at the tendering stage.
An additional three high-voltage transmission projects have been identified by the Indian government to
be awarded to private companies, with state-owned institutions Power Financing Corporation and
Rural Electrification Corporation conducting the tendering process for these projects.
Several states have also recognised the importance of an efficient transmission grid.
In August 2011, the Haryana state government launched a new investment programme to construct 174
new sub-stations with varying levels of power output. A total of 98 existing stations will also be
refurbished, expanded and augmented so as to further contribute towards the state's ambitious energy
targets. Meanwhile, the government in Andhra Pradesh is considering investing US$3.09bn between 2012
and 2016 to boost the nation's power infrastructure, which includes work to strengthen the transmission
and distribution network.
In October 2011, it was reported by the Economic Times that the central government approved INR17bn
(US$350mn) for the state of Jammu and Kashmir to carry out power reforms aimed at cutting
transmission and distribution losses in 30 cities and towns across the state. The reforms, known
collectively as the Restructured-Accelerated Power Development and Reforms Program (R-APDRP),
would look to carry out system improvements in power distribution in the state, which currently are at
65%.

India Infrastructure Report Q1 2012
© Business Monitor International Ltd Page 93
Water Utilities
Investment into water treatment facilities remains on the backburner in India’s infrastructure sector. In
April 2011, Salman Khurshid, Minister of Water Resources, said the central government will discuss
measures to improve the country's water management and develop a new national water policy in 2012 to
address the issues of water scarcity, management and conservation. The state governments will also form
an individual policy at state level. The current national water policy was adopted in 2002.
In August 2011, the Indian state of Karnataka announced that it would invest US$4.1bn in a series of
irrigation projects, according to Water-Technology. The projects will be focused around the Upper
Krishna basin, and a firm programme of action is to be confirmed by December 2011. The funding will
also be directed towards a project to address irregularities in the supply of fresh drinking water in the
drought-hit Bijapur region.
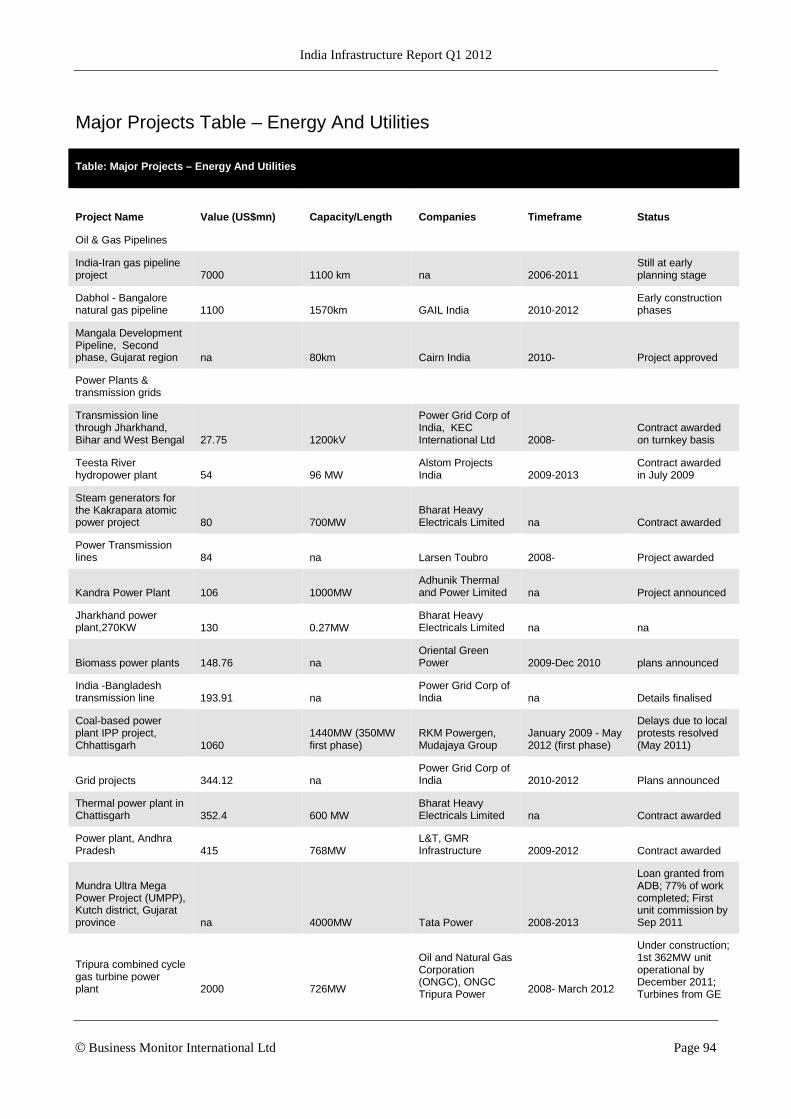
India Infrastructure Report Q1 2012
© Business Monitor International Ltd Page 94
Major Projects Table – Energy And Utilities
Table: Major Projects – Energy And Utilities
Project Name Value (US$mn) Capacity/Length Companies Timeframe Status
Oil & Gas Pipelines
India-Iran gas pipeline project 7000 1100 km na 2006-2011
Still at early planning stage
Dabhol - Bangalore natural gas pipeline 1100 1570km GAIL India 2010-2012
Early construction phases
Mangala Development Pipeline, Second phase, Gujarat region na 80km Cairn India 2010- Project approved
Power Plants & transmission grids
Transmission line through Jharkhand, Bihar and West Bengal 27.75 1200kV
Power Grid Corp of India, KEC International Ltd 2008-
Contract awarded on turnkey basis
Teesta River hydropower plant 54 96 MW
Alstom Projects India 2009-2013
Contract awarded in July 2009
Steam generators for the Kakrapara atomic power project 80 700MW
Bharat Heavy Electricals Limited na Contract awarded
Power Transmission lines 84 na Larsen Toubro 2008- Project awarded
Kandra Power Plant 106 1000MW Adhunik Thermal and Power Limited na Project announced
Jharkhand power plant,270KW 130 0.27MW
Bharat Heavy Electricals Limited na na
Biomass power plants 148.76 na Oriental Green Power 2009-Dec 2010 plans announced
India -Bangladesh transmission line 193.91 na
Power Grid Corp of India na Details finalised
Coal-based power plant IPP project, Chhattisgarh 1060
1440MW (350MW first phase)
RKM Powergen, Mudajaya Group
January 2009 - May 2012 (first phase)
Delays due to local protests resolved (May 2011)
Grid projects 344.12 na Power Grid Corp of India 2010-2012 Plans announced
Thermal power plant in Chattisgarh 352.4 600 MW
Bharat Heavy Electricals Limited na Contract awarded
Power plant, Andhra Pradesh 415 768MW
L&T, GMR Infrastructure 2009-2012 Contract awarded
Mundra Ultra Mega Power Project (UMPP), Kutch district, Gujarat province na 4000MW Tata Power 2008-2013
Loan granted from ADB; 77% of work completed; First unit commission by Sep 2011
Tripura combined cycle gas turbine power plant 2000 726MW
Oil and Natural Gas Corporation (ONGC), ONGC Tripura Power 2008- March 2012
Under construction; 1st 362MW unit operational by December 2011; Turbines from GE

India Infrastructure Report Q1 2012
© Business Monitor International Ltd Page 95
Table: Major Projects – Energy And Utilities
Project Name Value (US$mn) Capacity/Length Companies Timeframe Status
Company and Bharat Heavy
super critical thermal power plant in Yamuna Nagar 552.86 660MW
Haryana Power Generation Corporation 2009- Plans announced
Undersea transmission line to Sri Lanka 573 500MW na 2008-2011 Project announced
thermal power project at Warora in Chandrapur 586.4 540MW
KSK Energy Ventures, Wardha Power Company 2009 Project launched
Kishanganga hydropower project, Ganga River, Kashmir 650 330 MW
Hindustan Construction, Halcrow Group 2009-2016
Under construction; Stay order by Pakistan not obtained from International Court of Arbitration (Se
Thermal Power Plant, Andhra Pradesh 660 1600MW Tata Projects na Contract Awarded
Nigrie power plant 828 1320MW L&T, Mitsubishi (supply contract) na
Contract for supply of technology awarded
thermal power project at Kamalanga in Orissa 952 1050MW GMR Infrastructure na Funds secured
Coal power plant at Amreli, Gujarat 963.74 2000 MW Torrent Power 2009-2012 Agreement signed
Thermal coal-based power plant, Chhattisgarh 1070 2400MW BHEL, Jindal Power 2007 -
Face legal proceedings due to construction without prior environment clearance (Jul 2010)
Two wind farms in Karnataka and Maharashtra 1200 500MW
National Thermal Power Corporation na At planning stage
power plant in Central India 1200 1000MW
National Thermal Power Corporation na na
Power plant in Mundra in the western Indian state of Gujarat 1220 4000MW
Doosan Heavy Industries and Construction Company -April 2012 Contract awarded
Rosa power plant 1290 1200MW Reliance Power 2010-2012
First unit due December 2009, second unit March 2010
Thermal power plant, Chhattisgarh 1320 1200MW GMR 2010-2014
Construction due to begin March 2010
thermal power plant 1400 1320MW
Bharat Heavy Electricals, Maharashtra State Power Company na JV formed
Two power plants in Gujarat and Kerala 1500 1200MW Pertonet 2009-2013 Plans announced

India Infrastructure Report Q1 2012
© Business Monitor International Ltd Page 96
Table: Major Projects – Energy And Utilities
Project Name Value (US$mn) Capacity/Length Companies Timeframe Status
Hydropower project, Manipur 1890 1500MW
Satluj Jal Vidyut Nigam, NHPC 2009-2021 Project Announced
Talwandi Sabo power plant, Punjab 2160 660MW Sterlite Energy -2012
Financial closure achieved
power plant in Gujarat 2300 2000MW Jindal Group -2012 Awaiting approval
power project in Tamil Nadu 2310 2000MW
Macnamara International na At planning stage
thermal power plant at Gidderbaha 2600 2640MW na na
Expression of interest (EoI) completed
Dadri Power project, UP 3150 3500 MW Reliance Power na
EPC tender released
Hydropower projects India (and Nepal) 3200 236 MW
Tata Power, SN Power 2009-2015 Plans announced
coal-fired power project, Sasan, Madhya Pradesh 4300 3960MW Reliance Power 2011-June 2014
Under construction; First unit completion set for May 2013
Oil refinery and thermal power station on Hare Island 120-580 250MW Tuticorin Port Trust na
Initial outline announced (Oct 08)
solar installations na 1000MW Enfinity, Titan Energy Systems 2010-2015 Plans announced
Two nuclear reactors - Kakrapar na 1400MW NPCIL 2009-2017 Plans announced
wind power in Theni, Tamil Nadu na 99MW
CLP Holdings, Vestas Wind Technology India 2009-Q410 Agreement signed
Thermal power project, Marwa, Chhattisgarh na 1000MW BGR Energy na Contract awarded
Shahpur power plant na 4000MW Reliance Power na EPC tender released
Nuclear power plants, Gujarat, Rajasthan na na na na Plans announced
Expansion of Rosa Thermal Plant , Uttar Pradesh 2660 1200MW Reliance Power 2011-2012
Second Phase under construction; US$1.33bn capital expenditure announced
Dondaiche power plant na 1320MW Mahagenco 2010-2014 Construction due to begin in 2010
13 Hydropower projects in Himachal Pradesh na 1583 MW
Moserbaer, DCM Shriram Infrastructure and Jindal Steel and Power na Approval granted

India Infrastructure Report Q1 2012
© Business Monitor International Ltd Page 97
Table: Major Projects – Energy And Utilities
Project Name Value (US$mn) Capacity/Length Companies Timeframe Status
Solar PV power plant, Mithapur, Gujarat na 25MW Tata Power 2010- end 2011
PPA signed; Under construction
Kirthai power plant na 240 MW na 2009-
Second phase, bidding due to start end 2009
nuclear power plants na 2000MW AP Genco na
Project's location under discussion: Kadapa and Srikakulam mooted.
power project at Cheyyur, south of Chennai na 4000MW na 2008-2017
Land still to be acquired (Dec 08)
thermal power plant units in Rajasthan. na 500MW
Bharat Heavy Electricals 2008- Project awarded
power plant in Bihar na 1980MW NTPC 2008- Project awarded
Coal-fired power plant, Orissa province 2200 1000MW
Neyveli Lignite Corp Ltd 2010-
Seeking government approval
Coal fired power plant in Baithrani na 240 MW
Kerala State Electricity Board, National Thermal Power Corporation 2008- Project announced
IGCC Power Plant in Vijayawada na 125 MW
Bharat Heavy Electricals, APGenco 2008- Project announced
Power Plant at Tuticorin na 2000MW
Coastal Energen Private Ltd 2008- Project announced
Power project, Utter Pradesh na 732MW Lanco Infratech 2008-
Received financing of US$587.2mn
Coal-based Thermal Plant in Nagapatinuam district 1,570 1200MW Chettinad Power 2008-
Construction approved (February 2011)
Two 600MW Power Plants at Meja na 600MW
National Thermal Power Corp 2008- Project announced
Power Plant in Gujarat na 350MW Bharat Heavy Electricals 2008-2010 Project awarded
Rajpura Thermal Power Project, Punjab na 1320MW
Lanco Infrastructure Limited na
Bidding completed (Dec 08)
thermal power project in Punjab na 1980MW Sterlite Energy 2008- Project announced
Ultra Mega Power plant (UMPP), Sarguja, Chhattisgarh na 4000MW na June 2010 - Tender underway
Gautami Power plant, Andhra Pradesh 688.44 800MW
GVK Power and Infrastructure, EPC: Hyundai Engineering, Larsen & Toubro -2013
First unit to come online Q213; Second expansion on hold due to gas supply issues from Reliance
Krishnapatnam coal- 3755 4000MW Reliance Power - 2013 Under construction;

India Infrastructure Report Q1 2012
© Business Monitor International Ltd Page 98
Table: Major Projects – Energy And Utilities
Project Name Value (US$mn) Capacity/Length Companies Timeframe Status
fired power plant (UMPP), Andhra Pradesh
Delays due to land disputes and unsuitable soil condition for boiler foundation;
Chhattisgarh power plant 567 1200MW
Dainik Bhaskar Power/Bharat Heavy Electricals Ltd (EPC) na
EPC contract awarded (July 2010)
Power plant, Uttar Pradesh 1400 1980MW
Jaiprakash Group, L&T 2010-2015
Supply contract awarded
Bajaj Energy, thermal power project, Uttar Pradesh 490 450MW Bajaj Energy 2010-
Financial closure (September 2010)
Krishnapatnam coal fired power plant 1500 (first phase) 1320MW
Sembcorp Utilities, Gayatri Energy Ventures 2010-2014
Reached financial closure (September 2010)
Andhra Pradesh power plant first phase 1500 1320MW
Sembcorp Industries, Gayatri Energy Ventures Private Lim na
Financial closure reached
Coal fired power plant, Raigarh district, Chhattisgarh state 584.1 1200MW
Visa Power, Construction contract: Bharat Heavy Electricals (BHEL) August 2011 -
Construction contract awarded
Rattle hydropower project in Jammu and Kashmir 1100 690MW
GVK Power & Infrastructure (GVKPIL), GVK Developmental Projects 2010-2017
Project awarded under BOOT basis
thermal power plant in Punjab na 2640MW
National Thermal Power Corporation, Punjab State Power Corporation na MOU signed
Gujarat solar power plant na 25MW GMR Infrastructure na
Approval granted (October 2010)
Haryana nuclear power plant na 1600MW
Nuclear Power Corporation of India (NPCI), Haryana Power Generation Corporation (HPGCL) 2010-
HPGCL proposed two new sites for plant; NPCIL purchasing land for project in Fatehabad district
Lakshadweep solar power plant 7.8 1MW
Bharat Heavy Electricals Limited 2010-2011
Contract awarded (October 2010)
Orissa UMPP (Darlipalli and Gajmara) 12400 8000MW NTPC 2010-2017
Delayed due to land acquisition problems (October 2010)
Jammu and Kashmir UMPP na 5000MW
National Hydro Power Corporation, Independent Power Producer na
Contract awarded (October 2010)

India Infrastructure Report Q1 2012
© Business Monitor International Ltd Page 99
Table: Major Projects – Energy And Utilities
Project Name Value (US$mn) Capacity/Length Companies Timeframe Status
Thermal/coal-based power plant, Baradarha, Janjgir-Champa district, Chhattisgarh 325.6 1200MW
Larsen and Toubro, DB Power Limited
October 2010 - May 2013
Contract awarded (October 2010)
Three solar power plants, Haryana na na
Haryana Power Generation Corporation (HPGCL) 2010-
Shortlisting consultants
Chhindwara dam project, Madya Pradesh 31.5 1320MW
Om Metals Infraprojects, SEW na Contract awarded
Coal-based thermal power plant, Madhya Pradesh 4500 3960MW
National Thermal Power Corporation, MP Power Trading Company 2010-
MOU agreement signed
Solar power plant in Rajasthan na 5MW
Bergamo Harbinsons Energy, Andri Urja 2010-
Contract to sign in November 2010
Vadinar gas-fired power plant, Gujarat na 380MW Essar Energy 2010-
First of two phases commissioned
Four solar power plants 3000 1000MW Areva 2010- At planning stage
power plant in Adra, West Bengal na 1320MW
National Thermal Power Corporation (NTPC), Indian Railways na MOU to be signed
thermal power plant, Chitrakoot district, Bundelkhand na 600MW
Creative Thermo Light, Uttar Pradesh Power Corporation (UPPCL) 2010-2014 MOU signed
Tuppadahalli Wind turbine farm in Karnataka state 80.75 56.1MW Acciona Energy
2010 - October 2011 Completed
Tidal farm, Gujarat state na 50MW Atlantis Resources 2012- Contract awarded
Katwa super thermal power plant, Burdwan district, West Bangal 1800 1600MW
West Bengal Power Development, Bharat Heavy Electricals, NTPC 2010-
Seeking environmental clearance; Acquired 1.97km square out 4.22km square acres of land required for
power plant project, Rajasthan and Madhya Pradesh state 1770 16500MW Adani Power 2010-2014 At planning stage
Two 2MW solar PV power projects, Chandrapur Super Thermal Power Station 10.8 2MW
Megha Engineering and Infrastructure, Instant Energy, Mahagenco 2010- August 2011 Contract awarded
Coal power plant expansion 2000 660MW
Orissa Power Generation 2011 -
Bidding deadline was February 2011

India Infrastructure Report Q1 2012
© Business Monitor International Ltd Page 100
Table: Major Projects – Energy And Utilities
Project Name Value (US$mn) Capacity/Length Companies Timeframe Status
Expansion of coal-fired power plant, Banharpali in Jharsuguda 2000 1320MW
Orissa Power Generation 2010-
Global tender floated /Financial closure loan planned for June 2011
Wind power plants 1100 na Tata Power 2010-2017 At planning stage
Jaitapur nuclear power project, Maharashtra 10000 3300MW
Areva, Nuclear Power Corporation of India
2011-2018 (first reactor)
Agreement signed; Studies to start in 2011; Face potential delays
Thermal power project, Bakreswar, West Bengal na 600MW na 2010-
US$658bn loan from Japan rejected due to concerns of ability to repay loan
renewable energy projects 40 500MW
Asian Development Bank (ADB), NTPC, Kyushu Electric Power 2010-2013
At development stage
100km Power transmission line project to link Jharli to the Bawana project na 400KV Jhajjar KT Transco
2010-2012 (14 Months)
Financial closure reached
lignite-based power plant, Bhavnagar na 150MW
Suryachakra Energy & Infrastructure Private 2010- At planning stage
coal fire unit, Bellary thermal power station 817.6 700MW
Bharat Heavy Electricals (BHEL), Karnataka Power Corporation (KPCL) 2010- Contract awarded
Hindalco thermal power plant, Orissa (structural steel works) 56.4 300MW Larsen & Toubro 2010- Contract awarded
Sepco-I thermal power plant, Punjab 36.1 1420MW Larsen & Toubro 2010- Contract awarded
Pirpainty Power Plant, Bhagalpur na 1320MW
Ganga Power and Natural Resources, Bihar State Electricity Board
2010-December 2014
MOU signed; In the process of obtaining clearance
Tamnar power plant extension project, Ghardhoda 2900 3600MW Jindal Power 2010-
Construction resume for two 600MW units; Awaiting approval for another 2400MW capacity extension
Kudankulam nuclear power plant, Tamil Nadu 2600 2000MW
Nuclear Power Corporation of India (NPCIL), Atomstroyexport
2006 - December 2011 (first reactor); August 2012 (Second reactor)
Commencement delayed for first reactor due ongoing negotiations with local residents, Plans scrapped

India Infrastructure Report Q1 2012
© Business Monitor International Ltd Page 101
Table: Major Projects – Energy And Utilities
Project Name Value (US$mn) Capacity/Length Companies Timeframe Status
Arunachal Pradesh hydropower plant 140 90MW CESC 2012-2016
Project announced (December 2010)/Financial closure expected end-2012
solar thermal power plant, Parewar, Rajasthan 155.92 50MW
Godawari Power & Ispat (GPIL) 2010-
Official approval received
coal-fired power plant, Auraiya district 280 250MW
Uttar Pradesh Power Corporation (UPPCL), Unitech Machines (UMT) 2010-2014 MOU signed
800MW, Mundra; 120MW, Jojobera; 1,050MW, Maithon; 100MW of wind and 25MW of solar, Gujarat na 2095MW Tata Power 2011 At planning stage
solar power plant na 5MW Rithwik Projects 2010-2011 (1 year) Contract awarded
coal-fired power project at Jhajjar, Haryana na 1320MW CLP India
2010- December 2011 (first unit), May 2012 (second unit)
US$288mn financing agreement and US$813mn signed
Power plant investment 2000 630MW Dongfang Electric 2010- At planning stage
Expansion of Patratu Thermal Power Station, Jharkhand 1470 1320MW
National Thermal Power Corporation (NTPC) 2011-
MOU signed with Jharkhand State Electricity Board
Visakhapatnam power plant, Andhra Pradesh 5120 4000MW
National Thermal Power Corporation (NTPC) 2011-
PPA signed; Construction to start
Pitamahul coal-fired power project, Sonepur district, Orissa 1600 1300MW
KU Projects Private Limited (KPPL) 2011- MOU signed
Mahakalapara coal-fired power project, Kendrapara district, Orissa 1600 1300MW
SPI Ports Private Limited(SPIPL) 2011- MOU signed
Tentulipathar coal-fired power project, Angul district, Orissa 1460 1300MW
NSNL Nagapatnam Power Company Private Limited (NNPCPL) 2011- MOU signed
coal-fired plant at Luni, Orissa 1620 1320 MW JSL Stainless 2010-
Signed PPA with Grid Corporation of Orissa
Singaji thermal power project, Khandwa district 1428 1320 MW
Madhya Pradesh Power Generating Company Limited (MPPGCL)
2010-2012 (First phase)
Second phase to start
Kudgi coal-based na 4000MW NTPC 2011- Planning to float

India Infrastructure Report Q1 2012
© Business Monitor International Ltd Page 102
Table: Major Projects – Energy And Utilities
Project Name Value (US$mn) Capacity/Length Companies Timeframe Status
thermal power plant tenders for procurement of equipment
Wind power plants in Karnataka, Maharashtra, Rajasthan and Tamil Nadu 191 150MW
Suzlon Energy, Hindustan Zinc Limited (HZL)
2011-September 2011
First phase (50MW) to be completed by March 2011
5 power generation projects, Orissa, Raigarh, Raipur, Chattisgarh 1180 na
Power Grid Corp of India 2011- At planning stage
Combined cycle gas-based power plant, Western Tripura district 65 100MW
North Eastern Electric Power Corporation (NEEPCO) July 2011 - 2013
First phase (60MW) awaiting construction (July 2011)
Anuppur coal-based plant, Madhya Pradesh 1400 2520MW
Macquarie Group, MB Power Madhya Pradesh (MBPMPL), Moser Baer Projects (MBPPL) 2011-2014
Under construction; Macquarie to invest US$129mn
solar power project, Rajasthan na 100MW
Reliance Power, Rajasthan Sun Technique Energy 2011-2012
PPA signed with NTPC
solar and wind project, Rajasthan 221.5 100MW Konark Group 2011-
Land lease agreements signed
coal-fired power plant, Navalakhi port, Kutch district, Gujarat 2000 2400MW
Vandanaa Power Infratech 2011-2014 MOU signed
Renewable energy park, Dholera Special Investment Region, Ahmedabad, Gujarat state 2640 na
Hindustan Construction (HCC) 2011-
Received government investment of US$2.55bn
coal-fired power plant (ultra-supercritical), Chandigarh 2200 800MW BHEL, NTPC 2011-2017 At planning stage
Development of renewable energy sources 7400 na
Asian Development Bank 2011-2013 At planning stage
Sagardighi thermal power plant, Murshidabad district, West Bengal na 1000MW na April 2011 - 2015
Construction to start

India Infrastructure Report Q1 2012
© Business Monitor International Ltd Page 103
Table: Major Projects – Energy And Utilities
Project Name Value (US$mn) Capacity/Length Companies Timeframe Status
Kholongchhu hydropower plant na 670MW na 2011-
Feasibility study to be completed in December 2011
Second stage of Muzaffarpur thermal power plant project (two 195MW units), Bihar 51 195MW
Hindustan Construction Company (HCC) 2011-2014 Contract awarded
gas-based power plant, Gujarat 242 375MW Larsen & Toubro 2011-2013
EPC contract awarded
power plant, Karnakata 54 50MW Orient Paper and Industries (OPIL) 2011- At planning stage
solar power plant, Meghalaya 33 10MW Azure Power 2011-
Awaiting state government approval
Haryana biomass power plant 150 154MW
Gammon Infrastructure Projects, Barmaco Energy Systems 2011-2013
Agreement signed (February 2011)
HEPL thermal power plant, West Bengal 892 660MW EMTA Power 2011-2015 At planning stage
1200MW expansion to 655MW gas-fired power plant, Gujarat 1300 1200MW
China Light and Power (CLP) 2011-
Approval granted from Central Electricity Authority (CEA)
gas-fired power plant in the district of Jhajja, Haryana na 420MW GMR 2011-2013
In talks with state government; Plant designed for Indira Gandhi International Airport
Mandva coal-based thermal power project, Maharashtra na 1320MW
Lanco Infratech, Lanco Vidarbha Thermal Power 2011-
Received environmental clearance from Ministry of Environment & Forests
Indira Gandhi Super Thermal Power Project, Haryana na 1500MW
National Thermal Power Corporation 2011-
500MW thermal unit completed; Remaining two units under construction
solar plant (Phase 3), Kutch, Gujarat 66.6 20MW
Solairedirect Energy India na
Seeking investment; In talks with government
Samalkot natural gas-fired power plant, Andhra Pradesh 2000 2400MW
Reliance Infrastructure, Reliance Power, Black & Veatch 2011-
Turbine orders placed; Seeking US$625mn loan from US Exim Bank (July 2011)
Sarguja power plant, Chhattisgarh na 1200MW Adani Power 2011-
Awaiting environmental

India Infrastructure Report Q1 2012
© Business Monitor International Ltd Page 104
Table: Major Projects – Energy And Utilities
Project Name Value (US$mn) Capacity/Length Companies Timeframe Status
clearance
Wind power plant, Maharashtra 22 na
Mahanagar Telephone Nigam (MTNL) 2011-
At planning stage; Feasibility study to start
Kovvada nuclear power plant, Andhra Pradesh 22000 1300 MW na na
At planning stage; stage government agreed to provide 1,300 acres of land
Nizampatnam nuclear power plant, Andhra Pradesh 22000 6000 MW na 2011- At planning stage
Raigarh gas-based power plant, Maharashtra na 1300MW
DMIC Development Corporation na
Received clearance from environment ministry
Guna gas-based power plant, Madhya Pradesh na 1300MW
DMIC Development Corporation 2011-
Received clearance from environment ministry
Rajasthan coal-based power plant, Maharashtra na 1320MW Adani Power 2011-
Received clearance from environment ministry
thermal power plant, Jharkhand na 270MW Adani Power 2011-
Received clearance from environment ministry
biomass power plant, Chhattishgarh na 12MW Adani Power 2011-
Received clearance from environment ministry
Amravati coal-based power plant, Maharashtra na 1350MW Indiabulls 2011-
Received clearance from environment ministry
coal based captive power plant, Tamil Nadu na 120MW ARS Metals 2011-
Received clearance from environment ministry
gas-based captive power plant, Gujarat na 7.2MW Raymond 2011-
Received clearance from environment ministry
Bedabahal ultra mega power project (UMPP), Orissa 3810 4000MW
National Thermal Power Corporation (NTPC); Orissa Power Generation Corporation 2011-
Bidding deadlines delayed fifth time to May 31 2011; project 8 months behind schedule
Balagarh thermal power plant expansion (660MW to 1320MW), West Bengal 1500 660MW CESC 2011-2016
At planning stage to double capacity
Transmission lines between Northeast India and Agra 353 1728km
BHEL, ABB, Power Grid Corporation of India 2011- Order received
Koteshwar Hydro Power Project na 400MW
Tehri Hydro Development 2011-
First unit (100MW) commissioned in April 2011

India Infrastructure Report Q1 2012
© Business Monitor International Ltd Page 105
Table: Major Projects – Energy And Utilities
Project Name Value (US$mn) Capacity/Length Companies Timeframe Status
21 new wind, biomass and mini hydro power projects, Karnataka state na 114MW na 2011-
Awaiting central government approval
5 thermal power plants, Bihar na na na 2011-
Proposal from private investors approved
Wind power project, Tamil Nadu 85 100MW
Techno Electric and Engineering Company, Simran Wind Project 2011-
1st phase (37.5MW) by mid-July 2011; US$85mn loans from IFC, Standard Chartered Bank, DBS Bank
Patan solar power plant, Gujarat na 40MW PLG Power
April 2011- end-2012
At planning stage; To be developed in four stages
coal-fired power plant, Ranchi, Jharkhand 1350 1320MW Madhucon Projects 2012-2015
MOU signed with Jharkhand government; US$1bn of financing to be raised by company
power plant, Madhya Pradesh 293.08 (first phase) 1360MW JK Organisation
2011-2013 (first phase) At planning stage
transmission lines, Maharashtra 82.1 400 kV
KEC International, Maharashtra State Electricity Transmission Company 2011-2012 Contract awarded
An integrated power distribution network for countries part of the South Asian Association for Regional Cooperation (SAARC) na 100000MW na 2011- At planning stage
Western Region System Strengthening (WRSS) project, Gujarat 314.33 1500km
Reliance Infrastructure, Reliance Power Transmission (RPTL) 2011-
First Solapur-Karad transmission line commissioned; Second 103km Limdi-Ranchodpura transmission line
Krishnapatnam power plant, Andhra Pradesh na 1,920MW
Simhapura Energy, Madhucon 2011-
First 300MW stage completed by June 2011; Construction has four phases
Jegurupadu III gas-based power plant, Andhra Pradesh na 800MW
GVK, Hyundai Engineering, Larsen & Toubro, Alstom -H2 2014
Phase III on hold due to gas supply uncertainties from Reliance
Madhya Pradesh Power Sector Investment Programme 620 10000MW na 2011-
Final loan instalment of US$69mn received from ADB

India Infrastructure Report Q1 2012
© Business Monitor International Ltd Page 106
Table: Major Projects – Energy And Utilities
Project Name Value (US$mn) Capacity/Length Companies Timeframe Status
(transmission capacity)
Three (3x360MW) gas-based power plants, Nagapattinam 770.9 1080MW
Larsen & Toubro, PPN Power Generating Company na
Contract awarded by PPN to L&T
Thermal power plant project, Patutu na 1980MW
Jharkhand State Electricity Board na
Project in limbo; Proposals originally to be invited in early 2011
Eight wind power projects(25MW each), Karnataka or Tamil Nadu 273 200MW GAIL 2011 At planning stage
Three photovoltaic power plants, between Dhule and Chandrapur districts, Maharashtra 438 155MW Mahagenco 2011
To be constructed by Mahagenco
Solar photovoltaic (PV) plant, Dhule district, Maharashtra province 195 75MW
Lanco Solar, Lanco Infratech, Juwi Holdings, Maharashtra State Power Generation Company
2011 - February 2012 Contract awarded
Coal-based power plant, Jharkhand na 1320MW Adani Power (APL) 2011
Proposal submitted to state government; Coal supplies from Jharkhand Urma Pahari Coal Mines
Wind power project, Gujarat na 50MW
Enercon, Torrent Power
2011 - December 2011
Deal signed with Enercon
Solar power project, Gujarat na 50MW Torrent Power
2011 - December 2011 PPA signed
Solar PV project, Rajasthan na 5MW
Astonfield Renewable Resources, Grupo T-Solar Global, Schneider Electric 2011 -
Schneider Electric as EPC contractor; Debt financing provided by Indian banks
Natural gas-based power plant, Maharashtra state na 250MW GAIL India 2011-
PPA to be signed; Received approval from GAIL's board
Hydropower plant EPC project 67.07 na
Ramky Infrastructure, Ramky Enviro Engineers 2011-2013 Under construction
Laying of two 250km high-capacity transmission lines between Vemagiri and Hyderabad, Andhra 290 250km na July 2011 -
At tendering stage (July 2011)

India Infrastructure Report Q1 2012
© Business Monitor International Ltd Page 107
Table: Major Projects – Energy And Utilities
Project Name Value (US$mn) Capacity/Length Companies Timeframe Status
Pradesh
Solar photovoltaic (PV) power plant, Belakavadi village, Karnataka 13.89 5MW
Bharat Heavy Electricals (BHEL) 2011 -
Contract awarded by Karnataka Power Corporation (KPCL)
Dharapuram wind farm, Tamil Nadu 350 250MW
WinWinD Power Energy, Suryachakra Green Power
June 2011 - Q3 2013
Constructed under 3 phases
Kotlibhel II hydropower plant, Uttarakhand na 530MW
National Hydroelectric Power Corporation (NHPC) June 2011 -
Proposal rejected by MoEF (June 2011)
Alaknanda Badrinath hydropower plant, Nanda Devi Biosphere Reserve, Uttarakhand na 650MW GMR Energy June 2011 -
Proposal rejected by MoEF (June 2011)
Solar power plant, Gujarat na 30MW Moser Baer - July 2011 Under construction
Coal-based thermal power plant, Langrin Coalfield, West Khasi Hills District, Meghalaya state 286.7 240MW NEEPCO June 2011 -
Investment unconfirmed; Construction period to take 32-month
Karcham Wangtoo RoR hydro power project, Kinnaur district, Himachal Pradesh 1569 1000MW
Jaypee Karcham Hydro Corporation, Jaypee Group - August 2011
Under construction; 1st, 2nd turbine completed; 3rd, 4th turbine completed by July and August 2011 r
Pumped-storage hydropower plant, Tehri 156 1000MW
Hindustan Construction Company, Alstom June 2011 - 2015
EPC contract awarded (June 2011)
Coal-based thermal power plant, Kanpur, Bilhaur, Uttar Pradesh na 1320MW NTPC January 2012 -
Awaiting environmental clearance
Coal-based power project, Kanpur 1480 1320MW
National Thermal Power Corporation (NTPC) January 2012 -
Construction to start in January 2012
Vishnugad Pipalkoti hydropower plant, Alaknanda river, Uttarakhand 648 444MW THDC India July 2011 - 2016
US$648mn loan from World Bank (July 2011)
Solar power plant, Pokhran, Rajasthan 304.6 100MW PLG Power July 2011 -
Seeking approval from the Indian Energy Exchange and the Rural Electrification Corporation (July 201

India Infrastructure Report Q1 2012
© Business Monitor International Ltd Page 108
Table: Major Projects – Energy And Utilities
Project Name Value (US$mn) Capacity/Length Companies Timeframe Status
3 solar power projects (Patan, Kutch and Mithapur regions), Gujarat na 30MW
Tata BP Solar India, Tata Power, BP Solar
July 2011 - end-2011
Contracts secured; Projects part of Gujarat Phase-I solar power policy; 25-yr PPA signed
Two 400KV transmission (25-year concession) projects, Rajasthan state 83.5 400km GMR Energy
July 2011 - July 2013
Seeking financing from IDFC (July 2011); Construction to take 2 years
Pressurised heavy-water nuclear reactor, seventh unit of the Rajasthan Atomic Power Station, Rajasthan na 700MW
Nuclear Power Corporation of India (NPCIL)
July 2011 - June 2016 Under construction
3 Hydropower projects (Subarnapur, 100MW, Sambalpur, 100 MW, Boudh, 120 MW), Mahanadi River, Orissa 586 320MW
NHPC, Orissa Hydro Power Corporation July 2011 - 2016
Pact signed with state government (July 2011); To potentially face protest (July 2011)
High-voltage transmission lines (include five transformer substations),Uttar Pradesh 1166 1600km
Isolux Infrastructure, Isolux Corsan Aug 2011 - 2048
37.5-year, BOOT concession awarded (August 2011)
Laying of two 250km high-capacity transmission lines between Tamil Nadu and Karnataka 233 250km na July 2011 -
At tendering stage (July 2011)
Coal fired power plant, Orissa state na 1320MW Visa Power August 2011 - Contract awarded
Lodhva coal-based Ultra Mega Power Plant (UMPP), Junagadh district, Gujarat 5400 4000MW na August 2011 -
Site Selected (August 2011)
Gare Pelma II coal-fired power plant, Raigarh, Chhattishgarh 2700 2000MW Lanco Infratech August 2011 - 2015
Concession awarded (August 2011)
Siang Upper hydropower project, Arunachal Pradesh state 22000 9500MW
National Thermal Power Corporation (NTPC) 2011 -
In discussion with state government (August 2011); Undergoing field studies (August 2011)
Koldam coal-based na 800MW NTPC - 2012 Under construction

India Infrastructure Report Q1 2012
© Business Monitor International Ltd Page 109
Table: Major Projects – Energy And Utilities
Project Name Value (US$mn) Capacity/Length Companies Timeframe Status
power project, Himachal Pradesh
(August 2011)
2 Hydropower plant, Uttarakhand na 400MW NHPC August 2011 -
At planning stage (August 2011)
Ultra-mega power plants in the states of Tamil Nadu and Andhra Pradesh na na na na 2 sites chosen
Solar power plant, Rajasthan state na 40MW Reliance Power August 2011 - 2012
PPA agreement signed with Reliance Infra, US$84mn loan approved from US Exim Bank (August 2011)
Solar power plant, Jaisalmer, Rajasthan na 100MW Reliance Power August 2011 - 2013
PPA agreement signed with NTPC (Aug 2011); Solar modules supplied by First Solar (Sep 2011)
Gas-fired power plant, between villages of Arwa and Mothuka, Haryana region na 1500MW
Haryana Power Generation Corporation September 2011 -
Environment Management Plan awaiting approval, EIA report being prepared (September 2011)
Teesta stage-IV hydropower project 773 520MW NHPC August 2011 -
Garnering all statutory clearances (August 2011)
Ghatampur coal-based power plant, Kanpur Nagar district, Uttar Pradesh state 2100 2000MW
Neyveli Lignite Corporation, Uttar Pradesh Rajya Vidyut Utpadan Nigam (UPRVUNL) September 2011 -
MOU signed with UPRVUNL, Feasibility & Environmental studies underway (Sep 2011)
Neyveli coal-based power plant (replacement of existing 600MW TPS-I), Cuddalore district, Tamil Nadu 1200 1000MW
Neyveli Lignite Corporation
September 2011 - December 2015
Received government approval, At tendering stage (Jun 2011)
Bithnok coal-based power plant (includes linked mine of 2.25mtpa capacity), Bikaner district, Rajasthan 481 250MW
Neyveli Lignite Corporation September 2011 - At planning stage
Solar thermal power plant, Rajasthan 115.1mn 50MW
Lauren Jyoti, Jyoti Structures, Lauren, Godawari Green Energy
September 2011 - May 2013
Contract awarded by Godawari Green Energy (Sep 2011)
Transmission systems, Madhya Pradesh and Chhattisgarh 288.7 na
Power Grid Corporation of India Ltd ( PGCIL)
August 2011 - end-2012
At planning stage, received management
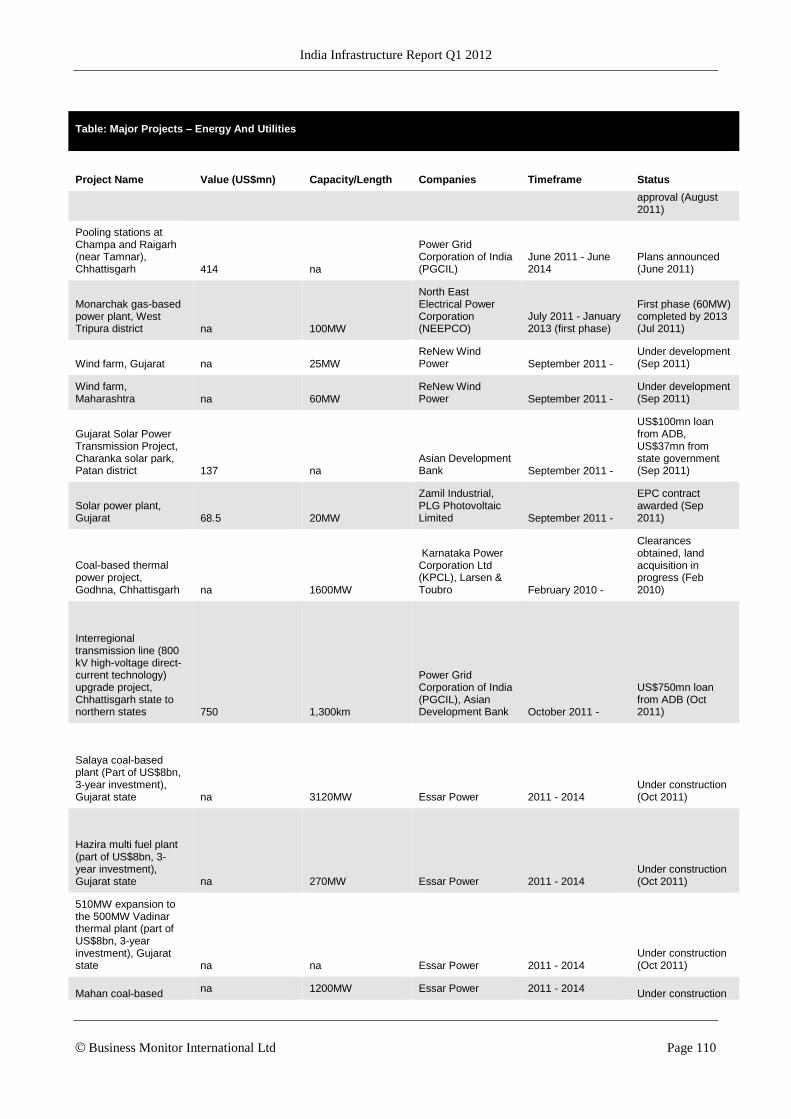
India Infrastructure Report Q1 2012
© Business Monitor International Ltd Page 110
Table: Major Projects – Energy And Utilities
Project Name Value (US$mn) Capacity/Length Companies Timeframe Status
approval (August 2011)
Pooling stations at Champa and Raigarh (near Tamnar), Chhattisgarh 414 na
Power Grid Corporation of India (PGCIL)
June 2011 - June 2014
Plans announced (June 2011)
Monarchak gas-based power plant, West Tripura district na 100MW
North East Electrical Power Corporation (NEEPCO)
July 2011 - January 2013 (first phase)
First phase (60MW) completed by 2013 (Jul 2011)
Wind farm, Gujarat na 25MW ReNew Wind Power September 2011 -
Under development (Sep 2011)
Wind farm, Maharashtra na 60MW
ReNew Wind Power September 2011 -
Under development (Sep 2011)
Gujarat Solar Power Transmission Project, Charanka solar park, Patan district 137 na
Asian Development Bank September 2011 -
US$100mn loan from ADB, US$37mn from state government (Sep 2011)
Solar power plant, Gujarat 68.5 20MW
Zamil Industrial, PLG Photovoltaic Limited September 2011 -
EPC contract awarded (Sep 2011)
Coal-based thermal power project, Godhna, Chhattisgarh na 1600MW
Karnataka Power Corporation Ltd (KPCL), Larsen & Toubro February 2010 -
Clearances obtained, land acquisition in progress (Feb 2010)
Interregional transmission line (800 kV high-voltage direct-current technology) upgrade project, Chhattisgarh state to northern states 750 1,300km
Power Grid Corporation of India (PGCIL), Asian Development Bank October 2011 -
US$750mn loan from ADB (Oct 2011)
Salaya coal-based plant (Part of US$8bn, 3-year investment), Gujarat state na 3120MW Essar Power 2011 - 2014
Under construction (Oct 2011)
Hazira multi fuel plant (part of US$8bn, 3-year investment), Gujarat state na 270MW Essar Power 2011 - 2014
Under construction (Oct 2011)
510MW expansion to the 500MW Vadinar thermal plant (part of US$8bn, 3-year investment), Gujarat state na na Essar Power 2011 - 2014
Under construction (Oct 2011)
Mahan coal-based na 1200MW Essar Power 2011 - 2014 Under construction
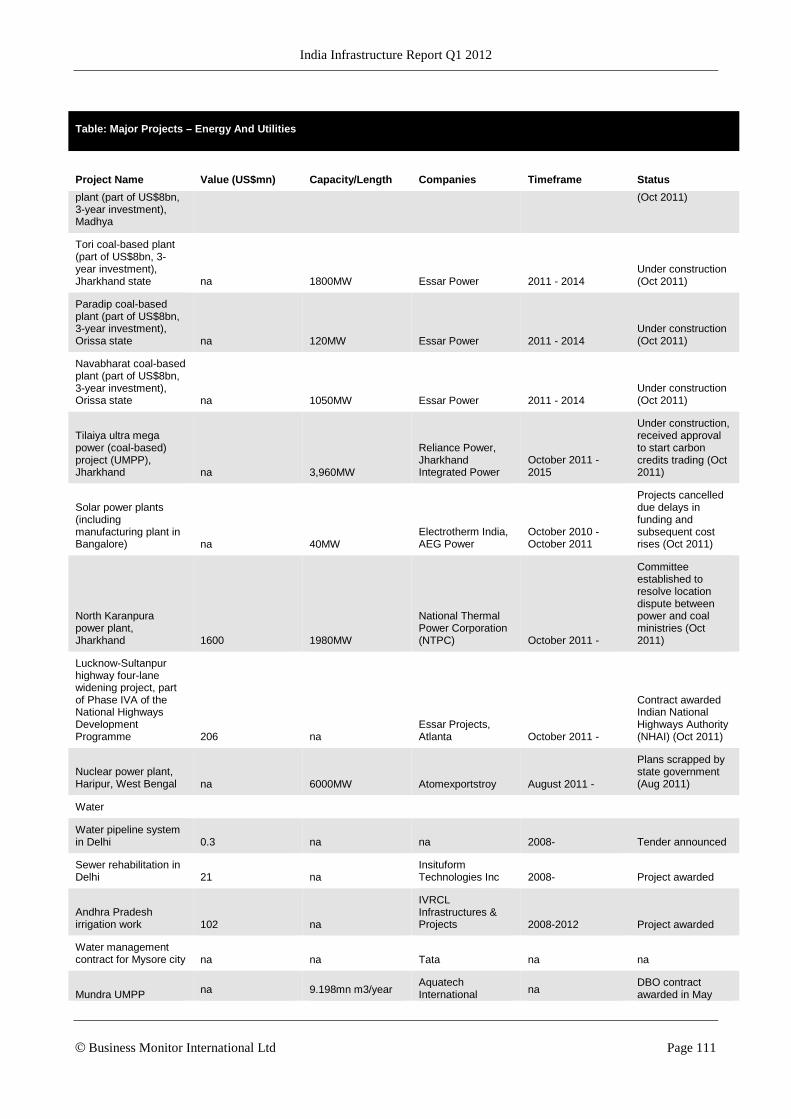
India Infrastructure Report Q1 2012
© Business Monitor International Ltd Page 111
Table: Major Projects – Energy And Utilities
Project Name Value (US$mn) Capacity/Length Companies Timeframe Status
plant (part of US$8bn, 3-year investment), Madhya
(Oct 2011)
Tori coal-based plant (part of US$8bn, 3-year investment), Jharkhand state na 1800MW Essar Power 2011 - 2014
Under construction (Oct 2011)
Paradip coal-based plant (part of US$8bn, 3-year investment), Orissa state na 120MW Essar Power 2011 - 2014
Under construction (Oct 2011)
Navabharat coal-based plant (part of US$8bn, 3-year investment), Orissa state na 1050MW Essar Power 2011 - 2014
Under construction (Oct 2011)
Tilaiya ultra mega power (coal-based) project (UMPP), Jharkhand na 3,960MW
Reliance Power, Jharkhand Integrated Power
October 2011 - 2015
Under construction, received approval to start carbon credits trading (Oct 2011)
Solar power plants (including manufacturing plant in Bangalore) na 40MW
Electrotherm India, AEG Power
October 2010 - October 2011
Projects cancelled due delays in funding and subsequent cost rises (Oct 2011)
North Karanpura power plant, Jharkhand 1600 1980MW
National Thermal Power Corporation (NTPC) October 2011 -
Committee established to resolve location dispute between power and coal ministries (Oct 2011)
Lucknow-Sultanpur highway four-lane widening project, part of Phase IVA of the National Highways Development Programme 206 na
Essar Projects, Atlanta October 2011 -
Contract awarded Indian National Highways Authority (NHAI) (Oct 2011)
Nuclear power plant, Haripur, West Bengal na 6000MW Atomexportstroy August 2011 -
Plans scrapped by state government (Aug 2011)
Water
Water pipeline system in Delhi 0.3 na na 2008- Tender announced
Sewer rehabilitation in Delhi 21 na
Insituform Technologies Inc 2008- Project awarded
Andhra Pradesh irrigation work 102 na
IVRCL Infrastructures & Projects 2008-2012 Project awarded
Water management contract for Mysore city na na Tata na na
Mundra UMPP na 9.198mn m3/year Aquatech International na
DBO contract awarded in May

India Infrastructure Report Q1 2012
© Business Monitor International Ltd Page 112
Table: Major Projects – Energy And Utilities
Project Name Value (US$mn) Capacity/Length Companies Timeframe Status
desalination plant Corporation 2009
Water supply scheme to Kurugodu, Bellary na na na 2008- Tender launched
Water treatment plant in Tamilnadu na na na 2008- Tender announced
Chennai Pumping Station expansion na na na 2008- Tender launched
Street drinking water taps for slums of Kadapa na na na 2008- Project announced
Sewage system for 9 towns in Rajasthan na na na 2008- Project announced
Two desalination Plants, Mumbai 260 36.5 mn m3/year na na
First phase to be completed 2014
Underground drains in Jabalpur city, Madhya Pradesh (210km) 118 na
Larsen and Toubro (L&T) 2010-2013 Contract awarded
Haryana project (stormwater drainage, wastewater collection, water supplies and associated works in industrial units situated in Panipat and Rai) 36 na
Larsen and Toubro (L&T) 2010-2012 Contract awarded
Water supply and mitigation project, Tamil Nadu 86 na
Nagarjuna Construction 2010- contract awarded
Chhattisgarh Canal Project, 60km 56 na na 2010-2014
Received government approval
Power, water and sewerage development projects 1200 na
Mitsubishi Heavy Industries, Tata Motors 2010- At planning stage
Water treatment plant, Bihar state na 2.271mn m3/year Punj Lloyd 2011- Contract awarded
Expansion of water treatment plants, Ganges river 109 na na 2011-
At planning stage; funded by state and federal governments

India Infrastructure Report Q1 2012
© Business Monitor International Ltd Page 113
Table: Major Projects – Energy And Utilities
Project Name Value (US$mn) Capacity/Length Companies Timeframe Status
Rajasthan Urban Sector Development Investment Program (New treatment plants, renovating distribution networks and installing new connections in slums and low-income areas) 63 na
Asian Development Bank (ADB) 2011-
US$63mn loan agreement signed between ADB and Rajasthan state government
Water supply projects (treatment plant, pipes and pumping stations, Guwahati;flood relief culverts, bridges and sluice gates, Dibrugarh), Assam 200 na
Asian Development Bank (ADB)
October 2011 - December 2017
US$200mn loan from ADB (Oct 2011)
Source: BMI. na=not available.

India Infrastructure Report Q1 2012
© Business Monitor International Ltd Page 114
Residential/Non-Residential Construction and Social Infrastructure
Table: India Residential and Non-residential Building Industry Data
2008/09 2009/10 2010/11 2011/12f 2012/13f 2013/14f 2014/15f 2015/16f 2016/17f
Residential and Non-Residential Building Industry Value As % of Total Construction 54.3 53.5 53.0 52.2 51.5 50.3 49.6 48.9 48.4
Residential and Non-Residential Building Industry Value, INRbn 2,450.9 2,684.1 3,136.9 3,499.1 3,945.2 4,461.4 5,112.0 5,800.4 6,573.6
Residential and Non-Residential Building Industry Value, US$bn 56.3 55.4 68.6 76.1 83.9 97.5 117.5 140.6 164.3
Residential and Non-Residential Building Industry Value Real Growth, % chg y-o-y -2.5 7.5 6.3 2.4 4.2 4.8 6.1 5.5 5.3
Residential and Non-Residential Building Industry Value as % of GDP 4.4 4.1 4.0 3.8 3.8 3.8 3.8 3.8 3.8
e/f = BMI estimate/forecast, Source: BMI Research
Table: India Residential and Non-residential Building Industry Data
2013/14f 2014/15f 2015/16f 2016/17f 2017/18f 2018/19f 2019/20f 2020/21f 2021/22f
Residential and Non-Residential Building Industry Value As % of Total Construction 50.3 49.6 48.9 48.4 47.9 47.6 47.3 47.0 46.8
Residential and Non-Residential Building Industry Value, INRbn 4,461.4 5,112.0 5,800.4 6,573.6 7,416.2 8,355.5 9,412.5 10,575.6 11,894.7
Residential and Non-Residential Building Industry Value, US$bn 97.5 117.5 140.6 164.3 190.2 219.9 247.7 278.3 313.0

India Infrastructure Report Q1 2012
© Business Monitor International Ltd Page 115
Table: India Residential and Non-residential Building Industry Data
2013/14f 2014/15f 2015/16f 2016/17f 2017/18f 2018/19f 2019/20f 2020/21f 2021/22f
Residential and Non-Residential Building Industry Value Real Growth, % chg y-o-y 4.8 6.1 5.5 5.3 4.8 4.7 4.7 4.4 4.5
Residential and Non-Residential Building Industry Value as % of GDP 3.8 3.8 3.8 3.8 3.7 3.7 3.7 3.7 3.6
e/f = BMI estimate/forecast, Source: BMI Research
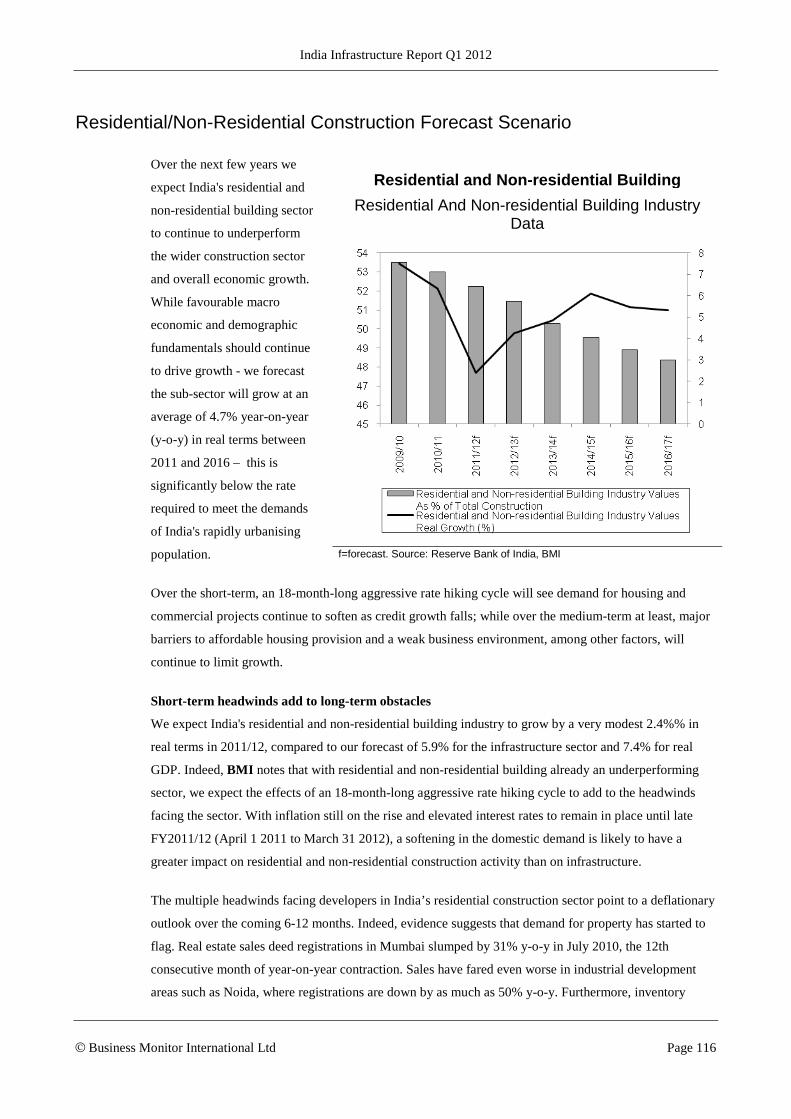
India Infrastructure Report Q1 2012
© Business Monitor International Ltd Page 116
Residential/Non-Residential Construction Forecast Scenario
Over the next few years we
expect India's residential and
non-residential building sector
to continue to underperform
the wider construction sector
and overall economic growth.
While favourable macro
economic and demographic
fundamentals should continue
to drive growth - we forecast
the sub-sector will grow at an
average of 4.7% year-on-year
(y-o-y) in real terms between
2011 and 2016 – this is
significantly below the rate
required to meet the demands
of India's rapidly urbanising
population.
Over the short-term, an 18-month-long aggressive rate hiking cycle will see demand for housing and
commercial projects continue to soften as credit growth falls; while over the medium-term at least, major
barriers to affordable housing provision and a weak business environment, among other factors, will
continue to limit growth.
Short-term headwinds add to long-term obstacles
We expect India's residential and non-residential building industry to grow by a very modest 2.4%% in
real terms in 2011/12, compared to our forecast of 5.9% for the infrastructure sector and 7.4% for real
GDP. Indeed, BMI notes that with residential and non-residential building already an underperforming
sector, we expect the effects of an 18-month-long aggressive rate hiking cycle to add to the headwinds
facing the sector. With inflation still on the rise and elevated interest rates to remain in place until late
FY2011/12 (April 1 2011 to March 31 2012), a softening in the domestic demand is likely to have a
greater impact on residential and non-residential construction activity than on infrastructure.
The multiple headwinds facing developers in India’s residential construction sector point to a deflationary
outlook over the coming 6-12 months. Indeed, evidence suggests that demand for property has started to
flag. Real estate sales deed registrations in Mumbai slumped by 31% y-o-y in July 2010, the 12th
consecutive month of year-on-year contraction. Sales have fared even worse in industrial development
areas such as Noida, where registrations are down by as much as 50% y-o-y. Furthermore, inventory
Residential and Non-residential Building
Residential And Non-residential Building Industry Data
f=forecast. Source: Reserve Bank of India, BMI

India Infrastructure Report Q1 2012
© Business Monitor International Ltd Page 117
levels are ticking up. Unsold inventory in Mumbai increased to 12 months in July (from a low of nine in
March 2011), and similar trends have been witnessed across other major cities such as Bangalore (18
months) and Chennai (10).
These figures illustrate that elevated property prices and the rising cost of mortgage financing have started
to hurt consumer appetite for new homes. Mortgage rates at the Housing Development Finance
Corporation (HDFC), India's largest mortgage lender, have risen to a 2½-year high of 10.75% in line,
with the Reserve Bank of India's 350bps tightening cycle since March 2010, and the low spread suggests
previous rate increases may yet have to be passed on. Given BMI’s Country Risks analysts’ subdued
outlook on the Indian consumer, we would not expect to see households embark on a major buying spree
anytime soon.
A More Expensive PropositionIndia - RBI Repo Rate & HDFC Mortgage Rate, %
Source: BMI, RBI, HDFC
A build-up of unsold inventory, higher financing costs and huge debt levels have also severely dented the
liquidity position of real estate developers. Indeed, the sector's total debt burden was estimated to be
worth US$24.6bn in July 2011, up from just US$3.8bn in September 2005, and rolling over this debt has
become extremely expensive in a high-rate environment. Builders such as Real Estate Holdings and
Akarsh Residence were forced to sell debt at yields between 16-24% in Q111.
Indeed, the tough operating environment, weakening earnings prospects and the fall-out from a number of
housing loan scandals last year has seen the BSE Realty Index majorly underperform the broader index in

India Infrastructure Report Q1 2012
© Business Monitor International Ltd Page 118
the last few years (see chart). Indeed, since its October 2010 cyclical peak, the index is down by 55%,
making it the worst performing sub-sector on the BSE.
Underdeveloped Mortgage Market While elevated interest rates will dampen demand for mortgages –
and by extension new homes – over the short-term; of greater concern to the long-term development of
India's housing sector is the fact that mortgages remain accessible to very few. The mortgage market in
India accounts for less than 5% of GDP and although it holds vast growth potential, we believe the
inaccessibility of home loans remains one of the key barriers to the long-term development of India's
residential construction sector. BMI notes this issue is one of the keys to unlocking the private investment
needed to meet the vast underlying demand for housing in the country.
That said, we believe that residential construction projects will continue to provide a key source of value
for the sector, although growth will not come at the rate needed to keep pace with the huge demand for
affordable homes generated by a rapidly urbanising population. Social housing provision will remain a
pressing issue as the government struggles to address the country’s urban housing deficit of 25mn. BMI
notes that confusion over the roles of central, state and local government actors, coupled with bureaucracy
and widespread corruption, has hampered the country's efforts to implement a coherent and effective
urban development strategy.
BMI notes that manifold obstacles continue to undermine India’s business environment – particularly
those facing construction companies – and we believe that over the short- to medium-term, growth will
continue to be curbed by these weaknesses.
However, there are increasing signs that the government is taking a more pro-active approach to tackling
the country's long-term development needs. In particular, the appointments of Kamal Nath and Jairam
Ramesh as ministers for urban development and the environment respectively appear to be positive and
could offer some upside potential to our forecasts.
Residential/Non-Residential Construction and Social Infrastructure Overview
India's urban population will grow by 215mn by 2025 and by 2030 the country is projected to have 68
cities with a population of over one million – compared to 42 today. This poses a stern test for India,
which is already home to Asia’s largest slum population. The pressure on affordable housing in particular
will become increasingly acute over the next decade as housing and land supply constraints drive up
property prices.
This will expand the growing proportion of the urban population unable to buy a home at market rate, and
further perpetuate India's chronic urban slum problem that threatens to derail its urban transformation.
While significant obstacles will need to be overcome if India is to come close to addressing these
challenges, we believe the sheer level of demand for physical and social infrastructure will ensure large

India Infrastructure Report Q1 2012
© Business Monitor International Ltd Page 119
levels of private investment continue to pour into the country. We expect this to continue over the next
few years, with both upside and downside risks present.
While elevated interest rates will dampen demand for mortgages – and by extension new homes – over
the short-term; of greater concern to the long-term development of India's housing sector is the fact that
mortgages remain accessible to very few. The mortgage market in India accounts for less than 5% of
GDP and although it holds vast growth potential, we believe the inaccessibility of home loans remains
one of the key barriers to the long-term development of India's residential construction sector. BMI notes
this issue is one of the keys to unlocking the private investment needed to meet the vast underlying
demand for housing in the country.
Central to this problem is finding a sustainable housing financing solution for those within India's low- to
middle-income bracket, as banks, unsurprisingly, prefer to lend to those within the mid- to higher-income
levels. The government will need a housing model that is both attractive to private developers and flexible
enough to be accessible to those within India's vast low income bracket. Such a solution has so far been
beyond the capabilities of the Indian government and its realisation over the short- to medium-term
remains unlikely.
Steps In The Right Direction
However, over the last 12 months there have been encouraging signs that the government is seeking to
tackle the issue of mass affordable housing provision. In June 2011, the government launched the
ambitious Rajiv Awas Yojana (RAY) scheme, targeting 32mn people across 250 cities. The scheme
includes welcome elements such as the establishment of a low-income mortgage fund and the assigning
of property rights to slum dwellers. However, BMI notes that while the government's establishment of a
US$137mn mortgage guarantee fund to facilitate greater lending to low income groups is a positive step,
it falls way short of what is required.
Indeed, we have long stressed that the level of investment required to meet India's slum housing demands
is at a far higher level than the government alone will be able to sustain in the long-term. While moderate
success has been achieved in harnessing the private sector for economic infrastructure projects, social
infrastructure remains a largely untapped area.

India Infrastructure Report Q1 2012
© Business Monitor International Ltd Page 120
Tourism Ticking Up
A planned US$2.1bn theme park project
in Gujarat, announced in July 2011, is the
latest illustration of a growing trend
across Asia as countries seek to capitalise
on rising consumer-spending and a
burgeoning mass tourism market. BMI
notes that while visitors from developed
markets such as the UK and US are still
the biggest contributors by number to
India's tourism market, the balance is
shifting, with arrivals from Asia and
within India itself likely to be the major
growth driver over the coming years.
With a population of over one billion and an expanding middle-class, we believe India's domestic tourism
industry will increasingly become a key driver of demand within the commercial construction sector in
particular, as hotels and resort development create growing value for the industry. Indeed, in April 2011,
International hotel chain Starwood hotels announced plans to ramp up its presence in India. With 31
hotels in the country, the firm plans to add a further seven by the end of 2011 and also plans to open its
first W brand hotel in Mumbai in 2015.
Cabinet Reshuffle A Positive Move
The appointment of Kamal Nath as India's new Minister for Urban Development following a cabinet
reshuffle in January 2011 can be interpreted as an attempt by the government to inject some much-needed
momentum into the sector. Moreover, having had success in harnessing private sector support for public
projects in his previous role at the road transport ministry, Mr Nath's appointment is an encouraging sign
that India's central government is seeking a more active role in tackling its long-term development needs.
While the role of urban development minister is not traditionally regarded as a high profile one, this could
well change with Nath's appointment. BMI notes that his appointment is part of a wider drive by the
Congress-led government to alert investors to the opportunities within the sector. However, his
appointment is the easy part, as the government must now attempt to find a solution which will allow it to
meet the housing and educational needs (among other requirements) of the millions who will move to the
cities over the next 20 years. In the case of affordable housing, BMI notes that the government will need
a model that is attractive to private developers and flexible enough to be accessible to the vast range of
people within India's expanding urban low-income bracket.
A Growing Attraction
India – Foreign Tourist Arrivals (Monthly)
0
100,000
200,000
300,000
400,000
500,000
600,000
700,000
800,000
Aug
-02
Feb
-03
Aug
-03
Feb
-04
Aug
-04
Feb
-05
Aug
-05
Feb
-06
Aug
-06
Feb
-07
Aug
-07
Feb
-08
Aug
-08
Feb
-09
Aug
-09
Feb
-10
Aug
-10
Feb
-11
Source: Bloomberg.

India Infrastructure Report Q1 2012
© Business Monitor International Ltd Page 121
The level of investment required to meet these demands is at a far higher level than the Indian
government alone will be able to sustain in the long-term. Furthermore, while moderate success has been
achieved in harnessing the private sector for economic infrastructure projects, social infrastructure
remains largely untapped. This trend is likely to continue over the foreseeable future, reflected in our
forecasts for India's residential and non-residential building sector. Between 2011 and 2020, we expect
real growth in the sector to average 4.2% y-o-y. In contrast we expect to see 7% average growth for the
overall construction sector and over 7.5% for the booming Indian economy as a whole. Fostering greater
investment into its urban building sector
must therefore be a priority for the
government.
BMI believes that PPPs represent a major
potential source of funding for a social
infrastructure sector that as yet remains
largely untapped. Of the 450 PPP
projects at various stages of progress,
over 60% are road projects, with the
remainder mostly economic infrastructure
projects, notably ports, power projects
and airports. Having worked in the only
sector where PPPs have really flourished,
there is growing evidence that Kamal
Nath plans to implement a more investor-friendly approach, with a greater focus on private procurement.
Between 700 to 900mn square metres (m2) of commercial and residential space needs to be built in the
country every year, according to a Mckinsey Global Institute (MGI) report. In order to meet such
demand, significant private sector participation will be needed, both in terms of financing and expertise,
over the long term. However, while India has had some success increasing private sector participation
through the creation of a more conducive project financing environment, the limited long-term borrowing
capability of domestic banks and a lack of transparency still present challenges and pose risks.
In the affordable housing sector in particular, such risks have deterred investment, despite the huge
growth potential. Inadequate business models and developers' preferences for building more profitable
mid to high-end residential housing have traditionally inhibited growth within the sector and limited
mortgage lending options for lower-income groups.
Companies such as Bangalore-based developer Provident Housing, the affordable housing arm of
Puravankara Group, have sought to overcome such obstacles by using funding from new bookings to
finance operational costs, thereby reducing the financing risks associated with such projects. Indeed, its
successful business model means the firm is now targeting new projects across 33 cities over the next five
Roads Ahead
India PPP Projects By Sector
Source: Ministry of Finance
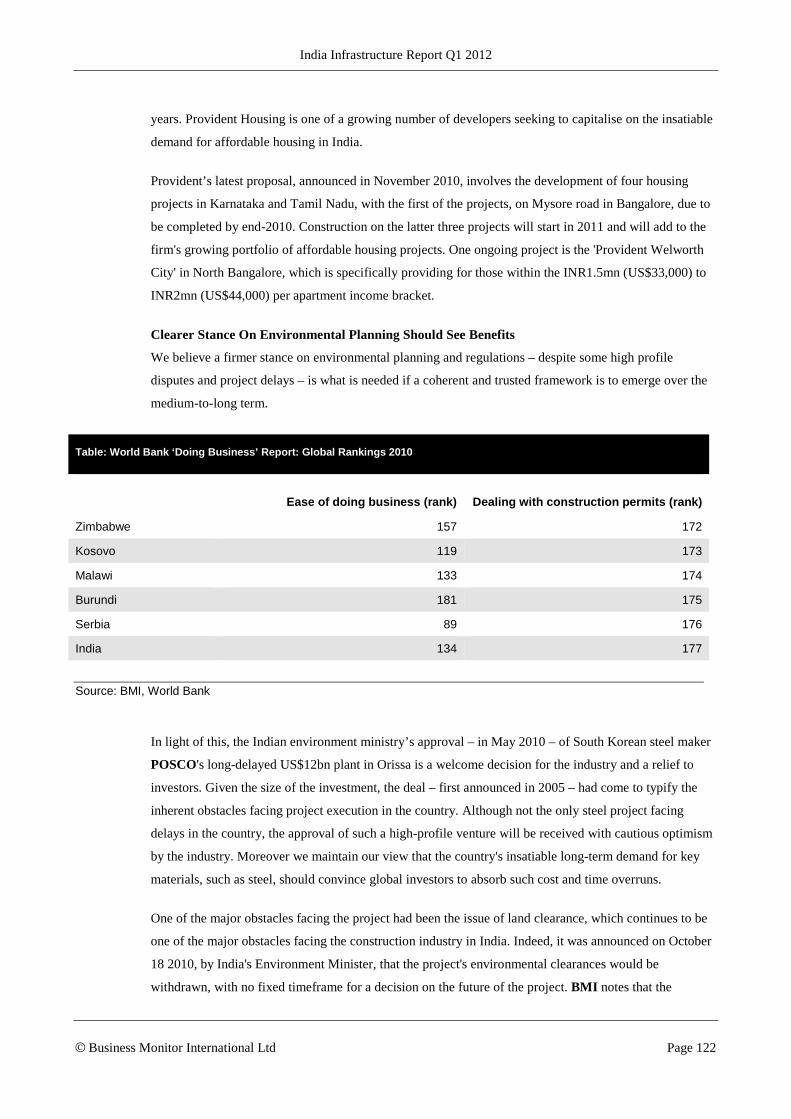
India Infrastructure Report Q1 2012
© Business Monitor International Ltd Page 122
years. Provident Housing is one of a growing number of developers seeking to capitalise on the insatiable
demand for affordable housing in India.
Provident’s latest proposal, announced in November 2010, involves the development of four housing
projects in Karnataka and Tamil Nadu, with the first of the projects, on Mysore road in Bangalore, due to
be completed by end-2010. Construction on the latter three projects will start in 2011 and will add to the
firm's growing portfolio of affordable housing projects. One ongoing project is the 'Provident Welworth
City' in North Bangalore, which is specifically providing for those within the INR1.5mn (US$33,000) to
INR2mn (US$44,000) per apartment income bracket.
Clearer Stance On Environmental Planning Should See Benefits
We believe a firmer stance on environmental planning and regulations – despite some high profile
disputes and project delays – is what is needed if a coherent and trusted framework is to emerge over the
medium-to-long term.
Table: World Bank ‘Doing Business’ Report: Global Rankings 2010
Ease of doing business (rank) Dealing with construction permits (rank)
Zimbabwe 157 172
Kosovo 119 173
Malawi 133 174
Burundi 181 175
Serbia 89 176
India 134 177
Source: BMI, World Bank
In light of this, the Indian environment ministry’s approval – in May 2010 – of South Korean steel maker
POSCO's long-delayed US$12bn plant in Orissa is a welcome decision for the industry and a relief to
investors. Given the size of the investment, the deal – first announced in 2005 – had come to typify the
inherent obstacles facing project execution in the country. Although not the only steel project facing
delays in the country, the approval of such a high-profile venture will be received with cautious optimism
by the industry. Moreover we maintain our view that the country's insatiable long-term demand for key
materials, such as steel, should convince global investors to absorb such cost and time overruns.
One of the major obstacles facing the project had been the issue of land clearance, which continues to be
one of the major obstacles facing the construction industry in India. Indeed, it was announced on October
18 2010, by India's Environment Minister, that the project's environmental clearances would be
withdrawn, with no fixed timeframe for a decision on the future of the project. BMI notes that the

India Infrastructure Report Q1 2012
© Business Monitor International Ltd Page 123
opposition of local farmers and families who would lose their land under the proposed project was cited
as a key reason; the decision also reflected Delhi and its new environment minister Jairam Ramesh's
firmer stance on environmental impact and social protection.
However, claims by local people that they are being forced off their land have now been dismissed –
despite ongoing protests – by Ramesh, and approval has been granted, raising hopes that future projects
may be dealt with more swiftly as greater clarity in the implementation of planning procedures is
gradually achieved. The project was billed as the single largest investment in the country when
announced and has therefore been regarded by foreign investors as a test case for the country's
environmental vetting procedures.
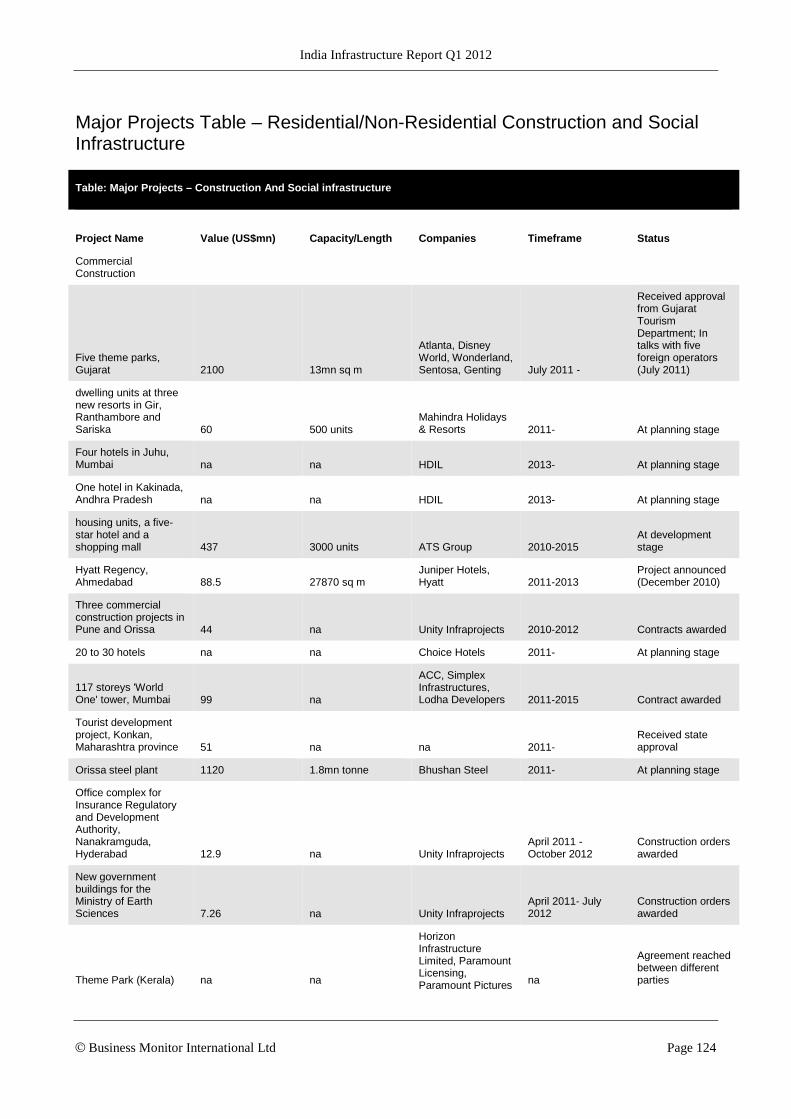
India Infrastructure Report Q1 2012
© Business Monitor International Ltd Page 124
Major Projects Table – Residential/Non-Residential Construction and Social Infrastructure
Table: Major Projects – Construction And Social infrastructure
Project Name Value (US$mn) Capacity/Length Companies Timeframe Status
Commercial Construction
Five theme parks, Gujarat 2100 13mn sq m
Atlanta, Disney World, Wonderland, Sentosa, Genting July 2011 -
Received approval from Gujarat Tourism Department; In talks with five foreign operators (July 2011)
dwelling units at three new resorts in Gir, Ranthambore and Sariska 60 500 units
Mahindra Holidays & Resorts 2011- At planning stage
Four hotels in Juhu, Mumbai na na HDIL 2013- At planning stage
One hotel in Kakinada, Andhra Pradesh na na HDIL 2013- At planning stage
housing units, a five-star hotel and a shopping mall 437 3000 units ATS Group 2010-2015
At development stage
Hyatt Regency, Ahmedabad 88.5 27870 sq m
Juniper Hotels, Hyatt 2011-2013
Project announced (December 2010)
Three commercial construction projects in Pune and Orissa 44 na Unity Infraprojects 2010-2012 Contracts awarded
20 to 30 hotels na na Choice Hotels 2011- At planning stage
117 storeys 'World One' tower, Mumbai 99 na
ACC, Simplex Infrastructures, Lodha Developers 2011-2015 Contract awarded
Tourist development project, Konkan, Maharashtra province 51 na na 2011-
Received state approval
Orissa steel plant 1120 1.8mn tonne Bhushan Steel 2011- At planning stage
Office complex for Insurance Regulatory and Development Authority, Nanakramguda, Hyderabad 12.9 na Unity Infraprojects
April 2011 - October 2012
Construction orders awarded
New government buildings for the Ministry of Earth Sciences 7.26 na Unity Infraprojects
April 2011- July 2012
Construction orders awarded
Theme Park (Kerala) na na
Horizon Infrastructure Limited, Paramount Licensing, Paramount Pictures na
Agreement reached between different parties

India Infrastructure Report Q1 2012
© Business Monitor International Ltd Page 125
Table: Major Projects – Construction And Social infrastructure
Project Name Value (US$mn) Capacity/Length Companies Timeframe Status
Corporation
Delhi-Mumbai Industrial Corridor (DMIC) project (include construction of a 4,000MW power plant, a high-speed freight line, a six-lane intersection-free expressway, three ports, six airports, seven cities, nine large industrial zones) 90000 1483km
Delhi Mumbai Industrial Corridor Development Corporation (DMICDC)
September 2011 - 2018
US$3.7bn revolving fund set up for trunk infrastructure, tendering process to start in 2011
Mix-used developments ( Raheja Revanta, Raheja Phoenix, and Raheja Shristi), New Delhi and Guargaon 204 na
Arabtec Holding, Raheja
October 2011 - 2014
Contract awarded (Oct 2011)
Healthcare
MedCity (500-bed hospital, six centres of excellence, a resort hotel, a convention centre) 223 500 beds DM Healthcare 2011-2013
Funding to come from bank financing, internal accruals and a proposed IPO
Housing
residential and office units in two developments, Haryana 44 550 units
Vigneshwara Developers 2010-2014 At planning stage
Industrial Construction
Contract work includes building, repairing or altering steel buildings for the Aditya Aluminium project at Sambalpur, Orissa 11.6 na
Hindustan Construction Company (HCC) Contract awarded 2010-2012
Orissa steel plant 12000 na POSCO na
Received final approval (May 2011) by Ministry of Environment. Project delayed since 2005
Two polyester plants(1.5mn tonnes each) 1200 3mn tonnes Indorama Ventures 2010-2014 At planning stage
Piping work for its Paradip refinery 37.5 na
Indian Oil, Punj Lloyd 2010- Contract awarded
Cement plant near Bandi wildlife sanctuary na na
Harish Cement India na
Government approval withdrawn on environmental grounds; Land acquisition

India Infrastructure Report Q1 2012
© Business Monitor International Ltd Page 126
Table: Major Projects – Construction And Social infrastructure
Project Name Value (US$mn) Capacity/Length Companies Timeframe Status
proceedings suspended
Cement plant, Karnakata 322 3 mn tonnes
Orient Paper and Industries (OPIL) 2011- At planning stage
Concentrated solar power (CSP) plants na na
Bharat Heavy Electricals (BHEL), Abengo 2011- Agreement signed
Three wind equipment manufacturing plants in Gujarat and Tamil Nadu 111 na Gamesa 2012-
At planning stage; Location of plants at Gujarat and Tamil Nadu
Durgapur steel plant expansion, West Bangal 646 na
Steel Authority of India 2011- At planning stage
Kalinganagar steel plant, Jaipur na 1.1mn tonnes
Neelachal Ispat Nigam (NINL) -October 2011
Under construction (second phase)
Kutra cement plant expansion, Orissa 1800 1mn tonnes Shiva Cement 2011- MoU signed
Power equipment manufacturing plant, Tamil Nadu na 3000MW Doosan July 2011 -
At planning stage (July 2011)
Residential Construction
Gurgaon luxury residential development 107 na Sobha Developers 2010-2011 At planning stage
Four residential projects (Mumbai, Chennai, Hyderabad, Nagpur) na na
Mahindra Lifespace Developers 2010-2014 Projects announced
Housing projects, Bengaluru na na
Pruksa Global, Pruksa India Housing 2010-
First project launched
Township in Alibaug near Mumbai 45 na
Samira Habitats, Peninsula Land 2010- At planning stage
Four housing projects in Karnataka and Tamil Nadu 750 na
Provident Housing, Puravankara Group 2010- At planning stage
Luxury apartment project, Pune city (two towers approx. 90 apartments) 144.4 na Vascon Engineers 2010-2013
At development stage
Mohali housing project, Punjab 99.8 na
Godrej Properties (GPL) 2010- At planning stage
Chennai residential development 99.7 na
Phoenix Hodu Developers 2010-2013 Under construction
Chintels Serenity project (555 apartments), National Capital Region 68.7 na Chintels India 2010-
45.43 investment planned

India Infrastructure Report Q1 2012
© Business Monitor International Ltd Page 127
Table: Major Projects – Construction And Social infrastructure
Project Name Value (US$mn) Capacity/Length Companies Timeframe Status
An exclusive villa project, Goa 66 na Nitesh Estates 2010-2013 Project launched
35 storey residential project, Mangalore 33 na SKS Netgate 2010-2012 Project launched
Bihar Kosi Flood Recovery Project 220 na na 2011-
Agreement signed with World Bank and Indian government
Lavasa township project first phase, Pune 611 (first phase) 300000 persons
Hindustan Construction Company, Lavasa October 2011 -
Suspended, Environmental clearance refused by MOEF, Undergoing legal proceedings (Oct 2011)
One Avighna Park, Mumbai 400 na
Elemec Electrical Contracting 2011-
Contract awarded (March 2011)
58 buildings for urban poor 46.7 na Neev Infra 2011-2012
Contract won from central government
Housing units, Delhi na 20850 units Delhi Development Authority 2011- At planning stage
2,688-unit luxury residential project, Pallikaranai, Chennai 380.5 na Puravankara 2011-2015 At planning stage
25 luxury and affordable housing projects and five townships, Maharashtra 226 na Soham Group 2011-2014 At planning stage
Indiramma (affordable housing programme) 586 4.7mn units na 2011-2012 At planning stage
1,250 acre township, Panvel na na
Wadhwa Group, Gulf Finance House June 2011 -
At planning stage; Able to house 1.4mn people once completed
Karvenagar apartment complex (2800 residential units), Pune 177.6 2800 units Acron Infra Projects June 2011 -2012
Construction works started (June 2011)
Source: BMI. na=not available.

India Infrastructure Report Q1 2012
© Business Monitor International Ltd Page 128
Business Environment
India Business Environment
India comes fourth in BMI’s Asia Pacific Business Environment Ratings in Q411 with a score of 63.4 out
of 100. BMI's Infrastructure Business Environment Ratings quantify the gap between scope for growth
and the structural weaknesses holding back the market. For its Industry Rewards, India scores 77.5 out of
100, one of the highest scores globally, due to the combination of expected high growth and large
industry value in the construction sector. However, in all three of the other categories (Country Rewards,
Industry Risks and Country Risks), which make up the total infrastructure BE score, India performs
poorly receiving scores of 45.4, 55 and 57.8 respectively. Labour market, access to electricity, institutions
and corruption are the worst performing indicators for India.
Rewards
Industry Rewards
India’s infrastructure industry is set to expand impressively over the long term, given the government’s
efforts to attract capital for multibillion-dollar investments in transport, energy, utilities and urban
infrastructure. According to our forecasts, India will witness robust growth in terms of construction
industry value, giving the country high scores for growth levels and value of the industry over the next
five years. While all of this has given India the highest infrastructure market score in the region, the score
has fallen from scores of 80 and above to 77.5. Concerns regarding the level of investment filtering
through to projects on the ground are steadily becoming a major risk to India realising its unmatched
growth potential in the construction sector and our current score reflects this concern.
Country Rewards
The country’s labour market posts a modest performance. With more than half the population younger
than 25, labour supply does not seem to be a hurdle. However, the Associated Chambers of Commerce
and Industry of India (ASSOCHAM) has reported a large shortage of skilled labour in the construction
industry, with a shortage of skilled civil engineers posing a real concern. Also, in spite of a well-
established financial system, institutions have been wary of lending to contractors, because of the high
risk of default. Many firms have been forced to borrow at high rates of interest to meet working-capital
requirements. Access to an uninterrupted supply of power is another hurdle for the industry.
Risks
Industry Risks
The Indian construction industry is relatively large in comparison to its peers; however, the sector is
dominated by a handful of large players who alone posses the expertise to execute several mega-projects
that are required. The sector is seeing an increasing number of international players enter; however, most
have chosen to do so via a tie-in with a local company in order to help navigate the complex regulatory

India Infrastructure Report Q1 2012
© Business Monitor International Ltd Page 129
and operating environment. Construction companies have tended to seek joint ventures (JVs) with local
construction players, whereas private equity and other funds have chosen to take stakes in existing
companies active in the infrastructure, especially power, sectors. Local expertise is crucial to executing
infrastructure projects in India and therefore local players – of which there are a number of substantial
size – are best placed to win contracts.
Country Risks
India’s convoluted political and economic profile means that there are numerous country-wide risks that
affect potential returns in the infrastructure sector. Among them, two key risks are India’s over-burdened
legal system and rampant corruption. India's legal framework is complex and archaic, with a variety of
often conflicting regulations still in place. The court system is prone to lengthy delays, where even the
liquidation of a bankrupt company can take up to 20 years. Meanwhile, foreign businesses have to
manoeuvre through a panoply of rules and certifications to obtain the estimated 70 separate approvals
needed to set up shop in India (unless they are operating within a special economic zone).
Corruption is another major issue of concern for investors in India, and the country has fallen from 84th in
2009 to 87th in 2010 (out of 178 countries) in Transparency International's Corruption Perceptions Index.
Wide-ranging administrative discretion provided by India's legendary bureaucracy provides numerous
opportunities for officials to extort bribes. The lack of transparency in governance rules and excessive
bureaucratic procedures provide the context for graft to prosper.
In particular, the government’s procurement system has been identified as being riddled with corruption
and malpractice. However, some progress has been made in combating corruption in recent years, with
several public officials indicted or convicted under anti-corruption laws. According to the World Bank's
2010 Doing Business survey, India ranks a relatively lowly 133 in the overall ease of doing business
category, out of 183 countries. With corruption in the headlines, however, the authorities are being forced
into action. The government is looking to pass the Jan Lokpal bill – which would essentially put in place
an independent anti-corruption body – in the 2011 monsoon session of parliament.

India Infrastructure Report Q1 2012
© Business Monitor International Ltd Page 130
Regional Overview
Asia Pacific Infrastructure Business Environment Ratings
BMI View: The rising cost of construction inputs and capital continues to be a problem in 2011, but the
mounting headwinds throughout the global economy suggest that external risks, not adverse monetary
conditions, are the key issues plaguing the Asian infrastructure sector going into 2012. Over the long-
term, we continue to see upside potential for rewards throughout the Asia Pacific region, with many
countries still launching massive infrastructure programmes. This reaffirms the region's status as the
world's largest concentration of infrastructure and construction markets.
There is still substantial disparity in the demand for infrastructure throughout Asia, and this translates into
a significant divergence in rewards and risks among the Asia Pacific infrastructure markets. A 40-point
differential exists between the top and bottom countries in BMI 's Risk/Reward Infrastructure regional
ratings table. Such a wide dispersion presents investors with a range of rewards at different levels of risk.
Asia The Melting Pot Asian Countries (LHS) And Regional (RHS) - Infrastructure BE Risk/Reward Ratings, Scores out of
100
* Higher Score = Lower Risks, CEE = Central/Eastern Europe. Source: BMI
The key findings from this quarter's update on the Asia Pacific Infrastructure Business Environment (BE)
Ratings can be summarised as follows:
Although the elevated levels in inflation and the aggressive rate hikes to curb these pressures for
much of 2011 have created a tough business climate for construction companies, we expected
these monetary difficulties to lessen in 2012 due to growing headwinds throughout the global
economy.
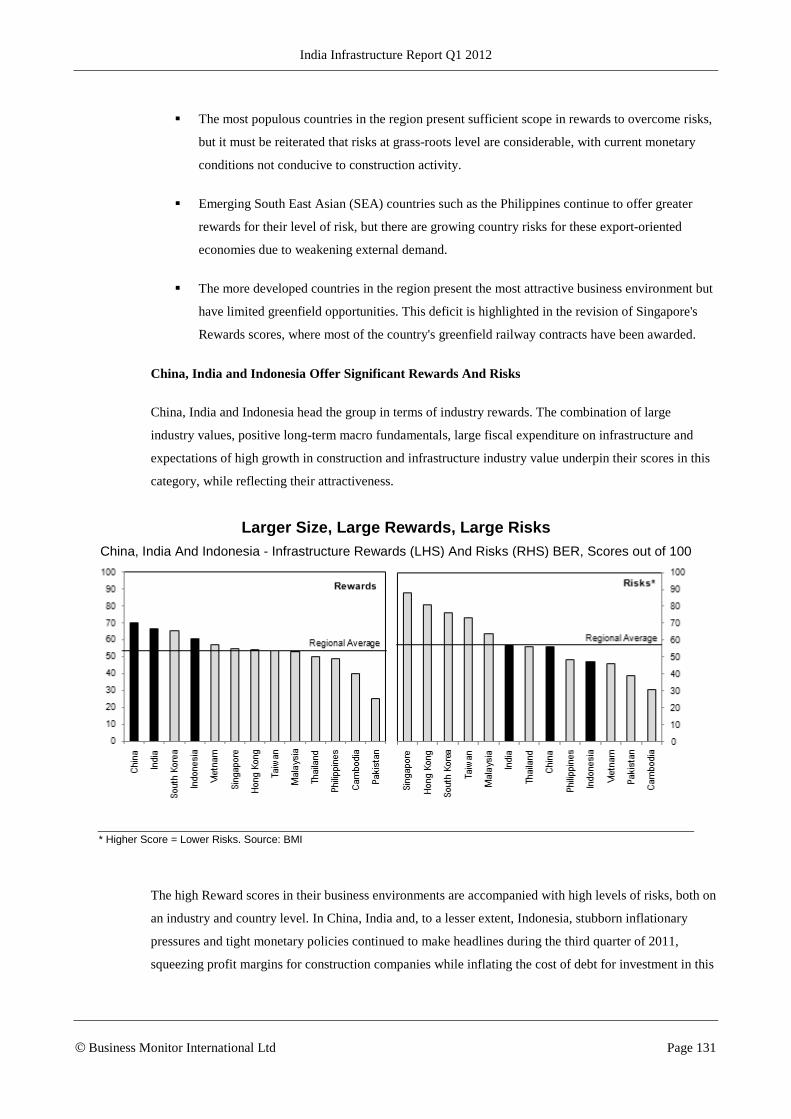
India Infrastructure Report Q1 2012
© Business Monitor International Ltd Page 131
The most populous countries in the region present sufficient scope in rewards to overcome risks,
but it must be reiterated that risks at grass-roots level are considerable, with current monetary
conditions not conducive to construction activity.
Emerging South East Asian (SEA) countries such as the Philippines continue to offer greater
rewards for their level of risk, but there are growing country risks for these export-oriented
economies due to weakening external demand.
The more developed countries in the region present the most attractive business environment but
have limited greenfield opportunities. This deficit is highlighted in the revision of Singapore's
Rewards scores, where most of the country's greenfield railway contracts have been awarded.
China, India and Indonesia Offer Significant Rewards And Risks
China, India and Indonesia head the group in terms of industry rewards. The combination of large
industry values, positive long-term macro fundamentals, large fiscal expenditure on infrastructure and
expectations of high growth in construction and infrastructure industry value underpin their scores in this
category, while reflecting their attractiveness.
Larger Size, Large Rewards, Large Risks China, India And Indonesia - Infrastructure Rewards (LHS) And Risks (RHS) BER, Scores out of 100
* Higher Score = Lower Risks. Source: BMI
The high Reward scores in their business environments are accompanied with high levels of risks, both on
an industry and country level. In China, India and, to a lesser extent, Indonesia, stubborn inflationary
pressures and tight monetary policies continued to make headlines during the third quarter of 2011,
squeezing profit margins for construction companies while inflating the cost of debt for investment in this

India Infrastructure Report Q1 2012
© Business Monitor International Ltd Page 132
capital-intensive industry. As a result, we have seen a decline in construction activity in these countries
throughout the better part of 2011, as companies become cautious in taking on large-scale projects.
However, going into 2012, we expect these tough monetary conditions to lessen and create a more
conducive environment for infrastructure development, prompting us to maintain our Country Risks
scores (which are already elevated) for these three countries. Besides monetary conditions, there are other
idiosyncratic risks that continue to plague the respective business environments in China, India and
Indonesia.
China continues to channel vast amounts of public funds into its already-sizeable construction industry,
dwarfing allocations in all other emerging markets. Nevertheless, concerns such as the transparency of the
tendering process and biases towards foreign companies continue to have an adverse impact on China's
business environment. Meanwhile, issues related to inefficiencies and wastages are growing following the
infrastructure boom during the last Five-Year plan. Recent examples include the boom and bust of high-
speed rail, where the approvals for new high-speed railway projects are suspended and safety checks
conducted on existing lines, and the liquidity problems facing local governments due to large-scale
lending to economically unviable infrastructure projects.
Although these factors are expected to dampen the overall growth in rewards for China's construction
sector, there are potential bright spots in certain sub-sectors. China has plans to launch a raft of measures
to bolster funding the country's mass social housing programme. China has also completed its mandatory
safety inspections on nuclear plants without incident, suggesting that it is likely to continue its massive
nuclear-building programme.
India also has plans to spend significant amounts on plugging its infrastructure deficit, with the country's
12th Five-Year Plan (2012/13- 2016/17) to push out US$1trn worth of infrastructure investment.
However, project execution continues to suffer due to weighty bureaucratic problems and an incoherent
legal framework. This fosters corruption and inefficiencies, which culminate in delays and project cost
inflation for sponsors. Sectors ranging from energy infrastructure to road and rail continue to face serious
challenges over the time needed to secure property rights, navigate planning regulation and deal with
localised protests. One area of particular concern is that of land acquisition. A land acquisition bill and
legislation on resettlement are expected to be completed in December 2011, with the proposals likely to
include farmer-friendly provisions in terms of compensation and government-centric handling of virtually
all land acquisition deals (even on behalf of private players). Although the new laws are expected to bring
much-needed clarity to the land acquisition process, the issue has become increasingly politicised, with
proposed reforms likely to see investors pay well above market rates for property.
Therefore, even though the government has been making serious attempts to address the problem
regarding access to financing (the country has launched measures to boost the size and sophistication of

India Infrastructure Report Q1 2012
© Business Monitor International Ltd Page 133
the domestic debt market), concerns over the level of investment filtering through to projects on the
ground remain pertinent.
Indonesia continues to present significant opportunities, with the government's latest plan in June 2011
expected to launch a slew of industrial construction projects worth a combined US$22.3bn (IDR190trn).
Combined with the launch of core infrastructure projects under a private-public partnership framework,
Indonesia's infrastructure sector is sending the right signals to investors about its vast growth potential.
However, we have yet to see a decisive change in Indonesia's regulatory environment, as the industry
continues to be fraught with intrinsic risks. A new land acquisition bill was supposed to be implemented
in 2011 but is still stuck in parliamentary discussions. High levels of corruption and an unsophisticated
regulatory environment (particularly in legal rights that facilitate lending) mean there are substantial
country risks. Industry risks are also on the downside, with significant concerns regarding the
transparency of the tendering process. The government is looking to provide incentives and guarantees to
limit the downside risks to investors, but it remains to be seen if the Indonesian government is able to
effectively implement them. Lastly, the infrastructure sector remains dominated by quasi- state-owned
entities, and there is no precedent to gauge how the long-term returns from infrastructure could play out.
South East Asia Offering Greater Rewards, But Face Greater External Risks
For emerging SEA countries, inflationary pressures remain stubborn and are starting to have a growing
impact on construction activity in 2011. Nevertheless, we continue to expect these emerging SEA
countries to offer greater rewards relative to their level of risk, with the Philippines achieving an
appreciation in their Industry Rewards scores this quarter. These countries continue to exhibit varying
levels of infrastructure deficits and have launched multi-billion dollar infrastructure programmes to
address such shortfalls. Therefore, we expect them to continue to present numerous opportunities in their
respective infrastructure sectors over the long-term.
Vietnam Leads In Rewards, Trails In Risks Emerging South East Asia (ex-Indonesia) - Infrastructure Rewards (LHS) And Risks (RHS) BER,
Scores out of 100

India Infrastructure Report Q1 2012
© Business Monitor International Ltd Page 134
* Higher Score = Lower Risks. Source: BMI
Risks in these SEA countries are also relatively stable, but evidence of a stalling economic recovery in the
US suggests that there could be a worse-than-expected slowdown in external demand. This could increase
risks on a country level for the infrastructure sectors in these emerging SEA countries as their economies
(or tax revenues) are dependent on a vibrant export sector to finance infrastructure expenditure. This
potential risk has yet to be reflected in our ratings. Malaysia, in fact, saw an improvement in its country
ratings due to a resilient domestic market, but we expect them to make an impact in the following
quarters. Thailand, for example, has shown signs of these growing external risks, but the downward
revision in its Country Risk score is also due to the prospect of further political instability within the
country. Although the July parliamentary elections saw the Pheu Thai Party win an overwhelming
majority, the party's adamant stance on amending the constitution is increasing the risks of renewed
political protests by supporters of the opposition party, the People's Alliance for Democracy. This is
clouding the political situation in Thailand, which is not positive for investor confidence.
Nearly Developed Markets Offer Best Risks/Rewards Mix
Inflationary pressures have also remained elevated in Asian countries that are nearing developed market
status in terms of their infrastructure market maturity. However, with the exception of Hong Kong, they
have not reached levels that are detrimental to construction growth and, instead, we expect the weakening
external demand to be the main concern affecting demand for infrastructure.
Singapore Moderates On Rewards Nearly Developed Countries In Asia - Infrastructure Rewards (LHS) And Risks (RHS) BER, Scores
out of 100

India Infrastructure Report Q1 2012
© Business Monitor International Ltd Page 135
* Higher Score = Lower Risks. Source: BMI
Nevertheless, these countries continue to offer the best business environments for realising investment
returns. Countries such as Singapore, Hong Kong, Taiwan and South Korea are highly developed in terms
of their legislative and regulatory environments and present very little in the way of risk to sponsors and
financiers. The average score for Risks in these developed markets is 79.4 out of 100, significantly higher
than the remaining nine Asian markets at 50.3. Furthermore, these countries offer significant
opportunities for brownfield projects and remain committed to improving their infrastructure to support
economic development.
This quarter, Singapore's Rewards scores have seen a major downward revision, pushing its ranking in
the overall BE ratings table from second to third place. This decline is because most of the country's
greenfield contracts for the next decade, centred on the US$48.6bn urban railway expansion project, have
been awarded.
South Korea continues to hold top spot in our Asia BE Ratings table as it offers the best combination of
risks and rewards. The recent successful bid by South Korea to host the 2018 Winter Olympics and the
ongoing plans by the government to expand and diversify the country's transport networks and electricity
generation capacity are expected to provide a steady stream of greenfield projects. However, the sector
has been saturated since the construction boom in the 1990s, and places high entry barriers for foreign
companies.

India Infrastructure Report Q1 2012
© Business Monitor International Ltd Page 136
Table: Regional Infrastructure Business Environment Ratings
Reward
s Risks
Industry Reward
s
Country Reward
s Reward
s Industry
Risks Country
Risk Risks
Infrastructure BE
Rating
Regional
Ranking
South Korea 52.5 88.9 65.2 75.0 77.1 76.3 68.5 1
China 75.0 60.9 70.1 40.0 66.5 55.9 65.8 2
Singapore 37.5 86.2 54.6 90.0 86.2 87.7 64.5 3
India 77.5 45.4 66.3 55.0 57.8 56.7 63.4 4
Hong Kong 35.0 90.1 54.3 85.0 77.8 80.7 62.2 5
Taiwan 42.5 74.0 53.5 75.0 71.6 73.0 59.4 6
Indonesia 67.5 48.2 60.8 25.0 62.2 47.3 56.7 7
Malaysia 42.5 72.2 52.9 55.0 69.8 63.9 56.2 8
Vietnam 55.0 60.4 56.9 35.0 53.9 46.3 53.7 9
Thailand 37.5 72.3 49.7 50.0 60.5 56.3 51.7 10
Philippines 45.0 55.1 48.5 35.0 57.1 48.3 48.5 11
Cambodia 47.5 25.9 39.9 20.0 37.6 30.6 37.1 12
Pakistan 15.0 43.6 25.0 35.0 41.7 39.0 29.2 13
Regional Average 48.5 63.3 53.7 51.9 63.1 58.6 55.2
Source: BMI. Scores out of 100, with 100 highest. The Infrastructure BE Rating is the principal rating. It is comprised of two sub-ratings 'Rewards' and 'Risks', which have a 70% and 30% weighting respectively. In turn, the 'Rewards' Rating is comprised of Industry Rewards and Country Rewards, which have a 65% and 35% weighting respectively and are based upon growth/size of the Infrastructure industry (Industry) and the broader economic/socio-demographic environment (Country). The 'Risks' rating is comprised of Industry Risks and Country Risks which have a 40% and 60% weighting respectively and are based on a subjective evaluation of industry regulatory and competitive issues (Industry) and the industry's broader Country Risk exposure (Country), which is based on BMI's proprietary Country Risk Ratings. The ratings structure is aligned across the 14 Industries for which BMI provides Business Environment Ratings methodology, and is designed to enable clients to consider each rating individually or as a composite, which the choice depending on their exposure to the industry in each particular state. For a list of the data/indicators used, please consult the appendix at the back of the report.

India Infrastructure Report Q1 2012
© Business Monitor International Ltd Page 137
Company Monitor
Gammon India Ltd.
Strengths Gammon is well placed within the Indian infrastructure sector, meaning it can take
advantage of opportunities as they arise.
Gammon has a presence in the infrastructure sectors in Asia, the Middle East and Africa.
Weaknesses It was hit by higher finance costs and currency fluctuations, dampening Q109/10 results.
Opportunities India’s strong population growth and a growing economy is fuelling demand for
infrastructure.
India’s government is looking to improve the regulatory regime to make the business
environment more attractive for private sector companies looking to invest in
infrastructure. It is also opening up the sector to private companies through PPPs.
Threats Lack of widely available domestic expertise to take on large infrastructure and civil
engineering projects.
Company Overview Gammon India Limited is an India-based civil engineering company. Over the past 70 years, the
company has expanded its operations both in India and abroad. Gammon has taken on the
design and construction of bridges, ports, harbours, thermal and nuclear power stations, dams,
high-rise structures, chemical and fertiliser complexes, environmental structures, cross country
water, and oil and gas pipelines.
Recent Activity Gammon is currently involved in a number of projects: the improvement, operation and
maintenance of the Vadape-Gonde Road; the Parbati Hydroelectric Project; the Rampur
Hydroelectric Project; the West Bengal Corridor Project; the construction of the Bramhaputra
Bridge; the part design and construction of viaduct and structural work on three elevated stations
for phase two of the Delhi MRTS Project; the Gorakhpur By-Pass; the Kosi Bridge; the Dahej
Uran Pipeline Project; the Gandikota Package two, Andhra Pradesh Irrigation Works; and the
Kalwakurthy Lift Irrigation Scheme.
In August 2011, Gammon Infrastructure Projects announced that the Company has sold its 50%
stake in the 12MW operational biomass power plant of Punjab Biomass Power Ltd. at Ghanour to
its joint venture partner for a cash consideration. Further, the Company has sold its 50% stake in
seven other biomass power projects in Punjab to its joint venture partner and has in turn bought
an additional 50% stake in six biomass power projects in Haryana and one in Punjab from the
joint venture partner. The Company, as a result of the transaction, will have 100% stake in
biomass projects to generate 66 MW power. The transaction, however, is subject to the approval
of the concerned authorities and lenders. Terms were not disclosed.
In February 2011, Gammon India’s Gammon-OJSC Mosmetrostroy announced that it had been
awarded two contracts to design and construct underground stations and associated tunnels for
the Chennai Metro Rail Limited amounting to INR19.47bn. The project involves the construction of

India Infrastructure Report Q1 2012
© Business Monitor International Ltd Page 138
seven underground stations along with twin-bored tunnels covering a total length of 6.4km.
In September 2010, Gammon India announced it had bagged an order to supply a 150MW steam
turbine and boiler for Nagai power plant valued at approgammonximately INR3.1bn (US$67mn).
In February 2010, Gammon India announced it had been awarded a contract by ISKCON
(International Society for Krishna Consciousness), aggregating to INR1.37bn (US$29.8mn) for
Construction of the ‘Sri Chaitanya Chandrodaya Mandir and Indian Educational & Cultural Centre’
at Sri Mayapur, West Bengal.
In January 2010, Gammon India announced that it had been awarded a project by Jindal Power,
aggregating to INR3.08bn (US$67mn) for civil works.
Strategy And
Evaluation
Gammon India is currently engaged in the business of investing in, developing, operating and
maintaining infrastructure projects under the public-private partnership (PPP) model.
The company has a strong presence in diverse sectors such as roads, bridges, ports,
hydroelectric power, biomass power and SEZs. Going forward, the company intends to extend its
operations in more major segments such as mass rapid transit systems, power transmission lines,
airports and SEZs.
Gammon regularly enters into strategic alliances and partnerships with leading domestic and
international players to jointly apply and bid for projects, aiming to further expand its presence and
remit.
The company has been hit by the global downturn, with results for the three months to June 30
2009 (or Q1 2009/10) showing a 52% drop in net profits. The company did post a strong increase
in net sales, growing by 45% to reach INR8.5bn from INR5.8bn in Q108/09. Despite this, the
company was hit by higher finance costs and currency fluctuations which led to a 37% drop in
profit before tax to INR398mn.
Company Data Net sales/income from operations: INR8.50bn (US$182mn) – three months to June 30
2009.
Profit after tax: INR250mn (US$5.36mn) – three months to June 30 2009.
India Infrastructure Report Q1 2012
© Business Monitor International Ltd Page 139
Reliance Infrastructure
Strengths The company’s portfolio includes some of India’s flagship infrastructure projects, such as
the Mumbai and New Delhi metros, and more recently the Tilaiya UMPP.
Fitch Ratings India has awarded an ‘Ind AAA’ debt rating for the company.
Weaknesses Reliance’s heavy involvement with the PPP market potentially exposes the company to
demand risks associated with external economic shocks.
Opportunities Strong population growth and a growing economy is fuelling demand for infrastructure.
India’s government is looking to improve the regulatory regime to make the business
environment more attractive for private sector companies looking to invest in
infrastructure. It is also opening up the sector to private companies through PPPs.
Threats Lack of widely available domestic expertise to take on large infrastructure and civil
engineering projects.
Company Overview Reliance Infrastructure Ltd (formerly Reliance Energy Limited) is India’s largest private sector
power utility, as well as a key player in many other infrastructure sectors. In the power sector,
Reliance is involved in the generation, transmission, distribution and trading of electricity; and
constructing power plants as energy performance certificates partners. In the infrastructure space,
the company is focused on roads and urban infrastructure, including mass rapid transit systems,
sea-link and airports, as well as in specialty real estate and special economic zones (SEZ).
Recent Activity In October 2011, Reliance Power has received permission to start trading carbon credits for its
3,960MW Tilaiya ultra mega power project (UMPP) in Jharkhand. The coal-fired plant secured
approval from the Clean Development Mechanism Executive Board (CDM-EB) of the United
Nations Framework Convention on Climate Change (UNFCCC). The approval will enable the
plant to earn INR20bn (US$407.36mn) by trading 21.3mn carbon credits during the first 10 years
of operations. The plant, scheduled to start generation in 2015, is being developed by Reliance's
wholly owned subsidiary Jharkhand Integrated Power.
In September 2011, the first phase of construction of the Mumbai Metro rail line was set to be
completed by the end of 2012, reports News Resources International. The Mumbai Metropolitan
Region Development Authority has said that the US$510mn project is 80% complete.
Construction is being led by Indian utilities company Reliance Infrastructure. The entire line will
total 146.5km, and is projected to cost US$4.3bn.
In September 2011, Arizona-based solar technology company First Solar is to supply Indian
energy generator Reliance Power with 100MW of solar modules, according to Reuters. Around
40MW-worth of First Solar's thin film modules are to be supplied by the end of 2011, with the
remaining 60MW to follow in 2012. The deal was supported by the Export-Import Bank of the
United States (Ex-Im Bank), which approved a US$84.3mn direct loan to Reliance, as part of its
efforts to support the US solar-energy exports.The thin film modules will be used at Reliance's

India Infrastructure Report Q1 2012
© Business Monitor International Ltd Page 140
plant in Jaisalmer, Rajasthan.
In August 2011, Reliance Power (R Power) announced plans to make a INR15bn (US$333.2mn)
investment in a 200MW wind power plant project in Vashpet, Maharashtra. The plant, which is
scheduled to start operations in September 2012, will have 80 wind electric generators supplied
by German wind turbine supplier Fuhrländer. A long-term power purchase agreement (PPA),
already sanctioned by the Maharashtra State Electricity Regulatory Commission, has been signed
with Reliance Infrastructure at a rate of INR5.37 (US$0.12) per unit. The plant's generation
capacity will eventually increase to 400MW. The project will be entitled to receive 3.7mn certified
emission reductions (CERs) during the first 10 years, which is likely to generate additional
revenue of INR3bn (US$66.6mn) for the project.
In August 2011, Reliance Power was set to receive a US$625mn (INR28bn) loan from US Exim
Bank for the construction of its 2,400MW gas-based power project in Samalkot, Andhra Pradesh.
The approval process for the loan was expected to be completed by September 2011, according
to chairman of US Exim Bank, Fred Hoghberg. The loan is part of a memorandum of
understanding (MoU) signed between US Exim bank and Reliance Group, with the former
agreeing to provide up to US$5bn for the purchase of US goods and services used in Reliance's
projects. The US$625mn loan was disbursed because Reliance Power had, in November 2010,
awarded GE Energy a US$750mn contract to supply three steam turbines and six gas turbines for
the Samalkot power project. Besides GE, US electrical engineering company Black & Veatch was
also selected to design the Samalkot power plant in March 2011.
In June 2011, Reliance Infrastructure (RLIN) announced that it was holding talks with investors
and funds to sell a stake in its roads, metro lines, and transmission businesses. Reliance currently
has a portfolio of three urban railway lines in Mumbai and Delhi, five transmission line projects
and 11 road projects. According to its CEO, Lalit Jalan, Reliance's business units are receiving a
lot of interest from several foreign parties such as construction companies and private equity
firms. He believes that this strong interest is due to the significant growth potential of these
businesses. However, he declined to identify the interested parties.
In June 2011, Reliance Infrastructure won a 53km road construction project in India, according to
Reuters. The firm will build and operate the road, which is to be located in Rajasthan, over a
period of 18 years. The project is worth INR5.9bn (US$128mn).
In March 2011, Reliance Infra had announced that it will build a 2,400MW power plant in
Samalkot, in Andhra Pradesh, India, according to Infra News. The gas-based plant will cost an
expected INR72bn (US$1.6bn) and was contracted by Indian energy firm Reliance Power.
In February 2011, Reliance Infrastructure announced that the company would purchase up to
INR10bn (US$221mn) of its outstanding equity shares at INR725 per share. The buyback will be
made from the open market through the stock exchange.

India Infrastructure Report Q1 2012
© Business Monitor International Ltd Page 141
Strategy And
Evaluation
Reliance’s core market is the generation, transmission and distribution of electricity. However,
Reliance has also established a strong presence in other infrastructure segments such as road
and metro projects.
According to Morgan Stanley, Reliance was estimated to have invested a total of INR16,500mn in
infrastructure projects by the end of the 2010 financial year.
The Morgan Stanley report said that ‘stronger than expected’ growth in the engineering,
procurement, construction (EPC) portfolio will insulate the company’s operations from potential
‘political interference’ in the PPP market.
We note that reducing the reliance on long-term concessions in both transport and power projects
will consequently reduce the company’s exposure to demand risks and possibly price risks.
However, the government has shown significant willingness to finance the country’s massive
infrastructure needs through private sector participation and to buttress that involvement through
schemes such as the viability funding gap, making political interference a relatively small risk.
The company had already signed a US$5bn credit agreement with US Exim bank for the
purchase of US goods and services used in Reliance's projects, while it is currently holding talks
with investors and funds to sell a stake in its roads, metro lines, and transmission businesses,
potentially unlocking additional value in them.
Reliance is thus in a favourable position to extend its portfolio in both the transport and power
sectors in India.
The chairman of Reliance Power, Anil Ambani, announced that the company planned to finance
power projects with debt in 2009/10, according to Reuters. The company was planning to raise
nearly INR200bn (US$4.1bn) to finance its three mega-power projects. The three projects are
expected to generate 4,000MW of electricity each.
Reliance posted improved results in its 2008/09 annual report (covering April 1 2008 to March 31
2009). Gross revenue for the company increased by an impressive 46% in a challenging business
environment to reach INR109bn (US$2.16bn) up from INR750bn (US$1.87bn) in 2007/08. Both
gross and net profit also increased, by 3.5% and 4% respectively. Net profit for the year was
INR11.39bn up from INR10.85bn in 2007/08. Conversely, the company’s net profit in US dollar
terms, as quoted by Reliance in their annual report, fell to US$224.55mn in 2008/09 from
US$270.34mn, illustrating the currency fluctuations between the US dollar and the Indian rupee.
However, as Reliance carries out the majority of its work in India, this had a limited impact on
profit margins.
Company Data Gross revenue (April 2008 to March 2009): INR109bn (US$2,160.69mn)
Net profit (April 2008 to March 2009): INR11.39bn (US$224.57mn)
India Infrastructure Report Q1 2012
© Business Monitor International Ltd Page 142
Larsen & Toubro
Strengths Strong focus on technology and innovation, with engineering research centres in numerous parts of India; Mumbai, Vadodara, New Delhi, Chennai and Kolkatta.
Revenue streams diversified over different parts of India. Large construction order book - around INR1,364bn (US$3.0bn) at the end of June 2011.
Weaknesses Limited geographical diversification – 91% of order book from India at the end of June 2011.
Opportunities Opportunities for greenfield projects span across all sub-sectors of India’s infrastructure sector.
Strong population growth and a growing economy is fuelling demand for infrastructure in India.
India’s government is keen to encourage and facilitate the participation of private sector in infrastructure.
Threats India has a complex and over bureaucratic business environment, with a lack of transparency in some tendering processes.
Project delays, caused by issues with land clearance and a nebulous bureaucratic system, continue to be a significant problem in India’s infrastructure industry.
Concerns with access to finance due to maturity mismatch between loans required by infrastructure companies and loans offered by Indian banks.
Company Overview
Larsen & Toubro (L&T) is a technology, engineering, construction and manufacturing
conglomerate based in India. The firm was established in 1938 and is one of the largest
companies in India’s private sector, with global operations in 20 countries. The Engineering and
Construction Division of L&T is the largest construction organisation in India. The division covers
every discipline of construction: civil, mechanical, electrical and instrumentation engineering. L&T
also manufactures and markets critical construction and mining machinery, plus a wide range of
electrical and electronic products and systems
Financial Highlights
(L&T) continues to ride the infrastructure boom in its domestic market, with revenues in the first
quarter of FY2011/12 (April-March) growing by 21% y-o-y to reach INR94.8bn (US$2.1bn). This
places it in a good starting position to hit its revenue growth target of 25% for FY11/12. The
surprise performance was its net profit performance, which beat consensus and saw a higher-
than-expected increase of 12% y-o-y in Q1 FY2011/12. This was a reversal from Q1 FY2010/11's
net profit figures, which fell by 58% y-o-y. According to L&T, its Q1 FY2011/12 net profit
performance was aided by an acceleration in project execution, but we note that income from its
non-operating operations, particularly in financial services, was also a key component in boosting
headline profitability, growing by 38% y-o-y in Q1 FY2011/12.
Strategy and
Evaluation
Headwinds On The Horizon
We believe that the company is facing several headwinds over the short term due to its
exposure to the Indian infrastructure market. India accounted for 91% of its order book at the
end of Q1 FY2011/12, while its engineering and construction division, which covers the
infrastructure, power and hydrocarbons sectors, accounted for 85% of its total order book.
Elevated levels of inflation and rising interest rates (to curb inflation) are increasing the
operational costs and financing costs for L&T. Both factors have already affected L&T's
financials in Q1 FY2011/12 and are expected to continue to do so through the rest of the
India Infrastructure Report Q1 2012
© Business Monitor International Ltd Page 143
financial year. Operating margins fell to 11.9% in Q1 FY2011/12 from 12.8% in Q1 FY10/11,
while interest expenses grew by 25% y-o-y compared with the previous quarter. In July, the
company launched a stake sale at its financial holding company, L&T Finance Holdings, to
raise US$252mn in funds for its infrastructure financing vehicles, but this is unlikely to be
sufficient to meet its financing needs.
Another major concern – due to tighter monetary conditions – is the impact on the broader
economy. Economic activity is slowing down in India and the government is releasing fewer
infrastructure projects so as to further cool the economy. This slowdown in project releases
means that L&T will continue to face growing competition for infrastructure projects in India. For
example, the recent release of the 555.5km Ahmedabad-Udaipur-Kishangarh expressway-
widening project, India's largest ever road project, saw 11 parties compete for the project, while
the US$290mn Vemagiri-Hyderabad transmission cable laying concession saw 28 companies
taking part in its bidding process. These issues are reducing the number of projects being
awarded to L&T and have impacted the company's project order inflows, which grew by just
4% y-o-y in Q1 11/12.
Overseas Markets Not Offering As Much Long-Term Growth Potential
A move overseas would seem prudent to offset this current weakness in the Indian
infrastructure sector. L&T has done just that, winning three overseas hydrocarbon projects (two
from UAE and one from Thailand) worth US$889mn in August. However, these markets offer
limited growth opportunities going forward, with real construction growth in the UAE and
Thailand expected to come in at a relatively modest 3.3% and 3.9% per annum over the next
five years respectively, compared to 8.5% (9.9% for the infrastructure sector) in India. Thailand
continues to hold significant political risks which could hamper project implementation in the
country, while there are suggestions within the UAE that there could be a review of all
government-sponsored projects in Abu Dhabi – an indication that there could be a cut in
construction spending.
Stock Price To Trend Sideways And Still Outperform
We therefore conclude that L&T should instead focus on streamlining its operations (ie
increasing efficiency in project execution and maintaining a tight control on costs) in the Indian
market and weather the market's near-term weakness. L&T still retained a huge construction
orderbook at around INR1,364bn (US$3.0bn) at the end of Q1 11/12 – more than three times
full-year revenue figures – and this will sustain revenues over the next couple of years. Its
strong focus on technology should also hold it in good stead. The company has numerous
engineering research centres in different parts of India carrying out in-depth research on
construction design, engineering systems and material stress analysis. This focus on
technology and construction has allowed the firm to take on a diverse range of infrastructure
projects, from oil rigs to metro railway networks.
Following recent selling pressure, we do not have a firm conviction on the company's stock
price over the near-term, and suspect that it will continue to trend sideways in FY2011/12.
Even if this scenario were to take place, we would expect L&T to remain an outperformer
against the broader Bombay Stock Exchange, given that other sectors (most notably consumer
discretionaries and technology) are much more expensive and, by extension, exposed to

India Infrastructure Report Q1 2012
© Business Monitor International Ltd Page 144
downside growth risks. From a global perspective, L&T remains one of the stronger
infrastructure players in terms of stock performance. When rebased from the start of 2009,
L&T's stock price is an outperformer against the SENSEX and a huge outperformer against our
proprietary Infrastructure Index, which is an indication of market sentiment for the global
construction sector.
Recent
Activity/Projects
In September 2011, Larsen & Toubro announced that it had received a project order
valued around US$150mn from the Petroleum Development Oman. The order is for the
development of a gas treatment plant, which includes gas desulfurisation and gas
dehydration units with required utilities and supporting facilities as well as associated
pipelines.
In September 2011, Larsen & Toubro announced that it was set to work on a new railway
construction project in Mumbai, according to Railway-Technology. The project is expected
to cost between US$260mn to US$326mn, and will include a railway station along with
space reserved for commercial and retail operations. Work will begin once railway
operator Indian Rail gains access to the land, and will take four years to complete.
In August 2011, Larsen & Toubro announced that it had won three international contracts
worth US$889mn in the UAE and Thailand. The first contract, worth US$189mn, was
awarded by Abu Dhabi Gas Industries and involves the engineering, procurement and
commissioning (EPC) of 123km of pipelines for its Habshan-Ruwais-Shuweihat gas
pipeline project. The second US$450mn EPC contract was awarded by UAE-based
ADMA-OPCO. The contract involves the development of towers, bridges and pipelines.
The third contract, valued at US$250mn, was awarded by Thailand-based PTTEP
International for the Phase-1A of the Zawtika Development Project.
In July 2011, Larsen & Toubro announced that it had won a INR12.1bn (US$269mn) EPC
contract from Qatar General Electricity & Water Corporation for the supply and
construction of 13 extra high-voltage substations in Qatar. The project will be completed in
between 18 to 26 months times.
In June 2011, Larsen & Toubro’s L&T BPP Tollway Private Limited announced that it had
signed the INR26bn concession agreement with NHAI for the four-lane widening of the
24km stretch of NH14 between Beawer and Pindwara in the state of Rajasthan. The
project will be executed on a BOTDBFO (Design, Build and Finance & Operate) basis and
is expected to be completed within 30 months.
In May 2011, Larsen & Toubro announced that it had won a INR35bn order from PPN
Power Generating Company to develop a three 360MW gas-based power plants – in the
Nagpattinam District of Tamil Nadu state – on a EPC basis.
Company Data Gross revenue (April 2010 to March 2011): INR109bn, % y-o-y
Net profit (April 2010 to March 2011): INR11.39bn % y-o-y
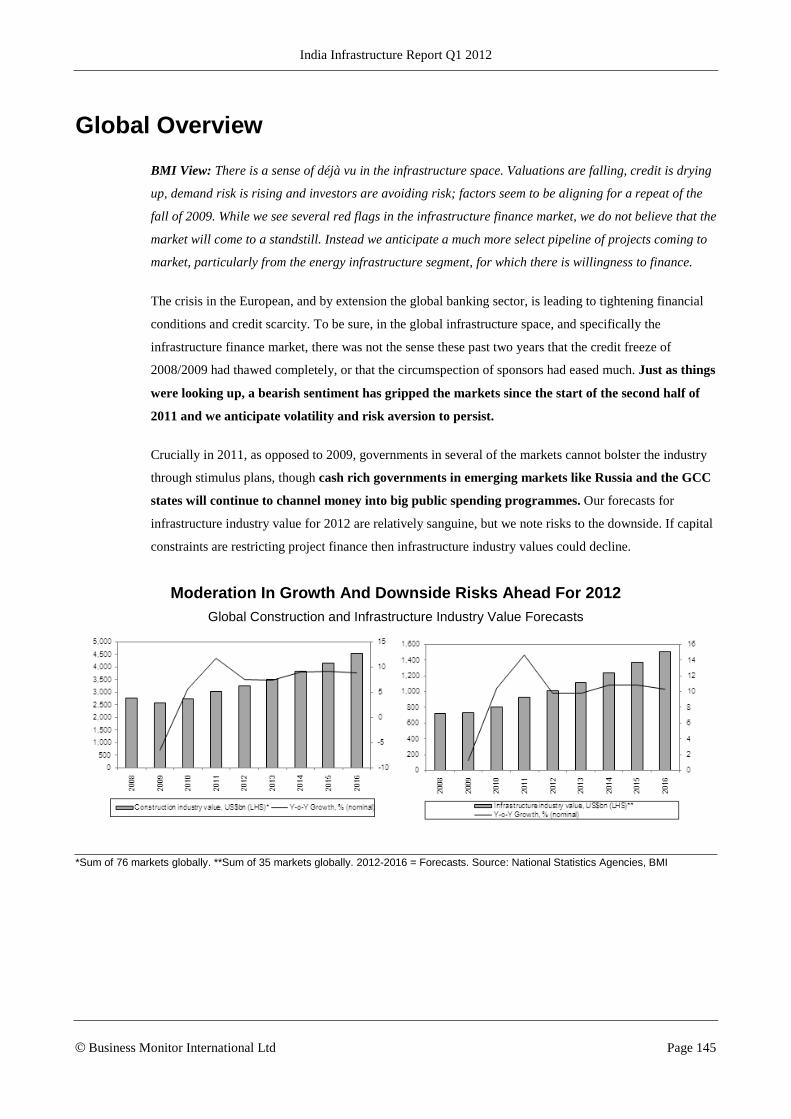
India Infrastructure Report Q1 2012
© Business Monitor International Ltd Page 145
Global Overview
BMI View: There is a sense of déjà vu in the infrastructure space. Valuations are falling, credit is drying
up, demand risk is rising and investors are avoiding risk; factors seem to be aligning for a repeat of the
fall of 2009. While we see several red flags in the infrastructure finance market, we do not believe that the
market will come to a standstill. Instead we anticipate a much more select pipeline of projects coming to
market, particularly from the energy infrastructure segment, for which there is willingness to finance.
The crisis in the European, and by extension the global banking sector, is leading to tightening financial
conditions and credit scarcity. To be sure, in the global infrastructure space, and specifically the
infrastructure finance market, there was not the sense these past two years that the credit freeze of
2008/2009 had thawed completely, or that the circumspection of sponsors had eased much. Just as things
were looking up, a bearish sentiment has gripped the markets since the start of the second half of
2011 and we anticipate volatility and risk aversion to persist.
Crucially in 2011, as opposed to 2009, governments in several of the markets cannot bolster the industry
through stimulus plans, though cash rich governments in emerging markets like Russia and the GCC
states will continue to channel money into big public spending programmes. Our forecasts for
infrastructure industry value for 2012 are relatively sanguine, but we note risks to the downside. If capital
constraints are restricting project finance then infrastructure industry values could decline.
Moderation In Growth And Downside Risks Ahead For 2012 Global Construction and Infrastructure Industry Value Forecasts
*Sum of 76 markets globally. **Sum of 35 markets globally. 2012-2016 = Forecasts. Source: National Statistics Agencies, BMI

India Infrastructure Report Q1 2012
© Business Monitor International Ltd Page 146
We look for indicators in the banking and financial sector as proxies to gauge sentiment and look for red
flags for infrastructure finance. What we see gives reasons for concern that a new credit crunch is
underway, with banks unwilling to lend to each other. Spreads between the London Interbank Rate
(LIBOR) and the US swap rates have been rising steadily since August 2011 reflecting stress in the
banking sector.
Stress In The Banking SectorSpread: 3-month LIBOR and 3-month US swap rates
Source: Bloomberg
More specifically, and tied to the above, is the picture from the credit default swap rates (CDS) for major
banking institutions around the world. Universally, they are at their highest levels in two years, reflecting
deep investor concern about the prospects for the sector.
Pricing In The Risks2-Year Credit Default Swap Rates For Banking Groups

India Infrastructure Report Q1 2012
© Business Monitor International Ltd Page 147
Source: Bloomberg
Worryingly for the infrastructure market, some of the largest and most active lenders, including
Sumitomo, Societe General and Credit Agricole and the export import banks of China and India are
amongst the banks globally with the highest premiums.This spike in CDS rates leaves us with two main
conclusions:
Firstly, we see trouble ahead for the French infrastructure market, as its domestic banks may struggle to
support Europe's largest PPP market.
Secondly, and most importantly, we believe that it raises red flags in emerging markets, particularly sub-
Saharan Africa, Asia and Latin America, which rely on export credit from China to finance a lot of the
larger infrastructure projects. The state-owned nature and strategic value the export credit agencies means
that their operations will be supported by a constant supply of state money. However, the movements in
their CDS highlight the deteriorating market perceptions of the risks the banks are exposed to.
Having said all of the above, we stress that we do not see the market being in a funding drought, nor do
we believe the infrastructure finance market will descend into the hibernation we saw in 2008/2009. We
have not seen deals failing to be financed, on the contrary there has been a healthy PPP pipeline.
However, it is much leaner. What we expect is that the project finance market will become much more
selective and we highlight the energy sector (excluding renewables) as the most likely candidate to see
the highest level of activity. Already, this seems to be the case with major financings announced in recent
days for the Origin LNG terminal and the SIR refinery in Cote d'Ivoire.

India Infrastructure Report Q1 2012
© Business Monitor International Ltd Page 148
Private Capital Not Meeting Expectations
Against the backdrop of one of the worst climates for private equity fundraising, infrastructure
fundraising activity has also come to a standstill with a mere US$2.8bn raised between July and
September 2011, according to data from the industry journal Infrastructure Investor. This is significantly
below the US$100bn target set by the industry in 2011. In April 2011, research firm Prequin said that
there were 131 unlisted infrastructure funds in the market seeking to raise a total of US$92bn from
institutional investors.
This ambitious fundraising target reflects a perceived appetite in the market from institutional investors to
become involved in infrastructure. However, the disappointing fundraising achieved in the first nine
months of the year however reflects that institutional investors are reluctant to part with their money. It
also reflects a change in the infrastructure finance markets, whereby big institutional investors are
circumventing fund managers and private equity firms and going straight to the market themselves, as
was the case with the Gassled divestment in Norway and the Brussels and Copenhagen airport stakes,
where large Canadian pension funds went for a direct stake in the assets.
Fundraising Struggles To Recover In Spite Of Numerous New Funds Capital Raised By Infrastructure Funds, US$bn
*BMI Estimate based on 9-month 2010 actual figures; **BMI estimate. Source: Preqin
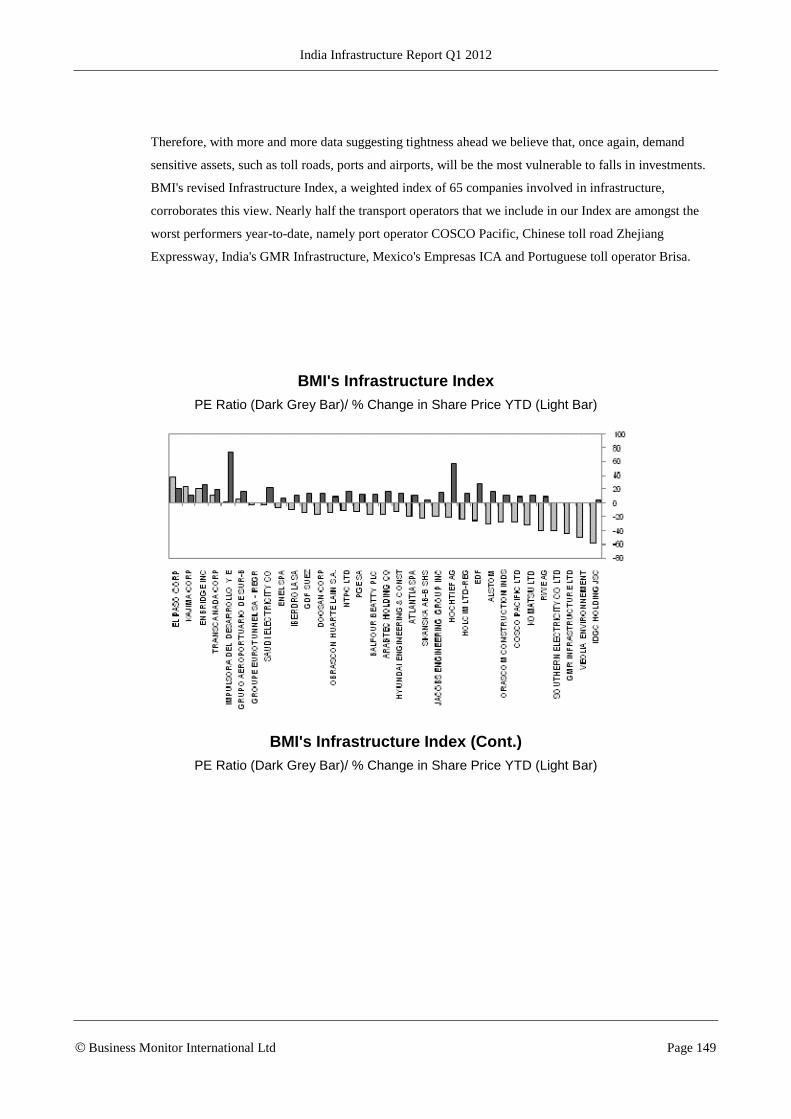
India Infrastructure Report Q1 2012
© Business Monitor International Ltd Page 149
Therefore, with more and more data suggesting tightness ahead we believe that, once again, demand
sensitive assets, such as toll roads, ports and airports, will be the most vulnerable to falls in investments.
BMI's revised Infrastructure Index, a weighted index of 65 companies involved in infrastructure,
corroborates this view. Nearly half the transport operators that we include in our Index are amongst the
worst performers year-to-date, namely port operator COSCO Pacific, Chinese toll road Zhejiang
Expressway, India's GMR Infrastructure, Mexico's Empresas ICA and Portuguese toll operator Brisa.
BMI's Infrastructure Index PE Ratio (Dark Grey Bar)/ % Change in Share Price YTD (Light Bar)
BMI's Infrastructure Index (Cont.) PE Ratio (Dark Grey Bar)/ % Change in Share Price YTD (Light Bar)
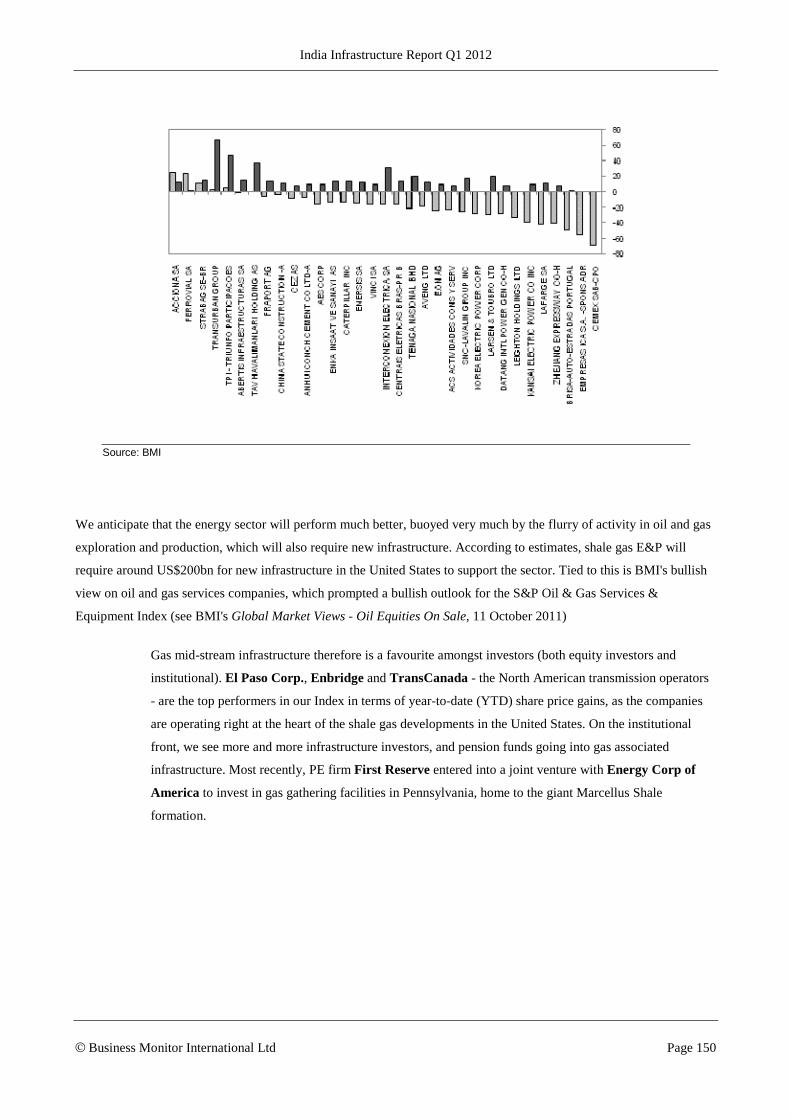
India Infrastructure Report Q1 2012
© Business Monitor International Ltd Page 150
Source: BMI
We anticipate that the energy sector will perform much better, buoyed very much by the flurry of activity in oil and gas
exploration and production, which will also require new infrastructure. According to estimates, shale gas E&P will
require around US$200bn for new infrastructure in the United States to support the sector. Tied to this is BMI's bullish
view on oil and gas services companies, which prompted a bullish outlook for the S&P Oil & Gas Services &
Equipment Index (see BMI's Global Market Views - Oil Equities On Sale, 11 October 2011)
Gas mid-stream infrastructure therefore is a favourite amongst investors (both equity investors and
institutional). El Paso Corp., Enbridge and TransCanada - the North American transmission operators
- are the top performers in our Index in terms of year-to-date (YTD) share price gains, as the companies
are operating right at the heart of the shale gas developments in the United States. On the institutional
front, we see more and more infrastructure investors, and pension funds going into gas associated
infrastructure. Most recently, PE firm First Reserve entered into a joint venture with Energy Corp of
America to invest in gas gathering facilities in Pennsylvania, home to the giant Marcellus Shale
formation.

India Infrastructure Report Q1 2012
© Business Monitor International Ltd Page 151
Valuations Falling, But Gas-Related Equities Outperform BMI Infrastructure Index, Major Stock Indices / Best and Worst Performers In BMI's Infrastructure
Index, 100 = January 2011
Source: BMI
The successive sell offs in global equity markets in August and September pushed down all equities, and
infrastructure saw a steeper fall led by declines in construction and building materials, with Mexico's
CEMEX having witnessed the largest fall YTD.
With valuations falling, cash rich companies (particularly ones backed by big sovereign wealth funds, like
Qatari Diar and Mubadala) could move to snap up attractive, but undervalued assets. Already Qatar has
been on the prowl, looking to increase its infrastructure portfolio in Europe. If wider M&A activity picks
up globally then we see opportunities in the market as our Infrastructure Index suggests that companies
with strong underlying assets are trading at low valuations.

India Infrastructure Report Q1 2012
© Business Monitor International Ltd Page 152
Methodology
Industry Forecasts
BMI’s industry forecasts are generated using the best-practice techniques of time-series modelling and
causal/econometric modelling. The precise form of model we use varies from industry to industry, in each
case being determined, as per standard practice, by the prevailing features of the industry data being
examined. BMI mainly uses ordinary least squares (OLS) estimators and in order to avoid relying on
subjective views and encourage the use of objective views, uses a ‘general-to-specific’ method. BMI
mainly uses a linear model, but simple non-linear models, such as the log-linear model, are used when
necessary. During periods of ‘industry shock’, for example a deep industry recession, dummy variables
are used to determine the level of impact. Effective forecasting depends on appropriately selected
regression models. BMI selects the best model according to various different criteria and tests, including,
but not exclusive to:
R2 tests explanatory power; Adjusted R2 takes degree of freedom into account;
Testing the directional movement and magnitude of coefficients;
Hypothesis testing to ensure coefficients are significant (normally t-test and/or P-value);
All results are assessed to alleviate issues related to auto-correlation and multi-co linearity.
BMI uses the selected best model to perform forecasting.
It must be remembered that human intervention plays a necessary and desirable role in all of BMI’s
industry forecasting. Experience, expertise and knowledge of industry data and trends ensures that
analysts spot structural breaks, anomalous data, turning points and seasonal features where a purely
mechanical forecasting process would not. Within the infrastructure industry, this intervention might
include, but is not exclusive to, new investments across sectors or cancelled projects; general investment
climate and business environment changes; changing domestic or regional trends; macroeconomic
indicators; and regulatory changes.
Example Of Construction Value Model
(Construction value)t = β0 + β1*(Gross Fixed Capital Formation)t + β2*(inflation)t + β3*(lending rate)t +
β4* (population)t + β5*(government expenditure)t + β6*(construction value)t-1 + εt
Note: Infrastructure sub-sector values are forecast using a similar regression model.

India Infrastructure Report Q1 2012
© Business Monitor International Ltd Page 153
Construction Industry
A number of principal criteria drive our forecasts for each construction and engineering variable:
Construction GDP And Infrastructure Spending
Figures for construction GDP and infrastructure spending are based, where possible, on national accounts
as published by relevant central banks, as well as primary government/ministry sources and official data.
Where these are unavailable, construction GDP forecasts are based on a range of variables including:
Stated infrastructure and development programmes;
Likely increases owing to related urban or industrial sector developments;
Political factors (such as an electorally motivated public works programmes).
Construction as a percentage of GDP is calculated using BMI’s own macroeconomic and demographic
forecasts.
Employment Within The Construction Industry
These figures are forecast based on:
The growth or otherwise of the construction industry;
Company results and expansion plans.
Data Methodology
New Infrastructure Data Sub-sectors
BMI’s new Infrastructure Data examines the industry both from the top down and the bottom up in order
to calculate the industry value of infrastructure and its sub-sectors.
For the bottom up - a country-specific - approach, we have made full use of BMI’s Infrastructure Major
Projects Databases for each country, in most cases dating back to 2005. This has allowed us to calculate
historical ratios between general infrastructure industry value and its sub-sectors, which we then use for
forecasting. Our Major Projects Tables are not exhaustive, but they are sufficiently comprehensive to
provide a solid starting point for our calculations.
The top down approach uses deduction to form the main hypothesis. We have separated the 35 countries
into three Tiers. Each Tier comprises a group of countries that are on a similar economic development
trajectory and have similar patterns in terms of infrastructure spending, levels of infrastructure
development and sector maturity. This methodology enables us to confirm and overcome any deficiencies
of infrastructure-specific data, by applying an average group ratio (calculated from the countries for
which official data exists) to the countries for which data is limited.

India Infrastructure Report Q1 2012
© Business Monitor International Ltd Page 154
Tier I- Developed States; common characteristic: mature infrastructure markets, investments typically
target maintenance of existing assets or highly advanced projects at the top of the value chain.
Infrastructure as percent of total construction on average around 30%.
Countries in Tier I: Germany, Greece, UK, US, France, Hong Kong, Taiwan, Singapore, Israel, Japan,
Australia.
Tier II – Core Emerging Markets; common characteristic: the most rapidly growing of emerging markets,
where infrastructure investments are a strategic priority for the government. There is significant scope for
new infrastructure facilities from very basic levels (highways, heavy rail for instance) to more high value
projects (renewables, urban transport). Infrastructure as percent of total construction on average around
45% and above.
Countries in Tier II: Mexico, South Korea, Peru, Turkey, Vietnam, Poland, Hungary, South Africa,
Nigeria, Russia, China, India Brazil, Indonesia.
Tier III- Emerging Europe; common characteristic: regional socioeconomic trajectories, development has
been defined by the recent or pending accession to European structures such as the European Union.
Infrastructure development to a large degree dictated by EU development goals and financed through
vehicles such as the PHARE and ISPA programmes, and institutions such as the EBRD and EIB.
Infrastructure as percent of total construction on average between 30% and 40%.
Countries in Tier III: Czech Republic, Romania, Bulgaria, Slovakia, Slovenia, Estonia, Latvia, Lithuania,
Croatia, Ukraine.
This methodology has enabled us to calculate infrastructure industry values for states where this was not
previously possibly. Furthermore, it has enabled us to create comparable indicators.
The top down hypothesis-led approach has been used solely to calculate the Infrastructure Industry Value
as a Percentage of Total Construction. For all sub-sector calculations we have applied the bottom-up
approach, i.e. calculated the ratios from our Major Projects Tables where data was not otherwise
available.
Construction
Construction Value
Our data is derived from GDP by output figures from each country’s national statistics office (or
equivalent). Specifically, it measures the output of the construction industry over the reported 12 month
period in nominal values (i.e. domestic currency terms). As it is derived from GDP data, it is a measure of
value added within the industry (i.e. the additional contribution of the construction industry over other
industries, such as cement production). Consequently, it does not measure the nominal value of all inputs
used in the construction industry, which, for most states would increase the overall figure by 50-60%.

India Infrastructure Report Q1 2012
© Business Monitor International Ltd Page 155
Furthermore, it is important to note that the data does not provide an indication of the total value of a
country’s buildings, only the construction sector’s output in a given year.
This data is used because it is reported by virtually all countries and can therefore be used for
comparative purposes. However, it is important to note that, where we are able to locate them, data
released by national statistical offices or industry groups or associations for the overall value of the
construction sector also taken into account and published by us.
Growth
Our data and forecasts for real construction measures the real increase in output (rather than nominal
growth, which would also incorporate inflationary increases). In short, it is an inflation adjusted value of
the output of the construction industry year-on-year. Consequently, real growth will – in virtually all
instances – be lower than the nominal growth of our ‘construction value’ indicator.
Construction Industry, % Of GDP/Construction Value (US$)
These are derived indicators. We use BMI’s Country Risk team’s GDP and exchange rate forecasts to
calculate these indicators.
Capital Investment
Total Capital Investment
Our data is derived from GDP by expenditure data from each country’s national statistics office (or
equivalent). It is a measure of total capital formation (excluding stock build) over the reported 12 month
period. Total capital formation is a measure of the net additions to a country’s capital stock, so takes into
account depreciation as well as new capital. In this context, capital refers to structures, equipment,
vehicles etc. As such, it is a broader definition than construction or infrastructure, but is used by BMI as a
proxy for a country’s commitment to development.
Capital Investment (US$), % Of GDP, Per Capita
These are derived indicators. We use our Country Risk team’s population, GDP and exchange rate
forecasts to calculate them. As a rule of thumb, we believe an appropriate level of capital expenditure is
20% of GDP, although in rapidly developing emerging markets it may, and arguably should, account for
up to 30%.
Government Capital Expenditure
This is obtained from government budgetary data and covers all non-current spending (i.e. spending on
transfers, salaries to government employees, etc.). Due to the absence of global standards for reporting
budgetary expenditure, this measure is not as comparable as construction/capital investment.
Government Capital Expenditure, US$bn, % Of Total Spending
These are derived indicators.

India Infrastructure Report Q1 2012
© Business Monitor International Ltd Page 156
Construction Sector Employment
Total Construction Employment
This data is sourced from either the national statistics office or the International Labour Organization
(ILO). It includes all those employed within the sector.
Construction Employment, % y-o-y; % Of Total Labour Force
These are derived indicators.
Average Wage In Construction Sector
This data is sourced from either the national statistics office or the ILO.
India Infrastructure Report Q1 2012
© Business Monitor International Ltd Page 157
Infrastructure Business Environment Rating
Risk/Reward Ratings Methodology
BMI’s approach in assessing the risk/reward balance for infrastructure industry investors globally is
fourfold. First, we identify factors (in terms of current industry/country trends and forecast
industry/country growth) that represent opportunities to would-be investors. Second, we identify country
and industry-specific traits that pose or could pose operational risks to would-be investors. Third, we
attempt, where possible, to identify objective indicators that may serve as proxies for issues/trends to
avoid subjectivity. Finally, we use BMI’s proprietary Country Risk Ratings (CRR) in a nuanced manner
to ensure that only the aspects most relevant to the infrastructure industry are incorporated. Overall, the
system offers an industry-leading, comparative insight into the opportunities/risks for companies across
the globe.
Ratings System
Conceptually, the ratings system divides into two distinct areas:
Rewards: Evaluation of sector’s size and growth potential in each state, and also broader industry/state
characteristics that may inhibit its development.
Risks: Evaluation of industry-specific dangers and those emanating from the state’s political/economic
profile that call into question the likelihood of anticipated returns being realised over the assessed time
period.
For each category and sub-category, each state is scored out of 100 (100 being the best), with the overall
risk/reward rating a weighted average of the total score. Importantly, as most of the countries and
territories evaluated are considered by BMI to be ‘emerging markets’, our rating is revised on a quarterly
basis. This ensures that the rating draws on the latest information and data across our broad range of
sources, and the expertise of our analysts.

India Infrastructure Report Q1 2012
© Business Monitor International Ltd Page 158
Table: Infrastructure Business Environment Indicators
Indicator Rationale
Rewards
Industry rewards
Construction expenditure, US$bn
Objective measure of size of sector. The larger the sector, the greater the opportunities available.
Sector growth, % y-o-y Objective measure of growth potential. Rapid growth results in increased opportunities.
Capital investment, % of GDP Proxy for the extent the economy is already oriented towards the sector.
Government spending, % of GDP
Proxy for extent to which structure of economy is favourable to infrastructure/ construction sector.
Country rewards
Labour market infrastructure From BMI’s Country Risk Ratings (CRR). Denotes availability/cost of labour. High costs/low quality will hinder company operations.
Financial infrastructure From CRR. Denotes ease of obtaining investment finance. Poor availability of finance will hinder company operations across the economy.
Access to electricity From CRR. Low electricity coverage is proxy for pre-existing limits to infrastructure coverage.
Risks
Industry risks
No. of companies Subjective evaluation against BMI-defined criteria. This indicator evaluates barriers to entry.
Transparency of tendering process
Subjective evaluation against BMI-defined criteria. This indicator evaluates predictability of operating environment.
Country risks
Structure of economy
From CRR. Denotes health of underlying economic structure, including seven indicators such as volatility of growth; reliance on commodity imports, reliance on single sector for exports.
External risk From CRR. Denotes vulnerability to external shock – principal cause of economic crises.
Policy continuity Subjective rating from CRR. Denote predictability of policy over successive governments.
Legal framework From CRR. Denotes strength of legal institutions in each state. Security of investment can be a key risk in some emerging markets.
Corruption From CRR. Denotes risk of additional illegal costs/possibility of opacity in tendering/ business operations affecting companies’ ability to compete.
Source: BMI