india macroeconomic scenario
TRANSCRIPT

India Macroeconomic Scenario
Indian Council for Research on International Economic Relations

The turnaround of India’s growth story • As per the new series of national accounts India’s GDP grew at 6.9% in fiscal 2014, compared to
5.0% as per the old series.
• The Central Statistical Office (CSO) expects GDP growth for fiscal 2015 to rise to 7.4 % in fiscal
2015- putting India at par with china.
• Economic survey 2013-14 expects India to grow around 8.1- 8.5% in 2015-16 boosted by
declining oil prices and increasing monetary easing.
Note: CSO’s estimate for 2014-15 Source: Central Statistical Office

The new GDP math • CSO has released the new series national accounts. The major change in the new series are:
Revision in the base year from 2004-05 to 2011-12
Revisions in the methodology of compilation, adoption of latest classification systems, and,
inclusion of new and recent data sources.
GDP at factor cost will replaced by Gross Value Added (GVA) at basic prices, which is the practice
in OECD countries and will facilitate international comparability of data
GVA at basic prices will be used to calculate the ‘GDP at Market Prices’ which will henceforth be
referred to as ‘GDP’.
Comprehensive coverage of Corporate Sector both in manufacturing and services and
partnership firms covered under Limited Liability Partnership Act have also been covered.
GVA at basic prices= [Compensation to employees] + [Operating surplus/mixed income] + [Consumption of fixed capital] + [Production taxes] – [Production subsidies] GDP = GDP at MP= ΣGVA at basic prices + Product taxes - Product subsidies

Implications of the revised GDP series • Growth has been revised upwards boosted by higher growth in industrial sector on the
supply side and an uptick in government and private consumption and investments on the demand side.
• Changing structure of the economy- The share of agriculture and industry in GDP has risen, while that of services has fallen.
• Nominal GDP for 2013-14 is marginally lower than the old series implying no impact on significant ratios such as CAD, fiscal deficit.
GVA at basic prices
GVA at factor cost
GDP at Market Prices= GDP
Private Final Consumption Expenditure
Gross Fixed Capital Formation
New series: 2011-12 base 2012-13 4.9 4.9 5.1 5.5 -0.3 2013-14 6.6 6.6 6.9 6.2 3
Old series: 2004-05 base 2012-13 - 4.5 4.7 5 0.8 2013-14 - 4.7 5 4.8 -0.1
Increase Decline
Source: CSO
13.9 26.1
14.9
59.9 17.9
31.4
17.9
50.7
Agric
ultu
re
Indu
stry
Man
ufac
turin
g
Serv
ices
Old series New series
Source: CSO
Growth rates in new and old series, % y-o-y % share in total GVA Factor cost, 2013-14

Manufacturing holds the key for future growth • A recent OECD paper1 highlighted that :
– Manufacturing sector in India has contributed little to income, export and employment growth2. – India’s manufacturing productivity is low in international comparison. – It has created few and low quality jobs. Most manufacturing jobs were created in informal sector. – Manufacturing growth is constrained by a complex business environment, stringent labor
regulations, infrastructure bottlenecks and tax system. Policies are needed to address them. – Structural changes like movement to higher technological sectors are needed.
1Challenges and Opportunities of India's Manufacturing Sector”, Joumard, I., U. Sila and H. Morgavi (2015 ), OECD
Share of manufacturing exports in total exports has declined Manufacturing Productivity is low in International Comparison
Value added per employee, 2009

Investments remain muted, efficiency increases • Investment (GFCF) as a proportion to GDP have declined post 2011-12. This was accompanied by lower capital
efficiency (rising Incremental Capital Output Ratio) .
• Slowdown was driven by rising policy uncertainty, delayed project approvals and supply bottlenecks (particularly in
power and mining), partially due to higher interest rates (IMF, 2014 and Tokuoka, 2012) and other structural
constraints .
• Efficiency of capital has risen in the last one year due to better business environment, speedier clearances etc.
33.6 31.9
30.7 28.7
30.5 31.8
33.7 33.5 33.3 33.5 35.3
33.9 32.3
2004
-05
2005
-06
2006
-07
2007
-08
2008
-09
2009
-10
2010
-11
2011
-12
2012
-13
2013
-14
Investments as a percent of GDP* (2011-12 series)
Investments as a percent of GDP* (2004-05 series)
4.8 3.8 4.0 4.3
5.7
4.5 4.4
6.0
8.5 7.7
6.6
4.8 20
04-0
5
2005
-06
2006
-07
2007
-08
2008
-09
2009
-10
2010
-11
2011
-12
2012
-13
2013
-14
ICOR as per old series ICOR as per new series
Decline in Investments... ...but higher capital efficiency
Source: CSO Note: Capital efficiency has been measured by ICOR which is calculated as the ratio of GFCF to incremental GDP at MP Source: CSO
ICOR has declined to
pre-crisis level
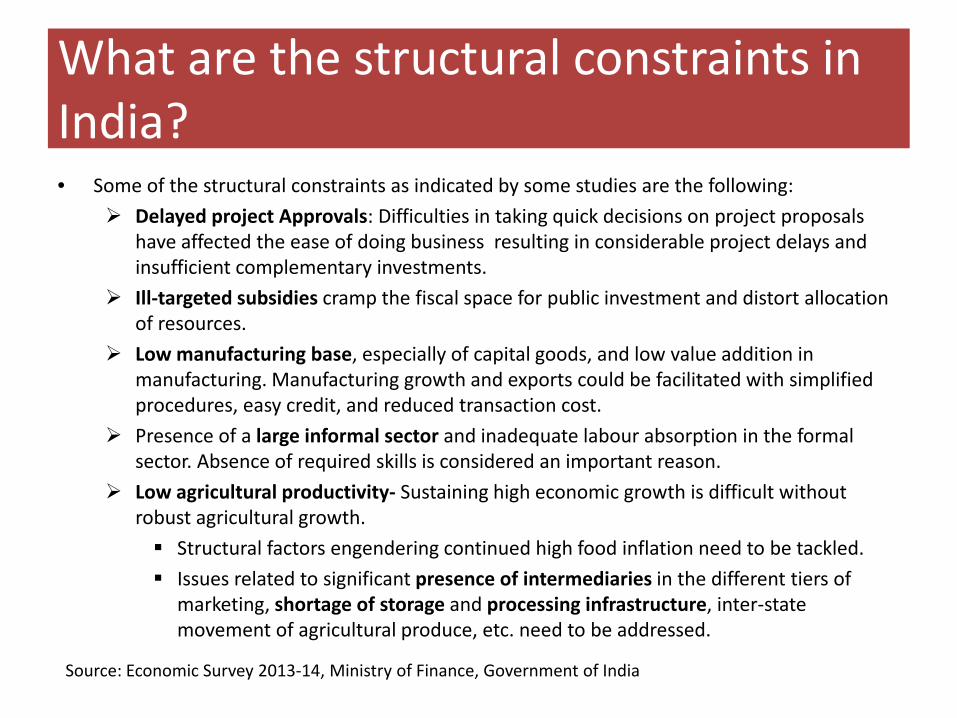
What are the structural constraints in India? • Some of the structural constraints as indicated by some studies are the following:
Delayed project Approvals: Difficulties in taking quick decisions on project proposals have affected the ease of doing business resulting in considerable project delays and insufficient complementary investments.
Ill-targeted subsidies cramp the fiscal space for public investment and distort allocation of resources.
Low manufacturing base, especially of capital goods, and low value addition in manufacturing. Manufacturing growth and exports could be facilitated with simplified procedures, easy credit, and reduced transaction cost.
Presence of a large informal sector and inadequate labour absorption in the formal sector. Absence of required skills is considered an important reason.
Low agricultural productivity- Sustaining high economic growth is difficult without robust agricultural growth. Structural factors engendering continued high food inflation need to be tackled. Issues related to significant presence of intermediaries in the different tiers of
marketing, shortage of storage and processing infrastructure, inter-state movement of agricultural produce, etc. need to be addressed.
Source: Economic Survey 2013-14, Ministry of Finance, Government of India
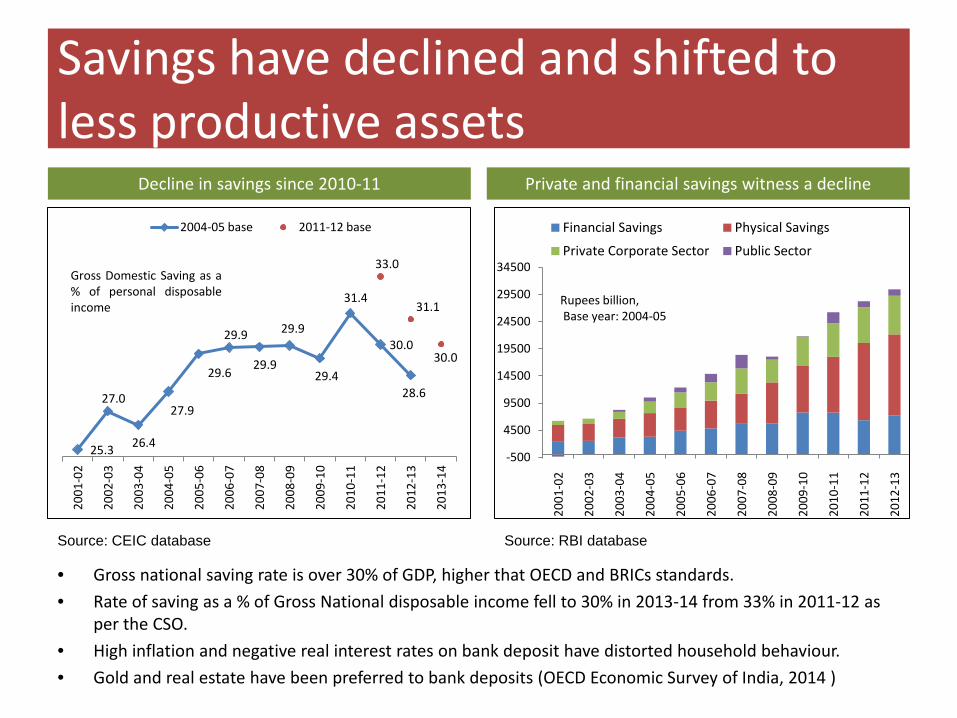
Savings have declined and shifted to less productive assets
• Gross national saving rate is over 30% of GDP, higher that OECD and BRICs standards. • Rate of saving as a % of Gross National disposable income fell to 30% in 2013-14 from 33% in 2011-12 as
per the CSO. • High inflation and negative real interest rates on bank deposit have distorted household behaviour. • Gold and real estate have been preferred to bank deposits (OECD Economic Survey of India, 2014 )
Source: CEIC database
-500
4500
9500
14500
19500
24500
29500
34500
2001
-02
2002
-03
2003
-04
2004
-05
2005
-06
2006
-07
2007
-08
2008
-09
2009
-10
2010
-11
2011
-12
2012
-13
Financial Savings Physical Savings
Private Corporate Sector Public Sector
Rupees billion, Base year: 2004-05
25.3
27.0
26.4
27.9
29.6
29.9
29.9
29.9
29.4
31.4
30.0
28.6
33.0
31.1
30.0
2001
-02
2002
-03
2003
-04
2004
-05
2005
-06
2006
-07
2007
-08
2008
-09
2009
-10
2010
-11
2011
-12
2012
-13
2013
-14
2004-05 base 2011-12 base
Gross Domestic Saving as a % of personal disposable income
Decline in savings since 2010-11 Private and financial savings witness a decline
Source: RBI database

Ballooning deficits but overall debt under control
Adversely affecting the financial savings
Source: RBI, Economic survey
Source: Economic survey
Worsening fiscal situation
-6
-4
-2
0
2
4
Jan-
02
Oct
-02
Jul-0
3
Apr-
04
Jan-
05
Oct
-05
Jul-0
6
Apr-
07
Jan-
08
Oct
-08
Jul-0
9
Apr-
10
Jan-
11
Oct
-11
Jul-1
2
Apr-
13
Jan-
14
Oct
-14
Real interest rate
Real interest rate
Inflation has played and important role in stabilizing the debt; resulting in negative interest rate in last few years

Budget 2015-16:
• Acceleration of economic growth is likely to boost the revenue
• Low international energy prices will significantly reduce the energy subsidy burden
• Significant increase in the surplus profit transfer by the RBI to the government.
• Cuts in the capital expenditure to curb fiscal deficit is worrisome.
Source: RBI, Economic survey
(Red denotes increase from previous year while grey denotes decline)
Gross Fiscal Deficit
Gross Primary Deficit
Revenue Deficit Subsidies
2007-08 2.5 -0.9 1.1 1.4 2008-09 6 2.6 4.5 2.3
2009-10 6.5 3.2 5.2 2.2
2010-11 4.8 1.8 3.2 2.2
2011-12 5.7 2.7 4.4 2.5
2012-13 4.8 1.8 3.6 2.6
2013-14 4.5 1.1 3.1 2.2
2014-15RE 4.1 0.8 2.9 2.1
2015-16B 3.9 0.7 2.8 1.8
Fiscal Indicators (% of GDP)
XXX
• Tax to GDP ration has stagnated in the last 4 years. • Even with higher growth predicted for FY15 (7.4%), the
rise in tax to GDP ratio is only marginally higher . • As per the World bank database, India’s tax revenue as
a % of GDP for 2013 at 10.7% was much lower than the world average of 14. 3%.
• Implementation of the Goods and Services Tax (GST) will be instrumental in raising the tax to GDP ratio.
Note- BE= Budget estimate, RE= Revised Estimate, GDP at Market prices (2004-05 base used) Source: Union Budget, CSO
7.1% 7.4% 7.4% 7.7% 8.5% 8.8% 9.1% 9.4%
2011-12 Actual 2012-13 Actuals 2013-14 (RE) 2014-15 (BE)
Tax Revenue as a % of GDP (centre)
Revenue Reciepts as a % of GDP (centre)
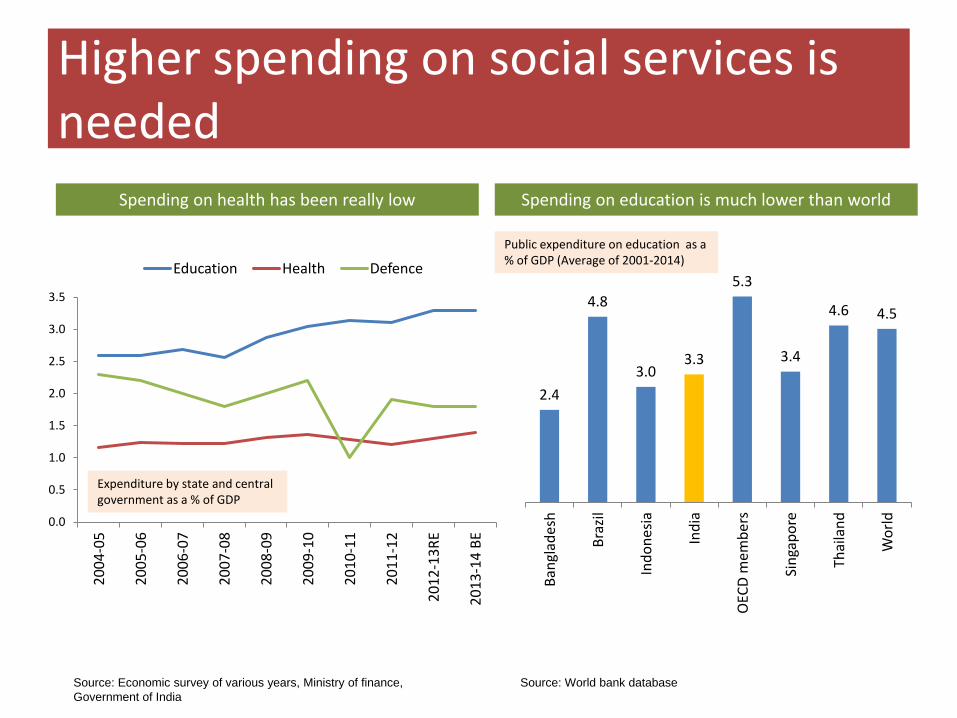
Higher spending on social services is needed
0.0
0.5
1.0
1.5
2.0
2.5
3.0
3.5
2004
-05
2005
-06
2006
-07
2007
-08
2008
-09
2009
-10
2010
-11
2011
-12
2012
-13R
E
2013
-14
BE
Education Health Defence
2.4
4.8
3.0 3.3
5.3
3.4
4.6 4.5
Bang
lade
sh
Braz
il
Indo
nesia
Indi
a
OEC
D m
embe
rs
Sing
apor
e
Thai
land
Wor
ld
Source: Economic survey of various years, Ministry of finance, Government of India
Source: World bank database
Spending on health has been really low Spending on education is much lower than world
Expenditure by state and central government as a % of GDP
Public expenditure on education as a % of GDP (Average of 2001-2014)

14th Finance Commission Report: New dimension to centre- state relations
• The union government on 24th February, 2014 accepted the recommendations of 14th Finance Commission.
• The commission was headed by former RBI governor Dr. Y.V. Reddy.
• The commission has assumed a nominal gross domestic product (GDP) growth rate of 13.5% during the five-year period.
• The increased share of tax devolution from the centre to the states will provide greater fiscal policy space to states, even at the cost of leaving less revenue for its own schemes and programs
• Increase in the flow of unconditional transfers to states and would leave enough fiscal space for the centre to carry out specific purpose transfers to states
• The report adhered to the recommendation of the Kelkar committee on the fiscal consolidation road map assuming improvement in the macro-economic conditions and improvement in total tax revenues due to tax reforms
Major Recommendations
Increase the share of states in centre’s divisible tax pool to 42% from current 32%
Reduce fiscal deficit to 3.6% and 3% of GDP by 2015-16 and 2016-17 respectively and revenue deficit to zero by 2019-
2020
An independent fiscal council to be established to undertake fiscal policy implications of budget proposals.
Compensate states fully (100%) for 3 years in case of revenue loss due to GST
Do away with plan and non- plan distinction in revenue expenditure of state governments
FRBM act to be replaced with a Debt ceiling and Fiscal Responsibility legislation
Source: 14th Finance Commission Report

Deteriorating health of the banking system
Select Financial Indicators of SCBs (Red denotes increase from previous year while grey denotes decline) 1998 2008 2009 2010 2011 2012 2013 2014 CRAR (per cent) 11.5 13.0 13.2 14.5 14.2 14.2 13.9 13.0 Gross NPA (per cent) 14.8 2.4 2.4 2.5 2.3 2.9 3.4 4.1 Net NPA (per cent) 7.6 1.1 1.1 1.1 0.9 1.2 1.7 2.2 Return on Equity (per cent) 14.6 12.5 13.3 13.3 13.7 13.4 12.9 9.5 Interest Spread (per cent) 3.1 2.4 2.4 2.7 3.1 3.1 3.0 -
Asset quality of commercial banks in India has deteriorated due to downturn in the economy in recent years
• Strains on a number of companies/projects has resulted in sharp rise in NPAs
• Return on equity has declined sharply on account of lower profitability; however, fresh infusion of capital post the implementation of Basel III capital norms since April 1, 2013 is also responsible for the decline (RBI Annual Report, 2014)
Gross NPAs Across Sectors (% of gross advances to the sector) 2011 2012 2013 2014 Agriculture 3.3 4.3 4.7 4.4 Medium & Small Enterprises 3.6 4.0 5.1 5.2 Other Priority Sector 4.0 4.4 3.0 3.0 Total Priority Sector 3.6 4.2 4.4 4.4 Non Priority Sector 1.8 2.3 3.0 4.0 Total 2.4 2.9 3.4 4.1
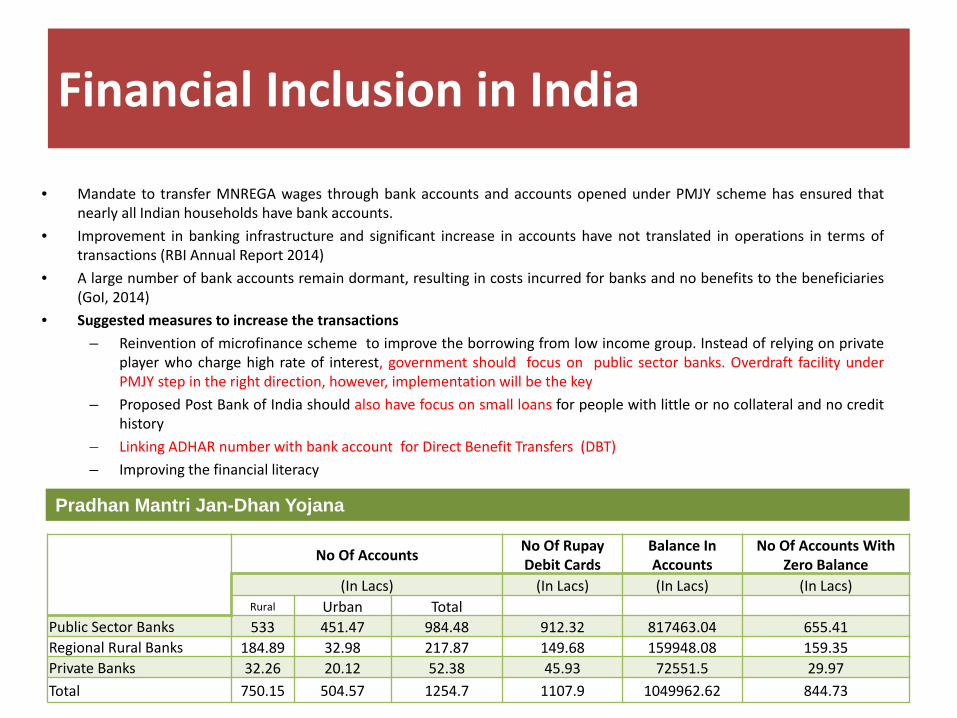
Financial Inclusion in India
• Mandate to transfer MNREGA wages through bank accounts and accounts opened under PMJY scheme has ensured that nearly all Indian households have bank accounts.
• Improvement in banking infrastructure and significant increase in accounts have not translated in operations in terms of transactions (RBI Annual Report 2014)
• A large number of bank accounts remain dormant, resulting in costs incurred for banks and no benefits to the beneficiaries (GoI, 2014)
• Suggested measures to increase the transactions – Reinvention of microfinance scheme to improve the borrowing from low income group. Instead of relying on private
player who charge high rate of interest, government should focus on public sector banks. Overdraft facility under PMJY step in the right direction, however, implementation will be the key
– Proposed Post Bank of India should also have focus on small loans for people with little or no collateral and no credit history
– Linking ADHAR number with bank account for Direct Benefit Transfers (DBT) – Improving the financial literacy
No Of Accounts No Of Rupay
Debit Cards Balance In Accounts
No Of Accounts With Zero Balance
(In Lacs) (In Lacs) (In Lacs) (In Lacs) Rural Urban Total
Public Sector Banks 533 451.47 984.48 912.32 817463.04 655.41 Regional Rural Banks 184.89 32.98 217.87 149.68 159948.08 159.35 Private Banks 32.26 20.12 52.38 45.93 72551.5 29.97 Total 750.15 504.57 1254.7 1107.9 1049962.62 844.73
Pradhan Mantri Jan-Dhan Yojana

Improvement in CAD, but external sector vulnerable • Moderation in gold imports and international crude oil prices has pulled CAD down. Gold
has been a key driver of the CAD in recent years • Despite improvement in CAD, the external position remains vulnerable • Export growth remains subdued • Reserves cover less than eight months of import • The quality of reserve has also declined; potentially volatile component of our liability has
increased from 42 % of reserve in 2010 to 66 % of reserve in 2014
Source: Thomson Reuter Datastream, RBI
Balance of Payments Avg.2004- 2008
Avg.2010 -2014
2010-11
2011-12 2012-13 2013-14
Merchandise Exports (% change) 25.3 12.2 40.4 20.9 -1 3.9 Merchandise Imports (% change) 32.3 9.7 27.6 30.3 0.5 -7.2 Trade Balance/GDP (%) -5.4 -8.9 -7.5 -10.1 -10.5 -7.9 Invisible Balance/GDP (%) 5.1 5.7 4.6 5.9 5.8 6.1 Current Account Balance/GDP (%) -0.3 -3.2 -2.8 -4.2 -4.7 -1.7 Net Capital Flows /GDP(%) 4.6 3.7 3.7 3.6 4.8 2.6
(Red denotes increase from previous period while grey denotes decline) External Debt Indicators External Debt Stock (US$ billion) 156.5 357.9 317.9 360.8 409.4 440.6 Debt-GDP Ratio (%) 17.7 20.4 18.2 20.5 22 23.3 Import cover of Reserves (in Months) 13.9 8.5 9.5 7.1 7 7.8 Short-term Debt to Total Debt (%) 13.6 21.2 20.4 21.7 23.6 20.3 Reserves to Debt (%) 113.7 85 95.9 81.6 71.3 69
0
5
10
15
20
25
30
35
Q1
2009
Q3
2009
Q1
2010
Q3
2010
Q1
2011
Q3
2011
Q1
2012
Q3
2012
Q1
2013
Q3
2013
Q1
2014
Q3
2014
$ billion
CAD Gold
Exchange rate misalignment
• Free fall of the Rupee value in recent years has raised the question of
fair/equilibrium value of the currency
• Overvaluation/undervaluation creates distortions in the market; these episodes
are followed by painful corrections
• Despite sharp depreciation in recent years, studies show that Rupee is still
overalued
– Bhagwati & Barua (2014) show that Rupee is overvalued by 7 – 8 % at the exchange rate of 63.6
Rs./$
– Rajwade (2014) showed that due to high remittances and capital inflows India is suffering a variety of
the Dutch Disease
– Rajwade (2014) said that exchange rate needs to be around 70 Rs./$

Mild uptick in FDI inflows
• The uptick in FDI inflows was on account of higher inflows in telecommunications (300%), computer software( 130%), chemicals (200%) and power (100%) sector.
• Services sector, metallurgical industries, Hotel & Tourism are the sectors which witnessed maximum decline in last 2 years.
• Japan continues to be among the top 5 countries investing in India.
-30 -10 10 30 50 70 90 110 130 150
0 5,000
10,000 15,000 20,000 25,000 30,000 35,000 40,000 45,000 50,000
2000
-01
2001
-02
2002
-03
2003
-04
2004
-05
2005
-06
2006
-07
2007
-08
2008
-09
2009
-10
(P)
2010
-11
(P)
2011
-12
(P)
2012
-13
(P)
2013
-14
(P)
Total FDI inflows Growth in FDI inflows USD million
Note: P- Provisional Source: Department of industrial Policy and Promotion
USD million Country 2010-11 2011-12 2012-13 2013-14
2014-15 (April-
November)
1 MAURITIUS 6987 9942 9,497 4859 5205
2 SINGAPORE 1705 5257 2308 5985 3747
3 JAPAN 1562 2972 2237 1718 1289
4 U.K. 755 7874 1080 3215 998
5 NETHERLANDS 1170 1115 1856 2270 2429
Source: Department of industrial Policy and Promotion
Share of top investing countries FDI equity inflows

MEA’S Annual Budget
Year 2012-13 2013-14 2014-15 2015-16
MEA (RE) 10,062.00 11,793.65 12,620.00 14,966.83*
MEA(A) 10,114.77 11,794.94 NA NA
GTB (RE) 14,30,825 15,90,434 16,81,158 17,77,477*
% of GTB (RE) 0.70 0.74 0.75 0.84**
Abbreviations: BE: Budgeted Estimate A: Actual RE: Revised Estimate NA: Not available MEA: Ministry of External Affairs GTB: Government's Total Budget
* Budgeted Estimates figure due to unavailability of Revised Estimates figures for the respective years ** Calculated using Budgeted Expenditure due to unavailability of Revised Estimates for the respective years
(In crores)
Source: Ministry of External Affairs and Expenditure budget, Union Budget.
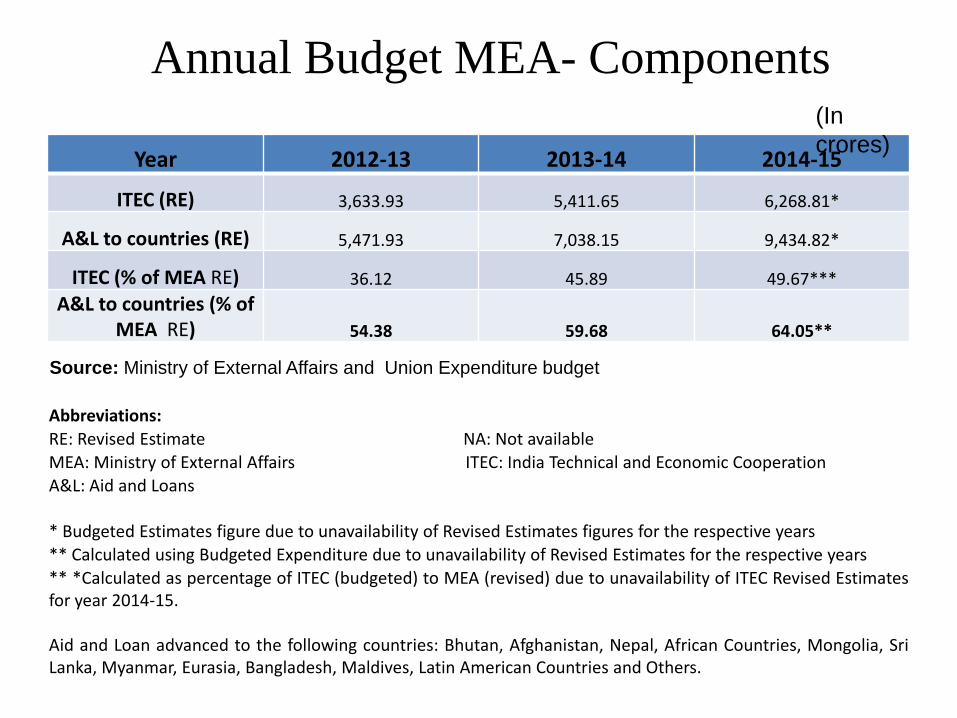
Year 2012-13 2013-14 2014-15
ITEC (RE) 3,633.93 5,411.65 6,268.81*
A&L to countries (RE) 5,471.93 7,038.15 9,434.82*
ITEC (% of MEA RE) 36.12 45.89 49.67*** A&L to countries (% of
MEA RE) 54.38 59.68 64.05**
Abbreviations: RE: Revised Estimate NA: Not available MEA: Ministry of External Affairs ITEC: India Technical and Economic Cooperation A&L: Aid and Loans * Budgeted Estimates figure due to unavailability of Revised Estimates figures for the respective years ** Calculated using Budgeted Expenditure due to unavailability of Revised Estimates for the respective years ** *Calculated as percentage of ITEC (budgeted) to MEA (revised) due to unavailability of ITEC Revised Estimates for year 2014-15. Aid and Loan advanced to the following countries: Bhutan, Afghanistan, Nepal, African Countries, Mongolia, Sri Lanka, Myanmar, Eurasia, Bangladesh, Maldives, Latin American Countries and Others.
(In crores)
Annual Budget MEA- Components
Source: Ministry of External Affairs and Union Expenditure budget

Year 2012-13 2013-14 2014-15 *
Bhutan 3,409 4,190 6,074
Afghanistan 491 525 676
Sri Lanka 290 410 500
Bangladesh 280 580 350
Nepal 270 380 450
Annual Budget MEA- A&L Top 5 recipients (In crores)
Source: Outcome Budget, Ministry of External Affairs.
Aid and Loans advanced to the other countries include, African countries, Mongolia, Myanmar, Eurasia, Maldives, Latin American countries and Others.

1.33
1.49 1.36
0.70 0.74 0.75
0.55 0.55 0.54
2012 2013 2014
MEA budget as % of Total Budget US India SA
Note: SA denotes Republic of South Africa. SA equivalent of MEA, India is Department of International Relations and Cooperation. USA equivalent of MEA, India is Department of States. Source: US- U.S Department of State and The White House India- Ministry of External Affairs and Expenditure budget, Union Budget Republic of South Africa- National Treasury, Ministry of Finance, Republic of South Africa
Annual Budget MEA- India, US, SA

Comparison of Annual Budgets
0 1,000 2,000 3,000 4,000
US
India
SA
US India SA Total Budget 3,506 276.8 106.1
Total Budget (In $ Billion)
0 10 20 30 40 50 60
US
India
SA
US India SA MEA Budget 47.8 2.1 0.6
MEA Budget (In $ Billion)
•India’s 2014 Union Budget is around 7.9% of US Federal Budget. •India’s 2014 MEA budget was around 4.3 % of US Department of State Budget. •Republic of South Africa’s budget for the same was around 1.19 % of US Department of State Budget. Note: SA denotes Republic of South Africa.
SA equivalent of MEA, India is Department of International Relations and Cooperation. USA equivalent of MEA, India is Department of State. Source: US- U.S Department of State and The White House India- Ministry of External Affairs and Expenditure budget, Union Budget Republic of South Africa- National Treasury, Ministry of Finance, Republic of South Africa