india office, q2 2015 e-commerce overtakes bfsi as...
TRANSCRIPT
MARKETVIEW
ECONOMIC GROWTH ACCELERATES IN MARCH TO A 4-
YEAR HIGH; ON RECOVERY MODE
The Indian economy witnessed a gradual recovery on the back of investment-friendly policies initiated over the past year. The gross domestic product (GDP) expanded by 7.3% in FY 2015, marginally higher than the 6.9% recorded in the previous fiscal. Furthermore, India’s economic growth accelerated to 7.5% during the January–March 2015 period, putting us ahead of China (7%) as the world’s fastest-growing large economy. This improvement was spearheaded by both the manufacturing and the ‘finance, insurance and real estate service’ segments that performed strongly, growing by 7.1% and 11.5%, respectively. The International Monetary Fund (IMF) has forecast India’s growth to strengthen to 7.5% in 2015 as well as in 2016. The World Bank has also projected economic growth to accelerate to 7.5% in 2015, reaching 8% by 2017, on the back of a spurt in investment activity.
LEGISLATIVE MEASURES AND IMPLICATIONS
The real estate and construction sector saw a spate of legislative initiatives from the Government over the past few months, many of which are currently being debated in Parliament. The Government approved the Real Estate Regulatory Bill, wherein the scope of the amended Bill was expanded to cover residential and commercial real estate segments; even as the lower house of Parliament approved the Goods and Services Tax (GST) regulation that is likely to bring uniformity in taxation across the country.
E-commerce overtakes BFSI as the second largest occupier of office space in India after IT
India Office, Q2 2015
With inflation under control, the Reserve Bank of India (RBI) reduced the repo rate by 25 bps (for the third time since January) to 7.25% in June 2015.
Additionally, the Minimum Alternate Tax (MAT) exemption paved the way for the launch of Real Estate Investment Trusts (REITs) by clarifying that it would be levied only on actual transfer of shares on listings and that Foreign Direct Investment (FDI) norms would be allowed in rent-yielding commercial assets, thereby removing a key investment related restriction by the Foreign Exchange Management Act (FEMA). While clarification on MAT will encourage developers to firm up their plans, the levy of the Dividend Distribution Tax (DDT) is likely to act as a deterrent for foreign investors. However, the exemption of both would prove to be an incentive for real estate investors and developers looking at raising capital via the REIT-route. At a time when the realty sector is struggling for funding, REITs will likely improve liquidity in the commercial real estate market to a large extent.
OFFICE MARKETS FIRMLY IN RECOVERY,
EXPANSION MODE; ALTERNATE BUSINESS
DISTRICTS REMAIN THE FLAVOR
Improved macro-economic sentiments led to a notable rise in absorption in the office leasing market with a number of blue-chip tenants moving to quality developments across leading cities in the April–June period. The office market observed strong demand in the second quarter with prominent Grade-A developments
Q2 2015 CBRE Research © 2015, CBRE, Inc | 1
Rents Up 14 Markets
Rents Stable 17 markets
Rents Down 1 Market
Demand (Y-O-Y) 6%
Supply (Y-O-Y) 25%

MARKETVIEW
0%
50%
100%
150%
200%
250%
Pune
-CBD
Delhi
- CB
D
Mumb
ai - B
KC
Kolka
ta - P
BD
Gurga
on
Hyde
rabad
- IT
corrid
or
Chart 3: Segmentation of Transaction Activity as per Transaction Size
Chart 1: Growth in Transaction Activity in Prominent Micro-markets (Q-o-Q)
witnessing higher absorption levels. Demand continued to remain healthy with enhanced enquiries for fresh expansions and consolidation requirements by various corporates.
Leasing activity rebounded in the second quarter with more than 8 million sq. ft. of office space absorbed across the seven leading cities—a quarter-on-quarter (q-o-q) increase of around 70%. Close to 35% of this total absorption was reported from Bangalore, where leasing remained upbeat in the Outer Ring Road (ORR) and North Bangalore regions. Office space demand Delhi-NCR, Mumbai and Chennai also continued to witness a positive momentum with several large-sized transaction closures being reported in IT and SEZ developments, located mostly in peripheral locations. These three cities accounted for almost 53% of the total absorption, each witnessing a healthy take-up of more than a million square feet of office space. On a quarterly comparison, all cities registered healthy absorption levels—barring Pune, which observed a dip in absorption activity during this quarter. A few large-sized expansions are under various stages of execution, however, and are expected to conclude in the coming months.
However, the total office space absorption for the January – June period stood at approximately 13 million sq. ft., a decline of 12% when compared to H1 2014. Transaction activity was mostly led by office leasing in Bangalore (28%), Delhi NCR (23%) and Mumbai (20%); while smaller cities such as Chennai and Pune contributed around 25% in their transaction market shares.
Occupier interest during the review period remained strong in peripheral and suburban office districts such as Gurgaon in Delhi NCR; Bandra–Kurla Complex and Thane/Navi Mumbai/Powai/Vikhroli in Mumbai; the IT Corridor / Extended IT Corridor in Hyderabad; the Old Mahabalipuram Road (OMR) stretch along Perungudi, Sholinganallur/Thoraipakkam in Chennai; Hinjewadi / Kharadi / Baner / Yerawada in Pune; and Salt Lake Sector V and Rajarhat in Kolkata.
Q2 2015 CBRE Research © 2015, CBRE, Inc | 2
Source: CBRE Research, Q2 2015.
Chart 2: Segment Wise Split of Transaction Activity
Source: CBRE Research, Q2 2015.
Source: CBRE Research, Q2 2015.
INDIA OFFICE
IT 36%
SEZ 23%
Commercial (Non IT)
41%
39%
32%
12%
5% 3%
9%
Less than 10,000 sq. ft. 10,000 -30,000 sq. ft. 30,000-50,000 sq. ft.
50,000-70,000 sq. ft. 70,000-90,000 sq. ft. 90,000 sq. ft. and above

MARKETVIEW
Bangalore 55%
Hyderabad 22%
Mumbai 17%
Kolkata 4%
Pune 1%
Chennai 1%
Office space demand in these locations was mainly driven by corporate occupiers from the IT/ITeS, e-Commerce, banking / financial services, and engineering / manufacturing sectors for their office space requirements.
SEARCH FOR QUALITY SPACE DROVE OCCUPIERS TO
PRE-COMMIT
Due to paucity of new quality supply in key micro-markets, occupiers looking for premium Grade-A office spaces pre-committed to space in upcoming IT Parks and IT-SEZs during the quarter. Corporate occupiers who pre-committed to spaces in certain under-construction developments positively impacted the transaction activity during the quarter. Owing to lack of quality office spaces with larger floor plates, most under-construction developments in suburban and peripheral micro-markets across cities attracted enhanced levels of enquiries and pre-commitment activity.
SMALL TO MEDIUM SIZED DEALS DOMINATED
TRANSACTION ACTIVITY
Prominent IT buildings witnessed considerable traction and accounted for a share of around 36% of total transacted space in the quarter. In addition, SEZ developments spread across Gurgaon, Bangalore, Chennai and Pune also observed strong leasing activity (23% share), which was mostly generated by corporates from the IT, pharmaceuticals and research/consulting sectors.
Larger-sized transactions were limited, and constituted only around 9% of total transactions concluded during Q2 2015. A few big ticket transactions (above 100,000 sq. ft.) were finalized in Gurgaon, Mumbai, Bangalore, Chennai and Pune by leading corporates such as Home Credit India, Accenture, Epilson Technologies, and Oracle, among others. Additionally, smaller transactions (less than 10,000 sq. ft.) constituted close to 39% of total transactions; while those ranging between
Q2 2015 CBRE Research © 2015, CBRE, Inc | 3
Chart 4: City Wise Split of New Supply
Source: CBRE Research, Q2 2015.
INDIA OFFICE
10,000–30,000 sq. ft. accounted for around 32% of total deal closures reported during the quarter.
E-COMMERCE FIRMS WERE THE SECOND
LARGEST OCCUPIER OF OFFICE SPACE
A key development witnessed during the review period was the spurt in office space leasing by online retail firms, with the likes of Amazon, Flipkart and Snapdeal committing to large spaces—particularly in the NCR and Bangalore. This led to the sector emerging as the second largest occupier of office space during the second quarter with a share of about 17%, followed by banking / financial services at around 16%. With a share of approximately 36%, IT/ITeS remained the largest occupier of office space across the seven leading cities.
DEVELOPMENT COMPLETIONS SURGED BY
AROUND 6% Q-O-Q, BANGALORE SEES THE
HIGHEST OFFICE SPACE ADDITION
With the completion of numerous large-sized office developments across the leading cities, close to 9 million sq. ft. of Grade-A office space was added during the quarter—representing a q-o-q increase of 6% and a y-o-y rise of 25%. Commercial (non-IT) projects accounted for the majority of this new supply, while a few development completions were new phases of existing projects.

MARKETVIEW
0%1.0%2.0%3.0%4.0%5.0%6.0%7.0%8.0%9.0%
10.0%
Bang
alore
- PBD
Bang
alore-
EBD,
South
Hyde
rabad
- Ex
IT Co
rridor
(IT),
Pune
- Off C
BD (I
T)
Bang
alore
- CBD
, Mum
bai -
Malad
/Gore
gaon
, Pun
e - PB
D (IT)
Gurga
on (I
T), H
ydera
bad -
IT Co
rridor
(IT/IT
SEZ)
Moreover, the prime office space segment across key cities witnessed a supply infusion of close to 17 million sq. ft. in the first six months of 2015; an increase of about 28% when compared to H1 2014. Bangalore accounted for around 33% of the total supply introduced, while Delhi NCR accounted for about 26% of the total share. Mumbai and Hyderabad constituted close to 28% of the total supply completed in the Jan – June 2015 period.
Anticipating a healthy demand for quality office space, developers in Bangalore successfully delivered numerous projects in Q2 2015—making it the highest contributor of new office space with a share of almost 55%. The pent up supply accumulated over the past few months was released in the ORR and North Bangalore. Mumbai and Hyderabad also witnessed an increase in project completions and garnered a share of nearly 39% of the total supply released during the quarter. Cautious market sentiments in Chennai, Pune and Kolkata, however, restricted development completions, leading to higher slippage rates as the completion of several projects got delayed to subsequent quarters.
Additionally, NCR was the only market devoid of any new development completions during Q2 2015, as none of the projects lined up for completion could procure the necessary statutory approvals for operations. The entire pipeline lined up during the quarter was pushed further into the second half of 2015, creating a potential supply glut for select locations in the city in the coming few months.
OFFICE SPACE RENTAL RATES INCREASE AMID
ROBUST DEMAND
Strong demand and high occupancy rates in prominent micro-markets unsurprisingly boosted the confidence of landlords to quote higher rental values. This resulted in strong rental growth (5–6%) in Bangalore’s Central Business District (CBD), while maintaining stability in the prime office districts of most cities. On the other hand, Kolkata CBD observed a decline in rental values
Q2 2015 CBRE Research © 2015, CBRE, Inc | 4
INDIA OFFICE
on the back of weak occupier demand. Moreover, sustained occupier interest in IT / IT SEZ projects in Gurgaon and Noida (Delhi NCR); Malad / Goregaon (Mumbai); North Bangalore and ORR (Bangalore); IT and Extended IT Corridor (Hyderabad); Aundh, Baner, Viman Nagar, Hinjewadi and Kharadi (Pune), resulted in a q-o-q rental appreciation of 3–6% in each of these micro-markets. Whilst Whitefield in Bangalore observed rental appreciation of 9-10% over Q1 2015. In addition, select developments in the peripheral and suburban micro-markets of Bangalore and Gurgaon recorded rental appreciation on the back of notable pre-commitment activity in under-construction projects.
Chart 6: Strongest Office Rental Growth, Q2 2015 Vs Q2 2014
Source: CBRE Research, Q2 2015.
Chart 5: Strongest Office Rental Growth, Q-o-Q
Source: CBRE Research, Q2 2015.
0%
2.0%
4.0%
6.0%
8.0%
10.0%
12.0%
14.0%
Bang
alore-
ORR
Bang
alore-
EBD
Mumb
ai-Ma
lad/G
orega
on…
Hyde
rabad
-ITCo
rridor,
Pune
-…
Bang
alore-
CBD
Bang
alore-
PBD

MARKETVIEW
Gurgaon 73%
Noida 17%
Delhi(SBD) 4%
Delhi(CBD) 6%
MARKET SUMMARY
• Gurgaon accounted for 73% of total demand in Delhi-NCR
• E-commerce companies leased approximately 30% of the total transacted space
• Steady occupier enquiries resulted in rental appreciation (2-5%) in most peripheral sub-markets
The Central Business District (CBD) of Connaught Place witnessed a marginal increase in absorption levels in Grade-A developments; Grade-B buildings also witnessed strong demand from corporates looking for smaller format office spaces. Occupiers from the banking / financial services, engineering/manufacturing and research/consulting sectors dominated leasing activity; and were majorly concentrated in developments such as Gopaldas Bhawan, Ashoka Estate and New Delhi House on Barakhamba Road in the second quarter. Rental values remained mostly stable during the review period.
Transaction activity in the Secondary Business District (SBD) of Nehru Place, Saket and Jasola witnessed a marginal increase in the second quarter. The lack of any new supply, along with a marginal increase in demand levels led to a marginal decline in vacancy levels. Transaction activity was mostly concentrated in developments located at Jasola and Okhla during the second quarter of the year. Prominent transactions include Amarchand Mangaldas leasing around 45,000 sq. ft. in the Religare building, Saket, and Club Mahindra leasing around 7,000 sq. ft. at TDI Centre, Jasola. Rental values continued to remain stable across micro-markets in the quarter under review.
The peripheral region of Gurgaon constituted most of the demand for office space in the second quarter. DLF Cyber City, Sohna Road, and Golf Course Road continued to remain the key locations that attracted increased interest from occupiers from the IT/ITES, e-commerce and research/consulting sectors. Space take-up
Q2 2015 CBRE Research © 2015, CBRE, Inc | 5
Chart 7: Rental Value Movement
Chart 8: Capital Value Movement
Chart 9: Segmentation of Transaction Activity
Source: CBRE Research, Q2 2015.
Source: CBRE Research, Q2 2015.
Source: CBRE Research, Q2 2015.
NATIONAL CAPITAL REGION (NCR)
0
50
100
150
200
250
300
Q22013
Q32013
Q42013
Q12014
Q22014
Q32014
Q42014
Q12015
Q22015
(INR/
sq. f
t./mo
nth)
CBD SBD (Nehru Place) SBD (Jasola / Saket) Gurgaon Non IT Noida (IT/IT SEZ))
0
5,000
10,000
15,000
20,000
25,000
30,000
35,000
40,000
45,000
50,000
Q22013
Q32013
Q42013
Q12014
Q22014
Q32014
Q42014
Q12015
Q22015
(INR/
sq. f
t.)
CBD SBD (Nehru Place) SBD (Jasola / Saket) Gurgaon Noida (IT/IT SEZ))
MARKETVIEW
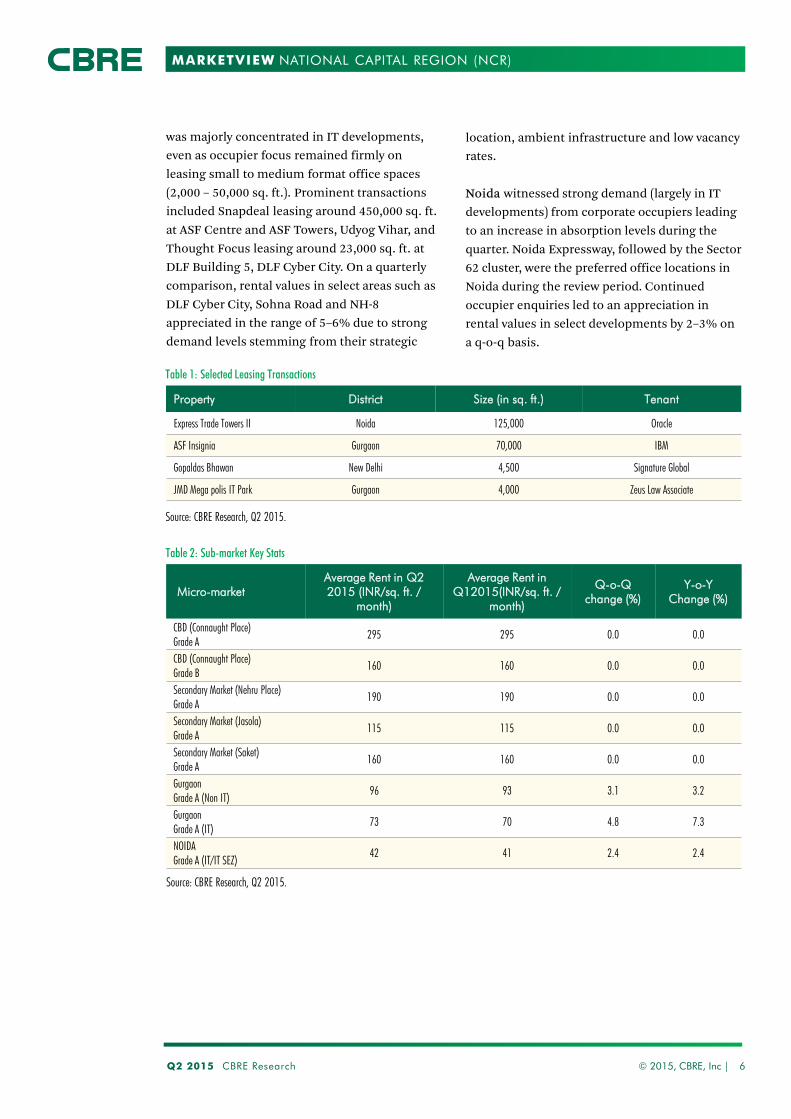
location, ambient infrastructure and low vacancy rates.
Noida witnessed strong demand (largely in IT developments) from corporate occupiers leading to an increase in absorption levels during the quarter. Noida Expressway, followed by the Sector 62 cluster, were the preferred office locations in Noida during the review period. Continued occupier enquiries led to an appreciation in rental values in select developments by 2–3% on a q-o-q basis.
Micro-market Average Rent in Q2 2015 (INR/sq. ft. /
month)
Average Rent in Q12015(INR/sq. ft. /
month)
Q-o-Q change (%)
Y-o-Y Change (%)
CBD (Connaught Place) Grade A
295 295 0.0 0.0
CBD (Connaught Place) Grade B
160 160 0.0 0.0
Secondary Market (Nehru Place) Grade A
190 190 0.0 0.0
Secondary Market (Jasola) Grade A
115 115 0.0 0.0
Secondary Market (Saket) Grade A
160 160 0.0 0.0
Gurgaon Grade A (Non IT)
96 93 3.1 3.2
Gurgaon Grade A (IT)
73 70 4.8 7.3
NOIDA Grade A (IT/IT SEZ)
42 41 2.4 2.4
Property District Size (in sq. ft.) Tenant
Express Trade Towers II Noida 125,000 Oracle
ASF Insignia Gurgaon 70,000 IBM
Gopaldas Bhawan New Delhi 4,500 Signature Global
JMD Mega polis IT Park Gurgaon 4,000 Zeus Law Associate
was majorly concentrated in IT developments, even as occupier focus remained firmly on leasing small to medium format office spaces (2,000 – 50,000 sq. ft.). Prominent transactions included Snapdeal leasing around 450,000 sq. ft. at ASF Centre and ASF Towers, Udyog Vihar, and Thought Focus leasing around 23,000 sq. ft. at DLF Building 5, DLF Cyber City. On a quarterly comparison, rental values in select areas such as DLF Cyber City, Sohna Road and NH-8 appreciated in the range of 5–6% due to strong demand levels stemming from their strategic
Table 1: Selected Leasing Transactions
Q2 2015 CBRE Research © 2015, CBRE, Inc | 6
Table 2: Sub-market Key Stats
Source: CBRE Research, Q2 2015.
Source: CBRE Research, Q2 2015.
NATIONAL CAPITAL REGION (NCR)

MARKETVIEW
0
50
100
150
200
250
300
Q22013
Q32013
Q42013
Q12014
Q2 2014
Q3 2014
Q4 2014
Q1 2015
Q2 2015
(INR /
sq. f
t. / m
onth)
CBD EBD (Lower Parel) EBD (Worli, Prabhadevi)
ABD SBD PBD (Malad, Goregaon) (IT)
PBD (Powai, Vikhroli) (IT) PBD (Thane, New Mumbai) (IT)
MARKET SUMMARY
• Peripheral markets constituted approximately 50% of the total space take-up
• Banking / financial services sector leased about 31% of the total transacted space
• New supply was concentrated in BKC, Andheri and Lower Parle
The Central Business District (CBD) of Nariman Point, Fort and Cuffe Parade witnessed a renewal in transaction activity in select buildings that had undergone refurbishment in recent months. Domestic banking / financial services firms and law firms remained the prominent occupiers of space. No new supply addition was observed and rental values maintained stability in the second quarter.
The Extended Business District (EBD) of Lower Parel witnessed sluggish transaction activity with the closure of a few small and medium format office spaces, mostly from banking / financial services occupiers. This micro-market witnessed the completion of a new phase in an already existing IT development, resulting in a q-o-q appreciation of about 2–3% in vacancy rates. Leasing activity in the micro-markets of Worli and Prabhadevi remained dormant, leading to stability in vacancy rates and rental values during the review period.
Commercial leasing activity picked up in the Alternative Business District (ABD) of Bandra Kurla Complex and Kurla (W) with increasing occupier interest opting to relocate or expand operations in this micro-market. Many small to mid-size transactions by banking / financial services and engineering/manufacturing firms were concluded in the quarter. On the supply side, a significant quantum of office space was released with the completion of two commercial projects—One BKC (A Wing) and Kalpataru Inspire (Synergy II)—during the second quarter. Owing to healthy supply addition, vacancy rates appreciated marginally; while rents remained stable on a q-o-q basis.
Q2 2015 CBRE Research © 2015, CBRE, Inc | 7
Chart 10: Rental Value Movement
Chart 11: Capital Value Movement
Chart 12: Segmentation of Transaction Activity
Source: CBRE Research, Q2 2015.
Source: CBRE Research, Q2 2015.
Source: CBRE Research, Q2 2015.
MUMBAI
ABD 42%
PBD - Thane/Navi Mumbai
32%
PBD - Malad/Goregaon
10%
PBD - Powai/Vikhroli 7%
SBD 5%
CBD 2%
EBD - Lower Parel 2%
0
5,000
10,000
15,000
20,000
25,000
30,000
35,000
Q22013
Q32013
Q42013
Q12014
Q22014
Q3 2014
Q4 2014
Q1 2015
Q22015
(INR /
sq. f
t.)
CBD EBD (Lower Parel) EBD (Worli, Prabhadevi)ABD SBD PBD (Malad, Goregaon) (IT)PBD (Powai, Vikhroli) (IT) PBD (Thane, New Mumbai) (IT)
MARKETVIEW
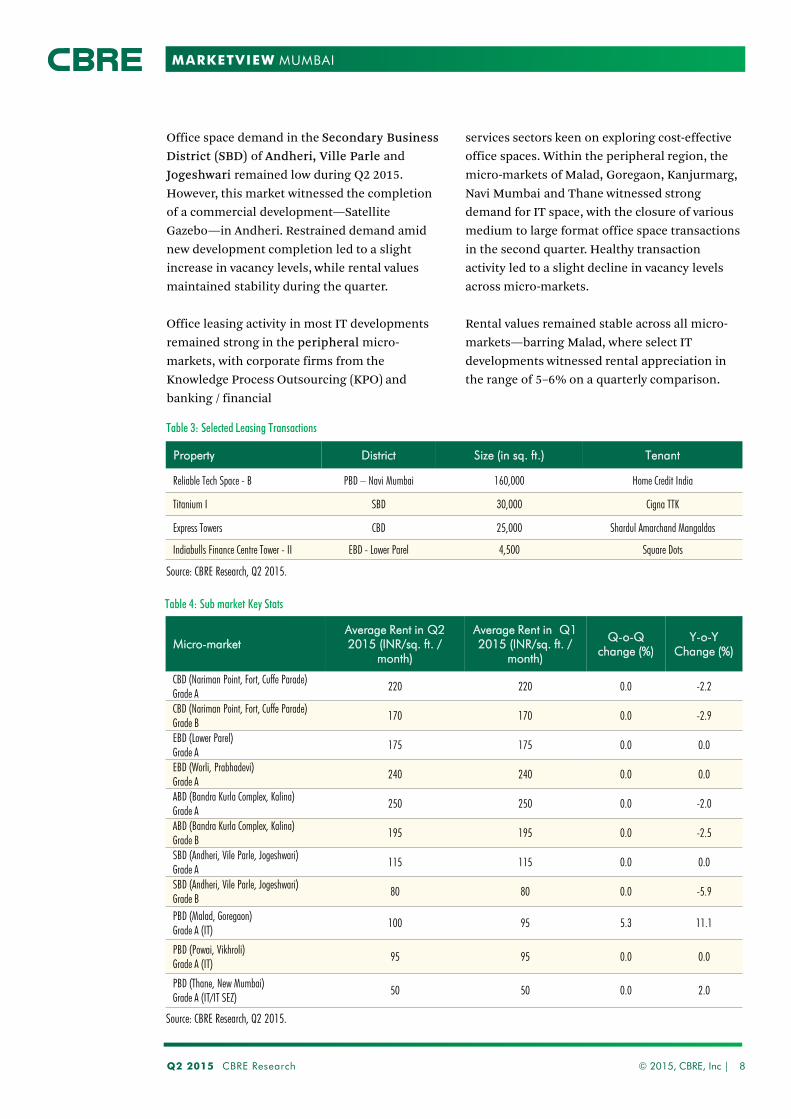
Office space demand in the Secondary Business District (SBD) of Andheri, Ville Parle and Jogeshwari remained low during Q2 2015. However, this market witnessed the completion of a commercial development—Satellite Gazebo—in Andheri. Restrained demand amid new development completion led to a slight increase in vacancy levels, while rental values maintained stability during the quarter.
Office leasing activity in most IT developments remained strong in the peripheral micro-markets, with corporate firms from the Knowledge Process Outsourcing (KPO) and banking / financial
services sectors keen on exploring cost-effective office spaces. Within the peripheral region, the micro-markets of Malad, Goregaon, Kanjurmarg, Navi Mumbai and Thane witnessed strong demand for IT space, with the closure of various medium to large format office space transactions in the second quarter. Healthy transaction activity led to a slight decline in vacancy levels across micro-markets.
Rental values remained stable across all micro-markets—barring Malad, where select IT developments witnessed rental appreciation in the range of 5–6% on a quarterly comparison.
Property District Size (in sq. ft.) Tenant
Reliable Tech Space - B PBD – Navi Mumbai 160,000 Home Credit India
Titanium I SBD 30,000 Cigna TTK
Express Towers CBD 25,000 Shardul Amarchand Mangaldas
Indiabulls Finance Centre Tower - II EBD - Lower Parel 4,500 Square Dots
Table 3: Selected Leasing Transactions
Q2 2015 CBRE Research © 2015, CBRE, Inc | 8
Source: CBRE Research, Q2 2015.
MUMBAI
Table 4: Sub market Key Stats
Micro-market Average Rent in Q2 2015 (INR/sq. ft. /
month)
Average Rent in Q1 2015 (INR/sq. ft. /
month)
Q-o-Q change (%)
Y-o-Y Change (%)
CBD (Nariman Point, Fort, Cuffe Parade) Grade A
220 220 0.0 -2.2
CBD (Nariman Point, Fort, Cuffe Parade) Grade B
170 170 0.0 -2.9
EBD (Lower Parel) Grade A
175 175 0.0 0.0
EBD (Worli, Prabhadevi) Grade A
240 240 0.0 0.0
ABD (Bandra Kurla Complex, Kalina) Grade A
250 250 0.0 -2.0
ABD (Bandra Kurla Complex, Kalina) Grade B
195 195 0.0 -2.5
SBD (Andheri, Vile Parle, Jogeshwari) Grade A
115 115 0.0 0.0
SBD (Andheri, Vile Parle, Jogeshwari) Grade B
80 80 0.0 -5.9
PBD (Malad, Goregaon) Grade A (IT)
100 95 5.3 11.1
PBD (Powai, Vikhroli) Grade A (IT)
95 95 0.0 0.0
PBD (Thane, New Mumbai) Grade A (IT/IT SEZ)
50 50 0.0 2.0
Source: CBRE Research, Q2 2015.

MARKETVIEW
ORR 76%
North Bangalore 12%
PBD 4%
EBD 3%
South Bangalore 3% CBD
2%
0
20
40
60
80
100
120
Q22013
Q32013
Q42013
Q12014
Q22014
Q32014
Q42014
Q12015
Q22015
(INR/
sq. f
t./mo
nth)
CBD EBD Outer Ring Road (ORR)
PBD (Whitefield, Electronic City) South Bangalore North Bangalore
MARKET SUMMARY
• ORR dominated transaction activity, accounting for 76% of total absorption
• Supply addition was mainly concentrated in North Bangalore and ORR
• IT/ITeS remained major driver with approximately 36% share of total demand
The Central Business District (CBD) of MG Road, Richmond Road, Residency Road and Lavelle Road witnessed slight increase in transaction activity with sustained demand from corporates exploring second generation space options, offering relatively lower rentals. Transaction closures were confined to the take-up of smaller format office spaces during the quarter. This region witnessed an exodus of tenants towards cost effective locations offering quality Grade-A developments with larger floor plates. Sustained occupier demand in select commercial developments contributed to a rental appreciation of about 5–6% on a q-o-q basis.
The Extended Business District (EBD) of Indira Nagar, Koramangala, Old Madras Road and CV Raman Nagar registered lackluster performance in leasing activity owing to limited availability of quality office space. Additionally, this micro-market also observed the release of second generation space (Bagmane Tech Park and Embassy Golf Links Business Park) as a result of the various consolidation initiatives of corporate office occupiers in Bangalore. Low vacancy rates and limited availability of quality office options led to a marginal appreciation in select commercial developments on a q-o-q basis.
The micro-markets of Bannergatta Road, JP Nagar, Jayanagar and Mysore Road in South Bangalore witnessed sluggish transaction activity in the quarter. Larger numbers of corporates sought relocation options, thus evaluating options along the ORR as the commencement of the Metro construction work will lead to traffic congestion and hinder easy access to this region.
Q2 2015 CBRE Research © 2015, CBRE, Inc | 9
Chart 13 Rental Value Movement
Chart 14: Capital Value Movement
Chart 15: Segmentation of Transaction Activity
Source: CBRE Research, Q2 2015.
Source: CBRE Research, Q2 2015.
Source: CBRE Research, Q2 2015.
BANGALORE
0
2,000
4,000
6,000
8,000
10,000
12,000
14,000
16,000
18,000
Q22013
Q32013
Q42013
Q12014
Q22014
Q32014
Q42015
Q12015
Q22015
(INR /
sq. f
t.)
CBD EBD Outer Ring Road (ORR)PBD (Whitefield, Electronic City) South Bangalore North Bangalore
MARKETVIEW
Micro-market Average Rent in Q2 2015 (INR/sq. ft. /
month)
Average Rent in Q1 2015 (INR/sq. ft. /
month)
Q-o-Q change (%)
Y-o-Y Change (%)
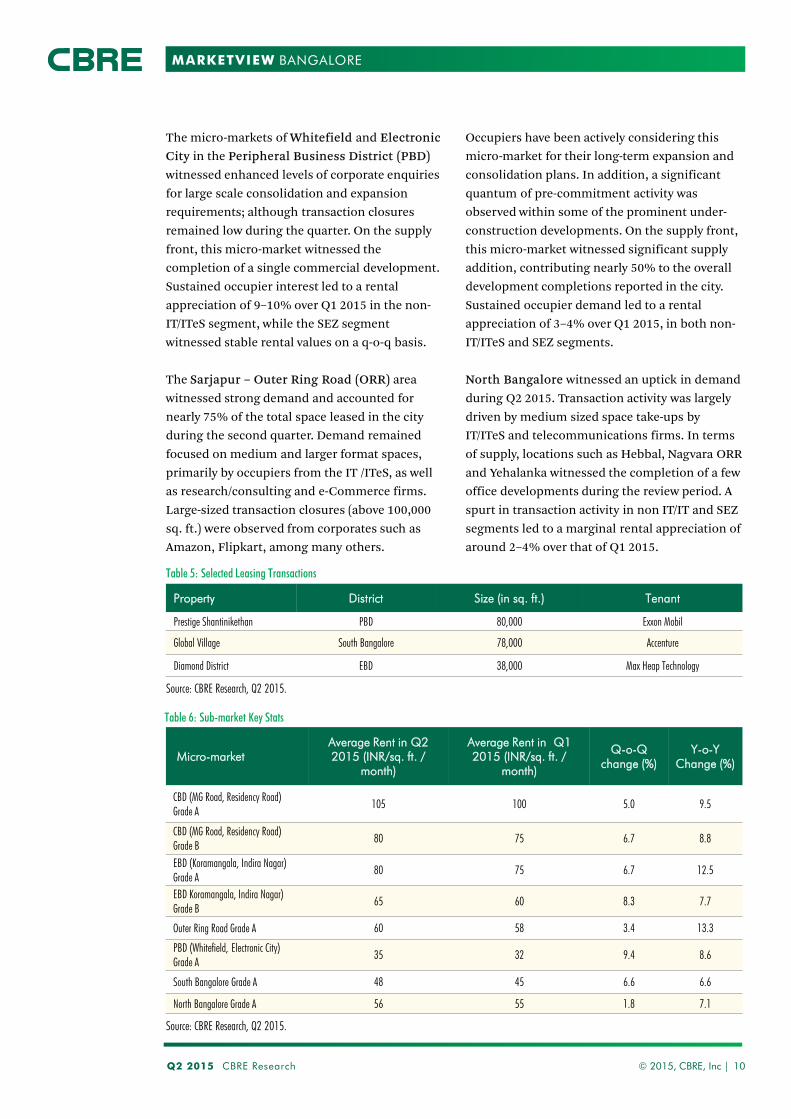
CBD (MG Road, Residency Road) Grade A
105 100 5.0 9.5
CBD (MG Road, Residency Road) Grade B
80 75 6.7 8.8
EBD (Koramangala, Indira Nagar) Grade A
80 75 6.7 12.5
EBD Koramangala, Indira Nagar) Grade B
65 60 8.3 7.7
Outer Ring Road Grade A 60 58 3.4 13.3
PBD (Whitefield, Electronic City) Grade A
35 32 9.4 8.6
South Bangalore Grade A 48 45 6.6 6.6
North Bangalore Grade A 56 55 1.8 7.1
The micro-markets of Whitefield and Electronic City in the Peripheral Business District (PBD) witnessed enhanced levels of corporate enquiries for large scale consolidation and expansion requirements; although transaction closures remained low during the quarter. On the supply front, this micro-market witnessed the completion of a single commercial development. Sustained occupier interest led to a rental appreciation of 9–10% over Q1 2015 in the non-IT/ITeS segment, while the SEZ segment witnessed stable rental values on a q-o-q basis.
The Sarjapur – Outer Ring Road (ORR) area witnessed strong demand and accounted for nearly 75% of the total space leased in the city during the second quarter. Demand remained focused on medium and larger format spaces, primarily by occupiers from the IT /ITeS, as well as research/consulting and e-Commerce firms. Large-sized transaction closures (above 100,000 sq. ft.) were observed from corporates such as Amazon, Flipkart, among many others.
Property District Size (in sq. ft.) Tenant
Prestige Shantinikethan PBD 80,000 Exxon Mobil
Global Village South Bangalore 78,000 Accenture
Diamond District EBD 38,000 Max Heap Technology
Table 5: Selected Leasing Transactions
Occupiers have been actively considering this micro-market for their long-term expansion and consolidation plans. In addition, a significant quantum of pre-commitment activity was observed within some of the prominent under-construction developments. On the supply front, this micro-market witnessed significant supply addition, contributing nearly 50% to the overall development completions reported in the city. Sustained occupier demand led to a rental appreciation of 3–4% over Q1 2015, in both non-IT/ITeS and SEZ segments.
North Bangalore witnessed an uptick in demand during Q2 2015. Transaction activity was largely driven by medium sized space take-ups by IT/ITeS and telecommunications firms. In terms of supply, locations such as Hebbal, Nagvara ORR and Yehalanka witnessed the completion of a few office developments during the review period. A spurt in transaction activity in non IT/IT and SEZ segments led to a marginal rental appreciation of around 2–4% over that of Q1 2015.
Q2 2015 CBRE Research © 2015, CBRE, Inc | 10
Table 6: Sub-market Key Stats
Source: CBRE Research, Q2 2015.
Source: CBRE Research, Q2 2015.
BANGALORE

MARKETVIEW
IT Corridor 65%
Extended IT Corridor 24%
CBD 7%
PBD 3%
SBD 1%
MARKET SUMMARY
• IT corridor dominated transaction activity • Rents in IT developments in IT corridor and
Extended IT Corridor witnessed appreciation • Supply addition was mainly concentrated in
the suburban locations of Madhapur and Gachibowli
• IT developments dominated transaction activity with 44% share of total demand
The Central Business District (CBD) comprising areas of Begumpet, Punjagutta, Somajiguda and parts of Banjara Hills witnessed the closure of a few smaller format office transactions in the second quarter. Due to restricted demand levels, rental values remained largely stable in this region.
The Secondary Business District (SBD) of Ameerpet, Himayathnagar, parts of Banjara Hills, Kukatpally, and Jubilee Hills observed sluggish demand in the present quarter. Going forward, this region is likely to witness completion of a single commercial development (nearly 1 million sq. ft.) by the end of this year. Limited demand, coupled with negligible supply addition, led to stable rentals in this micro-market.
Commercial leasing activity remained buoyant in the IT Corridor of Madhapur, Kondapur and Raidurg, in the second quarter. Locations such as Madhapur garnered significant interest from IT/ITeS firms. On the supply front, Madhapur witnessed the completion of an SEZ and an IT development during the review period. Most of the recent completions are strata sold, which are not preferred by MNC’s evaluating office space options in this region, thus resulting in a marginal increase in vacancy rates. Also, healthy occupier enquiries in select IT / SEZ developments led to a marginal increase in rentals on a quarterly comparison.
Owing to lack of social infrastructure, the Extended IT Corridor of Nanakramguda Gachibowli, and Manikonda continued to
Q2 2015 CBRE Research © 2015, CBRE, Inc | 11
Chart 16: Rental Value Movement
Chart 17: Capital Value Movement
Chart 18: Segmentation of Transaction Activity
Source: CBRE Research, Q2 2015.
Source: CBRE Research, Q2 2015.
Source: CBRE Research, Q2 2015.
HYDERABAD
0
5
10
15
20
25
30
35
40
45
50
Q22013
Q32013
Q42013
Q12014
Q22014
Q32014
Q42014
Q12015
Q22015
(INR /
sq. f
t./ m
onth)
Secondary Business District 1 Secondary Business District 2 IT Corridor (IT)
Extended IT Corridor (IT) PBD (IT)
0
1,000
2,000
3,000
4,000
5,000
6,000
7,000
8,000
Q12013
Q22013
Q32013
Q42013
Q12014
Q22014
Q32014
Q42014
Q12015
Q22015
(INR /
sq. f
t.)
CBD Secondary Business District 1 IT Corridor Extended IT Corridor PBD

MARKETVIEW
Property District Size (in sq. ft.) Tenant
Divyasree Orion Block 7 North Tower
IT Corridor 45,000 Invesco
V IT Park IT Corridor 25,800 Zen Quality Assurance
Ramky Grandiose Towers IT Corridor 9,500 Qvantel
Central Plaza CBD 2,500 Tata Technologies
witness stagnant demand in Q2 2015. Select IT developments, however, observed enhanced levels of corporate enquiries for large scale consolidation and expansion requirements, leading to a slight increase in rental values on a q-o-q basis. Of the total supply released, nearly
Table 7: Selected Leasing Transactions
60% was from Gachibowli (majorly non- IT segment).
The Peripheral region of Shamshabad, Uppal and Pocharam continued to experience a lack of demand for office space, with negligible leasing activity during the present quarter.
Q2 2015 CBRE Research © 2015, CBRE, Inc | 12
Source: CBRE Research, Q2 2015.
HYDERABAD
Micro-market Average Rent in Q2 2015 (INR/sq. ft. /
month)
Average Rent in Q1 2015 (INR/sq. ft. /
month)
Q-o-Q change
(%)
Y-o-Y Change
(%)
CBD (Begumpet, Punjagutta, Somajiguda and parts of Banjara Hills )
46 46 0.0 0.0
Secondary Business District 1 (Parts of Banjara Hills, Jubilee Hills)
46 46 0.0 0.0
Secondary Business District 2 (Ameerpet, Himayathnagar, Kukatpally)
26 26 0.0 0.0
IT Corridor (HITEC City, Madhapur, Kondapur, Raidurg) Grade A (IT)
44 42 4.8 10.0
IT Corridor (HITEC City, Madhapur, Kondapur, Raidurg) Grade A (IT SEZ)
45 43 4.7 9.8
Extended IT Corridor (Nanakramguda,, Manikonda, Gachibowli) Grade A (IT)
36 34 5.9 5.9
Extended IT Corridor (Nanakramguda, Raidurg, Manikonda, Gachibowli) Grade A (IT SEZ)
40 40 0.0 0.0
PBD (Shamshabad, Pocharam, Uppal) Grade A (IT)
26 25 4.0 4.0
PBD (Shamshabad, Pocharam, Uppal) Grade A (IT SEZ)
30 29 3.4 7.1
Table 8: Sub-market Key Stats
Source: CBRE Research, Q2 2015.

MARKETVIEW
PBD 43%
SBD 29%
Off CBD 22%
CBD 6%
MARKET SUMMARY
• Chennai contributed 15% to the total space take up during this quarter
• Leasing activity remained largely concentrated in the peripheral markets
• IT/ITeS sector remained the major contributor to overall office demand
Commercial leasing activity in the Central Business District (CBD) of Anna Salai, T Nagar, RK Salai, Alwarpet and Nungambakkam witnessed steady transaction activity; deal closures were confined to the take up of smaller format office spaces during the second quarter. On the supply front, this region witnessed completion of a medium sized commercial development by an independent developer. Rental values remained largely stable in this micro-market.
Owing to lack of quality space options, locations such as Taramani and Guindy in the Off/Non CBD micro-market witnessed weak tenant demand during the quarter. Majority of the absorption activity was concentrated in a prominent SEZ development. Owing to high occupancy levels in the completed phases, the upcoming phases of Ramanujan IT City (SEZ) observed strong occupier demand, resulting in significant pre-commitment activity during the review period.
The suburban micro-markets of OMR (Rajiv Gandhi Salai), Perungudi and Mount Poonamallee Road witnessed a marginal increase in space take-up in the second quarter. These micro-markets attracted strong interest from corporate occupiers owing to lower rentals, good connectivity, and the presence of better quality office spaces with larger floor plates. Rental and capital values remained largely stable during the review period.
Compared to other micro-markets, the Peripheral Business District (PBD) of Perungalathur, Sholinganallur, Siruseri,
0
10
20
30
40
50
60
70
80
Q22013
Q32013
Q42013
Q12014
Q22014
Q32014
Q42014
Q12015
Q22015
(INR/
sq. f
t./mo
nth)
CBD Off CBD SBD PBD (IT)
Chart 21: Segmentation of Transaction Activity
Q2 2015 CBRE Research © 2015, CBRE, Inc | 13
Chart 19: Rental Value Movement
Chart 20: Capital Value Movement
Source: CBRE Research, Q2 2015.
Source: CBRE Research, Q2 2015.
Source: CBRE Research, Q2 2015.
CHENNAI
0
2,000
4,000
6,000
8,000
10,000
12,000
14,000
Q22013
Q32013
Q42013
Q12014
Q22014
Q32014
Q42014
Q12015
Q22015
(INR/
sq. f
t.)
CBD Off CBD SBD PBD (IT)

MARKETVIEW
Ambattur and GST Road led the absorption activity in the city, accounting for around 43% of the total space leased in Chennai during the quarter. This region saw a few medium format transaction closures from ITeS and healthcare firms such as Access Healthcare, HCL Technologies and IVTL Infoview Technologies, among others. Corporate occupiers from the
Property District Size (in sq. ft.) Tenant
Shriram Gateway PBD 212,000 Accenture
Center Point II SBD 192,000 BNP Paribas
Temple Steps Off CBD 10,000 Agility Logistics
KRM Plaza` CBD 9,700 Nestle
Table 9: Selected Leasing Transactions
Q2 2015 CBRE Research © 2015, CBRE, Inc | 14
Table 10: Sub-market Key Stats
Source: CBRE Research, Q2 2015.
Source: CBRE Research, Q2 2015.
Micro-market Average Rent in Q2 2015 (INR / sq. ft.
/ month)
Average Rent in Q1 2015 (INR / sq. ft. /
month)
Q-o-Q change
(%)
Y-o-Y Change
(%)
CBD (Anna Salai, Nungambakkam, RK Salai, T Nagar, Egmore, Alwarpet) Grade A
74 74 0.0 1.4
Off CBD (Guindy, Kilpauk, Taramani, Adyar, Anna Nagar) Grade A (Non IT/IT)
58 58 0.0 3.6
Off CBD (Guindy, Kilpauk, Taramani, Adyar, Anna Nagar) Grade A (Non IT SEZ)
71 71 0.0 4.4
Suburban Business District (Velachery, Perungudi, Mount Poonamallee Road) Grade A (Non IT)
44 44 0.0 0.0
Suburban Business District (Velachery, Perungudi, Mount Poonamallee Road) Grade A (IT)
51 51 0.0 6.3
Suburban Business District (Velachery, Perungudi, Mount Poonamallee Road) Grade A (IT SEZ)
60 60 0.0 15.4
Peripheral Business District (Perungalathur, Sholinganallur, Siruseri, Ambattur, GST Road) (IT)
27 27 0.0 3.8
Peripheral Business District (Perungalathur, Sholinganallur, Siruseri, Ambattur, GST Road) (IT SEZ)
40 40 0.0 8.1
banking / financial services and IT sectors were observed exploring office options in this region for their expansion and consolidation requirements. Locations such as Ambattur, Navallur and Sholinganallur are expected to witness heightened activity in the coming months on the back of strong occupier demand. Rental values remained stable during the review period.
CHENNAI

MARKETVIEW
PBD 64%
Off CBD 24%
CBD 12%
MARKET SUMMARY
• IT / ITeS sector dominated leasing activity with 30% share
• IT buildings in Off CBD/PBD observed rental appreciation of 5–6%
The Central Business District (CBD) of MG Road, Koregaon Park, Bund Garden, Kalyani Nagar, Dhole Patil, FC Road and JM Road observed strong demand for IT space with major concentration in developments such as Panchshil Tech One, Marisoft I and Sky One, among others. A spurt in transaction activity in IT developments led to a marginal rental appreciation of 1–2% on a quarterly basis.
The Off CBD of Viman Nagar, Magarpatta, Aundh, Baner, Shanker Seth Road and Nagar Road witnessed low levels of absorption with the closure of a few small and medium format office spaces, largely by IT and Knowledge Process Outsourcing (KPO) firms. Owing to the absence of large, ready-to-move-in office spaces, this micro-market witnessed firms exploring options in office developments that were nearing completion. A few large-sized transactions currently under discussion are likely to convert into closures in the coming few months.
This micro-market witnessed limited new supply as developers delayed construction in anticipation of increased FSI for the ITeS segment in the proposed IT and Enabled Services policy for Maharashtra. Strong occupier demand contributed to a slight increase in rents in existing IT developments, while remaining stable in non-IT and SEZ segments.
The Peripheral Business District (PBD) of Hinjewadi, Kharadi, Hadapsar and Talawade attracted enhanced levels of enquires for larger format office spaces from IT firms; however, transaction closures remained low during the quarter. Due to anticipated delivery of quality office space options in the coming months, a few key occupiers looking for contiguous, larger
Q2 2015 CBRE Research © 2015, CBRE, Inc | 15
Chart 22: Rental Value Movement
Chart 24: Segmentation of Transaction Activity
Chart 23: Capital Value Movement
Source: CBRE Research, Q2 2015.
Source: CBRE Research, Q2 2015.
Source: CBRE Research, Q2 2015.
PUNE
0
10
20
30
40
50
60
70
80
Q22013
Q32013
Q42013
Q12014
Q22014
Q32014
Q42014
Q12015
Q22015
(INR /
sq. f
t. / m
onth)
CBD Off CBD (IT) PBD (IT)
0
1,000
2,000
3,000
4,000
5,000
6,000
7,000
8,000
9,000
10,000
Q22013
Q32013
Q42013
Q12014
Q22014
Q32014
Q42014
Q12015
Q22015
(INR /
sq. f
t.)
CBD Off CBD (IT) PBD (IT)
MARKETVIEW
Micro-market Average Rent in Q2 2015 (INR/sq. ft. /
month)
Average Rent in Q1 2015 (INR/sq.
ft. / month)
Q-o-Q change (%)
Y-o-Y Change
(%)
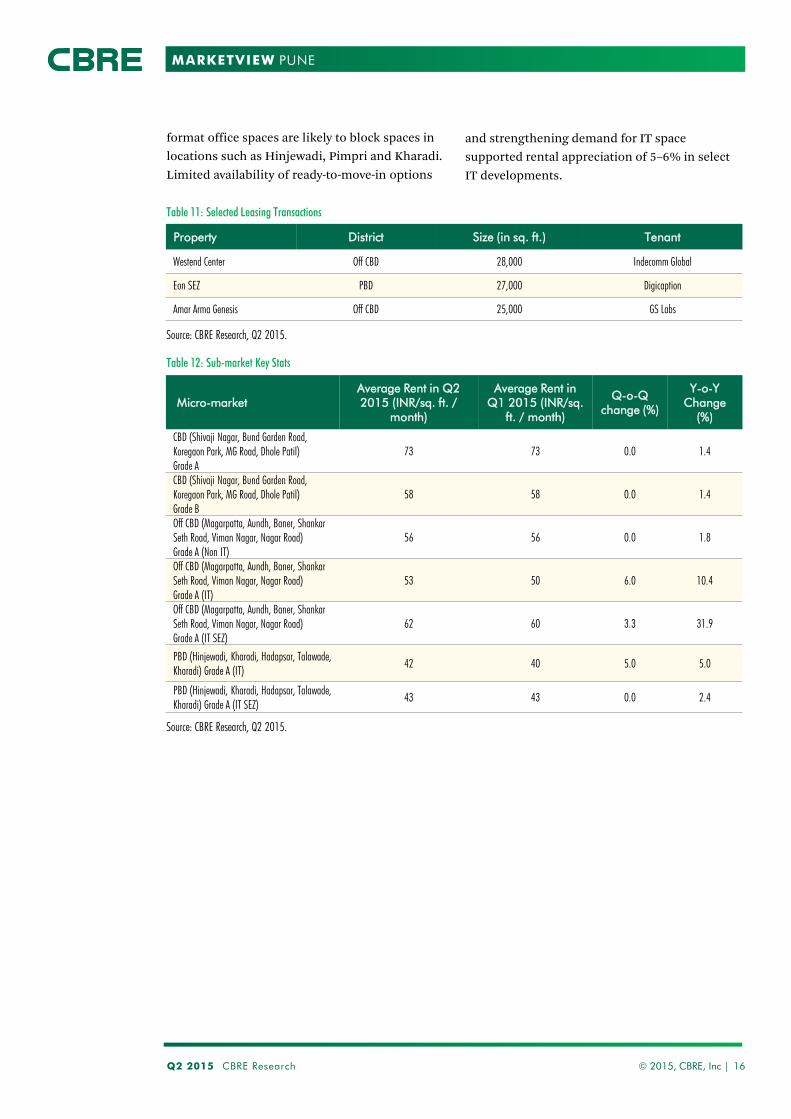
CBD (Shivaji Nagar, Bund Garden Road, Koregaon Park, MG Road, Dhole Patil) Grade A
73 73 0.0 1.4
CBD (Shivaji Nagar, Bund Garden Road, Koregaon Park, MG Road, Dhole Patil) Grade B
58 58 0.0 1.4
Off CBD (Magarpatta, Aundh, Baner, Shankar Seth Road, Viman Nagar, Nagar Road) Grade A (Non IT)
56 56 0.0 1.8
Off CBD (Magarpatta, Aundh, Baner, Shankar Seth Road, Viman Nagar, Nagar Road) Grade A (IT)
53 50 6.0 10.4
Off CBD (Magarpatta, Aundh, Baner, Shankar Seth Road, Viman Nagar, Nagar Road) Grade A (IT SEZ)
62 60 3.3 31.9
PBD (Hinjewadi, Kharadi, Hadapsar, Talawade, Kharadi) Grade A (IT)
42 40 5.0 5.0
PBD (Hinjewadi, Kharadi, Hadapsar, Talawade, Kharadi) Grade A (IT SEZ)
43 43 0.0 2.4
Property District Size (in sq. ft.) Tenant
Westend Center Off CBD 28,000 Indecomm Global
Eon SEZ PBD 27,000 Digicaption
Amar Arma Genesis Off CBD 25,000 GS Labs
format office spaces are likely to block spaces in locations such as Hinjewadi, Pimpri and Kharadi. Limited availability of ready-to-move-in options
Table 11: Selected Leasing Transactions
and strengthening demand for IT space supported rental appreciation of 5–6% in select IT developments.
Q2 2015 CBRE Research © 2015, CBRE, Inc | 16
Table 12: Sub-market Key Stats
Source: CBRE Research, Q2 2015.
Source: CBRE Research, Q2 2015.
PUNE

MARKETVIEW
PBD 76%
CBD 24%
0
20
40
60
80
100
120
Q22013
Q32013
Q42013
Q12014
Q22014
Q32014
Q42014
Q12015
Q22015
(INR /
sq. f
t. / m
onth)
CBD SBD PBD (IT)
MARKET SUMMARY
• Leasing activity remained upbeat in peripheral locations
• IT and electronics sectors remained the major drivers of overall office space demand
• Restrained demand in CBD is likely to keep rentals under pressure
The Central Business District (CBD) of Chowringhee, BBD Bagh, Park Street and Camac Sreet witnessed completion of two office developments—Arcadia Central on Camac Street and Diamond Heritage on Strand Road—that pushed up vacancy levels in the second quarter. Arcadia Central witnessed strong interest from occupiers looking at expansion requirements within the CBD micro-market; while Diamond Heritage, a traditional business house, observed low occupier interest owing to accessibility issues. On the demand side, corporate occupiers explored options in select developments with good support infrastructure and better facilities. Rentals declined by 9–10% on a quarterly comparison on the back of low occupier demand in the second quarter.
Owing to limited supply availability, the Secondary micro-markets of EM Bypass, Kasba–Gariahat, Topsia and Sarat Bose Road witnessed sluggish transaction activity in the second quarter. On the supply front, this micro-market is likely to witness healthy supply addition (mainly concentrated in Kasba and Topsia) in the second half of the year. A few developments, such as Tirumala 22 in Topsia and Acropolis in Kasba nearing completion, witnessed significant pre-commitment activity over the past few months. Vacancy levels in these developments were recorded at about 10–15% during the review period.
Office space absorption in the peripheral micro-markets of Salt Lake and Rajarhat increased significantly, with telecommunications and banking / financial services sectors being the major contributors to space take-up during the second quarter. Owing to construction delays, this micro-market did not witness any addition
Q2 2015 CBRE Research © 2015, CBRE, Inc | 17
Chart 25: Rental Value Movement
Chart 26: Capital Value Movement
Chart 27: Segmentation of Transaction Activity
Source: CBRE Research, Q2 2015
Source: CBRE Research, Q2 2015
Source: CBRE Research, Q2 2015
KOLKATA
0
2,000
4,000
6,000
8,000
10,000
12,000
14,000
16,000
18,000
20,000
Q22013
Q32013
Q42013
Q12014
Q22014
Q32014
Q42014
Q12015
Q22015
(INR /
sq. f
t.)
CBD SBD PBD (IT)
MARKETVIEW
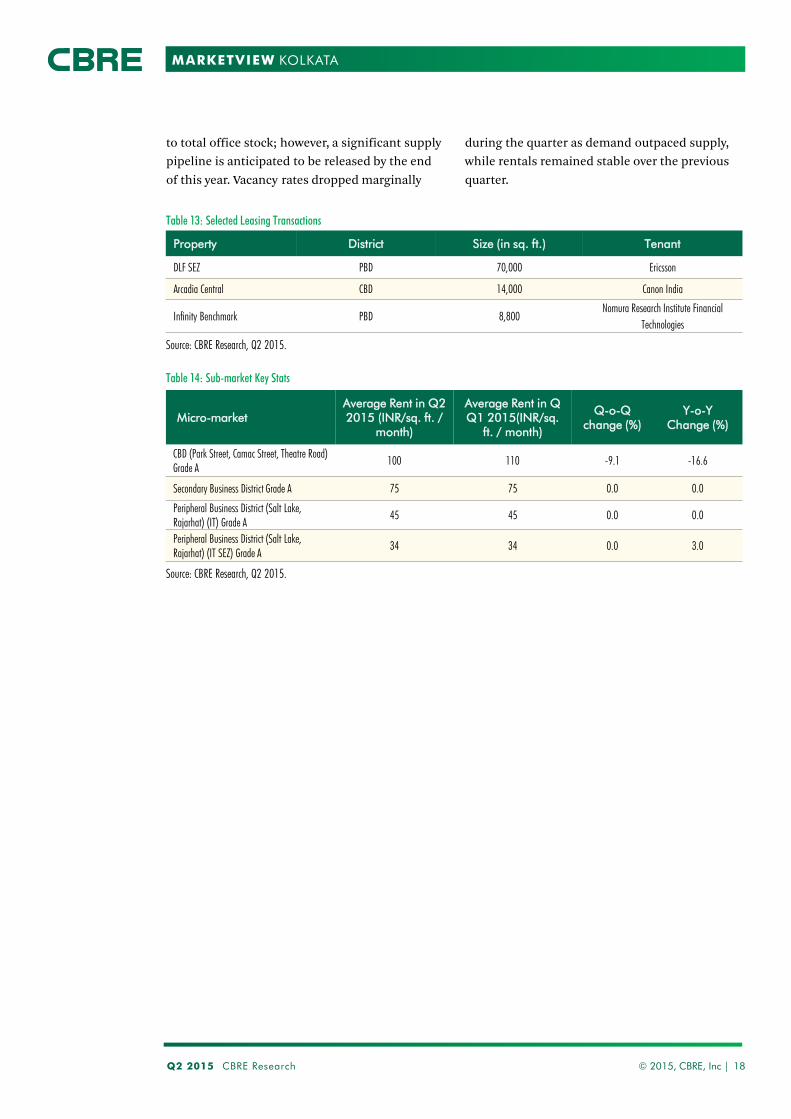
to total office stock; however, a significant supply pipeline is anticipated to be released by the end of this year. Vacancy rates dropped marginally
during the quarter as demand outpaced supply, while rentals remained stable over the previous quarter.
Property District Size (in sq. ft.) Tenant
DLF SEZ PBD 70,000 Ericsson
Arcadia Central CBD 14,000 Canon India
Infinity Benchmark PBD 8,800 Nomura Research Institute Financial
Technologies
Micro-market Average Rent in Q2 2015 (INR/sq. ft. /
month)
Average Rent in Q Q1 2015(INR/sq.
ft. / month)
Q-o-Q change (%)
Y-o-Y Change (%)
CBD (Park Street, Camac Street, Theatre Road) Grade A
100 110 -9.1 -16.6
Secondary Business District Grade A 75 75 0.0 0.0
Peripheral Business District (Salt Lake, Rajarhat) (IT) Grade A
45 45 0.0 0.0
Peripheral Business District (Salt Lake, Rajarhat) (IT SEZ) Grade A
34 34 0.0 3.0
Table 13: Selected Leasing Transactions
Table 14: Sub-market Key Stats
Source: CBRE Research, Q2 2015.
Source: CBRE Research, Q2 2015.
KOLKATA
Q2 2015 CBRE Research © 2015, CBRE, Inc | 18

MARKETVIEW
SUPPLY CRUNCH TO DRIVE RENTALS IN
PREFERRED OFFICE DESTINATIONS;
PRESSURES IN EMERGING MICRO-MARKETS
Although the first half of the year has already witnessed a significant quantum of project completions, a large portion of supply pipeline in Delhi NCR and Bangalore has also been pushed forward owing to delay in statutory approvals. Prime office markets in most leading cities are witnessing a scarcity of available Grade A office space, a trend that is likely to continue for the next couple of quarters resulting into rentals firming up in select locations.
While prime markets are expected to witness a supply crunch, a significant quantum of pipeline is concentrated in emerging, decentralized markets; where occupier interest to pre-commit in under construction developments is likely to increase due to lack of ready to move in options in completed projects that suit their requirements.
RENTAL GROWTH – CORE VS PERIPHERAL
Owing to strong occupier demand and restricted supply addition, most prime office locations are expected to continue to command a premium and witness rental growth in the short to medium term. However, select micro-markets such as the CBD of Delhi might witness a cautious slowdown in rental growth, as rents are already at a peak and occupiers might opt for peripheral locations for further expanding their footprint.
MARKET OUTLOOK
DEMAND TO STRENGTHEN; IT, BANKING AND
E-COMMERCE TO REMAIN THE DOMINANT
SECTORS
Improvements in the macro-economic situation and business sentiments are expected to support expansionary momentum in the office market over the rest of the year. The second half of 2015 is expected to augur well for commercial real estate with the closure of several enquiries currently active in the market. Prime office spaces in centralized locations are likely to observe demand from corporates seeking smaller office configurations (mostly secondary space); while firms looking for larger format office spaces will explore cost effective options in the suburban and peripheral markets for their expansion or consolidation requirements.
Increased level of enquiries and significant pre-commitment activity is likely to further boost space absorption in the forthcoming quarters—particularly in Delhi NCR, Bangalore and Mumbai. It is also expected that the share of expansion related transactions in most of these cities will witness an increase compared to pure consolidation efforts reported in the past few quarters. Industry sectors such as IT/ITeS and banking / financial services are likely to remain the dominant demand drivers for office space, with engineering / manufacturing, research / consulting and pharmaceuticals being the other active sectors. It is likely that the current boom in e-Commerce and allied industries will continue to provide an impetus to demand for commercial space at least for the rest of the year.
Q2 2015 CBRE Research © 2015, CBRE, Inc | 19
OUTLOOK

MARKETVIEW
CONTACTS Abhinav Joshi Associate Director, India CBRE +91 124 465 9700 [email protected] Sunaina Malhotra General Manager, India CBRE +91 11 4239 0200 [email protected] Ram Chandnani Managing Director, Transaction Services, India CBRE Hulkul Brigade Centre, Ground Floor, No. 82 Lavelle Road, Bengaluru 560001 +91 80 40740000 [email protected]
Please visit the Global Research Gateway at www.cbre.com/researchgateway .
Disclaimer: CBRE Limited confirms that information contained herein, including projections, has been obtained from sources believed to be reliable. While we do not doubt its accuracy, we have not verified it and make no guarantee, warranty or representation about them. It is your responsibility to confirm independently their accuracy and completeness. This information is presented exclusively for use by CBRE clients and professionals, and all rights to the material are reserved and cannot be reproduced without prior express written permission of CBRE.
CIN - U74140DL1999PTC100244
INDIA OFFICE