india: perspectives on the draft national wind-solar ... · june 8, 2018 asia clean energy forum...
TRANSCRIPT

India: Perspectives on the Draft National Wind-Solar Hybrid Policy
Asia Clean Energy Forum Panel on Renewable Energy AuctionsJune 8, 2018
Gu-Yoon ChungHead of Business Development Asia PacificEnel Green Power

07/06/2018 Presentation footer 10PT. Please add the relevant country to the footer. 2
Enel GroupIntroduction

World’s largest global utility with the resources and products that are changing the way the world uses energy.
Leadership in all segments of the value chain
Diversified by technology & geographically
Focused on sustainability & growth
2017 Key Figures
87 GWof installed
capacity
over 45%renewable
258 TWhof net
production
Over 43 %Emission free
1.9 Million kmdistribution networks
44 Millionsmart meters
63,500EMPLOYEES
915,000SHAREHOLDERS
65 Millionend users
20 Millionfree retail customers
70.6 BN EUROSREVENUES(2016)
15.3 BN EUROSEBITDA(2016)
54.0 BN EUROSMARKET CAP.(Dec 2017)
31 5countries continents

A simple and effective organization
Group CEO
Global Divisions
Infrastructure
& Networks
Thermal
GenerationTrading
Renewable
EnergiesE-Solutions
Sub-Saharan Africa & Asia
North & Central America
Europe & North Africa
South America
Iberia
Italy
Geographies
Innovation & Sustainability
• Customers
• Local stakeholders
• Regulation
• Revenues
• Cash flow
• EBITDA
• Best practices implementation
• Technology/Solutions
• Efficiencies in Capex & Opex
• Capital allocation
• EBITDA

A simple and effective organization
Energy commodities sales
to end-user, maximize
customer reach and
improve customer journey
Manage the Group energy
distribution assets, improving
customers’ reach also
enhanced by digital platform
infrastructures
Manage the conventional
generation, reduce emissions
and improve performances
through digitization and
flexible assets
Overall Group portfolio
optimization, integrated
margin management, capacity
strategy supervision
Manage renewable
generation fleet,
maximizing global
footprint of the Group
in the renewable space
Downstream positioning of
the Group as leader in the
energy transition;
customer side innovation
and digital proposition
E- Solutions
Thermal
generation
Trading Retail
Infrastructure
and Network
Renewables

07/06/2018 Presentation footer 10PT. Please add the relevant country to the footer. 6
Enel Green Power

Enel Green Power A recognized World leader in renewables
All of our projects and goals are based on
sustainability, innovation and a proactive mindset
to create shared value for ourselves and the
communities in which we operate
When business meets sustainability,
Enel Green Power is the best partner at your side.
Enel Green Power is committed to delivering
tailor-made 100% sustainable energy solutions
worldwide

Enel Green Power in the World
19 Operating
Capacity
10 Capacity under
construction/execution
29countries
more than
employees7,600
1200plants
2018-2020 Industrial Growth Plan
5%
10%
14%4%
63%
4%
Italy
Iberia
South America
Europe & North Africa
North & CentralAmerica
Subsaharian Africa& Asia
7.8 GW
63%
34%
2%
1%
Wind
Solar
Hydro
Geo
7.8 GW
2017 Key Figures
0.9 GWGEO
9.2 GWWIND
27.8 GWHYDRO
2.6 GWSOLAR 89 TWh
consolidated
92 TWhmanaged
4.1 BILLION EUROS
EBITDA
3.4 BILLION EUROS
GROWTH CAPEX
37.1 GWconsolidated
40.5 GWmanaged

EGP contribution to Enel Group
2018 – 2020
Growth Capex
57%
EBITDA
26%
Managed
Installed Capacity
47%
Energy
Production
35%
2017
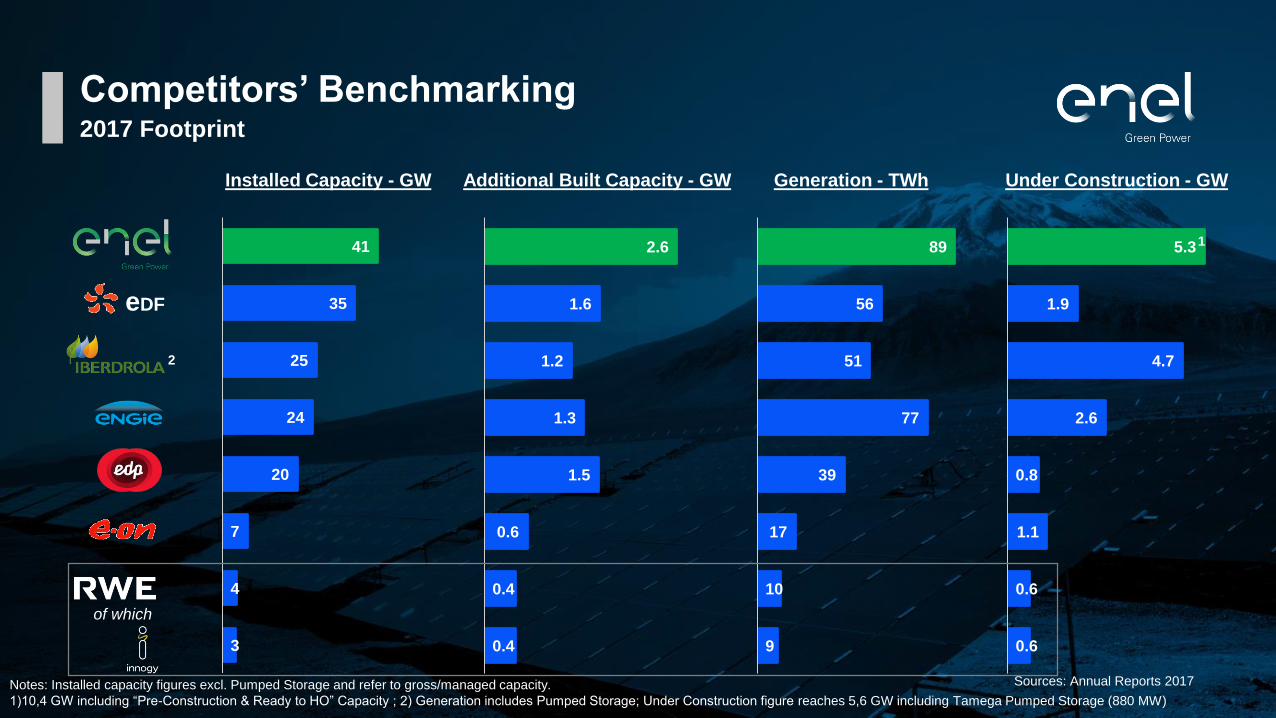
Competitors’ Benchmarking2017 Footprint
5.3
1.9
4.7
2.6
0.8
1.1
0.6
0.6
41
35
25
24
20
7
4
3
Installed Capacity - GW
2.6
1.6
1.2
1.3
1.5
0.6
0.4
0.4
Additional Built Capacity - GW
89
56
51
77
39
17
10
9
Generation - TWh
Sources: Annual Reports 2017
Under Construction - GW
Notes: Installed capacity figures excl. Pumped Storage and refer to gross/managed capacity.
1)10,4 GW including “Pre-Construction & Ready to HO” Capacity ; 2) Generation includes Pumped Storage; Under Construction figure reaches 5,6 GW including Tamega Pumped Storage (880 MW)
1
of which
eDF
2
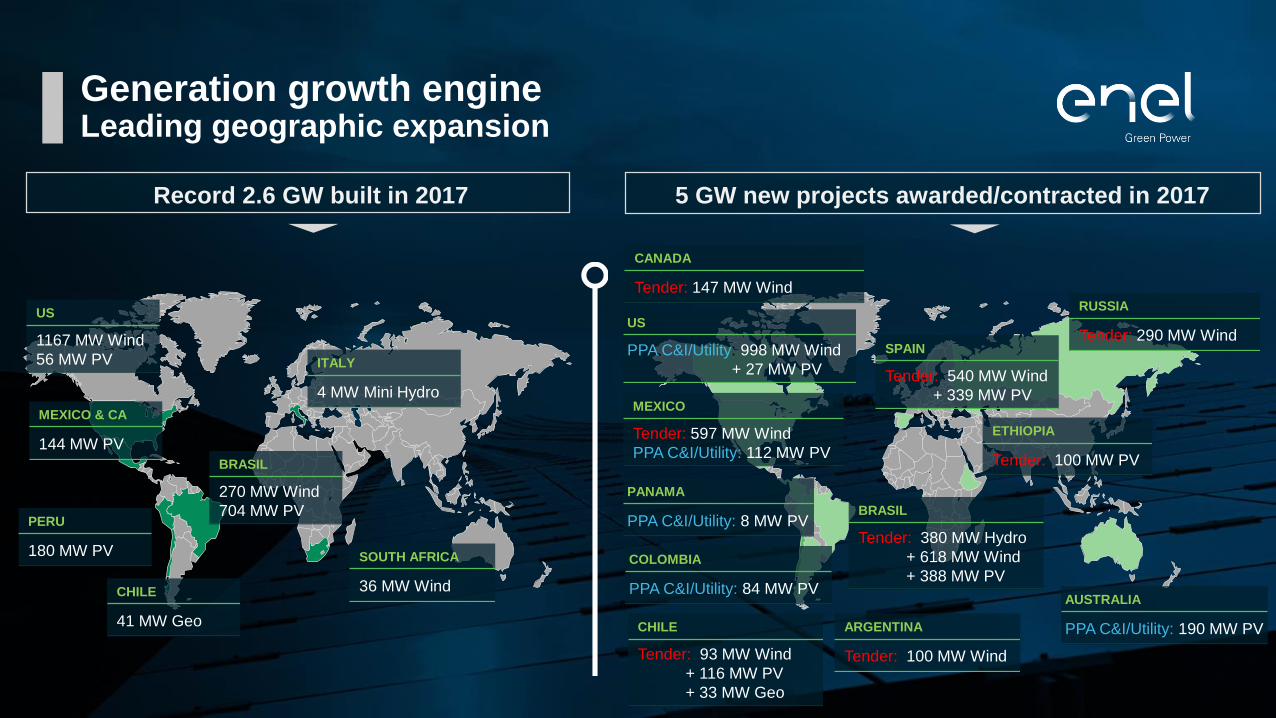
Generation growth engine Leading geographic expansion
Record 2.6 GW built in 2017 5 GW new projects awarded/contracted in 2017
CANADA
Tender: 147 MW WindRUSSIA
Tender: 290 MW WindSPAIN
Tender: 540 MW Wind
+ 339 MW PV
ETHIOPIA
Tender: 100 MW PV
BRASIL
Tender: 380 MW Hydro
+ 618 MW Wind
+ 388 MW PV
ARGENTINA
Tender: 100 MW Wind
CHILE
Tender: 93 MW Wind
+ 116 MW PV
+ 33 MW Geo
AUSTRALIA
PPA C&I/Utility: 190 MW PV
PANAMA
PPA C&I/Utility: 8 MW PV
US
PPA C&I/Utility: 998 MW Wind
+ 27 MW PV
MEXICO
Tender: 597 MW Wind
PPA C&I/Utility: 112 MW PV
US
1167 MW Wind
56 MW PV
MEXICO & CA
144 MW PV
PERU
180 MW PV
CHILE
41 MW Geo
SOUTH AFRICA
36 MW Wind
BRASIL
270 MW Wind
704 MW PV
ITALY
4 MW Mini Hydro
COLOMBIA
PPA C&I/Utility: 84 MW PV

07/06/2018 Presentation footer 10PT. Please add the relevant country to the footer. 12
Renewable Energy Tenders in India

Source: BNEF 1Q 2017 Global Auction and Tender Results_2017-04-07
India RES targets and outlookSizeable RES targets purely based on tenders for wind and solar
13
175GW renewable target by 2022, of which 129GW remains to be awarded
Competitive tariff environment
280 1.410 2.556 2.410 6.003Total MW 1.500
Auction clearing prices 2012 – 2017 (USD)
Stable and consistent tender schedule
9 GW
Jun’18
4-5 GW
Sep’18
4-5 GW
Dec’18
4-5 GWMar 19
5 GW
Jun’18
2-3 GW
Sep’18
2-3 GW
Dec’18
2-3 GWMar 19
Broad View of Upcoming Capacities by March 2019
$/MWh

Auctions driving down pricesWinning solar tariffs in Indian national solar tenders
10.95
7.49 7.005.51 5.25 4.63 4.34
2.44
2010 2011 2012 2013 2014 2015 2016 2017
Rupees per kWh
19.3% compounded average rate since 2010
Source: BNEF

Projected renewable tenders in India
15
SECI 4
Apr 2018
Wind
Solar
New Tech
2000 MW 1000 MW
SECI 7/8
Mar 2019
2000 MW
SECI 5/NTPC
July 2018
2000 MW
NTPC
Nov 2018
2000 MW
SECI
Aug 2018
2000 MW
Floating Solar
Sep 2018
500 MW
Wind Solar Hybrid
Mar 2019
Tender
Volume
Tender
Volume
Deal
Volume
State Tender
Feb/Mar2019
1000 MW
Karnataka
Sept 2018
1000 MW
(*) Timelines based on market intel and subject to government announcement
2000 MW
Maharashtra
Dec 2018
Steady pace of strong volumes, and introduction of new technologies
Enel Green Power awarded

16
Renewable Hybrid Tender in India

First Notice for Hybrid Tender
17
NiT (April 26, 2018)
1000 MW of wind in existing solar
projects or 1000 MW of solar in
existing wind projects

Policy from Central Government
18
Approved May 25, 2018
25th May, 2018 (Approved by Ministry with directive to SECI to roll out tenders)
RfS: Expected Mid July
Implementation Agency: SECI
Selection: e Bidding followed by e Reverse Auction
Eligible Bid Capacity: Minimum 200 MW; Maximum 500 MW per Bidder
Projects: Any rated capacity of wind and solar projects along with any energy storage facility
Criterion for Hybrid: Rated Power Capacity of one resource (SOLAR/WIND) should be 25%
of the Rated Power Capacity of the other resource
Location: To be identified by bidders
Connectivity: CTU @220 kV and above at bidder's cost and responsibility
PPA: 25 Years with SECI (Within 2 Months of LoA)
PSA: Back to back with DISCOMs/Bulk Consumers. Solar/Non-solar RPOs can be fulfilled
through purchase of hybrid power.
Technical Eligibility: Developer/Owner/EPC of Wind/Solar projects of at least 25 MW
capacity at one location
Financial Eligibility: 1.5 Cr/MW
Bid Processing Fee: 3 lakhs + GST
EMD: 10 Lakh/MW
PBG: 20 Lakh/MW
Commissioning – 18 Months from LoA
Part Commissioning - The minimum capacity for acceptance of first part commissioning
shall be 50 MW or 50% of the allocated project capacity, whichever is lower.
CUF - Has to be at least 40% or more. To be declared at PPA signing, allowed to be revised
once with 1st year of CoD and cannot fall below 90% of the declared CUF value
Format and bidding rules borrow from
existing SECI solar & wind tenders
Set minimum ratio (4:1) for
hybridization
Allow only AC-level combination
(“co-located”)
Opened possibility to also incorporate
storage
But still lacking in details!
19
Hybrid Renewable Projects

Why Hybrid Renewable Projects?
20
ACEF Presentation
(June 2017)
Taking the cue from last year’s discussion..

Why Hybrid Renewable Projects
21
Challenges Facing Renewables
• Siting Constraints
• Siting depends on resource
availability
• Environmental challenges (e.g. land
use, wild-life), local opposition
• Transmission challenges
• High Upfront Capital Costs
• Resource Intermittency
• Higher challenge for solar and wind
projects
• Reliability challenges
Need to find smarter and
more efficient ways to
maximize renewable
electricity production
and minimize
environmental footprint
One solution is to
combine (“hybridize”)
renewable technologies
on a single site.

Benefits of Hybrid Renewable Projects
22
Stillwater Geothermal-Solar PV-CSP Hybrid Project (Nevada, USA)
Hourly generation profile of geothermal and solar
✓ Generation that closely follows the daily load
✓ Cost-saving on shared infrastructure and
maintenance
✓ Minimize environmental footprint

Potential Benefits for Wind/Solar/ESS Hybrid
23
Hourly generation profile of geothermal and solar
Source: DNV-GL presentation
• Wind and Solar also (often) yield
complementary generation profiles
• Addition of batteries could further
minimize curtailment/congestion
losses and optimize the serve of
peak load
• Problems are site specific and
cost!

Fontes Hybrid Plant
24
Tacaratu (PE) - Brazil
Fontes dos Ventos (wind)
– 80 MW of installed
capacity
Fontes solar – 11 MW of
installed capacity
Generating more than 340
GWh per year.

Wind/solar hybrid configuration
25
AC or DC combination?
• Combines the wind and solar output in AC (using
separate inverters)
• Achieves savings through the common use of the
sub-station (utilizing the spare capacity)
• Recently launched Indian tender allows only this
configuration
• Solar (and battery) output is integrated with the
wind output in DC and converted together to AC
• Potentially lower losses, higher efficiency, and
higher degree of integration (sharing of
components)
• Purpose-specific WTG is needed (and being
developed)

Final Thoughts
• Hybridizing renewables can bring value in terms of generation
profile, environmental profile and cost
• Certain combination (e.g. storage) may not be cost-competitive
with stand-alone renewables (yet)
• Integrating different technologies using a shared infrastructure
(especially if different project sponsors) may require clear rules
on metering and cost-sharing
26

Key levers for a winning Business Model
Tailor made solutions to meet a variety of customer needs
Flexible structures squeezing risk-value trade offs
COMMERCIAL
STRUCTURING
Strategic partnerships and co-development agreements
High quality pipeline of projects
PROJECT
DEVELOPMENT
Access to competitivecost of financing
Attractive alternatives to industry financial players
FINANCE
SOURCING
Economies of scale, global procurement
Design-to-value to increase reliability and minimize costs
ENGINEERING &
CONSTRUCTION
Big data and predictive maintenance
Performance excellence at lower costs
OPERATION &
MAINTENANCE
Integrated portfolio (generation/retail/trading)
Risk mitigation synergies at Group level
ENERGY
MANAGEMENT
Wind Onshore
our main
portfolio driver
Solar Photovoltaic
increasing key role
in solar market
Geothermal Energy
leadership in the sector
Hydroelectric
focused on
small-medium hydro
How We Originate How We Execute How We Deliver4 technologies across the Globe
Technological and Geographical diversification with an optimized Value Chain

Thank [email protected]