india pharmaceuticals sector
TRANSCRIPT
DISCLOSURE APPENDIX CONTAINS ANALYST CERTIFICATIONS AND THE STATUS OF NON-US ANALYSTS. U.S. Disclosure: Credit Suisse does and seeks to do business with companies covered in its research reports. As a result, investors should be aware that the Firm may have a conflict of interest that could affect the objectivity of this report. Investors should consider this report as only a single factor in making their investment decision.
18 October 2011 Asia Pacific/India Equity Research
Specialty Pharmaceuticals
India Pharmaceuticals Sector THEME
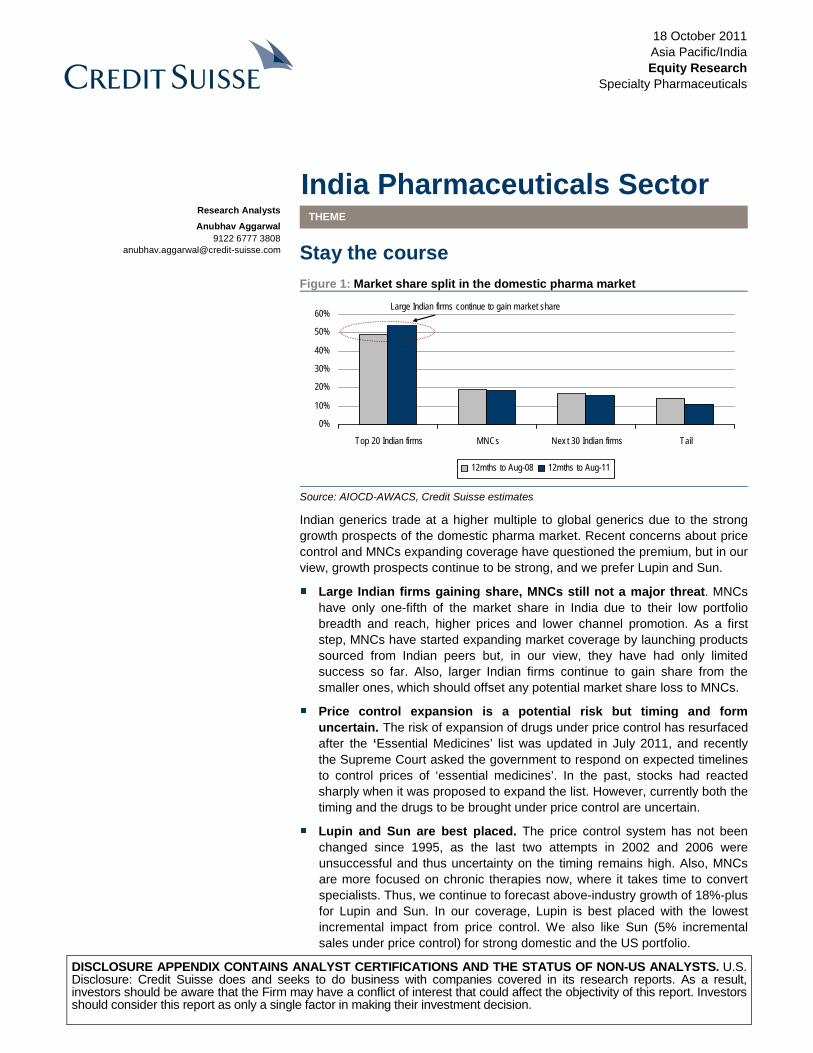
Stay the course Figure 1: Market share split in the domestic pharma market
0%
10%
20%
30%
40%
50%
60%
Top 20 Indian firms MNCs Nex t 30 Indian firms Tail
12mths to Aug-08 12mths to Aug-11
Large Indian firms continue to gain market share
Source: AIOCD-AWACS, Credit Suisse estimates
Indian generics trade at a higher multiple to global generics due to the strong growth prospects of the domestic pharma market. Recent concerns about price control and MNCs expanding coverage have questioned the premium, but in our view, growth prospects continue to be strong, and we prefer Lupin and Sun.
■ Large Indian firms gaining share, MNCs still not a major threat. MNCs have only one-fifth of the market share in India due to their low portfolio breadth and reach, higher prices and lower channel promotion. As a first step, MNCs have started expanding market coverage by launching products sourced from Indian peers but, in our view, they have had only limited success so far. Also, larger Indian firms continue to gain share from the smaller ones, which should offset any potential market share loss to MNCs.
■ Price control expansion is a potential risk but timing and form uncertain. The risk of expansion of drugs under price control has resurfaced after the ‘Essential Medicines’ list was updated in July 2011, and recently the Supreme Court asked the government to respond on expected timelines to control prices of ‘essential medicines’. In the past, stocks had reacted sharply when it was proposed to expand the list. However, currently both the timing and the drugs to be brought under price control are uncertain.
■ Lupin and Sun are best placed. The price control system has not been changed since 1995, as the last two attempts in 2002 and 2006 were unsuccessful and thus uncertainty on the timing remains high. Also, MNCs are more focused on chronic therapies now, where it takes time to convert specialists. Thus, we continue to forecast above-industry growth of 18%-plus for Lupin and Sun. In our coverage, Lupin is best placed with the lowest incremental impact from price control. We also like Sun (5% incremental sales under price control) for strong domestic and the US portfolio.
Research Analysts
Anubhav Aggarwal 9122 6777 3808
18 October 2011
India Pharmaceuticals Sector 2
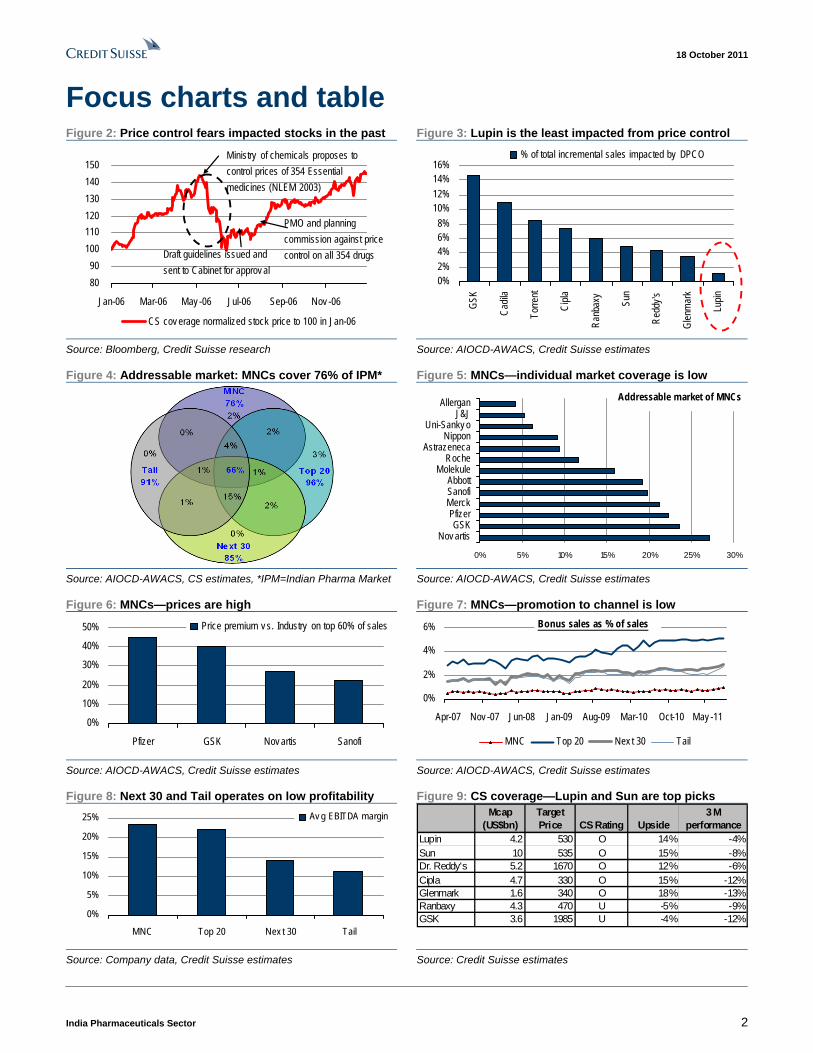
Focus charts and table Figure 2: Price control fears impacted stocks in the past Figure 3: Lupin is the least impacted from price control
8090
100110120130140150
Jan-06 Mar-06 May -06 Jul-06 Sep-06 Nov -06
CS cov erage normalized stock price to 100 in Jan-06
Ministry of chemicals proposes to control prices of 354 Essential medicines (NLEM 2003)
Draft guidelines issued and sent to Cabinet for approv al
PMO and planning commission against price control on all 354 drugs
0%2%4%6%8%
10%12%14%16%
GSK
Cadil
a
Torre
nt
Cipla
Ranb
axy
Sun
Redd
y's
Glen
mar
k
Lupin
% of total incremental sales impacted by DPCO
Source: Bloomberg, Credit Suisse research Source: AIOCD-AWACS, Credit Suisse estimates
Figure 4: Addressable market: MNCs cover 76% of IPM* Figure 5: MNCs—individual market coverage is low
Addressable market of MNCs
0% 5% 10% 15% 20% 25% 30%
Nov artisGSK
PfizerMerckSanofiAbbott
MolekuleRoche
AstrazenecaNippon
Uni-Sanky oJ&J
Allergan
Source: AIOCD-AWACS, CS estimates, *IPM=Indian Pharma Market Source: AIOCD-AWACS, Credit Suisse estimates
Figure 6: MNCs—prices are high Figure 7: MNCs—promotion to channel is low
0%
10%
20%
30%
40%
50%
Pfizer GSK Nov artis Sanofi
Price premium v s. Industry on top 60% of sales
0%
2%
4%
6%
Apr-07 Nov -07 Jun-08 Jan-09 Aug-09 Mar-10 Oct-10 May -11
MNC Top 20 Nex t 30 Tail
Bonus sales as % of sales
Source: AIOCD-AWACS, Credit Suisse estimates Source: AIOCD-AWACS, Credit Suisse estimates
Figure 8: Next 30 and Tail operates on low profitability Figure 9: CS coverage—Lupin and Sun are top picks
0%
5%
10%
15%
20%
25%
MNC Top 20 Nex t 30 Tail
Av g EBITDA margin Mcap (US$bn)
Target Price CS Rating Upside
3 M performance
Lupin 4.2 530 O 14% -4%Sun 10 535 O 15% -8%Dr. Reddy's 5.2 1670 O 12% -6%Cipla 4.7 330 O 15% -12%Glenmark 1.6 340 O 18% -13%Ranbaxy 4.3 470 U -5% -9%GSK 3.6 1985 U -4% -12%
Source: Company data, Credit Suisse estimates Source: Credit Suisse estimates
18 October 2011
India Pharmaceuticals Sector 3
Stay the course Indian generics trade at a higher multiple to global generics due to the strong growth prospects of the domestic pharma market. Recent concerns about price control and MNCs expanding coverage have questioned the premium but, in our view, growth prospects remain strong.
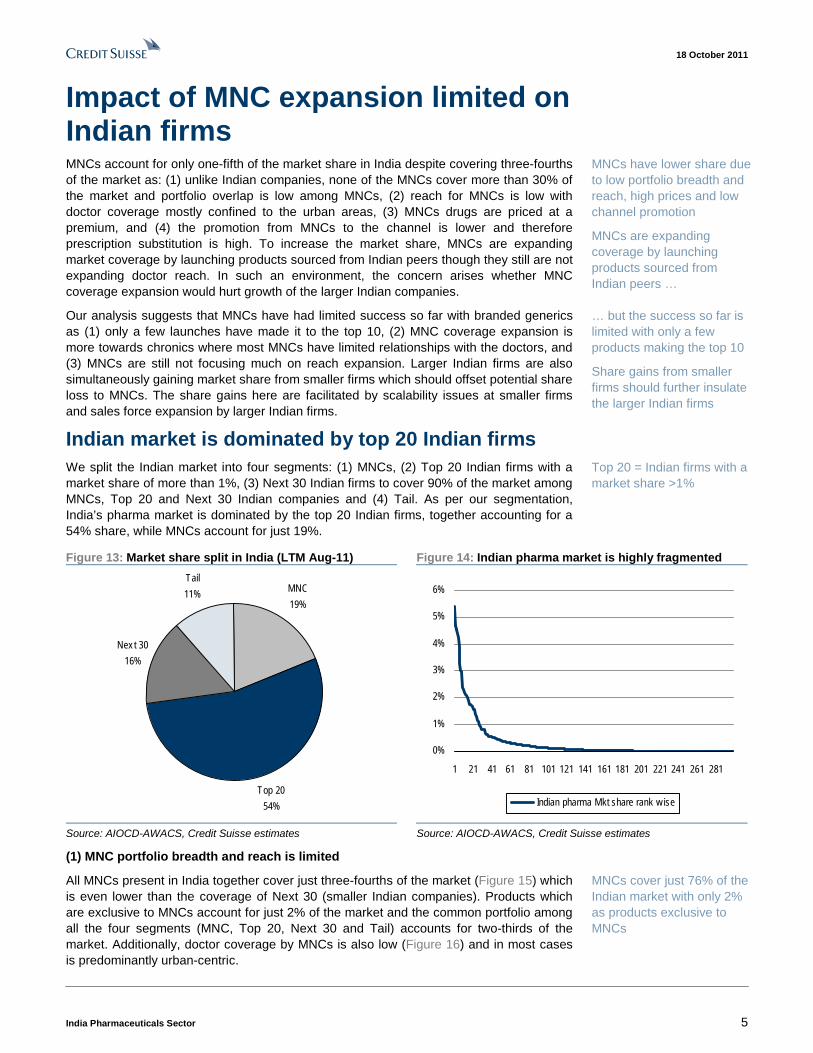
Impact of MNC expansion limited on Indian firms MNCs account for only one-fifth of the market share in India despite covering three-fourths of the market as: (1) unlike Indian companies, none of the MNCs cover more than 30% of the market and portfolio overlap is low among MNCs, (2) reach for MNCs is low with doctor coverage mostly confined to the urban areas, (3) MNCs’ drugs are priced at a premium and (4) promotion by MNCs to the channel is lower and therefore prescription substitution is high. To increase the market share, MNCs are expanding market coverage by launching products sourced from Indian peers though they still are not expanding doctor reach. In such an environment, the concern arises whether MNC coverage expansion would hurt the growth of the larger Indian companies.
Our analysis suggests that MNCs have had a limited success so far with branded generics, as (1) only a few launches have made it to the top 10 ranks, (2) MNC coverage expansion is more towards chronics where most of them have limited relationships with the doctors, and (3) MNCs are still not focusing much on reach expansion. Larger Indian firms are also simultaneously gaining market share from the smaller ones which should offset any potential share loss to MNCs. The share gains here are facilitated by scalability issues at smaller firms and sales force expansion by larger Indian firms.
Price control—potential risk but timing & form uncertain The risk of expansion of drugs under price control has resurfaced after (1) the National List of Essential Medicines (NLEM) was updated in July 2011 and (2) the Supreme Court recently asked the government to respond on expected timelines to control prices of ‘essential medicines’—the next hearing is set for 17 November 2011. In 2006, stocks reacted sharply when it was proposed to bring the entire NLEM list under price control. When a medicine is brought under price control, its pricing is based on a ‘cost plus’ model, thus impacting profitability and the incentive for the manufacturer to promote the drug.
In the past, the criteria for selection of drugs under price control were based on sales and market share to prevent monopoly in the market. In our analysis, we have considered those drugs under NLEM 2011 where the size is more than Rs400 mn and the market share of a single formulator is more than 10%. In terms of incremental sales under price control, Lupin should be the least impacted while GSK should be the most impacted due to almost 100% exposure to India.
Stay with Lupin and Sun In our view, it is early to call for a de-rating of the sector, as both timing and form of price control are uncertain. The price control system has not been changed since 1995, as the last two attempts in 2002 and 2006 were unsuccessful. Also, MNCs are more focused on chronic therapies now where it takes time to convert specialists. Therefore, we continue to forecast growth of 18%-plus for Sun and Lupin. Between the two risks, DPCO is more severe and Lupin is best placed in our coverage with the lowest incremental impact. We also like Sun with an incremental 5% sales impact from DPCO but with a much stronger domestic presence and lower product concentration in the US. We change our coverage target price by -6% to 6% to factor in INR depreciation, a reduction in DEPB benefits, weak domestic growth for Cipla and Dr. Reddy’s, and lower margins for Glenmark.
MNCs have a lower share due to low portfolio breadth and reach, high prices and low channel promotion
MNCs are expanding coverage by launching products sourced from Indian peers
But the success so far is limited with only a few products making the top 10
Share gains from the smaller firms should further insulate the larger Indian firms
Supreme Court recently asked the government about timelines to control prices of Essential Medicines – the next hearing is set for 17 November 2011
Drugs under price control are included based on sales and market share criteria
Lupin is the least impacted in our coverage
Early to call for a de-rating – last two changes to DPCO were unsuccessful
Continue to be positive on the sector growth and forecast 18%+ growth for Lupin and Sun
18 October 2011
India Pharmaceuticals Sector 4
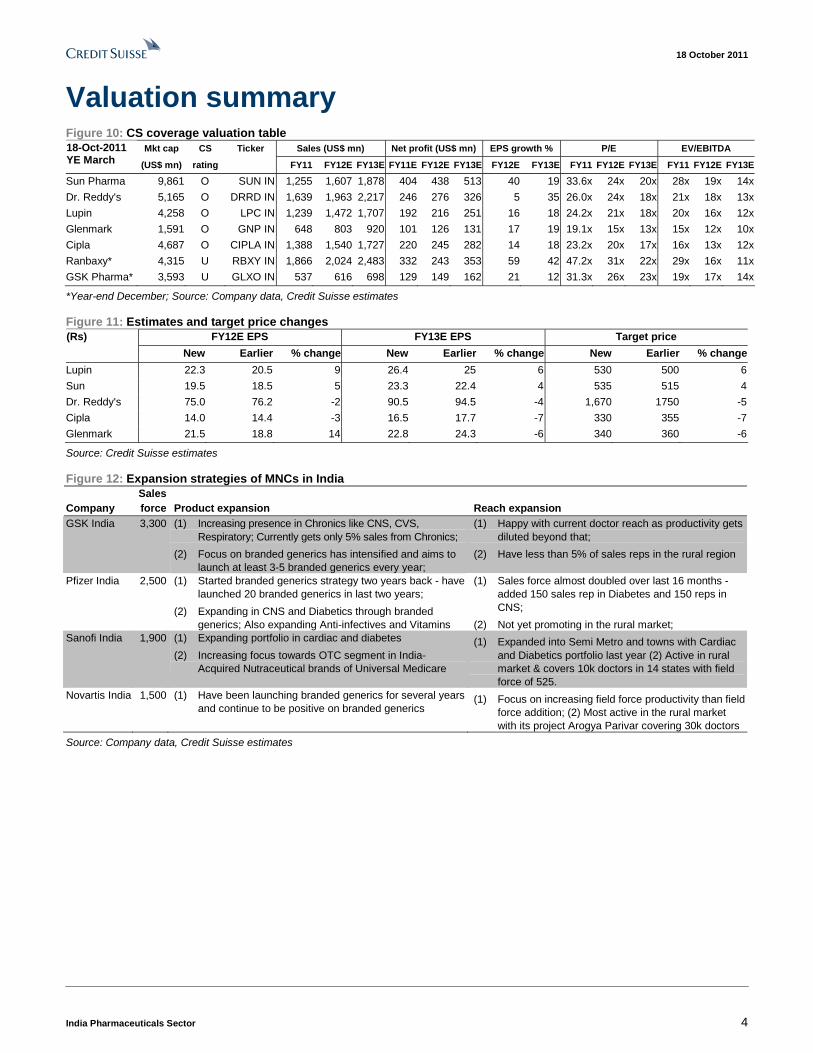
Valuation summary Figure 10: CS coverage valuation table
Mkt cap CS Ticker Sales (US$ mn) Net profit (US$ mn) EPS growth % P/E EV/EBITDA 18-Oct-2011 YE March (US$ mn) rating FY11 FY12E FY13E FY11E FY12E FY13E FY12E FY13E FY11 FY12E FY13E FY11 FY12E FY13E
Sun Pharma 9,861 O SUN IN 1,255 1,607 1,878 404 438 513 40 19 33.6x 24x 20x 28x 19x 14x
Dr. Reddy's 5,165 O DRRD IN 1,639 1,963 2,217 246 276 326 5 35 26.0x 24x 18x 21x 18x 13x
Lupin 4,258 O LPC IN 1,239 1,472 1,707 192 216 251 16 18 24.2x 21x 18x 20x 16x 12x
Glenmark 1,591 O GNP IN 648 803 920 101 126 131 17 19 19.1x 15x 13x 15x 12x 10x
Cipla 4,687 O CIPLA IN 1,388 1,540 1,727 220 245 282 14 18 23.2x 20x 17x 16x 13x 12x
Ranbaxy* 4,315 U RBXY IN 1,866 2,024 2,483 332 243 353 59 42 47.2x 31x 22x 29x 16x 11x
GSK Pharma* 3,593 U GLXO IN 537 616 698 129 149 162 21 12 31.3x 26x 23x 19x 17x 14x
*Year-end December; Source: Company data, Credit Suisse estimates
Figure 11: Estimates and target price changes FY12E EPS FY13E EPS Target price (Rs)
New Earlier % change New Earlier % change New Earlier % change
Lupin 22.3 20.5 9 26.4 25 6 530 500 6
Sun 19.5 18.5 5 23.3 22.4 4 535 515 4
Dr. Reddy's 75.0 76.2 -2 90.5 94.5 -4 1,670 1750 -5
Cipla 14.0 14.4 -3 16.5 17.7 -7 330 355 -7
Glenmark 21.5 18.8 14 22.8 24.3 -6 340 360 -6
Source: Credit Suisse estimates
Figure 12: Expansion strategies of MNCs in India Sales Company force Product expansion Reach expansion GSK India 3,300 (1) Increasing presence in Chronics like CNS, CVS,
Respiratory; Currently gets only 5% sales from Chronics;
(2) Focus on branded generics has intensified and aims to launch at least 3-5 branded generics every year;
(1) Happy with current doctor reach as productivity gets diluted beyond that;
(2) Have less than 5% of sales reps in the rural region
Pfizer India 2,500 (1) Started branded generics strategy two years back - have launched 20 branded generics in last two years;
(2) Expanding in CNS and Diabetics through branded generics; Also expanding Anti-infectives and Vitamins
(1) Sales force almost doubled over last 16 months - added 150 sales rep in Diabetes and 150 reps in CNS;
(2) Not yet promoting in the rural market; Sanofi India 1,900 (1) Expanding portfolio in cardiac and diabetes
(2) Increasing focus towards OTC segment in India- Acquired Nutraceutical brands of Universal Medicare
(1) Expanded into Semi Metro and towns with Cardiac and Diabetics portfolio last year (2) Active in rural market & covers 10k doctors in 14 states with field force of 525.
Novartis India 1,500 (1) Have been launching branded generics for several years and continue to be positive on branded generics
(1) Focus on increasing field force productivity than field force addition; (2) Most active in the rural market with its project Arogya Parivar covering 30k doctors
Source: Company data, Credit Suisse estimates
18 October 2011
India Pharmaceuticals Sector 5
Impact of MNC expansion limited on Indian firms MNCs account for only one-fifth of the market share in India despite covering three-fourths of the market as: (1) unlike Indian companies, none of the MNCs cover more than 30% of the market and portfolio overlap is low among MNCs, (2) reach for MNCs is low with doctor coverage mostly confined to the urban areas, (3) MNCs drugs are priced at a premium, and (4) the promotion from MNCs to the channel is lower and therefore prescription substitution is high. To increase the market share, MNCs are expanding market coverage by launching products sourced from Indian peers though they still are not expanding doctor reach. In such an environment, the concern arises whether MNC coverage expansion would hurt growth of the larger Indian companies.
Our analysis suggests that MNCs have had limited success so far with branded generics as (1) only a few launches have made it to the top 10, (2) MNC coverage expansion is more towards chronics where most MNCs have limited relationships with the doctors, and (3) MNCs are still not focusing much on reach expansion. Larger Indian firms are also simultaneously gaining market share from smaller firms which should offset potential share loss to MNCs. The share gains here are facilitated by scalability issues at smaller firms and sales force expansion by larger Indian firms.
Indian market is dominated by top 20 Indian firms We split the Indian market into four segments: (1) MNCs, (2) Top 20 Indian firms with a market share of more than 1%, (3) Next 30 Indian firms to cover 90% of the market among MNCs, Top 20 and Next 30 Indian companies and (4) Tail. As per our segmentation, India’s pharma market is dominated by the top 20 Indian firms, together accounting for a 54% share, while MNCs account for just 19%.
Figure 13: Market share split in India (LTM Aug-11) Figure 14: Indian pharma market is highly fragmented
MNC
19%
Top 20
54%
Nex t 30
16%
Tail
11%
0%
1%
2%
3%
4%
5%
6%
1 21 41 61 81 101 121 141 161 181 201 221 241 261 281
Indian pharma Mkt share rank w ise
Source: AIOCD-AWACS, Credit Suisse estimates Source: AIOCD-AWACS, Credit Suisse estimates
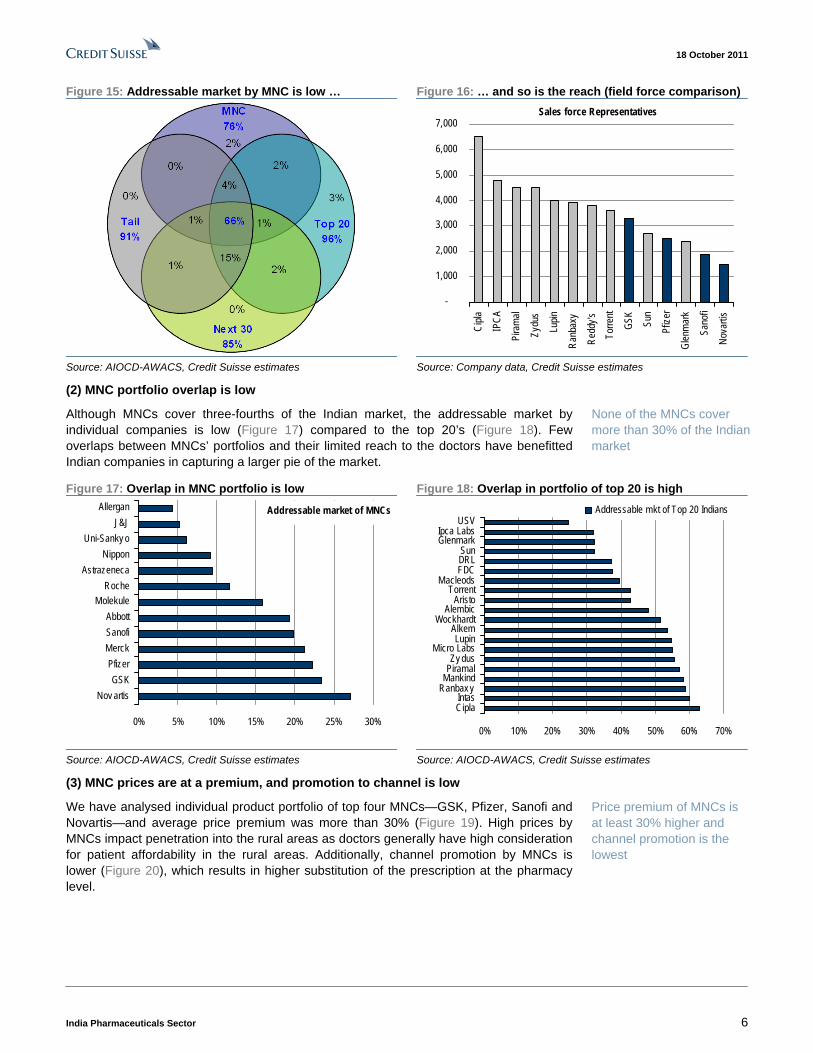
(1) MNC portfolio breadth and reach is limited
All MNCs present in India together cover just three-fourths of the market (Figure 15) which is even lower than the coverage of Next 30 (smaller Indian companies). Products which are exclusive to MNCs account for just 2% of the market and the common portfolio among all the four segments (MNC, Top 20, Next 30 and Tail) accounts for two-thirds of the market. Additionally, doctor coverage by MNCs is also low (Figure 16) and in most cases is predominantly urban-centric.
MNCs have lower share due to low portfolio breadth and reach, high prices and low channel promotion
MNCs are expanding coverage by launching products sourced from Indian peers …
… but the success so far is limited with only a few products making the top 10
Share gains from smaller firms should further insulate the larger Indian firms
Top 20 = Indian firms with a market share >1%
MNCs cover just 76% of the Indian market with only 2% as products exclusive to MNCs
18 October 2011
India Pharmaceuticals Sector 6
Figure 15: Addressable market by MNC is low … Figure 16: … and so is the reach (field force comparison)
-
1,000
2,000
3,000
4,000
5,000
6,000
7,000
Cipla
IPCA
Pira
mal
Zydu
s
Lupin
Ranb
axy
Redd
y'sTo
rrent
GSK
Sun
Pfize
r
Glen
mar
k
Sano
fi
Nova
rtis
Sales force Representatives
Source: AIOCD-AWACS, Credit Suisse estimates Source: Company data, Credit Suisse estimates
(2) MNC portfolio overlap is low
Although MNCs cover three-fourths of the Indian market, the addressable market by individual companies is low (Figure 17) compared to the top 20’s (Figure 18). Few overlaps between MNCs’ portfolios and their limited reach to the doctors have benefitted Indian companies in capturing a larger pie of the market.
Figure 17: Overlap in MNC portfolio is low Figure 18: Overlap in portfolio of top 20 is high
Addressable market of MNCs
0% 5% 10% 15% 20% 25% 30%
Nov artisGSK
PfizerMerckSanofiAbbott
MolekuleRoche
AstrazenecaNippon
Uni-Sanky oJ&J
Allergan
0% 10% 20% 30% 40% 50% 60% 70%
CiplaIntas
Ranbax yMankindPiramalZy dus
Micro LabsLupin
AlkemWockhardt
AlembicAristo
TorrentMacleods
FDCDRLSun
GlenmarkIpca Labs
USVAddressable mkt of Top 20 Indians
Source: AIOCD-AWACS, Credit Suisse estimates Source: AIOCD-AWACS, Credit Suisse estimates
(3) MNC prices are at a premium, and promotion to channel is low
We have analysed individual product portfolio of top four MNCs—GSK, Pfizer, Sanofi and Novartis—and average price premium was more than 30% (Figure 19). High prices by MNCs impact penetration into the rural areas as doctors generally have high consideration for patient affordability in the rural areas. Additionally, channel promotion by MNCs is lower (Figure 20), which results in higher substitution of the prescription at the pharmacy level.
None of the MNCs cover more than 30% of the Indian market
Price premium of MNCs is at least 30% higher and channel promotion is the lowest
18 October 2011
India Pharmaceuticals Sector 7
Figure 19: MNC prices on average are higher Figure 20: Bonus sales as % of total sales
0%
5%
10%
15%
20%
25%
30%
35%
40%
45%
50%
Pfizer GSK Nov artis Sanofi
Price premium v s. Industry on top 60% of sales
0%
1%
2%
3%
4%
5%
6%
Apr-07 Nov -07 Jun-08 Jan-09 Aug-09 Mar-10 Oct-10 May -11
MNC Top 20 Nex t 30 Tail
Source: AIOCD-AWACS, Credit Suisse estimates Source: AIOCD-AWACS, Credit Suisse research
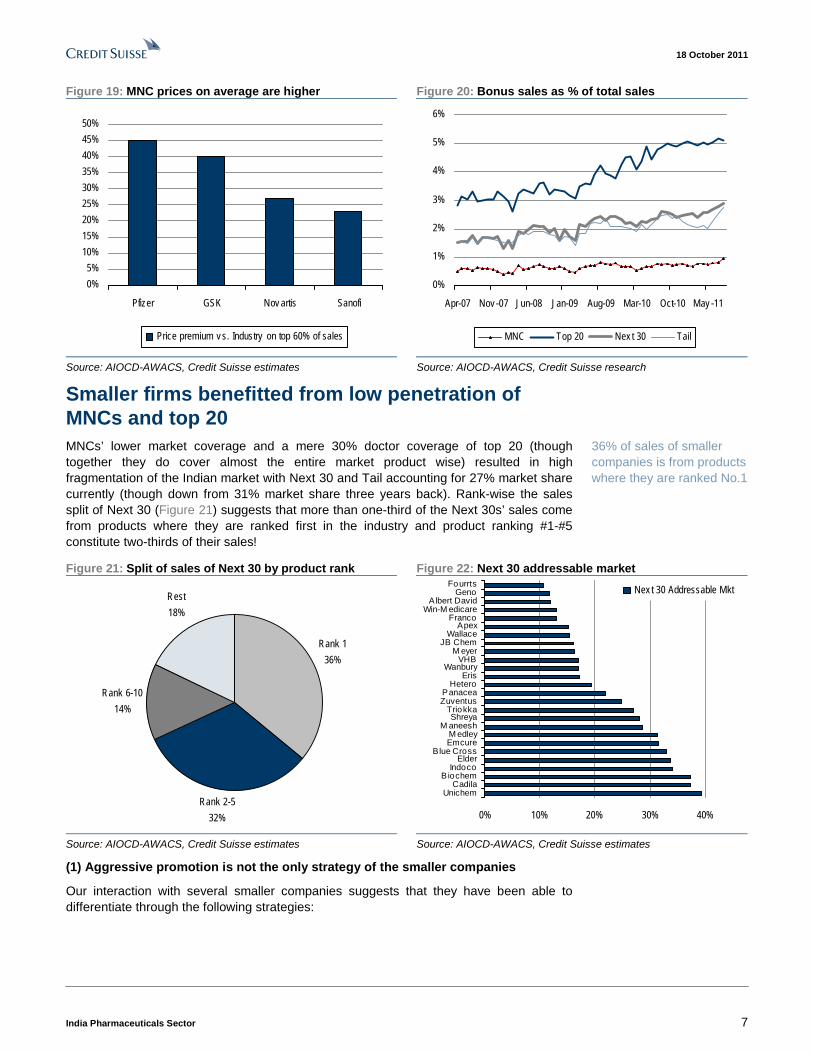
Smaller firms benefitted from low penetration of MNCs and top 20 MNCs’ lower market coverage and a mere 30% doctor coverage of top 20 (though together they do cover almost the entire market product wise) resulted in high fragmentation of the Indian market with Next 30 and Tail accounting for 27% market share currently (though down from 31% market share three years back). Rank-wise the sales split of Next 30 (Figure 21) suggests that more than one-third of the Next 30s’ sales come from products where they are ranked first in the industry and product ranking #1-#5 constitute two-thirds of their sales!
Figure 21: Split of sales of Next 30 by product rank Figure 22: Next 30 addressable market
Rank 1
36%
Rank 2-5
32%
Rank 6-10
14%
Rest
18%
0% 10% 20% 30% 40%
UnichemCadila
B iochemIndoco
ElderBlue Cross
EmcureM edley
M aneeshShreya
TriokkaZuventusPanacea
HeteroEris
WanburyVHB
M eyerJB Chem
WallaceApex
FrancoWin-M edicare
Albert DavidGeno
FourrtsNex t 30 Addressable Mkt
Source: AIOCD-AWACS, Credit Suisse estimates Source: AIOCD-AWACS, Credit Suisse estimates
(1) Aggressive promotion is not the only strategy of the smaller companies
Our interaction with several smaller companies suggests that they have been able to differentiate through the following strategies:
36% of sales of smaller companies is from products where they are ranked No.1
18 October 2011
India Pharmaceuticals Sector 8
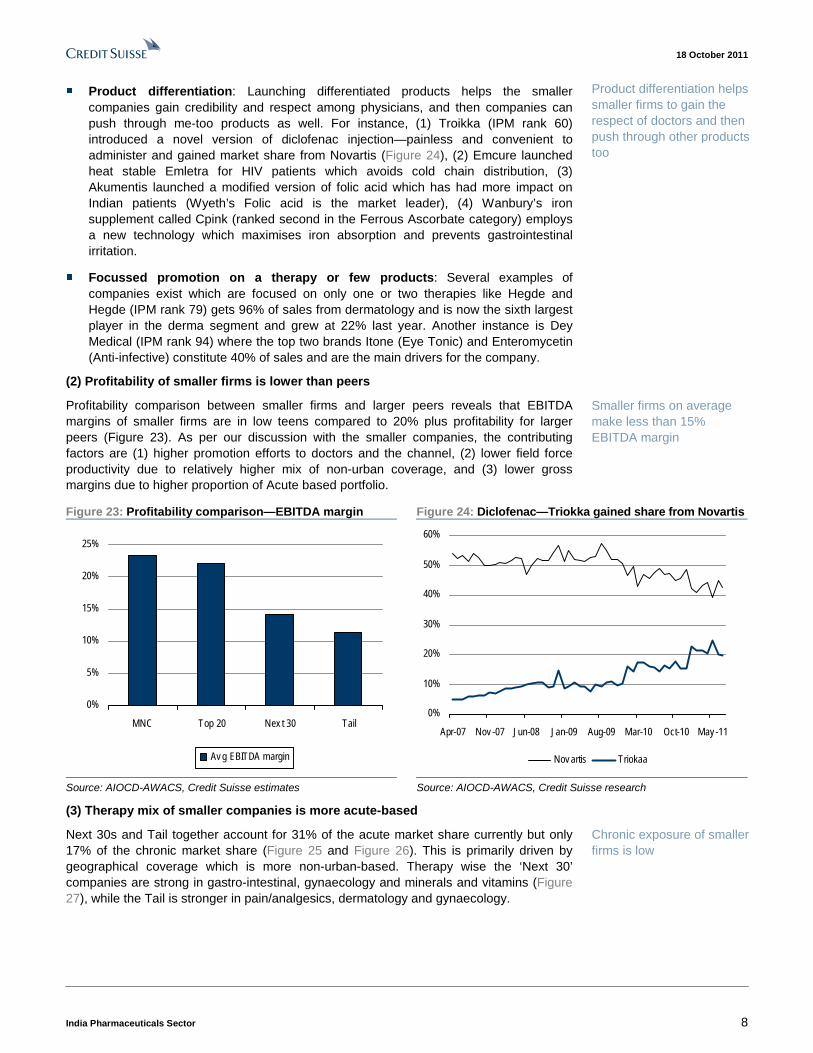
■ Product differentiation: Launching differentiated products helps the smaller companies gain credibility and respect among physicians, and then companies can push through me-too products as well. For instance, (1) Troikka (IPM rank 60) introduced a novel version of diclofenac injection—painless and convenient to administer and gained market share from Novartis (Figure 24), (2) Emcure launched heat stable Emletra for HIV patients which avoids cold chain distribution, (3) Akumentis launched a modified version of folic acid which has had more impact on Indian patients (Wyeth’s Folic acid is the market leader), (4) Wanbury’s iron supplement called Cpink (ranked second in the Ferrous Ascorbate category) employs a new technology which maximises iron absorption and prevents gastrointestinal irritation.
■ Focussed promotion on a therapy or few products: Several examples of companies exist which are focused on only one or two therapies like Hegde and Hegde (IPM rank 79) gets 96% of sales from dermatology and is now the sixth largest player in the derma segment and grew at 22% last year. Another instance is Dey Medical (IPM rank 94) where the top two brands Itone (Eye Tonic) and Enteromycetin (Anti-infective) constitute 40% of sales and are the main drivers for the company.
(2) Profitability of smaller firms is lower than peers
Profitability comparison between smaller firms and larger peers reveals that EBITDA margins of smaller firms are in low teens compared to 20% plus profitability for larger peers (Figure 23). As per our discussion with the smaller companies, the contributing factors are (1) higher promotion efforts to doctors and the channel, (2) lower field force productivity due to relatively higher mix of non-urban coverage, and (3) lower gross margins due to higher proportion of Acute based portfolio.
Figure 23: Profitability comparison—EBITDA margin Figure 24: Diclofenac—Triokka gained share from Novartis
0%
5%
10%
15%
20%
25%
MNC Top 20 Nex t 30 Tail
Av g EBITDA margin
0%
10%
20%
30%
40%
50%
60%
Apr-07 Nov -07 Jun-08 Jan-09 Aug-09 Mar-10 Oct-10 May -11
Nov artis Triokaa
Source: AIOCD-AWACS, Credit Suisse estimates Source: AIOCD-AWACS, Credit Suisse research
(3) Therapy mix of smaller companies is more acute-based
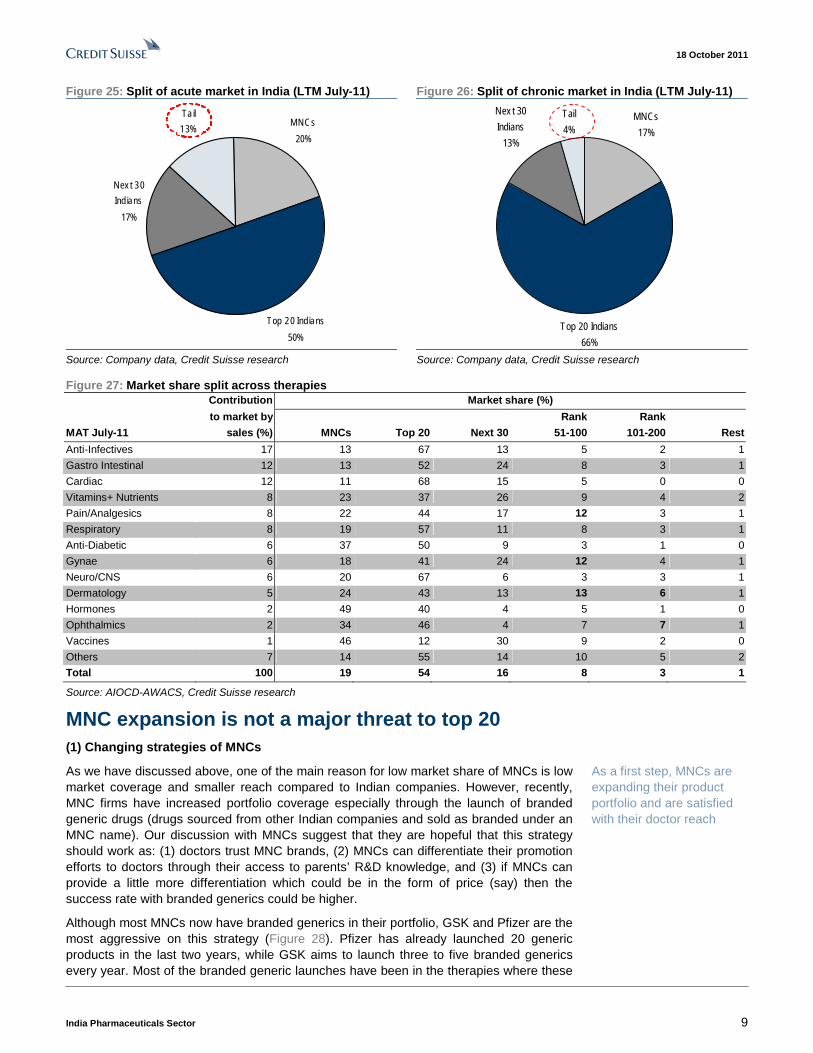
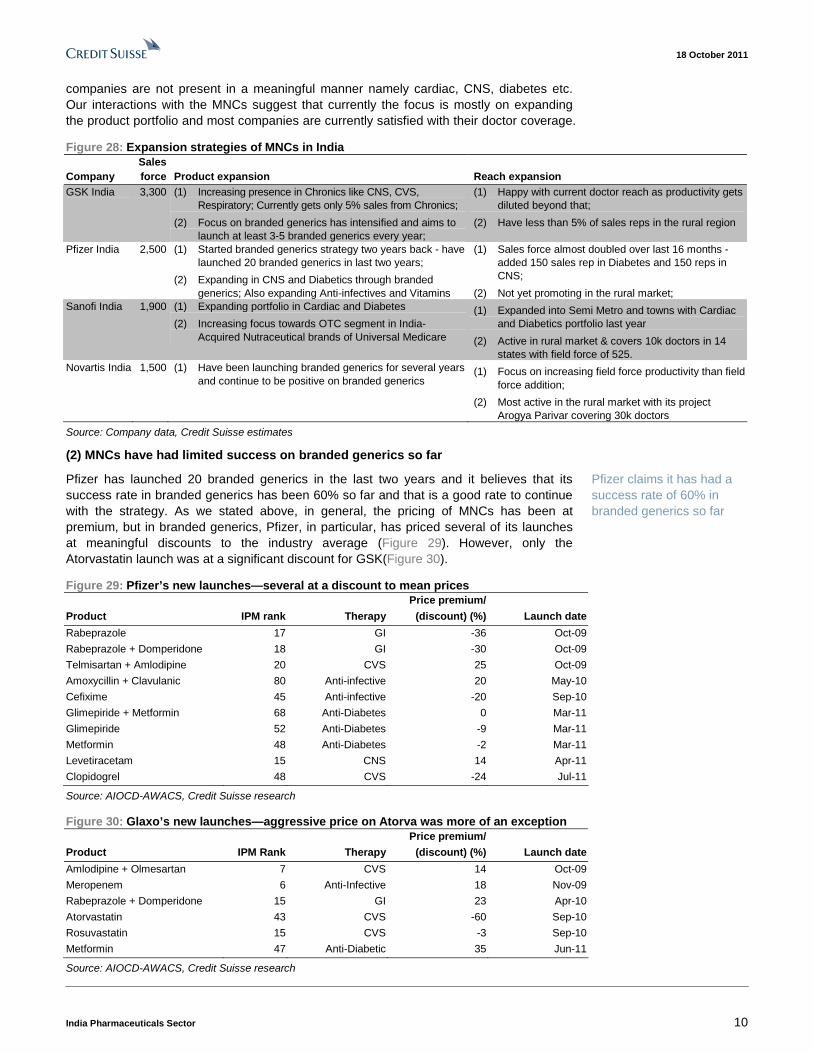
Next 30s and Tail together account for 31% of the acute market share currently but only 17% of the chronic market share (Figure 25 and Figure 26). This is primarily driven by geographical coverage which is more non-urban-based. Therapy wise the ‘Next 30’ companies are strong in gastro-intestinal, gynaecology and minerals and vitamins (Figure 27), while the Tail is stronger in pain/analgesics, dermatology and gynaecology.
Product differentiation helps smaller firms to gain the respect of doctors and then push through other products too
Smaller firms on average make less than 15% EBITDA margin
Chronic exposure of smaller firms is low
18 October 2011
India Pharmaceuticals Sector 9
Figure 25: Split of acute market in India (LTM July-11) Figure 26: Split of chronic market in India (LTM July-11)
MNCs
20%
Top 20 Ind ians
50%
Nex t 30
Ind ians
17%
Ta il
13%
MNCs
17%
Top 20 Indians
66%
Nex t 30
Indians
13%
Tail
4%
Source: Company data, Credit Suisse research Source: Company data, Credit Suisse research
Figure 27: Market share split across therapies Contribution Market share (%)
to market by Rank Rank
MAT July-11 sales (%) MNCs Top 20 Next 30 51-100 101-200 Rest
Anti-Infectives 17 13 67 13 5 2 1
Gastro Intestinal 12 13 52 24 8 3 1
Cardiac 12 11 68 15 5 0 0
Vitamins+ Nutrients 8 23 37 26 9 4 2
Pain/Analgesics 8 22 44 17 12 3 1
Respiratory 8 19 57 11 8 3 1
Anti-Diabetic 6 37 50 9 3 1 0
Gynae 6 18 41 24 12 4 1
Neuro/CNS 6 20 67 6 3 3 1
Dermatology 5 24 43 13 13 6 1
Hormones 2 49 40 4 5 1 0
Ophthalmics 2 34 46 4 7 7 1
Vaccines 1 46 12 30 9 2 0
Others 7 14 55 14 10 5 2
Total 100 19 54 16 8 3 1
Source: AIOCD-AWACS, Credit Suisse research
MNC expansion is not a major threat to top 20 (1) Changing strategies of MNCs
As we have discussed above, one of the main reason for low market share of MNCs is low market coverage and smaller reach compared to Indian companies. However, recently, MNC firms have increased portfolio coverage especially through the launch of branded generic drugs (drugs sourced from other Indian companies and sold as branded under an MNC name). Our discussion with MNCs suggest that they are hopeful that this strategy should work as: (1) doctors trust MNC brands, (2) MNCs can differentiate their promotion efforts to doctors through their access to parents’ R&D knowledge, and (3) if MNCs can provide a little more differentiation which could be in the form of price (say) then the success rate with branded generics could be higher.
Although most MNCs now have branded generics in their portfolio, GSK and Pfizer are the most aggressive on this strategy (Figure 28). Pfizer has already launched 20 generic products in the last two years, while GSK aims to launch three to five branded generics every year. Most of the branded generic launches have been in the therapies where these
As a first step, MNCs are expanding their product portfolio and are satisfied with their doctor reach
18 October 2011
India Pharmaceuticals Sector 10
companies are not present in a meaningful manner namely cardiac, CNS, diabetes etc. Our interactions with the MNCs suggest that currently the focus is mostly on expanding the product portfolio and most companies are currently satisfied with their doctor coverage.
Figure 28: Expansion strategies of MNCs in India Sales Company force Product expansion Reach expansion GSK India 3,300 (1) Increasing presence in Chronics like CNS, CVS,
Respiratory; Currently gets only 5% sales from Chronics;
(2) Focus on branded generics has intensified and aims to launch at least 3-5 branded generics every year;
(1) Happy with current doctor reach as productivity gets diluted beyond that;
(2) Have less than 5% of sales reps in the rural region
Pfizer India 2,500 (1) Started branded generics strategy two years back - have launched 20 branded generics in last two years;
(2) Expanding in CNS and Diabetics through branded generics; Also expanding Anti-infectives and Vitamins
(1) Sales force almost doubled over last 16 months - added 150 sales rep in Diabetes and 150 reps in CNS;
(2) Not yet promoting in the rural market; Sanofi India 1,900 (1) Expanding portfolio in Cardiac and Diabetes
(2) Increasing focus towards OTC segment in India- Acquired Nutraceutical brands of Universal Medicare
(1) Expanded into Semi Metro and towns with Cardiac and Diabetics portfolio last year
(2) Active in rural market & covers 10k doctors in 14 states with field force of 525.
Novartis India 1,500 (1) Have been launching branded generics for several years and continue to be positive on branded generics
(1) Focus on increasing field force productivity than field force addition;
(2) Most active in the rural market with its project Arogya Parivar covering 30k doctors
Source: Company data, Credit Suisse estimates
(2) MNCs have had limited success on branded generics so far
Pfizer has launched 20 branded generics in the last two years and it believes that its success rate in branded generics has been 60% so far and that is a good rate to continue with the strategy. As we stated above, in general, the pricing of MNCs has been at premium, but in branded generics, Pfizer, in particular, has priced several of its launches at meaningful discounts to the industry average (Figure 29). However, only the Atorvastatin launch was at a significant discount for GSK(Figure 30).
Figure 29: Pfizer’s new launches—several at a discount to mean prices Price premium/
Product IPM rank Therapy (discount) (%) Launch date
Rabeprazole 17 GI -36 Oct-09
Rabeprazole + Domperidone 18 GI -30 Oct-09
Telmisartan + Amlodipine 20 CVS 25 Oct-09
Amoxycillin + Clavulanic 80 Anti-infective 20 May-10
Cefixime 45 Anti-infective -20 Sep-10
Glimepiride + Metformin 68 Anti-Diabetes 0 Mar-11
Glimepiride 52 Anti-Diabetes -9 Mar-11
Metformin 48 Anti-Diabetes -2 Mar-11
Levetiracetam 15 CNS 14 Apr-11
Clopidogrel 48 CVS -24 Jul-11
Source: AIOCD-AWACS, Credit Suisse research
Figure 30: Glaxo’s new launches—aggressive price on Atorva was more of an exception Price premium/
Product IPM Rank Therapy (discount) (%) Launch date
Amlodipine + Olmesartan 7 CVS 14 Oct-09
Meropenem 6 Anti-Infective 18 Nov-09
Rabeprazole + Domperidone 15 GI 23 Apr-10
Atorvastatin 43 CVS -60 Sep-10
Rosuvastatin 15 CVS -3 Sep-10
Metformin 47 Anti-Diabetic 35 Jun-11
Source: AIOCD-AWACS, Credit Suisse research
Pfizer claims it has had a success rate of 60% in branded generics so far
18 October 2011
India Pharmaceuticals Sector 11
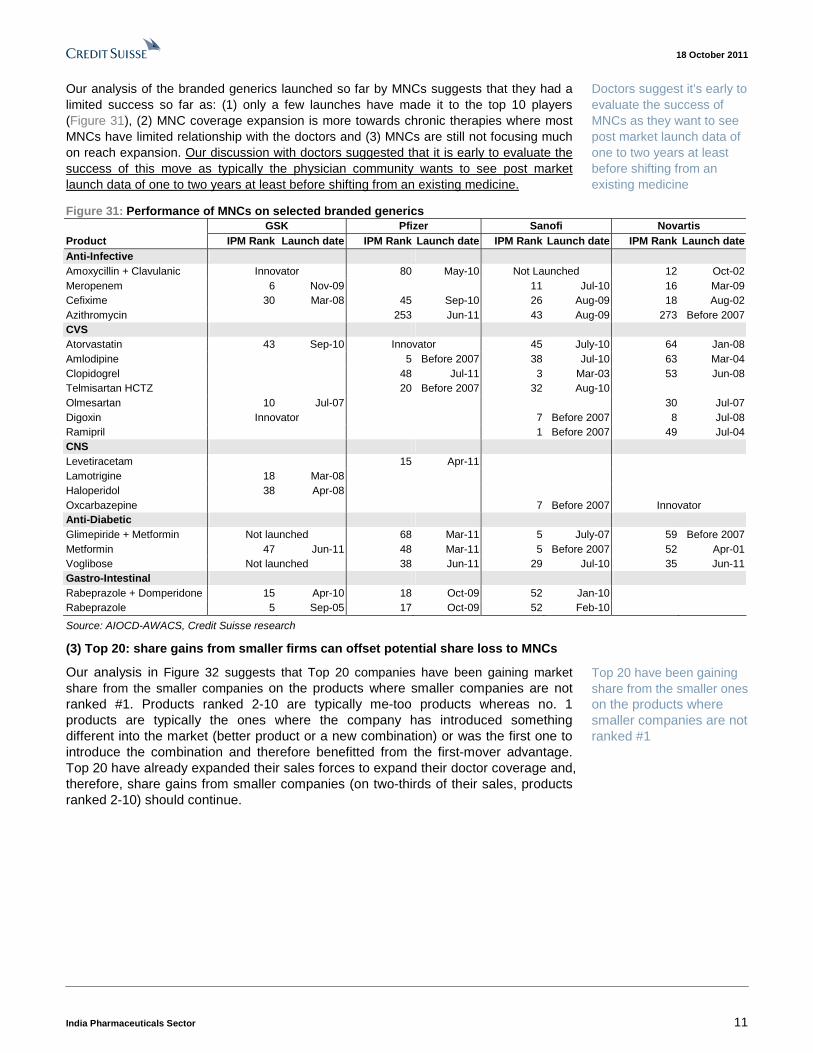
Our analysis of the branded generics launched so far by MNCs suggests that they had a limited success so far as: (1) only a few launches have made it to the top 10 players (Figure 31), (2) MNC coverage expansion is more towards chronic therapies where most MNCs have limited relationship with the doctors and (3) MNCs are still not focusing much on reach expansion. Our discussion with doctors suggested that it is early to evaluate the success of this move as typically the physician community wants to see post market launch data of one to two years at least before shifting from an existing medicine.
Figure 31: Performance of MNCs on selected branded generics GSK Pfizer Sanofi Novartis Product IPM Rank Launch date IPM Rank Launch date IPM Rank Launch date IPM Rank Launch date Anti-Infective Amoxycillin + Clavulanic Innovator 80 May-10 Not Launched 12 Oct-02 Meropenem 6 Nov-09 11 Jul-10 16 Mar-09 Cefixime 30 Mar-08 45 Sep-10 26 Aug-09 18 Aug-02 Azithromycin 253 Jun-11 43 Aug-09 273 Before 2007 CVS Atorvastatin 43 Sep-10 Innovator 45 July-10 64 Jan-08 Amlodipine 5 Before 2007 38 Jul-10 63 Mar-04 Clopidogrel 48 Jul-11 3 Mar-03 53 Jun-08 Telmisartan HCTZ 20 Before 2007 32 Aug-10 Olmesartan 10 Jul-07 30 Jul-07 Digoxin Innovator 7 Before 2007 8 Jul-08 Ramipril 1 Before 2007 49 Jul-04 CNS Levetiracetam 15 Apr-11 Lamotrigine 18 Mar-08 Haloperidol 38 Apr-08 Oxcarbazepine 7 Before 2007 Innovator Anti-Diabetic Glimepiride + Metformin Not launched 68 Mar-11 5 July-07 59 Before 2007 Metformin 47 Jun-11 48 Mar-11 5 Before 2007 52 Apr-01 Voglibose Not launched 38 Jun-11 29 Jul-10 35 Jun-11 Gastro-Intestinal Rabeprazole + Domperidone 15 Apr-10 18 Oct-09 52 Jan-10 Rabeprazole 5 Sep-05 17 Oct-09 52 Feb-10
Source: AIOCD-AWACS, Credit Suisse research
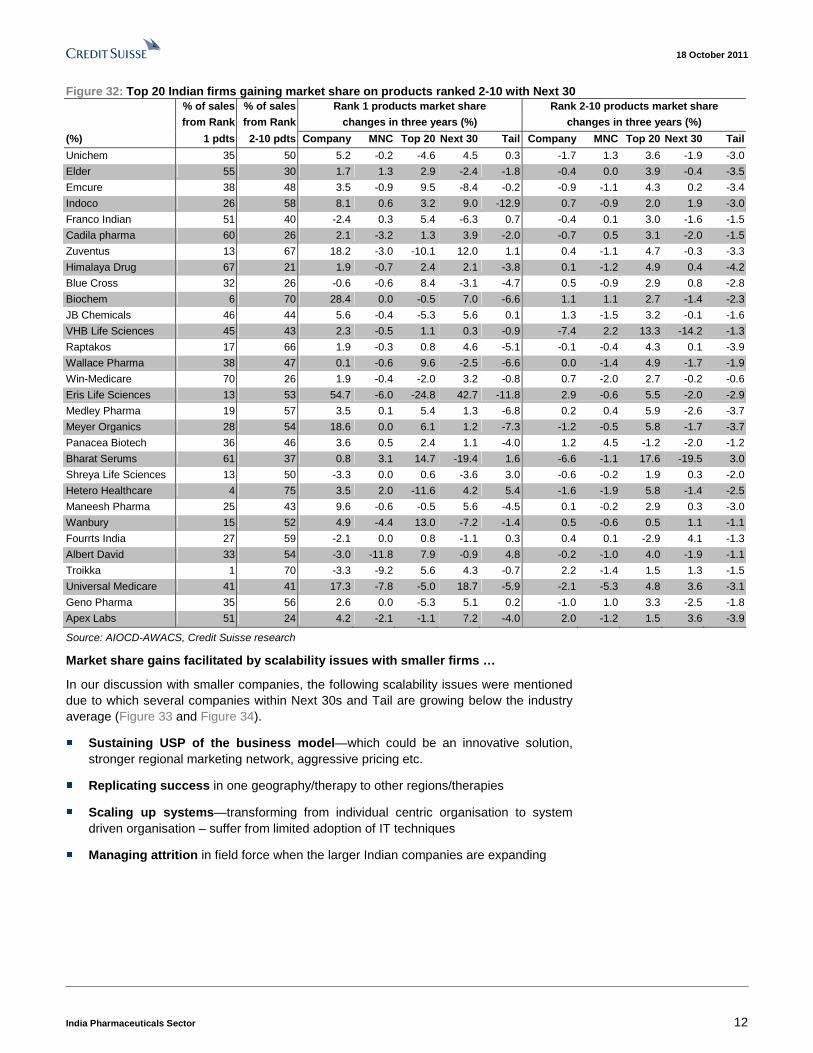
(3) Top 20: share gains from smaller firms can offset potential share loss to MNCs
Our analysis in Figure 32 suggests that Top 20 companies have been gaining market share from the smaller companies on the products where smaller companies are not ranked #1. Products ranked 2-10 are typically me-too products whereas no. 1 products are typically the ones where the company has introduced something different into the market (better product or a new combination) or was the first one to introduce the combination and therefore benefitted from the first-mover advantage. Top 20 have already expanded their sales forces to expand their doctor coverage and, therefore, share gains from smaller companies (on two-thirds of their sales, products ranked 2-10) should continue.
Doctors suggest it’s early to evaluate the success of MNCs as they want to see post market launch data of one to two years at least before shifting from an existing medicine
Top 20 have been gaining share from the smaller ones on the products where smaller companies are not ranked #1
18 October 2011
India Pharmaceuticals Sector 12
Figure 32: Top 20 Indian firms gaining market share on products ranked 2-10 with Next 30 % of sales % of sales Rank 1 products market share Rank 2-10 products market share
from Rank from Rank changes in three years (%) changes in three years (%)
(%) 1 pdts 2-10 pdts Company MNC Top 20 Next 30 Tail Company MNC Top 20 Next 30 Tail
Unichem 35 50 5.2 -0.2 -4.6 4.5 0.3 -1.7 1.3 3.6 -1.9 -3.0
Elder 55 30 1.7 1.3 2.9 -2.4 -1.8 -0.4 0.0 3.9 -0.4 -3.5
Emcure 38 48 3.5 -0.9 9.5 -8.4 -0.2 -0.9 -1.1 4.3 0.2 -3.4
Indoco 26 58 8.1 0.6 3.2 9.0 -12.9 0.7 -0.9 2.0 1.9 -3.0
Franco Indian 51 40 -2.4 0.3 5.4 -6.3 0.7 -0.4 0.1 3.0 -1.6 -1.5
Cadila pharma 60 26 2.1 -3.2 1.3 3.9 -2.0 -0.7 0.5 3.1 -2.0 -1.5
Zuventus 13 67 18.2 -3.0 -10.1 12.0 1.1 0.4 -1.1 4.7 -0.3 -3.3
Himalaya Drug 67 21 1.9 -0.7 2.4 2.1 -3.8 0.1 -1.2 4.9 0.4 -4.2
Blue Cross 32 26 -0.6 -0.6 8.4 -3.1 -4.7 0.5 -0.9 2.9 0.8 -2.8
Biochem 6 70 28.4 0.0 -0.5 7.0 -6.6 1.1 1.1 2.7 -1.4 -2.3
JB Chemicals 46 44 5.6 -0.4 -5.3 5.6 0.1 1.3 -1.5 3.2 -0.1 -1.6
VHB Life Sciences 45 43 2.3 -0.5 1.1 0.3 -0.9 -7.4 2.2 13.3 -14.2 -1.3
Raptakos 17 66 1.9 -0.3 0.8 4.6 -5.1 -0.1 -0.4 4.3 0.1 -3.9
Wallace Pharma 38 47 0.1 -0.6 9.6 -2.5 -6.6 0.0 -1.4 4.9 -1.7 -1.9
Win-Medicare 70 26 1.9 -0.4 -2.0 3.2 -0.8 0.7 -2.0 2.7 -0.2 -0.6
Eris Life Sciences 13 53 54.7 -6.0 -24.8 42.7 -11.8 2.9 -0.6 5.5 -2.0 -2.9
Medley Pharma 19 57 3.5 0.1 5.4 1.3 -6.8 0.2 0.4 5.9 -2.6 -3.7
Meyer Organics 28 54 18.6 0.0 6.1 1.2 -7.3 -1.2 -0.5 5.8 -1.7 -3.7
Panacea Biotech 36 46 3.6 0.5 2.4 1.1 -4.0 1.2 4.5 -1.2 -2.0 -1.2
Bharat Serums 61 37 0.8 3.1 14.7 -19.4 1.6 -6.6 -1.1 17.6 -19.5 3.0
Shreya Life Sciences 13 50 -3.3 0.0 0.6 -3.6 3.0 -0.6 -0.2 1.9 0.3 -2.0
Hetero Healthcare 4 75 3.5 2.0 -11.6 4.2 5.4 -1.6 -1.9 5.8 -1.4 -2.5
Maneesh Pharma 25 43 9.6 -0.6 -0.5 5.6 -4.5 0.1 -0.2 2.9 0.3 -3.0
Wanbury 15 52 4.9 -4.4 13.0 -7.2 -1.4 0.5 -0.6 0.5 1.1 -1.1
Fourrts India 27 59 -2.1 0.0 0.8 -1.1 0.3 0.4 0.1 -2.9 4.1 -1.3
Albert David 33 54 -3.0 -11.8 7.9 -0.9 4.8 -0.2 -1.0 4.0 -1.9 -1.1
Troikka 1 70 -3.3 -9.2 5.6 4.3 -0.7 2.2 -1.4 1.5 1.3 -1.5
Universal Medicare 41 41 17.3 -7.8 -5.0 18.7 -5.9 -2.1 -5.3 4.8 3.6 -3.1
Geno Pharma 35 56 2.6 0.0 -5.3 5.1 0.2 -1.0 1.0 3.3 -2.5 -1.8
Apex Labs 51 24 4.2 -2.1 -1.1 7.2 -4.0 2.0 -1.2 1.5 3.6 -3.9
Source: AIOCD-AWACS, Credit Suisse research
Market share gains facilitated by scalability issues with smaller firms …
In our discussion with smaller companies, the following scalability issues were mentioned due to which several companies within Next 30s and Tail are growing below the industry average (Figure 33 and Figure 34).
■ Sustaining USP of the business model—which could be an innovative solution, stronger regional marketing network, aggressive pricing etc.
■ Replicating success in one geography/therapy to other regions/therapies
■ Scaling up systems—transforming from individual centric organisation to system driven organisation – suffer from limited adoption of IT techniques
■ Managing attrition in field force when the larger Indian companies are expanding

18 October 2011
India Pharmaceuticals Sector 13
Figure 33: Next 30 and Tail growing below industry avg. Figure 34: Only few small companies growing above mkt
0%
2%
4%
6%
8%
10%
12%
14%
16%
18%
20%
IPM Top 20 MNC Nex t 30 Tail
3 y r CAGR LY grow th
0%
10%
20%
30%
40%
50%
60%
% of cos grow ing abov e mkt
grow th rate in 3 y r CAGR
% of cos grow ing abov e mkt
grow th rate last y ear
Nex t 30 Tail
Source: AIOCD-AWACS, Credit Suisse estimates Source: AIOCD-AWACS, Credit Suisse estimates
… however, success stories do exist
While cognizant of the scalability issues, several companies have been able to make it to Top 20 or are in the process (Figure 35). Mankind initially focused on non-urban markets with aggressive pricing and aggressive promotion and later was able to replicate its success in the urban markets too. Macleods enjoys a reputation of bringing differentiated products to the market while Eris life Sciences focused initially on cardiac and diabetes portfolio and now trying to replicate the success in rest of the therapies.
Figure 35: A glimpse of some success stories in Indian pharma IPM rank 2000 2001 2002 2003 2004 2005 2006 2007 2008 2009 2010 2011
Mankind 57 40 33 30 27 20 14 10 10 9 7
Macleods 58 42 35 30 27 24 24 23 21 21 17 12
Zuventus 272 286 258 123 73 51 41 35 33 34 34 32
ERIS Lifesciences 127 94 64 48
Source: ORG-IMS Health
18 October 2011
India Pharmaceuticals Sector 14
Price control—potential risk but timing and form uncertain The risk of expansion of drugs under price control has resurfaced after (1) the National List of Essential Medicines (NLEM) was updated in July-11 and (2) the Supreme Court recently asked the government to respond on expected timelines to control prices of Essential Medicines—the next hearing is set for 17 November 2011. In 2006, stocks had reacted sharply when it was proposed to bring the entire NLEM list under price control. When a medicine is brought under price control, its pricing is based on cost plus model thus impacting profitability and the incentive for the manufacturer to promote the drug.
In the past, criteria for selection of drugs under price control were based on sales and market share to prevent monopoly situations in the market. In our analysis, we considered those drugs under NLEM 2011 where size is more than Rs400 mn and market share of a single formulator is more than 10%. In terms of incremental sales under price control, Lupin should be the least impacted while GSK should be the most impacted due to almost 100% exposure to India.
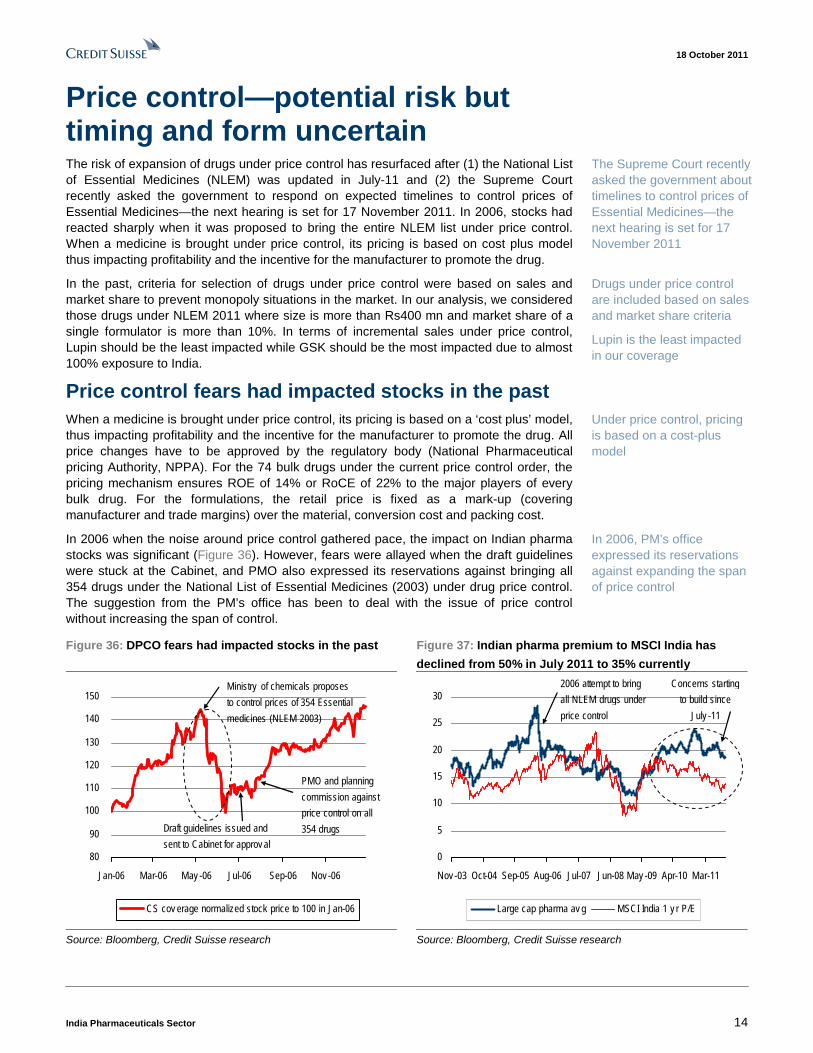
Price control fears had impacted stocks in the past When a medicine is brought under price control, its pricing is based on a ‘cost plus’ model, thus impacting profitability and the incentive for the manufacturer to promote the drug. All price changes have to be approved by the regulatory body (National Pharmaceutical pricing Authority, NPPA). For the 74 bulk drugs under the current price control order, the pricing mechanism ensures ROE of 14% or RoCE of 22% to the major players of every bulk drug. For the formulations, the retail price is fixed as a mark-up (covering manufacturer and trade margins) over the material, conversion cost and packing cost.
In 2006 when the noise around price control gathered pace, the impact on Indian pharma stocks was significant (Figure 36). However, fears were allayed when the draft guidelines were stuck at the Cabinet, and PMO also expressed its reservations against bringing all 354 drugs under the National List of Essential Medicines (2003) under drug price control. The suggestion from the PM’s office has been to deal with the issue of price control without increasing the span of control.
Figure 36: DPCO fears had impacted stocks in the past Figure 37: Indian pharma premium to MSCI India has
declined from 50% in July 2011 to 35% currently
80
90
100
110
120
130
140
150
Jan-06 Mar-06 May -06 Jul-06 Sep-06 Nov -06
CS cov erage normalized stock price to 100 in Jan-06
Ministry of chemicals proposes
to control prices of 354 Essential
medicines (NLEM 2003)
Draft guidelines issued and
sent to Cabinet for approv al
PMO and planning
commission against
price control on all
354 drugs
0
5
10
15
20
25
30
Nov -03 Oct-04 Sep-05 Aug-06 Jul-07 Jun-08 May -09 Apr-10 Mar-11
Large cap pharma av g MSCI India 1 y r P/E
2006 attempt to bring
all NLEM drugs under
price control
Concerns starting
to build since
July -11
Source: Bloomberg, Credit Suisse research Source: Bloomberg, Credit Suisse research
The Supreme Court recently asked the government about timelines to control prices of Essential Medicines—the next hearing is set for 17 November 2011
Drugs under price control are included based on sales and market share criteria
Lupin is the least impacted in our coverage
Under price control, pricing is based on a cost-plus model
In 2006, PM’s office expressed its reservations against expanding the span of price control
18 October 2011
India Pharmaceuticals Sector 15
Risk of expansion of drugs under price control has resurfaced after (1) the National List of Essential Medicines (NLEM) was updated in July-11 and (2) the Supreme Court asked the Ministry of Health on 11 October 2011 to respond within four weeks on expected timelines to control prices of Essential Medicines. The next hearing is scheduled on 17 November 2011. Indian pharma premium over the MSCI is already down from the peak of 50% in July 2011 to 35% currently (Figure 37).
Each successive DPCO in the past has stressed deregulation except one
Except for the last proposed DPCO in 2006, all the previous DPCOs had resulted in reducing bulk drugs under price control (Figure 38). Till 1987, prices of 347 drugs were controlled. In the first revision in 1987, price control on drugs was eased to be applicable to 142 drugs and then in the last revision in 1995 it came down to 74 drugs. This was further proposed to be reduced to just 30 drugs in 2002 but the Supreme Court also wanted life-saving drugs to be under price control. As a result, a National List of Essential Medicines (NLEM 2003) was constituted and had 354 drugs (of which 50 were under price control as in 1995 DPCO order).
During 2006, the draft guidelines suggested to include all 354 drugs under NLEM 2003 under price control. This would have expanded drugs under price control significantly from 74 drugs under the 1995 order to more than 354 drugs in 2006. However, as discussed above, this could not be implemented finally.
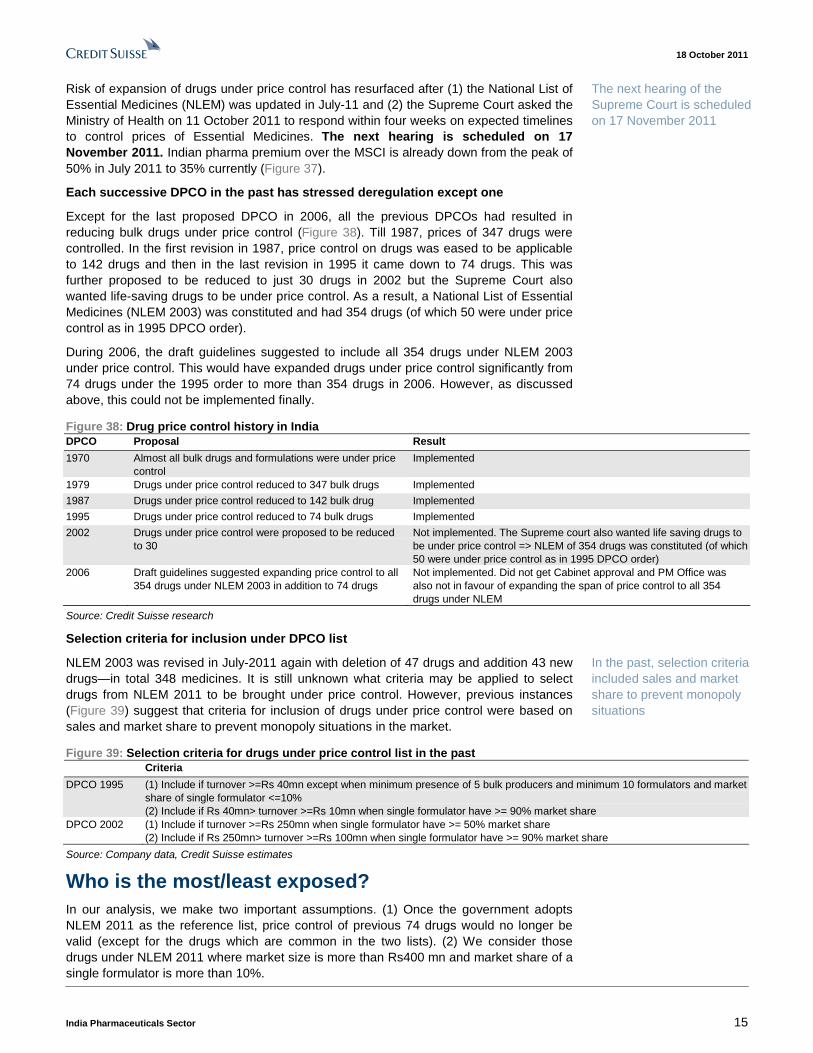
Figure 38: Drug price control history in India DPCO Proposal Result
1970 Almost all bulk drugs and formulations were under price control
Implemented
1979 Drugs under price control reduced to 347 bulk drugs Implemented
1987 Drugs under price control reduced to 142 bulk drug Implemented
1995 Drugs under price control reduced to 74 bulk drugs Implemented
2002 Drugs under price control were proposed to be reduced to 30
Not implemented. The Supreme court also wanted life saving drugs to be under price control => NLEM of 354 drugs was constituted (of which 50 were under price control as in 1995 DPCO order)
2006 Draft guidelines suggested expanding price control to all 354 drugs under NLEM 2003 in addition to 74 drugs
Not implemented. Did not get Cabinet approval and PM Office was also not in favour of expanding the span of price control to all 354 drugs under NLEM
Source: Credit Suisse research
Selection criteria for inclusion under DPCO list
NLEM 2003 was revised in July-2011 again with deletion of 47 drugs and addition 43 new drugs—in total 348 medicines. It is still unknown what criteria may be applied to select drugs from NLEM 2011 to be brought under price control. However, previous instances (Figure 39) suggest that criteria for inclusion of drugs under price control were based on sales and market share to prevent monopoly situations in the market.
Figure 39: Selection criteria for drugs under price control list in the past Criteria
DPCO 1995 (1) Include if turnover >=Rs 40mn except when minimum presence of 5 bulk producers and minimum 10 formulators and market share of single formulator <=10% (2) Include if Rs 40mn> turnover >=Rs 10mn when single formulator have >= 90% market share
DPCO 2002 (1) Include if turnover >=Rs 250mn when single formulator have >= 50% market share (2) Include if Rs 250mn> turnover >=Rs 100mn when single formulator have >= 90% market share
Source: Company data, Credit Suisse estimates
Who is the most/least exposed? In our analysis, we make two important assumptions. (1) Once the government adopts NLEM 2011 as the reference list, price control of previous 74 drugs would no longer be valid (except for the drugs which are common in the two lists). (2) We consider those drugs under NLEM 2011 where market size is more than Rs400 mn and market share of a single formulator is more than 10%.
The next hearing of the Supreme Court is scheduled on 17 November 2011
In the past, selection criteria included sales and market share to prevent monopoly situations
18 October 2011
India Pharmaceuticals Sector 16
Figure 40: GSK is most exposed and Lupin is the least Figure 41: Incremental impact on India sales from DPCO
0%
2%
4%
6%
8%
10%
12%
14%
16%G
SK
Cad
ila
Torre
nt
Cip
la
Ran
baxy Su
n
Red
dy's
Gle
nmar
k
Lupi
n
% of total incremental sales impacted by DPCO
0%
5%
10%
15%
20%
25%
30%
35%
40%
45%
GSK
Cad
ila
Torre
nt
Cip
la
Ran
baxy Su
n
Red
dy's
Gle
nmar
k
Lupi
n
Current India sales under DPCO Potential India sales under DPCO
Source: AIOCD-AWACS, Credit Suisse estimates Source: AIOCD-AWACS, Credit Suisse estimates
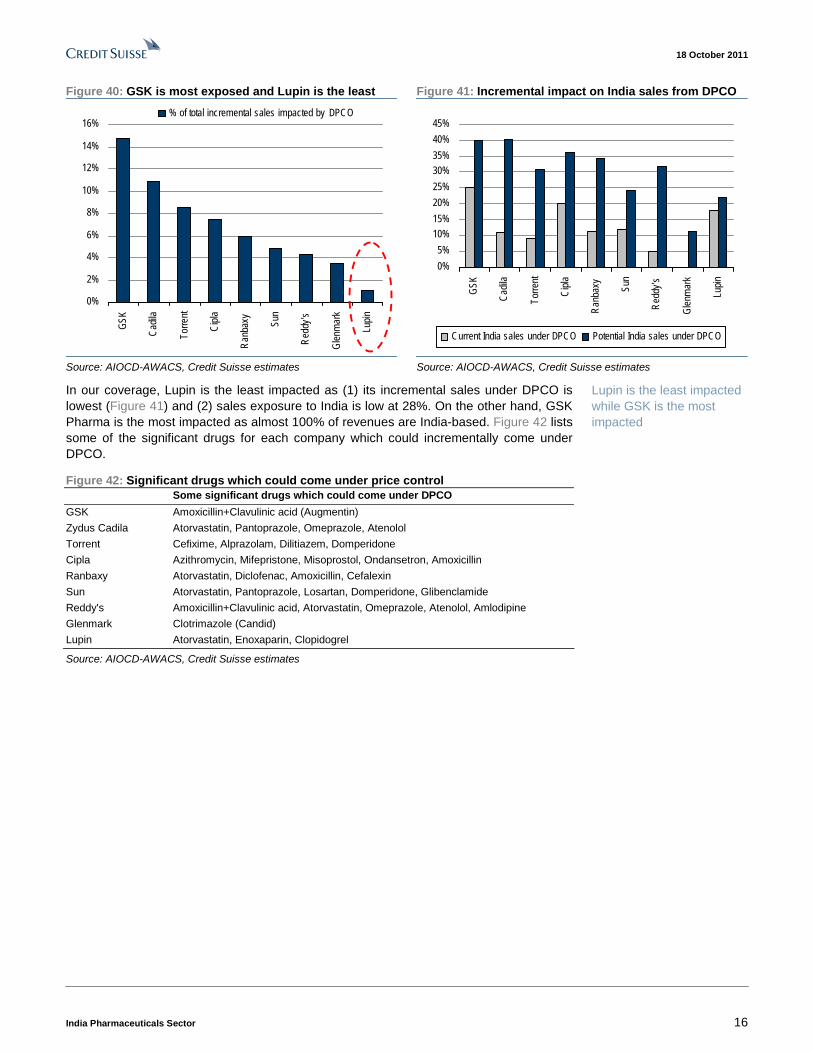
In our coverage, Lupin is the least impacted as (1) its incremental sales under DPCO is lowest (Figure 41) and (2) sales exposure to India is low at 28%. On the other hand, GSK Pharma is the most impacted as almost 100% of revenues are India-based. Figure 42 lists some of the significant drugs for each company which could incrementally come under DPCO.
Figure 42: Significant drugs which could come under price control Some significant drugs which could come under DPCO
GSK Amoxicillin+Clavulinic acid (Augmentin)
Zydus Cadila Atorvastatin, Pantoprazole, Omeprazole, Atenolol
Torrent Cefixime, Alprazolam, Dilitiazem, Domperidone
Cipla Azithromycin, Mifepristone, Misoprostol, Ondansetron, Amoxicillin
Ranbaxy Atorvastatin, Diclofenac, Amoxicillin, Cefalexin
Sun Atorvastatin, Pantoprazole, Losartan, Domperidone, Glibenclamide
Reddy's Amoxicillin+Clavulinic acid, Atorvastatin, Omeprazole, Atenolol, Amlodipine
Glenmark Clotrimazole (Candid)
Lupin Atorvastatin, Enoxaparin, Clopidogrel
Source: AIOCD-AWACS, Credit Suisse estimates
Lupin is the least impacted while GSK is the most impacted
18 October 2011
India Pharmaceuticals Sector 17
Stay with Lupin and Sun In our view, it is early to call for a de-rating of the sector, as both timing and form of price control is uncertain. The existing price control system has not been changed since 1995, as the last two attempts in 2002 and 2006 were unsuccessful. Also, MNCs are more focused on chronic therapies now where it takes time to convert specialists. Therefore, we continue to forecast growth of 18%-plus for Sun and Lupin. Between the two risks, DPCO is more severe and Lupin is best placed in our coverage with the lowest incremental impact. We also like Sun with an incremental 5% sales impact from DPCO but with a much stronger domestic presence and lower product concentration in the US. We change our coverage target price by -6% to 6% to factor in INR depreciation, a reduction in DEPB benefits, weak domestic growth for Cipla and Dr. Reddy’s, and lower margins for Glenmark.
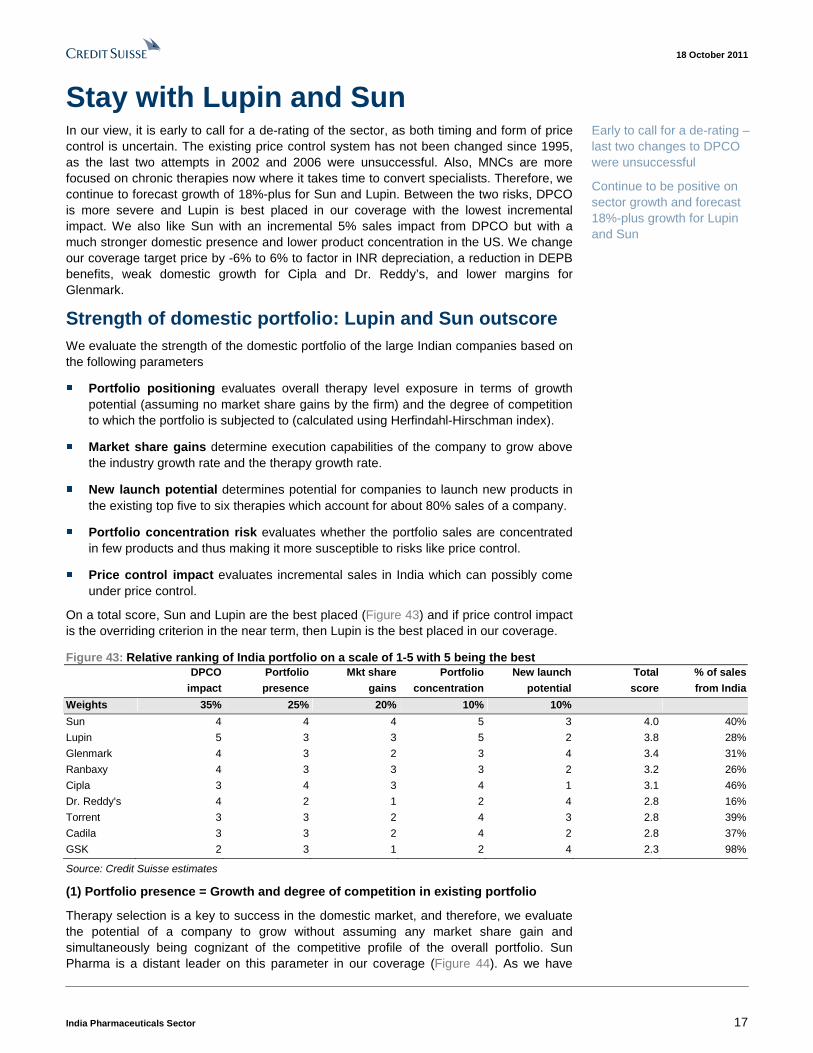
Strength of domestic portfolio: Lupin and Sun outscore We evaluate the strength of the domestic portfolio of the large Indian companies based on the following parameters
■ Portfolio positioning evaluates overall therapy level exposure in terms of growth potential (assuming no market share gains by the firm) and the degree of competition to which the portfolio is subjected to (calculated using Herfindahl-Hirschman index).
■ Market share gains determine execution capabilities of the company to grow above the industry growth rate and the therapy growth rate.
■ New launch potential determines potential for companies to launch new products in the existing top five to six therapies which account for about 80% sales of a company.
■ Portfolio concentration risk evaluates whether the portfolio sales are concentrated in few products and thus making it more susceptible to risks like price control.
■ Price control impact evaluates incremental sales in India which can possibly come under price control.
On a total score, Sun and Lupin are the best placed (Figure 43) and if price control impact is the overriding criterion in the near term, then Lupin is the best placed in our coverage.
Figure 43: Relative ranking of India portfolio on a scale of 1-5 with 5 being the best DPCO Portfolio Mkt share Portfolio New launch Total % of sales
impact presence gains concentration potential score from India
Weights 35% 25% 20% 10% 10%
Sun 4 4 4 5 3 4.0 40%
Lupin 5 3 3 5 2 3.8 28%
Glenmark 4 3 2 3 4 3.4 31%
Ranbaxy 4 3 3 3 2 3.2 26%
Cipla 3 4 3 4 1 3.1 46%
Dr. Reddy's 4 2 1 2 4 2.8 16%
Torrent 3 3 2 4 3 2.8 39%
Cadila 3 3 2 4 2 2.8 37%
GSK 2 3 1 2 4 2.3 98%
Source: Credit Suisse estimates
(1) Portfolio presence = Growth and degree of competition in existing portfolio
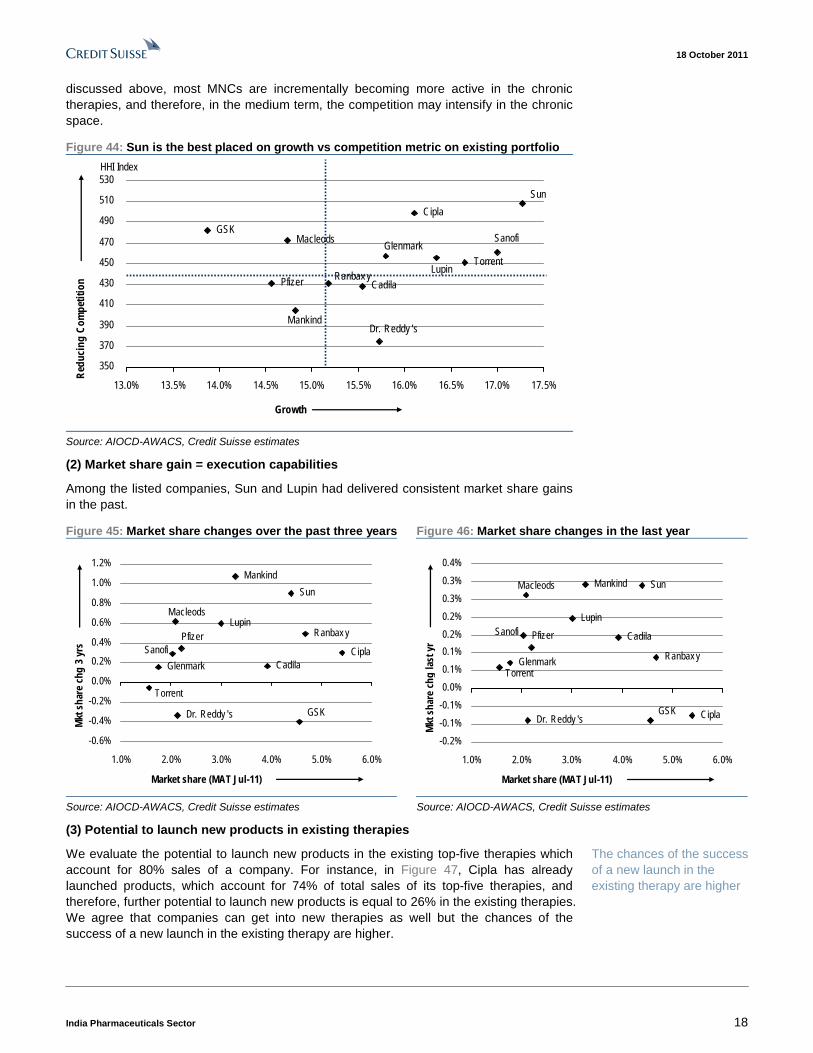
Therapy selection is a key to success in the domestic market, and therefore, we evaluate the potential of a company to grow without assuming any market share gain and simultaneously being cognizant of the competitive profile of the overall portfolio. Sun Pharma is a distant leader on this parameter in our coverage (Figure 44). As we have
Early to call for a de-rating – last two changes to DPCO were unsuccessful
Continue to be positive on sector growth and forecast 18%-plus growth for Lupin and Sun
18 October 2011
India Pharmaceuticals Sector 18
discussed above, most MNCs are incrementally becoming more active in the chronic therapies, and therefore, in the medium term, the competition may intensify in the chronic space.
Figure 44: Sun is the best placed on growth vs competition metric on existing portfolio
Macleods
Mankind
Sanofi
Pfizer
GSK
TorrentGlenmark
CadilaRanbax y
Lupin
Dr. Reddy 's
Cipla
Sun
350
370
390
410
430
450
470
490
510
530
13.0% 13.5% 14.0% 14.5% 15.0% 15.5% 16.0% 16.5% 17.0% 17.5%
Growth
Red
ucin
g C
ompe
titio
n
HHI Index
Source: AIOCD-AWACS, Credit Suisse estimates
(2) Market share gain = execution capabilities
Among the listed companies, Sun and Lupin had delivered consistent market share gains in the past.
Figure 45: Market share changes over the past three years Figure 46: Market share changes in the last year
Macleods
Mankind
SanofiPfizer
GSK
Torrent
Glenmark Cadila
Ranbax yLupin
Dr. Reddy 's
Cipla
Sun
-0.6%
-0.4%
-0.2%
0.0%
0.2%
0.4%
0.6%
0.8%
1.0%
1.2%
1.0% 2.0% 3.0% 4.0% 5.0% 6.0%
Market share (MAT Jul-11)
Mkt
sha
re c
hg 3
yrs
Sun
CiplaDr. Reddy 's
Lupin
Ranbax y
Cadila
GlenmarkTorrent
GSK
PfizerSanofi
MankindMacleods
-0.2%
-0.1%
-0.1%
0.0%
0.1%
0.1%
0.2%
0.2%
0.3%
0.3%
0.4%
1.0% 2.0% 3.0% 4.0% 5.0% 6.0%
Market share (MAT Jul-11)
Mkt
sha
re c
hg la
st y
r
Source: AIOCD-AWACS, Credit Suisse estimates Source: AIOCD-AWACS, Credit Suisse estimates
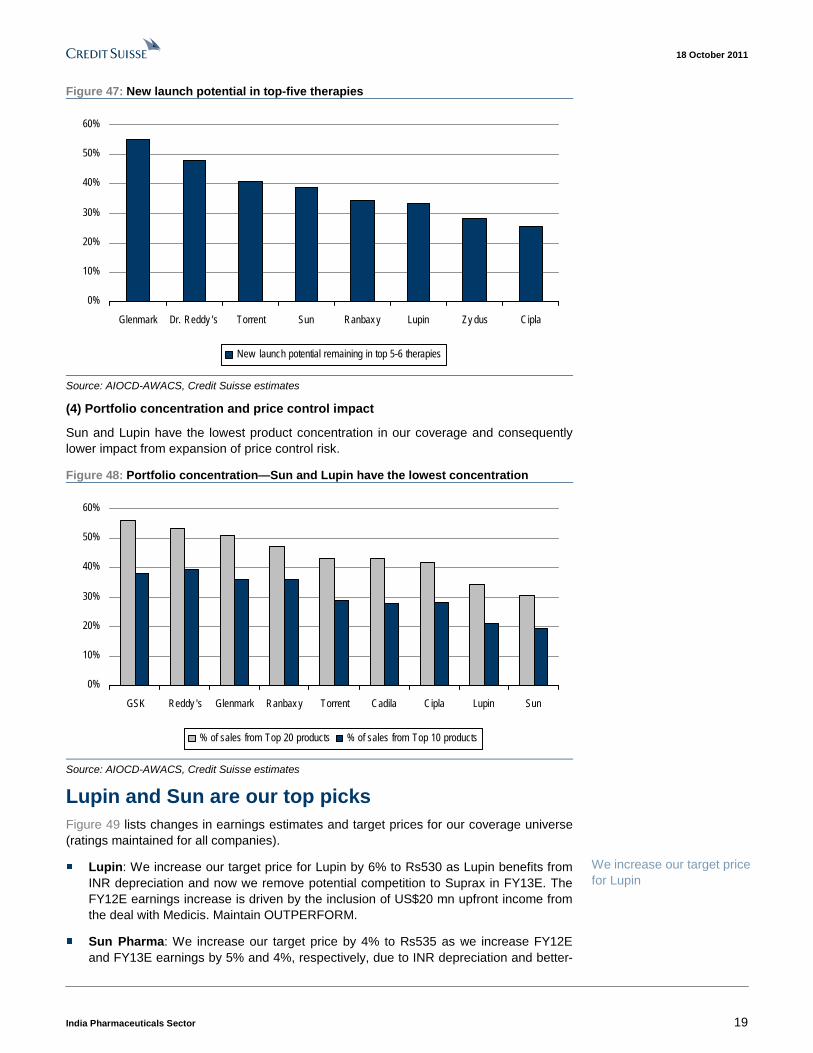
(3) Potential to launch new products in existing therapies
We evaluate the potential to launch new products in the existing top-five therapies which account for 80% sales of a company. For instance, in Figure 47, Cipla has already launched products, which account for 74% of total sales of its top-five therapies, and therefore, further potential to launch new products is equal to 26% in the existing therapies. We agree that companies can get into new therapies as well but the chances of the success of a new launch in the existing therapy are higher.
The chances of the success of a new launch in the existing therapy are higher
18 October 2011
India Pharmaceuticals Sector 19
Figure 47: New launch potential in top-five therapies
0%
10%
20%
30%
40%
50%
60%
Glenmark Dr. Reddy 's Torrent Sun Ranbax y Lupin Zy dus Cipla
New launch potential remaining in top 5-6 therapies
Source: AIOCD-AWACS, Credit Suisse estimates
(4) Portfolio concentration and price control impact
Sun and Lupin have the lowest product concentration in our coverage and consequently lower impact from expansion of price control risk.
Figure 48: Portfolio concentration—Sun and Lupin have the lowest concentration
0%
10%
20%
30%
40%
50%
60%
GSK Reddy 's Glenmark Ranbax y Torrent Cadila Cipla Lupin Sun
% of sales from Top 20 products % of sales from Top 10 products
Source: AIOCD-AWACS, Credit Suisse estimates
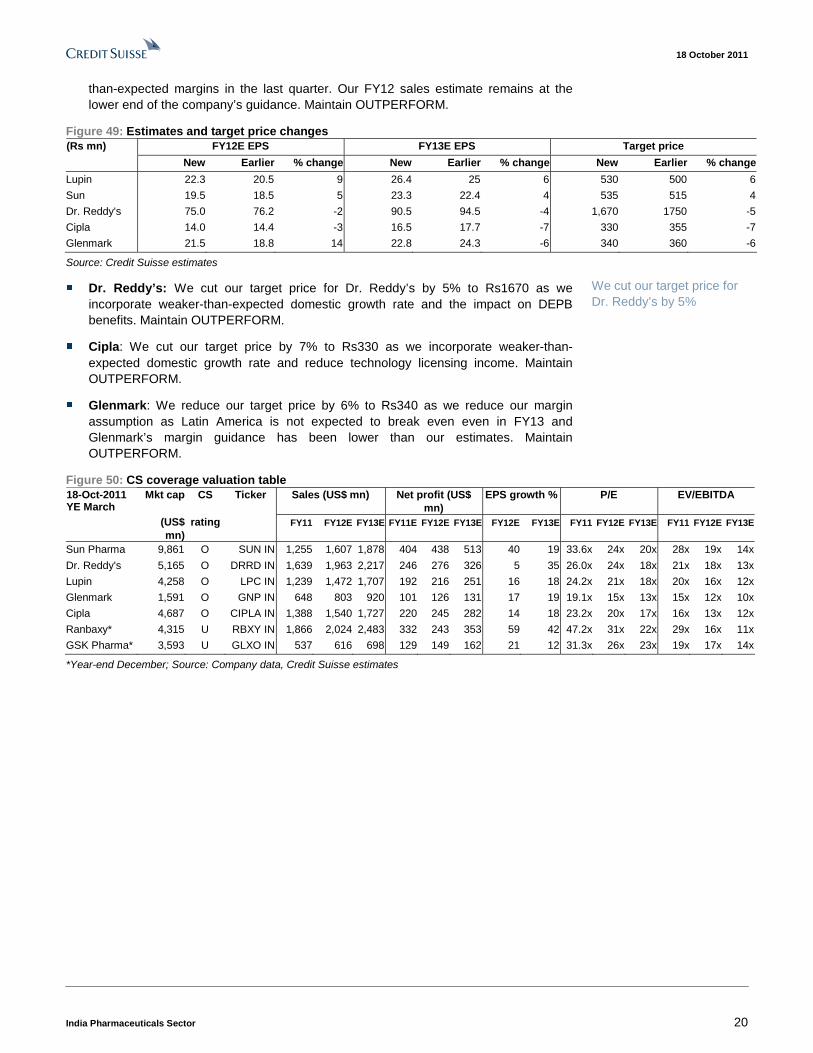
Lupin and Sun are our top picks Figure 49 lists changes in earnings estimates and target prices for our coverage universe (ratings maintained for all companies).
■ Lupin: We increase our target price for Lupin by 6% to Rs530 as Lupin benefits from INR depreciation and now we remove potential competition to Suprax in FY13E. The FY12E earnings increase is driven by the inclusion of US$20 mn upfront income from the deal with Medicis. Maintain OUTPERFORM.
■ Sun Pharma: We increase our target price by 4% to Rs535 as we increase FY12E and FY13E earnings by 5% and 4%, respectively, due to INR depreciation and better-
We increase our target price for Lupin
18 October 2011
India Pharmaceuticals Sector 20
than-expected margins in the last quarter. Our FY12 sales estimate remains at the lower end of the company’s guidance. Maintain OUTPERFORM.
Figure 49: Estimates and target price changes FY12E EPS FY13E EPS Target price (Rs mn)
New Earlier % change New Earlier % change New Earlier % change
Lupin 22.3 20.5 9 26.4 25 6 530 500 6
Sun 19.5 18.5 5 23.3 22.4 4 535 515 4
Dr. Reddy's 75.0 76.2 -2 90.5 94.5 -4 1,670 1750 -5
Cipla 14.0 14.4 -3 16.5 17.7 -7 330 355 -7
Glenmark 21.5 18.8 14 22.8 24.3 -6 340 360 -6
Source: Credit Suisse estimates
■ Dr. Reddy’s: We cut our target price for Dr. Reddy’s by 5% to Rs1670 as we incorporate weaker-than-expected domestic growth rate and the impact on DEPB benefits. Maintain OUTPERFORM.
■ Cipla: We cut our target price by 7% to Rs330 as we incorporate weaker-than-expected domestic growth rate and reduce technology licensing income. Maintain OUTPERFORM.
■ Glenmark: We reduce our target price by 6% to Rs340 as we reduce our margin assumption as Latin America is not expected to break even even in FY13 and Glenmark’s margin guidance has been lower than our estimates. Maintain OUTPERFORM.
Figure 50: CS coverage valuation table Mkt cap CS Ticker Sales (US$ mn) Net profit (US$
mn) EPS growth % P/E EV/EBITDA 18-Oct-2011
YE March (US$ mn)
rating FY11 FY12E FY13E FY11E FY12E FY13E FY12E FY13E FY11 FY12E FY13E FY11 FY12E FY13E
Sun Pharma 9,861 O SUN IN 1,255 1,607 1,878 404 438 513 40 19 33.6x 24x 20x 28x 19x 14x
Dr. Reddy's 5,165 O DRRD IN 1,639 1,963 2,217 246 276 326 5 35 26.0x 24x 18x 21x 18x 13x
Lupin 4,258 O LPC IN 1,239 1,472 1,707 192 216 251 16 18 24.2x 21x 18x 20x 16x 12x
Glenmark 1,591 O GNP IN 648 803 920 101 126 131 17 19 19.1x 15x 13x 15x 12x 10x
Cipla 4,687 O CIPLA IN 1,388 1,540 1,727 220 245 282 14 18 23.2x 20x 17x 16x 13x 12x
Ranbaxy* 4,315 U RBXY IN 1,866 2,024 2,483 332 243 353 59 42 47.2x 31x 22x 29x 16x 11x
GSK Pharma* 3,593 U GLXO IN 537 616 698 129 149 162 21 12 31.3x 26x 23x 19x 17x 14x
*Year-end December; Source: Company data, Credit Suisse estimates
We cut our target price for Dr. Reddy’s by 5%
18 October 2011
India Pharmaceuticals Sector 21
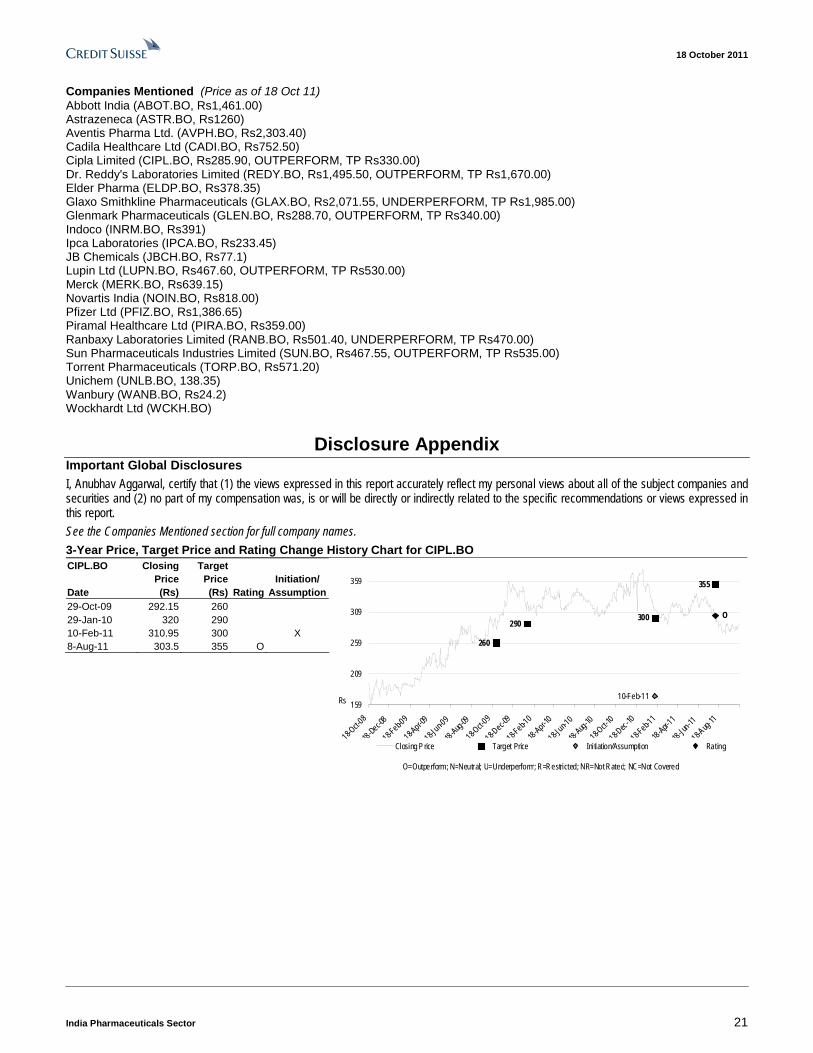
Companies Mentioned (Price as of 18 Oct 11) Abbott India (ABOT.BO, Rs1,461.00) Astrazeneca (ASTR.BO, Rs1260) Aventis Pharma Ltd. (AVPH.BO, Rs2,303.40) Cadila Healthcare Ltd (CADI.BO, Rs752.50) Cipla Limited (CIPL.BO, Rs285.90, OUTPERFORM, TP Rs330.00) Dr. Reddy's Laboratories Limited (REDY.BO, Rs1,495.50, OUTPERFORM, TP Rs1,670.00) Elder Pharma (ELDP.BO, Rs378.35) Glaxo Smithkline Pharmaceuticals (GLAX.BO, Rs2,071.55, UNDERPERFORM, TP Rs1,985.00) Glenmark Pharmaceuticals (GLEN.BO, Rs288.70, OUTPERFORM, TP Rs340.00) Indoco (INRM.BO, Rs391) Ipca Laboratories (IPCA.BO, Rs233.45) JB Chemicals (JBCH.BO, Rs77.1) Lupin Ltd (LUPN.BO, Rs467.60, OUTPERFORM, TP Rs530.00) Merck (MERK.BO, Rs639.15) Novartis India (NOIN.BO, Rs818.00) Pfizer Ltd (PFIZ.BO, Rs1,386.65) Piramal Healthcare Ltd (PIRA.BO, Rs359.00) Ranbaxy Laboratories Limited (RANB.BO, Rs501.40, UNDERPERFORM, TP Rs470.00) Sun Pharmaceuticals Industries Limited (SUN.BO, Rs467.55, OUTPERFORM, TP Rs535.00) Torrent Pharmaceuticals (TORP.BO, Rs571.20) Unichem (UNLB.BO, 138.35) Wanbury (WANB.BO, Rs24.2) Wockhardt Ltd (WCKH.BO)
Disclosure Appendix Important Global Disclosures I, Anubhav Aggarwal, certify that (1) the views expressed in this report accurately reflect my personal views about all of the subject companies and securities and (2) no part of my compensation was, is or will be directly or indirectly related to the specific recommendations or views expressed in this report.
See the Companies Mentioned section for full company names. 3-Year Price, Target Price and Rating Change History Chart for CIPL.BO CIPL.BO Closing
Price Target
Price
Initiation/ Date (Rs) (Rs) Rating Assumption 29-Oct-09 292.15 260 29-Jan-10 320 290 10-Feb-11 310.95 300 X 8-Aug-11 303.5 355 O 260
290300
355
10-Feb-11
O
159
209
259
309
359
18-Oct-
08
18-Dec-0
8
18-Feb-0
9
18-Apr-0
9
18-Jun-0
9
18-Aug
-09
18-Oct-
09
18-Dec
-09
18-Feb-1
0
18-Apr-1
0
18-Jun-1
0
18-Aug
-10
18-Oct-
10
18-Dec
-10
18-Feb
-11
18-Ap
r-11
18-Ju
n-11
18-Aug-
11
Closing Price Target Price Ini tiation/Assumption Rating
Rs
O=Outperform; N=Neutral; U=Underperform; R=Restricted; NR=Not Rated; NC=Not Covered
18 October 2011
India Pharmaceuticals Sector 22
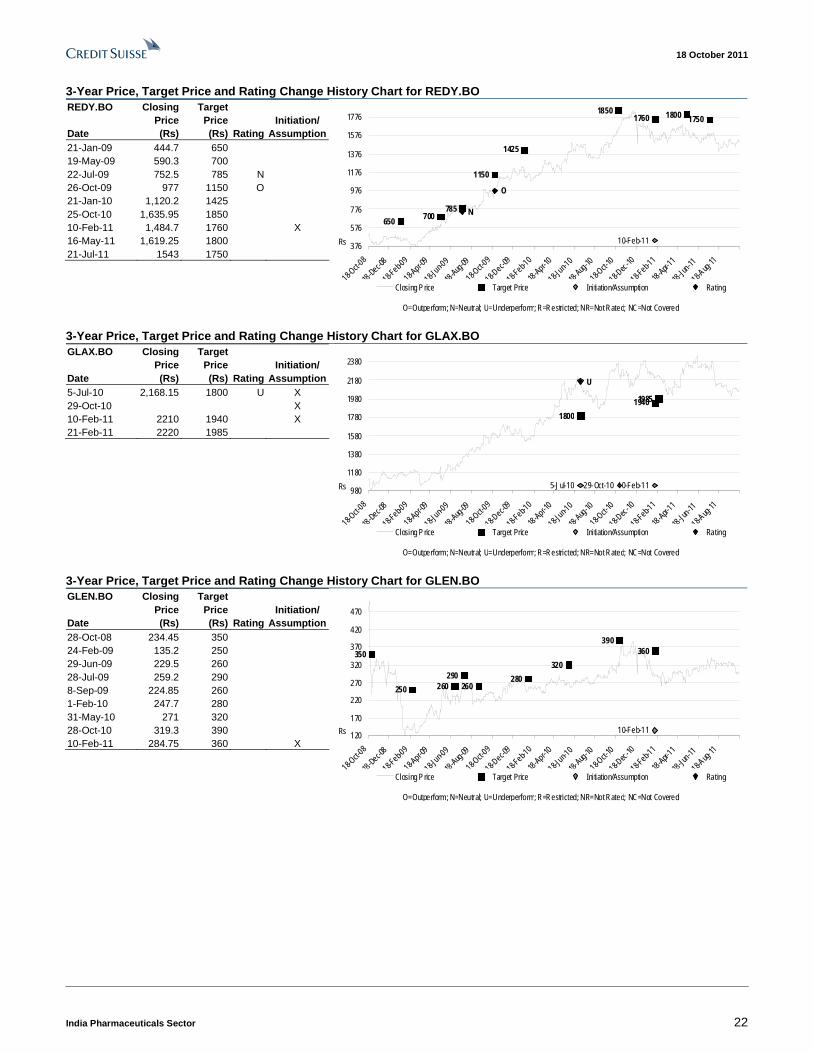
3-Year Price, Target Price and Rating Change History Chart for REDY.BO REDY.BO Closing
Price Target
Price
Initiation/ Date (Rs) (Rs) Rating Assumption 21-Jan-09 444.7 650 19-May-09 590.3 700 22-Jul-09 752.5 785 N 26-Oct-09 977 1150 O 21-Jan-10 1,120.2 1425 25-Oct-10 1,635.95 1850 10-Feb-11 1,484.7 1760 X 16-May-11 1,619.25 1800 21-Jul-11 1543 1750
650700
785
1150
1425
18501760 1800 1750
10-Feb-11
O
N
376
576
776
976
1176
1376
1576
1776
18-Oct-
08
18-Dec-0
8
18-Feb-0
9
18-Apr-0
9
18-Jun-0
9
18-Aug
-09
18-Oct-
09
18-Dec
-09
18-Feb-1
0
18-Apr-1
0
18-Jun-1
0
18-Aug
-10
18-Oct-
10
18-Dec
-10
18-Feb
-11
18-Ap
r-11
18-Ju
n-11
18-Aug-
11
Closing Price Target Price Ini tiation/Assumption Rating
Rs
O=Outperform; N=Neutral; U=Underperform; R=Restricted; NR=Not Rated; NC=Not Covered
3-Year Price, Target Price and Rating Change History Chart for GLAX.BO GLAX.BO Closing
Price Target
Price
Initiation/ Date (Rs) (Rs) Rating Assumption 5-Jul-10 2,168.15 1800 U X 29-Oct-10 X 10-Feb-11 2210 1940 X 21-Feb-11 2220 1985
1800
19401985
5-Jul-10 29-Oct-10 10-Feb-11
U
980
1180
1380
1580
1780
1980
2180
2380
18-Oct-
08
18-Dec-0
8
18-Feb-0
9
18-Apr-0
9
18-Jun-0
9
18-Aug
-09
18-Oct-
09
18-Dec
-09
18-Feb-1
0
18-Apr-1
0
18-Jun-1
0
18-Aug
-10
18-Oct-
10
18-Dec
-10
18-Feb
-11
18-Ap
r-11
18-Ju
n-11
18-Aug-
11
Closing Price Target Price Ini tiation/Assumption Rating
Rs
O=Outperform; N=Neutral; U=Underperform; R=Restricted; NR=Not Rated; NC=Not Covered
3-Year Price, Target Price and Rating Change History Chart for GLEN.BO GLEN.BO Closing
Price Target
Price
Initiation/ Date (Rs) (Rs) Rating Assumption 28-Oct-08 234.45 350 24-Feb-09 135.2 250 29-Jun-09 229.5 260 28-Jul-09 259.2 290 8-Sep-09 224.85 260 1-Feb-10 247.7 280 31-May-10 271 320 28-Oct-10 319.3 390 10-Feb-11 284.75 360 X
350
250 260290
260280
320
390360
10-Feb-11120
170
220
270
320
370
420
470
18-Oct-
08
18-Dec-0
8
18-Feb-0
9
18-Apr-0
9
18-Jun-0
9
18-Aug
-09
18-Oct-
09
18-Dec
-09
18-Feb-1
0
18-Apr-1
0
18-Jun-1
0
18-Aug
-10
18-Oct-
10
18-Dec
-10
18-Feb
-11
18-Ap
r-11
18-Ju
n-11
18-Aug-
11
Closing Price Target Price Ini tiation/Assumption Rating
Rs
O=Outperform; N=Neutral; U=Underperform; R=Restricted; NR=Not Rated; NC=Not Covered

18 October 2011
India Pharmaceuticals Sector 23
3-Year Price, Target Price and Rating Change History Chart for LUPN.BO LUPN.BO Closing
Price Target
Price
Initiation/ Date (Rs) (Rs) Rating Assumption 14-Nov-08 116.25 124 N 30-Jan-09 113.98 127 8-May-09 158 180 O 31-Jul-09 190.4 220 27-Oct-09 250.06 284 1-Feb-10 313.7 330 9-Feb-10 314 342 5-May-10 363.04 408 3-Nov-10 454 520 10-Feb-11 396 500 X 20-Apr-11 416.25 480 29-Jul-11 449.45 500
124 127
180
220
284
330342
408
520500
480500
10-Feb-11O
N107
157
207
257
307
357
407
457
507
18-Oct-
08
18-Dec-0
8
18-Feb-0
9
18-Apr-0
9
18-Jun-0
9
18-Aug
-09
18-Oct-
09
18-Dec
-09
18-Feb-1
0
18-Apr-1
0
18-Jun-1
0
18-Aug
-10
18-Oct-
10
18-Dec
-10
18-Feb
-11
18-Ap
r-11
18-Ju
n-11
18-Aug-
11
Closing Price Target Price Ini tiation/Assumption Rating
Rs
O=Outperform; N=Neutral; U=Underperform; R=Restricted; NR=Not Rated; NC=Not Covered
3-Year Price, Target Price and Rating Change History Chart for RANB.BO RANB.BO Closing
Price Target
Price
Initiation/ Date (Rs) (Rs) Rating Assumption 3-Nov-08 190.35 220 O 27-Apr-09 167.6 170 N 27-Jul-09 274.95 230 U 27-Oct-09 368 275 10-Feb-11 501.2 450 X 8-Aug-11 520.35 470 220
170
230
275
450470
10-Feb-11
U
NO
134
184
234
284
334
384
434
484
534
584
18-Oct-
08
18-Dec-0
8
18-Feb-0
9
18-Apr-0
9
18-Jun-0
9
18-Aug
-09
18-Oct-
09
18-Dec
-09
18-Feb-1
0
18-Apr-1
0
18-Jun-1
0
18-Aug
-10
18-Oct-
10
18-Dec
-10
18-Feb
-11
18-Ap
r-11
18-Ju
n-11
18-Aug-
11
Closing Price Target Price Ini tiation/Assumption Rating
Rs
O=Outperform; N=Neutral; U=Underperform; R=Restricted; NR=Not Rated; NC=Not Covered
3-Year Price, Target Price and Rating Change History Chart for SUN.BO SUN.BO Closing
Price Target
Price
Initiation/ Date (Rs) (Rs) Rating Assumption 1-Dec-08 214.4 274 O 2-Jun-09 245.94 284 29-Jun-09 220.07 250 30-Oct-09 276.33 N 1-Feb-10 301.51 266 25-May-10 317.8 304 10-Feb-11 420.4 425 X 25-May-11 437.4 515 O
274 284
250266
304
425
515
10-Feb-11
O
N
O194
244
294
344
394
444
494
18-Oct-
08
18-Dec-0
8
18-Feb-0
9
18-Apr-0
9
18-Jun-0
9
18-Aug
-09
18-Oct-
09
18-Dec
-09
18-Feb-1
0
18-Apr-1
0
18-Jun-1
0
18-Aug
-10
18-Oct-
10
18-Dec
-10
18-Feb
-11
18-Ap
r-11
18-Ju
n-11
18-Aug-
11
Closing Price Target Price Ini tiation/Assumption Rating
Rs
O=Outperform; N=Neutral; U=Underperform; R=Restricted; NR=Not Rated; NC=Not Covered
The analyst(s) responsible for preparing this research report received compensation that is based upon various factors including Credit Suisse's total revenues, a portion of which are generated by Credit Suisse's investment banking activities. Analysts’ stock ratings are defined as follows: Outperform (O): The stock’s total return is expected to outperform the relevant benchmark* by at least 10-15% (or more, depending on perceived risk) over the next 12 months. Neutral (N): The stock’s total return is expected to be in line with the relevant benchmark* (range of ±10-15%) over the next 12 months. Underperform (U): The stock’s total return is expected to underperform the relevant benchmark* by 10-15% or more over the next 12 months. *Relevant benchmark by region: As of 29th May 2009, Australia, New Zealand, U.S. and Canadian ratings are based on (1) a stock’s absolute total return potential to its current share price and (2) the relative attractiveness of a stock’s total return potential within an analyst’s coverage universe**, with Outperforms representing the most attractive, Neutrals the less attractive, and Underperforms the least attractive investment opportunities. Some U.S. and Canadian ratings may fall outside the absolute total return ranges defined above, depending on market conditions and industry
18 October 2011
India Pharmaceuticals Sector 24
factors. For Latin American, Japanese, and non-Japan Asia stocks, ratings are based on a stock’s total return relative to the average total return of the relevant country or regional benchmark; for European stocks, ratings are based on a stock’s total return relative to the analyst's coverage universe**. For Australian and New Zealand stocks, 12-month rolling yield is incorporated in the absolute total return calculation and a 15% and a 7.5% threshold replace the 10-15% level in the Outperform and Underperform stock rating definitions, respectively. The 15% and 7.5% thresholds replace the +10-15% and -10-15% levels in the Neutral stock rating definition, respectively. **An analyst's coverage universe consists of all companies covered by the analyst within the relevant sector. Restricted (R): In certain circumstances, Credit Suisse policy and/or applicable law and regulations preclude certain types of communications, including an investment recommendation, during the course of Credit Suisse's engagement in an investment banking transaction and in certain other circumstances. Volatility Indicator [V]: A stock is defined as volatile if the stock price has moved up or down by 20% or more in a month in at least 8 of the past 24 months or the analyst expects significant volatility going forward.
Analysts’ coverage universe weightings are distinct from analysts’ stock ratings and are based on the expected performance of an analyst’s coverage universe* versus the relevant broad market benchmark**: Overweight: Industry expected to outperform the relevant broad market benchmark over the next 12 months. Market Weight: Industry expected to perform in-line with the relevant broad market benchmark over the next 12 months. Underweight: Industry expected to underperform the relevant broad market benchmark over the next 12 months. *An analyst’s coverage universe consists of all companies covered by the analyst within the relevant sector. **The broad market benchmark is based on the expected return of the local market index (e.g., the S&P 500 in the U.S.) over the next 12 months. Credit Suisse’s distribution of stock ratings (and banking clients) is:
Global Ratings Distribution Outperform/Buy* 49% (61% banking clients) Neutral/Hold* 40% (56% banking clients) Underperform/Sell* 9% (53% banking clients) Restricted 2%
*For purposes of the NYSE and NASD ratings distribution disclosure requirements, our stock ratings of Outperform, Neutral, and Underperform most closely correspond to Buy, Hold, and Sell, respectively; however, the meanings are not the same, as our stock ratings are determined on a relative basis. (Please refer to definitions above.) An investor's decision to buy or sell a security should be based on investment objectives, current holdings, and other individual factors.
Credit Suisse’s policy is to update research reports as it deems appropriate, based on developments with the subject company, the sector or the market that may have a material impact on the research views or opinions stated herein.
Credit Suisse's policy is only to publish investment research that is impartial, independent, clear, fair and not misleading. For more detail please refer to Credit Suisse's Policies for Managing Conflicts of Interest in connection with Investment Research: http://www.csfb.com/research-and-analytics/disclaimer/managing_conflicts_disclaimer.html
Credit Suisse does not provide any tax advice. Any statement herein regarding any US federal tax is not intended or written to be used, and cannot be used, by any taxpayer for the purposes of avoiding any penalties.
See the Companies Mentioned section for full company names. Price Target: (12 months) for (CIPL.BO) Method: We use a 20x multiple on FY13E (Financial year 2013) earnings to arrive at a target price of Rs330. We value Cipla at our sector average multiple of 20x. Risks: In our view, there are three key risks to our Rs330 target price for Cipla. 1) Since CY03, Cipla has been involved in a lawsuit with the National Pharmaceutical Pricing Authority in India. If Cipla loses the lawsuit (the company believes it is likely to win), there could be downside on earnings. 2) slow ramp up in exports from Indore SEZ 3) delay in inhalers launch in Europe Price Target: (12 months) for (REDY.BO) Method: Our Target price for Dr. Reddy's is Rs1670. This is based on Rs 50/share present value from first to file products and rest Rs 1620/share from the base business. To value the base business, we use 20x price to Earning multiple (same as sector average) for financial year 2013 earnings. Risks: Risks to our Rs 1670 target price for Dr Reddy's include the following. Downside risks: 1) higher than expected price erosion in Germany on the contract business; 2) intensifying competition in Eastern Europe; 3) delay in launch of Fondaparinux; and 4) increase in Prevacid competition 5) Adverse result from US FDA inspection. Upside risks include 1) Contract research and manufacturing orders picking up beyong our assumption of 12% growth 2) Higher market share in the OTC launch of Allegra D24 and fexofenadine and 3) higher market share for Omeprazole OTC (more than 30%) Price Target: (12 months) for (GLAX.BO) Method: Our target price of Rs 1985/share for Glaxo SmithKline is based on 25x calender year 2011 estimates. Glaxo deserves to trade at premium to the Indian pharma sector as its product pipeline is supported by its parent, fixed investment is low, working capital is low and the company makes one of the highest margin in the Indian pharma industry. Therefore we value Glaxo at 20% premium to the sector which is average premium for the company. Risks: Upside risk to our target price of Rs 1985 include 1) Open offer or buy back announcement by the parent GSK.L 2) value accretive acquisition with the current cash of US$400mn 3) signing of multiple in-licensing deal which could increase product launch rate for Glaxo Downside risks in the business include 1) Vaccine prices drop sharply when an Indian company is able to launch their version. Several Indian companies are working on rotavirus vaccines (Glaxo's coressponding product is Rotarix) and therefore there would be downside to our estimates if
18 October 2011
India Pharmaceuticals Sector 25
that were to happen 2) Glaxo does not carry out its own R&D and is dependent on its parent pipeline and in-licensed deals. Growing partnerships between Indian doemstic pharma companies and multi national firms is a risk to in-licensing deals. Price Target: (12 months) for (GLEN.BO) Method: To calculate our Rs 360 target price for Glenmark Pharmaceuticals, we use sum-of-the-parts valuation, valuing base business at 18x financial year 2012 earnings (at 15% discount to sctor average) to arrive at Rs 336/share and value the first to file pipeline at Rs 24/share for our target price of Rs 360. We value Glenmark at a discount to the sector average due to low returns and high leverage compared to sector average. Risks: Downside risks to our Rs 360 target price for Glenmark pharmaceuticals include the following 1) Glenmarks aggressive targets for its US generics business can face some otherwise minor concerns on issues not under its direct control example delays in FDA approvals, a sharply slowing US market, or problems at any of their partners could derail the generics growth story 2) Glenmark's domestic market growth slowing down - till now it has been growing above the industry average and our target price expect that trend to continue 3) Most of the debt on the balance sheet is short term and therefore any liquidity tightening could make it difficult for Glenmark to roll over the debt. Upside risks to our target price are 1) increase in FDA approval rates 2) Significant recovery in Latin America 3) Potential deal in the research and development pipeline. We currently assign Zero Value to it. Price Target: (12 months) for (LUPN.BO) Method: Our Rs530 target price for Lupin is arrived at applying 20x price to earning multiple to Lupin's financial year 2013 earnings. The price to earning multiple used for Lupin is in line with sector average multiple. Risks: Downside Risks to our Rs530 target price for Lupin include: 1) slowdown in domestic sales growth; 2) slowdown in new product approvals in United States - we expect the company to get approvals for its ANDA filings in Oral Contraceptives in FY12 3) sharp decline in Suprax sales due to increasing competition 4) Higher than expected competiton in Lotrel and Oral Contraceptives leading to faster price erosion Price Target: (12 months) for (RANB.BO) Method: Our Target price for Ranbaxy is Rs470. This is based on Rs 105/share present value from first to file products and rest Rs 365/share from the base business. To value the base business, we use 20x price to Earning multiple for calender year 2012 earnings. Our target multiple for the base business is in line with the industry average. Risks: Upside Risk to our Rs470 target price for Ranbaxy are: 1) we are ascribing zero value to the NCE pipeline - if the company were to out-license in early stages, there could be upside to earnings, and 2) there are several Paragraph IV challenges under litigation - any success on those could provide a positive surprise 3) resolution of US FDA import ban earlier than our expectation Price Target: (12 months) for (SUN.BO) Method: Our Target price for Sun is Rs535. This is based at 23x earning financial year 2013, at 15% premium to sector average due to superior return and strong balance sheet. Sun pharma has traded at a premium of 15% to large cap pharma peers over the last six years. Risks: Downside risks to our Rs535 target price for Sun Pharmaceuticals include the following: 1) potential penalties on pantoprazole litigation 2) Significant downward revision to Taro's CY10 audited financials 3) higher than expected price erosion on taxotere 4) competition becoming more intense in the chronic segment in India and 5) expensive acquisition with the use of cash Please refer to the firm's disclosure website at www.credit-suisse.com/researchdisclosures for the definitions of abbreviations typically used in the target price method and risk sections.
See the Companies Mentioned section for full company names. The subject company (CIPL.BO, GLAX.BO, GLEN.BO, LUPN.BO) currently is, or was during the 12-month period preceding the date of distribution of this report, a client of Credit Suisse. Credit Suisse provided investment banking services to the subject company (CIPL.BO, GLAX.BO, GLEN.BO, LUPN.BO) within the past 12 months. Credit Suisse provided non-investment banking services, which may include Sales and Trading services, to the subject company (GLAX.BO) within the past 12 months. Credit Suisse has received investment banking related compensation from the subject company (GLAX.BO) within the past 12 months. Credit Suisse expects to receive or intends to seek investment banking related compensation from the subject company (CIPL.BO, REDY.BO, GLAX.BO, GLEN.BO, LUPN.BO, RANB.BO) within the next 3 months. Credit Suisse has received compensation for products and services other than investment banking services from the subject company (GLAX.BO) within the past 12 months. Important Regional Disclosures Singapore recipients should contact a Singapore financial adviser for any matters arising from this research report.
The analyst(s) involved in the preparation of this report have not visited the material operations of the subject company (CIPL.BO, REDY.BO, GLAX.BO, GLEN.BO, LUPN.BO, RANB.BO, SUN.BO) within the past 12 months.
Restrictions on certain Canadian securities are indicated by the following abbreviations: NVS--Non-Voting shares; RVS--Restricted Voting Shares; SVS--Subordinate Voting Shares. Individuals receiving this report from a Canadian investment dealer that is not affiliated with Credit Suisse should be advised that this report may not contain regulatory disclosures the non-affiliated Canadian investment dealer would be required to make if this were its own report. For Credit Suisse Securities (Canada), Inc.'s policies and procedures regarding the dissemination of equity research, please visit http://www.csfb.com/legal_terms/canada_research_policy.shtml.
As of the date of this report, Credit Suisse acts as a market maker or liquidity provider in the equities securities that are the subject of this report.
Principal is not guaranteed in the case of equities because equity prices are variable. Commission is the commission rate or the amount agreed with a customer when setting up an account or at anytime after that.
18 October 2011
India Pharmaceuticals Sector 26
Taiwanese Disclosures: Reports written by Taiwan-based analysts on non-Taiwan listed companies are not considered recommendations to buy or sell securities under Taiwan Stock Exchange Operational Regulations Governing Securities Firms Recommending Trades in Securities to Customers.
To the extent this is a report authored in whole or in part by a non-U.S. analyst and is made available in the U.S., the following are important disclosures regarding any non-U.S. analyst contributors: The non-U.S. research analysts listed below (if any) are not registered/qualified as research analysts with FINRA. The non-U.S. research analysts listed below may not be associated persons of CSSU and therefore may not be subject to the NASD Rule 2711 and NYSE Rule 472 restrictions on communications with a subject company, public appearances and trading securities held by a research analyst account. • Anubhav Aggarwal, non-U.S. analyst, is a research analyst employed by Credit Suisse Securities (India) Private Limited. For Credit Suisse disclosure information on other companies mentioned in this report, please visit the website at www.credit-suisse.com/researchdisclosures or call +1 (877) 291-2683. Disclaimers continue on next page.
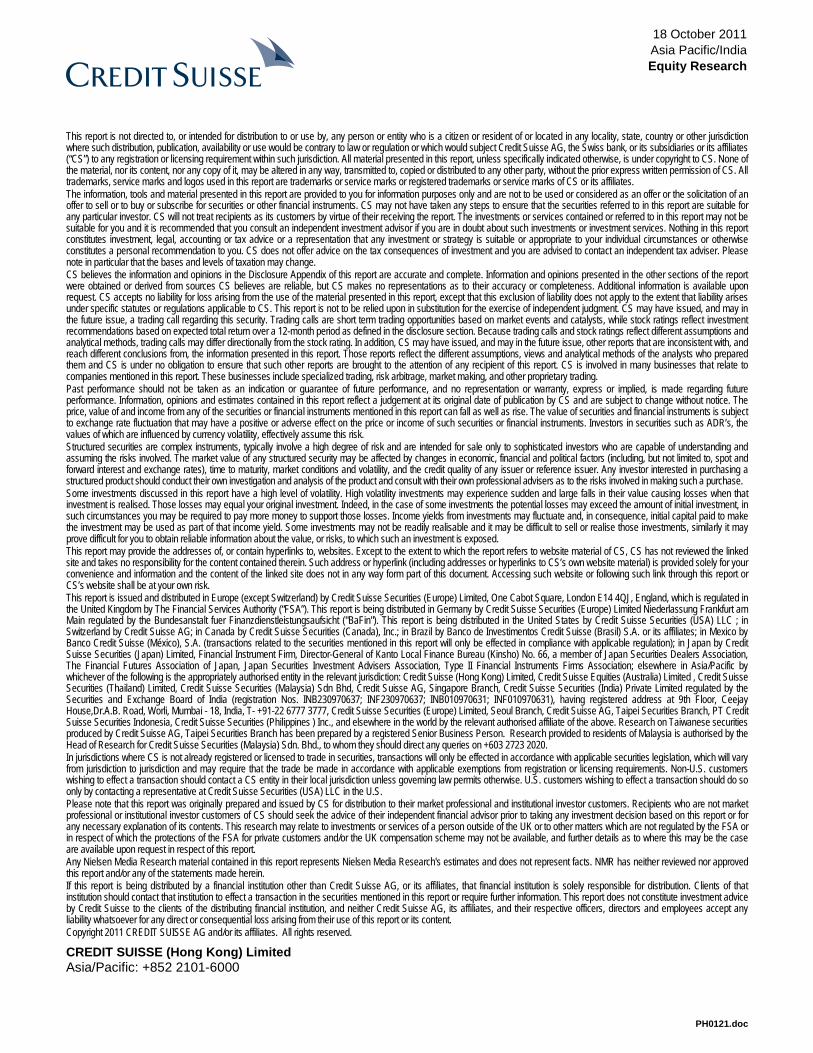
18 October 2011 Asia Pacific/India Equity Research
PH0121.doc
This report is not directed to, or intended for distribution to or use by, any person or entity who is a citizen or resident of or located in any locality, state, country or other jurisdiction where such distribution, publication, availability or use would be contrary to law or regulation or which would subject Credit Suisse AG, the Swiss bank, or its subsidiaries or its affiliates (“CS”) to any registration or licensing requirement within such jurisdiction. All material presented in this report, unless specifically indicated otherwise, is under copyright to CS. None of the material, nor its content, nor any copy of it, may be altered in any way, transmitted to, copied or distributed to any other party, without the prior express written permission of CS. All trademarks, service marks and logos used in this report are trademarks or service marks or registered trademarks or service marks of CS or its affiliates. The information, tools and material presented in this report are provided to you for information purposes only and are not to be used or considered as an offer or the solicitation of an offer to sell or to buy or subscribe for securities or other financial instruments. CS may not have taken any steps to ensure that the securities referred to in this report are suitable for any particular investor. CS will not treat recipients as its customers by virtue of their receiving the report. The investments or services contained or referred to in this report may not be suitable for you and it is recommended that you consult an independent investment advisor if you are in doubt about such investments or investment services. Nothing in this report constitutes investment, legal, accounting or tax advice or a representation that any investment or strategy is suitable or appropriate to your individual circumstances or otherwise constitutes a personal recommendation to you. CS does not offer advice on the tax consequences of investment and you are advised to contact an independent tax adviser. Please note in particular that the bases and levels of taxation may change. CS believes the information and opinions in the Disclosure Appendix of this report are accurate and complete. Information and opinions presented in the other sections of the report were obtained or derived from sources CS believes are reliable, but CS makes no representations as to their accuracy or completeness. Additional information is available upon request. CS accepts no liability for loss arising from the use of the material presented in this report, except that this exclusion of liability does not apply to the extent that liability arises under specific statutes or regulations applicable to CS. This report is not to be relied upon in substitution for the exercise of independent judgment. CS may have issued, and may in the future issue, a trading call regarding this security. Trading calls are short term trading opportunities based on market events and catalysts, while stock ratings reflect investment recommendations based on expected total return over a 12-month period as defined in the disclosure section. Because trading calls and stock ratings reflect different assumptions and analytical methods, trading calls may differ directionally from the stock rating. In addition, CS may have issued, and may in the future issue, other reports that are inconsistent with, and reach different conclusions from, the information presented in this report. Those reports reflect the different assumptions, views and analytical methods of the analysts who prepared them and CS is under no obligation to ensure that such other reports are brought to the attention of any recipient of this report. CS is involved in many businesses that relate to companies mentioned in this report. These businesses include specialized trading, risk arbitrage, market making, and other proprietary trading. Past performance should not be taken as an indication or guarantee of future performance, and no representation or warranty, express or implied, is made regarding future performance. Information, opinions and estimates contained in this report reflect a judgement at its original date of publication by CS and are subject to change without notice. The price, value of and income from any of the securities or financial instruments mentioned in this report can fall as well as rise. The value of securities and financial instruments is subject to exchange rate fluctuation that may have a positive or adverse effect on the price or income of such securities or financial instruments. Investors in securities such as ADR’s, the values of which are influenced by currency volatility, effectively assume this risk. Structured securities are complex instruments, typically involve a high degree of risk and are intended for sale only to sophisticated investors who are capable of understanding and assuming the risks involved. The market value of any structured security may be affected by changes in economic, financial and political factors (including, but not limited to, spot and forward interest and exchange rates), time to maturity, market conditions and volatility, and the credit quality of any issuer or reference issuer. Any investor interested in purchasing a structured product should conduct their own investigation and analysis of the product and consult with their own professional advisers as to the risks involved in making such a purchase. Some investments discussed in this report have a high level of volatility. High volatility investments may experience sudden and large falls in their value causing losses when that investment is realised. Those losses may equal your original investment. Indeed, in the case of some investments the potential losses may exceed the amount of initial investment, in such circumstances you may be required to pay more money to support those losses. Income yields from investments may fluctuate and, in consequence, initial capital paid to make the investment may be used as part of that income yield. Some investments may not be readily realisable and it may be difficult to sell or realise those investments, similarly it may prove difficult for you to obtain reliable information about the value, or risks, to which such an investment is exposed. This report may provide the addresses of, or contain hyperlinks to, websites. Except to the extent to which the report refers to website material of CS, CS has not reviewed the linked site and takes no responsibility for the content contained therein. Such address or hyperlink (including addresses or hyperlinks to CS’s own website material) is provided solely for your convenience and information and the content of the linked site does not in any way form part of this document. Accessing such website or following such link through this report or CS’s website shall be at your own risk. This report is issued and distributed in Europe (except Switzerland) by Credit Suisse Securities (Europe) Limited, One Cabot Square, London E14 4QJ, England, which is regulated in the United Kingdom by The Financial Services Authority (“FSA”). This report is being distributed in Germany by Credit Suisse Securities (Europe) Limited Niederlassung Frankfurt am Main regulated by the Bundesanstalt fuer Finanzdienstleistungsaufsicht ("BaFin"). This report is being distributed in the United States by Credit Suisse Securities (USA) LLC ; in Switzerland by Credit Suisse AG; in Canada by Credit Suisse Securities (Canada), Inc.; in Brazil by Banco de Investimentos Credit Suisse (Brasil) S.A. or its affiliates; in Mexico by Banco Credit Suisse (México), S.A. (transactions related to the securities mentioned in this report will only be effected in compliance with applicable regulation); in Japan by Credit Suisse Securities (Japan) Limited, Financial Instrument Firm, Director-General of Kanto Local Finance Bureau (Kinsho) No. 66, a member of Japan Securities Dealers Association, The Financial Futures Association of Japan, Japan Securities Investment Advisers Association, Type II Financial Instruments Firms Association; elsewhere in Asia/Pacific by whichever of the following is the appropriately authorised entity in the relevant jurisdiction: Credit Suisse (Hong Kong) Limited, Credit Suisse Equities (Australia) Limited , Credit Suisse Securities (Thailand) Limited, Credit Suisse Securities (Malaysia) Sdn Bhd, Credit Suisse AG, Singapore Branch, Credit Suisse Securities (India) Private Limited regulated by the Securities and Exchange Board of India (registration Nos. INB230970637; INF230970637; INB010970631; INF010970631), having registered address at 9th Floor, Ceejay House,Dr.A.B. Road, Worli, Mumbai - 18, India, T- +91-22 6777 3777, Credit Suisse Securities (Europe) Limited, Seoul Branch, Credit Suisse AG, Taipei Securities Branch, PT Credit Suisse Securities Indonesia, Credit Suisse Securities (Philippines ) Inc., and elsewhere in the world by the relevant authorised affiliate of the above. Research on Taiwanese securities produced by Credit Suisse AG, Taipei Securities Branch has been prepared by a registered Senior Business Person. Research provided to residents of Malaysia is authorised by the Head of Research for Credit Suisse Securities (Malaysia) Sdn. Bhd., to whom they should direct any queries on +603 2723 2020. In jurisdictions where CS is not already registered or licensed to trade in securities, transactions will only be effected in accordance with applicable securities legislation, which will vary from jurisdiction to jurisdiction and may require that the trade be made in accordance with applicable exemptions from registration or licensing requirements. Non-U.S. customers wishing to effect a transaction should contact a CS entity in their local jurisdiction unless governing law permits otherwise. U.S. customers wishing to effect a transaction should do so only by contacting a representative at Credit Suisse Securities (USA) LLC in the U.S. Please note that this report was originally prepared and issued by CS for distribution to their market professional and institutional investor customers. Recipients who are not market professional or institutional investor customers of CS should seek the advice of their independent financial advisor prior to taking any investment decision based on this report or for any necessary explanation of its contents. This research may relate to investments or services of a person outside of the UK or to other matters which are not regulated by the FSA or in respect of which the protections of the FSA for private customers and/or the UK compensation scheme may not be available, and further details as to where this may be the case are available upon request in respect of this report. Any Nielsen Media Research material contained in this report represents Nielsen Media Research's estimates and does not represent facts. NMR has neither reviewed nor approved this report and/or any of the statements made herein. If this report is being distributed by a financial institution other than Credit Suisse AG, or its affiliates, that financial institution is solely responsible for distribution. Clients of that institution should contact that institution to effect a transaction in the securities mentioned in this report or require further information. This report does not constitute investment advice by Credit Suisse to the clients of the distributing financial institution, and neither Credit Suisse AG, its affiliates, and their respective officers, directors and employees accept any liability whatsoever for any direct or consequential loss arising from their use of this report or its content. Copyright 2011 CREDIT SUISSE AG and/or its affiliates. All rights reserved.
CREDIT SUISSE (Hong Kong) Limited Asia/Pacific: +852 2101-6000