india state of indian agriculture 2012-13.pdf
DESCRIPTION
INDIA STATE OF INDIAN AGRICULTURE 2012-13TRANSCRIPT

State of Indian Agriculture2012-13
Government of IndiaMinistry of Agriculture
Department of Agriculture and CooperationDirectorate of Economics and Statistics
New Delhi


iii
State of Indian Agriculture 2012-13CoNtENtS
Pages
List of tables vi List of Boxes viii List of Figures ix List of Annexures xi List of Abbreviations/Acronyms xiii
1. Indian Agriculture: Performance and Challenges 1 Crop Production 1 Rates of Growth in Area, Production and Yield 2 Growth of Agriculture Sector 6 Regional Variations in Growth 7 Capital Formation in Agriculture 7 Land and Water 9 IrrigationandWaterUseEfficiency 13 InputsforAgriculturalGrowth 13 SeedandPlantingMaterial 13 Integrated Nutrients Management (INM) 14 Integrated Pest Management 16 Mechanization 16 Labour and Agricultural Wages 17 Agriculture Credit and Insurance 17 Agricultural Extension Services 18 Agricultural Prices and Markets 19 the Way Forward 21
2. Natural Resource Management 23 Land&LandUse 23 Challenges 24 Policies & Programmes 24 Way Forward 25 Soil 26 Challenges 26

iv
Policies & Programmes 26 Water Resources 27 Challenges 28 Programmes&Schemes 30 TheWayForward 31 ClimateChange 32 Challenges 32 NationalMissionforSustainableAgriculture(NMSA) 32 Droughtmanagement 33 Wayforward 34
3. Farm Inputs and Management 35 SeedsandPlantingMaterial 35 Integrated Nutrient Management 42 Integrated Pest Management 48 Farm Machinery and Equipment 51 Labour and Agricultural Wages 55 Agricultural Credit 56 Insurance 60 Extension Services 62
4. Agricultural Production and Programmes 72 Agricultural Production 72 ProgrammesandSpecialInitiativesinCropSector 83 NationalFoodSecurityMission(NFSM) 83 Rashtriya Krishi Vikas Yojana (RKVY) 86 MacroManagementofAgriculture(MMA) 90 Horticulture: the Growth Driver of Indian Agriculture 91 the Way Forward 98
5. Agricultural Prices and Markets 99 Agricultural Prices 99 AgriculturalPricePolicyandMSP 103 MarketInterventionandPriceSupportSchemes 104 Procurementoffoodgrains 105 AgriculturalMarketing 108

v
Challenges 111 Way Forward 111 India in Global Agricultural trade 112
6. Post-Harvest Management and Value Addition 117 Food Processing Sector 117 Plan Schemes 121 National Mission on Food Processing (NMFP) 126 Challenges 127 the Way Forward 127
7. Agricultural Research and Education 128 Natural Resource Management 128 CropScience 130 Horticulture 134 Animal Science 135 Fisheries 139 AgriculturalEngineering 143 Agricultural Education 148
8. Animal Husbandry, Dairying & Fisheries 153 DairyingandLivestockProduction 153 Challenges 154 the Way Forward 155 Feed and Fodder for Livestock 157 Challenges 158 the way forward 158 Meat and Poultry Sector 159 Challenges 160 TheWayForward 160 FisheriesSector 160 Challenges 161 the Way Forward 161 Annexures 163

vi
List of Tables
Sl. Title Page No. No.
1.1 Production of major crops during the recent years 2
1.2 AllIndiaAverageAnnualGrowthRatesofArea,ProductionandYieldof 3 Principal Crops
1.3 GrossCapitalFormationinAgriculture&AlliedSectorsatconstant 8 (2004-05)prices
1.4 DistributionofNumberofHoldingsandAreaOperatedinIndiaasper 10 AgricultureCensus2010-11
1.5 Size Group wise distribution of Average Holdings in the country 11
1.6 Cropping Pattern in India (Area in Million Hectares) 12
3.1 Requirement&AvailabilityofCertified/QualitySeedsofHybrids 35
3.2 ConsumptionofFertilizersintermsofNPKnutrientsinIndia 43
3.3 ConsumptionofFertilizersinIndia 43
3.4 SoilTestingLaboratoriessanctionedunderNationalProjectonManagement 46 of Soil Health & Fertility
3.5 Bio-pesticidesusage 48
3.6 QualityofPesticidesavailableintheIndianmarkets 50
3.7 WageIncreaseinAgriculture&Non-AgricultureSectorduring2001-11 56
3.8 InstitutionalcredittoAgriculture 57
3.9 SourcesofcredittoAgricultureSector 60
4.1 Production of Foodgrains in Recent years 74
4.2 Production of Rice in the Eastern States 74
4.3 ValueofExportofHorticultureCommodity 94
4.4 Status of APMC Acts Reforms with respect to Horticulture Produce 96
5.1 ContributionofdifferentgroupsFoodinInflation(allsegments) 100
5.2 MinimumSupportPricesofsomeoftheMajorCropsfor2012-13 103
5.3 CentralIssuePricesoffoodgrains 107
5.4 Top10Agriculturalexports 113
5.5 Top10Agriculturalimports 114

vii
6.1 Contribution and Growth of Food Processing Industries 118
6.2 Sector-wiseNumberofRegisteredProcessingUnits 119
6.3 ForeignDirectInvestmentinFoodProcessingSectorfromApril2007toMay2012 120
6.4 PersonsEmployedunderRegisteredFoodProcessingIndustries 120
6.5 Capital Investment in Registered Food Processing Industries 121
8.1 Compound Annual Growth Rates (CAGRs) in Production of Milk, Egg, 154 WoolandMeatatAll-IndiaLevel(%)

viii
List of Boxes
Sl. Title Page No. No.
2.1 LandUseinIndia 23
2.2 Soil Survey Status: SLUSI 27
3.1 PlantGenomeSaviorCommunityAwards 37
3.2 InnovativeSteps:FarmCropManagementSystem 63
3.3 KisanCallCentre(KCC) 66
3.4 Farmers’Portal 66
4.1 KrishiKarmanAwards 73
4.2 Best Practices in Rice Cultivation 75
4.3 BestPracticesinWheatCultivation 76
4.4 Best Practices adopted in pulses 79
4.5 BestPracticesinOilseedsCultivation 80
4.6 Best Practices and Achievements in Cotton 82
4.7 BestPracticesinJuteCultivation 83
4.8 SalientFeaturesoftheRevisedMMAScheme 90
4.9 ProtectedCultivation 93
4.10 SalientachievementsunderNHM&HMNEH 97
5.1 ReformsinAgriculturalProduceMarketsCommittee(APMC)Act 108
6.1 ComponentsofFoodSafetySchemes 123
6.2 HumanResourceDevelopmentinFoodProcessingSector 123
6.3 AchievementsofIICPT 124
6.4 Achievements of the NMPPB 124
6.5 Functions and objectives of the IGPB 125
7.1 Multipleuseofwaterforincreasingwaterproductivity–aCasestudy 130
7.2 RapeseedmustardinricefallowinManipur-Asuccessstory 130
7.3 Breedingofhighvaluemarinetropicalfinfish,silverpompano,Trachinotusblochii 142
7.4 Introduction of trout farming in Sikkim 142
7.5 Fishbasedproductionsysteminseasonallyfloodedwetlands 143
7.6 EquipmentandTechnologiesdevelopedforaidingMechanisation 143
7.7 National Academy of Agricultural Research Management (NAARM) 149

ix
List of Figures
Sl. Title Page No. No.
1.1(a) All India Average Annual Growth Rates in Area, Production and 4 Yield of major crops during the 11th Plan
1.1(b) All India Average Annual Growth Rates in Yield of major crops during 4 the10thand11thPlan.
1.2 Growth Rates by Economic Activity 6
1.3 AnnualAverageGrowthRatesofGrossStateDomesticProductfrom 7 Agriculture2007-08to2011-12(at2004-05prices)
1.4 Rates of growth in Gross Capital Formation in Agriculture Sector 9
1.5 Average size of operational holdings as per different Agriculture Census 11
1.6 Crop-WiseShare(%)inArea 12
1.7 State wise Fertilizer consumption, Kg/Ha 15
2.1 total degraded Land 26
2.2(a) Irrigated Area & Sources of Irrigation 27
2.2(b) Percent of Irrigated Area under different crops 28
2.3 Potentialcreatedandutilizedinrespectofmajor&mediumprojects 28
3.1 ApplicationsReceivedforRegistrationofVarietiesatPPV&FRA 37
3.2 Crop-wise-RegistrationCertificatesissued 37
3.3 Nos.ofseedsamplesreceivedandanalyzed 38
3.4 Requirement&availabilityofseedsinIndia 39
3.5 ProductionandConsumptionofSeedsinIndia 39
3.6 PotentialbenefitsofvarioustraitsincorporatedintheGMcrops 40
3.7 FarmPoweravailabilityandaverageyieldoffoodgrainsinIndia 51
3.8 NumberofagriculturaltractorsandcombineharvestersinIndia 52
3.9 PopularAgriculturalEquipment 53
4.1 Share in Value of Projects, total Value `27447 Crore 87
4.2 Share in Projects, total Project 5768 87
4.3 GrowthTrendinHorticultureProduction 91
4.4 Share in Production 92
4.5 Growth in area, production and productivity of fruits 92
x
4.6 Growthinarea,productionandproductivityofvegetables 93
4.7 Per capita availability of F & V 95
5.1 Wholesale Price Index (WPI) of Food Articles 99
5.2 TrendinInflationinFoodArticles 100
5.3 PercentShareofProteinsFood,SugarandEdibleOilsintotalFood 101 (articlesplusproducts)Inflation
5.4(a) Production,Procurementandprocurementas%ofproductionofwheat 105
5.4(b) Production,Procurementandprocurementas%ofproductionofRice 105
5.5 UzhawarSanthaiinTamilNadu 109
5.6 AgriculturalTradeaspercentofGDP 113
6.1 Growth in FPI, Manufacturing & General Index (Cumulative) 119
xi
List of Annexure
Sl. Title Page No. No.
1.1: Plan-wiseGrowthRates(%)byEconomicActivity 163
1.2: PlanWiseGDPShare(%)toTotalEconomybyEconomicActivity 165
1.3: PlanWiseandYearWiseShare(%)ofPublic&PrivateSectorin 167 Gross Capital Formation (GCF)
1.4: PlanWiseandYearWiseshare(%)ofGCF/Investment 169
1.5: All India Average Annual Growth Rates of Area, Production and 171 Yield of Principal Crops
2.1: LandUseClassification 172
2.2: AgricultureLandbyuseinIndia 173
2.3: TrendsinCroppingPatterninIndia 174
3.1: All-IndiaConsumptionofFertilizersinTermsofNutrients(N,P&K) 175
3.2: FertilizerConsumptionperHectareinAgriculturalLandinSelectedCountries 176
3.3: ConsumptionofElectricityforAgriculturalPurposes 177
3.4: State-wiseConsumptionofElectricityforAgriculturepurposein2009-10 178
3.5: State-wiseNumberofKisanCreditCardsissuedupto31stMarch2012 180
3.6: ProductionandConsumptionofSeed,FertilizerandPesticidesinIndia 181
3.7: State-wiseConsumptionofFertilizers 182
3.8: State-wiseEstimatedConsumptionofFertiliserperHectare 184
3.9: Crop-wiseDistributionofCertified/QualitySeeds 186
3.10: FlowofInstitutionalCredittoAgricultureSector 188
3.11: NationalAgriculturalInsuranceScheme(NAIS),SeasonwiseCumulative 189 upto2011-12
4.1: All India Estimates of Area of Foodgrains 191
4.2: AllIndiaEstimatesofProductionofFoodgrains 193
4.3: AllIndiaEstimatesofYieldsofFoodgrains 195
4.4: Area under Commercial Crops 197
4.5: Production of Commercial Crops 198
4.6: Yield of Commercial Crops 199
4.7: AllIndiaEstimatesofAreaunderHorticultureCrops 200

xii
4.8: AllIndiaEstimatesofProductionofHorticultureCrops 203
4.9: PerCapitaNetAvailabilityofFoodgrains(GramsPerDay)inIndia 207
4.10: PercapitaConsumptionofConventionalFoodItems 208
4.11: PercapitaConsumptionofEmergingFoodItems 209
4.12: PercentageCompositionofConsumerExpenditure 210
5.1: Minimum Support Prices 211
5.2: Top10AgriculturalExportsItems 212
5.3: Top10AgriculturalImportItems 213
6.1: List of ICAR/DARE Institutions 214
6.2: List of Agricultural Universities 217
7.1: ProductionofMilk,Eggs,WoolandMeat-AllIndia 220

xiii
List of Abbreviations/Acronyms
Abbreviation MeaningA.I. ArtificialInseminationAAGR Average Annual Growth RateAAS Agro-MeteorologicalAdvisoryServiceACA Additional Central Assistance SchemeACABC Agri-ClinicsandAgri-BusinessCentresADB Asian Development BankADWDRS Agricultural Debt Waiver and Debt Relief SchemeAFC Agricultural Finance CorporationAGDP Agriculture Gross Domestic ProductAIC Agricultural Insurance CompanyAICRP AllIndiaCo-ordinatedResearchProjectAICVIP AllIndiaCo-ordinatedVegetableImprovementProjectAIR All India RadioAl AluminiumAMDP Accelerated Maize Development ProgrammeAMFUs Agro-MetFieldUnits
AMIGS Agricultural Marketing Infrastructure, Grading and Standardization Scheme
AMIS Agricultural Market Information SystemAPMC Agricultural Produce Marketing CommitteeARU Audience Research UnitASEAN Association of South East Asian NationsAtMA Agriculture technology Management AgencyAU Agricultural UniversityAWS Automatic Weather StationsBB Bacterial BlightBCM Billion Cubic MetersBGREI Bringing Green Revolution in Eastern India
BIMStEC Bengal Initiative for Multi-Sectoral Technical and EconomicCooperation
BISA Borlaug Institute of South AsiaBMC Bulk Milk CoolerBPD Business Planning and Development (units)BRICS Brazil, Russia, India, China & South Africa

xiv
Bt Bacillus thuringenesis Btt Block technology teamCa CalciumCA Controlled AtmosphereCAA&A Controller of Aid Accounts & AuditCACP Commission for Agricultural Costs & PricesCAFts Centre of Advanced Faculty training CAGR Compound Annual Growth RatesCAV Chicken Anaemia VirusCAZRI Central Arid Zone Research InstituteCBA Capture Based AquacultureCCEA Cabinet Committee on Economic AffairsCDAP Comprehensive District Agriculture PlanCECA Comprehensive Economic Cooperation AgreementCEo ChiefExecutiveOfficerCEPA Comprehensive Economic Partnership AgreementCFBs Corrugated Fibreboard BoxesCFDo Central Fodder Development organizationCFSPF Central Fodder Seed Production FarmCGMS Cytoplasmic Male SterilityCIAE Central Institute of Agricultural EngineeringCIB&RC Central Insecticides Board & Registration CommitteeCIFE Central Institute of Fisheries EducationCIFRI Central Inland Fisheries Research InstituteCIFt Central Institute of Fisheries technologyCIL Central Insecticides LaboratoryCIMMYt International Maize and Wheat Improvement CentreCIPMCs Central Integrated Pest Management CentersCLRDV Cotton Leaf Roll Dwarf VirusCMtP Central Minikit testing ProgrammeCMU Central Monitoring UnitCORD-M Centre for organizational Research & Development in ManagementCRICot Central Institute for Research on Cotton technologyCRIDA Central Research Institute for Dryland AgricultureCRRI Central Rice Research InstituteCSC Central Seed Committee

xv
CSo Central Statistical organisation CSSRI Central Soil Salinity Research InstituteCStLs Central Seed testing LaboratoriesCSWCRtI Central Soil and water Conservation Research and training InstituteCt Computed tomographyCV CoefficientofVariationCWWG Crop Weather Watch GroupDAAPs District Agriculture Action PlansDAC Department of Agriculture and CooperationDADF Department of Animal Husbandry, Dairying & FisheriesDAP Di-ammoniumPhosphateDARE Department of Agricultural Research and ExtensionDCFR Directorate of Coldwater Fisheries ResearchDCFR Directorate of Coldwater Fisheries ResearchDDP Desert Development ProgrammeDEDS Dairy Entrepreneurship Development SchemeDES Directorate of Economics and StatisticsDFQF DutyFreeQuotaFreeDG Director General DHA Docosahexaenoic AcidDIVA Differentiation of Infected and Vaccinated AnimalsDLC District Level committeesDNA Deoxyribo Nucleic AcidDPAP Drought Prone Area ProgrammeDPPQ&S DirectorateofPlantProtection,Quarantine&Storage
DPQS Development and Strengthening of Infrastructure Facilities for Production andDistributionofQualitySeeds
DSS Decision Support SystemDVCF Dairy Venture Capital FundDWM Directorate of Water ManagementDWSR Directorate of Weed Science ResearchEAPs Externally Aided ProjectsEDP Entrepreneurship Development ProgrammesEFtA European Free trade AgreementEoI Expression of InterestEoU Export oriented Unit

xvi
EPA Eicosapetaenoic AcidEPCG Export Promotion Capital Goods Scheme EPD Electronic Data ProcessingERFS Extended Range Forecast System
ESVHD Establishment and Strengthening of existing Veterinary Hospitals and Dispensaries
et al. Et alii (and others)Ett Embryo transfer technologyEXIM Export ImportF&V Fruit and VegetablesFAo Food and Agriculture organization
FASAL Forecasting Agricultural output using Space, Agro meteorology and Land based observations
FCo Fertilizer Control orderFDI Foreign Direct InvestmentFe IronFFDA Fish Farmers Development AuthorityFFSs Farmers’FieldSchoolsFI Financial Institution FICCI Federation of Indian Chambers of Commerce and IndustryFig. FigureFLD Frontline demonstrationFM Frequency ModulationFMD Foot & Mouth DiseaseFPI Food Direct InvestmentFPo Farmer Producer organizationsFPt Field Progeny testingFPtC Food Processing training CentresFQCL FertilizerQualityControlLaboratoriesFtAs Free trade AgreementsFYM Farm Yard ManureFYP Five Year PlanGAPs Good Agricultural PracticesGBPUAt Govind Ballabh Pantnagar University of Agriculture and technologyGCF Gross Capital FormationGDP Gross Domestic Product

xvii
GHGs Green House GasesGHP Good Hygiene PracticesGHP Good Horticultural PracticeGIS Geographical Information SystemGM GeneticallymodifiedGME Green Mussel ExtractGMP Good Manufacturing PracticesGoI Government of IndiaGPS Ground Positioning SystemGR Gypsum RequirementGSDP Gross State Domestic ProductGtZ German technical CooperationHACCP Hazard Analysis and Critical Control PointsHMNEHS Horticulture Mission for North East & Himalayan StatesHRD Human Resource Development HSADL High Security Animal Disease Laboratory
HSIIC Haryana State Industrial & Infrastructure Development Corporation Ltd.
HYVs High Yielding VarietiesIBSA India, Brazil, South AfricaICAR Indian Council of Agricultural Research ICAR India Council of Agricultural ResearchICAR RCER ICAR Research Complex for Eastern RegionICAR RCGoA ICAR Research Complex for GoaICAR RCNEH ICAR Research Complex for North Eastern Hill regionICICI Industrial Credit and Investment Corporation of IndiaICRISAt InternationalCropsResearchInstitutefortheSemi-AridTropicsICt Information and Communication technologyICt Information and Communication technologyIDA International Development AgencyIDWG Inter-DepartmentalWorkingGroupIFAD International Fund for Agriculture DevelopmentIFS Integrated Farming SystemIGPB Indian Grape Processing BoardIICPt Indian Institute of Crop Processing technologyIIPR Indian Institute of Pulses Research

xviii
IISS Indian Institute of Soil ScienceIMD Indian Metrological Department IPM Integrated Pest ManagementIPM Integrated Pest ManagementIPPC International Plant Protection ConventionIPR Intellectual Property RightsIPRs Intellectual Property RightsIQR IndividualQuickFreezeIRIWI International Research Initiative for Wheat ImprovementISo International organisation of Standardization ISoPoM Integrated Scheme of oilseeds, Pulses, oil palm and MaizeItDP Integrated tribal Development ProgrammeItDP Institute of transportation and Development PolicyIVF In vitro FetilizationIVLP Institute Village Linking ProgrammeIVR Interactive Voice Response IVRI Indian Veterinary Research InstituteIWDP Integrated Wastelands Development ProgrammeIWM Integrated Water ManagementIWMP Integrated Watershed Management ProgrammeJBE-SSD Juvenile Bycatch Excluder cum Shrimp Sorting DeviceJFMCs Joint Forest Management CommitteesJICA Japan International Cooperation AgencyJRF Junior Research FellowshipK PotassiumKCC Kisan Call Centre/Kisan Credit Cardskg kilogramKVASU Kerala Veterinary and Animal Science UniversityKVK Krishi Vigyan KendraLAMP LoopAssistedAmplificationLPA Long Period AverageLtFE Long term Fertilizer ExperimentLWo Locust Warning organization MA ModifiedAtmosphereMANAGE National Institute of Agricultural Extension ManagementMAS Molecularmarker-assistedselection

xix
MAS Markers Assisted SelectionMBM Meat-cum-BoneMealMF Military FarmsMFPS Mega Food Parks SchemeMg MagnesiumMGNREGA Mahatma Gandhi National Rural Employment Guarantee ActMGNREGA Mahatma Gandhi National Rural Employment Guarantee Actmha Million hectaresMIP Market Intervention PriceMIS Market Intervention SchemeMMA Macro Management of AgricultureMNAIS ModifiedNationalAgriculturalInsuranceSchemeMo Molybdenum MoA Ministry of AgricultureMoEt Multi ovulation Embryo transfer technologyMoFPI Ministry of Food Processing IndustriesMoP Muriate of PotashMoU Memorandum of UnderstandingMPFD Madhya Pradesh Forest DepartmentMRI Magnetic Resonance ImagingMRIN Market Research Information NetworkMRP Mixed Recall periodMSN Micro and Secondary NutrientsMSP Minimum Support Price/Minimum Standard ProtocolMt Metric tonnesMtCs Model training CoursesN NitrogenNAARM National Academy of Agricultural Research ManagementNAAS National Academy of Agricultural SciencesNABARD National Bank for Agricultural and Rural DevelopmentNABARD National Bank for Agriculture and Rural DevelopmentNABL National Accreditation Board for testing and Calibration LaboratoriesNADRS National Animal Disease Reporting SystemNAE Niche Area of ExcellenceNAFED National Agricultural Cooperative Marketing Federation NAIP National Agricultural Innovative Project

xx
NAIS National Agricultural Insurance SchemeNAMA Non Agricultural Market Access NAPCC National Action Plan on Climate ChangeNARP National Agricultural Research ProjectNARS National Agricultural Research SystemNAS National Accounts Statistics NBAGR National Bureau of Animal Genetic ResourcesNBFGR National Bureau of Fish Genetic ResourcesNBSSLUP National Bureau of Soil Survey and Land Use PlanningNBSSLUP National Bureau of Soil Survey and Land Use PlanningNCAP National Centre for Agricultural Economics and Policy ResearchNCDC National Cooperative Development CorporationNCIPM National Center for Integrated Pest ManagementNCR National Capital RegionNDC National Development CouncilNDDB National Dairy Development BoardNE North-EastNeGP-A National e Governance Plan in AgricultureNEPZ North Eastern Plain Zone NFSM National Food Security MissionNGo Non-GovernmentalOrganizationNHM National Horticulture MissionNIASM National Institute of Abiotic Stress ManagementNIC Nation Informatics Centre NIC NationalIndustrialClassificationNICRA National Initiative for Climate Resilient Agriculture
NIFtEM National Institute of Food technology, Entrepreneurship & Management
NIPHM National Institute of Plant Health ManagementNISAGENEt National Information System on Agricultural Education Network in
IndiaNLAs National Level AgenciesNMAM National Mission on Agricultural MechanisationNMPPB National Meat and Poultry Processing BoardNMPS National Mission for Protein SupplementsNMSA National Mission for Sustainable Agriculture

xxi
NMSA National Mission on Sustainable AgricultureNPCBB National Project for Cattle and Buffalo BreedingNPIL National Pesticides Investigational LaboratoryNPMSH&F National Project on Management of Soil Health & FertilityNPPtI National Plant Protection training InstituteNPRR National Pesticide Reference RepositoryNPSD New Policy on Seed DevelopmentNPV Nuclear Polyhedrosis VirusesNRC National Research CentreNRC National Research CentreNRCAF National Research Centre for Agroforestry NRCE National Research Centre on EquinesNRM Natural Research ManagementNSC National Seeds CorporationNSRtC National Seed Research and training CentreNSS National Sample SurveyNSSo National Sample Survey organisation NtIs Nodal training InstitutesNWDPRA National Watershed Development Project for Rainfed AreasNWPZ North Western Plain ZoneoECD organization for Economic Cooperation and DevelopmentoFt on Farm trialoFt On-FarmTrialoPAE oil Palm Area ExpansionoPDP oil Palm Development ProgrammeoPex Neutraceutical oyster Peptide oPP oilseeds Development ProgrammeotS one time SettlementP Prosperous PACS Primary Agricultural Credit SocietiesPAG Pregnancy Associated GlycoproteinPCP PentachlorophenolPCR Polymerase Chain ReactionPCR Polymerase Chain ReactionPDADMAS Project Directorate on Animal Disease Monitoring and SurveillancePDC Project Directorate on Cattle

xxii
PDFMD Project Directorate on Foot and Mouth DiseasePDFSR Project Directorate on Farming System Research PDP Professional Development ProgrammePDS Public Distribution SystemPFDC Precision Farming Development CentrePG Post GraduationPHM Post Harvest ManagementPHtM Post Harvest technology and ManagementPKS Polyketide SynthasePMts Project Management teamsPNA Peptide Nucleic AcidsPPP Public Private PartnershipsPPR Peste des Petits RuminantsPPR Peste des Petits RuminantsPPRC Paddy Processing Research CentrePPV&FR ProtectionofPlantVarietiesandFarmers’RightsPQSs PlantQuarantineStationsPRAP Participatory Action Research ProgrammePSCs PhytosanitarycertificatesPSS Price Supports SchemePtAs Preferential trading AgreementsPUFAs Polyunsaturated Fatty AcidsPZ Peninsular ZoneQTL QuantitativeTraitLociR& D Research and DevelopmentR&D Research and DevelopmentRADP Rainfed Area Development ProgrammeRBH Rural Business HubsRC Registration CommitteeRDIMS RKVY Database and Management Information SystemRFID RadioFrequencyIdentificationRIDF Rural Infrastructure Development FundRKVY Rashtriya Krishi Vikas YojnaRPQS RegionalPlantQuarantineStationsRPtLs Regional Pesticides testing LaboratoriesRRBs Regional Rural Banks

xxiii
RSFP&D Regional Stations for Forage Production and DemonstrationRtPCR Rapid or Real time Polymerase Chain ReactionRT-PCR Reverse transcription Polymer Chain Reaction
RVP & FPR Soil Conservation in the Catchments of River Valley Project & Flood Prone River
SAARC South Asian Association for Regional CooperationSAMCs State Meteorological CentresSAMEtI State Agricultural Management & Extension training InstitutesSAS Statistical Analysis SystemSAU State Agricultural UniversitySAUs State Agricultural Universities SCH Single Cross HybridsSDA Scheduled Desert AreaSe SeleniumSEWP State Extension Work PlanSFCI State Farms Corporation of IndiaSHPIs Self Help Promoting InstitutionsSi SiliconSKUAS&t Sher-e-KashmirUniversityofAgriculturalScienceandTechnologySKUASt Sher-e-KashmirUniversityofAgriculturalScienceandTechnologySLC State Level committeesSLSC State Level Sanctioning CommitteeSLUB State Land Use BoardSME Small and Medium EnterprisesSMI Soil Moisture IndicatorSMS Short Message ServiceSNPs Single Nucleotide PolymorphismsSoC Soil organic CarbonSRF Senior Research FellowshipSRI SystemofRiceIntensificationSRR Seed Replacement RatesSSCAs StateSeedCertificationAgenciesSSCs State Seed CorporationsSSGs StatesSpecificGrantsSSM Special Safeguard MechanismStCCS Short term Cooperative Credit Structure

xxiv
StCR Soil test and Crop Response StLs Soil testing Laboratories/Seed testing LaboratoriesSW South WesttAR TechnologyAssessmentandRefinementtERI the Energy & Resources InstitutetFGs tenant Farmers Groups
tMNE technology Mission for Integrated Development of Horticulture in North Eastern States including Sikkim
tMo technology Mission on oilseedstN tamil NadutPDS targeted Public Distribution SchemetVEs town and Village EnterprisesUG Under GraduateUNESCAP UnitedNationEconomicandSocialCommisionforAsiaandthePacificUP Uttar PradeshURP Uniform recall PeriodUt Union territoryVAt Value Added taxVMC Vessel Management CellVNN Viral Nervous NecrosisWB West BengalWBCIS Weather Based Crop Insurance SchemeWDPs Watershed Development ProgrammesWDPSCA Watershed Development Project in Shifting Cultivation AreasWFP World Food ProgrammeWHo World Health organisationWIGISAt Wine Grape Insuring Structuring Automation toolWPI Wholesale Price IndexWto World trade organisationXDR Special Drawing Rights

1.1 Indiaaccounts foronlyabout2.4%of theworld’s geographical area and4%of itswaterresources, but has to support about 17 % oftheworld’shumanpopulationand15%of thelivestock. Agriculture is an important sector of the Indian economy, accounting for 14%of thenation’s GDP, about 11% of its exports, abouthalf of the population still relies on agriculture as its principal source of income and it is a source of raw material for a large number of industries. Accelerating the growth of agriculture production is therefore necessary not only to achieve an overall GDP target of 8 per cent during the 12th Plan and meet the rising demand for food, but also to increase incomes of those dependent on agriculture to ensure inclusiveness.
Crop Production1.2 During2011-12,therewasrecordproductionoffoodgrainsat259.32milliontonnes,ofwhich131.27milliontonneswasduringKharifseasonand128.05milliontonnesduringtheRabiseason.of the total foodgrains production, production of cerealswas242.23milliontonnesandpulses17.09million tonnes. As per 2nd advance estimates for 2012-13,totalfoodgrainsproductionisestimatedat 250.14 million tonnes (124.68 million tonnesduring Kharif and 125.47 million tonnes during Rabi seasons). the 6.59 million tonnes (about 5.02 per cent) decline in kharif production hasbeen on account of late onset of monsoon and deficientrainfallinseveralstatesaffectingkharifproduction in Andhra Pradesh, Bihar, Gujarat, Haryana, Karnataka, Maharashtra, Rajasthan, tamil Nadu and West Bengal. the production of rice (bothkharif and rabi) is estimatedat 101.8million tonnes, pulses at 17.58 million tonnes, oilseeds at 29.46 million tonnes, sugarcane at 334.54milliontonnesandcottonat33.80million
bales (of 170 kg. each). Though, production ofrice,sugarcaneandcottonduringkharif2012-13has been lower than that of the last year, these are better than the average production during the lastfiveyears.Productionof coarse cerealshasbeenseverelyaffectedbythedeficientmonsoonin Gujarat, Haryana, Karnataka, Maharashtra and Rajasthan, with the result that the overall production of Coarse Cereals has been lower by 3.95 million tonnes as compared to kharif2011-12.Productionof juteisestimatedat10.56millionbales(of180kgeach)whichismarginallylowerthanthatoflastyear(10.74millionbales).Productionof themajor crops since2007-08 till2012-13(secondestimates)isgiveninTable1.1.
1.3 The delayed onset and deficient first halfof South-West monsoon in 2012 had adverseimpact on Kharif crop area coverage and yields. There has been significant improvement in therainfallsituationinAugustandSeptember,2012,resulting in good soil moisture conditions and improved prospects for rabi crops for 2012-13.State/Ut governments have been advised to take advantage of the good soil moisture and targetforsignificantlyhigherrabiproductionsoas to make good for the loss of production in the kharif season. ICAR has developed technology for high yielding and pest resistant varieties of crops suitable for different agro-climatic zones.States/Uts have been advised to use the high yielding and pest resistant varieties of crops and popularize the use of agricultural machinery in farm operations to overcome the problem of labour shortage. Further, integration of fodder component in the State Agricultural Plans, extension services through KVKs/AtMAs and allocationofatleast25%ofthefundsunderRKVYtopromotethelivestockandfisheriessectorhasbeen recommended.
CHAPtER 1
Indian Agriculture: Performance and Challenges

2 State of Indian Agriculture
Table 1.1: Production of major crops during the recent years (million tonnes/bales)
Crop Season 2007-08 2008-09 2009-10 2010-11 2011-12Final
Estimates
2012-132nd Adv Estimates
Rice Kharif 82.66 84.91 75.92 80.65 92.75 90.69Rabi 14.03 14.27 13.18 15.33 12.56 11.11total 96.69 99.18 89.10 95.98 105.31 101.80
Wheat Rabi 78.57 80.68 80.80 86.87 94.88 92.30Coarse Cereals Kharif 31.89 28.54 23.83 33.08 32.46 28.51
Rabi 8.86 11.49 9.72 10.32 9.58 9.96total 40.75 40.03 33.55 43.40 42.04 38.47
total Cereals Kharif 114.55 113.45 99.75 113.73 125.21 119.19Rabi 101.46 106.45 103.70 112.52 117.02 113.37total 216.01 219.90 203.45 226.25 242.23 232.56
Pulses Kharif 6.40 4.69 4.20 7.12 6.06 5.48Rabi 8.36 9.88 10.46 11.12 11.03 12.09total 14.76 14.57 14.66 18.24 17.09 17.57
Foodgrains Kharif 120.96 118.14 103.95 120.85 131.27 124.68Rabi 109.82 116.33 114.15 123.64 128.05 125.47total 230.78 234.47 218.10 244.49 259.32 250.15
oilseeds Kharif 20.71 17.81 15.73 21.92 20.69 19.45Rabi 9.04 9.91 9.15 10.56 9.11 10.01total 29.75 27.72 24.88 32.48 29.80 29.46
Sugarcane 348.19 285.03 292.30 342.38 361.04 334.54Cotton* 25.88 22.28 24.02 33.00 35.20 33.80Jute & Mesta** 11.21 10.37 11.82 10.62 11.40 11.13*(millionbalesof170kgeach),**(millionbalesof180kgeach)
Rates of Growth in Area, Production and Yield1.4 Given the limitations in the expansion of acreage, the main source of long-term outputgrowth is improvement in yield. A comparative picture in average annual growth rates of area, production and yield of different crops for two periods,2002-03to2006-07(the10th Plan period) and2007-08 to2011-12 (the11th Plan period) is given in table 1.2. the area under jowar, bajra, small millets, ground nuts, rapeseed and mustard,
sunflower and mesta has have witnessed anegative growth during the 11th Plan. Yields of all the major crops have recorded positive growth during the 11th Plan period. Average Annual Growth Rates in area, production and yields of major crops at all India level during 11th Plan and a comparison of annual average growth in yield rates during the 10th and 11th Plan periods are depicted in Fig. 1.1 (a) and 1.1 (b) respectively. Impressive rates of growth (more than 4 percent per annum) in production

IndianAgriculture:PerformanceandChallenges 3
were observed in the case of wheat, bajra, maize, coarse cereals, gram, tur, total pulses, groundnut, sesamum, soyabean, total oilseeds and cotton. the increases in production in the case of wheat, bajra, maize, groundnut and total oilseeds can
mainly be attributed to increase in yields, where as the growth in production in the case of gram, tur, total pulses, soyabean and cotton is driven by a combination of both expansion in area and increase in productivity/yield.
Table 1.2: All India Average Annual Growth Rates of Area, Production and Yield of Principal Crops
Crops Average Annual Growth (%) Average Annual Growth (%)10th Plan (2002-03 to 2006-07) 11th Plan (2007-08 to 2011-12)Area Production Yield Area Production Yield
Rice -0.39 1.25 1.17 0.18 2.69 2.41Wheat 1.30 1.11 -0.32 1.31 4.64 3.29Jowar -2.84 -0.89 2.07 -5.71 -3.00 3.26Bajra 1.67 17.12 7.28 -1.38 7.84 8.64Maize 3.77 4.02 -0.15 2.16 8.90 6.47Ragi -5.52 -2.67 0.40 0.41 8.11 6.66Small Millets -5.03 -2.49 2.32 -4.42 -0.13 4.08Barley -0.28 -1.21 -0.90 0.61 6.32 4.64Coarse Cereals -0.26 2.55 1.75 -1.59 5.68 7.27Total Cereals 0.07 1.21 0.74 -0.03 3.79 3.76Gram 3.60 4.70 0.28 2.32 4.62 2.27tur 1.38 1.06 -0.41 3.13 4.84 1.51Total Pulses 1.31 2.66 0.65 1.36 4.28 2.78Total Foodgrains 0.29 1.29 0.59 0.19 3.80 3.55Sugarcane 3.98 4.90 0.66 0.04 0.99 0.87Groundnut -1.65 3.61 4.32 -0.86 15.82 13.91Sesamum 0.98 3.64 0.51 2.42 8.28 5.30R&M 7.32 11.55 3.24 -1.69 -0.37 0.76Sunflower 14.04 13.83 0.37 -18.74 -14.46 6.20Soyabean 5.80 12.26 6.18 4.00 7.71 3.90Total Nine Oilseeds 3.55 7.99 3.53 -0.07 5.54 5.32Cotton 0.57 20.01 19.40 5.97 10.46 3.93Jute -1.82 -0.38 1.49 0.47 1.26 0.62Mesta -3.85 -2.44 1.45 -7.00 -5.94 0.80Jute & Mesta -2.15 -0.58 1.45 -0.59 0.62 1.12
Source: Directorate of Economics & Statistics, Ministry of Agriculture.

4 State of Indian Agriculture
Fig. 1.1 (a): All India Average Annual Growth Rates in Area, Production and Yield of major crops during the 11th Plan
of growth in yield during the 11th plan than that of the10th Plan. Growth in yields of sugarcane and rapeseed & mustard suggest that their yields seem to have attained the plateau and need renewed research to boost their productivity levels.
A perusal of the rates of growth in yield reveals that most of the crops have recorded higher growth during the 11th Plan than that during the 10th Plan. However, sugarcane, and rapeseed & mustard, soybean and cotton recorded lower rates
-20
-16
-12
-8
-4
0
4
8
12
16
Rice
Whe
at
Jow
ar
Bajra
Mai
ze
Coar
seCe
real
s
Tota
lCer
eals
Gra
m Tur
Tota
lPul
ses
Tota
lFoo
dgra
ins
Suga
rcan
e
Gro
undn
ut
Sesa
mum R&
M
Sunf
low
er
Soya
bean
Tota
lNin
eO
ilsee
ds
Cott
on
Jute
Area Production Yield
Fig. 1.1 (b): All India Average Annual Growth Rates in Yield of major crops during the 10th and 11th Plan
-4
0
4
8
12
16
20
Rice
Whe
at
Mai
ze
Coar
seCe
real
s
Tota
lCer
eals
Gra
m Tur
Tota
lPul
ses
Tota
lFoo
dgra
ins
Suga
rcan
e
Gro
undn
ut
R&M
Soya
bean
Tota
lNin
eO
ilsee
ds
Cott
on
Perc
ent
10 Plan 11 Plan

Indian Agriculture: Performance and Challenges 5
Horticulture1.5 the horticulture sector has been a driving force in stimulating a healthy growth trend in Indian agriculture. India is currently producing 257.2 million tonnes of horticulture produce from anareaof23millionha.Overthelastdecade,theareaunderhorticulturegrewbyabout3.8%perannumbutproductionroseby7.6%perannum.the higher growth rate in horticulture was brought about by improvement in productivity of horticulture crops, which increased by about 28% between 2001-02 and 2011-12. The specialthrust given to the sector, especially after the introduction of the Horticulture Mission for North East & Himalayan States (HMNEH) and the National Horticulture Mission (NHM) in the Xth Plan has borne positive results. Given the increasing pressure on land, the focus of growth strategy is on raising productivity by supporting high density plantations, protected cultivation, micro irrigation, quality planting material, rejuvenation of senile orchards and thrust on post harvest management, to ensure that farmers do not lose their produce in transit from farm gatetotheconsumer’splate.
Livestock Sector1.6 the agriculture sector in India is predominantly part of a mixed crop-livestockfarming system. the livestock sector supplements income of the farmers, provides employment, draught power and manure. the development of livestock sector is more inclusive and can result in a sustainable agriculture system. India is the largest producer of milk in the world, estimated production of milk in 2011-12 is 127.9 milliontonnes and the second largest producer of fishin the world with estimated production of 8.85 milliontonnesduring2011-12.Therateofgrowthin livestock sector has also been higher than that in the crop sector in the recent years.
Major Schemes for Accelerating Agricultural Production1.7 In order to increase the agricultural growth rates, Rashtriya Krishi Vikas Yojana (RKVY), launchedinAugust2007,incentivizesthestates
to increase public investment in agriculture and allied sectors taking agro climatic conditions, natural resource issues and technology into account and integrating livestock, poultry and fisheries more fully while providingmore flexibility and autonomy to the states inplanning and execution of the schemes. It has become the principal instrument for increasing the states’ investment in the agriculture sectorwhichnowincludesseveralcommodityspecificmeasures namely Bringing Green Revolution to the Eastern Region of India (BGREI), Special Initiative for Pulses and oilseeds, Accelerating Fodder Production, Creating Vegetable Clusters, Initiatives for Nutritional Security through Intensive Millet Promotion (INSIMP), oil Palm Development, Protein Supplements, Rainfed Area Development Programme and the Saffron Mission. Beside RKVY, National Food Security Mission (NFSM) and the National Horticulture Mission (NHM) have also emerged as the path breaking interventions which have helped in achieving record production of cereals, pulses, oilseeds, fruits, vegetables and spices during 2010-11 and 2011-12. With the focusedinterventions under the National Food Security Mission supported by other programs and schemes and conducive price policy regime, target of 20 million tonnes of additional foodgrains production has been exceeded during the 11thfiveyearplan.Notonlyhasthedemandbeencompletely met particularly for the cereals, the buffer and strategic reserves are at levels that are more than double their set limit. there is a record export of cereals that has gained not only huge foreign remittance but has also stabilized global food economy through increased availability and reasonable price. to reduce over exploitation of naturalresourcesinthenorth-westregionandtoincrease the productivity of rice, wheat, maize and pulses, BGREI has started involving promotion of innovative production technologies and agronomical practices addressing the underlying key constraints of different agro-climatic subregions. System of Rice Intensification (SRI),laser land leveling; hybrid rice technologies and line transplanting of rice seedlings etc. are being promoted under this initiative.

6 State of Indian Agriculture
1.8 Apart from population pressure, notwithstanding recent surge in productivity and production of cereal crops, there is a need to bridge the yield gaps in low productivity regions by effective technology dissemination which can be combined with an efficient supply andservice system, strengthening and reorienting agricultural R&D, reducing regional disparities, targeting rain fed areas and emphasizing development of high potential, resource rich states in eastern India.
1.9 Ensuring stability in food systems through optimal combination of food procurement, stocks andtrade,inco-ordinationwithpricemovementsneeds to be given emphasis to improve economic conditions of farmers. Besides enhancing the production and productivity of our agriculture, there is a need to diversify into high value items – fruits, vegetables, milk and dairy products to meet the changing dietary preferences and to
realize higher income for the farmers. towards this end Government is giving special emphasis to the production of pulses, oil seeds and fruits and vegetables, in which we are short of our requirements.
Growth of Agriculture Sector1.10 Asper theCentralStatisticsOffice (CSO)revisedestimates(releasedon31st January2013of Gross Domestic Product, agriculture and allied sectorsgrewat 3.6per centduring2011-12, recording an average rate of growth of 3.6per cent per year during the 11thPlan(2007-12).Further, as per the advance estimates released by CSo on 7thFebruary,2013,agricultureandalliedsectors are estimated to grow at 1.8 per cent during2012-13asagainst3.6percentduringthelast year. the rates of growth of the economy and the agriculture and allied sectors since 2007-08are given in Fig. 1.2.
Fig. 1.2: Growth Rates (%) by Economic Activity
9.3
5.86.3
5.86.7
0.1
-0.3
2.7
8.6
0.8 0.4
3.2
9.3
7.98.8
5.46.2
3.6 3.9
1.8
-2.0
0.0
2.0
4.0
6.0
8.0
10.0
tota
lEco
nom
y
Agr
icul
ture
,for
estr
y&
fishi
ng
Agr
icul
ture
,inc
l.liv
esto
ck
Fish
ing
2007-08 2008-09 2009-10 2010-11 (QE) 2011-12 (RE)

Indian Agriculture: Performance and Challenges 7
Regional Variations in Growth1.11 the Indian Agriculture growth pattern has been very diverse at the state level. As agriculture is a state subject, the overall performance of the agriculture sector in India largely depends on what happens at the state level. there is a wide variation in the performance of different states. During the 11thPlan(i.e.2007-08to2011-12)thegrowth performance of agriculture in Madhya Pradesh (7.6%), Chhatisgarh (7.6%), Rajasthan
(7.4%), Jharkhand (6.0%)andKarnataka (5.6%),was much higher than that of Punjab (1.6%),Maharashtra (2.0%), Tamil Nadu (2.2%) WestBengal(2.8%),UttarPradesh(3.3%)andHaryana(3.3%). High coefficient of variation (>2) wasobserved in the case of Himachal Pradesh and Maharashtra. the average annual growth rates (percent) of gross state domestic product from agricultureduring2007-08to2011-12(at2004-05prices)aregiveninFig.1.3.
Source:CentralStatisticsOffice,NAD.
Fig. 1.3: Annual Average Growth Rate (%) of Gross State Domestic Product from Agriculture 2007-08 to 2011-12 (at 2004-05 prices)
7.6 7.6 7.46.0 5.6 4.9 4.9 4.8 4.7
3.9 3.3 3.3 2.8 2.7 2.2 2.0 2.0 1.6 1.1
-0.7
1.01.8 1.8 1.8 1.4 1.9
0.52.4 2.5
1.0 1.2 0.71.7
2.7 2.5
0.9
8.3
1.3
16.7
-2.4-5.0
0.0
5.0
10.0
15.0
20.0
Mad
hya
Pr.
Chat
tisga
rh
Raja
stha
n
Jhar
khan
d
Karn
atak
a
And
hra
Pr.
Ass
am
Guj
arat
Biha
r
Odi
sha
Har
yana
Utt
arPr
ades
h
Wes
tBen
gal
Utt
arak
hand
Tam
ilN
adu
J&K
Mah
aras
htra
Punj
ab
Him
acha
lPr.
Kera
la
perc
ent
Growth Rate Coefficient of Variation
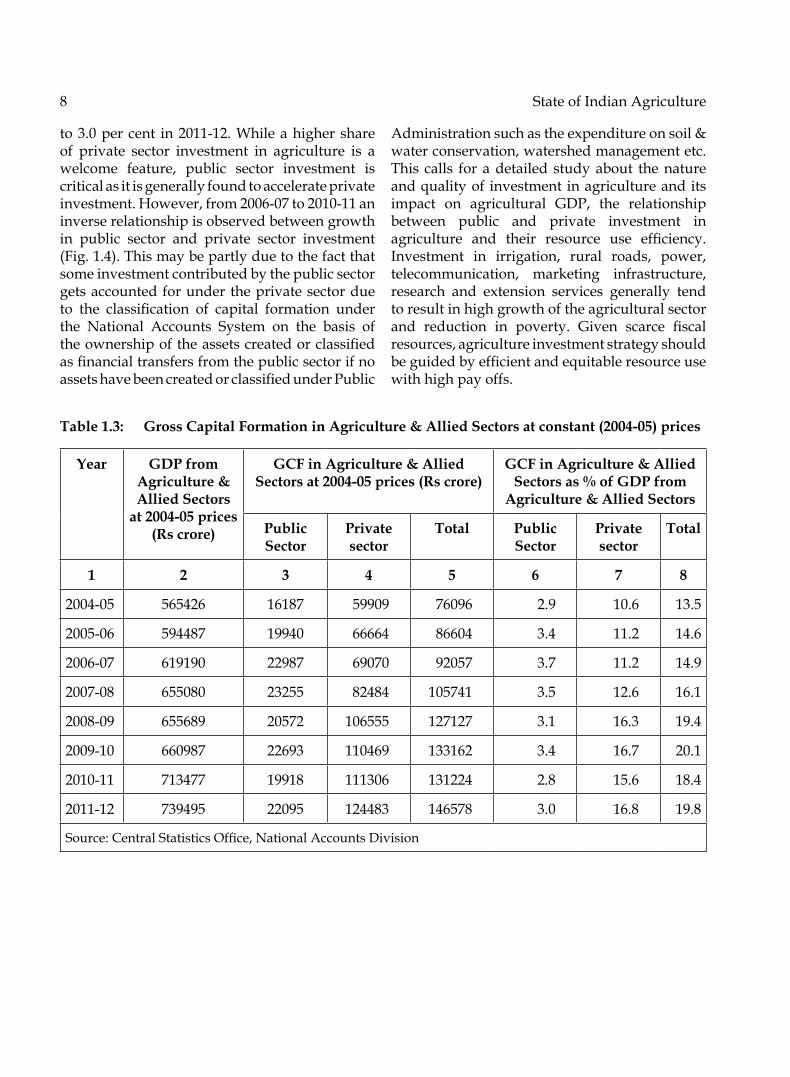
Capital Formation in Agriculture1.12 Investment or capital formation is one of the basic requirements for growth of any sector. Even though the Gross Capital Formation (GCF) in agriculture & allied sectors as percentage of agricultural GDP has increased from 14.9 per centin2006-07to19.8percentin2011-12(Table1.3), when compared with the overall capitalformationintheeconomywhichisabout40per
cent of the GDP, capital formation in agriculture sector is much lower. Further, the share of public sector capital formation in agriculture & allied sectorshascomedownfrom25percentin2006-07toabout15percentin2011-12whereasthatofprivate sector has gone up from 75 per cent to 85 percent.Infactduringthefirstfouryearsofthe11th Five Year Plan, capital formation in public sector in agriculture as per cent of agricultural GDPhascomedownfrom3.5percentin2007-08
8 State of Indian Agriculture
to3.0percent in2011-12.Whileahighershareof private sector investment in agriculture is a welcome feature, public sector investment is critical as it is generally found to accelerate private investment.However,from2006-07to2010-11aninverse relationship is observed between growth in public sector and private sector investment (Fig. 1.4). this may be partly due to the fact that some investment contributed by the public sector gets accounted for under the private sector due to the classification of capital formation underthe National Accounts System on the basis of theownershipoftheassetscreatedorclassifiedasfinancialtransfersfromthepublicsectorifnoassetshavebeencreatedorclassifiedunderPublic
Administration such as the expenditure on soil & water conservation, watershed management etc. this calls for a detailed study about the nature and quality of investment in agriculture and its impact on agricultural GDP, the relationship between public and private investment in agriculture and their resource use efficiency.Investment in irrigation, rural roads, power, telecommunication, marketing infrastructure, research and extension services generally tend to result in high growth of the agricultural sector and reduction in poverty. Given scarce fiscalresources, agriculture investment strategy should beguidedbyefficientandequitableresourceusewith high pay offs.
Table 1.3: Gross Capital Formation in Agriculture & Allied Sectors at constant (2004-05) prices
Year GDP from Agriculture & Allied Sectors
at 2004-05 prices (Rs crore)
GCF in Agriculture & Allied Sectors at 2004-05 prices (Rs crore)
GCF in Agriculture & Allied Sectors as % of GDP from
Agriculture & Allied Sectors
Public Sector
Private sector
Total Public Sector
Private sector
Total
1 2 3 4 5 6 7 8
2004-05 565426 16187 59909 76096 2.9 10.6 13.5
2005-06 594487 19940 66664 86604 3.4 11.2 14.6
2006-07 619190 22987 69070 92057 3.7 11.2 14.9
2007-08 655080 23255 82484 105741 3.5 12.6 16.1
2008-09 655689 20572 106555 127127 3.1 16.3 19.4
2009-10 660987 22693 110469 133162 3.4 16.7 20.1
2010-11 713477 19918 111306 131224 2.8 15.6 18.4
2011-12 739495 22095 124483 146578 3.0 16.8 19.8
Source:CentralStatisticsOffice,NationalAccountsDivision

Indian Agriculture: Performance and Challenges 9
Land and Water1.13 The progressive fragmentation of landholdings, degrading natural resource base and emerging concerns of climate change are escalating pressure on land and water. Land and water resources being finite, increasedagricultural production and a diversified foodbasket to meet the requirement of the increasing population with higher per capita income, has to emanate from the same limited net sown area by increasing productivity with an optimal use of available water and land resources. Natural resources viz. arable land, water, soil, biodiversity (plant, animal and microbial genetic resources) are rapidly shrinking due to demographic and socio-economic pressures,monsoon disturbances, increasing frequencies of floodsanddroughts.Overuseofmarginallands,imbalanced fertigation, deteriorating soil health, diversion of agricultural land to nonagricultural uses, depleting aquifers & irrigation sources, salinizationoffertilelandsandwater-loggingarepressing challenges requiring urgent attention. For making agriculture sustainable to meet the
country’sfoodrequirement,aprudentlandusepolicy, water availability and soil health have to be maintained at levels that are conducive to pursue agricultural activities with higher level of productivity.
1.14 Land degradation is major threat to our food and environmental security. As per estimates ofIndianCouncilofAgriculturalResearch(2010),out of total geographical area of 328.73 mha,about120.40mhaisaffectedbyvariouskindofland degradation resulting in annual soil loss of about 5.3 billion tonnes through erosion. Thisincludes water and wind erosion (94.87 mha), waterlogging(0.91mha),soilalkalinity/sodicity(3.71mha),soilacidity(17.93mha),soilsalinity(2.73mha)andminingandindustrialwaste(0.26mha). Besides, water and wind erosions are wide spreadacrossthecountry.Asmuchas5.3billiontonnes of soil gets eroded every year. of the soil so eroded, 29% ispermanently lost to sea, 10%is deposited in reservoirs reducing their storage capacityandrest61%getsshiftedfromoneplacetoanother.Significantincreaseinuseofchemicalfertilizersparticularly in thenorth-westernpart
Fig. 1.4: Rates of growth (%) in Gross Capital Formation in Agriculture (including Animal Hushandary) Sector
-15.0
-10.0
-5.0
0.0
5.0
10.0
15.0
20.0
25.0
30.0
35.0
2005
-06
2006
-07
2007
-08
2008
-09
2009
-10
2010
-11
2011
-12
PUBLIC PRIVAtE totAL

10 State of Indian Agriculture
of the country coupled with imbalanced nutrient application, non-judicious use of pesticides,intensivecroppingsystem,anddeclineinsoilbio-diversity and depletion of organic matter in soil are areas of concern requiring urgent attention.
1.15 Furthermore, climate change is likely to impact agricultural land use and production due to less availability of water for irrigation, higherfrequencyandintensityofinterandintra-seasonal droughts and floods, low soil organicmatter, soil erosion, less availability of energy, coastal flooding etc. could impact agriculturalgrowth adversely. For proper management of natural resources and to ensure sustainable agriculture growth in the country, there is need for a land use policy which should be integrated with all developmental programmes for the holistic development of rural areas, natural resource management and eco-restoration.Considering skewed ownership of land, it is necessary to strengthen implementation of laws relating to land reforms, with particular reference to tenancy laws and leasing, distribution of ceiling surplus land and wasteland, providing adequate access to common property and wasteland resources and consolidation of holdings. Computerization of land records, formulation of
policyondiversionofagriculturallandfornon-agricultural uses, updating of land and soil survey maps,finalizationofanenablingframeworkforinvolvement of private sector in natural resource management, and encouraging Public Private Partnership in land and watershed development programmes are urgently required.
1.16 the land reforms agenda has not gone beyond the imposition of land ceilings even though the incidences of tenancy are too high in most parts of the country. Substantial chunks of scarce land remain untilled because of landowners’reluctancetoleaseoutlandforfearoflosingitsownership.Asignificantpercentofthe tenants are landless and marginal farmers. Thesetenantswouldbenefitfromleasing-insinceit would help them to expand their miniscule holdings and allow better use of their labour resources. there is a need to urgently address the issue of legalizing land leasing.
1.17 Provisional results of Agriculture Census 2010-11,areavailableforallStates/UTs.Detailsof number, area and average size of operational holdings in the country as per available data of various Agriculture Censuses are given in tables 1.4 & 1.5 respectively.
Table 1.4: Distribution of Number of Holdings and Area Operated in India as per Agriculture Census 2010-11
Sl. No.
Size Group Number of holdings
(in million)
Area operated (in million ha.)
Average operated area per
holding (ha.)
Percentage of holdings
to total holdings
Percentage of area
operated to total area
1 Marginal(Below1.00ha.)
92.4 35.4 0.38 67.04 22.25
2 Small(1.00-2.00ha.)
24.7 35.1 1.42 17.93 22.07
3 Semi-Medium(2.00-4.00ha.)
13.8 37.5 2.71 10.05 23.59
4 Medium(4.00-10.00ha.)
5.9 33.7 5.76 4.25 21.18
5 Large(Above10.00ha.)
1.0 17.4 17.38 0.73 10.92
All holdings 137.8 159.2 1.16 100.00 100.00Note: total may not tally due to rounding off.

Indian Agriculture: Performance and Challenges 11
Table 1.5: Size Group wise distribution of Average Holdings in the country(Area in ha.)
Sl. No
Size Groups 1970-71
1976-77
1980-81
1985-86
1990-91
1995-96
2000-01*
2005-06*
2010-11P
1 Marginal(Below 1 ha.)
0.40 0.39 0.39 0.39 0.39 0.40 0.40 0.38 0.38
2 Small(1-2ha.)
1.44 1.42 1.44 1.43 1.43 1.42 1.42 1.38 1.42
3 Semi-Medium(2-4ha.)
2.81 2.78 2.78 2.77 2.76 2.73 2.72 2.68 2.71
4 Medium(4-10ha.)
6.08 6.04 6.02 5.96 5.90 5.84 5.81 5.74 5.76
5 Large(Above10ha)
18.1 17.57 17.41 17.21 17.33 17.21 17.12 17.08 17.38
All Size Classes 2.28 2.00 1.84 1.69 1.55 1.41 1.33 1.23 1.16Note: total may not tally due to rounding off. *excludes JharkhandP: Provisional.Source:AgricultureCensus2010-11.
1.18 Increasing demand for industrialization, urbanization, housing and infrastructure is forcing conversion of agricultural land to non – agricultural uses; the scope for expansion of the area available for cultivation is limited. As per AgricultureCensus2010-11,smallandmarginalholdings of less than 2 hectare account for 85 per
cent of the total operational holdings and 44 per cent of the total operated area. the average size of holdings for all operational classes (small & marginal, medium and large) have declined over the years and for all classes put together it has comedownto1.16hectarein2010-11from2.82hectarein1970-71ascanbeseenfromFig.1.5.
Fig. 1.5: Average size of operational holdings as per different Agriculture Censuses
2.82
2.001.84
1.691.55
1.41 1.331.23 1.16
0.00
0.50
1.00
1.50
2.00
2.50
3.00
1970-71 1976-77 1980-81 1985-86 1990-91 1995-96 2000-01 2005-06 2010-11
Ave
rage
size
(in'h
a.)
Reference Year

12 State of Indian Agriculture
1.19 As per the land use statistics, the acreage under different crops and the cropping pattern during the last two decades is given in the following table. While the net sown area has come down from 143million hectares in 1990-91 to 140million hectares in 2009-10, the grosscropped area has gone up by 6 million ha, from 186 to 192 million ha during the same period due
toincreaseinthecroppingintensityfrom130to137percent.22percentoftheacreageisunderpaddy which has remained stable during the last two decades. Area under wheat has slightly increased from13per cent in1990-91 to15percent in 2009-10. Area under coarse cereals hascome down significantly from 19.5 per cent to14.5 per cent during this period.
Table 1.6: Cropping Pattern in India (Area in Million Hectares)
Years 1990-91 2003-04 2009-10(p)
total Area Under Crops 185.74 189.67 192.20
Net area sown 143.00 140.71 140.02Cropping Intensity (percent) 129.89 134.80 137.26Area under Food Crops 141.03 142.12 141.06AreaunderNon-FoodCrops 44.71 47.55 51.14Net Irrigated area 48.02 57.05 63.26totAL/Gross Irrigated Area 63.20 78.04 86.42
Fig. 1.6: Crop-Wise Share (%) in Area
23 22.3 22
12.9 14.2 14.9
19.5 16.5 14.5
13.412.9
12.5
2.12.4
2.4
1.31.7
1.7
3.6 4.95.4
13.5 13.814.9
4.1 4.2 5.2
24.1 25.1 26.6
0%
10%
20%
30%
40%
50%
60%
70%
80%
90%
100%
1990-91 2003-04 2009-10
Non-Food Crops
Cotton
Oilseeds
Fruits & Vegetables
Condiments & Spices
Sugarcane
Pulses
Coarse Cereals
Wheat
Rice

IndianAgriculture:PerformanceandChallenges 13
Irrigation and Water Use Efficiency1.20 Water is a scarce natural resource,fundamental to life, livelihood, food security and sustainable development. Water demand is increasing rapidly due to population growth, urbanization and changing lifestyle. owing to increasing demand of water for domestic, industrial and energy uses, there is a severe constraint in the availability of water for agriculture. Climate change might complicate further the existing temporal and spatial variation inavailabilityofwater.Extremeeventslikefloodsand droughts are occurring more frequently and affecting livelihood and food security. Low water use efficiency, poor maintenance of irrigationsystems and poor recovery of water charges are some of the major problems associated with the management of water resources in the country. Inadequate and sub-optimal pricing of bothpower and water is promoting the misuse of groundwater. the decline in the water table across the country is a matter of serious concern. there is a need to promote participatory management of aquifers to ensure sustainable and equitable use of water. Promotion of micro-irrigationtechniques, alignment of cropping pattern with the availability of water and greater involvement and empowerment of Water Users associations in the command areas could lead to improvement inwateruseefficiency.
1.21 the ultimate irrigation potential in the countryisestimatedatabout140millionhectares.of this, about 58.5 million hectare is from major and medium irrigation sources, and 81.5 million hectare is from minor irrigation sources (about 64.1 million hectare from groundwater irrigation and 17.4 million hectare from surface water). Groundwater provides about 70 percent ofirrigationand80percentofthedrinkingwatersupplies.Thewideninggap(about15%)betweenirrigation potential created and that being utilized is also a matter of concern. this gap needs to be narrowed within the shortest possible time.
1.22 Inefficient water use in irrigation is alsoleading to environmental degradation via water logging and induced salinity. Micro-irrigationtechnologies like drip and trickle systems, surface
and subsurface drip tapes, micro-sprinklers,sprayers, micro-jets, spinners, rotors, bubblers,etc. have great potential in improving water use efficiency. However, despite wide promotion,only about 0.5 million hectare are currentlyunder micro-irrigation (NAAS 2009). Moderntechniques such as micro-irrigation, watershedmanagement, rainwater harvesting and groundwater recharging are vital in utilizing the existing resources and expanding the irrigation system in a viable manner. Major investment in research and development that enhance water use efficiency is required. Extension servicesthat reach out to farmers to help boost the speed of technology-adoption as well as developspecialized skills and knowledge related to water application are necessary.
Inputs for Agricultural Growth1.23 Toenhanceproductivity,easyandreliableaccess to inputs such as quality seeds, fertilizers, pesticides, access to suitable technology tailored for specific needs, the presence of supportinfrastructure and innovative marketing systems to aggregate and market the output from large number of small holdings efficiently andeffectively are necessary. Use of high yielding varieties/hybrids as in the case of Bt cotton and maize, economy in input use, and cost effective farming techniques such as System of Rice Intensification (SRI) are necessary to improvefarm productivity.
Seed and Planting Material1.24 Quality seeds and plantingmaterials arethe key agricultural inputs, which determine the productivity of the crops. The efficacy of otheragricultural inputs such as fertilizers, pesticides and irrigation is largely determined by the quality of the seed used. It is estimated that quality of seedaccountsfor20-25%ofproductivity.Hencetimely availability of quality seeds at affordable prices to farmers is necessary for achieving higher agricultural productivity and production. the varied agro climatic conditions of the country are suitable for cultivation of large number of crops and varieties. this necessitates production of quality seeds and planting materials for a

14 State of Indian Agriculture
huge range of crops for achieving the targeted production. the organized sector comprising of both the private and public sector accounts for about15 to20%of the total seeddistributed inthe country. the remaining portion is contributed by the unorganized sector comprising mainly of farm-saved seeds.Prudentmechanism for seedcertification, testing, labeling and enforcementis necessary to maintain seed quality. Varietal development, plant variety protection, seed production, quality assurance, creation of infrastructure for seeds, transgenics, import of planting material, export of seeds and promotion of domestic seed industry are necessary for a vibrant seed industry. An enabling environment for speedy trial and evaluation of imported seeds for the betterment of agriculture production in thecountryisnecessary.TheSeedsBill,2004hasbeen introduced in the Parliament to overcome the limitation of Seeds Act 1966, and provides for the regulation of seed quality and planting material of all agricultural, horticultural and plantation crops with the view to ensure availability of true to type seeds to Indian farmers; curb sale of spurious and poor quality seeds; protection of rights of farmers, increase private participation in seed production, distribution and seed testing; liberalize imports of seeds and planting material, and align with World trade organization (Wto) commitments and international standards, needs to be enacted with utmost urgency. the seed multiplication ratio from Breeder seed to Foundation seed and from Foundation seed to Certified seedneeds tobe addressedby all theseed producing agencies, both in public and private sectors. Comprehensive and authentic database on seed production and distribution in India by public and private sectors needs to be built for the benefit of all the stakeholders.there is need to ensure adequate and timely availability of seed through appropriate tie ups with NSC, SFCI, State Seed Corporations etc., popularize Good Agricultural Practices (GAP), enhance Seed Replacement Ratio to 20-25% inpulsesand20%incaseofgroundnut,popularizenew farming techniques like ridge-furrowsowing, deep ploughing, zero seed drill and seed
treatment for enhancing agricultural production in the country.
Integrated Nutrients Management (INM)1.25 Chemical fertilizers are the immediate source of nutrients in soils. Consumption of nitrogenous (N), phosphatic (P) potassic (K) fertilizers has increased from 1.1 million tones in 1966-67,theyearprecedingthegreenrevolutionto 27.7million tonnes in 2011-12. The all-Indiaaverage consumption of fertilizers has increased from105.5kgperhain2005-06to144kgperhain2011-12.However,ourconsumption ismuchlower than that in Bangladesh (118), Pakistan (205) and China (396). The world averageconsumptionoffertilizerwas107kgperhectarein 2009. Further, veryhighvariabilityhasbeenobserved in fertilizer consumption across the states and crops. While per hectare consumption is243.56kginPunjaband266.11kginAndhraPradesh,itiscomparativelylowinMP(88.36kg/ha),Orissa(56.52kg/ha),Rajasthan(62.35kg/ha)and Himachal Pradesh (55.18 kg/ha) and below 5 kg/ha in some of the North Eastern States.
1.26 With a view to encourage balanced use of fertilizers, government introduced Nutrient Based Subsidy (NBS) policy from April 2010whereunderafixedrateofsubsidyisannouncedon nutrients, namely, nitrogen (N), phosphate (P), potash (K) and sulphur (S). Price of urea is administratively decided whereas prices of other fertilizers are market determined. Consequently, price of urea is much lower than that of other fertilizers. this has resulted in excessive use of urea, thereby distorting the balanced norms of fertilizer application. Balanced fertilization would have ensured adequate availability of nutrients in soil to meet the requirement of plants at critical stages of growth. this calls for promoting soil test based balanced and judicious use of chemical fertilizers in conjunction with organic sources of nutrients to sustain and improve soil health and its productivity. Further, lack of awareness about soil testing and intensive agriculture is leading towidespreaddeficiencyofmicronutrientssuchas zinc, iron, manganese and boron. Similarly,

Indian Agriculture: Performance and Challenges 15
imbalanced NPK application, rising multi nutrient deficiency and lack of application oforganic manure are leading to reduction in carbon content in the soil. Soil organic Carbon (SOC)iscentraltosoilhealthasitinfluencesoilstructure, water retention, microbial activities, soil aeration and nutrient retention. Depletion in soil organic carbon is leading to poor fertilizer useefficiency(FUE)ofthesoilwhichonaverageisestimatedtobe33%forN;15%forP;20%forKandmicronutrientsasagainst50%forN;30%forPand50%forKwiththebestmanagementpractices. Intensive agriculture, while increasing food production, has at the same time caused second generation problems in respect of nutrient imbalance including greater mining of soil nutrients, depletion of soil fertility, emerging deficiencies of secondary and micronutrients,decline of the water table and quality of water, decreasing organic carbon content, and overall deterioration in soil health. Government is promoting Integrated Nutrient Management
(INM), advocating soil test based balanced and judicious use of chemical fertilizers in conjunction with organic sources of nutrients for improving soil fertility. Introduction of customized fertilizers on the basis of soil testing and the agronomic multi-locationaltrialswhicharecropspecificandarea specific are recommended. Promotion ofINM which includes soil test based balanced and judicious use of chemical fertilisers in conjunction with bio-fertilisers, and organic manures likeFYM, compost, vermi-compost, green manure,Fruit and Vegetable Waste Compost, MSW compost etc.; use of complex fertilisers (NPK) and customized fertilisers which are considered to be agronomically better and more balanced fertilisers in place of straight fertilizers; use of fertilisers fortified with micro-nutrients; use ofBio-fertilisers - phosphate solubilizing bacteria;Azospirillum, Azotobacter, and Rhizobium; potash mobilizing biofertilizers which can supplement upto 20-25% of chemical fertilizers(NPK). In this context seed supplying agencies
Fig. 1.7 : State wise Fertilizer consumption, Kg/Ha

16 State of Indian Agriculture
mayconsiderprovisionofbio-fertilisersandseedtreating material along with seed packets.
Integrated Pest Management1.27 the protection of crops from depredations of pests and diseases is a sine qua non for higher agricultural productivity, increased farm incomes and enhanced food security for the nation. this is especially significant for a nation like Indiawhich is faced with rising demand for food and agricultural produce for a growing population. In a scenario where agricultural productivity in India is below global bench marks and per capita availability of agricultural farm land is diminishing, risk of production loss upto 30%from incursion of pests and diseases needs to be averted. It is noteworthy that use of chemical pesticides in India is very low and estimated at only 381 grams per hectare (technical gradepesticide) when compared to the global average of 500gramsoftechnicalgradepesticideperhectare.Information provided by State Governments revealthataround90millionhectaresofcroppedarea is within the ambit of pesticides usage leaving out significant swathes of agriculturalland in the country where pesticides are not being applied to crops. Different estimates show thatmorethan50%ofconsumptionofpesticidesis garnered by insecticides, whereas herbicides and fungicides together contribute about 30-40%oftotalpesticideconsumption.Theusageofchemical pesticides which had fallen drastically since 1991 has witnessed a revival during the 11th FiveYearPlan.Bio-pesticidesusagehasshownasteady increase in the last two decades to reach a consumptionlevelofmorethan6000MTsduring2011-2012 as per information provided by theStates. Among the crops, cotton, rice, vegetables and fruits account for the largest share of pesticide consumption in the country.
1.28 It is evident from the above that while spread and dosage of pesticide application in the country is low, yet in the context of rising concerns centered around hazards associated with pesticides residues in food and environment, there is a need to adopt strategies and practices that are consistent with principles of good agricultural
practices. Recognizing the imperative of safe and judicious use of pesticides, the Government of India and the State Governments have been trying actively to promote Integrated Pest Management. IPM advocates adoption of cultural and mechanical tools and need based application of bio-control agents and bio-pesticides, whilesafe and judicious use of chemical pesticides is recommended only as a measure of last resort. IPM is being promoted by the Government of India and State Governments primarily through training and demonstrations in farmers field schools, capacity building programmesfor extension personnel and support to State Governments for setting up of Bio-control andBio-pesticidestestinglaboratoryfacilities.
1.29 Whereas efforts are being made to control pests and diseases in crops, it is equally important in the liberalized global trade environment to shore up our defences against introduction of exotic pests and diseases into the country through agricultural imports which have the potential to threaten agricultural/ horticultural crops andbio-securityof thecountry.Thequarantineregulatory framework is built around the Plant Quarantine Order 2003 which has laid downagricultural commodity and country specificphytosanitary treatments for imports into the country. the regulatory responsibilities are primarilydischarged throughPlantQuarantineStations established in all regions of the country manned by technical personnel and equipped with laboratory facilities.
Mechanization1.30 Availabilityofadequatefarmpowerisverycrucial for timely farm operations, increasing landandlabourefficiency,increasingproductionand productivity and reducing crop produce losses. Farm mechanization can also address the issues of scarcity of farm labour during peak agricultural seasons like sowing and harvesting. It has been observed that farm power availability and foodgrain yield have a direct relationship. States with higher farm power availability have, in general, more productivity.
Indian Agriculture: Performance and Challenges 17
1.31 The tractor density in India is about 16tractors for1,000hectares, asagainst theworldaverage of 19 tractors and that in USA 27 tractors per one thousand hectare of cropped area. the increasing threat to natural resources, notably land and water, has further necessitated switching over to machine assisted resource-conservation techniques such as zero-tillage,raised-bedplanting,precisionfarming,etc.Eventhough farm mechanization is increasing in India, itismostlyregionspecific.Thedecreasingtrendin operational land holdings is an impediment in the growth of agricultural mechanization. Small and marginal farmers who cultivate about 85 per cent of the holdings and account for nearly 44 per cent of the total cultivates area cannot afford high cost agricultural machines. High cost of mechanization and lower credit worthinessresults in the ‘exclusion’ofmajorityof small and marginal farmers in India from the benefit of farm mechanization The useof farm machinery is also dependent on the availability of other infrastructural services in theruralareas.Mechanizationofsmallandnon-contiguous group of lands is found to be against ‘economiesofscale’especially foractivities likeland preparation and harvesting, thereby making individual ownership of agricultural machinery uneconomical. In order to make farm equipments and machines available to the farmers at affordable cost, Farm Machinery Banks can be established to custom hire the machines and equipments to the farmers. this will, besides increasing the power availability, help in removing the disparity in availability the farm power among various states and reduce the drudgery associated with various farm operations.
1.32 Recognizing the need to spread thebenefits of agricultural mechanization amongall strata of farmers, Department of Agriculture & Cooperation is integrating the components of agricultural mechanization under various schemes and programmes through promotion of ‘Custom Hiring Centre’ for agriculturalmachinery.
1.33 Ithasbeenestimatedthatabout18to25%losses occur in the entire food supply–chain from production to consumption. A three pronged
strategy involving (i) compression of the supply–chain by linking producers and markets; (ii) promoting processing in production catchments to add value before the produce is marketed; and (iii) developing small-scale processingrefrigerated chambers or cold storage using conventional and non conventional sources is required to reduce post harvest losses. this would require greater attention to post-harvestengineering research and development.
Labour and Agricultural Wages1.34 Agriculture is a labour intensive activity.Cost of cultivation data shows that labour accounts formorethan40percentofthetotalvariablecostofproduction in most cases. therefore, availability of labour to work in agriculture is crucial in sustaining agricultural production. Agricultural wages have traditionally been low, due to low productivity, large disguised unemployment in agriculture sector, and lack of sufficientemployment opportunities elsewhere. However, in recent years there has been a perceptible change in this trend due to economic growth and adoption of employment generation policy like the MGNREGA and increase in minimum wages under the Minimum Wages Act. the average daily wagesforagriculturalfieldlabourforploughingand harvesting at all India level have increased at the rate of 8.7 per cent and 9.2 per cent per annum during 2001-02 to 2010-11 respectivelyas against the average wages paid for industries covered under Annual Survey of Industries (ASI) at6.3percentperannum.However,agriculturalwages, in general, are still much lower than the industrial wages. With skill development this gap will narrow down, putting further pressure on availability and cost of agricultural labour. this further strengthens the necessity for agricultural mechanization in a manner that is inclusive and suitable for Indian conditions.
Agriculture Credit and Insurance1.35 Agriculture Credit plays an importantrole in improving agricultural production, productivity and mitigating the distress of farmers. Government has taken several measures forimprovingagriculturalcreditflowtofarmers.

18 State of Indian Agriculture
As against the credit flow target of Rs.4,75,000crorefortheyear2011-12,achievementhasbeenRs.511029crore,107%ofthetarget.Thetargetofcredit flow for the year 2012-13 has been fixedat Rs.5,75,000 crore and achievement as at endSeptember,2012isRs.2,39,629crore.CroploansuptoaprincipalamountofRs.3lakharebeingprovided effectively at 4 per cent per annum with an interest subvention of 4 per cent for timelyrepaymentofloans.Further,thebenefitofinterest subvention has been extended to small and marginal farmers having Kisan Credit Card for a further period up to six month post harvest against negotiable warehouse receipt for keeping their produce in warehouses to avoid any distress sale. the limit of collateral free farm loan has been increasedfromRs.50,000toRs.1,00,000.ARevivalPackage for Long term Cooperative Credit Structure (LtCCS) is also under consideration of the Government in consultation with State Governments.
1.36 Over the years, there has been asignificant increase in the share of formalfinancial institutions (commercial banks, RRBsand cooperatives) in the total credit availed by cultivator households. The formal financialinstitutions accounted for about 66 per cent of the total credit to cultivator households by the early 1990s.However,theshareofformalinstitutionalcredit to agriculture witnessed some reversal duringtheperiodbetween1991and2002whichwas partly due to a contraction in rural branch network in the 1990s, and partly due to thegeneral rigidities in procedures and systems of institutional sources of credit. the regional distribution of agricultural credit by commercial banks, both in terms of quantum of credit and the number of accounts, has been skewed. there is asignificantconcentrationinthesouthernstates(Andhra Pradesh, Karnataka, Kerala, tamil Nadu) followed by the northern and western states. In contrast, the share of the eastern (Bihar, Jharkhand, odisha and West Bengal) and the north-easternstateshasbeenlow.Further,nearlythree quarters of the farmer households still do not have access to the formal credit system and have no means to insure themselves against income shocks. this leaves them vulnerable to the informal money lenders.
1.37 With a view to encourage the farmersto adopt progressive farming practices, high value inputs and higher technology and to stabilize farm incomes, insurance coverage in the event of failure of the notified crops as aresult of natural calamities, pests and diseases, the National Agricultural Insurance Scheme (NAIS) has been introduced in the country from Rabi 1999-2000 season. Under the scheme, atpresent, 10% subsidy in premium is availableto small & marginal farmers which is shared by the Central and respective State Government on 50 : 50basis alongwith claims fornormal suminsured & indemnity level for food and oilseed crops. to improve further and make the NAIS easier&morefarmerfriendly,ModifiedNationalAgricultural Insurance Scheme (MNAIS) has been implemented onpilot basis in 50districtsfromRabi2010-11season.BesidestheNAISandMNAIS, Pilot Weather Based Crop Insurance Scheme (WBCIS) and Pilot Coconut Palm Insurance Scheme (CPIS) are being implemented by the government. Despite the various schemes launched by the government from time to time, agriculture insurance coverage in terms of area, number of farmers and value of agricultural output insured is very small as compared to the total number of holdings/farmers (137.8million as per agriculture census 2010-11), thetotal cultivated area (159.2 million hectares) and the value of agricultural output. A broader base both in terms of area covered and crops insured is necessary for the viability of the schemes.
Agricultural Extension Services1.38 Over the years, extension system in thecountry has been exposed to multiple challenges. Farmers’ needs in terms of information andtechnology support have become more complex due to rapidpace of developments in the fieldofagriculture.Climate-change,depletingnaturalresources, scarcity of labour and volatile market forces are some of the concerns that have put tremendous pressure both on the farmers as well as extension system in the context of increasing theproductivity,profitabilityandsustainabilityof Agriculture. Rebuilding an agricultural extension system that is capable of adapting to

Indian Agriculture: Performance and Challenges 19
the changing agriculture scenario within the country and globally remains a big challenge. Efficaciousextensionservicesarebeingprovidedby organising farmers into groups (FIG, CIG, FACs, Producer Companies etc.); reaching out to the farmers directly by ensuring availability of dedicated functionaries under AtMA and establishing convergence not only between research & extension but also among extension functionaries under different schemes and putting inplaceextensiveandintegrated5-tiereduseofICTtools&massmedia.Qualityofservicesbeingprovided through Kisan Call Centres (KCCs) has been enhanced significantly with use of lateststate of the art tools, dissemination of information about new schemes & programmes and effective supervision & greater involvement of State Governments. the success story on production of foodgrain, pulses, vegetables, and fruits during last three years is an eloquent testimony of the way extension machinery worked in tandem with other programmatic interventions (e.g. RKVY, NHM, NFSM, MMA etc.) and has succeeded in propagating technologies and providing timely information to farmers.
Agricultural Prices and Markets1.39 Food and agricultural commodity pricesin India are primarily determined by domestic demand and supply factors. Market micro infrastructure, the systems and procedures of commodities trading and players determine the marketefficiency.Ithasbeenobservedthatthereis wide spread imperfection in the agricultural produce markets. there is general opaqueness and poor price transmission mechanism. Consequently, there is a wide gap between the prices received by the farmers and the prices paid by the consumer. At times, the farmers are not able to receive a price to cover his cost of production while the consumers are paying an abnormally high price for the same commodity. this is a major concernforthepolicymakers.Highfoodinflationwith an inadequate supply response, aggravated by logistic and market-related constraints areother areas requiring attention. Imperfect market conditions, restrictions on the movement of agricultural commodities due to infrastructural
constraints, transport bottlenecks and local taxes influencetheretailpricestrendsacrossthemajormarkets and consumption centres.
1.40 Theprincipalfactorsbehindthehigherlevelsofinflationintherecentperiodareconstraintsinproduction and distribution especially in high value items such as pulses, fruits and vegetables, milk and dairy products, egg, meat and fish.Increase in prices can be attributed to both supply and demand factors. the per capita availability of some of the items such as cereals and pulses has been declining resulting in some pressure on their prices. In the case of fruits and vegetables, milk, egg, meat and fish, prices have gone updespite an increase in per capita availability. this is due to a changing pattern in the demand of the households for high value items with increasing income levels. Market imperfections also add to these trends by restricting the price transmission. these include lack of infrastructure facilities like efficient transport facilities, storage,processing,marketing and credit facilities. When growth picks up at low income levels the demand for food items would increase as income elasticity of demand for food is higher at lower levels of income. thus, lower per capita availability of foodgrains and structural shortage of key agricultural commodities like oilseeds and pulses combined with the rising demand have kept food priceinflationhigh.Thisprocesshasgotfurtheraccentuated by spikes in global food prices through international transmission. Rising international prices of oil also impacted the cost of production of agriculture through increase in input costs of fertilizers, transportation and a general rise in the cost of all other inputs and services. Increase in cost of production results in increasing the MSP ofagriculturalcommoditieswhichalsoinfluencesmarket sentiments. the enduring solution to price inflation lies in increasing productivity,keeping the cost of production under control and removing market imperfections through reforms and infrastructure improvements. the wide variations in market fees, commission charges, lack of grading, standardization and packaging facilities are resulting in higher marketing transaction costs and low price realization by the farmers in regulated markets. this has resulted

20 State of Indian Agriculture
into fragmented supply chains with large intermediations. Establishment of an effective system of grading and marking of agriculture produce is necessary for an electronic agricultural marketing exchange.
1.41 Contract farming has considerable potential in terms farmers’ access to moderntechnology, quality inputs and marketing support through contractual agreement betweenprocessingand/ormarketingfirmsforproduction support at predetermined prices. It is necessary that direct marketing and contract farming is promoted to facilitate enhanced share of producers in consumer’s rupee. Development of agricultural marketing infrastructure is the foremost requirement for the growth of comprehensive and integrated agricultural marketing system in the country. the development of alternative and competitive marketing channels is necessary to induce competition in the existing marketing systems and to facilitate farmers to sell their produce at remunerativeprices.Creationofscientificstoragenearer to farm is necessary to avoid wastage and deterioration of the produce.
1.42 Many of the States are yet to adopt the model Agricultural Produce Marketing Committee (APMC) Act suggested by the Centralgovernmentin2003.TheAPMCActsofnon-reformedStatesdonotallowtheprocessorto directly buy the agricultural produce from agriculturists outside the market yard. this leads to long intermediation and high marketing cost, which result into lower share of farmers of the rupee paid by consumers and consumers also do not get fresh produce at reasonable prices. Many of the States that have amended their APMC Acts have not done so strictly on the lines of the Model law circulated by the Centre. Much needed provision for permitting the out-of-mandi transactions and the matter of exemption of market fee on horticultural perishables being pursued by the Department with States, do not find place in the amended statutes in severalStates. the Department is working towards an integrated nationwide market for agricultural produce.
1.43 Multiple intermediaries, high markettaxes ranging from 13% to 15.5% ad-valorembesides other market charges, poor marketing infrastructure and access are some of the reasons for high retail prices and these need to be rationalized. States should waive off market fee on fruit and vegetables under the APMC Act to ensure unhindered trade in the perishable commodities. there is a need for a Central legislation to ensure barrier free movement of agriculture commodities across the country to develop an integrated national market.
1.44 In the context of foodgrains policy, concern has been raised about simultaneous occurrence of high food inflation and largefoodgrains stocks in our granaries. the various commodity wise stocks limit notified alsodiscourages investment in storage facilities. the stock limits and movement of agricultural commodities across the country need to be freed so as to facilitate an integrated national market for agricultural produce across the country. Besides improving storage facilities, there is a need to redesign the mechanics of procurement and release of foodgrains to the market to ensure that the impact on prices is substantial in the desired direction. In a large number of markets in several states, such as Bihar, eastern UP, orissa, Assam, M.P. and Chhattisgarh where surpluses are emerging, there is a need to extend the price support mechanism for effective procurement operations and to strengthen the market infrastructure.
1.45 ThePrimeMinister’sEconomicAdvisoryCouncil (PMEAC) has also stressed in its recent Economic outlook report the need for agricultural reforms. the areas that have been identified for urgent attention include thereduction and rationalization of input subsidies, ensuringglitch-freemarketingof farmproduceand liberalizing tenancy arrangements. the time schedule for rationalizing fertilizer subsidy through the nutrient-based subsidy regimecalls for decontrolling the prices of urea, the most consumed fertilizer. Inefficiency inpowergeneration and huge transmission losses are not letting to remove subsidies on power for agricultural purposes. the Council has also

Indian Agriculture: Performance and Challenges 21
recommended for removing subsidies on canal watertoimprovewateruseefficiencyandcalledfor encouraging involvement of consumers in water and power distribution.
The Way Forward1.46 Whiletherehasbeenasignificantincreaseinproductionoffoodgrainsandotheragri-producein the recent past, there are formidable challenges, e.g. a decline in the average size of land holding, dwindlingwaterresourcesandinefficientwateruse, the adverse impact of climate change, shortage of farm-labour, poor and inefficientmarketing infrastructure, and increasing costs and uncertainties associated with volatility in international markets. the main determinants of agriculture growth would be: (a) viability of farm enterprise and returns to investment that depend on productive infrastructure, such as soil and water conservation and expansion and improvement of irrigation systems, market access, prices and risk; (b) availability and dissemination of appropriate technologies that depend on quality of research and extent of skill development; (c) plan expenditure on agriculture and in infrastructure which together with policy must aim to improve functioning of markets and more efficientuse of natural resources; and (d)governance in terms of institutions that make possible better delivery of services like credit, quality inputs like seeds, fertilizers, pesticides and farm machinery. In addition, certain regional imbalances must be clearly addressed. As the domestic supply of pulses, oilseeds and fruits and vegetables fall short of the demand, there is a needforcropdiversificationtowardsthesehighvalue crops. From the point of both food security and sustainability, extension of green revolution to low productivity areas in the Eastern Region where there is ample ground water and surplus labour needs much higher emphasis. Equally important would be the development of suitable technologies and crop varieties particularly for rain-fed area, as 55per cent of cropped area israin-fed.
1.47 Most of the smallholders sell their produce immediately after harvest, invariably realizing lower prices and later buy the commodities
during the lean season at much higher prices.this is partly due to smallholders need for cash and partly due to lack of adequate technologies and facilities for post harvest handling, storage and processing. this coupled with poor market information and weak market integration, adds to supply distortion and price volatility. to increase and stabilize supplies and thereby mitigate price volatility, improved infrastructural services, particularly for transportation, storage andprocessing, pro-smallholder innovations increditflow,organisationofproducersandotherstakeholders in the agriculture value chain with clear roles and responsibilities in cooperatives which can provide an array of services from provision of inputs to enhancing market access, financialservices,technologiesandinformation.
1.48 KCC is an innovative tool of credit delivery to meet the production credit requirement of the farmers in a timely and convenient manner. All eligible farmers should be brought within the umbrella of KCC in time bound manner and it should be made single product catering the all credit needs of farmers. the National Agricultural Insurance Scheme (NAIS) and modified NAIS(MNAIS) provide risk coverage of the crops on the basis of their yield. While the unit area for MNAIS is village/village panchayat, NAIS also allows notification of village as the unit area.However, many States notify a larger unit area such as Block, taluk and tehsil. the larger unit area does not cover the risk of individual farmers effectively because of larger variations in the yield in the unit area. the States are reluctant to notify a smaller unit area (such as a village) because of increased requirements of the minimum number of crop cutting experiments that has to be undertaken which is both costly and time consuming affair. the States need to deploy additional manpower and provide adequate training to the personnel engaged in the crop cutting experiments to ensure accurate and timely availability of yield data for effective implementation of the insurance schemes. Use of modern technology such as remote sensing through satellite imagery may be deployed to reduce the cost and improve the accuracy of crop cutting experiments.

22 State of Indian Agriculture
1.49 to sum up, the thrust areas for the agriculture sector include enhancing public sector investment particularly in research and technology transfer along with institutional reforms to make it more accountable towards delivery, conservation of land, water and biological resources, development of rain fed agriculture, development of minor irrigation and water use efficiency, timely and adequateavailabilityofinputs-seeds,fertilizers,pesticides,developing efficient marketing infrastructure,increasingflowofcreditparticularlytothesmalland marginal farmers.
1.50 Improvedperformance at farm levelwillresult in improved food security and improved farm livelihoods only if other components in the value-chain such as infrastructure supporting
agricultural upstream and downstream activities, including transport, storage, processing and marketing facilities for agricultural products are also developed simultaneously. Continuous innovation to improve productivity and competitiveness of the agriculture sector are necessary to create jobs, generate income and alleviate rural poverty. From the government’sside, enabling policies and institutions in a variety ofdomains-fromR&Dtotradeandmarkets,fromnatural resource governance to collective action by agricultural producers, agricultural extension and rural advisory services are necessary to bring knowledge, technologies, and services to farmers and entrepreneurs. Investment in relevant public goods which works both as a catalyst of, and complements to, private investment in agriculture is necessary.

2.1 Land, water resources, soil and biodiversity which are the natural resources for agriculture areunderconsiderablestrain.India’stotalgrosscropped area is about 192.2 million hectares and the net sown area is 140million ha. Overthe last three to four decades, net sown area remains stagnant and possibility of increasing it is minimal due to increasing demand on land for other purposes. the ultimate irrigation potential ofthecountryisestimatedtobeabout140millionha out of which about 76 million ha is met by surface water and remaining 64 million hectare fromgroundwatersources.Presently,about63millionha(45%)ofcroppedarea,isreportedtobe irrigated.
2.2 the demand for meeting food and water for a growing population from a shrinking natural resource base has shifted focus to enhance agricultural production in a sustainable manner. the progressive fragmentation of land holdings, degrading natural resource base and emerging concerns of climate change will further escalate pressure on land and water. Land and water resourcesbeingfinite, increasedproductionhasto come from the same restricted net sown area by increasing productivity. thus, increase in agricultural production will mainly come from enhancement in farm productivity with optimal use of available water and land resources.
2.3 Agricultureproductionismainlydependenton natural resources e.g. land, water, soil, biodiversity (plant, animal and microbial genetic resources), along with air and sunlight. But these natural resources are rapidly shrinking due to demographic and socio-economic pressures,monsoonal disturbances, increasing frequencies offloodsanddroughtsetc.Overuseofmarginallands, imbalanced fertigation, deteriorating soil health, diversion of agricultural land to nonagricultural uses, misuse of irrigation water, depleting aquifers & irrigation sources, salinization of fertile lands and water-loggingcontinue apace. During the last three decades while considerable emphasis has been laid on
CHAPtER 2
Natural Resource Management
development of natural resources (land, water and perennial biomass), negligible attention towards sustainablesocio-economicmanagementoftheseresources have reached to unprecedented levels. For making agriculture sustainable, to meet country’sfoodrequirement,soilhealthandwateravailability are to be maintained at levels that would re-assure farmers to pursue agriculturalactivities with higher level of productivity.
Land & Land Use2.4 Land use classification based on differenttype of uses indicate that a little more than half of total land mass of 328.73 million hectare inthe country is used for agriculture. this includes 140.02millionhanetsownareaundercultivationand 26.17 million ha for non-agricultural uses.over the years there is a gradual increase in area under non-agricultural uses. During the lastdecade (1999-2000 to 2009-10), area under non-agricultural uses has increased by 2.57 million ha (11%). During the same period cultivable landhasmarginallydeclinedby1.4millionha(0.8%)andnetsownareahasdeclinedby1.04millionha(0.7%).Asanormalprocess,ofurbanizationand development, while area under non-agricultural uses is increasing, measures taken by government, has reclaimed land for cultivation from degraded/culturable waste land category. The net cultivated area increased significantlyby about 18% from 119 million ha in 1950-51
Box 2.1: Land Use in India
• Forestarea:70millionha(21.2%)• Non-agriculturaluses:26.17millionha(8%)• Barren&uncultivable:16.78millionha(5.1%)• Culturablewaste:12.86millionha(3.9%)• Permanentpastures:10.15millionha(3.1%)• Miscellaneoustreecrops:3.35millionha(1%)• Fallowland:26.24millionha(8%)• Agriculturalland:182.46millionha(55.5%)• NetSownArea:140.02millionha(42.6%)Source: Directorate of Economics & Statistics

24 State of Indian Agriculture
to140millionha in1970-71andsincethenit ismore or less stable at 140million ha,where asthecroppingintensityhasincreasedfrom111%to137%duringthesameperiod.
2.5 During2010-2011,foodgrainsaccountedforthelargestshareofabout65%ofgrosscroppedarea.Duringthelastdecade(2000-2001to2010-2011)theareaundercereals,pulsesandoilseedshave increased by about 5.7 million ha, 6 million ha and 4 million ha respectively. However, during the same period the area under coarse cereals has declined by about 2.6 million ha. Analysis of the shift in area under various crops (in gross cropped area) reveals that share of jowar, bajra, ragi, barley has continuously declined, whereas area under pulses, rice, fodder, tobacco has more or less remained at the same level and share of maize, wheat, sugarcane, condiments and spices, fruits & vegetables, oilseeds, tea, coffee and fibershas increasedwhencompared to1950-51levels.Duringthelast10yearsthereisnodrasticchange in cropping pattern, while year to year fluctuationsarebeingobserved.However thereis a gradual increase in area under fruits and vegetables by about 1.6 million ha during the same period.
Challenges2.6 Land Fragmentation: Increasing human and animal population has reduced availability of land over the decades. Per capita availability of landhasdeclinedfrom0.89hectarein1951to0.32hectare in2001and isprojected to furtherslidedownto0.20hectarein2035.Asfarasagriculturalland is concerned, per capita availability of land has declined from 0.5 hectare in 1951 to 0.18hectare in 2001 and is likely to decline further.the average land holding size which was about 1.33hain2000-01hasdeclinedto1.16haduring2010-11.
2.7 Diversion of Agricultural Land: there has been an increase in putting agricultural land into non agricultural uses to accommodate developmental activities like industries, housing, transport, irrigation, recreational facilities etc. It has been estimated that during the period 1950-51to2009-10,thepercentageoflandusedfor
non agricultural purposes over reporting area has increasedfrom3.3to8.6%.Duringthelastdecade(1999-2000to2009-10),areaundernon-agriculturaluseshasincreasedby2.57millionhai.e.by11%.Due to large demand of land for infrastructure, more and more fertile land is being diverted. States where proportion of land under non agricultural usesishigherthanallIndiaaverage(%)areWestBengal, tamil Nadu, Bihar including Jharkhand, Sikkim, Assam, tripura, Goa, Andhra Pradesh, Kerala, UP, Haryana and Uts like Chandigarh, Delhi, Pudduchery and Daman & Diu.
2.8 Unwanted Crop Diversification: Apart from the diversion of lands from cultivation to nonagricultural uses and damage due to industrial waste, pollution, water extraction by the industries, townships etc., there is a tendency for diversified intensive agriculture for highereconomic gains based on market demands in areasnotconducivetoagro-climaticconditions.there is a need for shift in land use and cropping patterns in accordance to the climatic parameters, land characteristics and water availability scenarios.
2.9 Climate Change: Climate Change is likely to impact agricultural land use and production due to less availability of water for irrigation, higher frequency and intensity of inter andintra-seasonaldroughtsandfloods,lowsoilorganic matter, soil erosion, less availability of energy,coastalfloodingetc.ObservationsofInterGovernmental Panel on Climate Change (IPCC) reaffirms that the adverse impact of climatechange due to rising temperature and extreme weather events on the food production systems could impact agricultural growth adversely.
Policies & Programmes2.10 National Policy for Farmers, 2007 (NPF,2007)emphasizesonprotectionandimprovementof land, water, biodiversity and genetic resources for sustained productivity. Reflection of NPF,2007 is evident in the proposed draft LandAcquisition,Relief andRehabilitationBill, 2011where in minimum acquisition of agricultural landfornon-agriculturaluseisrecommended.

Natural Resource Management 25
2.11 Various Watershed Development Programmes (WDPs) are being implemented by Ministry of Agriculture and Ministry of Rural Development for development of degraded lands. these programmes are National Watershed Development Project for Rainfed Areas (NWDPRA), Soil Conservation in the Catchments of River Valley Project & Flood Prone River (RVP & FPR), Reclamation and Development of Alkali & Acid Soils (RADAS), Watershed Development Project in Shifting Cultivation Areas (WDPSCA) and Integrated Watershed Management Programme (IWMP). Under these WDPs, since inception till end of Eleventh Five Year Plan, an area of about 58 million ha has been developed.
2.14 Land Reform: Considering skewed ownership of land, it is necessary to strengthen implementation of laws relating to land reforms, with particular reference to tenancy laws and leasing, distribution of ceiling surplus land and wasteland, providing adequate access to common property and wasteland resources and consolidation of holdings. Allaying the fears of a farmer regarding possible alienation from his own land because of leasing it out to the retailer/processor requires the freeing up of land lease markets. Legalizing lease markets also protects the interests of the retailer/processor, and enables him to undertake larger investments. Registration of land deeds and the computerization of land records will bring about greater transparency and reliability, improve the marketability of land and enhance access of farmers to institutional credit that requires pledging of collaterals.
2.15 Computerization of Land Records: Land and soil surveys should be completed and inventory of land resources should be prepared in each State so that resource allocation is based on a reliable data base. A “soil to satellite” approach needs to be promoted along with computerization of land records for availability of easier, accurate and transparent information on land and land uses.
2.16 Policy on Diversion and Fragmentation of land: Productive agricultural land should not be diverted for industrialization or urbanization. In case of extreme national need, it could be stipulated that Industries who are provided with agricultural or other lands for development projects should compensate for treatment and full development of equivalent degraded/waste lands elsewhere. Considering the small size of landholding,itisnotpossibletoreapthebenefitsof economies of scale. Hence, there is need for aggregation of land through contract farming, cooperative farming, collective farming etc. to achieve this farmer producer organization, farmer industry partnership, farmer-farmerpartnership with enabling provisions in policies and reforms be encouraged to scale up input application, bringing in higher investment and reapthebenefitofcollectivebargainingpowerofsmall and marginal farmers.
Way Forward2.12 Incentivize Conservation Agriculture: Conservation Agriculture can be ensured by incentivizing sustainable farm operations through power connectivity, additional input subsidy, low premium on crop insurance etc.
2.13 Land Use Policy: For proper management of natural resources and to ensure sustainable agriculture growth in the country, there is need for a land use policy. As per Seventh Schedule of the Constitution of India, Land and Water falls under the purview of State Governments and it is for the States to bring about suitable legislation for regulating conversion of agricultural land for non- agricultural purposes. Land use planningshould be integrated with all developmental programmes, especially MGNREGA for holistic rural development, natural resource management andeco-restoration.
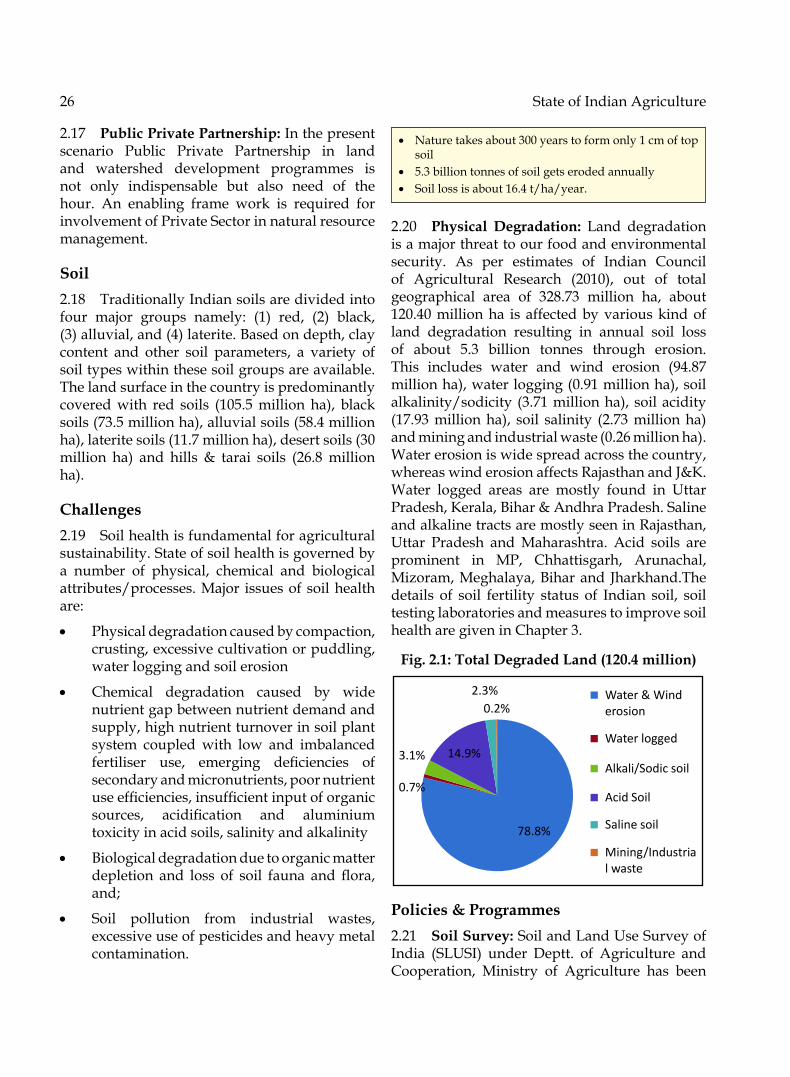
26 State of Indian Agriculture
2.17 Public Private Partnership: In the present scenario Public Private Partnership in land and watershed development programmes is not only indispensable but also need of the hour. An enabling frame work is required for involvement of Private Sector in natural resource management.
Soil2.18 traditionally Indian soils are divided into four major groups namely: (1) red, (2) black, (3)alluvial,and(4)laterite.Basedondepth,claycontent and other soil parameters, a variety of soil types within these soil groups are available. the land surface in the country is predominantly coveredwith red soils (105.5million ha), blacksoils(73.5millionha),alluvialsoils(58.4millionha),lateritesoils(11.7millionha),desertsoils(30million ha) and hills & tarai soils (26.8 million ha).
Challenges2.19 Soil health is fundamental for agricultural sustainability. State of soil health is governed by a number of physical, chemical and biological attributes/processes. Major issues of soil health are:
• Physical degradation caused by compaction, crusting, excessive cultivation or puddling, water logging and soil erosion
• Chemical degradation caused by wide nutrient gap between nutrient demand and supply, high nutrient turnover in soil plant system coupled with low and imbalanced fertiliser use, emerging deficiencies ofsecondary and micronutrients, poor nutrient useefficiencies,insufficientinputoforganicsources, acidification and aluminiumtoxicity in acid soils, salinity and alkalinity
• Biological degradation due to organic matter depletion and loss of soil fauna and flora,and;
• Soil pollution from industrial wastes, excessive use of pesticides and heavy metal contamination.
2.20 Physical Degradation: Land degradation is a major threat to our food and environmental security. As per estimates of Indian Council of Agricultural Research (2010), out of totalgeographical area of 328.73 million ha, about120.40millionha isaffectedbyvariouskindofland degradation resulting in annual soil loss of about 5.3 billion tonnes through erosion.this includes water and wind erosion (94.87 millionha),waterlogging(0.91millionha),soilalkalinity/sodicity (3.71millionha),soilacidity(17.93millionha), soil salinity (2.73millionha)andminingandindustrialwaste(0.26millionha).Water erosion is wide spread across the country, whereas wind erosion affects Rajasthan and J&K. Water logged areas are mostly found in Uttar Pradesh, Kerala, Bihar & Andhra Pradesh. Saline and alkaline tracts are mostly seen in Rajasthan, Uttar Pradesh and Maharashtra. Acid soils are prominent in MP, Chhattisgarh, Arunachal, Mizoram, Meghalaya, Bihar and Jharkhand.the details of soil fertility status of Indian soil, soil testing laboratories and measures to improve soil healtharegiveninChapter3.
engaged in conducting soil survey of the country since 1958 for National land based developmental programme. Soil survey aims at generating scientificdatabaseonsoilandlandresourcesforplanning and implementation of soil and water conservation (through watershed programmes) for natural resource management. Database is being generated to meet the needs for planning at National/State/Basin/District/Catchment and Village/micro-watershed levels. RapidReconnaisance Survey (RRS) is to demarcate and identify priority watersheds in the catchment areas on 1:50K scale based on either sedimentyield index or runoff generation potential index. Detailed Soil Survey (DSS) is to generate detailed information on soil and land characterization of the priority areas using cadastral map (1:4K/1:8K) or large scale aerial photograph/satellite images (1:10k to 1:20k) for micro level developmentalplanning. the survey is an established tool to identify various morphological, physical, chemical and mineralogical properties of soils in a systematic way through examination of soils in thefield and in the laboratory.The soils areclassifiedandinterpretedbasedonthepotentialsand limitation of the database for various utility purposes such as, land capability classification,soil hydrological grouping, suitable cropping pattern and soil fertility.
Water Resources2.22 the average annual rainfall in the country hasbeenestimated tobeabout1170millimeters(mm). the total of average annual rainfall, snowfall
Source: Min-istry of Water Resources
• Naturetakesabout300yearstoformonly1cmoftopsoil
• 5.3billiontonnesofsoilgetserodedannually• Soil loss is about 16.4 t/ha/year.
0.7%
3.1% 14.9%
2.3%0.2%
Water & Wind erosion
Water logged
Alkali/Sodic soil
Acid Soil
Saline soil
Mining/Industrial waste
78.8%
Policies & Programmes2.21 Soil Survey: Soil and Land Use Survey of India (SLUSI) under Deptt. of Agriculture and Cooperation, Ministry of Agriculture has been
Fig. 2.1: Total Degraded Land (120.4 million)

Natural Resource Management 27
engaged in conducting soil survey of the country since 1958 for National land based developmental programme. Soil survey aims at generating scientificdatabaseonsoilandlandresourcesforplanning and implementation of soil and water conservation (through watershed programmes) for natural resource management. Database is being generated to meet the needs for planning at National/State/Basin/District/Catchment and Village/micro-watershed levels. RapidReconnaisance Survey (RRS) is to demarcate and identify priority watersheds in the catchment areas on 1:50K scale based on either sedimentyield index or runoff generation potential index. Detailed Soil Survey (DSS) is to generate detailed information on soil and land characterization of the priority areas using cadastral map (1:4K/1:8K) or large scale aerial photograph/satellite images (1:10k to 1:20k) for micro level developmentalplanning. the survey is an established tool to identify various morphological, physical, chemical and mineralogical properties of soils in a systematic way through examination of soils in thefield and in the laboratory.The soils areclassifiedandinterpretedbasedonthepotentialsand limitation of the database for various utility purposes such as, land capability classification,soil hydrological grouping, suitable cropping pattern and soil fertility.
Water Resources2.22 the average annual rainfall in the country hasbeenestimated tobeabout1170millimeters(mm). the total of average annual rainfall, snowfall
Source: Min-istry of Water Resources
and glacier melt in terms of volume works out to about4000billioncubicmeters(bcm).However,due to losses through evaporation and evapo-transpiration, water availability has been assessed to be about 1869 bcm. Even available water cannot be fully utilized due to topographical constraints and hydrological features and utilizable water is estimatedtobeabout1123bcm(comprisingof690bcm surface water and 433 bcm replenishableground water. Large temporal and spatial variations are observed in rainfall and hence in the water availability. Most of the water is available during the monsoon period and that too, through afewspellsofintenserainfall,resultinginfloodsin major river systems. Area irrigated through different sources of irrigation and per cent of irrigated area under different crops are given in the following figures. There is a need to bringmore cropped area under assured irrigation to increase agriculture productivity and production.
Survey type Achievement (million ha)
Annual Precipitation (Including snowfall)
4000BCM
Average Annual Availability 1869 BCMEstimated Utilizable Water Resources
1123BCM
(i) Surface Water 690BCM(ii) Ground Water 433BCMPer Capita Water Availability (2001)incubicmeter
1820CM
Source: Ministry of Water Resources
Box 2.2: Soil Survey Status: SLUSI
Survey type Achievement (million ha)
Rapid Reconnaisance Survey (1:50K)
253.0
Detailed Soil Survey(1:5 K/8 K or larger) 13.5Land Degradation Mapping (1:50K)
45.0
SoilResourceMapping(1:50K) 45.9
Fig. 2.2(a): Irrigated Area and Sources of Irrigation
10.09
28.94
9
5.88
16.7
1.644
Canals (26%)
Tanks (3%)
Tubewells (46%
Dug wells (16%
others (9%)
Irrigated Area - 63.25 MHaa
%)
%)

28 State of Indian Agriculture
Challenges2.23 Regional Imbalance: there is huge temporal and spatial variation in rainfall and
water availability in the country. Most of the water is available during monsoon period and that too, through few spells of intense rainfall, resulting infloods inmajor rivers.Whileaverageannualrainfallofthecountryisabout1170mm,averagerainfallinNorthEastRegionisashighas10000mm per year whereas some parts of Western Rajasthan receive annual rainfall of about 100mm only. the basin wise availability of water is also quite varied as the Ganga-Brahmaputrariverbasincontributestomorethan50%oftotalannual water availability, whereas, about 15%each is only available in Southern and Western basins.
2.24 Sub-optimal Utilization of Created Facilities: The sub-optimalutilizationof createdfacilities is another major challenge. only about 85 per cent of created potential has been put into use. this gap has only been increasing over time. It is necessary to provide infrastructure for ensuring last mile connectivity in developed commands for optimal utilization of potential created.
2.25 Poor Water-use Efficiency: the present level of efficiency of irrigation system in Indiais relatively low and there is considerable scope for improvement. It is observed that irrigation
Fig 2.3: Potential created and uti-lized in respect of major & medium projects
Source: Directorate of Economics & Statistics
Fig. 2.2 (b): Per cent of irrigated area under different crops
28.4
30.30.8
0.9
2.34.5
5
1 8.6
4.14.5
% of Irrigated Area
Paddy
Wheat
Jowar
Bajra
Maize
Pulses
Sugarcane
Fruits &Veg
Oilseeds
Cotton
Source: Ministry of Water Resources
0
5
10
15
20
25
30
35
40
45
50
Irr.P
ot(M
Ha)
Plan Periods
Created
Utilised
Source: Ministry of Water Resources
Water Use Ef-ficiency of some Completed Major/Medium Irrigation projects
Efficiency in %
Fig. 2.3: Potential created and utilized respect of major & medium project

Natural Resource Management 29
2.25 Poor Water-use Efficiency: the present level of efficiency of irrigation system in Indiais relatively low and there is considerable scope for improvement. It is observed that irrigation
Fig 2.3: Potential created and uti-lized in respect of major & medium projects
efficienciesfromsurfacewatersourcesvariesintherangeof35to40%only,whereasforgroundwater,itisabout65-75%.
Source: Ministry of Water Resources
Water Use Ef-ficiency of some Completed Major/Medium Irrigation projects
Efficiency in %
2.26 Ground Water Depletion: Despite huge contribution of ground water in agriculture growth, it is heading for crisis and needs urgent attention. Due to unregulated use and heavy subsidies on power, there has been a tendency of excess withdrawal of this precious resource. Decline in water level is observed mostly in northern, north western and eastern parts of the country in the states of Uttar Pradesh, Rajasthan, Bihar, Jharkhand, West Bengal, Punjab and Haryana. Decline in water level has also been observed in parts of tamil Nadu and Andhra Pradesh. Decline in water level of more than 2 m,which is considered tobesignificant is seenin parts of Rajasthan, Haryana, Punjab, and western Uttar Pradesh, western Andhra Pradesh and North West part of tamil Nadu. out of 5842 numbers of assessed administrative units (Blocks/Taluks/Mandals/Districts), 802 unitsare Over-exploited, 169 units are Critical, 523unitsareSemi-critical.

30 State of Indian Agriculture
2.27 Competing Demand: the demand for water for various purposes is increasing due to population growth, urbanization and industrialization. Presently agriculture sector is usingabout83%ofavailablewaterresources,butdue to demand from other sectors availability maydeclineto68%in2050.
2.28 Water Logging and Soil Salinity: Another challenge relates to over-use of surface waterwhich has resulted in drainage problems causing water logging in some areas. Problem of water logging is very often observed in canal irrigation system and also in areas of poor drainage resulting in accumulation of water.
2.29 Climate Change: Although precise quantitative assessment of impact of climate change on water resources is yet to be made, various reports indicate that climate change couldresultinfurtherintensificationoftemporaland spatial variation in the availability of water andextremeeventsoffloodanddrought.
Programmes & Schemes2.30 Accelerated Irrigation Benefit Programme (AIBP): Major & medium irrigation projects are capital-intensive in nature. AcceleratedIrrigation Benefits Programme (AIBP) waslaunched by MoWR, Government of India during 1996-97 to provide financial assistanceto State Governments for accelerating the pace of irrigation development in the country. So far Irrigation potential created from major/medium projects and minor irrigation schemes is about 8 million ha.
2.31 Command Area Development Programme (CADP): the Centrally Sponsored Command Area Development (CAD) Programme was launchedin1974-75byMoWRfordevelopmentof adequate delivery system of irrigation water uptofarmers’fieldwithanobjectivetobridgethegap between potential created and utilised and toenhancewateruseefficiencyandproductionand productivity of crops per unit of land and water for improving socio-economic conditionof farmers. So far 314 projects with a CCA of28.95 Million ha have been included under the programme.
2.32 Repair, Renovation & Restoration (RRR) of Water Bodies: Repair Renovation & Restoration of Water Bodies (RRR) were taken up under both domestic and external support (World Bank) with an outlay of Rs.1250 crore and Rs.1500crore respectively during XI Plan by MoWR. the objective of the Scheme is to restore and augment storage capacities of water bodies, and to recover and extend their lost irrigation potential. Under the domestic support 3341 Water bodies weretaken up against which 694 water bodies have been completed. the evaluation of the scheme indicates that the storage capacity in the tanks havebeenenhancedintherangeof50-85%.
2.33 Artificial Recharge to Ground Water through dugwells: Ministry of Water Resources launched a scheme on “Artificial Recharge toGround Water through Dug Wells” in 6 States, namely, Maharashtra, Karnataka, Rajasthan, tamil Nadu, Gujarat & Madhya Pradesh during XI Plan with the objective to recharge rain runoff generatedinagriculturalfieldsthroughexistingdugwells in areas underlain by hard rock terrain and having majority of overexploited, Critical andSemi-criticalassessmentunits.Bytheendof2010-11about95000dugwellrechargestructureshave been completed.
2.34 National Mission on Micro Irrigation: National Mission on Micro Irrigation was launched in June 2010 as a continuation of theMicro Irrigation Scheme which was initiated in March,2005-06.DripandSprinklertechnologiesare being promoted to supply water at the root zone as per requirements. Micro irrigation is instrumental in not only enhancing efficiencyof water application but also in precision application of fertilizers & plant nutrients. By theendof2011-12, about3millionhaareahasbeen covered under drip & sprinkler irrigation. Major impediments in the implementation of National Mission on Micro Irrigation (NMMI) are initial cost of installation of MI system and lack of awareness of benefits of the system.Most of the farmers in the country are small and marginal farmers. Inspite of subsidy provided by both Central and State Governments, they finditdifficult to install theMIsystembecauseof high cost of equipment. Inspite of extension/
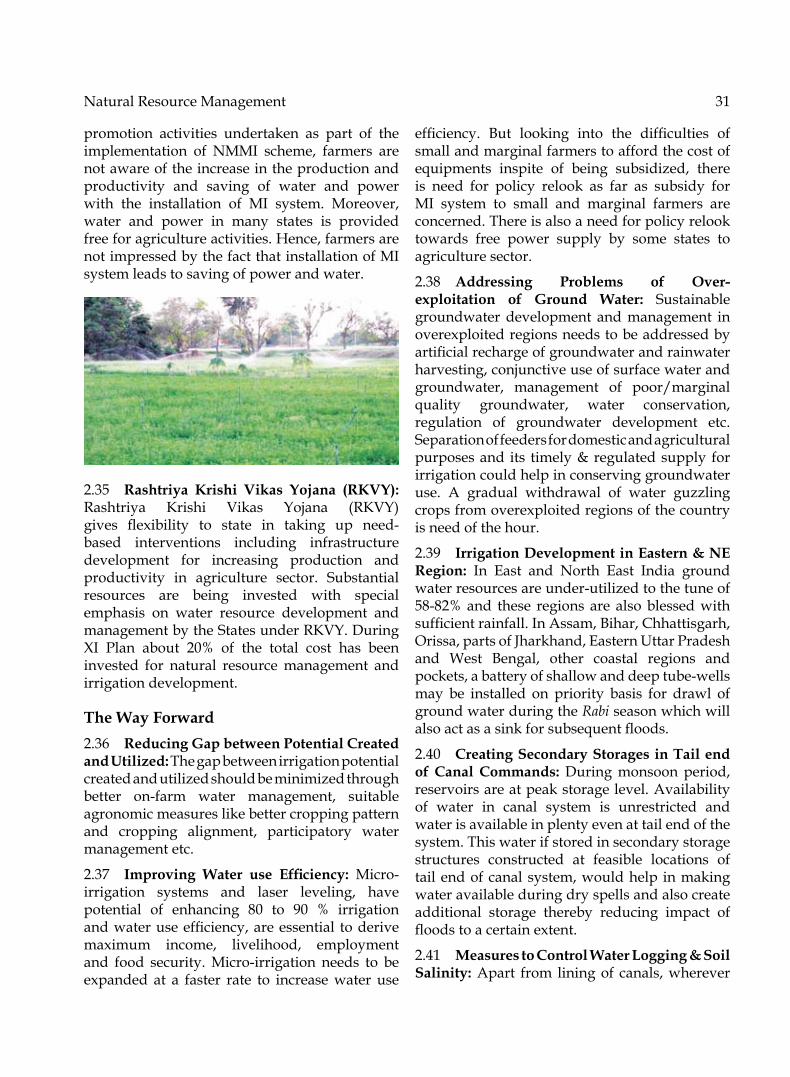
NaturalResourceManagement 31
promotion activities undertaken as part of the implementation of NMMI scheme, farmers are not aware of the increase in the production and productivity and saving of water and power with the installation of MI system. Moreover, water and power in many states is provided free for agriculture activities. Hence, farmers are not impressed by the fact that installation of MI system leads to saving of power and water.
2.35 Rashtriya Krishi Vikas Yojana (RKVY): Rashtriya Krishi Vikas Yojana (RKVY) gives flexibility to state in taking up need-based interventions including infrastructure development for increasing production and productivity in agriculture sector. Substantial resources are being invested with special emphasis on water resource development and management by the States under RKVY. During XI Plan about 20% of the total cost has beeninvested for natural resource management and irrigation development.
The Way Forward2.36 Reducing Gap between Potential Created and Utilized: the gap between irrigation potential created and utilized should be minimized through better on-farm water management, suitableagronomic measures like better cropping pattern and cropping alignment, participatory water management etc.
2.37 Improving Water use Efficiency: Micro-irrigation systems and laser leveling, have potential of enhancing 80 to 90 % irrigationandwateruseefficiency,areessential toderivemaximum income, livelihood, employment and food security.Micro-irrigation needs to beexpanded at a faster rate to increase water use
efficiency. But looking into the difficulties ofsmall and marginal farmers to afford the cost of equipments inspite of being subsidized, there is need for policy relook as far as subsidy for MI system to small and marginal farmers are concerned. there is also a need for policy relook towards free power supply by some states to agriculture sector.
2.38 Addressing Problems of Over-exploitation of Ground Water: Sustainable groundwater development and management in overexploited regions needs to be addressed by artificialrechargeofgroundwaterandrainwaterharvesting, conjunctive use of surface water and groundwater, management of poor/marginal quality groundwater, water conservation, regulation of groundwater development etc. Separation of feeders for domestic and agricultural purposes and its timely & regulated supply for irrigation could help in conserving groundwater use. A gradual withdrawal of water guzzling crops from overexploited regions of the country is need of the hour.
2.39 Irrigation Development in Eastern & NE Region: In East and North East India ground waterresourcesareunder-utilizedtothetuneof58-82%and these regions are alsoblessedwithsufficientrainfall.InAssam,Bihar,Chhattisgarh,orissa, parts of Jharkhand, Eastern Uttar Pradesh and West Bengal, other coastal regions and pockets,abatteryofshallowanddeeptube-wellsmay be installed on priority basis for drawl of ground water during the Rabi season which will alsoactasasinkforsubsequentfloods.
2.40 Creating Secondary Storages in Tail end of Canal Commands: During monsoon period, reservoirs are at peak storage level. Availability of water in canal system is unrestricted and water is available in plenty even at tail end of the system. this water if stored in secondary storage structures constructed at feasible locations of tail end of canal system, would help in making water available during dry spells and also create additional storage thereby reducing impact of floodstoacertainextent.
2.41 Measures to Control Water Logging & Soil Salinity: Apart from lining of canals, wherever

32 State of Indian Agriculture
required there is a need for drainage development either through surface/sub surface/bio drainage or a combined approach followed by appropriate agronomic measures.
2.42 Emphasis on Awareness Generation & Training: training and awareness of farmers towards proper use of irrigation water in critical stages of crop growth under different soil and environment conditions is very essential.
Climate Change2.43 Climate Change refers to statisticalvariations in properties of the climate system such as changes in global temperatures, precipitation, etc., due to natural or human drivers over a long period of time. Climate change could drastically alter the distribution and quality of natural resources thereby adversely affecting livelihood security of people. observations of Intergovernmental Panel on Climate Change (IPCC) indicate that adverse impact of climate change due to rising temperatures and extreme weather events on food production system could impact agricultural growth. Consistent warming trends and more frequent and intense extreme weather events are being observed across India in recent decades. Several areas have been identifiedasriskproneduetoimpactofclimatechange like coastal areas, Indo-Gangetic plainsandthedroughtandfloodproneregionsofthecountry. Besides production from crops and livestock, fresh water and marine ecosystem is also likely to be affected due to warming of sea surfacetemperatures.Suchclimaticfluctuationscould adversely affect agricultural sustainability resulting in unforeseen situational shortages which could also impact other economic sectors.
Challenges2.44 Climatechangeislikelytosignificantlyalterthe dynamics of extreme events such as tropical cyclones, associated storm surges and extreme rainfall events; possibly increasing their frequency and intensity. Low lying regions, including small islands, will face highest exposure to rising sea levels,whichwillincreaseriskoffloodsbringingmore cultivable area under submergence and
degradation. Vulnerability of India in the event of climate change is more pronounced due to its ever increasing dependency on agriculture, excessive pressure on natural resources and poor coping mechanisms. While in the short run impact might not be severe, most crops are likely towitness yield decline after 2020whentemperature threshold limit of many crops might get breached.
2.45 A one degree Celsius rise in mean temperature is likely to affect wheat yield in the heartland of green revolution. there is already evidence of negative impacts on yield of wheat and paddy in parts of India due to increased temperatures, increasing water stress and reduction in number of rainy days.
2.46 Crop specific simulation studies, thoughnot conclusive due to inherent limitations, projectasignificantdecreaseincerealproductionby the end of this century. Parts of western Rajasthan, southern Gujarat, Madhya Pradesh, Maharashtra, Northern Karnataka, Northern Andhra Pradesh, and Southern Bihar are likely to be more vulnerable in times of extreme events.
2.47 Irrigation requirements in arid and semiarid regions are estimated to increase by 10%forevery10°Crise in temperature.Rise insea level is likely to have adverse effects on the livelihoodsoffisherandcoastalcommunities.
National Mission for Sustainable Agriculture (NMSA)2.48 NMSA is one of the eight Missions under National Action Plan on Climate Change (NAPCC). It seeks to address issues on ‘Sustainable Agriculture’ in the context of risks associated with climate change by devising appropriate adaptation and mitigation strategies for ensuring food security, enhancing livelihood opportunities and contributing to economic stability at National Level.
2.49 NMSA seeks to transform Indian agriculture into a climate resilient production system through suitable adaptation and mitigation measures in domains of both crops and animal husbandry. these measures would be mainstreamed in

NaturalResourceManagement 33
research and development activities, absorption of improved technology and best practices, creationofphysicalandfinancial infrastructureand institutional frame work, facilitating access to information and promoting capacity building. While promotion of dryland agriculture would receive prime importance by way of developing suitable drought and pest resistant crop varieties and ensuing adequacy of institutional support, Mission for sustainable agriculture would also expand its coverage to rainfed areas for integrating farmingsystemswithlivestockandfisheries,sothat agricultural production continues to grow in a sustainable manner.
2.50 NMSA indentifies 10 key dimensions forpromoting suitable agricultural practices, which will be realized by implementing a Programme of Action (PoA) that covers both adaptation and mitigation measures through four functional areas, namely, Research and Development, Technologies, Products and practices, Infrastructure and Capacity building. While recognizing role of modern technologies and research in promoting sustainability of agriculture production this Mission also emphasizes on need to harness traditional knowledge and agricultural heritage for in-situ conservation ofgenetic resources.
2.51 Sustainable agricultural production shall continue to remain key to ensure food and livelihood security andwould require amulti-functional/multi-tierinstitutionalmechanismforensuring convergence and establishing linkage at all levels. NMSA, therefore, proposes to formulate policies of national importance in consultation with the States in National Development Council. Similarly, for deliberating cross cutting issues with other Missions as well as Ministries/Departments, an Inter Ministerial Coordination Committee, chaired by Cabinet Secretary is recommended. An intra-Ministerial Platformwill function in Ministry of Agriculture and its collaborative efforts with relevant Departments, NGO’s, Civil Society, Knowledge Institutionsand other stakeholders would be coordinated by Secretary,AgricultureandCo-operation.
Drought management2.52 the Department of Agriculture & Cooperation is the nodal department for coordination of relief efforts necessitated by drought. the Crisis Management Group on drought headed by the Central Drought Relief Commissioner reviews situation with the representatives of all the Line Departments, as and when warranted. A Crisis Management Plan is released annually to guide and formulate the Contingency Plan for all the sectors linked with the impact of drought to mitigate the impact of drought situation. State Governments are also advised to prepare district-wise contingencyplans accordingly. the Control Room of the Department collects information on rainfall, drinking water, etc to monitor the drought situation and liaises with the Central Ministries/Department & the States. In case of severe drought situation in the country, the National Crisis Management Committee (NCMC) under the Chairmanship of Cabinet Secretary also reviews the situation and takes necessary decisions to mitigatethedroughtsituation.SeparateMinister-level and Secretary level committees are in place to tackle the situation.
2.53 There is a Crop Weather Watch Group(CWWG) representing concerned Central Ministries/Departments under DAC which meets on regular basis to take stock of rainfall, weather forecast, progress of sowing, crop health, level of water in the major water reservoirs in the country, etc. Deliberation of CWWG is coordinated by the National Crop Forecasting Centre (NCFC) in the Department of Agriculture & Cooperation. the inputs information received on rainfall and its forecast, water storage in reservoirs, pest control, inputs availability, crop sowing status and prices are shared among the members of the Group for formulating strategy to meet the contingencies. The findings of CWWG and IMD reports aredeliberated and the requirements for agricultural and allied sectors are assessed and appropriate actions taken by the Central Government. the State Governments are also advised suitably and their efforts are supplemented from the Central resources, whenever the situation warrants

34 State of Indian Agriculture
for immediate intervention for mitigating the hardships of agricultural sector.
Current Status2.54 National Mission for Sustainable Agriculture (NMSA) was accorded ‘in principle’ approval by PM’s Council on Climate Change(PMCCC)on23.09.2010.MinistryofAgriculture,has thereafter, initiated a process of restructuring its ongoing Schemes/Programmes for making Indian agriculture climate resilient by embedding and mainstreaming various adaptation measures identified inNMSAontorelevantprogrammes,converging programmes with identical goals and discontinuing programmes which have lost relevance.
2.55 NMSA as a restructured Mission for XII plan shall cater to 5 Mission Deliverables focusing areas like rainfed area development, resource conservation,wateruseefficiencyandsoilhealthmanagement. Remaining Mission Deliverables
will be addressed by other Missions/Schemes including those by DARE and DAHD&F. Planning Commission has accorded its in-principle approval for implementing/launching NMSA during XII Plan.
Way Forward2.56 Long term drought proofing strategiesand development plans to enable appropriate coping mechanism during extended dry periods, particularly in the rainfed areas, need to be formulatedsuitabletospecificagroecology,socialfactors and available infrastructure to minimize the risk. Apart from conserving moisture and creating water bodies to meet the life saving irrigation during critical dry spells, there is need to focus on safety nets, varietal improvement for drought tolerant crops/plants, water saving technologies, supplementary livelihood support activities like animal husbandry, agro-forestry,smallscaleagro-processingunitsetctomitigatethe risk of crop failure.

3.1 Agricultural production is essentially anoutcome of the interplay of the natural resources such as land, water, soil, biodiversity; with the plant genetic material i.e. the seed and use of other agricultural inputs like chemical fertilizers, organic manure, pesticides, farm machinery and equipments, labour, credit and insurance; pricing policy and marketing infrastructure. Chapter two was devoted to natural resources. this chapter highlights the present state of agricultural inputs like seeds and planting materials, fertilizers, pesticides, farm machinery and equipment, credit etc, which determine agricultural productivity and production.
Seeds and Planting Material3.2 Seed quality is an important aspect that determines the output of a variety. Seed quality is administered through seed certification, seedtesting, seed labeling and seed law enforcement during the stages of production, processing and packagingofseeds.Presently, seedcertificationis carried out by 24 State Seed Certification
CHAPTER3
Farm Inputs and Management
Agencies. to ensure the quality of seeds, State Governments appoint Seed Inspectors under Seeds Act, 1966 and the Seeds (Control) order, 1983. These inspectors draw the sample fromseed packets being sold in the market and send thesametothenotifiedseedtestinglaboratoriesfor quality checking. If any seed is found sub-standard or any seed dealer contravenes the provisions of the Seeds Act or Seeds Rules, legal proceedings can be initiated against such seed dealers or distributors.
Hybrid Seeds3.3 Hybridseedsincrosspollinatedcropsgivehigher yield, hence, greater emphasis is given to hybrid seeds to improve crops productivity. the crop wise and State wise requirements, production and availability of hybrid seed during each of last three years and current year as reported by the State Governments is given in Table3.1.Itshowsthatavailabilityhasbeenbyand large higher than the requirement all these years:
Table: 3.1: Requirement & Availability of Certified/Quality Seeds of Hybrids
(Quantityinmilliontonnes)
S. No.
Crop 2009-10 2010-11 2011-12 2012-13 (KHARIF-2012)
Req. Av. Req. Av. Req. Av. Req. Av.
1 Paddy 2.9 5.3 9.8 10.9 9.9 9.2 28.8 28.8
2 Maize 62.7 61.1 75.4 92.2 101.7 142.1 73.7 77.0
3 Jowar 17.2 19.9 11.5 13.9 13.1 13.9 12.1 12.5
4 Bajra 22.4 19.7 21.9 26.0 24.6 28.4 23.0 25.9
5 Sunflower 4.0 6.4 5.8 6.3 7.0 9.6 2.5 2.7
6 Castor 3.7 5.0 2.5 3.1 3.4 4.5 4.0 4.3
7 Cotton 1.1 15.8 14.5 15.6 19.5 22.5 22.2 25.2
8 totAL 124.3 133.4 141.6 168.1 179.1 230.1 166.3 176.4
Req: Requirement Av. Availability

36 State of Indian Agriculture
3.4 Certified/quality seeds accounts for about30percentofthetotalseedsusedinthecountry.There are significant variations across cropsandstatesintheproportionofcertified/qualityseeds used. thus, there is a need to enhance the Seed Replacement Ratio. Further, presently, SRR has a major component of truthfully Labelled seeds (tL). this Department has been giving high emphasis to Seed Replacement Ratio (SRR) of major crops. Besides strengthening of seed production chain, efforts are underway to enhance supply and use of certified seeds,particularly of oilseeds. Bt. cotton is the only transgenic crop in the country under commercial cultivation. Besides, an impressive improvement intheproductivityofBt.Cotton,by15%to30%ascomparedtoNon-Bt.Cotton,therehasbeenasignificantreductionintheusagesofinsecticide,from46%in2001to21%during2009-2010dueto the adoption of transgenic technology.
3.5 The varied agro climatic conditions ofthe country are suitable for cultivation of large number of crops and varieties. though India produces quality seeds of a huge number of crops grown across the country during different seasons, its share of global seed market is less than 2%. TheNational Seed Policy envisages a 10%share of global market in the coming decade.
Planting Materials3.6 Productivity and quality of horticulturalcrops depends to a large extent on the availability and quality of planting material and rootstocks. With a view to boost the availability and quality of planting material, the Department of Agriculture and Cooperation has taken several initiatives, some of which are listed below:
• Establishment of strong nursery infrastructure for mass multiplication of varieties/rootstocks in commercial fruit crops.
• Establishment of mother blocks of improved
varieties for mass multiplications of disease free quality planting material.
• Establishment of rootstocks bank to mitigate problems related to biotic and abiotic stress.
• Implementing agencies to procure planting material only from accredited nurseries.
• Import of polyembryonic/clonal rootstocks and planting material of improved varieties of fruit crops, especially for establishment of mother/scion/root stock blocks to enhance capability of production of adequate quantities of planting material required for new plantation.
• tree Canopy Management to enhance production and productivity of horticulture crops
• Establishing clusters of excellence of horticultural crops all across the country.
Protection of Plant Varieties and Farmers’ Rights3.7 LegislationforProtectionofPlantVarietiesandFarmers’Rightswasenactedin2001,whichprovides for the establishment of sui generis and an effective system for protection of plant varieties, the rights of farmers and plant breeders and to encourage the development of new varieties. PPV&FRA registers plant varieties to protectplantbreeders’rights.Italsoprovidesforprotection of rights of the farmers in respect of their contribution made in conserving, improving and making available plant genetic resources. A total of 57 crop species have been notified forregistration purposes by the Authority. Linkage with private seed industry is very important and as of now 67 private companies has applied for registration for protection under the Act. Application received for registration of varieties – yearwiseandregistrationcertificatesissuedcrop-wisearegivenatFig.3.1&3.2,respectively.

FarmInputsandManagement 37
Fig. 3.1: Applications Received for Registration of Varieties at PPV&FRA
Year-wise(2007-12)
Fig 3.2: Crop-wise - Registration Certificates issued
Public
1021
Private
1735
Farmer
1110
T
0
200
400
600
800
1000
1200
1400
1600 Total Applicat
432547
2007 2008
tions 3866
688541
2009 2010
1361
297
0 2011 2012*
Pearl M
Pigon pea, 13
Rice, 27
Sesame, 2
Sorghum, 22
Wheat, 5
Millet, 27
58
Black gram, 11 Chick p
Maize, 63
pea, 19
Cotton, 34
Field pea, 2
Green gram
Jute, 7
Kidney bean,
Lentil, 10
20
m, 20
, 5
Box 3.1: Plant Genome Savior Community Awards
the Authority has instituted the “Plant Genome Savior Community Award/Reward and Recognition” as a national activity under the National Gene Fund constituted by the Government of India. Certificates have beenawarded to the farmers/communities for their efforts in conservation and preservation of plant genetic resources. Five communities/farmers were recognisedin2007-08andfourin2008-09.In2009-10thisscopewasbroadenedtosupportandrewardfarmers, communities of farmers, particularly
the tribal and rural communities engaged in conservation, improvement and preservation of genetic resources of economic plants and their wild relatives, particularly in areas identifiedas agro-biodiversity hot spots. Accordingly, the“Plant Genome Savior Community Award” was instituted from 2009-10. For 2009-10 two farmingCommunities from odisha and Karnataka and for2010-11, fourcommunitieswereconferred the“Plant Genome Savior Community Awards”. Seven applicantsweregivencertificatesofrecognitionfortheir noteworthy work.

38 State of Indian Agriculture
National Seed Research and Training Centre (NSRTC)3.8 NationalSeedResearchandTrainingCentre(NSRtC) located at Varanasi is the Central Seed testing Laboratory (CStL) under Seeds Act and also a Referral laboratory for courts in India. the Centre is responsible for testing the seed
samples received from the Notified State Seedtesting Laboratories across the Country under 5%re-testingprogrammetomaintainuniformitybetween results of Central Seed testing Laboratory and Notified State Seed TestingLaboratories. Details of samples received and testedduring2007to2012areshownbelow:-
Fig. 3.3: Nos. of seed samples received and analysed
7235
12,2
62
1185
6
1385
9
1597
8
4086
02000400060008000
1000012000140001600018000
2007
-08
2008
-09P
2009
-10
2010
-11
2011
-12
2012
-13
upto
June
,201
2
Total Nos. of Seed Samples received and analysed
Central Sector Scheme in Seed Sector3.9 Since2005-06,theDepartmentofAgriculture& Cooperation is implementing a Central Sector Scheme “Development and Strengthening of Infrastructure Facilities for Production and Distribution of Quality Seeds” (DPQS) toaddress the gap in infrastructure and to increase availability of quality seeds for different crops through various interventions. the objective of the scheme is to ensure production and multiplication of high yielding certified andqualityseedsofallcropsinsufficientquantitiesand to make the same available to farmers across the country on time and at an affordable prices.While the requirementof certifiedseedshas grown steadily for the last seven years, the availability has surpassed the requirement for thelastsevenyears,ascanbeseenfromFig.3.4.
National Seed Mission3.10 A needwas felt, in the current scenario,to upgrade and expand the existing scheme ‘Development and Strengthening of Infrastructure Facilities for Production and Distribution of QualitySeeds’(DPQS)intoaNationalMissionwitha focused, time bound and integrated approach to further improve the availability of quality seeds to the farmers. Hence, it is proposed to launch a Mini-Missionon“SeedsandPlantingMaterial”under the new Centrally Sponsored Scheme “National Mission on Agricultural Extension and technology” during twelfth Five Year Plan. the Mission includes seed planning, seed production, varietal replacement, seed infrastructure, quality control, specific interventions for seed PSUs,contingency planning, assistance to private sector, international cooperation, etc.
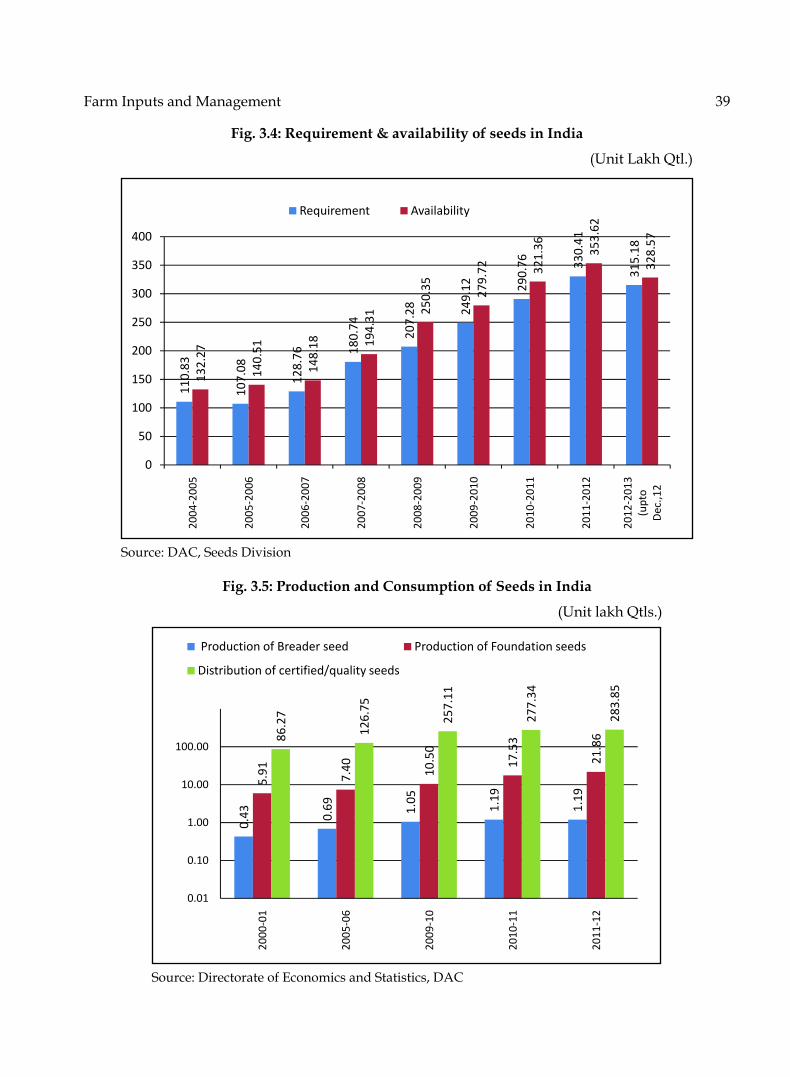
FarmInputsandManagement 39
Fig. 3.4: Requirement & availability of seeds in India
(UnitLakhQtl.)
Source: DAC, Seeds Division
Fig. 3.5: Production and Consumption of Seeds in India
(UnitlakhQtls.)
Source: Directorate of Economics and Statistics, DAC
110.
83
107.
08
128.
76 180.
74
207.
28 249.
12 290.
76 330.
41
315.
18
132.
27
140.
51
148.
18 194.
31
250.
35 279.
72 321.
36 353.
62
328.
57
0
50
100
150
200
250
300
350
400
2004
-200
5
2005
-200
6
2006
-200
7
2007
-200
8
2008
-200
9
2009
-201
0
2010
-201
1
2011
-201
2
2012
-201
3(u
pto
Dec
.,12
Requirement Availability
0.43 0.
69 1.05
1.19
1.19
5.91 7.40 10
.50
17.5
3
21.8
686.2
7
126.
75
257.
11
277.
34
283.
85
0.01
0.10
1.00
10.00
100.00
2000
-01
2005
-06
2009
-10
2010
-11
2011
-12
Production of Breader seed Production of Foundation seeds
Distribution of certified/quality seeds

40 State of Indian Agriculture
Genetic Modification in Agriculture3.11 A Genetically Modified crop contains agene or genes of a different species artificiallyinserted in its genome when the inserted gene sequence comes from an unrelated plant or from a completely different species, it is also known as transgene and the resulting GM crop as a transgenic crop.
3.12 Conventional plant breeding involvesexchange of genes between two plants to produce a hybrid for a desired trait by crosspollination. GM technology is similar to conventional plant breeding in terms of the objective of generating more useful and productive crop varieties containing new combination of genes, but it expands the possibilities by enabling introduction of useful genes not just from within the crop species or from closely related plants, but from a wide range of other organisms. It allows the transfer of
one or more genes, in a controlled and predictable way than is achievable in conventional breeding. GM crop plants can therefore incorporate the desired traits more quickly and more reliably than through conventional methods.
3.13 GM crops have been developed toincorporate various traits such as insect pest resistance, herbicide tolerance, disease resistance, alterednutritionalprofile,enhancedstoragelifeetc. The benefits of their use include increasedcrop yields, reduction in farm costs and thereby increaseinfarmprofitaswellasprotectionoftheenvironment. Research is focused on a second generation of GM crops that feature increased nutritional and/or industrial traits such as easy processability. these varieties are expected to bring inmoredirect benefits to consumer suchas correctionofdietarydeficiencies. Figure3.6summarizes the potential benefits of varioustraits incorporated in the GM crops.
Fig. 3.6: Potential benefits of various traits incorporated in the GM crops
Pest resistance
Herbicide resistance
St ( ld/ d htIncreased nutrition
Plant pharmaceuticals
Traits Potential Benefits
Availability of more crops
Better qualityproducts
Improvement in health
Reduced use of chemicals and herbicides
Improved
farming
Cheaper
food
Morefood
3.14 GeneticallyModifiedOrganisms (GMOs)and products thereof including GM crops are regulated products in India under the ‘Rules for the Manufacture, Use/Import/Export and Storage of Hazardous Micro organisms/
Genetically Engineered organisms or Cells notified by the Ministry of Environment andForests vide Notification No. 621 in OfficialGazette of Govt. of India on December 5, 1989 under the provisions of the ‘Environment

Farm Inputs and Management 41
(Protection) Act’, 1986. This has been done toensure sound application of biotechnology makingitpossibletoaccruebenefitsarisingfrommodern biotechnology while minimizing the risks to environment and human health.
3.15 These rules and regulations commonlyreferred to as ‘Rules 1989’ and cover areasof research as well as large scale applications of GMos and its products. these rules and regulations are implemented by Ministry of Environment and Forests (MoEF), Department of Biotechnology (DBt) and State Governments. For the development of GM crops at the laboratory stage,confinedmulti-locationtrialsforgenerationof biosafety data known as Biosafety Research Trials–IandBiosafetyResearchTrials-II(BRL-IandBRL-II)requirepriorapprovaloftheRCGMand the GEAC set up under the Rules, 1989. the compliance of the regulatory procedures duringGMcropfieldtrialsismonitoredbytheMonitoring–cum Evaluation Committee (MEC). the agronomic performance of the GM crops is also evaluated under the Indian Council of Agriculture & Research (ICAR) testing system. TheGEACtakesintoconsiderationthefindingsof the biosafety and agronomic studies as well as recommendations of the RCGM, ICAR and MEC before according approval for environmental release. only those transgenic crops which are found to be safe for human consumption as well as the environment are approved for commercial release.thus, release of GM crops and products is the mandate of the Ministry of Environment & Forests.
3.16 Theglobalareaunder25GMcropsin2011was1600lakhhectarescultivatedby29countries,thus indicating farmer acceptance globally. Soybean is the leading GM crop occupying 754 lakh ha, followed by maize (510 lakh ha),cotton (247 lakh ha) and canola (82 lakh ha). other prominent GM crops occupying less than 1.0 lakh ha area are Potato, sugar beet, alfalfa,papaya, squash, potato, tomato, poplar and sweet pepper. Among top ten countries, USA is leading byoccupying690 lakhhacultivatingeightGMcrops (Maize, soybean, cotton, canola, sugar beet, alfalfa, papaya and squash) followed by Brazil (303lakhha–Soybean,maize,cotton),Argentina
(237lakhha–Soybean,maize,cotton),India(106lakh ha –Cotton), China (39 lakh ha –Cotton,papaya, poplar, tomato, sweet pepper), Canada (104lakhha–Canola,maize,soybeanandsugarbeet), Paraguay (28 lakh ha – Soybean), Pakistan (26 lakh ha-Cotton), South Africa (23 lakh ha-Maize, soybean, cotton) and Uruguay (13 lakhha-Soybean,maize).
Status of GM in India3.17 Bt. cotton is the only GM crop beingcultivated in India. Considering the successful cultivation of Bt cotton in India, which resulted in morethan50%reductionofinsecticideusageoncottonandabout30-60%increaseinproductivityover10years,arecordexportof129 lakhbalesworthaboutRs.21,000croresandtheabsenceofany credible scientificevidenceof anynegativebio-safetyeffects,apositiveviewisbeingtakenfor GM crop research and development for the country. the Government of India through Genetic Engineering Approval Committee (GEAC), Ministry of Environment and Forests approved commercial cultivation of Bt cotton in 2002 which confers resistance to Lepidopteronpests of cotton. Bt cotton was initially approved for the Central (Gujarat, Maharashtra & Madhya Pradesh) and South (tamil Nadu, Andhra Pradesh & Karnataka) zone states in 2002 andlater on in North Zone states (Punjab, Haryana & Rajasthan) from the year 2005-06. It may bementioned that spread of cultivation of Bt cotton in India is outcome of farmers’ spontaneousresponse to success of Bt cotton in controlling pest and diseases, enhanced yield resulting in higher economic return. . Introduction of Bt cotton has played a catalytic role in enhancing cotton production and productivity in India.
Challenges and Way Forward3.18The challenges confronting the seed sectoris to make available quality seeds and planting materials having good genetic potential at an affordable price and across the country to the farmers to enable them harvest maximum yield under the given agro-climatic conditions. Inpursuance to this challenge, effort is being made to produce quality seeds with the collective efforts

42 State of Indian Agriculture
of Public and Private sector seed producing agencies, however, it cannot be said that enough is being done. there is need to develop better varieties/hybrids/planting materials, which will be able to manifest itself even under the challenging agro-climatic conditions. We haveto adopt new technologies available for fast tracking the development of quality varieties/planting materials like, Genetic Modification,tissue Culture etc. to address this concern. these technologies enable development, production of planting materials, varieties/hybrids, with better genetic potential in the shortest possible time and maintain uniformity of quality across the production line.
3.19 Genetic Modification helps in attacking/addressing multiple problems at the same time, like addressing the problems of productivity, stress tolerance, pests and disease tolerance simultaneously by combining genes responsible for higher productivity with genes responsible for stress tolerant and or genes responsible for disease/pests tolerance. Momentum for the development of GM technology in the country has somewhat slowed down due to opposition from certain quarters on safety issues, however, there is need to address these concerns through adoption of appropriate measures for safety and safeguards and move ahead with the technology for meeting the challenges facing the country.
3.20Itisalsoafactthatinmanycrops,theleadingvarietiesbeingcultivatedaremorethan20yearsold, though, every year new varieties are being released. this indicates that the concerns of the farmers are not being adequately addressed by R&D set up in the country. the State Agricultural Universities, ICAR and its Institutions and also the Private sector involved in development of new varieties/hybrids/planting materials, have to address this issue in a more concerted manner to make its impact pronounced on agricultural production.
3.21Theseedmultiplication ratio fromBreederseed to Foundation seed and from Foundation seedtoCertifiedseed,needstobeaddressedbyall the seed producing agencies, both in Public and Private Sector. Comprehensive and authentic
database on seed production and distribution in India by public and private sectors needs to bebuilt for thebenefitof informationofall thestakeholders. the seed chain and the norms for quality control have to be scrupulously followed by all the States/Uts to ensure maintenance of quality of seeds being sold to the farmers. the provision of subsidy for seeds for newer and older variety needs to be rationalized. the issue ofseedcertificationanddistributionofcertifiedseeds is largely dependent on the sumptuous implementation of the provisions of Seed Act by theStates.Theseedcertificationagenciesandseedinspectors have to be more vigilant to check sale of spurious seeds in the market. Accreditation of horticultural nurseries is gaining importance with the increasing demand for supply of quality planting materials of horticultural crops. Accreditation of nurseries therefore needs to be speeded up.
3.22TheStatesneedstopreparelongtermSeedPlan for the State keeping in mind the agro-climaticconditions,farmer’seconomicstatusanddesire to adopt quality seeds, SRR of the crop, State’scropcalendar,contingentsituationarising,etc., in order to ensure availability of quality seed at the right time to the farmers. often, it is seen that States do not have adequate Seed Plan, as a result of which the farmers are forced to fall back on ‘farm-saved’ seeds or Truthfully LabelledSeeds. this is not a viable option for enhancing productivity and production. Step has been taken in consultation with the State Governments to prepare Seed Plan for 5 years.
Integrated Nutrient Management3.23 Chemical fertilizers are the immediatesource of nutrients in soils. Consumption of nitrogenous (N), phosphatic (P), potassic (K) fertilizers has increased from 1.1 million tonnes in1966-67, theyearpreceding thegreenrevolutionto28.1milliontonnesin2010-11,butin2011-12itcamedownto27.7milliontonnes,adeclineof1.3percentoverthepreviousyear.Itis observed that while consumption of urea has increasedfrom16.6milliontonnesin2010-11to17.3milliontonnesin2011-12,anincreaseof4.5
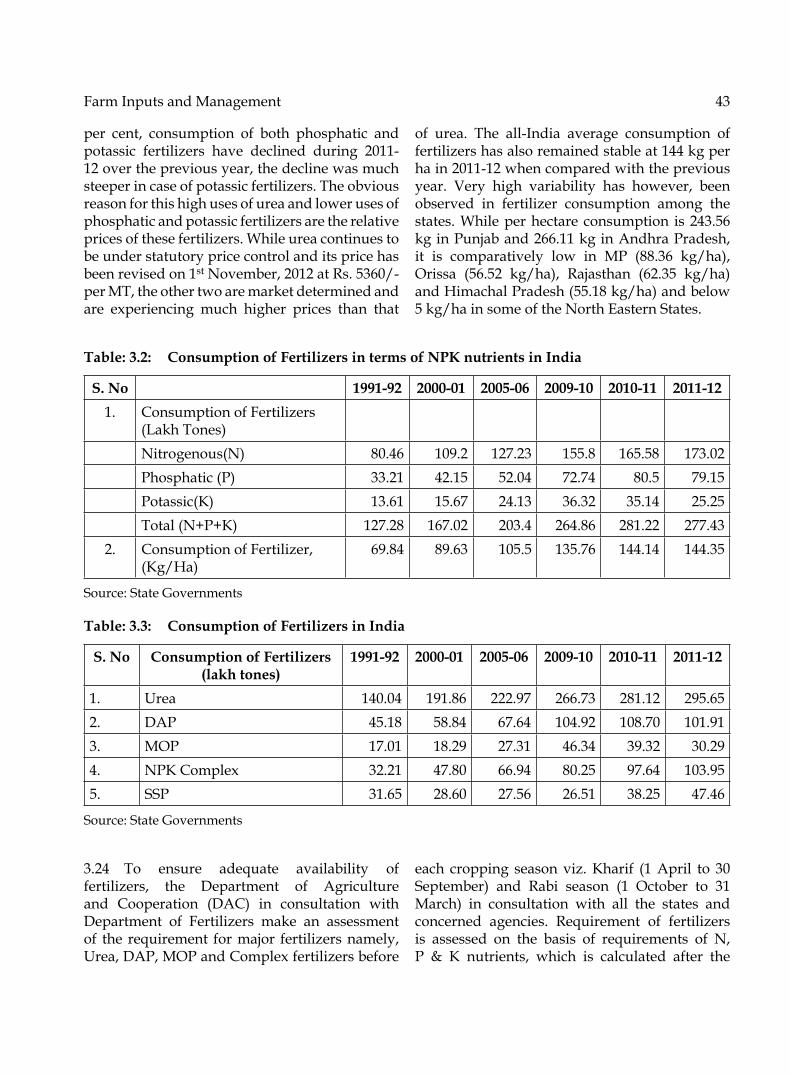
FarmInputsandManagement 43
per cent, consumption of both phosphatic and potassic fertilizers have declined during 2011-12 over the previous year, the decline was much steeper in case of potassic fertilizers. the obvious reason for this high uses of urea and lower uses of phosphatic and potassic fertilizers are the relative prices of these fertilizers. While urea continues to be under statutory price control and its price has been revised on 1stNovember,2012atRs.5360/-per Mt, the other two are market determined and are experiencing much higher prices than that
of urea. The all-India average consumption offertilizers has also remained stable at 144 kg per hain2011-12whencomparedwiththepreviousyear. Very high variability has however, been observed in fertilizer consumption among the states.Whileperhectareconsumption is243.56kg in Punjab and 266.11 kg in Andhra Pradesh, it is comparatively low in MP (88.36 kg/ha),Orissa (56.52 kg/ha), Rajasthan (62.35 kg/ha)and Himachal Pradesh (55.18 kg/ha) and below 5 kg/ha in some of the North Eastern States.
Table: 3.2: Consumption of Fertilizers in terms of NPK nutrients in India
S. No 1991-92 2000-01 2005-06 2009-10 2010-11 2011-121. Consumption of Fertilizers
(Lakh tones)Nitrogenous(N) 80.46 109.2 127.23 155.8 165.58 173.02Phosphatic (P) 33.21 42.15 52.04 72.74 80.5 79.15Potassic(K) 13.61 15.67 24.13 36.32 35.14 25.25total (N+P+K) 127.28 167.02 203.4 264.86 281.22 277.43
2. Consumption of Fertilizer,(Kg/Ha)
69.84 89.63 105.5 135.76 144.14 144.35
Source: State Governments
Table: 3.3: Consumption of Fertilizers in India
S. No Consumption of Fertilizers (lakh tones)
1991-92 2000-01 2005-06 2009-10 2010-11 2011-12
1. Urea 140.04 191.86 222.97 266.73 281.12 295.652. DAP 45.18 58.84 67.64 104.92 108.70 101.913. MoP 17.01 18.29 27.31 46.34 39.32 30.294. NPK Complex 32.21 47.80 66.94 80.25 97.64 103.955. SSP 31.65 28.60 27.56 26.51 38.25 47.46
Source: State Governments
3.24 To ensure adequate availability offertilizers, the Department of Agriculture and Cooperation (DAC) in consultation with Department of Fertilizers make an assessment of the requirement for major fertilizers namely, Urea, DAP, MoP and Complex fertilizers before
each cropping seasonviz.Kharif (1April to 30September) and Rabi season (1 October to 31March) in consultation with all the states and concerned agencies. Requirement of fertilizers is assessed on the basis of requirements of N, P & K nutrients, which is calculated after the

44 State of Indian Agriculture
comparison of consumption in last season vis-à-vis recommendeddose.GrossCroppedArea,Irrigated Area and Cropping Pattern are also taken into account while calculating the total requirements of N, P & K nutrients.
3.25 Further, to ensure the availability ofadequate quantity and proper quality of fertilizers to farmers, fertilizer was declared as an essential commodity under Essential Commodities Act, 1957. Fertilizer (Control) order (FCo), 1985 was promulgated to regulate the price, quality and distribution of fertilizers in the country. the FCo provides for compulsory registration of fertilizer manufacturers, importers and dealers; the specification of all fertilizers manufacturedor imported and sold in the country; regulation of the manufacture of fertilizer mixtures; packing and marking on the fertilizer bags; appointment of enforcement agencies; setting up of quality control laboratories and prohibition on the manufactureandimportandsaleofnon-standardor spurious or adulterated fertilizers.
3.26 Government introduced Nutrient BasedSubsidy (NBS) policy for phosphate (P) and potash(K)fertilizerswitheffectfromApril,2010.UnderNBSpolicy,afixedrateofsubsidy(onRs.per kg. basis) is announced on nutrients, namely, nitrogen (N), phosphate (P) and potash (K) and sulphur (S) by the Department of Fertilizer on annual basis. Any variant of the fertilizers covered under the subsidy scheme with micronutrients namely Boron and Zinc, is eligible for a separate per tonne subsidy to encourage their application along with primary nutrients. At present, 21 grades of P&K fertilizers, namely, DAP, MAP, tSP, MoP, Ammonium Sulphate, SSP and 15 grades of N P K complex fertilizers are covered under the NBS policy. MRPs of P&K fertilizers have been left open and fertilizer manufacturers/marketers are free to fix the MRP of P & Kfertilizers.
Balanced Use of Fertilizers3.27 Balanced fertilization isnormallydefinedas the timely application of all essential plant nutrients (which include primary, secondary
and micronutrients) in readily available form, in optimum quantities and in the right proportion, throughthecorrectmethod,suitableforspecificsoil/crop conditions. Balanced fertilization aims at ensuring adequate availability of nutrients in soil to meet the requirement of plants at critical stages of growth and thus ensuring adequate soil humustoimprovephysio-chemicalandbiologicalproperties of the soil. An imbalanced use of fertilizers is one of the reasons for a decline in the crop response ratio. this calls for promoting soil test based balanced and judicious use of chemical fertilizers in conjunction with organic sources of nutrients to sustain and improve soil health and its productivity.
3.28 MRPs of DAP,MOP and various gradesof complex fertilizers have risen sharply in last two years whereas MRP of urea has remained fixed.TheimpactofsharpriseinMRPsofP&Kfertilizers has been the inclination of farmers to use more urea irrespective of the presence (deficiency/sufficiency) of nitrogen in the soil.this is leading to imbalance in the NPK ratio and a decline in the marginal response of agricultural productivity to additional usage of fertilizer in the country.
3.29 Soil testing capacity of various Mobile/Static Soil testing Laboratories is about one crore per year, however, number of land holding is about 13.8 crores, therefore, to deliver sitespecific recommendations for balanced use offertilizers, there is a need to increase soil testing capacity in the country. Further, even though some farmers are getting their soil tested for nutrient availability/deficiency, but there stillexists a lack of awareness on the part of farmers to go for the right composition of fertilizers based on soil requirements. Most of the soil testing is taking place as a result of the campaigns run by the State Government under various schemes.
3.30 Intensive agriculture is experiencingwidespread deficiency of micronutrientsparticularly of Zinc followed by Iron, Manganese, Boron, etc. Hence, there is a greater need to redress the issue ofmicronutrientdeficiency inthe soil and its timely supply to the farmers.
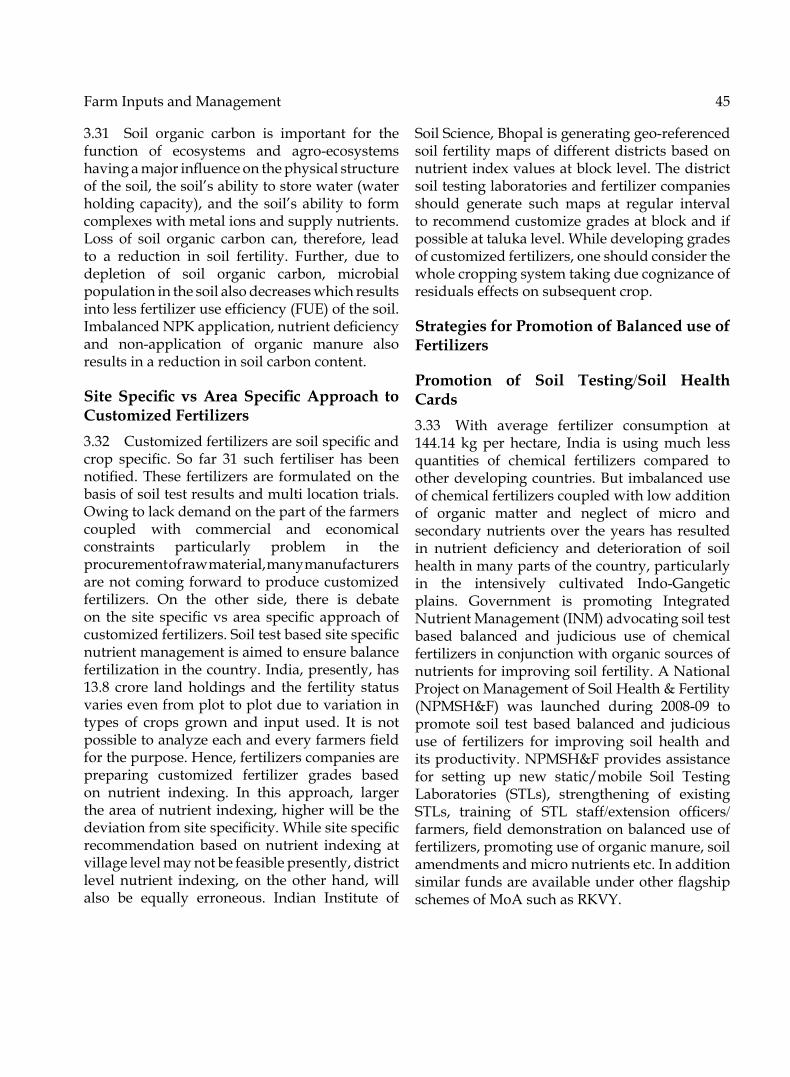
Farm Inputs and Management 45
3.31 Soil organic carbon is important for thefunction of ecosystems and agro-ecosystemshavingamajorinfluenceonthephysicalstructureofthesoil,thesoil’sabilitytostorewater(waterholding capacity), and the soil’s ability to formcomplexes with metal ions and supply nutrients. Loss of soil organic carbon can, therefore, lead to a reduction in soil fertility. Further, due to depletion of soil organic carbon, microbial population in the soil also decreases which results intolessfertilizeruseefficiency(FUE)ofthesoil.ImbalancedNPKapplication,nutrientdeficiencyand non-application of organic manure alsoresults in a reduction in soil carbon content.
Site Specific vs Area Specific Approach to Customized Fertilizers3.32 Customizedfertilizersaresoilspecificandcrop specific. So far 31 such fertiliser has beennotified.These fertilizersare formulatedon thebasis of soil test results and multi location trials. owing to lack demand on the part of the farmers coupled with commercial and economical constraints particularly problem in the procurement of raw material, many manufacturers are not coming forward to produce customized fertilizers. on the other side, there is debate on the site specificvs area specificapproachofcustomizedfertilizers.Soiltestbasedsitespecificnutrient management is aimed to ensure balance fertilization in the country. India, presently, has 13.8 crore landholdings and the fertility statusvaries even from plot to plot due to variation in types of crops grown and input used. It is not possibletoanalyzeeachandeveryfarmersfieldfor the purpose. Hence, fertilizers companies are preparing customized fertilizer grades based on nutrient indexing. In this approach, larger the area of nutrient indexing, higher will be the deviationfromsitespecificity.Whilesitespecificrecommendation based on nutrient indexing at village level may not be feasible presently, district level nutrient indexing, on the other hand, will also be equally erroneous. Indian Institute of
SoilScience,Bhopalisgeneratinggeo-referencedsoil fertility maps of different districts based on nutrient index values at block level. the district soil testing laboratories and fertilizer companies should generate such maps at regular interval to recommend customize grades at block and if possible at taluka level. While developing grades of customized fertilizers, one should consider the whole cropping system taking due cognizance of residuals effects on subsequent crop.
Strategies for Promotion of Balanced use of Fertilizers
Promotion of Soil Testing/Soil Health Cards3.33 With average fertilizer consumption at144.14 kg per hectare, India is using much less quantities of chemical fertilizers compared to other developing countries. But imbalanced use of chemical fertilizers coupled with low addition of organic matter and neglect of micro and secondary nutrients over the years has resulted in nutrient deficiency and deterioration of soilhealth in many parts of the country, particularly in the intensively cultivated Indo-Gangeticplains. Government is promoting Integrated Nutrient Management (INM) advocating soil test based balanced and judicious use of chemical fertilizers in conjunction with organic sources of nutrients for improving soil fertility. A National Project on Management of Soil Health & Fertility (NPMSH&F) was launched during 2008-09 topromote soil test based balanced and judicious use of fertilizers for improving soil health and its productivity. NPMSH&F provides assistance for setting up new static/mobile Soil testing Laboratories (StLs), strengthening of existing StLs, training of StL staff/extension officers/farmers,fielddemonstrationonbalanceduseoffertilizers, promoting use of organic manure, soil amendments and micro nutrients etc. In addition similarfundsareavailableunderotherflagshipschemes of MoA such as RKVY.
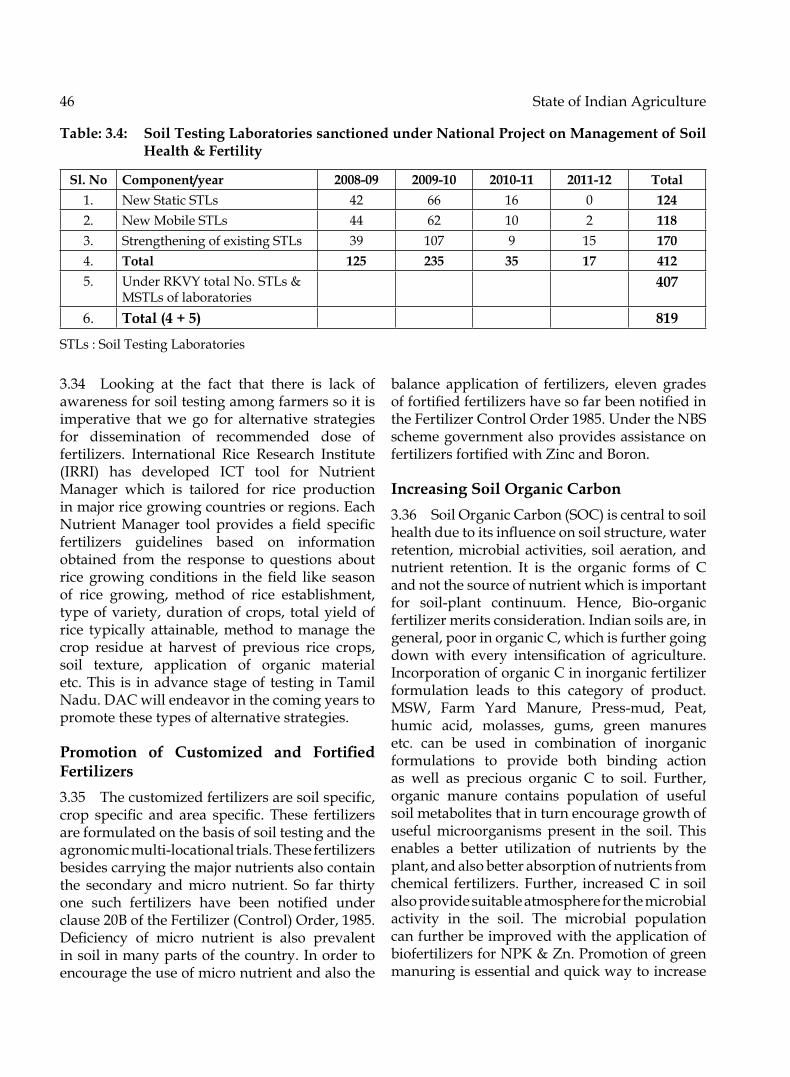
46 State of Indian Agriculture
3.34 Looking at the fact that there is lack ofawareness for soil testing among farmers so it is imperative that we go for alternative strategies for dissemination of recommended dose of fertilizers. International Rice Research Institute (IRRI) has developed ICt tool for Nutrient Manager which is tailored for rice production in major rice growing countries or regions. Each NutrientManager tool provides a field specificfertilizers guidelines based on information obtained from the response to questions about rice growing conditions in thefield like seasonof rice growing, method of rice establishment, type of variety, duration of crops, total yield of rice typically attainable, method to manage the crop residue at harvest of previous rice crops, soil texture, application of organic material etc. this is in advance stage of testing in tamil Nadu. DAC will endeavor in the coming years to promote these types of alternative strategies.
Promotion of Customized and Fortified Fertilizers3.35 Thecustomizedfertilizersaresoilspecific,crop specific and area specific. These fertilizersare formulated on the basis of soil testing and the agronomicmulti-locationaltrials.Thesefertilizersbesides carrying the major nutrients also contain the secondary and micro nutrient. So far thirty one such fertilizers have been notified underclause20BoftheFertilizer(Control)Order,1985.Deficiency of micro nutrient is also prevalentin soil in many parts of the country. In order to encourage the use of micro nutrient and also the
balance application of fertilizers, eleven grades offortifiedfertilizershavesofarbeennotifiedinthe Fertilizer Control order 1985. Under the NBS scheme government also provides assistance on fertilizersfortifiedwithZincandBoron.
Increasing Soil Organic Carbon3.36 SoilOrganicCarbon(SOC)iscentraltosoilhealthduetoitsinfluenceonsoilstructure,waterretention, microbial activities, soil aeration, and nutrient retention. It is the organic forms of C and not the source of nutrient which is important for soil-plant continuum. Hence, Bio-organicfertilizer merits consideration. Indian soils are, in general, poor in organic C, which is further going downwith every intensification of agriculture.Incorporation of organic C in inorganic fertilizer formulation leads to this category of product. MSW, Farm Yard Manure, Press-mud, Peat,humic acid, molasses, gums, green manures etc. can be used in combination of inorganic formulations to provide both binding action as well as precious organic C to soil. Further, organic manure contains population of useful soil metabolites that in turn encourage growth of useful microorganisms present in the soil. this enables a better utilization of nutrients by the plant, and also better absorption of nutrients from chemical fertilizers. Further, increased C in soil also provide suitable atmosphere for the microbial activity in the soil. the microbial population can further be improved with the application of biofertilizers for NPK & Zn. Promotion of green manuring is essential and quick way to increase
Table: 3.4: Soil Testing Laboratories sanctioned under National Project on Management of Soil Health & Fertility
Sl. No Component/year 2008-09 2009-10 2010-11 2011-12 Total1. New Static StLs 42 66 16 0 1242. New Mobile StLs 44 62 10 2 1183. Strengthening of existing StLs 39 107 9 15 1704. Total 125 235 35 17 4125. Under RKVY total No. StLs &
MStLs of laboratories 407
6. Total (4 + 5) 819
StLs : Soil testing Laboratories

Farm Inputs and Management 47
organic carbon. Farmers should take at least one green manuring crop once in every two years. In all rice fields, cultivation of greenmanuringplants as an intercrop is highly recommended (likeonerowofsesbaniaafterevery10-15rowsofricewhichcanbeincorporatedintofieldafter30-35days)toachievethebestproductivity.Useofcropstrawandweedbiomassasmulch-wheatand rice straw can also be used with dung and cattle urine to increase organic Carbon.
Fertilizer Use Efficiency (FUE)3.37 The fertilizeruse efficiencyon average isreportedtobe33%forN;15%forP;20%forKandmicronutrients. Even with the best management practices it has not been possible to achieve more than50%forN;30%forPand50%forK.Restof amount either get volatilized or get leached/fixedinthesoilincomplexforms,henceresultinginto to the economical loss.
3.38 Application of biofertilizers viz N fixingRhizobium for legume crops, Azopirillum and Azotobacter for non-legminous crops;P Solubilizing bacteria for phosphorus solubilization, K mobilizing bacteria for K uptake and for secondary nutrient Zn, Zinc solubilising bacteria alongwith chemical fertilizers can increase the fertilizer use efficiency. Further,management practices such as split application, placement of fertilizers at crop root, use of sloe releaseN fertilizers and nitrification inhibitors,and inclusion of legume crops in crop rotation can enhance fertilizeruse efficiency.Promotionof plantation of fertilizer trees on bunds is a long practice to conserve Nitrogen in the soil. there is alargepoolofN-fixingtreeswhichcanbeusedasfertilizer trees on bunds without compromising on space and yields of crops. Encouraging mixed/intercropping of pulses in intensively cultivated areas is another well established practice to enhancefertilizeruseefficiency.ICARandStateAgricultural Universities need to come forward on making state specific/area specific packageof practices, in form of consolidated and easily understandable handouts in local languages, to increaseFertilizerUseEfficiency(FUE).
3.39 Productionofurea ingranulated form or
coated (with sulphur or neem)/fortifiedUrea/Briquettedurea canalso improve theefficiencyin the use of urea. the use of naked prills needs to be discouraged and undersize prills (below 1.8 mm) should be prohibited. Being a key element for soil health, needs to be improved in the soil as C content, and its absolute amount applied maynotbeverysignificantconsideringfertiliseruse pattern. However, being integrated with inorganic formulation, it improves microclimate at rhizosphere. While FYM/compost etc requires application rates in terms of tonnes per hectare, approachofmicro-applicationofCatrootzonecaters to immediate need and one bag of urea along with four bags of compost can decrease the loses of nitrogen. Urea manufacturers need toproduce50%ofneemcoatedureaandthereisa need to increase R&D efforts on part of ICAR and State Agriculture Universities (SAUs) in this direction to develop these types of new products in collaboration with fertilizer industry.
Quality Control of Fertilizers3.40 Inordertocheckthequalityofthefertilizerssold in the country, at present there are 74 Fertilizer Quality Control Laboratoryworking under thecontrol of different State Governments. Since quality testing is a statutory requirement under the Fertilizer Control order, 1985, it is imperative to maintain all the instruments and equipment and to ensure supply of quality chemicals and glass-wares for the analysis. Further, thereshouldbeadequateFQTLtoensurethatall thedealers in the country are covered for fertilizer samples to be tested for quality checks. there is a need to develop or nominate reputed agencies as referral laboratories to improve quality of testing of fertilizers in the country.
Organic Farming3.41 The benefits of organic produce in termsof health and nutrition are well known. Bringing more farmers/farmers’ groups under organicfarming, production of on-farm organic inputsand proper organic management of such farms need to be encouraged to increase the quantity and quality of the produce and bring down its prices. Further, proper marketing strategies need

48 State of Indian Agriculture
to be explored to ensure remunerative prices to the farmers for their produce. ICAR and other research institutes should also undertake R&D for developmentofcropandareaspecificpackageofpractices to be adopted by the farmers. Similarly, SAUs should develop courses on organic farming for its promotion and development.
Integrated Pest Management3.42 Integrated Pest Management (IPM) isan eco-friendly approach which uses cultural,mechanical and biological tools and techniques for keeping pest population below economic threshold levels. this approach attaches a high premium on the efficacy of bio-control agentsand bio-pesticides. However, need based andjudicious use of chemical pesticides is permitted. With this objective, IPM helps in maximizing crop protection with minimum input costs, minimizing pollution in soil, water and air reducing occupational health hazards, conserving ecological equilibrium and reducing pesticide residue loads in food.
3.43 There are 31 Central Integrated PestManagement Centres (CIPMCs) located in 28 States and one Union territory. CIPMCs undertakefollowingactivities:-
1. Surveillance and monitoring of insect pests and diseases.
2. Augmentation and conservation of natural enemies.
3. Production and releases of bio-controlagents.
4. Human resources development through Farmers Field Schools (FFSs), season long training programmes etc.
3.44 During2011-12,atotalof7.96lakhhectareswas covered for pest monitoring activity. Similarly, the area coverage for augmentation and conservation of ‘friendly insects’ during2011-12was7.60lakhshectares.Duringthesameperiod, 1760 million bio-control agents werereleased which was the highest during the 11th Planperiod.Bio-pesticidesusagehasdisplayeda resolutely upward trend during the previous plan period as is evident from the table below:
Table 3.5: Bio-pesticides usage
Year Bio-pesticides2007-08 1873.002008-09 1459.002009-10 3366.002010-11 5151.002011-12 6506.00
total 18355.00Sources: Directorate of Plant Protection,Quarantineand Storage
3.45 During2011-12,724FarmersFieldSchools(FFS) have been organized during kharif and rabi seasons in different parts of the country in which 21720 farmers were given trainingand demonstration of the IPM approach. As of now,77Cropspecificpackageofpracticeshavebeen prepared to help farmers and extension functionaries adopt IPM approach to combat pests and diseases in an environmentally friendly manner. However, the challenge is in periodic updation and improvement of these package of practices so that prescription to farmers and extension functionaries are in tune with new knowledge and innovation. An important issue that confronts the sector relates to devising ways and means to enhance relevance and acceptability of package of practices among farmers in different agro-climate zones characterized by regionalvariations in farming traditions, practices and crop cycles. there is also a need to assure farmers that management solutions offered for control of pests and diseases conform to principles and standards of good Agricultural Practices.
3.46 IPMapproachisbeingpromotedatpresentchieflythroughthecentrallyfundedandmanagedCIPMCs and by State Governments under RKVY. However, the challenge is in promoting greater harmony and coordination among implementing agencies, expansion of coverage in a planned manner and establishment of long term commitments with farming communities to promote the entire gamut of activities that constitute an IPM approach.
3.47 Itisevidentthatuseofbio-controlagentsincombatingpestsisontherise,yetsignificant
Farm Inputs and Management 49
challenges posed by short shelf life, standardization and quality, storage and transportation need to be addressed by agricultural research institutions in the near future. Quality of bio-pesticides,particularly in relation to threat of lacing with chemical pesticides is an emerging problem in different parts of the country. Infrastructure for laboratory analysis of bio-pesticides remaininadequate in the country.
3.48 An import issue stems from inexactpest surveys, delays in transmission of pest sureveillance data and consequent advisories on adoption of mitigating measures. the time lag inprovidingadviceisoftenresponsiblefornon-recommended usage in terms of dosage, time period and schedule of applications, and type of pesticides to be used. this has implications on costofcultivation,efficacyoftreatmentasalsoon residue status.
3.49 The Central Insecticides Board andRegistration Committee constituted under the Insecticides Act of 1968 has been mandated to advise Central and State Governments on technical matters related to pesticides. the Registration Committee which is a statutory body under the Insecticides Act, 1968 receives applications for registration of pesticides for import, indigenous manufacture, exports, etc. the Registration Committee has granted registration to 241 active ingredients and 443 pesticideformulations. the Registration Committee has registered a total of 18microbial bio-pesticidesand three botanicals. During the 11th Plan period, the Registration Committee on an average have been issuing 3257 certificates of registration ofpesticideseachyear.However,theyear2012-13has seen an unprecedented number of applications for registration of pesticides in the country. the number of applications for registration up to November, 2012 during financial year 2012-13 alone is 10726 against an average receipt of4019 applications every year during the 11th Plan period. this has caused enormous strain on the existing resources of the Registration Committee, often delaying introduction of newly invented, efficacious, lowdose, safer pesticidesinto the country. Paucity of experts in toxicology has delayed swift evaluation of pesticides
registration proposals. the Computerized Registration of Pesticides(CRoP) which has been made operational recently requires further improvement and strengthening.
3.50 The Directorate of Plant Protection,Quarantine and Storage, Faridabad under theDepartment of Agriculture & Cooperation is the nodal agency for plant quarantine and export certification. To facilitate exports and importsof agricultural commodities, an important e-governanceinitiativehasbeenundertakenwiththe launchof thePlantQuarantine InformationSystem (PQIS) inApril 2011.ThePQIS aims toreduce lead time in processing of import permits, release orders for import consignments and phytosanitarycertificatesforexports.SinceApril,2011,61175importpermits,160,628importreleaseorders and 452,395 phytosanitary certificateshave been issued online using the PQIS. TheDepartment of Agriculture & Cooperation is coordinating with the Customs Authorities in theintegrationofPQISwiththeElectronicDataInterchange system being currently in use in the Customs Department to further facilitate imports and exports of agricultural commodities through a single window clearance system.
3.51 Qualitativeandquantitativeimprovementsin infrastructure and manpower is imperative at Plant Quarantine Stations in the country tocurb possibility of detection quarantine pests and pesticides residues in Indian agriculture export consignments and wood packaging material. technical audits and inspections of Pest Control operation by licencing authorities under the Directorate of Plan Protection and Storage require greater attention.However, a far daunting challenge is in establishing an Export Quality Assurance System that links togetherfarmers, exporters, logistic support providers, pest control operators, Plant Quarantine andCustomsOfficials.
3.52 With the gradual phasing out andabandonment of Methyl Bromide fumigation in many countries as a treatment option against pests of quarantine concern, agricultural imports intoIndiamayfaceincreasingdifficultiesintheabsence of equally effective alternatives

50 State of Indian Agriculture
3.53 Toensurethatonlygoodqualitypesticidesare available to farmers, 68 State Pesticides testing Laboratories (under the State Governments) and 2 Regional Pesticides testing Laboratories at Chandigarh and Kanpur, and a Central
Insecticides Laboratory at Faridabad (under the Department of Agriculture and Cooperation) have been established. the following table will shed some light on quality of pesticides available in the Indian markets:
Table 3.6: Quality of Pesticides available in the Indian markets
Year No. of samples analyzed Pesticides found mis-branded Percentage of mis-branded samples
2008-09 47420 1839 3.8
2009-10 59005 1989 3.4
2010-11 59331 1742 2.9
2011-12 62092 2137 3.4
Source:DirectorateofPlantProtection,QuarantineandStorageFaridabad.
3.54 So far, only 4 out of 68 State Pesticidestesting Laboratories have been accredited by the NABL. Both Regional Pesticides testing Laboratories are accredited by NABL, whereas the Chemistry and Bio Assay Divisions of the Central Insecticides Laboratories have been accredited for testing of chemical pesticides and bio-pesticides respectively. Efforts are beingmade to improve standard of infrastructure and laboratory practices in remaining labs for them to be accredited in the near future. Lack of accreditedandwell-equippedlaboratoriesintheStates is an important issue which has a direct bearing on the quality of pesticides available to farmers. Infrastructure for testing quality and composition of bio-pesticides, particularly toinvestigate presence of chemical pesticides, is deficient in States. In cases of misbranding ofpesticides, prosecutions in States also tend to take a long time.
Way forward3.55 Toassistfarmersandextensionworkersinthe adoption of Integrated Pest Management (IPM) approach, package of practices for 77 major crops have been developed so far. However, many of these package of practices need to be reviewed and updatedregularlytoaccommodatenewscientificknowledge and experiences. Recommendations to be credible and relevant to farmers in different agro-climaticzoneswithvaryingcropcyclesand
agronomic practices, there is a need to evaluate and incorporate scientific knowledge availablewith State Agricultural Universities (SAUs) in the package of practices. Efforts should be made forGAPcertificationforthepackageofpracticesfor quality assurance of our agricultural produce in domestic markets and greater acceptability in foreign markets.
3.56 The law (The Insecticides Act of 1968)requires pesticides to be registered before its import, manufacture, distribution and sale is permitted in the country. the process of registration inter alia involves validation of claims on efficacy of the agrochemical againstpestsanddiseasesassociatedwithspecificcrops.the statutory authority under the law while granting registration to a pesticide also approves a set of guidelines for usage and precautions to be followed. However, the prescription for usage are sometimes not adhered to by farmers resulting innon-recommendeduseofpesticidesoncropsfor which information or evidence of technical evaluation for efficacy and pesticides residueis not available with the statutory registration authority. the issue of usage of pesticides in non-recommendedcropsneeds tobe examinedin much greater detail, and in this venture SAUs and ICAR Institutes may be in a position to provide valuable insights.
3.57 Surveillanceofcropstodetectearlysignsof build up of pests and diseases is crucial for
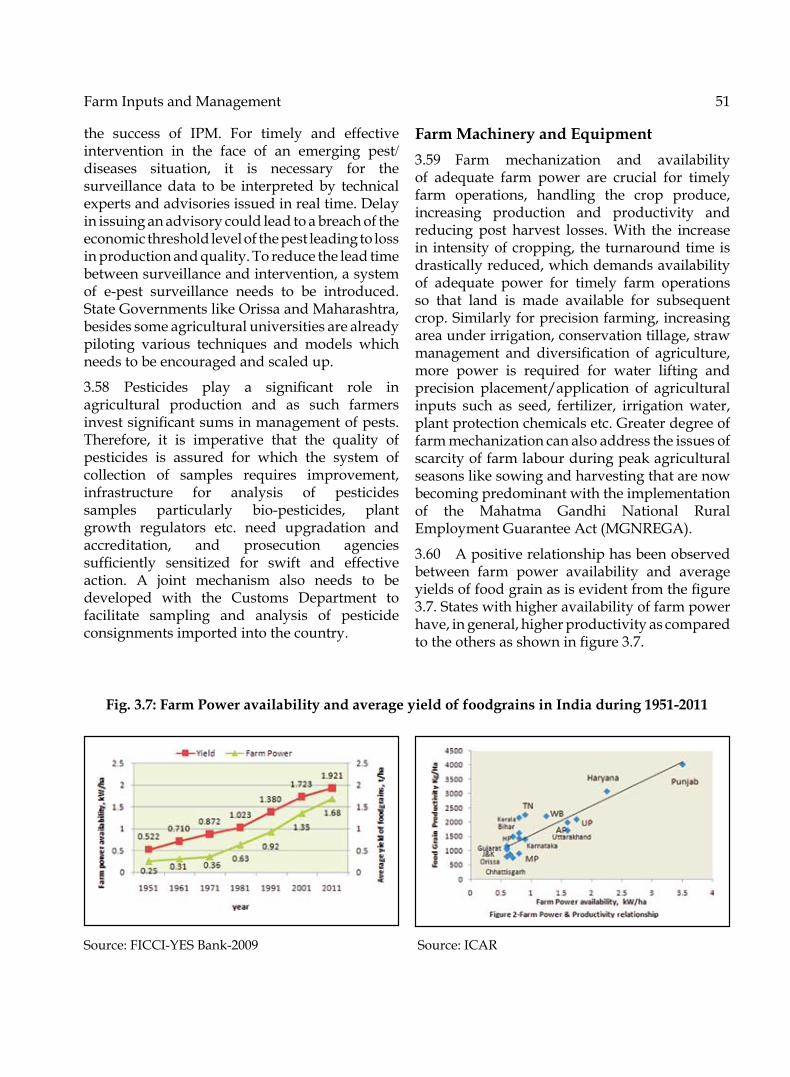
Farm Inputs and Management 51
the success of IPM. For timely and effective intervention in the face of an emerging pest/diseases situation, it is necessary for the surveillance data to be interpreted by technical experts and advisories issued in real time. Delay in issuing an advisory could lead to a breach of the economic threshold level of the pest leading to loss in production and quality. to reduce the lead time between surveillance and intervention, a system of e-pest surveillance needs to be introduced.State Governments like orissa and Maharashtra, besides some agricultural universities are already piloting various techniques and models which needs to be encouraged and scaled up.
3.58 Pesticides play a significant role inagricultural production and as such farmers investsignificantsumsinmanagementofpests.therefore, it is imperative that the quality of pesticides is assured for which the system of collection of samples requires improvement, infrastructure for analysis of pesticides samples particularly bio-pesticides, plantgrowth regulators etc. need upgradation and accreditation, and prosecution agencies sufficiently sensitized for swift and effectiveaction. A joint mechanism also needs to be developed with the Customs Department to facilitate sampling and analysis of pesticide consignments imported into the country.
Farm Machinery and Equipment3.59 Farm mechanization and availabilityof adequate farm power are crucial for timely farm operations, handling the crop produce, increasing production and productivity and reducing post harvest losses. With the increase in intensity of cropping, the turnaround time is drastically reduced, which demands availability of adequate power for timely farm operations so that land is made available for subsequent crop. Similarly for precision farming, increasing area under irrigation, conservation tillage, straw management and diversification of agriculture,more power is required for water lifting and precision placement/application of agricultural inputs such as seed, fertilizer, irrigation water, plant protection chemicals etc. Greater degree of farm mechanization can also address the issues of scarcity of farm labour during peak agricultural seasons like sowing and harvesting that are now becoming predominant with the implementation of the Mahatma Gandhi National Rural Employment Guarantee Act (MGNREGA).
3.60 Apositiverelationshiphasbeenobservedbetween farm power availability and average yieldsoffoodgrainasisevidentfromthefigure3.7.Stateswithhigheravailabilityoffarmpowerhave, in general, higher productivity as compared totheothersasshowninfigure3.7.
Fig. 3.7: Farm Power availability and average yield of foodgrains in India during 1951-2011
Source:FICCI-YESBank-2009 Source:ICAR
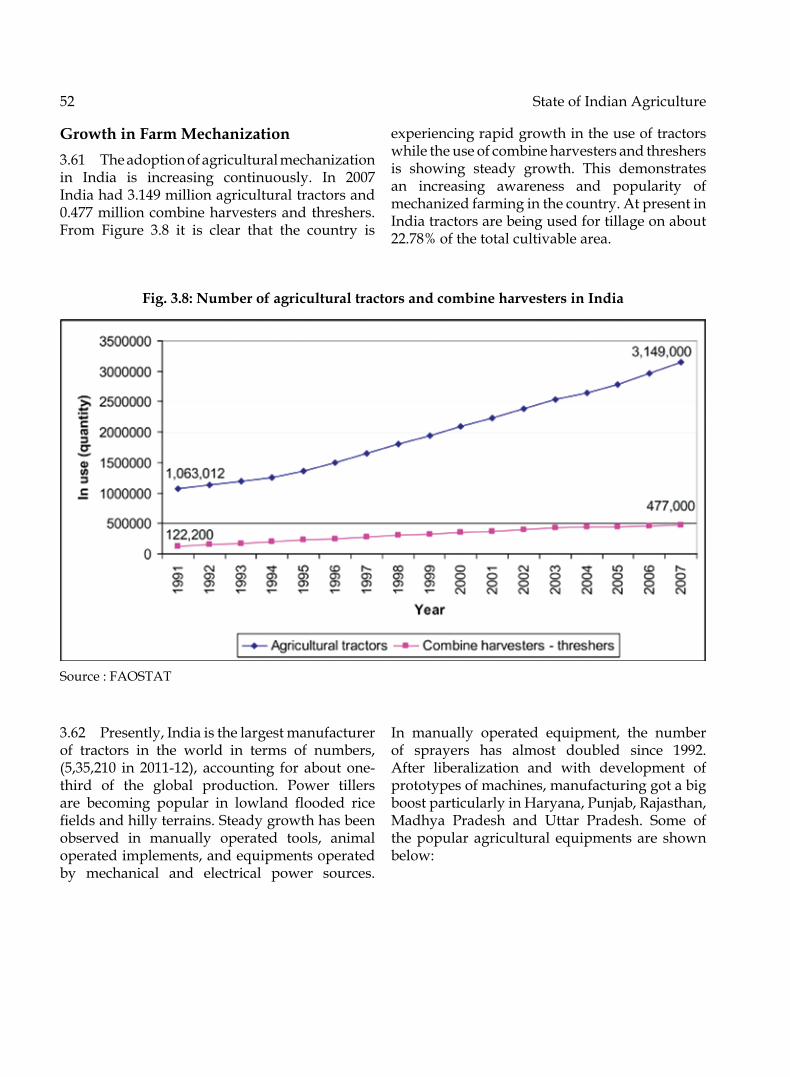
52 State of Indian Agriculture
Growth in Farm Mechanization3.61 Theadoptionofagriculturalmechanizationin India is increasing continuously. In 2007Indiahad3.149millionagriculturaltractorsand 0.477millioncombineharvestersandthreshers.From Figure 3.8 it is clear that the country is
experiencing rapid growth in the use of tractors while the use of combine harvesters and threshers is showing steady growth. this demonstrates an increasing awareness and popularity of mechanized farming in the country. At present in India tractors are being used for tillage on about 22.78%ofthetotalcultivablearea.
Fig. 3.8: Number of agricultural tractors and combine harvesters in India
Source : FAoStAt
3.62 Presently,Indiaisthelargestmanufacturerof tractors in the world in terms of numbers, (5,35,210 in 2011-12), accounting for about one-third of the global production. Power tillers are becoming popular in lowland flooded ricefieldsandhillyterrains.Steadygrowthhasbeenobserved in manually operated tools, animal operated implements, and equipments operated by mechanical and electrical power sources.
In manually operated equipment, the number of sprayers has almost doubled since 1992. After liberalization and with development of prototypes of machines, manufacturing got a big boost particularly in Haryana, Punjab, Rajasthan, Madhya Pradesh and Uttar Pradesh. Some of the popular agricultural equipments are shown below:

FarmInputsandManagement 53
Figure 3.9: Popular Agricultural Equipments
(a) Self Propelled Vertical conveyor
(c) Self Propelled Power Weeder
(e) Self Propelled Combine Harvester
(b) Straw Baler reaper cum binder
(d) Aeroblast Sprayer
(f) Power Tiller

54 State of Indian Agriculture
Challenges and Constraints for Mechanizing Small Farms3.63 Even though the adoption of farmmechanization is increasing in India, it is mostly region specific. Farmmechanizationhas a verylow growth rate in regions such as hilly and sloppy land. the decreasing trend in operational land holding is also obstructing the growth of agricultural mechanization. High costs of machines and maintenance, non-availabilityof appropriate agricultural machines and equipment that cater to and suit the requirements of small scale farms, non-availability of and ordifficulty ingettingbank credit and small landholding are some of the factors that hinder farm mechanization and force farmers to follow the traditional ways of agricultural operations. the use of farm machinery is also dependent on infrastructure and services available in the rural areas.
3.64 Though, India isoneof the topcountriesin agricultural production, in terms of farm mechanization, it is behind the world average. For instance, the tractor density of India is about 16 tractors for 1,000 hectares, while theworld average is 19 tractors and that of USA is 27. Clearly, there is significant opportunity formechanization of agriculture. However, this sector faces some key challenges such as:
• Indian agriculture requires customized farm machinery and equipment suiting to the requirements of different regions of the country which have highly diverse farm size & soil types.
• Skewed and seasonal usage of machines results in low economic viability of the machines and this call for innovative solutions for scaling up usage.
Farm Mechanization as Services3.65 Farmmechanizationsavestimeandlabour,cutsdowncropproductioncosts, reducespost-harvest losses and boosts crop output and farm incomes. the current scenario of increasing threat to natural resources, notably land and water, has further necessitated switching over to machine
assisted resource-conservation techniques suchas zero-tillage, raised-bed planting, precisionfarming, etc. Farm mechanization has now become more imperative while mitigating the effect of climate change by readjusting crop sowing schedules. The climate change-drivenearly onset of summers in the northern states has often resulted in a decline in wheat yields. this loss can be averted by sowing wheat early, which is possible only if the previous paddy crop is harvested mechanically and wheat is planted with zero-till seed drills that do not requireploughing the land.
3.66 Mechanization small andnon-contiguousgroup of lands is against ‘economies of scale’especially in organizations like land preparation and harvesting. With continued shrinkage in average farm size, more and more farms will fall into the adverse category thereby making individual ownership of agricultural machinery progressively more uneconomical. Moreover, farm mechanization is capital intensive and thus it remains beyond the reach of small and marginal farmers. Custom Hiring Centres are the options to make farm equipments and machines available to the farmers within easy reach and at affordable cost. this will not only increase the power availability but also help in removing the disparity in availability of farm power among various states thereby increasing the productivity of farm besides reducing drudgery associated with various farm operations.
3.67 Thecustomhiringofagriculturalmachineisbeing practiced successfully through cooperative societies in Punjab, Kerala, Karnataka, Andhra Pradesh. the successful modes of custom hiring centres can be replicated in the other part of the country.
Ensuring Quality of Agricultural Machines and Equipments3.68 To cope up with the ever increasingdemand for testing of newly developed agricultural machines and equipments, in addition to four FMt&tI , the DAC has authorized 28 State Agricultural Universities (SAUs)/ICAR Institutions including 3 State

Farm Inputs and Management 55
Agriculture Departments as testing Centers for testing and certifying certain categories of agricultural machinery and equipments. Now the DAC is actively considering introduction of new and innovative systems by involving private sectors such as self certification in caseof reputed manufactures, initially for tractors, combine harvesters and power tillers. Gradually this system will be introduced for all other agricultural machines and equipments.
Value Addition of Agricultural Produce3.69 Postharvestprocessingisanemergingareaof interest for mechanized operations. the present levelsofpostproduction losses are 2.8-10% indurables,6.8-12.5%insemi-perishablesand5.8-18%inperishableproducts(CIPHETLudhiana).About 50% of these losses could be preventedusing appropriate post harvest approaches. So there is still large scope for mechanization in post harvest processing of agricultural commodities
3.70 In India, agro-marketing is a largelyunorganized and inefficient; as high as 18 to25% loss occur in the entire food supply–chainfrom production to consumption. Markets for value-added and processed commodities areconsistently increasing with increasing demands by consumers of these products. Low-costimproved technologies are required to unleash potential and market efficiency and remaincompetitive simultaneously. New opportunities have emerged with the opening of the trade, therefore, issues related to sanitary and phyto-sanitary measures would need to be addressed appropriately. A three –pronged strategy is needed toreducepostharvestlosses-(a)compresssupply–chain by linking producers and markets;(b) promote processing in production catchments to add value before being marketed ; and (c) develop small-scale processing refrigeratedchambers or cold storage using conventional and non conventional sources. And these would requireresearchforagro-commodities,especiallypost-harvest engineering.More focuswouldbegiven to primary and secondary levels of value –addition and processing.
Developing Low Cost, Light Weight Multi-purpose Farm Equipments3.71 About 85% farmers are having less than2 hectares cultivated land and their livelihoods depend on agriculture. thus, it is necessary to focus on these small farmers by introducing & developing low cost, light weight, multi –purpose farm equipments. Precision farming in horticultural crops requires development for semi-mechanized nursery raising technologyand improved horticultural tools.
Way Forward3.72 Recognizing the need to spread thebenefitsofagriculturalmechanizationamongallstrataoffarmers’especiallysmallandmarginalfarmers, the Department of Agriculture & Cooperation is integrating the components of agricultural mechanization under various schemes and programmes aiming at catalyzing an accelerated but inclusive growth of agricultural mechanization in India by promoting ‘Custom HiringCentre’foragriculturalmachinery.
Labour and Agricultural Wages3.73 Agriculture is a labour intensive activity.Cost of cultivation data shows that labour accounts formorethan40percentofthetotalvariablecostofproduction in most cases. therefore, availability of labour to work in agriculture is crucial in sustaining agricultural production. Agricultural wages have been traditionally low due to low productivity, large disguised unemployment in agricultureduetolackofsufficientemploymentopportunities elsewhere. However, in recent years there is a perceptible change in this trend due to rapid economic growth and adoption of policies for employment generation including promotion of self employment opportunities. Wage levels in the agricultural sector have increased considerably during recent years. A table indicating the average daily wages for agricultural field labour for ploughing andharvesting at all India level and the average wages paid for industries covered under Annual Survey of Industries (ASI) is given below which
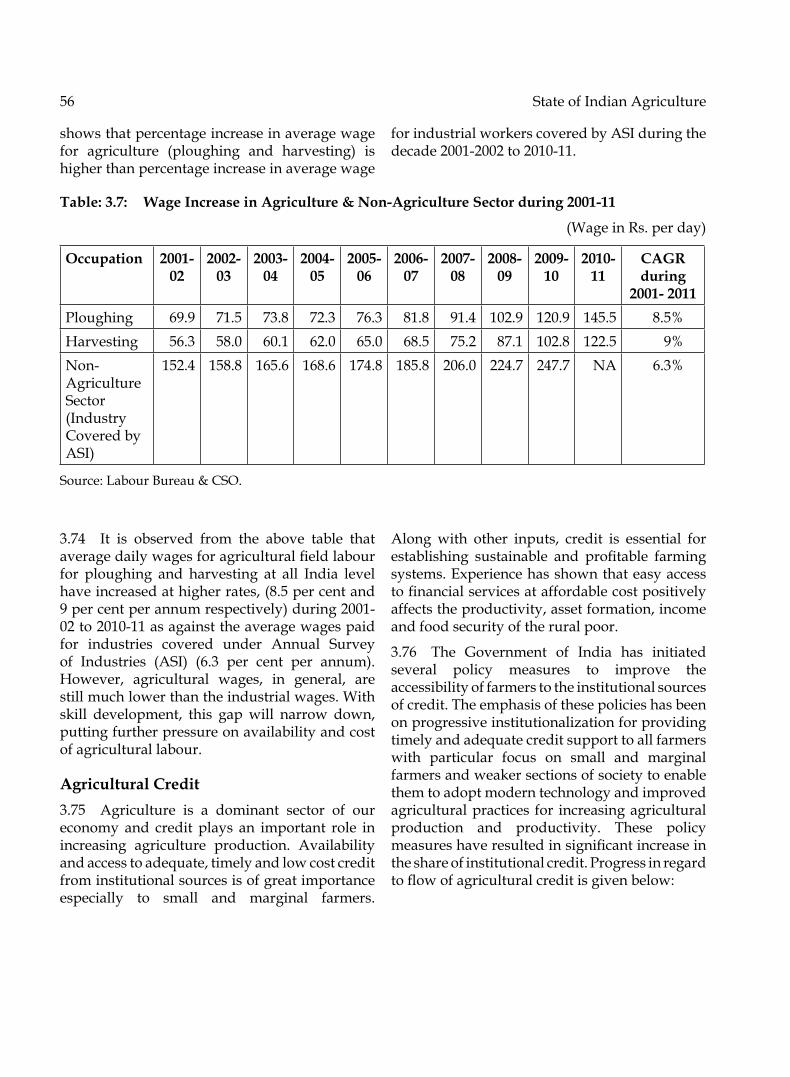
56 State of Indian Agriculture
shows that percentage increase in average wage for agriculture (ploughing and harvesting) is higher than percentage increase in average wage
for industrial workers covered by ASI during the decade2001-2002to2010-11.
Table: 3.7: Wage Increase in Agriculture & Non-Agriculture Sector during 2001-11
(Wage in Rs. per day)
Occupation 2001-02
2002-03
2003-04
2004-05
2005-06
2006-07
2007-08
2008-09
2009-10
2010-11
CAGR during
2001- 2011Ploughing 69.9 71.5 73.8 72.3 76.3 81.8 91.4 102.9 120.9 145.5 8.5%Harvesting 56.3 58.0 60.1 62.0 65.0 68.5 75.2 87.1 102.8 122.5 9%Non-Agriculture Sector (Industry Covered by ASI)
152.4 158.8 165.6 168.6 174.8 185.8 206.0 224.7 247.7 NA 6.3%
Source: Labour Bureau & CSo.
3.74 It is observed from the above table thataveragedailywagesforagriculturalfieldlabourfor ploughing and harvesting at all India level have increased at higher rates, (8.5 per cent and 9percentperannumrespectively)during2001-02to2010-11asagainsttheaveragewagespaidfor industries covered under Annual Survey of Industries (ASI) (6.3 per cent per annum).However, agricultural wages, in general, are still much lower than the industrial wages. With skill development, this gap will narrow down, putting further pressure on availability and cost of agricultural labour.
Agricultural Credit3.75 Agriculture is a dominant sector of oureconomy and credit plays an important role in increasing agriculture production. Availability and access to adequate, timely and low cost credit from institutional sources is of great importance especially to small and marginal farmers.
Along with other inputs, credit is essential for establishing sustainable and profitable farmingsystems. Experience has shown that easy access tofinancialservicesataffordablecostpositivelyaffects the productivity, asset formation, income and food security of the rural poor.
3.76 The Government of India has initiatedseveral policy measures to improve the accessibility of farmers to the institutional sources of credit. the emphasis of these policies has been on progressive institutionalization for providing timely and adequate credit support to all farmers with particular focus on small and marginal farmers and weaker sections of society to enable them to adopt modern technology and improved agricultural practices for increasing agricultural production and productivity. these policy measureshaveresultedinsignificantincreaseinthe share of institutional credit. Progress in regard toflowofagriculturalcreditisgivenbelow:

Farm Inputs and Management 57
Table 3.8: Institutional Credit to Agriculture(Rs. in Crore)
Year Target Short Term Credit Long Term Credit Total Credit2004-05 105000 74064 51245 1253092005-06 141000 105350 75136 1804862006-07 175000 138455 90945 2294002007-08 225000 183519 66066 2546582008-09 280000 210461 91447 2871492009-10 325000 276656 107858 3845142010-11 375000 335550 132741 4682912011-12 475000 396158 114871 511029
farmers, who promptly repay their crop loans, are extended loans at an effective interest rate of 4%p.a.
3.79 Extension of Interest Subvention Scheme to Post Harvest Loans: In order to discourage distress sale by farmers and to encourage them to store their produce in warehousing against warehouse receipts, the benefit of interestsubvention scheme has been extended to small and marginal farmers having Kisan Credit Card for a further period of upto six month post harvest on the same rate as available to crop loan against negotiable warehouse receipt for keeping their produce in warehouses.
3.80 Collateral Free Loans: the limit of collateral free farm loan has been increased from Rs.50,000toRs.1,00,000.
3.81 Relief in Event of Occurrence of Natural Calamities: Reserve Bank has put in place a mechanism to address situations arising out of natural calamities. the banks have been issued necessary guidelines for undertaking necessary credit relief measures in event of occurrence of natural calamities. the guidelines, inter alia, contain directions to banks to ensure that the meetings of District Consultative Committees or StateLevelBankers’Committeesareconvenedattheearliesttoevolveaco-ordinatedactionplanfor implementation of the relief programme in collaboration with the State/district authorities. Banks have been advised to provide conversion/
Major Initiatives to Increasing Flow of Credit3.77 Farm credit package: Government of India in its Farm Credit Package announced in June2004,advisedbanks todouble credit toagriculture sector in three years, i.e., by 2006-07.Intheannualbudgets,GovernmentofIndiaannounces targets for credit to agriculture to ensure adequate credit flow to the sector. Theflow of agriculture credit since 2003-04 hasconsistently exceeded the target. Agriculture creditflowhasincreasedfromRs.86981crorein2003-04toRs.468291crorein2010-11.Thetargetforthe2011-12wasfixedatRs.475000croreandachievement is Rs.511029 crore forming morethan107%ofthetarget.Thetargetofcreditflowfortheyear2012-13hasbeenfixedatRs.575000croreandachievementasonSeptember,2012isRs.239629crore.
3.78 Interest Subvention to Farmers: Government of India announced an interest subvention scheme in 2006-07 to enable banksto provide short term credit to agriculture (crop loan) upto Rs.3 lakh at 7% interest to farmers.Further, to incentivise prompt repayment, in the UnionBudgetfor2009-10,GovernmentofIndiaannounced an additional interest subvention of 1%tothosefarmerswhorepaytheirshorttermcrop loans promptly and on or before due date. This was subsequently raised to 2% in 2010-11 and 3% in 2011-12 and 2012-13 also. Thus,
58 State of Indian Agriculture
reschedulement of loans and consider moratorium period of at least one year in all cases of restructuring. to enhance awareness, the banks are also required to give adequate publicity to their disaster management arrangements, including the helpline numbers. Further, the banks have been advised not to insist for additional collateral security for such restructured loans.
3.82 Interest Subvention for Loan Restructured in the Drought Affected States in 2012: the standing guidelines of Reserve Bank of India (RBI) provide for rescheduling of short term crop loans upon declaration of natural calamity including drought. Such rescheduling of crop loans converts them into term loans for which normal rate of interest are applicable. Due to deficient rainfall this year in some parts of thecountry. the Government has decided that in cases where such loan are restructured due to drought,theinterestsubventionof2%whichisalready available for short term crop loans will continuetobeavailableforthecurrentfinancialyear on the full restructured amount.
3.83 Kisan Credit Card Scheme : Kisan Credit CardSchemeforfarmerswasintroducedin1998-99 to enable the farmers to purchase agricultural inputs such as seeds, fertilizers, pesticides, etc. the Kisan Credit Card Scheme is in operation throughout the country and is implemented by Commercial Banks, Coop. Banks and RRBs. the schemehasfacilitatedinaugmentingcreditflowfor agricultural activities. the scope of the KCC hasbeenbroad-basedtoincludetermcreditandconsumption needs. All farmers including Small farmers, Marginal farmers, Share croppers, oral lessee and tenant farmers are eligible to be covered under the Scheme. the card holders are also covered under Personal Accident Insurance Scheme (PAIS) against accidental death/permanent disability. Further, KCC scheme has beenrefinedonthebasisofsuggestionsmadebya Working Group (Bhasin Working Group) and it has been decided to convert Kisan Credit Card into a Smart Card cum Debit Card and revised guidelines have been issued by NABARD. Some of the major features of the revised guidelines are as under:
• Flexi KCC with simple assessment prescribed for marginal farmers.
• Validity of KCC for 5 years.
• For crop loans, no separate margin need to beinsistedasthemarginisin-builtinscaleoffinance.
• No withdrawal in the account to remain outstanding for more than 12 months; no need to bring the debit balance in the account to zero at any point of time.
• Interest subvention/incentive for prompt repayment to be available as per the Government of India and/or State Government norms.
• Noprocessing feeup toa limitofRs.3.00lakh.
• Onetimedocumentationatthetimeoffirstavailment and thereafter simple declaration (about crops raised/proposed) by farmer.
• KCC cum SB account instead of farmers having two separate accounts. the credit balance in KCC cum SB account to be allowed to fetch interest at saving bank rate.
• Disbursement through various delivery channels, including ICt driven channels like AtM/PoS/Mobile handsets.
3.84 Bringing Green Revolution in Eastern India (BGREI) : Financing Agricultural Investments in the Eastern Region – Concessional Refinance Support: In order to support the banking system finance key investments,NABARD has introduced a concessional refinance scheme in the year 2011-12, with anobjective to accelerate investments in agriculture to enhance production and productivity of crops in the Eastern region (Assam, Bihar, Jharkhand, Chhattisgarh, odisha, West Bengal and Eastern Uttar Pradesh) by incentivising the banks. Under thescheme,NABARDprovides100%refinancetobanksataconcessionalrateof7.5%p.a.providedcertain minimum targets are achieved by the bank in financing these key investments. Fouractivities viz, Water Resources development, Land development, Farm Equipments (including

Farm Inputs and Management 59
tractorfinancingongroupmodebasis)andSeedProduction are covered.
3.85 Revival Package for Short Term Cooperative Credit Structure: the Government is implementingapackage forrevivalofShort-term Rural Cooperative Credit Structure with financialoutlayofRs.13,596croreinthecountry.the Revival Package is aimed at reviving/strengtheningtheShort-termRuralCooperativeCredit Structure (CCS) and make it a well-managed and vibrant medium to serve the credit needs of rural India, especially the small and marginal farmers. It seeks to (a) provide financial assistance to bring the system to anacceptable level of health; (b) introduce legal and institutional reforms necessary for their democratic,self-reliantandefficientfunctioning;and (c) take measures to improve the quality of management.
3.86 SHG Bank Linkage-: SHG-BankLinkagemodel, continues to be the dominant model in theIndianmicrofinancecontextwithnearly7.96millionSHGscateringto100millionhouseholdssaving with the formal banking system to the tuneofRs.6,551crore.Overtheyears,theSHG-Bank Linkage programme has emerged as a viablemodel for financial inclusion of hithertoun reached poor households particularly in rural hinterlands. Despite the achievements, there are issues like skewed growth, intra state variations in implementation, credit widening and deepening, role of Micro Finance Institute (MFIs), etc.
3.87 Joint Liability Groups: the JLG mode of financing serves as collateral substitute forloans to be provided to the target group i.e. small, marginal, tenant farmers, oral lessees, share croppers, etc. It builds mutual trust and confidencebetweenthebankandthetargetgroupand minimizes the risks in the loan portfolio for the banks through group dynamics, cluster approach, peer education and credit discipline. TheobjectiveoftheJLGmodeoffinancingisto
provide food security to vulnerable section by enhanced agriculture production, productivity and livelihood promotion. JLGs can also easily serve as a conduit for technology transfer, facilitating common access to market information, training and technology dissemination in activities like soil testing, training and assessing inputrequirements,etc.Duringtheyear2011-12,variousbankshaddisbursedaloanofRs.1,700.39crore to 1,91,662 JLGs taking the cumulative loans disbursedtoRs.2,845.68crorefor3,32,707JLGs.
Concessional refinance is provided subject toconditionofminimum70%lendingagainstcreditpotentialfortheidentifiedactivitiesassessedonthe basis of projections made in the Potential Linked Plans. the commercial banks are required to achieve the minimum lending level of 70%while the RRBs and Co-operative Banks arerequired to achieve the minimum lending level of 50% of the Overall lending Target/Potential assessed.Thenormswererevisedduring2011-12beingthefirstyearofthescheme,to50%incaseofCommercialBanks and25% in caseofRRBsandCo-operativeBanks.Supporttothebanksfor(a) Forming and linking of Joint Liability Groups (JLGs) (b) Awareness programmes for promoting the scheme (c) organizing sensitization meets for thebranchofficialsof implementingbanksand(d)Trainingandcapacitybuildingof identifiedentrepreneurs is also offered under the scheme. In partial modification of the Scheme, TractorFinancing under group mode to Self Help Groups (SHGs)/Joint Liability Groups (JLGs) were also considered for concessional refinance by thebanks,providedtractorsarefinancedto;
a) An existing Self Help Group (SHG) which is at least two years old
b) A new Joint Liability Group (JLG), provided the number of land owning farmersinthegroupisnotlessthanfiveand every member is a Small Farmer (SF) or a Marginal Farmer (MF)
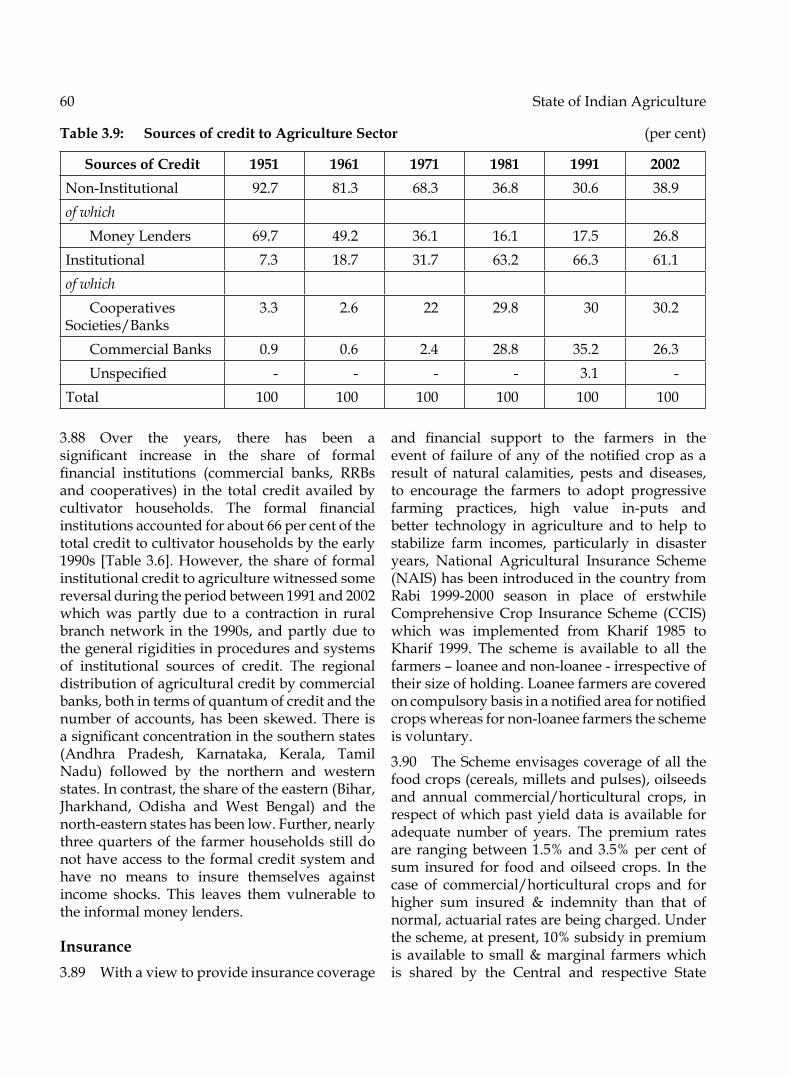
60 State of Indian Agriculture
3.88 Over the years, there has been asignificant increase in the share of formalfinancial institutions (commercial banks, RRBsand cooperatives) in the total credit availed by cultivator households. The formal financialinstitutions accounted for about 66 per cent of the total credit to cultivator households by the early 1990s [Table3.6].However, theshareof formalinstitutional credit to agriculture witnessed some reversalduringtheperiodbetween1991and2002which was partly due to a contraction in rural branchnetwork in the1990s,andpartlydue tothe general rigidities in procedures and systems of institutional sources of credit. the regional distribution of agricultural credit by commercial banks, both in terms of quantum of credit and the number of accounts, has been skewed. there is asignificantconcentrationinthesouthernstates(Andhra Pradesh, Karnataka, Kerala, tamil Nadu) followed by the northern and western states. In contrast, the share of the eastern (Bihar, Jharkhand, odisha and West Bengal) and the north-easternstateshasbeenlow.Further,nearlythree quarters of the farmer households still do not have access to the formal credit system and have no means to insure themselves against income shocks. this leaves them vulnerable to the informal money lenders.
Insurance3.89 Withaviewtoprovideinsurancecoverage
and financial support to the farmers in theeventof failureofanyof thenotifiedcropasaresult of natural calamities, pests and diseases, to encourage the farmers to adopt progressive farming practices, high value in-puts andbetter technology in agriculture and to help to stabilize farm incomes, particularly in disaster years, National Agricultural Insurance Scheme (NAIS) has been introduced in the country from Rabi 1999-2000 season in place of erstwhileComprehensive Crop Insurance Scheme (CCIS) which was implemented from Kharif 1985 to Kharif 1999. the scheme is available to all the farmers–loaneeandnon-loanee-irrespectiveoftheir size of holding. Loanee farmers are covered oncompulsorybasisinanotifiedareafornotifiedcropswhereasfornon-loaneefarmerstheschemeis voluntary.
3.90 TheSchemeenvisagescoverageofall thefood crops (cereals, millets and pulses), oilseeds and annual commercial/horticultural crops, in respect of which past yield data is available for adequate number of years. the premium rates are rangingbetween1.5%and3.5%percentofsum insured for food and oilseed crops. In the case of commercial/horticultural crops and for higher sum insured & indemnity than that of normal, actuarial rates are being charged. Under thescheme,atpresent,10%subsidyinpremiumis available to small & marginal farmers which is shared by the Central and respective State
Table 3.9: Sources of credit to Agriculture Sector (per cent)
Sources of Credit 1951 1961 1971 1981 1991 2002Non-Institutional 92.7 81.3 68.3 36.8 30.6 38.9of which Money Lenders 69.7 49.2 36.1 16.1 17.5 26.8Institutional 7.3 18.7 31.7 63.2 66.3 61.1of which Cooperatives Societies/Banks
3.3 2.6 22 29.8 30 30.2
Commercial Banks 0.9 0.6 2.4 28.8 35.2 26.3 Unspecified - - - - 3.1 -total 100 100 100 100 100 100

Farm Inputs and Management 61
Governmenton50 : 50basis alongwith claimsfor normal sum insured & indemnity level for food and oilseed crops.
3.91 The Agriculture Insurance Company ofIndia Ltd. (AIC) is the Implementing Agency (IA) of the Scheme. It is a yield guarantee scheme operating on “Area Approach” basis. the implementing States/Uts can notify any unit area of insurance i.e. block, mandal, tehsil, circle, phirka, gram panchayat etc. keeping in view the availability of past yield data and capacity of the State to undertake requisite number of Crop Cutting Experiments (CCEs) in each notified areas for assessment of crop loss.the State Government/Ut Administration is required to notify areas/crops well in advance of thecropseason,issuethenecessarynotification/instructions to all financial institutions andprovide past yield data.
3.92 If the actual average yield per hectareof the insured crop for the defined area (onthe basis of requisite number of Crop Cutting Experiments) in the insured season, falls short of specified Threshold yield, all the insuredfarmersgrowingthatcropinthedefinedareaaredeemed to have suffered shortfall in their yield. the scheme provides coverage against such contingency. the indemnity claims are worked out by the Implementing Agency i.e. Agriculture Insurance Company (AIC) of India Ltd., on the basis of yield data, based on requisite number of Crop Cutting Experiments, furnished by the implementing State/Ut. the claims are released to banks and the banks in turn credit the amount in the account of the beneficiary farmers anddisplay the particulars of beneficiaries on theirnotice board.
3.93 Indemnity claims are worked out on thebasis of the following formula:
Shortfall in yieldthreshold yield
× Sum Insured for the farmer.
Where shortfall = threshold Yield – Actual Yield fortheDefinedArea.
3.94 Financial liabilities towards claims above100%ofpremiumincaseofFoodCrops&Oilseedsalongwith10%premiumsubsidy to small and
marginal farmers, Bank Service charges and 20%ofadministrativeandoperationalexpensesare borne by the Government and shared on 50:50basisby theCentralGovernment and therespective State Governments. All claims in case of annual horticultural/commercial crops and higher sum insured and indemnity levels for food crops and oilseeds are being paid by the implementing agency.
Progress of Crop Insurance Programme3.95 At present, NAIS is being implemented by the 24 States and 2 Union territories namely Andhra Pradesh, Assam, Bihar, Chhattisgarh, Goa, Gujarat, Haryana, Himachal Pradesh, Jammu & Kashmir, Jharkhand, Karnataka, Kerala, Madhya Pradesh, Maharashtra, Manipur, Meghalaya, Mizoram, orissa, Sikkim, tamil Nadu, tripura, Uttar Pradesh, Uttarakhand, West Bengal, Andaman & Nicobar Islands and Puducherry.
3.96 Progress of the scheme can bemeasuredin terms of farmers/area covered, sum insured, premium collected, claims paid and farmers benefited.Duringthelasttwentyfivecropseasons(i.e. fromRabi 1999-2000 toRabi 2011-12), 1930lakh farmers have been covered over an area of 2915 lakh hectares insuring a sum amounting to Rs. 2555309 crore. Claims to the tune of aboutRs. 24528 crore have become payable against the premium income of about Rs. 7698 crore benefiting about 505 lakh farmers. State-wisebusiness statistics of NAIS are at Annexure.
3.97 TheModifiedNAIShasbeenimplementedin50districtsand44districtsduringRabi2011-12andKharif2012seasonsrespectively.FromRabi2010-11 to Rabi 2011-12 (three seasons), 15.38lakh farmers have been covered over an area of 16.57 lakh hectares insuring a sum amounting to Rs.3865crore.ClaimstothetuneofaboutRs.112crore have become payable against the premium ofaboutRs.323crorebenefitingabout1.45lakhfarmers.State-wisebusinessstatisticsofModifiedNational Agriculture Insurance Scheme (MNAIS) are at Annexure.
3.98 TheWeatherBasedCropInsuranceScheme(WBCIS)isbeingimplementedin230districtsin
62 State of Indian Agriculture
16States.FromKharif2007toRabi2011-12,243lakh farmers have been covered over an area of 338 lakhhectares insuringa sumamounting toRs. 42888.99 crore. Claims to the tune of about Rs. 117.91 crore have become payable against the premium of about Rs. 2291.75 crore benefitingabout 122 lakh farmers. State-wise businessstatistics of WBCIS are at Annexure.
3.99 The Coconut Palm Insurance Scheme(CPIS) is being implemented on pilot basis in selected states/areas. From 2009-10 to 2012-13,48715 farmers have been covered over an area of25389hectares, insuring27.66lakhpalmsforasumamountingtoRs.269.53crore.Claimstothe tune of about Rs. 153.23 lakh have becomepayable against the premium of about Rs. 146.45 lakh benefiting about 3385 farmers. State-wisebusiness statistics of CPIS are at Annexure.
3.100 All the above said schemes aredemanddriven and no state-wise allocation/release ismade under these schemes. Funds are released to the implementing agency who in turn settles the claims of farmers and provide premium subsidy as per provisions of the schemes.
The Way Forward – Yield Index Crop Insurance3.101TheNationalAgriculturalInsuranceScheme(NAIS) and modified NAIS (MNAIS) providerisk coverage of the crops on the basis of their yield. While the unit area for MNAIS is village/villagepanchayat,NAISalsoallowsnotificationof village as the unit area. However, many States notify a larger unit area such as Block, taluk and tehsil. the larger unit area does not cover the risk of individual farmers that effectively because of larger variations in the yield in the unit area. the States are reluctant to notify a smaller unit area (such as a village) because of increased requirements of the minimum number of crop cutting experiments that has to be undertaken which is both costly and time consuming affair. the States need to deploy additional manpower and provide adequate training to the personnel engaged in the crop cutting experiments to ensure accurate and timely availability of yield data for effective implementation of the insurance schemes. Use of modern technology such as
remote sensing through satellite imagery may be deployed to reduce the cost and improve the accuracy of crop cutting experiments.
3.102 Under the weather based insurancescheme, the crops are insured against adverse weather conditions. However, successful implementation of a weather based insurance product requires adequate number of automatic weather stations to be set up to capture the weather data accurately. At present, there are only about 3,000 automatic weather stations(including the weather stations set up by the private companies). However, about 10,000automatic weather stations would be required to properly implement weather based crop insurance scheme in the entire country. India Meteorological Department (IMD), agricultural universities, the private sector and insurance companies need to work closely to set up required number of automatic weather stations in the country for successful implementation of the weather based crop insurance scheme.
Extension Services3.103 The process of technology transfer inIndia has been amix of field extension carriedout by line departments, anchored by frontline extension systems of the ICAR Institutes and SAUs, Commodity Boards, NGos and voluntary organizations. Recently, Farmers’ Consortiumsunder different nomenclature have also emerged with this mandate. But most of them have not been able to reach out to the broad spectrum of clientele, who need problem solving, relevant technologies and ground level advisories. These efforts have however not been sufficientin the context of food security concerns. New initiatives viz. ever increasing ICt interventions; growing emphasis on people’s participationand democratic decentralization; increasing role of NGos; growing thrust on entrepreneurship development and multiplicity of facilitating and consultancy services required by different stakeholders are bound to play a catalytic role. Realizing the fact that Public extension services in India need to be geared up, particularly in addressing the emerging technological and knowledge needs,concerted efforts have been

FarmInputsandManagement 63
made in the recent past to strengthen the system by suitably revising and revamping the ongoing Schemes of the Department of Agriculture and Cooperation.
Support to State Extension Programmes for Extension Reforms3.104 The Scheme is currently in operation in614 districts of 28 states & 3 UTs. The schemeessentially focuses on institutionalizing key reforms. the extension support to farmers under the scheme is provided through a ‘basket of activities’ called theATMACafeteria,whichcovers activities that are to be implemented at both State and District levels. State level activities include preparation of State Extension Work Plan(SEWP),supportforup-gradingstateleveltraining institutions, such as, State Agricultural Management & Extension training Institutes (SAMEtI), human resource development of extension functionaries, organization of various agriculture related activities including monitoring and evaluation. District level activities are further categorized into four groups; namely: (i) Farmer oriented Activities; (ii) Farm Information Dissemination Activities; (iii) Research-Extension-FarmerActivities,and(iv)InnovativeActivities. Based on SREP, and the Block Action PlansjointlyfirmedupbytheBlockTechnologyteam (Btt) and BFAC, the District Agriculture Action Plans (DAAPs) are prepared annually. At the State Headquarter, district plans are collated and a State Extension Work Plan (SEWP) is approvedbyInter-DepartmentalWorkingGroup(IDWG) headed by the Agriculture Production Commissioner/Secretary (Agriculture) of the State. the State Extension Work Plan (SEWP) approved by IDWG is further put up to State Level Sanctioning Committee for approval and Government of India for release of funds.
3.105 ThestatusofimplementationofExtensionReforms Scheme is as under:
• Over215.15lakhfarmershavebeenbenefitedso far since inception of the scheme through various extension activities viz.:
• Over15.53 lakh farmersbenefited throughExposure Visits;
• over 49.55 lakh farmers through various training programmes at different levels;
• over 22.92 lakh farmers through Demonstrations; and
Box 3.2: Innovative Steps: Farm Crop Management System (FCMS): Tamilnadu
to implement farm level interventions through micro level planning and execution by the Departments viz., Agriculture, Horticulture, Agricultural Engineering, Agricultural Marketing and tNAU, a specially developed software package “Farm Crop Management System” has been developed. FCMS is being implemented in six districts of tamilNadu on Pilot basis Viz; trichy,Coimbatore, Erode, Vellore, Virudhunagar and tiruvarur.Personal Digital Assistants (PDA) are being distributed to collect detailed data base on field,inform availability of inputs such as seeds, fertilizers, pesticides, bio-pesticides etc., recordbiometric observations of crops at critical stages to arrive estimated yield, pest and disease outbreak, improved cultivation technologies, individual based insurance settlement and linkages for marketing of harvested crops. the data will be used to narrow down the yield gap and to facilitate the farmers for easy access to information like weather, input availability, farm based interventions, market intelligence and scheme benefits besidesknowing details of their own farm plan and inputs requirement.FCMS is being implemented in six districts of tamilNadu on Pilot basis Viz; trichy, Coimbatore, Erode, Vellore, Virudhunagar and tiruvarur.

64 State of Indian Agriculture
• over 115.72 lakh farmers through KissanMelas/Field days and Kissan Goshties.
• Over 1.10 lakh Farmers Interest Groups(FIG’s)havebeenmobilized.
• over 41,149 Farm Schools have been set up on thefieldofProgressive/Awardeesfarmers.
3.106 The Government has been trying itsutmost to strengthen the institution of AtMA. In fact, National Mission on Agricultural Extension and technology proposed to be launched during XII Plan which will focus on disseminating timely information and appropriate technologies to the farmers through the structure of AtMA and Block technology teams.
Establishment of Agri-Clinics and Agri-Business Centres3.107 Launched in 2002, the Scheme onEstablishmentofAgri-ClinicsandAgri-BusinessCentres (ACABC) was aimed to strengthen the extension services and to tap the potential of unemployed agriculture graduates in order to provide them self employment opportunities. Under the scheme, free training and handholding support is provided to unemployed agriculture graduates so as to enable them with required knowledge, skill and orientation towards agri-preneurship. Needed support is also extended to the trained graduates for developing a bankable agri-business project and for availing loansfrom a commercial bank at concessional rates. A provision of back ended capital subsidy and interest subsidy to them on the loans availed of forAgri-ventureestablishmentwasalsomadeintheyear2006.TheSchemeisbeingimplementedby Government of India through National Institute of Agricultural Extension Management (MANAGE) and the National Bank for Agriculture and Rural Development (NABARD). MANAGE coordinates and implements the training and handholding support through a network of 72 Nodal Training Institutes (NTIs) identifiedthrough a well designed process of screening and assessment. NABARD looks after the credit part of the scheme by refinancing the agri-business
loans granted by commercial banks to the trained graduates and release of subsidy thereon.
3.108 Ever since its launch in the year 2002,a total of 29,413 candidates have been trainedunder the scheme out of which 11009 haveestablished their ventures August,2012. Thisshows that the scheme has invoked tremendous interest in the unemployed agriculture graduates towards entrepreneurship in the rural areas. UP, Maharashtra and Bihar have exhibited remarkable achievement in the numbers of candidates that enrolled for ACABC training. States like Rajasthan, Karnataka, tamil Nadu, Andhra Pradesh, and J&K have also exhibited a modest progress. overall progress in the establishment of agri ventures by trained graduateswas 38%(approx.)sinceitsinception.Thepreviousyear’ssuccess rate was 53 %. A higher success rateduring coming years is anticipated.
3.109 Many factors contribute to the development of agripreneurs through ACABC Scheme including level of agricultural development in the State, awareness in prospective candidates about the ACABC scheme and infrastructure facilities available. thus, the need for efficient support organizations tomonitor the activities of small enterprises was felt. Moreover, prediction of the future demand, introduction of modern technologies, cost control and business expansion are the important areas, where entrepreneurs need regular support. Major revisions were made in the Scheme during 2010-11toaccommodatetheseconcerns.
3.110TherevisedtrainingcostpertraineeisnowlimitedtoRs.35,000byproportionatelyraisingthelimits under different components and adding the new area of hands on industry training. In order to incentivize most successful agripreneurs under that scheme an element of refresher training has been introduced in the revised Scheme format. This trainingofabout3-5daysdurationwouldbe conducted in specialized Institutions like SAUs/ICAR Institutes/IIMs/IIts/CSIR Institutes/DSt Institutes/Private Institutions. Similarly, NABARD has been given support to organize sensitization training and workshops to motivate the bankers across the country to provide credit

Farm Inputs and Management 65
to agripreneurs for establishing ventures. the initial Interest and Capital Subsidy pattern of the Scheme has been replaced with a Composite Subsidy (36% for general and 44% forwomen,SC/St & NE) in place of earlier Interest + Capital Subsidy to make the assessment simpler. the benefitofSubsidyshallbelimitedfortheprojectcostuptoRs.20lakh(plus5lakhforextremelysuccessful individuals) for individual projects and projectcostuptoRs.100lakhforagroupproject(established by a group comprising of minimum offive individuals)of trainedcandidatesunderthe Scheme. In order to ensure that the provisions made under the revised Scheme are gainfully utilized and Scheme achieves the desired success rates, sufficient checks and balances, and aneffective monitoring mechanism has been put in place with the active involvement of all the stakeholders including MANAGE, NABARD, Banks, State Functionaries, SAUs and ICAR.
Use of Media in Reaching up to the Farmers3.111 TheCentralSectorScheme ‘MassMediaSupport to Agriculture Extension’ has beenlaunched during the tenth Plan Period to enable a revamping of the extension services in the country by using electronic media i.e the wide network of Doordarshan and All India Radio for transfer of technology and information to the farmers. the primary objective of the Scheme is to use television and Radio with their massive penetration as a vehicle that could be exploited
for the purpose of extension. they have the advantage of reaching a wide audience at a very low cost. Under this Scheme, the existing infrastructure of Doordarshan (DD) and All India Radio (AIR) is being utilized to make the farmers aware of modern technologies and researches relatedtoagricultureandalliedareas.A30minuteprogramme is being telecast five to six days aweek through National, 18 Regional Kendras and 180High Power/Low Power Transmittersof Doordarshan. Similarly, 96 Rural FM Radio Stations of All India Radio are being utilized to broadcast30minutesofprogrammeforfarmers6 days a week. For telecasting success stories, innovations and for popularization of change-setting technology and farming practices through the Saturday slot of Doordarshan’s NationalChannel,DACisproducingfilms,whichwouldconsciouslyproject inter-aliapositiveaspectsofagriculture in India.
Focused Advertisement Campaign3.112 The Department of Agriculture &Cooperation, Ministry of Agriculture has launcheda ‘FocusedAdvertisementCampaign’to create awareness of assistances available under various schemes. At the national level this is being implemented by way of short advertisementsAudio&VideoSpots of 30 – 60seconds duration. the spots are broadcast/telecast through AIR, DD and private channels operating at the national and regional level during news, serials, and entertainment programmes having maximum viewership.
3.113 Following Spots are currently beingtelecast.
• Farm School (Munim)
• Farm School (Sass Bahoo)
• Kisan Credit Card
• National Horticulture Mission
• Accelerated Pulse Production Programme (A3P)
• Judicious use of Fertilizers
• Poorvi Bharat Haritkranti.

66 State of Indian Agriculture
• Kisna Call Centre (Husband & Wife)
• Kisan Call Centre (Sass Bahoo)
• 2 Audio spots on Kisan Call Centres
3.114 The spots have been telecast throughDD National and 25 Regional Kendras of DD as well as 21 private channels operating at National & Regional level. to monitor the campaign, a soft ware has been developed with the help of NIC. All the Channels are uploading the prelogs (timebandof20min)andpostlogs.IPTVshavealso been installed to monitor the campaign. A ‘Focused Publicity Campaign Committee’ hasbeen formed in DAC and regular meetings of the committee are being held to monitor the programme. A proposal has already been initiated to get the feedback of the campaign through Audience Research Unit (ARU) of Doordarshan.
the National Informatics Centre) covering both theheadquartersanditsfieldoffices/directorates.the important portals include SEEDNEt, DACNEt, AGMARKNEt (prices and arrivals in Mandis), RKVY (RashtriyaKrishiVikasYojana), AtMA, NHM (National Horticulture Mission), INtRADAC, NFSM (National Food Security Mission) and APY (Acreage, Productivity and Yield).Direction have been issued getting online data entry done right from the District level, so as to expedite generation of requisite queries & reportsinanefficientmanner.
Box 3.3: Kisan Call Centre (KCC)the Kisan Call Centre (KCC) initiative aims to provide information to the farming communitythrough toll-free telephone lines (telephone No.18001801551 ). Recently KCCs have been furtherrevamped by consolidation and appointing a new service provider for KCC to set up state of the art KCCsat14identifiedlocations. the restructured KCCs are now more professional with the following technological innovations:(a) Voice/Media Gateways (IPPBX based
decentralized system).(b) Dedicated MPLS leased line network with
dedicated bandwidth.(c) SMS to caller farmers providing a gist of
advisories given to them on phone.(d) Voice mail system for recording farmer’s
queries during idle time of KCC or during call lines busy, with provision for call back to the caller.
Box 3.4: Farmers’ Portalthis portal aims to serve as one Stop Shop for all farmers for accessing information on agricultural activities. Besides giving links to appropriate pages of the 80 portals already developed sofar, the Farmers’ Portal links the location of thefarmer (from his Block) with NARP (National Agricultural Research Project) Zone that he belongs to. thereafter, all information related to the cropsgrown in that area (coupledwithagro-climatic conditions in that region) is provided to the farmer using a graphical interface. Farmers can get information about package of practices; crop/seed varieties; common pests; dealer network for seeds, fertilizers&pesticides; machinery and tools; agro-met advisories etc.Data formost States hasbeen entered in one language, but the portal will be launched after the data is updated and entered both in English and in the vernacular language of the State.
ICT Interventions in Agriculture
Development of Portals3.115 DAC has developed 80 portals,applications and websites in collaboration with
Farm Inputs and Management 67
National E-Governance Plan in Agriculture (NeGP-A)3.116 The Mission Mode Project has beenintroduced during last phase of the 11thplan to achieve rapid development of agriculture in India through the use of ICt for ensuring timely access to agriculture related information for the farmers of the country. there are a number of current It initiatives/schemes undertaken or implemented by DAC which are aimed at providing information to the farmers on various activities in the agriculture value chain. these initiatives will be integrated so that farmers would be able to make proper and timely use of the available information. Such information is intended to be provided to farmers through multiple channels including Common Service Centers, Internet Kiosks and SMSs. 12 clusters of services have been identifiedandtheprojecthasbeensanctionedforimplementation in 7 States i.e. Assam, Himachal Pradesh, Karnataka, Jharkhand, Kerala, Madhya Pradesh and Maharashtra. the services include Information on Pesticides, Fertilizers& Seeds, Soil Health; Information on crops, farm machinery, training and Good Agricultural Practices (GAPs); Weather advisories; Information on prices, arrivals, procurement points, and providing interaction platform; Electronic certification forexports & import; Information on marketing infrastructure; Monitoring implementation/evaluation of schemes & program; Information on fishery inputs; Information on irrigationinfrastructure; Drought Relief and Management; Livestock Management.
Agrisnet3.117 Under this Scheme, funds are providedto State/Uts for computerization down to Block level. Funds to 26 states have been released under AGRISNEt to achieve the objective of providing computers up to Block level. State specificsoftwarepackageshavebeendevelopedto disseminate information to the farmers.Availability of requisite hardware and locally suitable software packages has resulted in quick retrieval of data, dissemination of information to farmers and provision of farmer centric services to farmers.
Some Successful State Initiatives
e-Krishi Kiran Programme (Soil Health Card Project) of the State of Gujarat3.118 The e-Krishi Kiran Programme (Soil Health Card Program) implemented by the Government of Gujarat is an online program of technology transfer with an individual farm condition in focus. It helps making transfer of technology more scientific, precise, easy, andneed based. the Soil Health Card System is a web based information system designed to run on internet and intranet (Gujarat State Wide Area Network). this is a repository of agricultural informationforthebenefitoffarmers,agriculturalscientists and decision makers. the Soil Health Card System is a unique information initiative of itskindforthebenefitoffarmersatthegrass-rootlevel.
3.119 Thesystemcangeneraterecommendationof the fertilizers needed for a particular crop basedonanutritionstatusoffarmer’ssoilonthebasis of low, medium, high soil fertility rating. It can generate recommendation of the possible alternative crops to a farmer for better crop production based on his cropping practice and weather condition in his area considering the facts like moisture availability index, available water capacity, and length of growing period, surplus water and supplementary irrigation. the system can generate state wise district wise, taluka wise and individual farmer wise model action plans for crop production.
Agrisnet Project in the State of West Bengal 3.120 Some ICT Services providedby State ofWest Bengal are given below:
G2C Services
• Availability of Quality Fertilizer(Manufacturers/Dealer wise) with MRP
• Soil Health Card which includes fertilizer recommendation for the crops according to soil test result
• Information on Weather to the farmers (Data on daily weather forecast, rainfall,
68 State of Indian Agriculture
temperature, evaporation, wind direction, dew etc.)
• Soil Survey and Soil Conservation related Statistics (Landuse, Landform, Soil Information – Basic information on the soil with soil classification based onapproximation ( a modern nomenclature of soil class).
• Availability of Pesticide (Maufacturer/Dealer wise) with MRP
• Availability of farm mechanization equipment/tools in the locality
G2B Services
• Information on subsidy under various schemes (on seed, fertilizer. pesticides, farm mechanization etc.)
• District wise Sales Report of Fertilizer of each manufacturer for a duration
• Crop wise requirement of Fertilizer in coming Seasons (Rabi/Khariff)
• District wise sales reports of seeds (of different crops and variety).
Agrisnet: Odisha3.121 Someoftheimportantmodulesdevelopedby State of orissa are given below.
• Farm Mechanisation: this module provides the targets and achievements of farm implements and machinery distributed to the beneficiaries of Odisha with relevantdetails.
• Pesticide Quality Control: the software enables the Pesticide testing laboratory to test the quality of the drawn samples of pesticides received from different officesand also checks the percentage of required active ingredients and the expiry date of the pesticides, As a result, the sample is treated asstandardorNon-standard.
• Fertilizer Quality Control: this module lays down the detailed procedure for sampling and chemical analysis of each Fertilizer sample drawn by Fertilizer Inspector from
different district. Samples are also received from outside state as referee sample.
• Fertilizer Input Management: this module focuses on the demand and supply of fertilizers for a particular range of District from the Fertilizer Manufacturers. It also ensures that the allotted quantities of different fertilizers are made available within stipulated time.
• Fertilizer Licensing System: this module emphasizes on online FRC application. this application is meant for the selling and storage of all permissible fertilizers in orissa for Manufacturer, wholesalers, Retail Dealers, Pool Handling Agencies, Importers etc. FRC is given to the applicant online.
Challenges3.122 The Extension system in India isfaced with multiple challenges in terms of its capacity, resources and outreach to cater to the fast emerging and diversified needs of Indianagriculture, particularly with respect to the following emerging issues
• Depleting soil and water resources
• Increasing climate variability
• Meeting food security with limited land and water resources
• Slackening growth in rainfed areas causing widespread distress.
3.123 Major challenges before the agriculturalextension system in the country revolve around the following areas:
i. Understaffed extension
ii. Insufficientplanningatdistrictlevelandbelow
iii. Lack of integration of KVKs with AtMA
iv. Public sector technology generation oftenfailstotakeintoaccountfarmer’sneeds,perceptionsandlocation–specificconditions for each crop

Farm Inputs and Management 69
v. Feeding India’s growing population,meeting diversified food basket andneeds of food security
vi. Productivity of rainfed agriculture has lagged, causing widespread distress
vii. Lack of support to knowledge intensive alternativesforrain-fedfarming.
viii. Inadequate efforts at linking small producers to markets though aggregation of produce through groups
The Way forward3.124 Thereisanemergentneedtorestructureand strengthen the extension system in the country to meet the challenges highlighted above. However, this restructuring and strengthening of agricultural extension machinery has to be a judicious mix of extensive physical outreach of personnel, enhancement in quality through domain experts & regular capacity building, interactive methods of information dissemination, Public Private Partnership and pervasive & innovative use of ICt/Mass Media. the extension personnel not only need to be deployed, but it also needs to be ensured that they are physically present in their assigned Panchayats on due days and actually mingle with the farmers to provide customised solutions based on local needs. Entrepreneurs in private sector, agri-businesscompanies and experts in NGos also need to be involved in a big way.
3.125 TheExtensionapproachthereforehastobe a combination of strategies for augmenting the workforce to support the delivery of extension services to the farmers together with adopting innovative approaches for managing the extension system in the country. Salient strategies proposed are outlines below:
Augmenting Extension Workforce• Positioning the dedicated manpower for
extension supported by the Government of India to the extent of 90%for about 21000posts under the modified ATMA Scheme2010.Firmbackwardandforwardlinkages
with the other staff in agriculture and allied departments through institution of Block technology team under AtMA.
• Supplementing the Extension workforce by augmenting the progress under Agri Clinics and Agri Business Centres (ACABC) Scheme and the Diploma in Agricultural Extension Services for Input Dealers (DAESI) (being implemented by MANAGE)
• Filling of the vacant posts in agriculture and allied areas by States and earmarking at least 30 % manpower exclusively for extensionapart from converging the extension functionaries under different schemes of the GoI viz. NFSM, NHM, INSIMP,CRoPSAP, NAIS etc. at district and block level with the manpower under AtMA for integrated extension delivery.
• Providing a display board in each village indicating the name of the extension worker assigned to the Panchayat and his/her contact number apart from details of main schemes (including their major components, eligibility, subsidy pattern etc.) applicable in that area.
• Close monitoring of farmer-orientedactivities like training & Exposure Visits (outside and within the State), Farm Schools, Demonstrations (agriculture and allied sectors), Mobilization & Capacity Building of Farmers’ Interest Groups, CommodityInterest Groups etc., Extension Activities like KisanMela, Exhibitions, Field Days and Farmers-ScientistsInteractions,skilltrainingof rural youth etc.
• Bringing in Convergence between Research and Extension system strictly in keeping with joint initiatives of the Department of Agriculture and Cooperation (DAC) and the Department of Agricultural Research and Education (DARE).
• Greater involvementofFarmers’AdvisoryCommitteesin from Block to State level in keeping with AtMA Guidelines. Moving to the regime of group based extension.

70 State of Indian Agriculture
Extension Strategy3.126 Apart from making efforts to ensureoptimal strength of extension workers to have deep penetration and direct reach to the farmers, it would be appropriate to advert to the overall extension strategy. We need to adopt a multi-prolonged approach as given below:
5 Tiered Mass Media Campaign
i) tV/Radio
ii) Newspaper
iii) Pamphlets/Leaflets
iv) SMS/inward voice calls in Kisan Call Centres
v) Internet & Common Service Centres (fifthtier).
• Apart from augmenting the use of Mass Media in extension delivery through conventional resources of print and electronic media, providing support of innovative electronic resources viz. LCD or Pico Projectors (with laptop) at Block in the country for projection of short low cost short filmsfocussedonspecificthemes.
• Bringing out low cost publications for the farmers in a farmer friendly manner preferably in local language and making them available up to village level.
Path-breakingmethodssuchasKalaJathas, Extension Buses etc.,already tried successfully, to deliver the message effectively and informally in an interactive manner.
Innovative and Pervasive Use of ICT:
• Reaching out to the farmers, possibly through customised ICt services viz. SMS, IVRS and Voice Recognitiontailor made to the needs of a Commodity InterestGrouporspecificagro-climaticarea. Dissemination of information has been firmly established in the Statesof Maharashtra, Karnataka, Andhra
Pradesh and tamil Nadu.
• Promoting the use of hand-helddevices for on the spot data entry and its subsequent updation through innovative technologies like voice recognition for farm level planning and farmer empowerment. this experiment has been successfully tried in 6 districts of tamil Nadu.
• Strengthening the Kisan Call Centres (KCC) Scheme with more number of agents to receive and answer farmers’calls and integration of innovative technologies and better management for ensuring quality of services.
• Integrated web-portal for farmers hasbeen prepared.
• Promoting Community Radio Stations (CRS) in a big way to expand the reach of localised technologies to the farmers located within a radius of 20 to 50Kilometres.
• Nationale-GovernancePlanAgricultureis being implemented in Phase-1 in 7seven States.
Induction Training & Refresher Courses for Extension Workers And Deployment of Domain Experts:
• Providing training and capacity building to extension workers at induction level and during service at periodic intervals as per technological developments and emerging needs of the farmers.
• Mainstreaming the alternative domain experts viz. retired scientists, department officials,agribusinessexpertswhohaveactually proved their specialization and acceptability to the farmers in a particular crop/enterprise. Institutionalising a system of Certified Crop Advisors who can evolve as Domain Experts.
• Ensuring proper mobility of the scientists alongwith extensionworkers for fieldvisits for programme monitoring or extension activities.

Farm Inputs and Management 71
Public Private Partnership
Strengthening the twomodes of public-privatepartnership promoted through the existing Schemes on ACABC & DAESI as outlined in the para 4.1 above. the provision of 10% of the expenditure of activities to be done only through the non-Governmental sector as per Modified ATMA Guidelines needs to be operationalized by all the States for harnessing the capacity available with private sector.
3.127 Some other measures which canstrengthen the public extension services include the following:
• All the institutions involved in extension activities should better target their beneficiaries;characterizetherequirementsof each beneficiary group; and customizetheir extension services, so that they become total solution providers to target groups.
• Extension activities to emphasize sustainable natural resource management including indigenous knowledge systems.
• Documentation, rationalization and institutionalization and popularization of contemporary farmer innovations.
• PromoteCIGs/SHGsinordertofillgapsin
extension services at the village level and to further federate the ongoing CIGs/SHGs.
• Thetime-lagbetweentechnologygenerationand dissemination needs to be minimized by devising suitable mechanism.
• Strengthenmediaande-resources throughpublications such as newsletters, books, manuals, leaflets, brochures, technologyhand outs, etc.; media coverage of extension programmes; development of cyber extension platforms and extension portal; content development cyber extension, production of AV and interactive aids, etc.
• Strengthening market intelligence, EDP and consultation through EDP packages, project report preparations and consultancies, industry and enterprise relations and partnership, establishing local market network on prices, establishing value chain demonstration units, etc.
• Strengthening continuing education programmes through open and distance learning for farmers and entrepreneurs with online courses, conducting certificatecourses for farmers, entrepreneurs input dealers, extension agencies, etc.

4.1 Withabout2.5%ofgloballandresources,4%ofwaterresourcesand17%ofglobalpopulationliving in India, achieving food security by increasing agricultural production has to be at the coreofIndia’sagriculturaldevelopmentstrategy.Situation assumes greater significancewith theincreasing population and growing economic prosperity. the government has launched a number of programmes for increasing production of agricultural commodities. Many new initiatives have been taken to widen the food basket keeping in view the demand and nutritional requirements of the population. Higher attention to Eastern Region, millets, pulses and fodder crops, national mission on protein supplement, setting up of Peri urban vegetable production clusters are some of these initiatives taken up for implementation during the year.
CHAPtER 4
Agricultural Production and Programmes
Agricultural Production4.2 Despite high dependence of Indian agriculture on monsoon rains (June to September), therehasbeenasignificant jumpinproductionof food grains and other crops over the past five years. During 2011-12, there was a recordproductionoffoodgrainsat259.32milliontonnes,comprisingof131.27milliontonnesduringKharifseason and 128.05 million tonnes during theRabi season. of the total foodgrains production, productionofcerealswas242.23milliontonnesand pulses 17.09 million tonnes. As per 2ndadvance estimates for 2012-13, total foodgrainsproductionisestimatedat250.14milliontonneswhichis9.18milliontonnesor3.54percentlowerthan that of of last year . the decline in kharif production(from131.27milliontonnesin2011-12to124.68milliontonnesin2012-13)hasbeen

AgriculturalProductionandProgrammes 73
onaccountoflateonsetofmonsoonanddeficientrainfall in several states affecting the production in Andhra Pradesh, Bihar, Gujarat, Haryana, Karnataka, Maharashtra, Rajasthan, tamil Nadu and West Bengal. Production of coarse cereals has beenseverelyaffectedbythedeficientmonsoonin Gujarat, Haryana, Karnataka, Maharashtra and Rajasthan.Therewasasignificantimprovementin the rainfall situation in September, 2012,signaling better soil moisture conditions and bright prospects for ensuing rabi crops. As per the 2nd advance estimates, foodgrains production during rabi season is estimated at 125.47 million tonnes. though this is marginally lower than thefinal(rabi)estimateof128.05milliontonnesduring the last year, in the past improvements have been reported in subsequent estimates anditisexpectedthatthecountrywouldfinallyharvest a higher production in the rabi season and bridge the shortfall in kharif production during 2012-13.Table4.1givesthedetailsofproductionof foodrains in the recent years.
4.3 Krishi Karman Awards were given tothe States (Box 4.1) by the President of India, Shri Pranab Mukherji on 15th January, 2013 inrecognition of their commendable efforts in achievingtherecordproductionin2011-12.
Box 4.1: Krishi Karman Awards
‘Krishi Karman Awards’ were instituted for the firsttimebytheMinistryofAgricultureindifferentcategories – total Foodgrains for large, medium and small States, Wheat, Rice, Coarse Cereals and Pulses during the year 2010-11. During the year2011-12, in addition to Krishi Karman Awards,‘Commendation Awards’ were also included for those States who achieved higher production and productivityovertheirpreviousfiveyearshighestbut could not get Krishi Karman Award. Besides, ‘Agriculture Minister’s Krishi Karman Awards for Progressive Farmers’werealsoinstitutedfromtheyear2011-12torewardonemaleandonefemalefarmer in each of the eight Krishi Karman Award winning States.Krishi Karman Awards for foodgrains comprised cashprizeofRs.2.00croreforeachState,aTrophyandCitation;forindividualcropcategoryRs.1.00crore, a trophy and Citation; and for Commendation Awardee States a Citation plus cash of Rs. 25.00
lakh for improvement of work environment to Agriculture Departments of Awardee States. Besides, Awardee Farmers were given a Citation pluscashawardofRs.1.00 lakhto improvetheirinfrastructure development.Following awards were presented on 15th January, 2012 by the Hon’ble President of India:(A) ‘Krishi Karman Awards, 2011-12: Total Foodgrains Production: Category-I (> 10 million tonnes) – Madhya
Pradesh. Category-II(<10to1milliontonnes)–Tamil
Nadu. Category-III (> 1 million tonne) – Manipur
and Nagaland. Individual Crops: Rice-Bihar Wheat-Haryana Pulses – Jharkhand Coarse cereals – Uttar Pradesh(B) ‘Commendation Awards: Total Foodgrains: Category-I - Punjab and Rajasthan. Category-II - Gujarat and Uttarakhand. Category-III - tripura, Arunachal Pradesh and
Mizoram. Individual Crops: Wheat - Himachal Pradesh. Pulses - West Bengal and Assam.(C) ‘Agriculture Minister’s Krishi Karman
Awards’ for Progressive Farmers: Madhya Pradesh: Shri Gambhir Singh for
Wheat and Smt. Radha Bai Dubey for Gram. Tamil Nadu: thiru P. Solaimalai and thirumati
t. Amalarani for Rice. Manipur: Shri Nongmaithem Ibomcha Meetei
and Smt. Nongmeikapam (o) Shyamashakhi Devi for Rice.
Nagaland: Shri Ghoshito and Smt. Kezhawetuou Yhome for Rice.
Bihar: Shri Sumant Kumar and Smt. Shanti Devi for Rice.
Haryana: Shri Ram Kumar and Smt. Anita for Wheat.
Jharkhand: Shri Damodar Chaudhary and Smt. Seemu Sardar for Arhar.
Uttar Pradesh: Shri Jhabbu Lal for Maize and Smt. Sharda Devi for Bajra.

74 State of Indian Agriculture
Table 4.1: Production of Foodgrains in Recent years(million tonnes)
Crop Target 10th plan 11th plan increase over base
Add Prodn under NFSM
2006-07
10th Plan Ave.
2007-08
2008-09
2009-10
2010-11
2011-12
11th Plan Ave.
Tml year
10th Plan Ave.
Rice 10 93 86 97 99 89 96 105 97 12 11Wheat 8 76 70 79 81 81 87 95 85 19 15Pulses 2 14 13 15 15 15 18 17 16 3 3total Food Grains
20 217 202 231 235 218 245 259 238 42 36
improving the productivity of rice based cropping system. table 4.2 gives details of the increase in production in the recent years as against the normal production of rice in the Eastern Indian States. Eastern states, in general have recorded much higher increases in production of rice than that witnessed in the all India average in the recent years. the increase in production is primarily on account of increase in yield.
Contribution of Eastern India4.4 A heartening aspect of the production of foodgrainsin2011-12isthecontributionfromtheEastern Indian States of Assam, West Bengal, Bihar, Jharkhand, orissa, Eastern Uttar Pradesh and Chhattisgarh in which a new initiative, ‘Bringing Green Revolution to Eastern India’ has beenstarted since 2010-11 with focused attention on
Table 4.2: Production of Rice in the Eastern States.
(Lakh tonnes)
State Normal 2010-11 2011-12 % Difference
Final Col. 3/2 Col. 4/3
1 2 3 4 5 6
Assam 29.31 47.37 45.16 61.62 (-)4.66
Bihar 42.52 31.02 71.63 -27.05 130.90
Chhattisgarh 47.96 61.59 60.28 28.42 (-)2.12
Jharkhand 25.84 11.10 31.31 -57.04 182.04
odisha 62.37 68.28 58.07 9.48 (-)14.95
Uttar Pradesh 115.59 119.92 140.22 3.75 16.93
West Bengal 102.45 130.46 146.06 27.34 11.96
total 426.04 469.74 552.73 10.26 17.67
ALL-India 940.20 959.80 1053.11 2.08 9.72

Agricultural Production and Programmes 75
Commodity Outlook4.5 In the increasingly gloablized world, it is important to keep track of developments elsewhere in the world so as to guard against the excessive price volatility seen in global markets in recent times and seize an opportunity for the farmers to realize better returns for their produce through suitable trade policies that link them to the global markets. It is important therefore to look at the food situation in a holistic manner covering all aspects ranging from production, consumption, prices, stocks and trade. towards this end a study has been commissioned by the Department of Agriculture and Cooperation to National Council of Applied Economic Research (NCAER) to develop Agricultural Outlook and Situation Analysis in the short and the medium terms.
4.6 Presently, main crop based food items: cereals (specificallyrice,wheat,jowar,bajra,maizeandoverall coarse grains), pulses (gram, tur), selected fruits and vegetables (banana, potato, onion), sugarcane and edible oils (groundnut, rapeseed/mustard, soybean) are monitored under the study with respect to their production, trade, stocks, prices and consumption both at national and global levels. Milk is also considered in the analysis. two short term forecasts published so far under the study for the quarters ending June 2012 and September 2012 are available on theweb site http://nfsm.gov.in.
Crop wise Situation
Rice4.7 Rice is an important food crops of India in term of area, production and consumer preference. India is the second largest producer and consumer ofriceintheworld,accountingfor22.3%ofglobalproduction. As a result of various initiatives such as introduction of better crop varieties, intensive application of inputs, irrigation and price support and procurement operation taken by the government, the production and productivity of rice has increased from 96.7 million tonnes and 2202kgperhectarein2007-08to105.31milliontonnes and 2393 kg per hectare respectively in2011-12.Althoughyielddifferentialswithin the
countryaresignificant-yieldofriceinBiharhasbeen less than half of the yield in Punjab, however, therehavebeensignificantimprovementsintherecent years. Rice yield in Bihar increased from 1.6tonnesin2009-10to2.2tonnesperhectarein2011-12.However,ourpaddyyield(3.38tonnes/ha) is much lower than that of our neighbors such as China (6.55 tonnes/ha), Bangladesh (4.18),Indonesia(5.01)andVietnam(5.32)asperFAOestimatesfor2010.Governmentiscreatingenabling environment for farmers to adopt suitable technologies and agronomic practices, incentivizing production of location specifichybrid rice seed and hazard tolerant varieties against abiotic and biotic stresses, and promoting infrastructural development for marketing.
4.8 Some of the technical innovative and economically viable interventions evolved by the research institutions are direct seeded rice method used in rainfed upland/lowland/irrigated areas, transplanted rice cultivation (tRC) in rainfed lowland/irrigated areas, Alternate Wetting and Drying (AWD) in irrigated areas with good water management practices, System of Rice Intensification(SRI)underleveled&welldrainedsoil with assured source of irrigation, integrated crop management through seed treatment, low seed rate, seedlings age & no. per hill, wider spacing, need based nutrient application, weed management, Intermittent irrigation, IPM etc. and promotion of new varieties.
4.9 Several programmes such as National Food SecurityMission(NFSM)launchedduring2007-08, BringingGreenRevolution inEastern India(BGREI)during2010-11arebeing implementedto increase the production and productivity of rice in the country.
Box 4.2: Best Practices in Rice Cultivation
System of Rice Intensification (SRI): About 1million hectares of total rice planting is covered by SRI technique. System has been adopted with modifications in different areas and newdevelopments are being researched for appropriate ricetrans-planter. Line transplanting in orissa and Eastern UP under BGREI: An area of 2.75 lakh ha is covered under BGREI program where under farmers have

76 State of Indian Agriculture
Box 4.3 :Best Practices in Wheat CultivationManaging optimum sowing time & seed treatment
No early sowing in oct in mid hills; optimum sowing time in November; In summer season in Leh/Ladakh sowing to be maintained in March/April.
Managing spacing between rows Reducingrowtorowspacingfrom20to18cmwithsameseedraterecommendedinHaryana;10%yieldincreasereported.
Adopting of Resource Conservation technologies (RCt) & Conservation Agriculture; use of Zero till Seed Drill and Laser Land Leveller.
Adoption of RCts and CA practices led to reduced cost of cultivation,
Varietal replacement for rust management; special focus on rust management through immediate varietal replacement in higher hills of Northern India.
Replacement of varieties with rust resistant ones in NWPZ, NEPZ and CZ; In higher hills introduction of new varieties after testing under the supervision of the State Agriculture Dept & SAU.
Surveillance at regular intervals for rusts by DAC and DWR experts.
Surveillance at regular intervals in Higher and mid hills; Revisiting the matter of rust epidemiology change if any; Surveillance in plains of NWPZ and NEPZ at regular intervals by DAC & DWR (ICAR) experts; creating awareness. CZ & PZ are also being monitored by DAC & DWR experts at regular intervals.
achievedanaverageyieldof3.75tonnes/hawhichis double the normal yields in orissa.Boro Rice area in Assam: Boro rice area in Assam is increasing at the rate of almost 2 lakh ha every year. Unlike the ahu and Sali rice season, boro rice season is relatively risk free and farmers have a good control over water, which encourages them to adopt input-intensive riceproduction toobtainedhigher yield. the average productivity of Boro rice is2.22 tonne/haasagainst0.9and1.52 tonne/hafor ahu and Sali rice respectively. Deep water areas can be brought under Boro riceHybrid Rice Area in Bihar, Jharkhand, Chhattisgarh and Uttar Pradesh: Yield gains are more in stress areas, with an average yield of 4.8 tonne/ha hybrid rice has potential to leap frog development in the Eastern Region.Adoption of Direct Seeded Rice in Punjab and Haryana:AreainPunjab:20,000ha,Averageyieldof Direct seeded 4.1 tonne/ha.Area in Haryana: 10,000 ha, Averageyield Direct seeded 4.3 tonne/ha.
Wheat4.10 The areaunderwheat has increased from27.99millionhectaresin2006-07to29.86millionhectaresin2011-12.Theproductionofwheatinthe
country has increased from 75.81 million tonnes in 2006-07toanalltimerecordhighof94.88milliontonnesin2011-12.Theaverageannualgrowthratesin respect of area, production and yield during 1990-91to1999-2000were1.62%,4.52%and2.87%,respectivelybutdeclinedto0.57percent,1.39percent and0.73per cent respectivelyduring2000-01to2010-11.Theincreaseinproductionhasbeendue to increase in area with irrigations facilities, seed treatment, better varieties, rust management and management of optimum time of sowing to escape terminal heat stress. the productivity ofwheatwhichwas 2602kg/hectare in 2004-05hasincreasedto3177kg/hectarein2011-12.Themajor increase in the productivity of wheat has been observed in the states of Haryana, Punjab, Madhya Pradesh and Uttar Pradesh. In order to sustain the present level of productivity and production, certain key areas such as increased seed replacement rate along with varietal replacement with rust resistant ones and resistance to different biotic and abiotic stresses including multi stress tolerant cultivars need to be addressed on priority basis. technological interventions such as maintaining optimum sowing time, avoiding terminal heat stress period, avoiding early sowing in mid hills to break green bridge to contain rusts,

Agricultural Production and Programmes 77
cultivatingrust resistantvarieties likeDPW-621-50,PBW-550,DBW-17etc.inplainsofNWPZandtesting & popularizing rust resistant varieties like HS-375&VL-832inhigherhillsinsummerseasoncultivation, adoption of Conservation Agriculture Practices including Resource Conservation technologies(RCt) including Zero tillage, revising rust epidemiology in higher hills, management of adequate spacing between rows to augment yield and weed & nutrient management are practiced.
Coarse Cereals4.11 Coarse Cereals comprises crops like jowar, bajra, ragi, other small millets (kudo, kutiki, sanwa, foxtail) and maize, which have traditionally been the main components of the food basket of the poor in India. these crops are grown predominantly in the rainfed regions of Karnataka, Maharashtra, tamil Nadu, Madhya Pradesh, Rajasthan, Haryana and Gujarat. there has been a decline in the area coverage under coarsecerealsfrom29.03millionhectaresin2004-05to26.42millionhectaresin2011-12.However,the productivity of coarse cereals has increased significantlyfrom1153kgperhectarein2004-05to 1591 kgper hectare in 2011-12. The increasein productivity has been observed in almost all the major coarse cereals producing States in the country. total production of coarse cereals which was33.46milliontonnesin2004-05increasedtothesofarhighestlevelof43.40milliontonnesin2010-11butdeclinedmarginallyto42.04milliontonnes in 2011-12 mainly on account of shiftin area to other competing crops. the average annual growth rate of area under coarse cereals continues to be negative, though the decline in the last decade has been at a slower pace as compared to 1990s. The average annual growth rate ofyieldofcoarsecerealduring2000-01 to2011-12hasbeensignificantlyhigherat4.56%leadingtoconsiderable improvement in production.
4.12 Millet cropsaregrowninaridandsemi-arid areas under low rainfall (200-600 mm),where fine cereals like wheat and rice cannotbe grown profitably. Millets have more food,feed and fodder values. these crops are more environments friendly and resilient to climate
changes. A majority of millet grains contain higherprotein,fiber,calciumandmineralsthanwheat and rice. therefore, these are now also beingcalledas“Nutri-cereals”.
4.13 Maize is the major coarse cereals accounting for a little more than half of the production of coarse cereals. In order to promote production of Maize, Accelerated Maize Development Programme(AMDP)asub-schemeofIntegratedScheme of oilseeds, Pulses, oil palm and Maize (ISOPOM) is under implementation from 2004.there has been an increase in the area coverage underMaizefrom7.89millionhectaresin2006-07to8.78millionhectaresin2011-12.ProductivityofMaizehasalsoincreasedsignificantlyfrom1912kgperhectarein2006-07to2478kgperhectarein 2011-12. The total production of Maize hasincreasedfrom15.10milliontonnesin2006-07to21.76milliontonnesin2011-12.
4.14 Non-adoption of the recommended dosesof inputs due to high risk under the rainfed agro-climatic regions, non-availability of highyielding varieties, quality seeds particularly of small millets, lack of assured procurement under MSP and poor resource base of the farmers who largely grow these crops are the limiting factors in increasing the area and production of coarse cereals. With a view to inhence the production and productivity of coarse cereals, interventions like promoting production of high yielding varieties/hybrid seeds through public and private sectors, organizing demonstrations with cluster approach and supplying subsidized inputs like fertilizers, bio-fertilizers, micro-nutrientsand plant protection support including seed treatment up to two hectare per farmer; creation of institutional infrastructure for value addition, demonstration of technology and entrepreneurship development, setting up small processing units for value addition etc are promoted by the Government under Rashtriya Krishi Vikas Yojana (RKVY) through the “Initiative for Nutritional Security through Intensive Millets Promotion (INSIMP)”. In order to meet the requirement of Refinement/Retrofitting and demonstration ofpost-harvest technologies, capacity building ofentrepreneurs, market linkages between producer

78 State of Indian Agriculture
and processors, two commodity–wise Centre of Excellence (CoE) for Sorghum and Pearl Millet have been operationalised at the Directorate of Sorghum Research (DSR), Hyderabad and CSS Hisar Agriculture University, Hisar. third CoE for small Millet is being established at University of Agriculture Sciences, Bengaluru. these Centers have developed large number of bakery and other food products and organize consumer awareness campaigns and training programmers for the entrepreneurs.
Pulses4.15 Being rich in protein, pulses not only form a vital part of the human diet, but also play a crucial role in balancing the dietary proteins. India holds the first rank in pulses productionand consumption in the world. India grows the largest varieties of pulses in the world accounting forabout32%oftheareaand23%oftheworldproduction. the important pulse crops are chickpea(48%),pigeonpea(16%),urdbean(9%),mungbean (7%), lentil (6%) and field pea (4%).the major pulse producing states are Madhya Pradesh(24%),Maharashtra(15%),UttarPradesh(12%), Rajasthan (12%) and Andhra Pradesh(9%),whichtogetheraccountfor72%ofthetotalproduction. An estimated amount of 30 to 147kg/ha Biological nitrogen is fixed by differentpulse crops in the soils in which they are grown.
4.16 Pulses production has registered a remarkable increase from 14.76 million tonnes in 2007-08toarecordlevelof18.24milliontonnesin2010-11.Theproductionofpulsesisestimatedmarginallylowerat17.09milliontonnesin2011-12. the increase in total production of pulses has been on account of improvement in production levels of tur, urad and moong. the average annual growth rate of area and production of pulses has beensignificantlyhigherduring2000-01to2010-11 as compared to the last decade. Productivity of pulses has increased from 625 kg per hectare in 2007-08to699kgperhectarein2011-12.Amajorincrease in the productivity of pulses has been noticed in the states of Gujarat, Maharashtra, Rajasthan, Uttar Pradesh and West Bengal. However, the average productivity of pulses
in India is less than the average productivity of 890 Kg/ha in world. Among the major pulsesproducing countries, the highest average yield of pulses has been recorded at 4219 Kg/ha in France,followedby1936Kg/hainCanadaand1882Kg/hainUSAin2010.
4.17 Cultivationofpulsesismostly(85%ofthearea) under rainfed condition, on marginal lands, on low fertile soil by resource poor farmers. Non availability of High Yielding Variety, low Seed Replacement Rate (SRR), high susceptibility to pests especially Helicover-pa armigera, inadequate market linkage are the primary reasons for low yield of pulses. With a view to minimize the problem and ensure protective irrigation at the critical stage of plant development sprinkler set, mobile rain gun, pump set, etc. are distributed to farmersforefficientuseofwaterfromDugwell,Pond and Polythene lining pond. Further, the seed multiplication ratio (SRR) has been increased to22.51%in2010-11from10.41%in2006-07.Toprovide proper market infrastructure, the market linked extension support through Small Farmers Agribusiness Consortium (SFAC) under 60000Pulses village programme is being implemented. Moreover, the Minimum Support Prices (MSPs) of Pulses have been increased substantially to incentivize farmers to increase the production and productivity of pulses. Research institutes like ICAR, IIPR, SAUs besides ICARDA and ICRISAt are making efforts to evolve varieties resistant to Helicoverpa. Emphasis is also being given on area expansion through promoting pulses cultivation in rice fallows, intercropping of pulses with oilseeds, cotton, cereals etc., productivity enhancement through A3P demonstrations,INM, IPM & popularization/promotion of the high yielding varieties/hybrids.
4.18 Under the National Food Security Mission (NFSM) from Rabi 2007-08, AcceleratePulses Production Programme (A3P) is beingimplemented to accelerate the production of Pulses, particularly Red gram, Green gram, Black gram, Chick pea and Lentil by promoting production and protection technologies. Integrated Development of60000PulseVillagesisimplementedinselectedwatershed areas in major pulses growing states by

Agricultural Production and Programmes 79
Box 4.4: Best Practices adopted in pulsesDistributionofcertifiedseed Distributed28.00lakhqtlsofcertifiedseedsofpulses. Integrated Nutrient Management Advocatedbalanceduseofmicronutrientsin39.00lakhha. Integrated Pest Management ConductedIPMinabout23.00lakhhaarea.Demonstration on latest production and protection technologies
Demonstratedabout18.00lakhhaareaundervariouspulses.
Capacity building (Farmers training) Trained15.00lakhfarmers. Yield gains Yield gain for different pulses crops were recorded upto three
times the normal yields. A document detailing impact on yields as a result of the promotional program has been published for the year2010-11.Thepublicationisavailableathttp://nfsm.gov.in.
4.20 An integrated approach involvingintroduction of new production technologies, better supply of inputs and extension service supportformarketing,post-harvesttechnologiesis adopted. Supply of quality seeds (certified)of improved cultivars, varietal replacements, increasing the area under irrigation and/or providing protective irrigation, improving water use efficiency by adopting improved irrigationtechniques and sprinkler irrigation and water saving devices, infrastructure provision (shallow tube wells) for exploitation of ground water (high water table areas) using low cost equipment and technology, integrated nutrient management (INM)withemphasisonbio-fertilizers,sulphurand micro-nutrients based cropping system,integrated management of pests and diseases limitingoilseedsproductivity indifferent agro-ecologies, selective mechanization (e.g., improved planters, groundnut digger and decorticator, safflower harvester, etc.) to improve efficiencyand overcome drudgery in oilseeds production, effective transfer of technology to narrow the gap (30to70%)betweenrealizableandrealizedyieldgap are some of the initiatives being taken by the Government to increase the production and productivity of oilseeds in the country. Some of the best practices being undertaken in oilseeds are given in Box 4.5.
Oilseeds4.19 the consumption of edible oils is rising continuously, outstripping the domestic production resulting in huge imports. During 2011-12,thecountryimportedabout9.2milliontonnes of edible oils which was about half of its domestic requirement. Edible oil demand is projected to reach 16.64 million tonnes by theterminalyear(2016-17)oftheXIIplan.Thiswould require 59 million tonnes of oilseeds production provided the proportion of different oilseeds remains constant in the coming years. Production of oilseeds during 2011-12 was29.80 million tonnes which was slightly lessthan the32.48million tonnes recorded in2010-11. oilseed cultivation is undertaken across the country in about 26 million ha on marginal lands, dependentonmonsoonrains,nearly72%ofareaunder oilseeds is rainfed and with low levels of input usage. Among the major oilseed growing States,highestyield in2011-12ofoilseed cropswas recorded by tamil Nadu State (2479 kg/ha) followedbyGujarat (1608kg/ha)andHaryana(1394kg/ha).Similarly,Stateswhicharehavinglower yield levels of oilseed crops are Assam (557 kg/ha), Chhattisgarh (550 kg/ha) and Odisha(661 kg/ha).
providingfundsforin-situmoistureconservation,new farm ponds with polythene lining and or dug wells. the special plan to achieve 19+ Million tonnes of Pulses production is also under
implementation during Kharif 2012-13. Some ofthe best practices implemented during the 11th Plan are given in Box 4.4.

80 State of Indian Agriculture
Sugarcane4.21 Sugarcane is the most important cash cropinIndia,whichiswidelycultivatedinsub-tropical and tropical region. tropical regions in Maharashtra, tamil Nadu, Gujarat, Karnataka, Andhra Pradesh, orissa and part of Madhya Pradeshaccountforabout45%ofthetotalareaandabout55%ofthetotalsugarcaneproductionin the country, with average productivity of about83tonnesperhectare.Sub-tropicalregioncomprising of Uttar Pradesh, Uttarakhand, Haryana, Punjab, Bihar, West Bengal and North EasternStatesaccountforabout55%ofareaandabout 45% of the total sugarcane productionwith an average productivity of about 56 tonnes per hectare. Sugarcane contributes about 4.4%of the value of output from crop sector and it occupies about 2.4% of India’s gross croppedarea. Sugarcane is cultivated in about 5 million hectares and India holds the second position in production of sugar after Brazil.
4.22 the area under sugarcane has declined from5.06millionhectaresin2007-08to4.17hain2009-10but increased thereafterandreached to5.04millionhectaresin2011-12.Theincreaseinarea coverage under sugarcane has been observed
in the States of Uttar Pradesh, Maharashtra and Karnataka. Production of sugarcane after attainingarecordlevelof355.52milliontonnesduring2006-07,declinedinthesubsequentyearsbut has started witnessing an increasing trend in recent years. the total production of sugarcane during2011-12was361.04milliontonnesandisestimatedat334.541milliontonnesduring2012-13. Yield of sugarcane was recorded at 71.67tonnes per hectares during the last year (2011-12). this year the yield is estimated (2nd estimate) at66.08tonneperhectare.
4.23 Developmentofhighyieldingvarietiesofsugarcanewhicharetoleranttobioticanda-bioticstress, strengthening of seed production and cluster approach to transfer of technologies with modern tools, propagation of micro irrigation system like drip irrigation/rain-gun sprinklerand adoption of improved method of irrigation i.e. furrow and skip furrow irrigation instead of floodirrigation,strengtheningofseedproductionprogramme through tissue culture, single eye bud and poly bag technology, chip bud method, moisture conservation practices through trash mulching and foliar spray with urea & MoP, introduction of partial mechanization so as to
Box 4.5: Best Practices in Oilseeds CultivationPractices adopted Results achieved1) Use of sprinkler irrigation under irrigation
Increase in yield, saving of water, Increased area under crop with available existing water
2) Use of HDPE pie to increase the water useefficiency
Judicious use of water, save money, reduced labour cost for irrigation, yield advantage
3)Useofpolythenemulchingroundnutcultivation in selected situations/regions.
40% savings in water for irrigation, reduced weed intensity,reducedincidenceofsuckingpestand23-50%increaseinyield.
4) Use of thiawan Sprayer Reduced labour cost, efficient application of plant protectionchemicals.
5) organization of Farmers Field School (FFS)
Efficienttransferofimprovedcultivationpracticesforincreasingthe yield.
6) Use of Drip irrigation for oil Palm Increase in yield, saving of water, Increased area under crop with available existing water, reducing conveyance, percolation andevaporationlossescomparedtofloodandbasinirrigationmethods.
7) Intercropping in oil Palm Generation of additional income during gestation period8) Harvesting of fully ripen Fresh Fruit bunches of oil Palm
Achievement of maximum oil extraction ratio.

Agricultural Production and Programmes 81
reduce cost of cultivation, Integrated Nutrient Management including organic, bio-fertilizerand micro elements, Integrated Pest management (IPM) enabling bio agents as well as wooly aphid managements, popularizing improved method of planting like trench method, paired row, ring pit, single bud plantation and ratoon management, are considered necessary for increasing the production and productivity of sugarcane.
4.24 Department of Agriculture is implementing Sustainable Development of Sugarcane Based cropping Systems Areas (SUBACS) to give more flexibilitytoStates.TheProgrammeisfocusingonwidening the quality cane seed availability to the cane growers locally by rearing of seed nurseries at the farmers field, establishment of tissueculture,bio-agentlab,transferoftechnologylikevarietal performance, biotic and abiotic stress management,integratedinsect-pestanddiseasemanagement, integrated nutrient management, planting techniques through demonstration at the farmers field, promotion of mechanizationin sugarcane, soil sustainability throughmicro-nutrients , drip irrigation , soil and seed treatment material through chemicals and heat therapy etc to increase the production and productivity of sugarcane in the country.
4.25 Further, best practices such as trench method and single bud plantation in Punjab, ring pit and trench method of planting in Haryana, trench method of planting in U.P., Bihar & Uttarakand, ratoon management in U.P., Uttarakhand, Maharashtra and Gujarat, and wider row spacing with paired row along with drip irrigation in Maharashtra and Karnataka are practiced.
Cotton4.26 India is second largest cotton producer, consumer and exporter of cotton in the world. Punjab, Haryana, Rajasthan, Maharashtra, Gujarat, Madhya Pradesh, Andhra Pradesh, tamil Nadu and Karnataka are the major cotton producing states. During the last decade the area, production and productivity of cotton have grownat3.14%,11.66%and8.25%respectively.During2011-12arecordareaof12.18lakhhectarewas sown, major increase in area were noticed in Andhra Pradesh, Maharashtra and Gujarat. Bt
cottonareaoccupies11.14millionhectares,91.5%of the total area under cotton and seems to be the widely accepted technology among farmers. As per the 2nd advance estimate, cotton production during2012-13isestimatedat33.80millionbales(of170kgeach)asagainst35.20millionbalesin2011-12.Yieldofcotton(590kglint/ha)inIndiaishowever, substantially below the world average of 745 kg lint/ha. Even in states like Punjab, Haryana and Rajasthan with 100% irrigation,better soil, Bt cotton hybrid seed and high input farming have not been able to boost yield comparable to international level. Considering the extent of area and the number of farmers involved in cotton cultivation, it is imperative to enhance productivity of cotton, to improve the socio-economicconditionofthepeopleengagedwith the cotton cultivation.
4.27 Development of GM cotton varieties suitable for high density planting system, fabrication & validation of available cotton hand picker, increasing yield especially under rainfed conditions, revival of deshi and ELS cotton area and production, to maintain Bt resistance management, continuous follow up of on line pest monitoring and advisory services and creation of custom hiring centers are some of the issues requiring attention to increase the production and productivity of cotton.
4.28 In order to increase the production and yield of cotton, technical interventions such as front line demonstration of production technology, Integrated Pest Management, Insecticide Resistance Management (IRM), use of modern farm implements are under operation which have shown an impressive impact on yield of cotton.
4.29 Department of Agriculture is implementing the technology Mission on Cotton (tMC). With a view to increase production, productivity and improve the quality of cotton. the tMC consists ofFourMini-Missions.MM-Ionresearchwhichis being implemented by ICAR, MM-II forenhancing production and productivity of cotton which is being implemented by Department of Agriculture & Cooperation, MM-III on thedevelopmentofmarketinfrastructureandMM-IVon modernization of ginning/pressing factories are being dealt by the Ministry of textiles.

82 State of Indian Agriculture
4.30 Under Mini Mission II assistance isprovided for various interventions, like production & distribution of certified seeds,trainingoffarmers&extensionofficials,FarmersField School, Front Line Demonstrations, supply
of Pheromone traps/bio-agents/bio-pesticides/drip/sprinkler/sprayers, Bt cotton management strategies, pest monitoring and surveillance, etc. Some of the best practices followed and the results thereof are listed in Box 4.6.
Box 4.6: Best Practices and Achievements in Cotton
Management of Bt refugea Large scale awareness on importance of Bt refugea planting with same non Bt hybrid seeds, alternate crops like pigeon peas helped to maintain resistance development for last ten years.
Use of neem based pesticides, MSKE, bio-pesticides, organic chemicals,pheromonetraps,bio-agents
Declineinpesticidessprayfrom15to6numbersinnorth,20to8in south and 12 to 6 in Central zone.
Promotion of trap, boarder crops, eco feast crops, bird patches etc
this helped to increase the natural enemies of cotton pests in thefield.
Adoption of Insecticide resistance management strategies
IRM-IPM program has resulted in a reduction in insecticideconsumptionby30%,andreducedthenumberofspraysby15%.
Large scale drip adoption in cotton Drip/sprinkler set beneficiaries reported increasingnumberofirrigationandsavingsinwaterbymorethan35%andincreaseinyieldby25%
on line pest monitoring Farmers are getting weekly advisory & pest management alert through SMS
Intercropping cotton with pulses & oilseeds
Intercropping of green gram (moong) in cotton in 1:1, 1:2 or 2:1 ratios was found advantageous from yield and economic point of view in Punjab and Haryana. the net returns were higher due to additional yield of green gram (4qtl/ha) for intercropped cotton. In north western Rajasthan, intercropping of green gram in paired rows of cotton brought about higher net monetary returns over sole cotton crop
Jute4.31 Juteisanimportantnaturalfibercropnextto cotton in India. Jute is mainly grown in eastern and north-eastern states namely West Bengal,Bihar, Assam, orissa, Meghalaya, Nagaland and tripura. India is the largest producer of Jute accounting for about 62.2 percent of world productionand59.3percentofthetotalareainthe World.
4.32 Withmarginalfluctuations,theareaunderjute and mesta in the country has been hovering at around 0.90million hectares during 2004-05to2011-12.However,therehasbeenanincreaseintheproductivityof juteandmestafrom2019kg.perhectarein2004-05to2268kg.perhectarein 2011-12. The production of jute & mesta isestimatedat11.13millionbales(of180kgeach)in
2012-13(2nd estimate), which is marginally lower ascomparedtotheirproductionduring2011-12(11.40millionbales).
4.33 The state ofWest Bengal contributes themaximum area to the tune of 74.6 per cent of the country’stotaljuteareaandabout81.6percentofthecountry’sjuteproduction.Mestaisgrownin the country in about 12 states, but the major mesta growing states are Andhra Pradesh, orissa, Bihar, tripura, Meghalaya and West Bengal. Andhra Pradesh is the main mesta growing state sharingabout31.3percentofthecountry’stotalarea which is about 1.14 lakh ha and nearly 41.5 percentofthecountry’stotalproductionof7.3lakh bales.
4.34 Jute is grownmainly in the Eastern andNorth-EasternStatesbutJuteSeedisproducedin
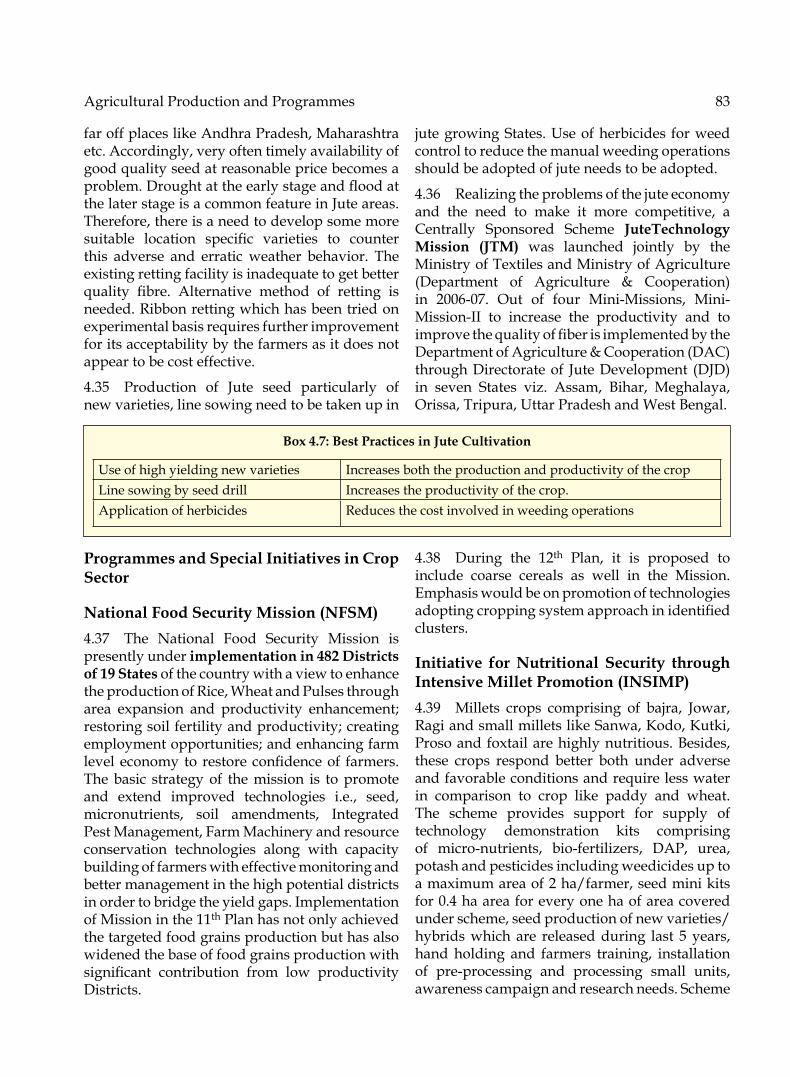
AgriculturalProductionandProgrammes 83
far off places like Andhra Pradesh, Maharashtra etc. Accordingly, very often timely availability of good quality seed at reasonable price becomes a problem.Droughtattheearlystageandfloodatthe later stage is a common feature in Jute areas. therefore, there is a need to develop some more suitable location specific varieties to counterthis adverse and erratic weather behavior. the existing retting facility is inadequate to get better quality fibre. Alternative method of retting isneeded. Ribbon retting which has been tried on experimental basis requires further improvement for its acceptability by the farmers as it does not appear to be cost effective.
4.35 Production of Jute seed particularly ofnew varieties, line sowing need to be taken up in
jute growing States. Use of herbicides for weed control to reduce the manual weeding operations should be adopted of jute needs to be adopted.
4.36 Realizingtheproblemsofthejuteeconomyand the need to make it more competitive, a Centrally Sponsored Scheme JuteTechnology Mission (JTM) was launched jointly by the Ministry of textiles and Ministry of Agriculture (Department of Agriculture & Cooperation) in 2006-07. Out of four Mini-Missions, Mini-Mission-II to increase the productivity and toimprovethequalityoffiberisimplementedbytheDepartment of Agriculture & Cooperation (DAC) through Directorate of Jute Development (DJD) in seven States viz. Assam, Bihar, Meghalaya, orissa, tripura, Uttar Pradesh and West Bengal.
Box 4.7: Best Practices in Jute Cultivation
Use of high yielding new varieties Increases both the production and productivity of the cropLine sowing by seed drill Increases the productivity of the crop. Application of herbicides Reduces the cost involved in weeding operations
4.38 During the 12th Plan, it is proposed to include coarse cereals as well in the Mission. Emphasis would be on promotion of technologies adoptingcroppingsystemapproachinidentifiedclusters.
Initiative for Nutritional Security through Intensive Millet Promotion (INSIMP)4.39 Millets crops comprising of bajra, Jowar, Ragi and small millets like Sanwa, Kodo, Kutki, Proso and foxtail are highly nutritious. Besides, these crops respond better both under adverse and favorable conditions and require less water in comparison to crop like paddy and wheat. the scheme provides support for supply of technology demonstration kits comprising of micro-nutrients, bio-fertilizers, DAP, urea,potash and pesticides including weedicides up to a maximum area of 2 ha/farmer, seed mini kits for0.4haareaforeveryonehaofareacoveredunder scheme, seed production of new varieties/hybrids which are released during last 5 years, hand holding and farmers training, installation of pre-processing and processing small units,awareness campaign and research needs. Scheme
Programmes and Special Initiatives in Crop Sector
National Food Security Mission (NFSM)4.37 The National Food Security Mission ispresently under implementation in 482 Districts of 19 States of the country with a view to enhance the production of Rice, Wheat and Pulses through area expansion and productivity enhancement; restoring soil fertility and productivity; creating employment opportunities; and enhancing farm leveleconomyto restoreconfidenceof farmers.the basic strategy of the mission is to promote and extend improved technologies i.e., seed, micronutrients, soil amendments, Integrated Pest Management, Farm Machinery and resource conservation technologies along with capacity building of farmers with effective monitoring and better management in the high potential districts in order to bridge the yield gaps. Implementation of Mission in the 11th Plan has not only achieved the targeted food grains production but has also widened the base of food grains production with significant contribution from low productivityDistricts.

84 State of Indian Agriculture
also envisage provision for setting up Centre of Excellence on value addition in millet.
4.40 Bringing Green Revolution in Eastern India (BGREI): BGREI is under operation in seven states of UP, Jharkhand, Bihar, West Bengal, Assam, orissa and Chhattisgarh with an objective to increase the productivity of rice based cropping system by intensive cultivation through promotion of recommended agriculture technology and package of practices by addressing the underlying constraints of different agro climatic sub regions. the activities carried out under the programme include demonstrations on Rice/Wheat; creation of asset building activities focusing on water management work such as construction of shallow tube wells, dug well/bore wells and water pumpsets; promotion of farm implements such as drum seeder, zero till seeddrills;andsitespecificactivities.
4.41 Accelerated Pulses Production Programme (A3P): A3P has been initiated under National Food Security Mission from Kharif 2010,wherein,farmersinonemillionhectaresofpotential pulses areas are involved in intensive promotion of pulses through village level block demonstration of production and protection technologies. It enable the farmers of the A3Pareas to avail Seed Mini kits, Integrated Nutrient Management, Integrated pest management components free of cost up to 2 hectares of area of individual farmers.
4.42 Sugarcane Based Cropping Systems (SUBACS): Sustainable development of SUBACS is implemented in 22 States/Union territories and provideshigherflexibilitytostatestoimplementthe programmes on the basis of their priorities and requirements. the main thrust of the scheme is on the transfer of improved technology to the farmersthroughfielddemonstration,trainingoffarmers, supply of farm implements, enhancing seed production and pest management.
4.43 Technology Mission on Cotton (TMC): TMCwas launched in 2000-2001 with the aimof increasing the production and productivity, and improving the quality of cotton. It consists of FourMini-Missions.MM-Ion research isbeingimplementedbyICAR,whileMM-IIforenhancing
production and productivity by Department of Agriculture & Cooperation. The MM-III is onthe development of market infrastructure and MM-IV on modernization of ginning/pressingfactories are being dealt by the Ministry of textiles. Increasing availability of quality seeds, emphasis on production of extra long staples cotton, covering more area under hybrids, popularization of Integrated Pest Management (IPM)methods,efficientuseofwaterthroughdripand sprinkler methods particularly in Central and Southern Zones, transfer of technology through field demonstrations and training of extensionworkers, dealers and farmers are some of the activities pursued under the Mission.
4.44 Jute Technology Mission (JTM): JtM was launchedinJune2006forincreasingproduction,productivityandqualityofjuteandalliedfibers.It has four Mini Missions, Mini Mission-I onresearch, implemented by ICAR, Mini Mission-II on development/extension, implemented by Department of Agriculture & Cooperation, Mini Mission-III on marketing and Mini Mission-IV on processing, utilization and industrial aspects, implemented by Ministry of textiles. Production and supply of hybrid seeds, transfer of technology through frontline demonstrations, training of farmers, extension workers and input dealers; establishment of seed de-lintingplants,establishment/strengtheningofbio-agentproduction units, plant protection measures like Insecticide Resistance Management (IRM), IPM demonstration, surveillance of diseases & pests andsupplyofsprayers/pheromones/bio-agents/bio-pesticides,supplyofwatersavingdeviceslikesprinkler and drip irrigation equipment are some of the activities undertaken under the Mission.
4.45 Integrated Scheme of Oilseeds, Pulses, Oilpalm and Maize (ISOPOM): ISoPoM is being implemented from 1stApril, 2004 for theproduction of oilseeds, pulses, oilpalm and maize. Pulses component of ISoPoM has been merged with the National Food Security Mission (NFSM) w.e.f.1.4.2010. The programme pre-dominantlybenefitssmallandmarginalfarmers,andstipulatesbenefitsof16.20%toSCPand8%to STP and 30% to women farmers as per thepolicy of the government.

Agricultural Production and Programmes 85
4.46 Oil Palm Development Programme (OPDP): Andhra Pradesh, Karnataka, tamil Nadu, Kerala, Goa, Gujarat, orissa, Maharashtra and Mizoram are implementing the oil Palm Development Programme (oPDP) under ISoPoM with a view to augment the domestic supply of edible oils and bridge the gap between demand and supply. Under the scheme, assistance is provided towards the cost of planting material, cultivation inputs, installation of drip irrigation system, diesel pump sets, training, development of waste-land, extension andpublicity,frontlinedemonstrations,leaf-nutrientsanalysis laboratories and testing of genotypes under various environmental conditions. the assistance provided under the scheme is shared on 75:25 basis between Government of India and State Governments except for the component of dripirrigationforwhichStates’shareis10%forall states except the states of Assam, tripura & Mizoram for which entire cost on installation of drip irrigation system in oil palm plantation is metbytheCentre.Year-wiseproductionofFreshFruit Bunches (FFBs) & CPo since inception of the ISoPoM is given in Annexure 4.
Oil Palm Area Expansion (OPAE) Sub-Scheme under RKVY
4.47 oil Palm Area Expansion (oPAE) Programme for bringing 60,000 hectares in 8identifiedstateshasbeenlaunchedduring2011-12under Rashtriya Krishi Vikas Yojana (RKVY). It is estimated that an area of 28,288 hectares has been achieved as fresh plantation under oPAE. oPAE includesstatespecifictargetsforareaexpansion,interventions, pattern of assistance, research and development components, institutional linkages, monitoring, initiatives for creating processing facilities in needy states to augment the production ofpalmoilafter4-5years.
4.48 Major constraints reported in oil palm plantations are as under:
• Availability of planting material in the country. the State Governments are importing planting material from different oil palm growing countries.
• In India cultivation of oil palm is carried out in small holdings and mostly dependent on
tube wells for irrigation.
• Lackofproperpackageofpracticeforspecificsites, i.e. oil palm being exotic and new crop, very little data/management practices are availableforitscultivationinvariousagro-climatic conditions of the country.
• Synchronization of area expansion under oil palm vis-à-vis creation of processingfacilities.
• Variation in import duty on edible oils on year to year basis results in major fluctuations in oil palmFFBs prices in thedomestic markets.
• oil Palm cultivation involves gestation period of 4-5 years and, therefore, farmer’s riskfor cultivation of this crop is more than the conventional agricultural and horticultural crops. Further, pricing of FFBs being linked to the landed cost of CPo, it is advisable to have a long term pricing policy with counter cyclic duty structure to encourage farmers to go for cultivation of this crop.
4.49 oil Palm is comparatively a new crop and in the highest oil yielding perennial crop with good planting material and irrigation facility. With proper management, there is a potential of 20-30MTfreshfruitbunches(FFBs)perhaafterattaining age of 5 years. this in turn is capable of yielding 4-5MT of palm oil and 0.4-0.5MTpalm kernel oil (PKo). In comparative terms yieldofpalmoilis10-15timestheyieldofedibleoil obtainable from traditional oilseeds. the emphasis is required to be laid on the following parameters to achieve success in implementation of the programme.
• Area expansion of oil palm in potential States and enhanced assistance for planting material, irrigation systems and critical inputs for cultivation of oil palm.
• Pursuance with the States for enactment of oil palm Act to ensure marketing of oil palm FFBs (Presently AP, tamil Nadu, Mizoram and Goa have enacted oil Palm Act)
• Establishment/maintenance of seed gardens for smooth production and availability of oil palm seed/sprouts within the country.
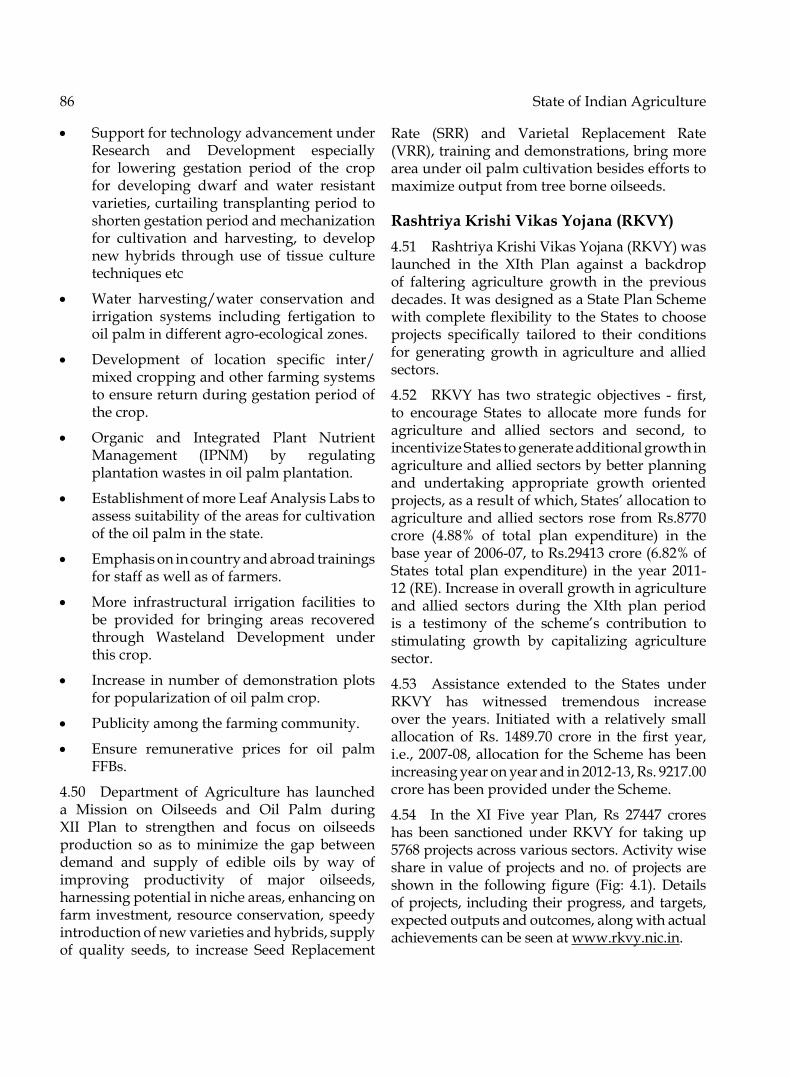
86 State of Indian Agriculture
• Support for technology advancement under Research and Development especially for lowering gestation period of the crop for developing dwarf and water resistant varieties, curtailing transplanting period to shorten gestation period and mechanization for cultivation and harvesting, to develop new hybrids through use of tissue culture techniques etc
• Water harvesting/water conservation and irrigation systems including fertigation to oilpalmindifferentagro-ecologicalzones.
• Development of location specific inter/mixed cropping and other farming systems to ensure return during gestation period of the crop.
• organic and Integrated Plant Nutrient Management (IPNM) by regulating plantation wastes in oil palm plantation.
• Establishment of more Leaf Analysis Labs to assess suitability of the areas for cultivation of the oil palm in the state.
• Emphasis on in country and abroad trainings for staff as well as of farmers.
• More infrastructural irrigation facilities to be provided for bringing areas recovered through Wasteland Development under this crop.
• Increase in number of demonstration plots for popularization of oil palm crop.
• Publicity among the farming community.
• Ensure remunerative prices for oil palm FFBs.
4.50 Department of Agriculture has launcheda Mission on oilseeds and oil Palm during XII Plan to strengthen and focus on oilseeds production so as to minimize the gap between demand and supply of edible oils by way of improving productivity of major oilseeds, harnessing potential in niche areas, enhancing on farm investment, resource conservation, speedy introduction of new varieties and hybrids, supply of quality seeds, to increase Seed Replacement
Rate (SRR) and Varietal Replacement Rate (VRR), training and demonstrations, bring more area under oil palm cultivation besides efforts to maximize output from tree borne oilseeds.
Rashtriya Krishi Vikas Yojana (RKVY)4.51 Rashtriya Krishi Vikas Yojana (RKVY) was launched in the XIth Plan against a backdrop of faltering agriculture growth in the previous decades. It was designed as a State Plan Scheme withcompleteflexibility to theStates tochooseprojects specifically tailored to their conditionsfor generating growth in agriculture and allied sectors.
4.52 RKVYhas two strategic objectives - first,to encourage States to allocate more funds for agriculture and allied sectors and second, to incentivize States to generate additional growth in agriculture and allied sectors by better planning and undertaking appropriate growth oriented projects,asaresultofwhich,States’allocationtoagricultureandalliedsectorsrose fromRs.8770crore (4.88% of total plan expenditure) in thebaseyearof2006-07,toRs.29413crore(6.82%ofStates total plan expenditure) in the year 2011-12 (RE). Increase in overall growth in agriculture and allied sectors during the XIth plan period is a testimony of the scheme’s contribution tostimulating growth by capitalizing agriculture sector.
4.53 Assistance extended to the States underRKVY has witnessed tremendous increase over the years. Initiated with a relatively small allocation of Rs. 1489.70 crore in the first year,i.e.,2007-08,allocationfor theSchemehasbeenincreasingyearonyearandin2012-13,Rs.9217.00crore has been provided under the Scheme.
4.54 In the XI Five year Plan, Rs 27447 crores has been sanctioned under RKVY for taking up 5768 projects across various sectors. Activity wise share in value of projects and no. of projects are shown in the following figure (Fig: 4.1). Detailsof projects, including their progress, and targets, expected outputs and outcomes, along with actual achievements can be seen at www.rkvy.nic.in.

Agricultural Production and Programmes 87
Fig. 4.1: Share in value of projects, Total value Rs. 27447 crore
Fig. 4.2: Share in projects, Total Projects - 5768

88 State of Indian Agriculture
4.55 RKVY has managed to infuse agriculture and allied sectors with steadily increasing public investment. RKVY is a quantum jump in evolution from the variegated schematic approach to a completely new approach with emphasis on regionally differentiated agricultural planning. It envisages States to prepare comprehensive District and State Agriculture Plans for taking up projects which are best suited to local conditions to catalyse existing production scenario for achieving higher production in agriculture and alliedsectors,byensuringrequiredflexibilitytothe States.
Wayside Market in Arunachal Pradesh
4.56 the range of interventions under RKVY is varied keeping in view diverse needs and requirements of the States. therefore, while Sikkim, Arunachal Pradesh and other North East States have taken up projects on piggery, enhancing market accessibility to farmers by developing wayside market sheds, and area expansion through land terracing and promotion ofoff-seasonvegetablecultivation,Maharashtrahas been successful in managing onion price fluctuationsbypromotinglowcostonionstoragestructures and tackling water stress by investing extensively in farm ponds. tamil Nadu, West Bengal, Bihar, Jharkhand and tripura have been promoting System of Rice Intensification(SRI) for increased productivity of paddy, while several States like Andhra Pradesh have promoted vegetable cultivation through pandals and trellises. States like Haryana and Punjab have concentrated on laying underground pipe lines for irrigation to promote more efficient
water management and better animal husbandry practices like promoting elite breed of murrah buffaloes and better community animal housing.
An Elite Murrah Buffalo
4.57 While Jharkhand chose to increase cropping intensity by creating water conservation structures like loose boulder and pucca check dams along with lift irrigation systems, Gujarat has preferred to check salinity ingress in coastal areas and reclaiming almost 70,000 ha of landfor cultivation. Kerala has addressed its labour shortage by setting up custom hiring centres for farm mechanization while Karnataka has set up telemetric Weather Stations at taluka level for rainfall forecast and farmer advisories.
4.58 RKVY format has also enabled launch of new schemes/programmes keeping States’flexibility and authority intact. Since 2010-11,severalsub-schemeshavebeenintroducedwithspecificfocusonpromotingricebasedcroppingsystem in Eastern India (Bringing Green Revolution in Eastern India (BGREI), increasing vegetable production and availability through Vegetable Clusters, Coarse Cereals, Rainfed Area Development Programme (RADP), Accelerated Fodder Development Programme (AFDP) etc. In all, nine special Programme/schemes are being implemented as sub-schemes of RKVY, whichhave very focused objectives and are under implementation in States best suitable for these, inthecurrentfinancialyearwithatotalallocationof Rs.2675 crore.
4.59 While RKVY has many positive facets which have enhanced focus on agriculture and alliedsectorsbyaccordingrequiredflexibilityto

Agricultural Production and Programmes 89
the States for initiating innovative schemes, ease of expenditure, ability to address local needs etc., implementation of the scheme over the last five years has also brought to the fore certainshortcomings which need to be addressed.
4.60 RashtriyaKrishiVikasYojna (RKVY)hasgreater acceptance among states as it provides flexibility to formulate state-specific strategies.However, RKVY has not effectively addressed specific issues arising out of substantial andgrowingshare(about83%)ofsmallandmarginalland holdings in the country. Small land holdings create adverse economies of scale necessitating aggregation of farm produces through appropriate institutional linkages at remunerative rates, integrating agricultural marketing value chain and creation of post-harvest & storagefacilities. While, fast growing sectors like Animal Husbandry, Dairying & Fisheries (19%), MicroIrrigation (15%) and Horticulture (9%) wouldaccount for 43% of total XI Plan outlay underRKVY, allocation in Marketing, Post Harvest Management & Cooperatives remained a mere 6% during the same period. Besides, share inproject allocation in other key sub- sectors viz.NaturalResourceManagement(5%),Seed(8%),Nutrient and Pest Management (4%) etc. werealso marginal during XI Plan period.
Check Dam in Jharkhand
4.61 Evaluation conducted by National Institute of Rural Development (NIRD) reveals thatnotwithstandingflexibilityandrelativelargefinancial outlay, States have not been able toinvest adequately in agricultural infrastructure
development projects. Many a time projects proposed under RKVY are not in tune with priorities and developmental gaps identifiedin Comprehensive District Agriculture Plan (C-DAP)andStateAgriculturalPlan(SAP).
4.62 A project under RKVY had an average allocation of about Rs. 4.75 crore during XI Plan Period.Itisstatedthatflexibilitytoundertakeanyproject under RKVY is leading to thin spread of resources supplemented by extended support to existing central/state schemes, missing priorities and continued prevalence of covering maximum sub-sectorsunderthisscheme.
4.63 Further, drawbacks were noticed in lackof effective monitoring & evaluation of the projects, weak linkages with Comprehensive District Agriculture Plans (C-DAPs) and StateAgriculture Plans (SAPs), excessive expenditure on “brick and mortar” instead of “soil and water”, poor quality of Detailed Project Reports (D PRs), minimal scrutiny of projects at State Level Sanction Committee (SLSC) level, etc. In order to address these and other shortcomings, it is proposed to reorient RKVY during the XIIth Plan period.
4.64 Accordingly, in the XII Plan, the entire RKVY budget is proposed to be divided in three streams viz. Production Growth, Infrastructure & Assets, and Special schemes of national importance in the ratio of 40:40:20.this is expected to provide a more focussed and planned approach to creation of infrastructure in agriculture and allied sectors and attract private investment as well. With substantial funds being invested for capitalizing agriculture and allied sectors under RKVY, it is felt that a continuous process of concurrent monitoring and evaluation needs to be ensured by the States. this would provide an in-built mechanism that providescontinuous feedback on the performance of schemes and provide valuable inputs/insights to implementing agencies as well as policy makers formid-coursecorrectionandcalibrationtohelpStatesmaximisereturnsandbenefitsfromRKVYprojects and investments.
4.65 RKVY model has received tremendous response from the States and for the XII Plan
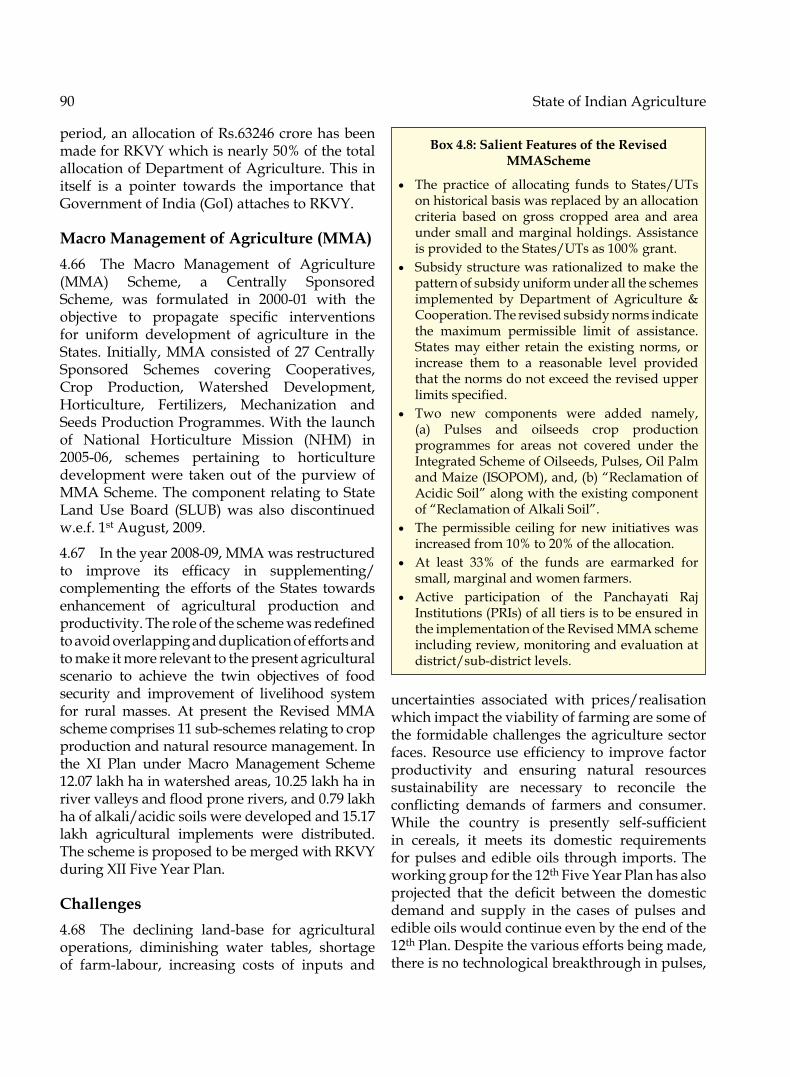
90 State of Indian Agriculture
period,anallocationofRs.63246crorehasbeenmadeforRKVYwhichisnearly50%ofthetotalallocation of Department of Agriculture. this in itself is a pointer towards the importance that Government of India (GoI) attaches to RKVY.
Macro Management of Agriculture (MMA)4.66 the Macro Management of Agriculture (MMA) Scheme, a Centrally Sponsored Scheme, was formulated in 2000-01 with theobjective to propagate specific interventionsfor uniform development of agriculture in the States. Initially, MMA consisted of 27 Centrally Sponsored Schemes covering Cooperatives, Crop Production, Watershed Development, Horticulture, Fertilizers, Mechanization and Seeds Production Programmes. With the launch of National Horticulture Mission (NHM) in 2005-06, schemes pertaining to horticulturedevelopment were taken out of the purview of MMA Scheme. the component relating to State Land Use Board (SLUB) was also discontinued w.e.f. 1stAugust,2009.
4.67 Intheyear2008-09,MMAwasrestructuredto improve its efficacy in supplementing/complementing the efforts of the States towards enhancement of agricultural production and productivity.Theroleoftheschemewasredefinedto avoid overlapping and duplication of efforts and to make it more relevant to the present agricultural scenario to achieve the twin objectives of food security and improvement of livelihood system for rural masses. At present the Revised MMA schemecomprises11sub-schemesrelatingtocropproduction and natural resource management. In the XI Plan under Macro Management Scheme 12.07lakhhainwatershedareas,10.25lakhhainrivervalleysandfloodpronerivers,and0.79lakhha of alkali/acidic soils were developed and 15.17 lakh agricultural implements were distributed. the scheme is proposed to be merged with RKVY during XII Five Year Plan.
Challenges4.68 The declining land-base for agriculturaloperations, diminishing water tables, shortage of farm-labour, increasing costs of inputs and
uncertainties associated with prices/realisation which impact the viability of farming are some of the formidable challenges the agriculture sector faces.Resourceuseefficiency to improve factorproductivity and ensuring natural resources sustainability are necessary to reconcile the conflicting demands of farmers and consumer.While the country is presently self-sufficientin cereals, it meets its domestic requirements for pulses and edible oils through imports. the working group for the 12th Five Year Plan has also projected that the deficit between the domesticdemand and supply in the cases of pulses and edible oils would continue even by the end of the 12th Plan. Despite the various efforts being made, there is no technological breakthrough in pulses,
Box 4.8: Salient Features of the Revised MMAScheme
• the practice of allocating funds to States/Uts on historical basis was replaced by an allocation criteria based on gross cropped area and area under small and marginal holdings. Assistance isprovidedtotheStates/UTsas100%grant.
• Subsidy structure was rationalized to make the pattern of subsidy uniform under all the schemes implemented by Department of Agriculture & Cooperation. the revised subsidy norms indicate the maximum permissible limit of assistance. States may either retain the existing norms, or increase them to a reasonable level provided that the norms do not exceed the revised upper limitsspecified.
• two new components were added namely, (a) Pulses and oilseeds crop production programmes for areas not covered under the Integrated Scheme of oilseeds, Pulses, oil Palm and Maize (ISoPoM), and, (b) “Reclamation of Acidic Soil” along with the existing component of “Reclamation of Alkali Soil”.
• the permissible ceiling for new initiatives was increasedfrom10%to20%oftheallocation.
• At least 33% of the funds are earmarked forsmall, marginal and women farmers.
• Active participation of the Panchayati Raj Institutions (PRIs) of all tiers is to be ensured in the implementation of the Revised MMA scheme including review, monitoring and evaluation at district/sub-districtlevels.

Agricultural Production and Programmes 91
theyieldsare stillhoveringaround600Kgperhectare. Pulses continue to be grown by small and marginal farmers on marginal lands under rainfed conditions. there is high variability in their prices. on the prices front, even though substantial increases have been made in the MSP, due to weak procurement/price support mechanism, farmers’ response in terms ofincrease in acreage under pulses is lukewarm. Nearly half of our domestic requirement of edible oils is met through imports. Developing oil palm, which have high oil contents, on large track of lands suitable for its cultivation, can bridge the gap between demand and supply of edible oils.
The Way Forward4.69 Viability of farm enterprise is an important issue. Resource use efficiency to obtain morewith the available resources and significantbreakthroughs in production technologies are required to cope with increasing demands particularly of pulses, oilseeds, fruits and vegetables. Diversification of agriculturalproduction must be emphasised both through input assistance and price support policies. Although MSP for pulses and oilseeds have been increased substantially in recent years, farmers are still not encouraged enough to put in the effort and resources required for the scale of production that is required to do away with the current imports of these commodities.
4.70 The regional imbalances inproductivitiesmust be clearly addressed. there is a need for more attention and resources to extend green revolution to areas of low productivity in the Eastern Region where there is ample ground water, fertile land and surplus labour. Equally important are rain-fed areas. Farm incomesare central to sustaining agricultural growth. Diversification towards higher value cropsand livestock can improve farm incomes and accelerate agricultural growth.
4.71 Agriculture Census 2010-11 reveals thatthe average size of an operational holding has come down to 1.16 hectares. Small and marginal farmers with farm sizes of less than 2 hectares comprise 85% of all holdings and 44% of total
area. this vast majority of farmers has to be the focus of our agricultural development policy.
Horticulture: The Growth Driver of Indian Agriculture4.72 the horticulture sector, with a wide array of crops – ranging from fruits and vegetables to orchids and nuts,mushrooms and honey - hasbeen a driving force in stimulating a healthy growth trend in Indian agriculture. India is currently producing 257.2 million tonnes of horticultureproducefromanareaof23millionha.Whatissignificantisthatoverthelastdecade,theareaunderhorticulturegrewbyabout3.8%per annum but production rose by 7.6% perannum. the noteworthy feature is that higher growth rate in horticulture was brought about by improvement in productivity of horticulture crops, which increased by about 28% between2001-02and2011-12.Thisgoeson toshowthatthe special thrust given to the sector, especially after the introduction of the Horticulture Mission for North East & Himalayan States (HMNEH) and the National Horticulture Mission (NHM) in the Xth Plan has borne positive results. Given the increasing pressure on land, the focus of growth strategy is on raising productivity by supporting high density plantations, protected cultivation, micro irrigation, quality planting material, rejuvenation of senile orchards and thrust on post harvest management, to ensure that farmers do not lose their produce in transit from farm gate to the consumer’splate.Thegrowth trendof horticulture crops during past 10 years isdepictedinFig.4.3below:
Fig. 4.3. Growth Trend in Horticulture Production

92 State of Indian Agriculture
Share in production of horticulture crops is depicted in Fig. 4.4.
Fig.4.4.Share in Production (% of 257.2 million MT)
Fruits29.7%
Vegetables60.6%
Plantationcrops6.4%
Spices2.3%
Others1.0%
Fruits4.73 Withaproductionof76.4million tonnes,fruits accounts for about 30 per cent of thetotal production of horticulture crops. the area underfruitcropsduring2011-12was6.7millionha, which is almost 29 per cent of area under horticulture in India. the area under fruit crops hasincreasedfrom4.0millionhain2001-02to6.7millionhain2011-12withcorrespondingincrease
in production from 43.0 to 76.4million tonnes.A large variety of fruits are grown in India. of these, banana, mango, citrus, papaya, guava, grape, sapota, pomegranate, pineapple, aonla, litchi, pear, plum, walnut, etc are important. Indiaaccounts for13percentof the totalworldproduction of fruits and leads the world in the production of mango, banana, papaya, sapota, pomegranate, acid lime and aonla.
4.74 the leading fruit growing states are Maharashtrawhichaccountsfor16.0percentofproductionfollowedbyAndhraPradesh(13.0%),Gujarat(10.0%),Karnataka(9.0%),UttarPradesh(8.0%),TamilNadu(7.0%)andBihar(5.0%),whichaltogether contributes for about 68.0 percent ofthe total fruit production in the country. Banana is themajor fruit accounting for 35 per cent oftotalproductionfollowedbymango(21%),citrus(11%), papaya (6%), guava (3.3%), grapes (3%),apple(3%)andothers(17.7%)inthecountry.Itmay also be mentioned that in the Himalayan states of Himachal and Jammu & Kashmir, the GDP from apples, plums, pears and stone fruits exceeds that of GDP from cereal crops.
4.75 Area, Production and Productivity of fruit cropshas registered significant increaseduringthe last ten years, as depicted in Figure. 4.5.
4.01
43
10.726.7
76.4
11.4
0
10
20
30
40
50
60
70
80
90
Area(m.ha) Production(m.MT) Productivity(MT/ha)
2001-02
2011-12
Fig. 4.5: Growth in area, production and productivity of fruits

AgriculturalProductionandProgrammes 93
Vegetables4.76 Vegetables are also an important constituent in horticulture sector which are mostly low gestation and high income generating crops. Many vegetables are now grown under protected cultivation like green houses and shadenethouseswitha scope for ‘off –season’production, which fetches remunerative prices. Vegetables occupied an area of 8.9 million ha during2011-12witha totalproductionof155.9million tonnes having average productivity of 17.4 tonnes/ha. Vegetable production registered aquantumjumpof77percentbetween2001-02and2011-12.
Box No. 4.9: Protected Cultivation
Protected cultivation involves the production of crops under protective cover such as green house, shade net houses, plastic tunnels, use of plastic mulch etc. which enable to enhanced productivity of crop per unit area. The Ultra-violet stabilizedcladding material on green houses help to harness sunlight energy inside green houses which result in good crop vigour and growth, hence yield. Protected cultivation is being promoted as a thrust area during XII Plan.
4.77 Morethan40kindsofvegetablesbelongingto different groups are grown in India in tropical, sub tropical and temperate regions. Important vegetable crops grown in the country are potato, tomato, onion, brinjal, cabbage, cauliflower,peas, okra, chillies, beans, melons, etc. the leading vegetables growing states are West Bengal which accounts for 15% of productionfollowed by Uttar Pradesh (12%), Bihar (10%),AndhraPradesh (8%),MadhyaPradesh (6.5%),Gujarat(6.4%),TamilNadu(5.8%),Maharashtra(5.7%), Karnataka (5.0%) and Haryana (3%),which altogether contributes about 83.4% ofthe total vegetable production in the country. Among vegetables, potato is the major vegetable accountingfor27.0%followedbytomato(12%),onion (11%), brinjal (8%), cabbage (5.4%),cauliflower (4.7%), okra (4%), peas (2.5%) andothers(25.4%)inthecountry.Indiaisthesecondlargest producer of vegetables after China and is a leader in production of vegetables like peas and
okra. Besides, India occupies the second position in production of brinjal, cabbage, cauliflowerand onion and third in potato and tomato in the world. Vegetables such as potato, tomato, okra and cucurbits are produced abundantly in the country.
4.78 the trend in area, production and productivity of vegetables are depicted in the Figure 4.6 below:
Fig.4.6: Growth in area, production and productivity of vegetables
6.16
88.62
14.48.9
155.9
17.52
0
20
40
60
80
100
120
140
160
180
Area(m.ha) Production(m.MT) Productivity(MT/ha)
2001-02
2011-12
Spices4.79 India is the largest producer, consumer and exporter of spices and spice products in theworld.Over100plantspeciesareknowntoyield spices and spice products among which around50aregrowninIndia.Indiaisknownasthe home of spices, producing a wide variety of spices like black pepper, chillies, ginger, turmeric, garlic, cardamom and a variety of tree and seed spices. Major spice, producing states are Andhra Pradesh(19%),Gujarat(15%),Rajasthan(14.7%),Karnataka (8%), Madhya Pradesh (7.7%) andTamilNadu(7%).ThespiceproductioninIndiais currently estimated at 5.95 million tonnes from anareaofabout3.21millionha.
4.80 Theproductionofspicesinthecountryhasregistered a substantial increase over the last ten yearswithaverageannualgrowthof5.8%.Chilliis themajorspicecropoccupyingabout25%ofarea under cultivation and contributing 22%
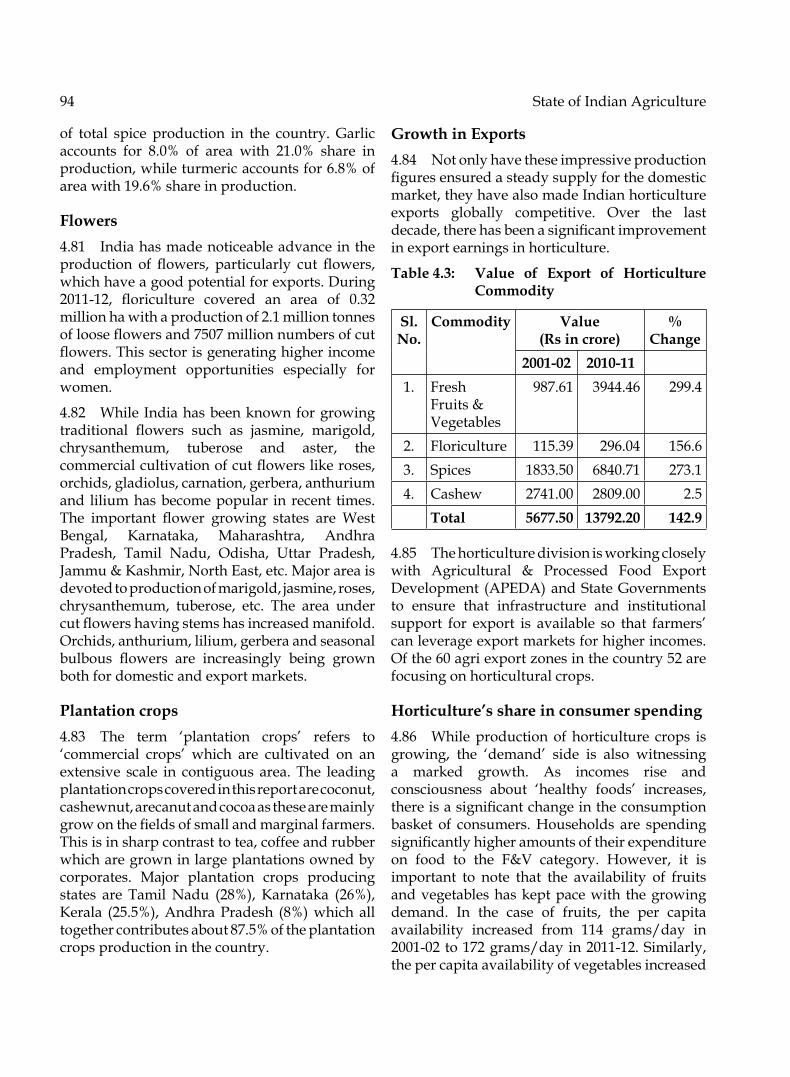
94 State of Indian Agriculture
of total spice production in the country. Garlic accounts for 8.0% of area with 21.0% share inproduction,whileturmericaccountsfor6.8%ofareawith19.6%shareinproduction.
Flowers4.81 India has made noticeable advance in the production of flowers, particularly cut flowers,which have a good potential for exports. During 2011-12, floriculture covered an area of 0.32million ha with a production of 2.1 million tonnes oflooseflowersand7507millionnumbersofcutflowers.Thissectorisgeneratinghigherincomeand employment opportunities especially for women.
4.82 While India has been known for growing traditional flowers such as jasmine, marigold,chrysanthemum, tuberose and aster, the commercialcultivationofcutflowerslikeroses,orchids, gladiolus, carnation, gerbera, anthurium and lilium has become popular in recent times. The important flower growing states are WestBengal, Karnataka, Maharashtra, Andhra Pradesh, tamil Nadu, odisha, Uttar Pradesh, Jammu & Kashmir, North East, etc. Major area is devoted to production of marigold, jasmine, roses, chrysanthemum, tuberose, etc. the area under cutflowershavingstemshasincreasedmanifold.orchids, anthurium, lilium, gerbera and seasonal bulbous flowers are increasingly being grownboth for domestic and export markets.
Plantation crops4.83 The term ‘plantation crops’ refers to‘commercial crops’ which are cultivated on anextensive scale in contiguous area. the leading plantation crops covered in this report are coconut, cashewnut, arecanut and cocoa as these are mainly growonthefieldsofsmallandmarginalfarmers.this is in sharp contrast to tea, coffee and rubber which are grown in large plantations owned by corporates. Major plantation crops producing states are TamilNadu (28%), Karnataka (26%),Kerala (25.5%),AndhraPradesh (8%)whichalltogethercontributesabout87.5%oftheplantationcrops production in the country.
Growth in Exports4.84 Not only have these impressive production figuresensuredasteadysupplyforthedomesticmarket, they have also made Indian horticulture exports globally competitive. over the last decade,therehasbeenasignificantimprovementin export earnings in horticulture.
Table 4.3: Value of Export of Horticulture Commodity
Sl. No.
Commodity Value (Rs in crore)
% Change
2001-02 2010-111. Fresh
Fruits & Vegetables
987.61 3944.46 299.4
2. Floriculture 115.39 296.04 156.63. Spices 1833.50 6840.71 273.14. Cashew 2741.00 2809.00 2.5
Total 5677.50 13792.20 142.9
4.85 the horticulture division is working closely with Agricultural & Processed Food Export Development (APEDA) and State Governments to ensure that infrastructure and institutional support for export is available so that farmers’can leverage export markets for higher incomes. Ofthe60agriexportzonesinthecountry52arefocusing on horticultural crops.
Horticulture’s share in consumer spending4.86 While production of horticulture crops is growing, the ‘demand’ side is also witnessinga marked growth. As incomes rise and consciousness about ‘healthy foods’ increases,thereisasignificantchangeintheconsumptionbasket of consumers. Households are spending significantlyhigheramountsoftheirexpenditureon food to the F&V category. However, it is important to note that the availability of fruits and vegetables has kept pace with the growing demand. In the case of fruits, the per capita availability increased from 114 grams/day in 2001-02to172grams/dayin2011-12.Similarly,the per capita availability of vegetables increased

Agricultural Production and Programmes 95
from 236 grams/day to 350 gram/day duringthis period. trend in per capita available of Fruits and Vegetables is given Fig. 4.7 below:
Fig. 4.7: Per capita availability of F & V
Towards Sustainable and Inclusive Growth in Horticulture4.87 the major challenge for horticulture is to sustain this growth in a manner which ensures higher incomes for the primary producer by ensuring better intuitional support mechanisms, infrastructure and technology support for the entire value chain – from pre –planting to Post Harvest management. While the ICAR system with its research institutions, National Research Centres and State Agricultural Universities have addressed issues relating to soil health, planting material, new and adaptive varieties, the major challenge for the DAC is to ensure higher returns to the farmer by ensuring that what is produced is not lost in transit on account of poor handling, perishability and that the farmer is part of the value chain.
Institutional support from ICAR4.88 the Horticulture Division of the Indian Council of Agricultural Research (ICAR) under Department of Agricultural Research & Education (DARE) addresses the research and education related aspects of horticulture through its Central Institutes, Directorates, National Research Centres (NRCs), Directorate of Research (DR) and All India Coordinated Research Projects (AICRP). these include the NRC for Citrus, Nagpur, NRC for Pomegranate, Sholapur, DR for Cashew, Puthur, NRC for orchids, DR for Grape
whichareinvolvedincropspecificR&D.NRC,Citrus is implementing a technology Mission on Citrus with NHM funding for addressing the problems of citrus growers in Vidharbha region of Maharashtra. NRC, Pomegranate is addressing the problem of tackling bacterial blight disease.
Linking farmers with markets4.89 the Planning Commission Committee on the subject, headed by Dr Saumitra Chaudhry recommended strengthening intuitional linkages between producers and consumers, recognition of the role of market intermediaries and supporting their efforts in backward integration, policy changes in APMC Acts to break the monopoly of the existing players and fiscal incentives toencourage investments in the sector.
Institutional Support and Market Linkages4.90 ThreemajorinitiativesoftheDAChavethepotentialtoimpactfarmer’sincomesinapositivemanner. these include the Vegetable Initiative for Urban Clusters (VIUC), support to Farmer Interest Group (FIGs) and Farmer Producer organization (FPos) for better integration with markets and input suppliers and the Public Private Partnership in Agriculture Development (PPP IAD) for Intensive agricultural Development. the salient feature of these is discussed below.
4.91 VIUC: Under the VIUC farmers living in peri-urban areas are encouraged to take upvegetable production in clusters to ensure primary level aggregationandbetter co-ordinationwithwholesalers and retailers. the idea is to support farmers with all essential inputs – from credit to seeds to soil nutrients – and assist them in primary level aggregation, grading, sorting, packaging and transport to the wholesale, and wherever possible retail points as well. It encourages farmers to have direct linkages with the large aggregators or retailers so that the farmers get a better value for their produce. the Small Farmers Agribusiness Consortium (SFAC), an agency supported by the DAC is assisting the NHM division in implementing this initiative. It has become so popular that many state governments are requesting for additional cities to be brought under its ambit.

96 State of Indian Agriculture
4.92 FPOs: VIUC encouraged the formation of Farmer Interest Groups and Farmer Producer organizations by encouraging the formation of cluster level Farmer Interest Groups (FIGs) which were organized into FPos. this strategy was based on the clear understanding that given the fragmented land holding pattern among primary producers, it was necessary to adopt the cluster based approach to achieve the economies of scale and scope. the task was also assigned to the SFAC.
4.93 PPP IAD for IAC: Another imitative which complimented this effort was the initiative to encourage partnerships with the corporate sector in the agricultural sector. the core idea here was to facilitate large scale integrated projects, led by private sector players in the agriculture and allied sectors, with aggregation of farmers, and integration of agricultural supply chain.
APMC Reforms4.94 APMC reforms are critical to the development of a value chain in horticulture produce, especially perishables. While production hasincreasedmanifold-bothintermsofvolumeand value, the number of intermediaries has remained‘constant’onaccountoftheprovisionsof the APMC Acts, most of which prescribe ownership of a premises in the market yard as a pre –condition to apply for a license. Many state governmentshaveagreed,in-principle,toamendthe Act and also introduce electronic auctions, besides allowing the establishment of terminal markets and electronic auction platforms. A snap shot of reforms status, especially with reference to horticulture produce is shown below:
Table 4.4: Status of APMC Acts Reforms with respect to Horticulture Produce
Status Statesi. APMC Act mended.
Arunachal Pradesh, Assam, Andhra Pradesh, Goa, Gujarat, Jharkhand, Madhya Pradesh, Maharashtra, Rajasthan, Sikkim, Uttarakhand
ii. Partially Modified
Chattisgarh, Delhi, Karnataka, Meghalaya, Mizoram, Nagaland, odisha, Punjab, tamil Nadu, tripura, West Bengal.
iii. Amendment under process
Haryana,
iv. to be carried out
Jammu & Kashmir, Uttar Pradesh
v. No APMC Act Andman & Nicobar Islands, Bihar, Dadar and Nagar Haveli, Daman & Diu, Kerala, Lakshadweep, Manipur
Fiscal Incentives4.95 the Report of planning commission recommended that government continue the Fiscal incentives for the horticulture sector to signal the support for the sector. these include:
i. Enhanced Subsidy :DAChasmodifiedits NHM/HMNEH/NHB schemes w. e. f.1.4.2010,byupwardrevisionofcreditlinked back ended subsidy from 25%to 40% of the capital cost of a projectin general areas and from 33.33% to55%incaseofHilly&scheduledareas,in respect of units which adopt new technologies.
ii. Rural Infrastructure Development Fund (RIDF) for warehousing: the RIDF window has been opened to the cold chain and warehousing sectors. State government.
iii. Reduction of Excise Duty on Import of Cold Storage Equipments: With effect from 2011-12 full exemptionfrom excise duty has been extended to air-conditioning equipment andrefrigeration panels for cold chain infrastructure; including conveyor belts.
iv. External Commercial Borrowing (ECB): External Commercial Borrowing (ECB)

Agricultural Production and Programmes 97
can be raised for investments in new projects, modernization/expansion of existing production units in real sector – industrial sector including infrastructure sector for creating cold storages or cold roomfacility, including farmlevelpre-cooling, for preservation or storage of agricultural/horticultural and allied produce
Support for Cold Chain Development4.96 the Planning Commission report also reiterated the need to strengthen the cold chain infrastructure in the country to address post harvest losses which ranged from 6 to 18 percent as per the CIPHEt report on the subject. Likewise a study by the NSE had pointed out the gap in cold storage capacity to the extent of37m.MT.Moreover thedistributionof coldstorages was skewed – both in terms of its concentration in UP, Punjab, West Bengal, and thatnearly80%capacitywasforpotatostorage.to address the issue of holistic development of the cold chain sector in the country, the NCCD was established with an initial corpus of Rs 25 crore from the government in 2011-12 in PPPmode. NCCD particularly addresses issues relating to cold chain management including standards, protocols and HRD. While the General Council of NCCD is headed by the Secretary DAC, its members include growers association, FPCs, co-operatives, corporate engaged in thesector- including equipment suppliers, logisticscompanies, industry bodies, resource institutions, regulatory and development agencies, apex intuitions, PSUs, state governments and Ministry of Food Processing Industries (MoFPI). NCCD has established four technical committees, viz. (i) Technical Specification, Standards, TestLaboratoryandProductCertificationCommittee,(ii) training, HRD and R & D Committee, (iii) Committee on Application of Non Conventional Energy sources in Cold Chain Infrastructures, and (iv) Committee on Supply Chain & Logistics for Post Harvest Management & Marketing.
4.97 It is significant to mention thatgovernment’s thrust to this sector has yieldedpositive outcomes. It may be mentioned that of
the 30 million MT capacity, nearly 14 millionMT has been created between 2000 to 2011 onaccount of interventions by HMNEH, National Horticulture Board (NHB), APEDA, MoFPI and Department of Animal Husbandry, Dairying and Fisheries (DAHD&F).
Support for Horticulture Development4.98 the major planned activities taken up under NHM and HMNEH scheme included programmes for production of planting material, area expansion including high density planting, rejuvenation of old and senile orchards, protected cultivation, creation of water resources, promotion of INM/IPM, which are basically aimed at productivity improvement. organic farming and Good Agricultural Practices (GAP) were promoted to enable chemical residue free horticulture produce, besides addressing environmental concerns of soil and land degradation. Horticulture mechanization was promoted to bring in efficiency in horticultureproduction and harvesting operations. Production and productivity improvement programmes were supplemented with creation of infrastructure facilities for post harvest management, processing and marketing.
Box 4.10: Salient achievements under NHM & HMNEH
• Area Expansion in 27 lakh ha additional area.• Setting of 3730 new nurseries for producing
quality planting material.• Rejuvenation of 5 lakh ha of old and
unproductive orchards• Constructionof5,55,000Communitytanksfor
providing life saving irrigation.• Setting up of 9100 units for post harvest
management.• Setting up of 850 Markets for marketing of
horticulture produce.• Setting up 91 food processing units for value
addition
Challenges4.99 In consonance with increase in horticulture production, sustaining the growth rate will be a challenge which calls for various interventions

98 State of Indian Agriculture
aimed at productivity enhancement, availability of quality planting material of improved high yielding varieties, reducing post harvest losses of perishable commodities, particularly fruits and vegetables and creation of effective supply chain. Developmental programmes on horticulture are proposed to be continued during XII Plan by subsuming the existing schemes of NHM, HMNEH, NHB, Coconut Development Board (CDB), Central Institute of Horticulture (CIH) and National Bamboo Mission (NBM) under the overall umbrella of NHM.
The Way Forward4.100 Productionandsupplyofqualityplantingmaterial will continue to be a high priority area for horticulture development during XII Plan. In this context, special emphasis will be laid for establishment of Hi-tech nurseries havingprovision for mother/scion blocks of improved varieties, good quality rootstock banks and hi-tech green house. Besides, the following steps will be taken:
• Establishment of crop based Centre ofExcellence will be encouraged in each state to server as a hub for supply of planting material and dissemination of technology to farmers.
• Area expansionprogrammewill be linkedto availability of quality planting material through accredited nurseries and tissue Culture units. Importance will be given for covering more area under F1 vegetable hybrids and export oriented varieties of ginger, turmeric & chillies. High density
planting and tree canopy management of orchards, right from establishment stage, will be given focus to derive better yield. Besides, an integrated approach will be encourage for taking up drip irrigation/mulching and other support systems required for cultivation of fruit and plantation crops.
• Rejuvenation of old and unproductiveorchards will continue to be a focus area for enhancing productivity, profitability andsustainability.
• Majorthrustwillbeonprotectedcultivation,particularly of high value crops, in green house, shade net house, plastic mulching etc.
• Creation of infrastructure for post harvestmanagements and value addition will also continue to be a high priority area with focus on creating cold chain networks.
• Setting up of markets infrastructure willbe linked with reforms in APMC Act, for permitting direct marketing of horticulture produce.
• Mobilization of farmers into producergroups/organizations is another priority area aimed at strengthening their negotiating power, besides functioning as viable farmer groups involved in production and marketing of horticulture produce.
• Humanresourcedevelopmentwillbegiventhrust for capacity building of farmers, horticulture entrepreneurs/supervisors and fieldfunctionaries.

Agricultural Prices5.1 Agricultural Prices mirror the health of agriculture sector. Food and agricultural commodity prices in India are primarily determined by domestic demand and supply factors. the nature of markets facing the agricultural commodities and imperfections in thesemarketsinfluencethepricetransmissionandthefinalconsumerprices.Inflationoffooditemshave become a major concern for policy makers worldwide.InIndia,therecentfoodinflationislargely due to an inadequate supply response particularly of pulses, fruits & vegetables, milk, egg, meat and fish due to increasing demand,
CHAPtER 5
Agricultural Prices and Markets
aggravated by various logistic and market-related constraints.
Food Articles5.2 Data on wholesale prices show by and large a continuous increase in Wholesale Price Index (WPI) of food articles during the period January2012toDecember,2012.Indicesofpricesof pulses, cereals and egg,meat and fish haveshownasubstantialincreasesinceMarch,2012ascan be seen from Fig. 5.1. Prices of vegetables as expectedhavebeensubjectedtohighfluctuationdue to seasonal factors.
Fig. 5.1: Wholesale Price Index (WPI) of food articles (January to December, 2012)
140
160
180
200
220
240
260
280
11-J
an Feb
Mar
Apr
May Jun Jul
Aug Se
p
Oct
Nov Dec
12-J
an Feb
Mar
Apr
May Jun Jul
Aug Se
p
Oct
Nov Dec
Inde
x
ALL COMMODITIES FOOD ARTICLES CEREALS
PULSES VEGETABLES FRUITS
MILK EGGS,MEAT & FISH
Food Articles have a weight of 14.34 in thewholesale price index. In food inflation, thecontribution of foodgrains (cereals and pulses)
is 28.5 percent, milk 22.6 percent and fruit & vegetables 26.8 percent. Details are given in table 5.1.

100 State of Indian Agriculture
Table 5.1: Contribution of different groups Food in Inflation ( all segments)
Items Weight Weight in Percent in food group
Food Grains (Cereals + Pulses)Cereals 3.37 23.5Pulses 0.72 5.0Vegetables 1.74 12.1Fruits 2.11 14.7Milk 3.24 22.6Eggs, Meat & Fish 2.41 16.8Condiments & Spices 0.57 4.0other Food Articles 0.18 1.3total Food Articles 14.34 100.0
5.3 The rate of inflation in food articles washoveringaround10%duringMarchtoJuly,2012.Thereafteritdeclinedtoalowof6.7%inOctober,2012 and have started increasing thereafter. InDecember,2012,rateofinflationinfoodarticleswasrecordedat11.2%.Cereals,pulses,vegetablesandegg,meatandfishhaverecordedinflationindoubledigit inDecember, 2012. as canbe seenfrom Fig.5.2.
5.4 Food products which comprise dairy, canning, grain mills, sugar, edible oils etc account for 9.97 per cent of the weight in the Wholesale Price Index, have also been witnessing high rate ofinflation,closeto10percentsinceJuly,2012.Rate of inflation in sugar, khandsari&gurhascontinuously been increasing sinceMarch 2012andstoodat12.2percentinDecember,2012.
5.5 the rise in per capita GDP by an average of 6percentinthelastfiveyearsimpliesanincreasein demand given that the income elasticity of
Fig. 5.2: Trend in Inflation in Food Articles
-25.0
-5.0
15.0
35.0
12-Jan Feb Mar Apr May Jun Jul Aug Sep Oct Nov Dec
Perc
ent
ALL COMMODITIES FOOD ARTICLESCEREALS PULSESFRUITS & VEGETABLES MILK
demand is usually more than unity for items such as fruits and vegetables, milk and dairy products,egg,meatandfish.Productionwouldhave to catch up with demand growth to keep the price rise in check. Small decline in supplies can leadtosharpfluctuations inpricesof thesecommodities.
5.6 there is a strong linkage between high ratesofoverall inflationinIndiaandhighratesof food price inflation. The latter is inevitablylinked to shortages of supply caused by the vagaries of the weather and other factors such as logistics that cause a mismatch between the supply and demand. on the demand side there

AgriculturalPricesandMarkets 101
is strong evidence to show that economic growth in India especially in the rural areas has raised employment and incomes. the higher disposable income amongst the wage earning section of rural India has possibly boosted demand for primary food, creating pressure on prices. High rates of foodinflationhavebeenfollowedbyanincreasein inflation in non-food manufactured goodsprimarily due to a rise in money wages.
5.7 Recentinflationandpriceriseoffooditemsis the effect of a complex interplay of demand and supply forces conditioned by domestic and international policies and market conditions. though short run supply shocks are responsible for price rise the impact of long run demand growth and relative inelasticity of long term production due to low investments in production
capacity enhancement are equally responsible for the current situation.
5.8 Food articles and food products together haveaweightof24.31percentintheWholesalePrice Index. During the period January to December2011,totalfood(articlesplusproducts)inflationaccountedfor23.3percentoftheoverallinflation. Protein items comprising of pulses,milkandmilkproducts,egg,meatandfish,andfruits and vegetables accounted for 57.9 per cent of the total food inflationduring 2011 (January- December). During the calendar year 2012(January–December), shareof food inflation intotalinflationis29.8percentandproteinsaccountfor58.2percentofthetotalfoodinflationascanbeseenfromFig.5.3.
Fig. 5.3: Per cent Share of Protein Foods, Sugar and Edible oils in total Food (Articles plus Products) Inflation
5.5 1.1 1.27.6 7.8
10.9 23.414.8
15.1 9.7
18.4
25.9
24.2 15.718.3
13.8
23.4
20.3 19.5 22.4
25.2
-0.8
5.2 9.6 9.5
-4.8
4.7 16.0 10.8 11.7
-10.0
0.0
10.0
20.0
30.0
40.0
50.0
60.0
70.0
80.0
90.0
2009
-10
2010
-11
2011
-12
2011
(J-D
)
2012
(J-D
)
Perc
ent
Pulses Fruits and Vegetables Milk & Milk Products
Eggs, Meat & Fish SUGAR, KHANDSARI EDIBLE OILS

102 State of Indian Agriculture
Challenges5.9 In comparison to wholesale prices, retail prices in different items display divergent trends in different markets. Due to regional differences in consumption patterns and supply conditions, prices and their movements vary across the major markets. Imperfect market conditions, restrictions on the movement of agricultural commodities due to infrastructural constraints, transportcostsandlocaltaxes,etc.influencetheretail price trends across the major markets and consumption centres. Differences in tastes and in varieties consumed across the centres also pose problems for comparison of retail prices.
5.10 The principal factors behind the higherlevels of inflation in the recent period areconstraints in production and distribution especially in high value items such as pulses, fruits and vegetables, milk and dairy products, egg, meat and fish. Increase in prices can beattributed to both supply and demand factors. the per capita availability of some of the items such as cereals and pulses have been declining resulting in some pressure on their prices. In the case of fruits and vegetables, milk, egg, meat and fish,priceshavegoneupdespitean increase inper capita availability. this is due to a changing pattern in the demand of the households for high value items with increasing income levels. Supply constraints are important in influencing therecent price rise both globally and domestically. Supply constraints are long term and short term in nature. Long-term supply constraintsinclude for example: inelastic supply of land; water; inadequate investments in key areas like irrigation; land development; and R&D.
5.11 Short-term constraints are weatherfluctuations,lackoftimelyavailabilityofinputslike fertilizers, quality seed, credit and policy environment, etc. Both long-term and short-term factors have influenced the productionof agricultural output in the recent period. Market imperfections also add to these trends by restricting the price transmission. these include lack of infrastructure facilities like efficienttransport facilities, storage, processing, marketing and credit facilities.
5.12 the Population of India increased from 1.03 to1.21billionduring2001-2011. Increasingpopulation in the face of a relatively constrained supply of agricultural output has brought down the per capita net availability of food grains from 510 grams per day in 1991 to 438.6 grams perday in2010.This is an indicatorof constrainedsupply in the face of increasing demand exerting pressure on the prices of food commodities.
5.13 Substantialfundsarebeingspentonvariouswelfare and employment oriented programmes andthesamearelikelytoincreasesignificantlyinthe near future. these programmes have infused substantial amounts of liquidity and purchasing power generating increased demand for food items.
5.14 When growth picks up at wage earning section of the population, the demand for food items would increase as income elasticity of demand for food is higher at lower levels of income. thus, lower per capita availability of food grains and structural shortage of key agricultural commodities like oilseeds and pulses combined with the rising demand have kept foodprice inflationhigh.Thisprocesshasgot further accentuated by spikes in global food prices through international transmission.
5.15 Rising international prices of oil also impacted the cost of production of agriculture through increase in input costs of fertilizers, transportation and a general rise in the cost of all other inputs and services. Increase in cost of production results in increasing the MSP of agricultural commoditieswhich also influencesmarket sentiments.
5.16 In the recent years, particularly since the commodity price hike of 2007-8, markets havebecome highly volatile. International stocks of key food items like cereals and animal feedstock are reduced due to shocks in major producing regions of Europe, Canada and Australia as also due to rising demand in developing countries putting upward pressure on prices. to some extent, speculative activities in the commodity marketsalsoinfluenceprices.

AgriculturalPricesandMarkets 103
Agricultural Price Policy and MSP5.17 The Government fixes the MinimumSupport Prices (MSPs) of various agricultural crops on the recommendations of the Commission for Agricultural Costs & Prices (CACP), the views of concerned State Governments and Central Ministries/Departments as well as other factors considered relevant for fixing MSP. MSP is inthe nature of a minimum guaranteed price for the farmers offered by the Government for their produce in case the market prices fall below that level. If the market offers higher price than MSP, the farmers are free to sell at that price.
5.18 the Government has announced the Minimum Support Prices (MSPs) for 2012-13
Seasons. the MSP of Paddy (Common) has been fixedatRs.1250perquintalandofPaddy(GradeA)atRs. 1280perquintal,which representsanincreaseofRs.170perquintaloverthelastyear’sMSPs. MSPs of Cotton (Medium Staple) and Cotton (Long Staple) have been raised by Rs. 800perquintalandRs.600perquintalandfixedatRs.3600perquintalandRs.3900perquintalrespectively. MSP of wheat has been raised from Rs.1285perquintalduring2011-12toRs.1350perquintalduringmarketingsession2012-13.MSPsofthemajorcropsfor2012-13seasonshavebeenannounced by the government. the details are given at Annexure. MSPs of some of the major crops are as follows:
Table 5.2: Minimum Support Prices of some of the Major Crops for 2012-13
Commodity Variety 2011-12 (#) increase in MSP 2011-12 over 2010-11
2012-13 (#) increase in MSP 2012-13 over 2011-12
PADDY Common 1080 80(8.0) 1250 170(15.7) Grade‘A’ 1110 80(7.8) 1280 170(15.3)CottoN Medium Staple 2800ª 300(12.0) 3600 800(28.6) Long Staple 3300ªª 300(10.0) 3900 600(18.2)WHEAt 1285 165 (14.7) 1350 65(5.05)JUtE 1675 100(6.3) 2200 525(31.3)SUGARCANE 145.00* 5.88 (4.2) 170.00* 25 (17.2)
# Figures in brackets indicate percentage increase.•Fairandremunerativeprice.
5.19 Apart from its recommendations on support prices for agricultural commodities, the Commission, as per its terms of Reference, also gives non price recommendations in its PricePolicyReports. In its 2012-13PricePolicyReport for kharif crops while pointing out about the trade distorting high taxes, mandi fees, commission and cess levied by various States, the Commission has highlighted about the need to rationalize these on basic commodities like paddy/rice. the Commission is of the view that uniformity in the State level tax structure in agricultural commodities is pre-requisite to
promote market efficiencies and a unified andintegrated national market free from any de facto restrictions on movement of goods across the States.
5.20 InitsPricePolicyReportforRabiCropsof2012-13season theCommissionhasemphasizedabout the need to impose an import tariff of 10percent on oilseeds and also review the present duty structure on oilseeds, raw and refinedoils and levy it as per economic rationality. the Government has already approved to defreeze the tariff values of all edible oils and notify their tariff values on the basis of their prevailing
104 State of Indian Agriculture
international prices which will have a positive impact on the duty collected from import of edible oilsandalsoprovideaneven-fieldtothedomesticrefining industry. Accordingly, the Governmenthas approved for enhancing import duty on crude edible oil from zero to 2.5 percent.
Market Intervention and Price Support Schemes5.21 the Department of Agriculture & Cooperation implements the Market Intervention Scheme (MIS) for procurement of horticultural commodities which are perishable in nature and are not covered under the Price Support Scheme. the objective of intervention is to protect the growers of these commodities from making distress sale in the event of a bumper crop during the peak arrival period when the prices tend to fall below economic levels and cost of production. the condition is that there should be eitheratleasta10percentincreaseinproductionor a 10 percent decrease in the ruling marketprices over the previous normal year. the Market Intervention Scheme (MIS) is implemented at the request of a state/Ut government which is ready tobear50percentoftheloss(25percentincaseofNorth-Eastern States), if any, incurredon itsimplementation. the extent of total amount of loss to be shared on a 50:50 basis between thecentral government and the state government is restricted to 25 percent of the total procurement value which includes cost of the commodity procured plus permitted overhead expenses. Under the Scheme, in accordance with MIS guidelines,apre-determinedquantityatafixedMarket Intervention Price (MIP) is procured by NAFED as the Central agency and the agencies designated by the state government for a fixedperiod or till the prices are stabilized above the MIP whichever is earlier. the area of operation is restricted to the concerned state only.
5.22 During the year 2011-12, the MIS hasbeen implemented in 6 States covering arecanut (Karnataka for 12,000 MTs), apple (HimachalPradesh–50,600MTs),onion(Karnataka–54,000MTs), Turmeric (Karnataka – 12,400 MTs) andpotato(UttarPradesh–1.00lakhMTs).Further,duringthecurrentyear2012-13(ason21.11.2012),
theMISisimplementedin3Statescoveringgarlic(Rajasthan–60,000MTs),chilly(AndhraPradesh–52,000MTs)andturmeric(TamilNadu–35,000Mts).
Price Supports Scheme (PSS)5.23 The Department of Agriculture &Cooperation implements the PSS for procurement of oil seeds, pulses and cotton, through NAFED which is the Central nodal agency, at the Minimum Support Price (MSP) declared by the government. NAFED undertakes procurement of oil seeds, pulses and cotton under the PSS as and when prices fall below the MSP. Procurement under PSS is continued till prices stabilize at or above the MSP. Losses, if any incurred by NAFED in undertaking MSP operations are reimbursed bythecentralgovernment.Profit,ifany,earnedin undertaking MSP operations is credited to the central government.
5.24 UnderthePSSduring2011-12procurementwas made for milling copra in Andaman & Nicobar for 343 MT (valuing Rs.182.76 lakh),gram in Rajasthan for 6344 MTs (valuingRs.1449.6 lakh) and urad in Rajasthan for 1.568 MTs (valuing Rs.0.62 lakh). Further, duringthe current year 2012-13 (as on 21.11.2012),procurement is made for milling copra in tamil Nadu, Lakshadweep, Kerala, Andhra Pradesh and Andaman Nicobar Ireland for 54,864 Mts (valuingRs.27980.73 lakh), ball copra inKeralaandKarnatakafor7866MTs(valuingRs.4219.09lakh), special grade milling copra in Andhra Pradesh for 49 Mts (valuing Rs.21.44 lakh) and urad in Maharashtra, Andhra Pradesh, Uttar Pradesh, Madhya Pradesh & Rajasthan for 9265 MTs(valuingRs.3983.86lakh).
5.25 the Price Support Scheme (PSS) is implemented by the Government of India to ensure a minimum support price of the produce to the farmers. the Government has notified various agencies such as FCI,NAFED,CWC, SFAC, etc., for this purpose. However, in some places, the market prices of agricultural produce remains below the MSP for variety of reasons. these include weak infrastructure of procurement agency, inadequate number of procurement centres, restrictive trade policies

AgriculturalPricesandMarkets 105
and lack of adequate processing and marketing facilities for the produce. the State Governments need to actively collaborate with these agencies to address these problems effectively. In case of certain commodities like Copra, there is a need to remove restrictions on export of coconut oil, strengthen drying facilities and include supply of coconut oil under the Public Distribution System.
Procurement of Foodgrains5.26 the main objectives of food management are procurement of foodgrains from farmers at remunerative prices, distribution of foodgrains to consumers, particularly the vulnerable sections
of society at affordable prices and maintenance of buffer stock for food security and price stability. the Central Government extends price support to paddy, coarse grains and wheat through the FCI and State Agencies. All the foodgrains conforming to the prescribed specifications offered for saleat specified centres are bought by the publicprocurement agencies at the Minimum Support Price (MSP) inclusive of bonus announced, if any. the farmers have the option to sell their produce to FCI/State Agencies at the MSP or in the open market as is advantageous to them. the Government procurements of (i) wheat and (ii) paddy during the last few years are shown in Figures 5.4 (a) & 5.4 (b) below.
Fig. 5.4 (a): Production, Procurement and procurement as % of production of wheat
Fig. 5.4 (b): Production, Procurement and procurement as % of production of Rice
758 785.7 806.8 808868.7
939.03
111.3226.9 253.8 225.1
283.4381.5
14.7
28.931.5
27.932.6
40.6
051015202530354045
0100200300400500600700800900
1000
2006
-07
2007
-08
2008
-09
2009
-10
2010
-11
2011
-12
Per
cent
Prod
uctio
n&
Proc
urem
ent
inLa
khto
nnes
Production Procurement Procuremnt as % of Production
933.6 966.9 991.8890.9
959.81043.2 1030.0
251.1 287.4 341.0 320.3 342.0 350.3 401.326.9
29.7
34.436.0 35.6
33.6
39.0
2527293133353739
0
200
400
600
800
1000
1200
2006
-07
2007
-08
2008
-09
2009
-10
2010
-11
2011
-12
2012
-13
Per
cent
Prod
uctio
n&
Proc
urem
enti
nla
khto
nnes
Production Procurement Procurment as % of Production

106 State of Indian Agriculture
5.27 In recent years there has been a high procurement as percentage of production of rice and wheat mainly because of high production and surpluses of several agricultural commodities even in deficit states like Bihar, Assam, EasternU.P. which have started generating surpluses of certain cereals. the excessive built up of stocks with FCI has been posing problems of storages which have high carrying costs. the excessive procurement by government has also not letting the private trade to play its role particularly in respect of two major cereals, namely wheat and rice that account for over 75 per cent of total food grain production in the country. Under the present mechanism of procurement at MSP, prices of these major agricultural commodities are to a large extent exogenously determined defying the market forces to bring equilibrium in the market. Active participation by the private trade in terms of volume and outreach is necessary. Further, procurement is essentially undertaken of paddy and wheat that too in a few states namely, Punjab, Haryana, Western Uttar Pradesh, Chhattisgarh, Andhra Pradesh and to some extent in Madhya Pradesh and Rajasthan. there have been reports from the eastern states particularly Eastern Uttar Pradesh, Bihar, orissa and West Bengal that in the absence of effective procurement mechanism, market prices of paddy and wheat have ruled below the MSP during the peak marketing session.
5.28 So far as coarse grain is concerned, state governments/agencies procure the coarse grains at the MSP on behalf of the FCI/Government of India and retain the quantity procured to the extent of their requirement for the PDS and the balance is delivered to the FCI by the State Govt. In case there is a demand for coarse grains in some other States, based on allocations issued by the Department of Food & Public Distribution, FCI moves this required quantity to that State. In case there is no such requirement, it is disposed of by FCI “as is where is basis” by open auction/tender. the difference between the economic cost and disposal/issue price is paid as subsidy to the State Governments.
Storage of Foodgrains5.29 total Storage capacity available with FCI ason30.09.2012was375.25lakhMTs.However,total storage capacity available with FCI and State agencies for storage of Central Pool Stocks is about 717 lakh Mts.
Constructions of godowns under Private Entrepreneurs Guarantee (PEG) Scheme of FCI5.30 Due to the increased procurement offoodgrains and to reduce the storage in Cover and Plinth (CAP), the Government formulated a Scheme for construction of storage godowns through private entrepreneurs, Central Warehousing Corporation (CWC) and State Warehousing Corporations (SWCs). Assessment of additional storage needs under the scheme is based on the overall procurement/consumption and the storage space already available. For the consuming areas, storage capacity is to be created to meet four month’s requirement ofPDS and other Welfare Schemes in a State. For the procurement areas, the highest stock levels in the last three years are considered to decide the storage capacity required. Later this scheme was extended to Decentralised Procuring (DCP) States in 2009. FCI has already sanctioneda total storage capacity of about 128.5 lakh tonnes out of which a capacity of about 94 lakh tonnes has been sanctioned to the private entrepreneurs. CWC and SWCs have been sanctioned 6.6 lakh tonnes and 27.9 lakh tonnes respectively.Acapacityofabout60lakhtonnesisunderconstruction.Atpresent,about31lakhMTs have been completed out of which 20.55lakh Mts has been taken over and the balance is expected to be taken over shortly. It is expected that by March 2013, a cumulative capacity of73lakhMTswillbecompletedandtakenoverunder the scheme.
Warehousing Development and Regulatory Authority (WDRA)5.31 Warehousing Development and

AgriculturalPricesandMarkets 107
Regulatory Authority (WDRA) has been set up by the Government of India under the Warehousing (Development & Regulation Act), 2007 with the objective of development andregulation of warehouses including registration and accreditation of the warehouses intending to issue negotiable warehouse receipts in the country. The authority has so far notified 40commodities for the purpose of Negotiable Warehouse Receipts (NWRs) and 75 more commodities including cereals, pulses, oil seeds, spices, rubber, tobacco, coffee etc. and 26 perishable commodities for cold storage and under process for being notified. So far302 warehouses have been accredited out ofwhich 271 warehouses have been registered with10.55lakhMTsstoragecapacityofCentralWarehousing Corporation, State Warehousing Corporation and Private organization.
Distribution of Foodgrains under Public Distribution System (PDS)5.32 The Department of Food & PublicDistribution makes allocations of food grains under targeted Public Distribution System (tPDS) for 6.52 crore Below Poverty Line (BPL) families including 2.43 crore Antyodaya AnnaYojana (AAY) families on the basis of 1993-94poverty estimates of the Planning Commission andMarch2000populationestimatesofRegistrarGeneral of India. Allocation of foodgrains for Above Poverty Line (APL) category are made depending upon the availability of foodgrains in the Central Pool and past offtake. Presently, these allocations range between 15 kg to 35 kgper family per month in different States/Uts.
Central Issue Prices of Rice and Wheat5.33 Wheat and rice are issued to the StateGovernments/Ut Administrations from the Central Pool at the uniform Central Issue Prices (CIP) for distribution under tPDS. the CIPs of wheat and rice are subsidized and have remained unchangedforBPLfamiliessinceJuly,2002.TheCentral Issue Prices of wheat and rice are as under:
Table 5.3: Central Issue Prices of foodgrains(Rs. per quintal)
Effective from
Foodgrains- wise
Scheme-wiseBPL APL AAY
1.7.2002totill date
Wheat 415 610 200
1.7.2002totill date
Rice 565 830 300
27.11.2007till date
Coarse grains
300 450 150
Export of Rice & Wheat5.34 Exportofwheatandnon-basmati riceonprivate account was banned w.e.f. 09.02.2007and01.04.2008respectively.However,exportofrice and wheat has been allowed on diplomatic considerations and humanitarian ground. the Government,on08.09.2011,permittedexportofnon-basmati rice and 20 lakh tonnes of wheatunder open General Licence (oGL) by private parties out of privately held stocks through EDI ports.Ason19.11.2012,aquantityof77.25lakhtonesofnon-basmatiriceand35.95lakhtonesofwheat have been exported under oGL. In view of record production of foodgrains in the recent years and comfortable stock position of wheat andnon-basmati rice in theCentralPool far inexcess of buffer norms/strategic reserve and also to offload the excess stocks of wheat dueto constraints in storage space with FCI/State Agencies, the government has on 03.07.2012approved export of 2 million tonnes of wheat from Central Pool Stocks through CPSUs of the Department of Commerce at the cost to be determinedbyindividualtendersubjecttofloorprice of US$228 per metric ton. the Government hasapprovedon29.11.2012,thecontinuationoftheunrestrictedexportofwheatandnon-basmatirice, in view of the adequate availability of wheat and non-basmati rice in the domestic market.Further,witheffectfrom26.03.2012,exportof6.5lakh tonnes of flour (Maida), Samolina (Rava/Sooji), Whole meal Atta and resultant Atta on privateaccountallowedintheyear2009hasbeenputonOGLupto31.03.2012.
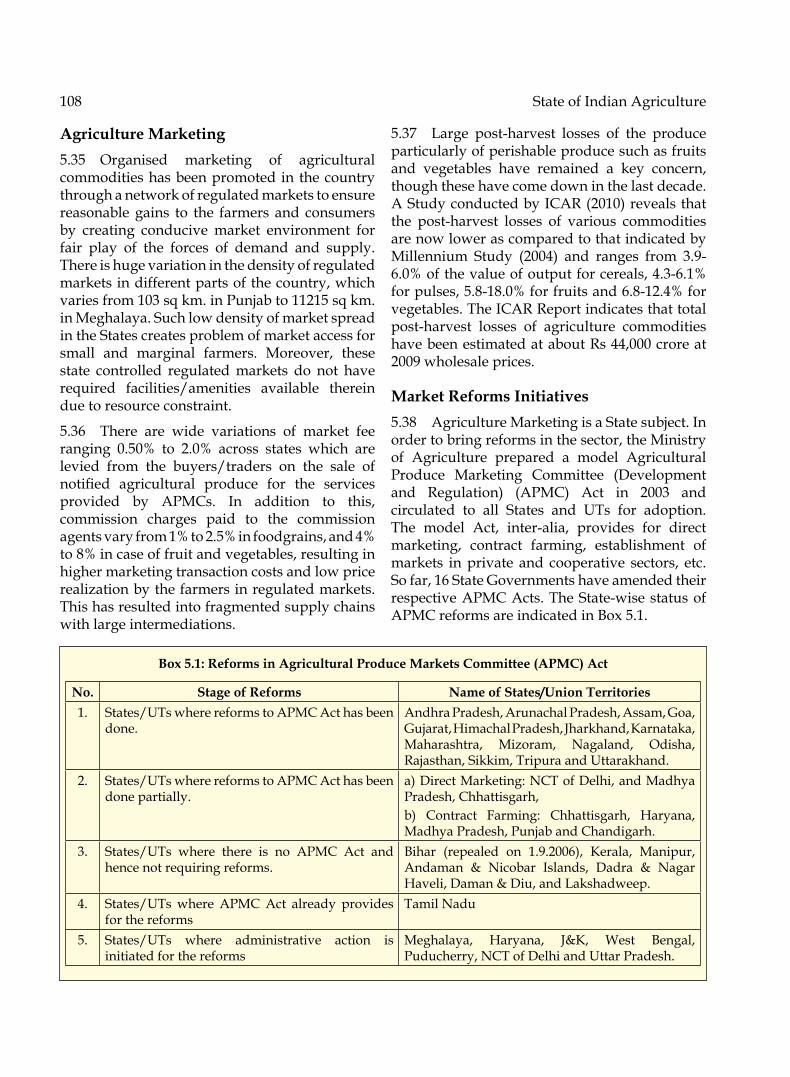
108 State of Indian Agriculture
Agriculture Marketing5.35 Organised marketing of agriculturalcommodities has been promoted in the country through a network of regulated markets to ensure reasonable gains to the farmers and consumers by creating conducive market environment for fair play of the forces of demand and supply. there is huge variation in the density of regulated markets in different parts of the country, which variesfrom103sqkm.inPunjabto11215sqkm.in Meghalaya. Such low density of market spread in the States creates problem of market access for small and marginal farmers. Moreover, these state controlled regulated markets do not have required facilities/amenities available therein due to resource constraint.
5.36 There are wide variations of market feeranging 0.50% to 2.0% across states which arelevied from the buyers/traders on the sale of notified agricultural produce for the servicesprovided by APMCs. In addition to this, commission charges paid to the commission agentsvaryfrom1%to2.5%infoodgrains,and4%to8%incaseoffruitandvegetables,resultinginhigher marketing transaction costs and low price realization by the farmers in regulated markets. this has resulted into fragmented supply chains with large intermediations.
5.37 Large post-harvest losses of the produceparticularly of perishable produce such as fruits and vegetables have remained a key concern, though these have come down in the last decade. AStudyconductedbyICAR(2010)revealsthatthe post-harvest losses of various commoditiesare now lower as compared to that indicated by Millennium Study (2004) and ranges from 3.9-6.0%ofthevalueofoutputforcereals,4.3-6.1%forpulses,5.8-18.0%forfruitsand6.8-12.4%forvegetables. the ICAR Report indicates that total post-harvest losses of agriculture commoditieshavebeenestimatedataboutRs44,000croreat2009wholesaleprices.
Market Reforms Initiatives5.38 AgricultureMarketingisaStatesubject.Inorder to bring reforms in the sector, the Ministry of Agriculture prepared a model Agricultural Produce Marketing Committee (Development and Regulation) (APMC) Act in 2003 andcirculated to all States and Uts for adoption. The model Act, inter-alia, provides for directmarketing, contract farming, establishment of markets in private and cooperative sectors, etc. So far, 16 State Governments have amended their respectiveAPMCActs.TheState-wisestatusofAPMC reforms are indicated in Box 5.1.
Box 5.1: Reforms in Agricultural Produce Markets Committee (APMC) Act
No. Stage of Reforms Name of States/Union Territories1. States/Uts where reforms to APMC Act has been
done. Andhra Pradesh, Arunachal Pradesh, Assam, Goa, Gujarat, Himachal Pradesh, Jharkhand, Karnataka, Maharashtra, Mizoram, Nagaland, odisha, Rajasthan, Sikkim, tripura and Uttarakhand.
2. States/Uts where reforms to APMC Act has been done partially.
a) Direct Marketing: NCt of Delhi, and Madhya Pradesh, Chhattisgarh,b) Contract Farming: Chhattisgarh, Haryana, Madhya Pradesh, Punjab and Chandigarh.
3. States/Uts where there is no APMC Act and hence not requiring reforms.
Bihar (repealed on 1.9.2006), Kerala, Manipur,Andaman & Nicobar Islands, Dadra & Nagar Haveli, Daman & Diu, and Lakshadweep.
4. States/Uts where APMC Act already provides for the reforms
tamil Nadu
5. States/Uts where administrative action is initiated for the reforms
Meghalaya, Haryana, J&K, West Bengal, Puducherry, NCt of Delhi and Uttar Pradesh.

AgriculturalPricesandMarkets 109
5.39 In order to accelerate the pace ofmarketreforms, the Ministry of Agriculture has set upaCommitteeof StateMinisters in-chargeofAgriculturalMarketing in 2010, with membersfrom the States of Maharashtra, Gujarat, Haryana, Uttarakhand, Bihar, Assam, odisha, Andhra Pradesh, Karnataka, Madhya Pradesh and Punjab. the Committee has been deliberating on various issues of marketing reforms and has held seven meetings so far. the Committee has submitted its “First Report” to the Government in September, 2011,whichhasbeencirculatedtoallStatesandUts for implementation of its recommendations. There is a strong need for taking pro-activemeasures by the States to reform their existing marketing systems.
Emerging Marketing Channels5.40 In order to provide a higher share ofconsumer prices to the farmers, there is a need to reduce the multiple layers of intermediation by providing alternative marketing channels. Several States have taken the initiatives in this regards. Farmers’ markets, like, ‘Apni Mandi’ (Punjab),‘KisanMandi’(Rajasthan),‘HadaspurVegetableMarket’ (Pune), ‘Rythu Bazaars’ (AndhraPradesh), Uzhawar Santhai (tamil Nadu) and ‘KrushakBazaars’(Orissa)havebeenestablishedas part of this initiative. the establishment of such farmers’marketshashelpedbothconsumersandfarmers.
Fig. 5.5: Uzhawar Santhai in Tamil Nadu
5.41 Contract farming has considerable potential in our country where small and marginal
farmers can have access to modern technology, quality inputs and marketing support through contractual agreement between processing and/or marketing firms for production support atpredetermined prices. It stipulates a commitment on thepartof the farmers toprovidea specificcommodity in terms of quality & quantity as determined by the purchaser and commitment on the part of company to support the farmer for production through quality inputs and other technical support. Various agriculture commodities including perishable fruits and vegetables are being grown under contract farming system in different States. the model APMC Act has the provision to promote and to facilitate contract farming.
5.42 Electronic mode of marketing of agriculture produce is being promoted by National Spot Exchange of India Ltd., where the farmers and traders can sell farm produce, while upcountry buyers, processors, exporters, and end-userscan buy the commodities electronically through competitive bidding. It is a compulsory delivery based platform, which enables the farmers and traders to sell their produce electronically and to realize the best possible price. However, success of electronic trading depends on establishing an effective system of grading and marking of agriculture produce which requires special attention of the States.
Empowering Farmers with Market Information5.43 Market information is an important toolin agricultural marketing system. In order to provide regular and timely information of prices of agricultural commodities prevailing in Agricultural Produce Markets in the country, the MinistryofAgriculturelaunchedtheICT-basedCentral Sector Scheme of Marketing Research and InformationNetwork (MRIN) in the year 2000.the Scheme provides electronic connectivity to important wholesale markets in the country for collectionanddisseminationofpriceandmarket-related information. Presently,more than 3,000markets from all over the country have been linked to a central portal (http://agmarknet.nic.in). these markets report the daily prices and

110 State of Indian Agriculture
arrivalsformorethan300commoditiesand2000varietiesfrommorethan1800marketscoveringnearly all the major agricultural and horticultural produce. The States’ APMCs need to regularlyupload data on price and arrivals on this portal. Some States e.g. Bihar and Kerala which do not have APMCs are not able to report this information for which alternative arrangements are required to be made.
5.44 the information available on the portal is in the public domain and can be instantly accessed from anywhere in the world. Farmers and stakeholders are accessing this information throughout the country. Many agencies are using the information to generate market intelligence and making it available to various stakeholders to support them in appropriate decision making. organizations like Reuters, Nokia, IKSL are disseminating market price information through SMS and voice based system.
Incentivizing Development of Agricultural Marketing Infrastructure5.45 Development of agricultural marketing infrastructure is the foremost requirement for the growth of comprehensive and integrated agricultural marketing system in the country. For the purpose, the Ministry of Agriculture is implementing demand driven Plan Schemes by providing assistance to entrepreneurs in the form of back ended credit linked subsidy.
5.46 Considering the immediate need for creation of storage capacities in rural and remote areas, the ‘GrameenBhandaranYojana’was launched in 2001 to provide assistance forcreationofscientificstoragegodownswithalliedfacilities. Since inception of the scheme, 28,744 godownprojectshavingacapacityof328.97lakhstonneswithasubsidyreleaseofRs.966.05crorehave been sanctioned by NABARD and NCDC all over the country up to 31st July, 2012. Thecost norms have been revised under the Scheme from20October2011toencouragethecreationof additional warehousing capacity.
5.47 though the scheme is being implemented across the country, it is unevenly spread with higher capacity creation in Madhya Pradesh,
Andhra Pradesh, Maharashtra, West Bengal and Karnataka and low capacity creation in tamil Nadu, Rajasthan, orissa, Bihar, Kerala and North Eastern States. the ceiling for creation of storage capacity of 18 lakh Mt in a State/Ut during XI Plan also proved hurdle in expansion of the scheme, which needs to be addressed in XII Plan, along with other issues like rates of subsidy particularly in North Eastern States, mandatory requirement of loan from bank for State Agencies, implementing procedures, etc.
5.48 With a view to induce large investment in the development of marketing infrastructure in the country; the Ministry launched the scheme of “Development/Strengthening of Agricultural Marketing Infrastructure, Grading andStandardization”in2004.Underthescheme,investment subsidy is provided on the capital cost of general or commodity specific infrastructurefor marketing of agricultural commodities and for strengthening and modernization of existing agricultural markets including wholesale, rural and periodic markets. the scheme is reform linked and is being implemented in only those States/Uts which have amended the State APMC Act by allowing setting up of agricultural markets in private and cooperative sectors. Underthescheme,backendedsubsidy@25%ofcapital cost of the project is provided. However, subsidy is given@ 33.3% in case ofNE States,hilly areas and SC/St entrepreneurs. Under the Scheme7853projectshavebeensanctionedason31.07.2012withsubsidyofRs.842.64crore.
5.49 Since the scheme is reform linked, the scheme is not being implemented in non-reformed States which include major States like Haryana, Uttar Pradesh and West Bengal. Thenon-reformedStates, therefore,needs tobepersuaded to make necessary reforms in their States to enable them to avail assistance under the scheme. the scheme has not been received very well by cooperative sector in the country, except Gujarat. Moreover, the assistance is not being availed under the Scheme by North Eastern States. these issues including some other issues like rates of subsidy, implementing procedures, emphasis on grading and standardization, etc. needs to be addressed in XII Plan.

Agricultural Prices and Markets 111
Standardization and Quality Certification5.50 Grading of agricultural commodities hasthree main purposes, namely, (a) to promote common trade language and avoid need for physical checking and handling at many points; (b) to protect consumers by ensuring quality of products he/she purchases; and (c) to protect the producer from exploitation by ensuring prices commensurate to the quality of produce. the Agricultural Produce (Grading & Marking) Act, 1937provides for grading andmarking ofagricultural commodities. Grade standards of various agricultural commodities are framed and notified in appropriate Grading and MarkingRules for specific commodity. Till date, Gradestandards of 212 agricultural commodities have been notified in 105 Commodity Grading andMarking Rules. The Grade standards notifiedunder the provisions of the said Act are popularly called ‘AGMARK Standards’. Grading andmarking under AGMARK is voluntary as per the provisions of theAct.However, certificationofBlended Edible Vegetable oils and Fat Spread is mandatory under AGMARK as per the provisionsof ‘Regulations’notifiedunderFoodSafety and Standards Act, 2006. The quantityand value of agricultural commodities certifiedunder AGMARK for domestic trade during the year2011-12were12.35lakhMTs,valuedatRs.12289.18 crore.
Challenges5.51 though the process of market reforms have been initiated by different State Governments by bringing amendments in the present APMC Act onthelinesofModelActcirculatedduring2003,but still many of the States are yet to adopt the same and even those of the reformed states are yet to adopt all provisions of Model Act uniformly. It is therefore, necessary to complete the process of market reforms early to provide the farmers an option for alternate competitive marketing channel for transaction of their agricultural produce at remunerative prices. there is a need for framing amended APMC Rules by all the States/Uts for implementation of the provisions of the Act.
5.52 Under the Essential Commodities Act, 1955 and also by administrative orders, the States have been imposing restrictions on cross border movement of specific commodities for tradepurpose, thus, hinderingdevelopment of inter-state trade formatchingdemand-supply.Statesalso notify various stock limits commodity-wise, which do encourage investment in storage facilities which is a crucial marketing infrastructure. the stock limits and movement of agricultural commodities across the country need to be freed so as to facilitate a common National Market of agricultural produce across the country.
5.53 The present agricultural marketingsystem in the country is marked by fragmented supply chain which is dominated by multiple market players resulting into high wastages thus, adversely affecting efficient marketing. Itis necessary that direct marketing and contract farming is promoted to facilitate enhanced share ofproducersinconsumer’srupee.
5.54 there is a large difference between the prices at retail level and those at wholesale level duetomultiple intermediariesandhigh taxes -13%to15.5%advaloremapartfromotherMarketCharges which need to be rationalized. It is also necessary that States may waive off market fee on fruit and vegetables under the APMC Act to ensure unhindered trade in those commodities. there is a need to create an integrated national market ensuring barrier free movement of agriculture commodities from one state to another.
The Way forward5.55 the development of alternative and competitive marketing channels is necessary to induce competition in the existing marketing systems and to facilitate sale of farm produce at remunerativeprices.Thereisaneedforefficientmarketingsystemincludingcreationofscientificstorage nearer to farm so that wastage and produce deterioration are avoided. It is also necessary to provide institutional credit requirement of the farmers through various instruments like pledge financing, negotiable warehousing receipt

112 State of Indian Agriculture
system so that they are not compelled to sell the produce at distress price. the present system of agricultural marketing needs to evolve towards establishmentofunifiednationalmarketforsaleof agricultural produce throughout the country efficientlywithoutanyundesirablebarriers.
5.56 Improvement of marketing linkages for both farm produce and inputs necessitates a strong private sector backed up by appropriate policy and legislative frameworks and effective government support services. Such services may include provision of market infrastructure, supply of market information, and agricultural extension services to advise farmers on marketing, capacity building in marketing; development of marketing linkages between farmers, agribusinesses and large retailers. Such linkages can be developed through cooperatives, contract farming or associations of stakeholders representing different interest groups like farmers, input suppliers, agricultural produce processers, etc. to join together in associations to promote their common goals. Government can work as a catalyst for the formulation of such associations to improve agricultural productivity, processing, marketing, support services, farm-market linkages, training and infrastructure.
5.57 With the help of Rural Infrastructure Development Fund (RIDF), cold storage of adequatecapacitymaybecreatedinall the660district headquarters so that any perishable item produced in the District can be stored there without forcing a distress sale on the farmer and not subjecting the product to perish.
India in Global Agricultural Trade5.58 Despite substantial degree of economic liberalisation since 1991, export of agricultural products has remained highly regulated. Policies on export of agricultural products have seen frequent changes mostly to protect interest of domestic consumers and industries. Indication of increase in prices of agricultural products has in many instances led to export restrictions to the detriment of farmers in the absence of other alternatives. the implication of such ambivalent
trade policy has to be carefully considered in view of the legitimate interest of the Indian farmers, our increasing integration with world trade and our commitment to international organizations like the Wto.
5.59 Frequent changes in export policy measures create a situation of uncertainty and undermine credibility of the country as a reliable source of agricultural produce for exports. once a market is created, a sudden declaration of ban erodes suchareputationmakingitdifficulttoregainthemarket developed by the exporters. often there are very small windows of opportunity in terms of timeandpriceforexportsintoday’scompetitiveworld commodity market. Uncertainty in policy prevents realisation of such opportunities.
5.60 Such a restrictive export policy amountsto penalising farmers and subsidising the consumers. With more than required availability of agricultural products, the time has come to do away with ad hoc control measures, which harm the interests of farmers including those who are aimed to be protected through such measures.
5.61 A consistent policy environment is necessary to adequately incentivise farmers to invest more in productivity increasing techniques, which will not only help the agriculture sector to realise its true potential but also assist in meeting the domestic demand. A stable trade policy on agricultural commodities will provide the right price signal and sufficient time to farmers torespond to that.
5.62 Despite policy uncertainties, over the years India has developed export competitiveness/niche for certain specialized products like basmati rice, oil meals, cotton, maize etc. India is among the 15 leading exporters of agricultural products intheworldandhasalsoemergedasignificantexporterhavingshareofmorethan5%ofglobalexports in certain crops like cotton, rice, eggs and oil meals. As per United Nations Commodity trade Statistics Database (UNCoMtRADE) 2010, the global agricultural export trade wasUSD 994.95 billion, out of which India’s sharewas1.63%atUSD16.26billion.India’sshareinglobalagriculturetradeis1.48%.

AgriculturalPricesandMarkets 113
Trade in Agriculture5.63 TheAgricultural Exports as a percentageofGDPincreasedfrom1.6percentin2007-08to2.2percentin2011-12.TheAgriculturalimports
asapercentageofGDPalso increased from0.9percentto1.3percentduringthesameperiod.Theshare of India’s total Agricultural Exports andImports as a percentage of GDP improved from 2.5percentto3.5percentduringthisperiod.
Fig. 5.6: Agricultural Trade as percent of GDP
1.6 1.5 1.4 1.52.2
0.9 1.0 1.2 1.1 1.30.7 0.6 0.2 0.5
0.9
2.5 2.5 2.6 2.63.5
2007-08 2008-09 2009-10 2010-11 2011-12 (P)
Agri and Allied Products as a % ofGDP
Exports Imports Balance of Trade Total Trade (Exp+Imp)
Agricultural Exports and Imports5.64 Agricultural exports increased from Rs. 120thousandcrorein2010-11toRs.187thousandcroreinfinancialyear2011-12registeringagrowthof nearly 55%. Increase in value of agriculturalexportsduring2011-12wasprimarilyonaccountof higher exports of cotton, marine products, guar gum meal, basmati & non-basmati rice,meat & meat preparations, spices, and oil meals.
During the same period export of tobacco, dairy& poultry products, sugar and molasses registered a decline. In 2011-12 over 2010-11the share ofagricultural exports in total exports increased from10.47%to12.81%.
5.65 India’s top 10 agricultural exportcommodities in terms of quantity and value for theyear2009-10,2010-11and2011-12isgiveninthe table 5.6.
Table 5.4: Top 10 Agricultural exports
Qty.‘000’tonnes,Value:Rs.Incrores.S. No. Item 2009-10 2010-11 2011-12
Qty. Value Qty. Value Qty. Value1 Cotton Raw incl. waste 1358 9537 1258 12981 2013 216232 Marine products 710 9999 801 11548 1032 165883 Guargum Meal 218 1133 403 2806 707 163574 Rice Basmati 2017 10890 2186 10582 3212 154505 Meat & Preparations 6286 8776 14111

114 State of Indian Agriculture
6 Spices 663 6157 749 7870 931 131767 oil Meals 4671 7832 6798 10846 7436 117628 Sugar 45 110 3241 10339 2747 87799 Rice (other than
Basmati)140 365 96 220 4099 8668
10 other cereals 2892 2973 3188 3596 4072 5479
Source: DG CI & S, Department of Commerce.
5.66 Compared to agricultural exports India’sagricultural imports increased from Rs. 56 thousand crore in 2010-11 to Rs 85 thousandcrore in 2011-12 registering a growth of nearly50%. Increase in value of agricultural importsduring this period was primarily on account of imports of Vegetable oils, pulses, cashew nuts
raw, fruits and nuts, milk & cream and spices. Share of agricultural imports in the total imports increased from 3.53% in 2010-11 to 3.63% in 2011-12.
5.67 India’s top 10 agriculture importcommodities for the year 2009-10, 2010-11and2011-12isgiveninthetablebelow:
Table 5.5: Top 10 Agricultural importsQty.‘000’tonnes,Value:Rs.incrores.
S. No.
Item 2009-10 2010-11 2011-12 Qty. Value Qty. Value Qty. Value
1 VegetableOilsfixededible 8034 26483 6905 29860 8429 462422 Pulses 3510 9813 2591 6980 3308 87673 Cashew Nuts 756 3048 504 2480 809 53384 Fruits & Nuts
(excl. Cashew nuts) 2873 3684 4519
5 Sugar 2551 5966 1198 2787 997 31386 Spices 153 1432 108 1359 124 21027 Cotton raw & waste 171 1241 56 604 78 10598 Milk & Cream 8 78 37 492 63 10389 Jute, raw 63 149 75 273 181 44910 Cereal Preparation 41 188 37 226 46 300
Source: DGCI & S, Department of Commerce.
Regional Free Trade Agreements5.68 India has been negotiating Free trade Agreements including liberalized trade in agriculture goods to increase its trade. the main developments during period under review have been:
(i) Negotiations on PtAs/FtAs continued to mark progress with European Union,
EFtA (Switzerland, Norway, Iceland and Liechtenstein). MERCoSUR (Brazil, Argentina, Paraguay, Uruguay), Chile, Israel, Indonesia, Australia, New Zealand and thailand.
(ii) ASEAN (Brunei, Indonesia, Malaysia, Philippines, Singapore, thailand, Cambodia, Lao PDR, Myanmar and Vietnam) trade in Goods Agreement

Agricultural Prices and Markets 115
was signed on 13th August 2009. ThisFtA became effective from 1st January 2010. India –South Korea PartnershipAgreement (CEPA) was concluded on 7thAugust2009.
(iii) TradeingoodsagreementsunderIndia-JapanCEPAandIndia-MalaysiaCECAwere concluded during 2010-11 andhave become effective from 1st August 2011and1stJuly2011respectively.
(iv) Recently more tariff concession has been provided to SAFtA LDCs (Bangladesh, Nepal, Bhutan and Maldives) and Non-LDCs (Sri Lanka and Pakistan).tariff on all agricultural products has been reduced to zero for SAFtA LDCs. Bangladeshwillbemajorbeneficiaryofthis liberalization. tariff on most of the agricultural products has been reduced to Non-LDCs of SAFTA. Pakistan willbebenefittedfromthisliberalization.
Multilateral Negotiations5.69 India is a founder Member of the World trade organization (Wto). As a Member, India has to abide by Wto rules, including the rules for agricultural trade as contained in the General Agreement on tariffs and trade, the Agreement on Agriculture and relevant provisions of other Wto agreements.
5.70 The Agreement on Agriculture (AOA)applies to basic agricultural products such as wheat, milk and live animals; products derived from them such as bread, butter and meat; and all processed agricultural products. It also applies to wines and spirits, tobacco products and fibers. It does not apply, however, to fishand fish products or forestry products. India’scommitments and obligations are governed by these rules and its schedule of commitments notified to theWTO in 1995 after theUruguayRound of trade negotiations.
5.71 the rules and commitments relate, inter alia, to tariffs, tariff quotas, domestic support to farmers (such as market price support) and export subsidies, and measures used to restrict exports
andimports.Indiahastofileannualnotificationsof its domestic support and export subsidies and ad hocnotificationsofanyinterimmeasures.tariffs on agricultural products have to be kept within the ‘bound’ or ceiling levels committedinIndia’sscheduleofcommitmentstotheWTO.While no subsidies are prohibited under the AoA, Members have to ensure that these are within the limits to which they are entitled and are in accordancewith criteria specified in theAgreement for various types of support.
Agriculture in the Doha Round of Trade Negotiations5.72 Agriculture is one of the subjects covered in the Doha Round of trade negotiations in the WTOwhichisunderwaysince2001.Otherareasaremarketaccessfornon-agriculturalproducts,services, trade-related aspects of intellectualproperty rights, rules (covering anti-dumpingand subsidies), trade facilitation, etc. these are partofa‘singleundertaking’whichmeansthatnothing is agreed until everything is agreed.
5.73 The three main elements or “pillars”of the Agreement on Agriculture (AoA) and the negotiations are: (i) market access, (ii) domestic support and (iii) export competition. the negotiations are aimed at: substantial improvements in market access; reductions of, with a view to phasing out, all forms of export subsidies; and substantial reductions in trade-distorting domestic support. Special anddifferential treatment for developing Members is also intended to be an integral part of the modalities.
5.74 the objective of the agriculture negotiations is to reduce/cap/eliminate trade-distortingdomestic support and export subsidies and increase market access through a reduction of tariffs. the proposals being negotiated also include special and differential treatment provisions for developing countries that would, inter alia, allow them to take minimal tariff cuts on sensitive tariff lines so as to safeguard their food and livelihood security and rural development needs. there is also a proposal for a special safeguard mechanism to enable developing countries to protect their

116 State of Indian Agriculture
farmers from the effects of import surges or price dips.
5.75 Doha Round of trade negotiations in the World trade organization (Wto), launched in November2001,isessentiallyonholdcurrently.The negotiations in the ‘Special Session’ of theWTO’s Committee on Agriculture take placeon the basis of draft texts on modalities that are brought by the chairperson of the Committee from time to time. the version that is currently being discussedwasissuedon6December2008.Sincethen hardly any progress has been made. ten issues-BlueboxsupportforUS,Cotton,SensitiveProducts, Tariff Capping for Non-SensitiveProducts, Tariff Quota Creation for SensitiveProducts/Non-SensitiveProductsbeyond100%duties, Tariff Simplification, Tropical Products
& Diversification Products and Preservation ofLong Standing Preferences have been in square brackets or otherwise annotated in the modalities sinceDecember2008.
The Way Forward5.76 the FtAs and Multilateral trade Agreements need to be revisited after careful analysis of their impact on the agriculture sector.
5.77 there is need to ensure an increased consistency in our trade policy. Measures such as export ban etc. should be the last recourse. International markets once developed must be protected and cultivated. Further, we need to ensure that our imports do not adversely impact the domestic production and returns to the farmers.
6.1 While increased productivity is an essential component of a vibrant agricultural sector, improvedpost-harvesthandlingandprocessingis essential to ensure value addition, reduction in wastage and good quality products reach the markets. too often, even when the yields are high, producers lose income due to poor post-harvest practices.
Food Processing Sector6.2 Food processing aims to make food more digestible, nutritious and extend the shelf life. Due to the seasonal variations high levels of wastage or shortages can arise if adequate measures are not taken to preserve and store the foods. Food processing covers all the processes that food items go through from the farm to the timeitarrivesontheconsumer’splate.Itincludesbasic cleaning, grading and packaging as in case of fruits and vegetables and also alteration of the rawmaterial toa stage justbefore thefinalpreparation. Value addition processes to make ready-to eat food like bakery products, instantfoods, flavored and health drinks, etc. are alsoincludedinthisdefinition.
6.3 Food processing offers an opportunityfor the creation of sustainable livelihoods and economic development for rural communities. Food processing has come a long way in the last few decades. the ever changing lifestyles, food habits and tastes of customers’ globallyhave altered the dynamics of the industry. the world food production and consumption patterns are evolving with a change in the needs ofthecustomer.Foodprocessingbenefitsallthesections of the society. It helps the:
Farmers–get better returns, higher yield, and lower the risks drastically,
Consumers-have access to a greater variety, better prices and new products,
Economy-gets benefitted with new business
CHAPtER 6
Post-Harvest Management And Value Addition
opportunities for the entrepreneurs and the work force gets employment.
6.4 With a huge production base, India can easily become one of the leading food suppliers to the world while at the same time serving the vast growing domestic market of over a billion people. India’s largemarket sizewith growing incomesand changing life styles also creates incredible market opportunities for food producers, food processors, machinery makers, food technologists and service providers in this sector.
6.5 Growth in food processing sector is also expected to open up a lot of opportunities for players having strong linkages in the agri value chain. Significant investment opportunitiesare yet to be tapped in the areas of supply chain management, cold storages, financing,retailing and exports. Historically, agriculture and FPI have been plagued by factors such as low public investment, poor infrastructure, inadequate credit availability and high levels of fragmentation. However, in the last few years there have been significant improvements onalmost all the fronts. the Indian food processing sector’s higher rate of growth as compared tothe agriculture growth rate is indicative of its low base, the increased availability of surpluses, changing life styles, tastes and higher disposable income with consumers.
6.6 Food processing sector which has been identifiedasathrustareafordevelopmentneedshuge investments in logistics for supporting the value chain from farm to plate. the enabling rules of the game and policy regime will determine the performance of the sector. Most food processing enterprises have been exempted from industrial licensing under the Industries (Development and Regulation) Act, 1951 with the exception of beer and alcoholic drinks and items reserved for the small scale sector. For foreign investment, automatic approval is given even up to 100percent equity for a majority of processed foods.

118 State of Indian Agriculture
6.7 Effective post-harvestmanagement allowsnot only the minimization of losses but also increases the value of the marketed agricultural products by transforming the agricultural raw materials. Good processing enables preservation of product quality at every stage of the marketing process. Attractive packaging makes the product more appealing to consumers who are therefore willing to pay more if the product offered is of good quality and easy to use. the policy initiatives of the government also include assistance for opening up of Mega Food Park, Cold Chain and development of Agri- export zones, skilldevelopment and R&D activities. Apart from the various schemes from the central government,
various state governments are implementing their own food processing promotion policies and schemes.
6.8 Food Processing Sector forms an important segment of the Indian economy in terms of its contribution to GDP. the sector contributes as muchas9.0to10.0percentofGDPinAgricultureand Manufacturing sector. During the last 5 years ending2010-11,FPIsectorhasbeengrowingatanAverage Annual Growth Rate (AAGR) of around 6 per cent as compared to around 4 per cent in Agriculture and 9 per cent in Manufacturing. Contribution of food processing sector in the recent years has been significant as may begauged from the table below:
Table 6.1: Contribution and growth of Food Processing Industries:
Contribution and Growth of FPI sector(GDP in Rs Crore)
S. No.
Description 2006-07 2007-08 2008-09 2009-10 2010-11
GDP at Factor Cost, of which…..
35,64,364 38,96,636 41,58,676 45,07,637 48,85,954
1 GDP Agriculture* 5,54,395 5,89,383 5,88,757 5,93,696 6,38,3012 GDP Manufacturing 5,70,458 6,29,073 6,56,302 7,19,728 7,74,1623 GDP-FPI 52,164 57,320 60,379 58,753 62,933
Growth (per cent) AAGR$4 GDP at factor cost 9.6 9.3 6.7 8.4 8.4 8.55 GDP Agriculture* 4.3 6.3 -0.1 0.8 7.5 3.86 GDP manufacturing 14.3 10.3 4.3 9.7 7.6 9.27 GDP FPI 9.4 9.9 5.3 -2.7 7.1 5.8
Share (per cent) Average8 GDP FPI as a share of
GDP in Agriculture*9.4 9.7 10.3 9.9 9.9 9.8
9 GDP FPI as a share of GDP in Manufacturing
9.1 9.1 9.2 8.2 8.1 8.7
Source: National Accounts Statistics, MoSPI* Includes Milk, Egg, Fish but excludes Forestry &Logging, AAGR$: Five year Average Annual Growth Rate
6.9 Performance of this sector has improved significantly in the recentyears.Manufacturingsector was generally growing at a higher rate than FPI till 2009-10. Performance of FPIimprovedsubstantiallyin2010-11;almostatpar
withmanufacturingsector.In2011-12,aspertheIndexofIndustrialProduction(IIP),FPIhasout-performed Manufacturing; while FPI grew at 15.1 per cent, manufacturing growth was close to 3.0percent.

Post-HarvestManagementandValueAddition 119
Table 6.2: Sector-wise Number of Registered Food Processing Units
S. No.
Year Meat, Fish, Fruits, Vegetables and Oils
Dairy Products
Grain Mill Products
Other Food Products
Beverages Total
1 1998-1999 4241 737 12164 5682 1029 23853
2 1999-2000 3819 795 12405 5810 1113 23942
3 2000-2001 3740 735 12446 5985 1082 23988
4 2001-2002 3454 865 12429 5688 1049 23485
5 2002-2003 3284 769 12856 5899 1008 23816
6 2003-2004 3352 912 12741 5757 1078 23840
7 2004-2005 3484 927 13639 6093 1219 25362
8 2005-2006 3549 1049 13893 6009 1225 25725
9 2006-2007 3459 1015 13880 6245 1160 25759
10 2007-2008 3667 1096 13805 6300 1351 26219
11 2008-2009 3580 1100 14599 6577 1362 27218
12 2009-2010 3697 1112 14673 6681 1316 27479
13 2010-2011(P)
4910 1493 18549 9071 1815 35838
(Source: Annual Survey of Industries), P: Provisional Results
Fig. 6.1: Growth in FPI, Manufacturing & General Index (Cumulative) during 2010-2012
(Source: Index of Industrial Production)

120 State of Indian Agriculture
Table 6.3: Foreign Direct Investment in Food Processing Sector from April 2007 to May 2012
S. No. Year (Apr-Mar) FDI in Rs crore FDI in US$ million1 2007-08 279.01 70.172 2008-09 455.59 102.713 2009-10 1,314.23 278.894 2010-11 858.03 188.675 2011-12 826.16 170.216 2012-13(Apr-August) 336.10 66.12
(Source: Department of Industrial Policy and Promotion)
and Small Enterprises (MSEs). For manufacture of items reserved for MSEs, FDI is permissible under automatic route up to 24 per cent.
6.10 Foreign Direct Investment (FDI) ispermissible for all the processed food products upto100%onautomaticrouteexceptforbeer/alcoholic drinks and items reserved for Micro
Table 6.4: Persons Employed under Registered Food Processing Industries
Year 2006-07 2007-08 2008-09 2009-10 2010-11(P) AAGR $Persons (In Lakh) 14.76 15.05 15.64 16.06 16.75Growth(%) 6.09 1.96 3.87 2.71 4.30 3.79
Source: Annual Survey of Industries, MoSPI; P: Provisional Results; $: Average Annual Growth Rate.
Source: Annual Survey of Industries, MoSPI. *: Provisional Results

Post-HarvestManagementandValueAddition 121
6.11 In terms of Investment, FP sector has registered a positive growth in terms of Capital Invested (fixed capital and physical workingcapital).AspertheASI2010-11(P),theInvested
CapitalinFPIndustrystoodatRs.2,49,337croregrowing at an AAGR of 22.17 per cent during fiveyearsending2010-11.
Source: Annual Survey of Industries, MoSPI. *: Provisional Results
Table 6.5: Capital Investment* in Registered Food Processing Industries
Year 2006-07 2007-08 2008-09 2009-10 2010-11 (P) AAGRInvested Capital (Rs. crore) 1,12,484 1,38,996 1,57,062 1,93,850 2,49,337 Growth Rate 22.21 23.57 13.00 23.42 28.62 22.17
*total of Fixed capital and Physical working capital. P: Provisional ResultsSource: Annual Survey of Industries, MoSPI
Plan Schemes
Scheme for Infrastructure Development6.12 the creation of integrated and holistic infrastructure is extremely important for the food processing sector. towards achieving this end the Ministry of Food Processing Industries (MoFPI) has been implementing a scheme for the creation of modern enabling infrastructure
that can facilitate the growth of food processing and an integrated cold chain mechanism for handling perishable produce. the MoFPI initiatives include launch of a number of schemes for strengthening infrastructure in agro and food processing sector. this includes Mega Food Parks Scheme, the Scheme for Cold Chain, Value Addition and Preservation Infrastructure and the Scheme for Construction and Modernization of Abattoirs.

122 State of Indian Agriculture
Mega Food Parks Scheme (MFPS)6.13 The Mega Food Parks Schemeaims toaccelerate the growth of the food processing industry in the country by facilitating establishment of strong food processing infrastructure backed byanefficientsupplychain.Underthisscheme,capital grant of 50 percent of the project costis provided in general areas and 75 per cent in difficult&ITDPnotifiedareas(withaceilingofRs50crore).Thegrantisutilizedtowardscreationof common infrastructure in Central Processing Centre (CPC) and Primary processing Centres (PPCs) in the park. Such facilities are expected to complement the processing activities of the units proposed to be set up at the CPC in the Park. EachMegaFoodParktakesabout30-36monthsto be completed.
6.14 Out of 30 Mega Food Parks proposedduringtheeleventhfiveyearplan,theMinistryhas taken up 15 projects under the Scheme so far. Amongthese,finalapprovalhasbeenaccordedto 15 Mega Food Parks in the states of Andhra Pradesh, Punjab, Jharkhand, Assam, West Bengal, Uttarakhand, tamil Nadu, Maharashtra, Gujarat, Uttar Pradesh, Madhya Pradesh, tripura, orissa, Bihar and Karnataka. the total assistance from the government to these projects is estimated at Rs.750crore.Inadditiontothese,15newMegaFood Parks have been recently approved by the Government. the process of selection of 15 newly approved Mega Food Parks is at an advance stage offinalization.
Scheme for Cold Chain, Value Addition and Preservation Infrastructure6.15 the Scheme for Cold Chain, Value Addition, and Preservation Infrastructure was approved in 2008with an objective toprovide integratedand complete cold chain, value addition and preservation infrastructure facilities without any break, for perishables from the farm gate to the consumer. the assistance under the Scheme includesfinancialassistance (grant-in-aid)of50percent of the total cost of plant and machinery and technical civil works in General areas and 75 percent for theNE region and difficultareas subject to amaximum of Rs 10 crore. In
the first phase, the Ministry has approved 10integratedcoldchainprojects in2008-09,whichare already being implemented in different parts of the country. Out of the 10 projects, 9 havestarted commercial operation. Substantive value addition, reduction in wastage and enhancement in farmers’ income is evident from concurrentevaluation of the projects. In the second phase, 28 projectshavebeenapproved.Inthe3rdup scaled plan of the scheme, 25 projects were approved. Further 146 new proposals have been received, which are under evaluations.
Modernization of Abattoirs6.16 The Ministry has approved 10 projectsin first phase which are at various stages ofprogress. two projects have been completed. Aproposal for up-scaling the scheme is underconsideration.
Scheme for Technology Upgradation, Establishment, Modernization of Food Processing Industries6.17 Under the Scheme for technology Upgradation, Establishment, Modernization of Food Processing Industries, financial assistanceisprovided in the formofgrants-in-aid for thesetting up of new food processing units as well as technological Upgradation and Expansion of existing units in the country. the Ministry extends financialassistanceintheformofgrant-in-aidtoentrepreneurs at 25 percent of the cost of Plant & Machinery and technical Civil Works subject to a maximumofRs.50lakhsingeneralareasor33.33percent subject to a maximum of Rs. 75 lakhs in difficult terrains. The implementation processof the Scheme has been made more transparent anddecentralizedfrom2007onwards.Earlierallthe applications for such grants were received by the Ministry through the State Nodal Agencies. these applications were then centrally processed and grants disbursed directly by the Ministry. From 2007-08, the receipt of applications, theirappraisal, calculation of grant eligibility as well as disbursement of funds has been completely decentralized. Under the new procedure, an entrepreneurorapplicantcanfileanapplication
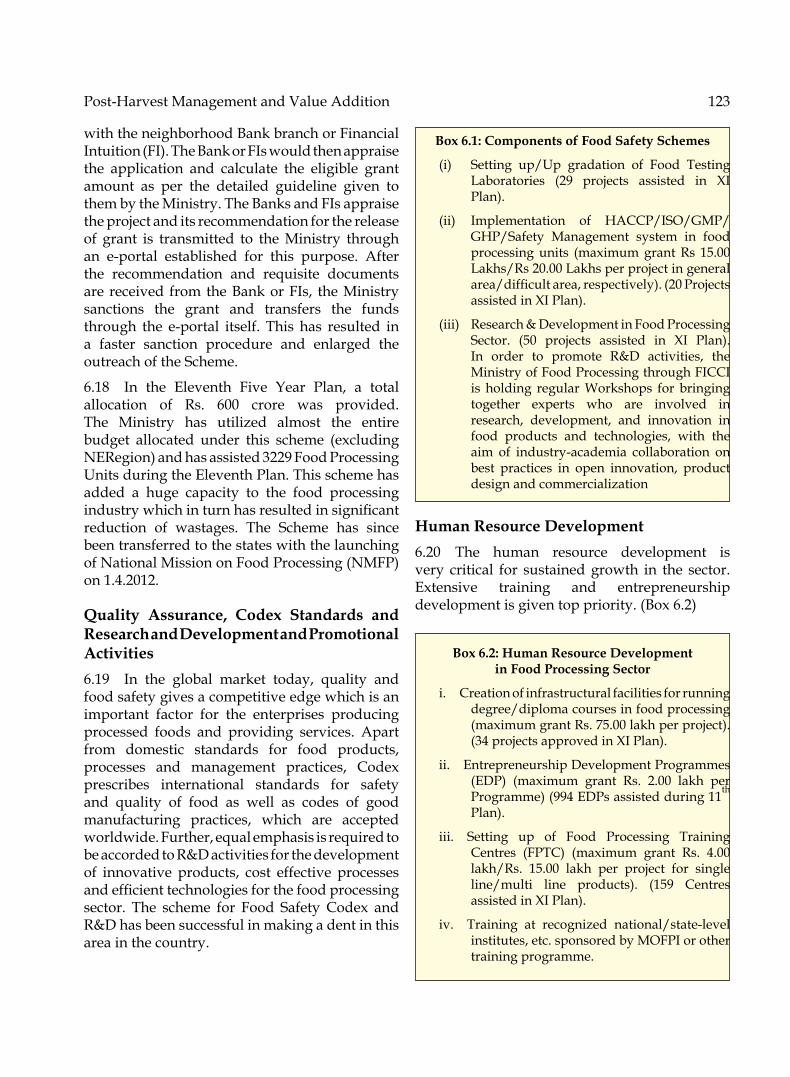
Post-HarvestManagementandValueAddition 123
with the neighborhood Bank branch or Financial Intuition (FI). the Bank or FIs would then appraise the application and calculate the eligible grant amount as per the detailed guideline given to them by the Ministry. the Banks and FIs appraise the project and its recommendation for the release of grant is transmitted to the Ministry through an e-portal established for this purpose. Afterthe recommendation and requisite documents are received from the Bank or FIs, the Ministry sanctions the grant and transfers the funds through the e-portal itself. This has resulted ina faster sanction procedure and enlarged the outreach of the Scheme.
6.18 In the Eleventh Five Year Plan, a total allocation of Rs. 600 crore was provided.the Ministry has utilized almost the entire budget allocated under this scheme (excluding NERegion)andhasassisted3229FoodProcessingUnits during the Eleventh Plan. this scheme has added a huge capacity to the food processing industrywhichinturnhasresultedinsignificantreduction of wastages. the Scheme has since been transferred to the states with the launching of National Mission on Food Processing (NMFP) on1.4.2012.
Quality Assurance, Codex Standards and Research and Development and Promotional Activities6.19 In the global market today, quality and food safety gives a competitive edge which is an important factor for the enterprises producing processed foods and providing services. Apart from domestic standards for food products, processes and management practices, Codex prescribes international standards for safety and quality of food as well as codes of good manufacturing practices, which are accepted worldwide. Further, equal emphasis is required to be accorded to R&D activities for the development of innovative products, cost effective processes andefficienttechnologiesforthefoodprocessingsector. the scheme for Food Safety Codex and R&D has been successful in making a dent in this area in the country.
Box 6.1: Components of Food Safety Schemes
(i) Setting up/Up gradation of Food testing Laboratories (29 projects assisted in XI Plan).
(ii) Implementation of HACCP/ISo/GMP/GHP/Safety Management system in food processingunits (maximumgrantRs 15.00Lakhs/Rs20.00Lakhsperprojectingeneralarea/difficultarea,respectively).(20Projectsassisted in XI Plan).
(iii) Research & Development in Food Processing Sector. (50 projects assisted in XI Plan).In order to promote R&D activities, the Ministry of Food Processing through FICCI is holding regular Workshops for bringing together experts who are involved in research, development, and innovation in food products and technologies, with the aim of industry-academia collaboration onbest practices in open innovation, product design and commercialization
Human Resource Development6.20 The human resource development isvery critical for sustained growth in the sector. Extensive training and entrepreneurship development is given top priority. (Box 6.2)
Box 6.2: Human Resource Development in Food Processing Sector
i. Creation of infrastructural facilities for running degree/diploma courses in food processing (maximumgrantRs.75.00lakhperproject).(34projectsapprovedinXIPlan).
ii. Entrepreneurship Development Programmes (EDP) (maximum grant Rs. 2.00 lakh perProgramme) (994 EDPs assisted during 11th Plan).
iii. Setting up of Food Processing training Centres (FPTC) (maximum grant Rs. 4.00lakh/Rs. 15.00 lakh per project for singleline/multi line products). (159 Centres assisted in XI Plan).
iv. Training at recognized national/state-levelinstitutes, etc. sponsored by MoFPI or other training programme.

124 State of Indian Agriculture
Strengthening of Institutions
Indian Institute of Crop Processing Technology (IICPT) - A National Institute with International Repute6.21 Indian Institute of Crop Processing technology (IICPt) formerly known as Paddy Processing Research Centre (PPRC), thanjavur is an autonomous organization under the administrative control of MoFPI. It has been in existence for the last three decades. As other commodities such as millets, pulses and oil seeds aregainingimportance;itwasdecidedin2001toexpand the mandate of this Institute to include the above commodities also. In the Budget Speech of2006-07, theHon’bleUnionFinanceMinisterannounced the intention of the Government to upgrade PPRC to a National Institute. the institute is being upgraded to a national level institute at a cost of Rs 88.49 crores.
Box 6.3: Achievements of IICPT
• IICPt has created World Class NABL Accredited FoodTestingLaboratoryandHigh-techresearchlaboratories viz. Food Microbiology Laboratory, Food Product & Development Laboratory,Food Packaging & Storage Laboratory and State of the art teaching laboratories
• A Hi-tech, state of the art food processingincubation cum training center with sales outlet has been created. Equipments and machinery are given on rental basis to stake holders.
• the Institute began offering formal degree courses at bachelors, masters and doctoral levelsinfoodprocessengineeringfrom2009-10academicyears.InB.Techprogram40studentsareadmittedeveryyear,10studentsinstudentsin the M. tech program and 5 in the Ph. D programs.
• the Institute has signed MoUs with 12 National and 10 International Institutions so far thatinclude University of Nebraska, Colorado State University, McGill University andIllionois Institute of technology, Chicago.
• Inthelast3+yearIICPTorganized25Nationaland 3 International Seminars/Conferences/Workshops, 25 Food Processing Expos, 276 TrainingPrograms,300+OutreachActivities.
National Meat and Poultry Processing Board (NMPPB)6.22 the Government of India established the National Meat and Poultry Processing Board on 19Feb2009.TheBoardisanautonomousbodyand would initially be funded by the Government of India for 2 years and would be managed by the industry itself. This industry-driven institutionhas been launched to work as a National hub for addressing all key issues related to the Meat and Poultry processing sector for its systematic and proper development. the Board serves as a single window service provider for producers, manufacturers and exporters of meat and meat products, for promoting the meat industry as a whole.
Box 6.4 : Achievements of the NMPPB
• the Board has setup a Food testing Laboratory at New Delhi. the Laboratory is equipped withmodernequipments to carryoutphysio-chemical analysis of food, water and any organic samples.
• TheBoardhassofarconductedover43trainingProgrammeintheyear2010-11and32trainingprogrammes in the year 2011-12 around thecountry to train Butchers, Meat Workers & Supervisors.
• the Board has organized 9 Industry meets viz. at Meerut, Kanpur, Aligarh, Moradabad, Agra, Kochi, Kolkata, Murshidabad and Hyderabad.
• NMPPBhasorganizedfirst, second, thirdandfourth“Mayor’sConference”onJune07,2011,November 02, 2011, January 17-18, 2012, atNew Delhi and on 5th and 6thOctober2012atAhmednagarrespectively. the objective of the Conference is to make the Mayors, Municipal CommissionersandotherGovernmentofficialsaware of the hygienic and safe techniques of production, processing and sale of meat and poultry products for domestic consumption.
Indian Grape Processing Board6.23 The Union Government in 2009 gave itsapproval for the establishment of the Indian Grape Processing Board (IGPB) at Pune, Maharashtra which is close to the principal grape growing and processing areas in the country.
Post-HarvestManagementandValueAddition 125
Box 6.5: Functions and Objectives of the IGPB
• to focus on Research & Development, Extension, and Quality upgradation, market researchand information, domestic and international promotion of Indian wine.
• to foster sustainable development of Indian Wine Industry
• to formulate a vision and action plan for the growth of Indian Wine Sector including research and development for quality upgradation in new technologies/processes.
6.24 During three years of its existence, the Board has focused on the promotion of “Wines of India” in the domestic as well as international market by participating in important and relevant exhibitions, fairs, consumer awareness & training programmes, undertaking advocacy work with the various state governments/central ministries on various issues related to taxes/levies and promotion aspects.
6.25 IGPB is going to implement a traceability programme“wine-net”forstandardsandqualityin wine sector. the board has also successfully conducted its election to the new executive committeeinFebruary2012.
National Institute of Food Technology, Entrepreneurship & Management (NIFTEM)6.26 For developing a vibrant food processing sector, India needs not only world-class foodtechnologists to undertake R&D in frontier areas, develop new products, processes, technologies and machineries, set food standards and protocol testing, but also business leaders & managers well versed with the requisite mix of food technologies, management and entrepreneurship who can exploit major opportunities in the expanding global food trade.
6.27 In the emerging global scenario, there was a need for setting up of an institution of global excellence, which could cater to the needs of the booming food processing sector , various stakeholders such as entrepreneurs, industry, exporters, policy makers, Government and other
research institutions. NIFtEM was conceived by MoFPI to create an international Center of Excellence in thefieldofFoodSciences&Foodtechnology. NIFtEM will grow into an apex world class Institute to promote cooperation and networking among existing institutions both within the country and International bodies. It has been set up to achieve the above objectives. the Institute will offer high quality educational, research and management programme specificto the food industry, provide referral advise on food standards, disseminate knowledge on the food sector and provide business incubation facility.
6.28 On 31st August, 2006 Government hadapproved setting up of NIFtEM at Kundli, Sonipat (Haryana) at a cost of Rs.244.60 crore.NIFTEM has acquired 100 acres of land fromHSIIDCatacostofRs.36.10crore.InApril,2011Government has approved the revision of the cost estimates to Rs.479.94 crore.
Mandate of NIFTEM6.29 NIFtEM would work as Sector Promotion organization of the food processing sector. Major objectives of NIFtEM drawn from its mandate are:
• Workingasa‘OneStopSolutionProvider’to all the problems of the sector.
• Working for Skill Development and Entrepreneurship Development for the sector.
• Facilitating business incubation services with its ultra-modern pilot plant forprocessing of fruits and vegetables, dairy, meat and grain processing.
• Conducting Frontier Area Research for development of the Sector.
• Developing world class managerial talent with advanced knowhow in food science and technology.
• Providing intellectual backing for regulations which will govern food

126 State of Indian Agriculture
safety and quality and at the same time foster innovation.
• Functioning as a knowledge repository in food processing domain such as product information, production and processing technology, market trends, safety and quality standards, management practices among others.
• Working for up gradation of SME food processing clusters.
6.30 NIFTEM has signed an MOU withWageningen University, the Netherlands on 08.11.2011onmutualcooperationinthefieldoffaculty/students exchange programme, research and other subjects of common interest. It has signed an MoU with Kansas State University, USAon29.08.2012onmutualcooperationinthefield of faculty/students exchange Programme,research and other subjects of common interest. So far NIFtEM has conducted 19 Short term TrainingProgrammesfromJuly,2011toOctober,2012.Theprocessofconductingsuchshorttermprogrammes is on. the Institute has commenced first academic session with B. Tech. (Foodtechnology & Management) and M. tech. (Food Technology&Management)w.e.f.16.08.2012.
National Mission on Food Processing (NMFP)6.31 India enjoys a competitive advantage inFood Processing sector given its huge production base of a number of agricultural, dairy, fishingand horticultural items. to ensure that this sector gets the stimulus it deserves, Ministry of Food Processing Industries (MoFPI)has been implementing a number of schemes for Infrastructure development, technology up-gradation & modernization, human resources development and R&D in the Food Processing Sector. In the context of the 12th Five Year Plan, it is felt that there is a need to decentralise the implementation of schemes through involvement of the states/Uts for better outreach, supervision, monitoring and ensuring job
creation. Accordingly, National Mission on Food Processing(NMFP) was launched as a centrally sponsored scheme on 1stApril,2012.
6.32 Besides continuing existing components/schemes such as Technology Up-gradation/Establishment/Modernisation of Food Processing Industries, Cold Chain, Value Addition and Preservation Infrastructure for Non-Horticultural Products, Modernizationof Abattoirs, Human Resource Development (HRD), Creation of Infrastructure Facilities for RunningDegree/Diploma/CertificateCoursesinFood Processing technology, Entrepreneurship Development Program (EDP), Food Processing training Centre (FPtC), Promotional Activities, organizing Seminar/Workshops, Conducting Studies/Surveys, Support to Exhibitions/Fairs, Advertisement & Publicity etc., the new Components/Schemes proposed during the 12th Plan are Creating Primary Processing Centres/Collection Centres in Rural Areas, Modernization of Meat Shops and Reefer vans.
Funding Pattern6.33 NMFPisimplementedasanewcentrallysponsoredschemewithfinancialcontributionofGovernment of India and States/Uts in the ratio of 75:25, except for North Eastern States, where the ratio is 90:10. Further, inUTs administeredby Government of India it is funded 100% byGovernment of India. this funding pattern is applicable to all components of the scheme.
6.34 The NMFP contemplates establishmentof a National Mission as well as corresponding Missions in the State and District level. the proposedstructurewouldbeathree-tierstructureat National, State and District levels. However, States would be at freedom to have mission structure at District levels or otherwise. Funds are to be transferred to the State Governments for implementation of the schemes through the State Missions. State Governments would be given flexibilitysothattheschemescanbetailoredtothe different requirements of different regions in the country.

Post-HarvestManagementandValueAddition 127
Challenges6.35 The most important challenges amongothers in the sector include avoidance of the significantwastage at every level and in valueaddition.Highfoodinflation,highpost-harvestwastage particularly in fruits and vegetables, low level of processing etc are the main challenges in the food processing sector. Addressing these core concerns by reducing wastage of food, increasing shelf life and enhancing value of agricultural produce are some of the objectives of the food processing industry. In terms of employment, the contribution of the sector is significant.According to the latest Annual Survey of Industries(ASI)for2010-11(ProvisionalResults),the total number of persons employed in the food processing sector was about 16.75 lakhs.the National Manufacturing Policy announced on 4th November 2011 seeks to give specialattention to food processing industries to ensure job creation. to promote industrial growth along with the objective of inclusive growth the food processing sector will get higher attention from the Government.
The Way Forward6.36 MoFPI incurred an expenditure ofRs 1596 crore on infrastructure and related projects during XI plan which comes to around Rs 319 crore per annum. Given the need forwastage reduction, value addition and the high employment potential of the sector, there is a need to substantially step up the allocations given the importance of the sector in terms of its contribution to the economy. there is also a need for greater involvement of state governments for better outreach, supervision and monitoring. Keeping this in view, government has already launched centrally sponsored National Mission onFoodProcessingon1.4.2012.Thereisaneedfor greater emphasis on creation of infrastructure with full participation of state governments and private sector. the main infrastructure schemes are for setting up Food Parks and Cold Chains are at present closed ended. this should be open ended permitting the Ministry to fund all the viable projects proposals received under these schemes rather than limiting the number of projects.

CHAPtER 7
Agricultural Research and Education
Natural Resource Management7.1 the Indian Council of Agricultural Research is engaged in developing technologies for conservation, management and sustainable utilization of the natural resources to ensure food, nutritional and environmental security in the country. the research programmes are being carried out within the perspective of different themes, viz; Soil Inventory and Characterization, Soil-Water-Nutrient Management, WatershedManagement, Resource Conservation technologies, Cropping/farming System, Agroforestry including Bio fuel Crops and Climate Change on agriculture. Several location specificcosteffectiveNRMtechnologies(suitingsoilandclimate)likecropdiversification,resourceconservation technologies (zero tillage, bed planting, laser leveling, SRI), soil reclamation/amelioration measures, integrated soil-water-nutrient management, water harvesting and conservation, participatory watershed models, micro irrigation, integrated farming system and agroforestry models etc have been developed to boost agricultural production and productivity in the country.
7.2 Extension activities based on NRM technologies are being popularized among the farmers throughout the country through IVLP programme, KVKs, State extension agencies etc. Also conducting Front Line Demonstrations (FLDs) on relevant technologies, imparting trainings to farmers, Subject Matter Specialists of Krishi Vigyan Kendras (KVKs), State Line Departments/NGos etc.; publishing popular articles and technical bulletins in local languages and organizing regional workshops etc.
7.3 Several NRM technologies like waterharvesting and recycling, construction/renovation of water bodies, watershed management, agroforestry/afforestation, vermicomposting/enriched composting etc, are being taken up under MGNREGA for generation of rural livelihoods through creation of employment
generation. An extensive programme on ‘More crop and income per drop of water “ under central scheme on ‘Participatory Action Research Programme’ (FPRAP) funded by Ministry ofWater Resources in participatory mode was under operation for the conservation and better utilization of rain water in rainfed areas. During 1stphase(2009-11),thetechnologiesforimprovingwater use efficiency were demonstrated in 7districts (Balangir, Kalahandi, Sonepur, Boudh, Ganjam, Jagatsingpur, Kendrapara) of odisha on478farmers’fieldscovering160haareaandduring second phase (2011-12) in 5 districts(Balasore, Mayurbhanj, Dhenkanal, Puri and Khurda)at100locationscovering5agro-climaticzones in Odisha. Also organised 22 one-dayfarmers’ trainings (2040 farmers) during 2009-2012. A special programme on scaling up ofwater productivity in Agriculture for livelihood through teaching cum demonstration has also beentakenupduringXIPlanperiodand101724farmers and 5824 trainers were trained all over the country.
7.4 the Council is strengthening its mechanisms of agro-advisories by setting up of AutomaticWeatherStations(AWS)inKVKslocatedin100vulnerable districts under National Initiative on Climate Resilient Agriculture (NICRA). Yet another150AWShasbeenplannedfortheXIIPlan.the ICAR is preparing district level contingency plans (300 districts completed) to provide anaction plan to the states in event of extreme climaticeventslikedrought,floods,heat&coldwave. During 2011-12, 67 farmers’ awarenessprogrammeand41trainers’trainingprogrammehave been organized under NICRA. A District Level Atlas of Climate Change Vulnerability for the entire country for prioritizing investments in R&D during XII Plan for climate resilient agriculturehavebeenfinalized.
7.5 to address future challenges, sustainable management of natural resources is vital as agricultural development with positive growth

Agricultural Research and Education 129
and long term sustainability cannot thrive on a deteriorating natural resource base. Confronted with widespread land degradation, ground water imbalances, impaired soil health and contamination of food and environmental pollution etc., the situation is getting further compounded with the recent climate change impacts on agriculture. to have a holistic solution to these emerging problems, the ICAR has set priority research on abiotic stress management (droughts,coldwaves,floods,salinity,alkalinity,acidity and nutritional disorders etc), climate resilient agriculture, conservation agriculture including organic farming, bio-industrialwatersheds, solid waste management, utilization of waste/poor quality water and applications of nanotechnology to enhance nutrient and water use efficiency and development of bio-censorsfor soil quality assessment etc.
Challenges7.6 Land Degradation: Major problems are loss of fertile soil and siltation of reservoirs and rivers. Challenges lie in rehabilitation of degraded land. ICAR institutes involved in research on the above are CSWCRtI, Lucknow, CAZRI, Jodhpur, NBSSLUP, Nagpur and NRCAF Jhansi.
7.7 Deterioration of Soil Health: Emergence of multi-nutrient deficiencies, low nutrient useefficienciesandnutrient response ratiosare themajor problems which can be resolved through enhancement of higher soil and crop productivity. IISS, Bhopal including AICRPs on StCR, MSN, LtFE and Network on Biofertilizers are involved in countering this challenge.
7.8 Low farm productivity & Profitability of Small Land Holdings: Resource poor farmers with lack of irrigation facilities, low input use efficienciesareencouragedtoimplementmethodsfor developing IFS for Enhancing productivity, profitabilityandlivelihoodforsmall&marginalfarmers. PDFSR, Modipuram; ICAR- RCNEH,Barapani; ICAR- RCGOA; ICAR RCER Patna;CRIDA Hyderabad; CAZRI Jodhpur, ICAR RC Goa, NRCAF Jhansi, AICRP on IFS and Network on organic farming are engaged in this endeavor.
7.9 Low Water Productivity: challenges of low water use and irrigation efficiency, decline inwater table, secondary salinization, contamination of ground water are met by augmenting water productivity through IWM, ground water recharge, multiple use of water and use of poor quality water. DWM, Bhubaneswar including AICRPs on Water Management and Ground water utilization, CSSRI, Karnal, ICAR RCER Patna; Project on Scaling up of water productivity are involved in research in this area..
7.10 Productivity of Rainfed/Dryland Agriculture: High risk farming due to low and erratic rainfall, resource degradation are mitigated through enhancing productivity through alternate agriculture, supplementary irrigation, judicious use of various inputs and stress tolerant cultivars. CRIDA Hyderabad, includingAICRPsonAgro-metrology,Drylandfarming, CAZRI Jodhpur, NRCAF Jhansi including AICRP on Agroforestry, CAZRI Jodhpur are the major centres involved in this research aspect.
7.11 Declining Factor Productivity of Intensive Agriculture: Indiscriminate and imbalance use of inputs are countered by sustaining higher agriculture productivity through conservation agriculture. PDFSR, Modipuram and DWSR Jabalpur are addressing this challenge.
7.12 Impact of Climate Change on Agriculture: Untimely/delayed rainfall, heat & cold waves, cyclone, tsunami and other forces of nature are creating increasing challenges for existent agricultural practices. the way towards meeting these challenges by developing appropriate technologies for climate resilient agriculture are undertakenthroughContingentPlansandAgro-advisories by CRIDA Hyderabad and NICRA project.
7.13 Abiotic Stresses: Droughts, water logging, salinity, alkalinity, acidity and nutritional disorders etc are being addressed by developing viable technologies for abiotic stress management. At the new institute NIASM Baramati, CSSRI Karnal and CRIDA Hyderabad.

130 State of Indian Agriculture
Box 7.1: Multiple use of water for increasing water productivity – a Case study
Multiple use of water in the water harvesting structuresintermsofpiscicultureinthepond,on-dyke horticulture, vegetable cultivation, poultry farming and honey bee culture on participatory basis in Dhenkanal district of orissa showed positive impact on rural livelihood. the yield of paddy within the command area was enhanced by120%incomparisonto2.2Mg/haoutsidethecommandarea.Thebenefitcostratioofthesystemwas 1.52 and overall water productivity of the systemwasenhancedby136%over the farmers’practicesof3.3Rs/m3 water.
Multiple use of water in water harvesting structure
Box 7.2: Rapeseed mustard in rice fallow in Manipur - A success story
CroppingintensityofRice-fallowsysteminManipurcould be increased by introducing zero till rapeseed cultivation (M-27) in rabi using residual soilmoisture.During2009-2010,atotalareaof40hawascovered under zero tillage rapeseed cultivation by 100farmfamiliesfollowedby165farmfamiliesin65haduring2010-2011,yielding7.1to10.80q/ha.
Rapeseed mustard in rice fallow in Manipur
Crop Science7.14 the All India Coordinated Research Projects and various institutes of the ICAR strived to develop new crop varieties which had specifictraitsthatimproveyieldandnutritionalquality and form part of the food security mission of the country. these crop varieties along with crop production technology for their cultivation had inherent tolerance to various key pests and diseases. the tolerance to drought, salinity and acidity/alkalinity of soils was also imparted in many of them.
Crop Variety Development7.15 Five wheat varieties, viz., Pusa Suketi (HS507)fortimelysown,irrigatedandrainfedcondition of Northern Hills Zone, Pusa Prachi (HI 1563) for high fertility, irrigated, late sownconditions of North Eastern Plains Zone (Eastern U.P., Bihar, Jharkhand, plains of West Bengal and North-EasternStates),Pusa Gaurav (HI 8691) for high fertility, irrigated, timely sown conditions of Madhya Pradesh, Pusa Basant (HD 2985) for cultivation under late and very late sown conditions of North Eastern Plains Zone (NEPZ), Pusa Bahar (HD 2967) for cultivation under conditions of rainfed and restricted irrigation in Peninsular Zone (PZ) and HD 3043 for restricted irrigated conditions of North Western Plains Zone (NWPZ)havebeenreleasedandnotifiedduring2012.Theirseedmultiplicationandbreedersseedproduction of these six varieties are taken up.
7.16 Single cross maize hybrid 17l with yellow, semi-dent grain with 21.93% for cultivation inZone-I(Uttarakhand,HimachalPradesh,Jammu& Kashmir and North Eastern Hill region) was released. Vivek Maize Hybrid 39, single cross, extra-early (85-90 days) for cultivationin Uttarakhand, Himachal Pradesh, Jammu & Kashmir and North Eastern Hill region with yellow, semi-flint grain; Vivek Maize Hybrid 43, extra-early maturing (85-90 days), easternUttar Pradesh and eastern states and in Central WesternIndiahavebeennotifiedforcultivation.
7.17 Improvement of the elite Basmati was continued to attain specific characteristics thatare in global demand.

AgriculturalResearchandEducation 131
7.18 Moderately wilt resistant Pusa 5023 Kabuli Chickpea,earlymaturing(135-140days)varietyfor Delhi state and NCR region extra bold seeded (50g for100seeds),yield2.5 t/ha,highproteinand good hydration capacity and thus easy to cook; moderately wilt resistant Pusa 5028, for DelhistateandNCRregion,firstdesi extra bold variety(41gfor100seed),yieldof2.7t/ha,earlymaturing variety (135-140 days), large brownbold seeds having high protein content and is fast to cook with faster hydration capacity.
7.19 VL Masoor 514, moderately resistant to wilt and rust diseases, for rainfed hills of Uttarakhand, bold seeded (100 seed weight3.05g),brownseedcoatwithminutespotsandgloboseflatseeded21.13%proteincontent.VL Masoor 133 Small seeded variety of lentil having 22.28% higher yield over VLMasoor 125 and27.12% over PL 05 over three years of testingin Uttarakhand hills under organic conditions. It has 24.06% protein content, andwas foundresistant to wilt and moderately rust diseases.
7.20 High-yielding medium-tall field peavariety, VL Matar 47with142-155daysmaturity,for timely sown rainfed areas of Uttarakhand hills with 21.04% protein content and resistantto powdery mildew and moderately resistant to rust diseases. Vivek Matar 11, the garden pea variety, attractive long green curved pods with high number of sweet and bold seeds per pod and highly resistant to powdery mildew, 132-155 days maturity, suitable for cultivation in Uttarakhand hills and also for Himachal Pradesh and Jammu & Kashmir.
7.21 Mustard varieties such as Pusa Mustard 26 (NPJ113)withanyieldof 1.6 t/ha,matures in126days,37.6%oilinseedsandistoleranttohightemperatures and salinity; for multiple cropping systems particularly in rice and cotton belts of Eastern UP and Eastern states of the country and Central Western India; Pusa Mustard 27 (EJ 17) matures in 118 dayswith seed yield of 1.53 t/lha and 41.7% oil, moderately tolerant to hightemperatures at seedling as well as maturity stage. It is suitable for multiple cropping systems and can successfully fit in between the harvestof kharif crops and sowing of wheat, vegetables
and sugarcane. It is a good substitute for toria crop. Pusa Mustard 28(NPJ-124)maturesin107days, yield 1.99 t/ha, 41.5% oil and possesseshigh temperature tolerance at seedling and grain filling stage. It fits well in multiple croppingsystems.Theworkon ‘00’ lines inBrassica and low glucosinolate content is in progress.
7.22 A total of 36 national explorations wereundertaken in 15 states and 2,713 accessions,including570ofwildspecies,werecollected.Inthe National Herbarium of Cultivated Plants, 321 herbarium specimenswere added,makingspecimens’holdingstotalto20,560.Germplasmforlong-termstoragetotheNationalGenebankcomprised4,302accessionsoftheorthodoxseed-species,24cryo-storednon-orthodoxspecies,and29 added to in- vitroGenebank.Atotalof10,334accessions were characterized and evaluated. Two high-protein rice cultivars (crude grainproteincontent,15-16.41%),ARC10063andARC10075, identified from the stock of Asom RiceCollections of the CRRI Rice Gene Bank have been found to have an additional slow moving globulin band. three glutelin bands are highly expressed in the high protein cultivars. they showed higher activity of Nitrate Reductase (NR) and Glutamic Dehydrogenase (GDH) at seedling(one-week-old)andmaximumtilleringstages (three-week-old). Forty-one clones ofSaccharum spontaneum, Erianthus rufipilus, E. elephantinus and E. arundinaceus were collected from West Bengal. S. spontaneum clones were assembled from different habitats and also from many morphotypes, excepting very tall types. S. spontaneum accession IND101568collected fromthehillslopeat1,270mslnearKurseongiswiththick cane and broad leaves.
7.23 Microbial Genomic Resource Repositorypossessesatotalof1,231genomicDNAisolatesfrom bacterial, fungal, cyanobacterial and actinomycetes cultures; 64 different cloning, gene-silencing, Expression vectors and 92 genesequences. In addition to this, 188 environmental samples, 6720 clones from genomic library ofMesorhizobium cicero Ca 181 strain and different strains of E. coli competent cells( DH5a, XL1 Blue, JM107,JM109)andAgrobacterium spp. have been preserved.

132 State of Indian Agriculture
7.24 During the current year, 623 tonnes ofnucleusseed,13038tonnesofbreederseed,10120tonneoffoundationseed,13084tonnesofcertifiedseed and 25141 tonnes of truthfully labelled seeds were produced. Under the participatory seed production programme 142 tons of quality seed of different wheat varieties were produced. Besides,5240tons,396lakhsofplantingmaterialand0.38lakhoftissuecultureplantsoffieldcropswere produced. the hybrid seed production technology for the first-ever Indian mustardhybrid NRC Sankar Sarson (NRCHB 506) hasbeen standardized and seed yield of 2.4tonnes/ha could be produced.
7.25 Many invasive pest species were a threat to the country. Preparedness for the invasion of Ug99 strain of black rust of wheat is complete by introducing resistant genes into all the cultivated wheat varieties for north-western plain zonein addition to that in peninsular zone. Yellow rust monitoring and management could reduce its impact, in spite of its presence in certain pockets. Cotton leaf roll dwarf virus (CLRDV) of Luteovirideaefamilywasidentifiedforthefirsttime in Haryana and parts of Punjab. Eucalyptus gall wasp, Leptocybe invasa was accidentally introduced into India, and is a serious pest on eucalyptus, threatening Indian paper industry. Parasitoids Quadrastichus mendeli and Selitrichodes kryceri (Eulophidae: Hymenoptera) were imported from Israel for its biocontrol. Q. mendeli could be established in all released areas of eucalyptus plantations in Karnataka, Andhra Pradesh, odisha, Gujarat, Haryana and Punjab. the mitigation of Papaya mealy bug invasion using the introduced exotic insect parasitoids as well as those native ones have come up in huge populationduetoconservationofagri-biodiversitywas complete in all the seven affected states. the impact of utilization of the exotic parasitoids of Papaya mealy bug in the last two years, makingthenationtosaveaboutRs1500croresby avoiding severe crop loss due to this invasive pest. Accelerate pulse production programme of the government was ably supported by effective surveillance and electronic reporting so as to contain them at initiation itself.. Integrated pest
management using new generation chemical synthetic pesticides along with biological control agents (insects, nematodes, microbial pathogens and antagonists) have provided support to the nation in achieving the targeted food and commodity production.
7.26 National Institute on Biotic Stress Management at Raipur, Chhattisgarh and Indian Institute of Agricultural Biotechnology at Ranchi, Jharkhand are approved by the government the plan and would be launched during this plan period.
7.27 A winnower cum grader for threshed paddy crop has been designed and fabricated and mounted on castor wheels to make it movable. Provision has been made for control of feed rate andair-flowdependingontheimpuritylevelinthe harvested crop, so as to improve its cleaning efficiency.Itsperformancehasbeestandardised.
7.28 A seed drill for sowing berseem seeds was developedusingfineflutedrollerformeteringofberseem seeds. Spring loaded tines were used to open furrow for sowing the seeds. the seed rate for berseem seed was variable in the range of 4 to 30kg/ha.Depthofsowingwascontrolledbythehydraulic device of the tractor.
7.29 Small sized manually operated cotton planter was developed for planting cotton seed and an adjustable cultivator was designed and developed for intercultural operation for narrow spaced cotton crop and a fertilizer applicator has beenmodifiedforequaldistributionoffertilizerfrom both tubes. Field efficiency of manuallyoperatedsmallhandpickervariedfrom56%to100%ofthehumanlabour.
7.30 Inordertomechanizethislabourintensiveoperation, a tractor operated paired row sugarcane cutter planter was designed and developed at Indian Institute of Sugarcane Research. With the help of this equipment, all the operations involved in cane planting were accomplished in a single pass of the equipment. the novel feature of the newly developed planter is its sett cutting mechanism. this mechanism facilitates free fall of the cut setts without gaps.

AgriculturalResearchandEducation 133
7.31 Irrigationschedulingisoneoftheactivitiesthat aim at effective and efficient utilization ofwater. In most of the farmers’ fields in India,irrigation scheduling based on soil moisture is not in practice. A simple and farmer-friendlyelectronicsoilmoisture-indicatinggadgetwhichhasbeennamedas‘SoilMoistureIndicator(SMI)’is developed.
7.32 Research for tribal and hill region catersto the agricultural research needs of the north-western Himalayan states of Uttarakhand, Himachal Pradesh and Jammu & Kashmir. Cold tolerant phosphate solubilizing bacteria Rt5RP2 and Rt6RP were isolated from rhizoplane of wild grass grown at 3100 & 3800 msl, respectively.Eight cold tolerant bacterial strains have been selected among the twelve elite strains for the development of eight bacterial consortia were developed.
7.33 Two patents, an improved process forthe enrichment of babchi drug from seeds of Psoralea corylifolia, and the other process enabling simultaneous detection of transgene 5-enol pyruvylshikimate-3-phosphate synthase(cp4epsps)geneandCaMV35Spromoterinmaizeutilizing novel primers in multiplex PCR, have been granted.
Challenges
Efficiency of Natural Resource Utilization for Optimized Cost of Production7.34 Responsive crop varieties to enhanceresourceutilizationefficiencyisthemajoroptionfor reducing cost of cultivation. Indigenous on farm resources along with application of soil-test based nutrients are required to support the optimized production from such crop cultivars. the production technologies of all newly releasedandnotifiedcropvarietiesaredirectedin this manner. Crop productivity is challenged by the need for quality agricultural inputs such as seeds, fertilizers and other agrochemicals. the states have to ensure the availability of quality agrochemicalinputsforvariousagro-ecologiessoas to increase crop productivity. Soils of various
crop ecologies are analysed for all major, minor, secondary and micronutrients and crop varieties are grown in these to assess their demand as well as potential to yield higher than existing varieties.
Enhanced Plant Protection Tools and Techniques for Prevention of Crop Loss7.35 RNAi technologies for management ofvarious crop diseases including nematodes, molecular-marker assisted detection of cropresistant genes against key pests (insect/mites/diseases/nematodes etc.), exploitation of conserved agro-biodiversity to enhance food-chain linked pest suppression strategies, classical biological control by introduction of exotic natural enemies to suppress invasive pests as well as inundative biological control to reduce pests in crops are
Post-harvest Management of Commodities Including Fodder7.36 Securingofthehighcropproductivitybyefficient post-harvest storage of commoditiesand processed products of food and fodder crops is to be major priority. the ICAR has taken up research in this direction in their crop institutes.
New Initiatives7.37 The government has approved theestablishment of i) National Institute for Biotic Stress Management at Raipur (Chhattisgarh) and ii) Indian Institute for Agricultural Biotechnology at Ranchi (Jharkhand). these are being taken up in XII Plan period.
Multitier Rice-Fish–Horticulture based Farming System in Odisha7.38 The Central Rice Research Institute,Cuttack, odisha, has developed a viable multitier rice-fish–horticulture based farming systemmodel of about 0.8 ha area for enhancing farmproductivity and income in substantial part of4millionhaofdeepwaterareas (50-100cm,maximum150cm,ofwaterdepth)inthecountry,
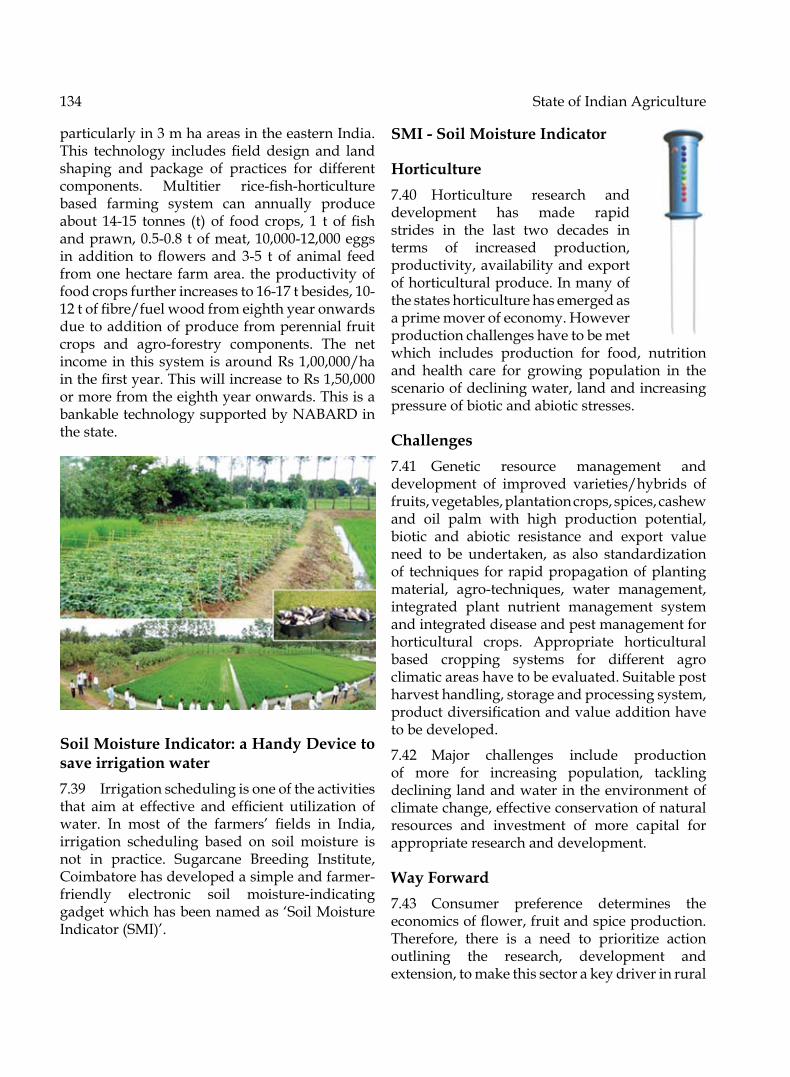
134 State of Indian Agriculture
particularlyin3mhaareasintheeasternIndia.This technology includes field design and landshaping and package of practices for different components. Multitier rice-fish-horticulturebased farming system can annually produce about 14-15 tonnes (t) of food crops, 1 t offishandprawn,0.5-0.8tofmeat,10,000-12,000eggsin addition to flowers and 3-5 t of animal feedfrom one hectare farm area. the productivity of foodcropsfurtherincreasesto16-17tbesides,10-12toffibre/fuelwoodfromeighthyearonwardsdue to addition of produce from perennial fruit crops and agro-forestry components. The netincome in thissystemisaroundRs1,00,000/hainthefirstyear.ThiswillincreasetoRs1,50,000or more from the eighth year onwards. this is a bankable technology supported by NABARD in the state.
Soil Moisture Indicator: a Handy Device to save irrigation water7.39 Irrigationschedulingisoneoftheactivitiesthat aim at effective and efficient utilization ofwater. In most of the farmers’ fields in India,irrigation scheduling based on soil moisture is not in practice. Sugarcane Breeding Institute, Coimbatorehasdevelopedasimpleandfarmer-friendly electronic soil moisture-indicatinggadget which has been named as ‘Soil Moisture Indicator(SMI)’.
SMI - Soil Moisture Indicator
Horticulture7.40 Horticulture research and development has made rapid strides in the last two decades in terms of increased production, productivity, availability and export of horticultural produce. In many of the states horticulture has emerged as a prime mover of economy. However production challenges have to be met which includes production for food, nutrition and health care for growing population in the scenario of declining water, land and increasing pressure of biotic and abiotic stresses.
Challenges7.41 Genetic resource management and development of improved varieties/hybrids of fruits, vegetables, plantation crops, spices, cashew and oil palm with high production potential, biotic and abiotic resistance and export value need to be undertaken, as also standardization of techniques for rapid propagation of planting material, agro-techniques, water management,integrated plant nutrient management system and integrated disease and pest management for horticultural crops. Appropriate horticultural based cropping systems for different agro climatic areas have to be evaluated. Suitable post harvest handling, storage and processing system, productdiversificationandvalueadditionhaveto be developed.
7.42 Major challenges include production of more for increasing population, tackling declining land and water in the environment of climate change, effective conservation of natural resources and investment of more capital for appropriate research and development.
Way Forward7.43 Consumer preference determines theeconomicsofflower,fruitandspiceproduction.therefore, there is a need to prioritize action outlining the research, development and extension, to make this sector a key driver in rural

AgriculturalResearchandEducation 135
and regional economic development. Demand for high value produce is growing both in domestic and overseas market at the same time, competition is also increasing. New changes in retailing participation of corporate sector means that retailing will depend upon strategic alliance and supply chain management. Strengthened research on impact assessment of climate change on horticultural crops using controlled environmental facilities and simulation models, analysis of past weather data and integration with productivity changes (including extreme events) is essential. Production, demand and supply of commodities, economics and trade, sensitive stages and process during crop development, diversity and dynamics of major insects, microbes andpathogens,intensificationofstudiesonpest,disease and weather relationships etc is required. therefore, sustainability will depend upon improving competitiveness, reducing impact on environment, quality assurance and food safety and capability of communities engaged in this sector to manage change.
Animal Science
Animal Genetic Resource Management
7.44 Whole-genomemapping of Indianwaterbuffalo (Bubalus bubalis) was carried out and assemblywithmorethan90GBDNAsequencedata generated. 6 new breeds viz. four cattle breeds (Binjharpuri, Ghumsuri, Khariar Motu cattle) and two of buffalo breeds (Banni, Chilka buffalo) were registered . Phenotypic characterization and evaluation of hill cattle as well as Bundelkhandi goat and goats of Uttrakhand was completed so also for Spiti donkey. Genotypic characterization of Indian horse breeds and phylogenetic tree were prepared. the microsatellite genotyping of 50individualsineachoftheBikaneri,Jaisalmeri,Kachchhi and Mewari breed was carried out and phylogenetic tree constructed.
7.45 A heat shock protein of 70 kDa (HSP70)was detected in lymphocytes of control and heat exposed broiler birds and four new proteins with molecular weight of 35, 55, 173, 189 kDa werefound in heat exposed broiler birds. National FMD Virus Repository was upgraded with latest/new
virus isolates and a total of 25 virus isolates were added to the repository. At present the National FMD virus Repository holds a total of 1712 isolates (O-1102,A-276,C-15andAsia1-319).
Animal Production
7.46 Indian Livestock Feed Portal having sequential information on livestock feeds and feeding to serve single window reference was developed. In vitro studies revealed that IGF-Iimproves progesterone production from luteal cells, thus improving embryonic survivability. Using longer wavelength lights (red spectrum) than incandescent lighting was found to improve egg production in commercial layer flocks byabout 6.33%. Supplementation of protectedfat to high yielding dairy cows improved milk yield(19.0litvs17.8lit/cow/day),reproductiveefficiency and was found to be economical tofarmers. Areca sheath can be considered an alternate source of dry fodder for livestock. Improved varieties of ducks for egg purpose, integrating with aquaculture in farmers’ pondand community ponds were introduced. Dietary supplementation of a combination of organic chromium (chromium picolinate) 1 mg/kg and Spirulina 2 g/kg was found effective in reducing eggcholesterolcontentbyabout20%.Collectionof semen from male ducks was standardized. Hen housed egg production increased up to 72 wks of age in IWN and IWP layers strains and wasfoundtobe309.63and297eggs,respectively.Outofthefournewheavycrosses(HC-1,HC-2,HC-3and HC-4) developed utilizing rural andbroilergermplasm,theHC-3andHC-4weighed1000and1100g,respectivelyat7wksofageandcrossed 2kg at 12 wks of age, which seemed to be promisingforbackyardpoultry.Qualityproteinmaize-basedlayerdietproduced3.3%highereggproduction and recorded 4.9% improvement infeed conversion compared to normal maize in White Leghorn layer chicken.
Animal Health
7.47 LoopAssistedAmplification(LAMP)wasdeveloped for detection of FMD and Pasteurella multocida. PCR for amplification of OMP 31of Brucella using self designed primers was
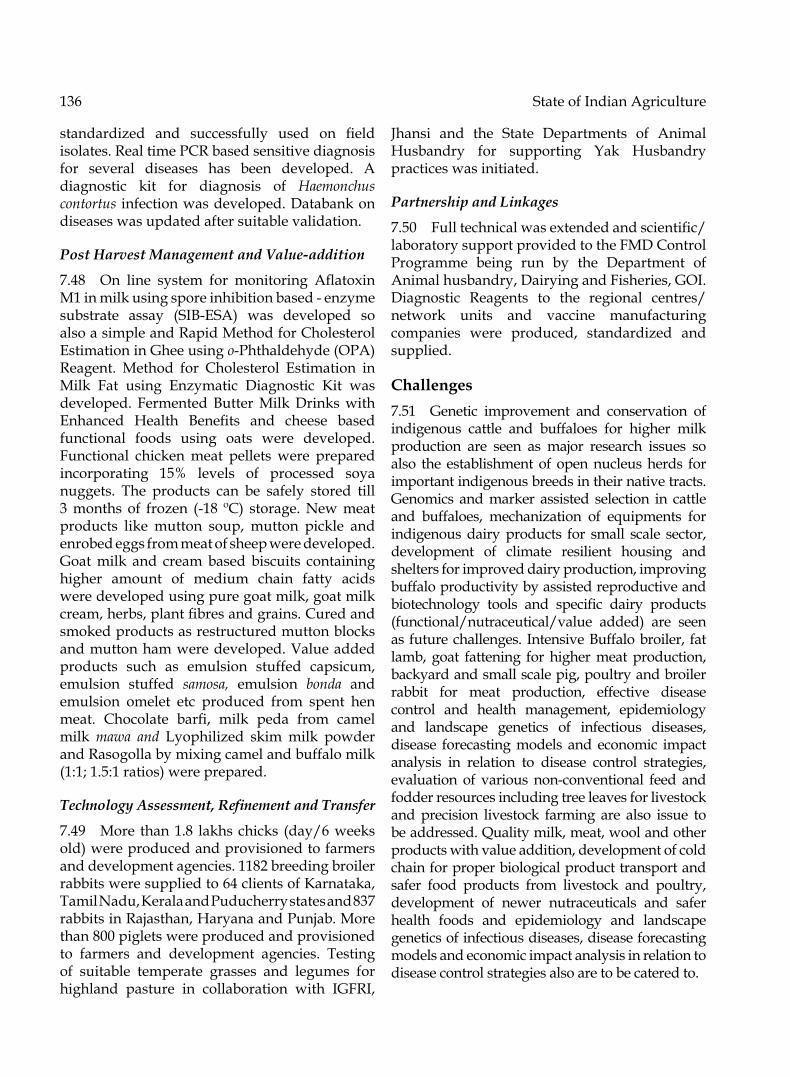
136 State of Indian Agriculture
standardized and successfully used on fieldisolates. Real time PCR based sensitive diagnosis for several diseases has been developed. A diagnostic kit for diagnosis of Haemonchus contortus infection was developed. Databank on diseases was updated after suitable validation.
Post Harvest Management and Value-addition
7.48 On line system for monitoring AflatoxinM1inmilkusingsporeinhibitionbased-enzymesubstrate assay (SIB-ESA) was developed soalso a simple and Rapid Method for Cholesterol Estimation in Ghee using o-Phthaldehyde(OPA)Reagent. Method for Cholesterol Estimation in Milk Fat using Enzymatic Diagnostic Kit was developed. Fermented Butter Milk Drinks with Enhanced Health Benefits and cheese basedfunctional foods using oats were developed. Functional chicken meat pellets were prepared incorporating 15% levels of processed soyanuggets. the products can be safely stored till 3months of frozen (-18 ºC) storage.Newmeatproducts like mutton soup, mutton pickle and enrobed eggs from meat of sheep were developed. Goat milk and cream based biscuits containing higher amount of medium chain fatty acids were developed using pure goat milk, goat milk cream,herbs,plantfibresandgrains.Curedandsmoked products as restructured mutton blocks and mutton ham were developed. Value added products such as emulsion stuffed capsicum, emulsion stuffed samosa, emulsion bonda and emulsion omelet etc produced from spent hen meat. Chocolate barfi, milk peda from camel milk mawa and Lyophilized skim milk powder and Rasogolla by mixing camel and buffalo milk (1:1; 1.5:1 ratios) were prepared.
Technology Assessment, Refinement and Transfer
7.49 More than 1.8 lakhs chicks (day/6 weeks old) were produced and provisioned to farmers and development agencies. 1182 breeding broiler rabbits were supplied to 64 clients of Karnataka, TamilNadu,KeralaandPuducherrystatesand837rabbits in Rajasthan, Haryana and Punjab. More than800pigletswereproducedandprovisionedto farmers and development agencies. testing of suitable temperate grasses and legumes for highland pasture in collaboration with IGFRI,
Jhansi and the State Departments of Animal Husbandry for supporting Yak Husbandry practices was initiated.
Partnership and Linkages
7.50 Fulltechnicalwasextendedandscientific/laboratory support provided to the FMD Control Programme being run by the Department of Animal husbandry, Dairying and Fisheries, GoI. Diagnostic Reagents to the regional centres/network units and vaccine manufacturing companies were produced, standardized and supplied.
Challenges7.51 Genetic improvement and conservation of indigenous cattle and buffaloes for higher milk production are seen as major research issues so also the establishment of open nucleus herds for important indigenous breeds in their native tracts. Genomics and marker assisted selection in cattle and buffaloes, mechanization of equipments for indigenous dairy products for small scale sector, development of climate resilient housing and shelters for improved dairy production, improving buffalo productivity by assisted reproductive and biotechnology tools and specific dairy products(functional/nutraceutical/value added) are seen as future challenges. Intensive Buffalo broiler, fat lamb, goat fattening for higher meat production, backyard and small scale pig, poultry and broiler rabbit for meat production, effective disease control and health management, epidemiology and landscape genetics of infectious diseases, disease forecasting models and economic impact analysis in relation to disease control strategies, evaluation of various non-conventional feed andfodder resources including tree leaves for livestock and precision livestock farming are also issue to beaddressed.Qualitymilk,meat,woolandotherproducts with value addition, development of cold chain for proper biological product transport and safer food products from livestock and poultry, development of newer nutraceuticals and safer health foods and epidemiology and landscape genetics of infectious diseases, disease forecasting models and economic impact analysis in relation to disease control strategies also are to be catered to.

AgriculturalResearchandEducation 137
Way Forward7.52 InthefieldofDairyproduction,processingand value addition, genetic improvement and conservation of indigenous cattle and buffaloes for higher milk production, establishment of open nucleus herds for important indigenous breeds in their native tracts genomics and marker assisted selection in cattle and buffaloes, mechanization of equipments for indigenous dairy products for small scale sector, development of climate resilient housing and shelters for improved dairy production, improving buffalo productivity by assisted reproductive and biotechnology tools and specificdairyproducts(functional/nutraceutical/value added) are seen as researchable areas.
New Inititatives7.53 NewNetworkProgrammesofBrucellosis,tuberculosis, paratuberculosis and leptospirosis, neonatal mortality, emerging infectious diseases and zoonosis, clinical nutrition for management of important diseases of livestock and poultry, nutritional interventions for control of infertility and reproductive disorders in bovines and veterinary Diagnostic imaging have made a beginning.
7.54 Buffalo Genomics, Diagnostics & vaccines and value addition projects will be taken up in platform mode. A Directorate on Companion AnimalResearchisbeinginitiated.Further,up-gradation/restructuring/renaming of institutes is being undertaken as under:
• Up gradation of HSADL, Bhopal to Institute of Bio-security and Agri-Defence
• two Regional Centers for NBAGR• Merging CARI and PD-Poultry to
Institute of Poultry Sciences
• Upgradation of NRC on Pigs to Directorate on Pig Research
• Upgradation of PDC Meerut to Institute on Cattle Research
• Upgradation of PDADMAS to Indian Institute Veterinary Epidemiology and Disease Informatics
• Up gradation of Bangalore campus to Central Laboratory on FMD under administrative control of PDFMD.
Successful spread of Artificial Insemination in pig in Assam7.55 the National Research Centre on Pig, Rani, Guwahati, Assam has developed technology for preservation of boar semen for extended period (up to 7 days at 15o C). this has been done to enable transport of semen from institute for ArtificialInsemination(AI)atfarawayvillages.
ThefirstsuccessfuldeliveryofaGhungroosowwasrecordedonMay16th2012.Thishappenedwiththebirthof13pigletsinGoskatavillageinKokrajhar district of Assam, located about 220kms from the institute. this feat was accomplished in collaboration with the KVK, Gosaigaon under Assam Agricultural University. Earlier, the institute rendered AI services within the vicinity

138 State of Indian Agriculture
of 65 Km radius, producing 1448 piglets at farmers’field.Thehighest litter size at birthof19pigletswasobservedunderfieldconditions.It is expected that increased number of superior piglets born out of AI will increase the income of pig farmers. the crossbred piglets produced through AI are in great demand due to their better growth rate. Recently, the Assam State Institute of Rural Development has procured AI bornpigletsfromthevillagesadoptedbyNRC-Pig for distribution among the farmers. the AI is becoming popular among the farmers and the technology developed by NRC on Pig can be transferredtothefarmers’fieldincollaborationwith state veterinary departments, KVks and NGos.
Athulya (ILM-1990) Layer Chickens - New Hope for Poultry Farmers7.56 the scientists of All India Coordinated Research Project (AICRP) Unit on Poultry Breeding under Indian Council of Agricultural Research at Mannuthy, Kerala have developed high producing heat tolerant Athulya strain (ILM-90) cross of IWN and IWP lines of layerchicken with desirable egg weight at Mannuthy in coordination with Directorate on Poultry, Rajendranagar, Hyderabad. The beneficiary ofthese chicks could get more eggs per bird and a premiumprice(Rs.4-5moreper100eggs)forthelarger eggs laid by the hens even from the early laying period itself. the mortality was also low during the laying period.
Conservation and Propagation of Elite Murrah Germplasm Available as Champion Bulls with Farmers7.57 out of approximately 55 million breedable buffaloesinIndia,hardly15%arebredthroughArtificial Insemination (AI). This requires over100,000 bulls for natural service and 5000-6000 bulls for frozen semen production. It isdifficult to find quality superior bulls to meetthis demand. Genetic improvement programme warrants quality frozen semen production from genetically superior bulls and adoption of AI at large scale. Such bulls are rare, isolated and scattered in the fieldwith fewprogressivefarmers/NGos and used to the limited extent with natural service in the vicinity. this poses the threat that in due course this invaluable germplasm may get deleted from the gene pool.
the Central Institute for Research on Buffaloes, Hisar undertook a novel exercise in conservation and propagation of such superior Murrah bulls through semen collection and cryopreservation. Besidesobtaininghistoryofpedigreeanddam’sproduction potential, a general examination of bull for breed characteristics and breeding soundness is made. Bulls are tested for infectious diseases and those found fit/negative aresubjected to collection of semen at farmers’doorsteps. the collected semen is examined for its normalcy and is processed for freezing, tested for post-thawevaluationandstoredfrozeninsemen

AgriculturalResearchandEducation 139
straws. this semen is made available to farmers interested in improvement of their buffaloes. the owner is paid remuneration or half the frozen doses as per his consent. the program was started inJune2008withaNationalChampionMurrahbull named ‘Gholu’ from village Didwadi inPanipat,Haryana.Sofar,thesemenfromthe13elite bulls, located in various parts of Haryana and Punjab, has been collected, frozen stored and sold to farmers.
First Embryo Transfer Mithun Calf (Bharat)7.58 World’s first ever mithun calf throughembryo transfer technology was born at the National Research Centre on Mithun, Jharnapani, Nagaland onMarch 27, 2012. Embryo transfertechnology (Ett) being one of the best tools for faster multiplication of quality germplasm, the scientists were working to standardize the techniques for mithun since last five years.Mithun (Bos frontalis), a rare bovine of South-east Asia is mainly confined in four differentStates viz., Arunachal Pradesh, Nagaland, Manipur and Mizoram of North-eastern Hillregion of India. Presently, the free range system of mithun rearing in its natural habitat (forest) results in inbreeding as well as crossbreeding with the local cattle, thereby resulting in loss of quality mithun germplasm. to address the issue of inbreeding and crossbreeding, the scientists of Animal Physiology section of the institutehavesuccessfullyappliedtheArtificialInsemination (AI) technique both at farm and the field (Khonoma village ofNagaland) level andproducedAI-borncalves.
Fisheries
Marine Fisheries and Mariculture7.59 Intheyear2011,MarineFisheriesCensus2011 was completed. Resource map of stockstructure of key species was documented. A model for chlorophyll based forecasting of fish and potential yield was completed. ANational Fisheries Grid to strengthen National Marine Information System was established. Development of harvesting strategies for oceanic natural resources like tuna, large pelagics and squids was outlined. Pop up satellite tagging of yellowfintunasforthefirsttimewasconductedin Indian waters. Adoption of combination of chumming with live bait and use of artificiallures and fresh baits and concerned efforts aimed at deep swimming tunas has resulted in increase ofthisfishery.Broodstockdevelopment,inducedbreeding and larval production of the marine finfishCobia,Rachycentron canadum was achieved for the first time in India. Successful breedingand seed production of nine marine ornamental fishes .Amphiprion ocellaris, A. percula, A. sebae, A. nigripes, A. frenatus, Premnas biaculeatus, Pomacentrus ocaerulus, Chrysiptera cyanae and Dascyllus aruanus was continued. tissue culture technology for in vitro production of pearls from blacklip oyster Pinctada margaritifera was further developed. Large scale spat production of clams Paphia malabarica, Meretrix meretrix, Crassostrea madrasensis and Pinctada margaritifera was achieved in hatcheries. open sea cage farming of seabass, cobia and lobster were demonstrated. Green Algal extract (CadalmintM GAe) developedandlaunched.Thisis100%vegetariannutraceutical from green algae for joint pains and arthritis. Green Mussel extract (GME), another nutraceutical from green mussel for joint pains was developed.
Brachishwater Aquaculture7.60 Major achievementswere the technologyof sea bass breeding and culture which has been standardized and commercialized through Rajiv Gandhi Centre for Aquaculture, Myladthurai, tamil Nadu. Another breakthrough was in breeding of pond reared Cobia, Rachydentrum
140 State of Indian Agriculture
canadum. Seabass feed under the brand name of BHEtKI AHAR has been standardized and commercialized. Breakthrough in breeding of pond reared Cobia, Rachydentrum canadum. Shrimp feed technology (Starter, grower and Finisher) for Penaeus monodon and Fenneropenaeus indicus was commercialized through M/s Bismi Feeds Ltd., Perunthottam, tamil Nadu. organic Shrimp farming of Penaeus monodon with organic inputs was also standardized for the production levels of 1.5 t/ha/crop. An immunodot blot test for WSSV “CIBA IMMUNoDot” was developed for early detection of WSS virus in shrimp. Nine patents have been applied for various diagnostic kits and methods. A molecular diagnostic kit based on reverse transcriptase polymerase chain reaction (RT-PCR) for earlydetection of betanodavirus, the causative agent of viral nervous necrosis (VNN) in finfishwasdeveloped.
Inland Fisheries7.61 In2011,digitalmapofinlandwaterbodiesof the country using remote sensing satellite data for the water bodies of 0.5 ha and above werecompleted for 7 states. Software was developed for catch estimation using visual basic and MS Access. Fish stock characterization is in progress along river Ganga, Brahmaputra and Narmada by digital truss images for morphometery and DNA sequencing. Impact of climate change in inland open waters suggest that out of 14 major river systems , four rivers are predicted to lose more than 7% of fish species under climate warmingscenario as determined from the model predicted. Elevated temperature showed Indian Major Carps maturing and spawning as early as March .Isolation of nine bacterial strains resistant to and capable of degrading dichlorophenol, trichlorophenol and pentacholoropheno l(PCP) was achieved. out of 9 strains tested, 5 were strongly degrading PCP and may have potential application in bioremediation. Threestrainscouldbeidentified.
Cold water Fisheries7.62 Development of GIS based decision support system for aquaculture in Kumaon region of Uttarakhand was completed.
Assessment ofMahseerfishery resources alongAssam, Himachal Pradesh, Arunachal Pradesh, Uttrakhand, Maharashtra and J&K were done using truss network and molecular markers. Phylogenic tree of population structure of cold waterfisheswasconstructed.Populationgeneticanalysis and genetic variability of common and economically important Snow trout, Salmo richardsonii is underway. 57 microsatellite markers were developed, out of which 27 were validated in different populations. Genetically improved strain of mirror carp and Ropsa scale carp were successfully bred after 2 yrs of transplantation and release as Champa 1 and Champa 2 along hill region of Arunachal Pradesh, Sikkim and Meghalaya. Feasibility studies of growing Hungarian strain of common carp and Chocolate mahseer in hilly regions in mono and polyculture systems were conducted. Seed production of golden mahseer, Tor putitora was upgraded for commercialization. Water requirement for maintenance of broodstock , grow out culture of trout and exotic carps in culture system observed t 5lps water for rainbow trout and 1lps for carpswere studied. 10% oftrout stock in farms of Arunachal Pradesh and Sikkimand2%ofMahseerstockinUttrakhand(DCFR) were found to be infected by pathogenic fungi, Saprolegnia parasitica and S. diclina. the growth of fungi was found to be inhibited by use of extract of Kali sarson and lemon grass.
Fisheries Technology7.63 Theinstitutedevelopedalargemeshsizepurseseine forsmallmechanized/trawlfisheryand a large mesh gillnets for large pelagic for Lakshadweep. Rubber wood was introduced as alternate material for traditional craft construction. A juvenile Bycatch Excluder cum Shrimp Sorting Device (JEE-SSD) was developed. Isolation ofbioactiveandindustriallycompoundsfromfishandfisherywasteswasachieved.Nutraceuticaloyster Peptide t (oPex) from edible oyster (Crassostrea madrasensis) extracted was found to have anti-inflammatory, anti-oxidant and anti-bacterial properties.technology for control of biofilmformationbypathogenicbacteriainfoodprocessing environment was developed. Design anddevelopmentofeffluenttreatmentplantsforseafood processing units was conducted. A Solar

Agricultural Research and Education 141
Fish Dyers of different capacities for different products was designed. Different value added products, canned products, Vacuum packed and modified atmospheric packed steaks wasdeveloped.
Fish Genetic Resources7.64 The database on 2358 indigenousfinfisheswithrespect totheir taxonomic,geneticinformation, and biological data was developed. ‘Fish Karyobank” containing information on karyomorphology, molecular markers and nucleotidesequencesofselectedfishspecieswasdeveloped.1500DNABarcodesformorethan400marineandfreshwaterfishspecieswasdeveloped.DNA Barcoding was used for forensic application todetectadulteration infishproducts toresolvelegal dispute. Sperm cryopreservation protocol wasdevelopedfor26fishspeciesandvalidatedin18fishspecies.Atissuebankwasestablishedwithover13.000accessionsfromdifferentfishspecies.Live gene bank has been established in Lucknow and Guwahati. Cell lines were developed from 5 freshwaterand2marinefishsp.EstablishmentofNational Fish Museum was initiated. Monoclonal antibody for three commercially important fishfor Sero-survellanceofpathogenswas achieved.CbCystatin in a hypoxia tolerant Indian Catfish,Clarias batrachus wasidentified.
7.65 the constraints/challenges affecting growth of sector are as under:
• Investmentindeepseafishingrequiredas this resource is estimated to hold 7% of the marine fish resources andexploitationisinsignificantsofar
• Policy decision and implementation mechanism regarding deep sea fishingto be put in place by the Govt.
• Investment in Sea cage culture and simultaneous proper legislation to come into effect regarding site and number of culture units (cages) to be established along coastal belt so as not to create pollution and other legal hazards in near future
• Non availability of National multi-speciesbrackishwaterShrimpandfinfish
broodstock center/hatchery. to attain productiontargetof4,00,000tonesfromcoastal aquaculture by 2020-21 as perNFDBbyhorizontalexpansionto3,00,000haandcompoundgrowthrateof6.13%,the sector needs research support In the formationoftwospecifiedFarms
• Absence of proper environmental flowin Indian rivers for sustenance of river ecosystem
• Near absence of proper water harvesting mechanism and water recirculatory system in hilly regions.
• Non availability of Vessel Management cell (VMC), which could look after the upkeep of departmental Vessel. A separate Vessel Management Cell (VMC) at the Institute level is needed to take care of repair and maintenance of research vessels.
• the sector needs a centre for advanced studies in policy planning and fisherymanagement which can undertake research in social Science as livelihood, socio-economic and trade issues andact as advisory on policy planning. Development of business models and totalfactorproductivityinfisherysector.Assist state departments of fisheries informulationof comprehensivefisheriesand aquaculture policy.
7.66 Some of the new initiatives to enhance theproductivityandproductionofthefisheriessector are listed below:
• Demonstration of Capture based aquaculture (CBA), wherein the juvenilesofwildfishescaughtarerearedto marketable sizes in captivity.
• The fishermen society ‘Sampradayaka Meenugara Sangha, Byndoor Valaya’ of Upunda village located at Byndoor participated with the researchers from CMFRI, Mangalore in community based activity and earned a farm gate price of ~Rs75,000 per cage by harvestingthe product during July, when the mechanizedfishingisbanned.

142 State of Indian Agriculture
• Introduction of Banana Shrimp Fenneropenaeus merguiensis in Gujarat.
• Introduction of low density farming system for Litopenaeus vannamei as diverse candidate for Shrimp farming.
• Estimation of environmental flow forsustenance of river ecosystem.
• Population structure, migratory behavior and development of breeding protocol for Hilsa.
• Initiation of bringing medium carp, Pengba (Oesteobrama belangeri), endangeredfishofManipurintoculturalfold.
• Successful breeding of minor carp Labeo dero present in foot hills, in captivity.
• Public aquarium to showcase rich fishbio-diversity established at NBFCR,Lucknow.
• Developmental of ornamental fishvillages.
• National brood bank development initiated.
Box 7.3: Breeding of high value marine tropical finfish, silver pompano, Trachinotus blochii
Successful breeding of silver pompano can be considered as a milestone towards the development of pompano aquaculture in the country. the farming of pompano can be successfully carried out inponds,tanksandfloatingseacages.Thespeciesis able to acclimatize and grow well even at a lower salinityofabout10pptandhence it is suited forfarming in the vast low saline and brackish waters of our country besides its potential for sea cage farming. In the Indian domestic market the current priceofpompanoisaboutRs.200/-perkg.
Silver pompano Trachinotus blochi
Pompano cannulation for breeding in captivity
21-45 days fingerlings of Pompano
Box 7.4: Introduction of Trout farming in Sikkim
DCFR, Bhimtal in association with Department of Fisheries, Sikkim under the project entitled “Sustainable Utilization of Mountain Fishery Resources: A PartnershipMode”; made three (3)trout breeding units functional for production of sufficient rainbow trout seed. On farm trainingprogramme on brood stock management, seed production and transportation of green-eyed ovahave been organized since last four years. Seed technology has been adopted by 199 private farmers
Brood Stock at State Trout Farm, Uttaray

AgriculturalResearchandEducation 143
during 2011-12 against only one private farmerduring2008-09.700more farmersareschedule totake seed production in coming years Seed thus produced will be utilized in Farms as well as for ranching in natural resources.
Breeding at Private Farm, Kuokhola
Box 7.5: Fish based production system in seasonally flooded wetlands
CIFRI implementedfishbasedproductionsysteminseasonallyfloodedwetlandsofWestBengal. Itsuggestedforstockingof6000fingerlings/hawithsupplementary feeding in these wetlands during flood period. The practices improved the waterproductivityfrom183g/m32008-09to209g/m3 by 2010-11andthefishyieldfrom2540kg/hain2008-09to3771kg/ha
Fish haul from the seasonally flooded wetland
Agricultural Engineering
Farm Mechanization and Energy Management
7.67 Farm mechanization has played a critical role in improving agricultural production as well as productivity through timeliness of field operations and by enabling proper andefficient use of inputs. A number of successfulfarm machineries have been developed and
commercialized during the past two decades through the sustained efforts of R&D institutions and industry. However, individual ownership of farm machinery by small and marginal farmers, which constitute the core of Indian agriculture, often proves to be uneconomical, especially in operations like land preparation and harvesting. With continued shrinkage in average farm holding size, custom hiring of farm machinery is being increasingly practised. It implies the use of various improved farm tools and equipment to reduce drudgery and to enhance overall productivity and production with the lowest cost of production. the equipment and technologies developed for aiding mechanisation of Indian agriculture are given in Box 7.6.
Box 7.6: Equipment and Technologies developed for aiding Mechanisation
• Precisionplanter-cum-herbicideapplicator• Seed-cum-fertilizerdrillforhillyregions• Tractor-operatedrear-mountedonionharvester• Animal-drawnfarmyardmanurespreader• Power-operatedribbonerforjute• Tractor-operated 7-rowmulti-crop planter for
seed spices • Needletypetrayseederforvegetablenursery• PowerweederforriceSRIcultivation• Pedal-operatedmaizedehuskersheller• Powertiller-operatedzero-tilldrillforhillyregion• Palmyratreeclimber• Hand-operatedrotaryarecanutpeeler• Testrigfortractorroll-overprotectivestructures• Solar-assistedheatpumpdryer forhigh-value
crops• Highsolidbiogasplant• Peelerfordehydratedgarlicflakes• Cashewnutdrumroastingmachine• Automatedflyerspinningmachine• RotatingflatsystemforCIRCOTMinicard• AxialFlowCottonPre-cleaner• RFIDTechnologyforCottonBaleTagging• Fibresegregatormachineforcoconutfibres• Digitalradiography,CTandMRI• Groundnutkernelde-skinner• ContinuousfeedtypeAloeveragelextractor• Copradrier

144 State of Indian Agriculture
Challenges7.68 Farm mechanization is an issue that requires immediate attention if the problems of human labour shortage, drudgery in farm operations, efficiency of input-use, tools and implementssuited to women farm workers, and climate resilience are needed to be resolved expeditiously. the challenges ahead are mechanization for horticultural and livestock sectors, conservation agriculture,hillagricultureandsite-specificinputapplications. Another set of challenges in farm mechanization relates to enhancing the availability of high quality farm machines through extensive manufacturing, testing, and marketing, especially, tomechanization-deficitregions.
7.69 Energy management in agriculture is another major issue. optimization of inputs, including farm operations, should lead to minimizing the energy intensity of Indian agriculture. An important challenge is to ensure propermatchingoffarmimplementswithprime-moversforgreaterenergyefficiency.Theprime-movers themselves need to be operated optimally. Another challenge is to reduce the dependence of Indian agriculture on conventional fuels through substitution of conventional energy sources with renewable sources for long term sustainability. While the available solar technologies need to be utilized to meet energy needs in agricultural production and post harvest operations, the surplusbiomassneedstobeefficientlyconvertedinto biofuels to meet fuel needs of agricultural operations. Algal fuels may hold the key to making Indian agriculture energy neutral.
7.70 On-farmprocessingandvalueadditionisan issue that is associated with reduction in post harvest losses and better farm income realization. the challenges include creation of infrastructure for conditioning, cleaning, grading, packaging, and storage in production catchments and transportation from production catchments to market destinations. Available technologies now permit primary and secondary processing of agricultural produce in production catchments, thereby, permitting the farm families and other rural workers to enhance their employment and income. The challenge is to adopt biorefinary
approach for processing the whole agricultural produce so as to derive the maximum benefitincluding the environmental sustainability.
Way Forward7.71 During the recent past, there has been a spurt in seeking engineering inputs in agriculture for reducing the cost of production, climate resilience and enhanced farm income and rural employment. Agricultural mechanization and post harvest value addition are the major engineering interventions sought by the stakeholders. Besides, the needs for equipment for efficientutilization of natural resources and energy management have also been realized. CIAE has formulated comprehensive programmes on Farm Mechanization and Precision Farming and Energy Management in Agriculture.
Expected Outcome/change in scenario• Reduced cost of agricultural production• Increased farm productivity• Successful models for custom hiring, rural
workshops for fabrication, repair and maintenance activities at village/cluster level.
• Increasedfarmers’income• Increased cropping intensity• Conservation of natural and input
resources• Environmental sustainability• Greater climatic resilience of Indian
agriculture• Conservation of non renewable energy in
farm operations• Increased use of renewable energy in
agriculture• Conservation of natural and input resources• In-house capacity created for research and
human resource development• Environmental sustainability• Greater climatic resilience of Indian
agriculture

Agricultural Research and Education 145
Ongoing schemes• Post-harvest technology for production
of contamination free clean cotton and standardization of ginning process and machines
• Mechanicalprocessing,fibreutilizationandproduct development
• Enhancement of quality and characterization ofcottonandothernaturalfibres,yarnsandtextiles.
• Use of Environment friendly agents & water, energy and chemical conserving technologies for cotton and blended textiles
• Value addition to natural fibres basedbiomass and byproducts
• Entrepreneurship in cotton technologies and human resource development
Success Stories
Novel Flexi Check Dam using Technical Textile7.72 A novel flexible check dam made ofrubber-textilecompositehasbeendevelopedforapplication across watersheds and small rivulets.
Flexi dams, commonly known as rubber dams areaspecialgroupofgeo-system,andmadefromtechnical textiles specially prepared from tailor madetextile-rubbercompositesasperthedesignneed.Rubber-fabriccompositehasbeenshapedintoasuitablewater-proofandwrinkle-freedam
structure as per the size of each check dam. A low cost inflation–deflation mechanism for therubber dam has also been developed along with an appropriate installation method on concrete structure. It has been successfully installed at small watersheds in Odisha at five locations,andshownthatcontrolofwaterflowandtimelystorage of water by the rubber dam resulted in increased crop production by 60% in the kharif (monsoon),and45%inrabi (winter) seasons.
Entrepreneurship on Briquetting Plant for Agro-residues7.73 Shri Gandhi has successfully establishedthebiomassbriquettingplant(500kg/hcapacity)at Mandideep, Bhopal district under the technical guidance of CIAE, Bhopal. Presently he produces about3000kgbiomassbriquettesperdaybasisand sells to local industries for thermal application using agro residues such as soybean straw and pigeon pea stalk, lantana weed stalk and other such weeds. this helps in gain of additional money to farmers of nearby villages, who were otherwise burning surplus agro-residues in thefield.
Intensive kusmi lac cultivation on semialata for sustained lac cultivation7.74 Shri Santosh Nirmal Horo raised a plantation of semialata inanareaof0.2hawith2000 plants in Kharsidag village, Ranchi dist.

146 State of Indian Agriculture
withtechnicalsupportfromIINRG,Ranchi.35.0kg of kusmibroodlacwasinoculatedinJuly2008on about 1264 semialata plants. 241 kg broodlac and 15 kg scrapedlacwas harvested from 1084plants giving an output: input ratio of 6.89. Subsequently, 40.0 kg of kusmi broodlac was inoculatedinJulyon1202semialata plants. A very goodcrop(333kgbroodlacand45kgscrapedlac)was harvested giving a broodlac output: input ratioof8.325.Thishasimprovedfarmersreturn.
Agricultural Extension7.75 TheICARhascreatedanetworkof630Krishi Vigyan Kendra to assess,refineanddemonstratenew technologies and products developed by the National Agricultural Research System (NARS). the KVKs are playing the role of intermediary institutionstofinetunetheresearchconducted,often under controlled conditions, before its adoptioninfarmer’sfield.Withtheobjectiveofdevelopinglocationspecifictechnologymodules,the entire process is carried out in participatory mode involving the farmers. the process of TechnologyAssessment andRefinement (TAR)
uses a tool known as On-Farm Trial (OFT).the major thematic areas under which oFts were carried out in crop husbandry include for example Varietal Evaluation, Integrated Nutrient Management, Integrated Crop Management, Integrated Disease Management, Integrated Pest Management, Resource Conservation technologies, Weed Management, Integrated Farming Systems, Post-Harvest Technologyand Value Addition, Improved tools and Farm Machinery, Seed and Planting Material Production, and Improved Storage techniques; whereas in the case of livestock Production and Management were Disease Management, Breed Evaluation, and Nutrition Management; and while in case of other enterprises were sericulture, mushroom production, vinegar production, vermin-compostingandmarketledextension.
7.76 Frontline demonstration (FLD) is another major mandated activity of KVKs, which aims at demonstrating the production potential of crops, livestock and other allied enterprises.
7.77 In order to create awareness among farmers and other stakeholders on improved agricultural technology, the KVKs organize large numberofextensionprogrammeslikefielddays,exhibitions, kisan mela, kisan ghosthi and filmshows, besides other extension programmes like scientistsvisitstofarmersfields,groupmeetingsand discussions, workshops, lectures and use of mass media for wider dissemination of farm technologies.
7.78 Kisan Mobile Advisory is another initiative in using Information and Communication Technologyfordisseminationofneed-basedandtimely information to the farmers. the KVKs also conducted programmes for capacity building of farmers and extension personnel of district line departments to update their knowledge and skills and orient them on frontier areas of technological developments. the other major contributions of KVKs included: production and supply of technological products; innovative technology delivery mechanisms; following an institutional approach for technology adoption through FIGs, Farmer Clubs, etc.; special emphasis on women empowerment; production of inputs at site like

Agricultural Research and Education 147
seed and planting materials; emphasis on rural entrepreneurial development like piggery rearing, low cost mushroom production, bee keeping, etc.;promotionofeco-friendlytechnologieslikeIPM, Zero tillage, etc.; and promotion of resource conservation technologies like laser leveling, agro-forestrymode,etc.
7.79 In addition to these, there are several success stories of KVKs covering paddy task force-asolutiontofarmlabourshortage,qualityprotein maize, innovative approach in sericulture, sweet potato based feeding system for pig, and protectedcultivationofvegetablesinnet-house.
Challenges7.80 It has been observed that younger generation is not interested in taking up agricultural and allied enterprises as a livelihood option. therefore, it is a matter of concern how to inculcate interest in agriculture and catch them young to retain in the agriculture sector. Besides, the other issues being faced are listed here under:
• Acute shortage and exorbitant prices of recommendedAgro-inputsaffectingthetechnology transfer and applications
• In the changing agricultural scenario, marketing problems are dominating over the production problems. Marketing support to farmers for primary processing, storage, grading, packing, certification, transportationetc. is equally important for successful technology transfer, adoption and benefitstofarmersatlarge.
• KVKsarefindingitdifficulttoup-scalethe assessed and refined technologieswhich are found fit for adoption byfarmers on large scale.
• Meeting the increasing expectations of stakeholders with the existing manpower and available infrastructure.
• Provision of uninterrupted power supply for E-connectivity and solvingbandwidth problems are necessary for the use of ICts by KVKs and other outreach programmes of NARS.
• Adequacy and continuity of staff in KVKs is emerging as a bottleneck to sustained progress.
Way Forward7.81 the important measures that needs to be strengthen KVKs are:
• Strengthening communication and knowledge sharing through establishment and maintenance of technology museums, mobile fieldservices, village adoption programmes, farmer field schools, Tele-Advisoryservices, online agri video channel, SMS basedagri-advisoryservice,informationkiosks, disaster management interventions, organising exhibitions, fielddays,exposurevisits,etc.
• Strengthening KVKs with provision of additional subject matter specialists in the field of agri-businessmanagement,conservation agriculture, agricultural processing and value addition and knowledge management.
• Provision of additional building, laboratory facilities and demonstration units as per emerging requirements.
• Strengthen media and e-resourcesthrough publications such as newsletters, books, manuals, leaflets,brochures, technology hand outs, etc., media coverage of extension programmes, development of cyber extension platforms and extension portal, content development cyber extension, production of audio visual and interactive aids, etc.
• Strengthening market intelligence, EDP and consultation through EDP packages, project report preparations and consultancies, industry and enterprise relations and partnership, establishing local market network on prices, establishing value chain demonstration units, etc.
• Strengthening continuing education programmes through open and distance

148 State of Indian Agriculture
learning for farmers and entrepreneurs withonlinecourses,conductingcertificatecourses for farmers, entrepreneurs, input dealers, extension agencies, etc.
• Strengthening the monitoring and coordination mechanism of KVKs by establishing more number of Zonal ProjectDirectoratesandZonalScientificAdvisory Panels.
• Impact assessment of KVK activities on regular basis so that necessary changes can be made in the ongoing programmes forthebenefitoffarmingcommunity.
Agricultural Education7.82 Niche Area of Excellence (NAE): this programme is aimed at creating global competitiveness in agricultural education and research through excellence in teaching, research, consultancy andother services in specificfield.Financialsupportto30ongoingsub-programmeswas provided in the year 211-12 and 20 newNiche Area of Excellence were sanctioned in the year2011-12.
7.83 Some of the important initiatives/main highlights being undertaken are as under:
• In the centre on Integrated Centre for Drought Resistance and Management : Genetic Engineering for Developing Crops-resistant to Drought, seven genes for protein turnover and folding, 8 transcriptional activators and 8 genes related to oxidative stress have been validated. Novel genes have been characterized and technology for creating double haploids has been developed.
• Under the programme, Microbial Biotechnology for Imparting Resistance in Plants against Insect Pests and Pathogens, transgenic tomato plants with resistance to leaf curl virus through transformation with RNAi technology have been developed.
• InthecentreontheDevelopmentofAgro-based Nutraceuticals for Health, agro-basedneutraceuticalsviz.maltodextrin-enriched ice-cream, lycopene-enriched
whey fruit juice beverage, curcumin-enrichedflavoredmilk,noninaturaljuiceand concentrate have been formulated. Functional fermented dairy products with synbiotics have been developed with prolonged shelf life have been evaluated in another centre at AAU, Anand.
• In the centre on Conservation, Cultivation, Processing and Quality Evaluation of Medicinal and Aromatic Plants, eco-friendlylow-costpost-harvestprocessingtechnology for storage, packaging of raw drug material of different medicinal aromatic plants has been standardized for medicinal and aromatic plants. Large scale commercial production of quality seed/planting material true to the type of medicinal and aromatic plants have been produced and sold to the farmers and growers.
• In the sub-programme on Animal Biotechnology – Molecular Diagnostics For Emerging Avian Viral Diseases and their Immunopathogensis, diagnostics kits for avian viral diseases have been developed and validation of chicken anemia virus antibody detection kit has been completed. For Marek’s diseasediagnosis kit is being validated.
• Under two different programmes, Quality Production in Fishes for Sustainable Farming (GBPUAt, Pantnagar) and Utilization of Inland Saline and Sodic Soil for Aquaculture (CIFE, Mumbai), technology for production of major freshwater fishes for sustainable farming has been standardized. the breeding season of Indian major and exotic carps has been prolonged by improved water quality and feeding management. Inland saline water resources are being used for aquaculture and standardized technology for the commercial farming of tiger shrimp (Penaeus monodon) using inland-salinewater has been developed.
7.84 A few technologies have been commercialized. these are commercial utilization of waste inland-saline areas and saline water
Agricultural Research and Education 149
where crop productivity is very poor. the following technologies were adopted by the farmers: i. Latex agglutination based kit for detecting chicken anaemia virus (CAV) infection, ii. Latex agglutination based kit for detecting Marek’sdiseasevirusinfection.
Entrepreneurship Development7.85 Experiential learning is a novel courseware aimed at promoting entrepreneurship, knowledge and marketing skills through meaningful hands on experience and working in project mode, through end to end approach in product development. the Council has provided financial support for theestablishmentof351experientiallearningunitsinvariousagriculturaluniversities.Outofthese,110unitsweresanctionedinthelastyear.Thissub-programme would help in transcending the mere knowledge-imparting education with limitedpracticaltrainingtoexperience-basedbehavioralchange through comprehensive practice sessions involving all aspects of an agricultural enterprise, from production to consumption.
National Information System on Agricultural Education Network in India (NISAGENET)7.86 In the NISAGENEt system, all the 61 AUs have been added and the system has been made operational to enter/update and upload data from their respective university/colleges. to expedite data management activities from AUs, 3Sensitization cumTrainingWorkshops for theNodalOfficersoftheNISAGENETwereorganized.A Reference Guide for Data Management has been prepared and made available on website and also distributed to the participants in the workshops. the system is rich in many layers of information. Many universities are also maintaining online cells in their websites.
Box 7.7: National Academy of Agricultural Research Management (NAARM)
the National Academy of Agricultural Research Management (NAARM) was established by the Indian Council of Agricultural Research (ICAR) at Hyderabad in the year 1976, as the Central Staff College of Agriculture. Initially its primary role was
to impart Foundation training to the new entrants of the Agricultural Research Service of ICAR. In 1979, it acquired its present name, and over the years,ithasgrownasafull-fledgedAcademywitha wider mandate to enhance the capacities of the institutions under NARS at all levels in agricultural research and education management, and carry out research to provide policy support in critical areas of organizational reform. In the Eleventh Plan period, the Academy added a new dimension of Post Graduate education in Agricultural Management and technology Management to develop a new generation of leaders for meeting the challenges of agricultural development in the 21st century.
National Agricultural Innovation Project7.87 NAIP is a World Bank and Govt. of India funded project being implemented by the ICAR contributes to the sustainable transformation of Indian agricultural sector from an orientation ofprimaryfoodself-sufficiencytooneinwhicha market orientation is equally important for poverty alleviation and income generation. the project is implemented through four components involving 191 consortia leaders and 646 consortia partners, adding up the number of participating institutionsto837.TheprojectisgrantedextensiontillJune,2014.
7.88 With a view to create an enabling environment for the management of change in NARS,43sub-projectsaretakenupincomponent1.through the ten Business Planning and Development Units (BPDs), 336 entrepreneurshavebeenincubated,83technologiesdevelopedby NARS have been commercialized and a total revenue of Rs. 13.22 crore has beengenerated. Some of the achievements in ICt areoperationalizationofanonlinee-publishingsystem for ICAR research journals, development of a knowledge management platform -Agropedia for aggregation and dissemination of information, rice knowledge management portal for providing complete rice information fromasingleportal,Consortiumfore-Resourcesin Agriculture (CeRA) facilitating 24×7 online access with approximately 3000 scholarlyjournals from 7 major publishers and catering to 134 institutions under NARS, creation of

150 State of Indian Agriculture
group catalog “AgriCat” (http://www.agricat.worldcat.org) of 12 major libraries for online access by the researchers and students, implementation of a general purpose statistical software package (SAS) with all modules for the NARS, creation of a new platform KVKnet (http://agropedialabs.iitk.ac.in/extension/) and vKVK (http://www.vkvk.in) as a knowledge network for KVK scientists, starting of seven e-courses for theBachelor’sdegreeprogrammes in thedisciplineof Agriculture, Horticulture, Veterinary Science, Home Science, Fishery Science, Agricultural Engineering and Dairy technology, creation of metadata&abstractsof7486andfulltextof6000of Ph. D. theses and setting up of nine media cells in different parts of the country for improving outreach and enhancing the brand image and visibility of the ICAR/NAIP.
7.89 total of 182 commodity price forecasts for 36 commodities were disseminated for thebenefitoffarmersacrossthecountry.Theimpactstudy has revealed that due to timely pre-harvestforecastcommunications,thebeneficiaryturmeric and cotton farmers additionally earned Rs. 100 crore.A carbon tool kit for sustainableagro forestry CDM projects has been developed.
7.90 Atotalof361scientists fromNARSweredeputed for international trainings to global institutions in frontier areas of sciences. Besides, 258 scientists have been trained abroad in the consortia based programmes. An interactive meeting with the scientists trained abroad has paved the way for effective utilization of the trained man power. out of 88 national trainings infrontierareaofagriculturalsciences,63havebeen completed. trained manpower is being used to develop a center of excellence in respective discipline besides being a Course Director/Resource person for further training in India.
7.91 Research on production to consumption system is covered by 51 consortia working across the sub-sectors of Indian agriculture. Some ofthe value chains identified include medicinaland aromatic plants, bio-fuel crops, poultry,fruitsandvegetables,fisheries, foodgrainsandoilseeds, plantation crops, livestock products, natural dyes and agro forestry. A good number of consortia have developed market driven
technologies, process protocols and products which have shown positive impact in terms of income and employment generation, value addition and strengthening of weak chains. Some of them are: i. Pashmina goat kid “Noori” (born on 9thMarch2012)developedbytransferof cultured embryos in blastocyst stage to the recipient goats through hand guided technique isthefirstreportintheworld,ii. Clinical trials of foxtail millet diabetic food on diabetic volunteers revealed blood glucose reduction by 14-18%,triglycerides and cholesterol reduction 8-10%,LDL cholesterol reduction by 5% and HDLcholesterol increase by 2-3%, iii. Process for virgin coconut oil production by intermediate moisture method, iv. technologies for utilization of defatted dried coconut meal using cold and hot extruders, v. Anthocyanin-rich black carrot(IPC 126) and beta-carotene + lycopene richredcarrot (IPC56)varieties identified formassmultiplication and distribution to the farmers, vi. off season production technology of carnation for sub-temperate conditions, vii. Standardization of technology for production of natural eco-powdersandproductionof2000kgofconsumerpreferred 5 colours namely orange, pink, yellow, blue and green, using basic sources Annatto, beet root, marigold and indigo, viii. Identificationof Melia dubia and Dalbergia sissoo as potential indigenous and fast growing pulp wood species due to their high pulp recovery and acceptable basic density, ix. A new method for production ofclarifiedsweetsorghum juiceusingfilteraidand vacuum filtration system, x. Process for preparation of handmade/quality papers and Micro Crystalline Cellulose Powder from banana fibre, xi. technology for production of cooked and smoked pork sausage with the addition of fermented bamboo shoot, xii. Development and commercialization of the value added product “Shelf stable sheep rumen crackles” from sheep by-products and xiii. Dipstick based detection kits for detection of Potato viruses viz. PVX, PVS, PVM and PVY.
7.92 Sustained improvement in the incomes and well-being of farm families mainly indisadvantaged areas which have so far been left behind in development is aimed in component 3 through 33 consortia operating in 102

Agricultural Research and Education 151
disadvantageddistrictsoutof150inthecountry.Significant achievements are: i. Publication on ‘Selected livelihood options for disadvantaged regionsofIndia’whereinthemajorinterventionsdescribed are: Integrated Rice-Fish-poultrysystem, Rice-fish-vegetable system, Poultry-fish-vegetable system, Pig- fish-vegetablesystem, Fish- singhara - makhana system,Hybrid maize in tribal districts of Rajasthan and Gujarat, Utilization of upland fallows for maize cultivation in Bastar, Cultivation of transplanted redgram in Bidar, Maize based intercropping in Jhabua, Conservation and strengthening of local high value poultry race Kadaknath, tuber crop cultivation, Lac cultivation in Jharkhand, Maharashtra and Madhya Pradesh, Mushroom cultivation, Pig rearing, Interventions on goat, Vermi compost and Water resource development, ii. Recommendation of IFS models viz., Specialized Integrated Farming System (SIFS) Model, Rice – Groundnut- Livestock:model for small farmers, Livestock-Vegetablesmodel for landless community, Integrated Redgram andBengalgram –Vermicomposting-Azolla - and Poultry Farming System for Bidardistrict, Sustainable Farming System Models for PrioritizedMicro-WaterShedsInRainfedAreasofJharkhand, iii. Horizontal expansion of Integrated Pig-Fish-Vegetable IFSmodule IntegratedRice-Fish-VegetableIFSmoduleinAssam,Rice–Fish-Poultry Farming System forWetland Clustersin tamil Nadu and Livelihood Security through cultivation of vegetables and spices, iv. Selected interventions viz.,Geographical Indication Registration, Organic Farming CertificationProgram, Livestock population growth, Desilting of minor irrigation tanks for increasing storage and improving soil fertility, Replacement of Lantana with bamboo, Understand the nature and go with proper technology – A success story of Sokham Gaon, Natural Hatching of Kadaknath Eggs, Impact of Mechanisation, Mitigating Water Logging through Bio-drainage with Sugarcaneand Innovative way of raising vegetable nursery under saline water situation, v. through an innovative service called ‘m-Krishi-Fisheries’, vi. Land shaping for the low lying coastal areas tofarmpond,furrowandridge,andpaddy-cum-fish culture, vii. Biodiversity survey for plant, animalandfishlandraceswasundertakeninthe
districts of Chamba, Udaipur and Adilabad and seed chain of distinct landraces was identifiedand developed, viii. Synergy with other organizations, ix. Marketing and x. Sustainability of Post Project Activities.
7.93 Sixty one sub-projects are operating infrontier areas of basic and strategic research like allele mining, genomics, bio-sensors, soilorganic carbon dynamics, abiotic stress, cryo-preservation,climatechange,off-seasonfloweringandfruitinginmango,inputuseefficiency,ethnicand fermented foods, etc.
7.94 overall, the project progress is satisfactory as revealed through the performance indicators, viz. development of 91 public private partnerships, pilotingof50ruralindustries,filingof51patent/intellectual property protection applications, publication of 181 research papers in high impact peer reviewed journals, international training of 361scientistsinfrontierareasofsciencesand258scientists in the consortia, establishment of ten BPDs, development of 69 production technologies, 80processingtechnologiesand181noveltools/protocols/methodologies for research and commercializationof31technologies.
Pashmina goat kid “Noori” born through hand guided technique of transfer of cultured embryo
National Fund for Basic, Strategic and Frontier Application Research in Agriculture
Salient achievements
• An autoclavable microencapsulation system

152 State of Indian Agriculture
withmultistagebreakup twofluidnozzlehas been developed for microencapsulation of sensitive food components which are prone to contamination (microorganisms and their products) including bacteriocins. Microencapsulation of the probiotic species, of yeast, Lactobacillus casei, and pediocin, nisin, xylanase, pectinase and amylase has been done.
• A Patent has been obtained on Fermentation vessel for conducting rumen gas production studies in vitro.
• Indigenous lab scale design and fabrication of atmospheric pressure cold plasma reactor with and without cooling system has been developed for environment friendly treatment of cotton fabrics for effective dyeing and other qualities. Generation of atmospheric pressure cold plasma could also be achieved.
• Argulus siamensis has been identified asthe most prevalent species followed by A. japonicus causing the highly damaging parasitic disease, argulosis, in Indian aquaculture systems. A PCR based marker foridentificationofthetwospecieshasbeendeveloped.
• Stem cell culture has been established using pig bone marrow MSC lines. these cell lines will be used for producing transgenic pluripotent cells which in turn can be used for development of transgenic pigs
• A transgenic with the constitutive expression of signaling gene BjEll1 available in the plant itself in mustard substantially reduced aphid infestation. A transgenic with a similar gene BjEll2 showed resistance to Alternaria blight, a fungal disease.
• Level of expression of 5 genes, BMP 15, GDF 9, MAtER, ZAR 1 and IGFBP 1, were identified as themarkers for developmentcompetence for oocytes to be used for in vitro embryo production in buffaloes and help in improving the in vitro production protocol.
• AgeneLef-8genehasbeen identifiedasamarker forquickandcorrect identification
of insecticidal Nuclear Polyhedrosis Viruses (NPVs)specifictodifferentinsectspecies.
• Autotransgenic (that is with a gene of self) fishofthespecies,Clarias batrachus (Indian catfishmagur),hasbeenmadewithexcessproduction of growth hormone and faster growthinconfinement
• Endrometrial epithelial, stromal and luteal cell cultures of buffalo were established which can be used to study prostaglandin and progesterone production in buffalo. Insulin, IGF 1 and nitric oxide were found to be related to luteal functioning and success of pregnancy. Pregnancy Associted Glycoprotein 1 (PAG 1) gene, and, oxytocin, Estrogen & progesterone receptor genes have been cloned. PAG 7 and PAG 11 proteins havebeenpurifiedwhichmaybeusefulindeveloping pregnancy diagnostics.
• Ovule-specific promoter FM 1 has beencloned from Arabidopsis and presence of expression has been validated in sorghum. Methodologies for screening the ovary development process in transgenics was developed. An unique target sequence of the SERK 1 gene (on chromosome 6) for RNAi silencing has been subcloned in an appropriate vector and is being used in transforming sorghum plants.
Intellectual Property and Technology Management
IPR Portfolio7.95 IPR portfolio of ICAR has increased in terms of number of ICAR institutes undertaking IPR protection activities, the number of forms of IPR secured, and the number of IPR grants to ICAR. Whileatotalof34IPRprotectionapplications(33patentsand1trademark)werefiledby11ICARinstitutesin2001,thecorrespondingfigureshaverisenbySeptember,2012to1621IPRapplications(707patents,868plantvarieties,21Trademarks,3 Designs, and 22 copyrights). A total of 143patents (including 6 international patents), registrationof298plantvarietiesofnotifiedcrops,21trademarks,22copyrightsand3designshavebeen granted to ICAR for IP protection.

CHAPtER 8
Animal Husbandry, Dairying and Fisheries
8.1 the animal production system in India is predominantly part of a mixed crop-livestockfarming system vital for livelihood security of the farmers. In such systems, the livestock sector supplements income of the farmers, provides employment, draught power and manure etc. the livestock production system assumes special significance in the present context of sustainedeconomic growth, rising income, increasing urbanization, changes in taste and preference that have led to dietary changes reflecting thegrowingdemandformilk,meat,eggandfish.Thedevelopment of livestock sector is more inclusive and can result in a sustainable agriculture system.
Dairying and Livestock Production
Milk8.2 India continues to be the largest producer of milk in the world. the estimate of milk production in 2011-12 is 127.9million tonnes compared to121.8million tonnes in 2010-11and 53.9milliontonnesin1990-91.Percapitaavailabilityofmilkat national level has increased from 176 grams perdayin1990-91to290gramsperdayin2011-12. Growth inmilk production in 2011-12 wasabout5%overthepreviousyear.
Meat8.3 Total meat production from cattle, buffalo,sheep, goat, pig and poultry at the all India level increased from 4.01 million tonnes in 2007-08to 5.5 million tonnes in 2011-12. Poultry meatproduction from commercial poultry farms were included in the production estimates of meat from 2007-08 onwards. Growth in meatproductionachievedin2011-12wasabout13.25%over previous year.
Wool8.4 the estimated wool production at the
national level has increased to 44.7 million kg. in 2011-12incomparisonto41.2millionkg.in1990-91.Growth inwool production in 2011-12wasabout4%overthepreviousyear.
Egg8.5 the estimate of total egg production for the year 2011-12 was 66.4 billion numbers ascomparedto21.1billionduring1990-91.Growthin egg production in 2011-12 was about 5.44%over the previous year.
Fish8.6 Indiaisthesecondlargestproduceroffishin the world, contributing about 5.54 per cent of global production. The total fish productionduring2011-12isprovisionallyestimatedat8.85million tonnes compared to 8.4 million tonnes in 2010-11withagrowthofabout5.3%perannum.Morethan60%offishproductioniscontributedby the inland fisheries, the rest being from themarine sector. the Gross Domestic Product from thefisheriessectoratcurrentpricesduring2010-11wasRs.62,594crorewhichis4.93percentofthe total GDP of agriculture & allied sectors.
8.7 During2011-12,thevolumeoffishandfishproducts exported was about 8,62,000 tonnesworthaboutRs.16,597.23crorei.e.aboutUS$3billion.Theexportoffishandfishproductshasmore than doubled during the Eleventh Plan period.
8.8 Growth in fishery sub-sector is next onlyto poultry. The policy for fishery developmentemphasizes inland fisheries, particularlyaquaculture in recent years, which has been instrumental in increasing production, enhancing exportsandreducing thepovertyoffishermen.the four components of production, nutrition, health and management in these sub-sectorsare supported through various schemes of the Government.

154 State of Indian Agriculture
Table 8.1: Compound Annual Growth Rates (CAGRs) in Production of Milk, Egg, Wool and Meat at All-India Level (%)
1980-81 to 1989-90 1990-91 to 1999-00 2000-01 to 2010-11 1980-81 to 2010-11Milk 5.6 4.2 4.2 4.6Eggs 8.06 4.2 5.6 6.3Wool 3 1.7 -1.2 1.0Meat - - 7.0* -Note:*CAGRformeatproductionisfortheyear2007-08to2010-11Meatproductiondatafrom2007-08isnotcomparable with the previous years data as poultry meat production from commercial poultry farms was includedfrom2007-08onwards.
Veterinary Support Services8.11 India has a total of 10,094 veterinaryhospitals and polyclinics and 19,531 veterinarydispensariesason01.04.2012.Mostofthesehavepoor infrastructure and equipment. Further, the technical manpower is inadequate (with about 25,000 veterinarians in government sector asagainsttheestimatedrequirementofabout67,000)to support health programmes for the massive livestock population. DADF has initiated a programme for “Establishment and Strengthening of existing Veterinary Hospitals and Dispensaries (ESVHD)” to strengthen the veterinary services at the field level. There is a need to strengthenveterinary hospital facilities for timely diagnosis and treatment of animal diseases. Emphasis also needs to be given to strengthen the mobile veterinaryservicestoensuredoor-stepveterinarysupport, particularly in inaccessible areas.
8.12 the present system of disease reporting is slow. A computerized National Animal Disease Reporting System (NADRS) linking taluka, Block, District and State Headquarters to a Central Disease Reporting and Monitoring Unit at the DADF in New Delhi has been initiated in2010-11.Thesoftwareforthesystemisbeingdeveloped by NIC to ensure faster and reliable disease reporting and processing of data which will facilitate timely intervention for prevention and containment of animal diseases.
Challenges8.13 The main challenges confronting theanimal health sector include:
8.9 India has the world’s largest livestockpopulation, accounting for about half the population of buffaloes and 1/6th of the goat population. Such a large population of livestock presents a challenge wherein existing productivity levels are sustained by application of modern science and technology, incentives and policies.
Plan Schemes
Livestock Health8.10 High prevalence of various animaldiseases like Foot & Mouth Disease (FMD), Paste des Petit Ruminants (PPR), Brucellosis, ClassicalSwineFeverandAvianInfluenzaetc.isa serious impediment to growth in the livestock sector. the economic loss on account of FMD is estimated to be more than Rs.20,000 croreper annum (NCAP, Preliminary Report 2010).Most of these animal diseases can be prevented through timely immunization. the Department of Animal Husbandry, Dairying & Fisheries (DADF) has initiated National Programmes for prevention and control of FMD, PPR and Brucellosis through the State Governments. the FMD control programme initially started in 54 districtsin2003hasbeenexpandedto221districtsand will be expanded to cover the entire country in a phased manner. Similar programmes have been initiated to control PPR and Brucellosis. Shortages of vaccines and lack of proper cold chain facility are among the major hindrances to a faster implementation of these programmes.

Animal Husbandry, Dairying and Fisheries 155
• Veterinary hospitals, dispensaries and technical manpower are inadequate.
• the disease reporting is neither timely nor complete which delays proper interventions.
• Inadequate availability of vaccines and lack of cold storage infrastructure.
The Way Forward8.14 the following measures will strengthen the animal health sector:
• Adequate veterinary disease diagnosis, epidemiology, hospital infrastructure and manpower need to be developed.
• Astrongprogrammeforsupplyofsufficientveterinary vaccines is necessary.
• Expeditious operationalization of NADRS
Cattle and Buffalo Breeding8.15 the objective of the scheme of ‘National ProjectforCattleandBuffaloBreeding(NPCBB)’is to promote genetic upgradation of bovines mainly through Artificial Insemination. Semenproduction in the country has increased from 22 millionstrawsin1999-2000to63millionstrawsin2011-2012andnumberofArtificialInsemination(AI) from 21.8 to 54 million per annum. Conceptionrateincreasedfrom20%to35%.Thenumbers of animals in milk has increased from 62 millionduring2000to81.8millionduring2011-12. Crossbred cattle population has increased from 20 million (1997) to 34 million (2007).21,700 breeding bulls with high genetic merithave been inducted for natural service in the areas out of the coverage of AI services. About 36,385 Government stationary AI centres havebeen assisted and equipped to function as mobile AI centres and about 21,753 privatemobile AIcentres have been established for delivery of AI services. 11,615 Government stationary AI centres are also operating. the dairy cooperatives are alsooperatingabout14,000mobileAIcentres.Inaddition, the NGos like BAIF and JK trust are operatingabout6,000mobileAIcentres.
8.16 In order to improve the quality of semen
production a Minimum Standard Protocol (MSP) for semen production has been implemented in all semen stations and 49 frozen semen bull stations have been strengthened as per this MSP. A central Monitoring Unit (CMU) has been constituted for evaluation of one semen station in two years. thirty four semen stations in the country have acquired ISO certification against3 during 2004. MSP for progeny testing andstandard operating procedures for AI technicians has also been formulated.
Challenges8.17 the challenges facing the dairy sector include:
• Small herd size and poor productivity
• Inadequate availability of credit
• Poor access to organized markets deprive farmers of proper milk price
• PoorAIservicenet-work
• Shortage of manpower and funds
• Limited availability of quality breeding bulls
• Disease outbreaks: mortality & morbidity
• Induction of crossbred animals in areas poor in feed resources
• Majority of grazing lands are either degraded or encroached
• Diversion of feed & fodder ingredients for industrial use
The Way Forward8.18 Continuous support to the States is essential for further genetic upgradation programmes to meet the increasing demand for milk in the country. there is further need to consolidate and improve the breeding infrastructure created underNPCBBandtakeupscientificprogrammeslike Embryo transfer technology (Ett), Multi ovulation Embryo transfer technology (MoEt), Markers Assisted Selection (MAS), development of semen sexing technology and use of sexed semen for faster propagation of elite germplasm

156 State of Indian Agriculture
and for increasing bovine productivity. there is a need to upgrade the skill of the AI workers to enable them to deliver livestock extension services to the farmers apart from the AI service.
Dairying8.19 Dairying is an important source of income for millions of rural families and has assumed an important role in providing employment and income generating opportunities. the Government of India and State Governments are making strong efforts to increase the productivity of milch animals and increase the per capita availability of milk to meet the requirement. the Department of Animal Husbandry, Dairying and Fisheries (DADF) has supported building up cooperative infrastructure, revitalization of sick dairy cooperative federations and extended support for creation of infrastructure for production of quality milk and milk products. An important scheme being implemented by theDepartmentduring2012-13 is the IntensiveDairy Development Programme (IDDP) for this purpose. through IDDP scheme, assistance is provided to Dairy Milk Unions/Federations for increasing milk production, procurement, preservation, transportation and processing of milk by developing dairy infrastructure at the village and district level. this section highlights the efforts made by the Government of India through its schemes to increase production of milk.
Strengthening Infrastructure for Quality & Clean Milk Production8.20 The scheme, introduced during October,2003aimsatimprovementofthequalityofrawmilk produced at the village level by creating awareness among dairy farmers and providing basic testing and measurement equipments at the Dairy Cooperative Society level for assisting in collection and testing of milk based on which payments are made to the farmers. Under the scheme, there is a provision for training of farmers on good milking practices, setting up of Bulk Milk Cooler (BMC) at Dairy Cooperative Society level and strengthening of laboratories for testing of milk.
Assistance to Cooperatives8.21 the central sector scheme started in 1999-2000, aims at revitalizing the sick dairycooperative unions at the district level and cooperative federations at the State level. the rehabilitation plan is prepared by the National Dairy Development Board (NDDB) in consultation with the concerned State Dairy Federation and District Milk Union. Since inception, Department has approved 42 rehabilitation proposals of Milk Unions so far in Madhya Pradesh, Chhattisgarh, Haryana, Karnataka, Uttar Pradesh, Kerala, Maharashtra, Assam, Nagaland, Punjab, West Bengal and tamil Nadu at a total outlay of Rs.310.91 crore and with a central share ofRs.155.64 crore, against which an amount of Rs 116.49 crore of Central share has been released undertheschemetill31stMarch,2012.
Dairy Venture Capital Fund (DVCF)/Dairy Entrepreneurship Development Scheme (DEDS)8.22 the Dairy/Poultry Venture Capital Fund scheme was started in December, 2004. TheschemeDVCFwasclosedon31.08.2010.UnderDVCF an amount of Rs 144.99 crore was released to NABARD as revolving fund, against which anamountofRs174.39 crorewasdisbursedas Interest Free Loan by NABARD for sanctioning 18,184dairyunitstill31.08.2010.
8.23 The DVCF scheme was modified andrenamed as Dairy Entrepreneurship Development Scheme (DEDS) from 1stSeptember,2010.SinceinceptionofDEDSanamountofRs.270.40crorehas been released to NABARD, against which NABARD has sanctioned 58,278 Dairy Units and releasedbackendedcapitalsubsidyofRs.238.32croretill30.09.2012
National Dairy Plan8.24 National Dairy Plan-Phase I (NDP-I)has been approved by Government of India for implementation from 2011-12 to 2016-17with a total investment of about Rs.2242 crore comprising Rs.1584 crore as IDA credit, Rs.176 crore as Government of India share, Rs.282 crore as share of End Implementing Agencies (EIAs)

Animal Husbandry, Dairying and Fisheries 157
that will implement the project in participating States and about Rs.200 crore as the shareof NDDB and its subsidiaries for providing technical and implementation support to the project. the Board of the World Bank approved the IDA credit of $350 million (Rs 1584 crore)fortheschemeon15.3.2012.TheAdministrativeapproval of the scheme has been issued by the DADF on 16thMarch2012.AnoutlayofRs.130crore has been provided under the budget of DADFfor2012-13.
8.25 NDP–I envisages to contribute to meeting the projected national demand of 150 million tonnes of milk by 2016-17 fromdomestic production through productivity enhancement, strengthening and expanding village level infrastructure for milk procurement and providing the producers with greater access to markets. It is also envisaged that the project would provide livelihood opportunities for the farmers on terms that are fair and reasonable. ThemainobjectivesofNDP-Iare:
a) To launch a focused scientificallyplanned multi-state initiative to laythe path for new processes, supported by appropriate policy and regulatory measures leading to increasing the productivity of milch animals and thereby increase milk production to meet the rapidly growing demand for milk; and
b) to provide rural milk producers with greater access to the organised milk-processing sector. Given the rapidly increasing demand for milk, priority inNDP-Iwouldbegiventoareaswithhigher potential in the 14 major milk producingStatescontributingabout90%ofthecountry’smilkproduction;i.e.,likeUttar Pradesh, Punjab, Haryana, Gujarat, Rajasthan, Madhya Pradesh, Bihar, West Bengal, Maharashtra, Karnataka, tamil Nadu, Andhra Pradesh, orissa and Kerala.
8.26 Fourteen major milk producing States in the country will be eligible for funding under various components based on the eligibility criteria which
will comprise geographical, technical, financialand governance parameters. The benefitsaccruingfromNDP-Iwillbehoweveracrossthecountry through availability of superior quality semen.
Feed and Fodder for Livestock8.27 Availability of adequate quantity of quality feed and fodder for livestock is essential for sustaining the livestock productivity. Due to increasing pressure on land for growing food grains, oil seeds, and pulses, fodder production generally gets lower priority. With about2.29%shareofthelandareaoftheworld,India is maintaining about 10.71% world’slivestock.Further,onaccountofdiversifieduseof agriculture residues, the gap between the demand and supply of fodder is increasing. the NABCoNS, and the National Institute of Animal Nutrition and Physiology, Bangalore have estimated shortages of feed and fodder in the countrytobearound35percentorso.Availabilityof feed resources also varies from area to area. At present,fodderisbeingcultivatedonlyon4%ofgrossed cropped area, which is not adequate to meet the requirement of the livestock.
8.28 In order to bridge the gap in demand and availability of fodder and feed, the DADF is implementing a ‘Centrally Sponsored Fodder and Feed Development Scheme (CSFFDS)’during2012-13.TheCSFFDSincludes9differentcomponents under varying subsidy patterns for assisting the States in practically all activities pertaining to fodder development. taking into account the prevailing drought situation in some states, a new component of “Establishment of FodderBanks”hasbeenaddedfortheyear2012-13 to procure surplus fodder from the farmersin areas where rainfall has been satisfactory or where irrigation facility is available and convert the same to silage or fodder blocks for storage and supply on cost plus basis to the deficientareas. A relaxation has also been granted to the Cooperatives, Milk Unions/Federations, and the State Governments by enhancing the central share for establishment of fodder block making unitsto75%ofcostfortheseagenciesfortheyear2012-13.
158 State of Indian Agriculture
Challenges8.29 the main challenges in providing adequate and quality feed and fodder for the livestock include:
(i) While the number of livestock is increasing, the grazing lands are diminishing. the area available for fodder cultivation is also limited.
(ii) the production and availability of improved fodder seeds is inadequate in the country compared to the requirement.
(iii) Diversion of crop residues for other industrial use aggravates the situation. Diverse uses of agriculture crop residues (paper industry, packaging, etc.) which can be used as feed/fodder have widened the gap between demand and supply of feed and fodder.
(iv) there is lack of authentic data on availability of feed and fodder.
(v) Lack of specific extension machinerywith specialized manpower for popularization of good fodder varieties and for more efficient use of cropresidues is another constraint.
(vi) the area under coarse cereals which are also used as feed has declined since last 30 years. Less coverage of area underhigh yielding varieties of coarse cereals is another reason for less availability of coarse grains.
(vii) A substantial amount of crop residues is burnt by the farmers after harvesting main crops like wheat and paddy.
Steps taken by the Government8.30 Besides revising the Centrally SponsoredSchemeonFodderandFeedDevelopmentin2010,the DADF has taken several steps in assisting the States for augmenting the availability of feed and fodder. Certain areas have been identifiedrequiring immediate interventions like increasing the area under fodder using quality fodder seeds, increasing availability of quality seeds and to
develop common property and development of waste land/grazing land etc. for production of fodder using resources available under ongoing programmes. States have also been assisted for variouspost-harvestmanagement interventionsto reduce the wastage of crop residues and its enrichment in quality. Detailed advisories have been issued to the States to increase availability of fodder.
The way forward8.31 The measures which can contributeto increasing availability of fodder and feed include:
(i) optimum utilisation of cultivable land and wasteland is required to grow fodder as per the requirement of the farmers. the forest department can play a major role in augmenting fodder production in the country. the degraded forest areas, mostly under the Joint Forest Management Committees (JFMCs), can be used for assisting growth of indigenous improved fodder varieties of grasses,legumes,andtreesunderarea-specific silvi-pastoral systems. Whilethe JFMCs may first meet their ownrequirements, the surplus can be stored by converting to silage or fodder blocks forsupplytodeficientareas.
(ii) Production of high yielding fodder seeds and seeds for dual purpose crops need to be upscaled by incentivizing production of such seeds by having a buy-backarrangement with the farmers, mainly with the help of organized/cooperative sector.
(iii) Wastage and alternative use of crop residues may be discouraged through a well laid out system of incentives and disincentives.
(iv) there is a need for undertaking an effective extension campaign for efficient uitlisation and enrichment ofcrop residues, growing fodder crops, and post harvest interventions like fodder densification, fodder and feed

Animal Husbandry, Dairying and Fisheries 159
enrichment, Azolla production, etc. Effective dovetailing with ongoing schemes like MGNREGA and RKVY will be useful.
(v) It is necessary to popularize scientificpractices for management of feed like ration balancing, utilization of wasted crop residues as fodder and use of feed supplements like Azolla and area specificmineralmixtureetc.toimprovequality of nutrition for the livestock.
(vi) there is a need to have a mechanism in place for collection of reliable data on feed and fodder particularly for cultivated fodder production and production of crop residues.
Meat and Poultry Sector8.32 Indiahasaround141milliongoatsand71.6million sheep. In terms of population, India ranks second in the world in goats and third in sheep. Poultry sector in India is broadly divided into twosub-sectors;(i)highlyorganizedcommercialsector and (ii) the unorganized sector which generates supplementary income and provides nutrition to the rearers. Further, small and medium farmers are mostly engaged in contract farming system under larger integrators. Needs of organized and unorganized sectors of poultry are different.
8.33 Under Centrally Sponsored Scheme,‘Poultry Development’, the following threecomponents are funded by the Department:
(i) Assistance to State Poultry Farms
one time assistance is provided to strengthen farms in terms of hatchery, brooding and rearing houses, laying houses for birds with provision for feed mill and their quality monitoring and in-house disease diagnostic facilities and feedanalysis laboratory. Till date, 233 farms havebeen assisted under the scheme since inception.
(ii) Rural Backyard Poultry Development
this component envisages supply of backyard poultry to beneficiaries from Below PovertyLine (BPL) families to enable them to gain
supplementary income and nutritional support. Assistance to States have been provided to cover over 3 lakh BPL beneficiary families between2009-10and2011-12.
(iii) Poultry Estates
Entrepreneurship skills are to be improved through an exploratory pilot project, ‘Poultry Estates’ in two States. It ismeant primarily foreducated, unemployed youth and small farmers withsomemarginmoney,formakingaprofitableventure out of various poultry related activities inascientificandbio-secureclusterapproach.
Poultry Venture Capital Fund8.34 The scheme provides finance throughNABARD for components like establishment of poultry breeding farm with low input technology birds,establishmentoffeedgo-down,feedmill,feed analytical laboratory, marketing of poultry products, egg grading, packing and storage for export capacity, retail poultry dressing unit, egg and broiler carts for sale of poultry products and central grower unit, etc. this scheme is implemented on back-ended Capital Subsidymodeattherateof33.3%forSC/STbeneficiariesandforNorthEastStatesand25%forothers.
Central Poultry Development Organizations & Central Poultry Performance Testing Centre8.35 The four centres of the Central PoultryDevelopment organizations are located at Chandigarh (Northern Region), Bhubaneswar (Eastern Region), Mumbai (Western Region) and Bangalore (Southern Region) while one Central Poultry Performance testing Centre is at Gurgaon, Haryana. these centres are promoting the development of poultry through the following measures:
• Availability of quality chicks of identifiedlow-inputtechnologypoultrystocks.
• Diversification into rearing of Duck, Emuand turkey (Southern Region), Japanese Quail (Northern andWestern region) andGuinea fowl (Eastern region).

160 State of Indian Agriculture
• training of trainers, farmers, women beneficiaries, various public and privatesector poultry organizations, NGos, Banks, Cooperatives and foreign trainees etc.
• Regular testing of various stocks available in the country to assess their performance.
Challenges8.36 Thechallengesfacingthemeatandpoultrysector include:
• Availability of feed ingredients like maize and soyabean is a major challenge, as poultry feed constitutes nearly 70% of the cost ofproduction and availability of these feed ingredients at a reasonable cost is essential for sustaining the growth rate.
• Pathogenic and emerging diseases namely Avian Influenza often causes heavy lossesboth in domestic market and international trade.
• there is a need for realistic national marketing intelligence to bridge the gap between supply and demand of poultry & poultry products.
• to meet the growing demand of sustainable and safe production there is a huge demand for trained and skilled manpower in poultry sector.
• Large size of target population to be improved in terms of productivity with application of science and technology pose a formidable challenge.
• Low level of processing and value addition in animal products.
The Way Forward8.37 The following measures are necessaryto strengthen the meat and poultry sector for accelerated and sustainable growth:
• Long-term sustainable productionmeasures have to be looked into to increase the production of maize and soyabean. Alternative feed resources have to be explored.
• Active surveillance, monitoring and control in case of any outbreaks in rapid manner.
• Network for a realistic national and global poultry database and marketing intelligence may be developed.
• Sufficient trained manpower should bedeveloped in the existing institutions.
• With growing urbanization and increasing quality consciousness, the market for scientifically produced meat products isexpected to grow rapidly. the market is growingforready-to-eatandsemi-processedmeatproductsbecauseofachangingsocio-economic scenario and increase in exports to neighboring countries, especially the Middle East.
• the mechanized slaughter houses produce huge quantities of offal and digesta from the slaughtered animals which could be profitably utilized for production of valueaddedproducts, likeMeat-cum-BoneMeal(MBM), tallow, Bone Chips, Pet Foods and methane as a source of energy for value addition in most of the modern plants.
• there is a need to support pig rearing in order to improve sow productivity, growth rate of pigletsandfeedconversionefficiency.
• It is important to encourage proper utilization of by-products of livestock slaughter forhigher income of livestock owners. the environmental pollution and spread of livestock diseases need to be prevented.
Fisheries Sector8.38 Allocationsmade for thedevelopmentoffisheriessectorthroughtheCentrallySponsoredSchemes and Central Sector Schemes are utilized for implementation of both development and welfare oriented schemes through the respective states and Uts. In addition to the allocations made through these schemes, assistance is provided to States through other flagship programmes likeRashtriya Krishi Vikas Yojana (RKVY) including the National Mission for Protein Supplements (NMPS).

Animal Husbandry, Dairying and Fisheries 161
National Fisheries Development Board8.39 National Fisheries Development Board(NFDB) has been established by the Government in2006asaspecialpurposevehicleforaccelerateddevelopment of the fisheries and aquaculturein a sustainable manner through upgradation of production technologies, management and utilization of resources, establishment of infrastructure for post-harvest operations andmarkets. NFDB has during the Eleventh Plan Period investednearlyRs.400 crore for variousdevelopmental activities. It is proposed to merge all Centrally Sponsored Schemes aimed at growth and enhancement of production and productivity in NFDB during twelfth Plan to provide greater focus and an integrated approach tothedevelopmentoffisheriesandaquaculturein the country.
Marine Fisheries Development Scheme8.40 During Eleventh Five Year Plan, theMarine Fisheries Development Scheme made provisionfordevelopmentof13fishingharborsand4fishlandingcentres,4fishingharborswererepairedandrenovated.Inaddition,43unitsofpost harvest infrastructure like ice plants, retail outlets were created; 8,342 traditional craftsmotorized; 3,921 safety appliances provided;40,993KLofHSDprovidedtofisherswithrebate;3deepsearesource-specificfishingvesselswerepromoted; introduction of 88 intermediate crafts wastakenupandonenewprivatefishingharborwas funded under a Build, operate and transfer (Bot) package.
Inland Fishery Development Scheme8.41 Under the scheme, 99,689 ha area of fresh water and 39,750 ha area of brackish waterwere covered for aquaculture and 1,69,907 fishfarmers were provided assistance for freshwater aquacultureand28,171fishfarmersforbrackishwater aquaculture during Eleventh Plan period.
Fishermen Welfare Scheme8.42 Under the scheme, during Eleventh Plan Period funds were released for coverage of 38lakhfishersforinsurance,constructionof31,400
houses, benefit of 4 lakh fishers under Saving-cum-reliefschemeandtrainingof31,648fishersinvariousfishfarmingandpostharvestactivities.
Database Scheme8.43 Underthescheme,inlandwaterbodiesaresurveyed and mapped in the States. through a pilot project, mapping of smaller water bodies has been completed in the State of West Bengal. Marine Fisheries Census was completed in all maritime states and islands. Registration of fishingvessels inall the coastalStatesandUTshas been initiated and development of database is under progress.
Challenges8.44 The main challenges facing the fisheriessector include:
• Shortage of quality and healthy fish seedsand other critical inputs.
• Lackofresource-specificfishingvessels.
• Inadequate awareness about nutritional and economicbenefitsoffish.
• Inadequateextensionstaffforfisheriesandtrainingforfishersandfisheriespersonnel.
• Low utilization and productivity of water bodies.
The Way Forward8.45 the following measures will help to further strengthenthefisheriessector:
• Schemes of integrated approach for enhancing inlandfishproductionandproductivitywithforward and backward linkages right from production chain and input requirements like qualityfishseedsandfishfeedsandcreationof required infrastructure for harvesting, hygienic handling, value addition and marketingoffish.
• Existing Fish Farmers Development Authority (FFDAs) need to be revamped and cooperative sectors, SHGs and youths be actively involved in intensive aquaculture activities.
162 State of Indian Agriculture
• Largescaleadoptionofculture-basedcapturefisheriesandcagecultureinreservoirsandlarger water bodies are to be taken up.
• Sustainable exploitation of marine fisheryresources especially deep sea resources and enhancement of marine fish productionthrough sea farming, mariculture, resource replenishment programme like setting up of artificialreefsetc.needtobetakenup.
Measures taken to address Inflation in Animal Products8.46 Food inflation in the last two years hasbeen impacted largely by increase in prices of animalproducts likemilk,fish,meat andeggs.Inflation for the broad group “eggs, meat andfish”hasgenerallybeenindoubledigitsduring2011-2012.Ithasshownsignsofmoderationwithinflation at 13.28% for period ending October,2012.Inflationofmilkhasbeenlargelyindoubledigitsduring2011-12buthasshowndownwardtrend during the current year, recording 6.35%forperiodendingOctober,2012.
8.47 The increase in inflation of protein rich
animal products was mainly due to increase in their consumption on account of rising incomes and also shifts in consumer preferences. this is also reflected in per capita increase in theirconsumption.
8.48 Government has taken various measures during 2011-12 to increase production and tomoderate inflation in animal products. TheNational Mission on Protein Supplements (NMPS) has been launched as a component of RKVY in 2011-12 for taking up activities topromote production of animal based protein through livestock development, dairy farming, pigandgoatrearingandfisheries.TheallocationforNMPSwasRs.300crorein2011-12,whichhasbeen increased toRs. 500 croreduring2012-13.to improve productivity in dairy sector, National Dairy Plan – Phase I with an outlay of Rs. 2242 crorehasbeenlaunchedduringMarch2012forimplementation during twelfth Five Year Plan with the assistance of the World Bank. the State Governments are also being requested to provide greater allocation under RKVY for taking up activities for promoting animal husbandry, dairyingandfisheries.

Annexure 163
Annexure. 1.1: Plan-wise Growth Rates (%) by Economic Activity(at 2004-05 prices)
Year Five Year Plan Total Economy
Agriculture, forestry &
fishing
Agriculture, incl.
livestock
Forestry & logging
Fishing
1951-52 First Plan (1951-56)
2.3 1.5 1.6 -0.2 6.21952-53 2.8 3.2 4.2 -5.4 5.51953-54 6.1 7.7 9.0 -3.2 2.11954-55 4.2 2.9 2.8 3.8 7.51955-56 2.6 -0.9 -1.5 4.0 8.1 Average 3.6 2.9 3.2 -0.2 5.91956-57 Second Plan
(1956-61)5.7 5.4 6.0 -0.7 11.1
1957-58 -1.2 -4.5 -5.1 0.4 2.31958-59 7.6 10.1 11.2 -0.2 4.31959-60 2.2 -1.0 -1.5 3.5 0.91960-61 7.1 6.7 7.3 1.1 6.9 Average 4.3 3.3 3.6 0.8 5.11961-62 Third Plan
(1961-66)3.1 0.1 -0.3 4.0 2.8
1962-63 2.1 -2.0 -2.1 0.2 -5.11963-64 5.1 2.3 1.9 5.8 9.31964-65 7.6 9.2 10.3 -1.7 10.01965-66 -3.7 -11.0 -13.5 13.4 0.0 Average 2.8 -0.3 -0.7 4.3 3.41966-67 Annual Plan
(1966-67)1.0 -1.4 -2.3 4.9 3.6
1967-68 Annual Plan (1967-68)
8.1 14.9 17.1 -0.4 4.3
1968-69 Annual Plan (1968-69)
2.6 -0.2 -0.3 0.4 6.0
Average 3.9 4.4 4.8 1.6 4.71969-70 Fourth Plan
(1969-74)6.5 6.4 7.2 -0.3 2.4
1970-71 5.0 7.1 7.4 4.9 2.61971-72 1.0 -1.9 -2.7 4.4 6.41972-73 -0.3 -5.0 -5.6 -0.9 2.71973-74 4.6 7.2 8.4 -2.8 2.9 Average 3.4 2.8 3.0 1.1 3.41974-75 Fifth Plan
(1974-79)1.2 -1.5 -2.8 8.7 7.6
1975-76 9.0 12.9 14.2 2.8 6.11976-77 1.2 -5.8 -6.1 -3.3 -3.31977-78 7.5 10.0 12.5 -11.5 0.01978-79 5.5 2.3 2.0 5.4 4.8 Average 4.9 3.6 4.0 0.4 3.1

164 State of Indian Agriculture
1979-80 Annual Plan (1979-80)
-5.2 -12.8 -13.4 -8.9 -0.7
1980-81 Sixth Plan (1980-85)
7.2 12.9 14.4 -1.5 1.81981-82 5.6 4.6 4.8 2.8 0.91982-83 2.9 -0.3 -0.1 -1.9 -1.11983-84 7.9 10.1 10.8 -3.2 19.61984-85 4.0 1.6 1.5 0.4 6.8 Average 5.5 5.8 6.3 -0.7 5.61985-86 Seventh Plan
(1985-90)4.2 0.3 0.2 0.6 3.3
1986-87 4.3 -0.4 -0.4 -1.2 0.51987-88 3.5 -1.6 -1.7 -1.8 2.71988-89 10.2 15.6 16.8 -0.6 9.11989-90 6.1 1.2 0.4 9.9 11.4 Average 5.7 3.0 3.1 1.4 5.41990-91 Annual Plan
(1990-91)5.3 4.0 4.3 -1.3 4.8
1991-92 Annual Plan (1991-92)
1.4 -2.0 -2.3 0.8 3.6
Average 3.4 1.0 1.0 -0.3 4.21992-93 Eighth Plan
(1992-97)5.4 6.7 7.1 -2.3 8.5
1993-94 5.7 3.3 3.2 -0.5 11.21994-95 6.4 4.7 4.7 2.7 6.31995-96 7.3 -0.7 -1.0 -0.4 5.21996-97 8.0 9.9 10.4 1.5 8.1 Average 6.5 4.8 4.9 0.2 7.91997-98 Ninth Plan
(1997-2002)4.3 -2.6 -3.0 2.5 1.7
1998-99 6.7 6.3 7.1 1.2 -5.01999-00 7.6 2.7 2.4 4.4 7.02000-01 4.3 0.0 -0.6 2.7 4.72001-02 5.5 6.0 6.5 3.1 5.0 Average 5.7 2.5 2.5 2.8 2.72002-03 Tenth Plan
(2002-07)4.0 -6.6 -8.1 0.7 4.1
2003-04 8.1 9.0 10.8 -1.1 3.62004-05 7.0 0.2 0.1 2.1 -2.02005-06 9.5 5.1 5.5 1.8 5.92006-07 9.6 4.2 4.1 3.3 6.6 Average 7.6 2.4 2.5 1.3 3.62007-08 Eleventh Plan
(2007-12)9.3 5.8 6.3 1.4 5.8
2008-09 6.7 0.1 -0.3 1.9 2.72009-10 8.6 0.8 0.4 2.9 3.22010-11 (QE) 9.3 7.9 8.8 2.2 5.42011-12 (RE) 6.2 3.6 3.9 2.4 1.8 Average 8.0 3.7 3.8 2.1 3.8

Annexure 165
Annexure 1.2: Plan-wise GDP Share (%) to Total Economy by Economic Activity(at 2004-05 prices)
Year Five Year Plan Agriculture, forestry &
fishing
Agriculture, incl. livestock
Forestry & logging
Fishing
1950-51
First Plan (1951-56)
51.9 41.8 14.3 1.01951-52 51.4 41.5 14.0 1.01952-53 51.6 42.1 12.9 1.01953-54 52.4 43.2 11.7 1.01954-55 51.7 42.6 11.7 1.01955-56 50.0 41.0 11.9 1.1 Average 51.4 42.1 12.4 1.01956-57
Second Plan (1956-61)
49.9 41.1 11.1 1.11957-58 48.2 39.5 11.3 1.21958-59 49.3 40.8 10.5 1.11959-60 47.8 39.3 10.6 1.11960-61 47.6 39.4 10.0 1.1 Average 48.6 40.0 10.7 1.11961-62
Third Plan (1961-66)
46.3 38.1 10.1 1.11962-63 44.4 36.5 9.9 1.01963-64 43.2 35.4 10.0 1.11964-65 43.9 36.3 9.1 1.11965-66 40.5 32.6 10.8 1.2 Average 43.7 35.8 10.0 1.11966-67 Annual Plan (1966-67) 39.6 31.5 11.2 1.21967-68 Annual Plan (1967-68) 42.0 34.2 10.3 1.11968-69 Annual Plan (1968-69) 40.9 33.2 10.1 1.2 Average 40.8 33.0 10.5 1.21969-70
Fourth Plan (1969-74)
40.9 33.4 9.4 1.11970-71 41.7 34.2 9.4 1.11971-72 40.5 32.9 9.7 1.21972-73 38.6 31.2 9.7 1.21973-74 39.5 32.3 9.0 1.2 Average 40.2 32.8 9.4 1.21974-75
Fifth Plan (1974-79)
38.5 31.1 9.7 1.31975-76 39.9 32.5 9.1 1.21976-77 37.1 30.2 8.7 1.21977-78 38.0 31.6 7.2 1.11978-79 36.8 30.6 7.2 1.1 Average 38.1 31.2 8.4 1.21979-80 Annual Plan (1979-80) 33.9 27.9 6.9 1.1
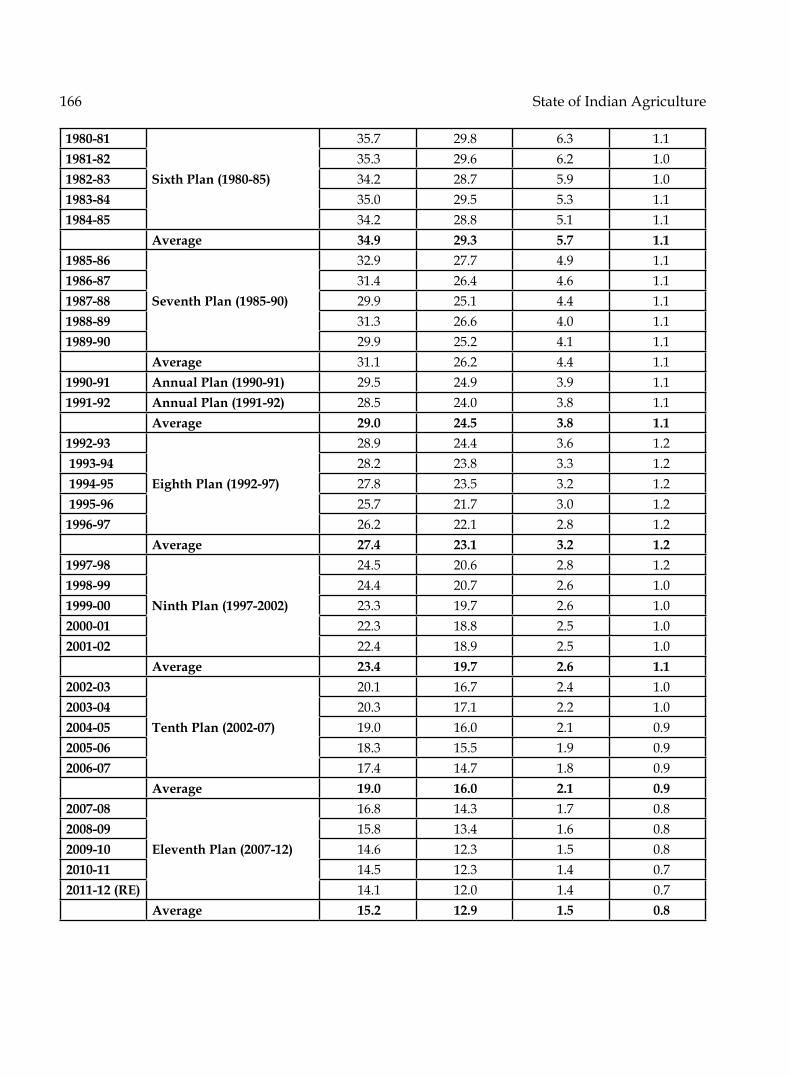
166 State of Indian Agriculture
1980-81
Sixth Plan (1980-85)
35.7 29.8 6.3 1.11981-82 35.3 29.6 6.2 1.01982-83 34.2 28.7 5.9 1.01983-84 35.0 29.5 5.3 1.11984-85 34.2 28.8 5.1 1.1 Average 34.9 29.3 5.7 1.11985-86
Seventh Plan (1985-90)
32.9 27.7 4.9 1.11986-87 31.4 26.4 4.6 1.11987-88 29.9 25.1 4.4 1.11988-89 31.3 26.6 4.0 1.11989-90 29.9 25.2 4.1 1.1 Average 31.1 26.2 4.4 1.11990-91 Annual Plan (1990-91) 29.5 24.9 3.9 1.11991-92 Annual Plan (1991-92) 28.5 24.0 3.8 1.1 Average 29.0 24.5 3.8 1.11992-93
Eighth Plan (1992-97)
28.9 24.4 3.6 1.2 1993-94 28.2 23.8 3.3 1.2 1994-95 27.8 23.5 3.2 1.2 1995-96 25.7 21.7 3.0 1.21996-97 26.2 22.1 2.8 1.2 Average 27.4 23.1 3.2 1.21997-98
Ninth Plan (1997-2002)
24.5 20.6 2.8 1.21998-99 24.4 20.7 2.6 1.01999-00 23.3 19.7 2.6 1.02000-01 22.3 18.8 2.5 1.02001-02 22.4 18.9 2.5 1.0 Average 23.4 19.7 2.6 1.12002-03
Tenth Plan (2002-07)
20.1 16.7 2.4 1.02003-04 20.3 17.1 2.2 1.02004-05 19.0 16.0 2.1 0.92005-06 18.3 15.5 1.9 0.92006-07 17.4 14.7 1.8 0.9 Average 19.0 16.0 2.1 0.92007-08
Eleventh Plan (2007-12)
16.8 14.3 1.7 0.82008-09 15.8 13.4 1.6 0.82009-10 14.6 12.3 1.5 0.82010-11 14.5 12.3 1.4 0.72011-12 (RE) 14.1 12.0 1.4 0.7 Average 15.2 12.9 1.5 0.8

Annexure 167
Annexure 1.3: Plan-wise and Year-wise Share (%) of Public & Private Sector in Gross Capital Formation (GCF)
(2004-05 prices)
Plan Period Year
(%) Share of Public & Private GCF in
GCF of Agriculture & Allied Sectors
(%) Share of Public & Private GCF in
GCF of Agriculture Sector incl. livestock
(%) Share of Public & Private GCF in
GCF of Forestry & logging Sector
(%) Share of Public & Private GCF in GCF of Fishing
SectorPublic Private Public Private Public Private Public Private
Third Plan (1961-66)
1959-60 NA1960-61 44.6 55.4 44.0 56.0 97.7 2.3 0 1001961-62 39.7 60.3 39.1 60.9 105.2 -5.2 0 1001962-63 44.0 56.0 42.9 57.1 103.2 -3.2 0 1001963-64 42.1 57.9 41.3 58.7 98.5 1.5 0 1001964-65 38.9 61.1 38.2 61.8 96.1 3.9 0 1001965-66 41.3 58.7 40.7 59.3 96.4 3.6 0 100
Average 41.2 58.8 40.4 59.6 99.9 0.1 0 100Annual Plan (1966-67)
1966-67 32.7 67.3 32.0 68.0 98.2 1.8 0 100
Annual Plan (1967-68)
1967-68 27.9 72.1 27.0 73.0 95.1 4.9 0 100
Annual Plan (1968-69)
1968-69 29.0 71.0 28.5 71.5 96.7 3.3 0 100
Average Fourth Plan (1969-74)
1969-70 28.4 71.6 27.8 72.2 105.2 -5.2 0 1001970-71 32.4 67.6 31.7 68.3 98.3 1.7 0 1001971-72 32.6 67.4 31.9 68.1 98.2 1.8 0 1001972-73 39.8 60.2 39.5 60.5 98.1 1.9 0.0 100.01973-74 35.9 64.1 35.6 64.4 98.0 2.0 0.2 99.8
Average 33.8 66.2 33.3 66.7 99.6 0.4 0.0 100.0Fifth Plan (1974-79)
1974-75 32.7 67.3 32.4 67.6 98.4 1.6 0.4 99.61975-76 35.3 64.7 34.9 65.1 98.7 1.3 0.7 99.31976-77 40.2 59.8 39.7 60.3 98.7 1.3 0.7 99.31977-78 41.9 58.1 41.5 58.5 100.8 -0.8 0.6 99.41978-79 38.8 61.2 38.2 61.8 98.6 1.4 0.6 99.4
Average 37.8 62.2 37.4 62.6 99.1 0.9 0.6 99.4Annual Plan (1979-80)
1979-80 40.4 59.6 39.8 60.2 98.6 1.4 0.6 99.4
Sixth Plan (1980-85)
1980-81 49.2 50.8 48.5 51.5 99.0 1.0 1.3 98.71981-82 54.7 45.3 54.0 46.0 99.2 0.8 1.5 98.51982-83 51.2 48.8 50.3 49.7 99.1 0.9 1.6 98.41983-84 48.1 51.9 46.7 53.3 98.9 1.1 2.6 97.41984-85 49.5 50.5 48.3 51.7 98.9 1.1 3.8 96.2
Average 50.5 49.5 49.6 50.4 99.0 1.0 2.2 97.8Seventh Plan (1985-90)
1985-86 46.6 53.4 45.6 54.4 99.7 0.3 2.4 97.61986-87 43.8 56.2 42.6 57.4 98.7 1.3 3.4 96.61987-88 35.8 64.2 35.0 65.0 98.0 2.0 1.8 98.21988-89 35.8 64.2 34.7 65.3 98.2 1.8 0.9 99.11989-90 31.0 69.0 29.5 70.5 98.3 1.7 0.9 99.1

168 State of Indian Agriculture
Average 38.6 61.4 37.5 62.5 98.6 1.4 1.9 98.1Annual Plan (1990-91)
1990-91 20.6 79.4 19.1 80.9 98.2 1.8 0.7 99.3
Annual Plan (1991-92)
1991-92 26.0 74.0 24.4 75.6 98.4 1.6 0.6 99.4
Average Eighth Plan (1992-97)
1992-93 22.0 78.0 20.8 79.2 98.2 1.8 0.1 99.91993-94 27.0 73.0 26.1 73.9 98.0 2.0 0.4 99.61994-95 31.2 68.8 30.6 69.4 98.1 1.9 0.2 99.81995-96 31.5 68.5 31.0 69.0 98.0 2.0 0.2 99.81996-97 27.9 72.1 27.3 72.7 97.9 2.1 0.1 99.9
Average 27.9 72.1 27.2 72.8 98.0 2.0 0.2 99.8Ninth Plan (1997-2002)
1997-98 22.1 77.9 21.2 78.8 97.4 2.6 0.1 99.91998-99 20.7 79.3 19.8 80.2 97.0 3.0 0.3 99.71999-00 15.0 85.0 14.6 85.4 95.2 4.8 -0.1 100.12000-01 15.2 84.8 14.8 85.2 95.5 4.5 0.0 100.02001-02 14.4 85.6 14.3 85.7 94.3 5.7 0.0 100.0
Average 17.5 82.5 16.9 83.1 95.9 4.1 0.1 99.9Tenth Plan (2002-07)
2002-03 14.0 86.0 14.2 85.8 94.6 5.4 0.0 100.02003-04 18.1 81.9 17.6 82.4 95.9 4.1 0.0 100.02004-05 21.3 78.7 22.1 77.9 95.9 4.1 0.0 100.02005-06 23.0 77.0 23.8 76.2 94.6 5.4 0.0 100.02006-07 25.0 75.0 25.9 74.1 96.5 3.5 0.0 100.0
Average 20.3 79.7 20.7 79.3 95.5 4.5 0.0 100.0Eleventh Plan (2007-12)
2007-08 22.0 78.0 22.9 77.1 97.0 3.0 0.0 100.02008-09 16.2 83.8 16.6 83.4 92.2 7.8 0.0 100.02009-10 17.3 82.7 18.0 82.0 94.6 5.3 0.0 100.02010-11 15.1 84.9 15.7 84.3 93.9 6.1 0.0 100.02011-12
Average (first four years)
17.7 82.3 18.3 81.7 94.4 5.6 0.0 100.0

Annexure 169
Annexure 1.4: Plan-wise and Year-wise share (%) of GCF/Investment(2004-05 prices)
Plan Period Year (%) Share of GCF in Agriculture & Allied Sectors to GCF in the total Economy
(%) Share of Agriculture & Allied Sectors
GCF to GDP in Agriculture & Allied Sectors
(%) Share of GCF in total Economy to GDP in total
Economy
Public Private TotalFirst Plan (1951-56) 1950-51 23.5 7.3 16.1
1951-52 25.2 7.5 15.31952-53 26.6 6.7 13.01953-54 28.8 6.4 11.61954-55 24.3 6.5 13.71955-56 23.6 7.4 15.7
Average 25.7 6.9 13.9Second Plan (1956-61) 1956-57 21.0 7.9 18.9
1957-58 19.8 7.6 18.61958-59 21.6 6.6 15.01959-60 15.1 5.4 17.21960-61 14.5 18.7 16.6 6.2 17.8
Average 18.8 6.8 17.5Third Plan (1961-66) 1961-62 13.7 19.8 16.8 6.7 18.5
1962-63 13.1 19.4 16.0 7.1 19.61963-64 12.0 21.0 15.9 7.7 20.81964-65 11.7 20.4 15.8 7.7 21.51965-66 12.0 19.6 15.6 8.7 22.6
Average 12.5 20.0 16.0 7.6 20.6Annual Plan (1966-67) 1966-67 11.5 21.2 16.7 9.6 22.9Annual Plan (1967-68) 1967-68 12.9 24.2 19.5 10.2 22.0Annual Plan (1968-69) 1968-69 14.5 26.7 21.5 11.2 21.4Average 13.0 24.0 19.2 10.4 22.1Fourth Plan (1969-74) 1969-70 14.3 24.1 20.2 10.5 21.2
1970-71 14.6 20.7 18.2 8.6 19.71971-72 14.1 19.6 17.4 9.4 21.91972-73 15.2 21.8 18.6 10.4 21.61973-74 14.3 19.9 17.4 9.6 21.7
Average 14.5 21.2 18.4 9.7 21.2Fifth Plan (1974-79) 1974-75 14.6 18.0 16.7 9.9 22.9
1975-76 14.1 22.9 18.8 9.0 19.11976-77 16.1 23.6 19.9 11.5 21.51977-78 16.9 19.6 18.4 11.0 22.81978-79 17.1 21.2 19.4 12.6 23.9
Average 15.8 21.0 18.6 10.8 22.0Annual Plan (1979-80) 1979-80 17.0 23.0 20.2 14.4 24.2

170 State of Indian Agriculture
Sixth Plan (1980-85) 1980-81 17.0 20.0 18.4 11.6 22.51981-82 13.3 13.4 13.3 9.3 24.81982-83 11.9 15.9 13.6 9.8 24.81983-84 12.3 18.2 14.8 9.8 23.21984-85 11.0 15.0 12.7 9.0 24.1
Average 13.1 16.5 14.6 9.9 23.9Seventh Plan (1985-90) 1985-86 9.5 12.9 11.1 8.5 25.3
1986-87 8.5 14.4 11.1 9.1 25.71987-88 9.4 17.7 13.5 11.2 24.81988-89 8.1 13.6 11.0 9.0 25.61989-90 7.0 13.8 10.6 8.9 25.2
Average 8.5 14.5 11.4 9.3 25.3Annual Plan (1990-91) 1990-91 6.6 19.9 14.1 12.8 26.9Annual Plan (1991-92) 1991-92 6.0 15.2 10.9 9.1 23.9Average 6.3 17.6 12.5 11.0 25.4Eighth Plan (1992-97) 1992-93 6.5 16.1 12.2 11.0 26.1
1993-94 6.7 14.9 11.2 9.1 23.11994-95 6.3 10.9 8.9 8.1 25.31995-96 6.7 7.8 7.4 8.1 28.01996-97 6.8 9.9 8.8 7.9 23.6
Average 6.6 11.9 9.7 8.8 25.2Ninth Plan (1997-2002) 1997-98 5.8 8.8 7.9 8.6 26.8
1998-99 5.7 9.8 8.5 9.2 26.41999-00 5.4 12.6 10.5 13.1 29.12000-01 5.1 12.4 10.2 11.9 26.02001-02 6.0 14.3 11.9 14.6 27.5
Average 5.6 11.6 9.8 11.5 27.1Tenth Plan (2002-07) 2002-03 5.7 12.2 10.5 14.2 27.2
2003-04 6.3 10.0 9.0 12.4 27.82004-05 6.7 7.3 7.2 13.5 35.82005-06 7.1 7.0 7.0 14.6 38.02006-07 7.1 6.4 6.6 14.9 39.3
Average 6.6 8.6 8.1 13.9 33.6Eleventh Plan (2007-12) 2007-08 6.1 6.5 6.4 16.1 42.5
2008-09 4.8 9.3 8.1 19.4 37.82009-10 5.1 7.8 7.1 19.8 40.82010-11 4.5 8.1 7.2 20.1 40.42011-12
Average (first four years) 5.1 7.9 7.2 18.8 40.4

Annexure 171
Annexure. 1.5: All India Average Annual Growth Rates of Area, Production and Yield of Principal Crops
Crops Average Growth (%) Average Growth (%)
11th Plan (2002-03 to 2006-07)
12th Plan (2007-08 to 2011-12)
Area Production Yield Area Production Yield
Rice -0.39 1.25 1.17 0.16 2.48 2.23
Wheat 1.30 1.11 -0.32 1.34 4.42 3.05
Jowar -2.84 -0.89 2.07 -5.50 -2.93 3.09
Bajra 1.67 17.12 7.28 -1.55 7.40 8.36
Maize 3.77 4.02 -0.15 1.99 8.72 6.46
Ragi -5.52 -2.67 0.40 0.95 8.86 6.90
Small Millets -5.03 -2.49 2.32 -4.78 12.76 17.60
Barley -0.28 -1.21 -0.90 0.79 6.19 4.29
Coarse Cereals -0.26 2.55 1.75 -1.63 5.67 7.30
Total Cereals 0.07 1.21 0.74 -0.04 3.61 3.59
Gram 3.60 4.70 0.28 2.36 4.34 1.91
Tur 1.38 1.06 -0.41 3.28 4.83 1.33
Total Pulses 1.31 2.66 0.65 1.61 4.41 2.66
Total Foodgrains 0.29 1.29 0.59 0.24 3.65 3.35
Sugarcane 3.98 4.90 0.66 0.24 0.79 0.48
Groundnut -1.65 3.61 4.32 -0.69 15.75 13.65
Sesamum 0.98 3.64 0.51 2.57 8.52 5.40
R&M 7.32 11.55 3.24 -1.63 0.05 1.18
Sunflower 14.04 13.83 0.37 -18.96 -14.98 5.82
Soyabea 5.80 12.26 6.18 4.14 7.82 3.88
Total Nine Oilseeds 3.55 7.99 3.53 0.02 5.67 5.36
Cotton 0.57 20.01 19.40 5.97 10.46 3.93
Jute -1.82 -0.38 1.49 0.48 1.57 0.90
Mesta -3.85 -2.44 1.45 -5.56 -5.43 -0.26
Jute & Mesta -2.15 -0.58 1.45 -0.42 0.94 -0.26
Source: Directorate of Economics & Statistics, Ministry of Agriculture.

172 State of Indian Agriculture
Annexure. 2.1: Land Use Classification(Area in thousand ha.)
Year Geo- graphical
Area
Agri. Land/Cultivable
land/Culturable
land/Arable
land
Forests Not available for cultivation
Other uncultivated land excluding fallow land
Fallow Lands Total cropped
areaArea
under non- agri-
cultural uses
Barren and un-
culturable land
Permanent pastures & other grazing lands
Land under Misc. tree crops &
groves (not incl. in net area sown)Permanent
pastures & other grazing lands
culturable waste land
Fallow lands other than
current fallows
Current fallows
1950-51 328726 189641 40482 9357 38160 6675 19828 22943 17445 10679 131893
1960-61 179689 54052 14840 35911 13966 4459 19212 11180 11639 152772
1970-71 182056 63830 16478 28128 13261 4367 17500 8728 10598 165791
1980-81 185156 67460 19596 19958 11989 3578 16744 9720 14826 172630
1990-91 185177 67805 21087 19389 11404 3818 14995 9662 13703 185742
1991-92 185000 67866 21465 19270 11299 3761 14994 9941 14672 182242
1992-93 184875 67981 21771 19122 11096 3781 14589 9672 14188 185618
1993-94 184734 68277 22210 18694 10966 3696 14409 9834 14376 186595
1994-95 184173 68603 22556 18463 11034 3732 14262 9969 13250 188053
1995-96 183623 68817 22362 19009 11064 3481 14098 10016 13831 187471
1996-97 184121 69103 22554 17964 10880 3655 14021 10192 13323 189502
1997-98 183972 69245 23138 17461 10845 3730 13943 10078 14275 189988
1998-99 184024 69215 23348 17524 10896 3679 13899 10106 13587 191649
1999-00 183873 69164 23598 17536 10845 3725 13742 10289 15053 188396
2000-01 183455 69843 23752 17483 10662 3445 13631 10267 14777 185340
2001-02 183551 69720 23912 17417 10528 3453 13520 10534 15344 188286
2002-03 183449 69821 24118 17520 10450 3443 13651 11967 22337 174108
2003-04 183132 69968 24513 17469 10484 3383 13241 11313 14487 189669
2004-05 182946 69960 24757 17471 10452 3364 13272 10878 14790 191119
2005-06(p) 182685 69994 24989 17334 10444 3391 13225 10696 14211 192756
2006-07(p) 182508 70002 25436 17290 10414 3364 13271 10516 15509 192408
2007-08(p) 182691 70020 25711 16990 10198 3413 13059 10329 14512 195138
2008-09(p) 182514 70034 26064 16798 10177 3356 12752 10286 14191 195357
2009-10(p) 182466 70042 26171 16783 10149 3351 12857 10484 15753 192197
(p) : Provisional except Geographical Area.# : In 2002-03 there is significant decline in Total Cropped Area and Net Area Sown due to decline in net area sown in the States of Andhra Pradesh, Karnataka, Kerala, Madhya Pradesh Maharashtra, Orissa, Rajasthan, Tamil Nadu, West Bengal and Haryana.This was mainly due to deficient rainfall.
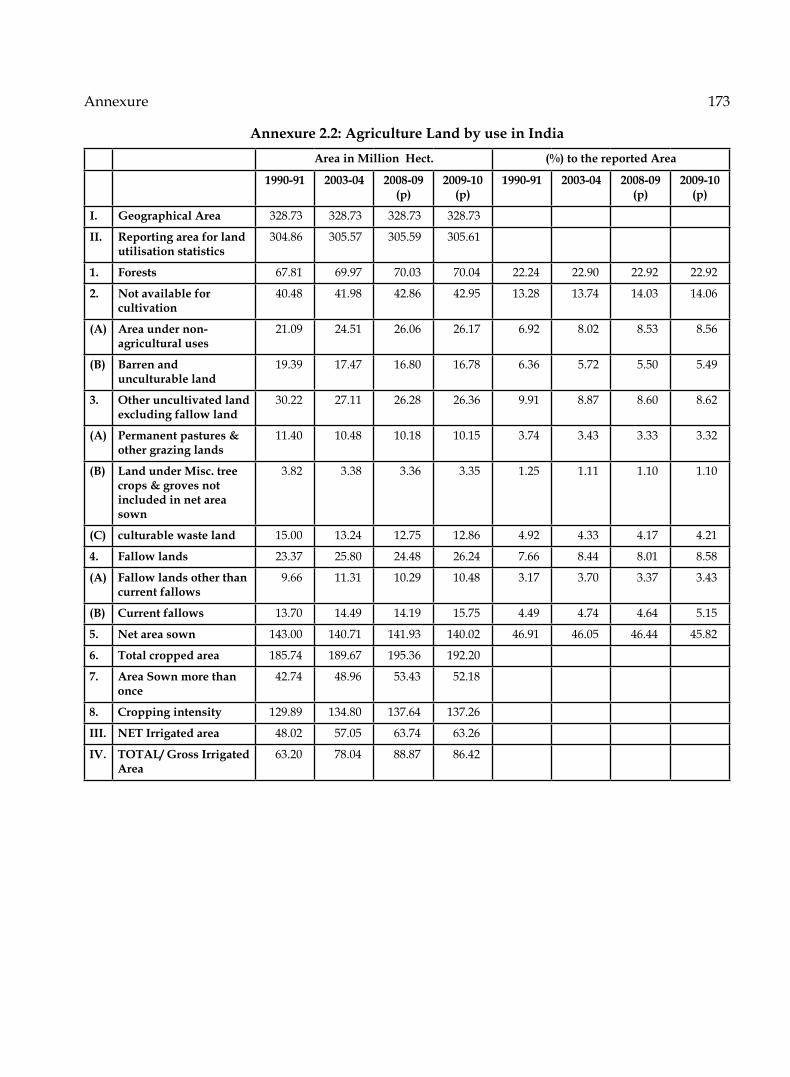
Annexure 173
Annexure 2.2: Agriculture Land by use in IndiaArea in Million Hect. (%) to the reported Area
1990-91 2003-04 2008-09 (p)
2009-10 (p)
1990-91 2003-04 2008-09 (p)
2009-10 (p)
I. Geographical Area 328.73 328.73 328.73 328.73
II. Reporting area for land utilisation statistics
304.86 305.57 305.59 305.61
1. Forests 67.81 69.97 70.03 70.04 22.24 22.90 22.92 22.92
2. Not available for cultivation
40.48 41.98 42.86 42.95 13.28 13.74 14.03 14.06
(A) Area under non-agricultural uses
21.09 24.51 26.06 26.17 6.92 8.02 8.53 8.56
(B) Barren and unculturable land
19.39 17.47 16.80 16.78 6.36 5.72 5.50 5.49
3. Other uncultivated land excluding fallow land
30.22 27.11 26.28 26.36 9.91 8.87 8.60 8.62
(A) Permanent pastures & other grazing lands
11.40 10.48 10.18 10.15 3.74 3.43 3.33 3.32
(B) Land under Misc. tree crops & groves not included in net area sown
3.82 3.38 3.36 3.35 1.25 1.11 1.10 1.10
(C) culturable waste land 15.00 13.24 12.75 12.86 4.92 4.33 4.17 4.21
4. Fallow lands 23.37 25.80 24.48 26.24 7.66 8.44 8.01 8.58
(A) Fallow lands other than current fallows
9.66 11.31 10.29 10.48 3.17 3.70 3.37 3.43
(B) Current fallows 13.70 14.49 14.19 15.75 4.49 4.74 4.64 5.15
5. Net area sown 143.00 140.71 141.93 140.02 46.91 46.05 46.44 45.82
6. Total cropped area 185.74 189.67 195.36 192.20
7. Area Sown more than once
42.74 48.96 53.43 52.18
8. Cropping intensity 129.89 134.80 137.64 137.26
III. NET Irrigated area 48.02 57.05 63.74 63.26
IV. TOTAL/ Gross Irrigated Area
63.20 78.04 88.87 86.42

174 State of Indian Agriculture
Annexure: 2.3: Trends in Cropping Pattern in India(%) Share Crop-wise
Years 1990-91 2003-04 2008-09(p) 2009-10(p)Total Area Under Crops 185742 189669 195357 192197Crop-wise Share in AreaRice 23.0 22.3 23.1 22.0Jowar 7.6 5.0 3.9 4.1Bajra 5.8 5.8 4.5 4.7Maize 3.2 3.8 4.2 4.3Ragi 1.2 0.9 0.8 0.7Wheat 12.9 14.2 14.3 14.9Barley 0.5 0.4 0.4 0.3Other Cereals & Small Millets 1.3 0.6 0.5 0.4Total Cereals & Millets 55.5 53.0 51.6 51.4Gram 4.0 3.7 4.1 4.2Arhar 1.9 1.8 1.7 1.8Other Pulses 7.4 7.3 6.4 6.5Total Pulses 13.4 12.9 12.2 12.5Total Foodgrains 68.9 65.9 63.8 63.9Sugarcane 2.1 2.4 2.5 2.4Total Condiments & Spices 1.3 1.7 1.6 1.7Total Fruits & Vegetables 3.6 4.9 5.2 5.4Other Food Crops 0.1 0.1 0.1 0.1Total Food Crops 75.9 74.9 73.2 73.4Groundnut 4.5 3.3 3.2 2.9Castor Seed 0.5 0.4 0.4 0.4Sesamum 1.3 1.0 1.0 1.2Rapeseed & Mustared 2.8 2.7 3.1 2.8Linseed 0.5 0.2 0.2 0.2Coconut 0.8 1.0 1.0 1.0Other Oilseeds 3.2 5.2 6.4 6.4Total Oilseeds 13.5 13.8 15.2 14.9Cotton 4.1 4.2 4.8 5.2Jute 0.4 0.5 0.4 0.4Other Fibres 0.2 0.1 0.1 0.1Total Fibers 4.7 4.8 5.3 5.7Indigo 0.0 0.0 0.0 0.0Opium 0.0 0.0 0.0 0.0Tobacco 0.2 0.2 0.2 0.3Tea 0.2 0.3 0.3 0.3Coffee 0.2 0.2 0.2 0.2Fodder Crops 4.5 4.6 4.4 3.9Other Non-Food Crops 0.8 1.1 1.2 1.4Total Non-Food Crops 24.1 25.1 26.8 26.6

Annexure 175
Annexure. 3.1: All-India Consumption of Fertilisers in Terms of Nutrients (N, P & K)(Thousand Tonnes)
Year N P K Total1 2 3 4 5
1950-51 58.7 6.9 - 65.61955-56 107.5 13.0 10.3 130.81960-61 210.0 53.1 29.0 292.11965-66 574.8 132.5 77.3 784.61970-71 1487.0 462.0 228.0 2177.01975-76 2148.6 466.8 278.3 2893.71980-81 3678.1 1213.6 623.9 5515.61985-86 5660.8 2005.2 808.1 8474.11986-87 5716.0 2078.9 850.0 8644.91987-88 5716.8 2187.0 880.5 8784.31988-89 7251.0 2720.7 1068.3 11040.01989-90 7386.0 3014.2 1168.0 11568.21990-91 7997.2 3221.0 1328.0 12546.21991-92 8046.3 3321.2 1360.5 12728.01992-93 8426.8 2843.8 883.9 12154.51993-94 8788.3 2669.3 908.4 12366.01994-95 9507.1 2931.7 1124.7 13563.51995-96 9822.8 2897.5 1155.8 13876.11996-97 10301.8 2976.8 1029.6 14308.11997-98 10901.8 3913.6 1372.5 16187.91998-99 11353.8 4112.2 1331.5 16797.51999-00 11592.7 4798.3 1678.7 18069.72000-01 10920.2 4214.6 1567.5 16702.32001-02 11310.2 4382.4 1667.1 17359.72002.03 10474.1 4018.8 1601.2 16094.12003-04 11077.0 4124.3 1597.9 16799.12004-05 11713.9 4623.8 2060.6 18398.32005-06 12723.3 5203.7 2413.3 20340.32006-07 13772.9 5543.3 2334.8 21651.02007-08 14419.1 5514.7 2636.3 22570.12008-09 15090.5 6506.2 3312.6 24909.32009-10 15580.0 7274.0 3632.4 26486.42010-11 16558.2 8049.7 3514.3 28122.22011-12 17300.3 7914.3 2525.5 27740.0
Note : Figures upto 1982-83 relate to Feb-.Jan. and onwards to April-March.Source: Department of Agriculture & Cooperation
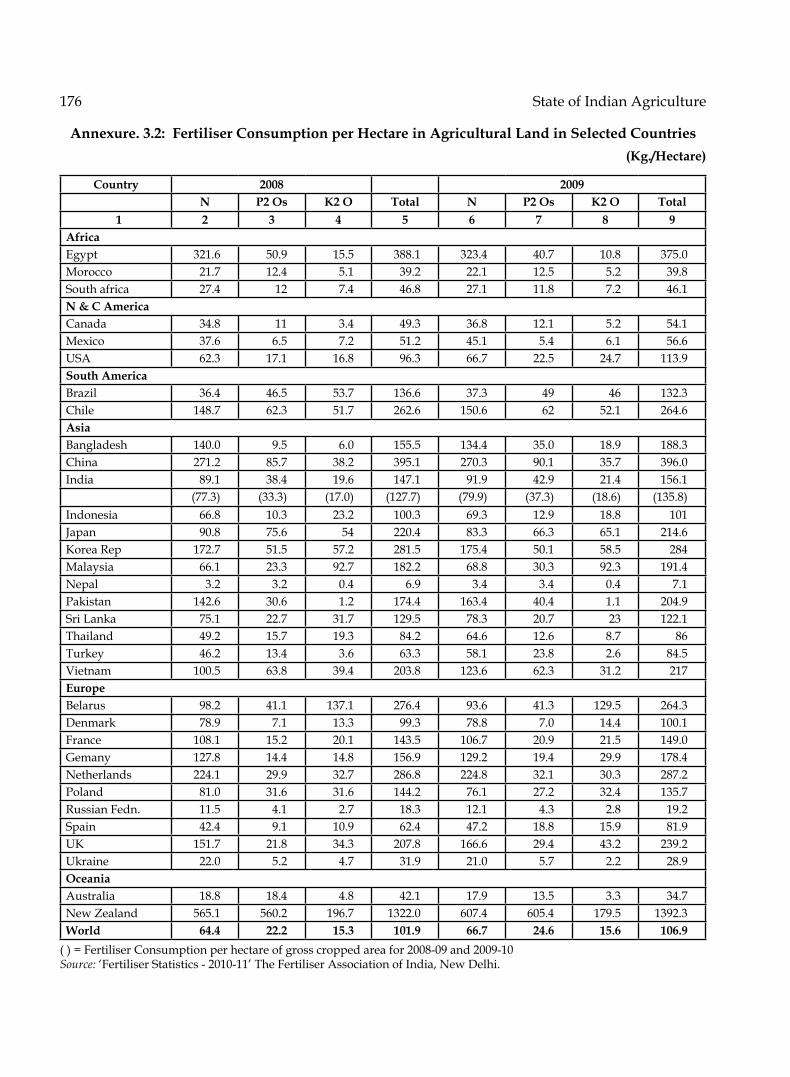
176 State of Indian Agriculture
Annexure. 3.2: Fertiliser Consumption per Hectare in Agricultural Land in Selected Countries(Kg./Hectare)
Country 2008 2009N P2 Os K2 O Total N P2 Os K2 O Total
1 2 3 4 5 6 7 8 9AfricaEgypt 321.6 50.9 15.5 388.1 323.4 40.7 10.8 375.0Morocco 21.7 12.4 5.1 39.2 22.1 12.5 5.2 39.8South africa 27.4 12 7.4 46.8 27.1 11.8 7.2 46.1N & C AmericaCanada 34.8 11 3.4 49.3 36.8 12.1 5.2 54.1Mexico 37.6 6.5 7.2 51.2 45.1 5.4 6.1 56.6USA 62.3 17.1 16.8 96.3 66.7 22.5 24.7 113.9South AmericaBrazil 36.4 46.5 53.7 136.6 37.3 49 46 132.3Chile 148.7 62.3 51.7 262.6 150.6 62 52.1 264.6AsiaBangladesh 140.0 9.5 6.0 155.5 134.4 35.0 18.9 188.3China 271.2 85.7 38.2 395.1 270.3 90.1 35.7 396.0India 89.1 38.4 19.6 147.1 91.9 42.9 21.4 156.1
(77.3) (33.3) (17.0) (127.7) (79.9) (37.3) (18.6) (135.8)Indonesia 66.8 10.3 23.2 100.3 69.3 12.9 18.8 101Japan 90.8 75.6 54 220.4 83.3 66.3 65.1 214.6Korea Rep 172.7 51.5 57.2 281.5 175.4 50.1 58.5 284Malaysia 66.1 23.3 92.7 182.2 68.8 30.3 92.3 191.4Nepal 3.2 3.2 0.4 6.9 3.4 3.4 0.4 7.1Pakistan 142.6 30.6 1.2 174.4 163.4 40.4 1.1 204.9Sri Lanka 75.1 22.7 31.7 129.5 78.3 20.7 23 122.1Thailand 49.2 15.7 19.3 84.2 64.6 12.6 8.7 86Turkey 46.2 13.4 3.6 63.3 58.1 23.8 2.6 84.5Vietnam 100.5 63.8 39.4 203.8 123.6 62.3 31.2 217EuropeBelarus 98.2 41.1 137.1 276.4 93.6 41.3 129.5 264.3Denmark 78.9 7.1 13.3 99.3 78.8 7.0 14.4 100.1France 108.1 15.2 20.1 143.5 106.7 20.9 21.5 149.0Gemany 127.8 14.4 14.8 156.9 129.2 19.4 29.9 178.4Netherlands 224.1 29.9 32.7 286.8 224.8 32.1 30.3 287.2Poland 81.0 31.6 31.6 144.2 76.1 27.2 32.4 135.7Russian Fedn. 11.5 4.1 2.7 18.3 12.1 4.3 2.8 19.2Spain 42.4 9.1 10.9 62.4 47.2 18.8 15.9 81.9UK 151.7 21.8 34.3 207.8 166.6 29.4 43.2 239.2Ukraine 22.0 5.2 4.7 31.9 21.0 5.7 2.2 28.9OceaniaAustralia 18.8 18.4 4.8 42.1 17.9 13.5 3.3 34.7New Zealand 565.1 560.2 196.7 1322.0 607.4 605.4 179.5 1392.3World 64.4 22.2 15.3 101.9 66.7 24.6 15.6 106.9
( ) = Fertiliser Consumption per hectare of gross cropped area for 2008-09 and 2009-10 Source: ‘Fertiliser Statistics - 2010-11’ The Fertiliser Association of India, New Delhi.

Annexure 177
Annexure. 3.3: Consumption of Electricity for Agricultural Purposes
Year Consumption for Agricultural Purposes
(GWh)
Total Consumption (GWh)
% Share of Agricultural
Consumption to Total Consumption
1 2 3 41982-83 17817 95589 18.641983-84 18234 102344 17.821984-85 20960 114068 18.381985-86 23422 122999 19.041986-87 29444 135952 21.661987-88 35267 145613 24.221988-89 38878 160196 24.271989-90 44056 175419 25.111990-91 50321 190357 26.441991-92 58557 207645 28.201992-93 63328 220674 28.701993-94 70699 238569 29.631994-95 79301 259630 30.541995-96 85732 277029 30.951996-97 84019 280206 29.981997-98 91242 296749 30.751998-99 97195 309734 31.381999-00 90934 312841 29.072000-01 84729 316600 26.762001-02 81673 322459 25.332002-03 84486 339598 24.882003-04 87089 360937 24.132004-05 88555 386134 22.932005-06 90292 411887 21.922006-07 99023 455748 21.732007-08 104182 501977 20.752008-09 107776 527564 20.432009-10 119492 569618 20.98
Source: Central Electricity Authority, New Delhi.

178 State of Indian Agriculture
Annexure. 3.4: State-wise Consumption of Electricity for Agriculture purpose in 2009-10
Region State/UT Consumption for Agriculture Purpose (GWh)
Total Energy Sold (GWh)
% Share of Consumption
for Agriculture
1 2 3 4 5
Northern Haryana 9190.03 22809.23 40.29
Himachal Pradesh 36.82 5814.51 0.63
Jammu & Kashmir 204.88 3538.71 5.79
Punjab 10469.31 31291.49 33.46
Rajasthan 12072.59 30622.78 39.42
Uttar Pradesh 7340.72 41625.1 17.64
Uttrakhand 298.10 6249.21 4.77
Chandigarh 1.02 1237.58 0.08
Delhi 39.67 19295.84 0.21
Sub-Total 39653.14 162484.45 24.40
Western Gujarat 12813.60 49777.64 25.74
Madhya Pradesh 5985.65 22323.67 26.81
Chhattisgarh 1751.60 11311.42 15.49
Maharashtra 13264.22 77660.62 17.04
Goa 110.76 2657.63 4.17
Daman & Diu 2.49 1452.25 0.17
D. & N. Haveli 3.00 3329.74 0.09
Sub-Total 33931.52 16813.17 20.11
Southern Andhra Pradesh 18825.020 59677.44 31.54
Karnataka 12384.770 36198.33 34.21
Kerala 266.00 13967.15 1.90
Tamil Nadu 11951.00 57722.33 20.70
Lakshadweep 73.80 1920.96 3.84
Pondicherry 0.00 25.48 0.00
Sub-Total 43500.59 169511.69 25.66
Eastern Bihar 794.01 6067.22 13.09
Jharkhand 65.72 13082.67 0.50

Annexure 179
Region State/UT Consumption for Agriculture Purpose (GWh)
Total Energy Sold (GWh)
% Share of Consumption
for Agriculture
1 2 3 4 5
Orissa 149.57 12227.86 1.22
West Bengal 1322.97 31455.00 4.21
A.& N. Islands 0.74 176.89 0.42
Sikkim 0.00 301.50 0.00
Sub-Total 2333.01 63311.14 3.68
North Eastern Assam 32.00 3257.00 0.98
Manipur 0.71 220.65 0.32
Meghalaya 0.63 898.42 0.07
Nagaland 0.00 225.00 0.00
Tripura 39.73 494.46 8.04
Arunachal Pradesh
0.00 311.00 0.00
Mizoram 0.50 191.33 0.26
Sub-Total 73.57 5597.86 1.31
Total (All India) 119491.83 569618.31 20.98
GWh: Giga Watt-hourSource: Central Electricity Authority, New Delhi.

180 State of Indian Agriculture
Annexure. 3.5: State-wise Number of Kisan Credit Cards issued up to 31st March 2012
Sr. No. State/UT Cooperative Banks
Regional Rural Banks
Commercial Banks
Total
1 2 3 4 5 61 Andhra Pradesh 4174481 2492510 11975335 186423262 Assam 21555 276559 601327 8994413 Arunachal Pradesh 980 3368 27215 315634 Bihar 867574 1576268 2418418 48622605 Gujarat 1380880 296685 1885499 35630646 Goa 5661 14731 203927 Haryana 1298501 450755 1050678 27999348 Himachal Pradesh 216528 86379 309506 6124139 Jammu & Kashmir 54619 42267 25126 12201210 Karnataka 2098737 1508086 3259689 686651211 Kerala 1713377 544295 1815367 407303912 MadhyaPradesh 4174101 729573 2215845 711951913 Maharashtra 5719704 384068 4192079 1029585114 Meghalaya 12116 23095 60270 9548115 Mizoram 2255 10018 22685 3495816 Manipur 13532 2082 32095 4770917 Nagaland 3470 1841 33828 3913918 Orissa 4182847 824902 1622269 663001819 Punjab 958837 187976 1634445 278125820 Rajasthan 3528806 674592 2392440 659583821 Sikkim 3476 10542 1401822 Tamil Nadu 1936258 395691 5259695 759164423 Tripura 30087 109090 98541 23771824 Uttar Pradesh 6987941 4805204 8341164 2013430925 West Bangal 1693611 719307 1946905 435982326 A & N island 4258 3821 807927 Chandigarh 8302 830228 Daman & Diu 1790 179029 New Delhi 2303 27186 2948930 D & N Haveli 3413 341331 Lakshdweep 1331 133132 Pondicherry 7781 133 78312 8622633 Jharkhand 281079 488978 714272 148432934 Chhattisgarh 1418490 427263 379184 222493735 Uttarakhand 383388 62838 413514 85974036 Other States 47 47
Breakup not available 188005 188005for CBs (1998-99) 0
Total 43177233 17123823 53064871 113365927
Source : Department of Agriculture and Cooperation, Credit Division.

Annexure 181A
nnex
ure.
3.6
: Pro
duct
ion
and
Con
sum
ptio
n of
See
d, F
ertil
izer
and
Pes
ticid
es in
Indi
aPr
ogra
mm
eU
nit
1999
-20
0020
00-
0120
01-
02
2002
-03
2003
-04
2004
-05
2005
-06
2006
-07
2007
-08
2008
-09
2009
-10
2010
-11
2011
-12
1
2
34
56
78
910
1112
1314
151.
Seed
s(i
)Pr
oduc
tion
of
Bree
der S
eeds
Th
ousa
nd Q
tls51
.13
42.6
945
.54
48.4
261
.82
66.4
668
.64
73.8
391
.96
94.4
110
5.00
119.
2111
9.21
(ii)
Prod
uctio
n of
Fo
unda
tion
Seed
s
Lakh
Qtls
.4.
665.
915.
446.
146.
506.
907.
407.
968.
229.
6910
.50
17.5
321
.86
(iii)
Dis
trib
utio
n of
Cer
tified
/Q
ualit
y Se
eds
Lakh
Qtls
.87
.98
86.2
791
.80
98.0
310
8.59
120.
2612
6.75
155.
0117
9.05
215.
8125
7.11
277.
3428
3.85
2. C
onsu
mpt
ion
of C
hem
ical
Fer
tilis
ers
Nitr
ogen
ous
(N)
Lakh
Ton
nes
115.
9210
9.20
113.
1010
4.74
110.
7711
7.13
127.
2313
7.73
144.
1915
0.91
155.
816
5.58
173.
00
Phos
phat
ic(P
)La
kh T
onne
s47
.99
42.1
543
.82
40.1
941
.24
46.2
452
.04
55.4
355
.15
65.0
672
.74
80.5
079
.14
Pota
ssic
(K)
Lakh
Ton
nes
16.7
815
.67
16.6
716
.01
15.9
820
.61
24.1
323
.35
26.3
633
.12
36.3
235
.14
25.2
6To
tal (
N+P
+K)
Lakh
Ton
nes
180.
6916
7.02
173.
6016
0.94
167.
9918
3.98
203.
4021
6.51
225.
7024
9.09
264.
8628
1.22
277.
40Pe
r Hec
tare
K
g.94
.94
89.6
391
.13
91.4
588
.05
94.5
210
5.50
111.
7611
5.27
127.
2113
5.27
146.
3214
4.33
3.C
onsu
mpt
ion
of P
estic
ides
(Tec
hnic
al
Gra
de M
ater
ial)
Thou
sand
To
nnes
46.2
043
.58
47.0
248
.30
41.0
040
.67
39.7
741
.51
43.6
343
.86
41.8
255
.54
50.5
8
4.A
rea
Cov
ered
Und
er
Soil
Con
serv
atio
n
(Cum
ulat
ive)
Lakh
Hac
tare
s-
4.36
4.70
4.30
5.55
7.37
8.67
11.4
17.
346.
825.
287.
494.
72
Sour
ces:
1) D
epar
tmen
t of A
gric
ultu
re &
Coo
pera
tion,
New
Del
hi.
2)
Sta
tes/
Uts
Zon
al C
onfe
renc
e, K
hari
f & R
abi.

182 State of Indian Agriculture
Ann
exur
e. 3
.7: S
tate
-wis
e C
onsu
mpt
ion
of F
ertil
izer
s
(Th
ousa
nd T
onne
s)Sl
.N
o.St
ate/
Zone
2009
-10
2010
-11
2011
-12
N
PK
Tota
lN
P
KTo
tal
N
PK
Tota
l
12
34
56
78
910
1112
1314
Sout
h Zo
ne
1A
ndhr
a Pr
ades
h17
07.1
2 87
5.87
47
8.38
30
61.3
7 19
66.6
3 10
31.9
8 49
8.18
34
96.7
9 19
77.2
9 10
43.0
2 32
2.04
33
42.3
5
2K
arna
taka
962.
90
629.
85
465.
73
2058
.48
1016
.21
696.
17
398.
05
2110
.43
1215
.94
786.
76
332.
85
2335
.55
3K
eral
a11
2.75
58
.18
93.9
6 26
4.89
11
7.68
69
.00
96.8
6 28
3.54
13
5.54
66
.16
99.6
3 30
1.33
4Ta
mil
Nad
u60
8.54
26
3.70
32
4.61
11
96.8
5 64
3.18
27
9.91
30
6.10
12
29.1
9 68
4.56
31
6.39
26
3.96
12
64.9
1
5Po
ndic
herr
y19
.37
5.04
6.
35
30.7
6 19
.14
4.81
5.
43
29.3
8 14
.61
3.90
3.
06
21.5
7
6A
&N
Isla
nds
0.31
0.
27
0.13
0.
71
0.39
0.
33
0.19
0.
91
0.37
0.
37
0.17
0.
91
7La
ksha
dwee
p0.
000.
000.
000.
00
0.00
0.
00
0.00
0.
00
0.00
0.
00
0.00
0.
00
Sub-
Tota
l (So
uth
Zone
) 34
10.9
9 18
32.9
1 13
69.1
6 66
13.0
6 37
63.2
3 20
82.2
0 13
04.8
1 71
50.2
4 40
28.3
1 22
16.6
0 10
21.7
1 72
66.6
2
Wes
t Zon
e
8G
ujar
at11
01.6
0 49
1.66
20
6.46
17
99.7
2 12
41.2
2 51
8.00
17
9.94
19
39.1
6 11
83.3
0 41
7.02
13
2.74
17
33.0
6
9M
adhy
a Pr
ades
h 94
1.82
60
5.63
11
3.72
16
61.1
7 99
8.30
74
1.11
12
8.33
18
67.7
4 10
61.7
5 75
0.76
79
.47
1891
.98
10C
hhat
tisga
rh
315.
83
162.
32
58.9
9 53
7.14
32
1.99
17
1.19
68
.99
562.
17
356.
40
177.
33
61.8
4 59
5.57
11M
ahar
asht
ra14
78.6
0 10
16.5
1 57
0.35
30
65.4
6 16
57.2
9 11
26.3
7 67
1.68
34
55.3
4 16
10.9
1 10
11.7
6 39
9.48
30
22.1
5
12Ra
jast
han
721.
96
316.
50
34.7
5 10
73.2
1 87
0.39
41
3.30
34
.95
1318
.64
913.
49
416.
11
26.1
8 13
55.7
8
13G
oa3.
25
3.14
2.
71
9.10
3.
32
2.27
1.
79
7.38
3.
06
2.67
1.
89
7.62
14D
aman
& D
iu0.
31
0.13
0.
02
0.46
0.
42
0.16
0.
03
0.61
0.
06
0.01
0.
00
0.07
15D
&N
Hav
eli
0.72
0.45
0.04
1.21
0.
72
0.53
0.
03
1.28
0.
60
0.41
0.
00
1.01
Sub-
Tota
l (W
est Z
one)
45
64.0
925
96.3
4 98
7.04
81
47.4
7 50
93.6
5 29
72.9
3 10
85.7
4 91
52.3
2 51
29.5
7 27
76.0
7 70
1.60
86
07.2
4
Nor
th Z
one
16H
arya
na96
1.88
33
3.16
60
.65
1355
.69
974.
04
335.
95
47.6
3 13
57.6
2 10
20.9
0 36
9.62
37
.53
1428
.05
17Pu
njab
13
58.1
9 43
3.60
73
.83
1865
.62
1402
.91
435.
17
73.4
3 19
11.5
1 14
16.5
6 44
8.65
52
.85
1918
.06
18U
ttar P
rade
sh
2898
.83
1039
.17
323.
50
4261
.50
2951
.01
1097
.49
267.
39
4315
.89
3067
.10
1024
.23
116.
42
4207
.75
19U
ttara
khan
d11
5.40
29
.65
10.2
6 15
5.31
11
1.92
30
.91
14.0
3 15
6.86
12
3.78
32
.31
10.3
4 16
6.43
20H
imac
hal P
rade
sh31
.32
10.9
0 11
.02
53.2
4 32
.59
10.7
3 11
.81
55.1
3 32
.80
9.70
8.
93
51.4
3
21Ja
mm
u &
Kas
hmir
74.5
0 24
.18
12.9
9 11
1.67
72
.82
37.3
0 11
.15
121.
27
66.1
3 28
.65
5.29
10
0.07
22D
elhi
1.86
0.
36
0.13
2.
35
0.37
0.
05
0.00
0.
42
0.35
0.
22
0.01
0.
58
23C
hand
igar
h0.
000.
000.
000.
00
0.00
0.
00
0.00
0.
00
0.00
0.
00
0.00
0.
00

Annexure 183Sl
.N
o.St
ate/
Zone
2009
-10
2010
-11
2011
-12
N
PK
Tota
lN
P
KTo
tal
N
PK
Tota
l
12
34
56
78
910
1112
1314
Sub-
Tota
l (N
orth
Zo
ne)
5441
.98
1871
.02
492.
38
7805
.38
5545
.66
1947
.60
425.
44
7918
.70
5727
.62
1913
.38
231.
37
7872
.37
East
Zon
e
24Bi
har
894.
43
247.
44
167.
99
1309
.86
907.
28
289.
59
155.
84
1352
.71
967.
78
297.
01
115.
36
1380
.15
25Jh
arkh
and
94.0
3 53
.84
19.4
8 16
7.35
79
.08
38.1
1 9.
01
126.
20
118.
02
42.0
1 11
.34
171.
37
26O
riss
a29
2.29
14
8.59
78
.46
519.
34
294.
72
153.
97
89.1
5 53
7.84
32
3.41
13
5.48
55
.80
514.
69
27W
est B
enga
l73
0.69
467.
3444
6.53
1644
.56
712.
37
495.
58
363.
87
1571
.82
831.
99
476.
17
309.
04
1617
.20
Sub-
Tota
l (Ea
st Z
one)
20
11.4
4 91
7.21
71
2.46
36
41.1
1 19
93.4
5 97
7.25
61
7.87
35
88.5
7 22
41.2
0 95
0.67
49
1.54
36
83.4
1
Nor
th E
ast Z
one
28A
ssam
127.
25
48.7
5 66
.27
242.
27
142.
76
59.5
1 74
.79
277.
06
151.
05
49.0
8 75
.52
275.
65
29Tr
ipur
a8.
10
3.03
3.
07
14.2
0 8.
01
4.47
3.
46
15.9
4 10
.42
5.49
2.
73
18.6
4
30M
anip
ur10
.67
1.01
0.
36
12.0
4 5.
10
1.10
0.
30
6.50
6.
59
0.97
0.
44
8.00
31M
egha
laya
2.50
0.
83
0.35
3.
68
3.03
1.
52
0.48
5.
03
3.27
1.
24
0.25
4.
76
32N
agal
and
0.47
0.
31
0.16
0.
94
0.77
0.
48
0.17
1.
42
0.75
0.
49
0.20
1.
44
33A
runa
chal
Pra
desh
0.51
0.
22
0.09
0.
82
0.52
0.
22
0.09
0.
83
0.55
0.
10
0.03
0.
68
34M
izor
am
2.00
2.
41
1.06
5.
47
2.05
2.
43
1.12
5.
60
0.92
0.
21
0.06
1.
19
35Si
kkim
0.00
0.00
0.
00
0.00
0.
00
0.00
0.
00
0.00
0.
00
0.00
0.
00
0.00
Sub-
Tota
l(Nor
th E
ast
Zone
) 15
1.50
56
.56
71.3
6 27
9.42
16
2.24
69
.73
80.4
1 31
2.38
17
3.55
57
.58
79.2
3 31
0.36
All
Indi
a15
580.
00
7274
.04
3632
.40
2648
6.44
16
558.
23
8049
.71
3514
.27
2812
2.21
17
300.
2579
14.3
025
25.4
527
740
Sour
ce: D
epar
tmen
t of A
gric
ultu
re a
nd C
oopr
atio
n, IN
M D
ivis
ion.

184 State of Indian Agriculture
Ann
exur
e. 3
.8: S
tate
-wis
e Es
timat
ed C
onsu
mpt
ion
of F
ertil
iser
per
Hec
tare
( Kgs
./Hec
tare
)Sl
.N
o.St
ate/
Zone
2009
-10
2010
-11
2011
-12
N
PK
Tota
lN
P
KTo
tal
N
PK
Tota
l
12
34
56
78
910
1112
1314
Sout
h Zo
ne
1A
ndhr
a Pr
ades
h12
5.83
64.5
635
.26
225.
6515
6.58
82.1
639
.66
278.
4115
7.43
83.0
425
.64
266.
11
2K
arna
taka
74.5
848
.85
36.1
215
9.55
78.9
454
.08
30.9
216
3.94
94.4
661
.12
25.8
618
1.43
3K
eral
a40
.84
21.0
734
.03
95.9
444
.09
25.8
536
.29
106.
2350
.78
24.7
937
.33
112.
90
4Ta
mil
Nad
u10
4.65
45.3
555
.82
205.
8211
5.43
50.2
454
.94
220.
6012
2.86
56.7
847
.37
227.
01
5Po
ndic
herr
y55
3.43
144.
0018
1.43
878.
8659
8.13
150.
3116
9.69
918.
1345
6.56
121.
8895
.63
674.
06
6A
&N
Isla
nds
22.1
419
.29
9.29
50.7
122
.94
19.4
111
.18
53.5
321
.76
21.7
610
.00
53.5
3
7La
ksha
dwee
p0.
000.
000.
000.
000.
000.
000.
000.
000.
000.
000.
000.
00
Ave
rage
(Sou
th Z
one)
97.2
152
.24
39.0
218
8.47
111.
5861
.74
38.6
921
2.01
119.
4465
.72
30.2
921
5.46
Wes
t Zon
e
8G
ujar
at90
.12
40.2
216
.89
147.
2311
1.44
46.5
116
.16
174.
1010
6.24
37.4
411
.92
155.
60
9M
adhy
a Pr
ades
h 46
.13
29.6
65.
5781
.37
46.6
334
.61
5.99
87.2
349
.59
35.0
63.
7188
.36
10C
hhat
tisga
rh54
.95
28.2
410
.26
93.4
557
.90
30.7
812
.41
101.
0964
.09
31.8
911
.12
107.
10
11M
ahar
asht
ra65
.27
44.8
725
.18
135.
3273
.29
49.8
129
.70
152.
8171
.24
44.7
417
.67
133.
65
12Ra
jast
han
32.5
114
.25
1.56
48.3
340
.03
19.0
11.
6160
.64
42.0
119
.14
1.20
62.3
5
13G
oa19
.12
18.4
715
.94
53.5
320
.75
14.1
911
.19
46.1
319
.13
16.6
911
.81
47.6
3
14D
aman
& D
iu15
5.00
65.0
010
.00
230.
0010
5.00
40.0
07.
5015
2.50
15.0
02.
500.
0017
.50
15D
&N
Hav
eli
26.6
716
.67
1.48
44.8
230
.00
22.0
81.
2553
.33
25.0
017
.08
0.00
42.0
8
Ave
rage
(Wes
t Zon
e)54
.69
31.1
111
.83
97.6
361
.63
35.9
713
.14
110.
7362
.06
33.5
98.
4910
4.13
Nor
th Z
one
16H
arya
na14
8.94
51.5
99.
3920
9.92
153.
3752
.90
7.50
213.
7616
0.75
58.2
05.
9122
4.85
17Pu
njab
17
2.58
55.1
09.
3823
7.05
178.
1555
.26
9.32
242.
7317
9.88
56.9
76.
7124
3.56
18U
ttar P
rade
sh
116.
2941
.69
12.9
817
0.96
119.
1744
.32
10.8
017
4.28
123.
8541
.36
4.70
169.
91
19U
ttara
khan
d91
.51
23.5
18.
1412
3.16
95.9
926
.51
12.0
313
4.53
106.
1627
.71
8.87
142.
74
20H
imac
hal P
rade
sh32
.26
11.2
311
.35
54.8
334
.97
11.5
112
.67
59.1
535
.19
10.4
19.
5855
.18
21Ja
mm
u &
Kas
hmir
65.7
021
.32
11.4
698
.48
63.6
032
.58
9.74
105.
9157
.76
25.0
24.
6287
.40
22D
elhi
42.2
78.
182.
9553
.41
8.04
1.09
0.00
9.13
7.61
4.78
0.22
12.6
1
23C
hand
igar
h0.
000.
000.
000.
000.
000.
000.
000.
000.
000.
000.
000.
00
Ave
rage
(Nor
th Z
one)
127.
5543
.85
11.5
418
2.94
131.
1646
.06
10.0
618
7.29
135.
4745
.25
5.47
186.
19
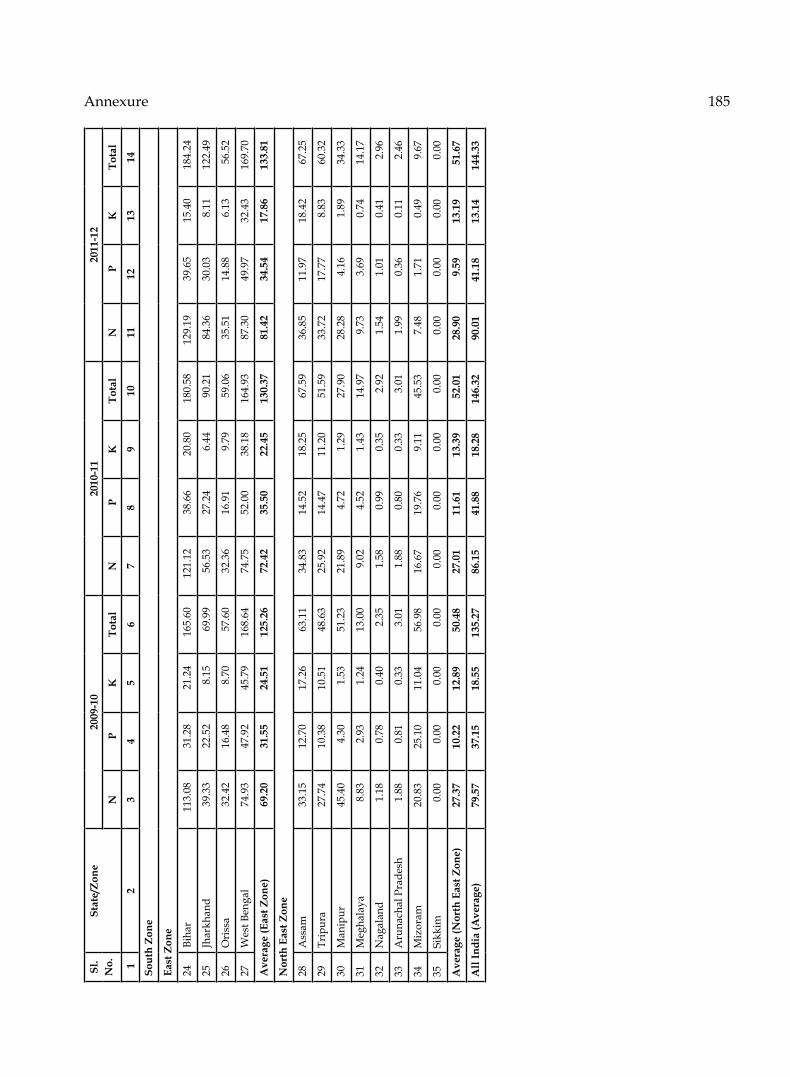
Annexure 185Sl
.N
o.St
ate/
Zone
2009
-10
2010
-11
2011
-12
N
PK
Tota
lN
P
KTo
tal
N
PK
Tota
l
12
34
56
78
910
1112
1314
Sout
h Zo
ne
East
Zon
e
24Bi
har
113.
0831
.28
21.2
416
5.60
121.
1238
.66
20.8
018
0.58
129.
1939
.65
15.4
018
4.24
25Jh
arkh
and
39.3
322
.52
8.15
69.9
956
.53
27.2
46.
4490
.21
84.3
630
.03
8.11
122.
49
26O
riss
a32
.42
16.4
88.
7057
.60
32.3
616
.91
9.79
59.0
635
.51
14.8
86.
1356
.52
27W
est B
enga
l74
.93
47.9
245
.79
168.
6474
.75
52.0
038
.18
164.
9387
.30
49.9
732
.43
169.
70
Ave
rage
(Eas
t Zon
e)69
.20
31.5
524
.51
125.
2672
.42
35.5
022
.45
130.
3781
.42
34.5
417
.86
133.
81
Nor
th E
ast Z
one
28A
ssam
33.1
512
.70
17.2
663
.11
34.8
314
.52
18.2
567
.59
36.8
511
.97
18.4
267
.25
29Tr
ipur
a27
.74
10.3
810
.51
48.6
325
.92
14.4
711
.20
51.5
933
.72
17.7
78.
8360
.32
30M
anip
ur45
.40
4.30
1.53
51.2
321
.89
4.72
1.29
27.9
028
.28
4.16
1.89
34.3
3
31M
egha
laya
8.83
2.93
1.24
13.0
09.
024.
521.
4314
.97
9.73
3.69
0.74
14.1
7
32N
agal
and
1.18
0.78
0.40
2.35
1.58
0.99
0.35
2.92
1.54
1.01
0.41
2.96
33A
runa
chal
Pra
desh
1.88
0.81
0.33
3.01
1.88
0.80
0.33
3.01
1.99
0.36
0.11
2.46
34M
izor
am
20.8
325
.10
11.0
456
.98
16.6
719
.76
9.11
45.5
37.
481.
710.
499.
67
35Si
kkim
0.00
0.00
0.00
0.00
0.00
0.00
0.00
0.00
0.00
0.00
0.00
0.00
Ave
rage
(Nor
th E
ast Z
one)
27.3
710
.22
12.8
950
.48
27.0
111
.61
13.3
952
.01
28.9
09.
5913
.19
51.6
7
All
Indi
a (A
vera
ge)
79.5
737
.15
18.5
513
5.27
86.1
541
.88
18.2
814
6.32
90.0
141
.18
13.1
414
4.33

186 State of Indian Agriculture
Ann
exur
e. 3
.9: C
rop-
wis
e D
istr
ibut
ion
of C
ertifi
ed/ Q
ualit
y Se
eds
(Lak
h Q
uint
als)
Cro
ps19
83-8
419
91-9
219
96-9
720
01-0
220
06-0
720
07-0
820
08-0
920
09-1
020
10-1
120
11-1
2
12
34
56
78
910
11
Cer
eals
Whe
at10
.94
14.0
4 23
.22
32.5
954
.55
63.2
574
.83
90.6
697
.83
94.6
9
Padd
y8.
8614
.47
16.5
7 25
.58
43.5
148
.93
58.1
860
.95
69.3
470
.11
Mai
ze1.
441.
50
1.88
2.
755.
745.
807.
947.
748.
948.
70
Jow
ar2.
593.
46
2.73
2.
202.
322.
382.
412.
242.
161.
99
Bajra
1.65
1.68
1.
71
1.80
2.16
1.90
2.20
1.74
2.31
5.00
Ragi
0.12
0.15
0.
19
0.14
0.21
0.27
0.25
0.05
0.26
0.23
Barl
ey0.
070.
05
0.13
0.
501.
081.
271.
621.
771.
793.
80
Sub-
Tota
l (C
erea
ls)
25.6
735
.35
46.4
3 65
.56
109.
8712
3.80
147.
4316
5.15
182.
6218
4.52
Puls
es G
ram
0.85
1.03
1.44
1.
535.
086.
738.
612
.32
12.5
011
.21
Lent
il0.
060.
080.
08
0.29
0.54
0.56
0.59
0.55
0.74
0.66
Peas
0.19
0.31
0.25
0.
310.
931.
101.
292.
071.
471.
36
Ura
d0.
380.
651.
07
0.97
0.8
1.40
1.37
1.61
1.96
1.72
Moo
ng0.
390.
620.
65
0.83
0.23
1.34
1.23
1.29
1.76
1.77
Arh
ar0.
140.
490.
58
0.64
0.85
1.18
1.09
1.37
1.52
1.94
Cow
pea
0.08
0.08
0.12
0.
050.
090.
100.
160.
200.
330.
28
Oth
ers
-0.
03-
0.07
0.11
0.16
0.15
0.28
0.56
0.25
Sub-
Tota
l (Pu
lses
)2.
093.
294.
194.
699.
6312
.57
14.4
819
.69
20.8
319
.19
Oils
eeds
Gro
undn
ut5.
166.
727.
27
5.25
9.89
14.4
315
.90
18.8
621
.79
17.8
3
Rape
seed
& M
usta
rd0.
290.
771.
02
0.86
1.36
1.71
1.63
2.09
2.07
2.49
Til
0.03
0.08
0.10
0.
160.
160.
220.
180.
180.
200.
23
Sunfl
ower
0.25
0.55
0.58
0.
480.
890.
920.
800.
760.
550.
22
Soya
bean
0.60
1.23
3.
08
4.99
14.0
516
.52
20.8
928
.44
25.5
536
.84
Lins
eed
0.01
0.01
0.02
0.
020.
020.
020.
010.
010.
040.
02
Cas
tors
eed
0.10
0.21
0.
30
0.26
0.36
0.42
0.42
0.29
0.31
0.69

Annexure 187C
rops
1983
-84
1991
-92
1996
-97
2001
-02
2006
-07
2007
-08
2008
-09
2009
-10
2010
-11
2011
-12
12
34
56
78
910
11
Saffl
ower
0.05
0.08
0.16
0.
070.
070.
080.
090.
070.
080.
07
Oth
ers
0.01
-0.
010.
200.
010.
010.
010.
01
Sub-
Tota
l (O
ilsee
ds)
6.49
9.66
12
.53
12.1
027
.00
34.3
339
.92
50.7
150
.61
58.4
0Fi
bres
Cot
ton
1.78
1.77
2.
93
2.62
2.45
1.89
2.27
2.36
2.33
2.52
Jute
0.12
0.26
0.25
0.
210.
260.
240.
280.
270.
270.
63
Mes
ta/O
ther
s0.
010.
060.
340.
500.
030.
020.
040.
21
Sub-
Tota
l (Fi
bers
)1.
912.
03
3.18
2.
893.
052.
632.
582.
652.
643.
36O
ther
Mis
cella
neou
s
Pota
to8.
74*
6.90
6.
696.
335.
125.
3510
.55
18.6
820
.08
16.6
8
Oth
ers
0.07
0.27
0.25
0.23
0.34
0.37
0.85
0.23
0.55
1.70
Sub-
Tota
l (O
ther
Mis
c.)
8.81
7.17
6.94
6.56
5.46
5.72
11.4
018
.91
20.6
318
.38
Gra
nd T
otal
44.9
757
.50
73.2
791
.80
155.
0117
9.05
215.
8125
7.11
277.
3428
3.85
* Est
imat
ed
Sour
ce: D
epar
tmen
t of A
gric
ultu
re a
nd C
oope
ratio
n, S
eeds
Div
isio
n

188 State of Indian Agriculture
Ann
exur
e. 3
.10:
Flo
w o
f Ins
titut
iona
l Cre
dit t
o A
gric
ultu
re S
ecto
r(R
s. in
Cro
re)
Part
icul
ars/
Age
ncy
1998
-99
1999
-200
020
00-0
120
01-0
220
02-0
320
03-0
420
04-0
520
05-0
620
06-0
720
07-0
820
08-0
920
09-1
020
10-1
120
11-1
2P
12
34
56
78
910
1112
1314
15
I. P
rodu
ctio
n (S
T) C
redi
t
Coo
pera
tive
Bank
s12
514
1477
116
528
1878
719
668
2264
027
157
3493
038
622
4051
540
230
5694
669
038
8182
9
RRBs
1710
2423
3245
3777
4775
6088
1001
012
712
1663
120
715
2241
329
802
3812
147
401
Com
mer
cial
Ba
nks
9622
1169
713
486
1790
421
104
2619
236
793
5764
083
202
1222
8914
7818
1899
08N
A26
6928
Oth
er
Age
ncie
s59
7455
4139
5710
468
00
00
00
Sub
Tota
l (A
)23
905
2896
533
314
4050
945
586
5497
774
064
1053
5013
8455
1835
1921
0461
2766
5610
7159
3961
58
II.
MT/
LT T
otal
Coo
pera
tive
Bank
s33
5634
8941
9047
3739
6842
3540
7444
7438
5831
6959
6265
5190
8361
34
RRBs
750
749
974
1077
1295
1493
2394
2511
3804
4099
4352
5415
6172
7049
Com
mer
cial
Ba
nks
8821
1303
614
321
1568
318
670
2624
944
688
6783
783
283
5879
881
133
9589
2N
A10
1688
Oth
er
Age
ncie
s30
2928
3941
2789
314
00
00
00
Sub
Tota
l (B)
1295
717
303
1951
321
536
2397
432
004
5124
575
136
9094
566
066
9144
710
7858
1525
511
4871
ST+M
T/LT
Cre
dit
Coo
pera
tive
Bank
s15
870
1826
020
718
2352
423
636
2687
531
231
3940
342
480
4825
846
192
6349
778
121
8796
3
RRBs
2460
3172
4219
4854
6070
7581
1240
415
223
2043
525
312
2676
535
217
4429
354
450
Com
mer
cial
Ba
nks
1844
324
733
2780
733
587
3977
452
441
8148
112
5477
1664
8518
1088
2289
5128
5800
3458
7736
8616
Oth
er
Age
ncie
s87
103
8380
8084
193
382
00
00
00
Gra
nd T
otal
(A
+B)
3686
046
268
5282
762
045
6956
086
981
1253
0918
0485
2294
0025
4658
3019
0838
4514
4682
9151
1029
Sour
ce: D
epar
tmen
t of A
gric
ultu
re a
nd C
oope
ratio
n, C
redi
t Div
isio
n.

Annexure 189A
nnex
ure.
3.1
1: N
atio
nal A
gric
ultu
ral I
nsur
ance
Sch
eme
(NA
IS),
Seas
on w
ise
Cum
ulat
ive
up to
201
1-12
(Rs.
in L
akh)
S.
No.
Seas
onFa
rmer
s In
sure
d (n
o.)
Are
a In
sure
d (h
a.)
Sum
In
sure
dFa
rmer
Pr
emiu
mG
OI S
hare
in
Pre
miu
mPr
emiu
m
Col
lect
edC
laim
s Pa
yabl
eC
laim
s Pa
idFa
rmer
s Be
nefit
ted
(no.
)1
23
45
67
89
1011
1Ra
bi 1
999-
2000
5799
4078
0569
3564
137
783
542
769
769
5528
8Ye
ar 1
999-
2000
5799
4078
0569
3564
137
783
542
769
769
5528
82
Kha
rif 2
000
8409
374
1321
9829
6903
3815
934
2370
2067
412
2248
1222
4836
3525
23
Rabi
200
0-01
2091
733
3111
423
1602
6819
5541
227
7959
4959
4952
6697
Year
200
0-01
1050
1107
1633
1252
8506
0717
889
2782
2345
212
8197
1281
9741
6194
94
Kha
rif 2
001
8696
587
1288
7710
7502
4621
400
2381
2616
249
354
4935
417
4187
35
Rabi
200
1-02
1955
431
3145
873
1497
5122
3738
930
1564
6664
6645
3325
Year
200
1-02
1065
2018
1603
3583
8999
9723
637
2770
2917
755
819
5581
921
9519
86
Kha
rif 2
002
9768
711
1553
2349
9431
6928
060
2243
3254
718
2431
1824
3142
9715
57
Rabi
200
2-03
2326
811
4037
824
1837
5531
7833
638
5018
855
1885
592
6408
Year
200
2-03
1209
5522
1957
0173
1126
924
3123
825
8036
397
2012
8620
1286
5223
563
8K
hari
f 200
379
7083
012
3555
1481
1413
2588
912
2228
333
6526
865
268
1712
269
9Ra
bi 2
003-
0444
2128
764
6866
330
4949
5782
312
6406
4970
649
706
2098
125
Year
200
3-04
1239
2117
1882
4177
1116
362
3167
015
3434
739
1149
7411
4974
3810
394
10K
hari
f 200
412
6871
0424
2733
9413
1706
243
885
1005
4589
410
3817
1038
1726
7474
311
Rabi
200
4-05
3531
045
5343
244
3774
2171
7320
675
8516
059
1605
977
2779
Year
200
4-05
1621
8149
2961
6638
1694
482
5105
812
1153
480
1198
7511
9875
3447
522
12K
hari
f 200
512
6738
3320
5310
3813
5191
042
951
1022
4499
510
7192
1071
9226
7450
513
Rabi
200
5-06
4048
524
7218
417
5071
6699
5926
210
482
3383
033
830
9807
48Ye
ar 2
005-
0616
7223
5727
7494
5518
5907
652
911
1283
5547
714
1022
1410
2236
5525
314
Kha
rif 2
006
1293
4117
1967
2994
1475
946
4407
513
2746
729
1774
9117
7491
3131
511
15Ra
bi 2
006-
0749
7798
076
3288
265
4221
1315
056
914
288
5159
651
596
1390
430
Year
200
6-07
1791
2097
2730
5875
2130
168
5722
418
9661
017
2290
8722
9087
4521
941
16K
hari
f 200
713
3988
2220
7547
4717
0079
649
766
1333
5243
291
536
9144
815
9186
317
Rabi
200
7-08
5044
016
7387
156
7466
6414
071
900
1587
181
005
8100
515
7860
8Ye
ar 2
007-
0818
4428
3828
1419
0324
4746
163
838
2233
6830
317
2540
1724
5331
7047
1

190 State of Indian Agriculture
S.
No.
Seas
onFa
rmer
s In
sure
d (n
o.)
Are
a In
sure
d (h
a.)
Sum
In
sure
dFa
rmer
Pr
emiu
mG
OI S
hare
in
Pre
miu
mPr
emiu
m
Col
lect
edC
laim
s Pa
yabl
eC
laim
s Pa
idFa
rmer
s Be
nefit
ted
(no.
)1
23
45
67
89
1011
18K
hari
f 200
812
9909
7517
6351
6215
6654
147
820
1686
5119
223
7771
2377
7142
1895
819
Rabi
200
8-09
6210
620
8857
495
1114
859
2307
732
4729
572
1508
8415
0234
1977
328
Year
200
8-09
1920
1595
2649
2657
2681
400
7089
749
3380
764
3886
5538
8006
6196
286
20K
hari
f 200
918
2530
7225
7698
1727
6167
180
572
2856
8628
545
6700
4470
1279
7052
421
Rabi
200
9-10
5646
964
7866
818
1087
561
2145
736
3928
735
5861
139
077
1042
548
Year
200
9-10
2390
0036
3363
6635
3849
232
1020
3064
9511
5020
5153
1248
6089
9013
072
22K
hari
f 201
012
6841
1717
1946
7823
7050
967
625
2270
7216
516
3820
1545
4122
5105
923
Rabi
201
0-11
4896
958
6855
237
1069
198
1990
944
4828
804
5790
056
654
1068
177
Year
201
0-11
1758
1075
2404
9915
3439
707
8753
467
1810
0969
2217
2021
1195
3319
236
24K
hari
f 201
111
5542
8515
7740
7523
4853
371
427
2616
7142
716
1635
1538
1017
7713
825
Rabi
201
1-12
5188
712
7190
212
1051
350
2149
237
6129
013
1867
814
063
Year
201
1-12
1674
2997
2296
4286
3399
882
9292
063
7610
0441
1635
0215
3817
1791
201
Tota
l19
2941
848
2914
9711
825
5309
3868
3222
4089
475
9779
2452
758
2402
589
5056
1374
Sour
ce: D
epar
tmen
t of A
gric
ultu
re a
nd C
oope
ratio
n, C
redi
t Div
isio
n.

Annexure 191A
nnex
ure.
4.1
: All
Indi
a Es
timat
es o
f Are
a of
Foo
dgra
ins
Cro
psSe
ason
Are
a (‘0
00 H
ecta
re)
1997
-98
1998
-99
1999
-20
0020
00-0
1
2001
-02
20
02-0
3 20
03-0
4 20
04-0
5 20
05-0
620
06-0
720
07-0
820
08-0
920
09-1
020
10-1
120
11-1
220
12-1
3*
12
34
56
78
910
1112
1314
1516
1718
Rice
Aut
umn
3140
3085
3033
3103
3043
2784
2696
2633
2557
2298
2224
2230
2084
1837
W
inte
r15
704
1528
315
542
1492
615
321
1473
114
835
1454
414
987
1350
013
627
1397
113
573
1100
9
K
hari
f20
982
2208
822
374
2267
322
255
2052
221
700
2118
721
791
2380
323
622
2460
921
961
2520
3
To
tal
Kha
rif
3982
540
456
4094
940
703
4061
938
037
3923
138
364
3933
539
601
3947
240
810
3761
838
049
4012
338
372
Ra
bi/
Sum
mer
3622
4347
4213
4009
4285
3139
3362
3543
4325
4212
4442
4727
4300
4814
3883
3788
To
tal
4344
744
802
4516
244
712
4490
441
176
4259
341
907
4366
043
814
4391
445
537
4191
842
862
4400
642
159
Whe
atRa
bi26
696
2752
327
486
2573
126
345
2519
626
595
2638
326
484
2799
528
039
2775
228
457
2906
929
865
2943
4
Jow
arK
hari
f52
0450
4348
2648
6344
7342
4344
6340
9937
6337
3835
0028
9332
3930
7226
2024
07
Ra
bi55
9847
5254
2549
9353
2250
5648
6849
9449
0447
3442
6446
3845
4843
1036
2538
22
To
tal
1080
197
9410
251
9856
9795
9300
9331
9092
8667
8473
7764
7531
7787
7382
6245
6229
Bajra
Kha
rif
9888
9297
8897
9829
9529
7740
1061
292
3395
8195
0895
7187
5389
0496
1287
7772
53
Mai
zeK
hari
f57
6255
9157
2759
8759
3459
7665
9065
9467
5869
6071
1968
9570
6372
8273
8170
84
Ra
bi/
Sum
mer
560
613
695
624
648
659
753
836
830
934
999
1279
1198
1271
1401
1275
To
tal
6321
6204
6422
6611
6582
6635
7343
7430
7588
7894
8117
8174
8262
8553
8782
8359
Ragi
Kha
rif
1657
1758
1634
1759
1647
1415
1666
1553
1534
1177
1387
1381
1268
1286
1176
1179
Smal
l M
illet
sK
hari
f15
2914
9514
1114
2413
1112
0111
9111
0110
6410
1010
3990
583
180
079
969
2
Barl
eyRa
bi85
879
372
577
866
070
265
761
763
064
660
370
662
470
564
375
5
Coa
rse
Cer
eals
Kha
rif
2403
923
184
2249
623
862
2289
320
575
2452
322
579
2270
122
394
2261
620
826
2130
522
053
2075
318
615
Ra
bi70
1561
5768
4563
9566
3064
1762
7964
4763
6463
1458
6666
2363
7062
8656
6958
52
To
tal
3105
429
341
2934
030
257
2952
326
992
3080
129
025
2906
528
708
2848
227
450
2767
528
339
2642
224
467
Cer
eals
Kha
rif
6386
463
639
6344
564
565
6351
258
612
6375
360
943
6203
661
995
6208
861
636
5892
360
102
6087
656
987
Ra
bi37
333
3802
738
543
3613
537
259
3475
236
235
3637
237
173
3852
138
346
3910
339
128
4016
839
417
3907
4
To
tal
1011
9710
1666
1019
8810
0700
1007
7193
364
9998
897
315
9920
810
0516
1004
3510
0739
9805
110
0270
1002
9396
061
Tur (
Arh
ar)
Kha
rif
3359
3439
3427
3632
3328
3359
3516
3519
3581
3562
3726
3378
3466
4367
4007
3794
Puls
es
Oth
er T
han
Tur
Kha
rif
7147
6910
6367
7026
7395
6592
8168
7799
7099
7114
7764
6431
7117
7953
7183
5847
Gra
mRa
bi75
6384
6961
4651
8564
1659
0670
4867
1569
2674
9475
4478
9381
6991
8682
9989
25
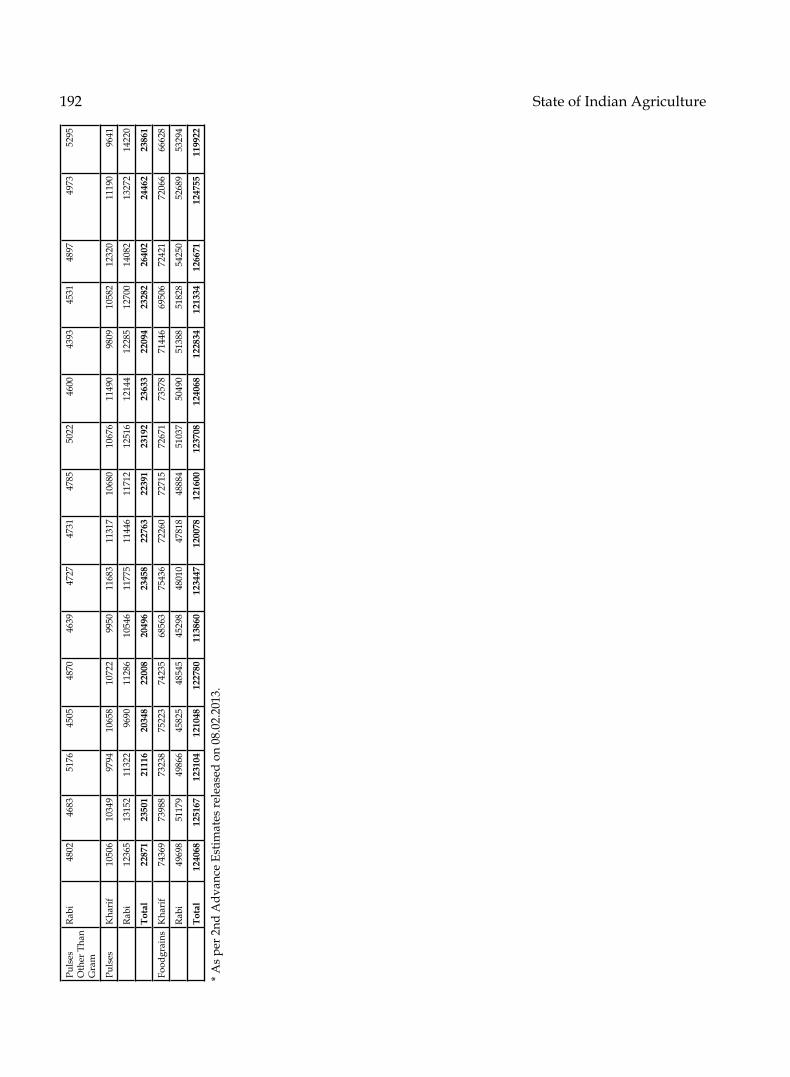
192 State of Indian Agriculture
Puls
es
Oth
er T
han
Gra
m
Rabi
4802
4683
5176
4505
4870
4639
4727
4731
4785
5022
4600
4393
4531
4897
4973
5295
Puls
esK
hari
f10
506
1034
997
9410
658
1072
299
5011
683
1131
710
680
1067
611
490
9809
1058
212
320
1119
096
41
Ra
bi12
365
1315
211
322
9690
1128
610
546
1177
511
446
1171
212
516
1214
412
285
1270
014
082
1327
214
220
To
tal
2287
123
501
2111
620
348
2200
820
496
2345
822
763
2239
123
192
2363
322
094
2328
226
402
2446
223
861
Food
grai
nsK
hari
f74
369
7398
873
238
7522
374
235
6856
375
436
7226
072
715
7267
173
578
7144
669
506
7242
172
066
6662
8
Ra
bi49
698
5117
949
866
4582
548
545
4529
848
010
4781
848
884
5103
750
490
5138
851
828
5425
052
689
5329
4
To
tal
1240
6812
5167
1231
0412
1048
1227
8011
3860
1234
4712
0078
1216
0012
3708
1240
6812
2834
1213
3412
6671
1247
5511
9922
* As
per 2
nd A
dvan
ce E
stim
ates
rele
ased
on
08.0
2.20
13.

Annexure 193A
nnex
ure.
4.2
: All
Indi
a Es
timat
es o
f Pro
duct
ion
of F
oodg
rain
s Cr
ops
Seas
on
Pro
duct
ion
(‘000
Ton
nes)
1997
-98
1998
-99
1999
-200
020
00-0
1
2001
-02
20
02-0
3 20
03-0
420
04-0
5 20
05-0
620
06-0
720
07-0
820
08-0
920
09-1
020
10-1
120
11-1
220
12-1
3*
12
34
56
78
910
1112
1314
1516
1718
Rice
Aut
umn
4591
.142
37.2
4653
.243
56.3
4661
.933
46.3
3733
.834
93.9
3449
.964
45.3
6430
.669
28.7
4557
.632
61.1
W
inte
r27
993.
126
717.
126
983.
925
759.
629
692.
123
499.
527
708.
525
540.
626
900.
027
004.
925
776.
727
487.
226
316.
925
742.
3
Kh
arif
3994
5.7
4176
5.8
4584
3.4
4266
2.5
4616
7.8
3623
7.3
4717
6.2
4319
5.5
4792
2.0
4672
0.6
5049
5.6
5053
5.5
4508
3.4
5169
0.7
To
tal
Khar
if72
529.
972
720.
177
480.
572
778.
480
521.
863
083.
178
618.
572
230.
078
271.
980
170.
882
702.
984
951.
475
957.
880
694.
092
747.
690
687.
5
Ra
bi/
Sum
mer
1001
4.6
1335
6.6
1220
2.4
1219
8.2
1281
8.2
8737
.199
07.5
1090
1.7
1352
1.5
1318
4.5
1399
0.0
1423
1.1
1313
5.1
1528
5.8
1256
3.4
1111
3.5
To
tal
8254
4.5
8607
6.7
8968
2.9
8497
6.6
9334
0.0
7182
0.2
8852
6.0
8313
1.7
9179
3.4
9335
5.3
9669
2.9
9918
2.5
8909
2.9
9597
9.8
1053
11.0
1018
01.0
Whe
atRa
bi66
349.
971
287.
576
368.
969
680.
872
766.
365
760.
872
156.
268
636.
969
354.
575
806.
778
570.
280
679.
480
803.
686
874.
094
882.
192
298.
8
Jow
arKh
arif
4962
.552
79.9
4818
.545
61.3
4228
.642
22.7
4843
.640
44.4
4071
.637
06.8
4114
.930
51.9
2763
.234
39.1
3320
.325
76.7
Ra
bi25
65.6
3135
.538
66.4
2968
.133
28.2
2789
.718
37.7
3199
.935
58.0
3444
.038
11.0
4193
.739
35.0
3564
.026
86.2
2679
.6
To
tal
7528
.184
15.4
8684
.975
29.4
7556
.870
12.4
6681
.372
44.3
7629
.671
50.8
7925
.972
45.6
6698
.270
03.1
6006
.552
56.4
Bajra
Khar
if76
44.4
6955
.657
82.2
6759
.282
84.0
4718
.912
109.
379
31.3
7684
.084
23.7
9970
.188
87.1
6506
.410
369.
910
276.
081
48.9
Mai
zeKh
arif
9429
.895
38.7
9706
.210
219.
611
248.
392
72.4
1273
4.4
1147
6.4
1215
5.9
1155
6.3
1510
6.7
1412
0.5
1229
3.3
1663
7.4
1648
6.3
1559
4.0
Ra
bi/
Sum
mer
1389
.416
09.0
1803
.418
23.6
1911
.918
79.3
2249
.926
95.6
2554
.035
40.7
3848
.756
10.9
4426
.250
88.4
5273
.154
64.4
To
tal
1081
9.2
1114
7.7
1150
9.6
1204
3.2
1316
0.2
1115
1.7
1498
4.3
1417
2.0
1470
9.9
1509
7.0
1895
5.4
1973
1.4
1671
9.5
2172
5.8
2175
9.4
2105
8.4
Ragi
Khar
if20
86.8
2608
.122
89.5
2731
.723
74.6
1315
.719
65.7
2432
.423
53.6
1443
.621
52.2
2039
.918
88.5
2193
.519
29.2
1784
.9
Smal
l M
illet
sKh
arif
639.
967
0.8
618.
258
6.9
576.
745
9.3
563.
847
7.6
471.
647
9.6
550.
744
4.8
381.
944
2.0
451.
540
2.2
Barle
yRa
bi16
79.4
1537
.814
47.0
1430
.614
24.5
1407
.412
97.6
1207
.112
20.6
1327
.911
96.1
1689
.113
54.7
1662
.916
18.7
1816
.5
Coar
se
Cere
als
Khar
if24
763.
425
053.
123
214.
624
858.
726
712.
219
989.
032
216.
826
362.
126
736.
725
610.
031
894.
628
544.
223
833.
333
081.
832
463.
328
506.
8
Ra
bi56
34.4
6282
.371
16.8
6222
.366
64.6
6076
.453
85.2
7102
.673
32.6
8312
.688
55.8
1149
3.7
9715
.810
315.
295
78.0
9960
.5
To
tal
3039
7.8
3133
5.4
3033
1.4
3108
1.0
3337
6.8
2606
5.4
3760
2.0
3346
4.7
3406
9.3
3392
2.6
4075
0.4
4003
7.9
3354
9.1
4339
7.1
4204
1.3
3846
7.3
Cere
als
Khar
if97
293.
397
773.
210
0695
.197
637.
110
7234
.083
072.
111
0835
.398
592.
110
5008
.610
5780
.811
4597
.511
3495
.699
791.
211
3775
.912
5210
.911
9194
.3
Ra
bi81
998.
990
926.
495
688.
188
101.
392
249.
180
574.
387
448.
986
641.
290
208.
697
303.
810
1416
.010
6404
.210
3654
.411
2475
.011
7023
.511
3372
.8
To
tal
1792
92.2
1886
99.6
1963
83.2
1857
38.4
1994
83.1
1636
46.4
1982
84.2
1852
33.3
1952
17.2
2030
84.6
2160
13.5
2198
99.8
2034
45.6
2262
50.9
2422
34.4
2325
67.1
Tur
(Arh
ar)
Khar
if18
49.5
2707
.926
93.8
2246
.322
59.8
2185
.823
56.4
2346
.927
38.0
2314
.130
75.9
2265
.524
64.6
2861
.126
54.1
2745
.1
Pulse
s O
ther
Th
an
Tur
Khar
if24
40.1
2433
.221
22.4
2201
.925
78.4
1965
.238
08.3
2370
.421
26.8
2481
.333
27.3
2420
.717
39.7
4259
.034
03.8
2737
.0
Gra
mRa
bi61
32.2
6800
.751
18.1
3855
.454
73.0
4236
.857
17.5
5469
.455
99.9
6333
.757
48.6
7060
.274
75.9
8221
.177
02.3
8567
.8

194 State of Indian Agriculture
Crop
sSe
ason
P
rodu
ctio
n (‘0
00 T
onne
s)
1997
-98
1998
-99
1999
-200
020
00-0
1
2001
-02
20
02-0
3 20
03-0
420
04-0
5 20
05-0
620
06-0
720
07-0
820
08-0
920
09-1
020
10-1
120
11-1
220
12-1
3*
12
34
56
78
910
1112
1314
1516
1718
Pulse
s O
ther
Th
an
Gra
m
Rabi
2549
.029
65.3
3483
.827
71.8
3056
.927
37.2
3023
.029
42.8
2919
.730
68.4
2609
.728
20.0
2981
.728
99.8
3328
.835
25.6
Pulse
sKh
arif
4289
.651
41.1
4816
.244
48.2
4838
.241
51.0
6164
.747
17.3
4864
.847
95.4
6403
.246
86.2
4204
.271
20.1
6057
.954
82.1
Ra
bi86
81.2
9766
.086
01.9
6627
.285
29.9
6974
.087
40.5
8412
.285
19.6
9402
.183
58.3
9880
.210
457.
611
120.
811
031.
112
093.
4
To
tal
1297
0.8
1490
7.1
1341
8.1
1107
5.4
1336
8.1
1112
5.0
1490
5.2
1312
9.5
1338
4.4
1419
7.5
1476
1.5
1456
6.4
1466
1.8
1824
0.9
1708
9.0
1757
5.5
Food
gr
ains
Khar
if10
1582
.910
2914
.310
5511
.310
2085
.311
2072
.287
223.
111
7000
.010
3309
.410
9873
.411
0576
.212
1000
.711
8181
.810
3995
.412
0896
.013
1268
.812
4676
.3
Ra
bi90
680.
110
0692
.410
4290
.094
728.
510
0779
.087
548.
396
189.
495
053.
498
728.
210
6705
.910
9774
.311
6284
.411
4112
.012
3595
.812
8054
.612
5466
.3
To
tal19
2263
.020
3606
.720
9801
.319
6813
.821
2851
.217
4771
.421
3189
.419
8362
.820
8601
.621
7282
.123
0775
.023
4466
.221
8107
.424
4491
.825
9323
.425
0142
.6
* As
per 2
nd A
dvan
ce E
stim
ates
rele
ased
on
08.0
2.20
13.

Annexure 195A
nnex
ure.
4.3
: All
Indi
a Es
timat
es o
f Yie
ld o
f Foo
dgra
ins
Crop
sSe
ason
Yie
ld (K
g./H
ecta
re)
1997
-98
1998
-99
1999
-200
020
00-0
1
2001
-02
20
02-0
3 20
03-0
420
04-0
5 20
05-0
620
06-0
720
07-0
820
08-0
920
09-1
020
10-1
120
11-1
220
12-1
3*
12
34
56
78
910
1112
1314
1516
1718
Rice
Aut
umn
1462
1373
1534
1404
1532
1202
1385
1327
1349
2804
2892
3107
2186
1776
W
inte
r17
8317
4817
3617
2619
3815
9518
6817
5617
9520
0018
9219
6819
3923
38
Kh
arif
1904
1891
2049
1882
2074
1766
2174
2039
2199
1963
2138
2054
2053
2051
To
tal
Khar
if18
2117
9818
9217
8819
8216
5820
0418
8319
9020
2420
9520
8220
1921
2123
1223
63
Ra
bi/
Sum
mer
2765
3073
2897
3042
2992
2783
2947
3077
3127
3130
3149
3010
3055
3176
3235
2934
To
tal
1900
1921
1986
1901
2079
1744
2078
1984
2102
2131
2202
2178
2125
2239
2393
2415
Whe
atRa
bi24
8525
9027
7827
0827
6226
1027
1326
0226
1927
0828
0229
0728
3929
8931
7731
36
Jow
arKh
arif
954
1047
998
938
945
995
1085
987
1082
992
1176
1055
853
1119
1267
1070
Ra
bi45
866
071
359
462
555
237
764
172
672
789
490
486
582
774
170
1
To
tal
697
859
847
764
771
754
716
797
880
844
1021
962
860
949
962
844
Bajra
Khar
if77
374
865
068
886
961
011
4185
980
288
610
4210
1573
110
7911
7111
24
Mai
zeKh
arif
1637
1706
1695
1707
1896
1552
1932
1740
1799
1660
2122
2048
1740
2285
2234
2201
Ra
bi/
Sum
mer
2482
2626
2594
2921
2952
2851
2987
3224
3076
3793
3854
4387
3694
4003
3765
4287
To
tal
1712
1797
1792
1822
2000
1681
2041
1907
1938
1912
2335
2414
2024
2540
2478
2519
Ragi
Khar
if12
6014
8314
0115
5314
4293
011
8015
6715
3412
2615
5214
7714
8917
0516
4115
14
Smal
l M
illet
sKh
arif
418
449
438
412
440
383
473
434
443
475
530
491
460
553
565
581
Barle
yRa
bi19
5819
4019
9718
4021
6020
0619
7519
5819
3820
5519
8523
9421
7223
5725
1624
05
Coar
se
Cere
als
Khar
if10
3010
8110
3210
4211
6797
213
1411
6811
7811
4414
1013
7111
1915
0015
6415
31
Ra
bi80
310
2010
4097
310
0594
785
811
0211
5213
1615
1017
3515
2516
4116
8917
02
To
tal
979
1068
1034
1027
1131
966
1221
1153
1172
1182
1431
1459
1212
1531
1591
1572
Cere
als
Khar
if15
2315
3615
8715
1216
8814
1717
3916
1816
9317
0618
4618
4116
9418
9320
5720
92
Ra
bi21
9623
9124
8324
3824
7623
1924
1323
8224
2725
2626
4527
2126
4928
0029
6929
02
To
tal
1772
1856
1926
1844
1980
1753
1983
1903
1968
2020
2151
2183
2075
2256
2415
2421
Tur
(Arh
ar)
Khar
if55
178
778
661
867
965
167
066
776
565
082
667
171
165
566
272
4
Pulse
s O
ther
Tha
n Tu
r
Khar
if34
135
233
331
334
929
846
630
430
034
942
937
624
453
647
446
8
Gra
mRa
bi81
180
383
374
485
371
781
181
580
884
576
289
591
589
592
896
0

196 State of Indian Agriculture
Crop
sSe
ason
Yie
ld (K
g./H
ecta
re)
1997
-98
1998
-99
1999
-200
020
00-0
1
2001
-02
20
02-0
3 20
03-0
420
04-0
5 20
05-0
620
06-0
720
07-0
820
08-0
920
09-1
020
10-1
120
11-1
220
12-1
3*
12
34
56
78
910
1112
1314
1516
1718
Pulse
s O
ther
Tha
n G
ram
Rabi
531
633
673
615
628
590
640
622
610
611
567
642
658
592
669
666
Pulse
sKh
arif
408
497
492
417
451
417
528
417
456
449
557
478
397
578
541
569
Ra
bi70
274
376
068
475
666
174
273
572
775
168
880
482
379
083
185
0
To
tal
567
634
635
544
607
543
635
577
598
612
625
659
630
691
699
737
Food
grai
nsKh
arif
1366
1391
1441
1357
1510
1272
1551
1430
1511
1522
1645
1654
1496
1669
1822
1871
Ra
bi18
2519
6720
9120
6720
7619
3320
0419
8820
2020
9121
7422
6322
0222
7824
3023
54
To
tal
1550
1627
1704
1626
1734
1535
1727
1652
1715
1756
1860
1909
1798
1930
2079
2086
* As
per 2
nd A
dvan
ce E
stim
ates
rele
ased
on
08.0
2.20
13.

Annexure 197A
nnex
ure.
4.4
: Are
a un
der C
omm
erci
al C
rops
Cr
ops
Seas
onA
rea (
‘000
Hec
tare
s)
1997
-98
1998
-99
1999
-200
020
00-0
120
01-0
220
02-0
320
03-0
420
04-0
5 20
05-0
620
06-0
720
07-0
820
08-0
920
09-1
020
10-1
120
11-1
220
12-1
3*
Gro
undn
utKh
arif
6064
.958
86.2
5808
.857
05.2
5461
.052
72.4
5196
.257
86.3
5739
.747
80.3
5312
.152
85.8
4616
.049
77.4
4316
.138
23.5
Ra
bi10
23.3
1509
.810
58.5
853.
477
7.1
663.
179
0.8
854.
199
6.3
834.
897
9.9
879.
186
1.5
878.
794
7.7
1042
.8
To
tal
7088
.273
96.0
6867
.365
58.6
6238
.159
35.5
5987
.066
40.4
6736
.056
15.1
6292
.061
64.9
5477
.558
56.1
5263
.848
66.3
Cast
orse
edKh
arif
641.
368
2.4
781.
610
79.6
716.
658
3.2
717.
274
3.0
864.
262
8.4
786.
986
6.2
734.
988
0.3
1470
.912
96.4
Nig
erse
edKh
arif
520.
949
4.8
480.
143
9.9
478.
041
4.4
431.
742
9.9
414.
446
9.0
407.
639
3.4
375.
537
1.0
364.
428
9.6
Sesa
mum
Khar
if16
60.0
1609
.015
60.2
1720
.016
70.6
1444
.417
00.3
1844
.017
23.2
1703
.217
99.1
1809
.119
42.1
2083
.219
01.5
1702
.5
Rape
seed
&
Mus
tard
Rabi
7041
.065
13.2
6026
.844
76.7
5073
.045
44.0
5428
.173
16.4
7276
.567
90.0
5825
.562
98.1
5588
.069
00.5
5893
.561
96.7
Lins
eed
Rabi
793.
974
9.4
593.
157
9.9
535.
845
0.1
476.
544
8.7
436.
843
6.5
467.
940
7.9
342.
035
9.2
322.
630
3.7
Saffl
ower
Rabi
619.
844
0.2
438.
542
4.8
404.
336
9.5
363.
936
9.1
364.
637
7.0
320.
329
4.6
287.
824
3.8
250.
415
7.1
Sunfl
ower
Khar
if59
0.5
732.
947
3.4
419.
130
9.3
531.
961
0.7
873.
191
9.4
860.
476
1.9
661.
556
7.7
315.
326
0.2
315.
3
Ra
bi11
52.9
1091
.881
4.7
654.
786
7.5
1110
.313
92.8
1287
.514
20.2
1304
.411
49.7
1151
.390
8.8
613.
747
1.7
555.
9
To
tal
1743
.418
24.7
1288
.110
73.8
1176
.816
42.2
2003
.521
60.6
2339
.621
64.8
1911
.618
12.8
1476
.592
9.0
731.
987
1.2
Soya
bean
Khar
if59
86.1
6488
.962
22.4
6416
.663
43.1
6105
.565
54.7
7571
.277
07.5
8328
.788
81.7
9510
.897
34.7
9601
.010
109.
110
631.
7
Edib
le
Oils
eeds
Khar
if14
822.
415
211.
814
544.
914
700.
814
262.
013
768.
614
493.
616
504.
516
504.
216
141.
617
162.
417
660.
617
235.
917
348.
016
951.
316
762.
6
Ra
bi98
37.0
9555
.083
38.5
6409
.671
21.9
6686
.979
75.6
9827
.110
057.
693
06.2
8275
.486
23.1
7646
.186
36.7
7563
.379
52.5
To
tal
2465
9.4
2476
6.8
2288
3.4
2111
0.4
2138
3.9
2045
5.5
2246
9.2
2633
1.6
2656
1.8
2544
7.8
2543
7.8
2628
3.7
2488
2.1
2598
4.7
2451
4.6
2471
5.1
Non
Edi
ble
Oils
eeds
Khar
if64
1.3
682.
478
1.6
1079
.671
6.6
583.
271
7.2
743.
086
4.2
628.
478
6.9
866.
273
4.9
880.
314
70.9
1296
.4
Ra
bi79
3.9
749.
459
3.1
579.
953
5.8
450.
147
6.5
448.
743
6.8
436.
546
7.9
407.
934
2.0
359.
232
2.6
303.
7
To
tal
1435
.214
31.8
1374
.716
59.5
1252
.410
33.3
1193
.711
91.7
1301
.010
64.9
1254
.812
74.1
1076
.912
39.6
1793
.516
00.1
Tota
l Nin
e O
ilsee
dsKh
arif
1546
3.7
1589
4.2
1532
6.5
1578
0.4
1497
8.6
1435
1.8
1521
0.8
1724
7.5
1736
8.4
1677
0.0
1794
9.3
1852
6.7
1797
0.9
1822
8.4
1842
2.2
1805
9.0
Ra
bi10
630.
910
304.
489
31.6
6989
.576
57.7
7137
.084
52.1
1027
5.8
1049
4.4
9742
.787
43.3
9031
.079
88.1
8995
.978
85.9
8256
.2
To
tal
2609
4.6
2619
8.6
2425
8.1
2276
9.9
2263
6.3
2148
8.8
2366
2.9
2752
3.3
2786
2.8
2651
2.7
2669
2.6
2755
7.7
2595
9.0
2722
4.3
2630
8.1
2631
5.3
Cotto
nTo
tal
8868
.093
42.2
8709
.585
34.4
9131
.876
69.6
7597
.987
86.6
8677
.191
44.5
9413
.794
06.7
1013
1.7
1123
5.0
1217
8.0
1177
3.0
Jute
Tota
l90
6.2
848.
384
6.6
827.
987
3.1
864.
584
9.0
773.
975
9.8
792.
981
4.1
785.
681
1.2
773.
680
9.0
773.
9
Mes
taTo
tal
200.
517
7.1
188.
718
9.7
174.
117
0.8
152.
514
1.8
137.
914
2.2
146.
211
5.3
94.2
98.6
95.6
86.8
Jute
&
Mes
ta
1106
.710
25.4
1035
.310
17.6
1047
.210
35.3
1001
.591
5.7
897.
793
5.1
960.
390
0.9
905.
487
2.1
904.
686
0.7
Suga
rcan
eTo
tal
3929
.840
54.9
4219
.743
15.7
4411
.645
20.3
3938
.436
61.5
4201
.751
50.8
5055
.244
15.4
4174
.648
84.8
5037
.750
62.5
* As
per 2
nd A
dvan
ce E
stim
ates
rele
ased
on
08.0
2.20
13.
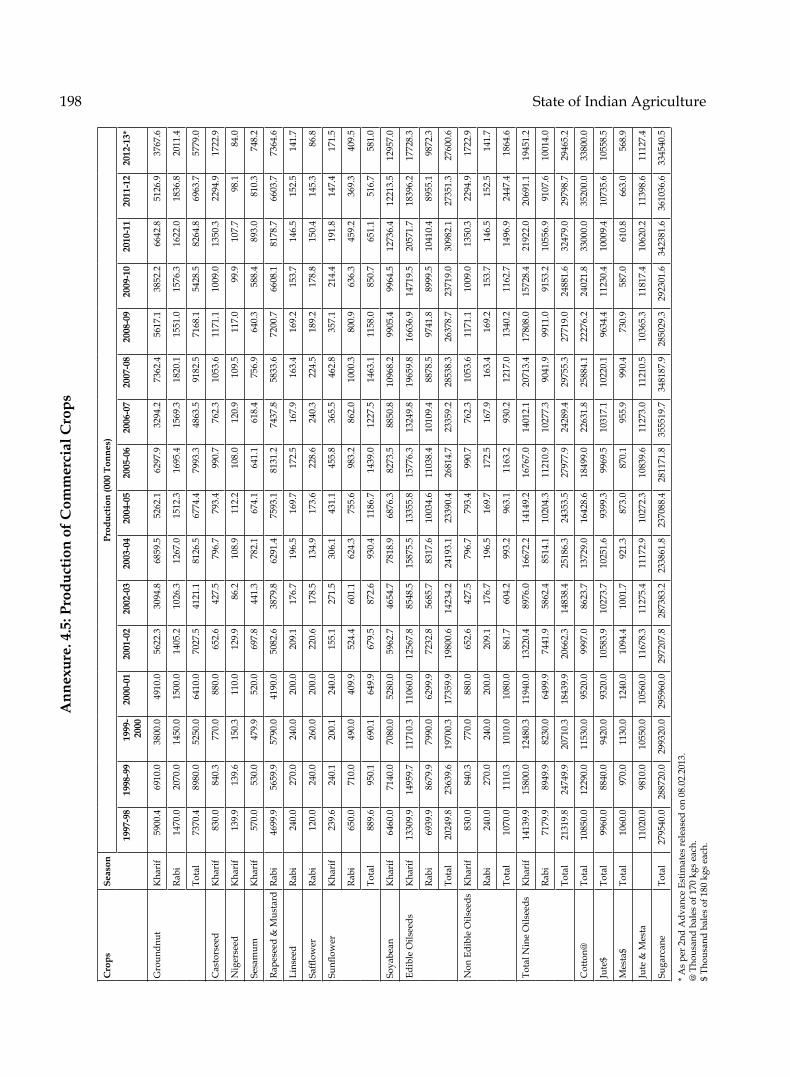
198 State of Indian AgricultureC
rops
Seas
onPr
oduc
tion
(000
Ton
nes)
1997
-98
1998
-99
1999
-20
0020
00-0
120
01-0
220
02-0
320
03-0
420
04-0
5 20
05-0
620
06-0
720
07-0
820
08-0
920
09-1
020
10-1
120
11-1
220
12-1
3*
Gro
undn
ut
Kha
rif
5900
.469
10.0
3800
.049
10.0
5622
.330
94.8
6859
.552
62.1
6297
.932
94.2
7362
.456
17.1
3852
.266
42.8
5126
.937
67.6
Rabi
1470
.020
70.0
1450
.015
00.0
1405
.210
26.3
1267
.015
12.3
1695
.415
69.3
1820
.115
51.0
1576
.316
22.0
1836
.820
11.4
Tota
l73
70.4
8980
.052
50.0
6410
.070
27.5
4121
.181
26.5
6774
.479
93.3
4863
.591
82.5
7168
.154
28.5
8264
.869
63.7
5779
.0
Cas
tors
eed
Kha
rif
830.
084
0.3
770.
088
0.0
652.
642
7.5
796.
779
3.4
990.
776
2.3
1053
.611
71.1
1009
.013
50.3
2294
.917
22.9
Nig
erse
edK
hari
f13
9.9
139.
615
0.3
110.
012
9.9
86.2
108.
911
2.2
108.
012
0.9
109.
511
7.0
99.9
107.
798
.184
.0
Sesa
mum
Kha
rif
570.
053
0.0
479.
952
0.0
697.
844
1.3
782.
167
4.1
641.
161
8.4
756.
964
0.3
588.
489
3.0
810.
374
8.2
Rape
seed
& M
usta
rdRa
bi46
99.9
5659
.957
90.0
4190
.050
82.6
3879
.862
91.4
7593
.181
31.2
7437
.858
33.6
7200
.766
08.1
8178
.766
03.7
7364
.6
Lins
eed
Rabi
240.
027
0.0
240.
020
0.0
209.
117
6.7
196.
516
9.7
172.
516
7.9
163.
416
9.2
153.
714
6.5
152.
514
1.7
Saffl
ower
Rabi
120.
024
0.0
260.
020
0.0
220.
617
8.5
134.
917
3.6
228.
624
0.3
224.
518
9.2
178.
815
0.4
145.
386
.8
Sunfl
ower
Kha
rif
239.
624
0.1
200.
124
0.0
155.
127
1.5
306.
143
1.1
455.
836
5.5
462.
835
7.1
214.
419
1.8
147.
417
1.5
Rabi
650.
071
0.0
490.
040
9.9
524.
460
1.1
624.
375
5.6
983.
286
2.0
1000
.380
0.9
636.
345
9.2
369.
340
9.5
Tota
l88
9.6
950.
169
0.1
649.
967
9.5
872.
693
0.4
1186
.714
39.0
1227
.514
63.1
1158
.085
0.7
651.
151
6.7
581.
0
Soya
bean
Kha
rif
6460
.071
40.0
7080
.052
80.0
5962
.746
54.7
7818
.968
76.3
8273
.588
50.8
1096
8.2
9905
.499
64.5
1273
6.4
1221
3.5
1295
7.0
Edib
le O
ilsee
ds
Kha
rif
1330
9.9
1495
9.7
1171
0.3
1106
0.0
1256
7.8
8548
.515
875.
513
355.
815
776.
313
249.
819
659.
816
636.
914
719.
520
571.
718
396.
217
728.
3
Rabi
6939
.986
79.9
7990
.062
99.9
7232
.856
85.7
8317
.610
034.
611
038.
410
109.
488
78.5
9741
.889
99.5
1041
0.4
8955
.198
72.3
Tota
l20
249.
823
639.
619
700.
317
359.
919
800.
614
234.
224
193.
123
390.
426
814.
723
359.
228
538.
326
378.
723
719.
030
982.
127
351.
327
600.
6
Non
Edi
ble
Oils
eeds
Kha
rif
830.
084
0.3
770.
088
0.0
652.
642
7.5
796.
779
3.4
990.
776
2.3
1053
.611
71.1
1009
.013
50.3
2294
.917
22.9
Rabi
240.
027
0.0
240.
020
0.0
209.
117
6.7
196.
516
9.7
172.
516
7.9
163.
416
9.2
153.
714
6.5
152.
514
1.7
Tota
l10
70.0
1110
.310
10.0
1080
.086
1.7
604.
299
3.2
963.
111
63.2
930.
212
17.0
1340
.211
62.7
1496
.924
47.4
1864
.6
Tota
l Nin
e O
ilsee
ds
Kha
rif
1413
9.9
1580
0.0
1248
0.3
1194
0.0
1322
0.4
8976
.016
672.
214
149.
216
767.
014
012.
120
713.
417
808.
015
728.
421
922.
020
691.
119
451.
2
Rabi
7179
.989
49.9
8230
.064
99.9
7441
.958
62.4
8514
.110
204.
311
210.
910
277.
390
41.9
9911
.091
53.2
1055
6.9
9107
.610
014.
0
Tota
l21
319.
824
749.
920
710.
318
439.
920
662.
314
838.
425
186.
324
353.
527
977.
924
289.
429
755.
327
719.
024
881.
632
479.
029
798.
729
465.
2
Cot
ton@
Tota
l10
850.
012
290.
011
530.
095
20.0
9997
.086
23.7
1372
9.0
1642
8.6
1849
9.0
2263
1.8
2588
4.1
2227
6.2
2402
1.8
3300
0.0
3520
0.0
3380
0.0
Jute
$To
tal
9960
.088
40.0
9420
.093
20.0
1058
3.9
1027
3.7
1025
1.6
9399
.399
69.5
1031
7.1
1022
0.1
9634
.411
230.
410
009.
410
735.
610
558.
5
Mes
ta$
Tota
l10
60.0
970.
011
30.0
1240
.010
94.4
1001
.792
1.3
873.
087
0.1
955.
999
0.4
730.
958
7.0
610.
866
3.0
568.
9
Jute
& M
esta
11
020.
098
10.0
1055
0.0
1056
0.0
1167
8.3
1127
5.4
1117
2.9
1027
2.3
1083
9.6
1127
3.0
1121
0.5
1036
5.3
1181
7.4
1062
0.2
1139
8.6
1112
7.4
Suga
rcan
eTo
tal
2795
40.0
2887
20.0
2993
20.0
2959
60.0
2972
07.8
2873
83.2
2338
61.8
2370
88.4
2811
71.8
3555
19.7
3481
87.9
2850
29.3
2923
01.6
3423
81.6
3610
36.6
3345
40.5
* As
per 2
nd A
dvan
ce E
stim
ates
rele
ased
on
08.0
2.20
13.
@ T
hous
and
bale
s of
170
kgs
eac
h.$
Thou
sand
bal
es o
f 180
kgs
eac
h.
Ann
exur
e. 4
.5: P
rodu
ctio
n of
Com
mer
cial
Cro
ps

Annexure 199C
rops
Seas
onYi
eld
(Kgs
./Hec
t.)
1997
-98
1998
-99
1999
-20
0020
00-0
120
01-0
220
02-0
320
03-0
420
04-0
5 20
05-0
620
06-0
720
07-0
820
08-0
920
09-1
020
10-1
120
11-1
220
12-1
3*
Gro
undn
utK
hari
f97
311
7465
486
110
3058
713
2090
910
9768
913
8610
6383
513
3511
8898
5
Ra
bi14
3713
7113
7017
5818
0815
4816
0217
7117
0218
8018
5717
6418
3018
4619
3819
29
To
tal
1040
1214
764
977
1127
694
1357
1020
1187
866
1459
1163
991
1411
1323
1188
Cas
tors
eed
Kha
rif
1294
1231
985
815
911
733
1111
1068
1146
1213
1339
1352
1373
1534
1560
1329
Nig
erse
edK
hari
f26
928
231
325
027
220
825
226
126
125
826
929
726
629
026
929
0
Sesa
mum
Kha
rif
343
329
308
302
418
306
460
366
372
363
421
354
303
429
426
439
Rape
seed
&
Mus
tard
Rabi
668
869
961
936
1002
854
1159
1038
1117
1095
1001
1143
1183
1185
1121
1188
Lins
eed
Rabi
302
360
405
345
390
393
412
378
395
385
349
415
449
408
473
467
Saffl
ower
Rabi
194
545
593
471
546
483
371
470
627
637
701
642
621
617
580
553
Sunfl
ower
Kha
rif
406
328
423
573
501
510
501
494
496
425
607
540
378
608
566
544
Ra
bi56
465
060
162
660
454
144
858
769
266
187
069
670
074
878
373
7
To
tal
510
521
536
605
577
531
464
549
615
567
765
639
576
701
706
667
Soya
bean
Kha
rif
1079
1100
1138
823
940
762
1193
908
1073
1063
1235
1041
1024
1327
1208
1219
Edib
le
Oils
eeds
Kha
rif
898
983
805
752
881
621
1095
809
956
821
1146
942
854
1186
1085
1058
Rabi
705
908
958
983
1016
850
1043
1021
1098
1086
1073
1130
1177
1205
1184
1241
Tota
l82
195
486
182
292
669
610
7788
810
1091
811
2210
0495
311
9211
1611
17
Non
Edi
ble
Oils
eeds
Kha
rif
1294
1231
985
815
911
733
1111
1068
1146
1213
1339
1352
1373
1534
1560
1329
Rabi
302
360
405
345
390
393
412
378
395
385
349
415
449
408
473
467
Tota
l74
677
573
565
168
858
583
280
889
487
497
010
5210
8012
0813
6511
65
Tota
l Nin
e O
ilsee
ds
Kha
rif
914
994
814
757
883
625
1096
820
965
836
1154
961
875
1203
1123
1077
Rabi
675
869
921
930
972
821
1007
993
1068
1055
1034
1097
1146
1174
1155
1213
Tota
l81
794
585
481
091
369
110
6488
510
0491
611
1510
0695
811
9311
3311
20
Cot
ton
Tota
l20
822
422
519
018
619
130
731
836
242
146
740
340
349
949
148
8
Jute
Tota
l19
7818
7620
0320
2621
8221
3921
7321
8623
6223
4222
6022
0724
9223
2923
8924
56
Mes
taTo
tal
952
986
1078
1177
1131
1056
1087
1108
1136
1210
1219
1141
1121
1115
1248
1180
Jute
& M
esta
17
9217
2218
3418
6820
0719
6020
0820
1921
7321
7021
0120
7123
4921
9222
6823
27
Suga
rcan
eTo
tal
7113
371
203
7093
468
578
6737
063
576
5938
064
752
6691
969
022
6887
764
553
7002
070
091
7166
766
082
* As
per 2
nd A
dvan
ce E
stim
ates
rele
ased
on
08.0
2.20
13.A
nnex
ure.
4.6
: Yie
ld o
f Com
mer
cial
Cro
ps

200 State of Indian Agriculture C
omm
oditi
es20
01-0
220
02-0
320
03-0
420
04-0
520
05-0
620
06-0
720
07-0
820
08-0
920
09-1
020
10-1
120
11-1
220
12-1
3@Fr
uits
Alm
ond/
Wal
nut *
117
117
106
106
130
132
132
136
142
2322
22A
onla
67
9598
App
le24
219
320
123
122
725
226
427
428
328
932
232
5Ba
nana
466
475
499
535
570
604
658
709
770
830
797
814
Ber
22
3434
Citr
us
(i)
Lim
e/Le
mon
21
923
424
3(ii
) Man
dari
n
324
329
340
(iii)
Swee
t Ora
nge
( Mos
ambi
)
157
162
165
(iv) O
ther
s
147
190
195
Citr
us T
otal
(i to
iv)
619
563
683
708
742
798
867
924
987
846
915
943
Cus
tard
appl
e
1519
20G
rape
s48
5258
6166
6568
8010
611
111
611
8G
uava
155
155
166
161
167
176
179
204
220
205
220
229
Jack
frui
t
3660
62K
iwi
0
33
Litc
hi58
5454
6063
6569
7274
7880
82M
ango
1576
1623
1907
1970
2081
2154
2201
2309
2312
2297
2378
2466
Papa
ya74
6858
7368
7283
9896
106
117
123
Pass
ion
Frui
t16
16Pe
ach
18
2020
Pear
41
4849
Pine
appl
e77
8081
8382
8780
8492
8910
210
4Pl
um
1426
26Po
meg
rana
te
97
112
112
117
124
109
125
107
112
111
Sapo
ta52
8412
113
414
014
915
215
615
916
016
316
9W
alnu
t *
114
150
158
Oth
ers
645
441
737
922
1008
1016
1112
1083
1105
913
889
884
Ann
exur
e 4.
7: A
ll In
dia
Estim
ates
of A
rea
unde
r Hor
ticul
ture
Cro
ps(A
rea
in 0
00 H
a)

Annexure 201 C
omm
oditi
es20
01-0
220
02-0
320
03-0
420
04-0
520
05-0
620
06-0
720
07-0
820
08-0
920
09-1
020
10-1
120
11-1
220
12-1
3@To
tal F
ruits
4127
3905
4767
5155
5454
5687
5989
6238
6471
6382
6705
6877
Veg
etab
les
Bean
s
100
118
122
Bitte
rgua
rd
6877
79Bo
ttleg
uard
75
105
108
Brin
jal
502
507
516
527
560
568
561
600
612
680
692
705
Cab
bage
258
234
255
288
254
249
266
310
331
369
390
397
Cap
sicu
m
610
10C
arro
t
5662
64C
aulifl
ower
270
255
268
239
289
302
312
349
348
369
391
399
Cuc
umbe
r
3540
44M
uskm
elon
40
3839
Okr
a34
732
935
335
739
239
640
743
245
249
851
853
5O
nion
496
425
554
614
704
768
821
834
756
1064
1087
1014
Parm
a l(p
oint
ed
gour
d) -
--
--
- -
- -
- -
-
Peas
303
305
285
276
286
297
313
348
365
370
408
419
Pota
to12
6013
3714
8515
2415
6917
4317
9518
2818
3518
6319
0719
31Ra
dish
13
316
016
2Si
taph
al/P
umpk
in
511
11Sw
eet P
otat
o13
213
213
313
312
312
312
312
411
911
311
011
1Ta
pioc
a23
920
722
024
524
525
527
028
023
222
122
724
4To
mat
o45
847
950
350
554
659
656
659
963
486
590
793
3W
ater
mel
on
6771
72O
ther
s18
9118
8215
1020
3722
4722
8224
1422
7522
9914
9616
6116
81To
tal
6156
6092
6082
6744
7213
7581
7848
7980
7985
8495
8989
9081
Aro
mat
ic
131
262
324
397
430
509
510
506
531
Flow
ers
Cut
Flow
ers
Loos
e10
670
101
118
130
144
166
167
183
191
254
272
Plan
tatio
n C
rops
Are
canu
t33
4.8
334.
836
5.0
364.
338
1.1
382.
738
6.6
387
400
400
464
476
Cas
hew
nut
740.
074
0.0
780.
082
0.0
843.
485
4.0
868.
089
392
395
397
999
1
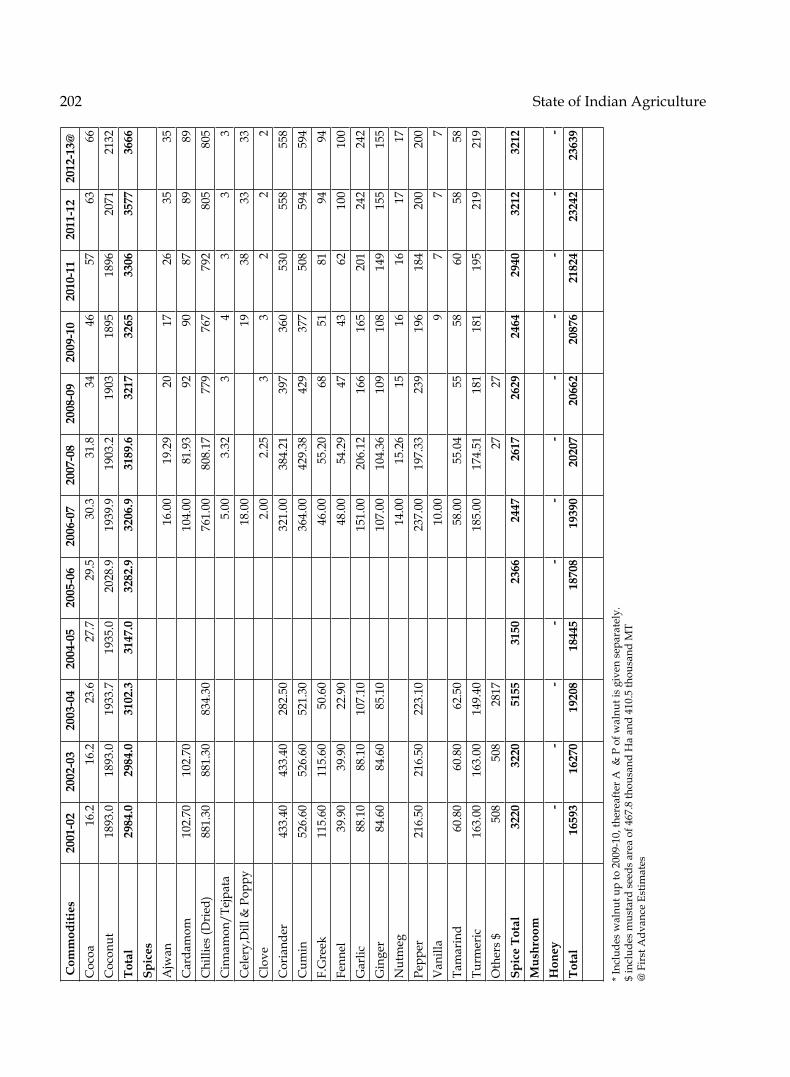
202 State of Indian Agriculture
Com
mod
ities
2001
-02
2002
-03
2003
-04
2004
-05
2005
-06
2006
-07
2007
-08
2008
-09
2009
-10
2010
-11
2011
-12
2012
-13@
Coc
oa16
.216
.223
.627
.729
.530
.331
.834
4657
6366
Coc
onut
1893
.018
93.0
1933
.719
35.0
2028
.919
39.9
1903
.219
0318
9518
9620
7121
32To
tal
2984
.029
84.0
3102
.331
47.0
3282
.932
06.9
3189
.632
1732
6533
0635
7736
66Sp
ices
Ajw
an
16.0
019
.29
2017
2635
35C
arda
mom
102.
7010
2.70
10
4.00
81.9
392
9087
8989
Chi
llies
(Dri
ed)
881.
3088
1.30
834.
30
76
1.00
808.
1777
976
779
280
580
5C
inna
mon
/Tej
pata
5.
003.
323
43
33
Cel
ery,
Dill
& P
oppy
18
.00
1938
3333
Clo
ve
2.00
2.25
33
22
2C
oria
nder
433.
4043
3.40
282.
50
32
1.00
384.
2139
736
053
055
855
8C
umin
526.
6052
6.60
521.
30
36
4.00
429.
3842
937
750
859
459
4F.
Gre
ek11
5.60
115.
6050
.60
46.0
055
.20
6851
8194
94Fe
nnel
39.9
039
.90
22.9
0
48
.00
54.2
947
4362
100
100
Gar
lic88
.10
88.1
010
7.10
151.
0020
6.12
166
165
201
242
242
Gin
ger
84.6
084
.60
85.1
0
10
7.00
104.
3610
910
814
915
515
5N
utm
eg
14.0
015
.26
1516
1617
17Pe
pper
216.
5021
6.50
223.
10
23
7.00
197.
3323
919
618
420
020
0V
anill
a
10.0
0
9
77
7Ta
mar
ind
60.8
060
.80
62.5
0
58
.00
55.0
455
5860
5858
Turm
eric
163.
0016
3.00
149.
40
18
5.00
174.
5118
118
119
521
921
9O
ther
s $
508
508
2817
27
27
Sp
ice
Tota
l32
2032
2051
5531
5023
6624
4726
1726
2924
6429
4032
1232
12M
ushr
oom
Hon
ey -
- -
- -
- -
- -
- -
- To
tal
1659
316
270
1920
818
445
1870
819
390
2020
720
662
2087
621
824
2324
223
639
* Inc
lude
s w
alnu
t up
to 2
009-
10, t
here
afte
r A &
P o
f wal
nut i
s gi
ven
sepa
rate
ly.
$ in
clud
es m
usta
rd s
eeds
are
a of
467
.8 th
ousa
nd H
a an
d 41
0.5
thou
sand
MT
@ F
irst
Adv
ance
Est
imat
es

Annexure 203
Com
mod
ities
2001
-02
2002
-03
2003
-04
2004
-05
2005
-06
2006
-07
2007
-08
2008
-09
2009
-10
2010
-11
2011
-12
2012
-13@
Frui
tsA
lmon
d/W
alnu
t*11
411
412
112
114
915
017
717
319
314
44
Aon
la
677
961
993
App
le11
5813
4815
2217
3918
1416
2420
0119
8517
7728
9122
0318
45Ba
nana
1421
013
304
1385
716
328
1888
820
998
2382
326
217
2647
029
780
2845
530
283
Ber
18
825
225
6C
itrus
(i)
Li
me/
Lem
on
2108
2272
2339
(ii) M
anda
rin
32
5531
2832
27(ii
i) Sw
eet O
rang
e( M
osam
bi)
13
1612
3211
86(iv
) Oth
ers
78
412
9013
31C
itrus
Tot
al (i
to iv
)47
8956
7757
8759
3361
3971
4580
1586
2396
3874
6479
2280
83C
usta
rdap
ple
10
512
713
3G
rape
s11
8412
4814
7515
6516
5016
8517
3518
7888
112
3522
2126
90G
uava
1716
1793
1831
1683
1737
1831
1981
2270
2572
2462
2510
2613
Jack
frui
t
540
1042
1032
Kiw
i
16
6Li
tchi
356
476
479
369
392
403
418
423
483
497
538
555
Man
go10
020
1273
311
490
1183
012
663
1373
413
997
1275
015
027
1518
816
196
1751
3Pa
paya
2590
2147
1692
2535
2173
2482
2909
3629
3913
4196
4457
4745
Pass
ion
Fru
it97
98Pe
ach
92
9190
Pear
30
029
431
7Pi
neap
ple
1182
1172
1234
1279
1263
1362
1245
1341
1387
1415
1500
1542
Plum
32
7269
Pom
egra
nate
665
801
809
840
884
807
820
743
772
772
Ann
exur
e 4.
8: A
ll In
dia
Estim
ates
of P
rodu
ctio
n of
Hor
ticul
ture
Cro
ps(P
rodu
ctio
n in
000
Ton
nes)

204 State of Indian Agriculture
Com
mod
ities
2001
-02
2002
-03
2003
-04
2004
-05
2005
-06
2006
-07
2007
-08
2008
-09
2009
-10
2010
-11
2011
-12
2012
-13@
Sapo
ta59
491
392
110
7711
1412
1612
5813
0813
4714
2414
2615
87W
alnu
t
187
284
277
Oth
ers
5202
4391
4991
5730
6715
6244
7321
7234
7201
5447
4991
5012
Tota
l Fru
its43
115
4531
746
063
5098
855
505
5971
465
764
6863
871
709
7487
876
424
8055
7V
eget
able
sBe
ans
88
811
5112
32Bi
tterg
uard
74
986
687
0Bo
ttleg
uard
13
5419
8420
52Br
inja
l83
4880
0184
7786
0193
6594
5396
7810
378
1056
311
896
1263
412
995
Cab
bage
5678
5392
5595
6114
5637
5584
5910
6870
7281
7949
8412
8603
Cap
sicu
m
6512
713
1C
arro
t
953
1153
1150
Cau
liflow
er48
9144
4449
4045
1553
2355
3857
7765
3265
6967
4573
4974
64C
ucum
ber
52
560
767
4M
uskm
elon
74
079
181
1O
kra
3325
3245
3631
3512
3975
4070
4179
4528
4803
5784
6259
6479
Oni
on52
5242
1062
6877
6194
3310
847
1390
013
565
1215
915
118
1751
116
817
Parm
al(p
oint
ed
gour
d) -
- -
- -
- -
- -
- -
-
Peas
2038
2062
1901
1945
2270
2402
2491
2916
3029
3517
3745
3913
Pota
to24
456
2316
127
926
2878
829
175
2860
034
658
3439
136
577
4233
941
483
4247
9Ra
dish
18
7822
8623
09Si
taph
al/P
umpk
in
143
278
282
Swee
t Pot
ato
1130
1130
1179
1179
1067
1067
1094
1120
1095
1047
1073
1089
Tapi
oca
6516
5426
5950
7463
7855
8232
9056
9623
8060
8076
8747
9944
Tom
ato
7462
7617
8126
8825
9820
1005
510
303
1114
912
433
1682
618
653
1937
7W
ater
mel
on
1436
1727
1793
Oth
ers
1952
620
127
1434
222
544
2748
129
146
3140
228
006
3116
818
526
1948
719
826
Tota
l88
622
8481
588
334
1012
4611
1399
1149
9312
8449
1290
7713
3738
1465
5415
6325
1602
91

Annexure 205 C
omm
oditi
es20
01-0
220
02-0
320
03-0
420
04-0
520
05-0
620
06-0
720
07-0
820
08-0
920
09-1
020
10-1
120
11-1
220
12-1
3@A
rom
atic
15
920
217
839
643
057
360
556
658
6Fl
ower
s C
ut #
2557
120
605
1793
020
710
2921
037
175
4364
447
942
6667
169
027
7506
675
413
Flow
ers
Loos
e53
573
558
065
965
688
086
898
710
2110
3116
5216
77Pl
anta
tion
Cro
psA
reca
nut
409.
340
9.3
439.
245
2.0
483.
148
3.3
476.
048
147
847
868
170
3C
ashe
wnu
t46
0.0
460.
053
5.0
544.
057
9.4
620.
066
5.0
695
613
675
725
752
Coc
oa6.
46.
48.
510
.010
.210
.210
.612
1314
1313
Coc
onut
8821
.388
21.3
1217
8.2
8829
.010
190.
110
893.
810
148.
310
148
1082
410
840
1494
015
347
Tota
l96
97.0
9697
.013
160.
998
35.0
1126
2.8
1200
7.3
1129
9.9
1133
611
928
1200
716
359
1681
5Sp
ices
Ajw
an
10.0
011
.12
1610
2227
27C
arda
mom
17.3
017
.30
17
.00
13.6
515
1616
1616
Chi
llies
(Dri
ed)
1113
.10
1113
.10
847.
80
12
33.0
012
94.1
512
7012
0312
2312
7612
76C
inna
mon
/Tej
pata
10
.00
6.96
79
55
5C
eler
y,D
ill &
Po
ppy
11
.00
1340
3333
Clo
ve
1.00
1.01
11
11
1C
oria
nder
318.
7031
8.70
172.
30
23
3.00
229.
9524
223
748
253
353
3C
umin
206.
4020
6.40
134.
80
13
0.00
172.
4717
215
631
439
439
4F.
Gre
ek13
6.60
136.
6064
.20
54.0
055
.48
7757
118
116
116
Fenn
el38
.50
38.5
027
.60
66.0
067
.78
6457
105
143
143
Gar
lic36
7.60
367.
6043
6.10
710.
0010
68.5
083
183
410
5812
2812
28G
inge
r31
7.80
317.
8030
5.90
377.
0039
0.08
380
385
702
756
756
Nut
meg
12
.00
11.3
711
811
1313
Pepp
er79
.10
79.1
070
.60
69.0
047
.01
4751
5241
41V
anill
a
0.00
01
11
Tam
arin
d18
4.40
184.
4018
2.30
185.
0018
2.08
178
185
206
203
203
Turm
eric
552.
3055
2.30
529.
00
83
6.00
794.
1982
179
399
311
6711
67O
ther
s $
433
433
2343
11
11

206 State of Indian Agriculture
Com
mod
ities
2001
-02
2002
-03
2003
-04
2004
-05
2005
-06
2006
-07
2007
-08
2008
-09
2009
-10
2010
-11
2011
-12
2012
-13@
Spic
e To
tal
3765
3765
5113
4001
3705
3953
4357
4145
4016
5350
5951
5951
Mus
hroo
m40
4040
4035
3737
3741
H
oney
1010
1010
5251
6565
65
Tota
l14
5784
1443
8015
3301
1669
3818
2817
1918
1321
1235
2147
1622
3089
2404
2725
7277
2658
77* I
nclu
des
wal
nut u
p to
200
9-10
, the
reaf
ter A
& P
of w
alnu
t is
give
n se
para
tely
.#
Flow
ers
Cut
in L
akh
num
ber
$ in
clud
es m
usta
rd s
eeds
are
a of
467
.8 th
ousa
nd H
a an
d 41
0.5
thou
sand
MT
@ F
irst
Adv
ance
Est
imat
es
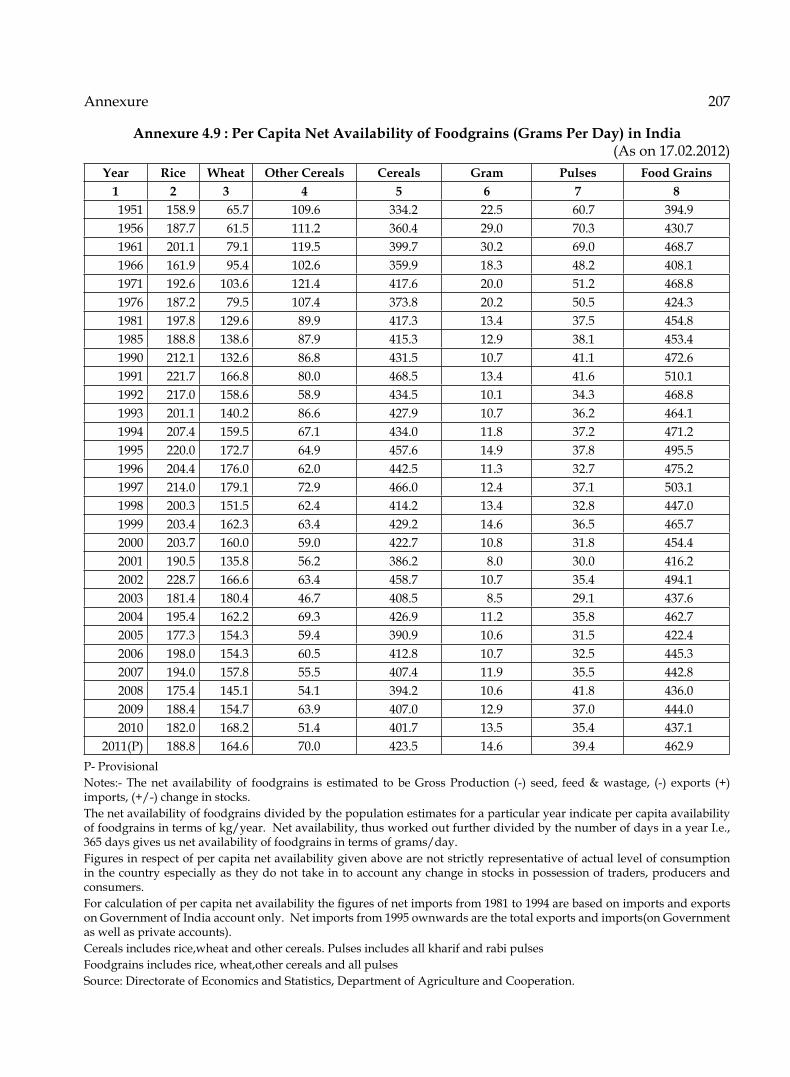
Annexure 207
Annexure 4.9 : Per Capita Net Availability of Foodgrains (Grams Per Day) in India(As on 17.02.2012)
Year Rice Wheat Other Cereals Cereals Gram Pulses Food Grains1 2 3 4 5 6 7 81951 158.9 65.7 109.6 334.2 22.5 60.7 394.91956 187.7 61.5 111.2 360.4 29.0 70.3 430.71961 201.1 79.1 119.5 399.7 30.2 69.0 468.71966 161.9 95.4 102.6 359.9 18.3 48.2 408.11971 192.6 103.6 121.4 417.6 20.0 51.2 468.81976 187.2 79.5 107.4 373.8 20.2 50.5 424.31981 197.8 129.6 89.9 417.3 13.4 37.5 454.81985 188.8 138.6 87.9 415.3 12.9 38.1 453.41990 212.1 132.6 86.8 431.5 10.7 41.1 472.61991 221.7 166.8 80.0 468.5 13.4 41.6 510.11992 217.0 158.6 58.9 434.5 10.1 34.3 468.81993 201.1 140.2 86.6 427.9 10.7 36.2 464.11994 207.4 159.5 67.1 434.0 11.8 37.2 471.21995 220.0 172.7 64.9 457.6 14.9 37.8 495.51996 204.4 176.0 62.0 442.5 11.3 32.7 475.21997 214.0 179.1 72.9 466.0 12.4 37.1 503.11998 200.3 151.5 62.4 414.2 13.4 32.8 447.01999 203.4 162.3 63.4 429.2 14.6 36.5 465.72000 203.7 160.0 59.0 422.7 10.8 31.8 454.42001 190.5 135.8 56.2 386.2 8.0 30.0 416.22002 228.7 166.6 63.4 458.7 10.7 35.4 494.12003 181.4 180.4 46.7 408.5 8.5 29.1 437.62004 195.4 162.2 69.3 426.9 11.2 35.8 462.72005 177.3 154.3 59.4 390.9 10.6 31.5 422.42006 198.0 154.3 60.5 412.8 10.7 32.5 445.32007 194.0 157.8 55.5 407.4 11.9 35.5 442.82008 175.4 145.1 54.1 394.2 10.6 41.8 436.02009 188.4 154.7 63.9 407.0 12.9 37.0 444.02010 182.0 168.2 51.4 401.7 13.5 35.4 437.1
2011(P) 188.8 164.6 70.0 423.5 14.6 39.4 462.9P- Provisional Notes:- The net availability of foodgrains is estimated to be Gross Production (-) seed, feed & wastage, (-) exports (+) imports, (+/-) change in stocks.The net availability of foodgrains divided by the population estimates for a particular year indicate per capita availability of foodgrains in terms of kg/year. Net availability, thus worked out further divided by the number of days in a year I.e., 365 days gives us net availability of foodgrains in terms of grams/day.Figures in respect of per capita net availability given above are not strictly representative of actual level of consumption in the country especially as they do not take in to account any change in stocks in possession of traders, producers and consumers.For calculation of per capita net availability the figures of net imports from 1981 to 1994 are based on imports and exports on Government of India account only. Net imports from 1995 ownwards are the total exports and imports(on Government as well as private accounts).Cereals includes rice,wheat and other cereals. Pulses includes all kharif and rabi pulsesFoodgrains includes rice, wheat,other cereals and all pulsesSource: Directorate of Economics and Statistics, Department of Agriculture and Cooperation.

208 State of Indian Agriculture
Annexure. 4.10: Per capita Consumption of Conventional Food Items
Commodities Year Quantity in Kg
Qty. consumed per Annum
Rural Urban
Rice 1993-94 82.61 62.42
2004-05 77.62 57.31
2009-10 74.70 56.64
Wheat 1993-94 52.56 54.02
2004-05 50.98 53.05
2009-10 53.03 52.82
Coarse cereals
1993-94 27.86 12.53
2004-05 18.86 10.59
2009-10 10.34 4.60
All cereals
1993-94 163.03 128.97
2004-05 147.46 120.94
2009-10 138.08 114.05
All pulses & Pulse Products
1993-94 9.25 10.46
2004-05 8.64 9.98
2009-10 7.92 9.60
All edible oil
1993-94 4.50 6.81
2004-05 5.84 8.03
2009-10 7.74 9.95
Source: NSSO, various rounds

Annexure 209
Annexure 4.11: Per capita Consumption of Emerging Food Items
Commodities
Year Quantity in Kg/Litre/No.
Qty. consumed per Annum
Rural Urban
Fruits and Vegetables 1993-94 32.97 35.41
2004-05 35.53 38.57
2009-10 49.14 50.11
Milk (Litre) 1993-94 47.94 59.50
2004-05 46.11 62.05
2009-10 50.09 65.19
Eggs (No.) 1993-94 7.79 18.01
2004-05 12.29 20.93
2009-10 21.08 32.53
Fish (kg) 1993-94 2.19 2.43
2004-05 2.45 2.51
2009-10 3.27 2.90
Goat meat/Mutton (Kg) 1993-94 0.73 1.34
2004-05 0.57 0.85
2009-10 0.57 1.11
Chicken (kg) 1993-94 0.24 0.37
2004-05 0.61 1.03
2009-10 1.50 2.19
Source: NSSO, various rounds
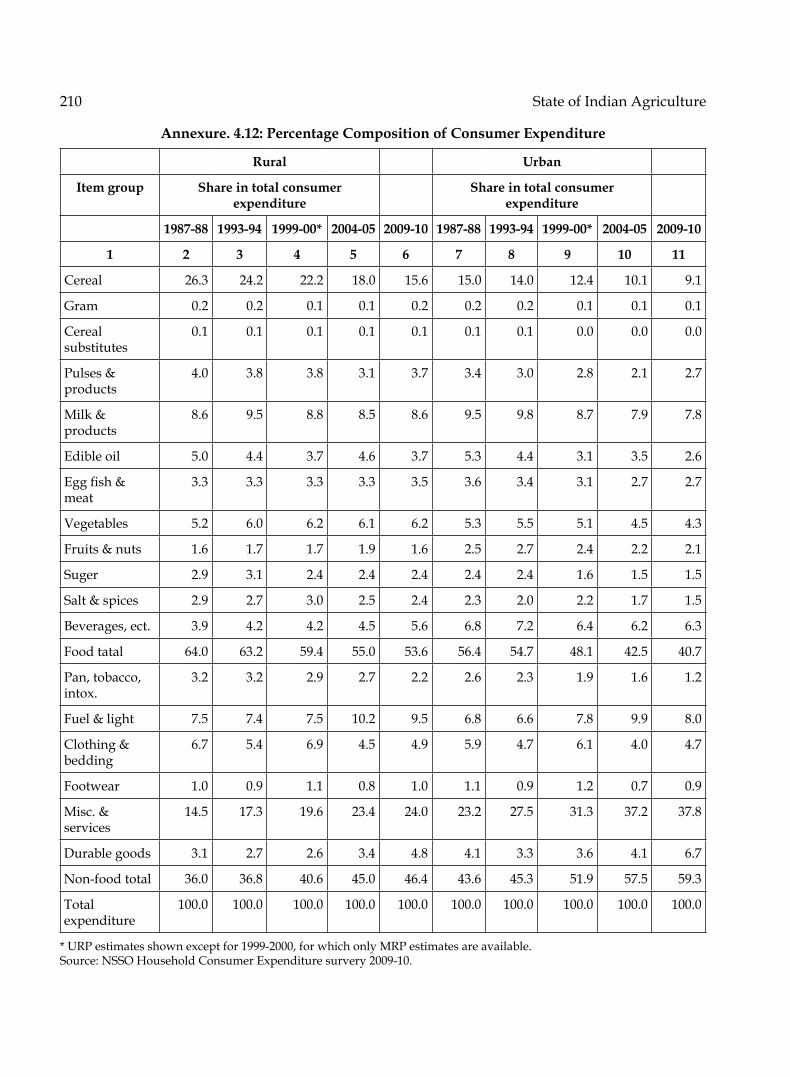
210 State of Indian Agriculture
Annexure. 4.12: Percentage Composition of Consumer Expenditure
Rural Urban
Item group Share in total consumer expenditure
Share in total consumer expenditure
1987-88 1993-94 1999-00* 2004-05 2009-10 1987-88 1993-94 1999-00* 2004-05 2009-10
1 2 3 4 5 6 7 8 9 10 11
Cereal 26.3 24.2 22.2 18.0 15.6 15.0 14.0 12.4 10.1 9.1
Gram 0.2 0.2 0.1 0.1 0.2 0.2 0.2 0.1 0.1 0.1
Cereal substitutes
0.1 0.1 0.1 0.1 0.1 0.1 0.1 0.0 0.0 0.0
Pulses & products
4.0 3.8 3.8 3.1 3.7 3.4 3.0 2.8 2.1 2.7
Milk & products
8.6 9.5 8.8 8.5 8.6 9.5 9.8 8.7 7.9 7.8
Edible oil 5.0 4.4 3.7 4.6 3.7 5.3 4.4 3.1 3.5 2.6
Egg fish & meat
3.3 3.3 3.3 3.3 3.5 3.6 3.4 3.1 2.7 2.7
Vegetables 5.2 6.0 6.2 6.1 6.2 5.3 5.5 5.1 4.5 4.3
Fruits & nuts 1.6 1.7 1.7 1.9 1.6 2.5 2.7 2.4 2.2 2.1
Suger 2.9 3.1 2.4 2.4 2.4 2.4 2.4 1.6 1.5 1.5
Salt & spices 2.9 2.7 3.0 2.5 2.4 2.3 2.0 2.2 1.7 1.5
Beverages, ect. 3.9 4.2 4.2 4.5 5.6 6.8 7.2 6.4 6.2 6.3
Food tatal 64.0 63.2 59.4 55.0 53.6 56.4 54.7 48.1 42.5 40.7
Pan, tobacco, intox.
3.2 3.2 2.9 2.7 2.2 2.6 2.3 1.9 1.6 1.2
Fuel & light 7.5 7.4 7.5 10.2 9.5 6.8 6.6 7.8 9.9 8.0
Clothing & bedding
6.7 5.4 6.9 4.5 4.9 5.9 4.7 6.1 4.0 4.7
Footwear 1.0 0.9 1.1 0.8 1.0 1.1 0.9 1.2 0.7 0.9
Misc. & services
14.5 17.3 19.6 23.4 24.0 23.2 27.5 31.3 37.2 37.8
Durable goods 3.1 2.7 2.6 3.4 4.8 4.1 3.3 3.6 4.1 6.7
Non-food total 36.0 36.8 40.6 45.0 46.4 43.6 45.3 51.9 57.5 59.3
Total expenditure
100.0 100.0 100.0 100.0 100.0 100.0 100.0 100.0 100.0 100.0
* URP estimates shown except for 1999-2000, for which only MRP estimates are available. Source: NSSO Household Consumer Expenditure survery 2009-10.

Annexure 211
Sl. No.
Commodity Variety 2008-09
2009-10 2010-11 2011-12 (#) increase in 2012-13 (#) increase inMSP 2011-12 MSP 2012-13over 2010-11 over 2011-12
KHARIF CROPS 1
Paddy
Common 850$ 950$ 1000 1080 80(8.0) 1250 170(15.7)Grade ‘A’ 880$ 980$ 1030 1110 80(7.8) 1280 170(15.3)
2
Jowar
Hybrid 840 840 880 980 100(11.4) 1500 520(53.1)Maldandi 860 860 900 1000 100(11.1) 1520 520(52.0)
3 Bajra 840 840 880 980 100(11.4) 1175 195(19.9)4 Maize 840 840 880 980 100(11.4) 1175 195(19.9)5 Ragi 915 915 965 1050 85(8.8) 1500 450(42.8)6 Arhar (Tur) 2000 2300 3000¶ 3200¶ 200(6.7) 3850 650(20.3)7 Moong 2520 2760 3170¶ 3500¶ 330(10.4) 4400 900(25.7)8 Urad 2520 2520 2900¶ 3300¶ 400(13.8) 4300 1000(30.3)9
Cotton
Medium Staple 2500ª 2500ª 2500ª 2800ª 300(12.0) 3600 800(28.6)Long Staple 3000ªª 3000ªª 3000ªª 3300ªª 300(10.0) 3900 600(18.2)
10 Groundnut in Shell
2100 2100 2300 2700 400(17.4) 3700 1000(37.0)
11 Sunflower Seed 2215 2215 2350 2800 450(19.1) 3700 900(32.1)12
Soyabeen
Black 1350 1350 1400 1650 250(17.8) 2200 550(33.3)Yellow 1390 1390 1440 1690 250(17.4) 2240 550(32.5)
13 Sesamum 2750 2850 2900 3400 500(17.2) 4200 800(23.5)14 Nigerseed 2405 2405 2450 2900 450(18.4) 3500 600(20.7) RABI CROPS 15 Wheat 1080 1100 1120$ 1285 165(14.7) 1350 65(5.05)16 Barley 680 750 780 980 200(25.6) 980 0(0.00)17 Gram 1730 1760 2100 2800 700(33.3) 3000 200(7.14)18 Masur (Lentil) 1870 1870 2250 2800 550(24.4) 2900 100(3.57)19 Rapeseed/
Mustard 1830 1830 1850 2500 650(35.1) 3000 500(20.00)
20 Safflower 1650 1680 1800 2500 700(38.9) 2800 300(12.00)21 Toria 1735 1735 1780 2425 645(36.2) 2970 545(22.47) OTHER CROPS 22 Copra Milling 3660 4450 4450 4525 75(1.7) 5100 575(12.7) (Calender Year) Ball 3910 4700 4700 4775 75(1.6) 5350 575(12.0)
23 De-Husked Coconut (Calender Year)
988 1200 1200 1200 0(0.0) 1400 200(16.7)
24 Jute 1250 1375 1575 1675 100(6.3) 2200 525(31.3)25 Sugarcane 81.18 129.84¤ 139.12¤ 145.00¤ 5.88(4.2) 170.00¤ 25(17.2)
Annexure 5.1: Minimum Support Prices (According to Crop Year) (As on 26.12.2012) (Rs. per quintal)
# Figures in brackets indicate percentage increase.$ An additional incentive bonus of Rs. 50 per quintal was payable over the Minimum Support Price(MSP).ª Staple length (mm) of 24.5 - 25.5 and Micronaire value of 4.3 - 5.1ªª Staple length (mm) of 29.5 - 30.5 and Micronaire value of 3.5 - 4.3¶ Additional incentive at the rate of Rs. 500 per quintal of tur, urad and moong sold to procurement agencies is payable during the harvest/arrival period of two months.¤ Fair and remunerative price.* Not announced.

212 State of Indian Agriculture
Annexure 5.2: Top 10 Agricultural Exports ItemsQty. ‘000’ tonnes, Value: Rs. in crores
Sl. No.
Item 2009-10 2010-11 2011-12 Percent change
in Value during 2010-11
over 2009-10
Percent change
in Value during 2011-12
over 2010-11
Qty. Value Qty. Value Qty. Value
1 Cotton Raw incl. waste
1358 9537 1258 12981 2013 21623 36.1 66.6
2 Marine products
710 9999 801 11548 1032 16588 15.5 43.6
3 Guargum Meal
218 1133 403 2806 707 16357 147.7 482.9
4 Rice Basmati 2017 10890 2186 10582 3212 15450 -2.8 46.0
5 Meat & Preparations
6286 8776 14111 39.6 60.8
6 Spices 663 6157 749 7870 931 13176 27.8 67.4
7 Oil Meals 4671 7832 6798 10846 7436 11762 38.5 8.4
8 Sugar 45 110 3241 10339 2747 8779 9299.1 -15.1
9 Rice (other than Basmati)
140 365 96 220 4099 8668 -39.7 3840.0
10 Other cereals 2892 2973 3188 3596 4072 5479 21.0 52.4
Source: DGCI & S

Annexure 213
Annexure 5.3: Top 10 Agricultural Import ItemsQty. ‘000’ tonnes, Value: Rs. in crores
Sl. No.
Item 2009-10 2010-11 2011-12 Percent change
in Value during 2010-11
over 2009-10
Percent change
in Value during 2011-12
over 2010-11
Qty. Value Qty. Value Qty. Value
1 Vegetable Oils fixed edible
8034 26483 6905 29860 8429 46242 12.8 54.9
2 Pulses 3510 9813 2591 6980 3308 8767 -28.9 25.6
3 Cashew Nuts 756 3048 504 2480 809 5338 -18.6 115.2
4 Fruits & Nuts (excl. Cashew nuts)
2873 3684 4519 28.2 22.7
5 Sugar 2551 5966 1198 2787 997 3138 -53.3 12.6
6 Spices 153 1432 108 1359 124 2102 -5.1 54.7
7 Cotton raw & waste
171 1241 56 604 78 1059 -51.3 75.3
8 Milk & Cream
8 78 37 492 63 1038 530.8 111.0
9 Jute, raw 63 149 75 273 181 449 83.2 64.5
10 Cereal Preparation
41 188 37 226 46 300 20.2 32.7
Source: DGCI & S

214 State of Indian Agriculture
Annexure: 6.1. List of ICAR/DARE Institutions
Deemed Universities1 Indian Agricultural Research Institute, New Delhi
2 National Dairy Research Institute, Karnal
3 Indian Veterinary Research Institute, Izatnagar
4 Central Institute on Fisheries Education, Mumbai
Institutions1 Central Rice Research Institute, Cuttack
2 Vivekananda Parvatiya Krishi Anusandhan Sansthan, Almora
3 Indian Institute of Pulses Research, Kanpur
4 Central Tobacco Research Institute, Rajahmundry
5 Indian Institute of Sugarcane Research, Lucknow
6 Sugarcane Breeding Institute, Coimbatore
7 Central institute of Cotton Research, Nagpur
8 Central Research Institute for Jute and Allied Fibres, Barrackpore
9 Indian Grassland and Fodder Research Institute, Jhansi
10 Indian Institute of Horticultural Research, Bangalore
11 Central Institute of Sub Tropical Horticulture, Lucknow
12 Central Institute of Temperate Horticulture, Srinagar
13 Central Institute of Arid Horticulture, Bikaner
14 Indian Institute of Vegetable Research, Varanasi
15 Central Potato Research Institute, Shimla
16 Central Tuber Crops Research Institute, Trivandrum
17 Central Plantation Crops Research Institute, Kasargod
18 Central Agricultural Research Institute, Port Blair
19 Indian Institute of Spices Research, Calicut
20 Central Soil and Water Conservation Research & Training Institute, Dehradun
21 Indian Institute of Soil Sciences, Bhopal
22 Central Soil Salinity Research Institute, Karnal
23 ICAR Research Complex for Eastern Region including Centre of Makhana, Patna
24 Central Research Institute of Dryland Agriculture, Hyderabad
25 Central Arid Zone Research Institute, Jodhpur
26 ICAR Research Complex Goa

Annexure 215
27 ICAR Research Complex for NEH Region, Barapani
28 National Institute of Abiotic Stress management, Malegaon, Maharashtra
29 Central Institute of Agricultural Engineering, Bhopal
30 Central Institute on Post harvest Engineering and Technology, Ludhiana
31 Indian Institute of Natural Resins and Gums, Ranchi
32 Central Institute of Research on Cotton Technology, Mumbai
33 National Institute of Research on Jute & Allied Fibre Technology, Kolkata
34 Indian Agricultural Statistical Research Institute, New Delhi
35 Central Sheep and Wool Research Institute, Avikanagar, Rajasthan
36 Central Institute for Research on Goats, Makhdoom
37 Central Institute for Research on Buffaloes, Hissar
38 National Institute of Animal Nutrition and Physiology, Bangalore
39 Central Avian Research Institute, Izatnagar
40 Central Marine Fisheries Research Institute, Kochi
41 Central Institute Brackishwater Aquaculture, Chennai
42 Central Inland Fisheries Research Institute, Barrackpore
43 Central Institute of Fisheries Technology, Cochin
44 Central Institute of Freshwater Aquaculture, Bhubneshwar
45 National Academy of Agricultural Research & Management, Hyderabad
National Research Centres1 National Research Centre on Plant Biotechnology, New Delhi
2 National Centre for Integrated Pest Management, New Delhi
3 National Research centre for Litchi, Muzaffarpur
4 National Research Centre for Citrus, Nagpur
5 National Research Centre for Grapes, Pune
6 National Research Centre for Banana, Trichi
7 National Research Centre Seed Spices, Ajmer
8 National Research Centre for Pomegranate, Solapur
9 National Research Centre on Orchids, Pakyong, Sikkim
10 National Research Centre Agroforestry, Jhansi
11 National Research Centre on Camel, Bikaner
12 National Research Centre on Equines, Hisar
13 National Research Centre on Meat, Hyderabad
216 State of Indian Agriculture
14 National Research Centre on Pig, Guwahati
15 National Research Centre on Yak, West Kemang
16 National Research Centre on Mithun, Medziphema, Nagaland
17 National Centre for Agril. Economics & Policy Research, New Delhi
National Bureaux1 National Bureau of Plant Genetics Resources, New Delhi
2 National Bureau of Agriculturally Important Micro-organisms, Mau, Uttar Pradesh
3 National Bureau of Agriculturally Important Insects , Bangalore
4 National Bureau of Soil Survey and Land Use Planning, Nagpur
5 National Bureau of Animal Genetic Resources, Karnal
6 National Bureau of Fish Genetic Resources, Lucknow
In XI Plan (total 185) 45 Institutes; 6 National Bureaux; 4 Deemed to be Universites; 17 NRCs, 25 PDs; 61 AICRPs, 17 Networks and 10 other programmes

Annexure 217
Annexure: 6.2. List of Agricultural UniversitiesAndhra Pradesh 3 Acharya NG Ranga Agricultural Univerwsity, Hyderabad Sri Venkateswara Veterinary University, Tirupati Horticulture University, Venkataramanagudem near
Tadepalligudem, West Godawari Assam 1 Assam Agricultural University, Jorhat Bihar 2 Rajendra Agricultural University, Pusa, Samastipur Bihar Agricultural University, Sabour, Samastipur Chhattisgarh 1 Indira Gandhi krishi Vishwavidyalaya, Raipur New Delhi (deemed to be)
1 Indian Agricultural Research Institute, Pusa-110012, New Delhi
Gujarat 4 Junagarh Agricultural University, Junagarh Sardarkrushinagar-Dantiwada Agricultural University, Sardar
Krushinagar, Banaskantha Anand Agricultural University, Anand Navsari Agricultural University, Navsari Haryana 3 Ch. Charan Singh Haryana Agricultural University, Hisar Lala Lajpat rai Univ. of Veterinary and Animal Sciences, Hisardeemed to be National Dairy Research Institute, Karnal-132001, Haryana Himachal Pradesh 2 Dr. Yashwant Singh Parmar University of Horticulture & Forestry,
Solan, Nauni Ch. Sarwan Kumar Krishi Viswa Vidalaya, Palampur J & K 2 Sher-E-Kashmir University of Agricultural Sceinces & Technology,
Jammu Sher-E-Kashmir University of Agricultural Sceinces & Technology
of Kashmir, Srinagar Jharkhand 1 Birsa Agricultural University, Kanke, Ranchi Karnataka 4 University of Agricultural Sciences, Dharwad University of Agricultural Sciences, Bangalore University of Agricultural Sciences, Raichur, Karnataka University of Horticultural Sciences, Navanagar, Bagalkot,
Karnataka Kerala 3 Kerala Agricultural University, Vellanikara, Trichur Kerala University of animal Sciences, Directorate of Dair
development, Pattom, Thiruvantapuram

218 State of Indian Agriculture
Kerala University of Fisheries & Ocean Studies, Papangad, Kotchi, kerala
Madhya Pradesh 3 Jawahar Lal Nehru Krishi Vishwavidyalaya, Jabalpur Madhya Pradesh Pashu Chikitsa Vigyan Vishvavidalaya, Civil
Lines, Jabalpur Rajmata VRS Agri. University, Gwalior Maharashtra 6 Dr. Balaesahib Sawant Konkan Krishi Vidypapeeth, Dapoli,
Ratnagiri Dr. Punjabrao Deshmukh Krishi Vidyapeeth, Krishinagar, Akola Mahatma Phule Krishi Vidyapeeth, Rahuri Marathwada Agricultural University, Parbhani Maharastra Animal and Fisheries Sciences University, Nagpurdeemed to be Central Institute of Fisheries Education, Mumbai-400061,
Maharashtra Manipur 1 Central Agri. University, Imphal Nagaland 1 Nagaland University, Medizipherma, Nagaland Odisha 1 Orissa University of Agriculture & Technology, Bhubaneshwar Punjab 2 Punjab Agricultural University, Ludhiana Guru Angad Dev Veterinary & Animal Sciences University,
Ludhiana Rajasthan 3 Maharana Pratap Univ. of Agriculture & Technology, Udaipur Swami Keshwanand Rajastahn Agricultural University, Bikaner Rajasthan Univ. of veterinary & Animal Sciences, Bijay Bhavan
Palace Complex, Bikaner Tamil Nadu 2 Tamil Nadu Agricultural University, Coimbatore Tamil Nadu Veterinary & Animal Sciences University, Chennai Uttar Pradesh 9 Chandra Shekhar Azad Univeristy of Agriculture & technology,
Kanpur Narendra Dev University of Agriculture & Technology, Faizabad UP Pandit Deen Dyal Upadhaya Veterinary and Animal Sciences
University, Mathura Sardar Vallabh Bhai Patel University of Agriculture and
Technology, Meerut Manyavar Shri Kanshiram Ji University of Agri. & Tech. Banda, UPdeemed to be Allahabad Agricultural Institute, Allahabad-211007, Uttar Pradesh Indian Veterinary Research Institute, Izatnagar, Bareilly-243122,
Uttar Pradesh

Annexure 219
Cus Banaras Hidu University, Varanasi, U.P. Aligarh Muslim University, Aligarh, U.P. Uttarakhand 2 Govind Ballabh Pant University of Agriculture & Technology,
Pantnagar University of Horticulture and Forestry, Ranichauri, Tehri Garhwal West Bengal 4 Bidhan Chandra Krishi Vishwavidyalaya, Mohanpur, Nadia Uttar Banga Krishi Vishwavidyalaya, Coach Bihar West Bengal University of Animal & Fishery Sciences, Kolkatadeemed to be Vishwa Bharti, Shantiniketan, West Bengal Total 61
In XI Plan 51 SAUs, 5 deemed to be Univ, 1 CAU, 4 CUs with Agri. Faculty

220 State of Indian Agriculture
Annexure 7.1: Production of Milk, Eggs, Wool and Meat- All India
Year Milk(Million Tonnes)
Eggs(Million Nos.)
Wool(Million Kgs.)
Meat(Million Tonnes)
1950-51 17.0 1832 27.5 -
1955-56 19.0 1908 27.5 -
1960-61 20.0 2881 28.7 -
1968-69 21.2 5300 29.8 -
1973-74 23.2 7755 30.1 -
1979-80 30.4 9523 30.9 -
1980-81 31.6 10060 32.0 -
1981-82 34.3 10876 33.1 -
1982-83 35.8 11454 34.5 -
1983-84 38.8 12792 36.1 -
1984-85 41.5 14252 38.0 -
1985-86 44.0 16128 39.1 -
1986-87 46.1 17310 40.0 -
1987-88 46.7 17795 40.1 -
188-89 48.4 18980 40.8 -
1989-90 51.4 20204 41.7 -
1990-91 53.9 21101 41.2 -
1991-92 55.7 21983 41.6 -
1992-93 58.0 22929 38.8 -
1993-94 60.6 24167 39.9 -
1994-95 63.8 25975 40.6 -
1995-96 66.2 27198 42.4 -
1996-97 69.1 27496 44.4 -
1997-98 72.1 28689 45.6 -
1998-99 75.4 29476 46.9 1.9
1999-2000 78.3 30447 47.9 1.9
2000-2001 80.6 36632 48.4 1.9
2001-2002 84.4 38729 49.5 1.9
2002-2003 86.2 39823 50.5 2.1
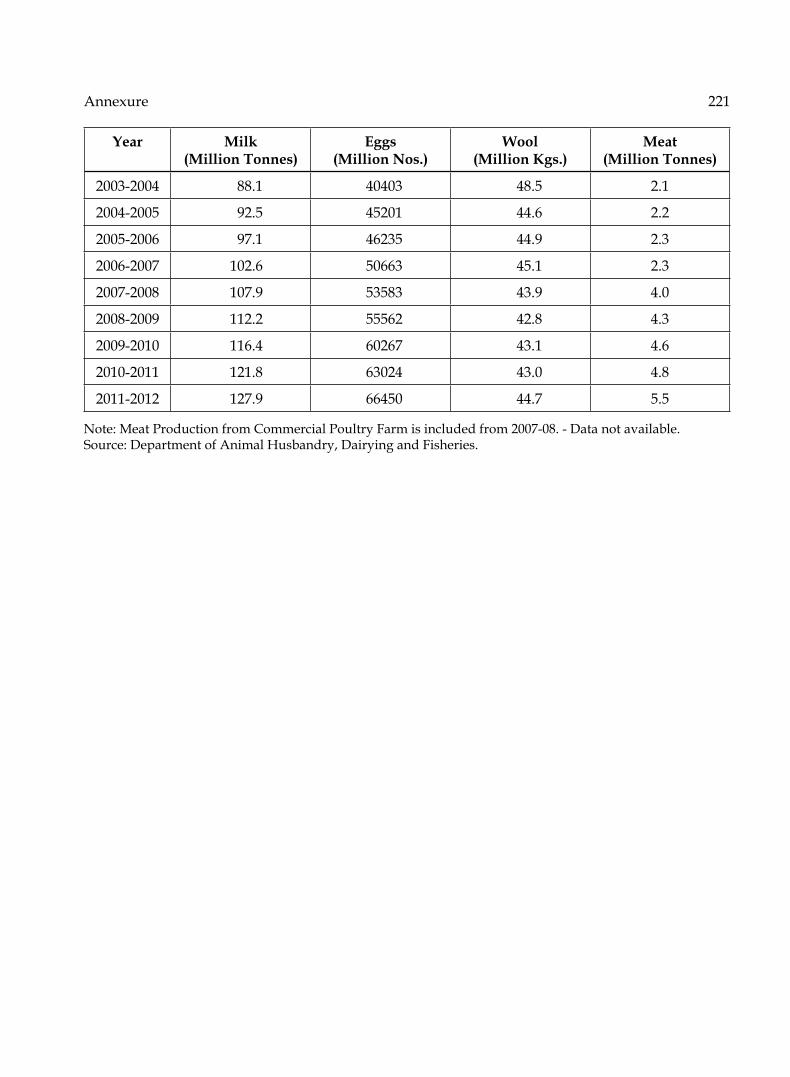
Annexure 221
Year Milk(Million Tonnes)
Eggs(Million Nos.)
Wool(Million Kgs.)
Meat(Million Tonnes)
2003-2004 88.1 40403 48.5 2.1
2004-2005 92.5 45201 44.6 2.2
2005-2006 97.1 46235 44.9 2.3
2006-2007 102.6 50663 45.1 2.3
2007-2008 107.9 53583 43.9 4.0
2008-2009 112.2 55562 42.8 4.3
2009-2010 116.4 60267 43.1 4.6
2010-2011 121.8 63024 43.0 4.8
2011-2012 127.9 66450 44.7 5.5
Note: Meat Production from Commercial Poultry Farm is included from 2007-08. - Data not available. Source: Department of Animal Husbandry, Dairying and Fisheries.