indian geotechnical conference (igc-2010)igs/ldh/files/igc 2015 pune/theme 5...50th indian...
TRANSCRIPT
50
th
IG
C
50th
INDIAN GEOTECHNICAL CONFERENCE
17th
– 19th
DECEMBER 2015, Pune, Maharashtra, India
Venue: College of Engineering (Estd. 1854), Pune, India
DISPERSION ANALYSIS USING ACTIVE MASW SURVEY DATA
Jumrik Taipodia1, Dipjyoti Baglari
2, Shibayan Biswas
3, Arindam Dey
4
ABSTRACT
Multichannel Analysis of Surface waves is one of the recent developments in geophysics which can
characterize the site up to depth of many meters. Site Characterization using MASW involves three steps
i.e. Data acquisition, Dispersion Analysis and Inversion Analysis. This paper explains about the
Dispersion Analysis. Dispersion of waves is the propagation of waves in the different direction, with
different frequency and different phase velocity. In MASW survey an image space is formed which is
basically a 3D plot of frequency and phase-velocity with the energy accumulation at each of the
combination of the former two entities. Based on the relative energy accumulation as observed from the
dispersion image space, the fundamental and the higher order mode dispersion curves can be identified. In
the present study, field experimentation studies have been conducted for active MASW survey using
Sledgehammer (9.82kg) and PEG hammer (40 kg) as the energy source. The dispersive nature of waves
was studied for which samples were collected at different sampling frequencies of 15000Hz, 3750Hz,
500Hz and 50 Hz. It was found out that the resolution of dispersion image space depends upon the
sampling frequency and the input source energy used. The study was carried out using the commercial
softwares EASYMASW and SURFSEIS. Additionally, a MATLAB coding (based on phase-shift method
by Park et al., 1999) is being developed to develop the dispersion image space and extract the dispersion
curve. The coding described here has ability of developing 2D and 3D motion of waves both in time-
domain and frequency domain. Commercial softwares extracts the dispersion curve based on the user
discretion, where the user is required to choose the points for the dispersion curve governed the color
coding of the image space. Such an attempt might result in missing the energy accumulation peaks and
end up with the user selecting a point which should have been actually absent in the dispersion curve. If
selected, this would render incorrect subsurface stratigraphy once the dispersion curve is utilized in an
inversion analysis. Attempt has been made to generate automated curve extraction program from the
image space which thus overcomes the problem faced in the manual picking of the dispersion points.
1J. Taipodia., Assistant Professor, Department of Civil Engineering, NIT Arunachal, [email protected]
2D. Baglari., Assistant Professor, Department of Civil Engineering, JIST Jorhat, [email protected]
3S. Biswas., PG Student, Department of Civil Engineering, IIT Guwahati, [email protected]
4Arindam Dey, Assistant Professor, Indian Institute of Technology Guwahati, [email protected]

J. Taipodia, D. Baglari, S. Biswas and A. Dey
This paper reports about the dispersion analysis conducted based on the raw records obtained from the
experimental investigation carried out at IIT Guwahati to determine the subsurface stratigraphy at a
particular test site. Active MASW survey was conducted with the application of a sledgehammer (weight
of 10 kg) and a Propelled Energy Generator (PEG of weight 40 kg) as the energy sources to generate
wave-fields across the soil medium. 4.5Hz geophones were used as receivers which provide the output in
the form of voltages generated due to the motion of the elements within the receivers. The offset and
receiver spacing were maintained to be 2 m. Data acquisition involved with the acquisition of
multichannel field records where the raw data was acquired at different sampling frequency from the field
based on different geometrical configurations of the arranged geophones. Based on the collected records,
dispersion analysis was conducted. In this paper, various aspects of dispersion analysis are discussed,
with the emphasis on the extraction of experimental dispersion curve. Two commercially available
software, EasyMASW and SurfSeis have been utilized for the generation of dispersion image, from where
manual picking technique has been used to extract the theoretical dispersion curve. However, since this
technique becomes subjective, an automated dispersion point picking has been developed with the aid of
indigenous Matlab coding which works on the principle of identification of dispersion points having the
highest accumulation of energy during wave propagation.
Keywords: Active MASW survey, Dispersion analysis, EasyMASW, SurfSeis, MatLab coding, Automated
Picking.

50
th
IG
C
50th
INDIAN GEOTECHNICAL CONFERENCE
17th
– 19th
DECEMBER 2015, Pune, Maharashtra, India
Venue: College of Engineering (Estd. 1854), Pune, India
DISPERSION ANALYSIS USING ACTIVE MASW SURVEY DATA
J. Taipodia., Assistant Professor, Department of Civil Engineering, NIT Arunachal, [email protected]
D. Baglari., Assistant Professor, Department of Civil Engineering, JIST Jorhat, [email protected]
S. Biswas., PG Student, Department of Civil Engineering, IIT Guwahati, [email protected]
A. Dey., Assistant Professor, Department of Civil Engineering, IIT Guwahati, [email protected]
ABSTRACT: Multichannel Analysis of Surface Waves is used to define the shear wave velocity profile of soil
strata. Dispersion Analysis is a critical component of the post-processing of data which involves the extraction of
dispersion curve from the dispersion image space. Based on the relative energy accumulation as observed from the
dispersion image space, the fundamental and the higher order mode dispersion curves can be identified. Software
such as EasyMASW and SurfSeis operates on manual picking of dispersion curve which renders the method to be
subjective. This article reports the development of an automated dispersion curve extraction procedure using
Matlab coding.
INTRODUCTION
Multichannel Analysis of surface waves (MASW)
is a recently developed non-destructive technique
to determine the sub-soil stratigraphy. The overall
procedure of a MASW survey comprises of Data
acquisition, Dispersion analysis and Inversion of
the extracted dispersion curve to obtain the
subsurface stratigraphy in terms of the shear wave
velocity profile [1].
This paper reports about the dispersion analysis
conducted based on the raw records obtained from
the experimental investigation carried out at IIT
Guwahati to determine the subsurface stratigraphy
at a particular test site. Active MASW survey was
conducted with the application of a sledgehammer
(weight of 10 kg) and a Propelled Energy
Generator (PEG of weight 40 kg) as the energy
sources to generate wave-fields across the soil
medium. 4.5Hz geophones were used as receivers
which provide the output in the form of voltages
generated due to the motion of the elements within
the receivers. The offset and receiver spacing were
maintained to be 2 m. Data acquisition involved
with the acquisition of multichannel field records
where the raw data was acquired at different
sampling frequency from the field based on
different geometrical configurations of the
arranged geophones. Based on the collected
records, dispersion analysis was conducted.
In this paper, various aspects of dispersion analysis
are discussed, with the emphasis on the extraction
of experimental dispersion curve. Two
commercially available software, EasyMASW and
SurfSeis have been utilized for the generation of
dispersion image, from where manual picking
technique has been used to extract the theoretical
dispersion curve. However, since this technique
becomes subjective, an automated dispersion point
picking has been developed with the aid of
indigenous Matlab coding which works on the
principle of identification of dispersion points
having the highest accumulation of energy during
wave propagation.
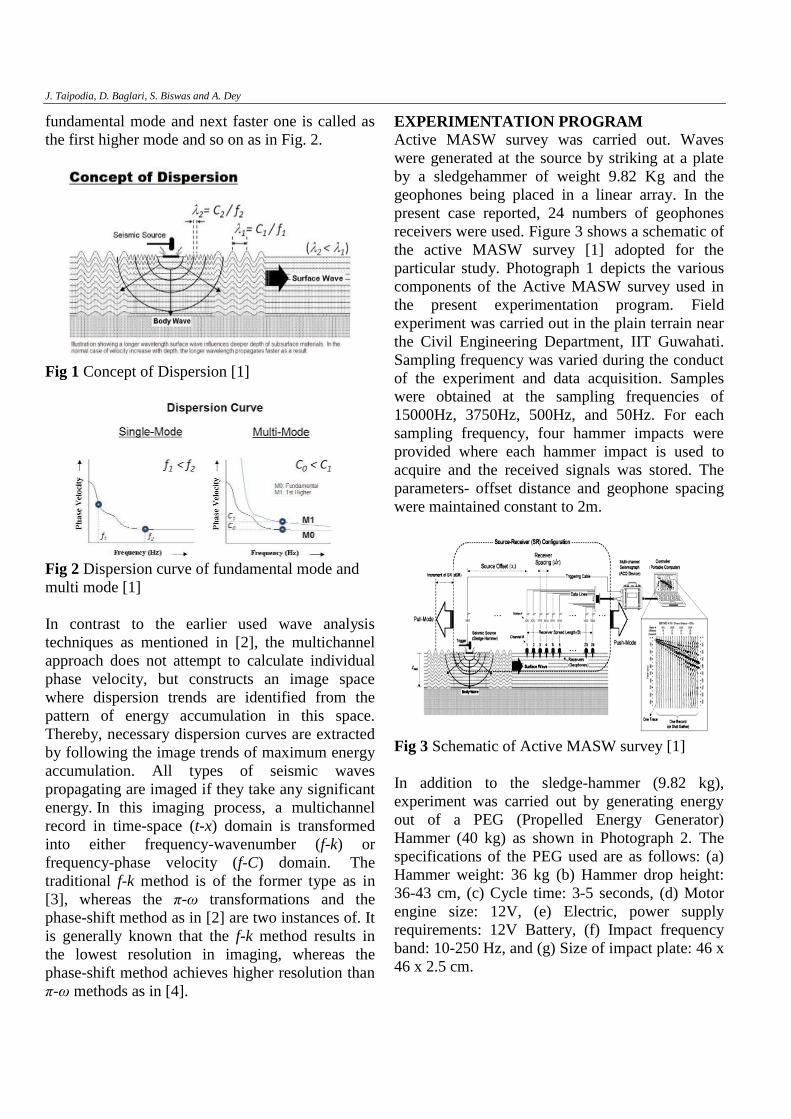
BASIC CONCEPT OF DISPERSION
Dispersion of waves is the phenomenon related to
the waves travelling through a wide area with
different frequency, wavelength and phase velocity
and with gradually enhanced wave-front as shown
in Fig. 1. Dispersion analysis is carried out to
obtain the dispersion curves which are the plots of
phase velocity versus frequency of the propagating
waves. It is obtained by Fast Fourier Transform
(FFT) of the time-space domain signal to achieve
the result in frequency domain.
When more than one phase velocities exist for
given frequency, it is referred as multimodal
dispersion. The slowest one in this case is called
J. Taipodia, D. Baglari, S. Biswas and A. Dey
fundamental mode and next faster one is called as
the first higher mode and so on as in Fig. 2.
Fig 1 Concept of Dispersion [1]
Fig 2 Dispersion curve of fundamental mode and
multi mode [1]
In contrast to the earlier used wave analysis
techniques as mentioned in [2], the multichannel
approach does not attempt to calculate individual
phase velocity, but constructs an image space
where dispersion trends are identified from the
pattern of energy accumulation in this space.
Thereby, necessary dispersion curves are extracted
by following the image trends of maximum energy
accumulation. All types of seismic waves
propagating are imaged if they take any significant
energy. In this imaging process, a multichannel
record in time-space (t-x) domain is transformed
into either frequency-wavenumber (f-k) or
frequency-phase velocity (f-C) domain. The
traditional f-k method is of the former type as in
[3], whereas the π-ω transformations and the
phase-shift method as in [2] are two instances of. It
is generally known that the f-k method results in the lowest resolution in imaging, whereas the
phase-shift method achieves higher resolution than
π-ω methods as in [4].
EXPERIMENTATION PROGRAM
Active MASW survey was carried out. Waves
were generated at the source by striking at a plate
by a sledgehammer of weight 9.82 Kg and the
geophones being placed in a linear array. In the
present case reported, 24 numbers of geophones
receivers were used. Figure 3 shows a schematic of
the active MASW survey [1] adopted for the
particular study. Photograph 1 depicts the various
components of the Active MASW survey used in
the present experimentation program. Field
experiment was carried out in the plain terrain near
the Civil Engineering Department, IIT Guwahati.
Sampling frequency was varied during the conduct
of the experiment and data acquisition. Samples
were obtained at the sampling frequencies of
15000Hz, 3750Hz, 500Hz, and 50Hz. For each
sampling frequency, four hammer impacts were
provided where each hammer impact is used to
acquire and the received signals was stored. The
parameters- offset distance and geophone spacing
were maintained constant to 2m.
Fig 3 Schematic of Active MASW survey [1]
In addition to the sledge-hammer (9.82 kg),
experiment was carried out by generating energy
out of a PEG (Propelled Energy Generator)
Hammer (40 kg) as shown in Photograph 2. The
specifications of the PEG used are as follows: (a)
Hammer weight: 36 kg (b) Hammer drop height:
36-43 cm, (c) Cycle time: 3-5 seconds, (d) Motor
engine size: 12V, (e) Electric, power supply
requirements: 12V Battery, (f) Impact frequency
band: 10-250 Hz, and (g) Size of impact plate: 46 x
46 x 2.5 cm.

50
th
IG
C
50th
INDIAN GEOTECHNICAL CONFERENCE
17th
– 19th
DECEMBER 2015, Pune, Maharashtra, India
Venue: College of Engineering (Estd. 1854), Pune, India
Photograph 1 Components of the MASW survey
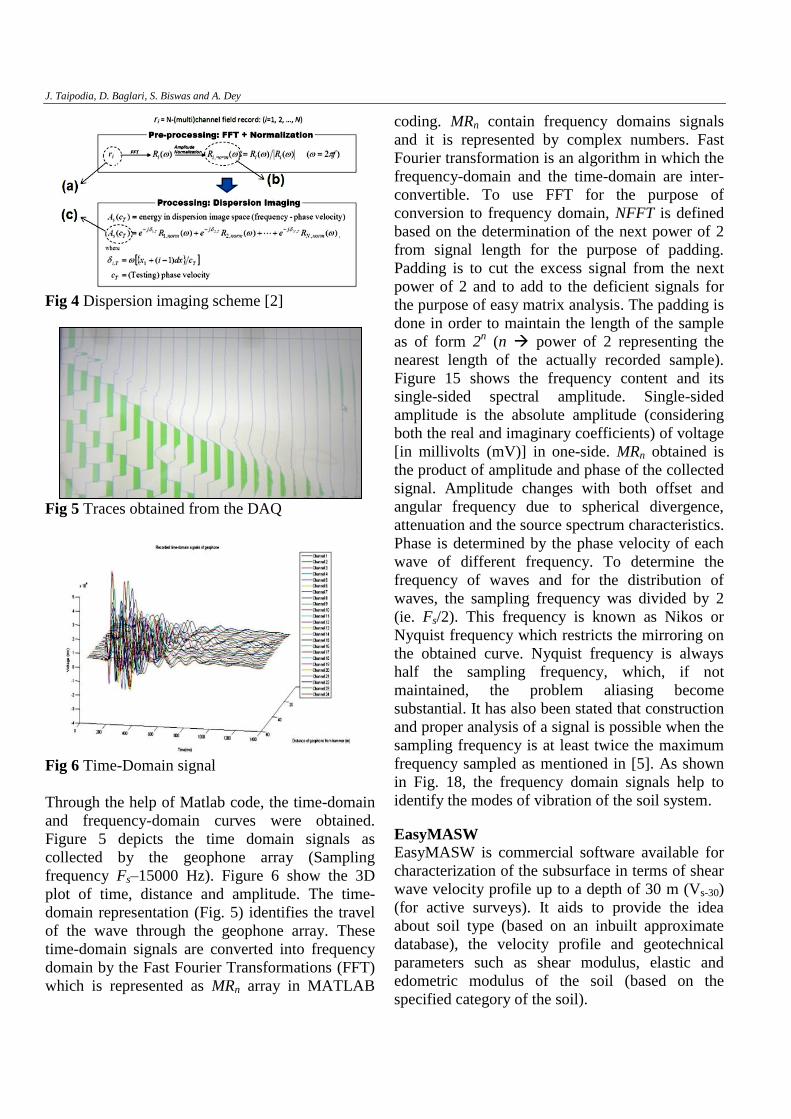
POST-PROCESSING OF RAW FIELD DATA
Matlab Coding The analytical investigation for the dispersion
curve was carried out as per the phase-shift method
proposed by [2] to obtain the dispersion image. As
per [4], the phase-shift method achieves higher
resolution than π-ω and f-k methods. In this phase-
shift method [2], the summed up amplitude of
frequency domain records is determined with
varying phase velocity. Figure 4 depicts the
dispersion imaging scheme as described in [2].
Photograph 2 PEG-40 kg hammer
First, the amplitude of each channel was
determined and subsequently the phase-shift for
each channel was calculated, followed by the
development of a plot of summed up energy with
respect to the varying phase velocity. To obtain the
dispersion curves, all the 2-D curves at different
frequencies are assembled to obtain a 3-D image
showing the energy distribution as the function of
phase velocity and frequency. A Matlab code has
been developed as a preliminary attempt to obtain
the summed up amplitude and the dispersion curve.
First, for the given sampling frequency and time
period, an N-channel record mrn is defined as an
array of N traces. mrn is the time-domain record as
shown in Fig. 5 as obtained from the data
acquisition system (DAQ).
J. Taipodia, D. Baglari, S. Biswas and A. Dey
Fig 4 Dispersion imaging scheme [2]
Fig 5 Traces obtained from the DAQ
Fig 6 Time-Domain signal
Through the help of Matlab code, the time-domain
and frequency-domain curves were obtained.
Figure 5 depicts the time domain signals as
collected by the geophone array (Sampling
frequency Fs–15000 Hz). Figure 6 show the 3D
plot of time, distance and amplitude. The time-
domain representation (Fig. 5) identifies the travel
of the wave through the geophone array. These
time-domain signals are converted into frequency
domain by the Fast Fourier Transformations (FFT)
which is represented as MRn array in MATLAB
coding. MRn contain frequency domains signals
and it is represented by complex numbers. Fast
Fourier transformation is an algorithm in which the
frequency-domain and the time-domain are inter-
convertible. To use FFT for the purpose of
conversion to frequency domain, NFFT is defined
based on the determination of the next power of 2
from signal length for the purpose of padding.
Padding is to cut the excess signal from the next
power of 2 and to add to the deficient signals for
the purpose of easy matrix analysis. The padding is
done in order to maintain the length of the sample
as of form 2n (n power of 2 representing the
nearest length of the actually recorded sample).
Figure 15 shows the frequency content and its
single-sided spectral amplitude. Single-sided
amplitude is the absolute amplitude (considering
both the real and imaginary coefficients) of voltage
[in millivolts (mV)] in one-side. MRn obtained is
the product of amplitude and phase of the collected
signal. Amplitude changes with both offset and
angular frequency due to spherical divergence,
attenuation and the source spectrum characteristics.
Phase is determined by the phase velocity of each
wave of different frequency. To determine the
frequency of waves and for the distribution of
waves, the sampling frequency was divided by 2
(ie. Fs/2). This frequency is known as Nikos or
Nyquist frequency which restricts the mirroring on
the obtained curve. Nyquist frequency is always
half the sampling frequency, which, if not
maintained, the problem aliasing become
substantial. It has also been stated that construction
and proper analysis of a signal is possible when the
sampling frequency is at least twice the maximum
frequency sampled as mentioned in [5]. As shown
in Fig. 18, the frequency domain signals help to
identify the modes of vibration of the soil system.
EasyMASW
EasyMASW is commercial software available for
characterization of the subsurface in terms of shear
wave velocity profile up to a depth of 30 m (Vs-30)
(for active surveys). It aids to provide the idea
about soil type (based on an inbuilt approximate
database), the velocity profile and geotechnical
parameters such as shear modulus, elastic and
edometric modulus of the soil (based on the
specified category of the soil).

50
th
IG
C
50th
INDIAN GEOTECHNICAL CONFERENCE
17th
– 19th
DECEMBER 2015, Pune, Maharashtra, India
Venue: College of Engineering (Estd. 1854), Pune, India
SurfSeis
SurfSeis software was developed at the Kansas
Geological Survey to process seismic data using
the multichannel analysis of surface waves
(MASW) method.
RESULTS AND DISCUSSIONS
The data obtained was first processed by
EasyMASW software. The dispersion images were
obtained for different sampling frequencies.
Fig. 7a Dispersion curve for sampling frequency
500 Hz obtained from EasyMASW
Fig. 7b Dispersion curve for sampling frequency
3750 Hz obtained from EasyMASW
Figure 7a depicts dispersion image with the
sampling frequency of 500Hz which was obtained
by EASYMasw Software. From this image space,
dispersion curve trend is identified and extracted to
carry out the inversion. Here, the first order and
higher order mode can be easily identified. Figure
7b-c shows the dispersion curve obtained with
sampling frequency of 3750 Hz and 15000 Hz,
respectively.
Fig. 7c Dispersion curve for sampling frequency
15000 Hz obtained from EasyMASW
It has been observed that the records collected
using 50Hz sampling frequency is not at all
sufficient to produce a dispersion image with
clarity. Lower sampling frequencies have higher
sampling intervals, and hence, pick-up too less
number of bits of information from the wave
propagating through the geophone, which might
result in skipping of many peak and valley features
of the wave. In active survey, the waves produced
due to impact are mostly high frequency waves
penetrating smaller depths in the subsurface. For
these waves, sampling frequency of 50Hz proves to
be insufficient, and hence, results in an obscure
dispersion image, which fails to provide any
information. Hence, it is suggested to go for higher
sampling frequency in order to obtain the best
possible dispersion curve. Figure 7d shows the
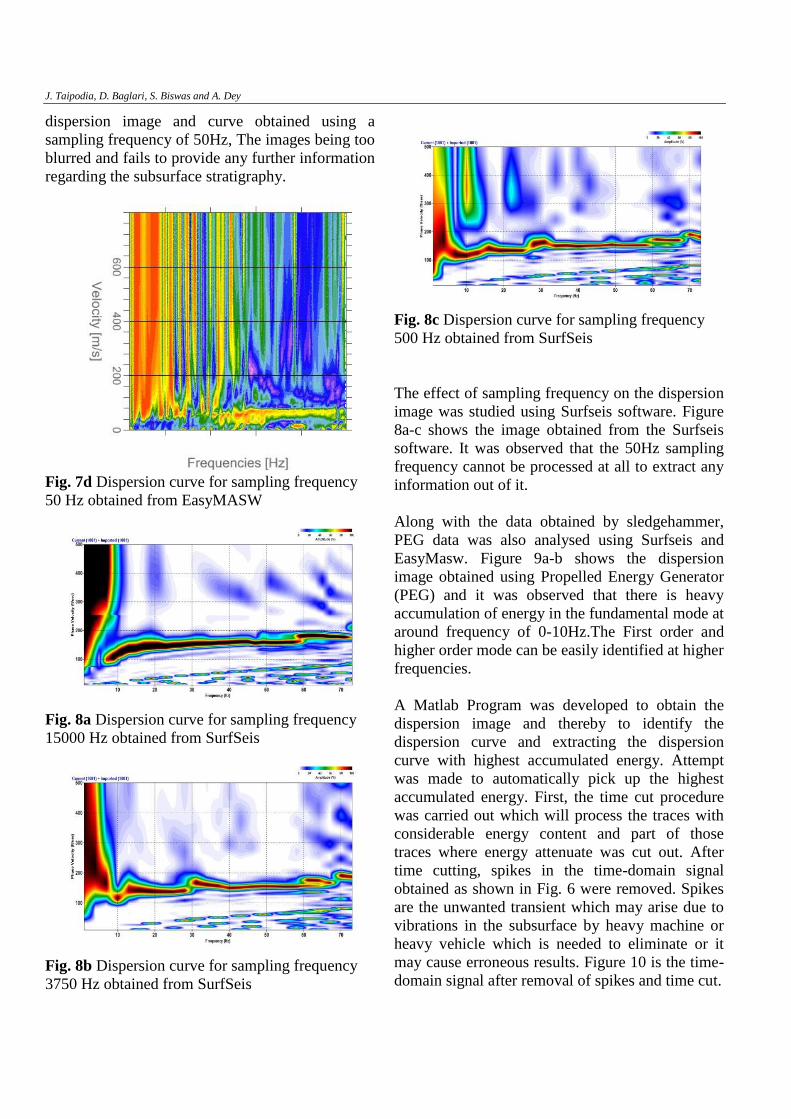
J. Taipodia, D. Baglari, S. Biswas and A. Dey
dispersion image and curve obtained using a
sampling frequency of 50Hz, The images being too
blurred and fails to provide any further information
regarding the subsurface stratigraphy.
Fig. 7d Dispersion curve for sampling frequency
50 Hz obtained from EasyMASW
Fig. 8a Dispersion curve for sampling frequency
15000 Hz obtained from SurfSeis
Fig. 8b Dispersion curve for sampling frequency
3750 Hz obtained from SurfSeis
Fig. 8c Dispersion curve for sampling frequency
500 Hz obtained from SurfSeis
The effect of sampling frequency on the dispersion
image was studied using Surfseis software. Figure
8a-c shows the image obtained from the Surfseis
software. It was observed that the 50Hz sampling
frequency cannot be processed at all to extract any
information out of it.
Along with the data obtained by sledgehammer,
PEG data was also analysed using Surfseis and
EasyMasw. Figure 9a-b shows the dispersion
image obtained using Propelled Energy Generator
(PEG) and it was observed that there is heavy
accumulation of energy in the fundamental mode at
around frequency of 0-10Hz.The First order and
higher order mode can be easily identified at higher
frequencies.
A Matlab Program was developed to obtain the
dispersion image and thereby to identify the
dispersion curve and extracting the dispersion
curve with highest accumulated energy. Attempt
was made to automatically pick up the highest
accumulated energy. First, the time cut procedure
was carried out which will process the traces with
considerable energy content and part of those
traces where energy attenuate was cut out. After
time cutting, spikes in the time-domain signal
obtained as shown in Fig. 6 were removed. Spikes
are the unwanted transient which may arise due to
vibrations in the subsurface by heavy machine or
heavy vehicle which is needed to eliminate or it
may cause erroneous results. Figure 10 is the time-
domain signal after removal of spikes and time cut.

50
th
IG
C
50th
INDIAN GEOTECHNICAL CONFERENCE
17th
– 19th
DECEMBER 2015, Pune, Maharashtra, India
Venue: College of Engineering (Estd. 1854), Pune, India
Fig 9a Dispersion curve obtained from Surfseis for
3750Hz sampling frequency using PEG
Fig 9b. Dispersion curve obtained using PEG for
3750Hz sampling frequency from EasyMASW
Fig 10 Time-domain signal after removal of spikes
After the removal of spikes the time domain signal
was squared up to eliminate the negative effect
(Fig. 11). The energy was accumulated on the
upper side of the axis. Then the squared up
amplitude was normalized to understand the
relation of energy all the channels or to compare
energies of each channel. Figure 12 shows the
Normalized squared time domain curve for 24
channels.
Fig 11 Squared-up time domain signal
Fig 12 Normalized squared-up time domain signal
Fig 13 Cumulative normalized squared-up
amplitude

J. Taipodia, D. Baglari, S. Biswas and A. Dey
The cumulative energy is found out which has been
shown in Fig. 13. Figure 14 shows the processed
time-domain signal of geophones which is ready
for FFT. Figure 15 is the Single sided Fourier
amplitude obtained by Fast Fourier transform
(FFT). The single sided amplitude spectra was then
normalised and squared up to obtained the
processed frequency records as shown in Fig
ures16-18 respectively.
Fig 14 Processed time-domain signal after time-cut
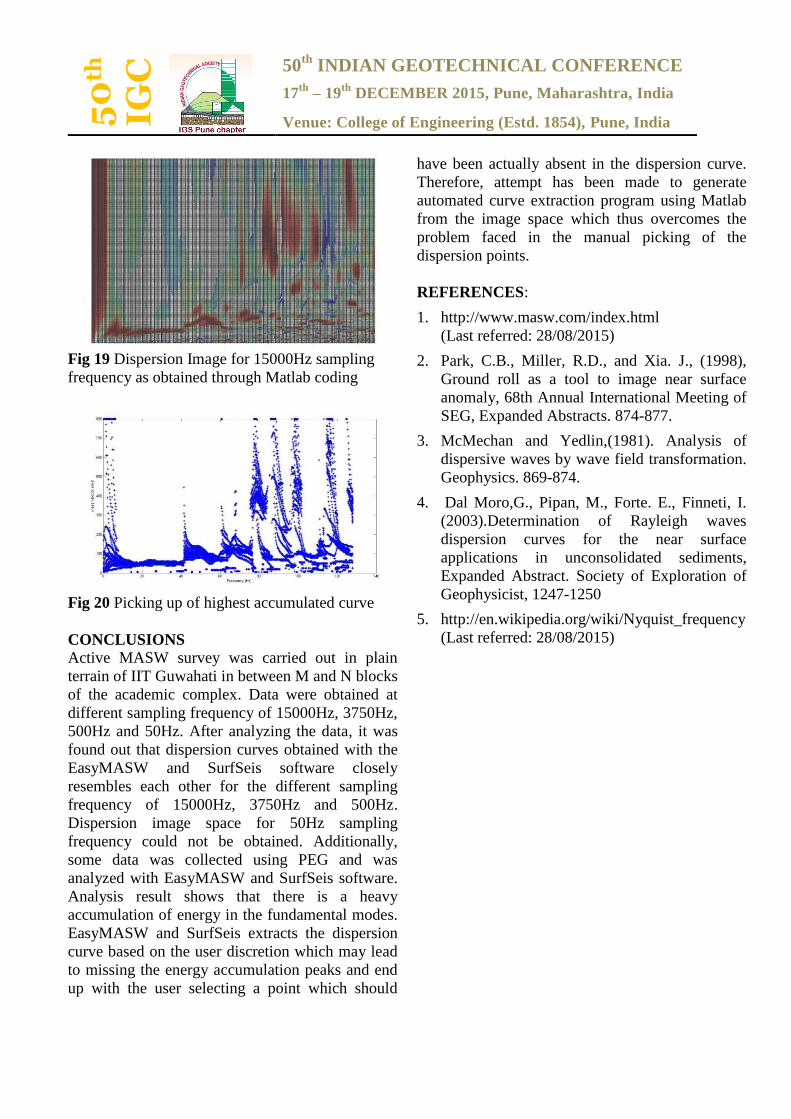
Figure 19 show the dispersion Image found by
Matlab code. Here, the highest accumulated energy
has to be identified and extracted to be used for the
inversion. Higher modes can also be identified
from this image.
Fig 15 Single sided Fourier amplitude
The processed frequency domain record was used
to obtain dispersion image space. Different type of
curve trend was identified. The fundamental mode
and higher order mode was identified according to
their energy accumulation pattern. The highest
accumulated energy was picked up using the
suitable Matlab subroutines which can be further
extracted and can be used for inversion. However,
more detailed study is required in this regard as the
resolution of image space obtained is quite low.
Figure 20 shows dispersion points selected by the
automated picking scheme developed in Matlab
which can be subsequently used for the inversion
procedure.
Fig 16 Normalized FFT records
Fig 17 Cumulative squared up normalized FFT
records
Fig 18 Processed frequency domain record
50
th
IG
C
50th
INDIAN GEOTECHNICAL CONFERENCE
17th
– 19th
DECEMBER 2015, Pune, Maharashtra, India
Venue: College of Engineering (Estd. 1854), Pune, India
Fig 19 Dispersion Image for 15000Hz sampling
frequency as obtained through Matlab coding
Fig 20 Picking up of highest accumulated curve
CONCLUSIONS
Active MASW survey was carried out in plain
terrain of IIT Guwahati in between M and N blocks
of the academic complex. Data were obtained at
different sampling frequency of 15000Hz, 3750Hz,
500Hz and 50Hz. After analyzing the data, it was
found out that dispersion curves obtained with the
EasyMASW and SurfSeis software closely
resembles each other for the different sampling
frequency of 15000Hz, 3750Hz and 500Hz.
Dispersion image space for 50Hz sampling
frequency could not be obtained. Additionally,
some data was collected using PEG and was
analyzed with EasyMASW and SurfSeis software.
Analysis result shows that there is a heavy
accumulation of energy in the fundamental modes.
EasyMASW and SurfSeis extracts the dispersion
curve based on the user discretion which may lead
to missing the energy accumulation peaks and end
up with the user selecting a point which should
have been actually absent in the dispersion curve.
Therefore, attempt has been made to generate
automated curve extraction program using Matlab
from the image space which thus overcomes the
problem faced in the manual picking of the
dispersion points.
REFERENCES:
1. http://www.masw.com/index.html
(Last referred: 28/08/2015)
2. Park, C.B., Miller, R.D., and Xia. J., (1998),
Ground roll as a tool to image near surface
anomaly, 68th Annual International Meeting of
SEG, Expanded Abstracts. 874-877.
3. McMechan and Yedlin,(1981). Analysis of
dispersive waves by wave field transformation.
Geophysics. 869-874.
4. Dal Moro,G., Pipan, M., Forte. E., Finneti, I.
(2003).Determination of Rayleigh waves
dispersion curves for the near surface
applications in unconsolidated sediments,
Expanded Abstract. Society of Exploration of
Geophysicist, 1247-1250
5. http://en.wikipedia.org/wiki/Nyquist_frequency
(Last referred: 28/08/2015)