indian ocean sources of agulhas leakageoceanrep.geomar.de/38080/1/jgrc22263.pdfresearch article...
TRANSCRIPT
RESEARCH ARTICLE10.1002/2016JC012676
Indian Ocean sources of Agulhas leakage
Jonathan V. Durgadoo1 , Siren R€uhs1, Arne Biastoch1 , and Claus W. B. B€oning1
1GEOMAR Helmholtz Centre for Ocean Research Kiel, Kiel, Germany
Abstract We examine the mean pathways, transit timescales, and transformation of waters flowing fromthe Pacific and the marginal seas through the Indian Ocean (IO) on their way toward the South Atlanticwithin a high-resolution ocean/sea-ice model. The model fields are analyzed from a Lagrangian perspectivewhere water volumes are tracked as they enter the IO. The IO contributes 12.6 Sv to Agulhas leakage, whichwithin the model is 14.1 6 2.2 Sv, the rest originates from the South Atlantic. The Indonesian Through-flowconstitutes about half of the IO contribution, is surface bound, cools and salinificates as it leaves the basinwithin 10–30 years. Waters entering the IO south of Australia are at intermediate depths and maintain theirtemperature-salinity properties as they exit the basin within 15–35 years. Of these waters, the contributionfrom Tasman leakage is 1.4 Sv. The rest stem from recirculation from the frontal regions of the SouthernOcean. The marginal seas export 1.0 Sv into the Atlantic within 15–40 years, and the waters cool and freshenon-route. However, the model’s simulation of waters from the Gulfs of Aden and Oman are too light andhence overly influenced by upper ocean circulations. In the Cape Basin, Agulhas leakage is well mixed. On-route, temperature-salinity transformations occur predominantly in the Arabian Sea and within the greaterAgulhas Current region. Overall, the IO exports at least 7.9 Sv from the Pacific to the Atlantic, thereby quan-tifying the strength of the upper cell of the global conveyor belt.
1. Introduction
In the global ocean circulation, the Indian Ocean (IO) constitutes a connector between the Pacific and AtlanticOceans. Broeker’s [1991] simple but profound schematic of the Great Ocean Conveyor Belt already illustratesthe importance of the IO. In the upper ocean, warm tropical waters are imported from the Pacific through theIndonesian Archipelago into the IO and exported south of Africa into the Atlantic where eventually convectiveoverturning occurs at high northern latitudes. The newly formed deep water subsequently spreads southwardand is redistributed into the Indian and Pacific Oceans after looping around Antarctica. In this study, we investi-gate whether the IO simply acts as a passive connector between the Pacific and Atlantic oceans or whether itadditionally actively modifies the waters that it communicates across. Since 1991, numerous authors haverevised Broeker’s depiction, highlighting the complex and eddying nature of both the upper and deep routes[Richardson, 2008; Lozier, 2010]. Among others, it is now recognized that the route through the IO occurs bothnorth and south of Australia, namely via the Indonesian Through-flow and Tasman leakage (Figure 1).
Water entering the IO from the Indonesian Archipelago, so-called Indonesian Through-flow (ITF), must navigatea complex route. The main entry point from the Pacific Ocean is through Makassar Strait between Borneo andSulawesi, with over 75% of the �15 Sv that eventually traverses into the IO [Sprintall et al., 2009; Tillinger andGordon, 2009]. The volume transport of ITF displays a relationship with phases of the El-Ni~no Southern Oscilla-tion. In the negative phase, an enhancement in through-flow has been reported [Meyers, 1996; Liu et al., 2015],with more waters of south Pacific origin entering Makassar Strait [van Sebille et al., 2014]. Further interannualvariations in ITF originate from coastal Kelvin waves propagating along the eastern IO basin, and are related tothe Indian Ocean Dipole [Liu et al., 2015]. Based on 3 decades (since 1984) of repeated expendable bathyther-mograph measurements between Fremantle (southwest Australia) and Sunda Strait (between the islands ofSumatra and Java) and surface winds measurements, Wijffels et al. [2008] and Liu et al. [2015] reported a posi-tive trend in geostrophic ITF transport of 1 Sv/decade. ITF waters enter the IO as a tongue of relatively fresh sur-face waters and saltier intermediate waters [Gordon et al., 1997] and feed into the South Equatorial Current.High-resolution numerical experiments with artificial opening and closing of the ITF passages provide evidenceof a codependency between ITF transport and Agulhas leakage further downstream [e.g., Le Bars et al., 2013].
Key Points:� A study of pathways, timescales, and
water transformations of IndianOcean sources of Agulhas leakage� On-route, Indonesian Through-Flow
cools and salinificates, while Tasmanleakage is deeper and experiences nochange in properties� The Pacific contributes at least 7.9 Sv
to the total Agulhas leakage of about14 Sv
Correspondence to:J. V. Durgadoo,[email protected]
Citation:Durgadoo, J. V., S. R€uhs, A. Biastoch,and C. W. B. B€oning (2017), IndianOcean sources of Agulhas leakage,J. Geophys. Res. Oceans, 122,doi:10.1002/2016JC012676.
Received 30 DEC 2016
Accepted 4 APR 2017
Accepted article online 13 APR 2017
VC 2017. American Geophysical Union.
All Rights Reserved.
DURGADOO ET AL. INDIAN OCEAN SOURCES OF AGULHAS LEAKAGE 1
Journal of Geophysical Research: Oceans
PUBLICATIONS

The interconnectivity of the three southern hemisphere subtropical gyres allows for the secondary inflow ofwaters into the IO from the Pacific Ocean south of Australia, so-called Tasman leakage [Ridgway and Dunn,2007; Speich et al., 2007]. Westward flow, in parts originating from the East Australian Current, is typicallyobserved between Tasmania and the Subtropical Front [Speich et al., 2002]. Early observational and mod-eled estimates of this leakage give 0–13 Sv of thermocline and intermediate waters flowing westward southof Tasmania [Rintoul and Sokolov, 2001; Speich et al., 2002]. More recent studies constrain these estimates toaround 4–5 Sv in the mean [van Sebille et al., 2012, 2014]. Derived from observational subsurface autono-mous floats, Rosell-Fieschi et al. [2013] reported a westward transport of 5.2 6 1.8 Sv at 1158E at intermediatedepth. Despite the fact that both interocean exchanges north and south of Australia being of Pacific origincould arguably be related to large scale wind patterns [e.g., Feng et al., 2011], van Sebille et al. [2014] notedno obvious link between the two. Little is known on the spreading of Tasman leakage in the IO, but it isassumed to partly contribute to Agulhas leakage.
Other sources of surface and intermediate waters for the IO are from the marginal seas in the northwesternpart of the basin (Figure 1). Resulting from extreme evaporation, warm, and saline water are formed in theRed Sea and Persian Gulf. These dense waters mix in the Gulfs of Aden and Oman due to high mesoscaleactivities [Fratantoni et al., 2006; Al Saafani et al., 2007; L’H�egaret et al., 2015]. In the Arabian Sea, they level
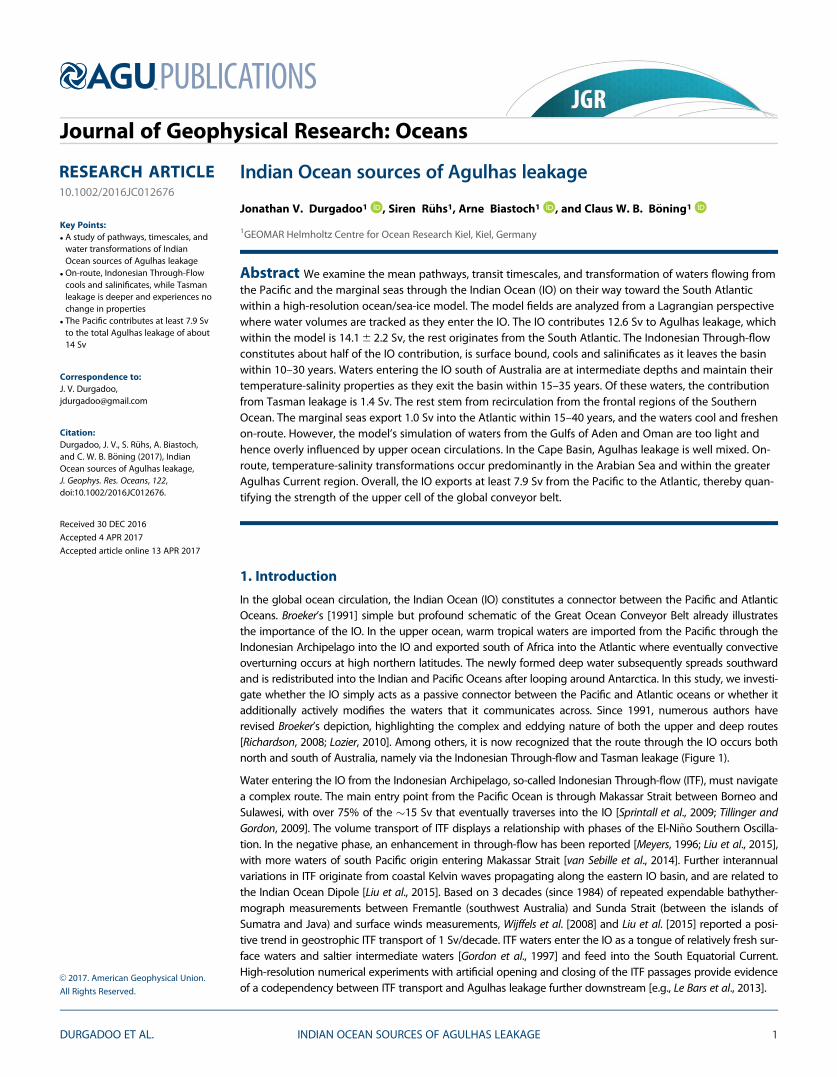
Figure 1. Representation of the mean circulation (contours of sea surface height, cm) and mesoscale variability (shading of sea surfaceheight variance, cm2) for the period 2000–2010 from (a) altimetric observations, AVISO, (b) model, ORCA0083. Sections in Figure 1a denotethe final sections used for the quantitative Ariane experiments; sections at 208E and 116.68E extend to Antarctica. Sections in Figure 1bhighlight the initial seeding sections used for the four main quantitative Ariane experiments. GoodHope (GH) is the section along whichAgulhas leakage is commonly monitored.
Journal of Geophysical Research: Oceans 10.1002/2016JC012676
DURGADOO ET AL. INDIAN OCEAN SOURCES OF AGULHAS LEAKAGE 2

at depth between 200 and 900 m and spread equatorward [Prasad et al., 2001; Bower et al., 2002; Chowdaryet al., 2005]. An analysis of historical hydrographic sections showed that the high salinities relative to theambient waters could be traced within the Mozambique Channel and downstream in the Agulhas Current[Beal et al., 2000; Roman and Lutjeharms, 2007]. South of Africa, the high salinity waters undergo additionalmixing and share the similar density classes as the relatively fresher but colder Antarctic Intermediate Water[Beal et al., 2006]. In the Cape Basin, You et al. [2003] reported about 0.4 6 1 Sv of Red Sea Water enteringthe South Atlantic.
The outflow from the Indian Ocean into the Atlantic Ocean passes through a vigorous western boundarycurrent regime southeast of Africa (Figure 1). The Agulhas Current transports warm and saline surface andintermediate water southward [Lutjeharms, 2006], with a typical transport of 84 6 24 Sv (estimated from 3years of mooring data) [Beal and Elipot, 2016]. The prominent contributors of water of the Agulhas Currentare from the Mozambique Channel (16.7 6 15.8 Sv, 6 years of mooring data) [Ullgren et al., 2012], from theSouth East Madagascar Current (37 6 10 Sv, four hydrographic sections) [Nauw et al., 2008], and the restfrom recirculations along the Agulhas Return Current [Lutjeharms and Ansorge, 2001; Lutjeharms, 2006]. Thelarge standard deviations in transport value stem from the dominance of the mesoscale in this region (Fig-ure 1). South of Africa, the Agulhas Current overshoots the shelf break and abruptly retroflects back into theIndian Ocean. The majority (�2/3–3/4) of the original Agulhas Current transport flows eastward as the Agul-has Return Current [Lutjeharms, 2006]. The remainder, roughly 15 Sv [Richardson, 2007], flows westward asAgulhas leakage mostly in form of mesoscale eddies, and constitutes the so-called warm and salty exportinto the South Atlantic that Broeker [1991] described.
Agulhas leakage in the Cape Basin can therefore in principle be decomposed into its various constituents:coming from the Pacific north and south of Australia, the marginal seas, and via the disparate sources of theAgulhas Current. The Cape Basin is, however, a cauldron, where waters of IO origin mix with ambient SouthAtlantic water and with waters from Drake Passage [Stramma and England, 1999], making it a challenge toidentify and more importantly volumetrically quantify individual water masses from classical potentialtemperature-salinity plots.
The aim of this study is to decompose the exhaust of the IO, Agulhas leakage, into its individual sourcesusing a high-resolution global ocean sea-ice model. We focus on waters of IO origin, determine and com-pare their pathways and associated timescales, and assess changes in properties along their way from thePacific and marginal seas toward the Atlantic. The spreading of individual water masses in the IO has beendescribed in the past using historical hydrography data sets, simple and coarse-resolution models [e.g., Youand Tomczak, 1993; You, 1998; Haines et al., 1999; Joseph and Swathi, 1999; Beal et al., 2000; Song et al.,2004]. We use a Lagrangian analysis approach that allows us to follow entire water volumes (which maycomprise of different water masses) and to provide quantitative measures by closing the IO inflow-outflowbudget. For this study, we seek an understanding of the mean flow and do not resolve any variability onseasonal, interannual, decadal, or longer timescales. Nonetheless, it is important to note that the circulationof the IO is subject to changes on a range of timescales. For example, owing to the seasonality of the Asianmonsoon winds, the upper ocean current system of the northern IO reverses biannually [Schott andMcCreary, 2001]. On interannual timescales strong imprints of the Indian Ocean Dipole and the El Ni~noSouthern Oscillation are observed [Saji et al., 1999; Behera et al., 2006; Ummenhofer et al., 2013]. As under-lined by Haines et al. [1999], in order to adequately resolve the mean circulation, it is important that theEulerian velocity fields used for the Lagrangian analysis incorporate the full temporal variability of the IO.
2. Methods
2.1. Model OutputThe ORCA0083 configuration of the NEMO model (version 3.6) [Madec, 2016] is used for this study. This con-figuration, developed within the European DRAKKAR consortium [The DRAKKAR Group, 2007], simulates theocean/sea-ice circulation nominally at 1/128 globally, which is eddy resolving between roughly 508S and508N [Hallberg, 2013]. ORCA0083 uses an Arakawa-C staggered grid arrangement in the horizontal, and has75 vertical levels, with 46 levels in the top 1000 m and spacing increasing from 1 m at the surface to a maxi-mum of 204 m at depth. The experiment used for this study is the ORCA0083-N06, which was run by theNational Oceanography Centre, Southampton, UK. The treatment of tracers is implemented using a
Journal of Geophysical Research: Oceans 10.1002/2016JC012676
DURGADOO ET AL. INDIAN OCEAN SOURCES OF AGULHAS LEAKAGE 3

Laplacian operator for isoneutral horizontal diffusion (eddy diffusion of 125 m2/s) and the total variance dis-sipation scheme for advection. Geopotential horizontal diffusion on momentum uses a bi-Laplacian opera-tor (eddy viscosity of 21.25e10 m4/s) and a vector form advection scheme conserving energy andenstrophy. Subgrid-scale vertical mixing is calculated through the turbulent eddy kinetic dependent diffu-sion scheme. This experiment started from rest with tracer fields initialized using a combined productderived from PHC2.1 [Steele et al., 2001], Medatlas [Jourdan et al., 1998], and Levitus et al. [1998], and wasforced using the Drakkar Forcing Set (DFS5.2) [Brodeau et al., 2010; Dussin et al., 2014] for the period 1958–2012.
The first 5 years (1958–1962) of the simulation are treated as the initialization phase, so that for thisstudy, 50 years output (1963–2012) are used. We note that a 5 years initialization phase is likely not suffi-cient to spin the whole overturning. However, it is sufficient for the circulation of the upper 1000 m inthe IO (dynamic height fields difference between the first and last decades of the 50 years shows nomajor discrepancies, not shown). The three-dimensional velocity and tracer fields were stored at tempo-ral resolution of 5 day means. Qin et al. [2014] showed that for offline Lagrangian analyses within modelsof similar horizontal resolution as ORCA0083, degradation in flow characteristics occurs when usingmodel output with temporal resolution beyond 9 day average. The model’s representation of the meanflow and of the variability of the IO region is adequate (Figures 1 and 2a). The region of high sea-surface-height variability in the source region of the Agulhas Current, which most nested configurations fail toreproduce adequately [Biastoch et al., 2008; Durgadoo et al., 2013], is well resolved by this simulation.Further details and overall evaluation of the model experiment can be found in Moat et al. [2016] andSchulze [2016].
2.2. Lagrangian Analysis of the Model FieldsTracking water within the Eulerian output fields of the model was performed offline using the ArianeLagrangian package [Blanke and Raynaud, 1997]. Ariane advects particles within the model fields by displac-ing them along analytically computed three-dimensional streamlines, taking advantage of the volume con-servation property of the model, which implies that the velocity field has to be locally nondivergent. Unlikeother explicit time-stepping methods, the analytical integration scheme yields unique and identical trajec-tory solutions both forward and backward in time.
Ariane runs in two complementary modes: quantitative and qualitative. In its quantitative mode, Arianeseeds particles along predefined sections at every time step (in this case, 5 day), whereby each particle isassigned a partial transport. The number of particles at each time-step is dependent on the transport acrossa particular section, such that the stronger the flow, the more particles are seeded; the cumulative transportof all particles represents the instantaneous Eulerian transport [Blanke and Raynaud, 1997]. Subsequently,the particles are advected forward or backward in time. Finally, they are captured when they cross edges ofa predefined domain, and their transports are summed up. This mode is most useful to determine the con-nectivity between the seeding section and the edges of the predefined domain. A prime example whereAriane is successfully used in this mode is in measuring Agulhas leakage, defined by the portion of the Agul-has Current entering the Atlantic across the GoodHope line [Durgadoo et al., 2013; Biastoch et al., 2015].
Blanke et al. [1999] introduced the concept of the Lagrangian streamfunction based on the fact that Arianerespects mass conservation (nondivergent flow). As particles are advected in the quantitative mode theirinfinitesimal transports are summed at each velocity grid cell wall they cross. The resulting three-dimensional transport field can then be integrated vertically to obtain a two-dimensional locally nondiver-gent flow field that can be described by a horizontal streamfunction. Such a Lagrangian streamfunctionthus represents the horizontal flow of the entire water volume that entered and left the study domain. Pre-requisites are that first initial sections are seeded with sufficiently large number of particles, and second suf-ficient time is allowed for the particles to leave the domain across the defined final sections.
In the qualitative mode of Ariane, seeding positions are obtained by either first running a quantitativeexperiment or by user-defined start positions. Here, the former is favored since the particle positionsderived from a quantitative experiment has the advantage of being tagged by partial transports. Further-more, in qualitative mode, spatial and temporal information of individual particle trajectories are stored.Such information can subsequently be analyzed to assess pathways, timescales (e.g., R€uhs et al. [2013] and
Journal of Geophysical Research: Oceans 10.1002/2016JC012676
DURGADOO ET AL. INDIAN OCEAN SOURCES OF AGULHAS LEAKAGE 4

L€ubbecke et al. [2015] for Agulhas water spreading in the Atlantic), and along-track changes in tracerproperties.
Four main sets of Lagrangian experiments were performed for this study, each corresponding to the startpositions of the particles at four different initial sections. These initial sections, illustrated in Figure 1b, cap-ture water entering the IO basin from the Pacific Ocean (ITF and TL) and the marginal seas adjacent to theIO, namely from the Gulfs of Oman (PGW) and Aden (RSW).
1. PGW—meridional section at the mouth of the Gulf of Oman along 59.58E; 22.58N-25.48N, where waterenters the Arabian Sea.
2. RSW—meridional section at the mouth of the Gulf of Aden along 50.88E; 11.98N–158N, where waterenters the Arabian Sea.
3. ITF—meridional section along 1148E; between Australia (228S) and Java (8.78S). The Indonesian Through-flow is a collective term consisting of water transport across the Indonesian Archipelago through variousStraits. Along 1148E, flow across 5 of the 7 Straits are captured, namely Lombok, Flores, Ombai, Timor,and Torres. Considering ITF collectively enables consistent analysis of pathways and timescales acrossthe IO basin. Separate experiments for the two remaining Straits, Sunda, and Malacca, were performed,and shall be mentioned briefly in the results.
4. TL—meridional section along 116.68E; between Antarctica and Australia (35.28S). Strictly speaking, Tas-man leakage occurs south of Tasmania [Ridgway and Dunn, 2007]. Here, since a sizable portion of thewestward flowing water along this longitude between Australia and the Subtropical Front indeed origi-nate from south of Tasmania [van Sebille et al., 2014], the nomenclature was deemed appropriate. Thewestward flowing Antarctic Coastal Current was not considered as part of TL, since it is confined south ofthe Antarctic Circumpolar Current and thereby does not enter the IO basin.
These four initial sections were designed to satisfy two criteria. First, the transport across each section is rep-resentative of the flow of the entire water column, including the respective water masses (as ordinarily mea-sured along their typical isopycnals) after which they are named. Second, the sections are offset from theoriginal water mass source, so as to minimize the effect of recirculations on timescales between the areawhere they originate and when they enter the IO.
The quantitative mode requires a closed domain to be defined, containing an initial section and several otherfinal sections along which particles are captured. These final sections are shown in Figure 1a. The sections at208E and 116.68E (TL) extend to the Antarctic continent. This domain was used for the quantitative experi-ments for PGW, RSW, and TL. For the ITF experiment, the final sections extending from Java to Papua (along8.68S) and New Guinea to Australia (along 142.58E) were replaced with the initial section shown in Figure 1b.
So as to capture the interannual and decadal variability of the flow, it is necessary to seed particles over atleast a few decades. In order to optimize the seeding strategy, and thereby allowing more particles to beseeded and integrated over a longer period of time, a series of preanalysis experiments was undertaken. Inthis preanalysis, particles were successively seeded full-depth along each initial section every 5 days over aperiod of 5 years, and were advected forward for a total of 25 years in quantitative mode. The initial posi-tions of particles that, within 25 years, exited the domain south of Africa at 208E were subsequently ana-lyzed. It was found that over 99% of the particles reaching 208E originated from PGW, RSW, ITF, and TL inthe upper 500, 1500, 1500, and 1600 m, respectively (not shown). Furthermore, for the TL preanalysis exper-iment, the particles reaching 208E originated from between Australia and 478S, which roughly delineatesthe subtropical regime from the Antarctic Circumpolar Current (Figure 1). Repeating this preanalysis inreverse yields the same result (backward tracking of particles from 208E to the four source regions). Resultsfrom the preanalysis experiments informed the design of the full set of Lagrangian experiments assessedhere.
The four main sets of Lagrangian experiments were constructed as follows. Seeding across each initial sec-tion was refined based on the depth and latitude criteria described above. In quantitative mode, 1.5 3 106,2.2 3 106, 10.1 3 106, and 10.0 3 106 particles were seeded every 5 days over a period of 30 years (1963–1992), corresponding to a total mean transport of 1.0, 3.6, 17.6, and 16.0 Sv across the PGW, RSW, ITF, andTL initial sections, respectively. The maximum accuracy achieved in this study is in the order of 0.1 Sv, there-fore all transports reported here are rounded to 1 decimal place. The particles were then integrated forwardfor 100 years. Less than 3% of the initially seeded particles remained in the IO domain by the end of the
Journal of Geophysical Research: Oceans 10.1002/2016JC012676
DURGADOO ET AL. INDIAN OCEAN SOURCES OF AGULHAS LEAKAGE 5

100 years. The long integration period was achieved by cycling twice through the input data, a practice pre-viously employed for other studies of this kind [van Sebille et al., 2011; R€uhs et al., 2013]. Out of 38.2 Sv (sumof the time-mean transport across the four initial sections), 23.2 Sv (60%, 3.8 3 106 particles) reached 208Ewithin 100 years, that is 0.3, 1.4, 10.9, and 10.6 Sv from PGW, RSW, ITF, and TL, respectively.
Subsequently, only those particles that exited the IO domain across 208E were placed back at their respec-tive initial seeding sections and advected forward in quantitative and qualitative modes for 100 years. Thepositions of the trajectories were stored every 5 days. Additionally, the modeled ambient temperature andsalinity interpolated at the trajectory locations were stored at the same temporal frequency. Even thoughcycling through the input data allows for the analysis of longer pathways and timescales, the analysis ofalong-track tracer characteristics ought to be restricted to the length of input data available, that is, 50 years(see section 3.4).
3. Results and Discussion
3.1. Pathways from the Marginal Seas and the Pacific to the South AtlanticWe generated the Lagrangian streamfunctions after 100 years of integration, and in order to obtain a closedvolumetric budget, particles remaining in the domain were omitted. Figure 2 shows the Lagrangian stream-function for each experiment for all particles, while Figure 3 shows the same but for only those particlesthat exited the domain across 208E within 100 years. In the first case, the isolines connect the initial seedingsection with all other sections of the domain, and in the second case, they highlight only the flow from theseeding section to the section at 208E south of Africa.
The 50 year mean Eulerian streamfunction, derived from annual average velocity fields, portrays the overallbarotropic circulation of the IO basin (Figure 2a). Prominently, the two gyres of the south IO, roughly delin-eated along 108S, are seen: the broad counter-clockwise south Indian subtropical gyre between 408S and108S, and the narrow clockwise tropical gyre between 108S and the Equator. Their associated westernboundary currents, namely the Agulhas Current [Lutjeharms, 2006], the North and South East MadagascarCurrents [Swallow et al., 1988], and the East African Coastal Current [Swallow et al., 1991], are also visible.North of the Equator, the circulation is strongly influenced by seasonal reversal of winds. A weak clockwisecirculation illustrates a stronger summer (southwest) monsoon on average.
The total Lagrangian streamfunction (Figure 2b) portrays the vertically integrated flow of the four IO watersources. The resemblance to the Eulerian mean both in structure and magnitude suggests that it adequatelycaptures the Eulerian circulation, hence validating the method. Generally, a congruity between the Eulerianand Lagrangian streamfunctions indicates that the prerequisites mentioned previously are sufficiently ful-filled. The biggest differences between the two fields probably stem from the fact that deep-water inflow(e.g., from the Atlantic across 208E) is not considered and particle trajectories with potentially longer resi-dence times in the IO (e.g., local recirculations in the Southwest IO) are prohibited to some degree by theexperiment design (section 2.2). Also, it is worth noting that the Eulerian streamfunction portrays the circu-lation of the 50 year mean, while the Lagrangian streamfunction is based on trajectories with various resi-dence times, up to 100 years [D€o€os et al., 2008]. The Lagrangian streamfunctions based on each individualexperiments (Figures 2c–2f), showing the spreading of waters from the different source regions, aredescribed next.
Water from the marginal seas entering the northwestern IO from the Gulfs of Oman and Aden show similarpathways (experiments PGW and RSW, Figures 2c and 2d). As they enter the Arabian Sea, these waters areadvected equatorward and experience strong recirculation associated with seasonally varying flows [Chow-dary et al., 2005; Schott et al., 2009]. Clearly distinguishable is the clockwise Great Whirl roughly centered at98N off Somalia, which recirculates both PGW and RSW waters predominantly during the southwest mon-soon [Beal and Donohue, 2013]. At the mouth of the Gulf of Aden, RSW either veers immediately southwardbetween the horn of Africa and the island of Socotra, or is advected westward into the Arabian Sea and intothe interior of the northern IO. The former occurs during the northeast (winter) monsoon, while the latterduring the southwest (summer) monsoon [Fischer et al., 1996; Schott and Fischer, 2000; Prasad et al., 2001].Beal et al. [2000] analyzed historical hydrographic data, and reported a preferred spread of Red Sea Wateralong the African west coast through the Mozambique Channel. In contrast, the lack of direct contours inFigure 2d suggests the main RSW pathway consist first of an equatorial detour before reaching the
Journal of Geophysical Research: Oceans 10.1002/2016JC012676
DURGADOO ET AL. INDIAN OCEAN SOURCES OF AGULHAS LEAKAGE 6

Mozambique Channel. Dense water overflows are generally poorly resolved in z-level models and requirespecial treatment [Legg et al., 2009]. ORCA0083-N06 contains no such special treatment for the overflowsfrom the Gulfs; hence, Red Sea Water entering the Arabian Sea is lighter than expected. Being more surfacebound in the model, waters from the Gulf of Aden is more prone to be affected by the seasonally changingcirculation. And since the summer monsoon dominates the annual cycle, a preferred pathway into the Ara-bian Sea is likely. Furthermore, another difference between our study and that of Beal et al. [2000] is that weconsider RSW as water exiting the Gulf of Aden over the full water column down to 1500 m, while Beal et al.[2000] focused on the spread of ‘‘pure’’ Red Sea Water along its typical density surfaces. Closed contours inthe Bay of Bengal indicate some degree of spreading and residence there.
Along the Equator, water from both PGW and RSW broadly spread eastward, congruent with the SouthEquatorial Counter Current. Thereafter, between 108S and 208S, they flow back toward Madagascar withinthe South Equatorial Current and split. The bunching of streamlines north of Madagascar and through theMozambique Channel highlights the preferred pathway toward the Agulhas Current. Averaged over the 30years of seeding, 1.0 and 3.6 Sv, enter the Arabian Sea from the Gulfs of Oman and Aden, respectively. Inthe model about 0.17 and 0.15 Sv (Eulerian means over 50 years) exits the Persian Gulf at the Strait of Hor-muz and the Red Sea at Bab al-Mandab Strait, respectively. These values fall within the reported observa-tional range of 0.17–0.25 Sv for the Persian Gulf [e.g., Bower et al., 2000] and of 0.05–0.6 Sv for the Red Sea
Figure 2. (a) Mean barotropic streamfunction from the Eulerian fields averaged over the period 1963–2012. (b–f) Lagrangian streamfunc-tion derived only from particles that exited the domain within 100 years; reference set to 0 over Africa (208E, Equator). (c–f) Streamlinesshowing the connection between the initial sections (PGW, RSW, ITF, and TL, highlighted by the green arrows) and the other final sectionsof the domain (black lines). Figure 2b is the sum of the four components shown in Figures 2c–2f. All units are in Sv.
Journal of Geophysical Research: Oceans 10.1002/2016JC012676
DURGADOO ET AL. INDIAN OCEAN SOURCES OF AGULHAS LEAKAGE 7

[e.g., Sofianos and Johns, 2002]. Downstream of both Straits, mesoscale activities enhance the flow further.For example, Fratantoni et al. [2006] roughly estimated an additional 2–3 Sv flow through the Socotra Pas-sage resulting from the propagation of Somali Current rings into the Gulf of Aden. Within 100 years, 0.3 and1.4 Sv exit south of Africa from PGW and RSW, respectively.
Water entering the IO basin across 1148E from the Indonesian Archipelago is concentrated primarily in thetop 600 m between the island of Java and 138S. A shallower secondary core is centered at 218S. Averagedover the 30 years of seeding, 17.6 Sv enters the basin in the top 1500 m (Figure 2e). This value falls withinthe observational range of 10.7–18.7 Sv [Sprintall et al., 2009]. The major source of water at 1148E is throughthe Lombok, Ombai, and Timor Straits, with 3.3, 3.3, and 7.4 Sv, respectively (Eulerian means over 50 years);these values are also in agreement with Sprintall et al. [2009]. The bulk of the water is transported westwardin a narrow band along 118S till about 1008E, and is subsequently broadened feeding different branches ofthe South Equatorial Current. At the Mascarene plateau (598E), two distinct branches of the South EquatorialCurrent are seen at 128S and 168S. The equatorward branch feeds the North East Madagascar Current, andbifurcates flowing through the Mozambique Channel and into the East African Coastal Current where itrecirculates around the tropical gyre. Entry into the northern IO occurs along the African coast. The pole-ward branch feeds the South East Madagascar Current. In the southwest IO, streamlines from the Mozam-bique Channel and south of Madagascar converge in the Agulhas Current, and downstream either exit thedomain or recirculate. Streamlines connecting the ITF section to the TL section indicate water exiting the IObasin south of Australia within 100 years either along the Agulhas Return Current and Subtropical Front (2.7Sv), typically after first negotiating the retroflection south of Africa, or directly via the Leeuwin Current (0.5Sv). About 60% (10.9 Sv) of ITF cross 208E south of Africa within 100 years, with the most direct route beingthrough the Mozambique Channel.
South of Australia (TL), 16.0 Sv entering the IO basin feed the broad westward flow of the south Indian sub-tropical gyre (Figure 2f). Most streamlines originating between Australia and 408S spread either north orsouth of Madagascar, while those south of 408S directly reach the Agulhas Current. Very little penetration ofTL waters is observed in the northern IO, with only �3% being transported across the domain sectionsnorth of 108S. This is likely due to the fact that TL waters are concentrated at intermediate depths (discussed
Figure 3. Similar to 2c–2f, but highlighting only the connectivity between initial sections (green arrows) and 208E, that is no transportacross the other final sections. 0.3, 1.4, 10.9, and 10.6 Sv from the initial sections PGW, RSW, ITF, and TL, respectively, reach 208E within 100years. All units are in Sv; Lagrangian streamfunction reference set to 0 over Africa (208E, Equator).
Journal of Geophysical Research: Oceans 10.1002/2016JC012676
DURGADOO ET AL. INDIAN OCEAN SOURCES OF AGULHAS LEAKAGE 8

further in the subsequent sections), hence less prone to recirculate in the relatively shallow tropical gyre.More than 65% (10.6 Sv) of TL water exit south of Africa, and about 20% (3.5 Sv) recirculate leaving thedomain again between 478S and Antarctica.
Within 100 years, a total of 23.2 Sv from the four source regions reach south of Africa at 208E. Figure 3 high-lights only the pathways connecting each individual component to the section at 208E. Since by design(preanalyses in section 2.2), water entering the IO basin are predisposed to leave the domain at 208E ifallowed sufficient time, the overall pathway depicted in this subset is similar to that shown in Figures 2c–2f.Most notable differences are: (1) Detours north of the Equator are less prominent in the cases of ITF and TL.(2) Recirculation of TL in the southwest IO is much weaker. This indicates that the pathway between TL and208E is for the most part direct and via the South East Madagascar Current.
Figure 4 schematically summarizes the most likely pathways shown in Figure 3 from the four source sec-tions toward 208E and subsequently into the Atlantic. Additionally, the origins of the contributions from ITFand TL are further decomposed. The partitioning of ITF waters coming across Lombok, Ombai, and TimorStraits and reaching 208E within 100 years reflects that of the total transport across the ITF initial section,namely roughly 60% (cf. Figure 2e and the Eulerian means for the transport across the Straits given above).For TL, a large portion of the 10.6 Sv comes from recirculations across the initial section [Sall�ee et al., 2006].The portion originating from between Tasmania and 508S as Tasman leakage (3.1 Sv) commensurate previ-ous findings [van Sebille et al., 2012, 2014; Rosell-Fieschi et al., 2013].
Of the 23.2 Sv that flows across 208E within 100 years, 90% flows either through the Mozambique Channelor southeast of Madagascar. Waters from PGW, RSW, and ITF flow preferably along the South Equatorial Cur-rent and through the Mozambique Channel, while TL waters predominantly either are incorporated withinthe South East Madagascar Current or flow directly westward. After crossing 208E, a little more than 50% ofthe waters proceed to leave the IO basin across GoodHope, the rest retroflects. Of the 12.2 Sv entering theAtlantic, over 96% were previously within the Agulhas Current, and can therefore be referred to as part ofAgulhas leakage (as opposed to the more general term ‘‘Indian Ocean leakage’’).
Figure 4. Schematic of the major pathways of water crossing 208E within 100 years from the Indian Ocean. Of the 23.2 Sv from the four source regions, PGW (orange), RSW (blue), ITF (red),and TL (green), 12.2 Sv enters the Atlantic across the GoodHope section (dashed black line), the rest retroflects (11.0 Sv). Agulhas leakage within the model is 14.1 6 2.2 Sv (see text fordetails). Sizes of arrows vary for clarity purposes. The table details the decomposition of leakage. Dashed arrows itemize the upstream sources of ITF and TL. Transport numbers are in Sv.
Journal of Geophysical Research: Oceans 10.1002/2016JC012676
DURGADOO ET AL. INDIAN OCEAN SOURCES OF AGULHAS LEAKAGE 9

The ratio of water last seen leaving the grey shaded boxes (Figure 4) in the Mozambique Channel (Moz),southeast of Madagascar (SEMC), and arriving directly at 208E without going through the Channel or south-east Madagascar are 5:4:1 (total of 23.2 Sv). There are no direct routes from the marginal seas to 208E within100 years, and water from the Gulfs of Oman and Aden flows either through the Mozambique Channel orthrough the Southeast Madagascar Current. Moreover, comparing the volume transports of particles’ firstentry into the grey shaded boxes and those last seen leaving them, there is a 20–25% chance that waterentering the Channel or the South East Madagascar Current will recirculate within the southwest IO gyre,re-enter the Channel or the Southeast Madagascar Current, before eventually exiting at 208E (also seen inFigure 3). The exception is for water from TL arriving southeast of Madagascar, where recirculation is negli-gible (weaker recirculation in the southwest IO in Figure 3d).
Agulhas leakage is commonly defined as the portion of the Agulhas Current, for example, at 328S that leaksinto the Atlantic across the GoodHope section within 3–5 years, and is intuitive measured in models using aLagrangian framework [Durgadoo et al., 2013; Biastoch et al., 2015; L€ubbecke et al., 2015]. In the present model,employing this definition and over the period 1963–2008, the mean value of Agulhas leakage is 14.1 Sv withan annual standard deviation of 2.2 Sv. This value falls well within the expected range [Richardson, 2007]. Inthe schematic (Figure 4), we show that Agulhas leakage can be decomposed on average as �1 Sv arrivingfrom the marginal seas of the northwest IO and �11 from the Pacific through the Indonesian Archipelago (�6Sv) and south of Australia (�5 Sv), totalling �12 Sv. The missing �2 Sv could stem first from the so-calledcold-water-route at intermediate depths from the south Atlantic [Rimaud et al., 2012; Rusciano et al., 2012] andsecond from the two remaining Straits not covered by the ITF section, namely Sunda and Malacca. As men-tioned in section 2.2, separate Lagrangian experiments were additionally performed for the two Straits. Theycontribute �0.4 Sv to Agulhas leakage. To estimate the portion of South Atlantic origin, a backward experi-ment was performed where particles were seeded along the GoodHope section between Africa and 508S inthe top 2000 m for 30 years and advected backward in time for a total of 80 years to determine their origins.Of the �14 Sv of Agulhas leakage seeded, �0.9 Sv originated poleward of 508S across 08E from the SouthAtlantic, �0.8 Sv originated from below the GoodHope section deeper than 2000 m. Thereby, all the constitu-ents of Agulhas leakage are accounted for.
Typically, 20–25% of Agulhas Current water leaks into the Atlantic. The Eulerian mean Agulhas Currenttransport at 328S (Figure 2a) in the model is �63 Sv (falls within observational uncertain range of Beal andElipot [2016]), of which �14 Sv leaks (classical definition), meeting the expectation. From the total Lagrang-ian streamfunction (Figure 2b) the Agulhas Current at 328S is 33 Sv (of which, PGW: 0.4 Sv, RSW: 2.2 Sv, ITF16.4 Sv, TL: 14 Sv; Figures 2c–2f), meaning that the current draws about half of its water from the foursource regions considered here. The remainder is drawn from water recirculating along the Agulhas ReturnCurrent and Subtropical Front [Lutjeharms and Ansorge, 2001; Lutjeharms, 2006].
3.2. Timescale Across the IO and Into the South AtlanticThe timescales associated with the flow from the source regions toward GoodHope are shown in Figure 5.Each box plot shows the temporal distribution in transport first crossing the respective latitudes and longi-tudes of only those particles that cross the GoodHope section as Agulhas leakage (12.2 Sv in total).
The westward transport of water from ITF and TL is mainly achieved by the mean flow with the core ofthe ITF waters being in the top 500 m and TL below that. Within the IO subtropical gyre between 608Eand 1008E the fastest modeled mean speeds are �0.1 m s21 in the top 500 m and �0.02 m s21 between500 and 1000 m (not shown). Therefore, between the ITF and TL initial sections and 778E, approximately4200 km apart, a particle traveling at these speeds, would take �1.3 years in the top 500 m and �6.7years below that. These values are consistent with the fastest timescales shown at 778E, indicated by thelower edges of the boxes in Figure 5b, where 25% of the transports reach the section in less than 1.2 and6.4 years, respectively. This and the narrow interquartile ranges of the boxes, suggest that only minor stir-ring occurs until 778E.
Waters from PGW being more surface-bound than those from RSW are likely to recirculate and linger in thenorthern IO. The bulk of the RSW waters (75% of it) cross the Equator twice as fast as PGW waters. Detoursin the Bay of Bengal further account for the long timescales in the northern IO. The slowest particles aredelayed by more than 2 decades between the Equator and 208S due to residence within the tropical gyre.
Journal of Geophysical Research: Oceans 10.1002/2016JC012676
DURGADOO ET AL. INDIAN OCEAN SOURCES OF AGULHAS LEAKAGE 10

In the southwest IO south of 208S between208E and 478E, the elongated boxes andextended tails indicate that the recirculatoryand highly eddying nature of the flow thereaffect timescales of water from all origins (cf.Figure 1).
At GoodHope, the fastest waters are fromITF, with 25% of the volume transport arriv-ing within the first decade. The relativelydirect pathways of water of Pacific origin incontrast to those from the marginal seas areevident from the length of the respectivelower tails in Figure 5. About half of thewater transported into the Atlantic from allsources occurs within 25 years. Worth not-ing is that within 50 years, which is thelength of one cycle of model data used,over 75% of the transport across GoodHopeare accounted for.
3.3. Depth Structure of Waters Enteringthe South AtlanticWithin the Lagrangian framework, it is possi-ble to examine the depth characteristics ofwaters of disparate sources along the Good-Hope section as they enter the South Atlan-tic and before. The depth distribution ofparticles that cross GoodHope as Agulhasleakage and were last seen leaving theMozambique Channel (across 208S) or theSoutheast Madagascar Current (across 258S,47–528E) are shown in Figure 6. The meanflow is in both cases intensified along thecoast to the left (cf. Figure 1), in the Mozam-
bique Channel in the upper 500 m and southeast of Madagascar below that. The dominance of waters ofITF origin in the Mozambique Channel (3.8 out of 6.1 Sv) and of waters of TL origin southeast of Madagascar(2.5 out of 5.1 Sv) is evident and in line with the results described in section 3.2 for the entire transportreaching 208E within 100 years. Southeast of Madagascar, there is additionally a clear delineation in the ver-tical between the waters of Pacific origin above and below 500 m. Red Sea Water, as a water mass, is typi-cally found in the southwest IO at intermediate depths [You, 1998; Beal et al., 2000; You et al., 2003]. Here, inthe upper layer above 750 m, waters of RSW origin can be found on either side of Madagascar. At interme-diate depth, however, a sizable amount of RSW water can only be detected in the Channel corroboratingprevious reports [e.g., You, 1998; Beal et al., 2000). The contribution of PGW is small and confined to the sur-face. Within the Agulhas Current, unlike the quasi-instantaneous observations of Beal et al. [2006], whofound distinct water of distinct origins on either side of the current’s core, here, no such clear demarcationis noted (not shown).
Agulhas leakage waters cross GoodHope mostly between 88E and 188E in the top 1250 m (Figure 6a), con-sistent with the broad fan of enhanced sea surface height variability in Figure 1b. In contrast to the rela-tively clear depth separation of ITF waters overlying TL waters within the subtropical gyre and southeast ofMadagascar, at GoodHope (similar to within the Agulhas Current further upstream), these two water sourcesare mixed throughout the water column. Nonetheless, integrated across the section, �4.5 Sv of ITF watersare concentrated in the top 500 m, while the same amount of TL waters are mostly centered between 250and 1000 m. van Sebille et al. [2010] previously examined the question of what determines the fate of Agul-has water crossing 208E. At that longitude, they noted a fairly similar spread in waters leaking into the
Figure 5. Transit time within the Indian Ocean of water eventually enter-ing the Atlantic within 100 years from PGW (0.2 Sv, orange), RSW (0.8 Sv,blue), ITF (6.1 Sv, red), and TL (5.1 Sv, green). Each box plot shows the tem-poral spread in transport reaching the respective lines of longitudes andlatitudes (grey dash lines in Figure 4). The edges of the boxes delineatethe 25 and 75 percentiles, and the medians are indicated as lines acrossthe boxes. The tails encompass 99% of the transport from the respectivesources reaching GoodHope (GH) as part of Agulhas leakage.
Journal of Geophysical Research: Oceans 10.1002/2016JC012676
DURGADOO ET AL. INDIAN OCEAN SOURCES OF AGULHAS LEAKAGE 11

Atlantic and to those returning to the IO. This lent support to the mechanism of ring shedding by loopocclusion [Ou and de Ruijter, 1986] as the dominant factor in determining the fate of water crossing 208E.With the exception of TL, values shown in Figure 4 suggest more water of PGW, RSW, and ITF origins toenter the Atlantic than to retroflect. It is important here to keep in mind the transport still left in the domainafter 100 years of integration, which provides an upper bound of the uncertainties in this discussion (head-ers in Figures 2c–2f). A detailed look at the overall depth distribution at 208E of waters leaking in contrast tothose retroflecting shows a general agreement with the conclusion of van Sebille et al. [2010]. This distribu-tion is unchanged from that upstream within the Agulhas Current. In the upper 250 m all sources but TLexhibit a preference for leaking. This is likely because of the surface-intensified cyclonic relative vorticity[van Sebille et al., 2010]. Below 500 m, waters of TL origin have a slight tendency to more likely retroflectthan leak.
Figure 6. Transport depth-longitude distribution of waters from four origins that exit the Indian Ocean within 100 years across the(a) GoodHope section, and having passed through the (b) Mozambique Channel or (c) Southeast Madagascar Current immediately priorexiting (grey shaded boxes in Figure 4). Color coding given in legend. Each pie chart represents the transport through 18 or 28 of longitude3 250 m, with 1 Sv scaled to represent size of the pie chart in the legend. Pie charts with total transports less than 0.1 Sv are indicated bydots instead. The left plots show the zonally integrated transport as a function of depth, with the black curve showing the sum of the fourcomponents. Partitioning shown in the legend correspond to the total depth-integrated transport of (a) 12.2 Sv (0.2, 0.8, 6.1, and 5.1 Sv forPGW, RSW, ITF, and TL respectively); (b) 6.1 Sv (0.1, 0.5, 3.8, and 1.7 Sv for PGW, RSW, ITF, and TL respectively); and (c) 5.1 Sv (0.1, 0.3, 2.2,and 2.5 Sv for PGW, RSW, ITF, and TL respectively).
Journal of Geophysical Research: Oceans 10.1002/2016JC012676
DURGADOO ET AL. INDIAN OCEAN SOURCES OF AGULHAS LEAKAGE 12

3.4. Water Properties Modification Within the Indian OceanFrom a Lagrangian connectivity perspective, we have investigated thus far the advective pathways and time-scales of water from the source regions to the Atlantic. The question remains: to what extent does the IndianOcean modify the water mass characteristics of the inflowing waters before exporting them? Here we con-sider the memory of the bulk water volume as opposed to that of individual particles or water masses.
Every 5 days, potential temperature (h) and salinity (S) were linearly interpolated from the tracer fields ontoeach particle location. Inherently the tracer field incorporate the simulated and parameterized turbulentmotions of the model, including the air-sea fluxes (described in section 2.1). For the purpose of examiningthe modification of water characteristics within the IO, only the first 50 years of the trajectories were consid-ered. We noted from Figure 5 that more than 75% of water from the Pacific and the marginal seas reachesthe Atlantic within 50 years. Figure 7 shows normalized transports binned according to potential tempera-ture h, salinity S, potential density anomaly r0, and depth of particles at their origins, at the first time theycross meridional and zonal sections across the IO, and finally as they exit across GoodHope within 50 years(sections shown in Figure 4). In the upper plot of Figure 7, the two distributions for ‘‘Init’’ are equivalent.
Waters from the marginal seas of the IO are typically characterized by their high salinities [Beal et al., 2000;Bower et al., 2000; Chowdary et al., 2005]. Initially waters from the Gulfs of Oman and Aden have distinctcharacteristics (h> 208C; S> 35.5), as evidenced by the shapes of the respective distributions (Figures 7aand 7b) being narrow and single peaked. Since only first crossing is considered, the broadening of therespective salinity distributions along 108N indicates that these waters rapidly mix with ambient waters ofthe Arabian Sea. From this point, they become indistinguishable. Between 108N and the Equator, while thepotential temperature distributions of PGW and RSW waters remain alike, a salient freshening is noted. Fur-thermore, the initial h–S signatures of the waters are lost. The densest RSW waters at intermediate depths(r0> 25 kg/m3) however maintain some of their relatively high salinity signatures. During the transit withinthe southern IO, the salinities remain relatively similar, but a gradual cooling occurs. Waters that do notdirectly exit at GH, and instead first recirculate within the south IO subtropical gyre undergo further erosionin properties.
Pacific waters through the Indonesian Archipelago are characterized by their relatively lower salinities(S< 35.5) and broad potential temperature distribution. The direct and fast (cf. Figure 5) westward advec-tion within the South Equatorial Current results in little change in water properties. Upon reaching Mada-gascar along 478E and further west, shifts in distributions are noted indicating mixing (Figure 7c).
Waters entering the IO south of Australia are predominantly confined at intermediate depths between 500and 1000 m, and undergo only slight changes in properties as they transit westward across the basin. Thereduction in amplitude and slight broadening of the distributions (Figure 7d) indicate minor erosion ofproperties and mixing with surrounding water masses below and above.
Within the model, waters from the Gulf of Oman lose their initial characteristics rapidly within the ArabianSea. South of the Equator, their high salinity signature is no longer detectable. This is similar to surfacewaters from the Gulf of Aden. At intermediate depths, a very small amount of high salinity waters from theRed Sea persists into the southern IO (model deficit discussed in section 3.1). In contrast to the rapid decayof waters from the marginal seas, waters from the Pacific north and south of Australia maintain their proper-ties for most of their westward crossing. At GoodHope, the properties of waters originating from the Gulfsand from the ITF are almost indistinguishable (Figures 7a–7c), consistent with the volumetric depth distribu-tion (Figure 6a). In contrast, the properties of waters from south of Australia cross GoodHope almost intact.
In general, water modification is possible by either mixing with ambient waters or via surface fluxes. We firstconsider the former. Salinity fields in the IO along the isopycnals at which water from the four sourceregions enter the basin show that the largest gradients occur in the northern IO (Figure 8). Waters from theGulfs enter a region of sharp contrast in the Arabian Sea favoring immediate isopycnal mixing. ITF entersthe IO basin over a relatively broad range of densities in the upper 500 m. At its surface and subsurface-intensified core (r0 22–23 kg/m3), it enters the basin in regions of weaker salinity gradients. Along isopycnalmixing starts to occur at about 808E and is gradual until Madagascar (478E). Weak gradients in the southernIO, in addition to little to no contact with the surface and weak recirculations in the southwest IO, result inwater from TL transiting the basin experiencing only minor erosion.
Journal of Geophysical Research: Oceans 10.1002/2016JC012676
DURGADOO ET AL. INDIAN OCEAN SOURCES OF AGULHAS LEAKAGE 13

Figure 7. Normalized transports (units Sv/Sv) binned by potential temperature (upper plot, 8C), salinity (middle-upper plot), potential density anomaly (r0, middle-lower plot, kg/m3),and depth (lower plot, m) at the initial positions (Init), at the first crossing of 4 meridional/zonal sections across the Indian Ocean basin (sections shown in Figure 4), and at GoodHope(GH). In the upper plot, the potential temperature ‘‘Init’’ histogram and the ‘‘Init’’ strip are equivalent, in that the horizontal strip is a top view of the histogram. The transport distributionswere normalized by the total transport of each component: (a) 0.1 Sv, (b) 0.5 Sv, (c) 4.6 Sv, and (d) 3.7 Sv entering the Atlantic within 50 years from PGW, RSW, ITF, and TL, respectively.The bin intervals are 0.58C, 0.1, 0.1 kg/m3, and 100 m, respectively.
Journal of Geophysical Research: Oceans 10.1002/2016JC012676
DURGADOO ET AL. INDIAN OCEAN SOURCES OF AGULHAS LEAKAGE 14

Biastoch et al. [2015] calculated the heat transport across GoodHope within a model with different atmo-spheric forcing by integrating full-depth from Africa to the dynamic boundary delineated by the SubtropicalFront. Applying the same method, we obtain 0.35 6 0.04 PW (1963–2012, using annual-mean values), whichroughly agrees with their estimate. Does the heat exported across GoodHope come from the Pacific, or mostlyset by surface fluxes within the IO basin? Waters from the Gulfs and ITF lie predominantly in the upper 250 m(lower plot Figure 7) and therefore experience modifications resulting from surface fluxes. Within the modeland in agreement with observations (not shown), the net surface heat flux exhibits a flux into the ocean inthe northern IO, and flux to the atmosphere within the subtropical gyre and the greater Agulhas Current sys-tem. Since volume is conserved for all particles, integrating under the curves of Figure 7 (upper plot) yieldsnormalized transport weighed potential temperature (TWT) values for the bulk of the water from the four ori-gins. At the source (init), the waters entering the IO have a TWT of 168C (PGW 5 248C, RSW 5 238C, ITF 5 218C,TL 5 108C). Overall, at GoodHope, the waters are 38C cooler (PGW 5 168C, RSW 5 158C, ITF 5 158C, TL 5 98C),suggesting that the IO cools the waters it receives. Figure 7 shows that this cooling occurs over the greaterAgulhas Current system, consistent with the model’s net heat flux to the atmosphere. In the Arabian Sea,north of the Equator, the temperature distributions of PGW and RSW indicate heat gain, which is also consis-tent with the sign of the net heat flux there. This therefore suggests that exchange with the atmosphere overthe IO basin is an important factor determining the heat exported to the South Atlantic.
The fresh water export of the IO is 2192 6 34 mSv (also calculated following Biastoch et al. [2015] and agreewith their value), and for the most part, waters from the ITF salinificate, while those from the Gulfs freshen.
4. Summary and Conclusions
We investigated the mean pathways, transit timescales, and transformation of waters flowing from thePacific Ocean and the marginal seas through the Indian Ocean (IO) on their way toward the South Atlantic.Lagrangian analyses of Eulerian fields from a high-resolution ocean/sea-ice model were performed. Particleswere released over a period of 30 model years along sections that define the entry points of water into theIO basin: at the mouths of the Gulfs of (1) Oman and (2) Aden, (3) north and (4) south of Australia. The
Figure 8. Salinity from the Eulerian fields averaged over density classes representative of the bulk of water entering the Indian Oceanbasin (initial sections, green arrows) for the period 1963–1992 from PGW (r0 5 24.5–25.5 kg/m3), RSW (r0 5 23.5–24.5 kg/m3), ITF(r0 5 22.0–23.0 kg/m3), and TL (r0 5 26.5–27.5 kg/m3).
Journal of Geophysical Research: Oceans 10.1002/2016JC012676
DURGADOO ET AL. INDIAN OCEAN SOURCES OF AGULHAS LEAKAGE 15

experiments were design so as to decompose and quantify the constituents of the exhaust of the IO,namely Agulhas leakage, and to determine whether the IO acts as a passive connector or plays an activerole as a modifier.
Agulhas leakage (AL) in the model is roughly 14 Sv, which is within the observed range (section 3.1). Basedon results from this study, Figure 9 shows the volumetric decomposition and the pathways of the sourcesof AL. The principal contributor of AL comes from north of Australia as Indonesian Through-Flow (ITF, 45%,6.5 Sv). More than half of that water flows through the Mozambique Channel within 5 years, where it ismostly confined in the upper 500 m along the African coast. Waters from Sunda and Malacca Straits werenot explicitly discussed here. They contribute around 0.4 Sv to AL. The second contributor of AL, 5.1 Sv, orig-inates from south of Australia, of which 30% (1.4 Sv) come directly from the Pacific as Tasman leakage, andthe rest from recirculations from the frontal regions of the Southern Ocean. Within the IO, these waters sitat intermediate depths and slowly transit westward within the subtropical gyre, reaching the Agulhas Cur-rent in about 2 decades mostly via the Southeast Madagascar Current (50%). About 20% flows directly intothe Agulhas Current. In the model waters from the Gulfs contributing to AL (1.0 Sv) have similar pathways,which first consist of a detour toward the northeastern IO before subsequently converging within theboundary currents on either side of Madagascar. Deficits in the model result in a negative density bias (ligh-ter than observed) for waters entering the IO from the Gulf of Aden. Therefore, their pathways north of 108Sportrayed in Figure 9 may be overly influence by the seasonally reversing upper ocean circulation there.Consequently, while our results do not suggest a direct route from the Gulf of Aden along western Africa(blue dashed line in Figure 9) as reported by Beal et al. [2000], we cannot discount it as a possible route.Finally, also not explicitly considered in this study, about 1.7 Sv of AL originate from the South Atlantic, pos-sibly from mode water recirculation and from Drake Passage.
Figure 9. Schematic decomposition of sources of Agulhas leakage and their mean pathways within the Indian Ocean. Line/arrow thicknessrepresents the different transport (Sv) contribution (see table in Figure 4). Indonesian Through-flow (red) additionally receives water fromSunda and Malacca Straits. Waters from south of Australia (green) consist of Tasman leakage and recirculations. Waters from the Gulfs(blue and orange), leaving the Arabian Sea share similar properties (represented thereafter in teal). A possible route from the Gulf of Adenalong western Africa is shown but not quantified (dashed blue, see text for details). Finally, Agulhas leakage also receives water from theAtlantic (dashed grey arrow). Grey shaded areas denote region where strongest changes in water properties occur.
Journal of Geophysical Research: Oceans 10.1002/2016JC012676
DURGADOO ET AL. INDIAN OCEAN SOURCES OF AGULHAS LEAKAGE 16

In the Cape Basin, we showed in Figures 6a and 7 that the source waters of AL are well mixed throughoutthe water column. On route, however, each individual component loses their original temperature andsalinity characteristics at different locations due to mixing with ambient waters and/or surface fluxes. Thisoccurs in the Arabian Sea for water from the Gulfs and in the larger Agulhas Current system for waters fromthe Gulfs and ITF (grey shading in Figure 9). However, water from south of Australia experiences very littlemodifications in properties during transit. The location and degree of mixing depend on the characteristicsof the ambient waters such that the stronger the isopycnal gradient, the more potential for mixing (Figure8). Therefore, the IO acts not only as a connector, but also as a modifier of water it receives from the Pacificand the marginal seas.
More profoundly Figure 9 shows that the IO exports 7.9 Sv from the Pacific to the Atlantic within 100 years.From a simple Broeker [1991] circulation point of view, this value therefore corresponds to the strength of theupper cell of the global conveyor belt. In other words, irrespective of the driving mechanisms, at least 7.9 Sv isthe Pacific contribution to the so-called Atlantic warm-water route within this model. Due to the Lagrangianexperiment design and in particular the duration of the integration, this value is given as a lower bound.
Of interest is to understand how an anomaly in properties in one of the sources would be communicatedacross the IO basin. For example, since the turn of the century, Lee et al. [2015] found an increase of about0.2 PW in heat transport across the ITF (interannual heat transport difference 2003–2012), which also coin-cided with stronger through-flow, resulting from a prolonged negative phase of the Interdecadal PacificOscillation [England et al., 2014]. Our model simulates this increase as well. The question is whether (part of)this additional heat could be observed in the South Atlantic within the coming 1–2 decades? We foundhere that in the mean the IO cools and salinificates water coming from the ITF. Furthermore, based on ourresults, the efficiency at which the IO can communicate an anomaly across depends on the amplitude andduration of the anomaly, in addition to the characteristic of the ambient waters. In order to further addressthis question, sensitivity model experiments could be designed similar to L€ubbecke et al. [2015] whoassessed a warming signal transported across the South Atlantic from an increase in transport of Agulhasleakage.
ReferencesAl Saafani, M. A., S. S. C. Shenoi, D. Shankar, M. Aparna, J. Kurian, F. Durand, and P. N. Vinayachandran (2007), Westward movement of
eddies into the Gulf of Aden from the Arabian Sea, J. Geophys. Res., 112, C11004, doi:10.1029/2006JC004020.Beal, L. M., and K. A. Donohue (2013), The Great Whirl: Observations of its seasonal development and interannual variability, J. Geophys.
Res. Oceans, 118, 1–13, doi:10.1029/2012JC008198.Beal, L. M., and S. Elipot (2016), Broadening not strengthening of the Agulhas Current since the early 1990s, Nature, 540, 570–573, doi:
10.1038/nature19853.Beal, L. M., A. Ffield, and A. L. Gordon (2000), Spreading of Red Sea overflow waters since of the thickness influence, J. Geophys. Res., 105,
8549–8564.Beal, L. M., T. K. Chereskin, Y. D. Lenn, and S. Elipot (2006), The sources and mixing characteristics of the Agulhas Current, J. Phys. Oceanogr.,
36(11), 2060–2074, doi:10.1175/JPO2964.1.Behera, S. K., et al. (2006), A CGCM study on the interaction between IOD and ENSO, J. Clim., 19(9), 1688–1705, doi:10.1175/JCLI3797.1.Biastoch, A., J. R. E. Lutjeharms, C. W. B€oning, and M. Scheinert (2008), Mesoscale perturbations control inter-ocean exchange south of
Africa, Geophys. Res. Lett., 35, L20602, doi:10.1029/2008GL035132.Biastoch, A., J. V Durgadoo, A. K. Morrison, E. van Sebille, W. Weijer, and S. M. Griffies (2015), Atlantic multi-decadal oscillation covaries with
Agulhas leakage, Nat. Commun., 6, doi:10.1038/ncomms10082. [Available at https://www.nature.com/articles/ncomms10082.]Blanke, B., and S. Raynaud (1997), Kinematics of the Pacific Equatorial Undercurrent: An Eulerian and Lagrangian approach from GCM
results, J. Phys. Oceanogr., 27, 1038–1053, doi:10.1175/1520-0485(1997)027< 1038:KOTPEU>2.0.CO;2.Blanke, B., M. Arhan, G. Madec, and S. Roche (1999), Warm water paths in the equatorial atlantic as diagnosed with a general circulation
model, J. Phys. Oceanogr., 29(11), 2753–2768, doi:10.1175/1520-0485(1999)029< 2753:WWPITE>2.0.CO;2.Bower, A. S., H. D. Hunt, and J. F. Price (2000), Character and dynamics of the Red Sea and Persian Gulf outflows, J. Geophys. Res., 105, 6387–6414.Bower, A. S., D. M. Fratantoni, W. E. Johns, and H. Peters (2002), Gulf of Aden eddies and their impact on Red Sea Water, Geophys. Res. Lett.,
29(21), 2025, doi:10.1029/2002GL015342.Brodeau, L., B. Barnier, A.-M. Treguier, T. Penduff, and S. Gulev (2010), An ERA40-based atmospheric forcing for global ocean circulation
models, Ocean Modell., 31(3), 88–104, doi:10.1016/j.ocemod.2009.10.005.Broeker, W. (1991), The Great Ocean Conveyor, Oceanography, 4(2), 79–89, doi:10.5670/oceanog.1991.07.Chowdary, J. S., C. Gnanaseelan, B. Thompson, and P. S. Salvekar (2005), Water mass properties and transports in the Arabian Sea from
Argo observations, J. Atmos. Ocean Sci., 10(3), 235–260, doi:10.1080/17417530600752825.D€o€os, K., J. Nycander, and A. C. Coward (2008), Lagrangian decomposition of the Deacon Cell, J. Geophys. Res., 113, C07028, doi:10.1029/
2007JC004351.Durgadoo, J. V., B. R. Loveday, C. J. C. Reason, P. Penven, and A. Biastoch (2013), Agulhas leakage predominantly responds to the Southern
Hemisphere Westerlies, J. Phys. Oceanogr., 43(10), 2113–2131, doi:10.1175/JPO-D-13-047.1.Dussin, R., B. Barnier, and L. Brodeau (2014), The making of Drakkar forcing set DFS5, DRAKKAR/MYOcean Rep. 05-10-14, LGGE, Grenoble,
France.
AcknowledgmentsThe model data used for this studywere kindly provided throughcollaboration within the DRAKKARframework by the NationalOceanographic Centre, Southampton,UK. We especially thank A.C. Cowardand colleagues for making the dataavailable. The Ariane-v2.2.6 Lagrangianpackage used can be obtained fromhttp://www.univ-brest.fr/lpo/ariane/.Altimetry data for model validationwere downloaded from http://aviso.oceanobs.com/. This work receivedfunding from the HelmholtzAssociation and the GEOMARHelmholtz Centre for Ocean ResearchKiel (J.V.D., grant IV014/GH018), andthe Cluster of Excellence ‘‘FutureOcean’’ (S.R., grant CP1412). The‘‘Future Ocean’’ is funded within theframework of the Excellence Initiativeby the DeutscheForschungsgemeinschaft (DFG) onbehalf of the German federal and stategovernments. The authors thankS. Lozier and C. Ummenhofer forhelpful discussions of the results.
Journal of Geophysical Research: Oceans 10.1002/2016JC012676
DURGADOO ET AL. INDIAN OCEAN SOURCES OF AGULHAS LEAKAGE 17

England, M. H., S. McGregor, P. Spence, G. A. Meehl, A. Timmermann, W. Cai, A. Sen Gupta, M. J. McPhaden, A. Purich, and A. Santoso(2014), Recent intensification of wind-driven circulation in the Pacific and the ongoing warming hiatus, Nat. Clim. Change, 4(3), 222–227, doi:10.1038/nclimate2106.
Feng, M., C. B€oning, A. Biastoch, E. Behrens, E. Weller, and Y. Masumoto (2011), The reversal of the multi-decadal trends of the equatorialPacific easterly winds, and the Indonesian Throughflow and Leeuwin Current transports, Geophys. Res. Lett., 38, L11604, doi:10.1029/2011GL047291.
Fischer, J., F. Schott, and L. Stramma (1996), Currents and transports of the Great Whirl-Socotra Gyre system during the summer monsoon,August 1993, J. Geophys. Res., 101, 3573–3587.
Fratantoni, D. M., A. S. Bower, W. E. Johns, and H. Peters (2006), Somali Current rings in the eastern Gulf of Aden, J. Geophys. Res., 111,C09039, doi:10.1029/2005JC003338.
Gordon, A. L., S. Ma, D. B. Olson, P. Hacker, A. Ffield, L. D. Talley, D. Wilson, and M. Baringer (1997), Advection and diffusion of IndonesianThroughflow Water within the Indian Ocean South Equatorial Current, Geophys. Res. Lett., 24, 2573–2576.
Haines, M. A., R. A. Fine, M. E. Luther, and Z. Ji (1999), Particle trajectories in an Indian Ocean Model and sensitivity to seasonal forcing,J. Phys. Oceanogr., 29(4), 584–598, doi:10.1175/1520-0485(1999)029< 0584:PTIAIO>2.0.CO;2.
Hallberg, R. (2013), Using a resolution function to regulate parameterizations of oceanic mesoscale eddy effects, Ocean Modell., 72, 92–103,doi:10.1016/j.ocemod.2013.08.007.
L’H�egaret, P., R. Duarte, X. Carton, C. Vic, D. Ciani, R. Baraille, and S. Corr�eard (2015), Mesoscale variability in the Arabian Sea from HYCOMmodel results and observations: Impact on the Persian Gulf Water path, Ocean Sci., 11(5), 667–693, doi:10.5194/os-11-667-2015.
Joseph, B., and P. S. Swathi (1999), Lagrangian particle transport in the Indian Ocean: A model study tank, J. Geophys. Res., 104, 5211–5224.Jourdan, D., E. Balopoulos, M.-J. Garcia-Fernandez, and C. Maillard (1998), Objective analysis of temperature and salinity historical data set
over the Mediterranean basin, in IEEE Oceanic Engineering Society. OCEANS’98. Conference Proceedings (Cat. 98CH36259), vol. 1, pp. 82–87, IEEE. [Available at http://ieeexplore.ieee.org/stamp/stamp.jsp?arnumber=725649.]
Le Bars, D., H. A. Dijkstra, and W. P. M. De Ruijter (2013), Impact of the Indonesian Throughflow on Agulhas leakage, Ocean Sci., 9(5), 773–785, doi:10.5194/os-9-773-2013.
Lee, S.-K., W. Park, M. O. Baringer, A. L. Gordon, B. Huber, and Y. Liu (2015), Pacific origin of the abrupt increase in Indian Ocean heat con-tent during the warming hiatus, Nat. Geosci., 8, 445–449, doi:10.1038/ngeo2438.
Legg, S., et al. (2009), Improving oceanic overflow representation in climate models: The Gravity Current Entrainment Climate ProcessTeam, Bull. Am. Meteorol. Soc., 90(5), 657–670, doi:10.1175/2008BAMS2667.1.
Levitus, S., M. Conkright, T. P. Boyer, T. O’Brian, J. Antonov, C. Stephens, L. S. D. Johnson, R. Gelfeld (1998), World ocean database 1998,Tech. Rep. NOAA Atlas NESDIS 18, U.S. Gov. Print. Off., Washington, D. C.
Liu, Q.-Y., M. Feng, D. Wang, and S. Wijffels (2015), Interannual variability of the Indonesian Throughflow transport: A revisit based on 30year expendable bathythermograph data, J. Geophys. Res. Oceans, 120, 8270–8282, doi:10.1002/2015JC011351.
Lozier, M. S. (2010), Deconstructing the conveyor belt, Science, 328(5985), 1507–1511, doi:10.1126/science.1189250.L€ubbecke, J. F., J. V. Durgadoo, and A. Biastoch (2015), Contribution of increased agulhas leakage to tropical Atlantic warming, J. Clim.,
28(24), 9697–9706, doi:10.1175/JCLI-D-15-0258.1.Lutjeharms, J. R. E. (2006), The Agulhas Current, Springer, Berlin Heidelberg.Lutjeharms, J. R. E., and I. J. Ansorge (2001), The Agulhas Return Current, J. Mar. Syst., 30(1–2), 115–138, doi:10.1016/S0924-7963(01)00041-0.Madec, G., and the NEMO team (2016), NEMO ocean engine, Note du Pole de mod�elisation, Institut Pierre-Simon Laplace (IPSL), 27, France.
[Available at http://www.nemo-ocean.eu/About-NEMO/Reference-manuals.]Meyers, G. (1996), Variation of Indonesian throughflow and the El Ni~no-Southern Oscillation, J. Geophys. Res., 101, 12,255–12,263.Moat, B. I., et al. (2016), Major variations in subtropical North Atlantic heat transport at short (5 day) timescales and their causes, J. Geophys.
Res. Oceans, 121, 3237–3249, doi:10.1002/2016JC011660.Nauw, J. J., H. M. van Aken, A. Webb, J. R. E. Lutjeharms, and W. P. M. de Ruijter (2008), Observations of the southern East Madagascar Cur-
rent and undercurrent and countercurrent system, J. Geophys. Res., 113, C08006, doi:10.1029/2007JC004639.Ou, H., and W. de Ruijter (1986), Separation of an inertial boundary current from a curved coastline., J. Phys. Oceanogr., 16, 280–289.Prasad, T. G., M. Ikeda, and S. P. Kumar (2001), Seasonal spreading of the Persian Gulf Water mass in the Arabian Sea, J. Geophys. Res., 106,
17,059–17,071.Qin, X., E. van Sebille, and A. Sen Gupta (2014), Quantification of errors induced by temporal resolution on Lagrangian particles in an eddy-
resolving model, Ocean Modell., 76, 20–30, doi:10.1016/j.ocemod.2014.02.002.Richardson, P. L. (2007), Agulhas leakage into the Atlantic estimated with subsurface floats and surface drifters, Deep Sea Res., Part I, 54(8),
1361–1389, doi:10.1016/j.dsr.2007.04.010.Richardson, P. L. (2008), On the history of meridional overturning circulation schematic diagrams, Prog. Oceanogr., 76(4), 466–486, doi:
10.1016/j.pocean.2008.01.005.Ridgway, K. R., and J. R. Dunn (2007), Observational evidence for a Southern Hemisphere oceanic supergyre, Geophys. Res. Lett., 34, L13612,
doi:10.1029/2007GL030392.Rimaud, J., S. Speich, B. Blanke, and N. Grima (2012), The exchange of Intermediate Water in the southeast Atlantic: Water mass transforma-
tions diagnosed from the Lagrangian analysis of a regional ocean model, J. Geophys. Res., 117, C08034, doi:10.1029/2012JC008059.Rintoul, S. R., and S. Sokolov (2001), Baroclinic transport variability of the Antarctic Circumpolar Current south of Australia (WOCE repeat
section SR3), J. Geophys. Res., 106, 2815–2832.Roman, R. E., and J. R. E. Lutjeharms (2007), Red Sea Intermediate Water at the Agulhas Current termination, Deep Sea Res., Part I, 54(8),
1329–1340, doi:10.1016/j.dsr.2007.04.009.Rosell-Fieschi, M., S. R. Rintoul, J. Gourrion, and J. L. Pelegr�ı (2013), Tasman leakage of intermediate waters as inferred from Argo floats, Geo-
phys. Res. Lett., 40, 5456–5460, doi:10.1002/2013GL057797.R€uhs, S., J. V. Durgadoo, E. Behrens, and A. Biastoch (2013), Advective timescales and pathways of Agulhas leakage, Geophys. Res. Lett., 40,
3997–4000, doi:10.1002/grl.50782.Rusciano, E., S. Speich, and M. Ollitrault (2012), Interocean exchanges and the spreading of Antarctic Intermediate Water south of Africa,
J. Geophys. Res., 117, C10010, doi:10.1029/2012JC008266.Saji, N. H., B. N. Goswami, P. N. Vinayachandran, and T. Yamagata (1999), A dipole mode in the tropical Indian Ocean, Nature, 401(6751),
360–363.Sall�ee, J. B., N. Wienders, K. Speer, and R. Morrow (2006), Formation of subantarctic mode water in the southeastern Indian Ocean, Ocean
Dyn., 56(5–6), 525–542, doi:10.1007/s10236-005-0054-x.
Journal of Geophysical Research: Oceans 10.1002/2016JC012676
DURGADOO ET AL. INDIAN OCEAN SOURCES OF AGULHAS LEAKAGE 18

Schott, F. A., and J. Fischer (2000), Winter monsoon circulation of the northern Arabian Sea and Somali Current, J. Geophys. Res., 105, 6359–6376.
Schott, F. A., and J. P. McCreary (2001), The monsoon circulation of the Indian Ocean, Prog. Oceanogr., 51(1), 1–123, doi:10.1016/S0079-6611(01)00083-0.
Schott, F. A., S.-P. Xie, and J. P. McCreary (2009), Indian Ocean Circulation and climate variability, Rev. Geophys., 47, 1–46, doi:10.1029/2007RG000245.
Schulze, L. M. (2016), Freshwater fluxes and vertical mixing in the Labrador Sea, doctoral thesis, 198 pp., Univ. of Southampton, Ocean &Earth Sci., Southampton, U. K. [Available at http://eprints.soton.ac.uk/391105/.]
Sofianos, S. S., and W. E. Johns (2002), An Oceanic General Circulation Model (OGCM) investigation of the Red Sea circulation, 1. Exchangebetween the Red Sea and the Indian Ocean, J. Geophys. Res., 107(C11), 3196, doi:10.1029/2001JC001184.
Song, Q., A. L. Gordon, and M. Visbeck (2004), Spreading of the Indonesian Throughflow in the Indian Ocean*, J. Phys. Oceanogr., 34, 772–792, doi:10.1175/1520-0485(2004)034<0772:SOTITI>2.0.CO;2.
Speich, S., B. Blanke, P. de Vries, S. S. Drijfhout, K. D€o€os, A. Ganachaud, and R. Marsh (2002), Tasman leakage: A new route in the globalocean conveyor belt, Geophys. Res. Lett., 29(10), 1416, doi:10.1029/2001GL014586.
Speich, S., B. Blanke, and W. Cai (2007), Atlantic meridional overturning circulation and the Southern Hemisphere supergyre, Geophys. Res.Lett., 34, L23614, doi:10.1029/2007GL031583.
Sprintall, J., S. E. Wijffels, R. Molcard, and I. Jaya (2009), Direct estimates of the Indonesian Throughflow entering the Indian Ocean: 2004–2006, J. Geophys. Res., 114, C07001, doi:10.1029/2008JC005257.
Steele, M., R. Morfley, and W. Ermold (2001), PHC: A global ocean hydrography with high-quality Artic Ocean, J. Clim., 14, 2079–2087, doi:10.1175/1520-0442(2001)014< 2079:PAGOHW>2.0.CO;2.
Stramma, L., and M. England (1999), On the water masses and mean circulation of the South Atlantic Ocean, J. Geophys. Res., 104, 20,863.Swallow, J., M. Fieux, and F. Schott (1988), The boundary currents east and north of Madagascar: 1. Geostrophic currents and transports,
J. Geophys. Res., 93, 4951.Swallow, J. C., F. Schott, and M. Fieux (1991), Structure and transport of the East African Coastal Current, J. Geophys. Res., 96, 22,245.The DRAKKAR Group (2007), Eddy-permitting ocean circulation hindcasts of past decades, in CLIVAR Exchanges, vol. 12, pp. 8–14. [Avail-
able at http://www.clivar.org/node/193.]Tillinger, D., and A. L. Gordon (2009), Fifty years of the Indonesian Throughflow, J. Clim., 22(23), 6342–6355, doi:10.1175/2009JCLI2981.1.Ullgren, J. E., H. M. van Aken, H. Ridderinkhof, and W. P. M. de Ruijter (2012), The hydrography of the Mozambique Channel from six years
of continuous temperature, salinity, and velocity observations, Deep Sea Res., Part I, 69, 36–50, doi:10.1016/j.dsr.2012.07.003.Ummenhofer, C. C., F. U. Schwarzkopf, G. Meyers, E. Behrens, A. Biastoch, and C. W. B€oning (2013), Pacific Ocean contribution to the asym-
metry in Eastern Indian Ocean variability, J. Clim., 26(4), 1152–1171, doi:10.1175/JCLI-D-11-00673.1.van Sebille, E., P. J. van Leeuwen, A. Biastoch, and W. P. M. De Ruijter (2010), On the fast decay of Agulhas rings, J. Geophys. Res., 115,
C03010, doi:10.1029/2009JC005585.van Sebille, E., L. M. Beal, and W. E. Johns (2011), Advective time scales of Agulhas leakage to the North Atlantic in surface drifter observa-
tions and the 3D OFES model, J. Phys. Oceanogr., 41(1947), 1026–1034, doi:10.1175/2011JPO4602.1.van Sebille, E., M. H. England, J. D. Zika, and B. M. Sloyan (2012), Tasman leakage in a fine-resolution ocean model, Geophys. Res. Lett., 39,
L06601, doi:10.1029/2012GL051004.van Sebille, E., J. Sprintall, F. U. Schwarzkopf, A. Sen Gupta, A. Santoso, M. H. England, A. Biastoch, and C. W. B€oning (2014), Pacific-to-Indian
Ocean connectivity: Tasman leakage, Indonesian Throughflow, and the role of ENSO, J. Geophys. Res. Oceans, 119, 1365–1382, doi:10.1002/2013JC009525.
Wijffels, S. E., G. Meyers, and J. Stuart Godfrey (2008), A 20-Yr average of the Indonesian Throughflow: Regional currents and the interbasinexchange, J. Phys. Oceanogr., 38, 1965–1978, doi:10.1175/2008JPO3987.1.
You, Y. (1998), Intermediate water circulation and ventilation of the Indian Ocean derived from water-mass contributions, J. Mar. Res., 56,1029–1067, doi:10.1357/002224098765173455.
You, Y., and M. Tomczak (1993), Thermocline circulation and ventilation in the Indian Ocean derived from water mass analysis, Deep SeaRes., Part I, 40(1), 13–56, doi:10.1016/0967-0637(93)90052-5.
You, Y., J. R. E. Lutjeharms, O. Boebel, and W. P. M. de Ruijter (2003), Quantification of the interocean exchange of intermediate watermasses around southern Africa, Deep Sea Res., Part II, 50(1), 197–228, doi:10.1016/S0967-0645(02)00384-3.
Journal of Geophysical Research: Oceans 10.1002/2016JC012676
DURGADOO ET AL. INDIAN OCEAN SOURCES OF AGULHAS LEAKAGE 19