indian urban resource millennium assessment by naturalists
TRANSCRIPT

Indian Urban SA- 30 pager
Indian Urban Resource Millennium Assessment by Naturalists (IURMAN) 30 pager Summary, June 2005
RANWA, C-26/1; Ketan Heights, Kothrud, Pune, 411038, India.
Telefax 91-20-5446518 Email: [email protected]; Website: www.ranwa.org
1. INTRODUCTION New millennium is stressed with the news of declining agro productivity &
prices, changing climate, polluted air, water & food, rising poverty & obesity, rising crime & violence, etc. Scientists world-wide are thus assessing the future ecosystem scenarios, to inform the policymakers about choosing the best of scientific & technological options for sustainable development under a global exercise viz. Millennium (Ecosystem) Assessment (MA, www.millenniumassesment.org).
The World Resource Institute (WRI) initiated MA in 2000 along with a dozen
partners such as United Nations Development Programme (UNDP), World Bank, besides several governments & voluntary agencies. It not only involves global overview, but also 20 national or local studies on resource supply (food, water, fuel etc.) & human well being (HWB), in an integrated fashion rather than as usual disparate sectoral reviews.
Indian Urban Resource Millennium Assessment by Naturalists (IURMAN, www.millenniumassessment.org/subglobal.indiaurban.aspx.) is one of the 20 sub-global partners. It is a self-funded associated assessment using similar methodology and sharing its results. The term “iurman” means “longevity” in a traditional Indian language “Sanskrit”, conveying its objective of enhancing “long-term survival”. IURMAN is a nested national scale assessment with focus on Pune-Bombay & Bangalore city local assessments, involving citizens (especially traders, teachers, media & NGOs). Farmers are the key rural stakeholders.
Research & Action in Natural Wealth Administration (RANWA,
www.ranwa.org), an NGO , co-ordinated IURMAN during 2000-2004, with its own focus being on Pune-Bombay urban belt & the themes of “biodiversity, food, fibre, waste, culture & well being”. Its partner Covenant Centre for Development (CCD, www.ccd.org.in) explored the “healthcare & handicrafts” nation-wide. Sustainable Rural Transformation (SuTRA, http://www.mecheng.iisc.ernet.in/~sutra) unit of the Indian Institute of Science (IISc) assessed “fuel” situation & future scenarios nationally, besides of water locally. Data collection involved extensive literature review, including electronic, as well as 17 workshops where 3,000 stakeholders were informally consulted, primarily during herbal healthcare enterprise consultations supported through CCD by Oxfam GB. RANWA’s biodiversity studies were sponsored by Centre for Environmental Education (CEE), Ahmedabad. Ashoka Trust for research in Ecology & Environment (ATREE), Bangalore routed to RANWA a seed grant from MA secretariat. RANWA members voluntarily contributed efforts for literature search & informal consultations.
Urban ecosystems depend on large inputs of energy & material, including water, drawn from vast rural & wild areas, which are largely self-sufficient, but receive negative feedback of urban waste. IURMAN assessed the urban inputs, outputs & their
1

Indian Urban SA- 30 pager
implications for the rural productivity & feedback to the cities. Biological products alone are considered as “natural” products. Soil, metals, minerals etc. constitute the “capital” & not the “interest” or (industrial) “production”. MA terms these products/ processes as “goods/ services”, but villagers think differently, as no charge is paid back.
Consequences of ecosystem & social changes have been “inferred” by examining
the 4 serial components of any system – (1) input, (2) process, (3) output & (4) feedback- which together constitute the “life cycle approach” (www.ilea.org). Who benefits at whose cost was also assessed. This helped in identifying “who” (which stakeholder) prioritises which response option on these 4 aspects and “why” (cost-benefit). It helped in assessing their feasibility (probability of implementation). Not only visible but also “hidden” cost and benefits, both upfront and “long term” were assessed e.g. trade off between CNG imports soon vis a vis retaining local biodiesel option in the next decade, as the former may imply political uncertainty.
Driving forces behind these changes were identified into direct (physical or
apparent causes- land use change, pollution, overuse etc.) and indirect (underlying causes- political, economic, social & technological (PEST) were identified. Response options at each of the 4 life cycle stages and on 4 PEST parameters were discussed with the stakeholders to assess their plausibility and sketch scenarios accordingly.
Absence of separate funding necessitated that user perceptions were documented
as “participant observation” during various ongoing workshops organised by other NGOs & draw post facto inferences. Interview & discussion methods were used during the workshop recess & evenings. Local experts were also consulted separately. Newspaper reports were crucial sources of publicly aired views of various stakeholders.
This 30 page is the summary of the key findings of the assessment arranged in the
order of sections (2) conditions & trends (3) drivers (4) Business As Usual (BAU) scenario (5) LEISA (Low External Input Sustainable Actions) scenario (6) Trade offs/ Synergy (7) Multi-scale variations (8) Traditional & modern epistemology (9) Lessons and (10) Uncertainties. Methodology for each scenario is separately reported. National variation, including from other cities, if any, are mentioned separately.
Fig. 1 Life Cycle Approach PROCESS INPUT OUTPUT FEEDBACK
2

Indian Urban SA- 30 pager
2. CONDITIONS & TRENDS (C & T) 2.0) Methodology
An urban ecosystem does not fix solar energy into biological production, unlike other ecosystems. Besides solar energy & wind, rains etc. climatic inputs; it draws large artificially drawn energy & material inputs from the surrounding villages or other cities. In turn, it produces some industrial products as outputs, besides services that are not physical. It also emits huge amount of air, water & soil polluting material.
The ecosystem energy & material flows were assessed using input-output model that involves several steps during their conversion. Loss or conversion at each step was noted & assigned to respective product or waste. For instance, of the vegetable purchased, 20-30% is unused on an average, & disposed as solid waste. The 70% portion that gets consumed, finally reaches the river as sewage. Thus, vegetable matter was considered as input as well as output, i.e. solid & water wastage. Literature provided gross data, but users informed above subtleties. Per capita values are converted to family/ household values using ratio of 1:5. Any variation in national scale, including case studies from other cities, is also reported.
Demography – Pune city hosts 3.2 million (= M) people i.e. nearly 0.6 M families, in an area of 700 sq. km i.e. 4570-persons/ sq. km. Immigration rate is 1% of the population annually. About 0.1 M families are “rich” (with a car), 0.2 M families are “middle class” (with an owned house 2 wheeler automobile), 0.3 M families are “poor”, that lack above. Of the poor, 0.2 M families- are slum dwellers (30% of total), mostly immigrants from rural areas that accounted for 70% of the population growth during last 2 decades. The rich are engaged in industry or trade & as senior government officers. The middle class is mostly clerical- including teaching etc. while the poor mostly work as labour, often contractually. Situation in other cities is likewise, such that 700 cities with population exceeding 0.1 M now host 28% of the countries’ population, and 10 mega cities, with over 0.2 M citizens each comprise 5% of the population but 90% of the rich and 50% of the GDP.
FOOD 2500 t (1300 T GRAINS, 600 t fruits & vegetables, 600 t milk incl. bakery/ dairy products)
SOLID WASTE 1,000 t (400 t organic- fruit & veg. waste, 500 t paper/ fibre, 100 t metal, cement/brick, glass etc. )
AIR POLLUTION 300 t Carbon (excludes 5,100 t coal burnt far off)
CITY
FOSIL FUEL 5300 t {Coal 5000 t= 10 MU (KWH) electricity; Petrol 120 t (168, 000 L); Diesel 80 t (110, 000 L), Kerosene 6 t (55, 000 L), Gas 50 t, Biomass 50 t}
POLLUTED WATER 250 million litres = 2.5 M t, mixed with 1300 t solid waste as sewage
WATER 650 M litres= 6.5 M t
FIBRE 25 t (paper 17 t, polymer 4 t, jute/ cotton 3 t, leather 1 t)
INDUSTRY PRODUCTS Metal- 5 t Polymer- 1 t Food- 10 t
Fig. 2- Pune City Ecosystem daily flows (input-output)- Population 3.2 M (M= Million) Note- Pollution caused due to consumers goods, fertilisers etc. & due to shops is not included.
Also excluded here are flows of long lasting structural material viz. Cement, Metal, Glass.
3

Indian Urban SA- 30 pager
2.1) Food- The city consumes nearly 2500 t of food each day, which includes 600 t milk, 600 t fruits & vegetables & 1200 t of food grains (cereals, pulses & oilseeds). About 80% of the food is home cooked, with another 10% from hotels & another 10% is processed in to packed food, with lower final volume. Each person consumes daily about 500 g grains, 200 g vegetables & fruits & 200 ml milk. Vegetable & fruits marketing employ 100,000 (3%) of the people (12% of the total earning citizens). Despite quantitative growth, quality, balance & equity in access declined. While 15% of the urbanites are overfed & obese, 28% of slum dweller or neighbouring villagers, often face hunger. Nutrition level declined from 2651 calorie per day per capita due to just 2135 calories due reduced diversity of natural food (Parikh & Radhkrishna, 2002). Packed food is often protein rich but vitamin poor and some (e.g. soft drinks) is even toxic, due to weak standards.
2.2) Water- Pune city draws 650-Million litre daily (MLD) water from various reservoirs (Anon, 2003). The Municipality claims to provide only 135 litre per person daily from Water Supply Department of the State Government who claim it to be 200 litre, totalling to 750 MLD. The discrepancy continues since the pipe installation 2 years ago, due to technical snag! Besides, the canal also supplies 10% water, though it is feared to burst anytime, which may submerge its bank slums. About 20% water supply was cut recently due to inclusion of 23 villages from 238 sq. km recently, which was initially not planned for. Surrounding villages get only 40-litres/ person daily & the farmers agitate against the city overuse during summer. Conflicts occurred last summer when 10% water was diverted for drinking purpose to neighbouring city hit by drought. In Chennai, has sucked groundwater from all neighbouring villages through Metrowater company (Srinivasa & Kozhizzeni, 2004). Farmers often block the water tankers on way to city. Villages outside Madurai have sued the city corporation for encroaching their water sources. Pune suburbs & fringe villages get inadequate piped supply & draw ground water from 107 wells/ bore-wells, besides 350 tankers during summer. Quality is poor on outskirts & canal water turbidity rank is 10- equalling the safety level. Excess built up area has left no open areas for natural percolation, leading to floods each week during monsoon, causing traffic jam & reduced work hours, besides air pollution. Rain Water Harvesting (RWH) is made compulsory for new buildings. In Chennai city, where all houses- even old once- were installed with RWH system hurriedly, only 65-70% turned out to be properly working & yielded the desired 4-month worth water (60,000 litre per family of 5 persons i.e. 120 days at 100 litres per person daily).
2.3) Fuel- Transport consumes about 250 t of petroleum products viz. petrol (50%), diesel (33%) & kerosene (17%). Of the 1.3 million vehicles that dot the city, 74% are 2 wheelers, private 4 wheelers as 12%, buses 8% & 3 wheelers (public transport) 5% (Anon, 1996). Some 0.4 million 2 wheeler owners consume 0.5 petrol daily on an average (i.e. 25 km) for 5 days a week. Besides, 0.2 M auto-rickshaws & 0.1 M cars each consume nearly 3 litre of petrol (30 km) weekly. This implies 150, 000 i.e. 0.15 M litre i.e. 120 t petrol daily. Some 50,000 public transport buses carries daily 0.6 million people, & requires 25,000 litre diesel daily, while private vehicles numbering 4 times more & require 3 times more, implying 100,000 i.e. 0.1 M litre i.e. 80 t diesel daily. Private transport uses about 6 times the fuel (40 passenger-km / litre) regardless of mode (car, or 2-3 wheeler) than the public (250 passenger-km/ litre per bus). Private transport also causes traffic congestion due to higher passenger space. Yet, it is promoted commercially, as a status symbol. In Mumbai city, efficient railway transport carries 60% of the transport load, mostly the poor, at cheap rate, with low emission.
4

Indian Urban SA- 30 pager
About 50,000 auto rickshaws (6-seater diesel type) manufactured by a local company
purchased 2 years ago were legally prevented last year by the petrol driven 3-seater Auto Rickshaw association & the PMC Bus Transport Corporation, who argued that the 6 seater vehicles caused excessive lead & SPM pollution. It got ignored that pollution per capita in 6 seater vehicle is 50% of the 3-seater, though pollutants differ and 6-seater is more convenient & cheaper. Pollution levels have not reduced as per the latest surveys but PMC bus profits have soared again by 20% and 3-seaters benefited. A multinational company, with unverified “eco friendly” claims, fills the niche for diesel autos now. Proposals exist for sky-bus or Metro railway or both in the next 5 years, supposedly to lighten the traffic burden, supposedly to reduce need for private transport, but the cost & efficiency claims are questioned variously, as it had little impact in improving traffic situation in New Delhi & Kolkatta. Many flyovers are often constructed through private agencies at huge costs but traffic congestion continues & pedestrians or cyclists (once the fame of Pune) are bypassed.
For cooking, the poor families (0.1 M) use Kerosene, daily about 0.1 litre, which amounts to 10,000 litres i.e. 6 t. Another 0.1 M poor families, primarily slum dwellers use 500 gm of biomass & waste (twigs, waste paper, plastic bags etc.) for cooking, totalling to 50 t/day. Others use LPG about 200 gm/ day/ family; amounting to 50 t/day, besides marginal microwave oven, claiming to be efficient, ignoring the 30% transmission losses & dirty coal emissions faraway. The hotel & food industry requirements are not calculated separately, for the sake of convenience. Despite similarity elsewhere, wood fuel is commoner in many other less industrialised cities, such as Madurai or even the Kolkatta mega polis.
Electricity use is about 6 unit per house daily, of which luxury items viz. water heater (1 unit), television/ refrigerator (2 unit), fan (1 unit) consume about 70% of the energy, that can be saved. Highly needed tube lights consume much less energy (1 unit). Houses consume about 180 units per month & 0.6 M houses imply 108 M units pm & 1300 MU pa. Commercial demand (both shops and industry) is double this size- 2400 MU, while other demands are negligible- street, water lifting etc. Need for cooler fan is more due to cement blocks & low (3 m high roof) flats in the apartment, that are 2-3 0C hotter than the mud or brick built & mud tile or leaf thatch rural houses, of which the latter are also 4-5 m tall. Thus, while cement/ concrete blocks use less manufacturing energy than bricks, they need more electrical cooling throughout the life span & cannot locally employ more labour. Transmission & distribution losses are as high as 30%, generating 1.4 unit per unit used. The loss is compensated by hydropower. Nuclear, wind & solar power is negligible.
2.4) Fibre- Each family uses about 250 gram of paper (newspaper, packing, stationary) daily, including office/ school-college work, totalling 17 t for the city. Polymer use (Plastic bags, bottles, flasks, packing etc.) use is about 1.6 Kg per month/ family & for the whole city, 4 t daily. Biopolymers & bio-plastic have been invented in 2004 at Ahmedabad & Pune respectively (Martondkar, 2004). Clothing material is purchased at 20 Kg/ year/ family i.e. 80 sq. m, of which, nearly 60% if synthetic & 40% if cotton. Hardly 10% of it is handloom, which is costliest, due to natural comfort & higher social status it confers. Urban total consumption is 3 t/ day. Cloth material required for apparels (cotton/ jute curtains, bed sheets, pillow covers, bags etc.) & packing is 1.4-t/ day per city. Leather bags, shoes etc. amount to 5 kg/ family/ year i.e. half that volume.
5

Indian Urban SA- 30 pager
2.5) Biodiversity- Many plant & animal groups (e.g. (mammals, fish) have lost up to 25% species diversity over the last 100 years or had become vulnerable to local extinction in the Pune urban area (www.ranwa.org/punealive). Urban consumption has threatened 540 medicinal plants species traded nationally that are collected only from the wild, 304 (i.e. 60%) are threatened with one of the above categories of extinction probability (Shankar & Ved, 2003). Urban demand is often fuelled by greed (skin care or beauty products or vitality), which has also cost dearly for the tiger or the rhinoceros. Species loss threatened livelihoods of about 10% people living in and around the forests, wetlands (including costs), deserts and alpine areas that consume or trade these. Wild animals including leopard commonly visit Pune, Mumbai, Chennai, and even Elephants on Bangalore outskirts due to green urban islands amidst barren surroundings.
Coastal fishermen at Mumbai reveal that fish catch & diversity has declined by 30-50% in the few decades due to reduced freshwater flows due to (a) many huge reservoirs built on rivers inland or (b) higher pollution load from the urban sewage river & estuaries or (c) higher pollution by coastal industries or (d) aquaculture farms or recent year round over harvest by the mechanical trawlers. Traditional fishermen fished at low intensity, barring monsoon- the fish breeding season- when fishing was prohibited by religious taboos, matched by demand side restraints on consumption during monsoon.
Mula-Mutha river has been converted to concrete walled gutter 3 years ago,
destroying the frog, crab & fish diversity, besides plants. Threat of industrial encroachment and harvest is growing, as wildlife sanctuaries get de-notified to permit industrial operations e.g. iron ore mining to meet the growing urban demand. Growing electricity demand in the cities (400 UNIT per year per capita) is 5 times above the rural average (125 UNIT), is met by submerging earlier forest, biodiversity and habitation, while the coal emissions triggered climate change.
2.6) Culture- About 10 truck loads i.e. 50 t of cut flowers are sold in the city each
day, to about 100,000 households (including official functions), at about 50 gram/ family. This provides livelihood to about 1,000 poor people, largely women. Some nature lovers visit the hilltops daily or weekly, but eco-tourism within the city is not a business yet. Its economic contribution in terms of health & cultural security is not counted yet but yet the habit is becoming popular day by day. Even at the nominal fee of Rs. 2 per head daily towards maintenance costs, existing eco tourism can be valued at Rs. 0.2 M daily. Besides, hill visitors provide livelihood to nearly 50 vendors of fruits, herbal juice etc. Hill lovers also protested against its mining & conversion to residential area. Unfortunately the river bed was dug & built up, encroached, used for dumping garbage & sewage, besides a road constructed on its banks. Animal pets are rare now, making people more dependent on artificial & non-creative goods such television. Few elders alone know about plants, animals & their significance. But camel rides for children are growing in parks, rare earlier.
2.7) Waste- About 400 t of organic waste gets generated in the city (150 g/ head) daily, comprising of fruit & vegetable skins/ roots, hotel leftover, sugarcane bagass, coir, flower waste etc. Inorganic waste is 60%, comprising mainly of paper, cloth & plastic, while 10% of it is metal, glass etc. Each person generates about 0.45 kg solid garbage daily. Separate collection in/organic garbage efforts failed earlier due to civic inertia. Solid garbage
6

Indian Urban SA- 30 pager
is dumped into wastelands across the urban periphery, though some villages protested against it & may file lawsuit, as also in Bangalore. Organic manure making or herbal household biogas is not a lucrative business yet, but some 50,000 street children are involved in rag picking. Dharavi, a Bombay slum containing 6% of the city population, generates Rs. 30,000 million i.e. 650 million US $ of goods annually- cloths, plastics etc. (Jamal, 2004 b). Landfills would be finished soon. Incineration of biomedical & toxic waste as also miniscule electricity generation from solid waste has begun in Mumbai city. Each mega-polis generates 1000 to 7,000 t of waste daily, causing disease, pollution & conflicts.
Nearly 1300 t of organic waste (1100 t faeces @ 0.3 kg per person per day, 200 t vegetable waste) drains through the river or gets locked up in the septic tanks daily. Another 200 t of inorganic waste (industrial effluents, solid waste) daily pollutes the river. About 30% families possess flush sanitation, 25% septic tanks, and as many lack good sanitation. Similar malady of sewage pollution haunts other cities too (Table 1, Narain, 2002).
Table 1- Nutrient wastage through urban drainage
CITY WASTE WATER MLD N 30 g/ ml P 7.5 mg/ l K 25 mg/ l Mumbai 2,500 73 18 61 Kolkatta 1,400 43 10 36 New Delhi 1,300 38 9 32 Pune 480 13 3 3 Hyderabad 400 11 3 9 Chennai 300 8 2 7
Sewage drain of 2.5 M t through the river has destroyed most of its fish, micro-invertebrate & bird diversity. Such pollution also increases Biological Oxygen Demand (BOD) & reduces costal fishery productivity later. The river is also polluted by some industries inorganically & pollutes 6 times more of clean water downstream, making 70% of the river stretch polluted & unsafe, as also at Delhi. Pollution load grows 4-5 times during festivals, especially idol immersion time, with zinc, calcium etc. deposits. Corporation & State Government announced 55% of the wastewater from 2005, but no infrastructure yet!
Nearly 340 t of carbon fuels are burnt for transport & cooking in the city daily,
producing 850 t CO2, besides other noxious gases. It is 3 times higher than 10 years ago- 250 t daily (Anon, 1996). Yet, it is much less than Mumbai, Delhi or Kolkatta (3,000 to 5,000 t daily). This implies 0.25 kg per capita daily i.e. about 100 kg per head annually. Transport contributed 70% of pollution here & other cities, except a bit less Kolkatta & Delhi due to manufacturing industries there. Delhi hosts electricity generating plants too. Supreme Court had warned 7 cities to reduce pollution to follow safety levels 2 years ago, with in vain. Air pollution exceeded safety level across 58% of Pune city area, in winters (Anon, 2003). Noise pollution is high- 90 decibel, and rarely 120-130 decibel, during the festivals due to firecrackers. Scrap units along the periphery- 500 of them- process city as well as imported waste - about 500 t pa or 1.5 t/ day the whole city. Such toxic waste causes lead or arsenic contamination, and explosions due to explosive material mixed (Jamal, 2004 a).
Electricity burns 0.5 kg of coal daily per person (for 1 unit) & 0.2 t annually
implying 1 kg of CO2 emission daily (10,000 t for the city) & 0.4 t annually (4 million t
7

Indian Urban SA- 30 pager
for the city). Commercial consumption is double that, much of which can be saved, but not the miscellaneous 10%. Annual carbon emission per capita is 0.1 t from local transport, 0.4 t from electricity use, 1 t from local production- marketing. Industrialised production & transport of goods consumed would cause more emission. Urban per capita direct carbon emission is 1.5 t, which is double that of the villagers (fig. 3), who save emission due to local food (10%), fewer industrial goods (20%) & transport (20%).
Fig. 3- Causes of carbon emission
Industry25%
Transport- goods25%
Transport- private15%
Transport- public10%
Marketing10%
TV, fridge, heater10%
Lighting, fan5%
2.8) HWB- Pune city area doubled from 350 sq. km to 700 sq. km since 1950, while
the population has quadrupled from 0.6 to 2.5 Million. It has doubled during the last 10 years itself, though some of its is merely due to annexing more area at the outskirts. City provides higher and/ or (semi-) secured source of income to its denizens compared to rural areas thus causing farm labour migration to cities, also as pleasure seeking professions (e.g. media) earn much more than need-based urban occupations (e.g. trading food & fibre). Year round income & assured supply of food to cities both help the poor labour or even the beggar in minimising seasonal hunger especially during non-agricultural season.
The energy flow in an ecological system or economic system are organised as
pyramids, comprising of functionally segregated tiers. Ecological pyramid consists of many producers- plants- few herbivores, even fewer predators and parasites (Fig. 4). This natural order is reversed by excess application of technology and markets. In the economic pyramid, 10% of the (basis) service sector employees (government, bankers, teachers etc.), capture 20% of the wealth. Services “avoidable” at small scale- defence, media, entertainment, and informatics etc.- become important in large societies, with 10% of the wealth. Parasitic sectors (entertainment etc.) usurp 30 times wages than the farmer/ farm labour (70% population), who are assigned just 25% of GDP (Table 2).
8

Indian Urban SA- 30 pager
Table 2- Economic inequity of occupations Profession Population GDP GDP/ capita Rank Daily Wages Rs. Labour (10% in city) 45 % 10 % 0.2 % 1 25 Farmer 35 % 20 % 0.6 % 3 50 Citizen (elite) 20 % 70 % 3.5 % 18 450
Fig. 4- Contrasting natural and artificial systems- energy and money flows
Parasites- Leeches (0.1%)
Predators- Lion (1%)
Herbivores- Industry Deer (10%) (15%E- 30%W)
Farmers- (70%E, 25%W)
Producers- plants (89%)
Service (10%E- 10%W)
Extra service (5%E- 10%W)
ECOLOGICAL ENERGY ECONOMIC WEALTH Note: E- employed population, W- monetary wealth
Such pro-urban-industrial policies cause negative feedback of higher migration to
cities, growing slums, degrading hygiene and traffic etc. High-income inequality causes high crime rate- theft, robbery, rape or even murder- 12,000-cases/ year. Crime rate of 2% (which affects 10% people as family size is 5) in urban India is 5 times the village rate (Anon, 2002). The rich are not entirely happy or secured though, regardless of external threats. Divorce affects 5% new marriages, which was unheard earlier, and rare yet in villages. The rich- IT professionals- are most unstable: diseased (70%) & infertile (20%), as well known from IT capital of India- Bangalore. Suicides – about 950 annually- 300 per million rates 6 times higher than the rural areas (Anon, 2003 b) & are caused primarily amongst children due to petty frustration & hot temper. Elderly people with traditional wisdom explain such violent behaviour as loss of tolerance towards constrains or nitrogen rich but micronutrient deficient food due to low farm organic inputs.
Non-communicable diseases (NCD) affect 30% citizens due to unhealthy “lifestyle” i.e. unbalanced diet & physical inactivity- leading to obesity & related ailments- diabetes, heart diseases etc. Impoverished air, food & water cause respiratory & circulatory system disorders (Asthama- 10%, Bronchitis- 4%, Eye irritation- 8%), causing over 50% of the middle age (40-60 years) deaths, as prevalent in pre-industrial times (Ghose, 2001). Traditional epidemics (e.g. Dengue) are reviving in cities. Commercial health services weaken citizen’s resilience through external techno-services. Exercises do not get integrated into lifestyles, unlike farmers or rural women. Ailments are thus growing & family healthcare expenses have doubled from 5% in 1980 to 10-12% of the monthly budget today. Medical advertisements promote carelessness (e.g. “shed weight without exercise”), & reducing body resilience. Modern medicines are withdrawn (e.g. Paracetomol) or toothpaste composition is changed every 6 months, claiming to be more “scientific”, unlike the traditional Neem (Azadirachta indica) tree twigs, which are sold in Mumbai & other cities to rural immigrants.
9

Indian Urban SA- 30 pager
3. DRIVERS OF CHANGE
The drivers of change are classified into two types: A. Direct (visible physical stresses): land use changes, overuse and pollution. B. Indirect (underlying societal causes): PEST- Political (law- policy), Economic,
Social, and Technological. The social factors include demographic i.e. population properties and cultural i.e. non-economic or in other words, aptitude. 3.A) Direct Drivers 3.A.1) Land use Change- Farmlands, public (government owned) wastelands, hills, riverbanks, ponds etc. in and around cities have been converted into habitation or infrastructure (roads, bridges, office premises etc.). This leads to:
i. Reduced open spaces and interrupted air circulation causes 2-3°C higher temperature than outside the city, and electrical cooling implies coal emissions.
ii. Reduced soil surface due to higher built up areas has reduced water soaking ability of the city, causing weekly water logging or flooding of roads and home gardens during monsoon, and stress of traffic jam reduces productivity.
iii. high air and noise pollution due to high travel distance between houses & workplaces, as city grows opportunistically with little planning.
iv. Reduced absorption of emission or less oxygen supply due to loss of tree cover. v. Reduced biodiversity due to habitat loss, which is a cultural loss.
3.A.2) Overuse – Overuse or misuse (inappropriate purpose) of products derived from faraway ecosystems leads to loss of their productivity as follows: i. Food products in cities are often processed industrially and either served in hotels or
as packed items each comprising about 10-15% of family expenses, compared to half of it a decade ago. Increased consumption of non-cereal food such as fruits, vegetables (200 gm per day per head) and dairy products (about 300 ml) causes air, water, pollution due to processing industries. It deprives the rural/ urban poor who consume it 50-70% less due to high cost, as ice cream etc. sales rise.
ii. Consumption of sweets such as chocolates or beverages (tea, coffee), addictive products (Tobacco, Beetle nut, alcohol etc.) is rampant in cities (about 25 gm per day per person) compared to villages, causing soil fertility loss and water scarcity in rural farms due to higher organic nutrition and water inputs needed e.g. sugarcane, grapes, tea, tobacco, Betel nut etc. whose monocultures also suffer from pests.
iii. Such industrial food is often nutrient poor, imbalanced diet, toxic due to pesticide residues and hence induces health hazards, much more than decades ago, or at present in the rural areas. Yet higher food consumption often reflects only imbalanced diet and micronutrient deficiency i.e. hidden hunger.
iv. City dwellers get 100-200 litre of water in most of the Indian cities while villagers hardly get 40 litre a day. Profligacy results in water wastage even of drinking water, which gets used for showers, gardens, lawn, and vehicle cleaning etc.
v. Clothing (about 6 kg i.e. 25 sq m per head per year) comprises 50% farm products (cotton yarn, footwear, bags from leather, rubber, jute). Synthetic and plastic (about 100 gm/ day/person) for packing etc. has been polluting air and river.
vi. Commercial promotion of private transport than public one, enhances air & sound pollution 4-6 fold times & causes traffic jam, due to more space used.
10

Indian Urban SA- 30 pager
vii. About 0.5 kg/ day/ head solid waste (about 40% of it is organic) is generated due to enhanced consumption of paper, plastics, electronic gadgets etc leading to high soil and water pollution. Urban sewage, about 0.2-kg/-head/ day also drains away vital nutrients to oceans, causing river pollution and coastal fishery decline. It prevents nutrient recycling to farmlands prevalent 3-4 decades, helping productivity.
viii. Consumerism is causing higher organic wastage such as cut flowers or banana leaves as fashionable leaf, cushion for dining plates in hotels, mimicking traditional practices such as gift of local flowers or dried, served regularly on leaf plates. Such distorted use of plant produces, wastes about 100 grams per day/ person.
ix. Increasing metal and cement use is a future waste burden as landfills are exhausted. x. Reduced use of local biodiversity products in festivals, as decorations or gifts or
religious offerings, exhausted many plants species from house gardens, and many dependent insects e.g. butterflies. Shrinking space for home gardens added to it.
xi. Pollution and climate change may not have affected any ecosystems facets except aquatic biodiversity, but deteriorated the human well being (HWB).
3.A.3) Pollution- Urban pollution does not appear to affect quality or production of any of the local ecosystem provisions- food, water, fuel, culture, except loss of aquatic biodiversity. However, air pollution degrades food sold in the open to the poor by vendors, while fertiliser seepage & pesticide in the villages degrade urban water quality. Of course, pollution is reducing HWB greatly, due to health & mental stresses.
Table 3- Relation between changes in product/ process and drivers of change
Aspect Land use Change Product overuse/ Misuse Food Less local grains,
milk, more vegetable More processed products cause imbalanced diet, hidden hunger or toxicity
Water Reduced drainage, enhanced flooding
High sweet/ addictive urban consumption (tea, tobacco, sugar, wine, betel nut) causes rural water scarcity
Fuel Increased fuel for air cooling, transport
Private transport enhancing fuel consumption 4-6 times than public transport
Fibre More paper, plastic, synthetic, yarn consumption Waste Greater distances,
more fuel & pollution Higher organic and more so inorganic waste, pollution of air, soil and water, land fill
Biodiversity Loss due to habitat encroachment
Urban reptile diversity not only hunted for trade but even remote forest diversity traded in cities for skin, teeth, nail
Culture Fewer home gardens, hills, water bodies
Water bodies used for recreation boating more polluting than erstwhile fishing.
Human well being (HWB)
Over proximity, less personal relationship
Food toxicity affects health. High urban elitist consumption deprives villages & the city slums.
3.B) Indirect Drivers 3.B.1) Demography – Population has grown nearly 4 times in most cities during the last 5 decades, about 30% of it due to population growth of erstwhile urban families and about 70% due to immigration from rural areas, primarily as slum dwelling urban labour. Population growth has intensified land use burden and problems there of.
11

Indian Urban SA- 30 pager
3.B.2)Technology - Transport, engine, waste water treatment, food processing and solid waste management segregation of organic and inorganic wastes, composting of organic waste, incineration or landfill of inorganic wastes have remained primitive and inefficient, enhancing the air, water, soil, and noise pollution. Some occupation such as forest labour, Bamboo artisans, fisher etc. eroded as their resources were cornered, overestimated & exhausted by the industrial overuse of timber, paper, fish, medicines etc. (Gadgil and Guha, 1995). Inefficient technology is preferred as being cheap, due to lack of penalty for the pollution caused as well as lack of incentives (seed grants, concessions etc.) for the green technology e.g. public transport, waste recycling. 3.B.3) Economy –Present economy only values visible and cash benefits, while ignoring hidden and in kind costs e.g. health, costs which are externalised. Since economic policy is tailored to maximise profits, economy grew faster (7% pa) during 1993-2002 post reforms (Liberalisation, Privatisation, Globalisation) than the decade before (5%). However, while urban employment grew by 2.1% during post-reform decade, rural employment grew hardly 1.1% (Parikh & Radhkrishna, 2002). Agricultural labour has reduced now, showing -2% growth, due to “selective mechanisation” of operations such as harvesting! Artisans (potter, cobbler, blacksmith, waterman etc. comprising about 10% of the labour) reduced. 3.B.4) Politics - Green technology is ignored due to lack of regulatory framework. Lack of political largely stems from lack of public awareness and inaction. Environmental policy is the national prerogative & local bodies cannot often change those. 3.B.5) Culture – Traditional culture of knowing, using, respecting and even worshipping biodiversity, water, soil etc. has eroded modern education on the other hand has not able to teach to students how using more mechanized, personalized products is eco-destructive and socially inequitable than handmade, public system goods, which pollute less and provide more livelihood opportunities. For, the education syllabi suit industrial countries with low population, which also benefits here the urban, industrial elite. Commercial consumerism through informal education (media), disables society to recognise its impacts on remote land, water and air and future generations e.g. declining farm productivity, aquatic biodiversity loss, climate change etc.
4. BUSINESS AS USUAL (BAU) SCENARIO- 2020
4.0) Methodology The “hi tech” scenario developed (resembling the “techno-garden” from the global assessment) is in fact Business As Usual (BAU) scenario up to the year 2020. It also reflects many elements of Global Orchestration (GO) scenario of the MA. Changing the technological and economic drivers, in accordance with their historical trend but with sharper focus, develops BAU scenario. Technology is less advanced but comparable to that of the developed world. BAU believes that technology can solve all the problems. Literature provided future projections data, for both Pune & nation (Kalam & Rajan, 1998). Obtaining views of the stakeholders filled the data gaps. Literature projections were often linear extrapolations, but cyclic or sinusoidal model estimates are made here. Such “curvilinear” path incorporates any negative feedback that may retard or revert the present trend. For instance, increasing traffic jam or rising fuel price could force people
12

Indian Urban SA- 30 pager
to prefer public transport over the private mode & curtail fuel consumption & costs. BAU scenario sketch was then discussed with experts for improvements & finalising. The present- independence development paradigm in India can be termed as “Techno-Commercial (TC)” as it reigned in S & T as well as markets to meet most of the personal & social needs. TC changes surpassed other social changes (non-economic i.e. cultural e.g. educational or political e.g. land reforms, decentralised governance) that constitute BAU. Indian Government has made TC plans for 2020 under the title- Providing Urban Amenities to Rural Areas (PURA), a hypothesis presented by the president (Kalam & Rajan, 1998). But BAU growth could be slower than PURA, due to historical social inertia & red tape. Assumptions underlying the BAU (TC) scenario include:
a) Economic growth improves Human Well being (HWB) by enabling all the earning people to buy commodities/ services they need.
b) Hi tech growth promotes cleaner, greener and easier lifestyles. c) Markets, not the government or people on their own, can meet basic needs. d) Some eco-friendly law and policy would evolve to reduce visible pollution. e) No major changes occur in land use, abiotic (minerals, fossils) resource use,
taxation & education, due to stakeholder resistance. f) Urban industries capture rural markets by luring customers, than local products.
Demography – Pune city would host 4 million (= M) people i.e. 25% more than today,
implying 0.8 M families, in an area of 700 sq. km. Population density of 5741 person/ sq. km then would be 25% higher than today. About 0.2 M families would be rich (with a car), 0.2 M families as middle class (with an owned house & 2 wheeler automobile), 0.4 M families as poor, without the above. Half the poor– 0.2 M families- would be slum dwellers. The rich would be in industries, trade or government. The clerics would constitute the middle class while the poor would be the labour. Demographically,
a) old, retired persons could comprise 40% of population than 30% today, as children would be fewer & migrate elsewhere for career than family.
b) about 50% urbanites would live in slums than 40% today, as unorganized labour (transport, trade, garbage and scrap disposal, sanitation, fitting etc.)
4.1) Food- The city would consume nearly 3000 t of food each day, including 700
t milk, 700 t fruits & vegetables & 1600 t of food grains (cereals, pulses & oilseeds). About 60% of the food home cooked, with another 20% would be hotel served while another 20% as packed food. However, as national food production would reduce by 20% due to declining farm productivity (Anon, 2004 b), arising from non-replenishment of biomass inputs, diversion to cash crop & shortened and irregular rainy season. Food will be costlier & consumption would reduce by 15% to 0.4 kg grain per capita daily. Slum dwellers, labourers face more hunger. Vegetables & fruits production would reduce by 10-15% to 180 gm & milk to 180 ml. Not only quantity but also quality, balance & equity in access would decline. Obese urbanites would rise from 10% to 15% (numbering 0.6 M), but double that number- 30% of the people, would have to go bed hungry. Nutrition level would further decline from 2135 calorie per day per capita to just 1850 calories or so due reduced intake. Food products quality control would improve.
13

Indian Urban SA- 30 pager
4.2) Water- Pune city daily water withdrawal would have reduced by 20% to 550 MLD due to cuts violently demanded by neighbouring farmers and villagers, while per capita consumption would drop by 35% to 130 litres per day. Surrounding villages would hardly get 30 litres/ person daily, as prevalent around Bangalore city today, leading to protests, conflicts & water theft by puncturing pipes or looting tankers en route, as happening today at Chennai city. Ground water extraction would be confined to 67 wells & bore wells, as 40 would have been over exhausted by 2010. Yet, present over-draw of 20% would escalate to 35%. Nearly 450 tankers could be providing water to many suburbs that lack adequate piped water supply. Weekly floods during the monsoon, traffic jam, reduced work hours would continue to enhance economic loss from 15% to 25%. Situation nationally could be grim too, due to scarcity (Gupta & Deshpande, 2000).
4.3) Fuel- Transport would continue to consume similar level- 260 t- of petroleum products but changed ratio: petrol (40%), diesel (40%), Biodiesel & Ethanol (each 7 %); Kerosene (4%). Ethanol production could be high but sales would be limited due to prohibitive costing. Biodiesel yield potential is overestimated today at 200 M t pa nationally. But planting even 50 M ha could generate only 50 M t seeds & 12 M t oil. It is only 15% of the present demand (60M t) & 12% of the demand of 90 M t in 2020. Besides, 30 M t manure generated nationally would replace 30% chemical fertilisers. Passenger load would increase 30% (same as population) but enhanced public transport would reduce traffic load by 10%. Number of vehicles could have declined by 35% to 0.9 M due to high costs, traffic jam, accidents etc. Nearly 0.1 million automobile owners would have discarded using it. About 0.4 million 2 wheeler owners would consume 0.5 petrol daily on an average (i.e. 25 km) for 5 days a week, implying 100 t petrol daily. About 0.25 M auto-rickshaws would be largely diesel based then, as also 0.1 M cars would each consume nearly 2 litre of diesel (20 km) weekly, implying 100, 000 i.e. 0.1 M litre i.e. 70 t diesel daily. Public transport buses would carry daily 0.8 million people, & require 40,000 litre diesel daily. Private vehicles (4 times more) would need 2 times more diesel. This implies 120,000 i.e. 0.12 M litre i.e. 100 t diesel.
Fossil fuel supplies could be scarce & costlier globally (Ehrenfield, 2003), also
due to political instability in the Gulf. Indian East coast prospective deposits found in 2004, to be harvested since 2007 would increase self-reliance, but also enhance emissions & climate change risk. Importing oil from Venezuela would have been successful but prove costly & emit more carbon during transport than imports from Gulf. Sky-bus and Metro railway could have lightened the traffic burden, emissions, costs etc. by below 30% as at Delhi or Kolkatta today. Such electronic public transport vehicles would cause coal & gas based thermal generator pollution faraway, nullifying household electricity savings. Of the poor families 0.2 M using Kerosene, daily about 0.1 litre, which amounts to 20,000 litres i.e. 12 t- double . Another 0.1 M poor families, primarily slum dwellers would continue to misery of using 500 gm of biomass & waste (twigs, waste paper, plastic bags etc.) for cooking, totalling to 50 t/ day, causing continued health hazard. The medium & the rich class- 0.3 M families- would use 25% less LPG due to high cost, about 150 gm/ day/ family; amounting to 50 t/ day for the city as of today.
14

Indian Urban SA- 30 pager
Electricity use would drop by 15% to 5 units per house daily, due to efficient technology & after costly privatisation. Air conditioners sales could not grow. Houses would need 150 units per month & 0.8 M houses imply 120 M units pm & 1440 MU pa, only 10% higher than today, despite to 30% population growth. Commercial electricity consumption (shops) would also halve to 50% of the housing. Hydropower would reduce- 15% of the demand than 20% as of today, as demand grows & reservoirs get silted. Nuclear power production around Mumbai would decline initially due to short supply of fuel from Russia but restored partially later after claiming carbon credit under the Kyoto protocol. Wind, solar power share in the energy provision would rise 2% each as Energy Legislation 2003 permits decentralised production & supply.
4.4) Fibre- Each family would use 20% less paper (newspaper, packing, stationary) due to high costs- 200 gram daily, including office/ school-college work. Digital technology may save some paper- totalling 15 t for the city. Biopolymers & bioplastic would have replaced synthetics by 20-30% using the technologies patented at Ahmedabad & Pune respectively during 2004 (Martondkar, 2004). Polymer use (Plastic bags, bottles, flasks, packing etc.), use would continue to be 1.6 Kg per month/ family but rise 30% at the city level to 4 t daily. Of this, 25% i.e. 1 t could be biodegradable, its further growth curtailed by the cost & demand-supply gap as tree plantations need 5-10 years to grow to harvesting stage. Clothing would be 20 Kg/ year/ family i.e. 80 sq. m as of today, but nearly 80% of it synthetic & 20% cotton, which will be primarily exported, despite pest attacks & competition with cheaper Chinese imports. Cloth & plastic consumption would 4 t/day each. Apparels & packing would be half the above- i.e. 2 t/day per city, in addition to plastic & other synthetic fibre used for packing. Leather bags, shoes etc. amount to 5 kg/ family/ year i.e. half of the above volume- 1 t/ day.
4.5) Biodiversity- About 10-30% of the species may be lost in the next 20 years due to loss of 30-40% of the present (i.e. 80-85% of the original) habitat area in city, as also nationally. Protected area network that covers just 4% of the original habitat area nationally & would not lose much area, but lose 5-10% species confined to special, marginal habitats. About 5-10% of the wild plant species & 70% of the agro-biodiversity (10-20% compared to 100 yeas ago) might go extinct due to rainfall vagaries. Urban market/ export demand would cause extinction of another 5-10%. Aquatic biodiversity would be lost most severely: 25-30%. Gardens & avenues may retain some biodiversity.
Incentives underlying the present conservation strategy would have proved to be inadequate, diluted and hence, failed. Not only the forest department driven protection and restoration would fail, but even cash driven community programmes would run into problems regarding benefit sharing ratio. Isolated recreation and research benefits would be too inadequate to enthuse the remote “globaphile” urbanites for monitoring and conservation. Benefits from commercial use of plant diversity and traditional knowledge in urban/ global health or agricultural industry would be too insignificant to serve as incentives for communities and government for continued conservation.
4.6) Culture- About 10 truck loads i.e. 50 t of cut flowers would continue to be sold in the city each day, to 50% fewer 50,000 households than today, but many more
15

Indian Urban SA- 30 pager
offices and functions. It would provide livelihood to about 1,000 poor people, largely women. More nature lovers would visit the hilltops daily or weekly, and eco-tourism inside the city would be a big business worth Rs. 1 million at Rs. 10 per person per morning trail. Its economic contribution in terms of health security & cultural satisfaction would be recognised as much higher. Hill visitors would provide livelihood to nearly 10 times (500) biodiversity product vendors than today. Hill lovers would protect the last refuge against mining or building, after having lost 25% of the present area. Remaining water bodies would be turned into water park- a sprawling business, which would curtail further dumping of garbage and encroachment. Yet, the city culture would have changed to rural kind with weekly shanties as happening since 2001 as at Chennai to provide cheap goods for the immigrants from village, compising60% of the citizens.
4.7) Waste- People would realise that 30-40% of the energy & materials get
wasted because city grows randomly. At least 70% of the wastage (overuse & pollution) could be avoided if city land use is planned to minimise the workplace- residence distance, recycle organic wastes into farm manure, promote public transport, educate children to save energy, material & water by promoting conservation culture over consumerism i.e. learn to prioritise need over luxury items & using shared resources.
About 400 t of organic waste will continue generated in the city (125 g/ head- less
by 20% from today) daily, would be turned into organic manure under the Pune-Bremen city collaboration underway since 2001. Recycling business would employ 0.1 M slum dwellers. Inorganic waste would be 70%, due to higher population and social inertia of paper, cloth & plastic, while 10% of it is metal, glass etc. Each person would generate 20% less waste due to high cost- about 0.4 kg daily. Plastic waste would reduce by 35% due to degradable bio-plastic & biopolymer for computer industry. Separated in/organic garbage collection scheme would be revived- with 50% success- due to education to school eco clubs. Garbage dumps in the wastelands would be moved 30-50 km away from the city, as peripheral villagers had protested against the sumps earlier. Landfills would have finished but cement, concrete, metal waste would grow unmanageably as houses built during 19980-95-boom period become fragile and collapse. Nanotechnology would be attempted for their disposal with mixed results. Incineration of biomedical or toxic waste and electricity generation could meet 2% of city energy needs.
About 400 t of organic waste i.e. 50% of the 1700 t of organic waste (1400 t faeces, 300 t vegetable waste) out of total 1900 t of total waste drained through the river would be recycled as organic manure. New housing colonies built after 2005 would be compelled legally to install DEWAT (Decentralised Wastewater Treatment) system (Srinivasa, 2004), in response to such request from citizens’ groups and farmers organisations enlightened by the MA process. Biological Oxygen Demand (BOD) would drop by 50% (1.1 mg/l) & costal fishery productivity restored 50%. Inorganic pollution would have not increased much (200 t as at present) as not many new industries started and existing ones could not produce more goods. About 80% of the river stretch was thus left much polluted. Pollution load would grow 3 times during festivals, especially idol immersion time, leading to deposits of zinc, calcium etc. but not 5-6 times as feared earlier. The savings could be achieved due to more public functions, less toxic materials used etc.
16

Indian Urban SA- 30 pager
Noise pollution enhanced to 100 decibel on an average, but maximum level reduced to 110 decibel, due to strict regulation of firecrackers and band etc.
Carbon fuels would be burnt only 10% less than today- 325 t daily, producing 775 t of CO2, (3.5 M t pa) besides other noxious gases, only 8% less than today. Repeated PIL could hardly reduce air pollution by 25%, yet above safety levels. Carbon emissions from electricity plants would reduce 15% per capita by replacing 30% with coal with gas. Another 15% would be saved in distribution. Total emissions would continue at 4-million t/ yr, due to 30% growth in consumers’ number. Carbon emission from electricity use would be 30% lower per capita than today. Each house would cause burning of 12 kg of coal daily & 4 t annually (0.8 t/ capita). Carbon emissions per capita annually would grow marginally above the present value of 10 t pa, despite Clean Development Mechanism (CDM) projects under the Kyoto convention, due to continued trade and transport. It would be too late for too few people to realise that technology alone cannot solve the societal problems without comprising addiction to comforts and luxuries. Toxic waste imports & processing would be curtailed by 25% by implementing the international Basel convention.
4.8) HWB- Economy grew faster (7% pa) until but likely global glut by 2010 due to conditions similar to 1940s: (a) supply exceeding the demand due to overestimate & hype (b) massive transfer of capital across nations & sectors due to free market. While urban employment continued to grow by 2% during under the Employment Guarantee Act, 2005, rural employment growth rate doubled (2 %) from productive work such as soil & water conservation. Agricultural labour reduction rate would halve to 1%: as agro-business grew initially. Traditional artisans (potter, cobbler, blacksmith, waterman etc. comprising about 10% of the labour force) slightly revived after urban industrial good became costlier after 2010 with fossil fuel scarcity. Crime rate doubled to 5% (which affected 25% people considering family size of 5) of the population i.e. 9 times than in the village. Conflicts with villagers over water & food sharing grew weekly.
Developed countries had prevented the farmer’s migration to cities by paying
huge subsidies to farmers, unaffordable in ecosystem culture of India. Also, subsidies were curtailed in the developed countries due to World trade Organisation (WTO) guidelines & MA recommendations. Few farmers remained in the field & climate vagaries by 2010 declined food production by 10-15%, compelling food imports. However, food scarcity was global as per the warning by FAO during 2002. Trade reduced as families & nations ensured their food security first. Farmers realised that they can survive without the urban gods & services, by consuming their farm grown food. Millets & tubers could still be produced due to their hardy nature, in about 30% of the dry lands, as happening today in Deccan plateau. Low produce hardly sufficed the local people, who avoided trading it, despite initial luring by the cities that starved later.
Divorces affected 50% of the marriages, as with developed world today. The rich-
IT professionals- the yesteryears’ heroes were the worst sufferers due to market crash, besides burden of disease (80%) & infertility (40%). Suicides – about 1500 annually- 500 per million rate- were 6 times higher in cities than the rural areas. Non-communicable diseases (NCD) had been more widespread than the communicable ones, affecting 60% urbanites due to unhealthy “lifestyle”. Obesity was rampant amongst 50% of the people
17

Indian Urban SA- 30 pager
caused diabetes, heart diseases etc. besides revived epidemics. Misplaced focus on hi-tech, hi-cost cure, than preventive healthcare has skyrocketed healthcare expenses to 25-30% of the budget. Many modern medicines were found hazardous & withdrawn. Traditional medicines were mostly extinct & unavailable. Food scarcity induced raids of hungry nomadic people, leading to bloodshed. Countries also began fights over water & food. Uncertainty, insecurity, inadequacy that the industrial civilisation had forgotten, soon revived. Illusion of prosperity on a weakening agricultural foundation could not last long, as it began to destroy itself due to negative feedback, like Narcissus or Black hole that represent unavoidable attraction towards self-destruction.
5. LOCAL & APPROPRIATE (LEISA) SCENARIO
5.0) Methodology BAU scenario developed assuming that prior planning is more important societal behaviour than environmental or human surprises (e.g. political instability, economic crash etc.). There is only slight change in the drivers of present development paradigm- fuel, technology, economy, & purpose. It is safer to develop an alternative scenario without such assumptions. While prior planning is necessary many non-plan factors can change societal behaviour. Hence, one must constantly monitor the changing nature & culture every 3-5 years & modify survival strategy from time to time. Such adaptive management scenario (also in the MA global parlance) is termed here as Low External Input Sustainable Actions (LEISA) strategy. It combines the best of modern science with Local Resources & Traditional Skills (LRTS). The purpose here is also not growth but surviving decently. It is a direction or path, but not a targeted plan, which may be unachievable due to prevailing “noise” i.e. disturbance, today & henceforth. LEISA is based on cyclic path of social and natural behaviour, wherein either conditions return to the same state after much change e.g. organic farming replacing chemical farming or herbal medicines replacing the synthetic or recent decentralisation policy. LEISA makes the following assumptions underlying the current trends:
1) Growing number of unemployed youth adopt innovative survival strategies including handicraft products on one hand and on the other, theft or robbery.
2) Growing food and water scarcity would trigger conflicts between the rich and the poor, cities and villages, between river basin state and even across nations that share large rivers or their hill catchments.
3) Imported fossil fuel supply may reduce and climate change (more droughts, cyclones, irregular rainfall timing etc.) would reduce agro- productivity and trade. Thus people will depend more on local resources, technologies or purposes.
4) Employment Generation Act, 2005 will lead to socio-political realisation that minimising machine could enhance human employment.
Demography – Pune city would host only 3.5 M i.e. 10% more than today,
implying 0.7 M families, & not 4 million (= M) people as projected linearly, as urban growth is retarding since 1995. The reversal would enhance due to (a) deteriorating employment, health, hygiene & traffic in the cities would irritate rural immigrants (b) employment guarantee act, 2005 promotes on farm employment for more villagers, avoiding emigration to cities for jobs (c) rural population growth rate would be haled to
18
Indian Urban SA- 30 pager
1% like cities due to similar constraints- rising stresses, sedentary lifestyle, infertility, rising mid-age mortality, obesity etc. Government of India estimated in 2000 that India’s population would peak during 2060 at 1600 million. However, estimate was revised during 2004 at 1350 million by 2035, due to above constraints (Rajlakshmi, 2004). Population density of 5000 person/ sq. km in 2020 would be 14% higher than today. About 0.2 M families would be rich (with a car), 0.2 M families as middle class (with an owned house & 2 wheeler automobile), 0.3 M families as poor, who lack above facilities. Over 70% of the poor– 0.2 M families- would be slum dwellers.
5.1) Food- Pune city would consume only 2500 t of food each day, including 600
t milk, 600 t fruits & vegetables & 1600 t of food grains (cereals, pulses & oilseeds). Food production per capita would reduce by 15% than today, to 0.4 kg grain per capita daily, as also in the BAU, because shifting from chemical to organic farming will reduce production initially, until the agro-ecosystem recovers. Similarly, vegetables & fruits consumption would reduce by 10-15% to 150 gm & milk to 150 ml. However, hunger amongst the slum dwellers would not be as much as with BAU, due to higher fresh food availability due to low agro- industrial growth, including meat and poultry. Health would improve by eating less but diverse local food and observe fast weekly. Quantity would decline, but quality, balance & equity in access to food would enhance. Higher handicrafts based employment would increase purchasing power of the poor. Food storage and public distribution system would be localised & respond faster. Overfed & obese citizens number would halve to 5%. Further, due to high crude oil costs, food will be consumed locally instead of nationwide transport. Costlier fertilisers would be used scarcely, and intercrops, farm bund trees & cattle would revive again. Costlier electricity and people enlightened about the health value of fresh food would hardly leave any milk for processing. Eco-damaging products would reduce: ice cream, chocolates, and cheese etc. availing fresh food to the poor.
Reduced monoculture would restore agro-biodiversity, more farm bund trees &
fodder crops, legume intercropping etc. Resultant higher organic manure, and micronutrient rich food would avoid “hidden hunger”, unlike today. Farm livestock would revive as economical, for milk and manure production, as sustainable compared to dairy or meat production. Higher agro-biodiversity & manure rich soil would make crops healthier &less vulnerable to pest attack, unlike monocultures today on nutrient poor soil. Ago-biodiversity would be lower than 6 decades ago as crop varieties are lost. Nevertheless, since millets and pulses are more drought and flood resistant than rice and wheat, local food security will prevail despite erratic rainfall. About 40% citizens would also grow kitchen vegetable gardens. Peoples’ mentality could be peaceful due less consumption of temper heating nitrogenous foods (meat etc.) and cash crops- onion, garlic, tomato.
5.2) Water- Pune city daily water withdrawal would have reduced by 20% to 550 MLD due to cuts violently demanded by neighbouring farmers and villagers, while per capita consumption would drop by 35% to 130 litres per day, as perhaps in reality today. It could reduce to 100 litre in reality then. Surrounding villagers would get daily 40 litres/ person, 25% more than the BAU scenario, thereby minimising the conflicts & water theft en route. Ground water extraction would be minimised, & many wells would function, as only 10-15% water demand would be met from these, unlike 20-30% as at present. It
19

Indian Urban SA- 30 pager
could be sustainable as recharge would continue to be low due to high built surface and few open soil sinks. Tankers providing water to suburbs facing drinking water shortage would reduce from 300 to 200, due to RWH, bore well revival and restored piped supply.
Floods during the monsoon, traffic jam, reduced work hours would reduce to once
a week, than every 2-3 days. Consequent economic losses would thus reduce to 5% from the present 15%. Rain Water Harvesting would meet 3-4 months of household demand for over 50% houses, especially built after 2005, due to corporation rules, 2004. Farmers would also need less irrigation water and divert it to household purposes, due to cultivation of low water demanding crops such as millets, climbing vegetables etc. Thus, stable though lower yields would be ensured, notwithstanding rainfall irregularity, unlike rice and wheat that need better rains. Reduced cultivation of cash crops- sugar, chilli, tomato, onion etc. would avoid further water scarcity, over-production, and market crash.
5.3) Fuel- Transport would consume 30% less fuel- 140 t- of petroleum products with changed ratio: petrol (40%), diesel (32%), Biodiesel (7%) & Ethanol (14 %). Ethanol could substitute petrol more as costs of petrol would be higher due to globally reduced supplies, and its transport from Gulf to India would be costlier, than locally produced ethanol. Biodiesel yield would be 1 M t in Maharashtra state due to plantations on 5 M ha of wasteland and farm bunds that would yield 5 t seeds annually- 10% of national produce feasible that time. Besides, it would generate 4 M t of organic, nitrogen rich manure- that would replace over 25% of the chemical fertilisers, very costly then. Manure ales would compensate losses from oil sales at below production rate.
The number of vehicles could have declined by 50% to 0.6 M due to high costs,
traffic jam, accidents etc. About 0.2 million 2 wheeler owners would consume 0.5 petrol daily on an average (i.e. 25 km) for 5 days a week, implying 50 t petrol. Nearly 0.2 million automobile owners would have discarded using it, due above constraints. About 0.20 M. Auto-rickshaws – 3 wheelers- would be largely diesel based then, as also 0.06 M cars would each consume nearly 2 litre of diesel (20 km) weekly, implying 70, 000 i.e. 0.07 M litre i.e. 50 t diesel daily. About 0.05 M 3 wheelers and 0.04 M cars would be disused and thus avoided. Public transport buses would carry daily 0.8 million people, & require 40,000-litre diesel. Private vehicles would need 1.5 times more diesel, being 2 times more, not 4 times more like in BAU scenario. Fossil fuel supplies could become scarce & costlier due to global exhaustion or political instability in the Gulf. East coast extraction could be unexpectedly postponed until 2010 as the major oil companies split & fought legal battle. Extraction could be difficult & costly. While it would increase self-reliance, but also marginally enhance emissions & climate change risk. As sky-bus and Metro railway could hardly reduce 20% of the traffic burden much, people learnt to travel less by avoiding casual visits. Fuel was costly & curtailing private transport saved consumption. City was cleaner due to lower emission than BAU, if not today.
Of the poor families 0.2 M would use Kerosene, daily about 0.1 litre, which amounts to 20,000 litres i.e. 12 t- double. Another 0.1 M poor families, primarily slum dwellers would continue to misery of using 500 gm of biomass & waste (twigs, waste paper, plastic bags etc.) for cooking, totalling to 50 t/ day, but improved cooking stove with government support could reduce health hazards. The medium & the rich class- 0.2
20

Indian Urban SA- 30 pager
M families- would use 25% less LPG due to high cost, about 150 gm/ day/ family; amounting to 50 t/ day for the city as of today. About 0.1 M families would also use herbal biogas, where kitchen vegetable wastes are digested.
Electricity use would drop by 50% to 3 units per house daily, due to both higher costs as private companies distribute electricity and more efficient technology. Luxury items viz. water heater, refrigerator, fan would be avoided thereby saving about 75% energy. Houses would thus need about 50 units per month & 0.7 M houses imply 35 M units pm & 400 MU pa, 70% lower than today, despite to 10% population growth. Commercial electricity consumption (shops) would be cut by half to 25% of the housing & that of today’s consumption to 100 MU pa through higher tariff and taxes. City lights would be burnt using biogas from toilet waste, & the slurry would be sold as farm manure. Shoppers would have also realised that excess advertisement does not enhance sales if the product quality is good and its demand is genuine. Industry would continue to consume double the domestic electricity- 800 MU, but 50% lower than today, due to reduced market demand after the economic glut likely by 2010. Coal would provide about 60% of electricity & gas the remaining. Transmission & distribution losses were avoided by meeting 20% of the energy demand through Solar & Wind technology, through low interest loans and tax incentives to local producer companies (As per the Companies Act amendment of 2001, and Electricity Act, 2002). Hydropower would meet 20% of the demand, but reservoirs had become less efficient. Nuclear power production around Mumbai declined initially due to short supply of fuel from Russia but restored partially later as it tried to claim carbon credit from Kyoto protocol. But nuclear option was not promoted further due to long term social and environmental risks it posed.
5.4) Fibre- Each family would use 20% less paper (newspaper, packing, stationary) due to high costs- 200 gram daily, including office/ school-college work. Digital technology may save some paper- totalling 15 t for the city. Bio-polymers & bio-plastic would have replaced synthetics by 20-30% using the technologies patented at Ahmedabad & Pune respectively during 2004. Polymer use (Plastic bags, bottles, flasks, packing etc.), use would be reduced by 30% through higher tariff and taxing to 1 Kg per month/ family and at the city level to 2 t daily. Of this, 50% i.e. 1 t could be biodegradable. Its further growth need not be curtailed by cost disincentives. Cloths would be consumed about 10 Kg/ year/ family i.e. 50% as of today. Nearly 20% of it would be synthetic & 60% cotton. Bamboo & Banana fibre will meet 10% fibre demand each. Cotton would be kept cheaper by reducing exports, maintaining yield by crop diversification that reduced pest attacks. Handloom would continue to be confined to the elite, but not exports, through tariff and other barriers. Urban total consumption would be 4 t/ day. Apparels & packing would be 50% of the above- i.e. 2 t/day per city. Plastic & other synthetic fibre used for packing would be reduced. Leather bags, shoes etc. could continue to amount 5 kg/ family/ year i.e. 50% of the above volume- 1 t/ day.
5.5) Biodiversity- About 20-30% of the species may be lost in the next 30-50 years due to loss of 20% of the present & 60-70% of the original habitat area, besides commercial harvests, pollution and climate change together. Nationally, protected area network that covers just 4% of the original habitat area would have lost about 25% of the
21

Indian Urban SA- 30 pager
biodiversity. About 5% of the wild plant species bout only 30% % of the agro-biodiversity (half that of BAU) would be lost, primarily due to inevitable climate change. Only species that LEISA can save compared to BAU is those threatened by trade (5-10%) at present for the growing urban and global demand. Encouraging local use for healthcare etc. would motivate local people to trade only the excess produce at fair prices. Such local, low-tech benefits would more beneficial and provide stronger rationale for biodiversity conservation as known historically than the moder, hi-tech global commercial use with remote benefit sharing possibility, as proposed under BAU.
5.6) Culture- About 10 truck loads i.e. 50 t of cut flowers would continue to be sold in the city each day, to 50% fewer 50,000 households than today, but many more offices and functions. These would be local species such as Jasmine and not the water intensive exotic Aster or Rose, thereby saving irrigation water. Floral trade would continue to provide livelihood to about 1,000 poor people, largely women. More nature lovers would visit the hilltops daily or weekly, and eco-tourism inside the city would be a big business worth Rs. 1 million at Rs. 10 per person per morning trail. Its economic contribution in terms of health security & cultural satisfaction would be recognised to be much higher. Hill visitors provide livelihood to nearly 10 times- 500 traders of snacks, fruits, herbal juice etc. Hill lovers would resist the last refuge from mining or buildings, after having lost 25% of the present area, just as with water bodies. Water Park would make sprawling business, which would curtail further dumping of garbage and encroachment. Due to reduced overall economic activity, importance of culture would grow. People would maintain butterfly cum medicinal plants garden, for fun & peace. Children would be taught to enjoy plant based creative games on ground- leaves, flowers, seeds etc. than the tabletop computer games as of today.
Eco-education integrated with daily activities provided through schools and
colleges proved to be a key driver in promoting eco-friendly lifestyle for majority of the citizens in the next decade. Media today spreads awareness about the global or national environmental problems such as global warming, biodiversity extinction, pollution of air, water, soil and needs to conserver these resources, but citizens are not much enlightened about how their daily local response options can change the worsening situation. Citizens are unaware of ecosystem conditions and trends in their resource catchments & hence less concerned about it- such as neighbouring districts (say for food and water) or key national markets (for fibre, handicrafts, medicines). Citizens today are unaware of carbon emission and pollution they can avoid by minimising their usage of refrigeration, television, metal gadgets, private transport, mega celebrations, synthetic cloths and bags, soft drinks, bottled water, packaged food etc. to bare minimum. Children would understand that ecosystem productivity is limited so that more resources consumption and pollution means less availability of these to the people at their place of origin due to their poverty and more challenging situation for the future generation to survive in a deteriorated environment. Eco-education would enlighten the students- future citizens- that ecosystem essentially means knowing and caring for “local” resources. Eco-friendly products would then mean local handicrafts, not natural commercial ones from faraway.
22
Indian Urban SA- 30 pager
5.7) Waste- About 500 t of solid organic waste will continue generated in the city (150 g/ head- as of today) daily, would be turned into organic manure and employ over 0.1 M slum dwellers. Inorganic waste would be 50%, due to lower consumption per capita. Each person would generate 30% less waste due to high cost- about 0.3 kg daily. Plastic waste would reduce by 50% both due to lower use (25%) and replacement by degradable bio-plastic & biopolymer for computer industry (25%), developed in 2004. Separated in/organic garbage collection scheme would be implemented again- with 50% success- due to education to school eco clubs. The garbage dumps in the wastelands would be moved 30-50 km away from the city, to pacify peripheral villagers. Cement, concrete, metal use would have reduced yet such waste would be unmanageable then. For, houses built during 19980-95-boom period would be fragile and collapse by 2010-20. People will cherish emergence of a super-microbe to convert inorganic waste into wealth or harmless material. Dilemma over using nano-technology for disposal would remain. Biomedical or toxic waste & incineration needs would reduce by 50% as citizens would prefer not only curative but preventive herbal healthcare. Electricity generation from solid waste could meet 5% of the (50% reduced) urban energy needs.
All 800 t of organic waste out of total 1500 t of total organic waste (1250 t sewage, 250 t vegetable waste etc.) drained through the river then would be recycled as organic manure. It would yield handsome revenues to the municipal corporation. New housing colonies built after 2005 would be compelled legally to install DEWAT (Decentralised Wastewater Treatment) system, in response to such request from citizens groups and farmers organisations enlightened by the MA process. Biological Oxygen Demand (BOD) would drop by 50% (1.1 mg/l) & costal fishery productivity restored 50%. Inorganic pollution would have halved (100 t daily) as no new industries would start but existing ones could produce less goods due to market slump, and also install effluent treatment system. The river stretch polluted would thus reduce to 60% from the present 70%. Pollution load would grow only 2 times during festivals, especially idol immersion time, leading to deposits of zinc, calcium etc. but not 5-6 times as feared earlier. The savings could be achieved due to more public functions, less toxic materials used etc.
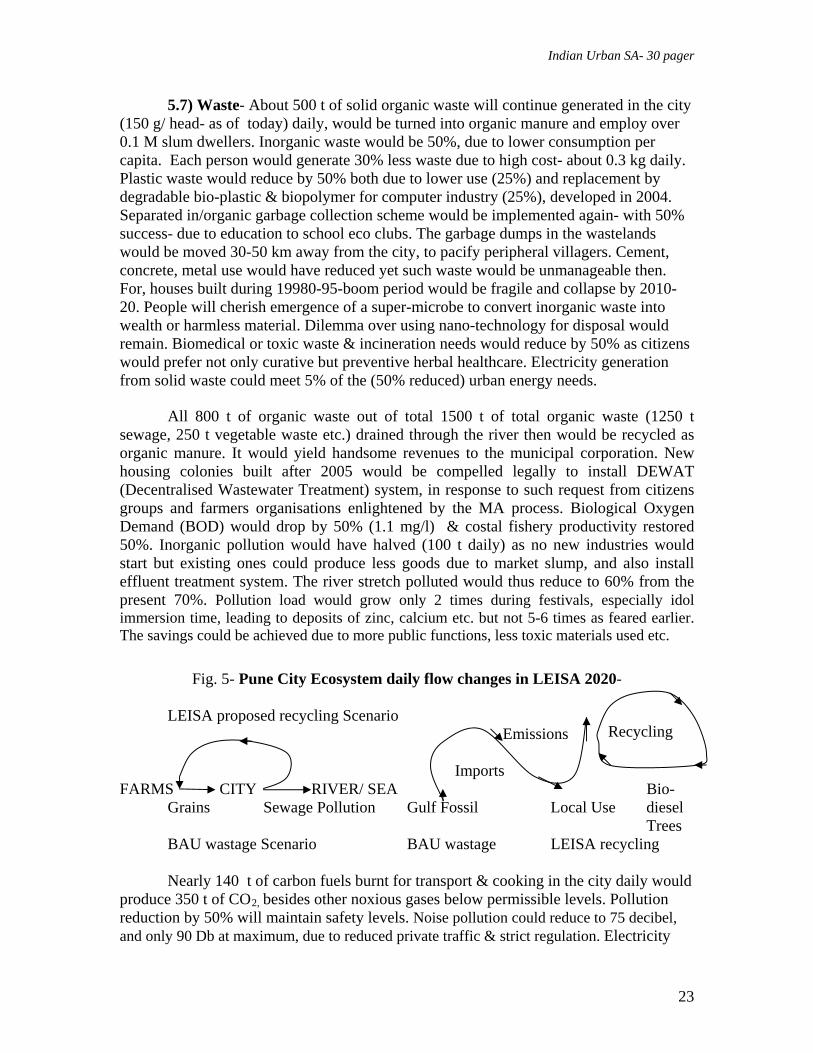
Fig. 5- Pune City Ecosystem daily flow changes in LEISA 2020- LEISA proposed recycling Scenario Emissions Recycling Imports
FARMS CITY RIVER/ SEA Bio- Grains Sewage Pollution Gulf Fossil Local Use diesel Trees BAU wastage Scenario BAU wastage LEISA recycling Nearly 140 t of carbon fuels burnt for transport & cooking in the city daily would
produce 350 t of CO2, besides other noxious gases below permissible levels. Pollution reduction by 50% will maintain safety levels. Noise pollution could reduce to 75 decibel, and only 90 Db at maximum, due to reduced private traffic & strict regulation. Electricity
23

Indian Urban SA- 30 pager
generation would emit about 4 t coal & 3 t gas daily at thermal power plants, amounting to 2,500 t/ yr- 50% less than today. Carbon emissions would reduce by 60% due to cleaner technology & reduced demand. Carbon emission per capita would reduce by 50% to 0.7 t pa. Toxic waste imports & processing would be avoided.
5.8) HWB- Economy would grow faster (7% pa) during 2002- 2010 but suffer global
glut due to excess production than demand and global capital flows. While urban employment continued to grow by 2% during under the Employment Guarantee Bill 2004 (expected to be enacted by 2005), rural employment growth rate doubled to 2 % due to soil & water conservation, plantation, road building etc. work. Agricultural labour trend would reverse and grow, at the pre-Green revolution rate of 2% annually, due to initiation of several on farm value addition enterprises under above law. But since natural productivity is low, LEISA cannot provide natural products for all- if all soaps, shampoos, detergents, medicines, which are chemically produced today, are to be replaced with herbal products, it would suffice hardly 10-40% of the national population. Most economic use could be local one. Traditional artisans (potter, cobbler, blacksmith, waterman, folk healer etc. comprising about 10% of the labour force) that survive marginally today despite difficulties (no demand, economic incentives to the competing industrial goods, publicity/ education about these) would revive after the glut by 2010. Rising fossil fuel prices would make urban industrial goods were costlier due to high transport & electricity costs- metal vessels, polymer footwear, bore well etc. National Biodiversity Strategy & Action plan 2004 helped its sustainable & participatory management.
Marginally reduced income inequality & unemployment would lower the crime rate slightly- amounting to 15,000 cases annually. Crime rate would be reduced two thirds of today to 2%, affecting 10% of the citizens, (considering family size of 5), which would be just double the village rate. Conflicts with villagers over sharing the scarce food & water would reduce to quarterly once, than monthly today or weekly as in the BAU scenario.
Climate change would reduce food production by 10% in 2010, requiring 10-15% imports of food crops. However, import scarcity due to global famine would compel seasonal hunger for the poor. Trade would reduce as families & nations ensured their food security first. Farmers growing water conserving millets & tubers in about 30% of the dry lands, were more food secure. Water intensive rice, wheat, sugarcane, modern vegetables and fruits farmers had joined them through organic farming for at least home consumption, as happening in Deccan plateau. Low but certain produce sufficed for the local population, and people did not trade it with non-essential urban commodities. However, farmers provided limited excess produce to their urban relatives and friends, that comprise 60% of the Urban population today. Urban employment had saturated and most of the banking, information, construction, security, labour jobs had turned non lucrative. Thus, 50-60% of the citizens, primarily labour, started returning to their parental farming families, where they had to be content with simple life devoid of erstwhile urban luxuries as well as tensions. Local rural culture would revive- nature related festivals and gifts, theatres, songs and dances, worship and meditation etc. Nature & society would have turned a full circle as farmer’s children return to the land. Industrial cities receded like the dinosaurs, while the self-reliant traditional subsistence organic farmers could prove resilient & durable like turtles.
24

Indian Urban SA- 30 pager
6. TRADE OFF & SYNERGY
BAU- Techno-commercial scenario: 6.1) TC scenario would lead to economic prosperity but enhance ecological insecurity and economic inequity. LEISA scenario could reduce economic prosperity but would not enhance ecological insecurity & economic inequity; even if could not reverse these. 6.2) Food and fuel (biodiesel) production would compete for land under TC. Food and water could compete under TC. The terminology “virtual water” would be used to shift food production to cash crops but it would be misleading as food crops need less water than crops e.g. floriculture, grapes, sugarcane, onion etc. 6.3) Food and biodiversity competition would grow under TC with mutual loss, through encroachment of forests for marginal farming and extensive monoculture and pesticides. 6.4) Higher food production could be less healthy due to poor quality under TC, due to lower biomass inputs in farmlands. Higher air, water, soil, noise pollution could harm health. Skyrocketing healthcare expenditure may cripple economic output as also traffic jam, flooding, cyclones etc. 6.5) Non-food agro industrial production and economic growth could grow synergistically at least in the short term in many places. 6.6) Reduced timber and fibre production jobs could reduce employment and inputs. 6.7) Waste recycling could enhance employment and terms partially but at the cost of waste handling labour is health. 6.8) HWB of the urban rich could grow with increasing ecotourism and education in the short term, while it could enhance pollution and stress air, soil and aquatic ecosystem, locally, while climate globally due to carbon emission for travel. LEISA scenario: 6.9) LEISA involves more trade off both ecology and economy, while more synergies between utilities and HWB. 6.10) Food products would reduce but stabilize under LEISA & agro biodiversity would grow, as also health. HWB would increase due to healthier food and higher farm employment though many would initially resent the handwork involved in it. 6.11) Food and fuel would grow synergistically under LEISA as more agro waste is deployed in biogas produce locally, but it could dampen economy prospects of urban industry desire of replacing food farm, with bio-diesel tree plantation.
25

Indian Urban SA- 30 pager
6.12) Water allocation to cities would decline under LEISA, and HWB dwindle in the short run in merely economic terms, due to higher rural allocation. Lower conflicts would compensate the economic loss & higher food production would also sustain higher HWB. 6.13) Waste production could be lower and organic content higher, with high recycling of both solid and liquid wastes under while carbon and other emissions could reduce under LEISA. However, it would appear to reduce the urban HWB in the short run due to lower availability of FMCG and luxury items – refrigeration, electronic communications, nationwide transport, fast food etc. 6.14) Fibre production would enhance from farmland under LEISA, through forestlands could increase slowly, marginally and enhance HWB due to employment generation. 6.15) Timber production could enhance marginally under LEISA due to HWB would enhance due to employment generation in carpentry. 6.16) HWB of the rich could reduce due to regulated and lower consumption of non violent silk, plastics, paper, cotton, polymers and goods transported from faraway to avoid packing. But HWB of the rural poor could enhance. TABLE 4 Trade Offs across 2 scenarios ES CHANGE* BAU LEISA Food + Fuel, water, fibre, Biodiversity - Fuel + Food, waste, water - Water - Food, waste, - Waste - HWB - Fibre + Food - BIODIVERSITY
+ Food, water -
HWB + Water, waste, Biodiversity Ecology and economy, Equity and economy.
*- The “change” indicates the desired direction- to enhance or to reduce. TABLE 5 Synergies under 2 scenarios Synergy of/ Under BAU LEISA Food Fuel (manure) Fuel Food (seeds, weeds) Water Economy (RWH) Waste (assimilation) Waste Food, HWB Food, fuel, Biodiversity Fibre HWB Biodiversity, HWB Biodiversity HWB Food, fuel water, fibre, waste, HWB. Culture Biodiversity
26

Indian Urban SA- 30 pager
7. CROSS SCALE VARIATIONS All the ecosystem products/ processes are scale dependent but at varying extent. The variation is seen in terms of all the parameters – conditions and trends, driving forces, response options plausible and scenarios. These are briefly summarized in the table 6. TABLE 6 Variation in prominent characters at local (L) & national (N) scale
ASPECT VARIATION DRIVERS RESPONSES Food L- scarcity
N- plenty L- overuse/ pollution N - land use
L- Livestock N- Vermi-compost
Fuel L – Oil N- Coal
L- Demography N- Technology
L – bio-diesel, biogas N – Gas
Water L- scarcity N- reduction
L– Policy N- Land use
L – Rainwater Harvesting N – Dry land crops
Fibre L – synthetic N– cotton
L- Pests, water scarcity N- Polymer technology
L- Multi-cropping N- Handloom
Bio-diversity
L – threatened N- restoring
L – land use, water pollution N - trade
L- eco-restoration N-
Culture L- Loss of BD & traditions N- Fashion
L- Acculturation/ cultural monopolisation N- Global cultural reversal
L- Assessing best practices & revitalisation N- Promoting localisation
Waste L- water, air N- upper air
L- Sewage, Transport N- Electricity
L- Organic recycling, reduce transport, public transport N- Local tech-goods
HWB L- Peace, diversity lost N- Economic growth
L- hi-tech, costly education N- commercialised media
L- eco education N- eco-friendly media policy
8. BRIDGING EPISTEMOLOGY
Traditional knowledge (TK) is enriched with experience, and not merely information. Several citizens above 40-50 years of age possess valuable TK about food, water, biodiversity or cultural aspects. The parameters on which they provided qualitative or semi-quantitative (ordinal ranking) data include quantity, quality, space, timing etc. which filled important gaps missing in the literature. For instance, the diversity of vegetables consumed few decades ago was quickly shared by many TK holders, but would require elaborate literature search such as trade reports. Their nutritional value could be found in the literature but only the TK holders told about its impact of cultural well being in terms of mental status. While TK is often qualitative & imprecise, its greatest advantage is the long-term historical experience, including cases that worked & case that failed. TK holders thus often possess wisdom about conditions for its application or not. TK must thus be looked up for such wisdom & guidance, and not merely as a source of information for new technological inventions. Piper, the pepper plant species traditionally used extensively as a spice is a healthy anti-oxidant. But when its extract of Pepperin was medically used, it caused disastrous side effects. Serpentine, Ravoulfia serpentina, provides similar example, wherein the plant got overexploited to almost extinction. In both cases, modern science, rather technology rushed to commercialise it before understanding traditional plant species with which it was used or other cautions.
27

Indian Urban SA- 30 pager
TABLE 7 Comparison of traditional knowledge (TK) & modern science (MS)
ASPECT TK MS Purpose Meeting local needs Meet global market demand Process Observation, consultation Experiments, literature survey Product Utility good/ process Good/ service/ research paper
Precision Less High Verification Empirical Mathematical modelling, simulation Framework Logical, holistic, spiritual Logical, focused, rational
Dissemination Oral, practical Written, theoretical Sharing rewards Benefits of direct usage Profits regardless of direct usage Sharing restraints Deservingness of student etc. Nil, except profit sharing
Strength Experience for decades Technology, quantitative objectivity Weakness Qualitative, subjective Narrow focus on few parameters
Opportunity Techno-commercial revival To learn cautionary wisdom from TK Risk/ Threat Extinction with old generation Pilferage to antisocial elements
9. UNCERTANITY
9.1) Uncertainty shadows both scenarios includes possible abrupt climatic change reported widely last year (www.ems.org/climate/). Others have independently predicted greater climatic instability, more drought, cyclone, heat and cold water, rainfall irregularity etc. (http://www.newscientist.com/news/news.jsp?id=ns99993655) that may reduce food & water supply, as well as transport. Tsunami- giant tidal waves & global flooding due to Canary islands La Palma earthquake is possible (Sample, 2004). 9.2) Fossil fuel has been the prime physical driver of rapid changes in the last century but its supply could become scarce due to above problems or political instability. Markets as social driver caused of rapid changes in the last century, thus increasing instability & uncertainty world-wide, including local over-production & glut. 9.3) Human society could witness increasing conflict between cities and villages, between states and nations, over scarce food, water and fuel, as known historically. Rate of changes social systems, including law, policy & public behaviour to promote cooperation & sacrifice is slow. Many commercialised technological innovations during the last century that prospered initially created negative impacts. Localisation could minimise uncertainty arising due to technology & markets at large scale.
10. LESSONS 10.1) Merely changing the inputs or process of production for changed product cannot maintain natural or social balance, but its long term feedback on social & natural system must be assessed before promoting any development option. 10.2) Internal aspects of natural & social systems must be examined, not just external ones. It could be futile to assess merely the productivity of the external natural systems, if purpose & means of production reduce equity & resilience within the social system. While human must guard against imbalance in nature (viewed as external plants, animals
28

Indian Urban SA- 30 pager
& other ecosystem components), internal human natural tendencies must also be balanced- ego, attraction, greed, pride & jealousy that have shaped the history. 10.3) Less obvious (i.e. hidden, long term), invisible, qualitative stakeholder or cost-benefit must be assessed, & not just obvious (i.e. visible, immediate) quantitative. 10.4) It is necessary to distinguish between the goal & tools, which cannot be confused. Economic growth & technological gadgets are only tools to achieve HWB, and their abundance in the society cannot be misread as HWB itself. Sustaining natural production is necessary, but other social measures for HWB also need assessment. Excess commercialisation, formalisation could obscure visibility (Goldsimth, 1987). 10.6) Unplanned drivers in nature (e.g. abrupt climate change) or society (e.g. war) could impact the supply of ecosystem products/ services. Thus, it is safer to aim at maintaining resilience within production systems to cope up with such surprises with local resources. Continuous monitoring of such external, non-planned drivers is also critical, & not just the narrow range of ecosystem parameters. 10.6) Uncertainty & insecurity, even conflicts may prevail under both TC & LEISA scenarios. Citizens ready to sacrifice present consumption levels as the “next practice” could incur less loss under low ecosystem productivity. 10.7) Supply side (augmentation) management is necessary, but insufficient unless complemented by demand side management (DSM- reduction, substitution, and reallocation) as “next practices”. Greater common goal of nature & societal sustainability & equity is not possible without some sacrifice by each stakeholder. 10.8) Natural & social evolution appear to follow circular path (cyclic or sinusoidal) & not linear, implying that, assets of present (e.g. investments or gadgets) could be future liability, while present liability (e.g. land) could be future asset. Hence, more than accumulating assets that enhance future liability, it is safer to maintain adaptability. References Anon, 1996, CO2 Mitigation in Indian Transport, Tata Energy Research Institute, New Delhi. Anon, 2002 . Human Development Report- South India. Oxfam & National Commission on Applied Economic Research (NCAER), New Delhi. Anon, 2003. Pune Environment Status Report. Department of Environment, University of Pune, for Municipal Corporation, Pune. Anon, 2004 a. Survey of Environment – 2003. The Hindu, Chennai. www.thehindu.com Anon, 2004 b. Survey of India Agriculture – 2004. The Hindu, Chennai.
29

Indian Urban SA- 30 pager
30
Ehrenfield David, 2003. Globalisation: Effects on Biodiversity & Society. Conservation & Society, vol. 1, No. 1, pp. 99-112. www.conservation&society.org Gadgil, M & R. Guha. 1995. Ecology & Equity: Use & Abuse of nature in contemporary India, Penguin, New Delhi. Ghose, C. 2001 Clean Air, Down To Earth Vol. 10 No. 8 p. 22-24. Goldsmith, E., 1987. Great U-Turn: De-industrialising society. http://www.edwardgoldsmith.com/key18.html. Gupta S. K. & Deshpande R. D. 2000. Water for India in 2050: First order assessment. Current Science.80 (9): 1216-1224. www.ias.ac.in/currsci Jamal Nidhi et al, 2004 a. Just Dump It: Down To Earth, V 13 No. 12 p. 27-36. also www.cpcb.nic.in Jamal Nidhi 2004 b. Simmering city. Down To Earth V 13 N 13 pp 49-51. Kalam A.P. J.A. & Y.S. Rajan. 1998. India – 2020: A vision for the New Millennium. Penguin, Delhi. http://planningcommission.nic.in/reports/genrep/bkpap2020/ Martondkar, Uday, 2004. A Green Promise: Micro-chips from plants. Down To Earth, V. XXIX N. 48 p. 62-63. Narain Sunita, 2002 Flush is ecologically mindless. Down To Earth V 10 No 19 p 28-38. Parikh, K. & Radhakrishna, R., 2002, India Development Report- 2002. Oxford Univ. Press, N. Delhi. Sample Ian, 2004. Tidal wave disaster threat: A doomsday scenario. Hindu. Aug. 11. Courtesy: Guardian. Rajlakshmi, T. K, 2004. Population Issues: Growing concern. Frontline, Vol. 8, No. 2, pp. 5-6. Srinivas, R K, 2004. Centralised Wastewater Treatment Won’t Work. Down To Earth. Vol. 13 No. 14 p. 46 Srinivasa R K, & Kozhizzeni D., 2004. Water Emergency. Down To Earth Vo. 13 No. 15 p. 23-38. Shankar D. & Ved D. K 2003. Export potential of Indian Medicinal Plants. FRLHT, Bangalore & EXIM Bank, Mumbai. http://envis.frlht.org/overview.htm#status.