indiana in the decennial censuses (statistical)
TRANSCRIPT

Index to Indiana Statistics in the Decennial Censuses Contents
3rd Census of the United States (1810) 2 4th Census of the United States (1820) 3 5th Census of the United States (1830) 4 6th Census of the United States (1840) 5 7th Census of the United States (1850) 7 8th Census of the United States (1860) 10 9th Census of the United States (1870) 17 10th Census of the United States (1880) 26
Prepared by the Indiana State Data Center, Indiana State Library

Indiana Statistics in the Decennial Census Publications Census / Description of Statistics Page Number
Indiana State Library
3rd Census of the United States (1810) p.d. 317 Un10a (oversized) – Data Center (with Agricultural Censuses) Free white males, free white females, all other free persons, slaves
o State 1 o County, township, town, age 85
3rd Census of the United States (1810) – Arts and Manufactures http://www.census.gov/prod/www/abs/decennial/1810.htm Manufactures, by type – Territory of Indiana 2 Manufactures, by type – Territory of Indiana, by division 162

Indiana Statistics in the Decennial Census Publications Census / Description of Statistics Page Number
Indiana State Library
4th Census of the United States (1820) p.d. 317 Un20c (oversized) – Data Center (with Agricultural Censuses) http://www2.census.gov/prod2/decennial/1820.htm Free white persons, foreigners, employments, slaves, colored persons, all other persons, by sex, by age
o State 1 o County, parish, division 39* o Recapitulation, state 39(b)
Note: Pagination for the online version differs from the print version. When using the online version, use the following pages:
o State 18 o County, parish, division 155 o Recapitulation, state 156
Indiana Statistics in the Decennial Census Publications Census / Description of Statistics Page Number
Indiana State Library
5th Census of the United States (1830) p.d. 317 Un30f (oversized) – Data Center (with Agricultural Censuses) Free white persons, slaves, free colored persons, all other free persons, by sex; 1790-1820
o State, county 20 Free white persons, slaves, free colored persons, deaf and dumb, blind, aliens (foreigners), by sex, by age:
o County, township, town 144 o Epitome of state 146
5th Census of the United States (1830) – Abstract of Returns p.d. 317 Un30abs – 3rd floor across from map room http://www.census.gov/prod/www/abs/decennial/1830.htm Aggregate, free persons, slaves, by sex, by race
o State, county 34
Indiana Statistics in the Decennial Census Publications Census / Description of Statistics Page Number
Indiana State Library
6th Census of the United States (1840) - Population p.d. 317 Un40s (oversized) – Data Center (with Agricultural Censuses) Free white persons; free colored persons; slaves; total population; employments; deaf, dumb, blind, and insane; schools, etc., statistics of;
o By county, township, town, ward; by age; by sex 346 o By county, by age, by sex 370 o Epitome of the whole population 374
6th Census of the United States (1840) - Industries & Resources p.d. 317 Un40st (oversized) – Data Center (with Agricultural Censuses) Statistics of mines, agriculture, horticulture, commerce, fisheries, products of the forest, and manufactures
o By county and township 328 6th Census of the United States (1840) - Compendium p.d. 317 Un40c (oversized) – Data Center (with Agricultural Censuses) http://www.census.gov/prod/www/abs/decennial/1840.htm County & principal towns; by age, by sex
o Free white persons 80 o Free colored persons 81 o Slaves 82 o Total population 82 o Employments 83 o Deaf, dumb, blind, and insane 83 o Schools, etc., statistics of 83
County o Mines, statistics of 286 o Agriculture, statistics of 287 o Horticulture, statistics of 289 o Commerce, statistics of 289 o Fisheries, statistics of 290 o Products of the forest, statistics of 290 o Manufactures, statistics of 290
Appendix: Tables of Apportionment
o Representatives, as fixed by the Constitution before the first enumeration, and prescribed according to the 1st, 2nd, 3rd, 4th, and 5th Censuses. 366
o Representatives each state will be entitled to according to the 6th Census 368
o Abstract of each preceding Census 370

Indiana Statistics in the Decennial Census Publications Census / Description of Statistics Page Number
Indiana State Library
7th Census of the United States (1850) p.d. 317 Un50 – 3rd floor across from map room http://www.census.gov/prod/www/abs/decennial/1850.htm Introductory statistics, by state:
o Comparative Table of population, 1790-1850 ix o Abstract of the Militia force of the U.S. xxxii o Population, square miles and density xxxiii o Representatives assigned to Congress, 1790-1850 xxxv o Place of birth – native population xxxvi o Place of birth – foreign born population xxxvii o Nativities of white & free colored population xxxviii o Births of persons under 1 year of age xxxix o Births, marriages, deaths, dwellings, families xli o Classification of ages of white population xlii o Classification of ages of free colored population xliii o Classification of ages of slave population xliv o Relative rank by class of population and by square
miles xlvi o Change in white population, 1790-1850 xlvii o Change in free colored population, 1790-1850 xlvii o Change in slave population, 1790-1850 xlviii o Deaf and dumb, blind, insane, and idiotic population,
totals and nativity l o Comparative population of largest cities lii o Number of churches, by denomination lvii o Value of church property, by denomination lvii o Church accommodations lviii o Attending school, by race, by sex, by nativity lix o Colleges, academies, schools lx o Illiterate population, by sex, by race lxi o Education statistics, 1840 lxi o Libraries lxiii & lxiv o Newspapers, 1840 lxiv o Newspapers and Periodicals lxv o Occupations of male inhabitants lxvii o Employments of free males over 15 years lxxx o Occupations of free and slave population, both
sexes, 1840 lxxx o Productions of agriculture lxxxii o Ratio of population and certain products lxxxiv o Agricultural returns, 1840 lxxxiv o Proportion of white males to females lxxxvi o Ratio of increase in population, 1790-1850 lxxxvii

Indiana Statistics in the Decennial Census Publications Census / Description of Statistics Page Number
Indiana State Library
o Ratio of several classes to the total population, 1790-1850 lxxxix
o Indian statistics, 1789, 1825 and 1853 xciv Table of counties, districts, and parishes:
o White, free colored, slave population, foreign born, dwellings, families xcv
Population of places (towns) included in the Census ciii Statistics of Indiana
o Counties – Population by age, by race, by sex 748 o Townships and towns – population by age, by race,
by sex 756 o State – nativities, by race, by sex 780 o Counties – Births, marriages, deaths, dwellings,
families 780 o State – Change in population, by race (incl. slaves),
1800-1850 781 o State – Deaf and dumb, blind, insane, idiotic, by
race, by sex, by nativity 782 o Counties – Colleges, academies, schools, teachers,
pupils, income, etc. 782 o Counties – Attending schools, by sex, by race,
native, foreign born 786 o Counties – Illiterate population, by sex, by race,
native, foreign born 788 o State – Professions, occupations, and trade of males 789 o Counties – Farm and implements, stock, products,
home manufactures, etc. 790 o State – Newspapers & periodicals, by type, number,
circulation, numbers printed, how often used 797 o Counties – Libraries, other than private, number,
volumes, by type 797 o Counties – Churches, church property, by
denomination 799 Notes on Indiana, by table 1021

Indiana Statistics in the Decennial Census Publications Census / Description of Statistics Page Number
Indiana State Library
7th Census of the United States (1850) – Abstract p.d. 317 Un50a – 3rd floor across from map room Statistics by state:
o Nativities – native population 16 o Nativities – foreign-born population 18 o Deaf and dumb – by race (incl. slaves), by sex 21 o Blind – by race (incl. slaves), by sex 22 o Insane – by race (incl. slaves), by sex 24 o Idiotic – by race (incl. slaves), by sex 25 o Paupers – native, foreign-born, annual cost of
support 28 o Churches – number, ratio to population,
accommodations, property value, average property value 30
o Churches – number, accommodations, property value, by denomination 32
o Valuation of real and personal estate 46 o Acres of improved and unimproved land, cash value,
and average cash value per acre 49 o Farmland - acres of farmland, cash value, value
of farming implements and machinery 84 o Livestock – number (by type) and value 86 o Produce, by type (grains, tobacco, cotton, crops,
fruits, dairy, sugar, home-made manufactures, slaughtered animals, etc.) 88
o Miles of railroad, land area, population, and population density 101
o Miles of railroad in operation and in progress 102 o Amount expended upon railroads 104 o Telegraph charges from Washington, D.C., to
Indianapolis and New Albany (miles and rates) 109 o List of telegraphs 112 o Area in square miles, population, and density
per square mile 134 o Deaths – number and ratio to the number living 140 o Population – Total and ratio of increase, 1790-1850,
Representatives in Congress 150 o Cotton goods – various statistics 154 o Woolen goods – various statistics 155 o Pig iron – various statistics 156 o Castings – various statistics 157 o Wrought iron – various statistics 158 o Malt and spirituous liquors – various statistics 159 o Population, by race (incl. slaves), and representation
in 33rd Congress 160

Indiana Statistics in the Decennial Census Publications Census / Description of Statistics Page Number
Indiana State Library
7th Census of the United States (1850) – Compendium p.d. 317 Un50co – 3rd floor across from map room http://www.census.gov/prod/www/abs/decennial/1850.htm Statistics by state:
o Comparative expense to each State and individual, 1840 and 1850 29
o Land area – square miles, percent of total, rank 36 o Geographical and political classification of the states 38 o Aggregate population and density 40 o Representation in Congress, 1790-1850 43 o Population (aggregate, families and dwellings,
sex, age, births, marriages, deaths, deaf, dumb, blind, etc., occupations, nativities)
o White population 45 o Free colored population 62 o Slave population 82 o Total population 95
o Religious worship / Churches 134 o Education / Schools 141 o The Press – Newspapers and Periodicals 155 o Libraries 159 o Charities / Paupers 161 o Average wages 164 o Crime 165 o Agriculture 169 o Manufactures 179 o Commerce 186 o Railroads and canals 189 o Real and personal estate taxes, annual taxes 190 o Comparative populations of large cities 192
Statistics of Indiana
o Counties – Adams through Lawrence 224 o Counties – Madison through Whitley 231
Populations of cities & towns 338 Age & sex, white and free colored population, Indianapolis 395 Ages of persons who died between 6/1/1849 and 6/1/1850 400

Indiana Statistics in the Decennial Census Publications Census / Description of Statistics Page Number
Indiana State Library
8th Census of the United States (1860) p.d. 317 Un60 – 3rd floor across from map room http://www.census.gov/prod/www/abs/decennial/1860.htm Volume 1: Population Introduction:
o Population by state iv o Colored population xiii o White males – between ages 18 and 45 xvii o Dwellings xxvii o Foreign residents xxix o Percentages of native/non-native, English, Irish, and
German populations xxxi o Migrations of native free population xxxiii o Course of internal migration xxxiv o Free persons married during the year xxxvi o Population and percentage of persons under 1 year
of age xxxviii o Deaths during the year xli o Institutions for the blind; proportion of blind persons lxxiii o Insane population lxxviii o Hospitals for the insane xcviii
Statistics for Indiana, by county:
o Population, by age, by sex, by race 106 o Population, by color, by condition, by sex 112 o Population of townships, cities, towns, by race,
by sex 113 o Population, native and foreign born, by race, by sex 128 o Nativities (state) 130 o Occupations (state) 130
Recapitulation, by state:
o White population, by age, by sex 592 o Free colored population, by age, by sex 594 o Civilized Indians, by age, by sex 596 o Population, by color and condition, with rate of
increase and representation in Congress 598 o Population, 1790-1850, with rate of change 600 o Indian population 605 o Population, native and foreign-born, by sex, by color 606 o Nativities of free population – native born 616

Indiana Statistics in the Decennial Census Publications Census / Description of Statistics Page Number
Indiana State Library
o Nativities of free population – foreign-born 620 o Deaf and dumb – by age, by race, by sex 624 o Deaf and dumb – nativities, by race, by sex 626 o Blind – by age, by race, by sex 631 o Blind –nativities, by race, by sex 634 o The insane – by age, by race, by sex 639 o The insane –nativities, by race, by sex 642 o The idiotic – by age, by race, by sex 647 o The idiotic –nativities, by race, by sex 650 o Occupations 656
Volume 2: Agriculture Introduction:
o Acres of land in farms, and cash value vii o Farming implements and machinery in use, value of x o Wheat production xxix o Indian corn production xlvi o Rye production lix o Oats production lxiv o Barley production lxviii o Buckwheat production lxxi o Peas and beans production lxxiv o Irish potato production lxxviii o Sweet potato production lxxxi o Dairy products lxxxii o Wool production lxxxvi o Flax production lxxxix o Flax-seed production xcii o Rice production xciv o Hops production xcv o Tobacco production xcvi o Cane sugar, maple sugar, sorghum molasses,
honey, etc. xcix o Domestic animals cviii o Value of livestock cxxvi
Statistics for Indiana, by county 38 Recapitulation
o Farms containing three acres or more 221 o Farms, acres of land improved, unimproved,
average number of acres, number of counties 222 Detailed topic index for Indiana statistics 263
Indiana Statistics in the Decennial Census Publications Census / Description of Statistics Page Number
Indiana State Library
Volume 3: Manufactures Introduction:
o Cotton goods produced during the year xxi o Woolen goods “ xxxv o Wool Carding “ l o Clothing (Men’s) “ lxvi o Boots and shoes “ lxxiii o Millinery “ lxxxviii o Hemp and Manilla cordage “ cxviii o Paper “ cxxxi o Printing “ cxlii o Bookbinding and blank books “ cxlv o Musical instruments “ cliii o Hats and caps (including hat bodies) “ clxii o Coal mined during the year clxxiii o Coal, bituminous, mined “ clxxiv o Pig iron produced “ clxxx o Bar, sheet, and railroad iron produced “ clxxxiii o Sewing machines “ cxc o Agricultural implements “ ccxvii
Statistics for Indiana:
o Manufactures, by type, by county – number of establishments, capital invested, cost of materials, employees, cost of labor, value of products 114
o Recapitulation 142 o Manufacture of leather, (omitted), by county 659 o Manufacture of leather, (included), by county 660 o Manufacture of leather, (added) 661 o Errata for Indiana 746
Volume 4: Mortality, Property, etc. Introduction:
o Population and manufactures of Indianapolis, New Albany, Evansville, and Fort Wayne xviii
o Population rank by state, 1790-1860 xx o Mean temperature, New Harmony xxx o Population, total and nativities, by state li o Nativities of foreigners, by state liii o Foreigners and their proportion to total white
population lvi o Nativities of Americans (native population), by state lxi
Indiana Statistics in the Decennial Census Publications Census / Description of Statistics Page Number
Indiana State Library
Mortality:
o Deaths in year ending June 1, 1860 3 o Deaths in year ending June 1, 1860, by type, Indiana 19 o Deaths in year ending June 1, 1860, by age, by sex,
by type 44 o Deaths in year ending June 1, 1860, by age, by sex,
by type, District IV (incl. Indiana) 80 o Deaths in year ending June 1, 1860, by sex,
by month 129 o Deaths in year ending June 1, 1860, by sex,
by month, by disease or by type 164 o Population, reported death, and ratio to living,
1850 and 1860 212 o Number and proportion of deaths, by cause, to total
deaths from known causes, by district 217 o Ratio of deaths from consumption, by district 244 o Deaths by suicide, by method, by district 253 o Rank, by ratios of death from specified causes and
classes of causes to total deaths 254 o Ratio of deaths, by age, to total deaths, by district 270
Banks and Insurance: 292 Real and Personal Estate, value of:
o By state 294 o By county 300
Newspapers and Periodicals, by type: 321 Railroads:
o Mileage, cost of construction, by railroad, 1850 & 1860 330
o Recapitulation 331 o Number of Railroads in operation, by year,
1850-1860 333 o Number of miles of Railroads brought into use, by
year, 1850-1860 334
Canals and River Improvements: 336
Land area, by type, and number of inhabitants per square mile: ` 339
Families and Free Population:
Indiana Statistics in the Decennial Census Publications Census / Description of Statistics Page Number
Indiana State Library
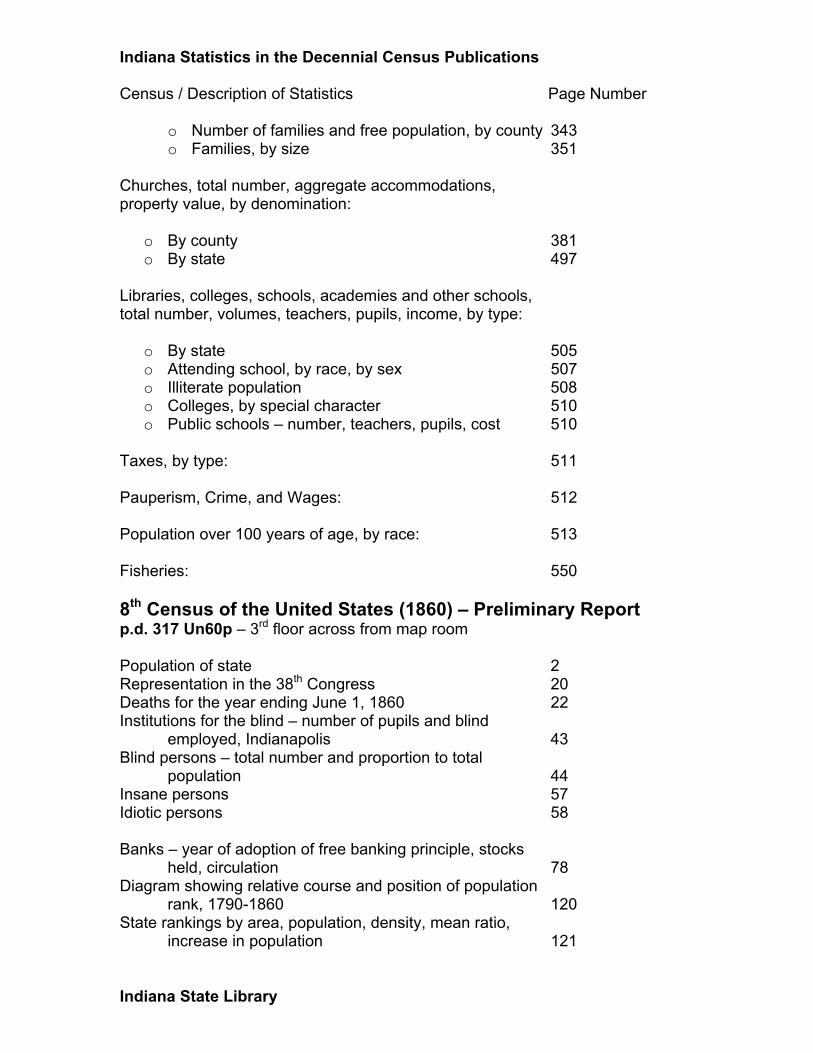
o Number of families and free population, by county 343 o Families, by size 351
Churches, total number, aggregate accommodations, property value, by denomination:
o By county 381 o By state 497
Libraries, colleges, schools, academies and other schools, total number, volumes, teachers, pupils, income, by type:
o By state 505 o Attending school, by race, by sex 507 o Illiterate population 508 o Colleges, by special character 510 o Public schools – number, teachers, pupils, cost 510
Taxes, by type: 511 Pauperism, Crime, and Wages: 512 Population over 100 years of age, by race: 513 Fisheries: 550 8th Census of the United States (1860) – Preliminary Report p.d. 317 Un60p – 3rd floor across from map room Population of state 2 Representation in the 38th Congress 20 Deaths for the year ending June 1, 1860 22 Institutions for the blind – number of pupils and blind employed, Indianapolis 43 Blind persons – total number and proportion to total
population 44 Insane persons 57 Idiotic persons 58 Banks – year of adoption of free banking principle, stocks held, circulation 78 Diagram showing relative course and position of population rank, 1790-1860 120 State rankings by area, population, density, mean ratio,
increase in population 121

Indiana Statistics in the Decennial Census Publications Census / Description of Statistics Page Number
Indiana State Library
Population and rate of change, by race, 1790-1860 124 Population, by race, by sex 134 Indiana population 136 Deaths from June 1, 1959 to May 31, 1860, by month, by age, by sex 138 Deaths from June 1, 1959 to May 31, 1860, by cause,
by sex 146 Violent deaths, by sex, by type 163 Deaf and dumb persons 168 Value of agricultural implements produced during year 169 Pig iron produced 170 Bar and other Rolled Iron produced 170 Steam engines and Machinery produced 171 Iron Founding 172 Coal produced 173 Printing 174 Sawed and Planed Lumber produced 176 Flour and Meal produced 177 Spirituous Liquors produced 178 Malt liquors brewed 179 Cotton Goods produced 181 Woolen Goods, (including Carding and Fulling and Mixed Goods,) produced 183 Leather produced 184 Boots and shoes produced 185 Furniture produced 186 Illuminating Gas produced 187 Fisheries 188 Soap and Candles produced 189 Products of Industry – number of establishments, capital invested, value of raw material, employees, value of product 190 Banks – capital, loans, specie, circulation, deposits,
1850 & 1860 192 Assessed value of real estate and personal property 194 True value and change in value of real estate and personal property, 1850 & 1860 195 Productions of Agriculture – Land, cash value of farms,
value of implements and machinery, live stock, crops, wine, dairy, beeswax, honey, sugar, slaughtered animals, etc. 96
Horses, Asses and Mules, Neat Cattle, Sheep, and Swine 210 Newspapers and Periodicals, by type 211 Railroads – mileage and cost of construction, by railroad, 1850 & 1860 226 Railroads – Capitulation, 1850 & 1860 230

Indiana Statistics in the Decennial Census Publications Census / Description of Statistics Page Number
Indiana State Library
Miles of Railroads in operation, by year, 1850-1860 235 Miles of Railroads brought into use, by year, 1850-1860 237 Canals and River Improvements 241 Population and change of population, 1850 & 1860,
Fort Wayne, Indianapolis, La Fayette, La Porte, Madison, Richmond 242
Population, by county, by race, by sex 254

Indiana Statistics in the Decennial Census Publications Census / Description of Statistics Page Number
Indiana State Library
9th Census of the United States (1870) p.d. 317 Un70 – 3rd floor across from map room http://www.census.gov/prod/www/abs/decennial/1870.htm Volume 1, Part 1: Statistics of the Population Introduction:
o Representation in Congress xv o True population, by race (White, Colored, Chinese,
Indians) xvii o Unknown causes of death, 1860 & 1870 xxxv
General Tables
o Rank and population – aggregate and by race, 1790-1870 3
o Population of Indiana – by counties, by race, 1790-1870 25
o Population of Indiana – by townships, cities, towns, by race, 1850-1870 122
o Nativity and foreign parentage, 1850-1870 299 o Nativity and foreign parentage – by counties,
1860 & 1870 308 o Nativity of native born – by race and place of birth 328 o Nativity or foreign born – by race and place of birth 336 o Nativity of native and foreign born population, by
county 352 o Nativity of native population – Indianapolis, by race 380 o Nativity of foreign born population – Indianapolis,
by race 386 o School attendance – by race, 1850-1870 394 o Illiteracy – by race, 1850-1870 396 o School attendance and illiteracy – Indiana –
by counties, by race, by sex, by age 409 o School attendance and illiteracy – Indianapolis,
by ward 444 o Schools, all classes, public, not public, colleges,
academies, etc. – total number, teachers, pupils, income, 1850-1870 450
o School statistics – Indiana 463 o Libraries, all classes, public, by type – number and
volumes, 1850-1870 474 o Newspapers and periodicals, by type, 1850-1870 482 o Churches – organizations, edifices, sittings,
property - by congregation, 1850-1870 506

Indiana Statistics in the Decennial Census Publications Census / Description of Statistics Page Number
Indiana State Library
o Churches – Indiana, by counties 536 o Pauperism and crime, 1850-1870 568 o Historical notes on the formation of the territory and
state of Indiana 575 o Description of parcels of territory into which the U.S.
has been divided by the successive boundaries of political subdivisions – Indiana (Territory and State) 582
o Table showing parcels of territory of which each political division of the U.S. was composed at specific dates, 1780-1868 588
o Land areas, density, families, dwellings, 1850-1870 595 o Rank in population, families, dwellings, population -
Indianapolis 598 o Population, families, dwellings – Indianapolis,
by ward 601 o Population of native and foreign born – by race,
by sex, 1850-1870 606 o Population of native and foreign born – by race,
by sex, by age 618 o Population – Indiana, by counties – by age, by sex 626 o Population – Indiana, selected townships and
towns – by age, by sex 643 o Occupations, by class, 1860 & 1870 664 o Occupations, by class – by sex, by age 670 o Occupations, by type – total population 674 o Occupations, by type – females engaged 686 o Occupations, by class – by age, by sex, by nativity 698 o Occupations, by type – by age, by sex, by nativity 704 o Occupations, by class and type – Indiana – by age,
by sex, by age, by selected nativity 732 o Occupations, by class – Indianapolis – by age,
by sex, by selected nativity 768 o Occupations, by type – Indianapolis – by age,
by sex, by selected nativity 786 Maps included in this volume
o Population density xlxi o Density of foreign population 297 o Density of German and Irish populations 326 o Density of English and Welsh, Swedish
and Norwegian, British, and Chinese population 343 o Illiteracy and wealth distribution 392 o U.S. acquisition and transfer of territory, 1780-1870 571

Indiana Statistics in the Decennial Census Publications Census / Description of Statistics Page Number
Indiana State Library
Volume 1, Part 2: Tables 1-8 Table 1: The United States
o Population – by state, by race, 1790-1870 3 Table 2: Indiana counties
o Population – by counties, by race, 1800-1870 25 Table 3: Indiana townships, cities, towns, wards
o Population – by townships, cities, towns, wards 1850-1870 122
Table 4: Nativity and Foreign Parentage, by state,
1850-1870 299 Table 5: Nativity and Foreign Parentage, by county,
1860 &1870 308 Table 6: Nativities, by State
o Place of birth of native born population 328 o Place of birth of foreign born population 336
Table 7: Nativities, by Counties
o Place of birth of native and foreign born – Indiana 352 Table 8: Nativities, Fifty Principle Cities
o Place of birth of native and foreign born – Indianapolis 380
Volume 2: Vital Statistics Introduction:
o Deaths from certain principle diseases with proportion to deaths from all causes xx
Mortality
o Deaths, by sex, 1850-1870 3 o Deaths, by sex, by age, 1850-1870 6 o Deaths, by sex, by month in 1870 10

Indiana Statistics in the Decennial Census Publications Census / Description of Statistics Page Number
Indiana State Library
o Deaths, by race, by nationality 15 o Deaths, by cause, by sex, by age 69 o Deaths, by cause, by sex, by month in 1870 235 o Deaths, by cause, by race, by nationality 331 o Deaths, by cause, by occupation 405 o Deaths, by sex, by race, by age 416
Blind, Deaf and Dumb, Insane, and Idiotic
o Summaries, by race, by sex 428 o Blind – by race, by sex, by nativity, by place of birth 432 o Blind – by race, by sex, by age 447 o Deaf and dumb – by race, by sex, by nativity, by
place of birth 453 o Deaf and dumb – by race, by sex, by age 467 o The insane – by race, by sex, by nativity, by
place of birth 473 o The insane – by race, by sex, by age 487 o The idiotic – by race, by sex, by nativity, by place
of birth 492 o The idiotic – by race, by sex, by age 505 o Persons appearing more than once in the tables of
“unfortunates”, by race, by sex 510 Births and Ages
o Persons born in, and surviving at the close of, each census year, with proportion to living persons, 1850-1870 532
o Population – by race, by sex, by nativity, 1850-1870 536
o Population – by age, by sex, 1850-1870 560 o Native population – by age, by sex 580 o Foreign-born population – by age, by sex 596 o White population – by age, by sex, 1850-1870 608 o Native white population – by age, by sex 624 o Foreign-born white population – by age, by sex 636 o Colored population – by age, by sex, 1850-1870 648 o Civilized Indians and Chinese population – by age,
by sex, 1860 & 1870 662 o Persons aged 80 years and over – by sex 673
Maps included in this volume
o Deaths from consumption xxiv o Deaths from malarial diseases 145 o Deaths from enteric, cerebro-spinal, and typhus
fevers 304

Indiana Statistics in the Decennial Census Publications Census / Description of Statistics Page Number
Indiana State Library
o Deaths from intestinal diseases 424 o Elevation curves 513 o Mean temperature for the year 578 o Mean precipitation of rain and melted snow 649
Volume 3: Wealth and Industry Statement of funded debt – Indiana 6 Wealth, taxation, and public indebtedness
o Valuation of property, taxation, and public debt, 1860 & 1870 10
o Indiana, by counties 27 Agriculture
o Sheep and wool 74 o Horses and neat cattle 75 o Productions of agriculture - Acreage in farms, cash
value, wages, value of implements, products, crops, livestock, etc. 81
o Productions of agriculture – Indiana, by counties 138 o Selected statistics – Indiana, by townships 297 o Number and size of farms 340 o Number and size of farms – Indiana, by counties 350
Manufactures – General
o Number of establishments, with remarks 388 o Number of establishments and production, capital,
wages, materials, 1850-1870 393 o Products of industry, by type 411 o Number of establishments and production, capital,
wages, materials – Indiana, by counties 512 o Industries, by type – Indiana 513
Manufactures – Special
o Number of establishments, quantities, value of materials and of products, number and kind of machine used in production, by type 588
o By type – Indiana, by counties 655 Mining and The Fisheries:
o Mining – establishments, quantities, employment, capital, wages, materials, products 759

Indiana Statistics in the Decennial Census Publications Census / Description of Statistics Page Number
Indiana State Library
o Coal, bituminous, Iron ore, and Stone – Indiana 761 o Mining industry, by type 767 o Coal, bituminous, Iron ore, and Stone – Indiana, by
counties 774 o Fisheries - establishments, quantities, employment,
capital, wages, materials, products 792 Occupations:
o Occupations, by class, by sex 808 o Occupations, by type, 812 o Occupations, by class, by sex, by age, by nativity 826
Maps included in this volume
o Wheat 81 o Corn 121 o Cotton 161 o Hay 217 o Tobacco 289 o Diary products 369 o Geological formations end
o Description of geological map 754 9th Census of the United States (1870) - Compendium p.d. 317 Un70c – 3rd floor across from map room http://www.census.gov/prod/www/abs/decennial/1870.htm Population:
o Population at each census, by race, 1790-1870 8 o Population at each census, by race, 1800-1870 -
Indiana, by counties 42 o Population, by nativity, by race – Indiana, by
counties, townships, cities, towns 166 o Population, by nativity, by foreign parentage,
1850-1870 376 o Native population, by place of birth 378 o Native white population, by place of birth 383 o Native colored population, by place of birth 388 o Foreign-born population, by place of birth 392 o German population, by place of birth 394 o British population, by place of birth 396 o British American population, by place of birth 397 o Native and foreign-born population, by place of
birth - Indiana, by counties 409 o Native population, by place of birth – Indianapolis 444
Indiana Statistics in the Decennial Census Publications Census / Description of Statistics Page Number
Indiana State Library
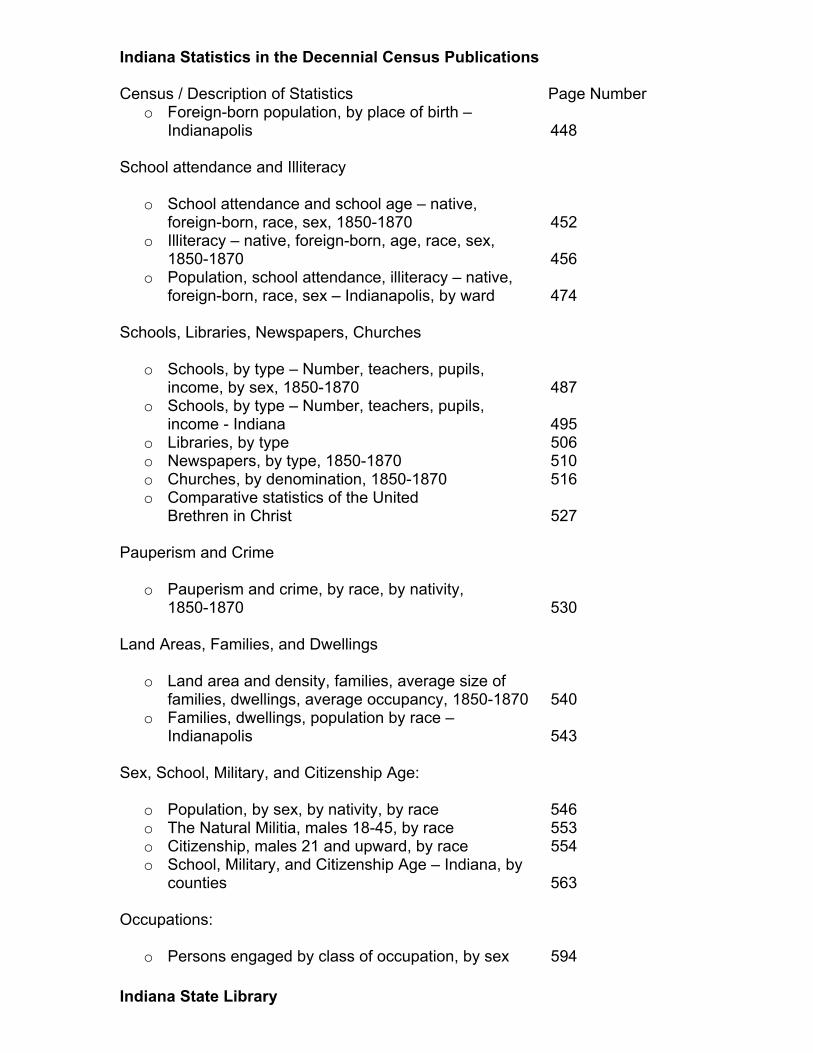
o Foreign-born population, by place of birth – Indianapolis 448
School attendance and Illiteracy
o School attendance and school age – native,
foreign-born, race, sex, 1850-1870 452 o Illiteracy – native, foreign-born, age, race, sex,
1850-1870 456 o Population, school attendance, illiteracy – native,
foreign-born, race, sex – Indianapolis, by ward 474 Schools, Libraries, Newspapers, Churches
o Schools, by type – Number, teachers, pupils, income, by sex, 1850-1870 487
o Schools, by type – Number, teachers, pupils, income - Indiana 495
o Libraries, by type 506 o Newspapers, by type, 1850-1870 510 o Churches, by denomination, 1850-1870 516 o Comparative statistics of the United
Brethren in Christ 527 Pauperism and Crime
o Pauperism and crime, by race, by nativity, 1850-1870 530
Land Areas, Families, and Dwellings
o Land area and density, families, average size of families, dwellings, average occupancy, 1850-1870 540
o Families, dwellings, population by race – Indianapolis 543
Sex, School, Military, and Citizenship Age:
o Population, by sex, by nativity, by race 546 o The Natural Militia, males 18-45, by race 553 o Citizenship, males 21 and upward, by race 554 o School, Military, and Citizenship Age – Indiana, by
counties 563 Occupations:
o Persons engaged by class of occupation, by sex 594

Indiana Statistics in the Decennial Census Publications Census / Description of Statistics Page Number
Indiana State Library
o Persons engaged by class of occupation, by age groups 596
o Persons engaged by class of occupation, by nativity 599 o Persons engaged by class of occupation,
by age groups - Indianapolis 618 o Persons engaged by class of occupation, by
nativity - Indianapolis 621 The Blind, Deaf and Dumb, Insane, and Idiotic
o The blind, by race, by sex 626 o The blind, by nativity 627 o The deaf and dumb, by race, by sex 628 o The deaf and dumb, by nativity 629 o The insane, by race, by sex 630 o The insane, by nativity 631 o The idiotic, by race, by sex 632 o The idiotic, by nativity 633
Wealth, Taxation, and Public Indebtedness
o Valuation of property, 1850-1870 638 o Taxation, 1860 & 1870 640 o Public indebtedness 641 o Valuation, taxation, and public indebtedness –
Indiana, by counties 652 Agriculture
o Farms, number, acreage, average size, 1850-1870 688 o Values of farms, implements, and machinery,
1850-1870 690 o Sheep and wool, 1860 & 1870 691 o Values of farm productions and wages, by class,
1850-1870 692 o Principle cereal productions, 1850-1870 694 o Horses and neat cattle 697 o Principle fibrous production, 1850-1870 698 o Hay, hops, rice, tobacco, 1850-1870 700 o Sugar and molasses, 1850-1870 702 o Potatoes, peas and beans, beeswax, honey,
and wine, 1850-1870 704 o Clover, grass, and flaxseed, 1850-1870 707 o Livestock on farms, 1850-1870 708 o Dairy products, 1850-1870 711 o Selected statistics of agriculture – Indiana,
by counties 728

Indiana Statistics in the Decennial Census Publications Census / Description of Statistics Page Number
Indiana State Library
Manufactures, Mining, and Fisheries
o Manufactures, mills, hands employed, capital invested, wages, materials, products, 1850-1870 797
o Manufactures, mills, hands employed (by sex and age group), capital invested, wages, materials, products - Indiana, by counties 820
o Manufactures, by selected industries 852 o Groups of principle industries 873 o Manufactures: Special statistics for principle
industries 886 o Mining, including quarrying, oil-boring, and
peat-cutting 940 o Fisheries, excluding whale fishery 941
Index for finding treatment of topics affecting the Table of Manufactures 942

Indiana Statistics in the Decennial Census Publications Census / Description of Statistics Page Number
Indiana State Library
10th Census of the United States (1880) p.d. 317 Un80 – 3rd floor across from map room http://www.census.gov/prod/www/abs/decennial/1880.htm Volume 1: Population Index to Illustrations and Maps Front Detailed Table of Contents I Introduction
o Progress of the nation: 1790-1880 XI o Vacant spaces on the map of population XXI o The settle area in 1880 XXIV o Cities XXVIII o The center of population XXXI
Elements of Population
o Population of the U.S., by sex XXXIV o Population of the U.S., by race XXXVI o Population of the U.S., native and foreign-born XXXIX
Influence of the Physical Features Upon the Distribution of the Population XLII Supervisors’ Districts – Indiana LXXXIII General Population Tables
o The United States, by state 1 o Indiana, by counties, 1790-1880 58 o Indiana, by townships, cities, towns 147 o Indiana, by place 156
Population, by Race, Sex, and Nativity
o By state, by race, 1860-1880 378 o Indiana, by counties, by race 388 o Indiana, by cities and towns (4,000+), by race,
1870 & 1880 417 o By state, by nativity, 1860-1880 426 o Indiana, by counties, by nativity, 1870 & 1880 431 o Indiana, by cities and towns (4,000+), by nativity,
1870 & 1880 448
Indiana Statistics in the Decennial Census Publications Census / Description of Statistics Page Number
Indiana State Library
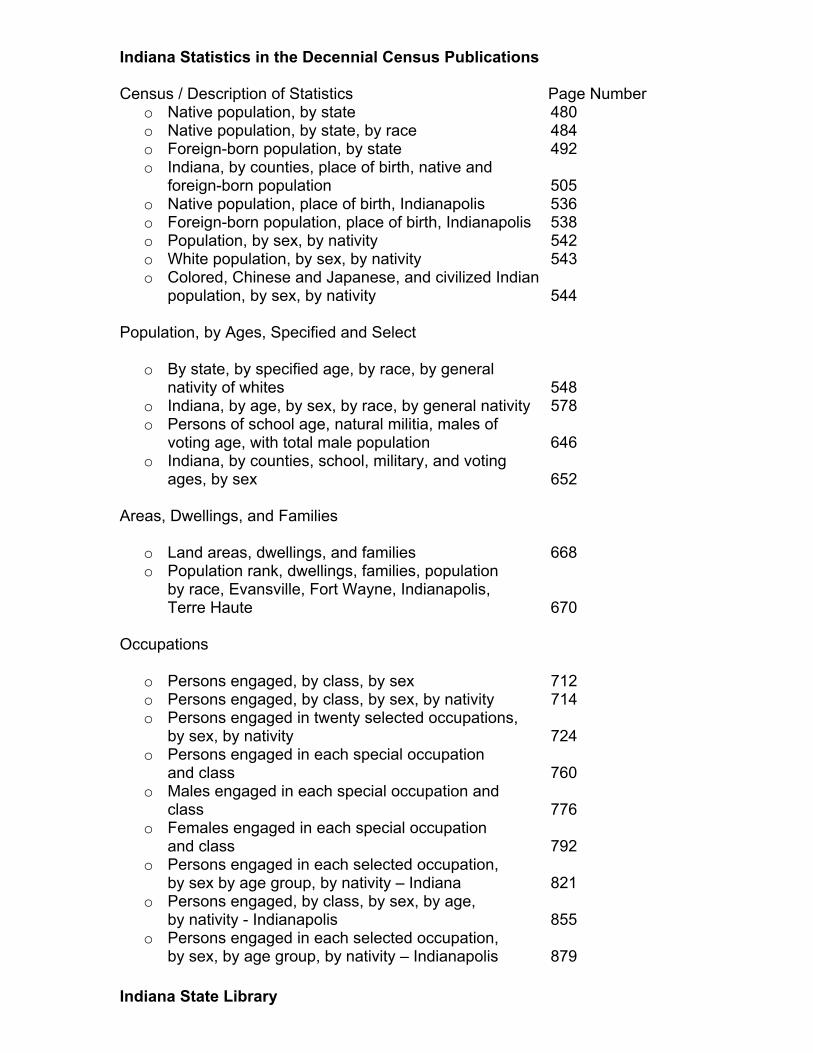
o Native population, by state 480 o Native population, by state, by race 484 o Foreign-born population, by state 492 o Indiana, by counties, place of birth, native and
foreign-born population 505 o Native population, place of birth, Indianapolis 536 o Foreign-born population, place of birth, Indianapolis 538 o Population, by sex, by nativity 542 o White population, by sex, by nativity 543 o Colored, Chinese and Japanese, and civilized Indian
population, by sex, by nativity 544 Population, by Ages, Specified and Select
o By state, by specified age, by race, by general nativity of whites 548
o Indiana, by age, by sex, by race, by general nativity 578 o Persons of school age, natural militia, males of
voting age, with total male population 646 o Indiana, by counties, school, military, and voting
ages, by sex 652 Areas, Dwellings, and Families
o Land areas, dwellings, and families 668 o Population rank, dwellings, families, population
by race, Evansville, Fort Wayne, Indianapolis, Terre Haute 670
Occupations
o Persons engaged, by class, by sex 712 o Persons engaged, by class, by sex, by nativity 714 o Persons engaged in twenty selected occupations,
by sex, by nativity 724 o Persons engaged in each special occupation
and class 760 o Males engaged in each special occupation and
class 776 o Females engaged in each special occupation
and class 792 o Persons engaged in each selected occupation,
by sex by age group, by nativity – Indiana 821 o Persons engaged, by class, by sex, by age,
by nativity - Indianapolis 855 o Persons engaged in each selected occupation,
by sex, by age group, by nativity – Indianapolis 879

Indiana Statistics in the Decennial Census Publications Census / Description of Statistics Page Number
Indiana State Library
Miscellaneous
o Newspapers and periodicals, by periods of issue, by type, by language, by denomination 912
o Public schools, number, buildings, property value, finances, teachers (by race), average pay, pupils (by race), average daily attendance 916
o Illiteracy, by sex, by age, by race, by nativity 919 o The insane, idiotic, blind and deaf-mutes, by sex, by
nativity, by race 926 o Paupers, by sex, by nativity, by race 928 o Prisoners, by sex, by nativity, by race 929
Index 931 Volume 2: Manufactures Top # (Bottom #) Index to Illustrations Front Remarks
o Agricultural rank and Manufacturing rank, by state xii (*12) o General statistics of manufactures, 1850-1880 xiii (*13) o Ratio of increase in population from 1870 to 1880,
compared to ratio of increase in manufacturing xvi (*16) o Distribution of 100 principle cities by state, with
related statistics xxiii (*23) o Gross product, net product, hands employed, and
wages page – 100 principle cities, (incl. Indianapolis, Terre Haute, Evansville, Fort Wayne) xxiv (*24)
o Rank of six leading industries in the top 30 cities, (incl. Indianapolis) xxvii (*27)
o Persons engaged, by age, by sex, by nativity xxx (*30) o Persons engaged, by age, by sex, by nativity –
Indianapolis xxxiii (*33) o Percent contribution, by age group, to
total employment xxxv (*35) o Percent contribution, by age group, to
total employment - Indianapolis xxxv (*35) o Percent contribution, by nativity, to total employment xxxvii (*37) o Percent contribution, by nativity, to total employment -
Indianapolis xxxviii (*38) o Manufactures, in 1810 xlix (*49)
General Statistics
o List of special agents and assistants, length of service, compensation – Evansville, Fort Wayne, Indianapolis,

Indiana Statistics in the Decennial Census Publications Census / Description of Statistics Page Number
Indiana State Library
Jeffersonville & New Albany, La Fayette, Logansport, Madison, Richmond, South Bend, Terre Haute, Vincennes v (5)
o Manufactures – establishments, capital, employees, wages, value of materials and products, 1850-1880 5 (15)
o Manufactures, by each specified industry 15 (25) o Manufactures – Indiana, by counties 111 (121) o Manufactures – Indiana, by specified industry 112 (122) o Manufactures – Indiana, by counties, by
specified industry 223 (233) o Manufactures, by 100 principle cities 389 (399) o Manufactures, by specified industries
o Evansville 402 (412) o Fort Wayne 403 (413) o Indianapolis 405 (415) o Terre Haute 440 (450)
o Special statistics for principle industries 446 (456) o Index to manufacturing statistics 467 (477)
Power Used in Manufactures
o Table of contents iii (489) o Power used, with percentage increase, 1870 & 1880 2 (494) o Percentage of water versus steam-power used,
1870 & 1880 3 (495) o Percentage and total amount of steam- and water-
power used, with rank 5 (497) o Average amount of steam- and water-power used per
square mile 6 (498) o Power used – number of establishments, wheels,
horse-power, boilers, engines 9 (501) o Power used – by certain industries 11 (503) o Power used – by state, by certain industries 21 (513) o Index 31 (523)
Factory System
o Table of contents iii (529) o Cotton industry – establishments, spindles, looms,
employees, capital invested, wages paid, cotton consumed, value of materials, quantity and value of products 10 (542)
o Progress of wages, 1840-1880 47 (579) o Index 75 (607)
Interchangeable Mechanism
o Table of contents iii (613)

Indiana Statistics in the Decennial Census Publications Census / Description of Statistics Page Number
Indiana State Library
o Agricultural implements - change in number of operatives employed, 1850-1880 74 (690)
o Agricultural implements – change in number of operatives per establishment, 1850-1880 74 (690)
o Agricultural implements – change in number of establishments 74 (690)
o Index 87 (703) Iron and Steel Production
o Table of contents iii (731) o Index of maps iv (732) o Relative rank in production, 1870-1880 4 (740) o Production of rails 8 (744) o Statistics of blast furnaces ` 10 (746) o Statistics of iron rolling mills 14 (750) o Aggregate of iron and steel manufactures 25 (761) o Aggregate of iron and steel manufactures – Indiana,
by counties 26 (762) o History – Early iron enterprises in Indiana &
Indianapolis 105 (841) o Index 155 (891)
Cotton Manufactures
o Establishments, capital, spindles, looms, average number of yarn, employees (by type, by sex), wages, materials (consumed and value of), products (manufactured and value of) 16 (956)
o Index 17 (957) Wool Manufactures
o Establishments, capital, machines, looms, spindles, employees (by type, by sex), wages, materials, products - by type of good produced 4 (966)
o Index 21 (983) Chemical Products and Salt
o Table of contents iii (987) o Potash, approximate percentage value 3 (993) o Statistics of the chemical industry 4 (994) o Geographic distribution of the industry 17 (1007) o Potash – number of establishments, pounds and
value of product 20 (1010) o Index 37 (1027)
Indiana Statistics in the Decennial Census Publications Census / Description of Statistics Page Number
Indiana State Library
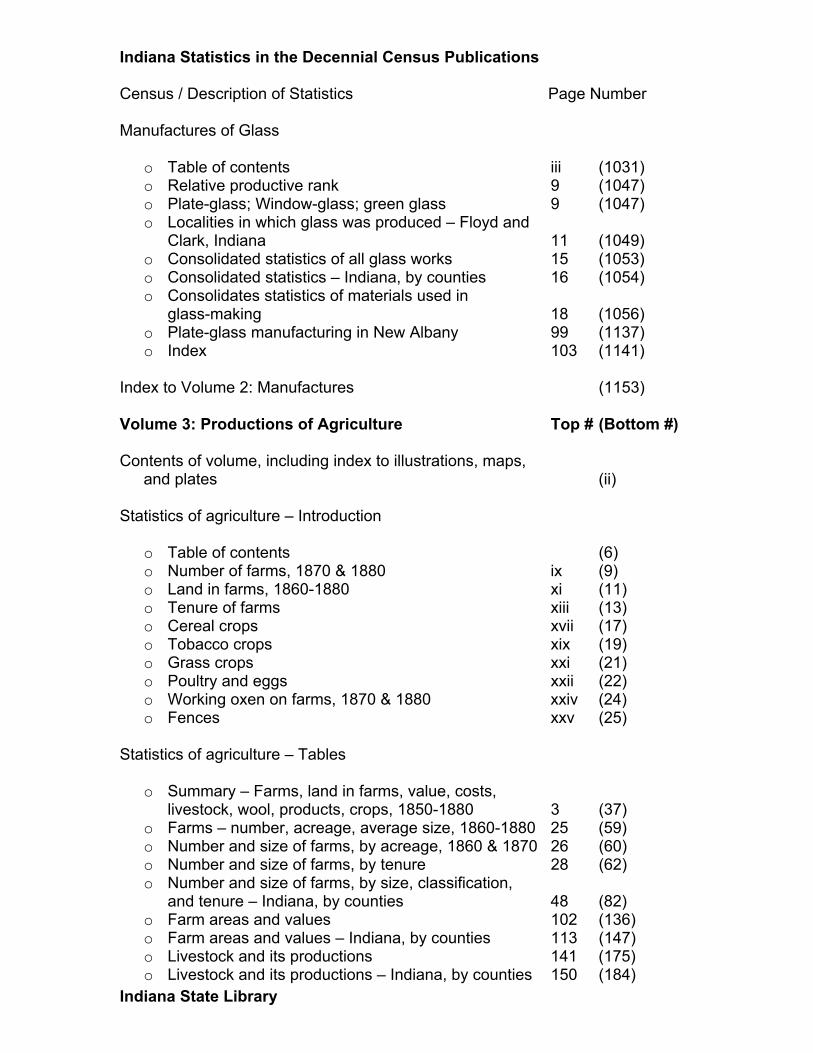
Manufactures of Glass
o Table of contents iii (1031) o Relative productive rank 9 (1047) o Plate-glass; Window-glass; green glass 9 (1047) o Localities in which glass was produced – Floyd and
Clark, Indiana 11 (1049) o Consolidated statistics of all glass works 15 (1053) o Consolidated statistics – Indiana, by counties 16 (1054) o Consolidates statistics of materials used in
glass-making 18 (1056) o Plate-glass manufacturing in New Albany 99 (1137) o Index 103 (1141)
Index to Volume 2: Manufactures (1153) Volume 3: Productions of Agriculture Top # (Bottom #) Contents of volume, including index to illustrations, maps,
and plates (ii) Statistics of agriculture – Introduction
o Table of contents (6) o Number of farms, 1870 & 1880 ix (9) o Land in farms, 1860-1880 xi (11) o Tenure of farms xiii (13) o Cereal crops xvii (17) o Tobacco crops xix (19) o Grass crops xxi (21) o Poultry and eggs xxii (22) o Working oxen on farms, 1870 & 1880 xxiv (24) o Fences xxv (25)
Statistics of agriculture – Tables
o Summary – Farms, land in farms, value, costs, livestock, wool, products, crops, 1850-1880 3 (37)
o Farms – number, acreage, average size, 1860-1880 25 (59) o Number and size of farms, by acreage, 1860 & 1870 26 (60) o Number and size of farms, by tenure 28 (62) o Number and size of farms, by size, classification,
and tenure – Indiana, by counties 48 (82) o Farm areas and values 102 (136) o Farm areas and values – Indiana, by counties 113 (147) o Livestock and its productions 141 (175) o Livestock and its productions – Indiana, by counties 150 (184)
Indiana Statistics in the Decennial Census Publications Census / Description of Statistics Page Number
Indiana State Library
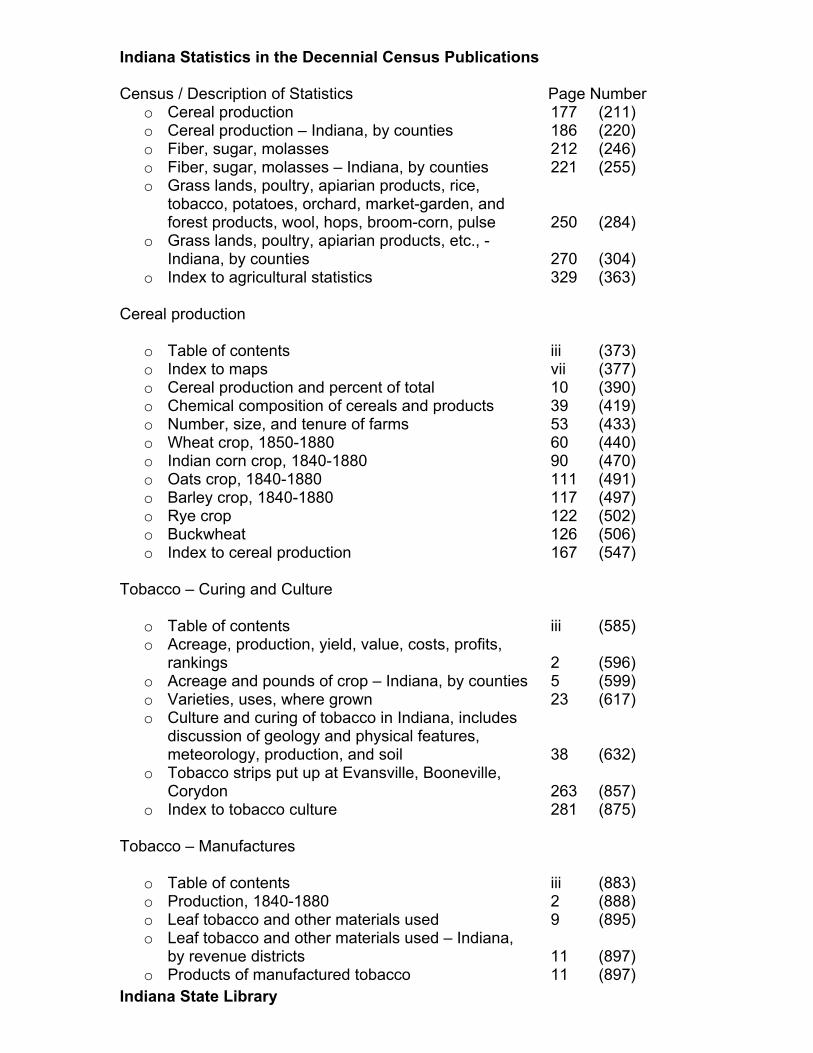
o Cereal production 177 (211) o Cereal production – Indiana, by counties 186 (220) o Fiber, sugar, molasses 212 (246) o Fiber, sugar, molasses – Indiana, by counties 221 (255) o Grass lands, poultry, apiarian products, rice,
tobacco, potatoes, orchard, market-garden, and forest products, wool, hops, broom-corn, pulse 250 (284)
o Grass lands, poultry, apiarian products, etc., - Indiana, by counties 270 (304)
o Index to agricultural statistics 329 (363) Cereal production
o Table of contents iii (373) o Index to maps vii (377) o Cereal production and percent of total 10 (390) o Chemical composition of cereals and products 39 (419) o Number, size, and tenure of farms 53 (433) o Wheat crop, 1850-1880 60 (440) o Indian corn crop, 1840-1880 90 (470) o Oats crop, 1840-1880 111 (491) o Barley crop, 1840-1880 117 (497) o Rye crop 122 (502) o Buckwheat 126 (506) o Index to cereal production 167 (547)
Tobacco – Curing and Culture
o Table of contents iii (585) o Acreage, production, yield, value, costs, profits,
rankings 2 (596) o Acreage and pounds of crop – Indiana, by counties 5 (599) o Varieties, uses, where grown 23 (617) o Culture and curing of tobacco in Indiana, includes
discussion of geology and physical features, meteorology, production, and soil 38 (632)
o Tobacco strips put up at Evansville, Booneville, Corydon 263 (857)
o Index to tobacco culture 281 (875) Tobacco – Manufactures
o Table of contents iii (883) o Production, 1840-1880 2 (888) o Leaf tobacco and other materials used 9 (895) o Leaf tobacco and other materials used – Indiana,
by revenue districts 11 (897) o Products of manufactured tobacco 11 (897)

Indiana Statistics in the Decennial Census Publications Census / Description of Statistics Page Number
Indiana State Library
o Products of manufactured tobacco – Indiana, by revenue districts 13 (899)
o Leaf tobacco used for cigars/cigarettes 13 (899) o Leaf tobacco used for cigars/cigarettes and number
manufactured – Indiana, by revenue districts 14 (900) o Rank of states in manufacturing, by type of product 15 (901) o Rank of cities in manufacturing, by type -
Indianapolis, Terre Haute, Michigan City 19 (905) o Chewing and smoking tobacco and snuff 22 (908) o Cigars and cigarettes 22 (908) o Sources of tax revenue 35 (921) o Receipts of western crops in western markets 51 (937) o Index 63 (949)
Cattle, Sheep, and Swine
o Table of contents iii (953) o On farms, ranch and range, estimated total 150 (1104) o Index 157 (1111)
Index to Volume 3: Agriculture 163 (1117) Volume 4: Agencies of Transportation Top # (Bottom #) Contents of volume (2) Railroads
o Table of contents iii (7) o General financial exhibit 25 (37) o General financial exhibit – Group II (incl. Indiana) 31 (43) o General balance-sheet 60 (72) o General balance-sheet – Group II (incl. Indiana) 70 (82) o Results of traffic operations 132 (144) o Results of traffic operations – Group II (incl. Indiana) 146 (158) o Mileage, traffic, etc. 226 (238) o Mileage, traffic, etc. – Group II (incl. Indiana) 228 (240) o Classification of freight: number of tons carried 246 (258) o Classification of freight: number of tons carried -
Group II (incl. Indiana) 247 (259) o Equipment and employees 257 (269) o Equipment and employees – Group II (incl. Indiana) 261 (273) o Accidents 280 (292) o Accidents – Group II (incl. Indiana) 281 (293) o History of construction 289 (301) o History of construction – Group II (incl. Indiana) 297 (309) o Mileage of completed road - Indiana 307 (319) o History of construction, by decade 308 (320)

Indiana Statistics in the Decennial Census Publications Census / Description of Statistics Page Number
Indiana State Library
o History of construction – Group II (incl. Indiana), by corporation 318 (330)
o Statement of mileage 376 (388) o Statement of mileage – Group II (incl. Indiana) 380 (392) o Statements relating to grades and curves –
Group II (incl. Indiana) 424 (436) o Roadway and track – Group II (incl. Indiana) 472 (484) o Summary of miles of finished road – Indiana 506 (518) o Statement exhibiting miles of road – Indiana 509 (521) o Statement of funded debt of railroad corporations –
Group II (incl. Indiana) 533 (545) o Statement of public land grants to railroads 566 (578) o Statement exhibiting rolling stock manufactured 570 (582) o Statement exhibiting fuel consumed 575 (587) o Condensed descriptions of agreements or
contracts, etc. 584 (596) o Index to statistics of railroads 603 (615)
Steam Navigation
o Table of contents iii (655) o Number, tonnage, value, capital invested, service,
and traffic of the steam craft 46 (704) o Number, tonnage, value, capital invested, service,
and traffic of the steam craft, by type 53 (711) o Merchant tonnage 60 (718) o Index to steam navigation 63 (721)
Canals
o Table of contents iii (727) o Abandoned canals, lengths, points connected,
when built, when abandoned, cost of construction 31 (761) o Index to canals 33 (763)
Telegraphs and Telephones
o Table of contents iii (767) o General financial exhibit – Columbus, Connersville,
Evansville, Vincennes, Muncie, Rushville 18 (788) o Service account – Columbus, Connersville, etc. 24 (794) o Index to telegraphs and telephones 27 (797)
Index to Volume of Agencies of Transportation (857)

Indiana Statistics in the Decennial Census Publications Census / Description of Statistics Page Number
Indiana State Library
Volume 5 & 6: Cotton Production (Parts I & II) (No statistics for Indiana) Volume 7: Valuation, Taxation, & Public Indebtedness List of illustrations (plates and maps) ii Table of contents iii Part I: Valuation and Taxation Introduction
o True valuation & per capita value of real and and personal property, 1850 3
o Assessed, true, and per capita valuation of real and personal property, 1860 4
o State rankings 5 o Assessed, true, and per capita valuation of real
and personal property, 1870 6 o State rankings, 1850-1870 7 o Population, assessed and estimated true
valuation, 1860 & 1870 8 o Property valuation by location, 1880 12 o Property valuation by ownership, 1870 & 1880 13 o State rankings, 1870 & 1880 14 o Per capita value of property, location vs. ownership 15 o Total assessed, estimated true, and ratio 16 o Graph, assessed valuation Plate I o Per capita value of real and personal property 17 o Aggregate taxes levied and per capita tax 18 o Graph, taxation per capita Plate II o Proportions of population, school, other, and
total taxation 19 o Proportions of school and other taxation 19 o Proportions of population, valuation, taxation 20 Statistics Tables o Graph, relative amounts of taxes levied Plate V o Graph, relative assessed valuations Plate VI o Summary, assessed valuation and taxation 25 o Chart, assessed valuation, taxation, and public
indebtedness, shown comparatively Plate XII o Valuation and taxation – Indiana, by counties
and cities 155 o Notes on city tax levies – summary tables 217

Indiana Statistics in the Decennial Census Publications Census / Description of Statistics Page Number
Indiana State Library
o Financial condition of cities having a population of 7,500 and over, summary 218
o Financial condition of cities having a population of 7,500 and over, summary – Indiana, by cities 222
o Notes on city tax levies – receipts 234 o Financial condition of cities having a population
of 7,500 and over, receipts 235 o Financial condition of cities having a population
of 7,500 and over, receipts – Indiana, by cities 237 o Notes on city tax levies – expenditures 244 o Financial condition of cities having a population
of 7,500 and over, expenditures 245 o Financial condition of cities having a population
of 7,500 and over, expenditures – Indiana, by cities 250 Part II – Public Indebtedness Introduction
o Total, state, county, and municipal debt, 1870 & 1880 284 o Population, total debt, per capital debt, and
increase or decrease, 1870 & 1880 285 o State rankings, total indebtedness, per capita debt,
increase or decrease of debt, percent increase, 1870 & 1880 286
o Net city debt, per capita 289 Ownership of National Debt
o Graphs, showing proportion of amounts and number of holders of registered bonds Plates IX and X
o Distribution of holders, total and percentage 492 o Rankings, total amount held 492 o Private bondholders 493 o Registered holders of 4, 4 ½, 5% bonds,
by sex of private holders and corporations 494 o Registered holders of 4, 4 ½, 5% bonds, by sex of
private holders and corporations – Indiana, by cities 496 o Registered holders of 4, 4 ½, 5% bonds,
by sex of private holders, by amounts held 498 o Registered holders of 4% consoles of 1907, by sex 502 o Registered holders of 4% consoles of 1907, by sex,
by amounts held 503 o Registered holders of 4 ½% funded loan, 1891-’98,
by sex 507 o Registered holders of 4 ½% funded loan, 1891-’98,
by sex, by amounts held 508 o Registered holders of 5% funded loan, 1881, by sex 512 o Registered holders of 5% funded loan, 1881, by sex,
by amounts held 513
Indiana Statistics in the Decennial Census Publications Census / Description of Statistics Page Number
Indiana State Library
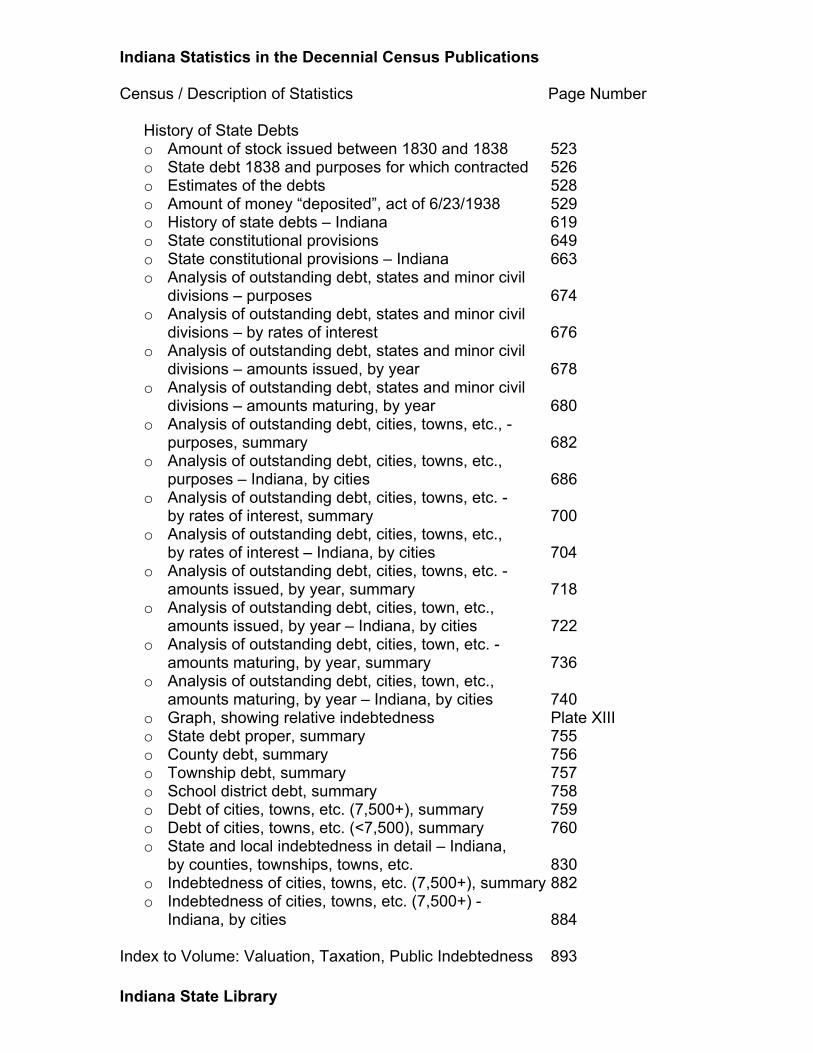
History of State Debts
o Amount of stock issued between 1830 and 1838 523 o State debt 1838 and purposes for which contracted 526 o Estimates of the debts 528 o Amount of money “deposited”, act of 6/23/1938 529 o History of state debts – Indiana 619 o State constitutional provisions 649 o State constitutional provisions – Indiana 663 o Analysis of outstanding debt, states and minor civil
divisions – purposes 674 o Analysis of outstanding debt, states and minor civil
divisions – by rates of interest 676 o Analysis of outstanding debt, states and minor civil
divisions – amounts issued, by year 678 o Analysis of outstanding debt, states and minor civil
divisions – amounts maturing, by year 680 o Analysis of outstanding debt, cities, towns, etc., -
purposes, summary 682 o Analysis of outstanding debt, cities, towns, etc.,
purposes – Indiana, by cities 686 o Analysis of outstanding debt, cities, towns, etc. -
by rates of interest, summary 700 o Analysis of outstanding debt, cities, towns, etc.,
by rates of interest – Indiana, by cities 704 o Analysis of outstanding debt, cities, towns, etc. -
amounts issued, by year, summary 718 o Analysis of outstanding debt, cities, town, etc.,
amounts issued, by year – Indiana, by cities 722 o Analysis of outstanding debt, cities, town, etc. -
amounts maturing, by year, summary 736 o Analysis of outstanding debt, cities, town, etc.,
amounts maturing, by year – Indiana, by cities 740 o Graph, showing relative indebtedness Plate XIII o State debt proper, summary 755 o County debt, summary 756 o Township debt, summary 757 o School district debt, summary 758 o Debt of cities, towns, etc. (7,500+), summary 759 o Debt of cities, towns, etc. (<7,500), summary 760 o State and local indebtedness in detail – Indiana,
by counties, townships, towns, etc. 830 o Indebtedness of cities, towns, etc. (7,500+), summary 882 o Indebtedness of cities, towns, etc. (7,500+) -
Indiana, by cities 884 Index to Volume: Valuation, Taxation, Public Indebtedness 893

Indiana Statistics in the Decennial Census Publications Census / Description of Statistics Page Number
Indiana State Library
Volume 8: The Newspaper and Periodical Press; Alaska; The Seal Islands of Alaska; The Ship-Building Industry The Newspaper and Periodical Press
o List of Illustrations ii o Table of contents iii o List of journals published in 1810 – Indiana Territory 44 o General statement for 1810 45 o Progress of the American press, 1776-1840 47 o Previous federal and state censuses of newspapers 52 o The half-century press 64 o Population and number of dailies published -
Indiana, by counties and towns 67 o Population, number of dailies published, circulation,
rankings – Indianapolis 77 o Tax imposed on advertisements, 1867 & 1880 86 o Newspapers regularly receiving AP dispatches 107 o Number of newspapers and magazines mailed to
subscribers 158 Statistical Tables
o Newspapers and periodicals, by periods of issue and class 170
o Average and aggregate circulation, with average subscription price 172
o Circulation, by periods of issue 174 o Wages, value of products, receipts from advertising,
receipts from subscription, employees 178 o Employees, pounds of type, presses owned 180 o Pounds of paper used, reams of paper used 181 o Newspapers established and suspended, 1850-1880 182 o Statistics of German language newspapers 183 o Newspapers devoted to religion, by denomination 185 o Comparative exhibit of number and circulation, by
decade, by periods of issue, 1850-1880 187 o Land area, population, number of publications,
circulation, average number of inhabitants to circulation, average land area per publication 192
o Number of counties and towns in which newspapers were published 193
o Newspapers, by periods of publication, by language 194 Catalogue of Publications
o Indiana – by counties, by cities 231

Indiana Statistics in the Decennial Census Publications Census / Description of Statistics Page Number
Indiana State Library
Chronological History
o Indiana 363 Bound files of American newspapers in the possession
of the American Antiquarian Society, Worcester (MA) 430 Index to Newspaper and Periodical Press 437 Ship-Building Industry of the United States Table of contents iii Fishing Vessels
o Persons employed, apparatus and capital 2 Steam Vessels
o Sizes of model barges built in Jeffersonville 184 o Discussion of shipyards in Indiana 191
Statistics of Ship-Building o Number, tonnage, and value of vessels built 253 o Number, tonnage, and value of vessels built -
Indiana, by counties 254 o Number and tonnage of vessels, establishments,
capital, employment, wages, materials used, value of products, by type 260
Index to report on Ship-Building 267 Volume 9: Part I: Forests of North America Table of contents v List of maps including maps contained in portfolio (part 2) accompanying volume 9 vii Woods
Specific gravity, ash, and weight of specimens 300 “ 340 Behavior of the principal woods under
transverse strain 404 Forests in their Economic Aspects
Statistics of the lumbering industry – establishments, capital, employment, labor, materials, products 486
Average size and product of saw-mills 488

Indiana Statistics in the Decennial Census Publications Census / Description of Statistics Page Number
Indiana State Library
Estimated consumption of wood for domestic
purposes 489 Forest fires – area burned, value of property
destroyed, causes 491 Forests of the U.S. – Indiana 547
General Index to Volume 9: Forests of North America Volume 9: Part II: Maps Accompanying Vol. 9, Report on Forestry Trees of North America List of maps is found in Part I, page vii. Volume 10: Petroleum and its Products; The Manufacture of Coke; Building Stones Petroleum and its Products
Table of Contents iii List of illustrations – maps, charts, plates v State in which liquid or gaseous bitumen occurs 26 Geological occurrence of bitumens 37 Index to names of persons 303 Index to subjects 307
The Manufacture of Coke
Table of contents iii List of illustrations iv Washers used, number of locomotives, cars, and
miles of railroad track 6 Establishments and periods of payments at the
coke works 9 Establishments that have stores connected with them 10 Rank in production of coke 10 Percentage of yield in coke of the coal coked 11 Amount and value of coke produced 12 Establishments, capital invested, ovens, employees,
wages , value of materials, coal used, coal property, coke produced 13
Establishments, capital invested, ovens, etc. - Indiana, by counties 14
Statistics of coke works idle 16 Average selling price, value of elements of cost 18 Description of Indiana coals 21 History of coking in Indiana 27 The coke industry in Indiana 48

Indiana Statistics in the Decennial Census Publications Census / Description of Statistics Page Number
Indiana State Library
Building Stones & The Quarry Industry
Table of contents iii List of illustrations – Plates and chromolithographs ix Building stones – quarries, capital invested, product,
value of product, machines, value of explosives used, months in operation, employees, animals employed, means of transportation 46
Number of quarries, capital invested, product, value of product, by type or rock 48
Number of quarries, capital invested, excavation, product, value or product, machines, value of explosives, months in operation, employees, animals employed, means of transportation, wages, by type of rock 50
The amount and kinds of rock quarried – Indiana 84 Stone construction in some principal cities -
Evansville, Ft. Wayne, Indianapolis, La Fayette, New Albany, Richmond, Terre Haute 100
Descriptions of quarries and quarry regions – Indiana 215 Descriptions of stone construction in cities -
Evansville, Ft. Wayne, Indianapolis, La Fayette, New Albany, Richmond, Terre Haute 302
Index to report on building stones 401 Volume 11: Mortality and Vital Statistics – States & Principle Cities Table of contents vii List of illustrations viii Introduction
Registers of death, issued and returned xii Proportion of deaths under 1 year of age xx Proportion of deaths in living population
– Indianapolis xxi Proportion of deaths, by sex xxix Appendix – List of counties by group liii
Tables
o Deaths, by sex, 1860-1880 3 o Deaths, by sex, by race 7 o Deaths, by sex, by age 10 o Deaths, by sex, by age, by race 20 o Deaths in each state and grand group, by color 32 o Rate of deaths, by state and grand group, by color 38

Indiana Statistics in the Decennial Census Publications Census / Description of Statistics Page Number
Indiana State Library
o Deaths, by disease, by age, by sex – Indiana, by state groups (groups of counties) 154
o Mortality in cities, by grand groups, by age, by sex, - Indianapolis 541
o Index to Statistics of Mortality 765 Volume 12: Mortality and Vital Statistics – Locality, Cause Table of contents v List of illustrations ix Introduction
o Locality in relation to deaths o Grand Group 7 – Great Northern Lakes xiv o Grand Group 10 – Ohio River Belt xvi o Grand Group 15 – Central Region, Plains
and Prairies xviii o Number of deaths from certain causes per
10,000 persons – Indianapolis xxvi o Causes of death – by Grand Group xxxi - cxxxvi o Deaths by consumption, by month – Indianapolis lxi o Still-births, by state lxxv o Deaths from suicide, by month – Indianapolis cii o Deaths from suicide, by mode – Indianapolis cvi o Deaths from suicide, by mode – Indiana cvii o Deaths from cancer – Indianapolis cxii o Number of female births to male births cxli o Number of births, proportion to total population cxlii o Number of births, proportion to women aged 15-49 cxlii o Proportion of population under 5 years of age and
over 60 years of age cli o Population between ages of 1-2 and 2-3 years clvi o Population between ages of 1-2 and 2-3 years, by
color, by nativity clvii
Tables
o Population, births, and deaths, with ratios and specified causes – Indiana, by groups, by counties 42
o Deaths, by class of disease, specified disease, month of death, sex, and age groups
o Grand Group 7 – Great Northern Lakes 230 o Grand Group 10 – Ohio Valley 254 o Grand Group 15 – Central Region 292
o Deaths from each cause, by sex – Grand Groups 348 o Deaths, by sex, by age – Indiana and State Groups 378
Indiana Statistics in the Decennial Census Publications Census / Description of Statistics Page Number
Indiana State Library
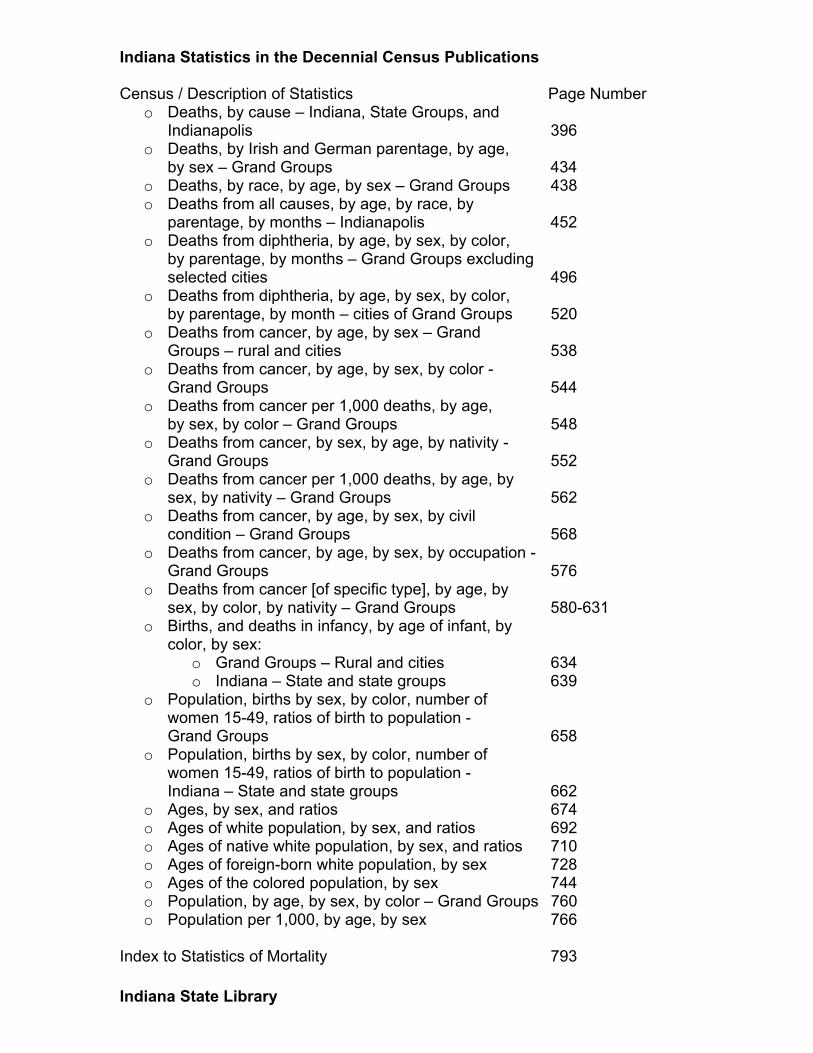
o Deaths, by cause – Indiana, State Groups, and Indianapolis 396
o Deaths, by Irish and German parentage, by age, by sex – Grand Groups 434
o Deaths, by race, by age, by sex – Grand Groups 438 o Deaths from all causes, by age, by race, by
parentage, by months – Indianapolis 452 o Deaths from diphtheria, by age, by sex, by color,
by parentage, by months – Grand Groups excluding selected cities 496
o Deaths from diphtheria, by age, by sex, by color, by parentage, by month – cities of Grand Groups 520
o Deaths from cancer, by age, by sex – Grand Groups – rural and cities 538
o Deaths from cancer, by age, by sex, by color - Grand Groups 544
o Deaths from cancer per 1,000 deaths, by age, by sex, by color – Grand Groups 548
o Deaths from cancer, by sex, by age, by nativity - Grand Groups 552
o Deaths from cancer per 1,000 deaths, by age, by sex, by nativity – Grand Groups 562
o Deaths from cancer, by age, by sex, by civil condition – Grand Groups 568
o Deaths from cancer, by age, by sex, by occupation - Grand Groups 576
o Deaths from cancer [of specific type], by age, by sex, by color, by nativity – Grand Groups 580-631
o Births, and deaths in infancy, by age of infant, by color, by sex:
o Grand Groups – Rural and cities 634 o Indiana – State and state groups 639
o Population, births by sex, by color, number of women 15-49, ratios of birth to population - Grand Groups 658
o Population, births by sex, by color, number of women 15-49, ratios of birth to population - Indiana – State and state groups 662
o Ages, by sex, and ratios 674 o Ages of white population, by sex, and ratios 692 o Ages of native white population, by sex, and ratios 710 o Ages of foreign-born white population, by sex 728 o Ages of the colored population, by sex 744 o Population, by age, by sex, by color – Grand Groups 760 o Population per 1,000, by age, by sex 766
Index to Statistics of Mortality 793
Indiana Statistics in the Decennial Census Publications Census / Description of Statistics Page Number
Indiana State Library
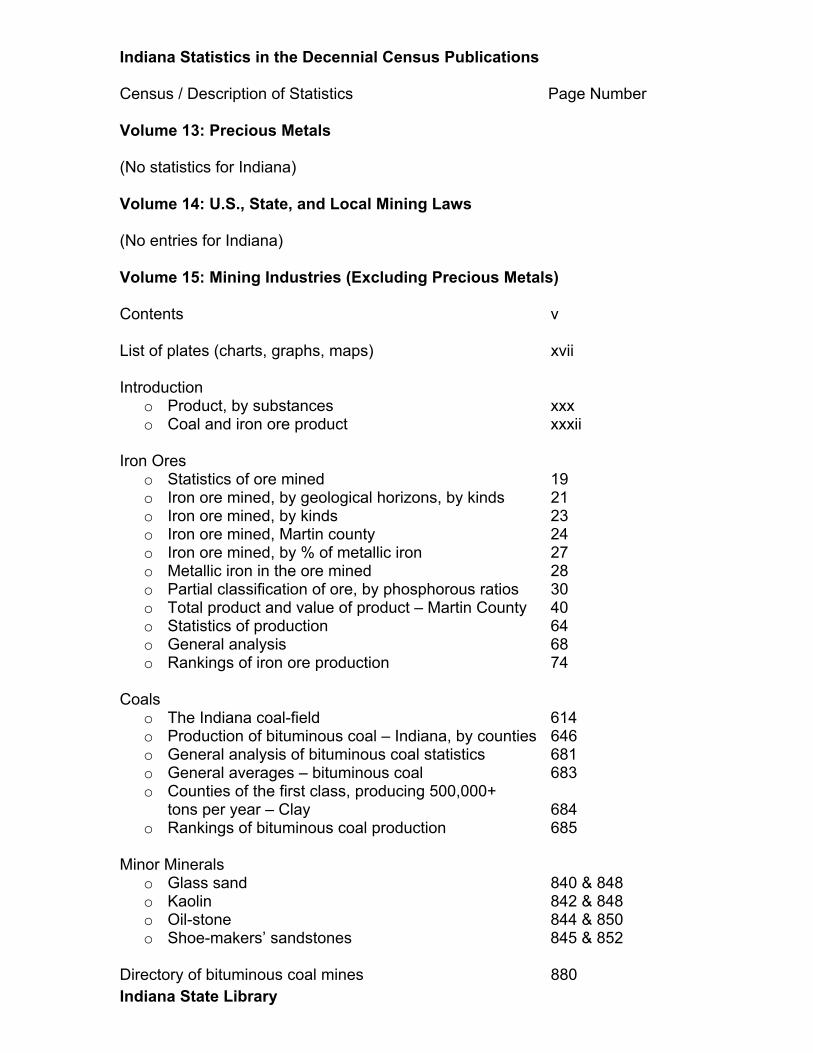
Volume 13: Precious Metals (No statistics for Indiana) Volume 14: U.S., State, and Local Mining Laws (No entries for Indiana) Volume 15: Mining Industries (Excluding Precious Metals) Contents v List of plates (charts, graphs, maps) xvii Introduction
o Product, by substances xxx o Coal and iron ore product xxxii
Iron Ores
o Statistics of ore mined 19 o Iron ore mined, by geological horizons, by kinds 21 o Iron ore mined, by kinds 23 o Iron ore mined, Martin county 24 o Iron ore mined, by % of metallic iron 27 o Metallic iron in the ore mined 28 o Partial classification of ore, by phosphorous ratios 30 o Total product and value of product – Martin County 40 o Statistics of production 64 o General analysis 68 o Rankings of iron ore production 74
Coals
o The Indiana coal-field 614 o Production of bituminous coal – Indiana, by counties 646 o General analysis of bituminous coal statistics 681 o General averages – bituminous coal 683 o Counties of the first class, producing 500,000+
tons per year – Clay 684 o Rankings of bituminous coal production 685
Minor Minerals
o Glass sand 840 & 848 o Kaolin 842 & 848 o Oil-stone 844 & 850 o Shoe-makers’ sandstones 845 & 852
Directory of bituminous coal mines 880

Indiana Statistics in the Decennial Census Publications Census / Description of Statistics Page Number
Indiana State Library
Directory of iron ore mines 932 Directory of mines of the minor minerals
o Glass sand 983 o Koalin 985 o Oil-stone 987 o Shoemakers’ sandstone
Index to mining industries 989 Volume 16: Water-Power, Part I Bottom of page General table of contents 7 Introduction
o Water- and steam-power, total horse-power and percent distribution, 1870 & 1880 12
o Total amount of water- and steam-power, rankings 14 o Land area, water- and steam-power, rankings per
square mile 14 Volume 17: Water-Power, Part II Bottom of page General table of contents 5 Water-power of the Ohio River Basin
o Table of contents & list of illustrations 431 o Introduction 435
Water-supply of certain cities
o Table of contents 507 o List of illustrations 513 o Direct plumbing – Indianapolis 562 o Pumping to distributing reservoirs – Attica, Fort
Wayne, La Fayette, New Albany 713 o Pumping to stand-pipe – South Bend, Terre Haute 729 o Pumping direct into distributing mains – Brazil,
Columbus, Crawfordsville, Evansville, Logansport, Marion, Union City 735
o Pumping to distributing reservoirs and mains - New Carlisle, Peru 763
o Index to report on water-supply of cities 779 Volume 18: Social Statistics of Cities, Part I (New England & Middle States) (No statistics for Indiana)

Indiana Statistics in the Decennial Census Publications Census / Description of Statistics Page Number
Indiana State Library
Volume 19: Social Statistics of Cities, Part II (Southern & Western States) General table of contents v Entries include basic population and trends, financial condition, historical sketch, distances to surrounding cities, latitude/longitude, location, railroads, discussion of infrastructure, entertainment, geography, public health conditions, industry:
o Evansville 437 o Fort Wayne, with map 444 o Indianapolis, with map 449 o La Fayette 457 o New Albany, with map 460 o Richmond, with map 465 o South Bend 470 o Terre Haute, with map 472
Volume 20: Wages; Average Retail Prices; Trades Societies, Strikes, Lockouts Statistics of Wages Table of contents vii Introduction
o Method of payment – all industries xxii o Interval of payment – all industries, 1830-1880 xxiv o Hours of labor – all industries, 1830-1880 xxx
Wage tables
o Agricultural implements – Henry F. Blount, Evansville 6
o Boots & shoes – Falley & Hoes, La Fayette 16 o Breweries & distilleries – Newman & Bohrer,
La Fayette 24 o Brick-making – An establishment in Indiana 30 o Cigars & tobacco – John Rauch, Indianapolis 42 o Flour- and grist-mills
o Hoagland & Tresselt, Fort Wayne 60 o Arnold, Thomas & Co., Huntington 61 o Gibson & Co., Indianapolis 62 o Breckenridge & Jenkins, Lafayette 62 o McDonald & Co., New Albany 63
o Gas & gas coke – Fort Wayne Gas Light Co., Fort Wayne; Indianapolis Gas Light & Coke Co., Indianapolis 76
o Glass, green 92

Indiana Statistics in the Decennial Census Publications Census / Description of Statistics Page Number
Indiana State Library
o Glass, window 97 o Stove foundries – Indianapolis Stove Co., Indpls 142 o Machinery – O. H. Temple, La Fayette 171 o Machinery – Machine-shop and foundery
o C. Kratz, Evansville 184 o Charles Hegewald & Co., New Albany 185 o Clark & Buck, Vincennes 185
o Machinery, Locomotives – Ohio & Mississippi Railroad Co., Vincennes and Seymour 190
o Nail factories – an establishment in Indiana 227 o Marble works – Francis Duffy, Lafayette 235 o Coal-mining – Brazil and Chicago Coal, Co., Brazil 243 o Stone quarrying & working – Terre Haute Stone
Works Co., Terre Haute 258 o Paper manufacture, writing – Erwin, Lane & Co.,
Elkhart 271 o Paper manufacture, rag & straw wrapping –
Ferdinand Funke, Evansville 272 o Pork-packing – Coffin, Greenstreet & Fletcher, Inpls 294 o Cotton manufacture – Evansville Cotton
Manufacturing Co., Evansville 341 o Woolen industry
o J. A. Leucke, Jr., Evansville 384 o C. E. Geisendorff & Co., Indianapolis 385 o Seymour Woolen Factory Co., Seymour 386
o Carriage & wagon works o A. A. Helfer & Sons, Indianapolis 414 o Shaw Carriage Co., Indianapolis 414
o Cooperage – William Slapp & Co., Madison 431 o Furniture
o Munk & Roberts, Connersville 441 o An establishment in Indiana 441 o Western Furniture Co., Indianapolis 442 o Lawrenceburg Furniture Mfg. Co., Lawrenceburg 442
o Saw- and planning-mills o Lumber – Jacob Meyers & Brother, Evansville 464 o Indianapolis Mfrs & Carpenters’ Union, Inpls 465 o Clift, Williams & Co., Terre Haute 466 o P. Kuntz, Union City 466
Wages of Mechanics
o Engineers o Agricultural implements 503 o Flour- and grist-mills 504 o Iron and steel
Founderies, stove 507 Machine-shop and foundery 508 Machinery, locomotives 508

Indiana Statistics in the Decennial Census Publications Census / Description of Statistics Page Number
Indiana State Library
Rolling-mills and nail factories 509 o Mining: Stone quarrying & working 510 o Paper manufacture 510 o Textiles: Woolen industries 513 o Wood-working
Furniture 514 Saw- and planning-mills 515
o Blacksmiths o Agricultural implements 517 o Gas & gas coke 518 o Iron and steel
Founderies, stove 519 Machinery 520 Machine-shop and foundries 521 Machinery, locomotives 522 Rolling-mills and nail factories 522 Carriage and wagon works 524
o Machinists o Agricultural implements 525 o Iron and steel
Machinery 526 Machine-shops and founderies 527 Machinery, locomotives 528 Rolling-mills and nail factories 528
o Textiles: Cotton manufacture 530 o Painters
o Agricultural implements 532 o Iron and steel: Machinery, locomotives 532 o Textiles: Cotton manufacture 533 o Wood working
Carriage and wagon works 533 Furniture 533
o Carpenters o Gas and gas coke 535 o Iron and steel
Founderies, stove 537 Machine-shops and founderies 538 Rolling-mills and nail factories 538
o Paper manufacture 540 o Textiles: Cotton manufacture 541 o Wood-working: Saw- and planning-mills 542
o Common Laborers o Agricultural implements 544 o Flour- and grist-mills 546 o Gas and gas coke 547 o Iron and steel
Founderies, stove 550 Machinery 552

Indiana Statistics in the Decennial Census Publications Census / Description of Statistics Page Number
Indiana State Library
Machine shops and founderies 552 Rolling-mills and nail factories 553
o Mining: Stone quarrying and working 555 o Paper manufacture 555 o Pork-packing 556 o Textiles: Cotton Manufacture 558 o Textiles: Woolen industry 560 o Wood-working
o Carriage and wagon works 560 o Cooperage 561 o Furniture 561 o Saw- and planning-mills 562
Index to Statistics of wages 565 Average Retail Prices of Necessaries of Life Table of contents iii Introduction
o Number of establishments or shops reporting 2 Average prices
o Dry goods 8 o Groceries 27 o Flour, meats, provisions, etc. 54 o Men’s heavy boots 92 o Coal 94 o Wood 98 o Coal or carbon oil 102 o House rent (rates) 104 o Board 108
Index to report on necessaries of life 113 Trade Societies Table of contents iii Introduction
o Number and distribution of trade societies 2 o Number of local unattached trade societies and
branches of national societies, by industry and by specific type 14
Index to report on trade societies 21

Indiana Statistics in the Decennial Census Publications Census / Description of Statistics Page Number
Indiana State Library
Strikes and Lockouts Table of contents iii Introduction
o Number of strikes and lockouts 5 Tables
o Number of strikes and lockouts, by industry group and by type 14
Index to report on strikes and lockouts 28 Volume 21: Defective, Dependent, and Delinquent Classes of the Population Table of contents iv Introduction
o Insane, idiots, blind, deaf-mutes, homeless, paupers, prisoners, juvenile delinquents - total, by sex, by nativity, by race xii-xviii
o Ratio of prisoners to total population, by sex, by nativity, by race xxi
o Ex-inmates of institutions, number remaining in-state, number residing elsewhere xxxvi
o Cases of mechanical restraint reported xliii The Insane
o Total number, by sex, by nativity, by race 3 o Total number, ratio to total population, by sex,
by nativity, by race, 1850-1880 5 o Total number, by sex, by nativity, by race -
Indiana, by counties 15 o Total number, by sex, by nativity, by race -
Indianapolis 38 o Total number, classified according to places where
they were found 39 o Total number, by sex, by nativity, by race - Indiana
Hospital for the Insane, Indianapolis 40 o Total number, by age, by sex, by nativity, by race 46 o Number of attacks, by sex, by nativity, by race 64 o Form of insanity, by sex, by nativity, by race 68 o Epileptic, suicidal, homicidal cases (and
combinations thereof), by sex, by nativity, by race 72 o Number having insane relatives, by sex, by
nativity, by race 75 o Marital status, by sex, by race 77
Indiana Statistics in the Decennial Census Publications Census / Description of Statistics Page Number
Indiana State Library
o Reported to be in seclusion, by sex, by nativity, by race 81
o Reported to be under constraint and type of constraint reported, by sex, by nativity, by race 85
o Reported as having been treated in any hospital or asylum 88
o Number who are also deaf or blind or both, by sex, by race 94
o Number of attacks, by sex, by nativity, by race - Indiana Hospital for the Insane, Indianapolis 103
o Epileptic, suicidal, homicidal cases (and combinations), by sex, by nativity, by race - Indiana Hospital for the Insane, Indianapolis 114
o Marital status, by sex, by race - Indiana Hospital for the Insane, Indianapolis 125
o Reported to be in seclusion, by sex, by nativity, by race - Indiana Hospital for the Insane, Inpls 135
o Reported to be under constraint and type of constraint reported, by sex, by nativity, by race - Indiana Hospital for the Insane, Indianapolis 147
o Total disbursements, by year, by decade, 1831-1880 - Indiana Hospital for the Insane, Inpls 160
o Patients admitted, by year, by decade, 1831-1880 - Indiana Hospital for the Insane, Indianapolis 167
o Patients treated, by year, by decade, 1831-1880 - Indiana Hospital for the Insane, Indianapolis 173
The Idiots
o Total number, by sex, by nativity, by race 181 o Total number and ratio to population, by sex, by
nativity, by race 183 o Total number, by sex, by nativity, by race - Indiana,
by counties 193 o Total number, Indianapolis 214 o Total number, according to where found 215 o Total number found in institutions for the same -
Indiana Asylum for Feeble Minded Children, Knightstown 216
o Total number found in hospitals and asylums for the insane - Indiana Hospital for the Insane, Inpls 217
o Total number, by age, by sex, by nativity, by race 220 o Total number of school age, by sex, by nativity, by
race 222 o Total number showing ages by decennial periods,
by sex, by nativity, by race 226 o Total number, by assigned causes 240 o Total number, by assigned causes, by sex, by
nativity, by race 244

Indiana Statistics in the Decennial Census Publications Census / Description of Statistics Page Number
Indiana State Library
o Total number who are epileptic or paralytic, by sex, by nativity, by race 254
o Physical condition, by sex, by nativity, by race - Indiana Asylum for Feeble-Minded Children 255
o Total number, according to size of head, by sex, by nativity, by race 257
o Total number, by ability to use their hands, by sex, by nativity, by race 261
o Total number, by ability to use their feet, by sex, by nativity, by race 265
o Total number, by ability to articulate, by sex, by nativity, by race 269
o Total number, showing in combination the gradation of idiocy by size of head, articulation, and use of hands and feet 277
o Total number reporting idiotic relations, by sex, by nativity, by race 291
o Marital status, by sex, by nativity, by race 293 o Number residing outside of institutions who have
received special training – Indiana Asylum for Feeble-Minded Children 296
o Total number who are deaf and/or blind, by sex, by race 298
The Blind
o Total number, by sex, by nativity, by race 301 o Total number and ratio to population, by sex,
by nativity, by race, 1830-1880 304 o Total number, by sex, by nativity, by race – Indiana,
by counties 316 o Total number, by sex, by nativity, by race –
Indianapolis 337 o Total number, according to places where found 338 o Total number, by sex, by nativity, by race – Indiana
Institute for the Education of the Blind 339 o Total number of school age, by sex, by nativity,
by race 343 o Total number, showing ages by decennial periods,
by sex, by nativity, by race 346 o Total number, blind and semi-blind, in and outside
of institutions 362 o Total number reported to have received special
instruction – Indiana Inst. for the Educ. of the Blind 368 o Total number who are also insane, idiotic, or deaf,
by sex, by race 374

Indiana Statistics in the Decennial Census Publications Census / Description of Statistics Page Number
Indiana State Library
The Deaf and Dumb
o Total number, by sex, by nativity, by race 379 o Total number, by sex, by nativity, by race – Indpls 380 o Total number, according to places where found 381 o Total number, by sex, by nativity, by race – Indiana
Inst. for Educ. the Deaf and Dumb, Indpls 382 o Total number of school age, by sex, by nativity,
by race 387 o Total number showing ages by decennial periods,
by sex, by nativity, by race 390 o Total number, by cause 402 o Total number, by cause, by sex, by nativity, by race 406 o Total number, by cause – Indiana Inst. for Educ. the
Deaf and Dumb 418 o Total number, in institutions, by sex, by nativity,
by race 424 o Total number who are reported to have received
special instruction – Indiana Inst. for Educ. the Deaf and Dumb, Indpls 436
o Total number who are also insane, idiotic, and/or blind, by sex, by race 438
Homeless Children
o Total number (16 years and younger) , by sex, by nativity, by race 443
The Paupers
o Total number in almshouses, by sex, by nativity, by race 447
o Total number of outdoor paupers, by sex, by nativity, by race 448
o Total number in almshouses and ration to population, 1850-1880 450
o Total and average days spent in almshouses 453 o Almshouse paupers, showing ages by decennial
periods, by sex, by nativity, by race 458 o Almshouse paupers, showing physical condition,
form of disability, and number having relatives in the same institution, by sex, by nativity, by race 466
Crime
o Prisoners, by sex, by nativity, by race 479 o Prisoners and ratio to population, by sex, by nativity,
by race, 1850-1880 481 o Prisoners, according to places where found 485 o Prisoners, by penitentiary, by sex, by nativity, by race 486

Indiana Statistics in the Decennial Census Publications Census / Description of Statistics Page Number
Indiana State Library
o Prisoners, by workhouse/house of correction, by sex, by nativity, by race 489
o Prisoners, showing ages by decennial periods, by sex, by nativity, by race 494
o Prisoners and inmates of reformatories, by legal residence 500
o Prisoners, showing duration and place of incarceration 502
o Prisoners, showing nature of offense, by sex, by nativity, by race 504
o Prisoners serving sentences for double crimes, by sex, by nativity, by race 512
o Prisoners serving out sentence, with place where found, and nature of sentence imposed 521
o Number of prisoners sentenced for not less than one year, by sex, by nativity, by race 528
o Number of prisoners sentenced for short terms, by sex, by nativity, by race 539
o Number of prisoners punished by fine, by sex, by nativity, by race 544
o Prisoners, by condition 550 o Inmates of reformatories, by sex, by nativity, by race 551 o Inmates of reformatories, duration of imprisonment,
average age, form of sentence, by sex, by nativity, by race 555
o Inmates of reformatories, by nature of offense committed, by sex, by nativity, by race 563
o Police statistics for cities of 5,000+ population 566 Statistical Summary of the Defective, Dependent, and Delinquent Classes
o Percentage of increase of population, 1830-1880 576 Index to Defective, Dependent, and Delinquent Classes 579 Volume 22: Power and Machinery Employed in Manufactures General table of contents iv Steam- and Water-power used in manufacture of iron and steel
o Table of contents iii o Water-power used, 1870 & 1880 4 o Rank in production 5 o Relation between product and power, 1870 & 1880 7 o Power used, by type of power 10

Indiana Statistics in the Decennial Census Publications Census / Description of Statistics Page Number
Indiana State Library
Manufacture of Engines and Boilers
o Table of contents iii o List of illustrations iv o The manufacture of steam engines, generally 1 o Reported time of labor, in per cent 6 o Index to manufacture of engines and boilers 65
Marine Engines and Steam Vessels
o Table of contents iii o List of illustrations v o Steam vessels built, by type 6 o Steam vessels built, by type – Indiana, by location 8 o Index to marine engines and steam vessels 105
Ice Industry
o Table of contents iii o Tons harvested, sold and consumed, value – Indpls 5 o Consumption of ice, showing total harvested,
type of customer, month consumed 40 o Index to report on ice industry 43
10th Census of the United States (1880) - Compendium p.d. 317 Un80c – 3rd floor across from map room http://www.census.gov/prod/www/abs/decennial/1880.htm Part 1: Population; Agriculture Errata Front Table of Contents iii Introduction:
o Population of the United States xlii Population Tables
o Population, by sex, by nativity, by race 2 o Population, 1790-1880 4 o Percentage increase, 1870-1880 6 o Density, 1790-1880 7 o Population – Indiana, by counties, 1860-1880 25 o Population – Indiana, by counties, by townships,
by cities, by wards, by towns 115 o Population, native and foreign-born, 1860-1880 332 o Population, white and colored, 1860-1880 333 o Population, Chinese, Japanese, and civilized Indians 334 o Population, by race – Indiana, by counties, 1860-1880 346

Indiana Statistics in the Decennial Census Publications Census / Description of Statistics Page Number
Indiana State Library
o Population, by race – Indiana, by cities and towns of 4,000+ inhabitants, 1870 & 1880 384
o Population, by nativity – Indiana, by counties, 1860-1880 417
o Population, by nativity – Indiana, places of 4,000+ inhabitants 454
o Native population, by state of birth 464 o Native white population, by state of birth 470 o Native colored population, by state of birth 476 o Foreign-born population, by place of birth 482 o Native and foreign-born population, by place of birth -
Indiana, by counties 501 o Native population, by state of birth – Indianapolis 542 o Foreign-born population, by place of birth – Indpls 546 o Population, by sex, by general nativity 552 o White population, by sex, by general nativity 554 o Colored population, by sex, by general nativity 556 o Chinese and Japanese population, by sex, by
general nativity 557 o Civilized Indian population, by sex, by general
nativity 558 o Natural militia (males 18-44), by race, by nativity 559 o Voting age (males 21+), by race, by nativity 560 o School, military, and citizenship ages, by sex -
Indiana, by counties 572 o Population, by age (every year) 608 o Native white males, by age (every year) 614 o Native white females, by age (every year) 620 o Foreign-born white males, by age (every year) 626 o Foreign-born white females, by age (every year) 632 o Colored males, by age (every year) 638 o Colored females, by age (every year) 644
Agriculture Tables
o Farms, total number, by specified class (size), 1860-1880 650
o Total land in farms, improved land, unimproved land, average size, value of farms, implements and machinery, products (1850-1880) 650
o Farms, improved land, value of land, buildings, fences, value of implements, value of livestock, cost of building and repairing fences, cost of fertilizer, estimated value of farm productions 684
o Farms, improved land, value of land, buildings, fences, etc. – Indiana, by counties 698
o Principal vegetable productions 738 o Principal vegetable productions – Indiana, by counties 764 o Livestock and its productions 832

Indiana Statistics in the Decennial Census Publications Census / Description of Statistics Page Number
Indiana State Library
o Livestock and its productions – Indiana, by counties 856 Index to Compendium (925) Part 2: Manufactures; Mining; Transportation; Infrastructure; Occupations; Foreign Parentage; Areas, Dwellings, Families; Insurance; Valuation, Taxation; Indebtedness; Publishing; Schools; Illiteracy; Defective, Dependent, and Delinquent Classes; Mortality Errata Front Table of contents iii Manufactures
o Statistics of manufactures, 1850-1880 928 o Statistics of manufactures – Indiana, by counties 963 o Statistics of manufactures – Indiana, by industries 965 o Statistics of principal industries
o Agricultural implements 1098 o Boots & shoes (factory industry) 1104 o Brick & tile 1106 o Cheese & butter 1110 o Chemical products 1114 o Cotton manufactures 1124 o Dyeing & finishing textiles 1128 o Flouring- and grist-mill products 1130 o Hosiery & knit goods 1132 o Iron & steel
Aggregate 1136 Blast furnaces 1138 Bloomaries & forges 1142 Iron rolling-mills 1144
o Leather Curried 1158 Tanned 1160 Sawed 1162
o Mixed textiles 1164 o Paper 1166 o Shipbuilding
Aggregate 1172 New vessels 1174 Repairing of vessels 1176 Boats 1178 Western rivers 1182
o Slaughtering and meatpacking 1186 o Woolen goods 1190 o Coke 1208 o Glass
Indiana Statistics in the Decennial Census Publications Census / Description of Statistics Page Number
Indiana State Library
Aggregate 1208 Green glass 1210 Plate glass 1210 Window glass 1210
Power Used in Manufactures
o Total amount of power used, 1860 & 1880 1216 o Proportional amounts of steam- and water-power 1218 o Statistics of power used in manufactures
o By states 1219 o Cotton goods 1220 o Flouring- and grist-mills 1221 o Hosiery and knit goods 1221 o Iron and steel 1222 o Lumber, sawed 1223 o Paper 1223 o Woolen goods 1224 o Other industries 1226
Mining
o Statistics of non-precious minerals 1242 o Bituminous coal 1242 o General statistics of quarrying industries 1244 o Marble and limestone 1246 o Sandstone 1246
Railroads
o Statistics by geographical groups (Group II includes Indiana) 1257
Steam Craft
o Tonnage and traffic, Group IV – Ohio River (includes Indiana) 1268
o Statement of number, tonnage, value, capital invested, service, and traffic (Group IV) 1272
o Statement of number, tonnage, value, capital invested, service, and traffic – Indiana, by type 1284
o Statement of number, tonnage, and value of steamers, sailing-vessels, canal-boats, barges, flats, wharf-boats, and hulks 1298
Telephones
o General financial exhibit 1328 o Balance sheet, etc. 1332 o Service account 1338

Indiana Statistics in the Decennial Census Publications Census / Description of Statistics Page Number
Indiana State Library
Occupations
o Comparative increase, 1870-1880 1346 o Total number of occupations reported – Indpls 1348 o Occupations, by class, by sex 1356 o Occupations, by class, by age, by sex, by nativity 1358 o Agriculture, by age, by sex, by nativity 1360 o Professional/personal services, by age, by sex, by
nativity 1362 o Trade and transportation, by age, by sex, by nativity 1364 o Manufacturing, mechanical and mining industries,
by age, by sex, by nativity 1366 o Principal (selected) occupations 1379 o All occupations, by class, by sex, by nativity – Indpls 1390 o Agriculture, by age, by sex, by nativity - Indpls 1392 o Professional/personal services, by age, by sex, by
nativity - Indpls 1394 o Trade and transportation, by age, by sex, by nativity -
Indpls 1396 o Manufacturing, mechanical and mining industries,
by age, by sex, by nativity - Indpls 1398 Fisheries
o Statistics of the fisheries 1402 Foreign Parentage
o Persons having one or both parents foreign-born; foreign-born persons having both parents native born 1408
Areas, Dwellings, and Families
o Areas, land surface, 1850-1880 1413 o Dwellings, 1850-1880 1414 o Families, 1850-1880 1415 o Dwellings, families, population – Evansville, Fort
Wayne, Indianapolis, Terre Haute 1416 Life Insurance
o Statement of capital stock – Franklin Life Ins. Co., Indpls 1432
o Income – Franklin Life Ins. Co., Indpls 1434 o Disbursements – Franklin Life Ins. Co., Indpls 1438 o Assets – Franklin Life Ins. Co., Indpls 1444 o Liabilities – Franklin Life Ins. Co., Indpls 1450
Fire and Marine Insurance
o Classification and capital stock 1458 o Assets 1464 o Liabilities 1470

Indiana Statistics in the Decennial Census Publications Census / Description of Statistics Page Number
Indiana State Library
o Income and expenditures 1476 o Surpluses and deficiencies 1482 o Risks written and risks in force 1488 o Ratios of the business 1494
Valuation and Taxation
o Assessed valuation, state, county, city, etc., valuation 1508 o Assessed valuation, state, county, city., etc.,
valuation – Indiana, by counties 1543 Public Indebtedness
o Holders of U.S. registered bonds 1569 o Amounts of U.S. registered bonds held 1569 o State and local debt, by type 1571 o Debts of states, counties, cities, towns, etc., with
local debt by counties – Indiana, by counties 1603 Newspapers and Periodicals
o Newspapers and periodicals published, by periods of issue 1628
o Classification of newspapers and periodicals 1629 o Number and language of all newspapers and
periodicals published 1630 o Newspapers and periodicals devoted to religion,
by denominations 1631 Public Schools
o Elementary and high, buildings and sittings, property value, receipts, expenditures, teachers and pupils, by race, by sex, salaries, months of service, average daily attendance 1640
Illiteracy
o Number unable to read, unable to write, by age groups, by sex, by nativity, by race, 1860-1880 1645
Defective, Dependent, and Delinquent Classes
o The insane, by sex, by nativity, by race 1671 o The idiotic, by sex, by nativity, by race 1672 o The blind, by sex, by nativity, by race 1673 o The deaf-mutes, by sex, by nativity, by race 1674 o Paupers, by sex, by nativity, by race 1675 o Prisoners, by sex, by nativity, by race 1676 o The insane, according to places where found 1678 o The insane, in hospitals and asylums for the same,
by sex, by nativity, by race 1679 o Idiots in hospital and asylums for the insane, by sex,
by nativity, by race 1683

Indiana Statistics in the Decennial Census Publications Census / Description of Statistics Page Number
Indiana State Library
o Idiots in training schools for the feeble-minded, by sex, by nativity, by race 1686
o Idiots classified according to places where found 1687 o The blind in institutions for the same, by sex, by
nativity, by race 1688 o Deaf-mutes in institutions for the same, by sex,
by nativity, by race 1690 o Prisoners classified according to places where found 1693 o Prisoners in penitentiaries, by sex, by nativity, by race 1694 o Inmates of reformatories, by sex, by nativity, by race 1697 o Prisoners in workhouses and houses of correction,
by sex, by nativity, by race 1700 Mortality
o Counties that comprise State Groups 1, 2, 3 1713 o Deaths, by sex, by certain specified ages – Indiana
and state groups 1726 o Deaths from ten principal causes – Indiana and
state groups 1729 Index to Compendium (1733)