indicative 2015 results (unaudited)
TRANSCRIPT
Indicative 2015 Results
(Unaudited)
February 2016

Excellence in Execution
Table of Contents
2
Macro Overview 3 3
Business Overview 3 6
Indicative 2015 Results 3 14
2016 Outlook 3 20
Macro Overview
Section 1
Excellence in Execution
5,14% 5,03%
4,92% 5,01%
4,72% 4,67% 4,73%
5,04%
1Q 2Q 3Q 4Q 1Q 2Q 3Q 4Q
Macro Overview
4
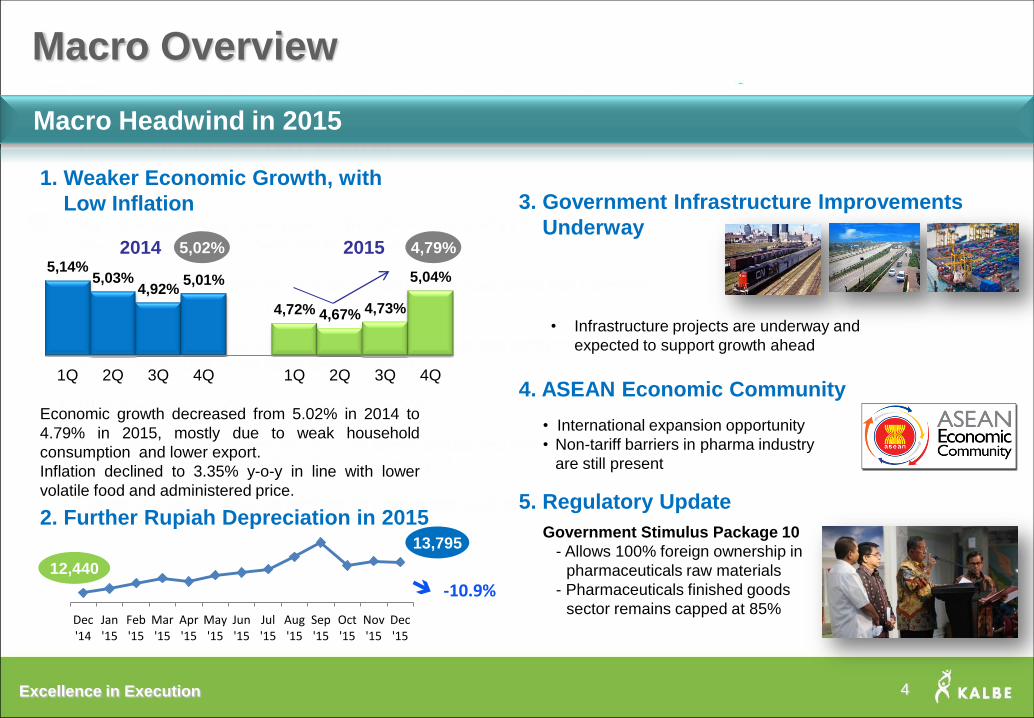
1. Weaker Economic Growth, with
Low Inflation
Economic growth decreased from 5.02% in 2014 to
4.79% in 2015, mostly due to weak household
consumption and lower export.
Inflation declined to 3.35% y-o-y in line with lower
volatile food and administered price.
3. Government Infrastructure Improvements
Underway
4. ASEAN Economic Community
• International expansion opportunity
• Non-tariff barriers in pharma industry
are still present
Government Stimulus Package 10
- Allows 100% foreign ownership in
pharmaceuticals raw materials
- Pharmaceuticals finished goods
sector remains capped at 85%
4,79%
2. Further Rupiah Depreciation in 2015
Dec '14
Jan '15
Feb '15
Mar '15
Apr '15
May '15
Jun '15
Jul '15
Aug '15
Sep '15
Oct '15
Nov '15
Dec '15
Macro Headwind in 2015
5,02%
13,795
12,440
5. Regulatory Update
• Infrastructure projects are underway and
expected to support growth ahead
-10.9%
2014 2015
4
Excellence in Execution
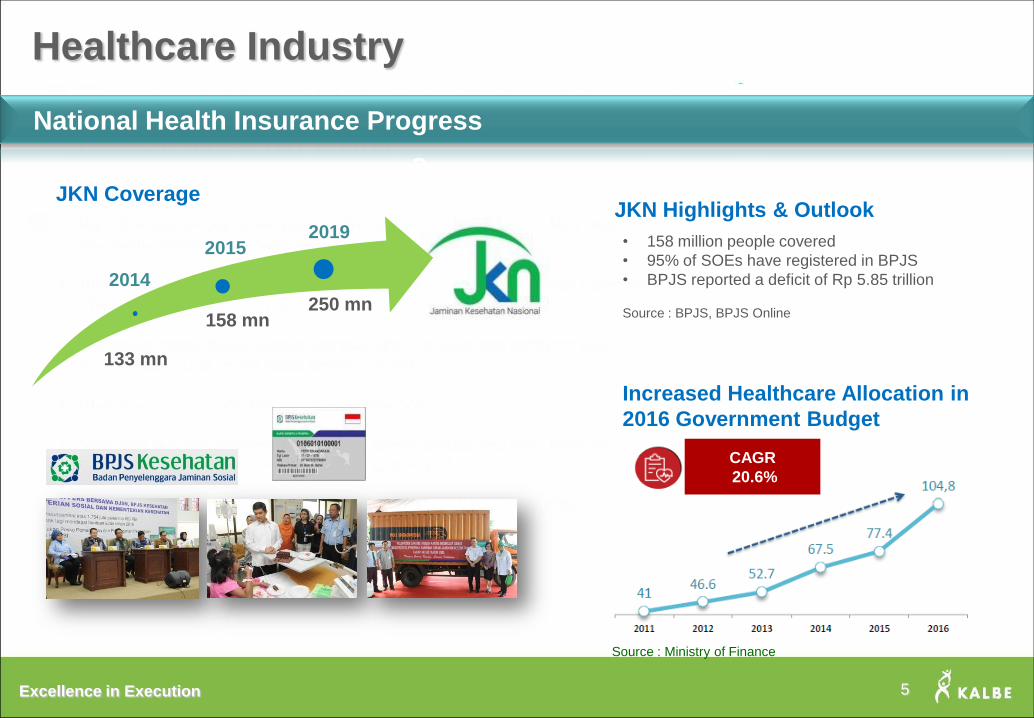
Healthcare Industry
National Health Insurance Progress
133 mn
158 mn 250 mn
JKN Coverage JKN Highlights & Outlook
• 158 million people covered
• 95% of SOEs have registered in BPJS
• BPJS reported a deficit of Rp 5.85 trillion
Source : BPJS, BPJS Online
Increased Healthcare Allocation in
2016 Government Budget
2019 2015
2014
Source : Ministry of Finance
5
CAGR
20.6%

Business
Overview
Section 2

Excellence in Execution 7
What Business
Are We In
To be the best Indonesian Global Health Care company driven by innovation, strong brands and excellent management
To improve health for a better life
We are an Innovative Health Care Business providing Health Care Products & Its Related Services
1. Sustainable Growth
2. Innovation, Quality, and Productivity
3. World Class Competence & Organization
Mission
Vision
Strategy
Values We believe in : Trust, Mindfulness, Innovation, Strive to be the best,
Interconnectedness
Our Business
Strengthening Our Footprints as a Health Care Company
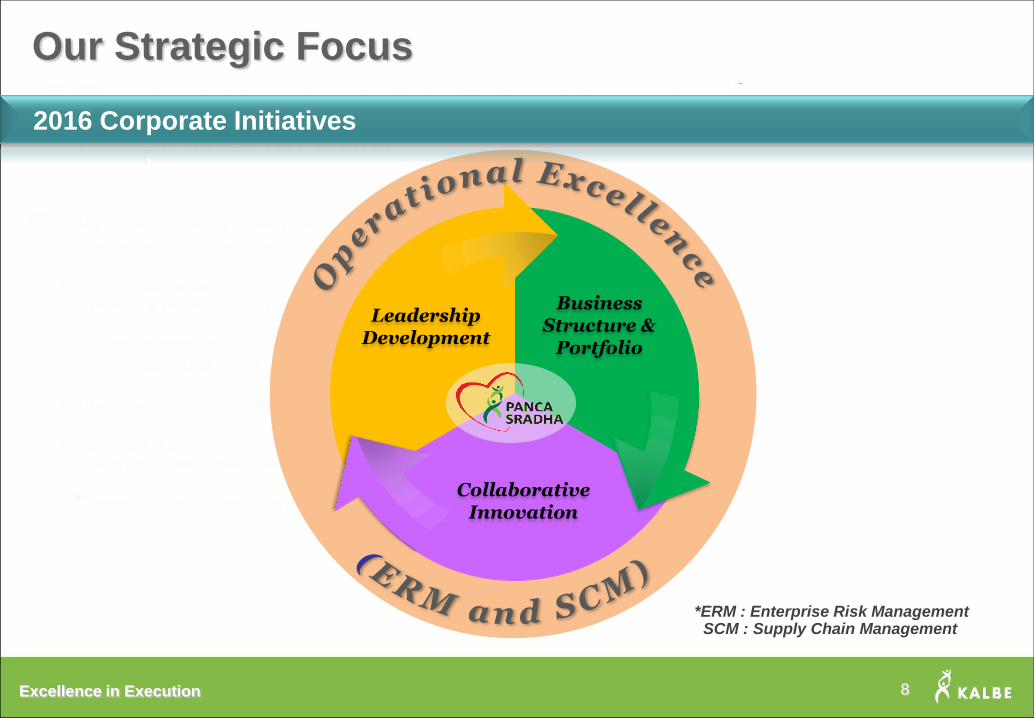
Excellence in Execution
Leadership Development
Business Structure &
Portfolio
Collaborative Innovation
8
Our Strategic Focus
2016 Corporate Initiatives
*ERM : Enterprise Risk Management SCM : Supply Chain Management
Excellence in Execution 9
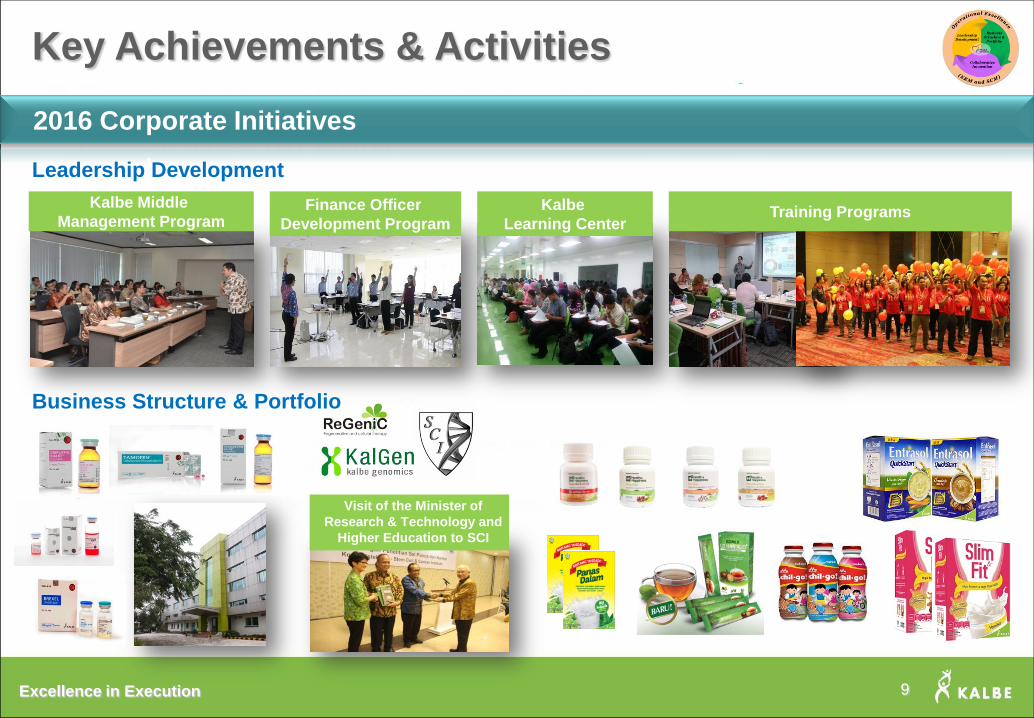
2016 Corporate Initiatives
Key Achievements & Activities
Kalbe Middle
Management Program Finance Officer
Development Program
Leadership Development
Business Structure & Portfolio
Training Programs Kalbe
Learning Center
Visit of the Minister of
Research & Technology and
Higher Education to SCI
Excellence in Execution 10
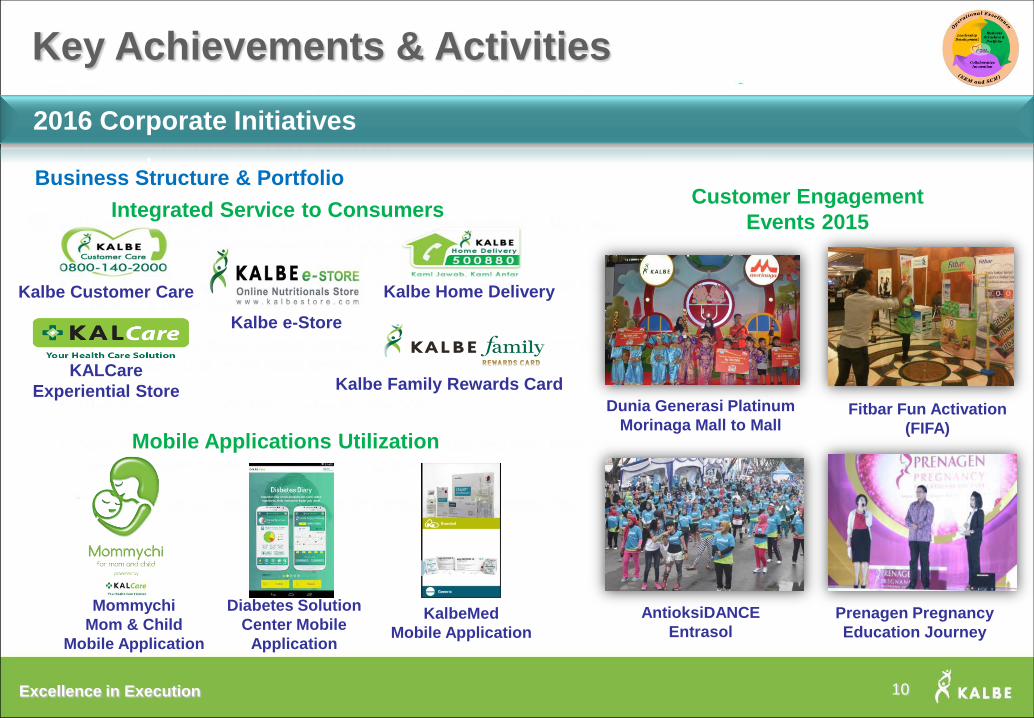
Kalbe e-Store
Kalbe Home Delivery
Kalbe Family Rewards Card KALCare
Experiential Store
Kalbe Customer Care
Integrated Service to Consumers
KalbeMed
Mobile Application
Mommychi
Mom & Child
Mobile Application
Mobile Applications Utilization
Diabetes Solution
Center Mobile
Application
Customer Engagement
Events 2015
Dunia Generasi Platinum
Morinaga Mall to Mall Fitbar Fun Activation
(FIFA)
AntioksiDANCE
Entrasol
Prenagen Pregnancy
Education Journey
2016 Corporate Initiatives
Business Structure & Portfolio
Key Achievements & Activities
Excellence in Execution 11
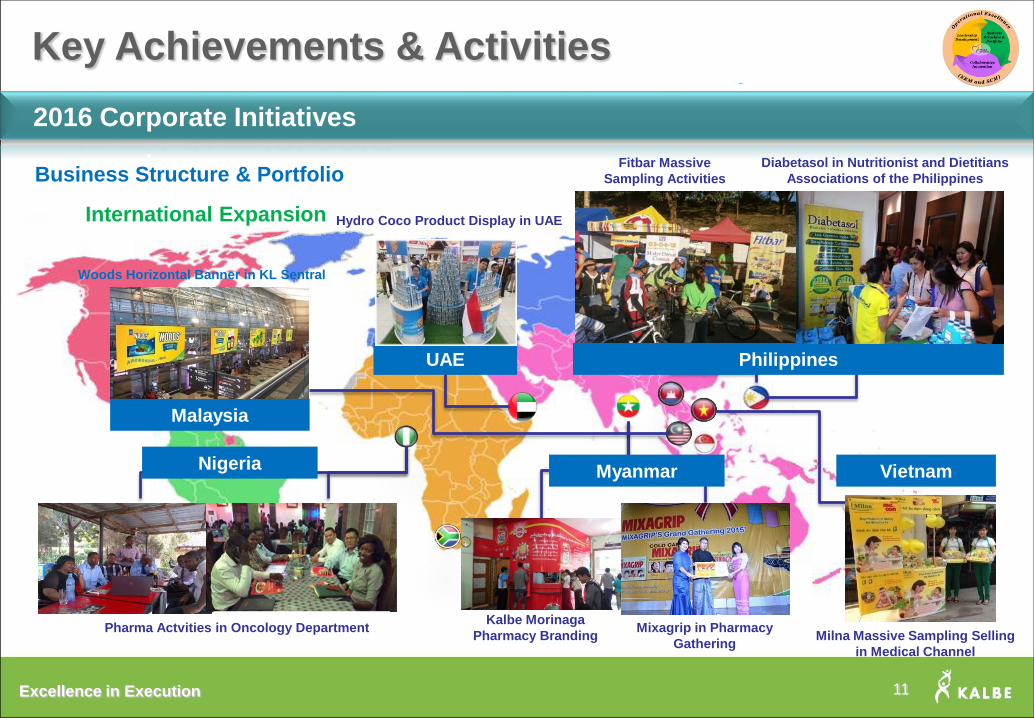
Pharma Actvities in Oncology Department Kalbe Morinaga
Pharmacy Branding Mixagrip in Pharmacy
Gathering Milna Massive Sampling Selling
in Medical Channel
Fitbar Massive
Sampling Activities
Diabetasol in Nutritionist and Dietitians
Associations of the Philippines
Hydro Coco Product Display in UAE
Philippines
Nigeria Myanmar Vietnam
Malaysia
Woods Horizontal Banner in KL Sentral
Key Achievements & Activities
2016 Corporate Initiatives
Business Structure & Portfolio
International Expansion
UAE

Excellence in Execution 12
2016 Corporate Initiatives
Key Achievements & Activities
Visit of the Minister of Industry to Biosimilar Factory Construction
JV Kalbe Genexine
Collaborative Innovation
JV Kalbe Blackmores

Excellence in Execution 13
Quality Assurance & Financial Compliance
2016 Corporate Initiatives
Enterprise Risk Management (ERM)
Supply Chain Management (SCM)
Powdered milk
capacity expansion New liquid milk factory Distribution Infrastructure
Key Achievements & Activities

Indicative 2015
Results
Section 3
Excellence in Execution
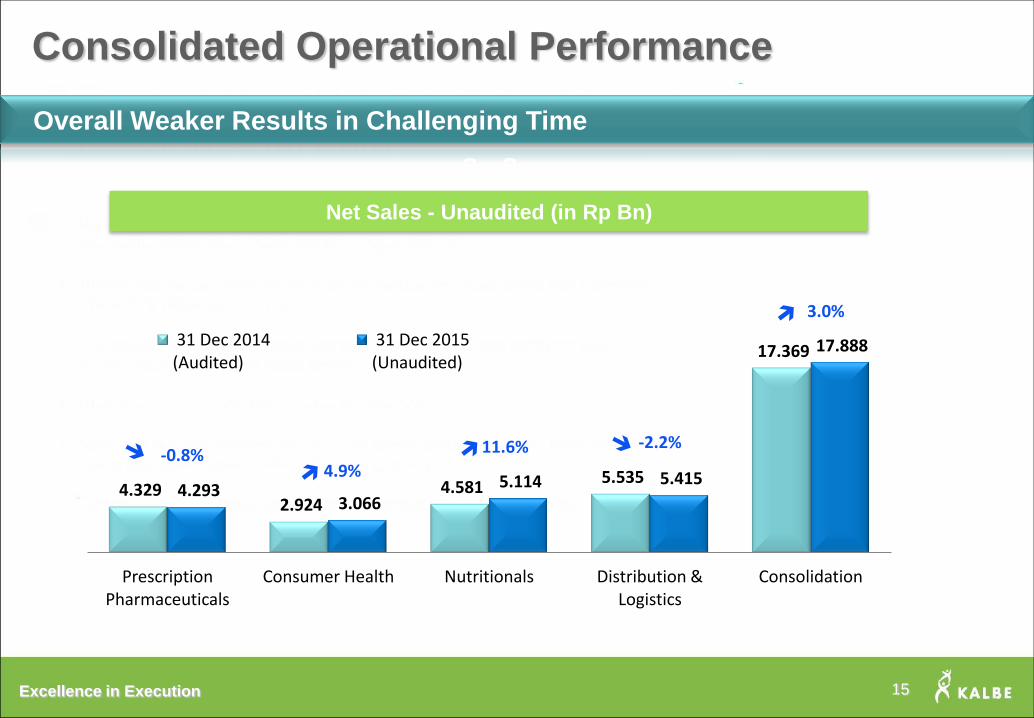
4.329 2.924
4.581 5.535
17.369
4.293 3.066
5.114 5.415
17.888
Prescription Pharmaceuticals
Consumer Health Nutritionals Distribution & Logistics
Consolidation
31 Dec 2014 (Audited)
31 Dec 2015 (Unaudited)
15
Net Sales - Unaudited (in Rp Bn)
-0.8% 4.9%
11.6% -2.2%
3.0%
Consolidated Operational Performance
Overall Weaker Results in Challenging Time
Excellence in Execution
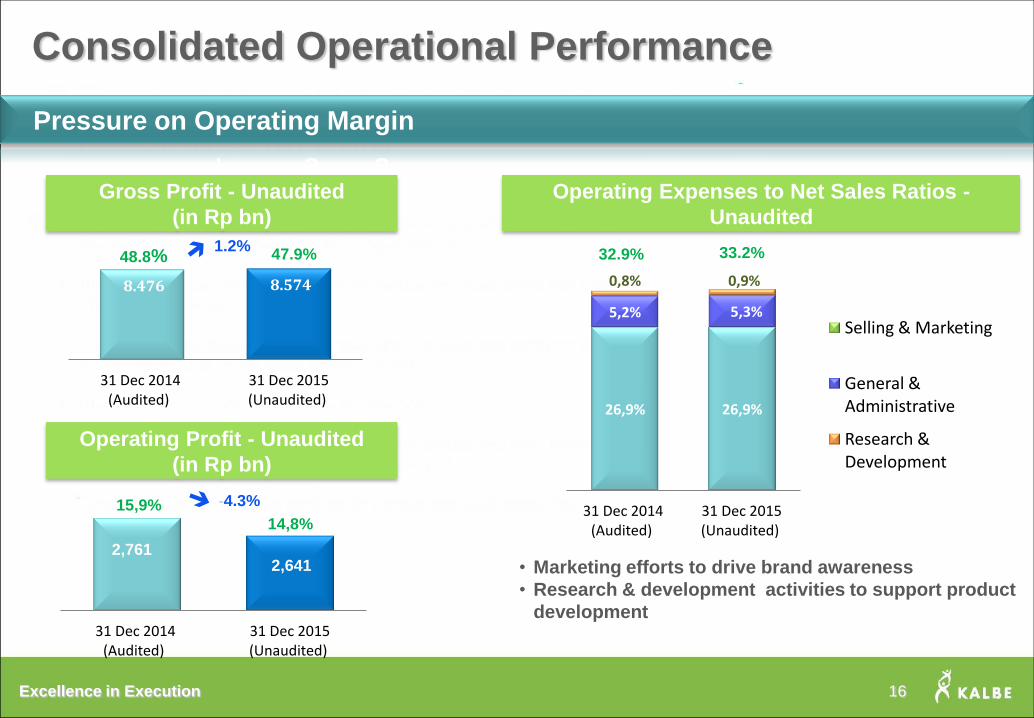
8.476 8.574
31 Dec 2014 (Audited)
31 Dec 2015 (Unaudited)
15,9%
14,8%
31 Dec 2014 (Audited)
31 Dec 2015 (Unaudited)
26,9% 26,9%
5,2% 5,3%
0,8% 0,9%
31 Dec 2014 (Audited)
31 Dec 2015 (Unaudited)
Selling & Marketing
General & Administrative
Research & Development
• Marketing efforts to drive brand awareness
• Research & development activities to support product
development
Operating Expenses to Net Sales Ratios -
Unaudited
Operating Profit - Unaudited
(in Rp bn)
1.2%
-4.3%
32.9%
2,761
33.2%
2,641
48.8% 47.9%
2,641
Gross Profit - Unaudited
(in Rp bn)
Consolidated Operational Performance
Pressure on Operating Margin
16

Excellence in Execution
2.065 1.975
31 Dec 2014 (Audited)
31 Dec 2015 (Unaudited)
2.764 2.709
31 Dec 2014 (Audited)
31 Dec 2015 (Unaudited)
Income Before Tax - Unaudited
(in Rp bn)
Net Income - Unaudited
(in Rp bn)
• Income before tax margin decreased from 15.9% in FY
2014 to 15.1% in FY 2015, mostly due lower gross profit.
-2.0%
• Net income margin decreased from 11.9% in FY 2014
to 11.0% in FY 2015, in line with lower income before
tax margin.
-4.3%
15.9% 15.1% 11.0% 11.9%
Consolidated Operational Performance
Negative Impact on Bottom Line
17

Excellence in Execution
43 45 44 50 48 48 49 48
142 122
110 115 107
132 125 116
27 38 35
57 41
50 46 44
158
129 120 108 114
131 128 120
2008 (Audited)
2009 (Audited)
2010 (Audited)
2011 (Audited)
2012 (Audited)
2013 (Audited)
2014 (Audited)
2015 (Unaudited)
Days of Account Receivables
Days of Inventories
Days of Account Payables
Net Operating Cycle
18
End-to-end supply chain
management will be implemented
to overcome fluctuation in
inventory
No. of days
Working Capital Management
Improving Inventory Days
Net Operating Cycle has been
reduced by 38 days from 158
days to 120 days

Excellence in Execution
470 469
783 994
852 945
2010 (Audited)
2011 (Audited)
2012 (Audited)
2013 (Audited)
2014 (Audited)
2015 (Unaudited)
14,0 19,0 19,0 17,0 19,0
51% 60% 51% 42% 43%
0% 20% 40% 60% 80%
0,0 5,0
10,0 15,0 20,0
2010 (Audited)
2011 (Audited)
2012 (Audited)
2013 (Audited)
2014 (Audited)
Cash Dividend* (Rp/share) Dividend Payout Ratio (%)
19
Total Debt and Gearing Ratio Cash & Net Cash Balance
Dividend Payment Capital Expenditure
* in Rp Billion
*For Fiscal Year *Cash dividend are adjusted for stock split impact
340 25
141 205
584
296 394
7,9%
0,5% 2,3% 2,9%
7,2%
3,2% 3,8%
0,0%
5,0%
10,0%
15,0%
0 100 200 300 400 500 600
2009 (Audited)
2010 (Audited)
2011 (Audited)
2012 (Audited)
2013 (Audited)
2014 (Audited)
2015 (Unaudited)
Total Debt in Rp Billion Gearing Ratio
1.562 1.902
2.291 1.860 1.895 1.895
2.704
1.222
1.877 2.151
1.655 1.311
1.598
2.309
2009 (Audited)
2010 (Audited)
2011 (Audited)
2012 (Audited)
2013 (Audited)
2014 (Audited)
2015 (Unaudited)
Cash and Cash Equivalent in Rp Billion Net Cash in Rp Billion
Working Capital Management
Strong Balance Sheets

2016 Outlook
Section 4

Excellence in Execution
Capex of Rp 1 – 1.5 Tn for production capacity and distribution network expansion.
21
1. Year-on-year Sales Growth 8% - 10%
2. Operating Profit Margin 14% - 15%
3. Earnings per Share Growth 8% - 10%
4. Dividend Payout Ratio 40% - 50%
Outlook 2016
2016 Earnings Guidance
Excellence in Execution
THANK YOU For further information:
PT Kalbe Farma Tbk.
Jalan Let.Jend. Suprapto Kav. 4
Jakarta 10510, Indonesia
Tel. : 62-21-42873888
Fax. : 62-21-42873678
Email : [email protected]
Website : www.kalbe.co.id
22