indicators of good governance: developing an index of governance
TRANSCRIPT

For comments, suggestions or further inquiries please contact:
Philippine Institute for Development Studies
The PIDS Discussion Paper Seriesconstitutes studies that are preliminary andsubject to further revisions. They are be-ing circulated in a limited number of cop-ies only for purposes of soliciting com-ments and suggestions for further refine-ments. The studies under the Series areunedited and unreviewed.
This study was funded by the UnitedNations Development Programme (UNDP)with the assistance of the National Eco-nomic and Development Authority–SocialDevelopment Staff (NEDA–SDS).
The authors acknowledge financialsupport from NEDA–SDS, UNDP and theHuman Development Network (HDN).
The views and opinions expressedare those of the author(s) and do not neces-sarily reflect those of the Institute and thesponsors.
Not for quotation without permissionfrom the author(s) and the Institute.
Rosario G. Manasan et al.
DISCUSSION PAPER SERIES NO. 99-04
March 1999
The Research Information Staff, Philippine Institute for Development Studies3rd Floor, NEDA sa Makati Building, 106 Amorsolo Street, Legaspi Village, Makati City, PhilippinesTel Nos: 8924059 and 8935705
Indicators of Good Governance:Developing an Index of Governance
Quality at the LGU Level
IINNDDIICCAATTOORRSS OOFF GGOOOODD GGOOVVEERRNNAANNCCEE::DDEEVVEELLOOPPIINNGG AANN IINNDDEEXX OOFF
GGOOVVEERRNNAANNCCEE QQUUAALLIITTYYAATT TTHHEE LLGGUU LLEEVVEELL
Rosario G. ManasanEduardo T. GonzalezRomualdo B. Gaffud
February 1999
2
TABLE OF CONTENTS
Page
1. INTRODUCTION 1
1.1. Objective of the Study 11.2. Limitations 2
2. REVIEW OF LITERATURE 2
2.1. Elements of Good Governance 32.2. Measuring the Performance of Governments 82.3. Construction of Composite Welfare/Human Development Indices 12
3. APPROACH AND METHODOLOGY 15
3.1. Overall Framework 153.2. Data and Measurement 15
4. CONSTRUCTION OF A GOVERNANCE INDEX 19
4.1. Choosing the Key Dimensions of Governance 194.2. Choosing the Indicators 214.3. Quantification and Measurement 284.4. Results of Pilot Tests 30
5. INSTITUTIONALIZATION ISSUES 36
6. SUGGESTED FUTURE REFINEMENTS 37
REFERENCES 39
3
LIST OF TABLES
Page
Table 1 Governance Index, Version 1 31
Table 2 Governance Index, Version 2 32
LIST OF FIGURES
Figure 1 Objective Tree for Good Governance Indicators, Version 1 17
Figure 2 Objective Tree for Good Governance Indicators, Version 2 18
Figure 3 Governance Quality Index and HDI 34
Figure 4 Comparison of GQI1 and GQI2 34
Figure 5 Comparison of SOII1 and SOII2 35
Figure 6 Comparison of Part I1 and PartI2 35
LIST OF APPENDICES
Appendix 1 Questionnaire/Survey Instruments 41
Appendix 2 Preliminary List of Performance Indicators 43
Appendix 3 Formulae Used to Compute the Different Indices 46
Appendix 4a Highlights of the National Workshop on 50Governance Indicators, Carlos P. Romulo Hall,NEDA sa Makati, October 30, 1998
Appendix 4b Highlights of the Workshop on Governace Indicators 58RDC Conference Hall, NEDA, Iloilo City18 September 1998
Appendix 4c Highlights of the Presentation of the UNDP-Funded 69Study on Indicators of Good Governance: DevelopingAn Index of Governance at the Local LevelApo View Hotel, August 14, 1998
4
INDICATORS OF GOOD GOVERNANCE:DEVELOPING AN INDEX OF GOVERNANCE QUALITY AT THE LGU LEVEL
Rosario G. Manasan, Eduardo T. Gonzalez and Romualdo B. Gaffud
1. INTRODUCTION
Ask people what they think of governance and they will probably tell you: government,authority, control, power.
True, it may be all these but there=s more.
Governance has been defined as Athe manner in which power is exercised in themanagement of a country=s economic and social resources for development.@ However,governance is not simply about how government conducts business in its own sphere. It is alsoabout how government interacts with civil society. It tells how well government has encouragedand facilitated people=s participation not only in the delivery of services but also in the evaluationand monitoring of government performance itself.
Governance is a complex concept. It includes the state=s institutions and structures,decisionmaking processes, capacity to implement and the relationship between governmentofficials and the public (Landell-Mills and Serageldin 1992).
As such, governance has both political and technical dimensions. It relates to a nation=spolitical system and how this functions in relation to public administration. At the same time, italso involves the efficiency and effectiveness of public management. The key to improving thelevel of governance is to find rules and norms that create incentives for state agencies, officialsand civil society to act in the collective interest at the least cost to society (World Bank 1997).
1.1. Objectives of the Study
The primary objectives of this study are: to develop measurable indicators of goodgovernance at the local government level; to test how applicable and acceptable good governanceindicators are in evaluating and monitoring LGU performance; and to find out how theseindicators can be integrated in the monitoring and evaluation system within the framework ofSustainable Human Development.
In particular, this study attempts to develop a composite index of the quality ofgovernance at the local government level. In doing so, the biggest challenge lies in being able toreduce the multiple facets of the governance concept into a small number of key observabledimensions. The next one is to define a limited number of indicators which are able to capturethe essence of each dimension and which can be measured with some consistency andcomparability over time and space.
The governance quality index that was constructed for this study focuses on threeprincipal elements: one, capacity of the LGU to mobilize and utilize resources; two, efficiency and
5
effectiveness in the delivery of social services; and three, presence of mechanisms to ensureaccountability.
This is not to say that this study's view of governance is limited to these aspects alone. Indeed, it is recognized that on a broad scale, governance indicators should also encompass thelegal framework for development including the judicial system (World Bank 1992), economicmanagement, and egalitarian income distribution (Huther and Shah 1998). However, this studydeems that these dimensions of governance are more applicable to the central government thanto LGUs.
1.2. Limitations
While the better measures of governance are based on outcome indicators (like theUNDP's human development index, HDI), outcome indicators are usually not measured oftenenough (either because it is costly to do so or because many outcome indicators do not showsignificant changes when measured frequently) for them to be more useful the perspective ofdevelopment administration. In this regard, the use of input, output or process indicators may bejustified on the grounds that these intermediate indicators serve as forerunners of thecorresponding outcome indicators. This, of course, presupposes a robust link between theintermediate indicators and the outcome indicators. For instance, studies have shown a strongconnection between government social/human development expenditures and HDI (UNDP 1996). Countries which spend more on social/human development tend to rank high in HDI.
The governance indicators developed in this study are, at best, limited to "end points" oroutput indicators. The indices constructed are not intended to supply information on why theresults are the way they are. They will not explain why some LGUs perform better than others. The indices developed may provide some clues, but they are generally scorecards. To determinethe reasons for the outcomes would require a full-blown evaluation type assessment that is outsidethe scope of this study.1
2. REVIEW OF LITERATURE
This section surveys two classes of works that are relevant in the task of constructingindicators of good governance. The first group focuses on the conceptual underpinnings ofgovernance. The second one deals with the more empirical concern for performancemeasurement.
1Cook et al. (1993) point out that only an in-depth evaluation can measure impacts and can tell what produced them.
Evaluations seek to identify causal relationships. In contrast, performance measurement focuses on effectiveness and efficiency andprovides a feedback to managers and policy makers.
6
2.1. Elements of Good Governance
It has been observed that it is the quality of governance and not the type of politicalregime that has made the difference in the economic performance of Asian countries. Projectevaluations conducted by the Asian Development Bank and the World Bank show that the projectperformance of countries are largely determined by the overall capacity for administration orimplementation.
These findings would seem to indicate the significance of the non-political and functionalelements in the strategic interactions between government and citizens. Moreover, they highlightthese fundamentals: accountability, transparency and predictability (Root, 1995). In like manner,the World Bank emphasizes four dimensions of governance: capacity and efficiency of the publicsector, accountability, legal framework for development, and transparency and information.
On the other hand, Lander-Mills and Serageldin (1992) include the following as thecritical elements that make up good governance: political and bureaucratic accountability, freedomof association, objective and efficient judiciary, freedom of information and expression, andefficient public institutions.
Meanwhile, Huther and Shah (1998) consider four observable aspects of governance:citizen exit and voice, government orientation (judicial efficiency, bureaucratic efficiency and lackof corruption), social development (i.e., human development in the tradition of UNDP plusequity) and economic management.
Accountability, Participation. Accountability holds public officials responsible forgovernment behavior and makes it imperative for them to be responsive to the needs of thecitizenry. At the local level, it refers to the flexibility of structures that would allow beneficiariesto improve program/project design and implementation. It also entails the establishment ofcriteria to measure the performance of local officials and the creation of oversight mechanismsto ensure that standards are met.
Accountability may be obtained at two levels: macro-level accountability and micro-levelaccountability (Paul 1991, World Bank 1992).
Macro-level accountability refers to the system whereby ministers are accountable to thelegislature and/or political leadership and whereby civil servants are accountable to the ministers. As such, it has two main aspects: financial accountability and economic accountability.
On the one hand, financial accountability involves: "a properly functioning governmentaccounting system for effective expenditure control and cash management; an external auditsystem which reinforces expenditure control by exposure and sanctions against mis-spending andcorruption; and mechanisms to review and act on the results of audits and to ensure that follow-upaction is taken to remedy problems identified@ (World Bank 1992).
On the other hand, economic accountability refers to the evaluation and monitoring ofefficient use of resources in government. It may be reflected in performance contracts,memorandums of understanding, value for money audits and legislative review of ministry ordepartment activities.
Macro-level accountability may be promoted by: making comprehensive and timelyinformation available; classifying expenditures in a manner consistent with budget programs; doing
7
appropriate analyses for decisionmaking; comparing budgets with results; improving theorganization and accounting system in the finance ministry; increasing the legal requirements forfinancial reporting; ensuring the independence of the audit organization; and focusing on Avaluefor money@ audits.
In contrast, micro-level accountability results from two basic factors. The first refers tothe willingness and ability of the public to Aexit@, meaning to consider other options whendissatisfied with a public service (Paul 1991). Exit is greatly influenced by the degree to whichthe public has access to alternative suppliers of a given public service. Policies and mechanismsthat promote greater competition like deregulation, contracting out of services to multiple privateproviders and public-private or public-public competition enhances exit.
Citing Baumol and Lee (1991), the World Bank (1992) noted that contestability is crucialin creating a competitive environment. That is, when incumbents are made to bid for contractsalong with outside competitors or when regulations favor new entrants, then incumbents are moreconscious of turning in a good performance.
The second aspect of micro-level accountability refers to the willingness and ability of thepublic to exert pressure on providers to perform well (i.e., the use of Avoice@). Voice depends onthe degree to which the public can influence the quality and quantity of a service through someform of articulation of preferences.
A survey of beneficiaries' satisfaction with the amount of services provided is one wayof providing "voice mechanisms." So are procedures for making complaints and institutions likethe ombudsman. Participation of non-government organizations or private sector representativesin decision-making or regulatory bodies is still another way of promoting voice.
The choice between exit and voice mechanisms should be guided by the factors whichfoster each of these options. The potential for exit depends on the presence of economies of scale(monopoly, e.g., the telecommunications industry used to consist of only one big industry player;so with the local airline industry), legal barriers to entry and spatial barriers to exit (e.g.,remoteness of a village so that it is efficiently served by only one school or clinic).
In contrast, the potential for voice is influenced by legal, institutional and informationalbarriers facing the public, the public=s level of income and education, and non-differentiability ofthe public service. For example, the absence of freedom of association, of participation and ofexpression certainly hampers the exercise of voice. So does lack of information. Also, loweducation levels constrain the public=s ability to evaluate options and participate in public debates.
Paul (1991) posits the following propositions in evaluating the menu of exit/voice options. First, when the public service operates as a local monopoly due to spatial barriers and when thepublic is characterized by low incomes and legal, institutional and informational barriers, improvedaccountability is better achieved through the use of voice. Under these conditions, the use ofvoice is likely to be stimulated by the intervention of agents outside of the local community (e.g.,NGOs).
8
Second, when the public service is characterized by large economies of scale and/or legalbarriers to entry, when service differentiation is difficult and when the public is not constrainedby low incomes and limited information, voice will tend to be used to induce greateraccountability. The use of voice under these conditions is likely to be initiated by the public andnot through external agents.
Third, when public service can be differentiated, when it is not constrained by economiesof scale and the public faces income, informational and institutional barriers, improvedaccountability is achieved through the use of exit.
The World Bank (1992) also asserts that micro-level accountability reinforces macro-levelaccountability. On the other hand, Paul (1991) makes a stronger statement in noting that overallpublic accountability is sustainable only if macro-level accountability is reinforced by micro-level accountability but that competition and/or participation cannot substitute for goodfinancial and economic accountability.
Lander-Mills and Serageldin (1992) adds a third dimension to public accountability:political accountability. In their view, political accountability is enhanced by the presence of asystem of popular choice which makes governments responsive to popular demand.
Transparency and Information. Transparency implies the provision of relevant andreliable information to all. The private sector needs accurate and timely information about theeconomy and government policies for effective decision making. Transparency in decision makingand implementation reduces uncertainty and can curb corruption among public officials. Itcomplements and reinforces accountability (by enhancing efficient use of resources and bypromoting participation) as well as predictability (by lowering uncertainty and transactions costs).
Predictability, Presence of Legal Framework. Predictability refers to the fair andconsistent application of laws, regulations and policies. This is important in creating a stableeconomic environment that allows prospective investors to assess opportunities and risks, totransact business with one another and to have a reasonable assurance or recourse againstarbitrary interference (World Bank 1992).
Predictability has five critical elements: "(1) there is a set of rules known in advance; (2)the rules are actually in force; (3) there are mechanisms assuring application of the rules; (4)conflicts are resolved through binding decisions of an independent judicial body; (5) there areprocedures for amending the rules when they no longer serve their purpose."
Efficiency of public sector. A capable public sector is one which collects its revenuesefficiently, and one which plans, programs, and budgets its expenditures soundly.
Social development. Good governance is one which promotes the health and well-beingof its citizenry in a manner that is equitable.
Sound economic management. For Huther and Shah (1998), sound economicmanagement may be observed through the government=s outward orientation, central bank=sindependence, and the debt-to-GDP ratio.

9
Along the same lines, Osborne and Gaebler (1992) enumerate the characteristics of goodgovernments -- decentralized, catalytic, community-owned, competitive, mission-driven, results-oriented, customer-driven, enterprising, anticipatory and market-oriented. These are the same qualities that characterize the best-run companies or corporations.
In the midst of serious social problems and swift global transformations, the authorsespouse a highly decentralized, non-traditional form of governance to maximize productivity andeffectiveness. Good governance based on these principles would mean a shift from traditional tonew roles and structures.
Catalytic and community-owned government. Local chief executives now assume therole of facilitating problem solving by stimulating the community into action. They are no longerconfined to the tasks of collecting taxes and delivering services. They are also involved indefining community problems and mobilizing scarce public and private resources to achievecommunity aspirations.
A catalytic local government assumes more "steering" functions (as opposed to "rowing")by "leading society, convincing its various interest groups to embrace common goals andstrategies." As such, the focus of a catalytic government ( or one that acts as a change agent)shifts from "doing" things (from delivering services) to making more policy decisions and puttingmore social and economic institutions into motion. It is also one that ensures that otherinstitutions are delivering services (in lieu of hiring more public employees to do the job).
Catalytic local governments may contract out some services but privatization is just oneof the answers. It is not the only answer. Community services and programs offered by localgovernments should be designed such that the clients are empowered and become less dependenton government for their needs. Ownership of programs by the community should be facilitatedby local officials through the self-help process. Non-governmental organizations and people'sorganizations should be tapped to assist in promoting self-help and in formulating andimplementing development projects.
Competitive, enterprising, anticipatory, results-oriented governance. Localgovernments, as further illustrated by Osborne and Gaebler (1992), should take a competitivestance to achieve greater efficiency. They should promote competition among service providersto keep costs down and to induce excellence for greater customer satisfaction. Localgovernments could enhance competition by encouraging private firms to provide goods andservices that were previously provided by the public sector either by load shedding (with thegovernment consciously withdrawing from public provision), procurement or contracting.2
They should also be enterprising in the sense that they should look for innovative waysof creating revenue (e.g., charging user fees for some public services, like the use of public restrooms, parking lots) and investing for returns (i.e., evaluating the returns on their spending as if
2Contracting is not easy. Referring to Donahue (xxxx), Osborne and Gaebler note that contracting works best when public
agencies can define precisely what they want done, generate competition for the job, evaluate a contractor's performance and replaceor penalize those who fail to achieve expected performance levels.

10
it were an investment). It is also important that governments put the right incentive structure inplace. One way of doing so is by allowing governments/agencies/departments to keep some ofthe money they make or save through such mechanisms like shared savings/earnings and revolvingor enterprise funds.
Good governance, moreover, translates to effective structuring of the market place orcreating incentives and alternatives/choices for people that lead to a certain vision. To make thispossible, reforms ought to take place such as the eradication of red tape and restrictive budgetprocedures typical in bureaucracies. A simplification of rules and structures makes way forgreater participation by the private sector.
Good local governance requires foresight. Local governments should focus more onprevention rather than cure as it is easier and less expensive to solve problems rather than torespond to crises. Prevention is particularly beneficial in health care and environmentalprotection. Thus, good governments are able to anticipate the future and to make decisions basedon foresight (e.g., through strategic planning).
A results-oriented local government gives more attention to funding, monitoring andmeasuring project/program outcomes rather than inputs (Osborne and Gaebler 1992). In contrast,when institutions are funded according to inputs, they have little incentive to turn in a goodperformance. In this light, a set of performance measures and, possibly, a system of linkingfunding or rewards with results is needed to ensure that program outcomes are achieved.3
At the personnel level, Root (1995) adds that clear career paths and adequatecompensation are essential in improving staff productivity. There is a need to establishmechanisms to evaluate performance so that promotion is based on achievement. Compensationand other incentives which include opportunities to upgrade skills should be linked with successfulprogram implementation.
Decentralized decisionmaking and fiscal responsibility. Shah (1994) argues thatdecentralization of fiscal responsibility contributes to the efficient provision of local publicservices since expenditures are matched closely which local preferences and needs. Moreover,accountability is promoted by the clearer and closer linkage between the benefits and costs oflocal public services. Oates (1972) further emphasizes the principle of subsidiarity: public servicesare provided most efficiently by "the jurisdiction having control over the minimum geographicarea that would internalize benefits and costs of such provision."
Moreover, the greater responsiveness of local governments to local demands encouragesfiscal responsibility and efficiency if financing is also decentralized and interjurisdictionalcompetition and innovation are enhanced (Root 1995). In line with this, the principle ofsubsidiarity has also been put forward with respect to taxation: lower levels of governmentshould be assigned to collect taxes unless a convincing case can be made for it to be given tohigher levels of government.
3 0sborne and Gaebler pointed out that many times performance measurement achieves good results quite independently
of the reward/incentive system.
11
Thus, decisionmaking should occur at the lowest level of government on the grounds ofefficiency, accountability, manageability and autonomy. However, economies of scale andbenefit-cost spillovers (or externalities) may alter these results somewhat. Economies of scalearise when the costs of production (per unit of output) decline with the scale of production. Inmany countries, for instance, the cost per resident of delivering specific types of services (likewater supply and sewage treatment) decreases as the number of residents increases. Similarly,certain services require specialty services that can only be justified for large client populations. Examples of these are tertiary hospitals, fire-fighting equipment for high-rise buildings, etc. (Bahland Linn 1992). In these cases, the optimal size Aplant@ for providing certain kinds of services inthe most-cost effective manner may be larger than a local jurisdiction.
On the other hand, benefit-cost spillovers occur when the benefits/cost of a public serviceare realized by non-residents of the jurisdiction providing the said service to its constituents. Forinstance, local health services such as immunization lower the morbidity risks not only of theresidents of a given municipalities but also those of other municipalities (Capuno and Solon 1996). Similarly, polluting activities in upstream municipalities increase the health risks and,consequently, the demand for health services in downstream municipalities.
Optimal size of jurisdiction will vary with specific instances of economies scale andbenefit-cost spillouts. The optimal provision of public services is ensured when the marginalbenefit equals the marginal cost of production. This is achieved when the benefit area and thepolitical jurisdiction are congruent. When this occurs fiscal equivalency is said to be in place(Oslon 1969). In such a situation, the free-rider problem is surmounted. However, the fiscalequivalency principle may require a different-sized jurisdiction for each public service.
According to Paderanga (1996), government has become more responsive to localconditions with the devolution of powers to local authorities. He claims that current problemswith decentralization and devolution call for a systems audit and staff training program. Thismeans there is need to properly identify what functions must be devolved including the specificlevels and forms of such functions. Moreover, there is need to implement an effective trainingprogram that will rapidly upgrade the level of competence in local governments .
2.2 Measuring the Performance of Governments
Output-input efficiency measures. According to Hatry et. al., (1992), efficiencymeasures of local governance are output-input ratios with outputs defined in terms of (1) workload, (2) some measure of effectiveness, and (3) equipment and personnel utilization rates.4
4 Hatry, et. al. give examples of these measurements. One of their illustrations is on fire protection and is shown below:
Fire Protection--Measures of Efficiency
Type 1: Output in units of work load over inputnumber of firecalls responded to per dollarnumber of fire prevention inspections per dollar, perhaps categorized by residential or commercial
Type 2: Output in units of effectiveness over input

12
In the first measure, one or more physical work load units can be identified as outputs.These outputs are then related to the amount of resources used in producing them. The secondmeasure considers output in terms of the quality of service provided. This type of measure,however, shares a shortcoming that is common to all effectiveness measures. It is often difficultto obtain some desirable indication of effectiveness in terms of the success of prevention efforti.e. prevention of crimes, fire, traffic accidents, or diseases.
In these cases, the approach often used is to measure the number of incidents notprevented -- the number of crimes, fire, traffic accidents, or prevailing diseases. The authors thenargue that relating these to cost or time does not make sense. Expressing effectiveness measuresas percentages likewise is not of much use; they should be converted to numbers which can beused in the ratios.
The third measure reflects the amount of specific resources that are utilized (or notutilized) for potentially productive activities. This type of measure does not directly assess theamount of output obtained from these resources and, thus, should be considered only as proxyindicator.
Hatry et al. (1992) caution that efficiency implies a certain level and quality of service. An increase in output-input ratio is not really an efficiency improvement if the quality of serviceis not maintained, at the very least. Thus, it is necessary to examine both efficiency andeffectiveness measures to see the whole picture of government performance. Moreover, thenumber of activities in local governments that can be measured seems endless. This could leadto excessive and tedious data collection and should be avoided.
number of fires fought for which less than a target amount of spread occurred per suppressionnumber of households and business establishments "protected" per dollar, with "protected" defined as those establishmentswithout a fire during the period
Type 3: Utilization Measurespercentage of downtime of major fire equipmentpercentage of time fire crews are understaffed
In like manner, Gaffud (1997) enumerates three elements that are essential in constructingindicators for measuring the performance of the public sector: efficiency, effectiveness andeconomy. Efficiency links outputs to costs; effectiveness ensures the attainment of organizationalobjectives/goals; and, economy matches actual to planned costs.
Some of the measurements illustrated above, where quantitative indicators are involved,may not actually work because of difficulties in measuring public sector outputs not only in valuebut, at times, also in physical terms. Gaffud (1997) contends that public sector outputs are
13
usually intermediate products that are, at best, "proxies" for the intended final output. Examplesof these are outputs produced by regulatory and social service agencies.
While the output of some government agencies can be measured (like postal serviceswhere service and cost comparisons with those incurred by private firms can be made),measurement of public sector output in other areas (like defense, regulatory activities and socialwelfare programs) remain elusive. Thus, input indicators as proxies for non-market outputs aregenerally acceptable.
Well-being indicators. Several sets of indicators have been made to assess theaccomplishment of government in promoting human or social development. The Social IndicatorsProject (SIP) done in 1973 by the Development Academy of the Philippines (DAP) was apioneering effort in formulating a set of indicators to gauge the performance of government.
It was meant to measure the state as well as the perception of human well-being in thecountry for a particular short-term period. Mangahas (1976) then thought that the indices couldbe linked to specific programs of government to truly reflect the essence of the social indicatorssystem. The said indicator system could thus be further developed as a basis to evaluate theactual performance of local government officials.
The SIP considered social concerns as the goals of Philippine society and treated socialindicators as synonymous to welfare indicators. Present welfare consists not only of the welfareof Filipinos currently alive but also of the welfare of future generations (Mangahas 1976). Theterms welfare, social, and development have been said to carry some value or ethical content. Incoming up with welfare indicators, it has been argued that indicators cannot and need not be freeof value judgment. What is more important is that elements of the judgment should be madeexplicit.
Research on social concerns and social indicators done in other countries supplied theguidelines used by the SIP in drawing up the list of basic Philippine social concerns. Thefollowing social concerns were found to be universal and not at all unique to any country: healthand nutrition, learning, income and consumption, employment, non-human productive resources,housing, utilities and the environment, public safety and justice, political values, and socialmobility.
For each concern a limited number of measurable variables or indicators were drawn up. The indicators chosen were those which are reliable, replicable, and simple to interpret in orderto be easily understood by the end-users -- the general public. Also, there was a preference infavor of final rather than intermediate indicators.
In other words, the indicators should reflect the outputs rather than the inputs of the socialsystem. For instance, it was noted that the crime rate is a preferable indicator than the numberof policemen per block. In like manner, the proportion of people who are ill is a better indicatorthan the number of hospitals beds available.
14
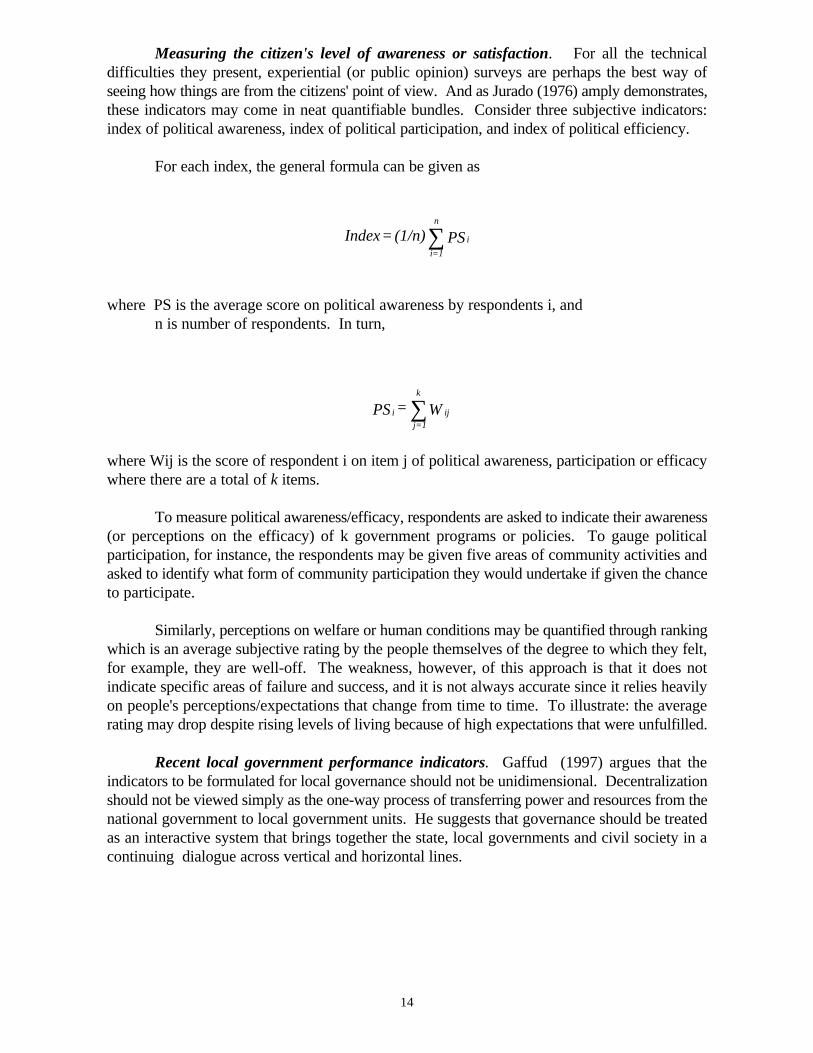
Measuring the citizen's level of awareness or satisfaction. For all the technicaldifficulties they present, experiential (or public opinion) surveys are perhaps the best way ofseeing how things are from the citizens' point of view. And as Jurado (1976) amply demonstrates,these indicators may come in neat quantifiable bundles. Consider three subjective indicators:index of political awareness, index of political participation, and index of political efficiency.
For each index, the general formula can be given as
where PS is the average score on political awareness by respondents i, andn is number of respondents. In turn,
where Wij is the score of respondent i on item j of political awareness, participation or efficacywhere there are a total of k items.
To measure political awareness/efficacy, respondents are asked to indicate their awareness(or perceptions on the efficacy) of k government programs or policies. To gauge politicalparticipation, for instance, the respondents may be given five areas of community activities andasked to identify what form of community participation they would undertake if given the chanceto participate.
Similarly, perceptions on welfare or human conditions may be quantified through rankingwhich is an average subjective rating by the people themselves of the degree to which they felt,for example, they are well-off. The weakness, however, of this approach is that it does notindicate specific areas of failure and success, and it is not always accurate since it relies heavilyon people's perceptions/expectations that change from time to time. To illustrate: the averagerating may drop despite rising levels of living because of high expectations that were unfulfilled.
Recent local government performance indicators. Gaffud (1997) argues that theindicators to be formulated for local governance should not be unidimensional. Decentralizationshould not be viewed simply as the one-way process of transferring power and resources from thenational government to local government units. He suggests that governance should be treatedas an interactive system that brings together the state, local governments and civil society in acontinuing dialogue across vertical and horizontal lines.
PS (1/n) = Index i
n
=1i∑
W = PS ij
k
j=1i ∑
15
In the manner of Osborne and Gaebler (1992), Gaffud favors local governments (1) thatexperiment with organizational combinations featuring partnerships with national governmentagencies and civil society, (2) that continue to carry out their role as providers while nationalgovernment agencies, the private sector and civil society may act as producers of basic services.
A distinction is made between the provision and production of basic services. Localgovernments act solely as providers. They could, of course, share or delegate the productionfunction through assignment or contract to others, either to national government agencies, otherpublic sector organizations, or private enterprises. As providers, local governments areconcerned with "creating" the policy environment, making resources available, and directingresource use toward planned priorities.
In this context, Gaffud maintains that local governments have three main strategicobjectives: to increase revenues; to improve the effectiveness of the communities with regard toservice delivery and to ensure the right mix of policy and administrative initiatives for continuingdecentralization.
Various indicators to gauge increased revenue generation have been proposed by Gaffud:tax effort, tax collection rates, ratio of local government revenues to total national revenue, ratioof internally generated revenues to total local government revenues and ratio of local taxes tototal local government revenue.
Various indicators of effectiveness of service delivery at the community level havelikewise been formulated: percentage of total local government expenditures for humandevelopment priorities, level of attainment of local governments in delivering devolved basicservices (in health, public works, agriculture), extent of partnership in service delivery betweenlocal governments and civil society institutions, and number of functioning local school and healthboards.
Gaffud notes that the policy and administrative environment should be ensured forcontinuing decentralization. This may be reflected in the following: share of local governmentsin total public sector budget, proportion of national agency budgets under the discretion of theregional development councils, partnership between national government agencies and inter-localgovernment, consortium arrangements for implementation of devolved and non-devolved basicservices, and number of projects proposed by local boards supported by regional field offices.
2.3. Construction of Composite Welfare/Human Development Indices
The need to develop a single index for various aspects of governance is generallyperceived to be important. Paqueo (1976) contends that despite difficulties in coming up with anindex to monitor the health of the people, there is pressure to have one just like the GNP whichis used to monitor the nation's economic health. Construction of a composite measure of humandevelopment which expresses various components in a single magnitude is difficult but severalsuccessful efforts have been made since.
Human Development Index. The human development index (HDI), for one, has beenwidely accepted. The HDI is based on three indicators: longevity, educational attainment andstandard of living (UNDP 1996). The UNDP's HDI methodology was used by the 1997Philippine Human Development Report (PHDR) in computing provincial level HDI for the

16
Philippines (HDN/UNDP 1997). As with the international computation, fixed minimum andmaximum values are applied; life expectancy at birth: 25 years and 85 years; adult literacy; 0%and 100%; combined primary, secondary and tertiary enrolment ratios: 0% and 100%; and realGDP per capita: P3,350 and P19,056 for the period 1991-1994, both expressed in 1985 prices.
For every province, an index each for life expectancy, literacy and income is computedaccording to the general formula:
where the index Ii refers to the index for each of the three components. The HDI for a provinceis then obtained by taking the average of the three components:
Capability Poverty Measure. The capability poverty measure (CPM) is another indexcomposed of three indicators: the percentage of children under five who are underweight; thepercentage of births unattended by trained health personnel; and, the percentage of women aged15 years and above who are illiterate (UNDP 1996). These indicators reflect the percentage ofthe population with capability shortfalls in three corresponding dimensions of humandevelopment: living a healthy, well-nourished life; having the capability of safe and healthyreproduction; and being literate and knowledgeable.
UNDP (1996) asserts that indicators to measure deprivation in capabilities should directlyreflect capability shortfalls. If unavailable, substitute indicators could be use, e.g., the availabilityof trained health personnel to attend births, access to health services, potable water and adequatesanitation. Nevertheless, indicators of actual access is better than those of potential access. Forinstance, rates of immunization or use of oral rehydration therapy are preferable to data on traveltime to a primary health care center in monitoring the effectiveness of the public health system.
The CPM differs from the HDI in that it deals with people's lack of capabilities, not withthe average level of capability in the country. The CPM is a more people-centered measure ofpoverty. It recognizes that human deprivation occurs in a number of critical dimensions. Thus,it is multidimensional. Unlike income (which is the more conventional way of measuring poverty),capabilities are ends rather than means. They are not measured in terms of inputs but in terms ofhuman development outcomes -- in the quality of people's lives.
The expansion of capabilities defines human development. However, the presentformulation of the CPM is faulted by its critics precisely because of the exclusion of income in theindex. They argue that the CPM should not ignore income in its formulation in the same mannerthat the HDI includes per capita GDP.
However, the 1996 Human Development Report argues that lack of opportunity signifiesthat access to the means to develop or maintain essential human capabilities is not beingadequately provided. Thus, indicators of the availability of social services which are the direct
X Minimum- XMaximumX Minimum- XActual
= Iii
iii
)I + I + I( (1/3) = HDI 321
17
means to ensuring a decent standard of living would be of better use than proxy indicators orindirect measures like income as in the human development index.
The three variables used in the CPM are given equal weight in the composite index. Thisimplies that each is a basic capability that cannot substitute for another that is lacking. Since thethree are foundational capabilities, it is assumed that policy should not seek to trade one offagainst another. If flexibility in weights is desired, it has been suggested that respondents tosurveys be asked to assign weights to each capability by allocating a fixed total.
Minimum Basic Needs. Reyes and Alba (1994) cite the difficulty in coming up with asingle index of welfare status. They argue that the Under 5 Mortality Rate (U5MR)recommended by UNICEF may be the best available indicator of overall social developmentbecause of its broad coverage. However, they do recognize the need to consider several measuresto gauge the conditions of the household or individual.
They note that it is important for policy makers to determine how sensitive the indicatorsare to changes in macro policies, i.e., the impact of macro policies on vulnerable groups. Theycontend that it is essential to focus on indicators that are sensitive to policy changes, even if theymeasure only one facet of human welfare. The minimum basic needs (MBN) indicators whichwere formulated by an inter-agency group for the use of the Presidential Commission to FightPoverty are examples of such indicators.
The minimum basic needs indicators cover three important areas of concern: survival,security and enabling needs. Indicators under each area are enumerated below:
Survival
* Health: infant mortality rate, child mortality rate
* Nutrition: prevalence of moderate and severe underweight, prevalence of acute and chronic malnutrition, prevalence of micronutrient deficiencies (anemia, endemic goiter,xerophthalmia), income above the food threshold
* Water and sanitation: proportion of households with sanitary toilet facilities, proportionof households with access to safe water supply
Security
* Income and security: income above the total poverty threshold, amount of household savings, employment or unemployment
* Shelter: proportion of households in makeshift houses
* Peace and order: crime incidence, incidence of armed encounters
Enabling Needs
* Basic education and literacy: elementary enrolment, rate of completion, basic andfunctional literacy
18
* Participation: membership in at least one area-based community organization, participationin formal electoral exercises
3. APPROACH AND METHODOLOGY
3.1. Overall Framework
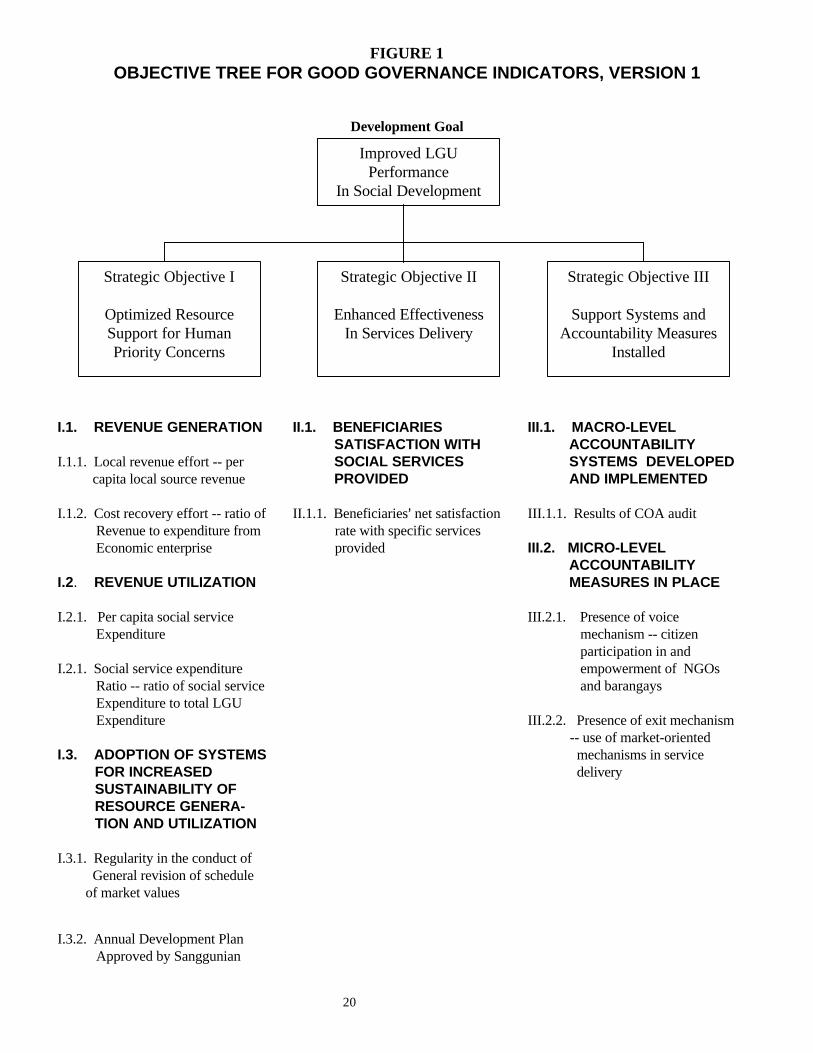
As a general approach, this study first develops a conceptual framework that helps definethe key observable dimensions of governance. Next, it further breaks down each of thesedimensions into their principal elements. In turn, a limited number of measurable indicators thatare able to represent the more important character of each of these elements are delineated.
This study adapts the objective tree approach used by Gaffud (1997). Thus, overalldevelopment goal of the LGU is delineated as improved performance in social/humandevelopment. Three strategic objectives are, then, deemed essential to the achievement of thisoverall goal: (1) optimized resource support for human/social development concerns; (2)enhanced effectiveness/efficiency in social service delivery; and (3) accountability systemsdeveloped and installed (Figure 1).
In turn, each of these three strategic objectives are defined in terms of componentelements or result packages (RPs). In particular, the "optimized resource support" objective isbroken down into 3 RPs: revenue generation; revenue use; and, adoption of systems to sustainrevenue generation and utilization. Similarly, the "effectiveness/efficiency in social servicedelivery" objective is supported by 1 RP: beneficiaries satisfaction with social services delivered.On the other hand, the "accountability" objective is further specified to include the following resultpackages: financial accountability systems developed and implemented; and micro-levelaccountability systems developed and implemented.
Section 4 presents in detail the conceptual basis for the choice of dimensions, principalelements of each dimension and performance indicators for each of these elements. This choiceis largely driven by the governance concepts expounded in Section 2. It attempts to address thefollowing questions. (1) Do these three dimensions of governance adequately capture LGUperformance in attaining the overall development goal? (2) Do the different result packagessatisfactorily support each of the strategic objective they represent? (3) How well do theperformance indicators/measures relate to each of the result packages? (4) How do thealternative performance indicators rank in terms of the different criteria set for choosingperformance indicators?
3.2. Data and Measurement
Data gathering. Most of the indicators listed in Figure 1 and Figure 2 can be measuredbased on LGU records, financial statements, other pertinent documents and key informantinterviews with local government officials and NGO representatives. For instance, all theindicators belonging to Strategic Objective I are of this type. In measuring these indicators,existing LGU records in the pilot LGUs were checked and validated by interviews with key localofficials.
19
However, some of the indicators in Figure 1 are based on experiential/attitudinal datathat required the conduct of public opinion surveys (e.g., those relating to micro-levelaccountability). In this regard, the respondents to the opinion surveys were drawn from localresidents using multistage (cluster) sampling. In the first stage, 2 barangays (one urban barangayand one rural barangay) were drawn randomly from the different barangays in each pilot LGU. Barangays were differentiated as to their urban character in order to capture differences in theusage/satisfaction of the residents for specified functions.
In the second stage, a random sample of individual respondents was drawn in each of theselected barangays. Since a complete listing of the residents in these barangays was not easilyavailable, randomness was assured by interviewing household heads in every other house linedup along the various thoroughfares in these barangays.
The coverage of the public opinion survey conducted in this study was sketchy becauseof time and resource constraints. On the average, some 50 respondents were interviewed for eachpilot LGU. Admittedly, this number is not large enough to yield a decent margin of error but thesurveys undertaken for purposes of this study were primarily done to pilot test the questionnaireand assess the feasibility of applying this approach in a more rigorous manner in futureresearches.
The questionnaire used for drawing out citizen's perception/satisfaction with servicedelivery and overall governance was patterned after the Social Weather Station (SWS) surveys(Appendix 1).
Criteria in selecting indicators. In the beginning, the number of measures included in thepreliminary list of indicators was too large in number (and thus, too complicated) to be of muchuse to local chief executives, NGA heads or local voters (Appendix 2). However, the list wastrimmed down in the course of the study (during field testing and consultative workshops) basedon the following criteria:5 how specific, how quantifiable, how universal, how credible, howsimple and acceptable the indicators are.
Specificity demands that the indicators provide information that are dis-aggregatedenough across functions or levels of government to be meaningful to the various users of theindicator system proposed. This implies that the indicators cannot be the Aone-size-fits-all@ type.In contrast, universality implies that the indicators can standardized to fit all levels of governmentor functions.
For purposes of this study, quantifiability means the indicators can be measured in termsof either an ordinal/cardinal scale or binary type responses.6 The latter includes, for example,indicators that relate to the presence/absence of certain modes of service provision or revenuegeneration.
5 These criteria are drawn largely from the works of Jackson and Palmer ( 1988) and Gaffud ( 1997).
6 In this sense, even citizen's perception are quantifiable.
20
FIGURE 1OBJECTIVE TREE FOR GOOD GOVERNANCE INDICATORS, VERSION 1
Development Goal
I.1. REVENUE GENERATION
I.1.1. Local revenue effort -- per capita local source revenue
I.1.2. Cost recovery effort -- ratio of Revenue to expenditure from Economic enterprise
I.2. REVENUE UTILIZATION
I.2.1. Per capita social service Expenditure
I.2.1. Social service expenditure Ratio -- ratio of social service Expenditure to total LGU Expenditure
I.3. ADOPTION OF SYSTEMS FOR INCREASED SUSTAINABILITY OF RESOURCE GENERA- TION AND UTILIZATION
I.3.1. Regularity in the conduct of General revision of schedule of market values
II.1. BENEFICIARIES SATISFACTION WITH SOCIAL SERVICES PROVIDED
II.1.1. Beneficiaries= net satisfaction rate with specific services provided
III.1. MACRO-LEVEL ACCOUNTABILITY SYSTEMS DEVELOPED AND IMPLEMENTED
III.1.1. Results of COA audit
III.2. MICRO-LEVEL ACCOUNTABILITY MEASURES IN PLACE
III.2.1. Presence of voice mechanism -- citizen participation in and empowerment of NGOs and barangays
III.2.2. Presence of exit mechanism -- use of market-oriented mechanisms in service delivery
I.3.2. Annual Development Plan Approved by Sanggunian
Improved LGUPerformance
In Social Development
Strategic Objective I
Optimized ResourceSupport for HumanPriority Concerns
Strategic Objective II
Enhanced EffectivenessIn Services Delivery
Strategic Objective III
Support Systems andAccountability Measures
Installed

21
FIGURE 2OBJECTIVE TREE FOR GOOD GOVERNANCE INDICATORS, VERSION 2
Development Goal
I.1. REVENUE GENERATION
I.1.1. Local revenue effort -- per capita local source revenue
I.1.2. Cost recovery effort -- ratio of revenue to expenditure from economic enterprise
I.2. REVENUE UTILIZATION
I.2.1. Per capita social service expenditure
I.2.1. Social service expenditure ratio -- ratio of social service expenditure to total LGU expenditure
I.3. ADOPTION OF SYSTEMS FOR INCREASED SUSTAINABILITY OF RESOURCE GENERA- TION AND UTILIZATION
I.3.1. Regularity in the conduct of general revision of schedule of market values
II.1. ADEQUACY OF SERVICES PROVIDED
II.1.1. Programming of service delivery inputs in compliance with national benchmarks
II.2. STRONG LGU-NGA COOPERATION
II.2.1. Presence/absence of NG-LGU cooperative agreements
III.1. MACRO-LEVEL ACCOUNTABILITY SYSTEMS DEVELOPED AND IMPLEMENTED
III.1.1. Results of COA audit
III.2. MICRO-LEVEL ACCOUNTABILITY MEASURES IN PLACE
III.2.1. Presence of voice mechanism -- participation of NGO representatives in local special bodies
III.2.2. Presence of exit mechanism -- use of market-oriented mechanisms in service delivery
I.3.2. Annual Development Plan Approved by Sanggunian
Improved LGUPerformance
In Social Development
Strategic Objective I
Optimized ResourceSupport for HumanPriority Concerns
Strategic Objective II
Enhanced EffectivenessIn Services Delivery
Strategic Objective III
Support Systems andAccountability Measures
Installed
22
On the other hand, credibility refers to the absence of known systematic built-in bias in themeasurement of the indicators. Simplicity implies that the indicators are clearly consistent withthe overall development goal as well as with the three strategic objectives.7 Lastly, acceptabilitywith the various stakeholders is validated in the workshops that were conducted in the course ofthis study.
It should be pointed out that these criteria are not entirely compatible with one another. Some trade-offs between the different criteria are evident. This is particularly true with regardto specificity and universality.
Composite indices. A composite index is constructed corresponding to each of thestrategic objectives. Furthermore, the composite indices, thus, derived are consolidated into anoverall governance index.
Initially, equal weights are assigned to the different indicators (and different resultpackages). These weights are, then, subjected to validation during the sub-national and nationalworkshops/consultations conducted in the course of the study.
Pilot Testing. Given time and resource constraints, the measurement of the indicatorspresented in Figure 1 and Figure 2, as well as the construction of the composite indices werepilot tested in 3 pre-selected LGU clusters. Each cluster consisted of three jurisdictions (oneprovincial government (PLGU), one city government (CLGU) and one municipal government(MLGU). The clusters were chosen on the basis of their provincial level HDI.
7 Simplicity is largely assured by the objective tree approach that is followed in this study.
* High HDI : Cavite PLGU, Trece Martirez CLGU and Noveleta MLGU* Medium HDI: Davao del Norte PLGU, Davao CLGU, and Mabini MLGU* Low HDI: Antique PLGU, San Jose MLGU, and Hamtic MLGU
4. CONSTRUCTION OF A GOVERNANCE INDEX
4.1. Choosing the Key Dimensions of Governance
As local governments make the painful passage to a decentralized set-up, they will beunder close scrutiny to improve their performance especially in human development. This is inkeeping with the mandate of the Local Government Code to establish LGUs that are performance-based and possessed of greater managerial accountability for social or human development outcomes.
Synthesizing the various elements of good governance that emerge from the survey ofliterature, the present study starts with the premise that good governance at the LGU level isprimarily determined by how well LGUs perform in improving the quality of life of their constituents, i.e., how efficient and effective LGUs are in bringing about social/humandevelopment.

23
LGUs not only provide goods and services. Before they can even start to do that theymust first mobilize and allocate resources. They also invest resources and negotiate contracts.All these activities impact strongly on final social outcomes. Thus, the way LGUs manageresources is extremely important. In this sense, local authorities need to govern on the basis ofconsistency and transparency of processes and broad-based community support.
A responsive regulatory framework can expedite social development, if enforcedconsistently. It is a necessary condition for good governance. Equally necessary is an externalenvironment in which people are sufficiently aware and involved to demand better performance.This includes a built-in mechanism for listening to the community, forming partnerships with civilsociety and other levels of government and accepting feedback from oversight agencies.
If these conditions are met, LGUs would be in a good position to improve social resultsfor a given amount of social spending. This should set off a virtuous circle in which each actionmakes the next one less difficult. But to chart the progress of LGUs at each stage, indicators areneeded that would assess how responsive and accountable decisions are at the local level.
Given this perspective, it is imperative that LGUs pursue the following three strategicobjectives if they are to attain the overall goal of achieving a higher level of human developmentin their areas of jurisdiction (Figure 1 and Figure 2).8
(1) Optimized resource support for human priority concerns.
8 Admittedly, governance has other dimensions in addition to the three outlined above: legal framework for
development including a sound judicial system, economic management, and egalitarian income distribution. However, itis deemed that these facets are less important for local governments as opposed to central governments.
This does not only mean raising and allocating money (even if budgeted for humandevelopment concerns). It also means diversifying revenue sources as well as providingthe policy and legal framework to ensure a steady source of income that can beprogrammed for productive use.
(2) Improved effectiveness and efficiency in social services delivery.
LGUs need to make serious attempts to (a) observe standards and benchmarksfor devolved social services; (b) increase the level of satisfaction of beneficiaries with theservices delivered; ( c) use non-traditional and innovative modes of service delivery; and(d) encourage private institutions to take an active part in social service delivery.
(3) Responsive and transparent decisions.
This requires the presence of a pro-active citizen feedback mechanism and strongintergovernmental relations to promote innovations in local resource management andsocial service provision. It also means that accounting and auditing procedures thatpromote restraint (to curb corruption and arbitrary action) and flexibility (to encouragenew and better ways of doing things) are developed and implemented.
24
4.2. Choosing the Indicators
Strategic Objective I: Optimized Resource Support for Human Priority Concerns. Thecapacity of LGUs to provide social services is largely determined by their financial resources andtheir ability to manage such resources vis-a-vis competing demands. With devolution, LGUs arefaced with greater expenditure responsibilities. Thus, one of the major challenges they must dealwith is how to mobilize additional revenues from local sources even with the higher IRA sharemandated under the 1991 Local Government Code.
In this regard, LGUs must increasingly seek to diversify their revenue sources, particularlythrough the institution of cost recovery measures. That is, they have to look beyond traditionalsources of revenue like the real property tax and local business taxes. Although higher local taxesare usually met with some resistance, experience in other countries shows that citizens generallyhave a greater willingness to pay fees in exchange for benefits received or services rendered.
At the same time, LGUs now have greater responsibility in providing human developmentconcerns with the devolution of many health and social welfare functions previously dischargedby national government agencies. To a large extent, the ability of LGUs to provide adequatesocial services will be determined by the amount of resources they allocate to these sectors.
However, while increased financial support to the social service sectors is an advantage,it is not sufficient in ensuring improvement in the quality of life of local constituents. Just asimportant are effective and efficient service delivery mechanisms as well as strong accountabilitymechanisms. In addition to the actual generation and utilization of revenues, the achievement ofStrategic Objective I also requires that systems and processes that will enhance the sustainabilityof these activities are put in place.
To sum up, the "optimized resource support" objective is broken down into 3 resultpackages: revenue generation; resource utilization; and adoption of systems and processes forincreased sustainability of revenue generation and utilization efforts.
In turn, two performance indicators are proposed for revenue generation: local revenueeffort and cost recovery in key economic enterprises or relevant service sector of the LGU.
Revenue Generation. Local revenue effort may be measured in numerous ways. Amongothers, Gaffud (1997) suggests efficient collection of real property tax, ratio of real property taxto total LGU income, ratio of local business taxes to total LGU income, and ratio of the IRA tototal LGU income.
These measures, however, share a number of common weaknesses. Most of theseindicators, if used singly, tend to favor certain types of LGUs. For instance, the ratio of localbusiness taxes to total LGU income would tend to rate more urbanized LGUs favorably sincethese LGUs are generally able to raise more revenues from local business taxes (compared withrural LGUs) because of the bigger share of transactions with industrial/commercial character (and,therefore, taxable) in these LGUs.
25
Moreover, these indicators, if taken individually, provide a limited and incomplete viewof LGU revenue generation effort. On the other hand, if they are used in conjunction with oneanother, the indicator system will get too complicated.
Hence, this study recommends the use of per capita local source revenue to measure localrevenue effort. In principle, revenue effort is measured by comparing actual revenues with therevenue base. Because of the absence of more relevant data on the local revenue base, populationis used as a proxy for the same.
Cost recovery in key economic enterprises or service sector is measured as the ratio ofactual revenues from the specified economic enterprise to the actual expenditures on the saidenterprise. For cities and municipalities, the key economic enterprise considered is the publicmarket. Since provincial governments do not operate economic enterprises, cost recovery isdefined in terms of the operations of public hospitals given that these facilities are the mostimportant cost center in provincial government units.
Resource Utilization. On the other hand, the "resource utilization" result package ismeasured by two performance indicators: per capita social service expenditures and the ratio ofLGU expenditures on social services to total LGU expenditures.
Actual LGU support to the attainment of human development concerns is best measuredby per capita LGU expenditures on the social sectors. However, this indicator may have somebias in favor of LGUs which have high per capita IRA. That is, it is possible that some LGUshave low per capita social service expenditures not for lack of commitment to the humandevelopment goal but due to lack of resources as a result of the amount of IRA allotted to them. In view of this fact, this study includes the LGU social service expenditure ratio as one of theperformance indicators for resource utilization so that greater LGU effort is given equalimportance. In other words, the LGU social expenditure ratio may be viewed as a measure ofeffort on the part of LGUs given their capacities, while per capita social spending may beunderstood as a measure of the adequacy of effort in meeting absolute needs.
Lastly, it is proposed that the result package for "adoption of systems for revenuegeneration and utilization@ be measured in terms of the following performance indicators:regularity in the conduct of the general revision of the schedule of market values and theapproval of the Annual Development Plan by the Local Sanggunian.
Strategic Objective II. Effectiveness/Efficiency in Social Service Delivery. In general,service delivery at the local level is still perceived as a primary function of government. Despitethe devolution of services that calls for the heightened participation of the private sector and civilsociety, government continues to be the main provider of services and facilities. Given thiscondition, good local governance could be manifested through enhanced effectiveness andefficiency in the delivery of social services.
It should be emphasized that while Strategic Objective I aims to ensure that adequatefinancial resources flow into social service sectors, Strategic Objective II helps ensure that LGUsuse these financial resources wisely so that they are able to maximize program impact for eachpeso spent.
26
In principle, effectiveness/efficiency in the delivery of social services is best measured byoutcome indicators like the human development index (HDI) itself. However, social outcomes(like life expectancy or literacy) are the result not only of LGU actions but also of centralgovernment actions making attribution truly problematic. This point assumes greater importancein cases like the Philippines where social services are typically delivered along two parallel tracks(an LGU track and a national government track) or where national government agencies andLGUs provide complementary inputs. It should be stressed that since the primary concern in thisstudy is the measurement of good governance at the LGU level, it is essential that the indicatorschosen are those that pertain to LGU performance only.
Given these considerations, LGU effectiveness/efficiency in service delivery may beappropriately gauged by using any one of the following approaches: (1) use of efficiencymeasures; (2) use of measures of client satisfaction, and (2) use of effectiveness measures.
Efficiency indicators usually involve the computation of output-input efficiency ratioswhere output is typically measured in terms of work load units a la Hatry et al. (1992). There aretwo difficulties in implementing this approach.
As already noted, public sector output is not easy to define. Moreover, administrativedata relating to LGU output in service delivery are not uniformly available at the local level. Inthe pilot tests, an attempt was made to simplify the exercise by defining output in terms of numberof beneficiaries/clients served by type of service (health, social welfare, day care centers).
It was found that not all LGUs gather and record this kind of information. For instance,data on number of clients served per type of social service were not easily accessible in TreceMartirez City, Davao City, Antique Province, and Davao del Norte Province. Moreover, forLGUs that do maintain records, there is a great deal of unevenness in the coverage ofbeneficiary/client information that LGUs monitor. This is particularly true for health serviceswhich range from prenatal care, to medical attendance in child birth, to post natal care, toimmunization, to micronutrient supplementation, and the like which are at times delivered to thesame individual at the same time. Because of these difficulties, this study opted not to useefficiency measures of LGU service delivery.
Beneficiaries Satisfaction Rate. Undoubtedly, measuring the extent of beneficiaries=satisfaction with specified social services provided by LGUs is one of the more accurate ways toassess the effectiveness of LGU performance in service delivery. The present study pilot testedthis approach using a questionnaire developed for the purpose (Appendix 1). Specifically,residents (household heads) were asked about their awareness of, utilization of and satisfactionwith hospital services provided by the provincial government; disaster management and socialwelfare services given to street children and abused/battered women provided by the provincialgovernment; health services provided by the rural health units and barangay health stations ofcity/municipal governments; and services of daycare centers operated by city/municipalgovernments. Residents were also asked about their satisfaction/dis-satisfaction with overall LGUmanagement. It should be pointed out that the cost of gathering data using attitudinal/perceptionsurveys is considerably higher compared with other approaches which make use of administrativedata.
27
Service Adequacy. Alternatively, Strategic Objective II may be measured by evaluatingthe effectiveness of basic social services delivered. As such, it may be broken down into tworesult packages. One, effectiveness in service delivery may be measured in terms of the adequacyof services provided. Two, LGU performance in service delivery may also be gauged by thepresence of systems which allow LGUs to access increased resources through stronger linkageswith national government agencies.
On the one hand, service adequacy may be measured by the extent to which LGUs havebeen able to comply with standards/benchmarks in the programming of service delivery inputs forsocial services. In general, such standards may be set in terms of the ratio of the number of targetclientele (or LGU population) to the number of government personnel. In particular, this studycompared the actual population-to-doctor ratio with the national benchmark of 20,000 populationper government physician; the actual population-to-nurse ratio with the national benchmark of20,000 per government nurse; the actual population-to-midwife ratio with the national benchmarkof 5,000 population per government midwife; and the actual number of children aged 3-5 per daycare worker with national standard of 150 children per government day care worker.
Strong linkages with national government agencies, on the other hand, can help reducefiscal imbalances and, in the process, can release more resources for increased local effort in socialdevelopment. National-local coordination is also needed to avoid piecemeal approaches andminimize regional and local differences in the quality of services (e.g., education, health). Sincemany social services are public goods (the benefits of which are largely non-excludable), localgovernments hardly have any incentive to increase their social budgets.
Matching grants and cost-sharing schemes between various levels of government are,thus, crucial in influencing local priorities in sectors of high national but low local priority (e.g.,public health, environment). Sound intergovernmental mechanisms, if in place, can help enhancethe availability and accessibility of social services at the LGU level.
In practice, a strong vertical linkage with national government agencies may be indicatedby the presence of agreements for central-local cooperation in service delivery.9 Theseagreements are mostly in the form of cost-sharing schemes that address the following weaknesses: limited LGU tax base, inappropriate expenditure and tax assignments, the collapse of commonstandards (e.g., in health), inefficiencies arising from interjurisdictional spillovers, economicinstability, and regional variations in net fiscal benefits.
International donors are implicitly included in this index. Note that the centralgovernment always has to step in as guarantor and project manager of donor-fundedundertakings, even if the donor has specifically targeted an LGU as loan or grant beneficiary. Thisstems from the lack of sovereign character of LGUs, making them ineligible to negotiate loansdirectly with bilateral or multilateral agencies.
9 Because the measurement of this indicator is limited to a presence/absence tally (i.e., an LGU is given a score
of 1 if it has entered into any LGU-NGA arrangement and a score of 0 otherwise), it does not capture the size, diversity,quality nor the extent of progress in collaboration. For instance, Cavite's cost share in its Comprehensive Health CareAgreement with DOH has been declining and the question is whether it still merits a score of 1. Size and diversity is anothercontentious problem: is a water supply project equivalent to a daycare center project? A good alternative would be an indexwherein local residents are presented with a list of programs and asked to indicate their priorities and see how the LGU-NGAcollaborative agreements are congruent with these priorities. But that is another story.

28
In sum, two alternative ways of delineating the result package/s for Strategic ObjectiveII are suggested. The first one makes use of public opinion surveys and defines StrategicObjective II in terms of the beneficiaries' net satisfaction with specified social services deliveredby LGUs (Figure 1).
In contrast, the second one makes use of administrative data and defines StrategicObjective II in terms of (1) the adequacy of services provided and (2) the presence of a strongvertical linkage with national government agencies (Figure 2).
Strategic Objective III. Accountability. Following the framework on accountabilityprovided by the World Bank 1992 and Paul (1991), this study breaks down overall accountabilityinto macro-level accountability and micro-level accountability.
Macro-level accountability. There is no such thing as an invisible hand in localgovernance. Institutional checks and balances are required to optimize the range of opportunitiesopen to local businesses, NGOs, and the LGUs themselves.
On one side of the equation is the need for restraint. LGUs must have the capacity toenforce rules and regulations that govern both market and civil society transactions. Such rules prevent the abuse of power, keep LGUs honest by reducing transactions costs, establish crediblecontrols over the LGUs= use of inputs, and hold local managers accountable for the attainmentof measurable outcomes. As such, macro-level accountability relies on formal instruments ofconstraints, which are anchored in key institutions, like accounting and auditing. Disclosurerequirements add to the transparency process.
On the other side of the equation is the need for flexibility. It may be that auditingstandards are outdated and put too much restraint on discretionary authority. Or, oversight fromnational agencies, such as the Commission on Audit (COA), may rely too much on rule-basedcompliance at the expense of the ability to be flexible. Sometimes, innovations that lead to high-quality service at less costs to citizens may come at the expense of COA violations.
While there is a need to reduce opportunities for corruption, dysfunctional rules thatimpede the wise exercise of discretionary authority may actually backfire. A continuing challengeis to set rules that allow LGUs to utilize a toolkit of innovative and flexible measures, but embedtheir decisionmaking in processes that allow for auditing and oversight from the community andfrom national agencies.
Having said this, however, it still remains that the presence of a strong external auditsystem system is critical in ensuring macro-level accountability. For purposes of this study,financial accountability is indicated by the results of the COA=s financial and compliance audit ofLGU accounts and operations.10
Initially, it was thought that the summary result of the COA audit (which indicateswhether the auditor assigned to the LGU renders a favorable, adverse qualified or no opinion as
10 The focus of the financial and compliance audit is on the validity and the propriety of transactions and fairness
of accounts presentation.
29
to the fairness of LGU accounts) may be used to reflect LGU performance relative to the externalaudit. However, a closer scrutiny of the COA audit reports for the pilot LGUs revealed that thereare inconsistencies among the auditors= over-all evaluation and their significant findings andrecommendations. Thus, what one auditor would rate as fair another auditor would just as likelygrade unfavorably.
The inconsistencies refer not only to the presence/absence of documentary evidence butalso to the magnitude of exposure to Ainappropriate transactions.@ For instance, the auditor ofHamtic, Antique rendered a favorable opinion of the financial statements of the municipality for1996 despite the absence of a year-end trial balance and physical inventory of assets whereas theauditor of Noveleta, Cavite rendered a qualified opinion on the fairness of the presentation of thefinancial statements due to the lack of physical inventory of its properties even if the said LGUsubmitted a year-end trial balance.
Similarly, the auditor of Davao Oriental rendered a qualified opinion of its financialstatements since it had disallowances amounting to P1.65 million and unliquidated cash advancesamounting to P0.9 million. On the other hand, the auditor of Antique gave an adverse opinionof its financial statements given that its unliquidated cash advances amounted to P3.4 million andthe LGU had no disallowances. Given these considerations, this study proposes to measure auditaccountability by comparing the magnitude of current year=s disallowances with LGU totalincome.
Micro-level accountability. Paul (1991) posited that micro-level accountability resultsfrom (1) the ability and willingness of the public to exert pressure on service providers to performwell (i.e., the use of Avoice@) and (2) the ability and willingness of the public to Aexit@ in favor ofalternative suppliers when dissatisfied with a public service.
Participatory mechanisms allow local governments to get wide consensus on local issuesand the necessary commitment to intervene quickly and flexibly. They also permit those outsidethe local government to restrain its actions while making the LGU more responsive to people=s needs and preferences. For local managers, the central challenge is finding ways to combinetechnical expertise with political legitimacy, which requires making decisions with deep regardfor community concerns.
Yet, even if the LGU has the people=s interest at heart, it is unlikely to understand whatthe people=s needs are in the absence of a functioning feedback mechanism. If the LGU is notequipped to listen, it will not be responsive to the diffused interests of the community, especiallythose of the minorities (urban poor, farmers, fisherfolk, indigenous cultural communities andwomen) who usually do not have a strong voice to articulate their demands.
Consultative processes offer civil society opportunities to provide inputs, and to take theburden off the LGU by involving communities in the oversight functions. True, getting feedbacktends to slow down decisionmaking, but the lack of it can be destabilizing as it decreases trust andconfidence in the local government and weakens its ability to gain broad agreements onexpenditure priorities, social development programs, and environmental management.
The extent of citizen participation in LGU affairs may be measured in two alternativeways. One way is through the use of experiential surveys whereby residents are asked about (1)
30
their participation in NGOs and barangay affairs; and (2) their perception of NGO/barangayinfluence in LGU affairs. The other way is by evaluating the extent of participation of NGO orprivate sector representatives in local special bodies through the use of administrative data. Both of these alternatives were considered in this study.
In the first instance, the indicators selected are perception measures: samples of citizenswere asked the extent to which they participated in NGOs and barangays, or the extent to whichthey (through the barangays or NGOs) are able to influence local decisionmaking (Appendix 1).
NGOs are civil society structures that interface with LGUs on a diversity of issues. Onthe other hand, barangays are the lowest-level governmental structures under the jurisdiction ofmunicipal-/city-level local governments. It is through the barangays that citizens are able to makedirect contact with their local governments. NGOs and barangays are the key links that couldensure that LGUs arrive at accountable decisions in a transparent manner.
Citizens' participation and citizens' empowerment indices are complementary indices. Participation alone does that guarantee political efficacy. A weak civil society, and a barangaysystem quite beholden to local authorities only transform participation into co-optation. To gaugewhether barangays and NGOs act as political pressure groups, the extent of their influence overLGU affairs must be taken into consideration.
Together, participation and empowerment would adequately portray the effectiveness ofcitizen oversight. These two sets of indicators provide crucial feedback to guide governmentresponse to the demand and complaints of its clients. In this sense, NGOs and barangays help tohold LGUs fully accountable to the public they serve.
In the second instance, the extent of participation of civil society institutions in LGUaffairs may be measured by comparing the actual number of NGOs represented in the various localspecial bodies (namely: the Local Development Council, the Local Health Board, the LocalSchool Board, and the Pre-qualification Bids and Awards Committee) with the number prescribedunder the Local Government Code. While this set of indicators is relatively easy to measure, itshould be emphasized that they may be misleading indicators of participation to the extent thatNGOs may have been captured by political leaders and/or government bureaucrats.
Exit mechanisms are just as important as voice mechanisms in ensuring micro-levelaccountability. Exit mechanisms are those that promote a more competitive environment inservice delivery. In this study, the presence of exit mechanisms in LGU delivery of social servicesis indicated by the presence of any one of the following innovative service delivery mechanismsat the LGU level: management contract, BOT, engagement of NGO/PO in service delivery. Defined as such, this indicator does not explicitly consider the relative significance of innovativesocial service delivery mechanisms that are in place or the quality of the service involved.
To summarize, Strategic Objective III is supported by two result packages:macroeconomic accountability and micro-level accountability. Macro-level accountability ismeasured by the relative size of COA disallowances. On the other hand, micro-levelaccountability is defined in terms of the presence of voice and exit mechanisms. The presence ofexit mechanisms is indicated by the use of any one of various market-oriented/innovativemechanisms in service delivery in the LGU. On the other hand, the presence of voice
31
mechanisms is measured by two alternative indicators. The first one makes use of public opinionsurveys and refers to (1) citizens' participation in NGOs and barangays and (2) citizens'perceptions of the empowerment of NGOs and barangays (Figure 1). The second one makes useof administrative data and refers to the participation of NGO representative in local specialbodies (Figure 2).
4.3. Quantification and Measurement
Overall, the performance indicators that chosen are broad enough to be adaptable andthus can be Aapplied@ in most local settings. The tradeoff is loss of specificity, since LGUs differmarkedly in terms of both their institutional capabilities and their structures. The indices may notbe able to reflect these differences although some of the indicators chosen have been definedrelative to specific functions that are unique to the relevant level of government. For instance,the net satisfaction rate for health services is defined with reference to hospital services in the caseof provincial governments and with reference to primary health services delivered by rural healthunits (RHUs) and barangany health stations (BHSs) in the case of city/municipal governments.
The indicators are straightforward and user-friendly (understandable to users). They alsoreadily yield to measurement. This is particularly true of the indicators presented in Figure 2. The indicators are not intensive in their requirements for information and can be easily monitored.
For the indicators presented in Figure 1 which makes use of perception surveys, the costsof data collection although much higher is still reasonable. Multistage sampling provides a wayto cut costs.
Before constructing the overall governance index as well as the composite indices for eachof the three Strategic Objectives, the indices of each of the performance indicators were firstmodified in two ways. One, all indices were defined in such a way that higher numbers representbetter governance. Two, all indices were re-scaled such that they all range from 0 to 1. For therevenue effort index, the cost recovery index, per capita social service expenditure index, andsocial service expenditure ratio, the re-scaling was achieved by dividing the actual figures by 2times the relevant national average. This implies that LGUs whose performance with respect tothese indicators are equal to the national average get a score of 0.5. To illustrate, local revenueeffort index is defined as:
where total loc revi refers to total local source revenue of LGU I;popni refers to population of LGUi;natl ave per pax loc rev refers to the national average per capita local source revenue.
)rev loc pax per ave natl* 2
popn/rev loc total 1, ( = index eff rev loc ii
i min
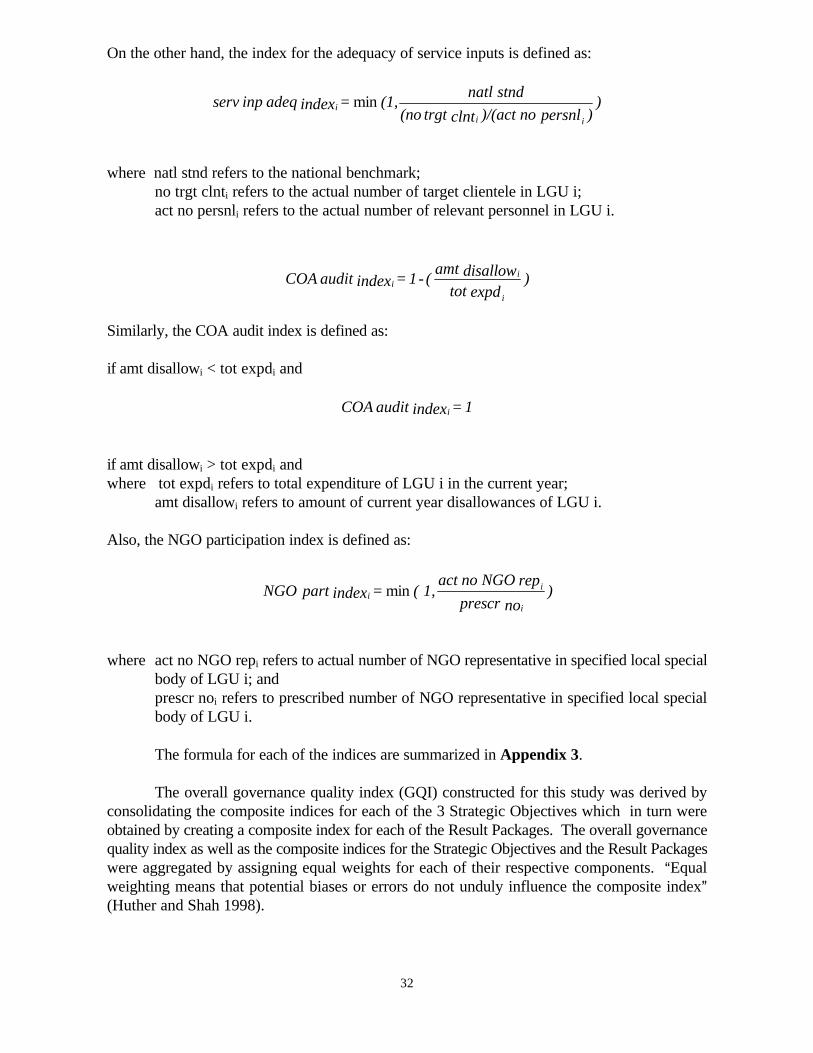
32
On the other hand, the index for the adequacy of service inputs is defined as:
where natl stnd refers to the national benchmark;no trgt clnti refers to the actual number of target clientele in LGU i;act no persnli refers to the actual number of relevant personnel in LGU i.
Similarly, the COA audit index is defined as:
if amt disallowi < tot expdi and
if amt disallowi > tot expdi andwhere tot expdi refers to total expenditure of LGU i in the current year;
amt disallowi refers to amount of current year disallowances of LGU i.
Also, the NGO participation index is defined as:
where act no NGO repi refers to actual number of NGO representative in specified local specialbody of LGU i; andprescr noi refers to prescribed number of NGO representative in specified local specialbody of LGU i.
The formula for each of the indices are summarized in Appendix 3.
The overall governance quality index (GQI) constructed for this study was derived byconsolidating the composite indices for each of the 3 Strategic Objectives which in turn wereobtained by creating a composite index for each of the Result Packages. The overall governancequality index as well as the composite indices for the Strategic Objectives and the Result Packageswere aggregated by assigning equal weights for each of their respective components. AEqualweighting means that potential biases or errors do not unduly influence the composite index@(Huther and Shah 1998).
))persnl no )/(actclnt trgt (no
stndnatl (1, = index adeq inp serv
iii min
)expd tot
disallow amt( -1 = index audit COA
i
ii
1 = index audit COA i
)no prescr
rep NGO no act 1, ( = index part NGO
i
ii min
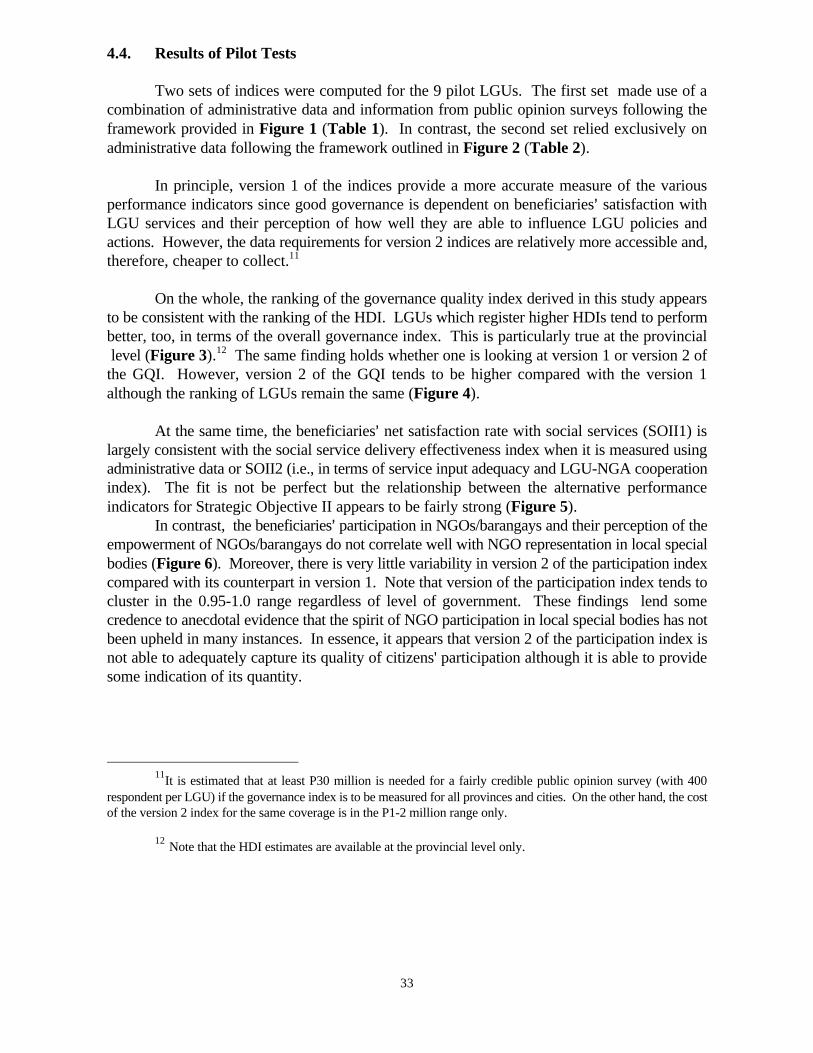
33
4.4. Results of Pilot Tests
Two sets of indices were computed for the 9 pilot LGUs. The first set made use of acombination of administrative data and information from public opinion surveys following theframework provided in Figure 1 (Table 1). In contrast, the second set relied exclusively onadministrative data following the framework outlined in Figure 2 (Table 2).
In principle, version 1 of the indices provide a more accurate measure of the variousperformance indicators since good governance is dependent on beneficiaries= satisfaction withLGU services and their perception of how well they are able to influence LGU policies andactions. However, the data requirements for version 2 indices are relatively more accessible and,therefore, cheaper to collect.11
On the whole, the ranking of the governance quality index derived in this study appearsto be consistent with the ranking of the HDI. LGUs which register higher HDIs tend to performbetter, too, in terms of the overall governance index. This is particularly true at the provincial level (Figure 3).12 The same finding holds whether one is looking at version 1 or version 2 ofthe GQI. However, version 2 of the GQI tends to be higher compared with the version 1although the ranking of LGUs remain the same (Figure 4).
11
It is estimated that at least P30 million is needed for a fairly credible public opinion survey (with 400respondent per LGU) if the governance index is to be measured for all provinces and cities. On the other hand, the costof the version 2 index for the same coverage is in the P1-2 million range only.
12 Note that the HDI estimates are available at the provincial level only.
At the same time, the beneficiaries= net satisfaction rate with social services (SOII1) islargely consistent with the social service delivery effectiveness index when it is measured usingadministrative data or SOII2 (i.e., in terms of service input adequacy and LGU-NGA cooperationindex). The fit is not be perfect but the relationship between the alternative performanceindicators for Strategic Objective II appears to be fairly strong (Figure 5).
In contrast, the beneficiaries= participation in NGOs/barangays and their perception of theempowerment of NGOs/barangays do not correlate well with NGO representation in local specialbodies (Figure 6). Moreover, there is very little variability in version 2 of the participation indexcompared with its counterpart in version 1. Note that version of the participation index tends tocluster in the 0.95-1.0 range regardless of level of government. These findings lend somecredence to anecdotal evidence that the spirit of NGO participation in local special bodies has notbeen upheld in many instances. In essence, it appears that version 2 of the participation index isnot able to adequately capture its quality of citizens' participation although it is able to providesome indication of its quantity.
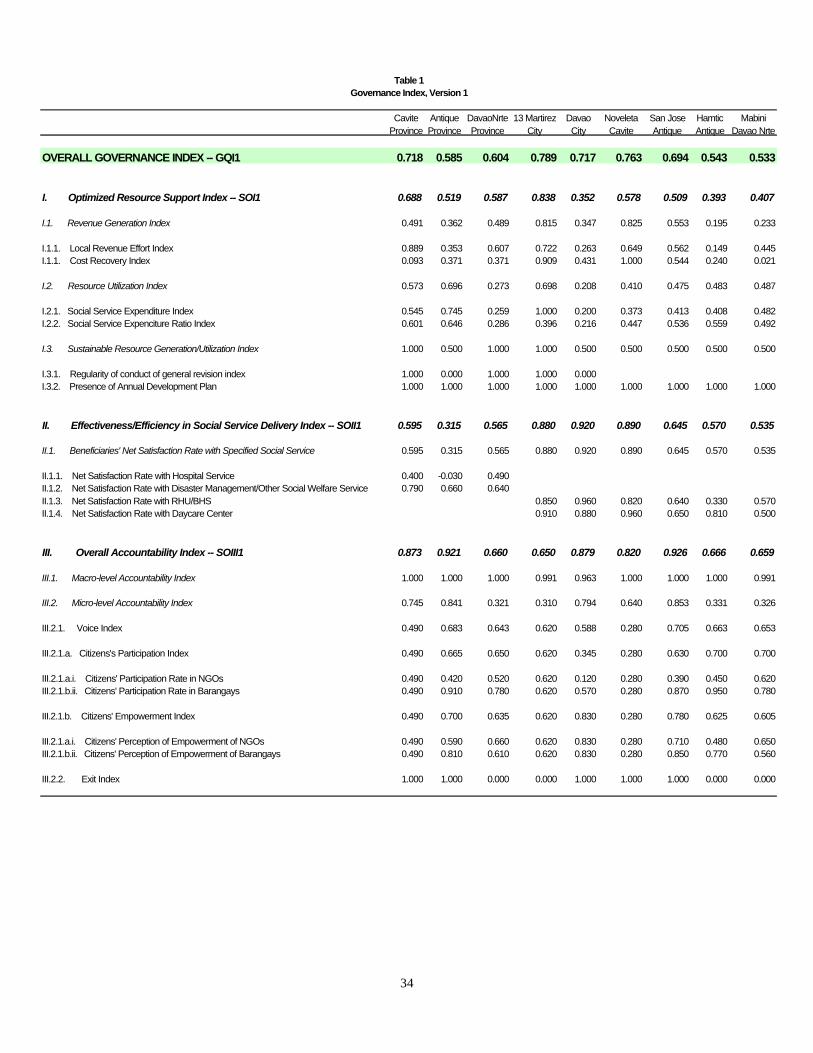
34
Cavite Antique DavaoNrte 13 Martirez Davao Noveleta San Jose Hamtic MabiniProvince Province Province City City Cavite Antique Antique Davao Nrte
OVERALL GOVERNANCE INDEX -- GQI1 0.718 0.585 0.604 0.789 0.717 0.763 0.694 0.543 0.533
I. Optimized Resource Support Index -- SOI1 0.688 0.519 0.587 0.838 0.352 0.578 0.509 0.393 0.407
I.1. Revenue Generation Index 0.491 0.362 0.489 0.815 0.347 0.825 0.553 0.195 0.233
I.1.1. Local Revenue Effort Index 0.889 0.353 0.607 0.722 0.263 0.649 0.562 0.149 0.445I.1.1. Cost Recovery Index 0.093 0.371 0.371 0.909 0.431 1.000 0.544 0.240 0.021
I.2. Resource Utilization Index 0.573 0.696 0.273 0.698 0.208 0.410 0.475 0.483 0.487
I.2.1. Social Service Expenditure Index 0.545 0.745 0.259 1.000 0.200 0.373 0.413 0.408 0.482I.2.2. Social Service Expenciture Ratio Index 0.601 0.646 0.286 0.396 0.216 0.447 0.536 0.559 0.492
I.3. Sustainable Resource Generation/Utilization Index 1.000 0.500 1.000 1.000 0.500 0.500 0.500 0.500 0.500
I.3.1. Regularity of conduct of general revision index 1.000 0.000 1.000 1.000 0.000I.3.2. Presence of Annual Development Plan 1.000 1.000 1.000 1.000 1.000 1.000 1.000 1.000 1.000
II. Effectiveness/Efficiency in Social Service Delivery Index -- SOII1 0.595 0.315 0.565 0.880 0.920 0.890 0.645 0.570 0.535
II.1. Beneficiaries' Net Satisfaction Rate with Specified Social Service 0.595 0.315 0.565 0.880 0.920 0.890 0.645 0.570 0.535
II.1.1. Net Satisfaction Rate with Hospital Service 0.400 -0.030 0.490II.1.2. Net Satisfaction Rate with Disaster Management/Other Social Welfare Service 0.790 0.660 0.640II.1.3. Net Satisfaction Rate with RHU/BHS 0.850 0.960 0.820 0.640 0.330 0.570II.1.4. Net Satisfaction Rate with Daycare Center 0.910 0.880 0.960 0.650 0.810 0.500
III. Overall Accountability Index -- SOIII1 0.873 0.921 0.660 0.650 0.879 0.820 0.926 0.666 0.659
III.1. Macro-level Accountability Index 1.000 1.000 1.000 0.991 0.963 1.000 1.000 1.000 0.991
III.2. Micro-level Accountability Index 0.745 0.841 0.321 0.310 0.794 0.640 0.853 0.331 0.326
III.2.1. Voice Index 0.490 0.683 0.643 0.620 0.588 0.280 0.705 0.663 0.653
III.2.1.a. Citizens's Participation Index 0.490 0.665 0.650 0.620 0.345 0.280 0.630 0.700 0.700
III.2.1.a.i. Citizens' Participation Rate in NGOs 0.490 0.420 0.520 0.620 0.120 0.280 0.390 0.450 0.620III.2.1.b.ii. Citizens' Participation Rate in Barangays 0.490 0.910 0.780 0.620 0.570 0.280 0.870 0.950 0.780
III.2.1.b. Citizens' Empowerment Index 0.490 0.700 0.635 0.620 0.830 0.280 0.780 0.625 0.605
III.2.1.a.i. Citizens' Perception of Empowerment of NGOs 0.490 0.590 0.660 0.620 0.830 0.280 0.710 0.480 0.650III.2.1.b.ii. Citizens' Perception of Empowerment of Barangays 0.490 0.810 0.610 0.620 0.830 0.280 0.850 0.770 0.560
III.2.2. Exit Index 1.000 1.000 0.000 0.000 1.000 1.000 1.000 0.000 0.000
Table 1Governance Index, Version 1
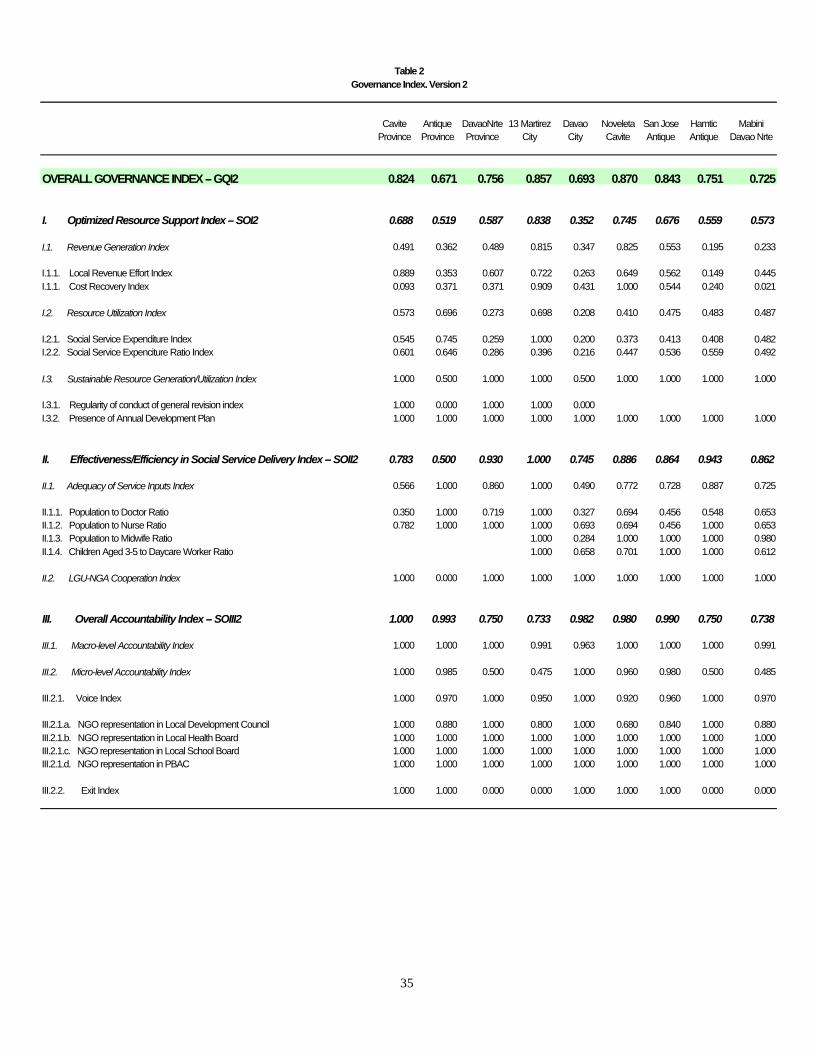
35
Cavite Antique DavaoNrte 13 Martirez Davao Noveleta San Jose Hamtic MabiniProvince Province Province City City Cavite Antique Antique Davao Nrte
OVERALL GOVERNANCE INDEX -- GQI2 0.824 0.671 0.756 0.857 0.693 0.870 0.843 0.751 0.725
I. Optimized Resource Support Index -- SOI2 0.688 0.519 0.587 0.838 0.352 0.745 0.676 0.559 0.573
I.1. Revenue Generation Index 0.491 0.362 0.489 0.815 0.347 0.825 0.553 0.195 0.233
I.1.1. Local Revenue Effort Index 0.889 0.353 0.607 0.722 0.263 0.649 0.562 0.149 0.445I.1.1. Cost Recovery Index 0.093 0.371 0.371 0.909 0.431 1.000 0.544 0.240 0.021
I.2. Resource Utilization Index 0.573 0.696 0.273 0.698 0.208 0.410 0.475 0.483 0.487
I.2.1. Social Service Expenditure Index 0.545 0.745 0.259 1.000 0.200 0.373 0.413 0.408 0.482I.2.2. Social Service Expenciture Ratio Index 0.601 0.646 0.286 0.396 0.216 0.447 0.536 0.559 0.492
I.3. Sustainable Resource Generation/Utilization Index 1.000 0.500 1.000 1.000 0.500 1.000 1.000 1.000 1.000
I.3.1. Regularity of conduct of general revision index 1.000 0.000 1.000 1.000 0.000I.3.2. Presence of Annual Development Plan 1.000 1.000 1.000 1.000 1.000 1.000 1.000 1.000 1.000
II. Effectiveness/Efficiency in Social Service Delivery Index -- SOII2 0.783 0.500 0.930 1.000 0.745 0.886 0.864 0.943 0.862
II.1. Adequacy of Service Inputs Index 0.566 1.000 0.860 1.000 0.490 0.772 0.728 0.887 0.725
II.1.1. Population to Doctor Ratio 0.350 1.000 0.719 1.000 0.327 0.694 0.456 0.548 0.653II.1.2. Population to Nurse Ratio 0.782 1.000 1.000 1.000 0.693 0.694 0.456 1.000 0.653II.1.3. Population to Midwife Ratio 1.000 0.284 1.000 1.000 1.000 0.980II.1.4. Children Aged 3-5 to Daycare Worker Ratio 1.000 0.658 0.701 1.000 1.000 0.612
II.2. LGU-NGA Cooperation Index 1.000 0.000 1.000 1.000 1.000 1.000 1.000 1.000 1.000
III. Overall Accountability Index -- SOIII2 1.000 0.993 0.750 0.733 0.982 0.980 0.990 0.750 0.738
III.1. Macro-level Accountability Index 1.000 1.000 1.000 0.991 0.963 1.000 1.000 1.000 0.991
III.2. Micro-level Accountability Index 1.000 0.985 0.500 0.475 1.000 0.960 0.980 0.500 0.485
III.2.1. Voice Index 1.000 0.970 1.000 0.950 1.000 0.920 0.960 1.000 0.970
III.2.1.a. NGO representation in Local Development Council 1.000 0.880 1.000 0.800 1.000 0.680 0.840 1.000 0.880III.2.1.b. NGO representation in Local Health Board 1.000 1.000 1.000 1.000 1.000 1.000 1.000 1.000 1.000III.2.1.c. NGO representation in Local School Board 1.000 1.000 1.000 1.000 1.000 1.000 1.000 1.000 1.000III.2.1.d. NGO representation in PBAC 1.000 1.000 1.000 1.000 1.000 1.000 1.000 1.000 1.000
III.2.2. Exit Index 1.000 1.000 0.000 0.000 1.000 1.000 1.000 0.000 0.000
Table 2Governance Index, Version 2
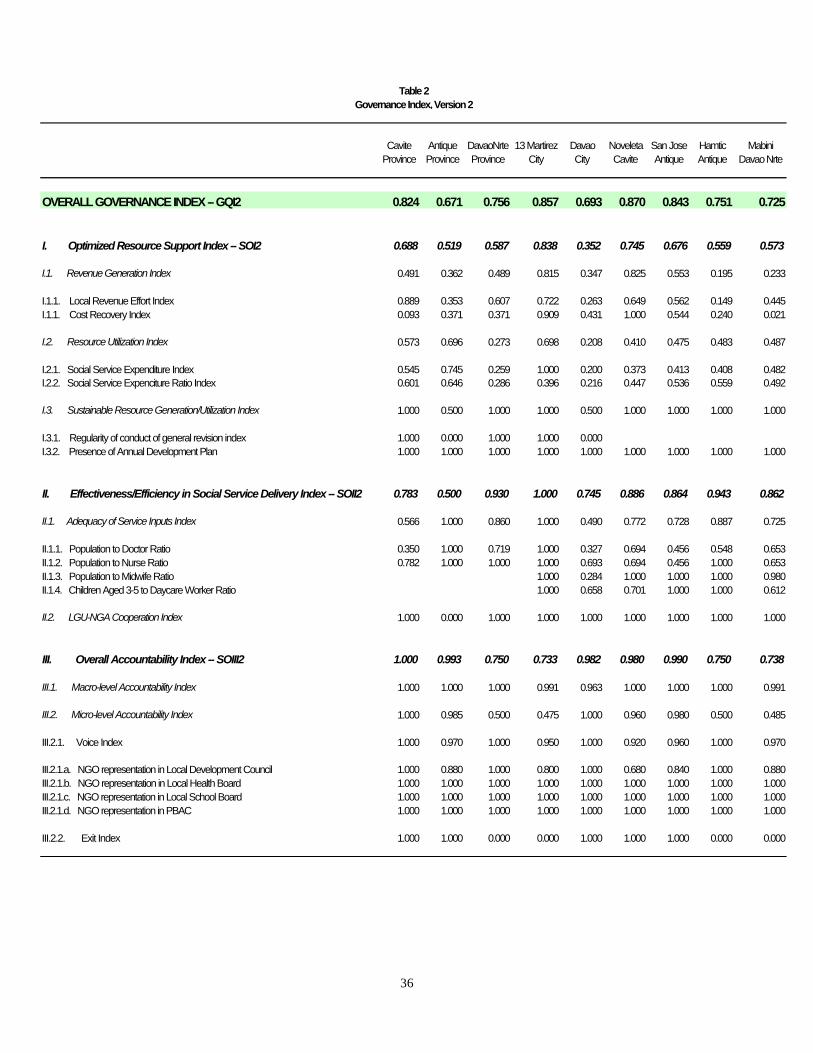
36
Cavite Antique DavaoNrte 13 Martirez Davao Noveleta San Jose Hamtic MabiniProvince Province Province City City Cavite Antique Antique Davao Nrte
OVERALL GOVERNANCE INDEX -- GQI2 0.824 0.671 0.756 0.857 0.693 0.870 0.843 0.751 0.725
I. Optimized Resource Support Index -- SOI2 0.688 0.519 0.587 0.838 0.352 0.745 0.676 0.559 0.573
I.1. Revenue Generation Index 0.491 0.362 0.489 0.815 0.347 0.825 0.553 0.195 0.233
I.1.1. Local Revenue Effort Index 0.889 0.353 0.607 0.722 0.263 0.649 0.562 0.149 0.445I.1.1. Cost Recovery Index 0.093 0.371 0.371 0.909 0.431 1.000 0.544 0.240 0.021
I.2. Resource Utilization Index 0.573 0.696 0.273 0.698 0.208 0.410 0.475 0.483 0.487
I.2.1. Social Service Expenditure Index 0.545 0.745 0.259 1.000 0.200 0.373 0.413 0.408 0.482I.2.2. Social Service Expenciture Ratio Index 0.601 0.646 0.286 0.396 0.216 0.447 0.536 0.559 0.492
I.3. Sustainable Resource Generation/Utilization Index 1.000 0.500 1.000 1.000 0.500 1.000 1.000 1.000 1.000
I.3.1. Regularity of conduct of general revision index 1.000 0.000 1.000 1.000 0.000I.3.2. Presence of Annual Development Plan 1.000 1.000 1.000 1.000 1.000 1.000 1.000 1.000 1.000
II. Effectiveness/Efficiency in Social Service Delivery Index -- SOII2 0.783 0.500 0.930 1.000 0.745 0.886 0.864 0.943 0.862
II.1. Adequacy of Service Inputs Index 0.566 1.000 0.860 1.000 0.490 0.772 0.728 0.887 0.725
II.1.1. Population to Doctor Ratio 0.350 1.000 0.719 1.000 0.327 0.694 0.456 0.548 0.653II.1.2. Population to Nurse Ratio 0.782 1.000 1.000 1.000 0.693 0.694 0.456 1.000 0.653II.1.3. Population to Midwife Ratio 1.000 0.284 1.000 1.000 1.000 0.980II.1.4. Children Aged 3-5 to Daycare Worker Ratio 1.000 0.658 0.701 1.000 1.000 0.612
II.2. LGU-NGA Cooperation Index 1.000 0.000 1.000 1.000 1.000 1.000 1.000 1.000 1.000
III. Overall Accountability Index -- SOIII2 1.000 0.993 0.750 0.733 0.982 0.980 0.990 0.750 0.738
III.1. Macro-level Accountability Index 1.000 1.000 1.000 0.991 0.963 1.000 1.000 1.000 0.991
III.2. Micro-level Accountability Index 1.000 0.985 0.500 0.475 1.000 0.960 0.980 0.500 0.485
III.2.1. Voice Index 1.000 0.970 1.000 0.950 1.000 0.920 0.960 1.000 0.970
III.2.1.a. NGO representation in Local Development Council 1.000 0.880 1.000 0.800 1.000 0.680 0.840 1.000 0.880III.2.1.b. NGO representation in Local Health Board 1.000 1.000 1.000 1.000 1.000 1.000 1.000 1.000 1.000III.2.1.c. NGO representation in Local School Board 1.000 1.000 1.000 1.000 1.000 1.000 1.000 1.000 1.000III.2.1.d. NGO representation in PBAC 1.000 1.000 1.000 1.000 1.000 1.000 1.000 1.000 1.000
III.2.2. Exit Index 1.000 1.000 0.000 0.000 1.000 1.000 1.000 0.000 0.000
Table 2Governance Index, Version 2
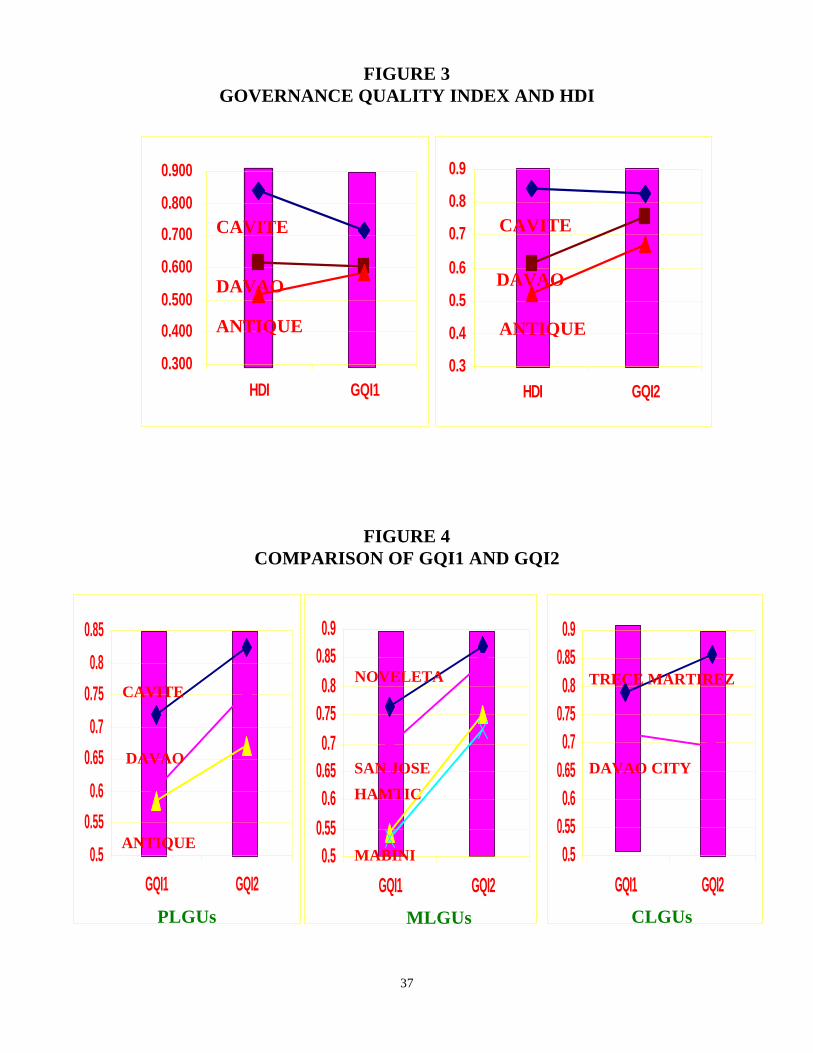
37
FIGURE 3GOVERNANCE QUALITY INDEX AND HDI
FIGURE 4COMPARISON OF GQI1 AND GQI2
0.3
0.4
0.5
0.6
0.7
0.8
0.9
HDI GQI2
0.300
0.400
0.500
0.600
0.700
0.800
0.900
HDI GQI1
ANTIQUE
DAVAO
CAVITE
ANTIQUE
DAVAO
CAVITE
0.50.550.6
0.650.7
0.750.8
0.850.9
GQI1 GQI20.5
0.550.6
0.650.7
0.750.8
0.850.9
GQI1 GQI2
0.5
0.55
0.6
0.65
0.7
0.75
0.8
0.85
GQI1 GQI2
ANTIQUE
DAVAO
CAVITENOVELETA
SAN JOSE
HAMTIC
MABINI
TRECE MARTIREZ
DAVAO CITY
PLGUs MLGUs CLGUs
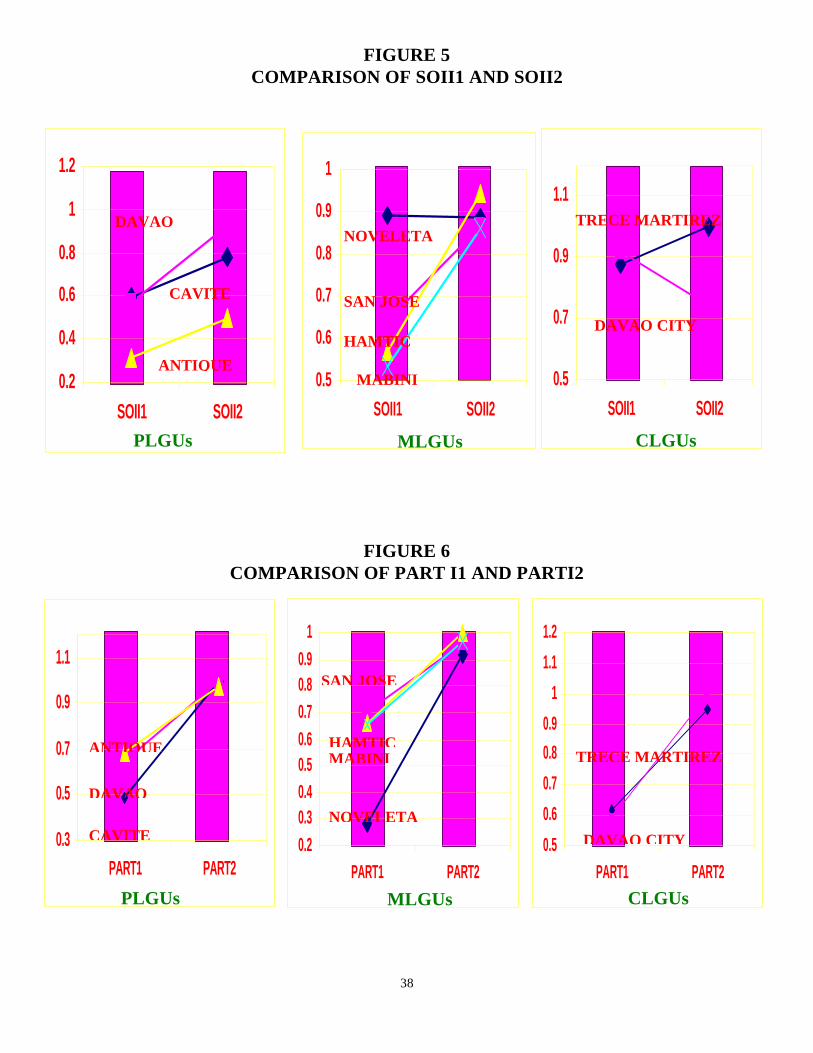
38
FIGURE 5COMPARISON OF SOII1 AND SOII2
FIGURE 6COMPARISON OF PART I1 AND PARTI2
0.5
0.7
0.9
1.1
SOII1 SOII20.5
0.6
0.7
0.8
0.9
1
SOII1 SOII20.2
0.4
0.6
0.8
1
1.2
SOII1 SOII2
ANTIQUE
DAVAO
CAVITE
NOVELETA
SAN JOSE
HAMTIC
MABINI
DAVAO CITY
TRECE MARTIREZ
PLGUs MLGUs CLGUs
0.5
0.6
0.7
0.8
0.9
1
1.1
1.2
PART1 PART20.20.30.40.50.60.70.80.9
1
PART1 PART2
0.3
0.5
0.7
0.9
1.1
PART1 PART2
ANTIQUE
DAVAO
CAVITENOVELETA
SAN JOSE
HAMTICMABINI TRECE MARTIREZ
DAVAO CITY
PLGUs MLGUs CLGUs
39
5. INSTITUTIONALIZATION ISSUES
Indicators of good governance serve as an important yardstick in evaluating theperformance of governments, in general, and LGUs, in particular, as they pursue the goals ofsustainable human development. They form part of the development framework for charting theprogress of the government's human development efforts at the local level, taking intoconsideration the limitations facing LGUs as well as the opportunities available to them.
Through these indicators, LGU performance can be reviewed and compared with oneanother in any given time period to identify both problem areas and best practice. Theperformance measures may also be compared with performance targets or standards. At the sametime, the performance of a specific LGU or group of LGUs may likewise be compared fromperiod to period to track progress and, possibly, establish trends. Implicit in this statement is theneed to have periodic measurement of progress towards the attainment of explicit objectives andgoals.
The indicators of good governance proposed in this study can be used in a variety ofways. In very broad terms, indicators of good governance may be used to clarify LGU goals andobjectives. The measurement of these indicators may focus greater attention in specifying thecritical components of good governance (Cook et al. 1993). They can be used to guide the localbudget process, to improve service delivery (either in terms of modes of delivery or in terms offunctions), to enhance accountability by easing access to information on the part of localcommunities, to "introduce the discipline of relevant benchmarking," and to improve the moraleof LGU officials and personnel.
LGU governance indicators will be helpful to LGU officials themselves to the extent thatthe indicators can be used to call attention to potential implementation problems as well as theneed for new policy directions. On the other hand, these indicators will be valuable to the nationalgovernment agencies in providing information that will enable them to better target their technicalassistance activities in terms of both content and target clientele.13 More importantly,performance indicators will be useful to civil society by providing information that may betterguide collective choice and action.
There is no doubt, therefore, that there is a need to measure the governance index on aperiodic basis. In the regional and national consultations conducted in the course of this study,there was a consensus that the governance quality index should be measured regularly, possiblyonce every three years. Being able to gauge the performance of the LGU during the term ofincumbent officials (as differentiated from previous officials) appears to be a major concern. Given this perspective, most of the participants in the consultations agreed that the best time tomeasure the governance index is at the middle of each term of LGU officials.
The next question is who should take on the task of measuring the governance qualityindex? This is a sensitive matter that hinges on several factors. First, the chosen institutionshould be credible to the various stakeholders: LGU officials, central government bureaucrats,NGOs/POs, and local constituents. In this regard, it is important to guard against the ratinginstitution introducing some systematic bias in the measurement process. Second, the designatedinstitution should have the capability to undertake the measurement of the index. In this case,local presence would be a major component of capability.
40
The likely candidate institutions include the League of Provinces/Cities, oversight nationalgovernment agencies, a confederation of NGOs, or consortium of academic institutions. TheLeague of LGUs has the advantage of being broad-based in the sense that they have localchapters. However, the Leagues, at this point in time, are not adequately staffed to engage in anexercise of this nature. Moreover, the Leagues can easily be accused, fairly or unfairly, of beingpartisan.
The Department of Interior and Local Government (DILG), the National Economic andDevelopment Authority (NEDA) or the Commission on Audit (COA) are possible institutionalhomes for the measurement of the governance quality index. However, LGUs may not takekindly to having any national government agency rate their performance since such arrangementmay be perceived as running counter to the spirit of greater local autonomy. Moreover, theseinstitutions may be seen by some of the stakeholders as either being too rules-oriented or under-staffed at the regional level to be credible in undertaking such an innovative exercise.
Local NGOs and local academic institutions appear to have the advantage of not onlybeing credible but also of having enough local presence to make the effort less costly. Betweenthese two groups, the latter has the additional advantage of possessing some of the technicalpreparation and discipline required for this activity. However, the former has the advantage ofhaving the missionary zeal and commitment that may be necessary in making the undertaking asuccess.
In the final analysis, a four-cornered collaborative agreement involving key nationalgovernment agencies, the Leagues of LGUs, NGOs, and local academic institutions may be themost appropriate institutional arrangement for the measurement of the governance quality index. Such an arrangement will allow these institutions to capitalize on each other's strengths andcompensate for each other's weaknesses.
6. SUGGESTED FUTURE REFINEMENTS
The following suggestions have been raised for consideration in future efforts to refine thegovernance quality index as it is defined in the present study.13
* Inclusion of some measure of the quality of the electoral process/participation at the locallevel in the governance quality index.
* Introduce output indicators which may be available from in the MBN indicator system(like the number of fully immunized children, number of pregnant women given tetanustoxoid vaccine, number of deliveries attended by medical personnel, number of
13
These suggestions were generated when the preliminary output of this study was presented in fourseminars/workshops attended by HDN members, representatives from key national government agencies, representatives from
the Leagues of LGUs, and members of the Regional Development Councils in Region VI and XI.
41
moderately/severely malnourished children, and number of children aged 3-5 attending daycare centers) in lieu of the service input indicators that are now part of SOII214
* Review of the specific social services that LGUs deliver on a regular basis so that theindicators be defined in terms of the same.
* Inclusion of indicators of LGU performance in the conduct of its regulatory functions aswell as in the delivery of services other than social services (like agricultural services, andinfrastructure services).
* Give more weight to SOII in the computation of the overall governance quality index.
14
If, indeed, these indicators are uniformly measurable across all LGUs, then these will yield a significantimprovement in the measurement of the governance quality index. The problem with most MBN indicators stem from thefact that they are measured with reference to a subset of barangays in the municipality (as opposed to all barangays) raisingdoubts as to their representativeness.
* Revisit the primary reason for the measurement of the governance quality index. It wasnoted that the governance quality index may take different forms depending on the end-use that it is meant to address. For instance, if the index is intended principally for HDNadvocacy then the indicators should focus on the delivery of priority human developmentconcerns. In contrast, if it is meant as part of the development administration toolkit thenit should encompass all LGU functions including local financial administration, localdevelopment planning, organization and management, local legislation, local servicedelivery and regulatory functions.
42
REFERENCES
Capuno, J. and O. Solon. AThe Impact of Devolution on Local Health Expenditures: Anecdotesand Preliminary Estimates from the Philippines,@ Paper submitted to the Health PolicyDevelopment Program, 1996.
Cook, Thomas, Jerry VanSant, Leslie Stewart, and Jamie Adrian. "Performance Measurements:Lessons Learned," Research Triangle Institute - Center for International DevelopmentStaff Working Paper, October 1993.
Gaffud, Romualdo. "A Concept Paper for the Formulation of Performance Indicators to Monitorand Evaluate the Pursuit of Sustained Local Autonomy." Prepared for the NEDA-DAPProject on the Formulation of Performance Indicators and Standards for DevelopmentAdministration, 1997.
Hatry, Harry P., et al. "Measuring Local Government Efficiency: A Preliminary Examination."How Effective Are Your Community Services: Procedures for Measuring their Quality.The Urban Institute, 1992.
Human Development Network/UNDP. Philippine Human Development Report 1997. Manila:UNDP, 1997.
Huther, Jeff and Answar Shah. AApplying a Simple Measure of Good Governance to the Debateon Fiscal Decentralization.@ Policy Research Working Paper 1894. Washington, D.C.:World Bank, 1998.
Jurado, Elsa P. "Indicators of Political Opportunity and Political Welfare." Measuring PhilippineDevelopment: Report of the Social Indicators Project. Development Academy of thePhilippines, 1976.
Landell-Mills, Pierre and Ismail Serageldin. AGovernance and the External Factor.@ InProceedings of the World Bank Annual Conference on Development Economics 1991. Washington, D.C.: World Bank, 1992.
Mangahas, Mahar (ed.). "The Measurement of Philippine National Welfare." MeasuringPhilippine Development: Report of the Social Indicators Project. Development Academyof the Philippines, 1976.
Oates, Wallace. Fiscal Federalism. New York: Harcourt Brace Jovanovich, 1972.
Osborne, David and Ted Gaebler. Reinventing Government. How the Entrepreneurial Spirit isTransforming the Public Sector. New York: Addison-Wesley Publishing Co., Inc., 1992.
Oslon, Mancur. "The Principles of Fiscal Equivalence: The Division of Responsibility AmongDifferent Level of Government." American Economic Review 59(2):479-487, 1969.

46
Paderanga, Cayetano, Jr. "Building Bureaucratic Capability." Paper prepared for the Workshopon Building Capacity for Sound Development Management--Public Sector at the AsianDevelopment Bank, January 16. 1996.
Paqueo, Vicente. "Social Indicators for Health and Nutrition." Measuring PhilippineDevelopment: Report of the Social Indicators Project. Development Academy of thePhilippines, 1976.
Paul, Samuel. AStrengthening of Public Service Accountability: A Conceptual Framework.@ World Bank Discussion Paper 136. Washington, D.C.:, World Bank, 1991.
Reyes, Celia M. and Isabelita Z. Alba. "Assessment of Community-Based Systems MonitoringHousehold Welfare." Presented at the First Technical Workshop of the Micro Impacts ofMacroeconomic Adjustment Policies (MIMAP) Project Phase III in Ternate, Cavite bythe Philippine Institute for Development Studies, February 17-18, 1994.
Root, Hilton L. Managing Development through Institution Building. Economics andDevelopment Resource Center, Asian Development Bank. Occasional Papers No. 12,October 1995.
Shah, Anwar. The Reform of Intergovernmental Fiscal Relations in Developing and EmergingMarket Economies. The World Bank. Policy and Research Series No. 23, 1994.
United Nations Development Programme. Human Development Report. New York, OxfordUniversity Press, 1996.
World Bank. Governance and Development. The World Bank: Washington, D.C., 1992.
FN: revisedgoodtxt.doc02-18-99/rgm

47
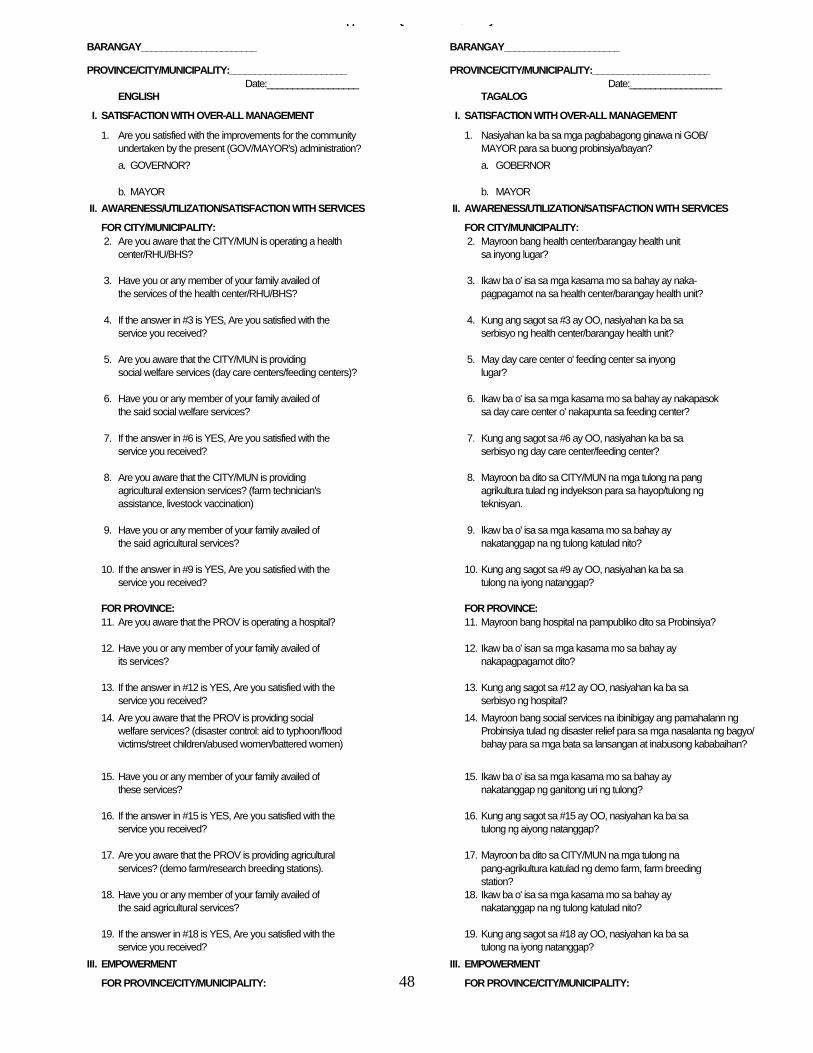
48
Appendix 1. Questtionnaire/Survey Instruments
BARANGAY_______________________ BARANGAY_______________________
PROVINCE/CITY/MUNICIPALITY:_______________________ PROVINCE/CITY/MUNICIPALITY:_______________________ Date:__________________ Date:__________________ENGLISH TAGALOG
I. SATISFACTION WITH OVER-ALL MANAGEMENT I. SATISFACTION WITH OVER-ALL MANAGEMENT
1. Are you satisfied with the improvements for the community 1. Nasiyahan ka ba sa mga pagbabagong ginawa ni GOB/undertaken by the present (GOV/MAYOR's) administration? MAYOR para sa buong probinsiya/bayan?
a. GOVERNOR? a. GOBERNOR
b. MAYOR b. MAYOR
II. AWARENESS/UTILIZATION/SATISFACTION WITH SERVICES II. AWARENESS/UTILIZATION/SATISFACTION WITH SERVICES
FOR CITY/MUNICIPALITY: FOR CITY/MUNICIPALITY: 2. Are you aware that the CITY/MUN is operating a health 2. Mayroon bang health center/barangay health unit
center/RHU/BHS? sa inyong lugar?
3. Have you or any member of your family availed of 3. Ikaw ba o' isa sa mga kasama mo sa bahay ay naka-the services of the health center/RHU/BHS? pagpagamot na sa health center/barangay health unit?
4. If the answer in #3 is YES, Are you satisfied with the 4. Kung ang sagot sa #3 ay OO, nasiyahan ka ba saservice you received? serbisyo ng health center/barangay health unit?
5. Are you aware that the CITY/MUN is providing 5. May day care center o' feeding center sa inyongsocial welfare services (day care centers/feeding centers)? lugar?
6. Have you or any member of your family availed of 6. Ikaw ba o' isa sa mga kasama mo sa bahay ay nakapasokthe said social welfare services? sa day care center o' nakapunta sa feeding center?
7. If the answer in #6 is YES, Are you satisfied with the 7. Kung ang sagot sa #6 ay OO, nasiyahan ka ba saservice you received? serbisyo ng day care center/feeding center?
8. Are you aware that the CITY/MUN is providing 8. Mayroon ba dito sa CITY/MUN na mga tulong na pangagricultural extension services? (farm technician's agrikultura tulad ng indyekson para sa hayop/tulong ngassistance, livestock vaccination) teknisyan.
9. Have you or any member of your family availed of 9. Ikaw ba o' isa sa mga kasama mo sa bahay aythe said agricultural services? nakatanggap na ng tulong katulad nito?
10. If the answer in #9 is YES, Are you satisfied with the 10. Kung ang sagot sa #9 ay OO, nasiyahan ka ba saservice you received? tulong na iyong natanggap?
FOR PROVINCE: FOR PROVINCE:11. Are you aware that the PROV is operating a hospital? 11. Mayroon bang hospital na pampubliko dito sa Probinsiya?
12. Have you or any member of your family availed of 12. Ikaw ba o' isan sa mga kasama mo sa bahay ayits services? nakapagpagamot dito?
13. If the answer in #12 is YES, Are you satisfied with the 13. Kung ang sagot sa #12 ay OO, nasiyahan ka ba saservice you received? serbisyo ng hospital?
14. Are you aware that the PROV is providing social 14. Mayroon bang social services na ibinibigay ang pamahalann ngwelfare services? (disaster control: aid to typhoon/flood Probinsiya tulad ng disaster relief para sa mga nasalanta ng bagyo/victims/street children/abused women/battered women) bahay para sa mga bata sa lansangan at inabusong kababaihan?
15. Have you or any member of your family availed of 15. Ikaw ba o' isa sa mga kasama mo sa bahay aythese services? nakatanggap ng ganitong uri ng tulong?
16. If the answer in #15 is YES, Are you satisfied with the 16. Kung ang sagot sa #15 ay OO, nasiyahan ka ba saservice you received? tulong ng aiyong natanggap?
17. Are you aware that the PROV is providing agricultural 17. Mayroon ba dito sa CITY/MUN na mga tulong naservices? (demo farm/research breeding stations). pang-agrikultura katulad ng demo farm, farm breeding
station?18. Have you or any member of your family availed of 18. Ikaw ba o' isa sa mga kasama mo sa bahay ay
the said agricultural services? nakatanggap na ng tulong katulad nito?
19. If the answer in #18 is YES, Are you satisfied with the 19. Kung ang sagot sa #18 ay OO, nasiyahan ka ba saservice you received? tulong na iyong natanggap?
III. EMPOWERMENT III. EMPOWERMENT
FOR PROVINCE/CITY/MUNICIPALITY: FOR PROVINCE/CITY/MUNICIPALITY:

49

50
PROVINCE/CITY/MUNICIPALITY:_______________________ PROVINCE/CITY/MUNICIPALITY:_______________________ Date:__________________ Date:__________________ILONGO DAVAO
I. SATISFACTION WITH OVER-ALL MANAGEMENT I. SATISFACTION WITH OVER-ALL MANAGEMENT
1. Nakontento ka man sa mga pagbag-o nga gihimo ni Gob/Mayor 1. Nalipay ka ba sa mga bag-ong gihimo ni Gobernor/Mayor parapara sa bug-os nga probinsiya/banwa? sa tibuok probinsiyal lungsod?
a. GOBERNOR a. GOBERNOR
b. MAYOR b. MAYOR
II. AWARENESS/UTILIZATION/SATISFACTION WITH SERVICES II. AWARENESS/UTILIZATION/SATISFACTION WITH SERVICES
FOR CITY/MUNICIPALITY: FOR CITY/MUNICIPALITY: 2. May-aral bala kamo nga health center/barangay health unit 2. Nakahibalo ba mo nga naay health center/barangay health unit
sa inyo nga lugar? sa inyong lugar?
3. Ikaw bala o isa sa mga upod mo sa panimalay nakaagi ng 3. Ikaw ba o usa sa imong mga kapamilya o kauban sa balaypabulong sa amo nga health center/barangay health unit? nakapatambal na sa health center/barangay health unit?
4. Kon ang sabat sa #3 ay HU-O, nalipay o nakuntento ka man 4. Kung ang tubag OO, nakontento o nalipay ba mo sa ilangbala sa ila serbisyo? serbisyo?
5. May day care center balao feeding center sa inyong nga lugar? 5. Nakahibalo ba mo nga naay day care center of feeding centersa inyong lugar?
6. Ikaw bala o isa sa mga upod mo sa panimalay nakasulod 6. Ikaw ba o usa sa imong mga kapamilya o kauban sa balayna sa day care center o nakakadto sa feeding center? nakapahimulos sa maong serbisyo?
7. Kon ang sabat sa #6 ay HU-O, nalipya o nakuntento ka man 7. Kung ang tuba OO, nakontento o nalipay ba mo sa ilangbala sa serbisyo sang inyo day care center/feeding? serbisyo?
8. May ara bala din sa inyo siyudad/banwa sang bulig pang- 8. Nakahibalo ba mo nga ang inyong lungsod o munisipyoagrikultura tulad sang indyeksiyon para sa mga hayop/ nagahatag ng tabang sa pang-uma o agricultural extensionbulig sang teknisyan? services sama sa farm technician's assistance ng injection para
sa mga hayop? 9. Ikaw bala o isa sa mga upod mo sa panimalay nakabaton 9. Ikaw ba o usa sa imong mga kapamilya o kauban sa balay
na sang sini nga bulig? nakapahimulos sa maong tabang pang-uma?
10. Kon ang sabat sa #9 ay HU-O, nalipay o nakuntento ka man 10. Kung ang tubag OO, nalipya o nakuntento ba mo sa ilangbala sa bulig nga mo nabaton? serbisyo?
FOR PROVINCE: FOR PROVINCE:11. May-ara bala nga hospital pampubliko diri sa probinsya? 11. Nakahibalo ba mo nga naay hospital sa inyong probinsiya?
12. Ikaw bala o isa sa mga upod mo sa panimalay nakaagi na 12. Ikaw ba o usa sa imong mga kapmilya o kauban sa balaypabulong didto? nakapagtamabal na maong hospital?
13. Kon ang sabat sa #12 ay HU-O, nalipay o nakuntento ka man 13. Kung ang tubag OO, nakontento o nalipay ba mo sa ilangbala sa ila serbisyo? serbisyo?
14. May ara bala social services nga ginhatag ang gobyerno sang 14. Nakahibalo ba mo nga ang inyong probinsiya na gahatag ngProbinsya katulad sang bulig para sa mga nahalitan sang bagyo/ social welfare services sama sa tabang para sa mga biktima ngbalay para sa mga palabuy-laboy ukon wala sang maistaran bagyo o baha, sa mga batang kalsad, mga naabusong babae, etc.?nga kabataan ukon para sa mga inabuso nga kababaihan?
15. Ikaw bala o isa sa mga upod mo sa panimalay nakabaton na sa 15. Ikaw ba o isa sa imong mga kapamilya o kauban sa balayamo nga klase sang balig? nakapahimulas na sa maong mga serbisyo?
16. Kon ang sabat #15 ay HU-O, nalipay on nakuntento ka man bala 16. Kung ang tubag OO, nakontento ba mo sa ilang serbisyo?sa bulig nga imo nabaton?
17. May-ara bala diri sa inyo siyudad/banwa sang mga bulig 17. Nakahibalo ba mo nga ang inyong probinsya nagahatag ngpang-agrikulta katulad sang demo farm, farm breeding station? agricultural services o tabang pang-uma sama sa pag-demo
sa umahan o research breeding stations?18. Ikaw bala o isa sa mga upod mo sa panimalay, nakabaton 18. Ikaw ba o usa sa imong mga kapamilya nakapahimulos sa
na sang amo sini nga klase sang bulig? maong agricultural services?
19. Kon ang sabat#18 ay HU-O, nalipay o nakuntento ka man 19. Kung ang tubag OO, nakontento ba mo sa ilang serbisyo?bala sa imo nabaton nga bulig?
III. EMPOWERMENT III. EMPOWERMENT
FOR PROVINCE/CITY/MUNICIPALITY: FOR PROVINCE/CITY/MUNICIPALITY:
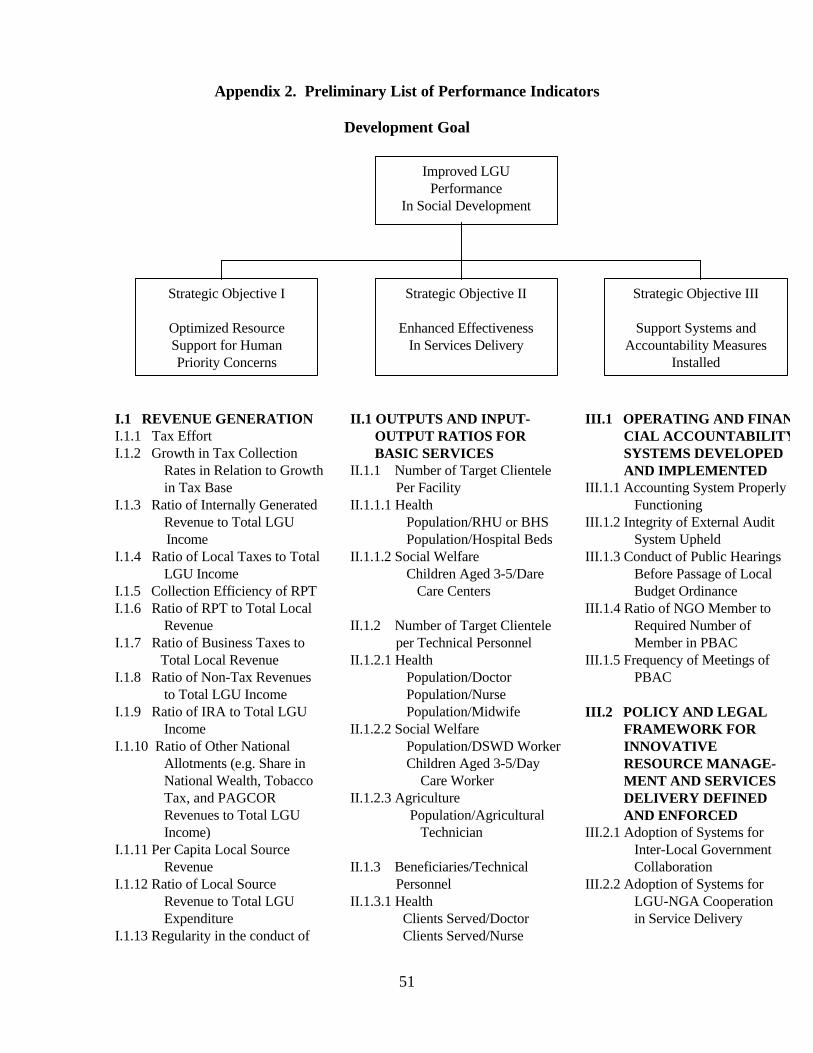
51
Appendix 2. Preliminary List of Performance Indicators
Development Goal
I.1 REVENUE GENERATIONI.1.1 Tax EffortI.1.2 Growth in Tax Collection Rates in Relation to Growth in Tax BaseI.1.3 Ratio of Internally Generated Revenue to Total LGU IncomeI.1.4 Ratio of Local Taxes to Total LGU IncomeI.1.5 Collection Efficiency of RPTI.1.6 Ratio of RPT to Total Local RevenueI.1.7 Ratio of Business Taxes to Total Local RevenueI.1.8 Ratio of Non-Tax Revenues to Total LGU IncomeI.1.9 Ratio of IRA to Total LGU IncomeI.1.10 Ratio of Other National Allotments (e.g. Share in National Wealth, Tobacco Tax, and PAGCOR Revenues to Total LGU Income)I.1.11 Per Capita Local Source RevenueI.1.12 Ratio of Local Source Revenue to Total LGU ExpenditureI.1.13 Regularity in the conduct of
II.1 OUTPUTS AND INPUT- OUTPUT RATIOS FOR BASIC SERVICESII.1.1 Number of Target Clientele Per FacilityII.1.1.1 Health Population/RHU or BHS Population/Hospital BedsII.1.1.2 Social Welfare Children Aged 3-5/Dare Care Centers
II.1.2 Number of Target Clientele per Technical PersonnelII.1.2.1 Health Population/Doctor Population/Nurse Population/MidwifeII.1.2.2 Social Welfare Population/DSWD Worker Children Aged 3-5/Day Care WorkerII.1.2.3 Agriculture Population/Agricultural Technician
II.1.3 Beneficiaries/Technical PersonnelII.1.3.1 Health Clients Served/Doctor Clients Served/Nurse
III.1 OPERATING AND FINAN- CIAL ACCOUNTABILITY SYSTEMS DEVELOPED AND IMPLEMENTEDIII.1.1 Accounting System Properly FunctioningIII.1.2 Integrity of External Audit System UpheldIII.1.3 Conduct of Public Hearings Before Passage of Local Budget OrdinanceIII.1.4 Ratio of NGO Member to Required Number of Member in PBACIII.1.5 Frequency of Meetings of PBAC
III.2 POLICY AND LEGAL FRAMEWORK FOR INNOVATIVE RESOURCE MANAGE- MENT AND SERVICES DELIVERY DEFINED AND ENFORCEDIII.2.1 Adoption of Systems for Inter-Local Government CollaborationIII.2.2 Adoption of Systems for LGU-NGA Cooperation in Service Delivery
Improved LGUPerformance
In Social Development
Strategic Objective I
Optimized ResourceSupport for HumanPriority Concerns
Strategic Objective II
Enhanced EffectivenessIn Services Delivery
Strategic Objective III
Support Systems andAccountability Measures
Installed
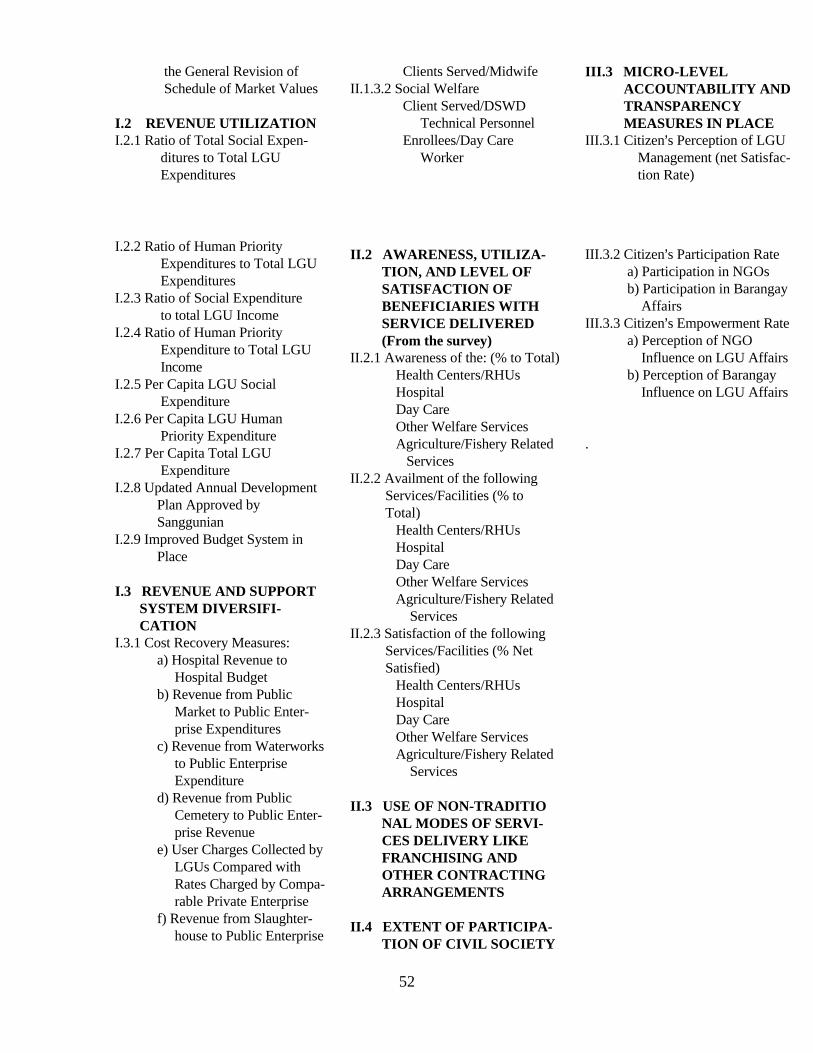
52
the General Revision of Schedule of Market Values
I.2 REVENUE UTILIZATIONI.2.1 Ratio of Total Social Expen- ditures to Total LGU Expenditures
Clients Served/MidwifeII.1.3.2 Social Welfare Client Served/DSWD Technical Personnel Enrollees/Day Care Worker
III.3 MICRO-LEVEL ACCOUNTABILITY AND TRANSPARENCY MEASURES IN PLACEIII.3.1 Citizen=s Perception of LGU Management (net Satisfac- tion Rate)
I.2.2 Ratio of Human Priority Expenditures to Total LGU ExpendituresI.2.3 Ratio of Social Expenditure to total LGU IncomeI.2.4 Ratio of Human Priority Expenditure to Total LGU IncomeI.2.5 Per Capita LGU Social ExpenditureI.2.6 Per Capita LGU Human Priority ExpenditureI.2.7 Per Capita Total LGU ExpenditureI.2.8 Updated Annual Development Plan Approved by SanggunianI.2.9 Improved Budget System in Place
I.3 REVENUE AND SUPPORT SYSTEM DIVERSIFI- CATIONI.3.1 Cost Recovery Measures: a) Hospital Revenue to Hospital Budget b) Revenue from Public Market to Public Enter- prise Expenditures c) Revenue from Waterworks to Public Enterprise Expenditure d) Revenue from Public Cemetery to Public Enter- prise Revenue e) User Charges Collected by LGUs Compared with Rates Charged by Compa- rable Private Enterprise f) Revenue from Slaughter- house to Public Enterprise
II.2 AWARENESS, UTILIZA- TION, AND LEVEL OF SATISFACTION OF BENEFICIARIES WITH SERVICE DELIVERED (From the survey)II.2.1 Awareness of the: (% to Total) Health Centers/RHUs Hospital Day Care Other Welfare Services Agriculture/Fishery Related ServicesII.2.2 Availment of the following Services/Facilities (% to Total) Health Centers/RHUs Hospital Day Care Other Welfare Services Agriculture/Fishery Related ServicesII.2.3 Satisfaction of the following Services/Facilities (% Net Satisfied) Health Centers/RHUs Hospital Day Care Other Welfare Services Agriculture/Fishery Related Services
II.3 USE OF NON-TRADITIO NAL MODES OF SERVI- CES DELIVERY LIKE FRANCHISING AND OTHER CONTRACTING ARRANGEMENTS
II.4 EXTENT OF PARTICIPA- TION OF CIVIL SOCIETY
III.3.2 Citizen=s Participation Rate a) Participation in NGOs b) Participation in Barangay AffairsIII.3.3 Citizen=s Empowerment Rate a) Perception of NGO Influence on LGU Affairs b) Perception of Barangay Influence on LGU Affairs
.

53
Expenditure g) Revenue from Public Utili- ties to Public Enterprise ExpenditureI.3.2 Community-Based Service Support System such as: a) Health Insurance b) Provident Fund c) Cooperative
INSTITUTIONS IN SERVICE DELIVERYII.4.1 Number of NGOs, POs, and Business Firms Engaged by an LGU in Service DeliveryII.4.2 Number of NGOs, POs, and Business Firms Engaged in Monitoring and Evaluation of LGU Basic Services
I.3.3 Use of Market-Oriented Mechanisms like BOT, Fran- chising, Service Contract Arrangements, Vouchers, and Bond Floatations a) BOT b) Bond Floatation c) Privatization/Management Contract d) Bank Loan e) Others
II.5 EXTENT OF PARTICIPA- TION OF CIVIL SOCIETY INSTITUTIONS IN LOCAL SPECIAL BODIESII.5.1 Proportion of NGO Member- ship to Total Composition of Local Development Councils (LDCs)II.5.2 Frequency of Meeting of Local Development CouncilII.5.3 Ratio of NGO Member to Required Number of Member in Local School Board (LSB)II.5.4 Frequency of Meetings of LSBII.5.5 Ratio of NGO Member to Required Number of Member in Local Health Board (LHB)II.5.6 Frequency of Meetings of LHB

54
Revised as 10 August 1998
Appendix 3. Formulae Used to Compute the Different Indices
1. Local Revenue Effort
where total loc revi refers to total local source revenue of LGU i;popni refers to population of LGU i;natl ave per pax loc rev refers to the national average per capita local source revenue.
2. Cost Recovery Index
where act ent revi refers to actual revenue from specified enterprise/activity in LGU i;act ent expdi refers to actual expenditure in specified enterprise/activity in LGU i;natl ave cost reco refers to national average cost recovery ratio in specified economicenterprise.
3. Per Capita Social Service Expenditure Index
where act soc serv expdi refers to actual social service expenditure of LGU i; and,natl ave soc serv expenditure refers to the national average per capital social serviceexpenditure.
4. Social Service Expenditure Ratio
where tot LGU expdi refers to total expenditure of LGU i.
)rev loc pax per ave natl* 2
popn/rev loc total 1, ( = index eff rev Loc ii
i min
)reco cost ave natl* 2expd ent /actrev ent act
1, ( = index reco Cost iii min
)servexpdnatlavesoc* 2
popn/expd socservact 1, ( = index expd servSoc ii
i min
)ratio expd serv socave natl* 2
expd LGU /totexpd serv socact 1, ( = ratio expd servSoc ii
i min
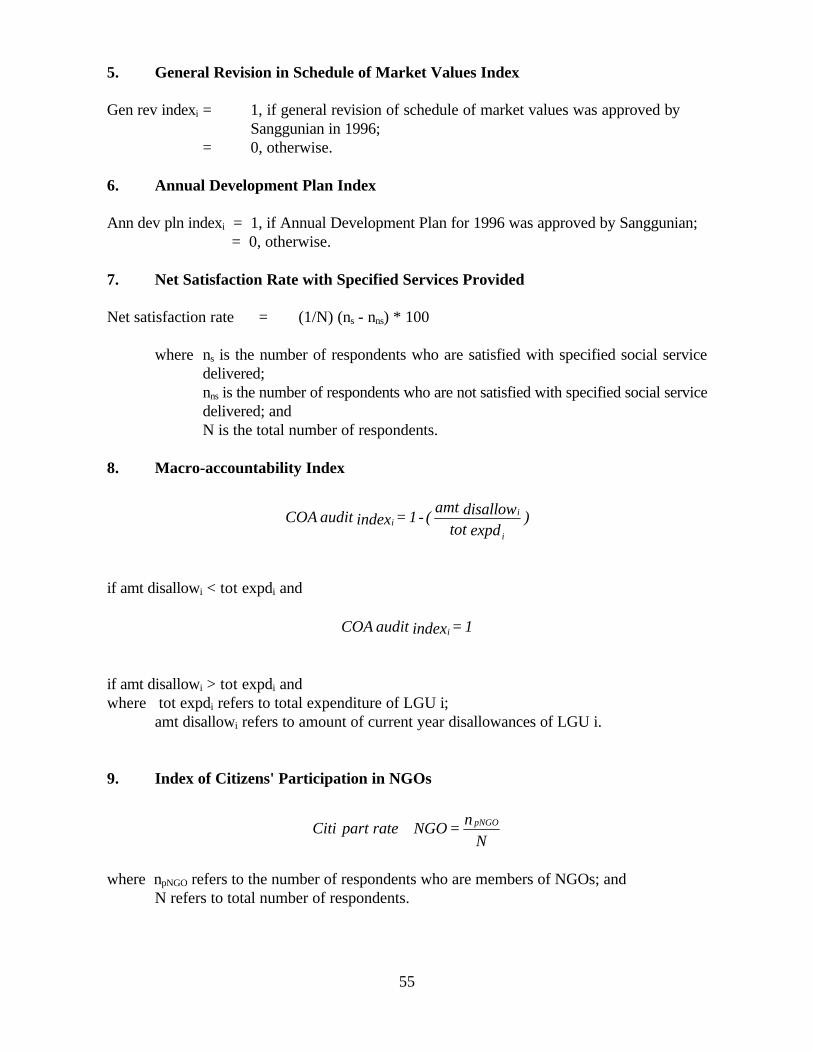
55
5. General Revision in Schedule of Market Values Index
Gen rev indexi = 1, if general revision of schedule of market values was approved by Sanggunian in 1996;
= 0, otherwise.
6. Annual Development Plan Index
Ann dev pln indexi = 1, if Annual Development Plan for 1996 was approved by Sanggunian; = 0, otherwise.
7. Net Satisfaction Rate with Specified Services Provided
Net satisfaction rate = (1/N) (ns - nns) * 100
where ns is the number of respondents who are satisfied with specified social servicedelivered;nns is the number of respondents who are not satisfied with specified social servicedelivered; andN is the total number of respondents.
8. Macro-accountability Index
if amt disallowi < tot expdi and
if amt disallowi > tot expdi andwhere tot expdi refers to total expenditure of LGU i;
amt disallowi refers to amount of current year disallowances of LGU i.
9. Index of Citizens' Participation in NGOs
Nn = NGO rate part Citi pNGO∈
where npNGO refers to the number of respondents who are members of NGOs; andN refers to total number of respondents.
)expd tot
disallow amt( -1 = index audit COA
i
ii
1 = index audit COA i
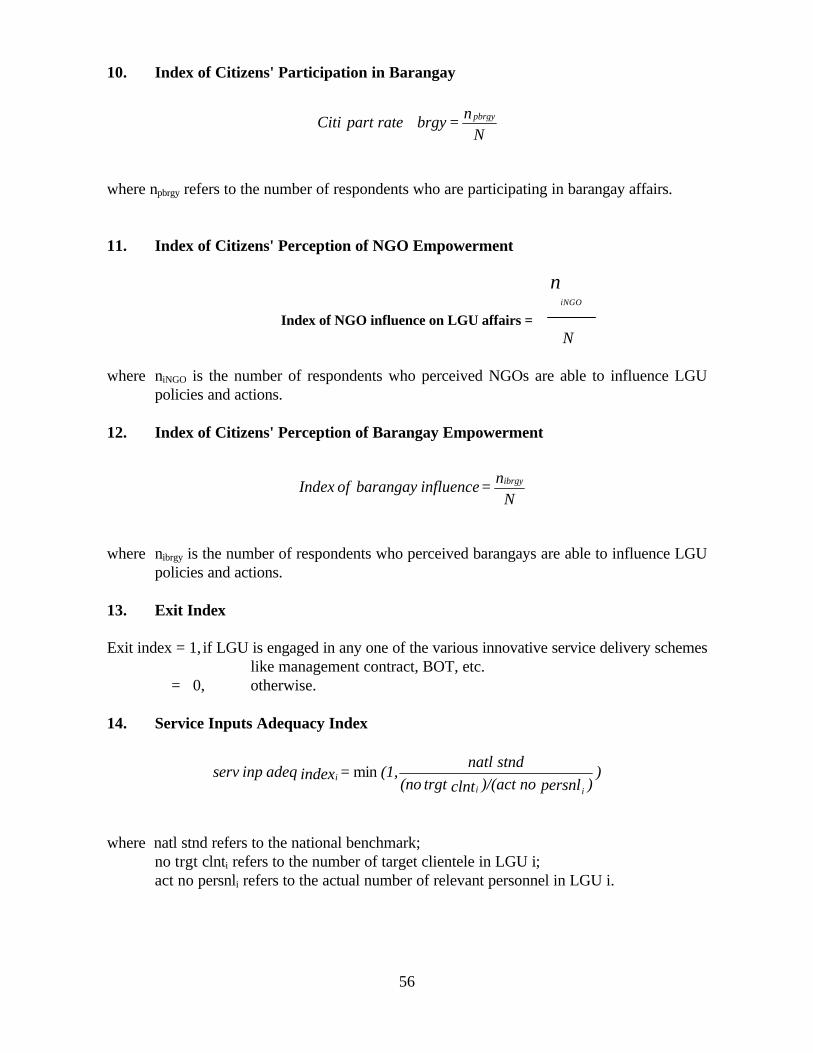
56
10. Index of Citizens' Participation in Barangay
where npbrgy refers to the number of respondents who are participating in barangay affairs.
11. Index of Citizens' Perception of NGO Empowerment
n
iNGO
Index of NGO influence on LGU affairs = N
where niNGO is the number of respondents who perceived NGOs are able to influence LGUpolicies and actions.
12. Index of Citizens' Perception of Barangay Empowerment
where nibrgy is the number of respondents who perceived barangays are able to influence LGUpolicies and actions.
13. Exit Index
Exit index = 1, if LGU is engaged in any one of the various innovative service delivery schemeslike management contract, BOT, etc.
= 0, otherwise.
14. Service Inputs Adequacy Index
where natl stnd refers to the national benchmark;no trgt clnti refers to the number of target clientele in LGU i;act no persnli refers to the actual number of relevant personnel in LGU i.
Nn =brgy rate part Citi pbrgy∈
Nn = influencebarangay of Index ibrgy
))persnl no )/(actclnt trgt (no
stndnatl (1, = index adeq inp serv
iii min
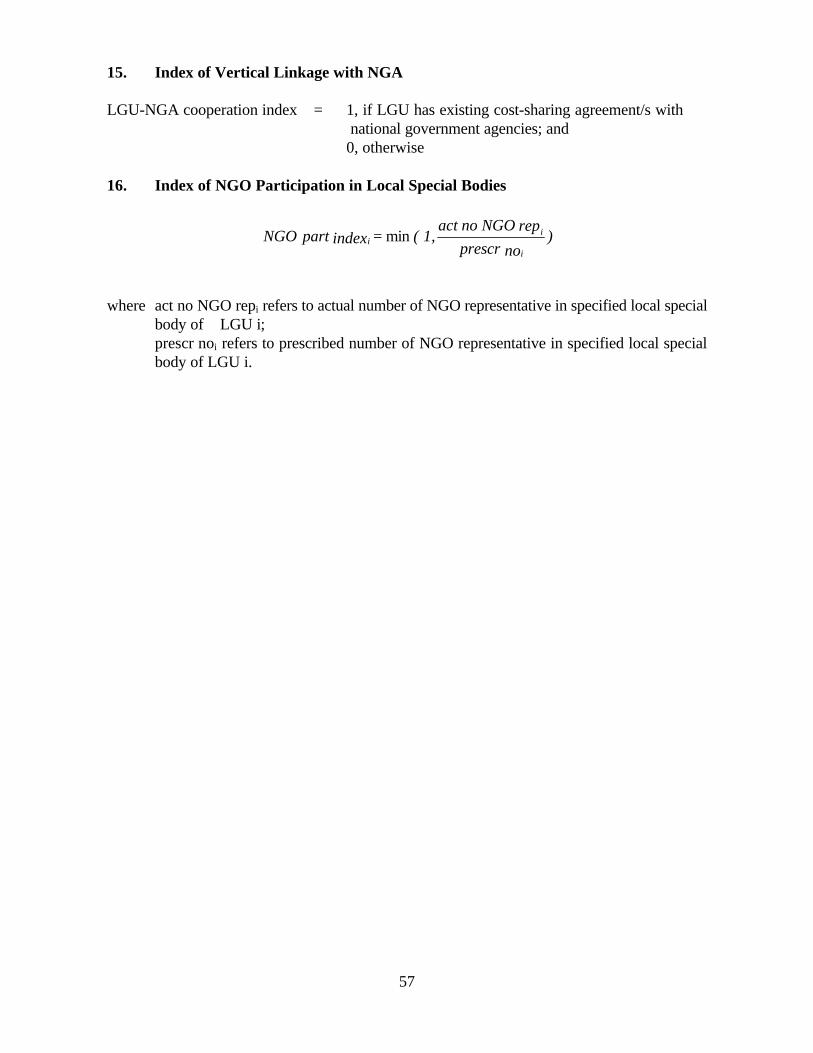
57
15. Index of Vertical Linkage with NGA
LGU-NGA cooperation index = 1, if LGU has existing cost-sharing agreement/s with national government agencies; and0, otherwise
16. Index of NGO Participation in Local Special Bodies
where act no NGO repi refers to actual number of NGO representative in specified local specialbody of LGU i;prescr noi refers to prescribed number of NGO representative in specified local specialbody of LGU i.
)no prescr
rep NGO no act 1, ( = index part NGO
i
ii min

50
Appendix 4aHIGHLIGHTS OF THE
NATIONAL WORKSHOP ON GOVERNANCE INDICATORSCarlos P Romulo Hall, NEDA sa Makati
30 October 1998
OBJECTIVES
The objectives of the national workshop were:
• To elicit comments/recommendations regarding the proposed governance indicator system;and
• To generate a consensus on the specific action points for government agencies and othersectors to institutionalize the good govemance indicator system.
PLENARY I
Clarificatory questions on the objectives and methodologies of the study were taken up in theplenary.
1. On the query as to what services were included in the survey, Dr. Manasan informed the bodythat the questionnaire contained specific questions for the services that were identified asprimary responsibilities of LGUs.
2. It was suggested that the alternative delivery system be subsumed under Strategic Objective2, to fall under enhancement of the delivery of basic services, rather than in StrategicObjective 3.
In response, Dr. Manasan explained that the study group vacillated on whether the studyshould include altemative delivery systems either under Objective 3 or Objective 2. Sheinformed the body that the main reason for including it in Objective 3 is based on the literatureon accountability where the civil society exercises "voice" and other exit mechanisms. She alsoagreed, however that one can be put over the other.
3. Regarding the proposition that the survey be made region-wide, it was noted that there isreally no concept of governance for a region as a whole, despite the presence of the RegionalDevelopment Councils (RDCS). It was also pointed out that the RDCs cannot be madeaccountable for the management of resources for a whole region.
Dr. Manasan explained that a region-wide measurement of the indicators is intended to trackthese indicators in all the provinces and cities of the region in order to get a region-wideperspective. This will enable the LGUs to compare themselves with one another.
Dr. Gonzalez assured the body that they did a review of literature to find out which featuresof govemance would suit the Philippine situation, specifically the local government. He notedthat a log-frame type of framework was used in the study. He also clarified that the hierarchyof the indicators was fashioned out of a logical sequencing of the indices.
51
4. Dir. Esguerra pointed out the need for a common concept of social services. She cited thenecessity of providing basic health services at the best quality for all.
In response, Dr. Manasan justified the inclusion of the services based on the functionsidentified in the Local Government Code. Given that mandate, the next question addressedwas the concept of effectiveness. She further explained that the analysis took off from asurvey asking people what they think the LGU priorities should be.
Dir. Esguerra noted that the HDN has determined the important services which should beused for policy advocacy.
Dr. Gonzalez clarified that it is the curative rather than preventive services that weredelegated to the provincial LGUs. The preventive services were lodged at the municipalLGUs. Therefore, their group focused at the municipal level because that is where most of theresults in preventive services can be obtained.
WORKSHOP OUTPUTS
GROUP A
Group A was tasked to:
1. Provide the operational definition of ACCEPTABILITY of the Govemance Quality Index(GQI) at the local level
2. Discuss the acceptability of the indicators; and3. Identify the advantages and disadvantages of adopting the weight system in measuring
governance
ISSUES AND POINTS RAISED
A. Definition of Acceptability of the GQI
• The acceptability of the GQI should cater to four dimensions: 1)social; 2) political; 3) financial;and 4) technical. The social dimension would refer to acceptability of the index by majority ofthe citizenry. Political acceptability on the other hand, would refer to acceptability of the indexby the powerholders or the public off,cials. The third dimension would require the system tobe acceptable to resource allocators and/or funders. Finally, technical acceptability is equatedwith acceptability to the academe. Hence, the acceptability of the GQI will hinge on allstakeholders in local governance.
B. Acceptability of the Set of Governance Indicators
• It was observed that the Governance Quality Index (GQI) can be correlated with the HumanDevelopment Index (HDI).
• Comments on the set of indicators (having integrated the four dimensions ofacceptability):
52
• Social - all indices vvere deemed to be socially acceptable• Political - with regard to Revenue Generation, it was suggested that 1.1.2 (cost recovery
effort) be deleted and instead, use the revenue to cost ratio. To elevate the purpose of thestudy, it was suggested that outcome indicators be used. Timeliness of Commission onAudit reports must also be requested.
• Technical - the present govemance indices can be correlated with other indices (e.g., HDI).It should be validated whether this set of indicators actually reflects what the study intendsto measure.
C. Use of a Weight System
• The use of principal component analysis to discover weights was suggested.• The data gathered must be used to determine appropriate cluster of variables.• It was proposed that the study develop individual sub-indices for each strategic objective.
GROUP B
Group B was tasked to:1. Validate the usefulness of the set of indicators;2. Comment on the proposed institutional arrangements; and3. Identify the means for generating financial support
ISSUES AND POINTS RAISED
A. Usefulness of the Indicators
• Some indicators may not be fair given that some functions are not yet fully devolved to LGUs.
• It may be too early to judge LGUs by these indicators. The national government is still tooinvolved in setting up priorities. Also, the priorities of the national government may notconform to the priorities of the local government.
• Timing should not be a major problem. It can serve as a challenge to LGUs to catch up. Withthese indicators, the civil society can concretely determine the local government's vveak pointsand areas for improvement. This issue can be used as well in gap analysis.
• It must be noted that LGUs have the authority and capability to mobilize resources intemally.These indicators can then monitor accountability of service delivery.
• The purpose of the indicators is manifold: 1) for performance assessment; 2)to aid gap analysiswhich can be used in decision-making; and 3) civil society advocacy as incentive for behaviorchange.
• As a monitoring tool, it is advantageous to extend the use of these indicators to monitor theperformance of the national government.
53
• These indicators can be incorporated in the determination of the Intemal Revenue Allotment.Local government performance should be added to the present criteria of land area,population, etc.
But this may not be advisable since LGU behavior could then be oriented tov~ardsinfluencing national government decision. (on the IRA)It must be clear that these indicators should promote good politics.
• The study may contribute changes/additions to the functions of LGUs. The final assessmentcan provide inputs to the ongoing amendment of the Local Government Code.
• DILG has a similar study, undertaken in cooperation with the Local Govemment Center ofthe UP CPA: The LGU Capability Classification Scheme. USAID and DILG will providecopies of their studies which are relevant to this project.
B. Proposed Institutional Arrangement
• In choosing the best institution/s where the system is to be lodged, the following criteriamust be considered: 1 )credibility, 2)sustainabilit,v, 3)technical capability, 4)10cal presence,and 5)mandate.
• If the actual implementation of the system is to be lodged at the national and/or localgovernment, a problem regarding public perception may arise. It should be noted that thesystem also aims to improve LGU behavior and performance. And for behavior to beinfluenced, the database must be credible.
• It is advisable to have as many players as possible to best reflect local reality.
• Other institutions such as the SWS, NGOs, and the academe can be contracted for qualitycontrol functions and training.
• PSSC is a possible implementing institution since it can mobilize affiliates in the academe.As a consortium of academic institutions, this can be a part of their mission area/e.
C. Financing Sustainability
• It was suggested that a multi-party type of arrangement be formed where the academe,NGOs, NG/LGs and other coordinating agencies are represented.

54
• Marketing of the system to universities and/or other institutions which may benefit fromthis set of measures of LGU performance was proposed.
• Piloting the mechanism could help achieve the above suggestions.
D. Recommendations
• Ensure consistency and comparability of indicators by having multi-sectoral consensus onweights and priorities. Furthermore, the set of indicators must undergo nationalstandardization.
• Lodge the implementation of the system with help of the academe.• Operate using multi-sourced funding for sustainability.• Pilot test for continuous advocacy to see if present arrangement will work. Pilot the new
system (factoring in all issues).• Version 1 of the study is preferred.
Plenary 11
• The workshop outputs were presented. The body adopted the recommendations of theworkshop groups as presented.
• Dir. Esguerra recommended that institutions like Land Bank which stand to benefit from anLGU Performance Indicator System can be tapped for funding.
• Following the recommendations of Group B, a project proposal for the pilot case of theIndicator system would have to be drafted.
• Ms. Ricasio suggested that the outputs of the workshop be annexed to the final revision ofthe paper.
Next Steps
• NEDA proposed to convene a meeting with potential donors (UNDP,ADB, USAID), theSustainable Human Development project personnel and other stakeholders to discuss thefeasibility of piloting the governance indicator system in selected regions.
• Dr. Cynthia Rose Banzon-Bautista committed to continuously advocate for the adoption ofthe governance indicator system within the HDN

55
Annex A
PROGRAMME
8:00 Registration8:30 The Philippine National Anthem8:35 Welcome Remarks
Dr. Cynthian Roze Banzon-BautistaVice-President, HDN
8:40 Presentation of the StudyDr. Eduardo Gonzalez
President, DAPDr. Rosario G. Manasan
Research Fellow, PIDS9:30 Coffee Break9:45 Workshop Mechanics
Ms. Marie Antoinette GuillermoMs. Maria Herminia Soriano
DAP10:00 Workshop Proper12:00 Lunch1:00 Presentation of Workshop Outputs
Group Rapporteur1:30 Open Furom
Dir. Erlinda M. CaponesNEDA-SDS
2:00 Closing RemarksDr. Cynthia Roze Banzon-Bautista
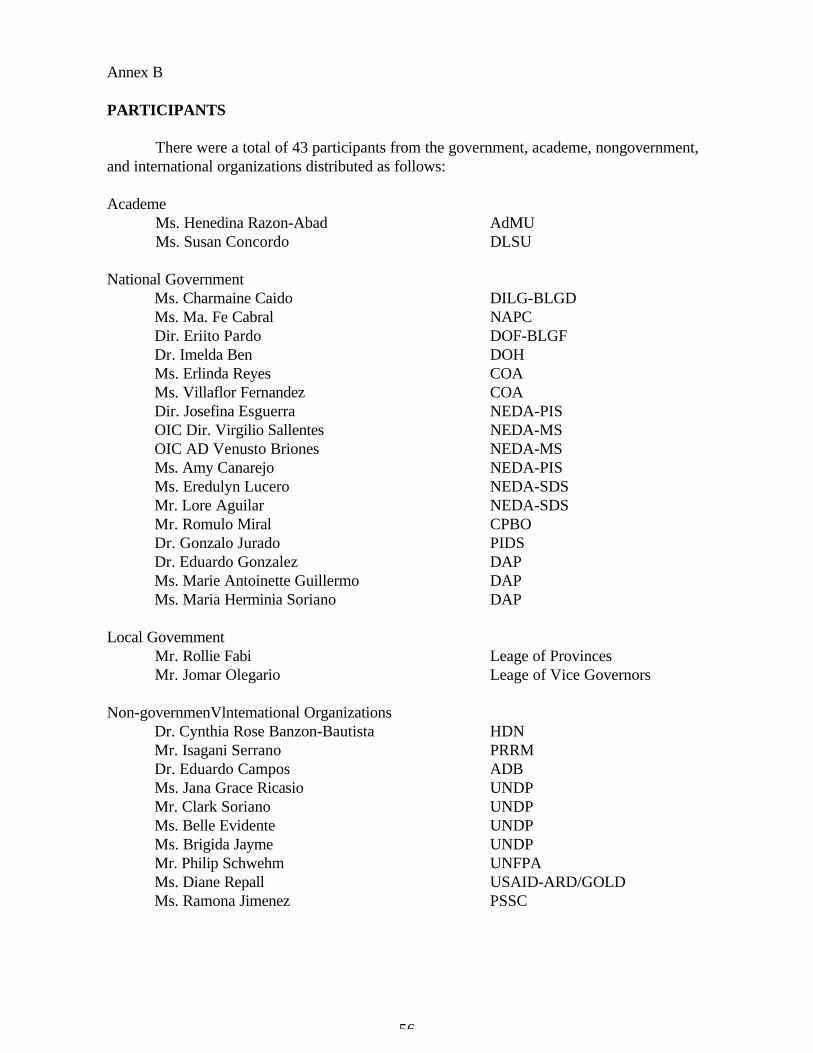
56
Annex B
PARTICIPANTS
There were a total of 43 participants from the government, academe, nongovernment,and international organizations distributed as follows:
AcademeMs. Henedina Razon-Abad AdMUMs. Susan Concordo DLSU
National GovernmentMs. Charmaine Caido DILG-BLGDMs. Ma. Fe Cabral NAPCDir. Eriito Pardo DOF-BLGFDr. Imelda Ben DOHMs. Erlinda Reyes COAMs. Villaflor Fernandez COADir. Josefina Esguerra NEDA-PISOIC Dir. Virgilio Sallentes NEDA-MSOIC AD Venusto Briones NEDA-MSMs. Amy Canarejo NEDA-PISMs. Eredulyn Lucero NEDA-SDSMr. Lore Aguilar NEDA-SDSMr. Romulo Miral CPBODr. Gonzalo Jurado PIDSDr. Eduardo Gonzalez DAPMs. Marie Antoinette Guillermo DAPMs. Maria Herminia Soriano DAP
Local GovemmentMr. Rollie Fabi Leage of ProvincesMr. Jomar Olegario Leage of Vice Governors
Non-governmenVlntemational OrganizationsDr. Cynthia Rose Banzon-Bautista HDNMr. Isagani Serrano PRRMDr. Eduardo Campos ADBMs. Jana Grace Ricasio UNDPMr. Clark Soriano UNDPMs. Belle Evidente UNDPMs. Brigida Jayme UNDPMr. Philip Schwehm UNFPAMs. Diane Repall USAID-ARD/GOLDMs. Ramona Jimenez PSSC

57
SecretariatDr. Rosario Manasan PIDSMr. Ross Quisao PIDSMs. Lucy Melendez PIDSMs. Eden Villanueva PIDSMs. Analyn Manuel PIDSDir. Erlinda M. Capones NEDA-SDSAD Felizardo Virtucio NEDA-SDSMr. Napoleon Imperial NEDA-SDSMs. Aleli Rosario NEDA-SDSMs. Susan Carandang NEDA-SDSMs. Joan Santiago NEDA-SDS
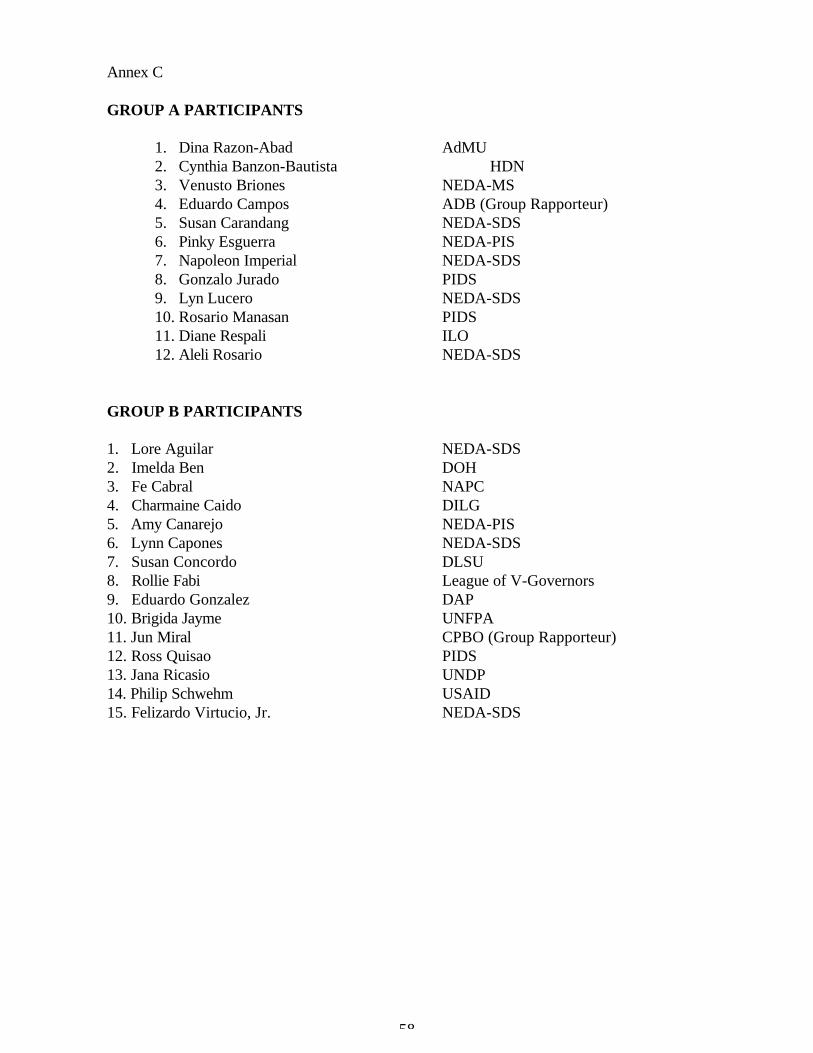
58
Annex C
GROUP A PARTICIPANTS
1. Dina Razon-Abad AdMU2. Cynthia Banzon-Bautista HDN3. Venusto Briones NEDA-MS4. Eduardo Campos ADB (Group Rapporteur)5. Susan Carandang NEDA-SDS6. Pinky Esguerra NEDA-PIS7. Napoleon Imperial NEDA-SDS8. Gonzalo Jurado PIDS9. Lyn Lucero NEDA-SDS10. Rosario Manasan PIDS11. Diane Respali ILO12. Aleli Rosario NEDA-SDS
GROUP B PARTICIPANTS
1. Lore Aguilar NEDA-SDS2. Imelda Ben DOH3. Fe Cabral NAPC4. Charmaine Caido DILG5. Amy Canarejo NEDA-PIS6. Lynn Capones NEDA-SDS7. Susan Concordo DLSU8. Rollie Fabi League of V-Governors9. Eduardo Gonzalez DAP10. Brigida Jayme UNFPA11. Jun Miral CPBO (Group Rapporteur)12. Ross Quisao PIDS13. Jana Ricasio UNDP14. Philip Schwehm USAID15. Felizardo Virtucio, Jr. NEDA-SDS
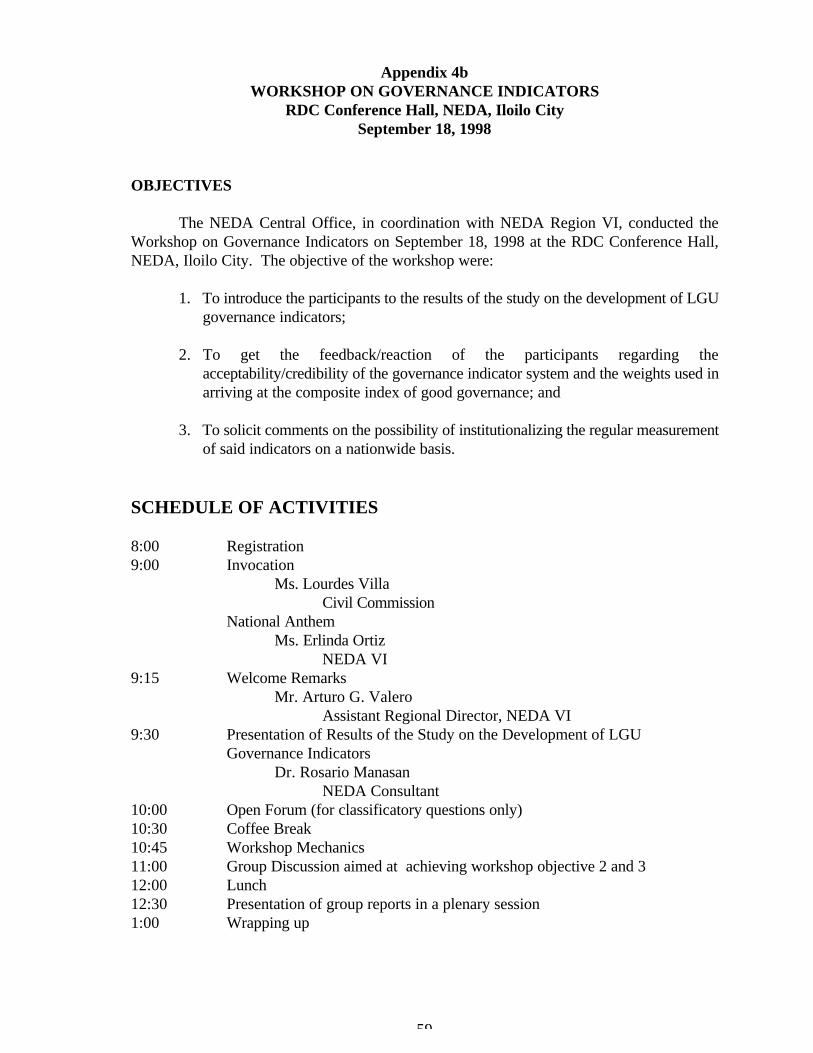
59
Appendix 4bWORKSHOP ON GOVERNANCE INDICATORS
RDC Conference Hall, NEDA, Iloilo CitySeptember 18, 1998
OBJECTIVES
The NEDA Central Office, in coordination with NEDA Region VI, conducted theWorkshop on Governance Indicators on September 18, 1998 at the RDC Conference Hall,NEDA, Iloilo City. The objective of the workshop were:
1. To introduce the participants to the results of the study on the development of LGUgovernance indicators;
2. To get the feedback/reaction of the participants regarding theacceptability/credibility of the governance indicator system and the weights used inarriving at the composite index of good governance; and
3. To solicit comments on the possibility of institutionalizing the regular measurementof said indicators on a nationwide basis.
SCHEDULE OF ACTIVITIES
8:00 Registration9:00 Invocation
Ms. Lourdes VillaCivil Commission
National AnthemMs. Erlinda Ortiz
NEDA VI9:15 Welcome Remarks
Mr. Arturo G. ValeroAssistant Regional Director, NEDA VI
9:30 Presentation of Results of the Study on the Development of LGUGovernance Indicators
Dr. Rosario ManasanNEDA Consultant
10:00 Open Forum (for classificatory questions only)10:30 Coffee Break10:45 Workshop Mechanics11:00 Group Discussion aimed at achieving workshop objective 2 and 312:00 Lunch12:30 Presentation of group reports in a plenary session1:00 Wrapping up

60
PARTICIPANTS
A total of 52 participants from the local government units, regional line agencies andnon-government organizations attended the workshop. (The list of participants is attached asAnnex A).
CLARIFICATORY QUESTIONS
1. Mr. Mario Nillos of PPDO-Iloilo asked the baseline year for Human DevelopmentIndex
Dr. Manasan informed that the baseline year for HDI was 1994 and itscomponents are: a) per capita income; b) life expectancy; and c) literacy rate.
2. Mr. Nillos also asked if poverty incidence is a part of HDI.
Dr. Manasan replied that poverty incidence is not included in HDI but in HumanDeprivation Index
3. Mr. Roque Hotilena of PPDO-Negros inquired about the estimated time frame ofthe study for a specific LGU.
Dr. Manasan informed that in the pilot testing they conducted, they stayed one week inAntique (for 2 municipalities only with respondents of only 50). She said for public opinionsurvey, 400 respondents are needed per LGU. For Version 2 or using administrative data only,4 days are needed per LGU – 2 days for gathering data and 2 days for processing the data.
4. Ms. Evelyn Trompeta of DILG informed that they have also come up with a LocalGovernment Performance Measurement wherein some of the areas mentioned in theGovernance Indicators were also covered. However, the DILG measurement weremore on specific areas of the legislative and executive aspects.
Dr. Manasan said if anybody is interested in the study, NEDA VI has a complete copy.
5. Mr. Rey Dusaran of CPU asked if some factor analysis were done to see if theindicators come together.
Dr. Manasan said no formal factor analysis was done.
6. Ms. Daisy Magbanua of CHED inquired if the socio-economic status of therespondents were considered in the multi- stage random sampling.
Dr. Manasan explained that they use the purposive approach at the provincial level. They utilize the random approach for the barangays.
61
7. Mr. Zaldy Barotil of Merciphil Foundation asked why the Academe was deleted inthe list of institutions which should take on the job of measuring and compilinggovernance indicators.
Dr. Manasan replied that this was unintentional and that the academe shouldbe in the list.
8. Mr. Barotil inquired how often must the index be measured. He asked if it wasassumed that a baseline study was already established such that a more meaningfulanalysis of the data will be done on the third year.
Dr. Manasan informed that the assumption is that when you measure at thestart of the third year, you are using the data of the incumbent in their second year. Third year is not yet available.
9. Dr. Venancio Ardales of the University of Iloilo said that since Dr. Manasan isasking the participants’ opinion if the study is political or apolitical, may he knowwhether the researchers have determined if their work is political or apolitical innature. He said there will be a lot of implications particularly for the LGUs whichwill be evaluated by the instrument.
Assistant Director Virtucio replied that it is not so much as self-assessmentbut the perception of the body. He defined apolitical as that where there is noperception of any bias or perception of leaning towards any party.
10. Dr. Ardales referred to Mr. Hofilena’s comment about manipulation of data forcertain LGUs. He remarked that if the instrument is constructed in a way that isinherently political, the data that will come out will be biased.
Dr. Manasan informed that the data were carefully validated and that theresearchers took pains that the data will not be manipulable.
WOKSHOP MECHANICS
The participants were divided into two groups, as follows:
1. Group A discussed Acceptability of the Governance Indicator System and the Index ofGovernance. The participants were asked to identify parameters for operationallydefining “acceptability of the indicators and given comments/reaction on theacceptability of the governance indicator system, and the weight used in compositeindex of good governance.
2. Group B tackled Institutionalization of the Governance Indicator System. Theparticipants were asked validate the need to periodically undertake the measurement ofthe governance indicator system and made recommendations on how to institutionalizethe governance indicator system in terms of:
• Recommendations on how to generate support for the system
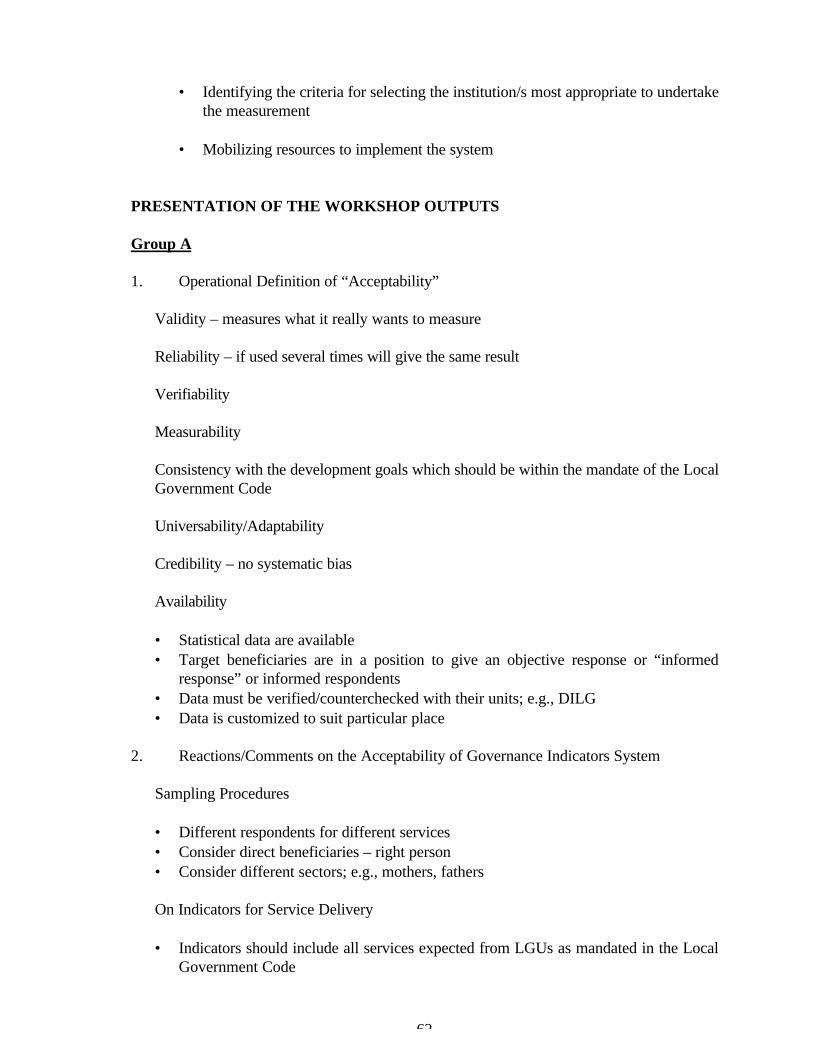
62
• Identifying the criteria for selecting the institution/s most appropriate to undertakethe measurement
• Mobilizing resources to implement the system
PRESENTATION OF THE WORKSHOP OUTPUTS
Group A
1. Operational Definition of “Acceptability”
Validity – measures what it really wants to measure
Reliability – if used several times will give the same result
Verifiability
Measurability
Consistency with the development goals which should be within the mandate of the LocalGovernment Code
Universability/Adaptability
Credibility – no systematic bias
Availability
• Statistical data are available• Target beneficiaries are in a position to give an objective response or “informed
response” or informed respondents• Data must be verified/counterchecked with their units; e.g., DILG• Data is customized to suit particular place
2. Reactions/Comments on the Acceptability of Governance Indicators System
Sampling Procedures
• Different respondents for different services• Consider direct beneficiaries – right person• Consider different sectors; e.g., mothers, fathers
On Indicators for Service Delivery
• Indicators should include all services expected from LGUs as mandated in the LocalGovernment Code
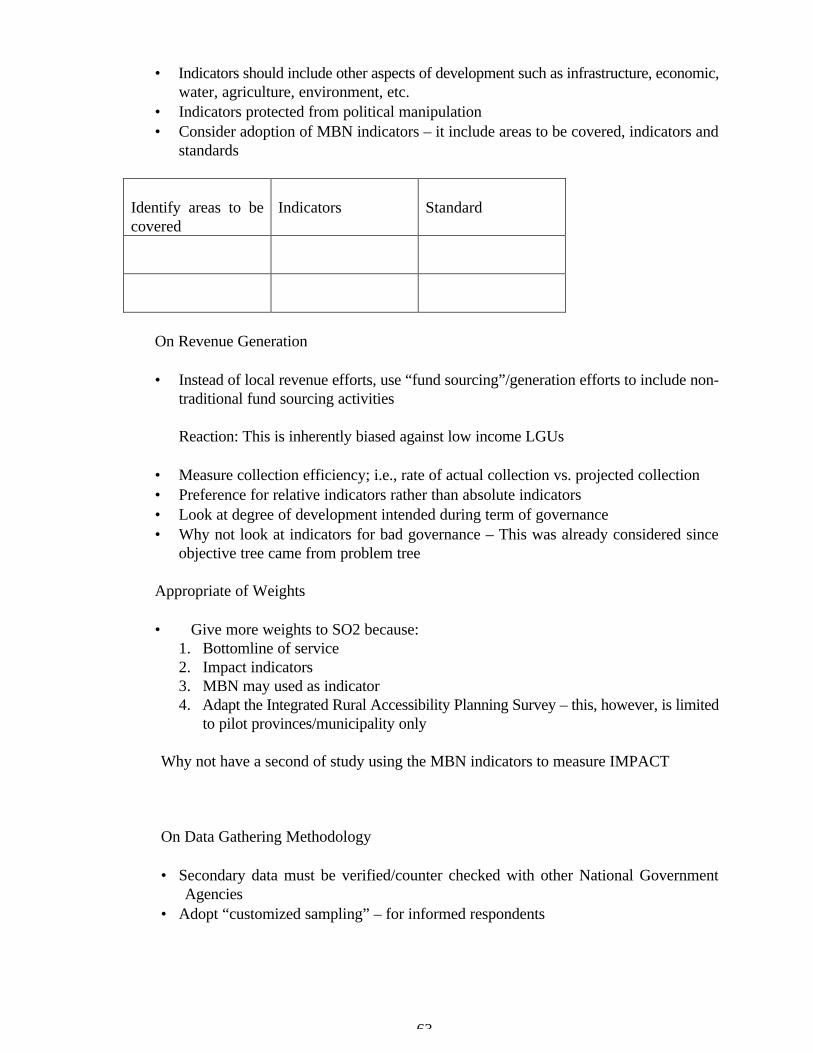
63
• Indicators should include other aspects of development such as infrastructure, economic,water, agriculture, environment, etc.
• Indicators protected from political manipulation• Consider adoption of MBN indicators – it include areas to be covered, indicators and
standards
Identify areas to becovered
Indicators Standard
On Revenue Generation
• Instead of local revenue efforts, use “fund sourcing”/generation efforts to include non-traditional fund sourcing activities
Reaction: This is inherently biased against low income LGUs
• Measure collection efficiency; i.e., rate of actual collection vs. projected collection• Preference for relative indicators rather than absolute indicators• Look at degree of development intended during term of governance• Why not look at indicators for bad governance – This was already considered since
objective tree came from problem tree
Appropriate of Weights
• Give more weights to SO2 because:1. Bottomline of service2. Impact indicators3. MBN may used as indicator4. Adapt the Integrated Rural Accessibility Planning Survey – this, however, is limited
to pilot provinces/municipality only
Why not have a second of study using the MBN indicators to measure IMPACT
On Data Gathering Methodology
• Secondary data must be verified/counter checked with other National GovernmentAgencies
• Adopt “customized sampling” – for informed respondents
64
Group A participants are listed in Annex B.
Group B
Group B’s output was presented by Mr. Leonardo Jamora of Panay State PolytechnicCollege, as follows:
1. Need Periodic Assessment
A. Frequency/Timing
1. Before the next administration, but not to be used for political purposes2. First Year – provide baseline information on the situation of the LGU,
as input to planning3. Second Year – for next term’s corrections
B. Other Issues
1. Cannot separate the indicators as reflection of performance of the LCEand the LGU
2. Should be comparable among LGUs and administrations3. How to relate the indicator system with the other M & E systems for
LGUs (DILG)
II. Institutionalization
A. Criteria for Selection of Institution
- non-political- technically capable- credible
B. Generating Resources
Sharing of resources:
Academic Institution - expertise of Faculty and StaffNEDA/DILG - fundsLGU - share from IRANGOs - technical capability/familiarity
with local development issues- package as research proposal
C. Supervision
a. Regional
Interagency: DILG, NEDA, CHED, NGOs, SCUs, Private Sector
65
b. National
Top Level Planning – Concerned Agencies
C. Accreditation of Participating Institutions
- Capability- Credibility
Group B participants are listed in Annex C
COMMENTS/ REACTIONS
1. Mr. Gullergan of CPDO-ILOILO asked for clarification on the provision of baselineinformation on the situation of the LGU as input to planning in the first year ofimplementation of the study.
Mr. Jamora replied that in their group's discussion, the implementation must start at thebaseline. After that, it will be on a case-to-case basis if the LGU can afford or those whoare participating in the annual evaluation or survey. ARD Valero clarified that therecommendation of the group is that evaluation will be conducted every year. The first yearwill be the baseline, the second year will be for the mid-term correction and the third year,which is before the next administration, will be the annual reporting of the performance orthe measurement of the indicator.
2. Mr. Nillos of PPDO-Iloilo said that they have no indicators at the local level. Their basisis the mandate as provided in the Local Government Code. He said one of Group A'ssuggestions is to put more weight on the basic service delivery of LGUs.
3. Ms. Cecilia Ortiz of PPDO-Guimaras said Group B's suggestion, if the study will beimplemented is to conduct a consultation with all the leagues so that the indicators will beacceptable to them. She said this will serve as one of the basis of measuring theirperformance.
4. On Mr. Gullergan's query as to who will conduct the evaluation, Mr. Jamora said theparticipation of private state colleges or universities will be solicited as they have their owninstitutionalized graduate program.
5. ARD Valero asked if the conduct of the study would not be affected if Group B's suggestionto tap the Internal Revenue Allotment will be followed. He also asked if the IRA will notdistort the priorities and the LGU can expect a favorable assessment if it is generous. Another question he posed is if the IRA would affect the objectivity of the study.
6. Mr. Nillos disagreed as regards getting the funds from IRA. He said that if there will be anadverse evaluation, there will be no allocation for the study in the succeeding year.

66
7. Mr. Ortiz said there are development-oriented local chief executives who may be willing toaccept favorable or unfavorable results. She suggested not to generalize everyone else doesnot want to.
ANNEX A
List of Participants
Name Office
1. Rodnel de los Reyes CPDO-Sagay City2. Lourdes Villa Civil Service Commission3. Ma. Jovita Santillana CPDO-La Carlota City4. Rose Mamaril Local Government Support Project5. Venancio Ardales University of Iloilo6. Aida Liza Bureau of Internal Revenue7. David Conadera Bureau of Local Government Finance8. Lourdes Diocson Department of Budget and Management9. Ma. Laline Lapu-os CPDO-Silay City10. Filipina Espinosa Philippine Information Agency11. Sylvia Bustamante Negro Council for Peace & Dev- Bacolod
City12. Leda Celi National Congress of the Unions in the
Sugar Industry of the Phils.13. Nathaniel Gallergan CPDO-Iloilo City14. Roque Hofilena PPDO-Negros Occidental15. Mario Nillos PPDO-Iloilo16. Gilbert Alparito CPDO-Cadiz City17. Simeon Leal PPDO-Iloilo18. Remedios Bayot Parole and Probation Administration19. Ofelia Pacete UP in the Visayas20. Agapito Abong. Jr. Bureau of Jail Management & Penology21. Melchor Teves Bureau of Jail Management & Penology22. Daisy Magbanua Commission on higher Education23. Cecilia Ortiz PPDO-Guimaras24. Lilibeth Bedonis Iloilo State College of fisheries25. Ma. Jade Catalan Iloilo State College of fisheries26. Evelyn Trompeta Dept. of Interior & Local Government27. Salome Siaton Dept. of Labor & Employment28. Christine Espanola Nat'l Intelligence & Coordination Board29. Ramon Hechanova Chamber of Real Estate & Builders
Association30. Rey Dusaran Central Philippine University31. Zaldy Barotil Merciphil Foundation, Inc.32. Leonardo Jamora Panay State Polytechnic College33. Rosario Manasan Phil. Institute for Development Studies

67
34. Ross Quisao Phil. Institute for Development Studies35. Eden Villanueva Phil. Institute for Development Studies36. Tonette Guillermo Development Academy of the Phils.37. Development Academy of the Phils.38. Felizardo Virtucio NEDA-CO39. Napoleon Imperial NEDA-CO40. Aleli Rosario NEDA-CO41. Arturo Valero NEDA-VI42. Raul Anlocotan NEDA-VI43. Ma. Isabel Blancia NEDA-VI44. Ma. Nesza Aleligay NEDA-VI45. Ma. Lourdes Miado NEDA-VI46. Juanita Sanchez NEDA-VI47. Manuel Luis Dionio NEDA-VI48. Corazon Porquez NEDA-VI49. Elizabeth Bugna NEDA-VI50. Erlinda Ortiz NEDA-VI51. Estela Paredes NEDA-VI52. Cynthia Lumampao NEDA-VI

68
ANNEX B
Group A Participants
Name Office
1. Dr. Venencio Ardales University of Iloilo2. Daisy Magbanua Commission on Higher Education3. Leda Celis NACUSIP-TUCP- Negros occ.4. Rose Mamaril Local Government Support Program5. Zaldy Barotil Merciphil Foundation, Inc.6. Mario Nillos PPDO-Iloilo7. Salome Siaton Dept. of Labor & Employment8. Ma. Isabel Blancia NEDA-VI9. Lourdes Diocson Dept. of Budget and Management10. Filipina Espinosa Public Information Agency11. Ma. Jade Catalan Iloilo State College of Fisheries12. Ofelia Pacete UP in the Visayas13. Ma. Laline Lapuas CPDO-Silay City14. Ma. Jovita Santillana CPDO-La Carlota City
ANNEX C
Group B Participants
1. Lourdes Villa Civil Service Commission2. Lilibeth Bedonia Iloilo State College of Fisheries3. Agapito Abang, Jr. Bu. Of Jail Management & Penalogy4. Melchor Teves Bu. Of Jail Management & Penalogy5. Rey Dusaran Central Philippine University6. Evelyn Trompeta Dept. of Interior & Local Government7. Christine Espanola Nat. Intelligence & Coord. Agency8. Gilbert Alparito CPDO-Cadiz City9. Rodnel del los Reyes CPDO-Sagay City10. Remedios Bayot Parole & Probation Administration11. Sylvia Bustamante Negros Council for Peace & Dev.-Bacolod
City12. Cecilia Ortiz PPDO-Guimaras13. Leonardo Jamora Panay State Polytechnic College - Capiz

69
Appendix 4cHIGHLIGHTS OF THE PRESENTATION OF THE UNDP-FUNDED STUDY ON
INDICATORS OF GOOD GOVERNANCE: DEVELOPING AN INDEX OFGOVERNANCE AT THE LOCAL LEVEL
Apo View Hotel, Davao CityAugust 14, 1999
Dr. Eduardo Gonzalez and Dr. Rosario Manasan delivered a 5O-minute presentation on thehighlights of the Study entitled: Indicators of Good Governance: Developing an Index ofGovernance at the Local Level. The presentation consisted of two parts: an overview of theStudy focusing on the objectives and rnethodologies used; and a discussion of the results of thepilot testing of indices In nine local government units (LGUs) In the country An open forumfollowed the presentation.
After the presentation, the following issues and concerns were raised:
1. Improvement in the Survey Questionnaire
1915. Asuncion J. Chin, outgoing PSR co RVC Xl, called the attention of the UNDPteam to the questionnaire used in their public opinion surveys. Specifically, she cited thatthe questions on social welfare services referred mostly to disaster relief, which is not ausual day to day activity. In addition, she stated that some of the social welfare activitiesindicated in the questionnaire, like the operation of municipal feeding centers, are nolonger being encouraged. She suggested that the questionnaire be reviewed for possibleamendment to put emphasis on the regular social welfare services being provided by theLGUs.
Ms. Amelita Atillo, outgoing PSR to RDC Xl, echoed Ms. Chin's concern, adding that thequestionnaire should also encompass sectoral specificity. This will give the local governmentexecutives an idea if social services have truly benefited the urban poor and tribal Filipinos.
(Dr. Manasan clarified that the survey questions were formulated based on the devolvedfunctions of different government agencies. However, the team agreed to take note ofthe suggestions.)
2. Integration of the MBN Survey with the Public Opinion Survey
ARD Salvador Estrera of DOH Xl inquired about the possibility of incorporating the MBNindicators into the Governance survey.
(Dr. Manasan and Dr. Gonzales remarked that though MBN indicators would make agood basis for the Governance survey, the constraint is that the MBN has not been inplace yet in all LGUs of the country, hence, there would be a problem on comparabilityof data.)
70
3. Ensuring Objectivity in the Assessment Process
Engr. Milagros Rabanes, PPDC of Davao Oriental, inquired how neutrality and objectivityin the evaluation process could be assured.
(Dr. Gonzales responded that objectivity can be assured if the evaluation and monitoringprocess are conducted by a tripartite group or a four-cornered arrangement to beparticipated in by the NGOs, academe, LGUs and league of mayors in order to providechecks and balance. He further added that to safeguard neutrality, indicators have tobe housed in a non-political body like the institutions which must have the privilege ofcollecting, storing and archiving data.)
4. Timetable of Index Measurement
Mr. Tommy Nograles, representative of Mayor Adelbert W. Antonino of General SantosCity viewed the evaluation process from the perspective of a local chief executive. Hepointed out that upon assumption of office the new mayor usually inherits the budget anddevelopment thrust of the previous administration. Thus, he can only implement his owndevelopment thrusts in the following year. In this regard, Mr. Nograles wanted to knowif this situation hen been considered In framing the indices and in timing the conduct ofthe study.
(Dr. Manasan stated that the team previously recommended that the study be conductedin the second year of the term of the LGU official. At this point, she suggested that theylook at the possibility of doing it at the staff of the third year.)
5. Basis of LGU Classification
Mr. Danilo Supe, PPDC of South Cotabato, asked the ream co consider classifying LGUsaccording co income, population or area because the presentation has shown that richerLGUs tend to show better performance than the poorer LGUs.
(Dr. Manasan remarked that based on their studies, it is not a/ways true that richerLGUs perform better than their poorer counterparts. She cited the time when theycompared the per capita revenue from local and property taxes collected by differentLGUs. Upon ranking, they found out that there was no correlation between Income classand efficiency in collecting taxes. An example was Trece Martirez, a 4th income classmunicipality with P1,200 per capita local revenue collection; and Davao City, a Ist income class city which had only P500 per capita local revenue collection.)
6. Lack of NGO Participation in LGU Affairs
Mr. Renato Tejano, PSR of Davao del Norte aired his sentiments regarding the lack ofImportance given to NGOs during their participation in public hearings and other forums.He observed that when the NGOs are invited, their ideas and suggestions are not usuallyadopted. Because of this, he believes that NGOs have become passive and less receptiveduring the meetings. He appealed to local government executives to be more responsiveto the ideas of the NGOs.
71
He also appealed to legislators co review the business taxes being collected in somemunicipalities which are too high because they deter the entry of local investors.
7. D1LG's Performance and Productivity Measurement (LPPM)
In behalf of DILG Xl, Mr. Felix Sanchez expressed appreciation to the UNDP team forcoming up with the study on governance measurement. He, likewise, Informed the bodythat DILG has a similar project that started In 1984 which is presently viewed withrenewed interest. According to him, DILG is willing to collaborate with UNDP and othersectors in order to come up with a very acceptable scheme of governance measurement.However, he suggested that indicators relative to local financial administration,development planning, organization and management, legislation and service delivery, aswell as, indicators on the capability of the government to exercise regulatory functions bealso considered in measuring local governance.
8. NGO Accreditation at the Local Level
Ms. Vilma Amon of NEDA XI remarked that she was struck by the statement that theaccreditation of NGOs in the local bodies is not very ideal.
(Dr. Manasan replied that when they surveyed some LGUs as to who among the NGOswas accredited in local special bodies, the people would answer that it was "the NGO ofthe Mayor's spouse". Hence the team deduced that this was probably the explanation whythe scores on NGO participation in the local bodies do not correlate with the scores onpeople's participation in the NGOs and their perception of the empowerment of theNGOs.)
9. Submission or Additional Comments
Director Pelayo acknowledged the importance of the study and on behalf of RDC Xl,thanked the UNDP team for an excellent presentation. She encouraged the participantsto submit any additional comment or suggestion to the NEDA Secretariat.

72