indicators of northern health: a resource for northern manitobans
TRANSCRIPT

INDICATORS OF NORTHERN HEALTH: A RESOURCE FOR NORTHERN MANITOBANS AND
THE BAYLINE REGIONAL ROUND TABLE
FINAL REPORT
January 2009

Rural Development Institute, Brandon University Brandon University established the Rural Development Institute in 1989 as an academic research centre and a leading source of information on issues affecting rural communities in Western Canada and elsewhere.
RDI functions as a not-for-profit research and development organization designed to promote, facilitate, coordinate, initiate and conduct multi-disciplinary academic and applied research on rural issues. The Institute provides an interface between academic research efforts and the community by acting as a conduit of rural research information and by facilitating community involvement in rural development. RDI projects are characterized by cooperative and collaborative efforts of multi-stakeholders.
The Institute has diverse research affiliations, and multiple community and government linkages related to its rural development mandate. RDI disseminates information to a variety of constituents and stakeholders and makes research information and results widely available to the public either in printed form or by means of public lectures, seminars, workshops and conferences.
For more information, please visit www.brandonu.ca/rdi.

INDICATORS OF NORTHERN HEALTH: A RESOURCE FOR NORTHERN MANITOBANS AND
THE BAYLINE REGIONAL ROUND TABLE Prepared by: Katherine Pachkowski Alison Moss Fran Racher Robert C. Annis Rural Development Institute Brandon University Brandon, MB R7A 6A9

Indicators of Northern Health: A Resource for Northern Manitobans and the Bayline Regional Round Table i
Acknowledgements The Rural Development Institute gratefully acknowledges the contributions of the many partners of the Manitoba component of the Community Collaboration to Improve Health Care Access of Northern Residents 2004-2007 project.
Over the course of this research project, many individuals made contributions to the project and to this document. The authors of this report wish to acknowledge the contributions of Marian Beattie, Myles Ferguson, Ryan Gibson, and Beth Peers; students Alex Martin, Anisa Zehtab-Martin and Laine Mosset; and administrative staff Sylvia Henry and Beverley Lischka of the Rural Development Institute, Brandon University.
This project was supported by the Canadian Institutes of Health Research, Aboriginal Peoples’ Health Grant # RLO – 74175.

Indicators of Northern Health: A Resource for Northern Manitobans and the Bayline Regional Round Table ii
Table of Contents Acknowledgements.......................................................................................................................... i Executive Summary ....................................................................................................................... iv List of Tables / Figures .................................................................................................................. vi I Introduction ................................................................................................................................. 1
Research Project.......................................................................................................................... 1 Organization of the Report.......................................................................................................... 1 Sources of the Data ..................................................................................................................... 2 Limitations of the Data ............................................................................................................... 3 Health Indicators......................................................................................................................... 4
II Provincial Health Status and Health Care .................................................................................. 5 Provincial Health Indicators ....................................................................................................... 5 Provincial Health Expenditures .................................................................................................. 7
III Health of Northern Canadians .................................................................................................. 9 Canadian Health Regions Comprise Peer Groups ...................................................................... 9 Health of Peer Groups............................................................................................................... 10
Peer Group C (with Burntwood Region) .............................................................................. 11 Peer Group F (with Nor-Man Region).................................................................................. 11
IV Manitoba First Nations Health................................................................................................ 15 Registered First Nations Health and Health Care Indicators .................................................... 17 Health Status ............................................................................................................................. 18 Measures of Illness and Injury.................................................................................................. 19 Preventive Care Measures......................................................................................................... 20 Health Care Utilization ............................................................................................................. 21 Jurisdictional Factors in First Nations Health Care Delivery ................................................... 22
Framework of Health Service Delivery in Manitoba............................................................ 22 Areas of Agreement .............................................................................................................. 23 Areas of Ambiguity............................................................................................................... 24
V Health in Northern Manitoba ................................................................................................... 27 Health Status ............................................................................................................................. 27 Measures of Illness ................................................................................................................... 29 Preventive Care Measures......................................................................................................... 30 Health Care Utilization ............................................................................................................. 30 Mental Health............................................................................................................................ 32
Treatment Prevalence............................................................................................................ 33 Use of Physician Services..................................................................................................... 36
VI Burntwood Region and Bayline Communities ....................................................................... 39 Health Status ............................................................................................................................. 40 Measures of Illness ................................................................................................................... 41 Preventative Care Measures...................................................................................................... 42 Health Care Utilization ............................................................................................................. 43 Mental Health............................................................................................................................ 46
Treatment Prevalence............................................................................................................ 46 Use of Physician Services..................................................................................................... 48
Demographics of Burntwood Region ....................................................................................... 50

Indicators of Northern Health: A Resource for Northern Manitobans and the Bayline Regional Round Table iii
Population by Age and Gender ............................................................................................. 50 Legal Marital and Common-Law Status............................................................................... 52 Language Characteristics ...................................................................................................... 53 Level of Schooling................................................................................................................ 54 Earnings and Income Characteristics.................................................................................... 55 Occupation Characteristics ................................................................................................... 57 Family, Household, and Private Dwelling Characteristics ................................................... 58 Demographics of Division 22 ............................................................................................... 60
VII Nor-Man Region and Bayline Communities......................................................................... 63 Health Status ............................................................................................................................. 63 Measures of Illness ................................................................................................................... 64 Preventive Care Measures......................................................................................................... 65 Health Care Utilization ............................................................................................................. 66 Mental Health............................................................................................................................ 67
Treatment Prevalence............................................................................................................ 68 Use of Physician Services..................................................................................................... 69
Demographics of Nor-Man Region .......................................................................................... 70 Population by Age and Gender ............................................................................................. 70 Legal Marital and Common-Law Status............................................................................... 72 Language Characteristics ...................................................................................................... 73 Level of Schooling................................................................................................................ 74 Earnings and Income Characteristics.................................................................................... 76 Occupation Characteristics ................................................................................................... 77 Family, Household, and Private Dwelling Characteristics ................................................... 78 Demographics of Division 21 ............................................................................................... 80
References..................................................................................................................................... 83 Appendix A................................................................................................................................... 85 Appendix B ................................................................................................................................... 86

Indicators of Northern Health: A Resource for Northern Manitobans and the Bayline Regional Round Table iv
Executive Summary The Rural Development Institute, Brandon University and the Saskatchewan Population Health and Evaluation Research Unit, University of Regina partnered to conduct a three-year research project entitled Community Collaboration to Improve the Health Care Access of Northern Residents. Funded by an Aboriginal People’s Grant from the Canadian Institutes of Health Research, the project was founded on the principles of a participatory action research.
In Manitoba, the Bayline Regional Round Table (BRRT) and its communities of Cormorant, Thicket Portage, Pikwitonei, Illford/War Lake and Wabowden partnered with the Burntwood Regional Health Authority, and the Nor-Man Regional Health Authority. This report was designed to bring together information for use by these northern communities, residents of northern Manitoba, regional health authorities, health service providers, and others interested in the health of northern residents. Health indicators and demographic statistics from a variety of sources are noted in each section and are used to illustrate the health of northern populations, their use of the health care system, and population characteristics that influence and determine their health status.
The report begins with information about the project and the data that have been gathered (Section I), followed by a comparison of the health status of Canadians by province (Section II), a discussion of the health of northern Canadians by regional peer groupings (Section III), details on the health of First Nations people of Manitoba (Section IV), and data on health in Northern Manitoba as compared with the South and Winnipeg (Section V). The report then focuses on the health districts and community groupings within the Burntwood Region (Section VI) and the Nor-man Region (Section VII), including population demographics of factors that influence health and well-being. Some highlights of these sections follow. Details on these highlights and other information about health indicators and demographics are located in the full report.
Section II - In a comparison of the 10 Canadian provinces, Manitoba ranked 10 in health status, 3 in health care outcomes, and tied for 9 in health care utilization and performance, for an overall ranking of 10 or last in overall health performance. Per capita health care spending was not indicative of performance as Manitoba ranked 7 for health care spending, with only 3 provinces spending more per person and Manitoba’s per capita rate above the national average.
Section III - Statistics Canada grouped Canada’s 139 health regions into 10 peer groups on the basis of 24 demographic characteristics such as population count, household income, education, employment status, and life expectancy. Health outcomes and risk factors were compared between and within these peer groups. Peer Group C, which included Burntwood and Churchill Health Regions of northern Manitoba, and Peer Group F, which included Nor-Man Health Region, had the lowest life expectancy of all Peer Groups for the nation. Group C, in last place with a life expectancy of 71.8 years, was almost 5 years lower than second last place Group F at 76.7. Both were significantly lower than the national average life expectancy of 78.3. These results suggested that the farther north people live in Manitoba, the shorter their life expectancy. Group C scored poorest of all peer groups on the four health behaviour indicators, related to smoking, obesity, infrequent exercise and heavy drinking. However, Group C scores for the psychosocial factors of high stress and depression were the best scores, significantly better than the national average. Group F had significantly poorer scores than the national averages on all indicators except infrequent exercise and high stress.

Indicators of Northern Health: A Resource for Northern Manitobans and the Bayline Regional Round Table v
Section IV - For all health regions in Manitoba, the health status of the Registered First Nations (RFN) population was poorer than that of the other Manitobans in each region. However in health regions in the south with the best overall health status, RFN populations had poorer health status than they did in northern health regions. Data suggested that for RFN populations, who live in northern regions and practice more traditional lifestyles, better health status than RFN populations in the south may be a result. The diabetes treatment prevalence among RFN was over four times higher (18.9%) than for other Manitobans (4.5%). Injury hospitalization rates were 3.7 times higher for RFN (30.4/1000), than for all other Manitobans (8.3/1000). A higher rate for the RFN population was consistent for every health region in Manitoba. Overall, immunization rates for RFN children were about 2/3 of those for other Manitoban children. Family practitioners and general practitioners provided for 83.9% of physician contacts for the RFN and 73.7% for other Manitobans. Given the poorer health status of RFN populations, the converse could be expected. Some 83.6% of family practitioner and general practitioner visits for RFN people, occurred in the health region of residence. For other Manitoban’s 90.9% occurred in the region of residence. Jurisdictional ambiguity and the lack of clarity on the respective roles and responsibilities of the federal and provincial governments concerning health and health services of First Nations people have an impact on accessibility and comprehensiveness of health care delivery in all Canadian provinces and territories.
Section V - Overall, health status in Northern Manitoba was significantly poorer than in the South and in Winnipeg. Treatment prevalence of diabetes, hypertension, and cumulative mental health disorders (due largely to the diagnosis of substance abuse) were significantly higher in Northern Manitoba. Immunization of one-year olds occurred 16% less often for males living in the North compared to the Province and 14% less often for females. The difference was more pronounced among two year olds. Despite the fact that individuals in the North suffer poorer health than their southern counterparts, Northern residents had lower rates of health care utilization.
Section VI - BRRT communities of Thicket Portage, Pikwitonei, and Wabowden were located in the same health district within the Burntwood Health Region, while War Lake was located in a district with Shamattawa, York Landing, and Split Lake. In general health status and health care data showed that the district including Thicket Portage/ Pikwitonei/ Wabowden fared somewhat better than the Burntwood Region as a whole. The district in which Ilford/War Lake was located showed a poorer health status than the Burntwood Region as a whole. Demographic details describing characteristics of the population of the Burntwood Region were compared to those of the Province of Manitoba as a whole. Demographics were provided for the total population of the Burnwood Region and for the Aboriginal Identity Population (AIP) (who identified themselves as being of Aboriginal decent when they completed the census).
Section VII - The BRRT community of Cormorant is located in District 3 of Nor-Man Health Region (often referred to as Nor-Man Other in reports) along with Sherridon/Cold Lake, Easterville/ Chemawawin First Nation, Grand Rapids/ Grand Rapids First Nation, Moose Lake/ Mosakahiken Cree Nation, Pukatawagan/Mathias Colomb First Nation. District 3 generally rated poorer than the other two districts of the Region on various health indicators. Demographics were provided for the total population of the Region and the AIP of the Region.

Indicators of Northern Health: A Resource for Northern Manitobans and the Bayline Regional Round Table vi
List of Tables / Figures Table 2.2 Per Capita Government Health Expenditure by Province ............................................. 7 Table 3.1 Principal Characteristics of Peer Groups of Northern Manitoba RHAs...................... 10 Table 3.2 Comparison of Peer Groups for Selected Characteristics............................................ 12 Table 3.3 Comparison of Peer Group C Health Regions for Selected Characteristics................ 13 Table 3.4 Comparison of Peer Group F Health Regions for Selected Characteristics ................ 14 Table 4.1 Manitoba RFN Population by RHA for On Reserve and Off Reserve RFNs, 1998.... 18 Table 4.2 Health Status of Registered First Nations People and Other Manitobans ................... 19 Table 4.3 Illness and Injury Rates for Registered First Nations People & Other Manitobans .... 20 Table 4.4 Preventive Care Measures by Registered First Nations People & Other Manitobans. 21 Table 4.5 Use of Physician and Hospital Services by RFN People & Other Manitobans........... 21 Figure 4.1 Framework for Current First Nation Health Service Delivery in Manitoba ............... 23 Table 4.6 Responsible Department for Select First Nations Health Services.............................. 24 Table 4.7 Services with Jurisdictional Ambiguity – Who pays? Which standards apply?
What are the rules of entitlement? .............................................................................. 25 Table 5.1 Health Status and Mortality by Health Region............................................................ 28 Table 5.2 Diabetes and Hypertension Treatment Prevalence by Health Region......................... 29 Table 5.3 Immunization of One and Two-Year Olds by Health Region ..................................... 30 Table 5.4 Physician Services by Health Region .......................................................................... 31 Table 5.5 Hospital Services by Health Region ............................................................................ 32 Table 5.6 Treatment Prevalence of Mental Disorders 1997/98 – 2001/02 .................................. 33 Table 5.7 Mental Illness Treatment Prevalence by Health Region ............................................. 34 Table 5.8 Treatment Prevalence of Depression/Substance Abuse by Health Region ................. 35 Table 5.9 Physician Visits for All Causes/Mental Illness by Health Region .............................. 37 Table 6.1 Health Status and Mortality of Burntwood Region by District ................................... 41 Table 6.2 Diabetes and Hypertension Treatment Prevalence by Burntwood Health District ..... 42 Table 6.3 Immunization of One and Two-Year Olds by Burntwood Health District.................. 43 Table 6.4 Physician Services by Burntwood Health District....................................................... 44 Table 6.5 Hospital Services by Burntwood Health District......................................................... 45 Table 6.6 Mental Illness Treatment Prevalence by Burntwood Health District .......................... 46 Table 6.7 Treatment Prevalence for Depression/Substance Abuse by Burntwood District ........ 47 Table 6.8 Physician Visits for All Causes/Mental Illness by Burntwood Health District ........... 49 Table 6.9 Population of Burntwood Region and Manitoba by Age and Gender, 2001............... 50 Table 6.10 Aboriginal Identity Population of Burntwood Region and Manitoba, 2001 ............. 51 Table 6.11 Aboriginal Identity Population by Age, Burntwood Region and Manitoba 2001 ..... 52 Table 6.12 Marital Status for Burntwood Region and Manitoba................................................. 52 Table 6.13 Aboriginal Identity Population by Marital Status, Burntwood and Manitoba........... 53 Table 6.14 Language Characteristics for Burntwood Region and Manitoba............................... 53 Table 6.15 Language Characteristics for Burntwood Region and Manitoba AIP ....................... 54 Table 6.16 Schooling for Burntwood and Manitoba ................................................................... 54 Table 6.17 Schooling for Burntwood and Manitoba AIP by Gender .......................................... 55 Table 6.18 Employment Income & Labour Force Indicators for Burntwood and Manitoba ...... 56 Table 6.19 Employment Income & Labour Indicators for Burntwood and Manitoba AIP......... 56 Table 6.20 Occupation Characteristics for Burntwood Region and Manitoba by Gender .......... 57 Table 6.21 Occupation Characteristics for Burntwood and Manitoba AIP by Gender ............... 58

Indicators of Northern Health: A Resource for Northern Manitobans and the Bayline Regional Round Table vii
Table 6.22 Family and Household Characteristics for Burntwood and Manitoba ...................... 59 Table 6.23 Family and Household Characteristics for Burntwood and Manitoba AIP ............... 60 Table 6.24 Population of Census Division 22 by Community .................................................... 61 Table 7.1 Health Status and Mortality by Nor-Man District ....................................................... 64 Table 7.2 Diabetes and Hypertension Treatment Prevalence by Nor-Man District .................... 65 Table 7.3 Immunization of One and Two-Year Olds by Nor-Man Health District..................... 65 Table 7.4 Physician Services by Nor-Man Health District.......................................................... 66 Table 7.5 Hospital Services by Nor-Man Health District............................................................ 67 Table 7.6 Treatment Prevalence by Nor-Man Health District ..................................................... 68 Table 7.7 Treatment Prevalence for Depression/Substance Abuse by Nor-Man District ........... 69 Table 7.8 Physician Visits for All Causes/ Mental Illness by Nor-Man Health District ............. 70 Table 7.9 Population of Nor-Man Region and Manitoba by Age and Gender ............................ 71 Table 7.10 Aboriginal Identity Population of Nor-Man Region and Manitoba .......................... 72 Table 7.11 Aboriginal Identity Population by Age, Nor-Man Region and Manitoba ................. 72 Table 7.12 Marital Status for Nor-Man Region and Manitoba.................................................... 73 Table 7.13 Aboriginal Identity Population by Marital Status, Nor-Man and Manitoba.............. 73 Table 7.14 Language Characteristics for Nor-Man Region and Manitoba.................................. 74 Table 7.15 Language Characteristics for Nor-Man Region and Manitoba AIP .......................... 74 Table 7.16 Schooling for Nor-Man Region and Manitoba by Age and Gender.......................... 75 Table 7.17 Schooling for Nor-Man and Manitoba AIP by Gender ............................................. 75 Table 7.18 Employment Income & Labour Characteristics for Nor-Man and Manitoba............ 76 Table 7.19 Employment Income & Labour Characteristics for Nor-Man and Manitoba AIP .... 76 Table 7.20 Occupation Characteristics for Nor-Man Region and Manitoba by Gender ............. 77 Table 7.21 Occupation Characteristics for Nor-Man and Manitoba AIP by Gender .................. 78 Table 7.22 Family and Household Characteristics for Nor-Man and Manitoba.......................... 78 Table 7.23 Family and Household Characteristics for Nor-Man and Manitoba AIP .................. 74 Table 7.24 Population of Census Division 21 by Community .................................................... 80
Indicators of Northern Health: A Resource for Northern Manitobans and the Bayline Regional Round Table 1
I Introduction This report is a component of the three-year research project Community Collaboration to Improve the Health Care Access of Northern Residents that was funded by an Aboriginal People’s Grant from the Canadian Institutes of Health Research. The project involved the communities of the Bayline Regional Round Table (BRRT) and their respective regional health authorities.
The initial purpose of the report is to provide information for use by each community; its BRRT partners; the northern health regions; and others interested in the health and health care access of residents of northern Manitoba. The report begins with a discussion of health status and health care across provinces in Canada and moves to a focus on the health of northern Canadians. Health and health care indicators for the Registered First Nation population of Manitoba are discussed followed by a review of the health of northern Manitobans. Health status and health care in the Burntwood Region and the Nor-Man Region in general are discussed and followed by a discussion of the same topics, to the extent possible, regarding the Bayline Communities located in those regions. Some data are provided on the demographics of populations by health region and health district. In this report the health regions of interest are the Burntwood and Nor-Man Health Regions, with a focus on the Bayline Communities of Ilford/War Lake First Nation, Pikwitonei, Thicket Portage, and Wabowden located in the Burntwood Health Region and Cormorant located in the Nor-Man Health Region.
Research Project Concern about the quality of access to health services within BRRT communities locally, regionally and provincially sparked interest in conducting a participatory action research (PAR) project engaging a variety of stakeholders. Conversations, interviews and focus groups were conducted with community members, service providers (itinerant, local, regional and provincial), and government representatives. Inclusion of personal experiences and community knowledge to empower participants is fundamental in PAR. This type of research activity values the process through which awareness and consciousness of issues is raised. Sharing knowledge across partners and collaboratively creating solutions are important outcomes of the project. In keeping with the inherent principles of community development, community members actively engaged in the process, extending their skills and knowledge necessary to take further charge of their own destinies and extending their partnerships to strengthen their actions to improve the health care access of northern residents.
In this report data will be provided on demographics and health status for use by the partnering communities. These data will complement the information gathered from community residents and their health care providers through the interviews and focus groups (Moss, Racher, Jeffery, Hamilton, Burles, & Annis, forthcoming).
Organization of the Report Section I, the introduction of the report, includes information about the purpose of this report, the research project, and the content of the report. Sources and limitations of the data are discussed. In addition the use of health indicators for health status and health care system evaluation is described.

Indicators of Northern Health: A Resource for Northern Manitobans and the Bayline Regional Round Table 2
In Section II, the health status of Canadians and Manitobans is discussed. The chapter begins with information about the ranking of Manitoba among provinces in Canada in terms of health status of its residents, health care outcomes and health care utilization. Provincial health care expenditures are compared.
In Section III, the focus is on northern health and the health of populations living in the northern health regions of Canada. Health regions of Canada are grouped according to demographics or characteristics of the populations, with the northern health regions being compared to the other health regions on indicators to measure health outcomes, health behaviours and psycho-social factors of the respective populations.
In Section IV, the health of Registered First Nations People of Manitoba are discussed including health status, measures of illness and injury, preventative care measures and health care utilization. Jurisdictional factors related to FN health care delivery are considered with attention to areas of agreement and areas of disagreement between federal and provincial jurisdictions.
In Section V, the health of Northern Manitobans is the focus considering health status, measures of illness, preventative care measures, and health care utilization. Mental health is discussed in light of treatment prevalence and use of physician services.
In Section VI, the Burntwood Region and the Bayline Communities therein are the focus of attention. Health and health care in the Burntwood Region are discussed by health district covering topics of health status, measures of illness, preventative care measures, and health care utilization. Mental health data are discussed in light of treatment prevalence and use of physician services. A variety of demographics to describe the characteristics of the population of the Burntwood Region are provided including figures for the Aboriginal Identity Population and the Region as a whole. Population counts for 2001 and 2006 by community are provided for Census Division 22.
In Section VII, the Nor-Man Region and the Bayline Communities therein are the focus of attention. Health and health care in the Nor-Man Region are discussed by health district covering topics of health status, measures of illness, preventative care measures, and health care utilization. Mental health data are discussed in light of treatment prevalence and use of physician services. A variety of demographics to describe the characteristics of the population of the Nor-Man Region are provided including figures for the Aboriginal Identity Population and the Region as a whole. Population counts for 2001 and 2006 by community are provided for Census Division 21.
The Executive Summary is provided at the front of the report to give the highlights of the report at a convenient glance.
Sources of the Data This report includes data from a variety of resources. Much of the data are demographic. Statistics Canada provided population information such as marital status, language characteristics, educational attainment, income and labour force characteristics, and occupation characteristics, as well as family and household characteristics. Other data were health indicators or measures of health of populations and were taken from regional health assessments and provincial studies by the Manitoba Centre on Health Policy.

Indicators of Northern Health: A Resource for Northern Manitobans and the Bayline Regional Round Table 3
Demographics were retrieved from Statistic Canada’s website at www.statcan.ca . On the website links were used to the 2001 Community Profiles; the 2001 Census Aboriginal Population Profiles; and the 2001 Aboriginal Peoples Survey (APS). The APS provided a number of statistics that may not be included in the 2001 Census Aboriginal Population profile and therefore can be used to supplement the Census Profiles.
Other data were retrieved from regional sources such as the Burntwood RHA Community Health Assessment (BRHA, 2004) and the Nor-Man RHA Community Health Assessment (NRHA, 2004). Reports used from the Manitoba Centre for Health Policy included: Health and Health Care Use of Registered First Nations People Living in Manitoba: A Population-Based Study (Martens et al., 2002), the Manitoba RHA Indicators Atlas: Population-Based Comparisons of Health and Health Care Use (Martens et al, 2003), Patterns of Regional Mental Illness Disorder Diagnoses and Service Use in Manitoba: A Population-Based Study (Martens, P. et al, 2004) and Sex Differences in Health Status, Health Care Use, and Quality of Care: A Population-Based Analysis for Manitoba’s Regional Health Authorities (Fransoo et al, 2005). Internet links to these reports were included in the reference list at the end of the report.
Although some 2006 census data were available at the writing of this report, detailed community data were not available as yet. Further, many of the studies discussed and data provided from other sources are related to 2001 data. Therefore 2001 data was used throughout this report with the addition of a comparison of population counts by census division and sub-division for 2001 and 2006.
Limitations of the Data In gathering data, two issues arose: the amount of data available and the quality of existing data. While data were readily available at the provincial and regional levels, when the focus shifts to smaller communities data become increasingly scarce. Locating community health data was difficult for two possible reasons: data have never been gathered in large enough samples to represent the community and/or community members in the area may not have the resources necessary or may not have identified the need to produce a statistical picture of the health status of their residents. However, data have been generated by the Manitoba Centre for Health Policy at the level of health districts within each health region. These data were the ‘closest to home’ data available for communities with populations of less than 500 persons.
Although census data cannot be generated in any detail (due to sample size) for communities with populations of less than 500 persons, demographics have been generated by health region within each province. These data about the characteristics of the population of each heath region complement the data on health indicators from the Manitoba Centre for Health Policy. In addition, aspects of the entire population of a region can be compared to specific populations such as the “Aboriginal Identity Population” to better understand the characteristics of populations of interest. These data were included in the latter two sections of the report.
Often the data provided by Statistics Canada were weighted to predict the responses of the entire population from the sample of a population that completed the survey. As a result of weighting or due to low response rates to surveys, the reliability of data may be questionable. When data were less reliable, Statistics Canada urged that data should be used with caution and symbols were used within tables to indicate those particular data. When such data were identified, these

Indicators of Northern Health: A Resource for Northern Manitobans and the Bayline Regional Round Table 4
symbols were included in the tables and the related footnotes were incorporated throughout this report.
Health Indicators The Canadian Institute for Health Information (2006) defined health indicators as standardized measures for comparing health status as well as health system performance and characteristics among different jurisdictions in Canada. A variety of indicators have been used to measure health status. The indicators chosen largely depended on those that were available for study; that is those factors that were possible to measure and had been measured. The goals of the research helped to focus on the most appropriate indicators for use within the study. Broadly speaking, health indicators are medical and non-medical.
Common medical indicators of health include: life expectancy at birth, infant mortality or death rates, and physical indicators such as body mass index (a calculation of body weight in relation to
height), and blood pressure. Access to health services is a medical indicator that is often evaluated using indicators
such as • availability (Do services exist?), • accessibility (Can people get to services?), • accommodation (Do services meet the needs of residents?), • affordability (Can people afford the costs of services and access to them?), and • acceptability (Are services delivered in acceptable ways?) (Racher & Vollman, 2002).
Common non-medical health indicators may include:
socio-economic factors such as income and social status, education, and employment; physical environmental factors such as housing, transportation and water quality; social environmental factors such as safe and supportive communities; social networks including availability of friends and family; culture and gender; as well as personal health behaviours such as the use of tobacco or alcohol, frequency and type of
exercise undertaken and nutritional practices (PHAC, 2001). Regional health authorities use demographic statistics and health indicators to monitor the health of their populations and the functioning of their health systems through comparative information. They seek to analyze existing information and to gather additional information on the health of the population served; the health services received by the region's residents; and non-medical factors that influence health of residents of the region (often referred to as social determinants of health); and characteristics of the community and the health system that provide useful contextual information.

Indicators of Northern Health: A Resource for Northern Manitobans and the Bayline Regional Round Table 5
II Provincial Health Status and Health Care In discussing health status and health care in Manitoba two areas of focus were considered. The first was a comparison of the Province of Manitoba to the other Canadian provinces on three evaluation categories of health indicators including health outcomes, health behaviours and psycho-social factors. The second was an illustration of the per capita government health expenditures by province.
Provincial Health Indicators In February 2006, the Conference Board of Canada released a report, Healthy Provinces, Healthy Canadians: A Provincial Benchmarking Report (Hamilton, 2006). The report contained an assessment of the state of provincial health care in Canada and the overall health of residents of each province. The report was based on the data from the Health Canada publication Healthy Canadians: A Federal Report on Comparable Health Indicators 2004. The aim of the report was to examine and compare provincial health care systems by using the 70 most recent health indicators. Researchers divided up the 70 indicators by gender when possible, which led to the identification of 119 health indicators. These health indicators were grouped into three categories: 51 were classified as health status (e.g. life expectancy, physical activity), 27 as health care outcomes (e.g. mortality or death rates for certain diseases, five-year survival rates for selected types of cancer), and 41 as health care utilization and performance (e.g. patient satisfaction with health care, wait times for selected surgeries). The health status of each province was rank ordered in terms of these 3 categories and an overall rank was calculated (Table 2.1).
The health status top performer was British Columbia, followed by Quebec and Ontario. The health status poorest performer was Manitoba. British Columbia placed first in the health care outcomes category followed by Alberta and Manitoba. Quebec dropped to last in this category which may be explained by its lack of reporting on 13 indicators in this category. Health care utilization and performance leader was New Brunswick, followed by Saskatchewan and Quebec. British Columbia dropped to second lowest followed by Manitoba and Ontario who tied for last place.
While no province did well in all areas, British Columbia and Alberta followed by Saskatchewan did best in the overall provincial comparison. Manitoba ranked 10th or last overall largely due to its low scores on a number of indicators in health status and health care utilization and performance.
Placing last in overall health performance by the Province of Manitoba suggested a substantial need for improvement in the health status of Manitoba residents and development of the health care system. Challenges in Manitoba that must be managed in the future included Manitoba’s placement as having:
the highest male infant mortality rate the highest female incidence rate for lung cancer, (tied with Quebec) the second highest incidence rate for female breast cancer the second highest female incidence rate for Chlamydia

Indicators of Northern Health: A Resource for Northern Manitobans and the Bayline Regional Round Table 6
Table 2.1 Provincial Ranking by Evaluation Category
Health Status Health Care Outcomes Health Care Utilization and Performance Overall Health Performance
Rank Province Rank Province Rank Province Rank Province
1. British Columbia 1. British Columbia 1. New Brunswick 1. British Columbia
2. Quebec 2. Alberta 2. Saskatchewan 2. Alberta
3. Ontario 3. Manitoba 3. Quebec 3. Saskatchewan
4. Alberta 3. Saskatchewan 3. Alberta 4. Ontario
5. Prince Edward Island 5. Ontario 5. Prince Edward Island 5. Quebec
6. Saskatchewan 6. New Brunswick 5. Nova Scotia 6. New Brunswick
7. New Brunswick 7. Nova Scotia 7. Newfoundland/Labrador 7. Prince Edward Island
8. Newfoundland/Labrador 8. Newfoundland/Labrador 8. British Columbia 8. Newfoundland/Labrador
9. Nova Scotia 9. Prince Edward Island 9. Ontario 9. Nova Scotia
10 Manitoba 10 Quebec 9. Manitoba 10 Manitoba
Source: Hamilton, C. (2006). Healthy provinces, Healthy Canadians: A provincial benchmarking report. Ottawa: Conference Board of Canada.

Indicators of Northern Health: A Resource for Northern Manitobans and the Bayline Regional Round Table 7
the third highest rate of potential years of life lost due to unintentional injury for males, second highest rate for females
the highest proportion of the population waiting more than a month for diagnostic and specialist visits
the highest proportion of the population reporting difficulty obtaining health information or advice any time of day
The report stated “Patients must truly be patient in Manitoba: the proportion of them who had to wait more than a month for diagnostic services and specialist visits was higher than in any other province. Manitoba also had the highest proportion of the population reporting difficulty obtaining health information or advice any time of day”.
Provincial Health Expenditures The report indicated that higher government spending per capita on health care was not indicative of better performance on health indicators (See Table 2.2). Nova Scotia had the lowest government health spending per capita at $2,096 and an overall performance ranking of eighth. Newfoundland/Labrador tied with Nova Scotia at eighth overall for performance and Newfoundland/Labrador was the highest spender at $2,828 per capita. Clearly over $700 difference in per capita spending between Newfoundland/Labrador and Nova Scotia did not generate any difference in ranking on overall health performance between the provinces. Quebec and New Brunswick were the next lowest spenders and were ranked 5th and 6th respectively in overall health performance. Manitoba spent $2,438 which is the fourth highest amount per capita but had an overall health performance rating of 10th or last place among the provinces. These findings certainly suggested that money would not be the entire solution to providing better health care.
Table 2.2 Per Capita Government Health Expenditure by Province
Per Capita Expenditure ($ lowest to highest) Province Overall Ranking
by Province 2,096 Nova Scotia 8 2,109 Quebec 5 2,157 New Brunswick 6 2,242 Saskatchewan 3 2,264 Ontario 4 2,422 Prince Edward Island 7 2,438 Manitoba 10 2,545 British Columbia 1 2,687 Alberta 2 2,823 Newfoundland and Labrador 8 2,321 Canada -
Source: Hamilton, C. (2006). Healthy provinces, Healthy Canadians: A provincial benchmarking report. Ottawa: Conference Board of Canada.


Indicators of Northern Health: A Resource for Northern Manitobans and the Bayline Regional Round Table 9
III Health of Northern Canadians To understand the health of northerners in Canada generally and in Manitoba specifically, it was informative to compare health indicators, with demographic and geographic factors being considered. These comparisons were accomplished by creating peer groupings of health regions across the nation and examining health indicators of those peer groupings. In its 2002 annual report, How Healthy are Canadians?, Statistics Canada grouped Canada’s 139 health regions into 10 peer groups (A through J) on the basis of 24 common socio-demographic characteristics such as population count, household income, education, employment status, and life expectancy (Statistics Canada, 2002a). Health outcomes and risk factors were then compared between and within these peer groups. Since this work in 2002, the Peer Groups have been reorganized and renamed. However since limited research to compare health indicators across peer groups has been published with the new groupings, and little has changed regarding health status in the north, the 2002 groupings were used in this report.
Canadian Health Regions Comprise Peer Groups The variables considered most important in assigning health regions to peer groups were the proportion of Aboriginal and visible minority populations, unemployment rate, population size, percentage of the population aged 65 years or older, and income inequality. For example, in 2002, Peer Group A included large urban centres with populations over 1 million people, such as Toronto, Montreal, and Vancouver. Peer Group A had a high percentage of visible minority population, a low percentage of Aboriginal people, higher than average years of schooling, and high inequality of income distribution. Peer Group B included urban centres with average population sizes over 500,000, a high percentage of visible minority population, low percentage of Aboriginal population and a high average number of years of schooling. For a listing of peer groups and their principle characteristics see Appendix A.
The Burntwood and Churchill Health Regions were considered together for this study and were included in Peer Group C, along with Région du Nunavik, Région des Terres-Cries-de-la-Baie-James, Northern Health Services Branch, and Nunavut. (See Appendix B for a list of the health regions by peer groups.) The characteristics of Peer Group C (Table 3.1) included: mostly northern health regions, high percentage (75.5%) of Aboriginal population, high unemployment rate (17.2%), low density of population (3.9/sq. km.), low percentage of visible minority population (0.9%), and low average number of years of schooling (10.6 years). Six health regions with 0.4% of the population of Canada belonged to Peer Group C.
The Nor-Man Health Region was included in Peer Group F (Table 3.1) which at the time of the study consisted of 13 health regions having 2.2% of the population of Canada. Characteristics of this peer group included: mostly northern health regions, high percentage (17.2%) of Aboriginal population, low density of population (5/sq. km.), low inequality of income distribution (median share = 23.6), and high percentage of inter-municipality migrants (22.8%).
Table 3.1 illustrates the principal characteristics of Peer Group C and Peer Group F for easy comparison. Peer Group C and Peer Group F both contained health regions that were similar in that they both contained mostly northern health regions with high percentages of Aboriginal populations and low density of population.

Indicators of Northern Health: A Resource for Northern Manitobans and the Bayline Regional Round Table 10
Table 3.1 Principal Characteristics of Peer Groups of Northern Manitoba RHAs
Peer Group C (included Burntwood RHA) Peer Group F (included Nor-Man RHA) Mostly northern health regions Mostly northern health regions High percentage of Aboriginal population High percentage of Aboriginal population Low density of population Low density of population High unemployment rate Low inequality of income distribution Low percentage of visible minority population High percentage of inter-municipality migrants Low average number of years of schooling
Peer Group C included health regions with high rates of unemployment, low percentages of visible minority populations, and low average years of schooling Meanwhile, health regions in Peer Group F experienced low inequality of income distribution (less difference between upper and lower income distribution across the population), and high percentages of inter-municipality migrants (residents moved more frequently between municipalities and communities).
Health of Peer Groups Life expectancy is considered to be one of the most important indicators of the health of a population. Average life expectancy in Canada is among the best in the world, a consistent placing for many years. While the average life expectancy in Canada is admirable, life expectancy within Canada varied considerably from region to region, from a low of 65.4 years in the Région du Nunavik, Quebec, to a high of 81.2 in Richmond, British Columbia (Shields & Tremblay, 2002), a difference of almost 16 years. Factors known to contribute to these disparities include socio-demographic differences between communities such as unemployment rates, proportions of people with postsecondary education and proportions of people who were Aboriginal (Gilmore & Wannell, 1999).
The study conducted by Shields and Tremblay (2002) looked at peer groupings to study health outcomes and risk factors both between and within peer groups. It is important to note that health indicators such as life expectancy varied considerably between peer groups. Often the range of estimates for the health regions within a peer group was also sizeable. In the study three categories of factors and a total of nine characteristics were measured both between peer groups and within peer groups. The three categories included:
1. Health outcomes – Measures used were life expectancy, disability free life expectancy, and self-reported health status of fair or poor.
2. Health behaviours – Measures used were daily smoking, obesity, infrequent exercise and heavy drinking.
3. Psychosocial factors – Measures used were high stress and depression.
Estimates of life expectancy and disability-free life expectancy used in this study were based on 1996 Census of Population, Canadian Vital Statistics Database, and population projections from the Demography Division. Other estimates, as well as population counts and sample sizes, were based on the 2000/01 Canadian Community Health Survey (CCHS), a comprehensive survey of more than 130,000 Canadians, aged 12 years and over, in 139 health regions covering all provinces and territories. The CCHS did not include persons living on Indian reserves, Canadian Forces Bases or in some remote areas. Estimates based on CCHS data were age-standardized to

Indicators of Northern Health: A Resource for Northern Manitobans and the Bayline Regional Round Table 11
account for populations with larger numbers of younger or older residents. Table 3.2 compared the peer groups along with the Canadian averages using the 3 categories and 9 characteristics. The ordering of peer groups was based on life expectancy, from highest to lowest.
When reading the tables comparing peer groups it was important to note that the differences between numbers was not indicative of whether the differences between groups was significant. The tables were organized with symbols to indicate when figures were significantly different from the average Canadian figures and whether the differences were significantly higher or lower than the averages. Similarly significance in differences of regions with their overall peer group was indicated. The coding at the bottom of each table provides these details.
As seen in Table 3.2, Peer Group C, which included Burntwood and Churchill Health Regions of northern Manitoba, and Peer Group F, which included Nor-Man Health Region, had the lowest life expectancy of all Peer Groups for the nation. Peer Group C, in last place with a life expectancy of 71.8 years, was almost 5 years lower than second last place Peer Group F at 76.7. Both were significantly lower than the national average life expectancy of 78.3 and the highest ranked Peer Group B at 79.6 years. These results suggested that the farther north people live in Manitoba, the shorter their life expectancy.
Peer Group C (with Burntwood Region) Peer Group C, which included Burntwood and Churchill Health Regions, had the poorest scores on the other two health outcome scores and the four health behaviour scores, all scores were significantly poorer than the calculations for the entire Canadian population. Peer Group C had a disability free life expectancy (number of years of life one can expect to live without activity limitation and outside of a health care institution) of 62.7 years, almost four years shorter than the national average of 68.6 years. Some 15% of those surveyed from Peer Group C considered their health to be poor or fair compared with 12% of the national population. Peer Group C scored poorest of all peer groups on the four health behaviour indicators, with 39% of survey respondents aged 12 years or older reporting smoking daily; 26% of those aged 20 years and older having body weights in the range for obesity; 27% of those aged 12 years or older reporting infrequent exercise (3 or less times per month); and 22% of those aged 18 years and older reporting heavy drinking (consuming 5 or more drinks on one occasion in the past 12 months). Peer Group C scores for the psychosocial factors of high stress (ages 18 years and older) and depression (ages 12 and older) were the best scores, significantly better than the national average.
In grouping health regions together, individual health region scores can be masked. However, when looking within Peer Group C to compare the different health regions in that peer group (See Table 3.3), the Burntwood and Churchill Health Regions had no significant differences from Peer Group C averages on any of the indicators.
Peer Group F (with Nor-Man Region) Peer Group F, which included Nor-Man Health Region, had significantly lower scores than the national averages on the other two health outcomes indicators, three of the four health behaviour indicators, and one of the two psychosocial factors. Peer Group F had a disability free life expectancy of 66.7, almost 2 years less than the national average. Some 13% of those surveyed considered their health to be poor or fair compared with the national calculation of 12%. On the health behaviour indicators 25% aged 12 years smoked daily; 19% of those aged 20 years and older had body weights in the range for obesity; and 21% of those aged 18 years and older

Indicators of Northern Health: A Resource for Northern Manitobans and the Bayline Regional Round Table 12
Table 3.2 Comparison of Peer Groups for Selected Characteristics Health Outcomes Health Behaviours Psycho-social Factors
No. of Health
Regions
Life Expectancy
(years)
Disability Free Life
Expectancy (years)
Fair or Poor Health
(age 12+) %
Daily Smoking (age 12+)
%
Obese (age 20+)
%
Infrequent Exercise
%
Heavy Drinking (age 18+)
%
High Stress
(age 18+) %
Depression (age 12+)
% Canada 139 78.3 68.6 12 22 15 22 16 26 7
Peer B 8 79.6 √ 69.5 √ 11 √ 18 √ 14 √ 19 √ 15 √ 27 8
Peer A 5 78.8 √ 69.6 √ 12 18 √ 11 √ 27 12 √ 26 6 √
Peer J 8 78.8 √ 68.8 √ 11 √ 22 16 17 √ 18 24 8
Peer I 34 78.3 67.6 12 23 17 19 √ 18 26 8
Peer G 21 77.9 67.5 12 23 20 20 √ 20 24 √ 8
Peer E 13 77.8 67.0 14 26 22 22 19 22 √ 7
Peer H 22 77.7 68.8 √ 12 25 15 24 17 29 7
Peer D 9 77.0 66.5 15 26 21 28 20 19 √ 6 √
Peer F* 13 76.7 66.7 13 25 19 18 √ 21 22 √ 8
Peer C* 6 71.8 62.7 15 39 26 27 22 19 √ 5 √ * Peer Group C includes Burntwood and Churchill Health Regions and Peer Group F includes Nor-Man Health Region. √ indicates that peer group estimate is significantly better than Canadian estimate.
indicates that peer group estimate is significantly worse than Canadian estimate. Estimates of life expectancy and disability-free life expectancy are based on 1996 Census of Population, Canadian Vital Statistics Database, and population projections from Demography Division. Other estimates, as well as population counts and sample sizes, are based on 2000/01 Canadian Community Health Survey (CCHS).
Source: Shields, M., & Tremblay, S. (2002). The health of Canada’s Communities. Health Reports Supplement, 13, 9-33. Statistics Canada Catalogue 82-003.

Indicators of Northern Health: A Resource for Northern Manitobans and the Bayline Regional Round Table 13
Table 3.3 Comparison of Peer Group C Health Regions for Selected Characteristics Health Outcomes Health Behaviours Psycho-social Factors
Life Expectancy
(years)
Disability Free Life
Expectancy (years)
Fair or Poor Health
(age 12+) %
Daily Smoking (age 12+)
%
Obese (age 20+)
%
Infrequent Exercise
%
Heavy Drinking (age 18+)
%
High Stress
(age 18+) %
Depression (age 12+)
% P C P C P C P C P C P C P C P C P C Canada 78.3 68.6 12 22 15 22 16 26 7 Peer Group C 71.8 62.7 15 39 26 27 22 19 √ 5 √ QC Région des
Terres-Cries-de-la-Baie-James
73.9 65.9 √ … … … … … … …
SK Northern Health Services Branch
73.3 62.5 15 33 22 22 24 22 …
MN Burntwood and Churchill
72.9 62.4 15 35 26 27 24 19 √ 6
NU Nunavut 69.8 62.9 16 48 28 30 18 16 √ 4 √ QC Région du
Nunavik 65.4 61.0 … … … … … … …
Estimates for peer group C based on CCHS data exclude Région des Terres-Cries-de-la-Baie-James and Région du Nunavik since CCHS data were not collected in these health regions. The questions on depression were not asked in the Northern Health Services Branch in Saskatchewan. In column P, √ indicates that health region estimate is significantly better than per group estimate; in column C, √ indicates that health region or peer group estimate is significantly better than Canadian estimate. In column P, indicates that health region estimate is significantly worse than peer group estimate, in column C, indicates that health region or peer group estimate is significantly worse than Canadian estimate. Source: Shields, M., & Tremblay, S. (2002). The health of Canada’s Communities. Health Reports Supplement, 13, 9-33. Statistics Canada Catalogue 82-003.

Indicators of Northern Health: A Resource for Northern Manitobans and the Bayline Regional Round Table 14
Table 3.4 Comparison of Peer Group F Health Regions for Selected Characteristics Health Outcomes Health Behaviours Psycho-social Factors
Life Expectancy
(years)
Disability Free Life
Expectancy (years)
Fair or Poor Health
(age 12+) %
Daily Smoking (age 12+)
%
Obese (age 20+)
%
Infrequent Exercise
%
Heavy Drinking (age 18+)
%
High Stress
(age 18+) %
Depression (age 12+)
% P C P C P C P C P C P C P C P C P C Canada 78.3 68.6 12 22 15 22 √ 16 26 7 Peer Group F 76.7 66.7 13 25 19 18 21 22 √ 8
AB North West RHA
80.0 √ 67.7 18 21 34 25 14 √ 23 7
BC North West 77.9 √ 67.1 11 22 20 13 √ √ 19 16 √ 7 AB Mistahia RHA 77.5 66.6 12 26 18 20 18 29 10 BC Peace Liard 77.5 67.4 12 22 18 17 23 22 7 QC Northern Quebec 76.9 68.7 √ 11 28 17 19 18 21 √ 4 √ √ BC Northern Interior 76.8 66.8 14 25 15 16 √ 20 22 10 NT North West
Territories 76.8 67.0 17 35 27 32 29 24 9
BC Cariboo 76.7 66.5 15 21 16 13 √ 21 24 11 AB Northern Lights
RHA 75.8 66.3 13 28 19 23 23 23 6
YT Yukon Territory 75.7 66.9 11 26 17 16 √ 23 19 √ 9 NF Health Labrador
Corp. 74.9 66.3 13 32 24 23 26 13 √ √ 5
AB Keeweetinok Lakes RHA
74.8 64.4 19 32 22 24 18 24 8
MN Nor-Man 74.6 65.1 16 21 27 12 √ √ 30 15 √ √ 8
In column P, √ indicates that health region estimate is significantly better than per group estimate; in column C, √ indicates that health region or peer group estimate is significantly better than Canadian estimate. In column P, indicates that health region estimate is significantly worse than peer group estimate, in column C, indicates that health region or peer group estimate is significantly worse than Canadian estimate.
Source: Shields, M., & Tremblay, S. (2002). The health of Canada’s Communities. Health Reports Supplement, 13, 9-33. Statistics Canada Catalogue 82-003.
Indicators of Northern Health: A Resource for Northern Manitobans and the Bayline Regional Round Table 15
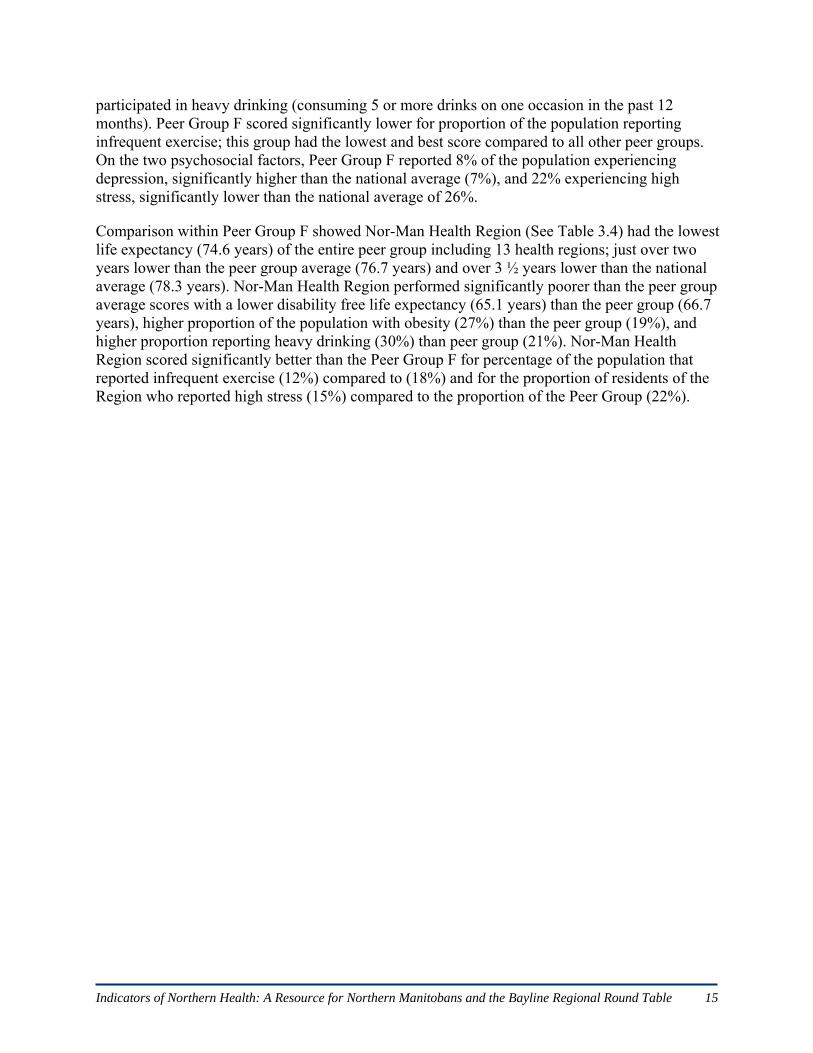
participated in heavy drinking (consuming 5 or more drinks on one occasion in the past 12 months). Peer Group F scored significantly lower for proportion of the population reporting infrequent exercise; this group had the lowest and best score compared to all other peer groups. On the two psychosocial factors, Peer Group F reported 8% of the population experiencing depression, significantly higher than the national average (7%), and 22% experiencing high stress, significantly lower than the national average of 26%.
Comparison within Peer Group F showed Nor-Man Health Region (See Table 3.4) had the lowest life expectancy (74.6 years) of the entire peer group including 13 health regions; just over two years lower than the peer group average (76.7 years) and over 3 ½ years lower than the national average (78.3 years). Nor-Man Health Region performed significantly poorer than the peer group average scores with a lower disability free life expectancy (65.1 years) than the peer group (66.7 years), higher proportion of the population with obesity (27%) than the peer group (19%), and higher proportion reporting heavy drinking (30%) than peer group (21%). Nor-Man Health Region scored significantly better than the Peer Group F for percentage of the population that reported infrequent exercise (12%) compared to (18%) and for the proportion of residents of the Region who reported high stress (15%) compared to the proportion of the Peer Group (22%).


Indicators of Northern Health: A Resource for Northern Manitobans and the Bayline Regional Round Table 17
IV Manitoba First Nations Health According to Statistics Canada 2001 Aboriginal Identify Population tables (2002b), the total population of all persons living in Manitoba (minus those in institutions) was 1,103,695. Of those, about 150,040 or 13% of Manitobans had identified themselves as being of Aboriginal decent. Within the total number of people who identified themselves as Aboriginal, 90,340 individuals indicated the single identity of North American Indian; 56,795 indicated the single identity of Métis, and 345 indicated the single identity of Inuit. Some 500 individuals indicated multiple Aboriginal responses and 2,060 indicated Aboriginal identity and did not fit specifically in any of the above categories. In 2001, the Burntwood RHA had a total population of about 42,995 people, with 31,235 Aboriginal people about 73% of that population (See Table 6.10 in Section VI). At the same point in time, the Nor-Man RHA had a total population of about 22,385 with 9,430 or about 42% indicating Aboriginal identity (See Table 7.10 in Section VII). Aboriginal Identity Populations are discussed in more detail related to the demographics of the Burntwood Health Region in Section VI and the Nor-Man Health Region in Section VII. Discussion of Registered First Nations Peoples (RFN) is the focus of this Section.
Two documents were explored to provide information on the health of First Nations people in Manitoba. Firstly, a report from the Manitoba Centre for Health Policy (MCHP) The Health and Health Care Use of Registered First Nations People Living in Manitoba: A Population-Based Study (Martens et al, 2002) offered much insight into the health and health care of RFN in the Province. Secondly, First Nations Health and Wellness in Manitoba, a report prepared for the Inter-governmental Committee on First Nations Health (ICFNH), provided a health profile of First Nations people in Manitoba, and discussed social determinants of health, jurisdictional factors, demographics and selected health care issues (Allec, 2005).
Registered First Nations Health and Health Care Indicators In The Health and Health Care Use of Registered First Nations People Living in Manitoba: A Population-Based Study, Martens and colleagues (2002) provided information on overall health status, rates of illness, preventive care measures, and use of health services by Registered First Nation People (RFN) of Manitoba who were living in Manitoba. The MCHP report used three types of geographical comparisons: 1) comparison by Tribal Council (and Independent groupings) for RFN living ‘on reserve’; 2) comparison by RHA, between RFN and all other Manitobans living within an RHA; and 3) comparison by RHA, between RFN living ‘on reserve’ or ‘off reserve’ within the RHA. The study focused on people in relation to their place of residence not by place where treatment was received. Data sources for information from the MCHP report included administrative data from Manitoba Health, Vital Statistics data (1995-1999), Census data from Statistics Canada (1996), and publicly-available reports from Indian and Northern Affairs Canada. Populations of RFN by health region in Manitoba were categorized by residency ‘on reserve’ and ‘off reserve’ (See Table 4.1). In the MCHP Report ‘on reserve’ included those individuals who had a band membership with a Manitoba FN community and a postal code within or near that community. Otherwise RFN individuals were considered to be living ‘off reserve’. Only those with Manitoba First Nations band membership were included in the RFN figures. Appendix B of the MCHP report provided comparisons of population counts in 1998 from a variety of sources.

Indicators of Northern Health: A Resource for Northern Manitobans and the Bayline Regional Round Table 18
Table 4.1 Manitoba RFN Population by RHA for On Reserve and Off Reserve RFNs, 1998
RHA On Reserve Off Reserve Total RFN Other (not RFN) Total South Eastman 21 286 307 52,386 52,693 Central 3,900 2,019 5,919 91,149 97,068 Brandon 2,143 2,143 44,547 46,690 South Westman 261 217 478 34,079 34,557 Winnipeg 21,204 21,204 622,585 643,789 Interlake 5,387 2,456 7,843 66,629 74,472 Marquette 2,623 367 2,990 34,737 37,727 North Eastman 5,343 1,026 6,369 32,394 38,763 Parkland 3,236 1,603 4,839 38,518 43,357 Burntwood 21,737 4,736 26,473 18,418 44,891 Nor-Man 5,528 1,611 7,139 18,198 25,337 Churchill 255 255 782 1,037 MB Total 48,036 37,923 85,959 1,054,422 1,140,381 Source: Martens, P., et al. (2002). The health and health care use of Registered First Nations People living in Manitoba: A population-based study. Winnipeg, MB: Manitoba Centre for Health Policy.
In 1998, Burntwood Health Region had the largest RFN population of all the health regions, with 26,473 or 59% of the total population of the Region having treaty status. Of the RFN people living in the Burntwood Region 21,737 or 82% lived on reserve and 4,736 or 18% lived off reserve. Some 28% of the population of the Nor-Man Region was comprised of individuals with treaty status and 77% of those lived on reserve.
Some highlights of the study including health status of RFN, and measures of illness and injury of RFN, as well as preventive care measures and health care utilization related to RFN are discussed below.
Health Status Three indicators of health status were used 1) life expectancy measures the expected length of life from birth (frequently used for worldwide comparisons); 2) premature mortality rate (PMR) measures the number of deaths before the age of 75 years for every 1000 people aged 0 to 74 years who live in the region (considered to be the best single measure of a population’s health status); and 3) potential years of life lost (PYLL) measures premature mortality or death before the age of 75 years and gives greater weight to deaths occurring at younger ages than deaths at later ages (See Table 4.2.).
Life expectancy of RFN was about 8 years less than that of all other Manitobans with male RFN life expectancy at 68.4 years compared to 76.1 years for all other Manitobans, and female RFN at 73.2 years compared to 81.4 years.
The RFN population of Manitoba had double the premature mortality rate (PMR) with 6.6 deaths/1000 people, compared to all other Manitobans (3.3 deaths/1000 people), indicating that the RFN population had a much poorer health status. Within each RHA, Registered First Nations people had substantially higher PMRs compared to all other people living in the region.
For RFN people, the potential years of life lost (PYLL) was much higher (2.5 times higher for males, 3 times higher for females) than for all other Manitobans. The PYLL for RFN males was

Indicators of Northern Health: A Resource for Northern Manitobans and the Bayline Regional Round Table 19
158 years/1000 males aged 1-74 years, compared to 63 years/1000 males. PYLL for RFN females was 103 years/1000 females aged 1-74 years compared to 36 years/1000 females. These figures indicated higher mortality rates for RFN and greater numbers of potential years of life lost.
Table 4.2 Health Status of Registered First Nations People and Other Manitobans
Life Expectancy Premature Mortality Rate Potential Years of Life Lost RFN Other MB RFN Other MB RFN Other MB
Male 68.4 years
Male 76.1 years
6.6 years /1000
3.3 years /1000
Male 158 years
/1000
Male 63 years /1000
Female 73.2 years
Female 81.4 years
Female 103 years
/1000
Female 36 years /1000
Source: Martens, P., et al. (2002). The health and health care use of Registered First Nations People living in Manitoba: A population-based study. Winnipeg, MB: Manitoba Centre for Health Policy.
Premature Mortality Rate - years per 1,000 population Age 0-74 Years 1995 – 1999 Potential Years of Life Lost - years per 1,000 population Age1-74 Years 1995 - 1999
While comparisons across health regions in general were covered in the next section of this report, it is apparent that for all health regions in Manitoba, the health status of the RFN population was always poorer than that of the other Manitobans in each region. However of note were the findings in this study that in health regions in the south with the best overall health status, RFN populations had poorer health status (for all three indicators above) than they did in northern health regions. Findings suggested that for RFN populations, who live in northern regions and practice more traditional lifestyles, better health status than RFN populations in the south may be a result.
Measures of Illness and Injury In discussions of illness and injury, three indicators were used 1) diabetes treatment prevalence or the number of persons diagnosed with diabetes and receiving treatment for it (at least two physician visits or one hospitalization) from 1996/97 to 1998/99, per thousand residents of the region; 2) hypertension prevalence or the number of persons aged 25 years or older diagnosed with hypertension (at least one physician visit) from 1996/97 to 1998/99, per thousand residents of the region; and 3) injury hospitalization rates of the number of hospitalizations (one day or longer) that resulted from injury, per thousand area residents (1994/95 to 1998/99). Rates for these three indicators were sex and age adjusted so comparisons across regions were not influenced by the differences in the sex and ages of the residents of different regions.
The diabetes treatment prevalence among RFN in Manitoba was over four times higher than for all other Manitobans. The RFN population had 189 cases/1000 residents compared to 45 cases/1000 residents for all other Manitobans. A rate or the number of cases per 1000 persons can be converted to percent of the population by calculating the number of cases per 100 persons (dividing numerator and denominator by 10) and converting to percent. Therefore 189 cases/1000 persons calculated to 18.9 cases/100 persons or 18.9% of the RFN population of Manitoba had diabetes, compared to 4.5% of other Manitobans.

Indicators of Northern Health: A Resource for Northern Manitobans and the Bayline Regional Round Table 20
Hypertension prevalence for RFN in Manitobans was 221 cases/1000 residents or 22.1% compared to other Manitobans with 202 cases/1000 residents or 20.2%.
Injury hospitalization rates were 3.7 times higher for RFN in Manitoba, than for all other Manitobans. The injury hospitalization rate for RFN was 30.4/1000 compared to all other Manitobans at 8.3/1000. A higher rate for RFN was consistent for every health region in Manitoba. Main causes for injury hospitalization for the RFN population, 31.6% of cases, were classified as ‘violence’, with 17.1% of due to ‘violence by others’ and 14.5% due to ‘violence to self’. The other Manitoba population had 10.4% of cases classified as ‘violence’, with 4.1% due to ‘violence by others’ and ‘6.3% due to ‘violence to self’. Falls were the cause of 21.8% of RFN injury hospitalizations and 48% of other Manitoba injury hospitalizations (See Table 4.3).
Table 4.3 Illness and Injury Rates for Registered First Nations People& Other Manitobans Diabetes Treatment
Prevalence Hypertension Prevalence Injury Hospitalization
RFN Other MB RFN Other MB RFN Other MB 18.9% 4.5% 22.1% 20.2% 3.0% 0.8%
Violence 31.6% - by others 17.1% - to self 14.4%
Violence 10.4% - by others 4.1% - to self 6.3%
Falls 21.8%
Falls 48.0%
Source: Martens, P., et al. (2002). The health and health care use of Registered First Nations People living in Manitoba: A population-based study. Winnipeg, MB: Manitoba Centre for Health Policy.
Preventive Care Measures Three indicators of preventative care were considered 1) childhood immunization rates for one-year old children (1994-1997) and two-year old children (1994-1996) with up-to-date completion of recommended immunization; 2) screening mammography (women ages 50-69 years with at least 1 mammogram in 1997/98-1998/99; and 3) breastfeeding initiation rates which identify the number of live born babies who were exclusively or partially breastfed at hospital discharge.
Childhood immunization rates for one-year old children were 62% for RFN compared to Other Manitobans at 89%. For two-year old children 45% of the RFN population was immunized compared to 77% for other Manitobans. Overall, immunization rates for RFN children were about 2/3 of those for other Manitoban children.
The mammography rate for RFN women aged 50-69 years was 26%, less than half the rate compared to other Manitoban women at 56%. Mammography rates for all Manitoban women fell short of the goals of the screening program. Mammography is a procedure used to screen for breast cancer. Screening every two years for women aged 50-69 years is recommended.
The breastfeeding initiation rate for RFN newborns was 57.1% compared to 80.5% for other Manitoban newborns. In both groups breastfeeding rates decreased as the health status of the population decreased (Table 4.4).

Indicators of Northern Health: A Resource for Northern Manitobans and the Bayline Regional Round Table 21
Table 4.4 Preventive Care Measures by Registered First Nations People & Other MB Childhood
Immunization Mammography Breastfeeding
RFN Other MB RFN Other MB RFN Other MB One-year olds
62% One-year olds
89% Two-year olds
45% Two-year olds
77%
26% 56% 57.1% 80.5%
Source: Martens, P., et al. (2002). The health and health care use of Registered First Nations People living in Manitoba: A population-based study. Winnipeg, MB: Manitoba Centre for Health Policy.
Health Care Utilization Health care utilization included the use of physician services and hospital services. Physician ambulatory visits included all physician contacts except those by hospital in-patients.
Physician services consisted of general practitioner and family practitioner visit rates, consult rates, specialist contact rates, types of providers and locations of visits. In 1998/99, 78.2% of the RFN population of Manitoba and 83.1% of other Manitobans made at least one visit to a physician. RFN had 6.1 visits per person that year compared to all other Manitobans at 4.9 visits per person. This finding was considered in keeping with the poorer health status of the RFN population. Consult rates were only slightly higher for RFN at .29 visits/person/year compared to other Manitobans at .27 visits/person/year. Specialist contact seemed to be driven by location of residence, with those living in Winnipeg having the greatest contact with specialists. Overall 16.1% of the RFN population had a visit with a specialist in 1998/99 compared to 26.3% of other Manitobans. Family practitioners and general practitioners provided for 83.9% of physician contacts for the RFN and 73.7% for other Manitobans. Given the poorer health status of RFN populations, the converse could be expected. Of the family practitioner and general practitioner visits for RFN people, 83.6% occurred in the health region of residence. For other Manitoban’s 90.9% occurred in the region of residence. (See Table 4.5).
Table 4.5 Use of Physician and Hospital Services by RFN People & Other Manitobans
Physician Services Hospital Services RFN Other MB RFN Other MB
Made at least 1 Physician Visit Admitted at least 1 to Hospital 78.2% 83.1% 15.5% 11.4% Visit Rate Hospitalization Rate 6.1 visits/person/year 4.9 visits/person/year 348/1000 156/1000 Consult Rate Total Days of Hospital Care .29 visits/person/year .27 1.75 days/person 1.05 days/person Type of Visit Provider Location of Hospitalizations Specialists 16.1% FP/GP 83.9%
Specialists 26.3% FP/GP 73.7%
Location of GP/FP Visits Within RHA 83.6% Within RHA 90.9%
Within RHA 66% Within RHA 80%
Source: Martens, P., et al. (2002). The health and health care use of Registered First Nations People living in Manitoba: A population-based study. Winnipeg, MB: Manitoba Centre for Health Policy.

Indicators of Northern Health: A Resource for Northern Manitobans and the Bayline Regional Round Table 22
Hospital services included hospitalization rates or separations, total days of hospital care and location of hospitalization. Over 15% of RFN people were admitted to hospital at least once in 1998/99 compared to just over 11% of other Manitobans. The rate of hospitalization or hospital separation (includes discharges, transfers, sign-outs against physician advice and deaths) was 384 separations per 1000 people in the RFN population compared to 156 per 1000 people in the population of other Manitobans. Total days of hospital care for RFN was 1.75 days/person compared to 1.05 days/person for other Manitobans. Some 66% of hospitalizations by RFN occurred within the health region of residence compared to 80% of hospitalizations for other Manitobans.
Jurisdictional Factors in First Nations Health Care Delivery First Nations Health and Wellness in Manitoba, a report prepared for the Inter-governmental Committee on First Nations Health (ICFNH), provided a health profile of First Nations in Manitoba and discussed social determinants of health, jurisdictional factors, demographics and selected health care issues (Allec, 2005). Much of the health profile included in this report used the data from the MCHP report discussed previously. Of particular interest was the discussion on jurisdictional ambiguity and the lack of clarity on the respective roles and responsibilities of the federal and provincial governments concerning health and health services of First Nations people. Jurisdictional issues have an impact on accessibility and comprehensiveness of health care delivery in all Canadian provinces and territories. Residents of northern communities and the health care providers that serve them have identified jurisdictional issues as primary barriers to the access of health services in northern Manitoba (Moss et al, forthcoming). Understanding of the complexities of jurisdictional ambiguity is central to problem solving and resolution. To that end, a framework for current health service delivery in Manitoba, areas of consensus and areas of ambiguity were discussed.
Framework of Health Service Delivery in Manitoba First Nation communities are located on a federal land base but within provincial health authorities (Allec, 2005). A framework to understand the First Nation health delivery system in Manitoba was developed by Dr. Catherine Cook (See Figure 4.1). First Nation communities received funding from the federal government through Health Canada and First Nations and Inuit Health Branch (FNIHB) for community-based programs such as Brighter Futures and Building Healthy Communities, as well as drug and alcohol prevention. FNIH also provided for non-insured health services to FN peoples. Regional health authorities received funding from the provincial government for the delivery of insured health services, including physician and hospital based services. Funding from the federal government flowed to the provincial government and provided for the delivery of insured health services to First Nation people and communities. In Manitoba some insured services were delivered in some reserve communities. Most often First Nations people had to leave their communities to access services provided by regional health authorities.

Indicators of Northern Health: A Resource for Northern Manitobans and the Bayline Regional Round Table 23
Figure 4.1: Framework for Current First Nation Health Service Delivery in Manitoba
Created by Catherine L. Cook, MD 2003 Source: Allec, R. (2005). First Nations Health and Wellness in Manitoba: Overview of Gaps in Service and Issues Associated with Jurisdictions Final Report. Report prepared for the Inter-governmental Committee on First Nations Health. Winnipeg: Government of Manitoba.
Areas of Agreement According to the report prepared for the ICFNH (Allec, 2005), despite jurisdictional disputes and ambiguity on many fronts, some areas of consensus seemed to exist. Table 4.6 was used to identify departments responsible for a variety of services. While agreement may have existed regarding who delivered the service, agreement did not necessarily follow as to 1) funding responsibility or who paid for the service, 2) whose service standards applied (federal, provincial or FN), or 3) whose rules of entitlement applied.
Federal Government
Provincial Government
Health Canada First Nations & Inuit Health Branch
Regional Health Authorities
First Nations

Indicators of Northern Health: A Resource for Northern Manitobans and the Bayline Regional Round Table 24
Table 4.6 Responsible Department for Select First Nations Health Services
On-Reserve Off-Reserve Professional Services Physician Manitoba Health Manitoba Health Audiology FNIHB Manitoba Health (if
hospital based) Oral Surgery Manitoba Health Manitoba Health Regular Dental Treatment FNIHB FNIHB Acute Care Hospital Services Manitoba Health Manitoba Health Promotion of Health and Prevention of Illness FNIHB Manitoba Health Protection of Health Immunization FNIHB Manitoba Health Communicable Disease FNIHB Manitoba Health Home and Community Care Care Coordination / Assessment FNIHB Manitoba Health Nursing FNIHB Manitoba Health Home Care FNIHB Manitoba Health Aids to Persons with Physical Disabilities Hearing Aids FNIHB /
Manitoba Health FNIHB / Manitoba Health
Visual Aids FNIHB FNIHB / Manitoba Health
Source: Allec, R. (2005). First Nations Health and Wellness in Manitoba: Overview of Gaps in Service and Issues Associated with Jurisdictions Final Report. Report prepared for the Inter-governmental Committee on First Nations Health. Winnipeg: Government of Manitoba.
The information was based on interviews and a review of information provided by Manitoba Health, FNIHB, INAC, AMC, the Romanow Report and a presentation by Josee G. Lavoie at the Primary Health Care conference on First Nations Health and Wellness, Winnipeg, March, 2005.
Areas of Ambiguity Table 4.7 was used to illustrate jurisdictional areas of ambiguity. According to Allec (2005):
Jurisdictional ambiguity has allowed both levels of government to minimize respective responsibility for First Nations entitlement to health services. The Indian Act does not define the responsibility for the provision of health services for First Nations. Provincial governments have not explicitly asserted jurisdiction in relation to health, and, since jurisdiction carries with it financial responsibility, provinces have not contested the federal government’s responsibility to provide health care to First Nations. As a result, neither government acknowledges a mandate to provide coordinated health care to First Nations on and off reserve. The federal government maintains it provides health services to First Nations as a matter of policy and practice, and not as a result of constitutional or treaty obligations. (pg. 17)

Indicators of Northern Health: A Resource for Northern Manitobans and the Bayline Regional Round Table 25
Table 4.7 Services with Jurisdictional Ambiguity – Who pays? Which standards apply? What are the rules of entitlement?
On-Reserve Off-Reserve Professional Services Podiatry / Chiropody Ambiguity Manitoba Health Chiropractic Ambiguity Manitoba Health Optometric FNIHB/
Manitoba Health Ambiguity
Home / Community Based Services Respite Care Ambiguity Manitoba Health Palliative Care Ambiguity Manitoba Health Community Rehabilitation Physiotherapy Ambiguity Manitoba Health Speech & Language Ambiguity Manitoba Health Audiology Ambiguity Manitoba Health Aids to Persons with Physical Disabilities Communication Aids Ambiguity Ambiguity Orthodontic / Prosthetic Devices Ambiguity Ambiguity Respiratory Equipment & Supplies Ambiguity Ambiguity Wheelchair, Mobility Aids & Seating Ambiguity Ambiguity Medical Supplies & Equipment FNIHB Manitoba Health Public Health Public Health Inspector and Monitoring Ambiguity Manitoba Health Food and Drug Safety Ambiguity Manitoba Health /
Health Canada Residential Long Term Personal Care Homes (higher levels of care) Ambiguity Manitoba Health Personal Care Homes (lower levels of care) INAC Manitoba Health Residential Care Facilities Ambiguity Ambiguity Independent Living Units with Support Services Ambiguity Ambiguity Chronic Care Hospitals Ambiguity Ambiguity Mental Health Services Crisis Counseling FNIHB Ambiguity Prevention Ambiguity Manitoba Health Transportation Medical Transportation Ambiguity Ambiguity Ambulance Services Ground Ambulance Ambiguity Manitoba Health Air Ambulance Ambiguity Manitoba Health Source: Allec, R. (2005). First Nations Health and Wellness in Manitoba: Overview of Gaps in Service and Issues Associated with Jurisdictions Final Report. Report prepared for the Inter-governmental Committee on First Nations Health. Winnipeg: Government of Manitoba.
The information was based on interviews and a review of information provided by Manitoba Health, FNIHB, INAC, AMC, the Romanow Report and a presentation by Josee G. Lavoie at the Primary Health Care conference on First Nations Health and Wellness, Winnipeg, March, 2005.

Indicators of Northern Health: A Resource for Northern Manitobans and the Bayline Regional Round Table 26

Indicators of Northern Health: A Resource for Northern Manitobans and the Bayline Regional Round Table 27
V Health in Northern Manitoba Examining different populations helped to pinpoint similarities and differences in health status and health care utilization between populations. To look at the health of Manitobans, researchers at the Manitoba Centre for Health Policy developed reports that shared information about residents of each of the regional health authorities (RHAs) of Manitoba. In addition some comparisons were made by placing the province’s various RHAs into two groups: Northern and Southern RHAs. Both approaches helped create pictures of the health status of Manitobans, and the ways that Manitoba residents used health care services.
Two documents were used to provide information on the health and health care use of residents of northern Manitoba. The first source was the MCHP report Sex Differences in Health Status, Health Care Use, and Quality of Care: A Population-Based Analysis for Manitoba’s Regional Health Authorities (Fransoo et al, 2005). Comparisons included indicators or measures of health status, illness, preventative care, and health care utilization across regions. The second source by the MCHP entitled Patterns of Regional Mental Illness Disorder, Diagnoses, and Services Use in Manitoba: A Population-Based Study (Martens et al, 2004) provided information specifically on mental illness. Comparisons included treatment prevalences and physician visits.
Tables included all RHAs in Manitoba and groupings for Rural South, North, Winnipeg and Manitoba as a whole. ‘South’ referred to the group of all southern and mid-province RHAs including South Eastman, Central, Assiniboine, Parkland, Interlake, and North Eastman. ‘North’ referred to a grouping of Manitoba’s three northern RHAs: Churchill, Nor-Man, and Burntwood.
When reading the tables comparing health regions it was important to note that the differences between numbers was not indicative of whether the differences between groups was significant. The tables were organized with symbols to indicate when figures were significantly different from the average Manitoba figures and whether the differences between male and female figures were significant for that area. The coding details at the bottom of each table provides these details.
Health Status The health status of the North was measured using the indicators of life expectancy, premature mortality rate, and potential years of life lost. Overall, health status in the North was significantly poorer than in the south and in Winnipeg. Life expectancy for males and females in Northern Manitoba was lower than the Manitoba average for the years 1999-2003: 4 years less for Northern males, 3.8 years less for Northern females (Table 5.1). In comparison to individuals in the Rural South, the differences were even more striking. Life expectancy for Northern males was 4.6 years less than those of the Rural South, while for Northern females was 4.4 years less.
Premature mortality rates were higher and potential years of life lost were greater for those living in the North compared to those living in Manitoba overall. In the years 1999-2003, 6.2 deaths per 1000 population aged 0-74 years occurred among males living in the North and 4.1 deaths per 1000 occurred among females, compared to 4.4 deaths per 1000 population among males, and 2.6 for females. For potential years of life lost, the differences again were striking. For males living in northern Manitoba, potential years of life lost were 113.4 years per 1000

Indicators of Northern Health: A Resource for Northern Manitobans and the Bayline Regional Round Table 28
Table 5.1 Health Status and Mortality by Health Region
RHAs Life Expectancy# Premature Mortality Rate* Potential Years of Life Lost+
Male Female Male Female Male Female South Eastman 78.4 82.2 m,f,d 3.3 2.1 d 56.6 32.6 Central 77.0 81.9 m,f,d 3.8 2.2 d 64.8 34.6 Assiniboine 76.2 82.6 f,d 4.3 2.3 d 73.9 31.2 Brandon 75.8 82.6 f,d 4.3 2.3 d 58.4 31.2 Parkland 76.1 80.9 d 4.3 2.8 d 76.6 42.6 Interlake 76.1 82.1 d 4.3 2.6 d 72.2 38.4 North Eastman 75.1 80.6 d 4.2 2.8 d 85.8 56.5 Churchill 74.4 75.8 5.3 3.3 m,d 122.3 38.5 Nor-Man 72.8 77.8 m,f,d 5.7 4.1 f 89.4 65.3 Burntwood 71.5 77.3 m,f,d 6.4 4.1 m,f,d 129.3 80.9 Rural South 76.5 81.9 m,f,d 4.0 2.4 d 69.8 37.0 North 71.9 77.5 m,f,d 6.2 4.1 m,f,d 113.4 75.0 Winnipeg 75.9 81.3 d 4.4 2.6 d 60.7 38.2 Manitoba 75.9 81.3 d 4.4 2.6 d 68.1 40.6 Source: Fransoo, R. et al. (2005). Sex differences in health status, health care use, and quality of care: A population-based analysis for Manitoba’s regional health authorities. Winnipeg: Manitoba Centre for Health Policy.
# 5 Year Life Expectancy, 1999-2003 *Premature Mortality Rate - Years per 1,000 population, Age 0-74 Years, 1999 – 2003 +Potential Years of Life Lost - Years per 1,000 population, Age1-74 Years, 1999 - 2003 'm' indicates area's rate for males was statistically different from Manitoba average for males 'f' indicates area's rate for females was statistically different from Manitoba average for females 'd' indicates difference between male and female rates was statistically significant for that area 's' indicates data suppressed due to small numbers

Indicators of Northern Health: A Resource for Northern Manitobans and the Bayline Regional Round Table 29
population compared to a provincial rate of 68.1 years per 1000 population and a Winnipeg rate of 60.7 years per 1000 population. Potential years of life lost for females living in northern Manitoba was 75.0 per 1000 population, compared to 40.6 years for Manitoba residents and 38.2 years for Winnipeg residents. Burntwood Region had the lowest life expectancy, the highest premature mortality rate and the highest potential years of life lost. These figures illustrated the disparity of health status between those living in the North (Burntwood Region in particular) and those living in the Rural South and Winnipeg.
Measures of Illness Given the differences in health status between the North and the Provincial average, the North also compared poorly against Manitoba in measures of illness. Table 5.2 illustrated the treatment prevalence of two relatively common diseases, diabetes and hypertension. Treatment prevalence was the measure of the number of people who received treatment for a particular illness in a given period of time, in this case for the years 2001/02 – 2003/04. The treatment prevalence of these diseases was seen to be significantly higher in Northern Manitoba than in Manitoba overall. Some 11% of men received treatment for diabetes in the North in this time period, compared to 7% in men in Manitoba. In women, the treatment prevalence for diabetes was 14%, compared to the provincial prevalence of 6%. Hypertension was also higher in the North, with 25.2% of men and 30.5% of women aged 20 years and over receiving treatment for the disease in this period.
Table 5.2 Diabetes and Hypertension Treatment Prevalence by Health Region
RHAs Diabetes Treatment Prevalence* Hypertension Treatment Prevalence+ Male Female Male Female
South Eastman m,f,d 5.7% 4.4% d 22.7% 25.4% Central m,f,d 5.8% 4.6% m,f,d 21.8% 24.3% Assiniboine f,d 6.7% 5.3% m,d 22.5% 26.8% Brandon f,d 7.4% 5.3% 24.2% 25.6% Parkland m,f,d 7.8% 7.0% m,d 22.0% 25.9% Interlake d 7.2% 6.2% f,d 25.2% 27.7% North Eastman 6.8% 6.2% d 24.3% 26.4% Churchill f 10.0% 14.8% m 35.6% 33.8% Nor-Man m,f,d 9.2% 10.9% m,d 21.0% 25.4% Burntwood m,f,d 12.2% 16.7% m,f,d 28.2% 34.3% Rural South f,d 6.5% 5.4% m,d 23.0% 26.0% North m,f,d 10.9% 14.2% f,d 25.2% 30.5% Winnipeg f,d 6.6% 5.6% 24.3% 25.4% Manitoba d 6.8% 6.3% d 24.0% 25.9%
Source: Fransoo, R. et al. (2005). Sex differences in health status, health care use, and quality of care: A population-based analysis for Manitoba’s regional health authorities. Winnipeg: Manitoba Centre for Health Policy.
*Diabetes Prevalence 2001/02-2003/04 per cent age 20-79 +Hypertension Prevalence 2001/02-2003/04 per cent age 25+ 'm' indicates area's rate for males was statistically different from Manitoba average for males 'f' indicates area's rate for females was statistically different from Manitoba average for females 'd' indicates difference between male and female rates was statistically significant for that area 's' indicates data suppressed due to small numbers

Indicators of Northern Health: A Resource for Northern Manitobans and the Bayline Regional Round Table 30
Preventive Care Measures Preventative care measures referred to childhood immunizations. Researchers at the Manitoba Centre for Health Policy found a relationship between area average incomes and rates of immunization. Individuals living in the North engaged in these preventative care measures less often than individuals living in Manitoba overall. This trend was demonstrated in Table 5.3. For example, immunization of one-year olds in the North was shown to occur at a rate of 66.3% in Northern males and 68.7% in Northern females. These figures were in contrast with Manitoba as a whole, in which 82.7% of one-year old males and of one-year old females were immunized in the years 2001-2002. The rates of immunization were even higher in Winnipeg. The difference in rates becomes more pronounced among two year olds, with 51.5% of Northern males and 53.3% of Northern females receiving their recommended immunizations, while for Manitoba the rates were 69.8% and 70.7% respectively.
Table 5.3 Immunization of One and Two-Year Olds by Health Region
RHAs Immunization of One-Year Olds* Immunization of Two-Year Olds+ Male Female Male Female
South Eastman 85.2% 87.7% 71.0% 75.9% Central 78.0% 77.9% 64.2% 68.5% Assiniboine 87.0% 86.7% 75.8% 74.1% Brandon 87.3% 85.0% 72.8% 74.6% Parkland 85.1% 86.9% 73.2% 74.0% Interlake 82.1% 79.7% 71.3% 67.8% North Eastman f 76.4% 69.5% f 61.8% 56.9% Churchill 93.8% 95.5% 92.9% 64.7% Nor-Man m 71.1% 75.4% 62.9% 64.3% Burntwood m,f 63.8% 65.6% m,f 46.3% 48.7% Rural South 81.8% 81.4% 68.9% 69.8% North m,f 66.3% 68.7% m,f 51.5% 53.3% Winnipeg m,f 86.1% 86.3% m,f 73.9% 74.5% Manitoba 82.7% 82.7% 69.8% 70.7%
Source: Fransoo, R. et al. (2005). Sex differences in health status, health care use, and quality of care: A population-based analysis for Manitoba’s regional health authorities. Winnipeg: Manitoba Centre for Health Policy.
Proportion of children born 2001-2002 immunized at 1 year Proportion of children born 2000-2001 immunized at 2 years 'm' indicates area's rate for males was statistically different from Manitoba average for males 'f' indicates area's rate for females was statistically different from Manitoba average for females 'd' indicates difference between male and female rates was statistically significant for that area 's' indicates data suppressed due to small numbers
Health Care Utilization Despite the demonstrated differences in health status, with individuals in the North suffering poorer health and shorter life expectancy than their southern counterparts, Northern residents had lower rates of health care utilization. Ambulatory visit rates and ambulatory consultation rates were lower among Northerners than among Manitobans as a whole. Northern males visited physicians 4.0 times per individual in the year 2003-2004, while females had 5.1 visits to a

Indicators of Northern Health: A Resource for Northern Manitobans and the Bayline Regional Round Table 31
physician. In the South for the same period, men visited a physician 4.4 times and females visited 5.4 times. Rates in Winnipeg were even higher, with men visiting physicians 4.8 times on average, and women visiting a physician 5.7 times.
Ambulatory consultation rates were somewhat better. The rate women received a consultation for the period of 2003-2004 was statistically the same for Northerners as it was in Manitoba overall. Northern men however, received consultations less often than the provincial rate, with 0.2 ambulatory consults per individual, compared to 0.3 provincially.
Visit rates to specialists by Northerners were significantly lower: 0.5 Northern males and 0.6 Northern females visited a specialist in the period of 2003-2004, while 1.2 Manitoban males and 1.3 Manitoban females visited specialists in the same period. Again, the visit rates to specialists in Winnipeg were higher yet, with 1.7 visits per individual in both men and women. These figures were in keeping with what is known; that health care services, particularly services from specialists, were more difficult to access by Northerners than by residents of the Rural South and particularly by residents of Winnipeg.
Table 5.4 Physician Services by Health Region
RHAs Ambulatory Visit Rates* Ambulatory Consultation Rates+
Visit Rates to Specialists#
Male Female Male Female
Male Female
South Eastman d 4.2 5.1 m,d 0.2 0.3 m,f,d 0.8 0.8 Central m,f,d 3.8 4.7 m,f,d 0.2 0.3 m,f,d 0.7 0.7 Assiniboine d 4.2 5.3 m,f,d 0.2 0.2 m,f,d 0.5 0.5 Brandon m,f,d 5.2 6.5 d 0.3 0.3 m,f,d 1.0 1.0 Parkland d 4.4 5.6 m,f,d 0.2 0.3 m,f,d 0.4 0.5 Interlake d 4.1 5.1 d 0.3 0.3 m,f,d 1.1 1.2 North Eastman d 4.2 5.6 d 0.3 0.3 m,f,d 0.9 1.0 Churchill m,f,d 2.2 3.0 0.2 0.3 m,f,d 0.5 0.5 Nor-Man d 4.5 5.8 m,f,d 0.2 0.3 m,f,d 0.4 0.5 Burntwood m,f,d 3.8 4.7 m,d 0.2 0.3 m,f,d 0.5 0.7 Rural South m,f,d 4.1 5.1 m,f,d 0.2 0.3 m,f,d 0.7 0.8 North m,f,d 4.0 5.1 m,d 0.2 0.3 m,f,d 0.5 0.6 Winnipeg m,f,d 4.8 5.7 m,f,d 0.3 0.4 m,f,d 1.7 1.7 Manitoba d 4.4 5.4 d 0.3 0.3 d 1.2 1.3
Source: Fransoo, R. et al. (2005). Sex differences in health status, health care use, and quality of care: A population-based analysis for Manitoba’s regional health authorities. Winnipeg: Manitoba Centre for Health Policy.
*Ambulatory Physician Visit Rates 2003/04 per individual +Ambulatory Consult Rates 2003/04 per individual #Ambulatory Visit Rates to Specialists 2003/04 per individual 'm' indicates area's rate for males was statistically different from Manitoba average for males 'f' indicates area's rate for females was statistically different from Manitoba average for females 'd' indicates difference between male and female rates was statistically significant for that area 's' indicates data suppressed due to small numbers

Indicators of Northern Health: A Resource for Northern Manitobans and the Bayline Regional Round Table 32
Individuals living in the North stayed in the hospital longer than their peers in the Rural South. Total separation rates were the number of individuals who had left a hospital due to death, discharge or transfer, and were commonly used as indicators of hospital service use. As seen in Table 5.5, the total separation rate for northern females was double the rate for Manitoban females in the period of 2003/04. The same was true for total hospital days used in the same period of time. The difference in rates between Northern and Southern men was less, but still was striking. Northern men had a total separation rate of 208.7, while provincially the rate for men was 126.6, and in Winnipeg, it was 105.8. It is important to note these differences in the context of the rates of preventative care in the North, discussed earlier in this section, and in health care utilization, also discussed earlier.
Table 5.5 Hospital Services by Health Region
RHAs Total Separation Rates* Total Hospital Days Used+ Male Female Male Female
South Eastman d 116.5 163.3 745.8 900.8 Central m,f,d 152.3 190.4 907.6 1075.5 Assiniboine m,f,d 161.7 200.6 1033.7 1209.2 Brandon d 132.4 164.4 1025.2 1053.2 Parkland m,f,d 172.3 241.1 f,d 1113.3 1584.4 Interlake m,f,d 145.1 185.3 797.8 955.3 North Eastman m,f,d 141.0 189.2 965.8 1056.1 Churchill m,f,d 207.4 316.0 m,f,d 5356.7 1979.7 Nor-Man m,f,d 155.9 253.8 1021.2 1323.2 Burntwood m,f,d 245.2 371.8 m,f,d 1449.6 2161.2 Rural South m,f,d 147.4 191.7 d 905.8 1089.3 North m,f,d 208.7 324.5 m,f,d 1306.6 1817.7 Winnipeg m,f,d 105.8 137.1 854.4 911.3 Manitoba d 126.6 162.0 878.2 998.1
Source: Fransoo, R. et al. (2005). Sex differences in health status, health care use, and quality of care: A population-based analysis for Manitoba’s regional health authorities. Winnipeg: Manitoba Centre for Health Policy.
*Hospital Separation Rates 2003/04 per 1000 +Total Hospital Days Rates 2003/04 per 1000 'm' indicates area's rate for males was statistically different from Manitoba average for males 'f' indicates area's rate for females was statistically different from Manitoba average for females 'd' indicates difference between male and female rates was statistically significant for that area 's' indicates data suppressed due to small numbers
Mental Health Mental illness, addiction, and acquired brain injury present challenges in Manitoba, Canada, and internationally. The World Health Organization stated that 1 out of 4 individuals would be affected by mental illness in their lifetime. Stigma and a lack of recognition of mental illness among community members as well as front line health care providers were recognized as difficulties. The mental health data were taken largely from the MCHP report Patterns of Regional Mental Illness Disorder Diagnoses and Service Use in Manitoba: A Population-Based Study (Martens et al, 2004). Most analyses included all residents aged 10 or older, living in

Indicators of Northern Health: A Resource for Northern Manitobans and the Bayline Regional Round Table 33
Manitoba for at least one year in the five fiscal years between 1997/98-2001/02. Age was determined at the mid-point of the five-year period used in the analysis (December 31, 1999).
Treatment Prevalence Table 5.6 was used to illustrate the treatment prevalence of mental illnesses (the number of people who have received treatment for the illness during a given period of time) among Northern Manitobans compared to the treatment prevalence among Manitobans overall, during a five-year period of time. Cumulative disorders included depression, schizophrenia, anxiety, substance abuse, and personality disorders. Any other disorders for which individuals sought treatment were classified as “other”.
Table 5.6 Treatment Prevalence of Mental Disorders 1997/98 – 2001/02 Mental Illness
Categories Treatment Prevalance by
Aggregate Areas of Manitoba+ Income Gradient of
Treatment* Disorders Rural
South North Winnipeg Brandon Urban
Quintiles Rural
Income Quintiles
The two main aggregate groupings of mental disorders Cumulative Disorders
L H H H (females); S (males)
- N
Other Disorders L L H H (males); S (females)
N + (small)
The separate disorders in the cumulative disorders category Depression L L H H - + (small) Anxiety Disorders L S H S - N Substance Abuse L H
(very high)
L (near MB)
H (females) - - (erratic pattern)
Schizophrenia L L H H - - (small) Personality Disorder
L L H H - - (erratic pattern)
Other selected disorders Dementia L L H S - N ADD/ADHD L L H H (males);
S (females) N N
Indicators derived from the CCHS Cycle 1.1 survey Positive Mood S L S H Balance Work Stress
S S S S
Probable Depression /Felt Depressed
L S S S
Source: Martens, P., et al. (2004). Patterns of Regional mental illness disorder diagnoses and service use in Manitoba: A population-based study. Winnipeg, MB: Manitoba Centre for Health Policy.
+Treatment prevalence are coded so that H means higher than the Manitoba average, L means lower than the Manitoba average and S means similar to the Manitoba average
*Income Gradient of Treatment are coded so that - means negative association, + means positive association; N means no association. A “negative association” means that as neighbourhood income increases, treatment prevalence decreases. Similarly, a “positive association” means that as neighbourhood income increases, the treatment prevalence also increases.

Indicators of Northern Health: A Resource for Northern Manitobans and the Bayline Regional Round Table 34
The term ‘treatment prevalence’ was used by researchers at the Manitoba Centre for Health Policy to describe the number of people who received treatment for a mental illness in a given period of time. This definition was in contrast to the term ‘prevalence’, which would describe the number of people who had the mental illness in a given period of time. Treatment prevalence for the cumulative group of mental illnesses in the North was higher than provincially. As shown in Table 5.6, this difference was due almost exclusively to the higher rates of substance abuse among Northerners, compared to Manitobans as a whole. The treatment prevalence of the other disorders in the cumulative group were lower than or the same as for Manitobans overall.
Data also showed that individuals with mental illness were hospitalized more than twice as often as those without mental illness. These differences were not accounted for by hospitalizations for mental illness. Individuals with mental illness suffered physical ailments more often than those without mental illness.
The treatment prevalence of cumulative disorders was 22.5% for males and 33.2% for females in the North, figures significantly higher than the Manitoba averages of 18.8% for males and 29.1 for females (See Table 5.7). The differences were even greater when the North was compared to the Rural South.
Table 5.7 Mental Illness Treatment Prevalence by Health Region RHAs Treatment Prevalence of
Cumulative Disorders+ Treatment Prevalence of Other
Mental Illness Disorders* Male Female Male Female
South Eastman m,f,d 17.1% 27.6% d 11.2% 14.4%Brandon f,d 19.5% 30.7% m,d 12.2% 13.7%Central m,f,d 15.7% 25.6% m,f,d 9.3% 11.6%Assiniboine m,f,d 15.2% 26.1% m,f,d 8.7% 11.3%Parkland m,f,d 16.0% 27.5% m,f,d 10.8% 15.2%Interlake m,f,d 17.1% 27.9% m,f,d 9.5% 12.1%North Eastman m,f,d 17.0% 27.8% m,f,d 9.4% 12.3%Burntwood m,f,d 24.5% 33.7% m,f,d 7.5% 8.6%Churchill d 20.6% 27.3% 9.6% 9.5%Nor-Man f,d 19.5% 32.6% f,d 11.4% 15.1% Rural South m,f,d 16.2% 26.8% m,f,d 9.7% 12.6%North m,f,d 22.5% 33.2% m,f,d 9.1% 11.3%Winnipeg m,f,d 19.8% 29.7% m,f,d 12.8% 15.0%Manitoba d 18.8% 29.1% d 11.5% 14.0%
Source: Martens, P. et al. (2004). Patterns of regional mental illness disorder diagnoses and services use in Manitoba: A population-based study. Winnipeg: Manitoba Centre for Health Policy.
+Rate of Individuals with any of 5 conditions per 100 (%) - 1997-2001 *Rate of Individuals with not any of 5 conditions per 100 (%) - 1997-2001 'm' indicates area's rate for males was statistically different from Manitoba average for males 'f' indicates area's rate for females was statistically different from Manitoba average for females 'd' indicates difference between male and female rates was statistically significant for that area 's' indicates data suppressed due to small numbers

Indicators of Northern Health: A Resource for Northern Manitobans and the Bayline Regional Round Table 35
The treatment prevalence of other mental illness disorders referred to the proportion of the population who had at least one diagnosis of a mental illness disorder during the five years, but either did not have ‘enough’ diagnostic codes to be classified in the five disorders if the cumulative group or had codes only for other mental illness conditions not included in the cumulative group. Dementia, hyperactivity, and eating disorders were examples of other mental illness diagnoses. Treatment prevalence of other mental illness disorders was highest for residents of Winnipeg at 12.8% for males and 15% for females, compared with those living in the North with the lowest rates at 9.1% for males and 11.3% for females.
Treatment prevalence of depression was lowest in the North with 9.4% of males and 20.1% of females being treated for depression, compared to the Provincial rate of 12.6% for males and 23.6% for females. The rates for Winnipeg were higher yet with males at 13.7% and females at 24.3%. (see Table 5.8.)
Treatment prevalence of substance abuse was highest among Northern residents, more than double that of the Province, with 14.1% of males and 15.4% of females being treated. The Manitoba rate for males was 6.3% and for females was 5.3%. Rates were lower again among residents of the Rural South at 5.4% for males and 4.4% for females.
Table 5.8 Treatment Prevalence of Depression/Substance Abuse by Health Region RHAs Treatment Prevalence of
Depression+ Treatment Prevalence of
Substance Abuse* Male Female Male Female
South Eastman m,d 11.9% 23.0% m,f,d 5.1% 4.1% Brandon m,f,d 13.5% 25.4% f,d 6.4% 5.9% Central m,f,d 10.9% 21.7% m,f,d 4.9% 3.7% Assiniboine m,f,d 10.3% 21.4% m,f,d 5.2% 4.6% Parkland m,f,d 10.7% 22.4% m,f,d 5.6% 4.7% Interlake m,d 11.6% 23.6% m,f,d 5.8% 4.7% North Eastman m,d 11.0% 22.9% d 6.4% 5.1% Burntwood m,f,d 8.9% 18.4% m,f,d 17.5% 20.2% Churchill m,f,d 6.5% 14.0% m,f 13.9% 16.8% Nor-Man m,d 10.2% 22.7% m,f,d 9.1% 8.2% Rural South m,f,d 11.0% 22.4% m,f,d 5.4% 4.4% North m,f,d 9.4% 20.1% m,f,d 14.1% 15.4% Winnipeg m,f,d 13.7% 24.3% m,f,d 6.1% 4.7% Manitoba d 12.6% 23.6% d 6.3% 5.3%
Source: Martens, P., Fransoo, R., McKeen, N. et al. (2004). Patterns of regional mental illness disorder diagnoses and services use in Manitoba: A population-based study. Winnipeg: Manitoba Centre for Health Policy.
+Rate of Individuals with any of 5 conditions per 100 (%) - 1997-2001 *Rate of Individuals with not any of 5 conditions per 100 (%) - 1997-2001 'm' indicates area's rate for males was statistically different from Manitoba average for males 'f' indicates area's rate for females was statistically different from Manitoba average for females 'd' indicates difference between male and female rates was statistically significant for that area 's' indicates data suppressed due to small numbers

Indicators of Northern Health: A Resource for Northern Manitobans and the Bayline Regional Round Table 36
Use of Physician Services All-cause physician visit rates were the average annual number of ambulatory visits to all physicians including general practitioners, family practitioners and specialists, for all causes including physical and mental health concerns, per resident. Since salaried physicians had less incentive to complete ‘shadow billing forms’, and some services may have been provided by nurses/ nurse practitioners in northern and isolated communities, the rate for general practitioner use may be undercounted. In addition, salaried psychiatrists working in the provincial mental health centres provided outpatient care but did not complete individual service claims for these visits. Therefore, visit rates reported were considered to be underestimates of actual visit rates, particularly among residents living near mental health centres.
As stated in the MCHP report, close examination of visit rates for mental illness showed a striking difference between Burntwood and Nor-Man RHAs, with no reason to believe that the need for mental health services differ greatly between the RHAs as the prevalence of cumulative disorders was so similar. The report suggested that Burntwood residents simply do not visit physicians for mental illness as often as Nor-Man residents, or that other alternate explanations also were possible. Burntwood residents may have been seeking as much care for mental health problems, but from other care providers such as nurses and social workers. Physicians in Burntwood may have been more likely to record physical problems for visits, even if mental health concerns also were addressed. Regardless of the explanation, the report suggested that the lower rate of physician visits for mental illness among Burntwood residents was a concern that would benefit from further exploration.
Despite their higher treatment prevalence of cumulative mental illnesses, Northerners had less use of physician services for mental illness than other Manitobans. Table 5.9 illustrated physician visits for all causes by individuals with and without a diagnosis of a cumulative mental illness. As seen in the table, both male and females with a cumulative disorder sought physician services at a greater rate than individuals without a cumulative disorder; similar findings were apparent throughout Manitoba.
When considering physician visits for all causes, the rate of visits for males with a cumulative disorder was 5.8 visits per person for the period 1997/98 to 2001/02 (age-adjusted for those 10 years old and over) for residents of the North, a lower figure when compared to 7.1 for Manitoba residents and 6.4 for residents of the Rural South. For those individuals with no cumulative disorder, the rate for males living in the North during the same period was 2.8 visits per person, compared with residents of the Province at 3.1 and those living in the Rural South at 3.0. For northern females with a cumulative disorder the physician visit for all causes rate was 7.8 per person for the period of 1997/98 to 2001/02, compared with the Province at 8.7 and the Rural South at 8.1. When considering females with no cumulative disorder, the visit rate for those living in the North was the same as the Province at 4.0 and higher than that for the Rural South at 3.9
For overall physician visits for mental illness, Northern males had 0.8 visits for the same period, compared with Rural Southern males at 1.0 and Manitoba males at 1.5 visits. Females living in the north had 0.9 visits compared with 1.3 visits by those in the Rural South and 1.6 visits for Manitobans overall. The differences between those living in the North and in the Province were significant for males and females as were the differences between those living in the Rural South

Indicators of Northern Health: A Resource for Northern Manitobans and the Bayline Regional Round Table 37
and in the Province as a whole. The differences between males and females were significant for those living in the North, in the South and in the Province overall.
Table 5.9 Physician Visits for All Causes/Mental Illness by Health Region RHA Physician Visits for All Causes+ Physician Visits for
Mental Illness* Male Female Male Female With
cumulative disorder
No cumulative
disorder
With cumulative
disorder
No cumulative
disorder
S. Eastman 1,0,d 6.4 2.9 1,0,d 8.1 3.7 m,f,d 1.1 1.3Brandon 0,d 6.9 3.3 d 8.8 4.1 m,f,d 1.3 1.5Central 1,0,d 6.1 2.8 1,0,d 7.7 3.6 m,f,d 1.0 1.2Assiniboine 1,d 6.2 3.1 1,0,d 8.1 3.9 m,f,d 0.9 1.2Parkland d 7.0 3.2 1,0,d 9.1 4.2 m,f,d 1.0 1.2Interlake 1,0,d 6.2 3.0 1,d 7.9 4.0 m,f,d 1.1 1.4N. Eastman d 6.7 3.1 d 8.6 4.1 m,f,d 1.1 1.3Burntwood 1,0,d 5.2 2.6 1,d 7.4 3.9 m,f 0.6 0.6Churchill d 5.6 2.7 d 9.2 4.3 m,d 0.6 1.8Nor-Man d 6.7 3.0 d 8.5 4.0 m,f 1.1 1.2 Rural South 1,0,d 6.4 3.0 1,0,d 8.1 3.9 m,f,d 1.0 1.3North 1,0,d 5.8 2.8 1,d 7.8 4.0 m,f,d 0.8 0.9Winnipeg 1,0,d 7.7 3.2 1,0,d 9.2 4.1 m,f,d 1.9 1.9Manitoba d 7.1 3.1 d 8.7 4.0 d 1.5 1.6
Source: Martens, P., Fransoo, R., McKeen, N. et al. (2004). Patterns of regional mental illness disorder diagnoses and services use in Manitoba: A population-based study. Winnipeg: Manitoba Centre for Health Policy.
+ Physician Visit Rates for Males With/Without Cumulative Disorders by RHA, 1997/98-2001/02, Age-adjusted annual rate of visits per resident aged 10 years + *Visit Rates to All Physicians for Mental Illness Disorders for those With Cumulative Disorders by District, 1997/98-2001/02, Age-adjusted annual rate of visits per resident aged 10 years + 'm' indicates area's rate for males was statistically different from Manitoba average for males 'f' indicates area's rate for females was statistically different from Manitoba average for females 'd' indicates difference between male and female rates was statistically significant for that area 's' indicates data suppressed due to small numbers '1' indicates area's rate for those with disorder was statistically different from Manitoba average with disorder '0' indicates area's rate for those without disorder was statistically different from Manitoba average without disorder 'd' indicates difference between two groups' rates was statistically significant for that area 's' indicates data suppressed due to small numbers

Indicators of Northern Health: A Resource for Northern Manitobans and the Bayline Regional Round Table 38

Indicators of Northern Health: A Resource for Northern Manitobans and the Bayline Regional Round Table 39
VI Burntwood Region and Bayline Communities In 2001, the Burntwood Region had a population of 42,995 (Statistics Canada, 2002c), the majority of whom self-identified as Aboriginal. This Region had a younger population compared to the Province, a trend that was projected to continue into the future due largely to higher birth rates and lower life expectancies than the provincial averages. The Region faced many challenges unique in the Province. Geographic isolation, high unemployment rates, and overcrowded and unaffordable housing were just some of those challenges. Each health region in Manitoba was made up of health districts. In the MCHP reports the Burntwood Region was comprised of 11 districts and some of the data were organized by districts. The districts within Burntwood Region included:
Thompson Gillam, Fox Lake Leaf Rapids, Lynn Lake, South Indian Lake Thicket Portage, Pikwitonei, Wabowden Island Lake Cross Lake Norway House Tadoule Lake, Brochet, Lac Brochet Oxford House, Gods Lake Shamattawa, York Landing, Split Lake, War Lake Nelson House
(Martens et al, 2004, p. 401)
The Burntwood Region communities that were members of the Bayline Regional Round Table (BRRT) included Thicket Portage, Pikwitonei, Wabowden and Ilford/War Lake. Cormorant, the other community in the BRRT, was located in the Nor-Man Region. In this section, the health status of the population of the Burntwood Region and of the districts that included the communities of the Bayline Regional Round Table were examined and compared to the Province. Cormorant is discussed in the next section along with the Nor-Man Region.
Thicket Portage, Pikwitonei, and Wabowden were located in the same district, while War Lake was located in a district with Shamattawa, York Landing, and Split Lake. In general when examining health status and health care, data showed that the district including Thicket Portage/ Pikwitonei/ Wabowden fared somewhat better than the Burntwood Region as a whole. The district in which Ilford/War Lake was located showed a poorer health status than the Burntwood Region as a whole.
Two documents were used to provide information on the health and health care use of residents of Burntwood Region and the districts therein. The first source was the report the MCHP Sex Differences in Health Status, Health Care Use, and Quality of Care: A Population-Based Analysis for Manitoba’s Regional Health Authorities (Fransoo et al, 2005). Comparisons included indicators or measures of health status, illness, preventative care, and health care utilization across regions. The second source by the MCHP entitled Patterns of Regional Mental

Indicators of Northern Health: A Resource for Northern Manitobans and the Bayline Regional Round Table 40
Illness Disorder, Diagnoses, and Services Use in Manitoba: A Population-Based Study (Martens et al, 2004) provided information specifically on mental illness. Comparisons included treatment prevalences and physician visits.
While it can be informative to examine the health of the population located within the Burntwood Region, information about the health districts within that region is also useful. Health status may differ between districts and communities within the Region. The sometimes considerable differences between the districts in the overall region can give a clearer understanding of the different needs of various communities. The Burntwood Region covered a large amount of land, much of which is accessible only by train or by air. Circumstances differed as did populations; therefore the health of residents of different districts within the Burntwood Region were illustrated. In the tables of this section and the next section of this report, the comparisons among and between populations residing in different health districts were used to identify differences in comparison to residents of the Province as a whole, not whether the differences were significant in comparison to residents of the Region as a whole. These criteria were included in the notes located at the bottom of each table.
The researchers at the Manitoba Centre for Health Policy calculated visits according to the place of residence of the user of the service, not according to the location of the services that were used. Burntwood Region was the residence of the service user, not necessarily the location of the service delivery.
Health Status Interesting trends emerged when examining the life expectancy, premature mortality rate, and potential years of life lost for the districts within the Burntwood Region. In looking at the 5-year life expectancy at birth (1999-2003) the Thicket Portage/ Pikwitonei/ Wabowden District showed a male life expectancy of 70.8 years per 1000 people, the Shamattawa/ York Landing/ Split Lake/ War Lake District had a male life expectancy of 71.0 years, both lower than the Burntwood Region as a whole at 71.5 years. Female life expectancy was higher (83.3 years) in the Thicket Portage/ Pikwitonei/ Wabowden District than in the Region at 77.3 years; the Shamattawa/ York Landing/ Split Lake/ War Lake District was lower yet at 70.1 years for females. (See Table 6.1.)
Premature mortality rates in the Thicket Portage/ Pikwitonei/ Wabowden District were 6.0 years per 1000 population aged 0-74 years old (1999 – 2003) in males and 3.0 in females, lower than in the Region at 6.4 years per 1000 population in males and 4.1 in females. While the Region as a whole was significantly higher than the Province, this District was not significantly different than the Province for males or females. The Shamattawa/ York Landing/ Split Lake/ War Lake District showed very different numbers with premature mortality rates in males at 9.0 years per 1000 population, and in females at 7.6 years, both significantly different than the Province as a whole. These higher figures for this District contributed to the higher average for the Burntwood Region as a whole and resulted in an average that was significantly higher the Province overall.
Numbers showed interesting differences in potential years of life lost (PYLL) across districts in the Region. The Thicket Portage/ Pikwitonei/ Wabowden District fared better in potential years of life lost, with rates of 85.4 years per 1,000 population, aged 1-74 years (1999 – 2003) in males and 36.6 years in females; figures not significantly different from the Province as a whole, but lower or better than the Regional rates of 129.3 years in males and 80.9 years in females. The influence of the Shamattawa/ York Landing/ Split Lake/ War Lake District on the overall higher

Indicators of Northern Health: A Resource for Northern Manitobans and the Bayline Regional Round Table 41
or poorer rates for Burntwood Region were apparent with rates of PYLL at 198.7 years in males and 188.6 years in females in that District. Both male and female rates were significantly higher or poorer in the Shamattawa/ York Landing/ Split Lake/ War Lake District than for the Province at 68.1 PYLL for males and 40.6 for females.
Table 6.1 Health Status and Mortality of Burntwood Region by District District Life Expectancy# Premature Mortality
Rate* Potential Years of
Life Lost+ Male Female Male Female Male Female
Thompson 74.7 83.7 d 4.7 2.7 84.5 51.7 Gillam/Fox Lake 70.6 76.1 4.8 3.1 d 93.8 33.9 Lynn/Leaf/SIL 74.6 73.6 f 6.0 4.8 122.8 95.1 Thick Por/Pik/Wab 70.8 83.3 6.0 3.0 85.4 36.6 Island Lake 67.9 75.0 m,f,d 8.2 4.9 144.1 74.0 Cross Lake 69.4 77.3 m,f,d 7.6 4.4 155.6 78.9 Norway House 68.3 73.1 m,f 8.2 5.7 146.1 83.4 Tad/Broch/Lac Br 68.4 78.5 m 7.3 4.8 m,f 178.9 103.2 Oxford H & Gods 73.1 77.1 m,f 7.3 5.0 m,f 172.3 119.8 Sha/York/Split/War 71.0 70.1 m,f 9.0 7.6 m,f 198.7 188.6 Nelson House 67.4 72.4 m,f 8.8 7.6 m,f 182.6 139.5 Burntwood 71.5 77.3 m,f,d 6.4 4.1 m,f,d 129.3 80.9 Manitoba 75.9 81.3 d 4.4 2.6 d 68.1 40.6
Source: Fransoo, R. et al. (2005). Sex differences in health status, health care use, and quality of care: A population-based analysis for Manitoba’s regional health authorities. Winnipeg: Manitoba Centre for Health Policy.
# 5 Year Life Expectancy at Birth, 1999-2003 *Premature Mortality Rate - Years per 1,000 population, Age 0-74 Years, 1999 – 2003 +Potential Years of Life Lost - Years per 1,000 population, Age 1-74 Years, 1999 - 2003 'm' indicates area's rate for males was statistically different from Manitoba average for males 'f' indicates area's rate for females was statistically different from Manitoba average for females 'd' indicates difference between male and female rates was statistically significant for that area 's' indicates data suppressed due to small numbers
Measures of Illness As in previous sections, treatment prevalence of diabetes and hypertension were used as measures of illness for comparative purposes. The Burntwood Region had a diabetes treatment prevalence of 12% in males and 17% in females. The treatment prevalence of this same disease in the Thicket Portage/ Pikwitonei/ Wabowden District was 10.8% in males and 21.1% in females (females significantly higher than the Province). In the Shamattawa/ York Landing/ Split Lake/ War Lake District, diabetes treatment prevalence was 16.9% in males and 28.7% in females; significantly higher than the Province for both males and females. (See Table 6.2.)
Similar differences were seen with hypertension treatment prevalence. In the Burntwood Region, the treatment prevalence of hypertension was 28.2 % males and 34.3% in females. The Thicket Portage/ Pikwitonei/ Wabowden District had lower treatment prevalence at 23.9% for males and 32.2% for females, while the Shamattawa/ York Landing/ Split Lake/ War Lake District

Indicators of Northern Health: A Resource for Northern Manitobans and the Bayline Regional Round Table 42
proportions showed 30.0% of males and 31.5% of females were treated for hypertension. Neither district was significantly different from the Province for males or females.
Table 6.2 Diabetes and Hypertension Treatment Prevalence by Burntwood Health District District Diabetes Treatment Prevalence+ Hypertension Treatment
Prevalence* Male Female Male Female
Thompson m,f 8.6% 9.0% m,f,d 27.3% 34.9% Gillam/Fox Lake m,f 12.3% 17.1% m,f 39.0% 47.9% Lynn/Leaf/SIL f,d 9.5% 15.8% m,f 38.5% 42.4% Thick Por/Pik/Wab f 10.8% 21.1% 23.9% 32.2% Island Lake m,f,d 25.7% 40.7% f,d 24.5% 33.4% Cross Lake m,f 18.7% 23.1% m,f 29.8% 33.3% Norway House m,f,d 18.4% 25.9% m,f 32.5% 40.1% Tad/Broch/Lac Br 2.9% 6.7% 23.4% 23.5% Oxford H & Gods m,f,d 12.1% 22.2% 23.2% 25.3% Sha/York/Split/War m,f,d 16.9% 28.7% 30.0% 31.5% BW Nelson House f,d 8.9% 16.6% f 29.3% 34.4% Burntwood m,f,d 12.2% 16.7% m,f,d 28.2% 34.3% Manitoba d 6.8% 6.3% d 24.0% 25.9%
Source: Fransoo, R. et al. (2005). Sex differences in health status, health care use, and quality of care: A population-based analysis for Manitoba’s regional health authorities. Winnipeg: Manitoba Centre for Health Policy.
+Diabetes Prevalence 2001/02-2003/04 per cent age 20-79 *Hypertension Prevalence 2001/02-2003/04 per cent age 25+ 'm' indicates area's rate for males was statistically different from Manitoba average for males 'f' indicates area's rate for females was statistically different from Manitoba average for females 'd' indicates difference between male and female rates was statistically significant for that area 's' indicates data suppressed due to small numbers
Preventative Care Measures Children living in the Thicket Portage/ Pikwitonei/ Wabowden District and the Shamattawa/ York Landing/ Split Lake/ War Lake District had higher proportions of the population receiving childhood immunization than children living the Burntwood Region as a whole. Some 63.8% of male children residing in the Burntwood Region were immunized at one year of age and 65.6% of female children were immunized at the same age. Also among one-year olds, 84.6% of male children living in Thicket Portage/ Pikwitonei/ Wabowden had been immunized and 82.4 % of female children. The Shamattawa/ York Landing/ Split Lake/ War Lake District had slightly lower proportions at 77.3% of male children in the same age group and 81.4% of females. (See Table 6.3.)
The trend continued among two-year old children. Some 46.3% of male children two-years of age and residing in the Burntwood Region were immunized; 48.7% of female children aged two-years old were immunized. In the Thicket Portage/ Pikwitonei/ Wabowden District 81.3% of male children and 87.5% of females in this age group were immunized. Interestingly these numbers showed a lower proportion of immunization of two-year old males and a higher proportion of immunization of two-year old females. In the Shamattawa/ York Landing/ Split

Indicators of Northern Health: A Resource for Northern Manitobans and the Bayline Regional Round Table 43
Lake/ War Lake District, 64.3% of two-year old male children, and 65.1% of female children the same age were immunized.
Of note were the very low immunization rates for one-year olds in Oxford House and Gods Lake District and the Nelson House District of the Burntwood Region. Similar trends were noted for the two-year old population in these two districts and several other communities also have immunization rates below 50% for two-year olds.
Table 6.3 Immunization of One and Two-Year Olds by Burntwood Health District District Immunization of
One-Year Olds* Immunization of Two-Year Olds+
Male Female Male Female Thompson 75.9% 70.2% 60.0% 58.5% Gillam/Fox Lake 88.9% 95.2% 100.0% 81.8% Lynn/Leaf/SIL 81.6% 74.5% 64.1% 76.1% Thick Por/Pik/Wab 84.6% 82.4% 81.3% 87.5% Island Lake m,f 51.9% 62.5% m,f 40.4% 37.2% Cross Lake 63.6% 65.4% m 43.8% 56.7% Norway House 80.8% 81.3% m,f 39.0% 44.8% Tad/Broch/Lac Br 65.2% 61.9% 34.4% 38.2% Oxford H & Gods m,f 36.1% 30.3% m,f 8.5% 15.6% Sha/York/Split/War 77.3% 81.4% 64.3% 65.1% Nelson House m,f 26.8% 28.3% m,f 24.6% 23.4% Burntwood m,f 63.8% 65.6% m,f 46.3% 48.7% Manitoba 82.7% 82.7% 69.8% 70.7%
Source: Fransoo, R. et al. (2005). Sex differences in health status, health care use, and quality of care: A population-based analysis for Manitoba’s regional health authorities. Winnipeg: Manitoba Centre for Health Policy.
Proportion of children born 2001-2002 immunized at 1 year Proportion of children born 2000-2001 immunized at 2 years 'm' indicates area's rate for males was statistically different from Manitoba average for males 'f' indicates area's rate for females was statistically different from Manitoba average for females 'd' indicates difference between male and female rates was statistically significant for that area 's' indicates data suppressed due to small numbers
Health Care Utilization Ambulatory visit rates, ambulatory consultation rates, and ambulatory visit rates to specialists were health indicators used to demonstrate the use of health services. Ambulatory visit rates and visit rates for specialists were significantly higher for females living in the Burntwood Region than for females living in the Province of Manitoba. All three rates were significantly lower for males residing in the Burntwood Region than for males living in Manitoba. (See Table 6.4.)
Ambulatory visit rates were significantly higher among females than males in the Burntwood Region, with 3.8 visits per person for males in 2004/05 compared 4.7 visits per person for females. Ambulatory visit rates for both females and males living in the Burntwood Region were significantly lower than for Manitoba at 4.4 visits per person for males and 5.4 visits per person for females. In the Thicket Portage/ Pikwitonei/ Wabowden District, ambulatory visit rates were 3.3 for males and 5.0 for females; not significantly different than the Province for males, but significantly different for females. In the Shamattawa/ York Landing/ Split Lake/ War Lake

Indicators of Northern Health: A Resource for Northern Manitobans and the Bayline Regional Round Table 44
District, the rates were 2.9 visits per person for males and 3.7 visits per person for females. Ambulatory visit rates in this district were significantly lower for males and females when compared to the Province. Given the poorer health status of residents of Burntwood and their more limited use of health services, issues related to access to health services come to the foreground.
Ambulatory consultation rates in the two districts were similar to Burntwood Region, at rates of 0.2 visits per person in 2003/04 for males and 0.3 visits for females. The Thicket Portage/ Pikwitonei/ Wabowden District had rates of 0.1 for males and 0.2 for females, while in the Shamattawa/ York Landing/ Split Lake/ War Lake District the rates were 0.2 and 0.3 for males and females respectively – the same rates as for the entire Burntwood Region and significantly different from the Province for males in both districts and significantly different from the Province for females in the Shamattawa/ York Landing/ Split Lake/ War Lake District only.
Ambulatory visit rates to specialists in the Burntwood Region were 0.5 visits for males and 0.7 visits for females. In the Thicket Portage/ Pikwitonei/ Wabowden District rates were lower, with males visiting at a rate of 0.2 visits per year and females at a rate of 0.4 visits per year. In the Shamattawa/ York Landing/ Split Lake/ War Lake District, rates were slightly higher, but still lower than in the Burntwood Region as a whole and significantly lower than Manitoba visit rates for both genders, with males visiting specialists 0.4 times a year and women 0.5 times a year in the District, compared to males visiting 1.2 times a year and females visiting 1.3 times a year in the Province.
Table 6.4 Physician Services by Burntwood Health District
District Ambulatory Visit Rates* Ambulatory Consultation Rates+
Visit Rates to Specialists#
Male Female Male Female Male Female Thompson d 4.1 5.4 m,d 0.2 0.3 m,f,d 0.4 0.6 Gillam/Fox Lake m,f,d 6.3 9.0 f,d 0.3 0.5 m,f 0.8 0.9 Lynn/Leaf/SIL f,d 4.0 6.5 m,d 0.2 0.3 m,f,d 0.3 0.5 Thick Por/Pik/Wab m,d 3.3 5.0 m,d 0.1 0.2 m,f,d 0.2 0.4 Island Lake m,f,d 3.2 4.5 d 0.3 0.4 d 1.0 1.3 Cross Lake m,f,d 3.6 4.3 0.3 0.3 m,f,d 0.4 0.6 Norway House m,d 3.6 5.2 f,d 0.3 0.5 m,f,d 0.6 1.0 Tad/Broch/Lac Br m,f,d 2.7 4.4 m,d 0.2 0.4 m,f,d 0.3 0.5 Oxford H & Gods m,f 3.7 4.1 0.3 0.3 m,f 0.5 0.6 Sha/York/Split/War m,f,d 2.9 3.7 m,f,d 0.2 0.3 m,f,d 0.4 0.5 Nelson House m,f,d 2.7 4.1 m,f,d 0.1 0.2 m,f,d 0.2 0.5 Burntwood m,f,d 3.8 4.7 m,d 0.2 0.3 m,f,d 0.5 0.7 Manitoba d 4.4 5.4 d 0.3 0.3 d 1.2 1.3
Source: Fransoo, R. et al. (2005). Sex differences in health status, health care use, and quality of care: A population-based analysis for Manitoba’s regional health authorities. Winnipeg: Manitoba Centre for Health Policy.
*Ambulatory Physician Visit Rates; +Ambulatory Consult Rates; and #Ambulatory Visit Rates to Specialists were per individual for the year 2003/04 'm' indicates area's rate for males was statistically different from Manitoba average for males 'f' indicates area's rate for females was statistically different from Manitoba average for females 'd' indicates difference between male and female rates was statistically significant for that area 's' indicates data suppressed due to small numbers

Indicators of Northern Health: A Resource for Northern Manitobans and the Bayline Regional Round Table 45
Significant differences were seen when examining hospital service use by residents of the Burntwood Region in comparison to the Province. Information on hospital use was provided by looking at two indicators: total separation rates per 1000 population for 2003/04 and total hospital days, rates per 1000 population for the same time period (Table 6.5). In comparing male and female utilization rates, whether at a provincial, regional or district level, females had significantly more hospital admissions than males (noted by the separation rates) and significantly longer hospital stays (noted by hospital days rates). Some of these differences may be explained by the female use of hospital services during pregnancy, labour and delivery. In addition, females have longer life expectancies so may make more use of hospital services during the later years of life.
Residents of the Burntwood Region used hospital services at rates significantly higher than the Province as a whole. Thicket Portage/ Pikwitonei/ Wabowden District utilized fewer hospital services than residents of the Burntwood Region as a whole, while residents of the Shamattawa/ York Landing/ Split Lake/ War Lake District utilized a great deal more hospital services in general than residents of the Region.
In the Burntwood Region residents had total hospital separation rates of 245.2 per 1000 males in 2003/04 and 371.8 in females (significantly higher than for the Province), compared to residents of the Thicket Portage/ Pikwitonei/ Wabowden District with rates of 113.2 per 1000 males and 271.3 in females. In the Shamattawa/ York Landing/ Split Lake/ War Lake District residents used hospital services at rates of 402.5 per 1000 males and 660.4 for females significantly higher than the Province, with rates of 126.6 for males and 162.0 for females.
Table 6.5 Hospital Services by Burntwood Health District
RHAs Total Separation Rates* Total Hospital Days Rates+ Male Female Male Female
Thompson f,d 154.6 259.0 1195.5 1565.1 Gillam/Fox Lake m,f 250.8 356.7 f,d 1326.1 10422.1 Lynn/Leaf/SIL m,f,d 189.0 361.0 d 1354.8 2103.7 Thick Por/Pik/Wab f,d 113.2 271.3 m,d 448.3 1144.2 Island Lake m,f,d 221.7 426.8 m,f,d 1506.1 2853.6 Cross Lake m,f,d 332.6 476.8 m,f 1959.1 2131.7 Norway House m,f,d 288.2 421.9 m,f 1853.9 2457.8 Tad/Broch/Lac Br f,d 173.8 329.1 951.5 1187.9 Oxford H & Gods m,f,d 231.1 403.0 m,f 1403.8 2294.7 Sha/York/Split/War m,f,d 402.5 660.4 m,f 2342.7 3074.3 Nelson House m,f,d 274.2 607.1 m,f 2409.4 3232.3 Burntwood m,f,d 245.2 371.8 m,f,d 1449.6 2161.2 Manitoba d 126.6 162.0 878.2 998.1
Source: Fransoo, R. et al. (2005). Sex differences in health status, health care use, and quality of care: A population-based analysis for Manitoba’s regional health authorities. Winnipeg: Manitoba Centre for Health Policy.
*Hospital Separation Rates 2003/04 per 1000 +Total Hospital Days Rates 2003/04 per 1000 'm' indicates area's rate for males was statistically different from Manitoba average for males 'f' indicates area's rate for females was statistically different from Manitoba average for females 'd' indicates difference between male and female rates was statistically significant for that area 's' indicates data suppressed due to small numbers

Indicators of Northern Health: A Resource for Northern Manitobans and the Bayline Regional Round Table 46
The data for total hospital days used showed similar trends. In the Burntwood Region, the rate of total hospital days used for males was 1449.6 and for females was 2161.2 per 1000 population, both rates significantly higher than for the Province. In the Thicket Portage/ Pikwitonei/ Wabowden District, the rates were 448.3 days per 1000 for males and 1144.2 for females, much lower that the Region. In the Shamattawa/ York Landing/ Split Lake/ War Lake District, numbers were much higher than the Region at 2342.7 days per 1000 males and 3074.3 days per 1000 females. The Region and both districts of interest within the Region were significantly higher than the Province for males and the Region along with the Shamattawa/ York Landing/ Split Lake/ War Lake District were significantly higher than the Province for females.
Mental Health The mental health status of persons living in the two districts of concern were examined and compared to the Burntwood Region and to the Province. Two indicators were used for comparisons: treatment prevalence of cumulative disorders (depression, schizophrenia, anxiety, substance abuse and personality disorders) and treatment prevalence of other mental illness disorders (other disorders such as eating disorders, attention deficit disorders, and dementia). The individuals living in these districts, with few exceptions, had poorer mental health and suffered from more disorders than residents living in the Burntwood Region overall. It should be noted that acute care and community mental health services in the Burntwood Region were centralized in the City of Thompson.
Treatment Prevalence The treatment prevalence of cumulative disorders (depression, schizophrenia, anxiety, substance abuse and personality disorders) was a concept used to identify that individuals were treated for these diseases and did not confirm their diagnosis with these disorders. (See Table 6.6.)
For residents of the Region and both districts of interest, treatment prevalence rates of cumulative disorders were significantly higher than for residents of the Province. Some 24.5% of males residing in the Burntwood Region were treated for a cumulative disorder and 33.7% of females were treated, compared to the Province at 18.8% and 29.1%. Of males residing in the Thicket Portage/ Pikwitonei/ Wabowden District, 25.9% were treated for a cumulative disorder; 41.0% of females were treated. In the Shamattawa/ York Landing/ Split Lake/ War Lake District, males had a treatment prevalence rate of 31.8% and females had a treatment prevalence rate of 37.5%.
For Burntwood residents, the treatment prevalence of other mental disorders was 7.5% of males and 8.6% of females, this time significantly lower than for the Province at 11.5% for males and 14.0% for females (Table 6.6). In the Thicket Portage/Pikwitonei/Wabowden District, the treatment prevalence for other mental disorders was 9.2% for males and 8.3% in females. In the Shamattawa/ York Landing/ Split Lake/ War Lake District, treatment prevalence was lower still, with treatment prevalence in males at 4.2% and in females 6.2%. For residents of the Burntwood Region, and the two districts, the treatment prevalence of other mental illness disorders were significantly lower than for the Province. Given the health status of residents in this northern region and these northern districts, these lower treatment prevalence rates cause questions to be raised concerning access to mental health services for residents of northern Manitoba.

Indicators of Northern Health: A Resource for Northern Manitobans and the Bayline Regional Round Table 47
Table 6.6 Mental Illness Treatment Prevalence by Burntwood Health District
District Treatment Prevalence of Cumulative Disorders+
Treatment Prevalence of Other Mental Illness Disorders*
Male Female Male Female Thompson m,f,d 24.2% 34.8% m,f 9.9% 9.8% Oxford H & Gods) m,f,d 25.7% 34.9% m,f 6.1% 6.1% Cross Lake m,f,d 25.8% 33.4% m,f 5.5% 7.0% Lynn/Leaf/SIL m,f,d 24.7% 40.1% m,f,d 5.4% 8.2% Island Lake m,f 15.3% 14.6% m,f 5.4% 6.9% Tad/Broch/Lac Br m,f,d 25.6% 43.0% m,f 4.0% 5.8% Gillam/Fox Lake f,d 22.2% 36.3% m,d 6.0% 10.0% Thick Por/Pik/Wab m,f,d 25.9% 41.0% f 9.2% 8.3% Norway House m,f,d 24.9% 33.9% m,d 9.1% 12.8% Sha/York/Split/War m,f,d 31.8% 37.5% m,f 4.2% 6.2% Nelson House m,f,d 36.2% 50.8% m,f 6.1% 8.2% Burntwood m,f,d 24.5% 33.7% m,f,d 7.5% 8.6% Manitoba d 18.8% 29.1% d 11.5% 14.0%
Source: Martens, P., Fransoo, R., McKeen, N. et al. (2004). Patterns of regional mental illness disorder diagnoses and services use in Manitoba: A population-based study. Winnipeg: Manitoba Centre for Health Policy.
+Percentage of individuals with any of 5 conditions - 1997-2001; *Rate of individuals with not any of 5 conditions 'm' indicates area's rate for males was statistically different from Manitoba average for males 'f' indicates area's rate for females was statistically different from Manitoba average for females 'd' indicates difference between male and female rates was statistically significant for that area 's' indicates data suppressed due to small numbers
One of the cumulative disorders, treatment prevalence of depression, was significantly lower for males than for females at the district, regional and provincial levels. (See Table 6.7.)
The treatment prevalence of depression was significantly higher among residents of the Burntwood Region at 8.9% for males and 18.4% for females compared to 12.6% for males and 23.6% for females in the Province as a whole. Questions arose as to whether the incidence and prevalence of depression were actually lower in the Region, or if the lower treatment prevalence was due to limited access to health services for treatment of depression. Given the rates of suicides among residents of northern Manitoba, lack of access to treatment for depression seems worth exploring as a contributing factor.
Males in the Thicket Portage/ Pikwitonei/ Wabowden District had a treatment prevalence for depression of 8.0%; males in Shamattawa/ York Landing/ Split Lake/ War Lake District had a higher treatment prevalence of 9.1%. Treatment prevalence of depression for females was 19.0% in the Thicket Portage/ Pikwitonei/ Wabowden District and 15.6% in the Shamattawa/ York Landing/ Split Lake/ War Lake District. (See Table 6.7.)
The treatment prevalence of substance abuse was significantly higher for residents of the Burntwood Region and of the two districts of interest than for residents of Manitoba. In addition, the treatment prevalence of substance abuse was significantly different for males and females at the provincial and the regional levels. Significantly more males than females were being treated for substance abuse at the Provincial level, while significantly more females than males were being treated at the Regional level. Treatment prevalence of substance abuse for Manitoba males
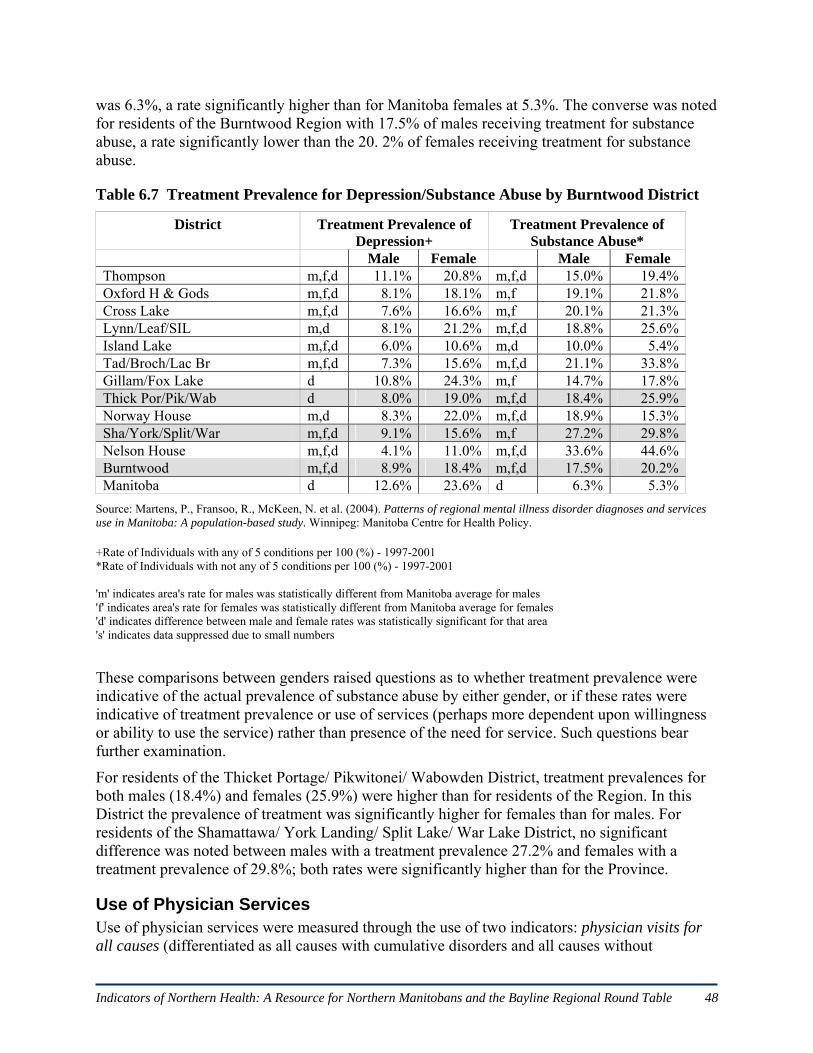
Indicators of Northern Health: A Resource for Northern Manitobans and the Bayline Regional Round Table 48
was 6.3%, a rate significantly higher than for Manitoba females at 5.3%. The converse was noted for residents of the Burntwood Region with 17.5% of males receiving treatment for substance abuse, a rate significantly lower than the 20. 2% of females receiving treatment for substance abuse.
Table 6.7 Treatment Prevalence for Depression/Substance Abuse by Burntwood District
District Treatment Prevalence of Depression+
Treatment Prevalence of Substance Abuse*
Male Female Male Female Thompson m,f,d 11.1% 20.8% m,f,d 15.0% 19.4%Oxford H & Gods m,f,d 8.1% 18.1% m,f 19.1% 21.8%Cross Lake m,f,d 7.6% 16.6% m,f 20.1% 21.3%Lynn/Leaf/SIL m,d 8.1% 21.2% m,f,d 18.8% 25.6%Island Lake m,f,d 6.0% 10.6% m,d 10.0% 5.4%Tad/Broch/Lac Br m,f,d 7.3% 15.6% m,f,d 21.1% 33.8%Gillam/Fox Lake d 10.8% 24.3% m,f 14.7% 17.8%Thick Por/Pik/Wab d 8.0% 19.0% m,f,d 18.4% 25.9%Norway House m,d 8.3% 22.0% m,f,d 18.9% 15.3%Sha/York/Split/War m,f,d 9.1% 15.6% m,f 27.2% 29.8%Nelson House m,f,d 4.1% 11.0% m,f,d 33.6% 44.6%Burntwood m,f,d 8.9% 18.4% m,f,d 17.5% 20.2%Manitoba d 12.6% 23.6% d 6.3% 5.3%
Source: Martens, P., Fransoo, R., McKeen, N. et al. (2004). Patterns of regional mental illness disorder diagnoses and services use in Manitoba: A population-based study. Winnipeg: Manitoba Centre for Health Policy.
+Rate of Individuals with any of 5 conditions per 100 (%) - 1997-2001 *Rate of Individuals with not any of 5 conditions per 100 (%) - 1997-2001 'm' indicates area's rate for males was statistically different from Manitoba average for males 'f' indicates area's rate for females was statistically different from Manitoba average for females 'd' indicates difference between male and female rates was statistically significant for that area 's' indicates data suppressed due to small numbers
These comparisons between genders raised questions as to whether treatment prevalence were indicative of the actual prevalence of substance abuse by either gender, or if these rates were indicative of treatment prevalence or use of services (perhaps more dependent upon willingness or ability to use the service) rather than presence of the need for service. Such questions bear further examination.
For residents of the Thicket Portage/ Pikwitonei/ Wabowden District, treatment prevalences for both males (18.4%) and females (25.9%) were higher than for residents of the Region. In this District the prevalence of treatment was significantly higher for females than for males. For residents of the Shamattawa/ York Landing/ Split Lake/ War Lake District, no significant difference was noted between males with a treatment prevalence 27.2% and females with a treatment prevalence of 29.8%; both rates were significantly higher than for the Province.
Use of Physician Services Use of physician services were measured through the use of two indicators: physician visits for all causes (differentiated as all causes with cumulative disorders and all causes without

Indicators of Northern Health: A Resource for Northern Manitobans and the Bayline Regional Round Table 49
cumulative disorders), and physician visits for mental illness. Rates for both indicators were calculated for the five year period from 1997/98 - 2001/02, using age-adjusted annual rates of visits per resident 10 years of age and older.
Physician visit rates for male residents of the Burntwood Region, all causes with or without cumulative disorders as well as for mental illness were significantly lower than for the Province of Manitoba for males. Rates for females with the exception of the regional female rate for those without a cumulative disorder were statistically lower than Manitoba averages (Table 6.8).
Table 6.8 Physician Visits for All Causes/Mental Illness by Burntwood Health District
District Physician Visits for All Causes+ Physician Visits for Mental Illness*
Male Female Male Female With
disorder No
disorder With
disorder No
disorder
Thompson 1,0,d 5.4 2.7 1,d 7.4 3.9 m,f 0.7 0.8Oxford H & Gods 0,d 5.5 2.1 0,d 6.9 2.9 f 0.8 0.6Cross Lake 1,0,d 5.2 2.4 1,d 6.3 3.6 m,f 0.4 0.5Lynn/Leaf/SIL 1,d 5.1 2.8 d 8.5 4.4 m,f,d 0.5 0.8Island Lake 1,0,d 4.8 2.3 1,d 6.4 3.6 m,f 0.6 0.6Tad/Broch/Lac Br 1,0,d 3.5 1.3 1,0,d 4.6 2.4 m,f 0.4 0.3Gillam/Fox Lake d 6.0 3.6 0,d 10.3 5.9 m,f 0.6 0.6Thick Por/Pik/Wab d 5.6 2.4 d 6.7 3.4 m,f 0.4 0.4Norway House 0,d 7.2 3.6 0,d 10.1 5.8 m,f 0.8 0.6Sha/York/Split/War 1,0,d 3.9 2.0 1,d 6.0 3.5 m,f 0.4 0.5Nelson House 1,0,d 4.2 1.8 1,d 6.4 3.3 m,f 0.3 0.4Burntwood 1,0,d 5.2 2.6 1,d 7.4 3.9 m,f 0.6 0.6Manitoba d 7.1 3.1 d 8.7 4.0 d 1.5 1.6
Source: Martens, P. et al. (2004). Patterns of regional mental illness disorder diagnoses and services use in Manitoba: A population-based study. Winnipeg: Manitoba Centre for Health Policy.
+All-Cause Physician Visit Rates for Males With and Without Cumulative Disorders by RHA, 1997/98-2001/02, Age-adjusted annual rate of visits per resident aged 10 years + *Visit Rates to All Physicians for Mental Illness Disorders for those With Cumulative Disorders by District, 1997/98-2001/02, Age-adjusted annual rate of visits per resident aged 10 years + '1' indicates area's rate for those with disorder was statistically different from MB average with disorder '0' indicates area's rate for those without disorder was statistically different from MB average without disorder 'd' indicates difference between two groups' rates was statistically significant for that area 's' indicates data suppressed due to small numbers 'm' indicates area's rate for males was statistically different from Manitoba average for males 'f' indicates area's rate for females was statistically different from Manitoba average for females 'd' indicates difference between male and female rates was statistically significant for that area 's' indicates data suppressed due to small numbers
For residents of the Thicket Portage/ Pikwitonei/ Wabowden District the ‘visits for all causes’ rates for those with a cumulative disorder were significantly different than the rates for those without a cumulative disorder (for males and females). Visits for all causes rates for the District were not significantly different from the Provincial rates. The rates for physician visits for

Indicators of Northern Health: A Resource for Northern Manitobans and the Bayline Regional Round Table 50
mental illness were significantly lower for males and females living in this District when compared to the rates for the Province.
For male residents of the Shamattawa/ York Landing/ Split Lake/ War Lake District ‘visits for all causes’ rates were significantly lower for those with a cumulative disorder and those without a cumulative disorder compared to the Province; for female residents rates were significantly lower for those with a cumulative disorder. Again the rates for physician visits for mental illness were significantly lower than for the Province.
Despite the higher prevalence of mental illness among residents of the Burntwood Region, health care utilization rates, measured as physician visits for all causes and physician visits for mental illness were significantly lower than for residents of Manitoba.
Demographics of Burntwood Region Exploring the characteristics of populations can be useful in planning health services and in understanding the other important factors that contribute to health and well-being of individuals and their communities. Demographic details describing characteristics of the population of the Burntwood Region were compared to those of the Province of Manitoba as a whole. The statistics used were taken from the 2001 Canadian census. One in every five people or 20% of the population was provided with a more detailed census form used to gather additional information about the characteristics of the population. The data from this sample were weighted to estimate the entire population. The demographics for Burntwood and for Manitoba included in this section of the report were based upon responses from the 20% sample of the population.
Demographics were provided for the total population of the Burnwood Region and for the Aboriginal Identity Population. The Aboriginal Identity Population was comprised of those individuals who identified themselves as being of Aboriginal decent when they completed the census. Since a large proportion of the residents of the Burntwood Region (73%) identified with at least one Aboriginal group, the AIP population information has been included.
Population by Age and Gender As seen in Table 6.9, in 2001 the total population when calculated from the 20% sample was 42,995 for the Burntwood Region and 1,103,695 for Manitoba. Occasionally male and female subtotals when added together did not equal the reported total, due to weighting of data to estimate the population (Statistics Canada. 2002c).
The proportions of the population for every age group from 0 to 4 years of age through to 30 to 34 years of age was higher in the Burntwood Region than for the Province, demonstrating a much younger population in the North than for the Province in its entirety. The greatest differences were noted in the two youngest age groups 0 to 4 years and 5 to 9 years of age, with almost 24% of residents in Burntwood Region being under 10 years of age compared to the Province with almost 14% of its population under the age of 10 years. At the other end of the age spectrum, barely 3% of the Burntwood population was aged 65 years and older compared to just over 13% of the Province.

Indicators of Northern Health: A Resource for Northern Manitobans and the Bayline Regional Round Table 51
Table 6.9 Population of Burntwood Region and Manitoba by Age and Gender, 2001
Burntwood Manitoba Age Male Female Total % Male Female Total %
Total 22030 20970 42,995 100 542895 560800 1,103,695 100 0-4 2505 2440 4,945 11.5 36695 34335 71,030 6.4 5-9 2695 2585 5,280 12.3 41370 39405 80,775 7.3 10-14 2540 2345 4,885 11.4 41970 40605 82,575 7.5 15-19 1980 1955 3,935 9.2 40890 38810 79,700 7.2 20-24 1580 1605 3,185 7.4 35850 36435 72,285 6.5 25-29 1595 1685 3,280 7.6 34900 35095 69,995 6.3 30-34 1685 1695 3,380 7.9 35800 36460 72,260 6.5 35-39 1705 1580 3,285 7.6 42950 43870 86,820 7.9 40-44 1435 1280 2,715 6.3 44225 44735 88,960 8.1 45-49 1215 1100 2,315 5.4 40220 41390 81,610 7.4 50-54 1110 920 2,030 4.7 35930 36765 72,695 6.6 55-59 750 660 1,410 3.3 27165 27625 54,790 5.0 60-64 535 430 965 2.2 21705 22805 44,510 4.0 65-74 505 450 955 2.2 36225 40835 77,060 7.0 75+ 205 240 445 1.0 27005 41630 68,635 6.2
Source: Statistics Canada. (2007). 2001 Basic Profile (table). Health regions: boundaries and correspondence with census geography. 2001 Census. Statistics Canada Catalogue no. 82-402-XWE. Ottawa. December 12. http://www.statcan.ca/bsolc/english/bsolc?catno=82-402-X (accessed November 13, 2008).
Aboriginal Identity Population The total population of the Burntwood Region was 42,995, and the Aboriginal Identity Population (AIP) totalled 31,235 people. Some 73% of the population of the Burntwood Region was included in the Aboriginal Identity Population, compared to the Province at 14%. Statistics Canada (2002d) defined ‘Aboriginal Identity Population’ as composed of those persons who reported identifying with at least one Aboriginal group, that is, North American Indian, Métis or Inuit, and/or who reported being a Treaty Indian or a Registered Indian, as defined by the Indian Act of Canada, and/or who were members of an Indian Band or First Nation. (See Table 6.10.)
Table 6.10 Aboriginal Identity Population of Burntwood Region and Manitoba, 2001
Burntwood Region Manitoba Aboriginal Identity
Total % AIP % non-
Ab Total % AIP % non-
Ab Total Population 42,995 72.6 27.4 1,103,695 13.6 86.4 Total AIP 31,235 100.0 -- 150,040 100.0 --
North American Indian 28,265 90.0 -- 90,340 60.0 -- Métis 2,450 7.8 -- 56,795 37.0 -- Inuit 15 0.05 -- 345 0.2 -- Multiple Aboriginal response 45 0.1 -- 500 0.3 -- Other Aboriginal response 455 1.5 -- 2,060 1.4 --
Non-Aboriginal 11,765 -- 100.0 953,660 -- 100.0 Source: Statistics Canada (2002); Census Aboriginal Population Profiles (2001).

Indicators of Northern Health: A Resource for Northern Manitobans and the Bayline Regional Round Table 52
Some 90% of those living in the Burntwood Region and who identified with at least one Aboriginal group, indicated that identity to be North American Indian; about 8% identified with the Métis. On a provincial level 60% of those who indicated Aboriginal identity specified North American Indian; 37% specified Métis.
As seen in Table 6.11, the distribution by age of those who identified themselves as Aboriginal and who resided in the Burntwood Regions was very similar to the age distribution for the total AIP in the Province of Manitoba. Larger proportions of the populations in both Burntwood and Manitoba were noted for younger age groups with very small proportions of the populations in the older age groups of 65 years of age and older.
Table 6.11 Aboriginal Identity Population by Age, Burntwood Region and Manitoba 2001
Source: Statistics Canada (2002); Census Aboriginal Population Profiles (2001).
Legal Marital and Common-Law Status Researchers at Statistics Canada provided data on legal marital status of Canadians by using five categories including single (never married), married (including common law), separated, divorced, and widowed. (See Table 6.12.)
Table 6.12 Marital Status for Burntwood Region and Manitoba
Burntwood Region Manitoba Marital Status Total % Total %
Pop. > 15 years 27,895 100.0 869,315 100.0 Single 12,385 44.4 275,150 31.7 Married 12,545 45.0 455,915 52.4
Common-law 3,405 59,410 Separated 840 3.0 24,445 2.8 Divorced 1,185 4.2 56,305 6.5 Widowed 945 3.4 57,505 6.6
Source: Statistics Canada. (2007). 2001 Basic Profile (table). Health regions: boundaries and correspondence with census geography. 2001 Census. Statistics Canada Catalogue no. 82-402-XWE. Ottawa. December 12. http://www.statcan.ca/bsolc/english/bsolc?catno=82-402-X (accessed November 13, 2008).
Burntwood AIP Manitoba AIP Age Group Total % Total %
Total 31,230 100.0 150,040 100.0 Age 0-4 4,200 13.0 17,995 12.0 Age 5-14 8,405 27.0 36,065 24.0 Age 15-19 3,110 10.0 14,395 9.5 Age 20-24 2,500 8.0 11,610 8.0 Age 25-44 8,470 27.1 43,710 29.0 Age 45-54 2,225 7.1 13,305 9.0 Age 55-64 1,315 4.2 7,410 5.0 Age 65-74 665 2.1 3,755 2.5 Age 75-84 285 1.0 1,460 1.0 Age 85+ 60 0.2 330 0.2 Median age 19.8 19.8 22.8 22.8

Indicators of Northern Health: A Resource for Northern Manitobans and the Bayline Regional Round Table 53
In 2001, 44.4% of the total population of the Burntwood Region (15 years of age and older) were single and had never married, compared to 31.7% of the total provincial population. Some 45% of the total population of the Burntwood Region considered themselves to be married including common-law, compared to the total provincial population at 52.4%. Higher proportions of the population of the Burntwood Region reported living in a common law relationship (12.2%) compared with the provincial population (6.8%).
Aboriginal Identity Population In 2001, those who resided in the Burntwood Region and indicated Aboriginal Identity had reported marital status with a similar distribution when compared to the total Aboriginal Identity Population of the Province. For example, 50% of the AIP (15 years of age and older) residing in the Burntwood Region reported being single and never married compared to the AIP of Manitoba at 51%. The proportion of the Burntwood AIP who reported being married (including common-law) was 40% compared to the provincial AIP at 34%. Some 3% of the Burntwood AIP was divorced compared to the provincial AIP at 7%. (See Table 6.13.)
Table 6.13 Aboriginal Identity Population by Marital Status, Burntwood and Manitoba
Burntwood AIP Manitoba AIP Marital Status Total % Total %
Pop. > 15 years 18,630 100.0 95,975 100.0 Single 9,420 50.0 49,425 51.0 Married 7,380 40.0 32,400 34.0
Common-law 2,330 14,050 Separated 555 3.0 3,825 4.0 Divorced 550 3.0 6,630 7.0 Widowed 720 3.8 3,700 4.0
Source: Statistics Canada (2002); Census Aboriginal Population Profiles (2001).
Language Characteristics Knowledge of the official languages of English and French were tabulated for the total population of the Burntwood Region in comparison with the Province. As seen in Table 6.14, the greatest proportion of people in the Region (95%) and the Province (90%) reported having knowledge of the English language. Proportions speaking English and French were very small, and the proportion of those speaking only French was negligible. (See Table 6.14.)
Table 6.14 Language Characteristics for Burntwood Region and Manitoba
Burntwood Region Manitoba Language Total % Total %
Total population 42,995 100.0 1,103,700 100.0 English only 40,810 95.0 990,280 89.7 French only 0 0 1,250 0.1 English and French 950 2.2 10,840 9.3
Source: Statistics Canada. 2007. 2001 Basic Profile (table). Health regions: boundaries and correspondence with census geography. 2001 Census. Statistics Canada Catalogue no. 82-402-XWE. Ottawa. December 12. http://www.statcan.ca/bsolc/english/bsolc?catno=82-402-X (accessed November 13, 2008).

Indicators of Northern Health: A Resource for Northern Manitobans and the Bayline Regional Round Table 54
Aboriginal Identity Population Of the total Aboriginal Identity Population in the Burntwood Region 28% of individuals reported speaking English only, compared to 64% of the AIP in Manitoba. (See Table 6.15.)
Table 6.15 Language Characteristics for Burntwood Region and Manitoba AIP
Burntwood AIP Manitoba AIP Language Total % Total %
Total population 31,230 100.0 150,045 100.0 English only 8,795 28.2 95,530 64.0 French only 0 0.0 145 0.10 English and French only 100 0.3 10,245 7.0 Knowledge of Aboriginal language 22,320 71.5 43,215 29.0
% Aboriginal language(s) first learned/understood 63.7 24.6 % Aboriginal language(s) spoken at home 64.1 22.8
Source: Statistics Canada (2002); Census Aboriginal Population Profiles (2001).
Nearly 72% of the AIP in Burntwood Region had knowledge of Aboriginal language; 29% of the AIP in Manitoba had such knowledge. Some 64% of the AIP living in the Burntwood Region who had knowledge of Aboriginal language reported speaking an Aboriginal language in their homes, compared with about 23% of the AIP population of Manitoba.
Level of Schooling Levels of schooling have been calculated for the populations of Burntwood Region and Manitoba for those residents who were aged 20 years and older (Table 6.16). In 2001, about 19% of that population residing in the Burntwood Region had less than grade 9 education compared to the Province at 11%. Over 50% of Burntwood Region residents who were 20 years of and older had not graduated from high school; 34% of Manitobans of the same age had not graduated from high school. Similar proportions of the populations of Burntwood (10%) and Manitoba (11%) had some college or university education. Some 6% more Manitobans (28.5%) than Burntwood residents (22.4%) had a trades, college or university certificate or diploma. Almost double the proportion of Manitobans (14.3%) compared to Burntwood residents (7.8%) held a university degree at a bachelor level or higher.
Table 6.16 Schooling for Burntwood and Manitoba
Burntwood Manitoba Level of Schooling
Total % Total % Total population aged 20 years and older 23,955 100.0 789,615 100.0 Less than grade 9 4,650 19.4 86,810 11.0 Grade 9 - 13, less than high school graduation 7,545 31.5 185,090 23.4 High school graduation certificate 2,065 8.6 89,720 11.4 Some college or university education 2,450 10.2 90,160 11.4 Trades/college/university diploma or certificate 5,375 22.4 224,685 28.5 University degree at bachelor’s level or higher 1,880 7.8 113,150 14.3
Source: Statistics Canada. 2007. 2001 Basic Profile (table). Health regions: boundaries and correspondence with census geography. 2001 Census. Statistics Canada Catalogue no. 82-402-XWE. Ottawa. December 12. http://www.statcan.ca/bsolc/english/bsolc?catno=82-402-X (accessed November 13, 2008).

Indicators of Northern Health: A Resource for Northern Manitobans and the Bayline Regional Round Table 55
Aboriginal Identity Population While data for the total populations of Burntwood Region and Manitoba were available for those aged 20 years and older, the Aboriginal Identity Population data were available for persons aged 25 years and older. As seen in Table 6.17, some 63% of the Burntwood Aboriginal Identity Population had not completed high school compared to the Provincial AIP at 50%. Similar proportions of the AIP populations for the Region and the Province had graduated from high school or had some postsecondary education. Higher proportions of the Manitoba AIP had received postsecondary certificates or diplomas (25.5%) compared to the Regional AIP (17.3%). Similarly, 5.2% of the Manitoba AIP had received a university degree while 3.8% of the Burntwood AIP had completed a degree. (See Table 6.17.)
Table 6.17 Schooling for Burntwood and Manitoba AIP by Gender
Burntwood AIP Manitoba AIP Level of Schooling Total Male Female Total Male Female
Population aged 25 years and older 13,020 6,445 6,575 69,970 32,920 37,050Less than high school graduation 8,145 4,170 3,975 34,940 17,310 17,625High school graduation certificate 815 380 430 5,430 2,580 2,850Some postsecondary education 1,325 610 710 8,100 3,570 4,530Trades/college/university certificate or diploma 2,250 1,105 1,145 17,870 8,155 9,705University degree at bachelor’s level or higher 490 180 310 3,635 1,305 2,335% with less than high school grad 62.6 64.7 60.5 49.9 52.6 47.6% with high school graduation certificate 6.3 5.9 6.5 7.8 7.8 7.7% with some postsecondary education 10.2 9.5 10.8 11.6 10.8 12.2% with trades/college/university certificate or diploma 17.3 17.1 17.4 25.5 24.8 26.2% with a university degree at bachelor’s level or higher 3.8 2.8 4.7 5.2 4.0 6.3
Source: Statistics Canada (2002); Census Aboriginal Population Profiles (2001).
Earnings and Income Characteristics At first glance the employment income and labour force characteristics for residents of Burntwood Region appeared to be better than for the Province as a whole. Average employment incomes were slightly higher in the Region than in the Province overall, whether looking at all employment income or focusing on average employment income from full year, full time work. However, upon examination of the participation, employment and unemployment rates, the residents of the Burntwood Region fared much poorer than the residents of the Province as a whole. (See Table 6.18.)
In 2001, the average employment income of the total population of Burntwood aged 15 years and older was similar ($27,265) to that of the total population of Manitoba ($27,178). The average employment income of the population of Burntwood who worked full year full time was $40,913, with males earning about 33% more than females ($47,522 for males and $31,520 for females respectively). The average income for Manitobans who worked full year full time was

Indicators of Northern Health: A Resource for Northern Manitobans and the Bayline Regional Round Table 56
$36,729. Employment income made up over 80% of the income of the residents of the Burntwood Region compared to 75% of the income of provincial residents.
A review of labour force indicators for 2001 showed that the employment rate was 50% for Burntwood residents compared to 63% for residents of the Province. The employment rate for females of either population was lower than the employment rate for males. Further, the Burntwood Region population had an unemployment rate of 17.5%, which was approaching three times the Manitoba unemployment rate of 6.1%. The rates of unemployment in Burntwood Region for both the males at 20% and females at 14% were substantially higher than for the Manitoba population of males at 6% and females at 6%.
Table 6.18 Employment Income & Labour Force Indicators for Burntwood & Manitoba
Burntwood Manitoba Employment Income Total Male Female Total Male Female
Population 15 years & older with employment 17,395 9,495 7,905 609,575 320,670 288,905
Avg. employment income $ 27,265 32,984 20,396 27,178 32,312 21,480 # Worked full year full time 8,355 4,900 3,450 337,105 197,990 139,110
Avg. employment income $ 40,913 47,522 31,520 36,729 41,153 30,433 Employment income - % 80.9 75.3 Labour Force Indicators Total Male Female Total Male Female Participation rate % 60.4 65.5 55.0 67.5 73.7 61.7Employment rate % 49.8 52.3 47.1 63.4 69.0 58.1Unemployment rate % 17.5 20.1 14.3 6.1 6.3 5.7
Source: Statistics Canada. 2007. 2001 Basic Profile (table). Health regions: boundaries and correspondence with census geography. 2001 Census. Statistics Canada Catalogue no. 82-402-XWE. Ottawa. December 12. http://www.statcan.ca/bsolc/english/bsolc?catno=82-402-X (accessed November 13, 2008).
Aboriginal Identity Population The average employment income of the Burntwood AIP aged 15 years and older was similar ($18,220) to that of the AIP population of Manitoba ($19,271); both figures being substantially lower than the average employment income for total populations of Burntwood ($27,265) or Manitoba ($27,178) noted earlier. (See Table 6.19.)
Table 6.19 Employment Income & Labour Indicators for Burntwood & Manitoba AIP
Burntwood Manitoba Employment Income Total Male Female Total Male Female
Population 15 years & older with earnings 9,435 4,970 4,460 58,285 29,915 28,365
Avg. employment income $ 18,220 19,710 16,558 19,271 21,597 16,817# Worked full year full time 3,490 1,770 1,725 25,325 13,420 11,905
Avg. employment income $ 30,237 33,185 27,216 29,079 31,957 25,835Employment income - % 67.7 73.5 Labour Force Indicators Total Male Female Total Male Female Participation rate % 49.3 53.5 45.0 59.0 64.8 53.8Employment rate % 35.3 35.2 35.3 47.8 51.1 44.8Unemployment rate % 28.4 34.2 21.5 19.0 21.2 16.7
Source: Statistics Canada (2002); Census Aboriginal Population Profiles (2001).

Indicators of Northern Health: A Resource for Northern Manitobans and the Bayline Regional Round Table 57
The average employment income of the AIP in Burntwood that worked full year full time, was $30,237, with males earning about 16% more than females ($33,185 and $27,216 respectively). The average income for AIP in Manitoba who worked full year full time was $29,079. Employment income made up 68% of the income of the AIP in Burntwood Region compared to 74% of the income of the provincial AIP.
The employment rate was 35% for the Burntwood AIP compared to 48% for the provincial AIP. Both figures were considerably lower than for total populations of the Region (50%) or the Province (63%). Further, the Burntwood Region AIP had an unemployment rate of 28.4% compared to the overall regional unemployment rate of 17.5%. Similarly the Manitoba AIP had an unemployment rate of 19% compared to the overall provincial rate of 6.1%. The rates of unemployment for males of the AIP in the Region and Province were higher than for females.
Occupation Characteristics In the Burntwood Region, the highest numbers of people were employed in (a) sales and service; (b) trades, transport and equipment operation; or (c) social science, education, government, or religion. These categories with the highest numbers were similar for the Province, with business, finance and administration replacing the social science, education, government, or religion in the top three categories.
Occupation characteristics varied by gender within the Burntwood Region, with males employed more in trades, transport and equipment operation (2,690) compared to females (100); in primary industry (1,045) compared to females (25); and in natural and applied sciences (600) compared to females (90). On the other hand, females dominated employment in business, finance and administration (1,510) compared to males (355); social science, education, government and religion (1,475) compared to males (710); and health occupations (515) compare to males (135).
Table 6.20 Occupation Characteristics for Burntwood Region and Manitoba by Gender
Occupation Burntwood Manitoba Total Male Female Total Male Female Total – Experienced labour force 15,620 8,640 6,980 577,340 307,465 269,875Management 1,145 725 420 50,850 33,200 17,650Business, finance, administration 1,865 355 1,510 101,940 27,765 74,180Natural/applied sciences 690 600 90 26,695 21,370 5,320Health occupations 650 135 515 36,690 7,410 29,280Social science, education, government, religion 2,185 710 1,475 45,890 15,810 30,080Art, culture, recreation, and sport 175 80 95 12,170 5,710 6,465Sales and service 4,505 1,800 2,705 139,940 59,050 80,895Trades, transport, and equipment operation 2,790 2,690 100 85,640 80,540 5,105Primary industries 1,070 1,045 25 40,580 31,295 9,285Processing, manufacturing and utilities 520 485 35 36,950 25,325 11,620
Source: Statistics Canada. 2007. 2001 Basic Profile (table). Health regions: boundaries and correspondence with census geography. 2001 Census. Statistics Canada Catalogue no. 82-402-XWE. Ottawa. December 12. http://www.statcan.ca/bsolc/english/bsolc?catno=82-402-X (accessed November 13, 2008).

Indicators of Northern Health: A Resource for Northern Manitobans and the Bayline Regional Round Table 58
Occupation characteristics also varied similarly by gender within the Province, with males employed about 16 times more often in trades, transport and equipment operation (80,540) compared to females (5,105); about three times more often in primary industry (31,295) compared to females (9,285); and about four times more often in natural and applied sciences (21,370) compared to females (5,320). In Manitoba, the female population also dominated employment in business, finance and administration (74,180) by about three times the male population (27,765) employed in that field. Females doubled the male population employed in social science, education, government and religion and quadrupled the male population in the health occupations.
Aboriginal Identity Population A review of occupation characteristics of the AIP for Burntwood showed that both the total numbers of males and females in the AIP labour forces were most likely to work in sales and service, followed by trades, transport and equipment operation. In the trades, employment of males strongly outweighed females for both the Region and the Province.
Table 6.21 Occupation Characteristics for Burntwood and Manitoba AIP by Gender
Occupation Burntwood AIP Manitoba AIP Total Male Female Total Male Female Total - Experienced labour force 8,005 4,255 3,750 53,130 27,725 25,405 Management 540 370 170 3,225 1,895 1,330 Business, finance, and administration 875 150 725 7,730 1,645 6,080 Natural/applied sciences 100 80 20 1,200 905 295 Health occupations 275 50 220 2,390 415 1,975 Social science, education, government, religion 1,230 390 835 5,320 1,515 3,810 Art, culture, recreation, and sport 100 45 55 905 480 425 Sales and service 2,830 1,195 1,635 15,700 6,155 9,545 Trades, transport, equipment operation 1,505 1,455 55 10,115 9,515 600 Primary industries 365 340 25 2,945 2,510 440 Processing, manufacturing/ utilities 190 175 15 3,595 2,685 910
Source: Statistics Canada (2002); Census Aboriginal Population Profiles (2001).
Males also dominated employment in primary industries as well as processing, manufacturing and utilities for both the Region and the Province, while females dominated employment in business, finance and administration as well as health occupations.
Family, Household, and Private Dwelling Characteristics According to the 2001 census, about 73% of families living in the Burntwood Region were couple families in structure, including those who reported being married-couple families (6,135) and those who reported living as common-law families (1700). About 84% of families living in the Province reported being couple families. Some 2,930 lone-parent families resided in the Region with 75% of those families being female lone-parent families compared to the Province with 82% of lone-parent families being headed by females. (See Table 6.22.)

Indicators of Northern Health: A Resource for Northern Manitobans and the Bayline Regional Round Table 59
Table 6.22 Family and Household Characteristics for Burntwood & Manitoba
Family Structure Burntwood Manitoba Total # of couple families by family structure 7,835 253,690
# married-couple families 6,135 224,055 # of common-law families 1,700 29,635
Total # of lone-parent families 2,930 49,160 # female lone-parent families 2,205 40,095 # male lone-parent families 730 9,060
Household Income Total Total Average household income ($) all households 48,869 50,756 Median household income ($) 40,289 41,661
Private Dwelling s Total % Total % Total # of private households or dwellings 11,975 100.0 432,550 100.0
# of owned dwellings 3,945 33.0 293,295 67.8 # of rented dwellings 3,630 30.3 128,925 29.8 # of band dwellings 4,395 36.7 10,330 2.4
Source: Statistics Canada. (2007). 2001 Basic Profile (table). Health regions: boundaries and correspondence with census geography. 2001 Census. Statistics Canada Catalogue no. 82-402-XWE. Ottawa. December 12. http://www.statcan.ca/bsolc/english/bsolc?catno=82-402-X (accessed November 13, 2008).
The average household income for Burntwood Region ($48,869) was lower than for the Province as a whole ($50,756). The median or the mid-point of all household incomes for Burntwood was $40,298 compared to the Province $41,661. In the Burntwood Region, about 1/3 or 33% of households owed their homes, compared with more than 2/3 or 68% of households in the Province. Similar proportions of the populations of the Region (30%) and the Province (30%) reported renting their homes. In the Burntwood Region over 1/3 or 37% of residents reported living in band dwellings while for the Province 2.4% reported living in band dwellings.
Aboriginal Identity Population Data related to family status were provided in a different format for the Aboriginal Identity Populations and total numbers of individuals in families were noted compared with the numbers of families in the previous section for the total populations. Some comparisons have been made using the proportions of individuals in each category.
Some 23% of individuals identifying as AIP in Burntwood Region were spouses, compared to 21% of the AIP of Manitoba. In Burntwood Region 8% of the AIP reported being a lone-parent compared with 8.8% of the AIP of Manitoba. Some 53% of the Burntwood AIP were children in census families compared with 47% of the Provincial AIP. About 8% of those indicating identity with the AIP in Burntwood considered themselves to be “non-family persons” compared to about 13% of the Provincial AIP. (See Table 6.23.)
The median or the mid-point of all household incomes for the Burntwood AIP was $29,360 compared to the Provincial AIP at $30,290. Both AIP had median household incomes that were much lower than the medians for the total Burntwood Region at $40,298 and the Province as a whole at $41,661.

Indicators of Northern Health: A Resource for Northern Manitobans and the Bayline Regional Round Table 60
Some 17% of the Burntwood AIP owned their homes, while 27% rented and 56% lived in “other dwellings” such as band housing. Meanwhile, 38% of the Provincial AIP population reported owning homes, compared to 44% who rented and 19% who lived in other dwellings.
Table 6.23 Family and Household Characteristics for Burntwood and Manitoba AIP
Family Status Burntwood Manitoba Total # people identifying as AIP 31,215 149,210
# spouses 7,225 31,755 # of common-law partners 2,335 13,990 # of lone-parents 2,535 13,180 # children in census families 16,575 70,375 # non family persons 2,555 19,900
Household Income Total Total Median household income ($) 29,360 30,290
Private Dwelling s Total % Total % Total # of private households or dwellings 7,785 100.0 55,035 100.0
# of owned dwellings 1,295 16.6 20,695 37.6 # of rented dwellings 2,110 27.1 24,040 43.7 # of other dwellings 4,380 56.3 10,300 18.7
Source: Statistics Canada (2002); Census Aboriginal Population Profiles (2001).
Demographics of Division 22 Earlier in this section, VI Burntwood Region and Bayline Communities, health indicators were discussed related to health status, measures of illness, preventative care measures, health care utilization and mental health. These indicators were provided for the Region and Districts within the Region as the “closest to home” data available. To provide demographic information that was consistent with the health indicators, population characteristics were reported for the Region as a whole compared to the Province as a whole. In addition Aboriginal Identify Population characteristics were provided for Burntwood Region and for the Province.
Data by census divisions and sub-divisions were considered to be less useful as they were not consistent with the population groupings by region used to provide data related to health indicators. However, this familiar geographical organization of data has been included to demonstrate community populations by using census division categorization of Census Division 22 which included Thompson and the many communities in the surrounding area. Population counts were provided for the 2006 census, the 2001 census and the percentage of change (Table 6.24). When this report was developed, regional data were not available in detail for 2006. As a result, this table also provided opportunity to share some population data at a 2006 level. The Bayline Communities located in Census Division 22 were shaded for easy identification.
Three of the Bayline Communities were located in Division 22, Unorganized Territory with the population of Pikwitonei showing a decline, the population of Thicket Portage showing some growth, and the population of Wabowden staying relatively stable. Ilford, as noted here, has also experienced a decline in population.
Statistics Canada (2002c) noted that geographic areas may change from one census to another. In order to facilitate comparison, the 2001 Census counts are adjusted to take into account boundary changes between the 2001 and 2006 census. The 2001 counts that were adjusted are identified by

Indicators of Northern Health: A Resource for Northern Manitobans and the Bayline Regional Round Table 61
the letter ‘A’. The letter ‘A’ may also refer to corrections to the 2001 counts usually the result of boundary changes. This symbol is also used to identify areas that have been created since 2001, such as newly incorporated municipalities (census subdivisions) and new designated places (DPLs).
Table 6.24 Population of Census Division 22 by Community
Geographic Name 2006 2001 % of Change Division No. 22 38,421 35,077 9.5 Cross Lake (19, 19A. 19E) 3,854 2,544E 51.49 Division No. 22, Unorganized 2,313 2,153AE …
Cross Lake 406 294 38.1 Gods Lake Narrows 88 113 -22.1 Island Lake 49 59 -16.9 Nelson House 0 54 -100.0 Norway House 521 456 14.3 Pikwitonei 91 117 -22.2 Red Sucker Lake 0 33 -100.0 Thicket Portage 156 137 13.9 Wabowden 498 497 0.2
Garden Hill First Nation 1,898 2,021 -6.1 God’s Lake 23 1,105 1,156 -4.4 God’s River 86A 556 471 18.0 Ilford 116 143 -18.9 Mystery Lake 147 5A 2840.0 Nelson House (170, 170A, 170B, 170C) 2,096 1,710 22.6 Norway House 4,071 3,950 3.1 Oxford House 24 1,947 1,731 12.5 Red Sucker Lake 1976 845 629 34.3 Source: Statistics Canada. (2002c). Community Profiles 2001.
…not applicable - In some cases the figure is deemed to be not appropriate or not applicable. In these cases the symbol, three dots (…) is displayed instead of a value. E use with caution - Population and dwelling count amendments - After the release of the 2001 Census population and dwelling counts, errors are occasionally uncovered in the data and it is not possible to make changes.
The next section of this report was included to focus on the Nor-Man Region and the Bayline Community of Cormorant located within that Region. Similar data regarding health, measures of illness, health care utilization and mental health, as well as demographics and discussion of the characteristics of the population have been included for the Region and the health districts within that Region.

Indicators of Northern Health: A Resource for Northern Manitobans and the Bayline Regional Round Table 62

Indicators of Northern Health: A Resource for Northern Manitobans and the Bayline Regional Round Table 63
VII Nor-Man Region and Bayline Communities In 2001, the Nor-Man Region had a population of 22,380 (Statistics Canada, 2002c). Each health region in Manitoba was made up of health districts. In the MCHP reports and the Nor-Man RHA reports, the Nor-Man Region was comprised of 3 districts, with some of the data being reported by district. The districts within Nor-Man Region included:
District 1: Flin Flon, Snow Lake, Cranberry Portage District 2: The Pas, Opaskwayak Cree Nation, RM of Kelsey District 3 or Nor-Man Other: Cormorant, Sherridon/Cold Lake, Easterville/ Chemawawin
FN, Grand Rapids/ Grand Rapids First Nation, Moose Lake/ Mosakahiken Cree Nation, Pukatawagan/Mathias Colomb First Nation)
(Nor-Man RHA, 2004; Martens et al, 2004) As one of the five communities comprising the Bayline Regional Round Table (BRRT), Cormorant was the only member community located in the Nor-Man Region. In this section, the health status of the population of the Nor-Man Region and the district that included Cormorant were examined and compared to the Province. The other community members of the BRRT were located in the Burntwood Region and were discussed in the previous section.
Two documents were used to provide information on the health and health care use of residents of Nor-Man Region and the districts therein. The first source was the report the MCHP Sex Differences in Health Status, Health Care Use, and Quality of Care: A Population-Based Analysis for Manitoba’s Regional Health Authorities (Fransoo et al, 2005). Comparisons included indicators or measures of health status, illness, preventative care, and health care utilization across regions. The second source by the MCHP entitled Patterns of Regional Mental Illness Disorder, Diagnoses, and Services Use in Manitoba: A Population-Based Study (Martens et al, 2004) provided information specifically on mental illness. Comparisons included treatment prevalences and physician visits.
While it can be informative to examine the health of the population located within the Nor-Man Region, information about the health districts within that region were also useful. Health status may differ between districts and communities within the Region. The sometimes considerable differences between the districts in the overall region can give a clearer understanding of the different needs of various communities. Circumstances differed as did populations; therefore the health of different districts that existed within the Nor-Man Region were illustrated. In the tables of this section, the comparisons of health districts included numbers and stated whether or not the differences were significant in comparison to the Province as a whole, not whether the differences were significant in comparison to the Region as a whole.
Health Status Some interesting trends emerged when examining the life expectancy, premature mortality rate, and potential years of life lost in the districts within the Nor-Man Region. When data of the three districts were separated and examined, residents of District 3 (Nor-Man RHA, 2004) or ‘Nor-Man Other’ (Martens et al, 2004), the district that included Cormorant, had the poorest health status compared to residents of the other two Nor-Man districts (Table 7.1).
Life expectancy among males and females living in the Nor-Man Region was lower than for residents of the Province as a whole. In looking at the 5-year life expectancy at birth (1999-2003)

Indicators of Northern Health: A Resource for Northern Manitobans and the Bayline Regional Round Table 64
residents of the ‘Nor-Man Other’ District (which included Cormorant) showed a male life expectancy of 69.4 years of age, a rate lower than the Nor-Man Region as a whole at 72.8 years. Female life expectancy for this District also was lower at 72.4 years of age compared to the Region at 77.8 years.
Premature mortality rates (PMR) for residents of the Nor-Man Region as a whole were significantly higher than for residents of the Province overall. Premature mortality rates for residents living in the ‘Nor-Man Other’ District also were significantly higher than rates for the Province and were higher than figures for the Nor-Man Region overall. In the Nor-Man Other District males had a PMR of 8.1 years per 1000 population aged 0-74 Years, (1999 – 2003) and females had a PMR of 6.8 years, compared to residents of the Nor-Man Region overall at 5.7 years per 1000 males and 4.1 years for females.
In the Nor-Man Region, the potential years of life lost were significantly higher for females when compared with the Province. Residents of the ‘Nor-Man Other’ District had the highest potential years of life lost (PYLL), although only the rate for females was significantly higher than the Province. The Nor-Man Other District had PYLL at 150.5 years per 1,000 population, aged 1-74 years (1999 – 2003) for males and 111.5 years for females, higher than the Nor-Man Region figures of 89.4 years for males and 65.3 years for females.
Table 7.1 Health Status and Mortality by Nor-Man District
District Life Expectancy# Premature Mortality Rate*
Potential Years of Life Lost+
Male Female Male Female Male Female F Flon/Snow L/Cran 75.5 79.1 4.3 3.3 54.5 55.5 The Pas/OCN/Kelsey 72.1 78.3 m,f,d 6.1 3.8 85.8 54.9 Nor-Man Other 69.4 72.4 m,f 8.1 6.8 f 150.5 111.5 Nor-Man 72.8 77.8 m,f,d 5.7 4.1 f 89.4 65.3 Manitoba 75.9 81.3 d 4.4 2.6 d 68.1 40.6
Source: Fransoo, R. et al. (2005). Sex differences in health status, health care use, and quality of care: A population-based analysis for Manitoba’s regional health authorities. Winnipeg: Manitoba Centre for Health Policy.
# 5 Year Life Expectancy at Birth, 1999-2003 *Premature Mortality Rate - Years per 1,000 population, Age 0-74 Years, 1999 – 2003 +Potential Years of Life Lost - Years per 1,000 population, Age 1-74 Years, 1999 - 2003 'm' indicates area's rate for males was statistically different from Manitoba average for males 'f' indicates area's rate for females was statistically different from Manitoba average for females 'd' indicates difference between male and female rates was statistically significant for that area 's' indicates data suppressed due to small numbers
Measures of Illness Treatment prevalence of diabetes and hypertension were used as measures of illness for comparative purposes. The diabetes treatment prevalence for those aged 20 to 79 years of age, during the period of 2001/02 - 2003/04, was significantly poorer for males (9.2%) and females (10.9%) living in the Nor-Man Region compared to males (7%) and females (6%) living in the Province overall. For residents of the Nor-Man Other District which included the community of Cormorant diabetes treatment prevalence was 10.2% for males and 20.9% for females, the highest rates of the three districts within the Nor-Man Region. (See Table 7.2.)

Indicators of Northern Health: A Resource for Northern Manitobans and the Bayline Regional Round Table 65
Hypertension treatment prevalence for residents of the Nor-Man Region aged 25 years and older was significantly lower for males than the rate for the males of similar age living in the Province overall. The hypertension treatment prevalence for residents of the Nor-man Other District was significantly lower at 17.3% for males and 20.7% for females compared to the Province at 24% and 25.9% respectively. Treatment prevalence for hypertension was the lowest in the Nor-Man Other District compared to all districts in the Region.
Table 7.2 Diabetes and Hypertension Treatment Prevalence by Nor-Man District
District Diabetes Treatment Prevalence+
Hypertension Treatment Prevalence*
Male Female Male Female F Flon/Snow L/Cran 7.7% 6.6% f,d 24.4% 29.9% The Pas/OCN/Kelsey m,f 10.2% 12.7% m,d 19.8% 23.9% Nor-Man Other m,f,d 10.2% 20.9% m,f 17.3% 20.7% Nor-Man m,f,d 9.2% 10.9% m,d 21.0% 25.4% Manitoba d 7% 6% d 24.0% 25.9%
Source: Fransoo, R. et al. (2005). Sex differences in health status, health care use, and quality of care: A population-based analysis for Manitoba’s regional health authorities. Winnipeg: Manitoba Centre for Health Policy.
+Diabetes Prevalence 2001/02-2003/04 per cent age 20-79 *Hypertension Prevalence 2001/02-2003/04 per cent age 25+ 'm' indicates area's rate for males was statistically different from Manitoba average for males 'f' indicates area's rate for females was statistically different from Manitoba average for females 'd' indicates difference between male and female rates was statistically significant for that area 's' indicates data suppressed due to small numbers
Preventive Care Measures Residents of the Nor-Man Region had lower rates of immunization for one-year olds (61.7% for males; 65.2% for females) compared with 82.7% for both males and females in the Province.
Table 7.3 Immunization of One and Two-Year Olds by Nor-Man Health District
District Immunization of One-Year Olds*
Immunization of Two-Year Olds+
Male Female Male Female F Flon/Snow L/Cran 83.1% 82.9% 74.0% 77.9% The Pas/OCN/Kelsey 74.9% 80.2% 70.6% 66.9% Nor-Man Other m 61.7% 65.2% m 48.1% 54.5% Nor-Man m 71.1% 75.4% 62.9% 64.3% Manitoba 82.7% 82.7% 69.8% 70.7%
Source: Fransoo, R. et al. (2005). Sex differences in health status, health care use, and quality of care: A population-based analysis for Manitoba’s regional health authorities. Winnipeg: Manitoba Centre for Health Policy.
*Proportion of children born 2001-2002 immunized at 1 year +Proportion of children born 2000-2001 immunized at 2 years 'm' indicates area's rate for males was statistically different from Manitoba average for males 'f' indicates area's rate for females was statistically different from Manitoba average for females 'd' indicates difference between male and female rates was statistically significant for that area 's' indicates data suppressed due to small numbers

Indicators of Northern Health: A Resource for Northern Manitobans and the Bayline Regional Round Table 66
The rates for two-year olds were lower, though not significantly so, when compared to the Province. In comparison to residents of the Province, the difference was significantly lower for one-year old male children living in the Nor-Man Region (71.1%) and significantly lower than the Province for both ages of male children living in the Norman Other District.
Among two-year olds born in 2001/02 in Manitoba, 69.8% of males and 70.7% of females were immunized. In Nor-Man, 62.9% of male children and 64.3% of female children were immunized, and in the Nor-Man Other District, 48.1% of males and 54.4% of females were immunized.
Health Care Utilization Health care utilization in the Nor-Man Region and in the different districts within the Region showed no clear patterns, save for much lower rates of visits to specialists. As specialist care in Manitoba is highly centralized, and with transportation issues in the North having great impact on how health care is accessed, these data were not surprising.
Ambulatory visit rates for residents of the Nor-Man Region in the years 2003/04 were higher than for residents of Manitoba as a whole, with males visiting physicians 4.5 times per year, compared to Manitoban males 4.4 times per year. Nor-Man females visited physicians 5.8 times per year compared to Manitoban females at 5.4 times per year. Physician visits for residents of the Nor-Man Other District were lower than for residents of the Nor-Man Region and significantly lower than for residents of Manitoba, despite the poorer health status in this District as discussed earlier in this report. Males living in this District visited physicians at a rate of 3.1 times per year, and females visited physicians at a rate of 4.6 times per year. (See Table 7.4.)
Ambulatory consultation rates in Manitoba were 0.3 visits for males and 0.3 visits for females. The rates for residents of the Nor-Man and the Other Nor-Man District were the same, at 0.2 visits among males and 0.3 visits among females.
Table 7.4 Physician Services by Nor-Man Health District
RHAs Ambulatory Visit Rates*
Ambulatory Consultation Rates+
Visit Rates to Specialists#
Male Female Male Female Male Female F Flon/Snow L/Cran d 4.7 5.7 m,f,d 0.2 0.2 d 0.4 0.4 The Pas/ OCN/Kelsey m,f,d 5.1 6.9 m,d 0.2 0.3 m,f,d 0.4 0.5 Nor-Man Other m,f,d 3.1 4.6 m,d 0.2 0.3 m,f,d 0.5 0.6 Nor-Man d 4.5 5.8 m,f,d 0.2 0.3 m,f,d 0.4 0.5 Manitoba d 4.4 5.4 d 0.3 0.3 d 1.2 1.3
Source: Fransoo, R. et al. (2005). Sex differences in health status, health care use, and quality of care: A population-based analysis for Manitoba’s regional health authorities. Winnipeg: Manitoba Centre for Health Policy.
*Ambulatory Physician Visit Rates 2003/04 per individual +Ambulatory Consult Rates 2003/04 per individual #Ambulatory Visit Rates to Specialists 2003/04 per individual 'm' indicates area's rate for males was statistically different from Manitoba average for males 'f' indicates area's rate for females was statistically different from Manitoba average for females 'd' indicates difference between male and female rates was statistically significant for that area 's' indicates data suppressed due to small numbers It is not surprising to find that visit rates to specialists were much lower for residents of the Nor-Man Region at 0.4 visits to a specialist per person among males and 0.5 visits per person among

Indicators of Northern Health: A Resource for Northern Manitobans and the Bayline Regional Round Table 67
females, compared to residents of Manitoba with a specialist visit rate among males of 1.2 visits per person, and a specialist visit rate among females of 1.3 visits per person. The numbers in the Nor-Man Other District were slightly higher, at 0.5 visits among males and 0.6 visits among females.
Information on hospital use was provided by looking at two indicators: total separation rates per 1000 population for 2003/04 and total hospital days rates per 1000 population for the same period (Table 7.5). Total separation rates for residents of the Nor-Man Region were significantly higher at 155.9 separations per 1000 population for males and 253.8 per 1000 population for females compared to residents of Manitoba at 126.6 separations per 1000 population for males and 162.0 per 1000 for females. Residents of the Nor-Man Other District had a separation rate of 178.1 for males and 370.5 for females. Both statistics were significantly higher than the Province and notably highest among residents of the three districts within the Nor-Man Region.
Individuals who lived in the Nor-Man Region were not only admitted to hospital more frequently, they stayed in hospital for periods that were longer than their peers in Manitoba. The Manitoba total hospital days rate was 878.2 for males and 998.1 for females. In Nor-Man, the rate was 1021.2 days for males and 1323.2 days for females. However, neither figure was significantly different than the Province. The total hospital days rate was higher for residents in the Nor-Man Other District, but only the female rate for the District (2013.7 days) was significantly higher than the Province (998.1 days).
Table 7.5 Hospital Services by Nor-Man Health District
RHAs Total Separation Rates* Total Hospital Days Rates+ Male Female Male Female
F Flon/Snow L/Cran d 138.7 198.6 968.1 1179.7 The Pas/OCN/Kelsey m,f,d 163.8 265.7 1001.3 1243.6 Nor-Man Other m,f,d 178.1 370.5 f 1300.1 2013.7 Nor-Man m,f,d 155.9 253.8 1021.2 1323.2 Manitoba d 126.6 162.0 878.2 998.1
Source: Fransoo, R. et al. (2005). Sex differences in health status, health care use, and quality of care: A population-based analysis for Manitoba’s regional health authorities. Winnipeg: Manitoba Centre for Health Policy.
*Hospital Separation Rates 2003/04 per 1000 +Total Hospital Days Rates 2003/04 per 1000 'm' indicates area's rate for males was statistically different from Manitoba average for males 'f' indicates area's rate for females was statistically different from Manitoba average for females 'd' indicates difference between male and female rates was statistically significant for that area 's' indicates data suppressed due to small numbers
Mental Health The mental health status of persons living in the Nor-Man Other District were examined and compared to residents of the Nor-Man Region overall and the Province. Two indicators were used for comparisons: treatment prevalence of cumulative disorders (depression, schizophrenia, anxiety, substance abuse and personality disorders) and treatment prevalence of other mental illness disorders (other disorders such as eating disorders, attention deficit disorders, and dementia) for males and females during the five-year period of 1997 to 2001.

Indicators of Northern Health: A Resource for Northern Manitobans and the Bayline Regional Round Table 68
Treatment Prevalence The treatment prevalence of cumulative disorders (depression, schizophrenia, anxiety, substance abuse and personality disorders) was a concept used to identify that individuals were treated for these diseases but did not confirm their diagnosis with these disorders. (See Table 7.6). The treatment prevalence of cumulative disorders was significantly different for males than for females at the provincial, regional and district levels. The rate for female residents of the Norman Region (32.6%) was significantly higher than for the Province (29.1%). Otherwise treatment prevalence rates for cumulative disorders at the Regional and Nor-Man Other District levels were not significantly different than the Province.
Treatment prevalence of other mental illness disorders (such as eating disorders, attention deficit disorders, and dementia) was significantly different for males and females at the provincial, regional and district levels. Treatment rates for females living in the Nor-Man Region (15.1%) were significantly higher than the Province (14.0%). Treatment rates for males living in the Nor-Man Other District (9.4%) were significantly lower than the Province (11.5%).
Table 7.6 Treatment Prevalence by Nor-Man Health District
District Treatment Prevalence of Cumulative Disorders+
Treatment Prevalence of Other Mental Illness Disorders*
Male Female Male Female F Flon/Snow L/Cran d 18.0% 27.4% m,d 9.0% 12.9%The Pas/OCN/Kelsey m,f,d 21.4% 38.2% m,f,d 14.4% 18.0%Nor-Man Other d 17.5% 29.8% m,d 9.4% 12.9%Nor-Man f,d 19.5% 32.6% f,d 11.4% 15.1%Manitoba d 18.8% 29.1% d 11.5% 14.0%
Source: Martens, P., Fransoo, R., McKeen, N. et al. (2004). Patterns of regional mental illness disorder diagnoses and services use in Manitoba: A population-based study. Winnipeg: Manitoba Centre for Health Policy.
+Rate of Individuals with any of 5 conditions per 100 (%) - 1997-2001 *Rate of Individuals with not any of 5 conditions per 100 (%) - 1997-2001 'm' indicates area's rate for males was statistically different from Manitoba average for males 'f' indicates area's rate for females was statistically different from Manitoba average for females 'd' indicates difference between male and female rates was statistically significant for that area 's' indicates data suppressed due to small numbers
Treatment prevalence for two of the cumulative disorders, depression and substance abuse were available for the five-year period from 1997 to 2001. It is evident in looking at the data that residents of the Nor-Man Region received treatment for depression at rates that were significantly lower than that of the Province and received treatment for substance abuse at rates that were significantly higher than that of the Province. (See Table 7.7.)
The proportion of male residents of the Nor-Man Region who received treatment for depression (10.2%) was significantly lower than the proportion of males residing in the Province who received treatment (12.6%). Similarly, the proportion of female residents of the Nor-Man Region who received treatment for depression (22.7%) was significantly lower than the proportion of females living in the Province who received treatment (23.6%). The proportions of males living in the Norman Other District (6.9%) and of females (19.9%) who received treatment for depression also were significantly lower than for the Province and lower than the rates for the residents of the Nor-Man Region overall.
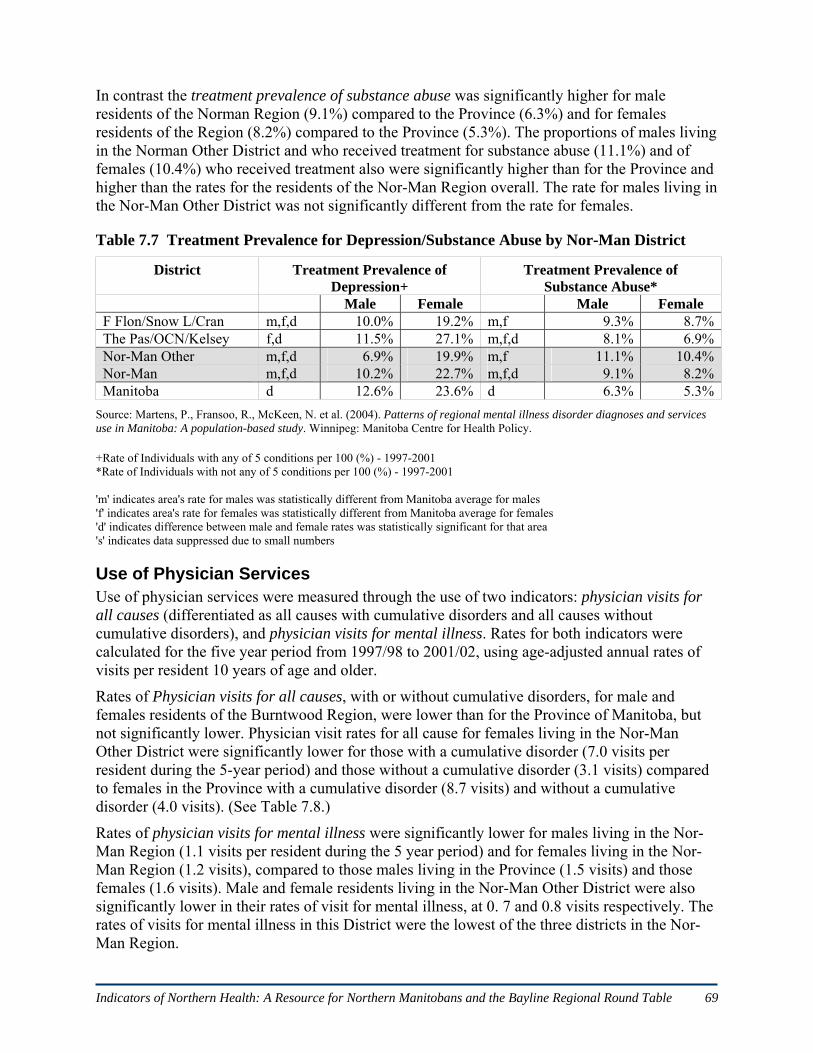
Indicators of Northern Health: A Resource for Northern Manitobans and the Bayline Regional Round Table 69
In contrast the treatment prevalence of substance abuse was significantly higher for male residents of the Norman Region (9.1%) compared to the Province (6.3%) and for females residents of the Region (8.2%) compared to the Province (5.3%). The proportions of males living in the Norman Other District and who received treatment for substance abuse (11.1%) and of females (10.4%) who received treatment also were significantly higher than for the Province and higher than the rates for the residents of the Nor-Man Region overall. The rate for males living in the Nor-Man Other District was not significantly different from the rate for females.
Table 7.7 Treatment Prevalence for Depression/Substance Abuse by Nor-Man District
District Treatment Prevalence of Depression+
Treatment Prevalence of Substance Abuse*
Male Female Male Female F Flon/Snow L/Cran m,f,d 10.0% 19.2% m,f 9.3% 8.7%The Pas/OCN/Kelsey f,d 11.5% 27.1% m,f,d 8.1% 6.9%Nor-Man Other m,f,d 6.9% 19.9% m,f 11.1% 10.4%Nor-Man m,f,d 10.2% 22.7% m,f,d 9.1% 8.2%Manitoba d 12.6% 23.6% d 6.3% 5.3%
Source: Martens, P., Fransoo, R., McKeen, N. et al. (2004). Patterns of regional mental illness disorder diagnoses and services use in Manitoba: A population-based study. Winnipeg: Manitoba Centre for Health Policy.
+Rate of Individuals with any of 5 conditions per 100 (%) - 1997-2001 *Rate of Individuals with not any of 5 conditions per 100 (%) - 1997-2001 'm' indicates area's rate for males was statistically different from Manitoba average for males 'f' indicates area's rate for females was statistically different from Manitoba average for females 'd' indicates difference between male and female rates was statistically significant for that area 's' indicates data suppressed due to small numbers
Use of Physician Services Use of physician services were measured through the use of two indicators: physician visits for all causes (differentiated as all causes with cumulative disorders and all causes without cumulative disorders), and physician visits for mental illness. Rates for both indicators were calculated for the five year period from 1997/98 to 2001/02, using age-adjusted annual rates of visits per resident 10 years of age and older.
Rates of Physician visits for all causes, with or without cumulative disorders, for male and females residents of the Burntwood Region, were lower than for the Province of Manitoba, but not significantly lower. Physician visit rates for all cause for females living in the Nor-Man Other District were significantly lower for those with a cumulative disorder (7.0 visits per resident during the 5-year period) and those without a cumulative disorder (3.1 visits) compared to females in the Province with a cumulative disorder (8.7 visits) and without a cumulative disorder (4.0 visits). (See Table 7.8.)
Rates of physician visits for mental illness were significantly lower for males living in the Nor-Man Region (1.1 visits per resident during the 5 year period) and for females living in the Nor-Man Region (1.2 visits), compared to those males living in the Province (1.5 visits) and those females (1.6 visits). Male and female residents living in the Nor-Man Other District were also significantly lower in their rates of visit for mental illness, at 0. 7 and 0.8 visits respectively. The rates of visits for mental illness in this District were the lowest of the three districts in the Nor-Man Region.

Indicators of Northern Health: A Resource for Northern Manitobans and the Bayline Regional Round Table 70
Table 7.8 Physician Visits for All Causes/ Mental Illness by Nor-Man Health District
District Physician Visits for All Causes+ Physician Visits for Mental Illness*
Male Female Male Female with
disorder no
disorder with
disorder no
disorder
F Flon/Snow L/Cran 0,d 7.1 3.5 0,d 9.2 4.4 m,f 1.1 1.2The Pas/OCN/Kelsey d 6.8 3.0 d 8.7 4.0 m,f 1.1 1.2Nor-Man Other 0,d 5.9 2.1 1,0,d 7.0 3.1 m,f 0.7 0.8Nor-Man d 6.7 3.0 d 8.5 4.0 m,f 1.1 1.2Manitoba d 7.1 3.1 d 8.7 4.0 d 1.5 1.6
Source: Martens, P., Fransoo, R., McKeen, N. et al. (2004). Patterns of regional mental illness disorder diagnoses and services use in Manitoba: A population-based study. Winnipeg: Manitoba Centre for Health Policy.
+All-Cause Physician Visit Rates for Males With and Without Cumulative Disorders by RHA, 1997/98-2001/02, Age-adjusted annual rate of visits per resident aged 10 years + *Visit Rates to All Physicians for Mental Illness Disorders for those With Cumulative Disorders by District, 1997/98-2001/02, Age-adjusted annual rate of visits per resident aged 10 years + 'm' indicates area's rate for males was statistically different from Manitoba average for males 'f' indicates area's rate for females was statistically different from Manitoba average for females 'd' indicates difference between male and female rates was statistically significant for that area 's' indicates data suppressed due to small numbers '1' indicates area's rate for those with disorder was statistically different from Manitoba average with disorder '0' indicates area's rate for those without disorder was statistically different from Manitoba average without disorder 'd' indicates difference between two groups' rates was statistically significant for that area 's' indicates data suppressed due to small numbers
Demographics of Nor-Man Region Exploring the characteristics of populations can be useful in planning health services and in understanding important factors that contribute to health and well-being of individuals and their communities. Demographic details describing characteristics of the Nor-Man Region were compared to those of the province of Manitoba as a whole. The statistics used were taken from the 2001 Canadian census. One in every five people or 20% of the population was provided with a more detailed census form used to gather additional information about the characteristics of the population. The data from this sample were weighted to estimate the entire population. The demographics for Nor-Man and for Manitoba included in this section of the report were based upon responses from the 20% sample of the population. Demographics were provided for the total population of the Nor-Man Region and for the Aboriginal Identity population. The Aboriginal Identity Population was comprised of those individuals who identified themselves as being of Aboriginal decent when they completed the census. Since a large proportion of the residents of the Nor-Man Region identified with at least one Aboriginal group (42.1%), the AIP population information has been included.
Population by Age and Gender As seen in Tables 7.9 in 2001 the total population of the Nor-Man Region calculated from the 20% sample was 23,380 and for the Province was 1,103,695. Occasionally male and female subtotals when added together did not equal the reported total, due to weighting of data to estimate the population (Statistics Canada. 2002c).

Indicators of Northern Health: A Resource for Northern Manitobans and the Bayline Regional Round Table 71
The proportions of the population for every age group from 0 to 4 years of age through to 20 to 24 years of age was higher in the Nor-Man Region than for the Province, demonstrating a much younger population than for the Province in its entirety. The greatest differences were noted in the two youngest age groups 0 to 4 years and 5 to 9 years of age, with almost 18% of residents in Nor-Man Region being under 10 years of age compared to the Province with almost 14% of its population under the age of 10 years. At the other end of the age spectrum, 8% of the Nor-Man population was aged 65 years and older compared to just over 13% of the Province.
Table 7.9 Population of Nor-Man Region and Manitoba by Age and Gender
Nor-Man Manitoba Age Male Female Total % Male Female Total %
Total 11305 11075 22,380 100 542895 560800 1,103,695 100 0-4 980 895 1,875 8.4 36695 34335 71,030 6.4 5-9 1045 995 2,040 9.1 41370 39405 80,775 7.3 10-14 980 985 1,965 8.8 41970 40605 82,575 7.5 15-19 890 990 1,880 8.4 40890 38810 79,700 7.2 20-24 650 725 1,375 6.1 35850 36435 72,285 6.5 25-29 745 745 1,490 6.6 34900 35095 69,995 6.3 30-34 765 700 1,465 6.5 35800 36460 72,260 6.5 35-39 825 875 1,700 7.6 42950 43870 86,820 7.9 40-44 1015 915 1,930 8.6 44225 44735 88,960 8.1 45-49 830 820 1,650 7.4 40220 41390 81,610 7.4 50-54 805 665 1,470 6.6 35930 36765 72,695 6.6 55-59 495 475 970 4.3 27165 27625 54,790 5.0 60-64 420 355 775 3.5 21705 22805 44,510 4.0 65-74 500 495 995 4.4 36225 40835 77,060 7.0 75+ 350 435 785 3.5 27005 41630 68,635 6.2
Source: Statistics Canada. (2007). 2001 Basic Profile (table). Health regions: boundaries and correspondence with census geography. 2001 Census. Statistics Canada Catalogue no. 82-402-XWE. Ottawa. December 12. http://www.statcan.ca/bsolc/english/bsolc?catno=82-402-X (accessed November 13, 2008).
Aboriginal Identity Population The total Nor-Man population in 2001 was 22,380, with 42.1% of the population self-identifying as being a member of an Aboriginal group. The Province had a self-identified Aboriginal population of just under 14% (See Table 7.10). Statistics Canada (2002d) defined ‘Aboriginal Identity Population’ (AIP) as composed of those persons who reported identifying with at least one Aboriginal group, that is, North American Indian, Métis or Inuit, and/or who reported being a Treaty Indian or a Registered Indian, as defined by the Indian Act of Canada, and/or who were members of an Indian Band or First Nation.
In the Nor-Man Region, a majority of those who self-identified as a member of an Aboriginal group, 68.6%, identified with the North American Indian group; 29.5% identified with the Métis. The remaining 1.7% identified as Inuit, “Multiple Aboriginal Response” or “Other Aboriginal Response”. In Manitoba as a whole, 60% of the AIP identified with the North American Indian group, and 37% identified with Métis.

Indicators of Northern Health: A Resource for Northern Manitobans and the Bayline Regional Round Table 72
Table 7.10 Aboriginal Identity Population of Nor-Man Region and Manitoba
Nor-Man Region Manitoba Aboriginal Identity
Total % AIP % non-
Ab Total % AIP % non-
Ab Total Population 22,385 42.1 57.9 1,103,695 13.6 86.4 Total AIP 9,430 100.0 -- 150,040 100.0 --
North American Indian 6,470 68.6 -- 90,340 60.0 -- Métis 2,785 29.5 -- 56,795 37.0 -- Inuit 10 0.1 -- 345 0.2 -- Multiple Aboriginal response 20 0.2 -- 500 0.3 -- Other Aboriginal response 135 1.4 -- 2,060 1.4 --
Non-Aboriginal 12,955 -- 100.0 953,660 -- 100.0 Source: Statistics Canada. 2007. Community Highlights for Norman Regional Health Authority (table). 2001 Census Aboriginal Population Profiles. Last updated January 2, 2007. http://www12.statcan.ca/english/profil01/AP01/Details/Page.cfm?Lang=E&Geo1=HR&Code1=4670&Geo2=PR&Code2=46&Data=Count&SearchText=norman&SearchType=Begins&SearchPR=46&B1=All&Custom= (accessed December 9, 2008).
As seen in Tables 7.11, the AIP population that resided in the Nor-Man Region was distributed similarly to the Manitoba AIP population. Larger portions of the populations in both Nor-Man and Manitoba were noted for younger age groups with very small proportions of the populations in the older age groups of 65 years of age and older.
Table 7.11 Aboriginal Identity Population by Age, Nor-Man Region and Manitoba
Nor-Man AIP Manitoba AIP Total % Total %
Total 9,425 100.0 150,040 100.0 Age 0-4 1,265 13.4 17,995 12.0 Age 5-14 2,270 24.0 36,065 24.0 Age 15-19 865 9.2 14,395 9.5 Age 20-24 675 7.2 11,610 8.0 Age 25-44 2,770 29.4 43,710 29.0 Age 45-54 800 8.5 13,305 9.0 Age 55-64 440 4.7 7,410 5.0 Age 65-74 215 2.3 3,755 2.5 Age 75-84 115 1.2 1,460 1.0 Age 85+ 10 0.1 330 0.2 Median age 22.3 22.3 22.8 22.8
Source: Statistics Canada. 2007. Community Highlights for Norman Regional Health Authority (table). 2001 Census Aboriginal Population Profiles. Last updated January 2, 2007. http://www12.statcan.ca/english/profil01/AP01/Details/Page.cfm?Lang=E&Geo1=HR&Code1=4670&Geo2=PR&Code2=46&Data=Count&SearchText=norman&SearchType=Begins&SearchPR=46&B1=All&Custom= (accessed December 9, 2008).
Legal Marital and Common-Law Status Researchers at Statistics Canada provided data on legal marital status of Canadians by using five categories including single (never married), married (including common law), separated, divorced, and widowed. Table 7.12 displays the frequencies (counts) of the various groups. In 2001, nearly 49% of the Nor-Man population (15 years of age and older) reported being married; this figure was similar to the overall Manitoba figure (52%). Nearly 6% of the Nor-Man

Indicators of Northern Health: A Resource for Northern Manitobans and the Bayline Regional Round Table 73
population was divorced; a figure comparable to the Province. Roughly 11% of Nor-Man population was living in a common-law relationship, a figure which was slightly higher than the corresponding Manitoba figure (6%).
Table 7.12 Marital Status for Nor-Man Region and Manitoba
Nor-Man Manitoba Marital Status Total % Total %
Pop. > 15 years 16,495 100.0 869,315 100.0 Single 5,895 35.7 275,150 31.7 Married 8,030 48.7 455,915 52.4
Common-law 1,875 59,410 Separated 480 2.9 24,445 2.8 Divorced 1,150 7.0 56,305 6.5 Widowed 935 5.7 57,505 6.6 Source: Statistics Canada. 2007. 2001 Basic Profile (table). Health regions: boundaries and correspondence with census geography. 2001 Census. Statistics Canada Catalogue no. 82-402-XWE. Ottawa. December 12. http://www.statcan.ca/bsolc/english/bsolc?catno=82-402-X (accessed November 13, 2008).
Aboriginal Identity Population As seen in Tables 7.13, 35% of the Nor-Man AIP (15 years of age and older) was married in 2001; the corresponding Manitoba AIP figure was 34%. About 7% of Nor-Man AIP was divorced, a figure which is comparable to the provincial AIP figure (7%).
Table 7.13 Aboriginal Identity Population by Marital Status, Nor-Man and Manitoba
Nor-Man AIP Manitoba AIP Marital Status Total % Total %
Pop. > 15 years 5,895 62.0 95,975 64.0 Single 2,915 49.9 49,425 51.0 Married 2,090 35.0 32,400 34.0
Common-law 910 14,050 Separated 195 3.0 3,825 4.0 Divorced 395 7.0 6,630 7.0 Widowed 295 5.0 3,700 4.0
Source: Statistics Canada. 2007. Community Highlights for Norman Regional Health Authority (table). 2001 Census Aboriginal Population Profiles. Last updated January 2, 2007. http://www12.statcan.ca/english/profil01/AP01/Details/Page.cfm?Lang=E&Geo1=HR&Code1=4670&Geo2=PR&Code2=46&Data=Count&SearchText=norman&SearchType=Begins&SearchPR=46&B1=All&Custom= (accessed December 9, 2008).
Language Characteristics Knowledge of the official languages of English and French were tabulated for the total population of the Nor-Man Region in comparison with the Province. As seen in Table 7.14 most (94.6%) of Nor-Man’s population reported speaking English only, somewhat higher than Manitoba's proportion of English only speakers (89.7%). Some 5% of the Nor-Man population and 9.3% of the Manitoba population reported speaking both French and English.

Indicators of Northern Health: A Resource for Northern Manitobans and the Bayline Regional Round Table 74
Table 7.14 Language Characteristics for Nor-Man Region and Manitoba
Nor-Man Region Manitoba Language Total % Total %
Total population 22,380 -- 1,103,700 100.0 English only 21,165 94.6 990,280 89.7 French only 0 0 1,250 0.1 English and French 1,120 5.0 102,840 9.3
Source: Statistics Canada. 2007. 2001 Basic Profile (table). Health regions: boundaries and correspondence with census geography. 2001 Census. Statistics Canada Catalogue no. 82-402-XWE. Ottawa. December 12. http://www.statcan.ca/bsolc/english/bsolc?catno=82-402-X (accessed November 13, 2008).
Aboriginal Identity Population As seen in Table 7.15, some 64% of the AIP who resided in the Nor-Man Region reported speaking English only. Nearly 35% of the AIP in the Nor-Man Region reported having knowledge of Aboriginal language; compare to Manitoba residents at 29%. Nearly 30% of the Nor-Man AIP who had knowledge of Aboriginal language reported speaking their primary Aboriginal language at home, compared to nearly 23% of the Manitoba AIP.
Table 7.15 Language Characteristics for Nor-Man Region and Manitoba AIP
Nor-Man Manitoba Language Total % Total %
Total population 9,430 -- 150,045 -- English only 6,035 64.0 95,530 63.7 French only 0 0.0 145 0.1 English and French 115 1.2 10,245 6.8 Knowledge of Aboriginal. language 3,270 34.7 43,215 28.8
% Aboriginal language(s) first learned/understood -- 31.6 -- 24.6 % Aboriginal language(s) spoken at home -- 29.2 -- 22.8
Source: Statistics Canada. 2007. Community Highlights for Norman Regional Health Authority (table). 2001 Census Aboriginal Population Profiles. Last updated January 2, 2007. http://www12.statcan.ca/english/profil01/AP01/Details/Page.cfm?Lang=E&Geo1=HR&Code1=4670&Geo2=PR&Code2=46&Data=Count&SearchText=norman&SearchType=Begins&SearchPR=46&B1=All&Custom= (accessed December 9, 2008).
Level of Schooling Levels of schooling have been calculated for the populations of the Nor-Man Region and Manitoba for those residents who were aged 20 years and older (Table 7.16). In the Nor-Man Region, 26.1% of the population had completed less than high school graduation, compared to 23.4% of the Manitoba population. Some 9.4% of the Nor-Man population reported having attained a high school graduation certificate, while 11.4% of Manitobans reported the same. In the Nor-Man Region, however, some 33.2% of respondents reported having a trades, college or university certificate; a proportion higher than for the Province of Manitoba, at 28.5%. Meanwhile, in the Nor-Man Region, 9.6% of individuals reported attaining a Bachelor's degree or higher, compared to 14.3% of Manitobans.

Indicators of Northern Health: A Resource for Northern Manitobans and the Bayline Regional Round Table 75
Table 7.16 Schooling for Nor-Man Region and Manitoba by Age & Gender
Nor-Man Manitoba Level of Schooling Total % Total %
Total population 20 years and older 14,615 100.0 789,615 100.0 Less than grade 9 1,635 11.2 86,810 11.0 Less than high school graduation 3,810 26.1 185,090 23.4 High school graduation certificate 1,380 9.4 89,720 11.4 Some college or university education 1,540 10.5 90,160 11.4 Trades/college/university diploma or certificate 4,845 33.2 224,685 28.5 University degree at bachelor’s level or higher 1,405 9.6 113,150 14.3 Source: Statistics Canada. 2007. 2001 Basic Profile (table). Health regions: boundaries and correspondence with census geography. 2001 Census. Statistics Canada Catalogue no. 82-402-XWE. Ottawa. December 12. http://www.statcan.ca/bsolc/english/bsolc?catno=82-402-X (accessed November 13, 2008).
Aboriginal Identity Population While data for the total populations of Nor-Man Region and Manitoba were available for those aged 20 years and older, the Aboriginal Identity Population data were available for persons aged 25 years and older. As seen in Table 7.17, slightly less than 7% of residents of the Nor-Man Region who comprised the AIP had a completed high school education, with males having a higher graduation percentage than females (8% and 5% respectively). Nearly 30% of the Nor-Man Region AIP had a completed trades, college or university education below the bachelor’s level. About 3% of the AIP had a university degree at the bachelor’s level or higher with females having a slightly higher percentage than males (4% and 3% respectively).
Table 7.17 Schooling for Nor-Man and Manitoba AIP by Gender
Nor-Man Manitoba Level of Schooling Total Male Female Total Male Female
Population 25 years and older 4,350 2,175 2,175 69,970 32,920 37,050 Less than high school graduation 2,075 1,030 1,045 34,940 17,310 17,625 High school graduation certificate 285 185 105 5,430 2,580 2,850 Some postsecondary education 570 265 300 8,100 3,570 4,530 Trades/college/university certificate or diploma 1,280 645 640 17,870 8,155 9,705 University degree at bachelor’s level or higher 145 60 85 3,635 1,305 2,335 % with less than high school grad 47.7 47.4 48.0 49.9 52.6 47.6 % with high school graduation certificate 6.6 8.5 4.8 7.8 7.8 7.7 % with some postsecondary education 13.1 12.2 13.8 11.6 10.8 12.2 % with trades/college/university certificate or diploma 29.4 29.7 29.4 25.5 24.8 26.2 % with university degree at bachelor’s level or higher 3.3 2.8 3.9 5.2 4.0 6.3
Source: Statistics Canada. 2007. Community Highlights for Norman Regional Health Authority (table). 2001 Census Aboriginal Population Profiles. Last updated January 2, 2007. http://www12.statcan.ca/english/profil01/AP01/Details/Page.cfm? Lang=E&Geo1=HR&Code1=4670&Geo2=PR&Code2=46&Data=Count&SearchText=norman&SearchType=Begins&SearchPR=46&B1=All&Custom= (accessed December 9, 2008).

Indicators of Northern Health: A Resource for Northern Manitobans and the Bayline Regional Round Table 76
Earnings and Income Characteristics As seen in Table 7.18, in 2001, the average earnings of the Nor-Man population who worked the full year, full time was $42,175, with males earning more than females ($49,040 and $31,306 respectively). The total figure was about 22% higher than the total Manitoba figure of $36,729. While on initial review, those individuals who worked full year, full time in Nor-Man seemed to have fared better than their peers in Manitoba, a review of labour force indicators showed that, in 2001, the unemployment rate at 12% was twice the overall Manitoba unemployment rate (6%). Both the male unemployment rate (13%) and the female unemployment rate (11%) in the Nor-Man Region were much higher than the Provincial rates. Employment income made up 80% of the income of those employed and living in the Nor-Man Region, compared to 75% for the Province.
Table 7.18 Employment Income & Labour Force Indicators for Nor-Man and Manitoba
Nor-Man Manitoba Employment Income Total Male Female Total Male Female
Population 15 years & older with employment 11,585 6,230 5,360 609,575 320,670 288,905
Avg. employment income $ 29,521 37,188 20,615 27,178 32,312 21,480 # Worked full year full time 5,965 3,655 2,310 337,105 197,990 139,110
Avg. employment income $ 42,175 49,040 31,306 36,729 41,153 30,433 Employment income % 80.0 75.3 Labour Force Indicators Total Male Female Total Male Female Participation rate % 65.4 70.6 60.1 67.5 73.7 61.7Employment rate % 57.4 61.4 53.4 63.4 69.0 58.1Unemployment rate % 12.1 13.0 11.2 6.1 6.3 5.7Source: Statistics Canada. 2007. 2001 Basic Profile (table). Health regions: boundaries and correspondence with census geography. 2001 Census. Statistics Canada Catalogue no. 82-402-XWE. Ottawa. December 12. http://www.statcan.ca/bsolc/english/bsolc?catno=82-402-X (accessed November 13, 2008).
Aboriginal Identity Population The average employment income of the Nor-Man AIP aged 15 years and older was similar ($21,099) to that of the AIP population of Manitoba ($19,271); both figures being substantially lower than the average employment income for total populations of Burntwood ($29,521) or Manitoba ($27,178) noted earlier. (See Table 7.19.)
The average employment income of the AIP in Nor-Man Region that worked full year full time, was $33,315 with males earning more than females ($37,922 and $27,786 respectively). The average income for AIP in Manitoba who worked full year full time was $29,079. Employment income made up 76% of the income of the AIP in the Nor-Man Region compared to 74% of the income of the provincial AIP.
The employment rate was 43% for the Nor-Man AIP compared to 48% for the provincial AIP. Both figures were considerably lower than for total populations of the Region (57%) or the Province (63%). Further, the Nor-Man Region AIP had an unemployment rate of 24.4% compared to the overall Regional unemployment rate of 12.1%. Similarly the Manitoba AIP had an unemployment rate of 19% compared to the overall provincial rate of 6.1%. The rates of unemployment for males of the AIP in the Region and Province were higher than for females.

Indicators of Northern Health: A Resource for Northern Manitobans and the Bayline Regional Round Table 77
Table 7.19 Employment Income & Labour Force Indictors for Nor-Man & Manitoba AIP
Nor-Man Manitoba Employment Income Total Male Female Total Male Female
Population 15 years & older with earnings 3,545 1,875 1,675 58,285 29,915 28,365
Avg. employment income $ 21,099 24,361 17,446 19,271 21,597 16,817# Worked full yr full time 1,565 850 710 25,325 13,420 11,905
Avg. employment income $ 33,315 37,922 27,786 29,079 31,957 25,835Employment income % 75.6 73.5 Labour Force Indicators Total Male Female Total Male Female Participation rate % 57.4 62.2 52.9 59.0 64.8 53.8Employment rate % 43.4 44.6 42.3 47.8 51.1 44.8Unemployment rate % 24.4 28.6 20.0 19.0 21.2 16.7
Source: Statistics Canada. 2007. Community Highlights for Norman Regional Health Authority (table). 2001 Census Aboriginal Population Profiles. Last updated January 2, 2007. http://www12.statcan.ca/english/profil01/AP01/Details/Page.cfm?Lang=E&Geo1=HR&Code1=4670&Geo2=PR&Code2=46&Data=Count&SearchText=norman&SearchType=Begins&SearchPR=46&B1=All&Custom= (accessed December 9, 2008).
Occupation Characteristics In the Nor-Man Region, the highest numbers of people were employed in (a) sales and service; (b) trades, transport and equipment operation; or (c) business, finance and administration. The top three categories were similar for the Province, with the order of the last two categories switched.
Occupation characteristics varied by gender within the Nor-Man Region, with males employed more in trades, transport and equipment operation (1,835) compared to females (70); in primary industry (890) compared to females (75); and in processing, manufacturing and utilities (530) compared
Table 7.20 Occupation Characteristics for Nor-Man Region and Manitoba by Gender
Nor-Man Manitoba Occupation Total Male Female Total Male Female
Total – Experienced labour force 10,460 5,715 4,750 577,340 307,465 269,875Management 830 505 325 50,850 33,200 17,650Business, finance, administration 1,255 225 1,030 101,940 27,765 74,180Natural/applied sciences 445 360 85 26,695 21,370 5,320Health occupations 510 90 425 36,690 7,410 29,280Social science, education, government, religion 970 300 665 45,890 15,810 30,080Art, culture, recreation, and sport 160 50 115 12,170 5,710 6,465Sales and service 2,805 930 1,880 139,940 59,050 80,895Trades, transport, and equipment operators 1,910 1,835 70 85,640 80,540 5,105Primary industries 965 890 75 40,580 31,295 9,285Processing, manufacturing and utilities 610 530 80 36,950 25,325 11,620
Source: Statistics Canada. 2007. 2001 Basic Profile (table). Health regions: boundaries and correspondence with census geography. 2001 Census. Statistics Canada Catalogue no. 82-402-XWE. Ottawa. December 12. http://www.statcan.ca/bsolc/english/bsolc?catno=82-402-X (accessed November 13, 2008).

Indicators of Northern Health: A Resource for Northern Manitobans and the Bayline Regional Round Table 78
to females (80). On the other hand, females dominated employment in business, finance and administration (1,030) compared to males (225); and health occupations (425) compare to males (90).
Occupation characteristics also varied similarly by gender within the Province, with males employed about 16 times more often in trades, transport and equipment operation (80,540) compared to females (5,105); about three times more often in primary industry (31,295) compared to females (9,285); and about four times more often in natural and applied sciences (21,370) compared to females (5,320). In Manitoba, the female population also dominated employment in business, finance and administration (74,180) by about three times the male population (27,765) employed in that field. Females doubled the male population employed in social science, education, government and religion and quadrupled the male population in the health occupations.
Aboriginal Identity Population A review of occupation characteristics for the Nor-Man Region AIP showed that males worked most often in trades, transport and equipment (26% of the male AIP) followed by sales and service (25% of the male AIP). The female AIP worked most often in sales and service (46% of the female AIP) followed by the business, finance and administration (13% of the female AIP).
Table 7.21 Occupation Characteristics for Nor-Man and Manitoba AIP by Gender
Nor-Man Manitoba Occupation Total Male Female Total Male Female
Total – Experienced labour force 3,130 1,680 1,455 53,130 27,725 25,405 Management 220 130 85 3,225 1,895 1,330 Business, finance, and administration 315 40 275 7,730 1,645 6,080 Natural/applied sciences 85 65 15 1,200 905 295 Health occupations 105 35 70 2,390 415 1,975 Social science, education, government, religion 335 75 255 5,320 1,515 3,810 Art, culture, recreation, and sport 50 20 25 905 480 425 Sales and service 1,075 415 665 15,700 6,155 9,545 Trades, transport, equipment operation 465 440 25 10,115 9,515 600 Primary industries 325 305 20 2,945 2,510 440 Processing, manufacturing/utilities 160 155 10 3,595 2,685 910
Source: Statistics Canada. 2007. Community Highlights for Norman Regional Health Authority (table). 2001 Census Aboriginal Population Profiles. Last updated January 2, 2007. http://www12.statcan.ca/english/profil01/AP01/Details/Page.cfm?Lang=E&Geo1=HR&Code1=4670&Geo2=PR&Code2=46&Data=Count&SearchText=norman&SearchType=Begins&SearchPR=46&B1=All&Custom= (accessed December 9, 2008).
Family, Household, and Private Dwelling Characteristics According to the 2001 census, about 81% of families living in the Nor-Man Region were couple families in structure, including those who reported being married-couple families (3,970) and those who reported living as common-law families (940). About 84% of families living in the Province reported being couple families. Some 1,245 lone-parent families resided in the Region with 79% of those families being female lone-parent families compared to the Province with 82% of lone-parent families being headed by females. (See Table 7.22.)

Indicators of Northern Health: A Resource for Northern Manitobans and the Bayline Regional Round Table 79
Table 7.22 Family and Household Characteristics for Nor-Man & Manitoba
Family Structure Nor-Man Manitoba Total # of couple families by family structure 4,910 253,690
# married-couple families 3,970 224,055 # of common-law families 940 29,635
Total # of lone-parent families 1,245 49,160 # female lone-parent families 985 40,095 # male lone-parent families 260 9,060
Household Income Total Total Average household income ($) all households 52,716 50,756 Median household income ($) 45,727 41,661
Private Dwelling s Total % Total % Total # of private households or dwellings 8,090 100.0 432,550 100.0
# of owned dwellings 5,100 63.0 293,295 67.8 # of rented dwellings 2,285 28.2 128,925 29.8 # of band dwellings 710 8.8 10,330 2.4
Source: Statistics Canada. 2007. 2001 Basic Profile (table). Health regions: boundaries and correspondence with census geography. 2001 Census. Statistics Canada Catalogue no. 82-402-XWE. Ottawa. December 12. http://www.statcan.ca/bsolc/english/bsolc?catno=82-402-X (accessed November 13, 2008).
The average household income for the residents of the Nor-Man Region ($52,716) was higher than for the Province as a whole ($50,756). The median or the mid-point of all household incomes for Nor-Man was $45,727 compared to the Province $41,661. In the Nor-Man Region, about 2/3 or 63% of households owed their homes, similar to the Province at 68%. Similar proportions of the populations of the Region (28%) and the Province (30%) reported renting their homes. In the Nor-Man Region 8.8% of residents reported living in band dwellings while for the Province 2.4% reported living in band dwellings.
Aboriginal Identity Population Data related to family status were provided in a different format for the Aboriginal Identity Populations and total numbers of individuals in families were noted compared with the numbers of families in the previous section for the total populations. Some comparisons have been made using the proportions of individuals in each category.
Some 22% of individuals identifying as AIP in the Nor-Man Region were spouses, compared to 21% of the AIP of Manitoba. In the Nor-Man Region 9% of the AIP reported being a lone-parent compared with 8.8% of the AIP of Manitoba. Some 49% of the Nor-Man AIP was children in census families compared with 47% of the Provincial AIP. About 10% of those indicating identity with the AIP in Nor-Man considered themselves to be “non-family persons” compared to about 13% of the Provincial AIP.
The median or the mid-point of all household incomes for the Nor-Man AIP was $30,660 compared to the Provincial AIP at $30,290. Both AIP had median household incomes that were much lower than the medians for the total Nor-Man Region at $45,727 and the Province as a whole at $41,661.
Some 39% of the Nor-Man AIP owned their homes, while 38% rented and 23% lived in “other dwellings” such as band housing. Meanwhile, 38% of the Provincial AIP population reported owning homes, compared to 44% who rented and 19% who lived in other dwellings.

Indicators of Northern Health: A Resource for Northern Manitobans and the Bayline Regional Round Table 80
Table 7.23 Family and Household Characteristics for Nor-Man and Manitoba AIP
Family Status Nor-Man Manitoba Total # people identifying as AIP 9,395 149,210
# spouses 2,060 31,755 # of common-law partners 910 13,990 # of lone-parents 840 13,180 # children in census families 4,615 70,375 # non family persons 970 19,900
Household Income Total Total Median household income ($) 30,660 30,290
Private Dwelling s Total % Total % Total # of private households or dwellings 3,060 100.0 55,035 100.0
# of owned dwellings 1,190 38.9 20,695 37.6 # of rented dwellings 1,160 37.9 24,040 43.7 # of other dwellings 710 23.2 10,300 18.7
Source: Statistics Canada. 2007. Community Highlights for Norman Regional Health Authority (table). 2001 Census Aboriginal Population Profiles. Last updated January 2, 2007. http://www12.statcan.ca/english/profil01/AP01/Details/Page.cfm?Lang=E&Geo1=HR&Code1=4670&Geo2=PR&Code2=46&Data=Count&SearchText=norman&SearchType=Begins&SearchPR=46&B1=All&Custom= (accessed December 9, 2008).
Demographics of Division 21 Earlier in this section, VII Nor-Man Region and Bayline Communities, health indicators were discussed related to health status, measures of illness, preventative care measures, health care utilization and mental health. These indicators were provided for the Region and Districts within the Region as the “closest to home” data available. To provide demographic information that was consistent with the health indicators, population characteristics were reported for the Region as a whole compared to the Province as a whole. In addition Aboriginal Identify Population characteristics were provided for Nor-Man Region and for the Province.
Data by census divisions and sub-divisions were considered to be less useful as they were not consistent with the population groupings by region used to provide data related to health indicators. However, this familiar geographical organization of data has been included to demonstrate community populations by using census division categorization of Census Division 21 which included Flin Flon, The Pas and the many communities in the surrounding area. Population counts were provided for the 2006 census, the 2001 census and the percentage of change (Table 7.24). When this report was developed, regional data were not available in detail for 2006. As a result, this table also provided opportunity to share some population data at a 2006 level. The only Bayline Community located in Census Division 21 was Cormorant which has been shaded for easy identification. Cormorant located in Division 21, Unorganized Territory showed a decline in population between 2001 and 2006, from 400 to 334 residents.
Statistics Canada (2002c) noted that geographic areas may change from one census to another. In order to facilitate comparison, the 2001 Census counts are adjusted to take into account boundary changes between the 2001 and 2006 census. The 2001 counts that were adjusted are identified by the letter ‘A’. The letter ‘A’ may also refer to corrections to the 2001 counts usually the result of boundary changes. This symbol is also used to identify areas that have been created since 2001, such as newly incorporated municipalities (census subdivisions) and new designated places (DPLs).

Indicators of Northern Health: A Resource for Northern Manitobans and the Bayline Regional Round Table 81
Table 7.24 Population of Census Division 21 by Community Geographic Name 2006 2001 % of Change
Division No. 21 21,606 22,556 -4.2 Chemawawin 2 983 964 2.0 Division No. 21, Unorganized 1,887 1,947A -3.1
Cormorant 334 400 -16.5 Easterville 80 80 0.0 Herb Lake Landing 0 15 -100.0 Moose Lake 205 212 -3.3 Sherridon 98 113 -13.3
Flin Flon 5,594 6,000 -6.8 Grand Rapids 336 355 -5.4 Grand Rapids 33 651 591 10.2 Kelsey 2,453 2,520A -2.7 Moose Lake 31A 698 740 -5.7 Opaskwayak Cree Nation (21A, 21B, 21C, 21E, 21I) *2,578 *2,432 6.0 Snow Lake 837 1,207 -30.7 The Pas 5,589 5,800A -3.6 Source: 2006 Census, Statistics Canada
Note: Users wishing to compare 2006 Census data with those of other censuses should then take into account that the bursaries of geographic areas may change from one census to another. In order to facilitate comparison, the 2001 Census counts are adjusted as needed to take into account boundary changes between the 2001 and 2006 census. The 2001 counts that were adjusted are identified by the letter ‘A’. The letter ‘A’ may also refer to corrections to the 2001 counts; however, most of these are the result of boundary changes. This symbol is also used to identify areas that have been created since 2001, such as newly incorporated municipalities (census subdivisions) and new designated places (DPLs). Symbols …not applicable In some cases the figure is deemed to be not appropriate or not applicable. In these cases the symbol, three dots (…) is displayed instead of a value. E use with caution Population and dwelling count amendments After the release of the 2001 Census population and dwelling counts, errors are occasionally uncovered in the data. It is not possible to make changes to the 2001 Census data presented in these tables.


Indicators of Northern Health: A Resource for Northern Manitobans and the Bayline Regional Round Table 83
References Allec, R. (2005). First Nations health and wellness in Manitoba: Overview of gaps in service
and issues associated with jurisdictions final report. Report prepared for the Inter-governmental Committee on First Nations Health. Winnipeg: Government of Manitoba. Available online at http://www.gov.mb.ca/ana/publications/1st_nations_health_final2005.pdf
Burntwood Regional Health Authority. (2004). Charting our course: The path ahead for northern health. BRHA community health assessment. Thompson, MB: Author. Available online at http://www.thompson.ca/dbs/brha/files/Publications/HealthAssessment %202004.pdf
Canadian Institute for Health Information (CIHI). (2006). Health Indicators 2006. Ottawa: Author. Available online at http://secure.cihi.ca/cihiweb/products/Indicators_2006_e.pdf
Hamilton, C. (2006). Healthy provinces, Healthy Canadians: A provincial benchmarking report. Ottawa: Conference Board of Canada. Available online at www.canceradvocacy.ca/ann/special.html/4301/Conference+Board+State+of+Health+Care.pdf
Fransoo, R., Martens, P., The Need to Know Team, Burland, E., Prior, H., Burchil, C., Chateau, D., Walld, R. (2005). Sex differences in health status, health care use, and quality of care: A population-based analysis for Manitoba's regional health authorities. Winnipeg, MB: Manitoba Centre for Health Policy. Available online at http://mchp-appserv.cpe.umanitoba.ca/reference/sexdiff.pdf
Gilmore, J., & Wannell, B. (1999). Life expectancy. Health Reports 11(3), 9-24. Statistics Canada, Catalogue 82-003.
Martens, P. Bond, R., Jebamani, L., Burchill, C., Roos, N.P., Derksen, S., Beaulieu, M., Steinbach, C., MacWilliam, L., Walld, R., et al. (2002). The health and health care use of Registered First Nations People living in Manitoba: A population-based study. Winnipeg, MB: Manitoba Centre for Health Policy. Available online at http://mchp-appserv.cpe.umanitoba.ca/reference/rfn_report.pdf
Martens, P., Fransoo, R., The Need to Know Team, Burland, E., Jebamani, L., Burchill, C., Black, C., Dik, N., MacWilliam, L., Derksen, S., et al. (2003). The Manitoba RHA Indicators Atlas: Population-Based Comparison of Health and Health Care Use. Winnipeg, MB: Manitoba Centre for Health Policy. Available online at http://mchp-appserv.cpe.umanitoba.ca/reference/rha2.pdf
Martens, P., Fransoo, R., McKeen, N., The Need to Know Team, Burland, E., Jabamani, L., Burchill, C., De Coster, C., Ekuma, O., Prior, et al. (2004). Patterns of regional mental illness disorder diagnoses and service use in Manitoba: A population-based study. Winnipeg, MB: Manitoba Centre for Health Policy. Available online at http://mchp-appserv.cpe.umanitoba.ca/reference/mental.health.pdf
Moss, A., Racher, F., Jeffery, B., Hamilton, C., Burles, M., & Annis, R.C. (forthcoming). Transcending boundaries: Collaborating to improve northern access to health services. In J. Kulig & A. Williams (Eds.). Rural health: A Canadian perspective. Vancouver: UBC Press.

Indicators of Northern Health: A Resource for Northern Manitobans and the Bayline Regional Round Table 84
Nor-Man Regional Health Authority. (2004). Nor-Man Regional Health Authority community health assessment report 2004. Flin Flon, MB: Author. Available online at http://www.norman-rha.mb.ca/documents/2004CHAReport-RevisedMarch2006.pdf
Public Health Agency of Canada. (2001). What determines health?: Key determinants. Retrieved November 3, 2008 from http://www.phac-aspc.gc.ca/ph-sp/determinants/index-eng.php#determinants
Racher, F. & Vollman, A. (2002). Exploring the dimensions of access to health services: Implications for nursing research and practice. Research and Theory for Nursing Practice: An International Journal, 16(2), 77-90.
Shields, M., & Tremblay, S. (2002). The health of Canada’s Communities. Health Reports Supplement, 13, 9-33. Statistics Canada Catalogue 82-003. Available online at http://www.statcan.ca/english/freepub/82-003-SIE/2002001/pdf/82-003-SIE2002002.pdf
Statistics Canada. (2002a). How healthy are Canadians? Annual report 2002. Ottawa: Author. Available online at http://www.statcan.ca/english/freepub/82-003-SIE/82-003-SIE2002001.htm
Statistics Canada. (2002b). Aboriginal Identity Population for Manitoba. Ottawa: Author. Retrieved November 3, 2008 from http://www12.statcan.ca/english/profil01/AP01 /Details/Page.cfm?Lang=E&Geo1=PR&Code1=46&Geo2=PR&Code2=01&Data=Count&SearchText=Manitoba&SearchType=Begins&SearchPR=01&B1=All&Custom=
Statistics Canada. (2002c). Community Profiles 2001. Ottawa: Author.
Statistics Canada. (2002d). Aboriginal Identity Population 2001. Ottawa: Author.
Statistics Canada. (2007). 2001 Basic Profile (table). Health regions: boundaries and correspondence with census geography. 2001 Census. Statistics Canada Catalogue no. 82-402-XWE. Ottawa. December 12. http://www.statcan.ca/bsolc/english/bsolc?catno=82-402-X (accessed November 13, 2008).
Statistics Canada. (2007). Community Highlights for Norman Regional Health Authority (table). 2001 Census Aboriginal Population Profiles. Last updated January 2, 2007. http://www12.statcan.ca/english/profil01/AP01/Details/Page.cfm?Lang=E&Geo1=HR&Code1=4670&Geo2=PR&Code2=46&Data=Count&SearchText=norman&SearchType=Begins&SearchPR=46&B1=All&Custom= (accessed December 9, 2008).

Indicators of Northern Health: A Resource for Northern Manitobans and the Bayline Regional Round Table 85
Appendix A Principal Characteristics of the 10 Peer Groups
Source: Shields & Tremblay (2002).

Indicators of Northern Health: A Resource for Northern Manitobans and the Bayline Regional Round Table 86
Appendix B
Source: Shields & Tremblay (2002).

RDI ADVISORY COMMITTEE
Scott Grills, Chair Brandon University
Brandon, MB
Mona Cornock Manitoba Agriculture, Food and Rural Initiatives
Brandon, MB
Larry Flynn Public Health Agency of Canada
Winnipeg, MB
Kim Beilby Manitoba Agriculture, Food and Rural Initiatives
Brandon, MB
Reg Helwer Shur-Gro Farm Services
Brandon, MB
Elliot Hewitt Agriculture and Agri-Food Canada
Calgary, AB
Ben Maendel Baker Hutterite Colony
MacGregor, MB
Jonathon Maendel Baker Hutterite Colony
MacGregor, MB
Darell Pack Agriculture and Agri-Food Canada
Winnipeg, MB
W.J. (Bill) Pugh Meyers Norris Penny
Brandon, MB
Fran Racher Brandon University
Brandon, MB
Doug Ramsey Brandon University
Brandon, MB
Frank Thomas Canadian Imperial Bank of Commerce
Brandon, MB
Larry Wark MTS Communications Inc.
Brandon, MB
Dion Wiseman Brandon University
Brandon, MB
Robert Annis, Director RDI, Brandon University
Brandon, MB
The role of the RDI Advisory Committee is to provide general advice and direction to the Institute on matters of rural concern. On a semi-annual basis the Committee meets to share information about issues of mutual interest in rural Manitoba and foster linkages with the constituencies they represent.