individualising fortification of human milk feeds to...
TRANSCRIPT
Individualising Fortification of Human Milk Feeds to
Achieve Growth Targets for Preterm Infants in the
Neonatal Clinical Care Unit
Gemma McLeod
BSc. (Nutr and Food Sc.), Grad. Dip. Nutr Diet., MSc. (Thesis).
This thesis is presented for the degree of
Doctor of Philosophy
of
The University of Western Australia
School of Biomedical, Biomolecular and Chemical Sciences
Faculty of Life and Physical Sciences
and
School of Women’s and Infants’ Health
Faculty of Medicine, Dentistry and Health Sciences
The University of Western Australia
35 Stirling Highway, Crawley, Western Australia, 6009
2010

i
This thesis is dedicated to Mothers
ii
Preface
This thesis was completed under the supervision of Professor Karen Simmer, School of Women’s and Infants’ Health and Associate Professor Jill Sherriff and Professor Peter Hartmann, School of Biomedical, Biomolecular and Chemical Sciences. Dr. Donna Geddes, Associate Researcher and Sonographer, School of Biomedical, Biomolecular and Chemical Sciences, performed the ultrasound, provided the ultrasound images and further technical and editorial support. Ms. Elizabeth Nathan, Biostatistician, The Women and Infants’ Research Foundation performed the modelling regression analysis, presented some data graphically, including the ultrasound percentiles and the Bland Altman graph, and provided statistical and editorial support. Parts of this research have been presented at national and international conferences. A077 McLeod G, Sherriff J, Simmer K, Tompkins J, Hartmann PE. Audit of nutrition intake and growth of preterm infants in the NCCU. Perinatal Society of Australia and New Zealand 11th Annual Congress, 1-4 April 2007, Melbourne Convention Centre, Victoria (2007). A181 McLeod G, Sherriff J, Hartmann PE, Pang WW, Sedgwick T, Kershaw D, Chiffings D, Simmer K. What are we feeding our preterm infants? 14th International Conference of the International Society for Research in Human Milk and Lactation (ISRHML). 31 January to 5 February 2008, The University Club, Crawley, Western Australia, Australia (2008). A033 McLeod G, Sherriff J, Hartmann PE, Kok C, Abernethy G, Geddes D, Simmer K. Body composition of preterm infants determined by air displacement plethysmography. Perinatal Society of Australia and New Zealand 13th Annual Congress, 19-22 April 2009, Darwin Convention Centre, Northern Territory (2009). A020 McLeod G, Sherriff J, Hartmann PE, Geddes D, Nathan E, Simmer K. Targeting human milk fortification to achieve preterm infant growth targets – A RCT. Perinatal Society of Australia and New Zealand 14th Annual Congress, 28-31 March 2010, Wellington, New Zealand. P097 McLeod G, Simmer K, Sherriff J, Nathan E, Geddes D, Hartmann PE. Comparison of different methodologies for measuring body composition. Perinatal Society of Australia and New Zealand 14th Annual Congress, 28-31 March 2010, Wellington, New Zealand. P082 McLeod G, Hartmann PE, Simmer K, Geddes D, Nathan E, Sherriff J. Subcutaneous tissue thickness (SCTT) in a cohort of very preterm (PT) infants. Perinatal Society of Australia and New Zealand 14th Annual Congress, 28-31 March 2010, Wellington, New Zealand.

iii
Acknowledgements
My thanks go first to the families who allowed their newborn, preterm babies to
participate in the studies, and to the mothers, who also when possible, provided samples
of their milk.
This work could not have been completed without the combined contribution of my
supervisors: Associate Professor Jill Sherriff, Professor Karen Simmer and Professor
Peter Hartmann. Jill mentored me and first fostered my interest in nutrition when I
studied as an undergraduate at Curtin University. The research documented in this
thesis links to her earlier research that she conducted in collaboration with Karen and
Peter in the neonatal unit at King Edward Memorial Hospital. Karen supported me in
the Neonatal Department and was instrumental in sourcing funding to procure the
PEAPOD and in providing employment for me during my studies. Peter was actively
involved in securing scholarship funding that enabled me to conduct this research and
played an integral role in obtaining equipment for milk analysis. I am indebted to all
three supervisors for their support and wisdom and for seeing this project through to its
completion.
Others have contributed generously with their expertise, namely Ms. Elizabeth Nathan
from the Women and Infants Research Foundation at King Edward Memorial Hospital,
who conducted parts of the statistical analyses, and Dr. Donna Geddes from The
University of Western Australia, who performed the ultrasound on the babies in the
trial. Liz and Donna went beyond their undertaking to help in the collection or analysis
of data, and both provided valuable feedback and encouragement on the papers.
Australian Rotary Health, The Thornlie Rotary Club, The University of Western
Australia, Stan Perron Charitable Trust Fund and the Post-Graduate Medical Research
Trust at King Edward Memorial Hospital provided the financial support that was used
to buy equipment, to conduct the research, to fund conference travel and to complete
my thesis. This project would not have been possible without the very tangible help of
these organisations, for which I am most grateful.
Ms. Debbie Chiffings, Ms. Daphne Kershaw, Ms. Tracey Sedgwick, Ms. Chooiheen
(Yen) Kok, Ms. Sandy Biggs, Ms. Gail Abernethy, Ms. Helen Symes, Ms. Annie

iv
Chang, Ms. Jenny Baxter, Ms. Maggie Yau, Ms. Kelly Cowley, Ms. Sheryl Dyson, Ms.
Karen Simmons, and Ms. Maria Santucci made this research possible through their
commitment to the mothers and infants and to supporting research in the Neonatal Unit.
No request was ever too big: thank you.
King Edward Memorial Hospital’s nursing and medical staff provided me with
continued inspiration through their dedication and commitment to infant care.
Particular acknowledgment must go to the nurses on the neonatal floor; to Dr. David
Baldwin for his support with regression modelling; to Professor Jane Pillow for her
advice with data analysis; to Dr. Noel French for sharing his views about infant growth
and development; to Professor Sanjay Patole for his advice about abstract writing and
for his encouragement; to Dr. Sven Schultz for his assistance with German translation;
to Dr. Jeff Tompkins for his assistance with Excel; and to Dr. Andy Gill for his
technical advice.
The Hartmann Lactation Research Group at The University of Western Australia and
the staff in the Perron Rotary Expressed Milk Bank at King Edward Memorial Hospital
also provided vital assistance. I would especially like to acknowledge those who
participated in body composition measurements; Dr Wei Pang, for teaching me how to
perform the assays; Dr. Ching Tat Lai, for his assistance in the laboratory; Dr. Ben
Hartmann, for helping to secure materials, store milk and for providing donor milk
composition data; Dr. Holly McClellan, for helping me measure the babies; and
Dr. Danielle Prime for helping me to prepare my presentation for the School of
Biomedical, Biomolecular and Chemical Sciences.
I am indebted to Mr. Travers McLeod, for his assistance with editing in the final week
prior to submission, and to Ms. Janet Dornan for her assistance with French translation.
My thanks go also to Ms. Elizabeth Poilly, Ms. Annette Butler and Ms. Robyn Collins
for their administrative assistance and encouragement; to Dr. John McTigue for
providing Neobase data; and to Ms. Jemma A’Court, for her assistance with formatting.
I would like to thank my mother and father, my brothers and sisters and my friends for
their love and encouragement.

v
Finally, I would like to thank my husband Lyall and my children, Charlie, Travers,
Dustin, Bronte and Lachlan – this thesis is the culmination of a study journey that
started almost twenty years ago and no words can adequately describe or thank my
family for the countless ways they have each shown their love and support: Lyall, for
your patience, understanding and commitment– thank you for your hard work and for
cooking all those meals; Charlie, so much early responsibility on such tiny shoulders –
thank you for the countless times you have helped me; Travers, for your loyalty and
commitment to family – so dependable - thank you for flying home early to help me
edit the final draft; Dusty, for your sensitive and gentle ways – they helped me get
through some tough times; Bronte, for your wisdom and insight - I love our long chats;
and Lachy, who has never known his mother not to be studying – thank you for your
beautiful acts of kindness over the years that have helped me to finally reach the end.
vi
Table of Contents Preface………………. ...................................................................................................... ii Acknowledgements….. ................................................................................................... iii List of Tables……….. ..................................................................................................... ix List of Figures………. .................................................................................................... xii List of Abbreviations… ................................................................................................. xiv Abstract……………… ................................................................................................. xvii
1.0 Introduction ......................................................................................... 1
1.1 References ........................................................................................... 5
2.1 Part 1 - Preterm Nutrition ................................................................. 11 2.1.1 Determinants of Growth ...................................................................................... 11 2.1.2 Developmental Origins of Health and Disease ................................................... 14 2.1.3 Fetal Nutrient Accretion ...................................................................................... 15 2.1.4 The Reference Fetus ............................................................................................ 20 2.1.5 Fetal Nutrition. .................................................................................................... 23 2.1.6 Preterm Nutrition ................................................................................................ 25 2.1.7 Postnatal Growth ................................................................................................. 27 2.1.8 Protein and Energy Requirements ....................................................................... 28 2.1.9 Energy………. .................................................................................................... 32 2.1.10 Protein………. .................................................................................................... 39
2.1.10.1 Protein Gain and Changes in Lean Body Mass During
Intrauterine Life .......................................................................... 40 2.1.10.2 Protein Metabolism ...................................................................... 40 2.1.10.3 Nitrogen Balance .......................................................................... 42 2.1.10.4 Nitrogen Absorption .................................................................... 42 2.1.10.5 Nitrogen Retention ....................................................................... 43 2.1.10.6 Amino Acid Profile ...................................................................... 44 2.1.10.7 Protein Energy Ratio (PER) ......................................................... 44 2.1.10.8 Protein Requirements ................................................................... 45
2.1.11 Human Milk Macronutrient Composition ........................................................... 46 2.1.12 Current Nutritional Feeding Practices ................................................................. 53 2.1.13 Fortification of Human Milk ............................................................................... 55
vii
2.2 Part 2 - Preterm Body Composition ................................................. 60 2.2.1 Central Body Composition Model ...................................................................... 60 2.2.2 Principles of Body Composition Measurement .................................................. 65 2.2.3 The Reference Infant ........................................................................................... 67 2.2.4 Air Displacement Plethysmography ................................................................... 72 2.2.5 Anthropometry .................................................................................................... 78 2.2.6 Magnetic Resonance Imaging (MRI) .................................................................. 80 2.2.7 Ultrasound…… ................................................................................................... 82 2.2.8 Dual Energy X-ray Absorptiometry .................................................................... 84 2.2.9 Bioelectrical Impedance ...................................................................................... 85 2.2.10 Other Techniques ................................................................................................ 85 2.3 Conclusion ........................................................................................ 87 2.4 References (Literature Review) ........................................................ 89
PAPER 1 – NUTRITIONAL AUDIT STUDY ............................................................ 107 Four-Week Nutritional Audit of Preterm Infants Born <33 Weeks Gestation ............. 107 Abstract……………… ................................................................................................. 108 Introduction…………. .................................................................................................. 109 Methods…………….. ................................................................................................... 110 Results……………….. ................................................................................................. 115 Discussion…………… ................................................................................................. 118 Recommendations……. ................................................................................................ 121 References (Paper 1)…. ................................................................................................ 124
PAPER 2 – BODY COMPOSITION FEASIBILITY STUDY .................................... 140 Feasibility study: Assessing the influence of macronutrient intakes on the body
composition of hospitalised preterm infants, using air displacement plethysmography140 Abstract……………… ................................................................................................. 141 Introduction…………. .................................................................................................. 142 Methods…………….. ................................................................................................... 143 Results……………….. ................................................................................................. 149 Discussion…………… ................................................................................................. 151 References (Paper 2)….. ............................................................................................... 157
viii
PAPER 3 – TARGET FORTIFICATION STUDY ...................................................... 169 Targeting Human Milk Fortification to Achieve Preterm Infant Growth Targets ........ 169 Abstract……………… ................................................................................................. 170 Introduction…………. .................................................................................................. 171 Methods…………….. ................................................................................................... 172 Results………………. .................................................................................................. 177 Discussion…………… ................................................................................................. 181 References (Paper 3)…. ................................................................................................ 185
PAPER 4 – ULTRASOUND STUDY .......................................................................... 197 Feasibility of Using Ultrasound to Assess Macronutrient Influences on the Body
Composition of Preterm Infants .................................................................................... 197 Abstract……………… ................................................................................................. 198 Introduction…………. .................................................................................................. 199 Method……………… .................................................................................................. 200 Results………………. .................................................................................................. 203 Discussion…………… ................................................................................................. 206 Conclusion…………… ................................................................................................ 213 References (Paper 4)…. ................................................................................................ 214
3.0 General Discussion ......................................................................... 230 3.1 Limitations……. .................................................................................................. 238 3.2 Future Directions .................................................................................................. 239 3.3 References (General Discussion) ......................................................................... 242
ix
List of Tables
Literature Review Table 1.1 Mean Composition of Weight Gain of the Reference Fetus During
Four Successive 4-Week Intervals ................................................................ 23 Table 1.2 Protein and Energy Recommendations for Preterm Infants over a
25-Year Period .............................................................................................. 31 Table 1.3 Effects of Varying Protein and Energy Intakes and PER on Growth ........... 35 Table 1.4 Recommended Preterm Infant Growth Rate, Protein Intake and Protein
Energy Ratio of Feeds According to Corrected Gestation and the Need
for Catch-up Growth ..................................................................................... 46 Table 1.5 Human Milk Composition of Preterm and Term Milk ................................. 47 Table 1.6 Levels of Fortification employed in an adjustable human milk
fortification trial ............................................................................................ 57 Table 1.7 Standard vs. An Adjustable Fortification Feeding Regimen ........................ 58 Table 1.8 Recommended Preterm Infant Growth Rate, Protein Intake and PER of
Feeds According to Corrected Gestation and the Need for Catch-up
Growth .......................................................................................................... 59 Table 1.9 Multicomponent Models Representing the Five Levels of Body
Composition .................................................................................................. 61 Table 1.10 Main Components of Body Mass (BM) at the Five Levels of Human
Body Composition ........................................................................................ 62 Table 1.11 Body Composition of the Reference Fetus at Term and the Male and
Female Reference Infants .............................................................................. 73 Table 1.12 Body Composition of Preterm and Term Infants at Term Age ..................... 77
Paper 1. Nutritional Audit Paper Table 1 Routine Fortification Practice and Targeted Nutrient Intakes, Based on
Assumed Milk Composition ....................................................................... 128 Table 2 Infant Demographics ................................................................................... 130 Table 3. Mean composition of the averaged macronutrient content each infant’s
unfortified milk feeds fed within the first four-weeks of life ...................... 132 Table 4a Protein and Energy Intakes of Infants <28 Weeks Gestation, Using
Assumed Milk Composition, Compared with ReasNI ................................ 134
x
Table 4b Protein and Energy Intakes of Infants ≥28 Weeks Gestation, Using
Assumed Milk Composition, Compared with ReasNI ................................ 135 Table 5 Protein and Energy Intakes of Infants, Using Measured Macronutrient
Milk Composition, Compared with ReasNI ............................................... 136 Table 6 Estimated Mean Weekly Weight Gain kg-1d-1 with 95% Confidence
Intervals for Infants <28 Weeks Gestation and ≥28 Weeks Gestation ....... 138 Table 7 Proposed New Feeds and Targeted Nutrient Intakes, Based on Revised
Milk Composition ....................................................................................... 139 Paper 2. Body Composition Feasibility Study
Table 1 Clinical Characteristics of Subjects ............................................................ 163 Table 2 Mean composition of the averaged macronutrient content of each
infant’s unfortified milk feeds fed during hospital stay .............................. 164 Table 3 Nutritional Intakes, Calculated Using Measured Milk Composition .......... 165 Table 4 Growth and Nutrition Models ..................................................................... 167 Table 5 Body Composition Measurements of Infants Measured with the
PEAPOD ..................................................................................................... 168
Paper 3. Targeted Fortification Study
Table 1 Infant Demographic and Clinical Data ....................................................... 191 Table 2 Mean composition of the averaged macronutrient content of each
infant’s unfortified milk feeds fed during hospital stay, measured with
the MIRIS .................................................................................................... 192 Table 3 Nutritional Intakes During (i) The Intervention Period and (ii)
Throughout Hospital Admission ................................................................. 194 Table 4 Growth and Body Composition of Infants at Discharge and Term CA ...... 195 Table 5 Modelling of Weight Gain and Body Composition with Macronutrient
Intake Data .................................................................................................. 196 Paper 4. Ultrasound Study
Table 1 Demographic and Clinical Data .................................................................. 221 Table 2 Intra-observer Reliability ............................................................................ 222 Table 3 Nutrition Intakes of infants ......................................................................... 223

xi
Table 4 Modelling of Ultrasound Body Composition and Nutritional Intake
Data ............................................................................................................. 225 Table 5 Prediction Model for %BC Incorporating Adipose Tissue Ultrasound
Measurements at Each Site ......................................................................... 226
xii
List of Figures
Literature Review
Figure 1.1 Weight Gain, Energy Balance, Protein Accretion and Fat Deposition
of the Fetus and the Preterm Infant Around 31 weeks Gestation ................. 34
Figure 1.2 Longitudinal Measurements (5-6 wk) of Resting Energy Expenditure,
Energy Intake and Weight Gain in Preterm Infants. ..................................... 38
Figure 1.3 Relationship between Lipid and Fat Components at the Molecular
Level and the Adipose Tissue Component (grey shading) at the
Tissue-Organ Level ....................................................................................... 63
Paper 1. Nutritional Audit Paper
Figure 1 Individual Expressed Milk Collections from a Range of Mothers ............. 129
Figure 2 Sources of Fluid Intake According to Gestational Age Group Mothers ..... 131
Figure 3 Protein, Fat, Lactose and Calculated Energy Content of Unfortified
Milk Feeds ................................................................................................... 133
Figure 4 Modelled Estimates of Growth for Infants in each Age Group, Based
on Total Intakes Calculated on Days when Measured Milk
Composition was Available, Adjusted for Birth Weight Z-Score, Days
to Fortification and Mean Total Protein Intake ........................................... 137
Paper 2. Body Composition Feasibility Study
Figure 1 Preterm Infant Participation ........................................................................ 162
Figure II Unadjusted serial changes in mean (SD) fat and fat free mass of
hospitalised preterm infants. ....................................................................... 166
Paper 3. Targeted Fortification Study
Figure 1 Targeted Fortification vs. Routine Fortification ......................................... 190
Figure 2 Sources of Nutrition .................................................................................... 193
Paper 4. Ultrasound Study
Figure 1 Ultrasound Imaging and Measurements...................................................... 218
xiii
Figure 1a Scapular Measurement ................................................................ 218
Figure 1b Abdominal Measurement ........................................................... 218
Figure 1c Arm Measurements ..................................................................... 219
Figure 1d Thigh Measurements .................................................................. 220
Figure 2 Corrected Gestational Age 90th Percentiles of Subcutaneous Tissue
Thickness of Preterm Infants Born <30 weeks (denoted by dotted line),
Compared with Gestational-age Specific 90th Percentiles of Fetal
Subcutaneous Tissue Thickness (denoted by solid line). ............................ 224
Figure 3 Scatter Plot Showing Body Fat Mass Percentage vs. Predicted Body
Fat Mass Percentage Estimates Derived from Regression Analysis ........... 227
Figure 4 Bland-Altman Plot of Difference ................................................................ 228
Figure 5 Relationship Between Different Compartments and Components of
Body Composition ...................................................................................... 229
General Discussion
Figure 1 Quadratic Model using the FFMD Data of Fomon et al.13 for Female
Infants Backwards Extrapolated from 2 Years of Age ............................... 235
Figure 2 Quadratic Model using FFMD Data of Butte et al.14 for Female Infants
Backwards Extrapolated from 2 Years of Age ........................................... 236
Figure 3 Age-specific FFMD Values Calculated from the Reference Fetus15 and
Illustrated Alongside Male and Female age-specific FFMD values
calculated for the Reference Infants by Fomon et al.15 and Butte et
al.14. ............................................................................................................. 237
xiv
List of Abbreviations
AA arachidonic acid AAP American Academy of Pediatrics AAP-CON AAP Committee on Nutrition ADJ adjustable human milk fortification AGA appropriate for gestational age AT adipose tissue ATV adipose tissue volume BC body composition BCM body cell mass BF bovine whey protein fortifier BIA bioelectrical impedance analysis BM body mass BUN blood urea nitrogen Bwt birth weight CA corrected age cGA corrected gestational age cm centimetre CPAP continuous positive air pressure (or airway pressure) CPS Canadian Paediatric Society CV coefficient of variation d day D donor DDI double deionised water DHA docosahexaenoic acid dL decilitre DM donor milk DNA Deoxyribonucleic acid DXA dual-energy x-ray absorptiometry ECF extracellular fluid ECS extracellular solids ECW extracellular water EFA essential fatty acids ELBW extremely low birth weight EN enteral nutrition EPUFA essential polyunsaturated fats ESPGHAN European Society of Paediatric Gastroenterology,
Hepatology and Nutrition ESPGHAN-CON ESPGHAN Committee on Nutrition FFM fat free mass FFMD fat free mass density FM fat mass g gram GA gestational age Gpi Intervention group Gpc Control group GR growth restricted h hour HC head circumference HM human milk HMA human milk analyser
xv
HMF human milk fortifier HMP human milk protein ICW intracellular water IGF insulin growth factor IF infant formula IQR interquartile range IUGR intrauterine growth restriction IV intravenous kcal kilocalorie KEMH King Edward Memorial Hospital kg kilogram kJ kilojoule L litre LBW low body weight LCPUFA long chain polyunsaturated fatty acid Lth length M mineral mg milligram Mo bone or osseous mineral Ms soft-tissue or non-osseous mineral MEF minimal enteral feeds MHz megahertz mL millilitre mm millimetre mM millimole MOM mothers’ own milk MRI magnetic resonance imaging MUFA monounsaturated fats MVM microvillus plasma membrane NCCU Neonatal Clinical Care Unit NEC necrotising enterocolitis NEFA non-esterified fatty acids NICU neonatal intensive care unit nm nanometre PCA postconceptional age PDA patent ductus arteriosus PER protein energy ratio PN parenteral nutrition PT preterm PTF preterm infant formula Ptn protein QMR quantitative nuclear magnetic resonance R residual RCT randomised controlled trial ReasNI reasonable nutrient intakes REE resting energy expenditure SCTT subcutaneous tissue thickness SD standard deviation SE standard error SFA saturated fats SGA small for gestational age SLT soft lean tissue
xvi
STB syncytiotrophoblast STD standard practice T term TBF total body fat TBK total body potassium TBN total body nitrogen TBWater total body water TBWeight total body weight Vb body volume VLBW very low birth weight wk week μL microlitre 2-C two compartment 3-C three compartment 4-C four compartment 6-C six compartment
xvii
Abstract
This thesis provides a detailed exposition of preterm nutrition and infant body
composition (BC) methods and reports four research studies as papers. The research
comprised (i) a nutrition audit (Paper 1, p 107), conducted in 2006, in which calculated
macronutrient intakes based on milk analysis were compared to those based on assumed
composition; (ii) a BC feasibility study (Paper 2, p 140) conducted in 2007, in which the
efficacy of applying a commercial two compartment (2-C) BC system to the serial
measurement of preterm body composition was explored; (iii) a targeted fortification
study (Paper 3, p 169), conducted in 2009, in which the fortification of human milk
feeds was targeted to protein and energy recommendations on the basis of measured
versus assumed composition and macronutrient influences on growth and BC were
assessed using air displacement plethysmography; and (iv) an ultrasound feasibility
study (Paper 4, p 197), conducted in conjunction with the intervention study, to explore
the usefulness of ultrasound in assessing serial changes in preterm subcutaneous adipose
and muscle tissue accretion, in response to macronutrient influences. Together, these
papers add further knowledge about nutritional intakes and targeted milk fortification
and as well, explore the novel application of air displacement plethysmography and
ultrasound to the longitudinal assessment of preterm BC.
The first research study (Paper 1, p 107) comprised a four week nutritional audit, which
quantified the macronutrient intakes of 63 preterm infants from one to four weeks of
life. Milk analysis was used to measure the macronutrient content of the milk feeds for a
subset of infants (n=36) and to compare assumed versus measured intakes. The audit
demonstrated that intravenous fluids were an important source of nutrition in infants
born <28 weeks gestation in the initial three weeks of life, and that the median (range)
macronutrient composition of milk feeds (g/L) was extremely variable and higher than
the assumed values (protein: 16.6 (13.4-27.6); fat: 46.1 (35.0-62.4); lactose: 68.0 (50.9-
74.8). Infants born <28 weeks gestation did not reach the third trimester fetal rate of
weight gain (g kg-1 d-1) until week four of the audit (week 1: -2.7 g, week 2: 8.1 g, week
3: 12.0 g and week 4: 17.2 g), whereas the weight gain of infants born ≥ 28 weeks
gestation approached the fetal rate by week two (week 1: -10 g, week 2: 14.6 g, week 3:
15.0 g and week 4: 16.6 g). The combined measured macronutrient intakes for the 36
infants for whom milk analyses were performed were modelled against their weekly
weight gain. Measured protein intake from all nutrition sources was found to have a
xviii
positive effect on weight gain, after adjustment was made for gestational age, birth
weight z-score and day of fortification; i.e. for every g increase in total protein intake
there was an associated average 1.0 g kg-1d-1 increase in weight gain (95% CI 0.07-1.84,
p=0.035).
A BC feasibility study (Paper 2, p 140) was conducted to assess if an air displacement
plethysmograph, the PEAPOD, was (i) a suitable method to employ in the clinical
setting to obtain serial BC measurements of hospitalised preterm infants and (ii) capable
of assessing the influence of macronutrient intakes on the composition of weight gain.
Preterm BC could first be measured as early as 31 weeks gestation using the PEAPOD.
The age at which infants qualified for a first measurement was dependant on their
respiratory and feeding status, and their ability to maintain body temperature. Mean
(SD) macronutrient (g kg-1d-1) and energy intakes (kJ kg-1d-1) of preterm infants from
birth to discharge, based on milk analysis, did not meet recommendations (Protein: 3.4
(0.3); Fat: 6.0 (1.0); Carbohydrate: 12.9 (1.0); Energy: 500 (43)). Fat and total energy
intakes were positively associated with increasing fat mass (FM). Protein (with
carbohydrate) intake was positively associated with increasing fat free mass. Preterm
infants had significantly greater FM (16.7%) compared with term infants (8.4%) at the
equivalent term age (p<0.001).
A randomised, intervention study (Paper 3, 169) was conducted to test the hypothesis
that targeting fortification of human milk feeds on the basis of milk analysis to meet
recommended reasonable intakes of protein and energy would improve preterm growth
and BC, compared to routine fortification based on assumed milk composition. Whilst
weight gain after recovery of birth weight [intervention vs controls: (g kg-1d-1: 13.4 (1.9)
vs. 14.3 (1.6), p=0.139] did not differ between groups, the mean % FM of infants in
both groups [13.7 (3.6) vs. 13.6 (3.5), p=0.984] was significantly greater than the
reference fetus (9.5%) at the equivalent mean age (p<0.001). Weight gain [g kg-1d-1:
(13.5 (3.5) vs. 15.7 (3.0), p=0.042)] and protein [g kg-1d-1: 3.2 (0.4) vs. 3.9 (0.3),
p<0.001] and energy [kJ kg-1d-1: 510 (39) vs. 559 (34), p<0.001] intakes of intervention
infants were significantly lower than controls during the intervention period. When
account was taken of all nutrition sources throughout hospital stay, [protein g kg-1d-1:
3.2 (0.3) vs. 3.4 (0.4), p=0.067; and energy (kJ kg-1d-1: 456 (39) vs. 481 (48), p=0.079]
intakes did not differ significantly between groups. The positive relationship found
between an achieved protein intake (>3.4 g kg-1d-1) and BC (2% reduction in %FM)
xix
suggests that fortification regimens that target higher protein intakes may improve
preterm growth outcomes.
An ultrasound study (Paper 4, p 197) was also undertaken in conjunction with the
targeted fortification study to determine the capacity of ultrasound to assess serial
changes in the thickness of preterm subcutaneous adipose and muscle tissues. Preterm
and fetal tissue accretion patterns were compared and changes to preterm adipose and
muscle tissue in response to macronutrient intakes during hospital stay were also
assessed. Measurements were taken for 40 infants approximately every three weeks
from birth until term corrected age in the mid-arm and mid-thigh, abdomen and
subscapular region. The coefficient of variation between 14-paired measurements from
duplicate scans of the four sites ranged between 3.2-14.7%. Relative to the fetus,
preterm adipose and muscle tissue thickness was reduced at an equivalent (corrected)
gestation, but towards term, a faster accretion rate of abdominal adipose tissue and limb
muscle tissue was evident, to the extent that in the mid-thigh, accretion of muscle tissue
mass exceeded that of the fetus. Timing of fortification (P=0.012), enteral carbohydrate
intake (p=0.008) and the protein energy ratio of intakes (p=0.038) modulated the ratio
of adipose to muscle tissue accretion over the four sites by -0.004, -0.048 and -0.042,
respectively.
In summary, this thesis adds further to our understanding of preterm nutrition and the
determinants of preterm infant growth. It explores the feasibility of applying the
PEAPOD to assessing serial changes in BC of hospitalised, preterm infants and presents
ultrasound as an alternative method for assessing preterm metabolic development in
response to postnatal nutritional and environmental influences.
1
1.0 Introduction
From a developmental perspective, untimely birth exposes the infant to a novel
nutritional milieu. In a healthy pregnancy, the human fetus develops in an anabolic
environment, taking up high amounts of amino acids, moderate amounts of glucose and
small amounts of lipid across the placenta1. In contrast, the preterm infant is initially fed
intravenous solutions containing low amounts of amino acids, varying amounts of
glucose and high amounts of lipid1 and the immature gut is primed with minimal enteral
feeds. It can be many days before the preterm infant is receiving intakes high enough
to prevent catabolism and several weeks before full enteral feeds are achieved. It seems
almost paradoxical therefore, that growth and development of preterm infants should be
expected to match that of their term-born peers.
Little is known about the longer term health consequences of preterm birth but it is
suggested that during critical periods of gestation and early postnatal life, ‘mechanisms
of developmental plasticity’ are operating2, 3 to ‘program metabolism’4-6 and to effect
the trajectory of growth, development and later health outcomes7-9. Nutrition is thought
to be an effector of metabolic programming in early life. A number of investigators
have demonstrated that manipulation and restriction of protein and energy during
pregnancy, lactation and postnatal feeding, including lactation, can alter growth,
metabolism and longevity10-18, suggesting the amount and type of nutrition fed to
preterm infants may be of critical importance to their biology.
This is concerning, given so little is known about preterm nutrition. Human milk is the
recommended19, 20 and preferred21 enteral feed for preterm infants because it offers
nutritional benefits22-25 and optimises immune protection and psychological
development. Some mothers however, have difficulty providing human milk for their
infants, as early delivery can potentially interrupt breast development26, delay secretory
activation27 as well as reduce the volume of milk production28. Donor milk (DM) has
become an attractive feeding alternative when mothers’ own milk (MOM) is
unavailable, but despite the clear, undisputed benefits of feeding human milk, the
protein, energy and micronutrient composition of both MOM and DM29, 30 is usually
insufficient 31, 32 33 to meet the high nutrient intakes recommended for preterm infants34.
2
Thus, it is common practice across neonatal units to add multicomponent commercial
fortifiers35 and energy supplements to human milk, assuming a standard milk
composition. Weight, length and head circumference gains are routinely used to assess
the adequacy of such regimens and growth faltering is common36-38. Consequently,
growth targets, currently based on intrauterine growth and fetal nutrient accretion
rates39-41, are rarely achieved in clinical practice. Although no clear alternative is
apparent, this has led clinicians to question both the adequacy of nutrition practices as
well as the legitimacy of using intrauterine growth as a reference standard.
Historically, fetal BC data were obtained through direct chemical analyses of mostly
stillborn, human cadavers. Synthesis of these data, and the subsequent construction of
the reference fetus40, have formed our current understanding of intrauterine growth and
nutrient accretion rates39, 41. Current nutrition guidelines for preterm infants have been
shaped by consideration of this reference growth standard39-41, as well as: (i) the
determinants of growth and BC42-46; (ii) the accumulation of an early nutrition deficit42,
47; (iii) amino acid and protein quality and quantity22, 48-50; and (iv) the need for
compensatory catch up growth51, 52. Most recent consensus recommendations base
energy requirement on birth weight34, 53-59 and suggest protein requirement is inversely
proportional to age and subject to the need for catch-up growth34, 60. The latest European
guidelines61 differentiate protein requirements according to a weight range and
recommend higher protein energy ratios than previously.
In an effort to meet current nutrition recommendations and to address the accumulation
of the early growth deficit, there has been a global shift in research focus towards
revising parenteral62-66 and enteral67-69 feeding strategies, investigating human milk
composition, developing new technology for its’ measurement in the clinical setting70-72
and to improving, developing and/or validating methodology to assess the composition
of growth73-76. Several investigators have demonstrated that more aggressive parenteral
amino acid and energy feeding from day one of life can be achieved without adverse
metabolic consequences and result in improved weight gain63, 64, 77. Others have targeted
individualised human milk fortification either by using urea as a nutritional marker of
adequacy78, 79 or by measuring milk composition80-82. Most have shown associated
improvements in weight gain, though these investigators did not measure BC and it is
therefore not known if intrauterine nutrient accretion rates were achieved.
3
Skinfold calipers83, 84, dual energy x-ray absorptiometry84, 85, isotope studies86, 87,
bioelectrical impedance88, 89, air displacement plethysmography90-92, ultrasound93 and
magnetic resonance imaging94, 95 have all been used in recent years to measure preterm
infant BC. Although all these methods and their application in the development of new
technology have some limitations96-98, this body of work has contributed substantially to
the understanding of preterm infant body composition. Whilst several of these studies
assessed the influence of nutrition on BC outcomes, human milk composition was either
assumed, and its variability was not accounted for, or human milk was not the major
source of nutrition. Therefore, the influence and manipulation of human milk feeding
practices on BC outcomes still needs further elucidation.
Most recent data suggests preterm birth rates are increasing and now account for
between 8-12% of all infants born in developed countries99-101. Survival at increasingly
younger gestations translates to increased risk of morbidity and mortality, protracted
and recurrent hospital stays and high economic burden100-104. The implications are
greater for those who are born small for gestational age (SGA) and/or growth
restricted105-107. Whilst advances in technology and clinical expertise have resulted in
improved medical management, knowledge about how best to nourish and grow
preterm infants is limited. Closing this gap in knowledge is important to ensure best
nutrition practice is applied to promoting their wellbeing, to optimising their growth and
development, as well as to reducing the very large health expenditure directed to their
care.
This thesis strives to address the following hypothesis:
‘That growth and BC of preterm infants will more closely match reference growth if
milk is fortified to target recommended protein and energy intakes on the basis of milk
analysis rather than on assumed macronutrient composition.
The primary aim of this thesis is:
To determine if milk fortification based on measured rather than assumed macronutrient
composition and targeted to recommended protein and energy intakes according to
corrected gestational age and birth weight, results in preterm growth and BC that is
comparable to reference growth.
4
The key objectives of this thesis are:
1. To audit the macronutrient and energy intakes of hospitalised preterm infants,
based on milk analysis.
2. To assess the application of air displacement plethysmography to the serial
measurement of preterm body composition.
3. To determine the influence of macronutrient intakes on growth and BC of
preterm infants.
4. To conduct a randomized intervention study to test the hypothesis.
5. To assess the novel application of ultrasound to the serial assessment of body
composition of hospitalised preterm infants.
6. To compare preterm and fetal BC outcomes (%FM, subcutaneous adipose and
muscle tissue accretion patterns).
Preterm infants admitted to a Statewide, tertiary neonatal unit in Perth, Western
Australia, at varying periods between 2006 and 2009 participated in four studies that
were conducted to test this hypothesis and to achieve these aims and objectives.
5
1.1 References
1. Thureen PJ. Early aggressive nutrition in the neonate. Pediatrics in Review. 1999; 20(9): e45-55. 2. Gluckman PD, Cutfield W, Hofman P, Hanson MA. The fetal, neonatal, and infant environments--the long-term consequences for disease risk. Early Human Development. 2005; 81(1): 51-9. 3. Gluckman PD, Hanson MA, Bateson P, Beedle AS, Law CM, Bhutta ZA, et al. Towards a new developmental synthesis: adaptive developmental plasticity and human disease. The Lancet. 2009; 373(9675): 1654-7. 4. Lucas A. Does early diet program future outcome? Acta Paediatr Scand. 1990; Suppl 365: 58-67. 5. Barker DJP. In Utero Programming of Cardiovascular Disease. Theriogenology. 2000; 53(2): 555-74. 6. Taylor P, Poston L. Developmental programming of obesity in mammals. Exp Physiol. 2007; 92.2: 287-98. 7. Barker DJ. In utero programming of chronic disease. Clin Sci (Lond). 1998; 95(2): 115-28. 8. de Boo H, Harding J. The developmental origins of adult disease (Barker) hypothesis. Aust NZ J Obs & Gynae. 2006; 46: 4-14. 9. Neu J, Hauser N, Douglas-Escobar M. Postnatal nutrition and adult health programming. Seminars in fetal and neonatal medicine. 2007; 12: 78-86. 10. Zambrano E, Bautista CJ, Deas M, Martinez-Samayoa PM, Gonzalez-Zamorano M, Ledesma H, et al. A low maternal protein diet during pregnancy and lactation has sex and window of exposure specific effects on offspring growth and food intake, glucose metabolism and serum leptin. J Physiol. 2005. 11. McCance RA. Food, growth, and time. Lancet. 1962; 2: 671-6. 12. Erhuma A, Bellinger L, Langley-Evans SC, Bennett AJ. Prenatal exposure to undernutrition and programming of responses to high-fat feeding in the rat. Br J Nutr. 2007; 98: 517-24. 13. Barker DJ. The developmental origins of adult disease. Eur J Epidemiol. 2003; 18(8): 733-6. 14. Roseboom T, de Rooij S, Painter R. The Dutch famine and its long-term consequences for adult health. Early Hum Dev. 2006; 82: 485-91. 15. Ong KK, Ahmed ML, Emmett PM, Preece MA, Dunger DB. Association between postnatal catch-up growth and obesity in childhood: prospective cohort study. BMJ. 2000; 320(7240): 967-71. 16. Lucas A. Programming by Early Nutrition: An Experimental Approach. J Nutr. 1998; 128(2): 401S-. 17. Singhal A, Fewtrell M, Cole TJ, Lucas A. Low nutrient intake and early growth for later insulin resistance in adolescents born preterm. Lancet. 2003; 361(9363): 1089-97. 18. Cleal JK, Poore KR, Boullin JP, Khan O, Chau R, Hambidge O, et al. Mismatched pre- and postnatal nutrition leads to cardiovascular dysfunction and altered renal function in adulthood. Proc Natl Acad Sci U S A. 2007; 104(22): 9529-33. 19. Pediatrics AAo. Breastfeeding and the use of human milk. Pediatrics. 2005; 115: 496-506. 20. National Health and Medical Research Council. Dietary Guidelines for Children and Adolescents in Australia incorporating the Infant feeding Guidelines for Health Workers. Canberra: Government Printing Office; 2003. 21. Patole S, Muller R. Enteral feeding of preterm neonates: a survey of Australian neonatologists. J Matern Fetal Neonatal Med. 2004; 16: 309-14.
6
22. Lonnerdal B. Nutritional and physiologic significance of human milk proteins. Am J Clin Nutr. 2003; 77(Suppl): 1537S-43S. 23. Kovacs A, Funke S, Marosvolgyi T, Burus I, Decsi T. Fatty acids in early human milk after preterm and full-term delivery. J Pediatr Gastroenterol Nutr. 2005; 41(4): 454-9. 24. Chuang C, Lin S, Lee H, Wang T, Shih Y, Huang F, et al. Free amino acids in full term and preterm human milk and infant formula. J Pediatr Gastroenterol Nutr. 2005; 40(4): 496-500. 25. Hernell O, Blackberg L. Digestion of human milk lipids: physiologic significance of sn-2-monoacylglycerol hydrolysis by bile salt stimulated lipase. Pediatr Res. 1983; 16: 882-5. 26. Cox DB, Kent JC, Casey TM, Owens RA, Hartmann PE. Breast growth and the urinary excretion of lactose during human pregnancy and early lactation: endocrine relationships. Exp Physiol. 1999; 84(2): 421-34. 27. Pang W, Hartmann P. Initiation of Human Lactation: Secretory Differentiation and Secretory Activation. J Mammary Gland Biol Neoplasia. 2007; 12: 211-21. 28. Henderson JJ, Hartmann PE, Newnham JP, Simmer K. Effect of preterm birth and antenatal corticosteroid treatment on lactogenesis II in women. Pediatrics. 2008; 121(1): e92-100. 29. Bortolozo EA, Tiboni EB, Candido LM. [Milk from human milk banks for low birthweight newborns: nutritional contents and supplementation]. Rev Panam Salud Publica. 2004; 16(3): 199-205. 30. Wojcik KY, Rechtman DJ, Lee ML, Montoya A, Medo ET. Macronutrient analysis of a nationwide sample of donor breast milk. J Am Diet Assoc. 2009; 109(1): 137-40. 31. Anderson GH, Atkinson SA, Bryan MH. Energy and macronutrient content of human milk during early lactation from mothers giving birth prematurely and at term. Am J Clin Nutr. 1981; 34(2): 258-65. 32. Lai C, Simmer K, Hartmann P. Variability in human milk composition of mothers delivering preterm. 2007 (Personal Communication 05/02/2007 C. Lai BBCS, UWA). 33. Gross SJ, Geller J, Tomarelli RM. Composition of breast milk from mothers of preterm infants. Pediatrics. 1981; 68(4): 490-3. 34. Tsang RC, Uauy R, Koletzko B, Zlotkin SH, editors. Nutrition of the preterm infant. Scientific basis and practical guidelines. 2nd Edition ed. Cincinnati, Ohio: Digital Educational Publishing, Inc.; 2005. 35. Kuschel CA, Harding JE. Multicomponent fortified human milk for promoting growth in preterm infants. Cochrane Database Syst Rev. 2004; 2: CD000343. 36. Clark RH, Wagner CL, Merritt RJ, Bloom BT, Neu J, Young TE, et al. Nutrition in the neonatal intensive care unit: how do we reduce the incidence of extrauterine growth restriction? Journal of Perinatology. 2003; 23(4): 337-44. 37. Ehrenkranz RA, Younes N, Lemons JA, Fanaroff AA, Donovan EF, Wright LL, et al. Longitudinal growth of hospitalised very low birth weight infants. Pediatrics. 1999; 104(2 Pt 1): 280-9. 38. Henriksen C, Westerberg AC, Ronnestad A, Nakstad B, Veierod MB, Drevon CA, et al. Growth and nutrient intake among very-low-birth-weight infants fed fortified human milk during hospitalisation. Br J Nutr. 2009: 1-8. 39. Kelly H, Sloan R, Hoffman Wea. Accumulation of nitrogen and six minerals in the human fetus during gestation. Human Biol. 1951; 23: 61-74. 40. Ziegler E, O'Donnell A, Nelson S, Fomon S. Body composition of the reference fetus. Growth. 1976; 40: 329-41.
7
41. Sparks J. Human intrauterine growth and nutrient accretion. Seminars in Perionatology. 1984; 8(2): 74-92. 42. Embleton NE, Pang N, Cooke RJ. Postnatal malnutrition and growth retardation: an inevitable consequence of current recommendations in preterm infants? Pediatrics. 2001; 107(2): 270-3. 43. McCance RA, Widdowson EM. The determinants of growth and form. Proc R Soc Lond B Biol Sci. 1974; 185: 1-17. 44. McCance RA. The composition of the body: its maintenance and regulation. Nutr Abstr Rev. 1972; 42(4): 1269-79. 45. Collins CT, Gibson RA, Miller J, McPhee AJ, Willson K, Smithers LG, et al. Carbohydrate intake is the main determinant of growth in infants born <33 weeks' gestation when protein intake is adequate. Nutrition. 2008; 24: 451-7. 46. Snyderman SE, Boyer A, Kogut MD, Holt LE, Jr. The protein requirement of the premature infant. I. The effect of protein intake on the retention of nitrogen. J Pediatr. 1969; 74(6): 872-80. 47. Martin CR, Brown YF, Ehrenkranz RA, O'Shea TM, Allred EN, Belfort MB, et al. Nutritional practices and growth velocity in the first month of life in extremely premature infants. Pediatrics. 2009; 124(2): 649-57. 48. Millward DJ, Jackson AA. Protein/energy ratios of current diets in developed and developing countries compared with a safe protein/energy ratio: implications for recommended protein and amino acid intakes. Public Health Nutr. 2004; 7(3): 387-405. 49. Donovan S, Atkinson SA, Whyte R, Lonnerdal B. Partition of nitrogen intake and excretion in low birth weight infants. Am J Dis Child. 1989; 143: 1485-91. 50. van den Akker CH, te Braake FW, Wattimena DJ, Voortman G, Schierbeek H, Vermes A, et al. Effects of early amino acid administration on leucine and glucose kinetics in premature infants. Pediatr Res. 2006; 59: 732-5. 51. Thureen P. The neonatologist's dilemma: catch up growth or beneficial undernutrition in very low birth weight infants - What are optimal growth rates? JPGN. 2007; 45: S152-S4. 52. Hales CN, Ozanne SE. The dangerous road of catch-up growth. J Physiol (Lond). 2003; 547 (Part 1): 5-10. 53. Denne S. Protein and energy requirements in preterm infants. Semin Neonatol. 2001; 6: 377-82. 54. Hulzebos CV, Sauer PJ, Hulzebos CV, Sauer PJJ. Energy requirements. Seminars In Fetal & Neonatal Medicine. 2007; 12(1): 2-10. 55. Thureen P, Heird WC. Protein and energy requirements of the preterm/low birthweight (LBW) infant. Pediatr Res. 2005; 57(5 Pt 2): 95R-8R. 56. Wilson DC, McClure G. Energy requirements in sick preterm babies. Acta Paediatr Suppl. 1994; 405: 60-4. 57. Leitch C, Denne S. Energy. In: Tsang RC UR, Koletzko B, Zlotkin SH, editor. Nutrition of the preterm infant Scientific basis and practical guidelines. 2nd ed. Ohio: Digital Educational Publishing Inc; 2005. p. 23-44. 58. Leitch CA, Ahlrichs J, Karn C, Denne SC. Energy expenditure and energy intake during dexamethasone therapy for chronic lung disease. Pediatr Res. 1999; 46(1): 109-13. 59. Leitch CA, Denne SC. Energy expenditure in the extremely low-birth weight infant. Clin Perinatol. 2000; 27(1): 181-95, vii-viii. 60. Rigo J. Protein, amino acid and other nitrogen compounds. In: Tsang R, Uauy R, Koletzko B, Zlotkin S, editors. Nutrition of the preterm infant Scientific basis and practical guidelines. 2nd ed. Cincinati: Digital Educational Publishing Inc; 2005. 61. Agostoni C, Buonocore G, Carnielli VP, De Curtis M, Darmaun D, Decsi T, et al. Enteral nutrient supply for preterm infants: commentary from the European Society
8
of Paediatric Gastroenterology, Hepatology and Nutrition Committee on Nutrition. J Pediatr Gastroenterol Nutr. 2010; 50(1): 85-91. 62. Simmer K, Simmer K. Aggressive nutrition for preterm infants--benefits and risks. Early Human Development. 2007; 83(10): 631-4. 63. Ibrahim HM, Jeroudi MA, Baier RJ, Dhanireddy R, Krouskop RW. Aggressive early total parental nutrition in low-birth-weight infants. J Perinatol. 2004; 24(8): 482-6. 64. te Braake FW, van den Akker CH, Wattimena DJ, Huijmans JG, van Goudoever JB. Amino acid administration to premature infants directly after birth. J Pediatr. 2005; 147(4): 457-61. 65. Valentine CJ, Fernandez S, Rogers LK, Gulati P, Hayes J, Lore P, et al. Early amino-acid administration improves preterm infant weight. J Perinatol. 2009; 29(6): 428-32. 66. Thureen PJ. Early aggressive nutrition in very preterm infants. Nestle Nutr Workshop Ser Pediatr Program. 2007; 59: 193-204; discussion -8. 67. Mishra S, Agarwal R, Jeevasankar M, Deorari AK, Paul VK. Minimal enteral nutrition. Indian J Pediatr. 2008; 75(3): 267-9. 68. Adamkin DH. Early aggressive nutrition: parenteral amino acids and minimal enteral nutrition for extremely low birth weight (<1 000 g) infants. Minerva Pediatr. 2007; 59(4): 369-77. 69. Kashyap S. Enteral intake for very low birth weight infants: what should the composition be? Semin Perinatol. 2007; 31(2): 74-82. 70. Corvaglia L, Battistini B, Paoletti V, Aceti A, Capretti MG, Faldella G. Near-infrared reflectance analysis to evaluate the nitrogen and fat content of human milk in neonatal intensive care units. Arch Dis Child Fetal Neonatal Ed. 2008; 93(5): F372-5. 71. Polberger S, Lonnerdal B. Simple and rapid macronutrient analysis of human milk for individualized fortification: basis for improved nutritional management of very-low-birth-weight infants? J Pediatr Gastroenterol Nutr. 1993; 17(3): 283-90. 72. Menjo A, Mizuno K, Murase M, Nishida Y, Taki M, Itabashi K, et al. Bedside analysis of human milk for adjustable nutrition strategy. Acta Paediatr. 2009; 98(2): 380-4. 73. Brunton JA, Bayley HS, Atkinson SA. Validation and application of dual-energy x-ray absorptiometry to measure bone mass and body composition in small infants. Am J Clin Nutr. 1993; 58(6): 839-45. 74. Brunton J, Weiler H, Atkinson S. Improvement in the accuracy of dual energy x-ray absorptiometry for whole body and regional analysis of body composition: validation using piglets and methodologic considerations in infants. Pediatr Res. 1997; 41: 590-6. 75. Ma G, Yao M, Liu Y, Lin A, Zou H, Urlando A, et al. Validation of a new pediatric air-displacement plethysmograph for assessing body composition in infants. Am J Clin Nutr. 2004; 79: 653=60. 76. Olhager E, Flinke E, Hannerstad U, Forsum E. Studies on human body composition during the first 4 months of life using magnetic resonance imaging and isotope dilution. Pediatric Research. 2003; 54(6): 906-12. 77. Thureen PJ, Melara D, Fennessey PV, Hay WW, Jr. Effect of low versus high intravenous amino acid intake on very low birth weight infants in the early neonatal period. Pediatr Res. 2003; 53(1): 24-32. 78. Arslanoglu S, Moro GE, Ziegler EE. Adjustable fortification of human milk fed to preterm infants: does it make a difference?[see comment]. Journal of Perinatology. 2006; 26(10): 614-21. 79. Arslanoglu S, Moro G, Ziegler E. Preterm infants fed fortified human milk receive less protein than they need. J Perinatol. 2009; 29: 489-92.
9
80. Polberger S, Raiha NC, Juvonen P, Moro GE, Minoli I, Warm A. Individualized protein fortification of human milk for preterm infants: comparison of ultrafiltrated human milk protein and a bovine whey fortifier. J Pediatr Gastroenterol Nutr. 1999; 29(3): 332-8. 81. de Halleux V, Close A, Stalport S, Studzinski F, Habibi F, Rigo J. [Advantages of individualized fortification of human milk for preterm infants]. Archives de Pediatrie. 2007; 14 Suppl 1: S5-10. 82. Ronnholm K, Perheentupa J, Siimes M. Supplementation with human milk protein improves growth of small premature infants fed human milk. Pediatrics. 1986; 77: 649-53. 83. Rodriguez G, Samper MP, Olivares JL, Ventura P, Moreno LA, Perez-Gonzalez JM. Skinfold measurements at birth: sex and anthropometric influence. Arch Dis Child Fetal Neonatal Ed. 2005; 90(3): F273-5. 84. Schmelzle HrR, Fusch C. Body fat in neonates and young infants: validation of skinfold thickness versus dual-energy X-ray absorptiometry. The American Journal Of Clinical Nutrition. 2002; 76(5): 1096-100. 85. Groh-Wargo S, Jacobs J, Auestad N, O'Connor DL, Moore JJ, Lerner E. Body composition in preterm infants who are fed long-chain polyunsaturated fatty acids: a prospective, randomized, controlled trial. Pediatr Res. 2005; 57(5 Pt 1): 712-8. 86. Hartnoll G, Betremieux P, Modi N. Randomised controlled trial of postnatal sodium supplementation on body composition in 25 to 30 week gestational age infants. Arch Dis Child Fetal Neonatal Ed. 2000; 82(1): F24-8. 87. Singhi S, Sood V, Bhakoo ON, Ganguly NK. Effect of intrauterine growth retardation on postnatal changes in body composition of preterm infants. Indian J Med Res. 1995; 102: 275-80. 88. Dung NQ, Fusch G, Armbrust S, Jochum F, Fusch C. Body composition of preterm infants measured during the first months of life: bioelectrical impedance provides insignificant additional information compared to anthropometry alone. Eur J Pediatr. 2007; 166(3): 215-22. 89. Tang W, Ridout D, Modi N. Influence of respiratory distress syndrome on body composition after preterm birth. Arch Dis Child Fetal Neonatal Ed. 1997; 77(1): F28-31. 90. Roggero P, Gianni ML, Amato O, Orsi A, Piemontese P, Cosma B, et al. Postnatal growth failure in preterm infants: recovery of growth and body composition after term. Early Hum Dev. 2008; 84(8): 555-9. 91. Roggero P, Gianni ML, Amato O, Orsi A, Piemontese P, Morlacchi L, et al. Is term newborn body composition being achieved postnatally in preterm infants? Early Hum Dev. 2009; 85(6): 349-52. 92. Roggero P, Gianni ML, Amato O, Orsi A, Piemontese P, Puricelli V, et al. Influence of protein and energy intakes on body composition of formula-fed preterm infants after term. J Pediatr Gastroenterol Nutr. 2008; 47(3): 375-8. 93. McDevitt H, Tomlinson C, White MP, Ahmed SF. Changes in quantitative ultrasound in infants born at less than 32 weeks' gestation over the first 2 years of life: influence of clinical and biochemical changes. Calcified Tissue International. 2007; 81(4): 263-9. 94. Olhager E, Forsum E. Total energy expenditure, body composition and weight gain in moderately preterm and full-term infants at term postconceptional age. Acta Paediatrica (Oslo, Norway: 1992). 2003; 92(11): 1327-34. 95. Pereira-da-Silva L, Abecasis F, Virella D, Videira-Amaral JM. Upper arm anthropometry is not a valid predictor of regional body composition in preterm infants. Neonatology. 2009; 95(1): 74-9.
10
96. Urlando A, Dempster P, Aitkens S. A new air displacement plethysmograph for the measurement of body composition in infants. Pediatric Research. 2003; 53(3): 486-92. 97. Wagner DR, Heyward VH. Techniques of body composition assessment: a review of laboratory and field methods. Res Q Exerc Sport. 1999; 70(2): 135-49. 98. Wilson DC, Day JM, Hamilton A, McClure G, Davies PS. Noninvasive methods of body composition analysis in preterm infants:--comparison with dilution of 2H218O. Basic Life Sci. 1993; 60: 133-8. 99. Australian Bureau of Statistics. Australian Social Trends 4102.0. 2007. 100. Department of Health and Human Services Centres for Disease Control and Prevention. Maternal and infant health research: preterm birth. 2009 [cited; Available from: http://www.cdc.gov/reproductivehealth/MaternalInfantHealth/PBP.htm 101. Field DJ, Dorling JS, Manktelow BN, Draper ES. Survival of extremely premature babies in a geographically defined population: prospective cohort study of 1994-9 compared with 2000-5. BMJ. 2008; 336(7655): 1221-3. 102. Elder DE, Hagan R, Evans SF, Benninger HR, French NP. Hospital admissions in the first year of life in very preterm infants. J Paediatr Child Health. 1999; 35(2): 145-50. 103. Commonwealth Department of Health and Ageing. National Hospital Cost Data Collection Cost Report Round 11 (2006-2007) Canberra: Australia. 2008. 104. Doyle LW, Ford G, Davis N. Health and hospitalistions after discharge in extremely low birth weight infants. Semin Neonatol. 2003; 8(2): 137-45. 105. Westby Wold SH, Sommerfelt K, Reigstad H, Ronnestad A, Medbo S, Farstad T, et al. Neonatal mortality and morbidity in extremely preterm small for gestational age infants: a population based study. Arch Dis Child Fetal Neonatal Ed. 2009; 94(5): F363-7. 106. Regev R, Lusky A, Dolfin T, Litmanovitz I, Arnon S, Reichman B. Excess mortality and morbidity among small for gestational age premature infants: a population based study. J Pediatr. 2003; 143: 186-91. 107. Monset-Couchard M, de Bethmann O, Relier JP. Long term outcome of small versus appropriate size for gestaional age co-twins/triplets. Arch Dis Child Fetal Neonat Ed. 2004; 89: F310-14.
11
2.1 Part 1 - Preterm Nutrition
2.1.1 Determinants of Growth
Fetal life, especially in the second half of pregnancy, is a time of rapid growth and
development. The fetus, fully dependent on its environment for everything it requires,
can only reach its full genetic potential when completely integrated in an optimal
environment1.
Much of what is known about the effects of nutrition on growth and development in
fetal and early postnatal life has been determined on animals. Over the course of time,
these studies have revealed not only the general principles of growth but have attempted
to elucidate the mechanisms involved and the interactions between genetics, metabolism
and the environment.
For example, in a classic experiment, Widdowson and McCance2 varied the number of
rats to be suckled by a single mother from the first day of birth and in so doing, offered
milk ad libitum to some and restricted the intake of others. As Kennedy had done
before them3, Widdowson and McCance found the first week to be a critical one in the
life of the rat, with a difference in growth between the small and large litters being
established within this short period. Those receiving unrestricted intake were two to
four times heavier than those in the large litters at 21 days of age and although all were
offered unlimited access to stock diet when they were able to eat, the difference in size
continued to increase and the rats in the small litters became much larger adults.
Widdowson and McCance2 reported that acceleration of growth altered the times at
which maturity was reached. Development of some functions appeared to be linked
more to chronological age (length and sexual maturity) whilst for others, it was
generally more closely linked to size (kidneys, adrenals, liver, stomach and small
intestine). Chemical maturity of skeletal muscle appeared to be a function of both age
and size. Accelerating growth during the suckling period exaggerated the natural
tendency to deposit fat. After each attaining a body mass of 170 g, the percentage of fat
in all rats was similar.
Widdowson4 later compared the growth of term piglets under-nourished in utero (runts
of 115 d gestational age) with normally growing fetuses of the same size but younger
(~ 25 d short of term, i.e. 90 d gestational age), and normally grown term piglets of the
12
same age but larger (~115 d gestational age). At term, the runts’ organs were a similar
weight to those of the fetuses 21 days younger, but their muscle mass was reduced,
suggesting lean tissue accretion was affected well before the 90th day of gestation. The
runts at term achieved only 39% of the body mass of their larger littermates, but 87% of
their brain-weight and between 26-53% of the weight of their remaining organs, which
suggests that growth, at least for some organs, was retarded in relation to body size and
that growth of others (e.g. the brain) had been relatively spared.
Some runts were rehabilitated and permitted to grow to maturity, but complete catch-up
growth was not achieved - the skeletons of the runts were fracture free, but they were
shorter and lighter. Also, although the organ weights of the rehabilitated runts were in
proportion for their size, they were much lighter when compared to the size of the
organs of their larger littermates.
In this same study, under-nourishing normally grown piglets after birth (just sufficient
nutrition to permit slow growth) produced similar growth patterns at one year of age to
those seen in the runts at birth. That is, muscle wasting was evident and there was
differential organ growth such that those organs least affected were those vital for
survival. Differences were observed in the size but not the number of muscle fibres in
the under-nourished pigs compared with those that were well nourished.
Rehabilitating these pigs, under-nourished for one, two or three years after birth with
abundant food demonstrated that appetites were veracious on re-feeding and they grew
rapidly. Organ size was in proportion to body size, DNA increased but nuclear division
stopped before complete catch-up growth was achieved. Fat deposition was greatest in
the pigs that had been under-nourished the longest.
In more recent years, Ozanne and Hales5 have provided compelling evidence that rapid
postnatal catch-up growth is associated with a reduced lifespan. Using a cross fostering
technique, these authors exposed mice either to a low protein intake to induce growth
restriction during fetal life (fetal undernutrition) or in the case of male offspring, to a
low protein intake in early postnatal life (postnatal undernutrition), and then exposed the
male mice either to normal chow diet (postnatal normal nutrition) or an obesity-
inducing diet (postnatal overnutrition). Shorter lifespan was seen in the animals that
were protein deprived and growth restricted during fetal life and that then underwent a
13
period of rapid postnatal growth acceleration (fetal undernutrition and
postnatal overnutrition). In contrast, Ozanne and Hales demonstrated that the male
mice that grew normally in utero that were nursed by low-protein-fed mothers in
unculled litters (fetal normal nutrition and postnatal undernutrition) not only had their
lifespan increased (by as much as 57%), but also appeared to be protected against the
life shortening effect of exposure to the obesity inducing diet.
Cleal and colleagues6 studied adult male offspring of ewes subjected to either
50% nutrient restriction or normal nutrient intake in early gestation, and then to either
postnatal nutritional deficiency or an adequate postnatal diet for the first three months of
life. The authors created four groups, two of which matched the pre and postnatal
nutritional environments and two in which they were mismatched. They found that a
mismatch between pre and postnatal nutrient environments (relative undernutrition
followed by adequate postnatal nutrition) induced cardiac hypertrophy, endothelial
dysfunction, poorer blood pressure control and altered vascular tone, compared to those
whose pre and postnatal nutrient environments were matched (i.e. undernourished in
early gestation and the first three months of postnatal life).
Widdowson and McCance1, 7, 8 in the late 1970’s summarised the lessons they had
learned about the determinants of growth and they remain pertinent today. Growth is a
function of genetics (plus epigenetics and the environment) and is influenced among
other things, by illness and nutrition9. Growth begins from the moment of conception
and division of the ovum marks the beginning of cell differentiation into tissues and
organs10. The growth of each organ takes place in at least two major stages: (i) increase
in cell number; and (ii) an increase in cell size11.
A biological clock is at work; that is, the time and rate at which the body grows is under
endocrine and metabolic regulation and is a function of chronological time from
conception1, 10. Increase in cell number, rather than cell size, tends to be more closely
connected to this biological clock. In no tissue can it continue indefinitely or beyond a
certain age2, 10. There is a metabolic cost associated with growth, and maintenance
requirements must first be met for normal growth to occur10, 12-14. No two parts of the
body grow at the same rate relative to the body as a whole and the time taken to reach
maturity differs between species2, 10, 15-17. Each nutrient has its own characteristic
influence on these processes, but all nutrient deficiencies delay growth10. Protein and
14
energy deficiencies delay all the processes of growth and tend to delay growth in size
and weight more than development and differentiation. If these nutritional insults occur
beyond the period when cell proliferation is possible the organ and body will never
achieve its full genetic complement of cells, even when nutrition is optimised2, 10, 11.
2.1.2 Developmental Origins of Health and Disease
It is difficult to know the extent to which the aforementioned findings can be
extrapolated to human populations. However, the animal studies support the view that
either deficiencies or excesses of nutrition during critical periods in the lifespan can
alter the normal trajectory of growth and development. Support is also found in
epidemiological and a limited number of experimental human studies. For example, the
five-month long severe ‘Dutch Famine’ provided a unique natural human study of the
long-term health effects of malnutrition exposure during gestation and childhood. Both
the timing of exposure, as well as the ensuing period of recuperation18 following the
famine, proved critical in influencing later health outcomes. Specifically, exposure to
undernutrition in early gestation resulted in increases in obesity19, coronary heart
disease20, atherogenic lipid profile21 and schizophrenia22. Exposure in mid and/or late
gestation resulted in impaired glucose tolerance23, hypertension24, microalbuminuria25,
obstructive airways disease26 and affective disorders27. Earlier menopause28 and
changes in insulin-like growth factor-I29 were evident in those exposed in early
childhood and there was a stronger association between famine exposure and breast
cancer for women who were exposed to famine between the ages of two and nine
years30. Similarly, two English surveys independently suggest that low birth weight31
and low weight at one year32 increases risk of cardiovascular31 and coronary heart
disease32. Low growth rates up to one year are associated with increased prevalence of
known risk factors for cardiovascular disease, including blood pressure33. Studies such
as these have shaped current theories about the developmental origins of health and
disease34, including the ‘Barker Hypothesis’35, the ‘Thrifty Gene Hypothesis’36 and the
‘Predictive Adaptive Response Hypothesis’37, 38.
Combined, these theories suggest that environmental cues, in the form of hormones and
of nutrients that cross the placenta to the fetus, can be affected by the mother’s BC,
metabolism, long-term lifestyle, immediate diet and stress levels. Developmental
plasticity37, 38 operates to program metabolism39 and provides the fetus and young infant
with the capacity to adjust the trajectory of growth and development to match these
15
environmental cues38. At one level, rapid and reversible homeostatic mechanisms can
be activated to mount an immediate adaptive response. However, adaptive responses
mounted to deal with either stressors or exposures during critical developmental periods
can affect growth, tissue differentiation and physiological set-points, affecting responses
to environmental challenges for life38. This adaptive plasticity is thought to be mediated
by epigenetic processes and confer an advantage in environments that change over
several generations37, 38, 40.
Most of the epidemiological evidence to support these theories has been mainly related
to maternal undernutrition, low birth weight, term offspring and later manifestation of
metabolic alterations of the offspring in adult life41, 42. However, limited evidence is
emerging to give some credibility to the relevance of these theories in the preterm infant
population. Children, adolescents and young adults born preterm were found to have
lower insulin sensitivity43-45 and higher blood pressure46 when compared to
age-matched controls born at term. Children aged 13-16 years, who were born preterm
and fed unfortified breast milk, had lower blood pressure47, lower lipid profile48, lower
leptin levels49 and greater insulin sensitivity50 compared to those preterm-born children
of similar age fed higher amounts of protein and energy from a commercially prepared
product (protein energy ratio (PER): 2.5 g protein per 100 kcal; IU 1 kcal = 4.184 kJ).
However, nutrition practices have changed over time and therefore it is difficult to
know if current formula preparations, which provide higher amounts of protein (PER:
2.7-3.6) would have the same effect on contemporary babies at the same age.
Still, concerns about the short and long-term growth and health outcomes of preterm
infants would appear justified based on current knowledge, which suggests that the
amount and type of nutrition provided during their early postnatal development may be
of critical importance to their biology. Preterm infants are surviving as young as
23 weeks gestation51. There is both a metabolic and physiological mismatch between
their pre and postnatal environments and the nutrition a preterm infant receives in the
early postnatal period, and up to term age, is in stark contrast to that received by the
aged-matched fetus that remains growing in utero.
2.1.3 Fetal Nutrient Accretion
Implicit in all preterm nutrition recommendations is an understanding of fetal growth
and nutrient accretion rates in the third trimester of intrauterine life. The rate at which
16
lean tissue accretion and fat deposition occurs in the fetus has been elucidated in the
majority from the chemical analyses of more than 169 human fetal cadavers. There has
been some difficulty in synthesising this body of work due to differences in analytical
procedures and incomplete datasets. A review of the literature up until 1951 (Fehling
1877, Camerer 1900a, Camerer 1900b, Camerer 1902, Soldner 1903, Givens and
Macy52 Hugounenq 1900, Iob and Swanson53, Schimitz 1923, Rosemann 1911,
Langstein 1917, Brubacher 1891 and Michel 1899) was attempted by Kelly and her
colleagues54, but in order for them to construct fetal age-specific curves for the contents
of the different chemical components these authors found it was necessary to first obtain
complete translations of the published literature. Unfortunately, once translations were
complete it became evident that in many instances the fetuses analysed were ‘judged’,
or ‘seemed’ to be ‘about’ a certain age … [and that] of the available papers presenting
analyses of human fetuses, only eleven contained records of the lengths.
Although there are marked differences in the BC of human fetuses of the same length,
there appears a definite relationship between age and average composition52. Thus,
since gestation could be calculated from crown-heel length, according to the method by
Scammon and Calkins55 [age=2.3+2.5/28(length)+(length)2/784], Kelly et al.54
compiled a dataset of 95 human fetuses, choosing from only those available papers
which included length records, and for each fetus, when data existed, recorded the
components of lipid, nitrogen, calcium, phosphorus and other nutrients. Whilst the
authors did not discuss the analytical methods used by the original investigators of these
papers, they did acknowledge that the dataset represented unknown variations in
methods of collection, preparation and analysis, and the subjects themselves likely
differed in their respective ethnicities as well as their nutritional and medical status.
Many of these methodological differences persisted in the later study designs of
Widdowson and Spray56, Widdowson and Dickerson57, Fee and Weil58 and Apte and
Iyenger59.
In agreement with an earlier review by Sparks60, marked variations exist in the
methodology of the chemical studies reported by Kelly et al54 and of those that have
since been published56-59.
17
These include:
The variation in the period of time between delivery and analysis, potentially
affecting measurements of total body water, body mass and length. For example,
Iob and Swanson53, Widdowson et al.56 and Apte and Iyengar59 were among
investigators who analysed unpreserved fetuses, which is likely to be most ideal for
obtaining accurate total body and organ weight and for estimating total body water.
Many of the fetuses in the series reviewed by Kelly et al.54 were kept on ice or
preserved in alcohol or formaldehyde prior to analysis.
Age was calculated from last menstrual age, foot length56, or according to Scammon
and Calkins’55 or Arey’s61 formulae, using crown-to-heel measurement52.
- Arey’s formula (crown-heel length (cm) x 0.2)61 is more simplified than the
formula of Scammon and Calkins55. It was Arey’s belief that Scammon and
Calkins had derived their formula using a dataset62 that had been corrected for
conceptional age, and that in interpolating the data to derive their total body
lengths, they had made the correction again61. Substitution of the original data62
into Scammon and Calkin’s formulae55 do not support Arey’s belief61.
Scammon and Calkins55 derived one formula based on Mall’s length data,
calculated from the last menstrual date62 (used by Kelly et al.54), as well as a
modification of this formula to calculate fetal age55 from the day of
conception62.
Whole carcass analyses were performed for some infants53, 58, whilst others analysed
aliquots of body organs56 and applied mathematical modelling based on organ
weight. The latter assumes uniform composition within the organ/tissue being
measured.
There was considerable variation in the reported solvents and/or methods used for
fat determination. Some investigators did not achieve total fat extraction, thus
structural lipids in membranes (and cholesterol, cholesterol-esters and the LCPUFA
in the nervous system) were not always quantified and fat mass (FM) was therefore
underestimated.
18
Total nitrogen was commonly converted to protein (conversion factor: 6.25) without
correction for non-protein nitrogen, resulting in overestimation of protein.
The fetuses and infants were a heterogeneous mix of stillborn, liveborn and
spontaneous abortions; thus the reasons for delivery were variable, including
adverse pregnancy, complications during labour or after birth or a combination of
these factors. Thus, birth weights and BC of the fetuses measured may not always
have been reflective of normal, healthy fetuses.
Some fetuses were born of malnourished mothers59 or of mothers with diabetes58.
Thus infants may have been growth restricted or macrosomic for gestation.
Data was reported in a variety of ways (i.e. graphically52, 56, as a proportion of total
ash, or as a proportion of total or fat free mass (FFM)53, 54, 57-59) and with varying
degrees of completeness.
Length was invariably measured using a tape:
- The accuracy of a length measurement can be affected by:
(i) the plasticity of the fetal head, which purportedly can amount to a length
measurement error of 0.5 to 1.0 cm; as well as
(ii) water loss, potentially occurring between delivery and analysis.
It is noteworthy that prior to Widdowson and Dickerson’s paper57, only six of all fetuses
analysed appeared to have weighed above 3000 g. Indeed, of the 95 reviewed by
Kelly et al.54, 74 had weights below 1000 g and only one infant, analysed by Fehling63,
weighed above 3000 g. Widdowson and Dickerson57 noted that when previous
investigators’ results for water, protein and fat were plotted against weight, curves
similar to those created from their own data could be obtained in the early stages. In
their view, relating values of BC to weight was preferable over age, as it was almost
impossible to be sure of the exact age of any of the fetuses that had so far been
analysed. By their estimates, the average term infant weighed about 600 g more than
was previously suggested for the ‘average’ newborn infant and fat content was closer to
16%, rather than 12%, of body weight. In their estimation, total average nitrogen
content of the term infant was 62.0 g (387.5 g protein, assuming protein was 16% N).
19
In 1974, and previously with Dickerson57, Widdowson7 reviewed the available fetal data
and accounted for the changes in body proportions and composition during growth.
Key points of their combined discourse are summarised:
The smallest fetuses weighing between 0.75 and 1.6 g comprise 93-95% water and
the term infant weighing an average 3500 g contains about 69% water in its body,
equivalent to approximately 82% when expressed in terms of FFM.
In the early stages of gestation, the fetus lays down only essential lipids
(e.g. long chain polyunsaturated fatty acids (LCPUFA) - docosahexaenoic acid
(DHA) and arachidonic acid (AA) in the nervous system; phospholipids in the cell
membranes) and for the first half of gestation, has no more than 0.5% fat.
Around the beginning of the second half of gestation, deposition of white fat in the
connective tissue under the skin and in the omenta becomes evident as well as
brown fat deposits around the muscles and blood vessels at the neck and between
the scapulae, around the vessels entering the thoracic duct, and around the aorta, the
kidneys and the adrenals64.
At 28, 34 and 40 weeks, the fetus has approximately 3.5%, 7.5% and 16% body fat,
respectively.
Increase in body mass accounts for most of the incremental change in nitrogen (and
potassium, the major intracellular ion).
Calcium and phosphorous are found in almost equal amounts (1.6-2.6 g kg-1
FFM) in fetuses weighing 10-50 g around 10-14 weeks gestation. The skeleton
becomes progressively calcified and the proportion of calcium in the body increases
more rapidly than that of phosphorus as the fetus grows. Near term, calcium values
range from between 8 to 11 g kg-1 FFM and the Ca:P ratio is between 1.7-1.8, which
is slightly lower than the average value for the adult.
Phosphorus increases in proportion to the body during fetal life and at term its value
of 6 g kg-1 FFM is half that of the adult.
The proportion of magnesium in the FFM rises during gestation from between 80 to
290 mg kg-1 FFM, but at term is still considerably less than that of an adult.
20
2.1.4 The Reference Fetus
From the available data of approximately 169 fetuses60, Ziegler et al.65 constructed the
BC of the reference fetus using only 22 fetuses. Their selection was limited to data
where:
gestational age was known from the date of the last menstrual period or
calculated from fetal length, using Scammon and Calkins’55 formula;
the gestations of all fetuses were greater than 22 weeks;
the mothers were non-diabetic and thought to be well nourished;
the infant was stillborn or had died within 48-hours of birth; and
there was no evidence of major congenital abnormalities.
Thus, data of fetuses ranging in gestation from 23.6 to 42 weeks were taken from the
reports of Camerer & Soldner (1900a, 1900b, 1902) as reported in Kelly et al54, Iob and
Swanson53 and Fee and Weil58. Camerer (1900a, 1900b, 1902) determined total
nitrogen by Kjeldahl and total lipid by alcohol and ether extraction66. Iob and
Swanson53 also determined total nitrogen by Kjeldahl and extracted mostly neutral,
non-polar, storage lipids (i.e. predominantly triacylglycerides) using the faecal fat
method described by Holt et al.67. Fee and Weil used the micro-Kjeldahl method to
determine nitrogen and also extracted neutral non-polar, storage lipids, which were
quantified by a three-time extraction with ethyl and petroleum ether (1:1). In all
studies, protein was assumed to comprise 16% nitrogen, which assumes complete
incorporation of total body nitrogen (TBN) into body protein68. This assumption, in
adults at least, is subject to a systematic error of 2-3%68, because under normal
physiological conditions, although more than 99% of TBN is incorporated into
protein68, there is a remaining portion that is found in non-protein sources such as urea,
creatine, creatinine, uric acid and free amino acids68. This non-protein nitrogen source
can increase in certain disease states, such as renal dysfunction and congestive heart
failure68. A variety of methods, which will not be discussed in this thesis, were used to
determine mineral composition. The birth weight of the six term-born infants
(37 wk to <42 wk) in this dataset varied from 2476 g to 3048 g. The infant born at
42 weeks gestation weighed 3348 g. In constructing the reference fetus, the authors65
excluded the work of Widdowson et al.56, 57 because estimates of gestational age, based
on recorded foot length, seemed unsatisfactory. The series of Apte and Iyengar59 was
excluded because the mothers were malnourished, as was the fetus of the malnourished
21
non-diabetic mother in the Fee and Weils report, and all those fetuses in the same report
whose mothers had diabetes58. Other reports, including those of Given’s and Macy52,
were excluded because of incomplete analysis.
Ziegler et al.65 modelled the data using a second order polynomial equation for lipid and
for the remaining components, a modified exponential function. The regression
equations permitted calculation of body mass and amounts of various components for
each week of gestational age from 24 to 40 weeks. As all but two of the infants were
below the 50th percentile, according to the values of Kloosterman, the authors
subsequently adjusted body mass to the 50th percentile69 and the composition data was
proportionally adjusted.
In this small dataset, water content of the whole fetus and the FFM decreased
throughout gestation, whilst protein and lipid content increased. The mineral
component of FFM behaved differently. Potassium increased in concentration
throughout gestation and calcium, phosphorus and magnesium decreased slightly from
the 24th to near the 27th week and then subsequently increased steadily until full term.
Sodium and chloride content, expressed per unit of FFM, progressively decreased in
concentration throughout the same period65. These changes are indicative of the
redistribution of fluid that occurs during intrauterine growth, as the relative proportion
of water contained in the intracellular compartment expands more rapidly than that of
the extracellular fluid volume. Around 20 weeks gestation, 85% to 90% of the fetus is
water, with one third of the water distributed to the intracellular compartment and two
thirds extracellularly. By term, there is a reversal in these relative proportions and
thereafter, postnatal growth is marked more by gradual increases in intracellular water
(ICW) and non-water intracellular and interstitial matrix materials70.
It is noted that the 24 week old reference fetus has only 0.1% body fat, which is
substantially lower than the percentage FM (%FM) of the 20 week old fetus (0.5%)
described by Widdowson7. It is probably biologically implausible for the fetus to have
only 0.1% FM at this gestation and is most likely due to the incomplete extraction of
non-polar membrane lipids, including phospholipids, cholesterol, cholesterol-esters and
the LCPUFA in the nervous tissue. At term, Zeigler’s reference fetus weighed 3450 g,
contained 74% water and 11.2% fat65. In comparison, the composition of the 40 week
old fetus described by Widdowson weighed 3500 g, contained 69% water and contained
22
16% fat7, 57; the latter representing a 51% increase in %FM at term compared with that
of the term reference fetus. It is noteworthy that Scammon and Calkin’s55 formula
(based on menstrual dates) had been used to calculate the gestational ages of the fetuses
analysed by Camerer (1900a, 1900b, 1902)54 and Iob and Swanson53, and their
combined data contributed to 73% of the reference fetus. Scammon and Calkin’s55
formula requires a crown-heel length measurement and most were obtained with a
measuring tape, a method that can be subject to considerable error. Widdowson
estimated gestational age using foot length56, which has been shown to correlate well
with crown-heel length (r = 0.96)71. However, it is doubtful that maturity can be
accurately estimated using foot-length as there is wide variation in the range of foot-
length measurements in infants of different gestational ages71.
The calculated mean daily gain and composition of gain of the reference fetus, over four
weekly intervals between 24 to 40 weeks gestation, is shown in Table 1.1. Initially, the
percentage of weight gain accreted as lean tissue is greater than that deposited as fat
(i.e. protein: 10.1% vs. fat: 8%), but in the last month of pregnancy this growth pattern
is reversed (i.e. protein: 14% vs. fat: 20%). For a mean weight gain of 16 g kg-1d-1
during the last trimester (24-36 wk), it is estimated between 20-30 kcal kg-1d-1 is stored.
Glycogen is largely ignored in this calculation72, as the enzymes required for
glycogenesis are expressed after the 27th week of gestation73 and glycogen accounts for
<1% of body weight7.
There is a need for caution when describing these, or indeed any fetal chemical data as
‘normative’ reference data, as the fetuses and deceased infants were clearly not
‘randomly selected’ from the general population and their growth and nutrient accretion
up to the time of delivery may not have represented normal growth74. Furthermore, in
many instances, the data may have been distorted by an inability to accurately assess
gestational age, a failure to apply consistent methodology to the chemical analyses of all
infants and because of the theoretical constructs chosen to model the data60.
Nonetheless, the reference fetus and the body of literature that represents fetal growth
are important contributions to understanding the BC of the developing fetus, and
together with some knowledge of fetal nutrition, provide a valuable premise for
estimating the energy, protein and other nutrient requirements for preterm infants.
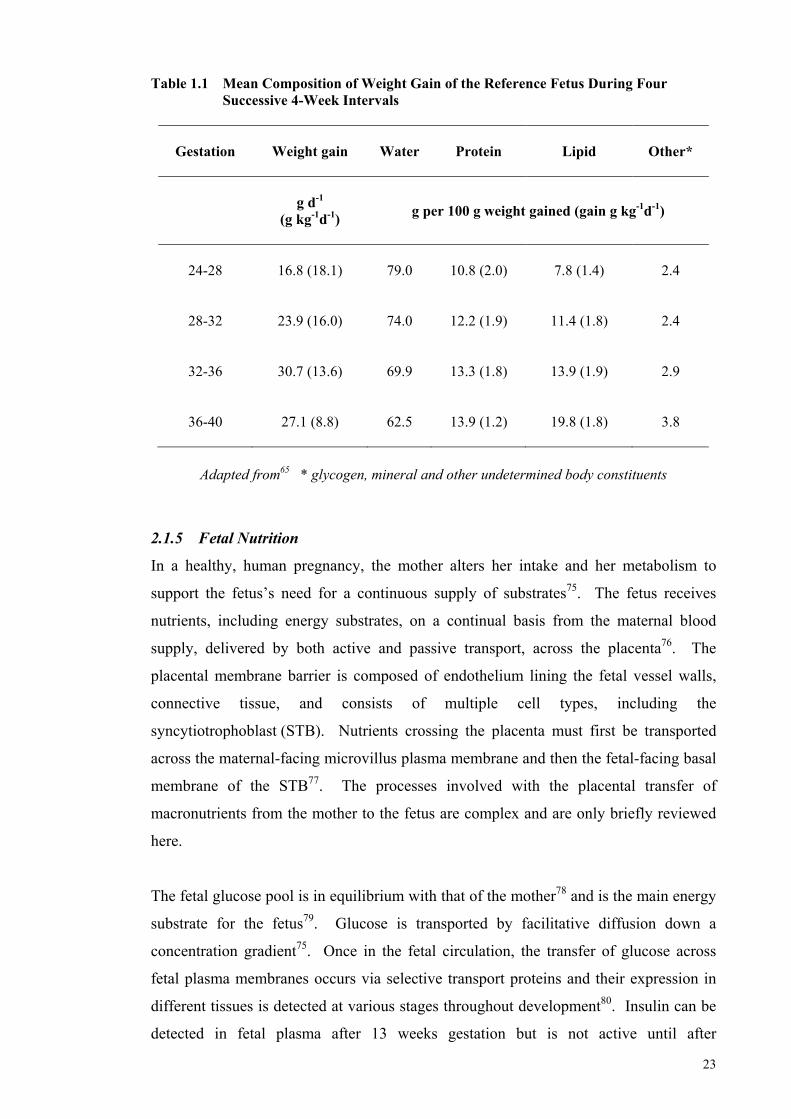
23
Table 1.1 Mean Composition of Weight Gain of the Reference Fetus During Four Successive 4-Week Intervals
Gestation
Weight gain Water Protein Lipid Other*
g d-1
(g kg-1d-1)
g per 100 g weight gained (gain g kg-1d-1)
24-28
16.8 (18.1) 79.0 10.8 (2.0) 7.8 (1.4) 2.4
28-32
23.9 (16.0) 74.0 12.2 (1.9) 11.4 (1.8) 2.4
32-36
30.7 (13.6) 69.9 13.3 (1.8) 13.9 (1.9) 2.9
36-40
27.1 (8.8) 62.5 13.9 (1.2) 19.8 (1.8) 3.8
Adapted from65 * glycogen, mineral and other undetermined body constituents
2.1.5 Fetal Nutrition
In a healthy, human pregnancy, the mother alters her intake and her metabolism to
support the fetus’s need for a continuous supply of substrates75. The fetus receives
nutrients, including energy substrates, on a continual basis from the maternal blood
supply, delivered by both active and passive transport, across the placenta76. The
placental membrane barrier is composed of endothelium lining the fetal vessel walls,
connective tissue, and consists of multiple cell types, including the
syncytiotrophoblast (STB). Nutrients crossing the placenta must first be transported
across the maternal-facing microvillus plasma membrane and then the fetal-facing basal
membrane of the STB77. The processes involved with the placental transfer of
macronutrients from the mother to the fetus are complex and are only briefly reviewed
here.
The fetal glucose pool is in equilibrium with that of the mother78 and is the main energy
substrate for the fetus79. Glucose is transported by facilitative diffusion down a
concentration gradient75. Once in the fetal circulation, the transfer of glucose across
fetal plasma membranes occurs via selective transport proteins and their expression in
different tissues is detected at various stages throughout development80. Insulin can be
detected in fetal plasma after 13 weeks gestation but is not active until after
24
glucocorticoid activity is established in the second trimester. The enzymes required for
glycogenesis and lipogenesis are thought not to be expressed until after the 27th week of
gestation73. Thus, glycogenesis is initiated during the second trimester, increases slowly
until the 36th week and is then accelerated to reach ~50 mg g-1 of tissue by term.
Although gluconeogenic enzymes are active in fetal liver near term, gluconeogenesis is
inhibited by high fetal insulin levels and is thought not to be functional in utero81.
Amino acids are the second main energy substrate for the fetus, and are also essential
for the accretion of fetal proteins and as biosynthetic precursors for metabolic pathways,
including synthesis of nucleotides and haem77. Net uptake of amino acids from the
maternal to the fetal circulation is a function of a number of different and bi-directional
fluxes across the placenta, involving both accumulative and exchange transporters77, 82.
Amino acids can be metabolised within the placenta to synthesise new amino acids.
Non-exchange efflux transport proteins transport amino acids across the fetal basal
membrane and the amino acids diffuse into fetal blood via the capillary endothelium83.
Plasma amino acids (and vitamins) are in higher concentrations in the fetus than in the
mother75 and the quality and quantity supplied to the fetus are likely to be important
determinants of fetal growth84, 85.
Fatty acids are necessary to the fetus as membrane components, as an energy source and
as precursors to cellular signalling molecules86. Essential fatty acids (EFA), linoleic
and -linoleic acid, and their respective LCPUFA metabolites, AA and DHA are
particularly important in brain and retinal development87, 88. The placenta lacks the
desaturase enzymes for conversion of EFA to LCPUFA and the fetus has limited
desaturase activity. Therefore, it is likely there is a preferential DHA transfer from the
maternal circulation to the placenta and maternal supplies must meet fetal demand89.
These come in the form of either non-esterified fatty acids (NEFA) bound by albumin,
or components of maternal lipoproteins. The presence of lipoprotein receptor-related
proteins permits the placental uptake of these lipoproteins. Lipoprotein-specific lipases
in the placental tissue hydrolyse the maternal triglycerides and the NEFA cross the
placenta according to a concentration gradient between the mother and the fetus, which
increases steadily during pregnancy86, 90. Maternal diet influences the profile of fatty
acids available to the fetus.
25
Within the STB, the fatty acids can be oxidised, re-esterified for later release, or
transferred directly to the placental basal membrane where they cross by facilitated
diffusion into the fetal circulation, bind to the -feto protein and are transported to the
fetal liver86, 90. At least before 24 weeks gestation there is little fetal lipid uptake,
suggesting that energy metabolism is not dependent on fat early in the third trimester
and only gradually increases towards term91. Before 24 weeks, fat is distributed equally
between internal and subcutaneous depots, but after this time a greater proportion is
saturated and deposited subcutaneously92.
2.1.6 Preterm Nutrition
The extremely preterm infant born near 24 weeks gestation comprises ~87% body water
and fat and glycogen stores (glycogen more likely not until ~27 weeks gestation72)
represent only 1-2% of total body weight65. Body systems are immature. The untimely
transition to extrauterine life at this time abruptly severs the placental tie, interrupts
nutrient delivery, alters metabolism and exposes the infant to a novel nutritional milieu.
Initially, in the neonatal clinical care unit (NCCU), the infant is fed glucose
intravenously via pump infusion at concentrations higher than can often be used93.
Glucose infusions to maintain plasma concentrations between ~3.0 to 6.7 mM are
necessary91 and infusion rates need adjustment according to glycaemic profile, postnatal
age and as enteral intake increases91.
Amino acid solutions94 are also infused by pump, usually within the first 36 hours of
life at low rates initially, advancing by small increments to a total between
2.5-4 g kg-1d-195, 96. Whether amino acid solutions should reflect the amino acid profile
of human milk or the fetal plasma or some other reference is unknown92 and difficult to
establish. Amino acids delivered parenterally do not undergo the same extent of enteric
and hepatic metabolism as amino acids delivered enterally, including conversion to
other amino acids (e.g. glutamate to arginine; phenylalanine to tyrosine; methionine to
cysteine) and thus, higher amounts of these products are required in parenteral
solutions94. Contemporary amino acid preparations attempt to mimic amino acid
concentrations in either the cord blood of the last trimester of pregnancy (Baxter
Primene™ 10%) or human milk (Vaminolact™ Pharmatel Fresenius Kabi).
26
Lipid fed intravenously is a major source of energy and the only source of essential fatty
acids for the preterm infant, but lipid clearance depends on lipoprotein lipase activity,
which may be inefficient in preterm infants97. Lipid, infused as emulsified
triacylglyceride, is commenced and increased at similar rates to amino acids but its
initiation is sometimes delayed by one to three days and at 3.0-3.5 g kg-1d-1, final
infusion rates exceed in utero rates of fatty acid uptake91, 95, 96. Lipid preparations are
commonly a blend of olive and soya oils, providing monounsaturated, essential
polyunsaturated and saturated fats in various proportions (e.g. Baxter Clinoleic™ 20%:
80% olive oil, 20% soybean oil: i.e. 65% monounsaturated fatty acids, 20% essential
PUFA and 15% saturated fatty acids). Micronutrients are added in standard amounts.
Minimal enteral feeds (MEF) are generally introduced as soon as the very preterm
infant is clinically stable (0-7 d), but daily advancement of feeds by 5-30 mL kg-1 may
not begin for a further 10-15 days95, 98. The evidence demonstrating the benefits of
MEF remains inconclusive99, but some studies suggest their early introduction promotes
gastrointestinal growth100, maturation of intestinal motor activity101-103, secretion of
enteric hormones and growth factors104 and improved tolerance of enteral
nutrition104-106. Standardising conservative feeding advancement is also thought
beneficial to protecting against necrotising enterocolitis107. As enteral volumes
increase, parenteral infusion is slowly titrated95 but it can be many days before the
preterm infant is receiving intakes high enough to arrest catabolism and several weeks
before birth weight is recovered and full enteral feeds are achieved.
The recommended,108 advocated109 and preferred98 enteral feed is human milk (HM) but
some mothers have difficulty providing HM for their preterm infants, as early delivery
can potentially interrupt breast development, delay secretory activation as well as
reduce milk production110. When MOM is unavailable or in limited supply, the
American Academy of Pediatrics (AAP) recommends the use of DM and preterm infant
formula (PTF) is recommended only when HM is not available108. Human milk is the
gold standard because it offers intrinsic nutritional benefits related to improvements in
host defence111-120, digestion and absorption of nutrients121-124, neuro-development111,
112, gastrointestinal function125, 126 as well as the mother’s psychological wellbeing127-129.
Human milk though, lacks sufficient protein, energy and micronutrients109, 130 to support
preterm growth targets and therefore is routinely fortified, mostly with additional
27
protein and micronutrients. Due to gut immaturity and fear of necrotising enterocolitis,
fortification can be delayed until milk feeds are tolerated at volumes close to 150 mL
kg-1d-1131.
The variances between intra and extrauterine nutrition are substantial and thus it seems
almost paradoxical that the growth and development of preterm infants should be
expected to mimic that of the aged-matched fetus and that of their term-born peers at
term equivalent age. In reality, intrauterine growth rates are rarely achieved, at least not
before birth weight is recovered132, and postnatal growth retardation is common133-136.
2.1.7 Postnatal Growth
Postnatal growth restriction has been defined as a weight below the 10th percentile at
36 weeks corrected gestational age (cGA)132 or as a decrease in z-score greater than two
standard deviations between birth and 36 weeks cGA137.
The true extent of postnatal growth restriction in preterm infants is difficult to determine
and the wide variation in its reported prevalence134-136, 138-140 could be related to the
various definitions132, 137 and the different reference growth charts used to classify
growth restriction141-145, the age at which growth is assessed, as well as to the nutritional
strategies employed in feeding preterm infants146.
A US study across 124 neonatal intensive care units (NICU) (1997–2000) found in a
combined cohort of more than 24 000 preterm infants, that the prevalence of growth
restriction (< 10th percentile) at discharge (< 34 wk to 41 wk cGA) according to the
reference chart of Thomas144 was 28% for weight, 34% for length and 16% for head
circumference136.
In another study of 4438 VLBW preterm infants conducted by the National Institute for
Child and Human Development Neonatal Research Network in 14 centres during
1995-1996, Alexander’s curve143 was used to classify 22% of infants as SGA at birth,
and as many as 97% as growth restricted (<10th percentile) at 36 weeks corrected age.
Regardless of the true prevalence, a multi-centre prospective cohort study conducted to
define longitudinal growth for hospitalised VLBW infants demonstrated that infants
born between 24 and 29 weeks gestation do not achieve the expected growth targets of
28
the reference fetus at the same gestational age and commonly have weights below the
10th percentile at discharge138. This retarded growth is reflective of weight loss in the
early postnatal period and the delay in time before birth weight is regained. Subsequent
feeding at recommended intakes does not always allow catch-up growth.
Embleton et al.134 demonstrated cumulative deficits in energy and protein intakes in
infants born ≤ 30 weeks gestation, amounting to a mean (SD) energy deficit of
813 (542) kcal kg-1 (IU 1 kcal = 4.184 kJ) and a protein deficit of 23 (12) g kg-1 by the
end of the 5th postnatal week. By an equivalent postnatal age, older infants (>30 weeks
and <34 weeks) also accrued an energy and protein deficit of around 382 (263) kcal kg-1
and 13 (15) g kg-1, respectively. Feeding at recommended levels
(120 kcal kg-1d-1 and 3.0 g protein kg-1d-1) did not correct these deficits by discharge
and dietary intake was found to account for at least 45% of the variation in changes of
growth.
More recently, using Bayley 11 Mental Developmental Index <70 and Psychomotor
Developmental Index <70, and after controlling for clinical and demographic
confounders, Ehrenkranz et al.147 showed that growth velocity in the postnatal period
prior to discharge exerted a significant and possibly independent effect on neuro-
developmental and growth outcomes when assessed at 18 to 22 months
corrected-age. Further, increased incidence of neurological impairment was
demonstrated in those infants who achieved slower rates of postnatal growth.
2.1.8 Protein and Energy Requirements
These growth and developmental outcomes have prompted several reviews of protein
and energy and other nutrient requirements for preterm infants over the past 25 years.
In 1985, the Committee on Nutrition at the American Academy of Pediatrics
(AAP-CON) considered for the first time, fetal accretion rates of individual nutrients
in addition to gains in fetal weight and length, when recommending nutrition intakes for
preterm infants148. At the time, the AAP-CON differentiated protein needs on the basis
of weight and gestational age (Table 1.2). Periodically since then, a number of different
nutrition committees comprising various international experts have revised
recommended protein and energy intakes along with the gestational age and weight
range to which the recommendations apply130, 149-153. In each revision, the committees
29
consider previous recommendations, the available scientific evidence and clinical
outcomes.
In the recent 2005 Consensus guidelines, both energy and protein recommendations
were differentiated on the basis of birth weight and protein requirement (and PER) was
reduced with increasing post-conceptional age (PCA) (Table 1.2).
A cautionary note is made in relation to these international 2005 Consensus guidelines.
At the time when these recommendations were made, there was (and still is) an AAP
policy statement in existence, recommending that the term ‘conceptional age’ not be
used in clinical practice154. The term is often used interchangeably with the terms
‘gestational age’ and ‘menstrual age’. ‘Gestational age’ (or ‘menstrual age’) is the time
elapsed between the first day of the last normal menstrual period and the day of
delivery. ‘Conceptional age’ is the time elapsed between the day of conception
(approximately 14 days after the first day of the last menstrual period) and the day of
delivery. Thus, there is an approximate two-week difference between gestational
age (or menstrual age) and conceptional age [i.e. gestational age (or menstrual age) +
two weeks = conceptional age]. The 2005 Consensus guideline for protein155 has the
potential to confuse clinicians, as in this instance the term post-conceptual age (PCA)
was used to mean corrected gestational age (cGA). Potentially, this guideline for
protein requirement has been incorrectly applied in clinical practice, making well-
considered revisions more difficult.
In January 2010, the European Society of Paediatric Gastroenterology, Hepatology and
Nutrition Committee on Nutrition (ESPGHAN-CON) (Table 1.2)109 released a revision
of their 1987 guidelines for preterm infants giving consideration to the current scientific
evidence and previous recommendations. Five members of the 2010 ESPGHAN-CON
were also contributing members of the ad hoc international expert Consensus
Committee that released their guidelines in 2005, with one member having had a major
editorial role and another, who contributed the chapter on protein130.
In their latest revision, the ESPGHAN-CON recommended ranges of nutrient intakes
for infants up to a weight of 1800 g. Excepting protein, ESPGHAN-CON chose not
make specific recommendations for infants with weights below 1000 g, as in its
considered opinion, data were lacking for these infants for most nutrients.
30
ESPGHAN-CON based their estimates per 100 kcal of energy with the expectation that
within each recommended nutrient range the minimum or maximum of each specific
nutrient would be met if energy intakes did not fall below 110 kcal kg-1d-1 (Table 1.2).
The recommendations for protein and the ratio of protein to energy are the highest that
have been recommended by any of the Committees over the past 25 years.
It is noteworthy that ESPGHAN-CON has used the age-terminology ‘post-conceptional
age’ when making its recommendations on energy, thus perpetuating the likelihood of
misinterpretation and inappropriate application of this recommendation.
Closer scrutiny of the basis upon which protein and energy recommendations are made
is necessary for understanding the applicability and limitations of the recommendations
made by the various committees, for recognising their potential influence on growth
outcomes of preterm infants and for directing the focus of future research that seeks to
develop evidence-based, best nutrition practice for feeding preterm infants.
Birth weight classification describes an infant’s birth weight relative to the reference
standard. Appropriate for gestational age (AGA) denotes a birth weight and/or length
within two standard deviations of the median birth weight for gestational age and small
for gestational age (SGA) denotes a birth weight and/or length with a difference of
greater than two standard deviations below the median156.
It is worth noting that intrauterine growth restriction (IUGR) is a term often used
synonymously with SGA. This is not technically correct, as IUGR is limited to the
process of decreased intrauterine growth rate detected by ultrasound measurement. If
either prolonged or sufficiently severe, IUGR may result in the delivery of an SGA
infant156, 157. Small for gestational age is only a proxy for IUGR when the pre-natal
growth pattern is unknown158.
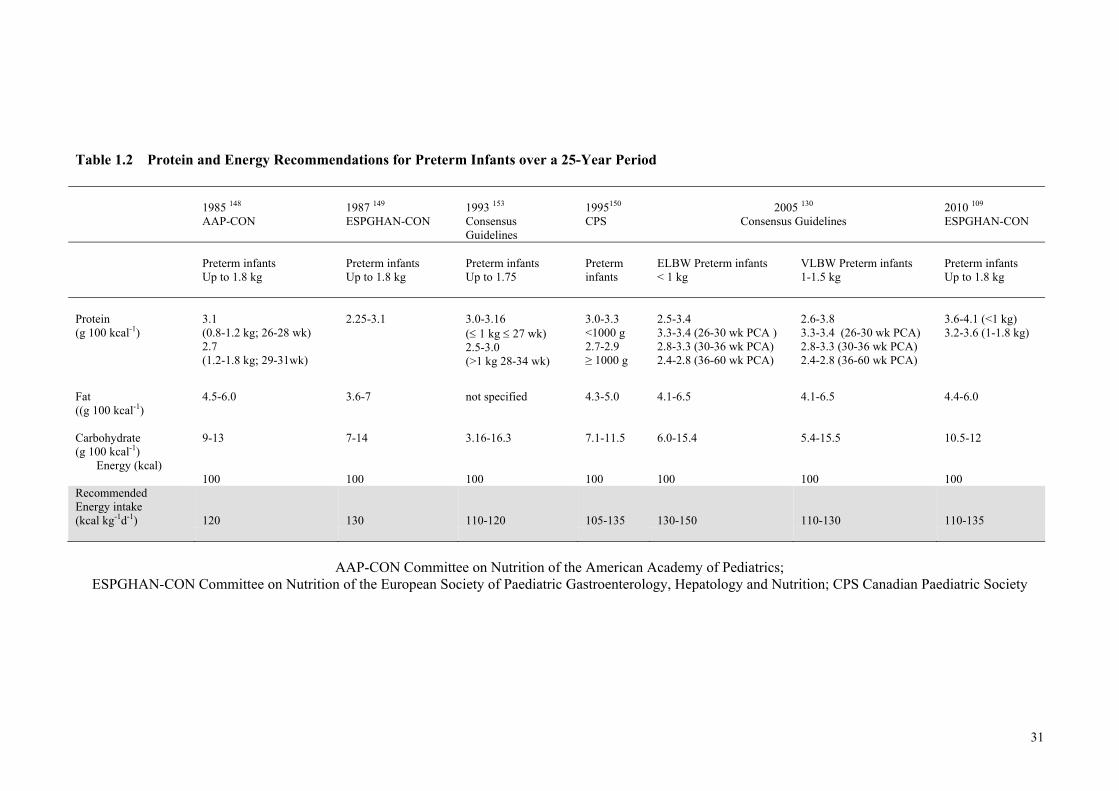
31
Table 1.2 Protein and Energy Recommendations for Preterm Infants over a 25-Year Period
1985 148 AAP-CON
1987 149 ESPGHAN-CON
1993 153 Consensus Guidelines
1995150 CPS
2005 130
Consensus Guidelines
2010 109 ESPGHAN-CON
Preterm infants Up to 1.8 kg
Preterm infants Up to 1.8 kg
Preterm infants Up to 1.75
Preterm infants
ELBW Preterm infants < 1 kg
VLBW Preterm infants 1-1.5 kg
Preterm infants Up to 1.8 kg
Protein (g 100 kcal-1)
3.1 (0.8-1.2 kg; 26-28 wk) 2.7 (1.2-1.8 kg; 29-31wk)
2.25-3.1
3.0-3.16 ( 1 kg 27 wk) 2.5-3.0 (>1 kg 28-34 wk)
3.0-3.3 <1000 g 2.7-2.9 ≥ 1000 g
2.5-3.4 3.3-3.4 (26-30 wk PCA ) 2.8-3.3 (30-36 wk PCA) 2.4-2.8 (36-60 wk PCA)
2.6-3.8 3.3-3.4 (26-30 wk PCA) 2.8-3.3 (30-36 wk PCA) 2.4-2.8 (36-60 wk PCA)
3.6-4.1 (<1 kg) 3.2-3.6 (1-1.8 kg)
Fat ((g 100 kcal-1)
4.5-6.0
3.6-7
not specified
4.3-5.0
4.1-6.5
4.1-6.5
4.4-6.0
Carbohydrate (g 100 kcal-1)
9-13
7-14
3.16-16.3
7.1-11.5
6.0-15.4
5.4-15.5
10.5-12
Energy (kcal) 100
100
100
100
100
100
100
Recommended Energy intake (kcal kg-1d-1)
120
130
110-120
105-135
130-150
110-130
110-135
AAP-CON Committee on Nutrition of the American Academy of Pediatrics;
ESPGHAN-CON Committee on Nutrition of the European Society of Paediatric Gastroenterology, Hepatology and Nutrition; CPS Canadian Paediatric Society
32
In clinical practice and research, the 10th percentile is commonly used as the lower limit
to denote growth restriction146, 159 because most of the data described in published
intrauterine growth charts are expressed as 90th, 50th and 10th percentiles140-142, 145.
However, the difference of greater than two standard deviations below the median birth
weight for gestational age approximates the 2.3rd percentile. A recent systematic review
and meta-analysis of intrauterine growth data by Fenton160 has resulted in an updated
reference describing intrauterine growth along the 3rd, 10th, 50th, 90th and 97th percentiles
for weight, length and head circumference on the one chart.
Although the growth of infants delivering prematurely may differ from that of the
undelivered, healthy, age-matched fetus, fetal gains in weight, length and head
circumference between 26 and 36 weeks gestation have largely been determined from
cross-sectional anthropometric measurements taken of newborns at different gestations
shortly after birth132, 146. Preterm nutrition support aims to achieve rates of growth in
weight, length and head circumference represented by the 50th percentile on intrauterine
reference charts, estimated to be between 14-18 g kg-1d-1, 0.9-1.1 cm wk-1 and
0.7-0.9 cm wk-1, respectively60, 139-143, 145, 160.
2.1.9 Energy
… When calories are sufficient but protein is lacking, the child is often fat,
although not growing12.
Several authors72, 152, 161 and Committees109, 130, 153 in the past two decades have
reviewed this topic as it relates to preterm infants. The various Committees making
recommendations about the energy, protein and other nutrient intakes of preterm infants
have each been limited by the data available to them at the time of making their
recommendations.
Assessing energy requirements for preterm infants requires an understanding of energy
balance (energy intake = energy excreted + energy expended + energy stored) and a
knowledge of the factors that influence it, including postmenstrual age, accumulated
pre- and postnatal nutrient deficits, composition of growth, and differences in resting
energy expenditure (REE)72.
33
In preterm infants, REE incorporates the energy required to maintain life processes and
includes part of the energy needed for growth72. It is affected by the cost of
activity162-165 (5-10 kcal kg-1d-1)72, thermoregulation166 (7-8 kcal kg-1d-1), tissue
synthesis72, 109, 167 (10 kcal kg-1d-1) and storage, which is strongly influenced by the
composition of intake, as well as by the metabolic demands of illness168-174. Although
lower values have been reported, especially in the first week of life, mean estimates of
REE vary between 45 to 60 kcal kg-1d-1175 and are thought to be either similar or just
slightly higher for SGA infants161, 176.
When compiling the latest 2005 Consensus Guidelines161, consideration was given to
the fetal chemical data as well as to the 223 complete energy and nutrient balance
studies162, 177-185 that had previously been reviewed by Putet72 and considered during
both the development of the 1993 guidelines153 and the establishment of requirements
for preterm infant formulae152. Using either respiratory calorimetry, doubly-labelled
water or both, the REE of VLBW infants born around 31 weeks gestation were
measured between 15-46 days postnatal age when the rate of intrauterine weight gain
had been either achieved or even exceeded (14-22 g kg-1d-1). Whilst the majority of
infants were fed term or PTF, over 90 infants were fed HM ± protein and/or energy
fortifier. These metabolic studies showed that a mean (SD) intake of
123 (16) kcal kg-1d-1 provided 111 (15) kcal kg-1d-1 of metabolisable energy
(energy intake - energy lost in faeces and urine; 85-90% retention), of which
58 (7) kcal kg-1d-1 was expended in energy and the remaining 52 (11) kcal kg-1d-1 was
stored in new tissue, mainly as fat 4.4 (1.1) g kg-1d-1 and protein 2.0 (0.4) g kg-1d-1.
Energy balance was more positive (52 kcal/kg/d vs. 28 kcal/kg/d) and fat deposition
occurred at relatively higher accretion rates in the 31 week old VLBW preterm infant
compared with that of the fetus at an equivalent age (4.4 g kg-1d-1 vs. 1.8 g kg-1d-1)
(Figure 1.1; Table 1.3)72.
It is not known if this higher rate of fat deposition is a necessary and a beneficial
physiological adaptation to ex utero life or if it is associated with later adverse
metabolic consequences, or both. However, given the stark differences between pre and
postnatal nutrition and the inability of the preterm infant to self-regulate intake fed
intravenously or enterally via feeding tube, suboptimal clinical nutrition practices likely
contribute to these growth outcomes.
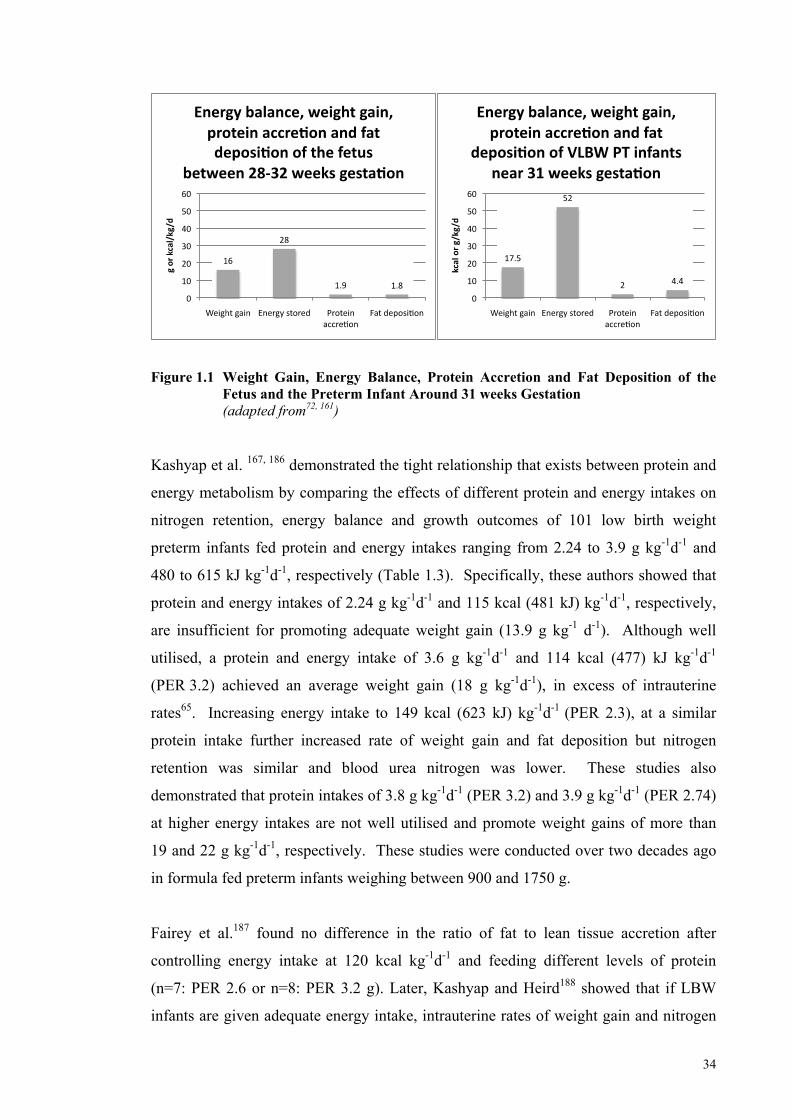
34
Figure 1.1 Weight Gain, Energy Balance, Protein Accretion and Fat Deposition of the
Fetus and the Preterm Infant Around 31 weeks Gestation (adapted from72, 161) Kashyap et al. 167, 186 demonstrated the tight relationship that exists between protein and
energy metabolism by comparing the effects of different protein and energy intakes on
nitrogen retention, energy balance and growth outcomes of 101 low birth weight
preterm infants fed protein and energy intakes ranging from 2.24 to 3.9 g kg-1d-1 and
480 to 615 kJ kg-1d-1, respectively (Table 1.3). Specifically, these authors showed that
protein and energy intakes of 2.24 g kg-1d-1 and 115 kcal (481 kJ) kg-1d-1, respectively,
are insufficient for promoting adequate weight gain (13.9 g kg-1 d-1). Although well
utilised, a protein and energy intake of 3.6 g kg-1d-1 and 114 kcal (477) kJ kg-1d-1
(PER 3.2) achieved an average weight gain (18 g kg-1d-1), in excess of intrauterine
rates65. Increasing energy intake to 149 kcal (623 kJ) kg-1d-1 (PER 2.3), at a similar
protein intake further increased rate of weight gain and fat deposition but nitrogen
retention was similar and blood urea nitrogen was lower. These studies also
demonstrated that protein intakes of 3.8 g kg-1d-1 (PER 3.2) and 3.9 g kg-1d-1 (PER 2.74)
at higher energy intakes are not well utilised and promote weight gains of more than
19 and 22 g kg-1d-1, respectively. These studies were conducted over two decades ago
in formula fed preterm infants weighing between 900 and 1750 g.
Fairey et al.187 found no difference in the ratio of fat to lean tissue accretion after
controlling energy intake at 120 kcal kg-1d-1 and feeding different levels of protein
(n=7: PER 2.6 or n=8: PER 3.2 g). Later, Kashyap and Heird188 showed that if LBW
infants are given adequate energy intake, intrauterine rates of weight gain and nitrogen
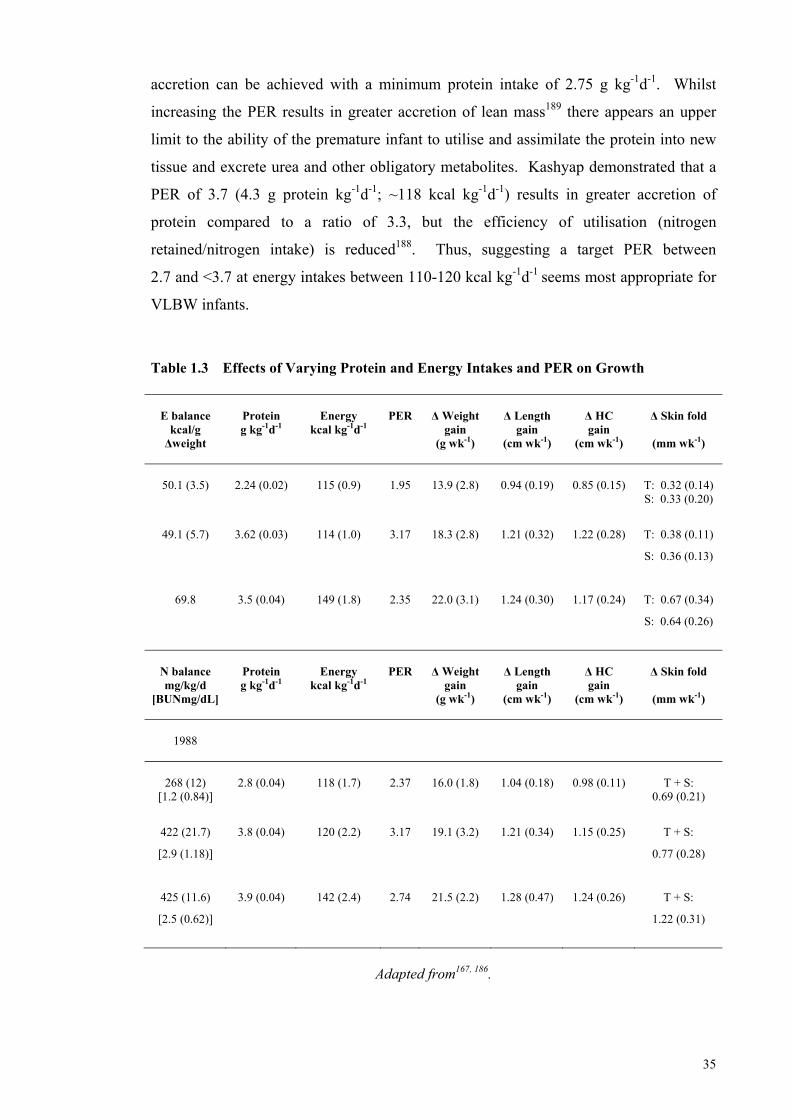
35
accretion can be achieved with a minimum protein intake of 2.75 g kg-1d-1. Whilst
increasing the PER results in greater accretion of lean mass189 there appears an upper
limit to the ability of the premature infant to utilise and assimilate the protein into new
tissue and excrete urea and other obligatory metabolites. Kashyap demonstrated that a
PER of 3.7 (4.3 g protein kg-1d-1; ~118 kcal kg-1d-1) results in greater accretion of
protein compared to a ratio of 3.3, but the efficiency of utilisation (nitrogen
retained/nitrogen intake) is reduced188. Thus, suggesting a target PER between
2.7 and <3.7 at energy intakes between 110-120 kcal kg-1d-1 seems most appropriate for
VLBW infants.
Table 1.3 Effects of Varying Protein and Energy Intakes and PER on Growth
E balance
kcal/g Δweight
Protein g kg-1d-1
Energy
kcal kg-1d-1
PER
Δ Weight
gain (g wk-1)
Δ Length
gain (cm wk-1)
Δ HC gain
(cm wk-1)
Δ Skin fold
(mm wk-1)
50.1 (3.5)
2.24 (0.02)
115 (0.9)
1.95
13.9 (2.8)
0.94 (0.19)
0.85 (0.15)
T: 0.32 (0.14) S: 0.33 (0.20)
49.1 (5.7) 3.62 (0.03) 114 (1.0) 3.17 18.3 (2.8) 1.21 (0.32) 1.22 (0.28) T: 0.38 (0.11)
S: 0.36 (0.13)
69.8 3.5 (0.04) 149 (1.8) 2.35 22.0 (3.1) 1.24 (0.30) 1.17 (0.24) T: 0.67 (0.34)
S: 0.64 (0.26)
N balance mg/kg/d
[BUNmg/dL]
Protein g kg-1d-1
Energy
kcal kg-1d-1
PER
Δ Weight
gain (g wk-1)
Δ Length
gain (cm wk-1)
Δ HC gain
(cm wk-1)
Δ Skin fold
(mm wk-1)
1988
268 (12)
[1.2 (0.84)]
2.8 (0.04)
118 (1.7)
2.37
16.0 (1.8)
1.04 (0.18)
0.98 (0.11)
T + S:
0.69 (0.21)
422 (21.7)
[2.9 (1.18)]
3.8 (0.04) 120 (2.2) 3.17 19.1 (3.2) 1.21 (0.34) 1.15 (0.25) T + S:
0.77 (0.28)
425 (11.6)
[2.5 (0.62)]
3.9 (0.04) 142 (2.4) 2.74 21.5 (2.2) 1.28 (0.47) 1.24 (0.26) T + S:
1.22 (0.31)
Adapted from167, 186.
36
On the basis of the available literature, assuming a weight gain of 16 to 20 g kg-1d-1,
a protein retention rate of 2 g kg-1d-1 and an energy retention rate of 90%, the 2005
ad hoc expert Consensus Committee recommended energy intakes of
110-130 kcal kg-1d-1 for VLBW infants. Their expectation was that these intakes would
lead to an energy balance higher than that achieved in utero and therefore, greater fat
deposition.
As previously noted, energy requirements were differentiated according to birth weight
and separate recommendations for ELBW infants were made for the first time in 2005.
Leitch and Denne161 reviewed reports of 24-hour energy expenditure measurements in
75 ELBW infants (mean gestation 29 wk; mean birth weight 905 g) obtained using
respiratory calorimetry. Five of the 12 studies investigated SGA infants (n=35). As
noted by the authors, the primary measured outcome of most of these studies was not
energy expenditure and therefore their validity in assessing the energy needs of the
ELBW infant is questionable. Further, the measurements were not taken until a mean
(SD) postnatal age of 38 (33) d and a mean weight of 1494 (443) g. Whilst these
studies showed there were no differences in energy expenditure, intake or growth rates
between the SGA and AGA ELBW infants, there was some indication that energy
expended by ELBW infants was greater than that of older infants.
Although energy expenditure in preterm infants with respiratory disease requiring
mechanical ventilation is unlikely to differ significantly from non-ventilated infants161,
sick ELBW infants requiring ventilator support at three and five postnatal weeks may
have higher requirements190 and it is estimated the energy needs of infants with chronic
lung disease may be 15-25% greater than in those who do not have the disease161.
Therefore, assuming an energy absorption rate of 90% and a proportional increase in
protein intake, energy requirements for ELBW infants were estimated in 2005 to be
130-150 kcal kg-1d-1 to achieve an energy balance of 25-30 kcal kg-1d-1161.
The most recent recommendations of the ESPGHAN-CON109 were made utilising data
published before March 2007. These recommendations were based on the assumption
that growth and nutrient retention similar to the fetus was an appropriate target, but that
allowances were needed to cater for differences between fetal and preterm nutrition and
for the risks associated with rapid postnatal weight gain, as described in earlier sections
of this review.
37
These recommendations109 were also made on the premise that REE does not vary
substantially with gestational age (~45 kcal kg-1d-1) and that the energy required for
protein and fat deposition, similar to that accreted in the fetus, is 5.5-7.75 kcal g-1 of
protein deposited and 1.5-1.6 kcal kg-1 of fat deposited (excluding the amount of energy
which is stored in the process)191, 192. ESPGHAN-CON estimated average energy
requirements for tissue deposition (13% protein, 20-30% fat) at 3.3-4.7 kcal g-1163, 192,
and calculated a requirement between 50-80 kcal kg-1d-1 in addition to REE to achieve
intrauterine rates of weight gain. Thus, allowing for 85-90% absorption rate,
ESPGHAN-CON determined that an energy intake of 110 to 140 kcal kg-1d-1 is
required.
However, Kashyap167, 186, 193 had previously shown that energy intakes either at or above
140 kcal kg-1d-1 appeared to increase fat deposition, without any clear evidence that lean
mass accretion was improved, and although carbohydrate appeared to have a protein-
sparing effect193, 194 and could possibly have resulted in faster linear growth, at energy
intakes of 155 kcal kg-1d-1, high carbohydrate to fat ratios deposited fat at rates greater
than fetal rates195. Therefore, on the premise that there is adequate protein intake, the
ESPGHAN-CON recommended energy intakes between 110-135 kcal/kg/d for healthy
growing preterm infants109.
In 2009, two years after ESPGHAN had met to deliberate over their latest
recommendations, Bauer et al.196 published five and six-week longitudinal data of the
REE, energy intakes and weight gain of 183 healthy, stable, growing preterm infants
born between 26 and 35 weeks gestation (gestational age 26 to 28 weeks (n=75), 29-32
weeks (n=49) and 33-35 weeks (n=59) and 14 term infants (gestational age 38-41
weeks). All infants were born AGA and all were free of respiratory support and sepsis.
Parenteral nutrition was started immediately after birth for all preterm infants. In the
first study week (3-5 d after birth), the preterm infants received 20-50% of the total
caloric intake parenterally and 50-80% enterally via a gastric tube. From the second
week, all infants were exclusively fed preterm formula until 36 weeks cGA, when they
were given the same term formula fed to term infants (Figure 1.2). The dataset was
collected over a period of 7 years.
Contrary to the belief held by the ESPGHAN-CON, Bauer demonstrated that
REE values increased with postnatal age in each gestational age group, with the most
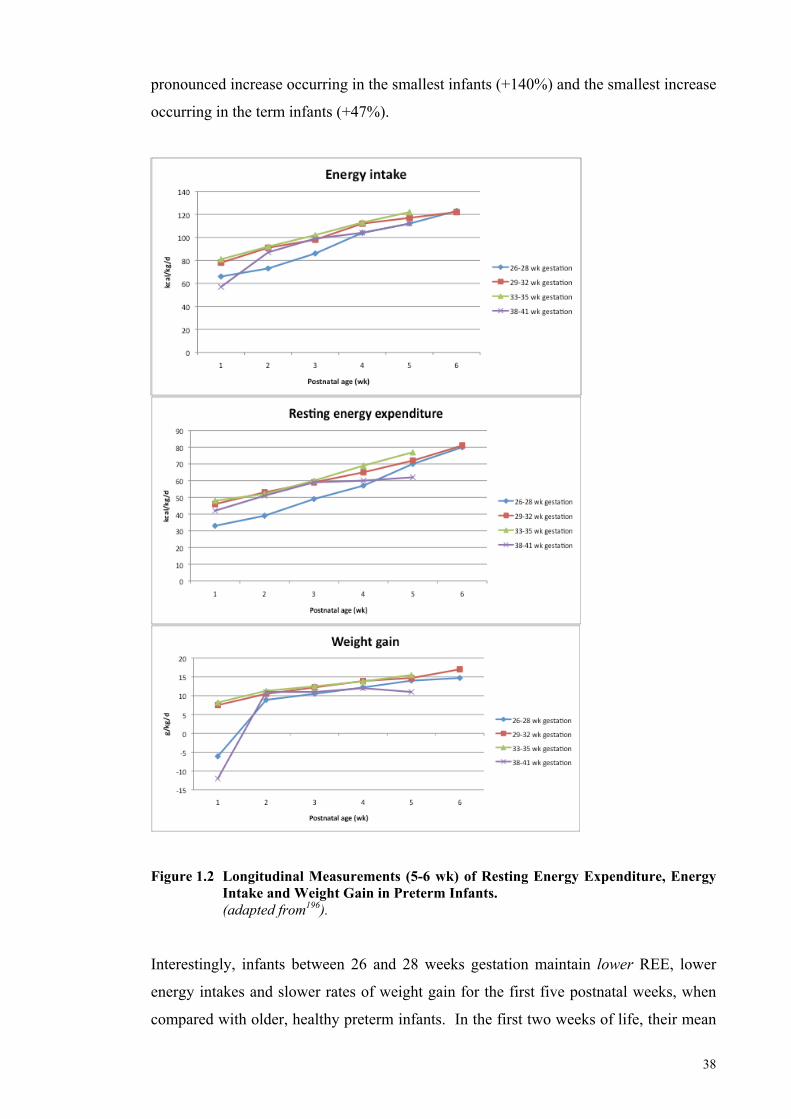
38
pronounced increase occurring in the smallest infants (+140%) and the smallest increase
occurring in the term infants (+47%).
Figure 1.2 Longitudinal Measurements (5-6 wk) of Resting Energy Expenditure, Energy
Intake and Weight Gain in Preterm Infants. (adapted from196). Interestingly, infants between 26 and 28 weeks gestation maintain lower REE, lower
energy intakes and slower rates of weight gain for the first five postnatal weeks, when
compared with older, healthy preterm infants. In the first two weeks of life, their mean
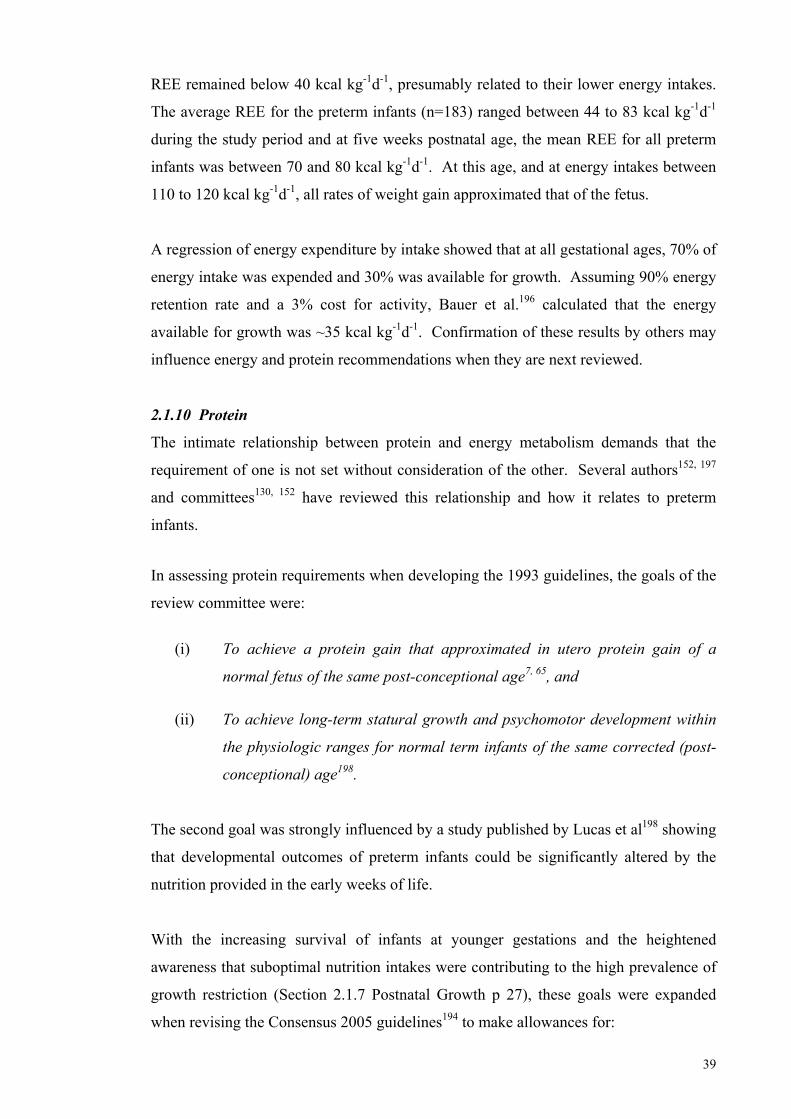
39
REE remained below 40 kcal kg-1d-1, presumably related to their lower energy intakes.
The average REE for the preterm infants (n=183) ranged between 44 to 83 kcal kg-1d-1
during the study period and at five weeks postnatal age, the mean REE for all preterm
infants was between 70 and 80 kcal kg-1d-1. At this age, and at energy intakes between
110 to 120 kcal kg-1d-1, all rates of weight gain approximated that of the fetus.
A regression of energy expenditure by intake showed that at all gestational ages, 70% of
energy intake was expended and 30% was available for growth. Assuming 90% energy
retention rate and a 3% cost for activity, Bauer et al.196 calculated that the energy
available for growth was ~35 kcal kg-1d-1. Confirmation of these results by others may
influence energy and protein recommendations when they are next reviewed.
2.1.10 Protein
The intimate relationship between protein and energy metabolism demands that the
requirement of one is not set without consideration of the other. Several authors152, 197
and committees130, 152 have reviewed this relationship and how it relates to preterm
infants.
In assessing protein requirements when developing the 1993 guidelines, the goals of the
review committee were:
(i) To achieve a protein gain that approximated in utero protein gain of a
normal fetus of the same post-conceptional age7, 65, and
(ii) To achieve long-term statural growth and psychomotor development within
the physiologic ranges for normal term infants of the same corrected (post-
conceptional) age198.
The second goal was strongly influenced by a study published by Lucas et al198 showing
that developmental outcomes of preterm infants could be significantly altered by the
nutrition provided in the early weeks of life.
With the increasing survival of infants at younger gestations and the heightened
awareness that suboptimal nutrition intakes were contributing to the high prevalence of
growth restriction (Section 2.1.7 Postnatal Growth p 27), these goals were expanded
when revising the Consensus 2005 guidelines194 to make allowances for:
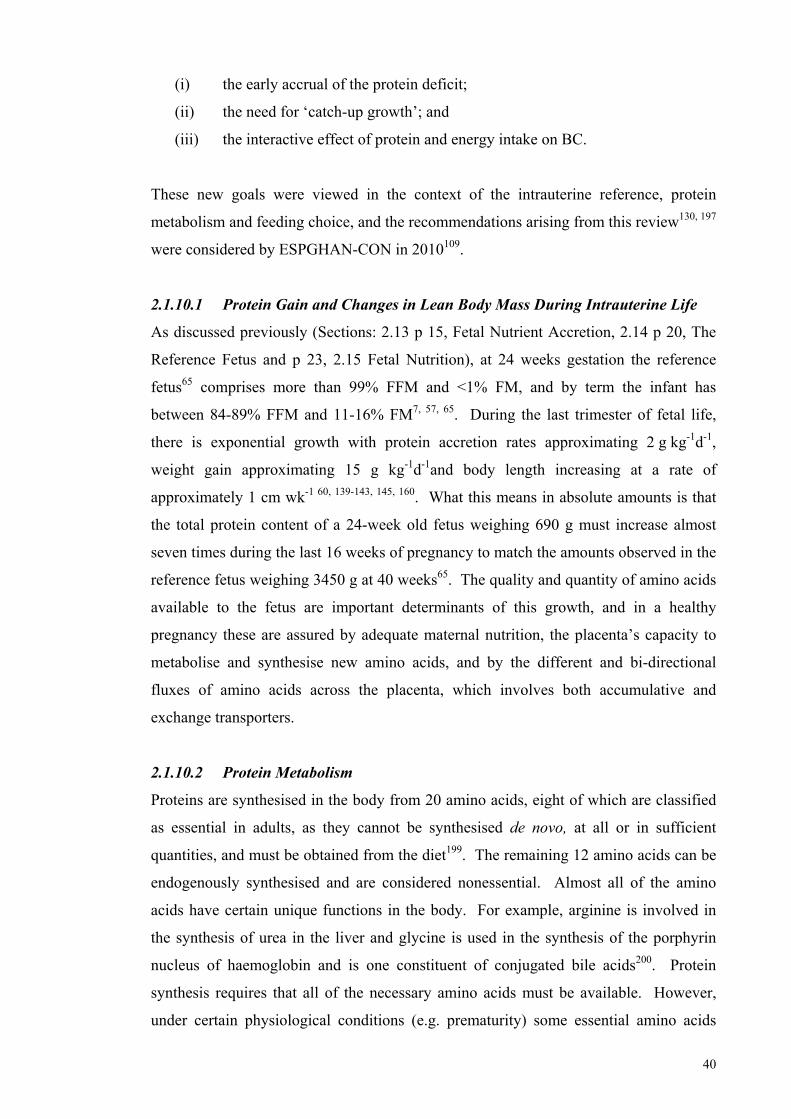
40
(i) the early accrual of the protein deficit;
(ii) the need for ‘catch-up growth’; and
(iii) the interactive effect of protein and energy intake on BC.
These new goals were viewed in the context of the intrauterine reference, protein
metabolism and feeding choice, and the recommendations arising from this review130, 197
were considered by ESPGHAN-CON in 2010109.
2.1.10.1 Protein Gain and Changes in Lean Body Mass During Intrauterine Life
As discussed previously (Sections: 2.13 p 15, Fetal Nutrient Accretion, 2.14 p 20, The
Reference Fetus and p 23, 2.15 Fetal Nutrition), at 24 weeks gestation the reference
fetus65 comprises more than 99% FFM and <1% FM, and by term the infant has
between 84-89% FFM and 11-16% FM7, 57, 65. During the last trimester of fetal life,
there is exponential growth with protein accretion rates approximating 2 g kg-1d-1,
weight gain approximating 15 g kg-1d-1and body length increasing at a rate of
approximately 1 cm wk-1 60, 139-143, 145, 160. What this means in absolute amounts is that
the total protein content of a 24-week old fetus weighing 690 g must increase almost
seven times during the last 16 weeks of pregnancy to match the amounts observed in the
reference fetus weighing 3450 g at 40 weeks65. The quality and quantity of amino acids
available to the fetus are important determinants of this growth, and in a healthy
pregnancy these are assured by adequate maternal nutrition, the placenta’s capacity to
metabolise and synthesise new amino acids, and by the different and bi-directional
fluxes of amino acids across the placenta, which involves both accumulative and
exchange transporters.
2.1.10.2 Protein Metabolism
Proteins are synthesised in the body from 20 amino acids, eight of which are classified
as essential in adults, as they cannot be synthesised de novo, at all or in sufficient
quantities, and must be obtained from the diet199. The remaining 12 amino acids can be
endogenously synthesised and are considered nonessential. Almost all of the amino
acids have certain unique functions in the body. For example, arginine is involved in
the synthesis of urea in the liver and glycine is used in the synthesis of the porphyrin
nucleus of haemoglobin and is one constituent of conjugated bile acids200. Protein
synthesis requires that all of the necessary amino acids must be available. However,
under certain physiological conditions (e.g. prematurity) some essential amino acids
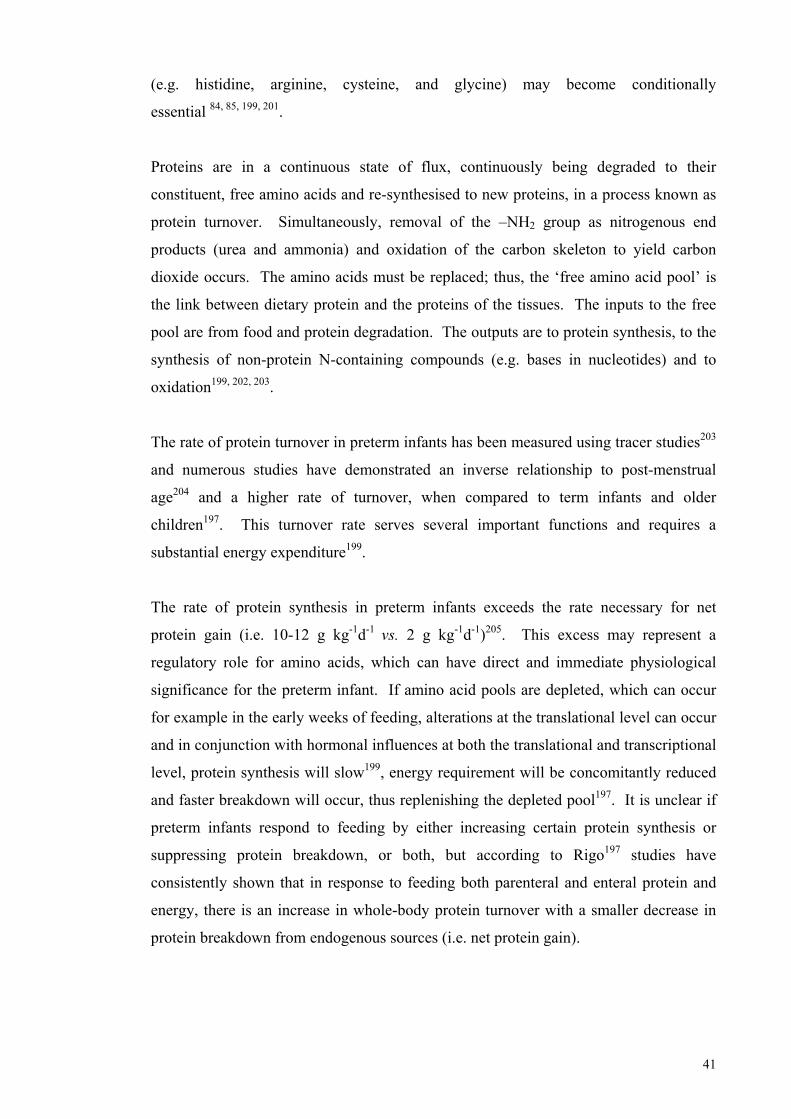
41
(e.g. histidine, arginine, cysteine, and glycine) may become conditionally
essential 84, 85, 199, 201.
Proteins are in a continuous state of flux, continuously being degraded to their
constituent, free amino acids and re-synthesised to new proteins, in a process known as
protein turnover. Simultaneously, removal of the –NH2 group as nitrogenous end
products (urea and ammonia) and oxidation of the carbon skeleton to yield carbon
dioxide occurs. The amino acids must be replaced; thus, the ‘free amino acid pool’ is
the link between dietary protein and the proteins of the tissues. The inputs to the free
pool are from food and protein degradation. The outputs are to protein synthesis, to the
synthesis of non-protein N-containing compounds (e.g. bases in nucleotides) and to
oxidation199, 202, 203.
The rate of protein turnover in preterm infants has been measured using tracer studies203
and numerous studies have demonstrated an inverse relationship to post-menstrual
age204 and a higher rate of turnover, when compared to term infants and older
children197. This turnover rate serves several important functions and requires a
substantial energy expenditure199.
The rate of protein synthesis in preterm infants exceeds the rate necessary for net
protein gain (i.e. 10-12 g kg-1d-1 vs. 2 g kg-1d-1)205. This excess may represent a
regulatory role for amino acids, which can have direct and immediate physiological
significance for the preterm infant. If amino acid pools are depleted, which can occur
for example in the early weeks of feeding, alterations at the translational level can occur
and in conjunction with hormonal influences at both the translational and transcriptional
level, protein synthesis will slow199, energy requirement will be concomitantly reduced
and faster breakdown will occur, thus replenishing the depleted pool197. It is unclear if
preterm infants respond to feeding by either increasing certain protein synthesis or
suppressing protein breakdown, or both, but according to Rigo197 studies have
consistently shown that in response to feeding both parenteral and enteral protein and
energy, there is an increase in whole-body protein turnover with a smaller decrease in
protein breakdown from endogenous sources (i.e. net protein gain).
42
2.1.10.3 Nitrogen Balance
Dietary protein requirements can be estimated from the sum of obligatory losses of
nitrogen through the urine, faeces and the skin and the amount deposited in newly
formed tissue (factorial method); or by measuring biochemical and physiological
responses to graded intakes (empirical method)109.
Nitrogen balance is the method that has been used most extensively to evaluate in vivo
protein metabolism in preterm infants197. Nitrogen balance is calculated as the
difference between nitrogen intake and nitrogen excretion. As nitrogen losses from the
skin and sweat are quantitatively small and difficult to measure (20-25 mg kg-1d-1)204,
only the nitrogen lost in the faeces and urine is considered in nitrogen balance
studies204. Fecal nitrogen excretion represents the non-absorbed fraction of nitrogen
intake (dietary nitrogen) as well as the endogenous nitrogen from secretions and
desquamation of cells206. Urinary nitrogen excretion represents the nitrogenous end
products from the oxidation of amino acids.
Using nitrogen balance (assuming an amount of fecal nitrogen, based on published
data), Zello determined during short-term changes in protein intake (1.0, 1.5, 2.0, 2.5,
and 3.0 g/kg/d) with 1 d of adaptation to the test intakes, that a minimum protein intake
of 0.74 g/kg/d was necessary to achieve zero balance (maintenance) in 21 formula-fed
preterm infants with mean (SD) gestational age and corrected-age at measurement of
29 ± 3 weeks and 36 ± 3 weeks, respectively207.
2.1.10.4 Nitrogen Absorption
The nitrogen balance studies conducted in preterm infants have predominantly been
performed at gestations ≥ 29 weeks and at weights > 1000 g and the data have been
extrapolated to ELBWs. Nitrogen absorption and retention rates have been shown to
vary with feeding regimen. Rigo and colleagues206 reviewed the nitrogen balances they
performed on VLBW preterm infants fed human milk (n=88), powdered formula
(n=49), liquid formula (n=58), and hydrolysed formula (n=31) over a 20-year period
prior to 1998. Fractional nitrogen absorption rate (true digestibility) differed
significantly according to feeding regimen: powdered whey or casein preterm formulae
(93%) > human milk ± human milk fortifier (83%) > protein hydrolysed formulae
(81%) > ready-to-feed whey predominant preterm formula (77%)206. These variable
digestibility rates may be related to the source of protein and nitrogen as well as to the
43
technical processes involved in formula manufacture. For example, the proteins in
human milk that have a non-nutritional role (e.g. lactoferrin, Ig A, lysozyme) are less
well absorbed than the nutritional whey and casein proteins. Both the nitrogen
component of the non-nutritious proteins and the nitrogen from other undigested
components in human milk (e.g. oligosaccharides) likely contribute to faecal
nitrogen120, 208, 209. Both hydrolysing protein in formula prior to its presentation in the
gut and heat treatment during processing of formula210, 211 may affect the normal
absorption process by promoting the Maillard reaction (chemical reaction between the
amino group and a reducing sugar) 206, thus explaining the lower rates of absorption in
hydrolysed and ready-to-feed formulae, compared with powdered products.
2.1.10.5 Nitrogen Retention
The proportion of synthesised protein used for protein gain (nitrogen retained/nitrogen
absorbed) was also shown to differ according to feeding regimen206. The highest mean
value was obtained in preterm infants fed powder and ready-to-feed whey predominant
formulae (78%) and lower mean values were observed in those fed protein hydrolysed
preterm formula (74%) and human milk (72%). Processing is the most likely
explanation for the lower values associated with hydrolysed formulae and the lower
mean coefficient obtained with human milk is in keeping with the smaller contribution
to protein gain of the metabolisable non-protein nitrogen fraction of human milk
(non-protein nitrogen ~20-25% of total nitrogen)212-214. It is notable that urea is a
normal constituent of human milk and may comprise as much as 15% of its total
nitrogen content213. A portion of dietary urea is hydrolysed by the action of bacterial
urease in the colon, leading to ammonia production that can then potentially be used as
a nitrogen source and returned to the metabolic pool213.
In healthy preterm infants, the efficiency of protein gain has been established at a mean
of 0.7, thus approximately 70% of absorbed amino acids are channelled to gains in
protein and the remaining 30% are oxidised and the nitrogen excreted. This, of course,
is only true within an adequate range of protein and energy intake (and a healthy
micronutrient status)204.
It should be noted that formula preparations are changing frequently and it is difficult to
know the exact composition of products and how these efficiency values and
coefficients relate to new products.
44
2.1.10.6 Amino Acid Profile
It is possible that some metabolic pathways are immature in preterm infants197,
increasing the risk of amino acid imbalance and consequently, metabolic derangement.
The optimal plasma concentrations for individual amino acids are not well defined in
preterm infants, but three options are considered:
(i) the amino acid concentration in umbilical cord plasma;
(ii) the amino acid concentration of the rapidly growing preterm infant receiving
human milk (± human milk protein supplementation); or
(iii) the amino acid concentration of the healthy, breast fed term infant.
The choice is difficult because the profile of amino acids in human milk changes
throughout lactation and between preterm and term milk215, according to the changing
ratio of whey to casein (approximately 80:20 in early lactation to 50:50 in late
lactation)119.
Plasma amino acid concentrations in preterm infants fed human milk fortified with
commercial fortifiers are similar to the mean (± 1 SD) of the amino acid values obtained
in cord blood and in preterm infants fed human milk fortified with human milk
protein)206. It is impossible to obtain this same nitrogen and amino acid pattern when
feeding cow’s milk based formula but formula companies are persistent in their efforts
in trying to achieve this goal.
2.1.10.7 Protein Energy Ratio (PER)
The metabolic cost for protein deposition relates to the energy content of the accreted
protein and to the extra energy expended during protein synthesis. This cost can be
calculated from energy and nitrogen balance studies and was discussed earlier
(p 34, Section 2.1.9 Energy). The metabolic cost of protein gain is approximately
10 kcal g-1 163, 179, 181, 183, 216 (including the energy stored: 4 kcal g-1) and the energy cost
of growth is approximated at 25-30 kcal kg-1d-1.
When energy intake is inadequate, amino acids will be oxidised for energy, leading to
negative nitrogen balance. At suboptimal energy intakes between 50 and
90 kcal kg-1d-1, increasing energy intake will spare protein for lean tissue gain and
improve nitrogen balance independently of the nature of the excess energy. Similarly, if
45
protein intake is suboptimal, increasing energy intake will spare protein for lean tissue
accretion. Hormonal responses to energy intake, especially insulin secretion, can
reduce demands by minimising net protein loss through the inhibition of both
proteolysis and the oxidation of amino acids. In contrast to this, an excess of dietary
energy also leads to the accumulation of excess adipose tissue, which results in an
increase in lean body mass and an associated increase in demands over time197.
As previously discussed, energy and protein metabolism is intimately interrelated and
the proportion of energy provided as protein as well as the total energy is important for
determining the quality and quantity of growth. The studies by Kashyap and
colleagues167, 186, 188, 189, 193 would suggest total energy intakes above 140 kcal kg-1d-1 and
a PER above 3.7 do not support growth targets. The key is finding the right balance
and, as energy and nitrogen balance studies have predominantly been preformed in
VLBW infants several days and weeks after birth, further research is needed to
determine the needs of very preterm infants and, importantly, how to achieve nutrition
and growth targets from birth.
2.1.10.8 Protein Requirements
Protein requirement is defined as the minimum intake of high quality dietary protein
that will provide the needs for maintenance at an appropriate BC and will permit growth
at the normal rate for age, assuming energy balance and normal level of activity202.
In 2005, Consensus nutrition guidelines related protein and PER to post-conceptual age
and the need for catch-up growth. The recommended reasonable intakes for premature
infants 26-30 weeks PCA were 3.8-4.4 g protein kg-1d-1 with a PER between 3.0-3.3 g
100 kcal-1 (Table 1.4). The protein requirement falls with postnatal age. These
recommendations are within the range of recommendations made by an expert panel
from the Life Sciences Research Office and the American Society for Nutritional
Sciences, who suggest 3.4 to 4.3 g protein kg-1d-1, an energy intake of 120 kcal kg-1d-1
and a protein energy ratio between 2.5 and 3.6 g 100 kcal-1.
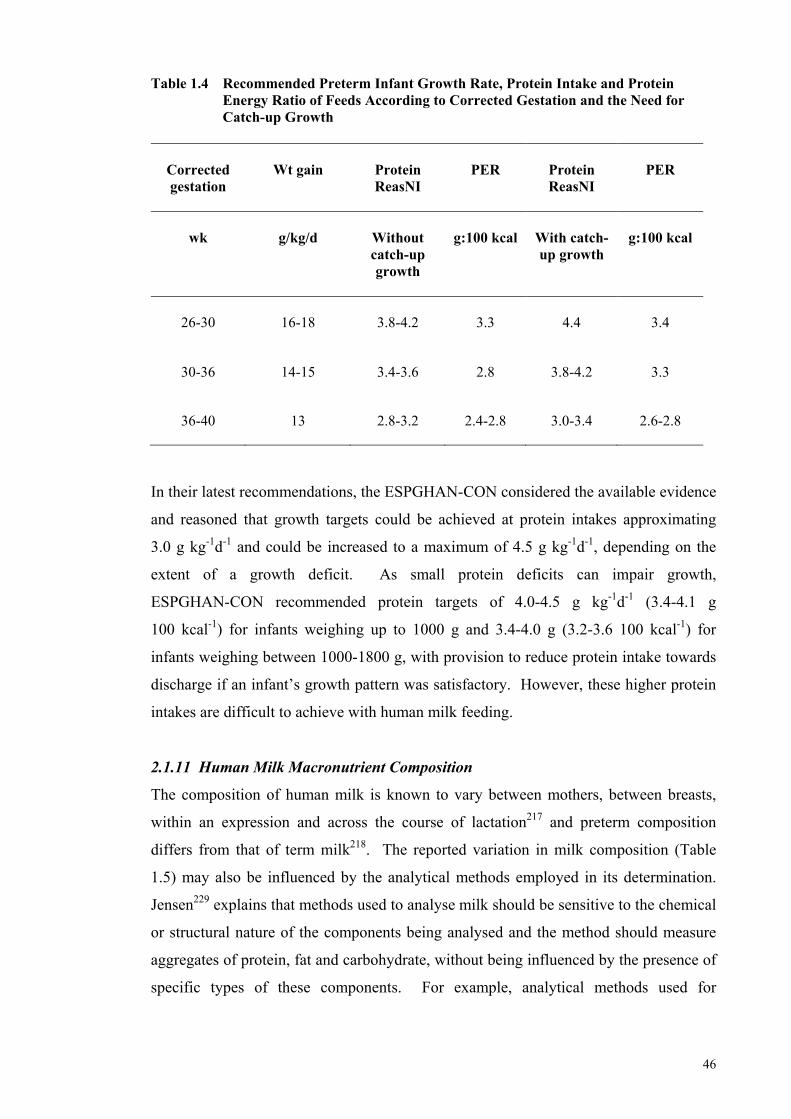
46
Table 1.4 Recommended Preterm Infant Growth Rate, Protein Intake and Protein Energy Ratio of Feeds According to Corrected Gestation and the Need for Catch-up Growth
Corrected gestation
Wt gain
Protein ReasNI
PER
Protein ReasNI
PER
wk
g/kg/d
Without catch-up growth
g:100 kcal
With catch-up growth
g:100 kcal
26-30
16-18
3.8-4.2
3.3
4.4
3.4
30-36 14-15 3.4-3.6 2.8 3.8-4.2 3.3
36-40 13 2.8-3.2 2.4-2.8 3.0-3.4 2.6-2.8
In their latest recommendations, the ESPGHAN-CON considered the available evidence
and reasoned that growth targets could be achieved at protein intakes approximating
3.0 g kg-1d-1 and could be increased to a maximum of 4.5 g kg-1d-1, depending on the
extent of a growth deficit. As small protein deficits can impair growth,
ESPGHAN-CON recommended protein targets of 4.0-4.5 g kg-1d-1 (3.4-4.1 g
100 kcal-1) for infants weighing up to 1000 g and 3.4-4.0 g (3.2-3.6 100 kcal-1) for
infants weighing between 1000-1800 g, with provision to reduce protein intake towards
discharge if an infant’s growth pattern was satisfactory. However, these higher protein
intakes are difficult to achieve with human milk feeding.
2.1.11 Human Milk Macronutrient Composition
The composition of human milk is known to vary between mothers, between breasts,
within an expression and across the course of lactation217 and preterm composition
differs from that of term milk218. The reported variation in milk composition (Table
1.5) may also be influenced by the analytical methods employed in its determination.
Jensen229 explains that methods used to analyse milk should be sensitive to the chemical
or structural nature of the components being analysed and the method should measure
aggregates of protein, fat and carbohydrate, without being influenced by the presence of
specific types of these components. For example, analytical methods used for
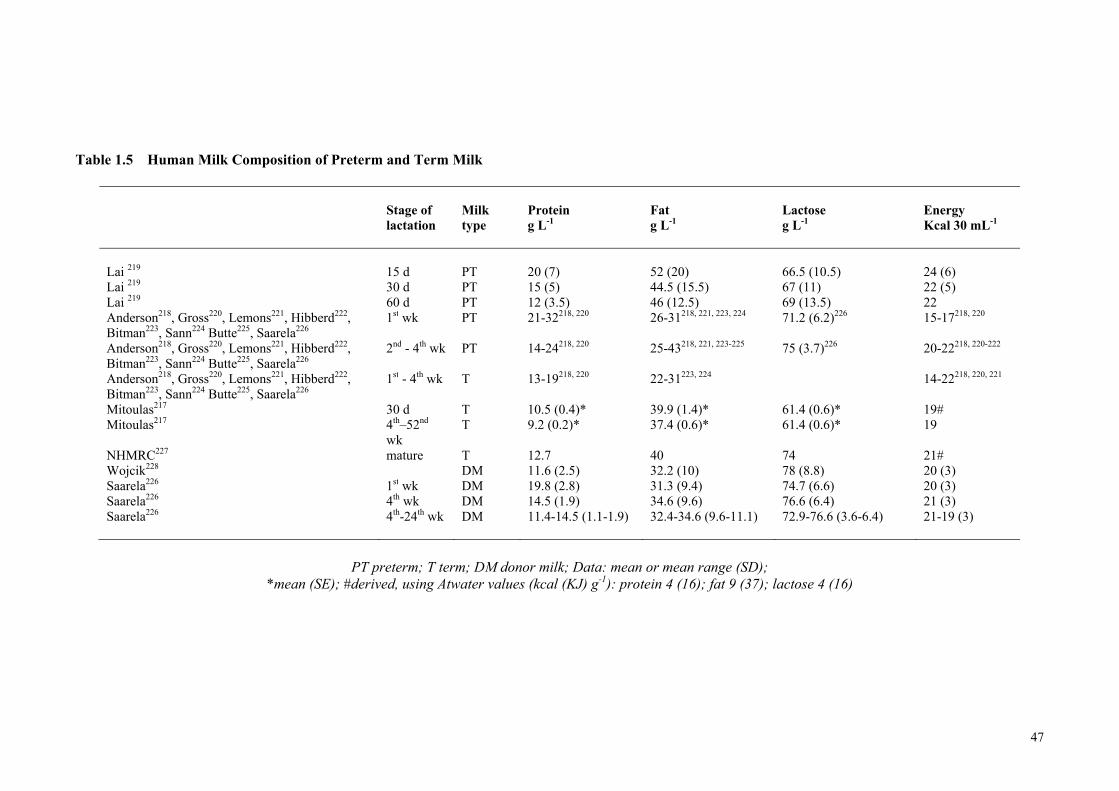
47
Table 1.5 Human Milk Composition of Preterm and Term Milk
Stage of lactation
Milk type
Protein g L-1
Fat g L-1
Lactose g L-1
Energy Kcal 30 mL-1
Lai 219 15 d PT 20 (7) 52 (20) 66.5 (10.5) 24 (6) Lai 219 30 d PT 15 (5) 44.5 (15.5) 67 (11) 22 (5) Lai 219 60 d PT 12 (3.5) 46 (12.5) 69 (13.5) 22 Anderson218, Gross220, Lemons221, Hibberd222, Bitman223, Sann224 Butte225, Saarela226
1st wk PT 21-32218, 220 26-31218, 221, 223, 224 71.2 (6.2)226 15-17218, 220
Anderson218, Gross220, Lemons221, Hibberd222, Bitman223, Sann224 Butte225, Saarela226
2nd - 4th wk PT 14-24218, 220 25-43218, 221, 223-225 75 (3.7)226 20-22218, 220-222
Anderson218, Gross220, Lemons221, Hibberd222, Bitman223, Sann224 Butte225, Saarela226
1st - 4th wk T 13-19218, 220 22-31223, 224 14-22218, 220, 221
Mitoulas217 30 d T 10.5 (0.4)* 39.9 (1.4)* 61.4 (0.6)* 19# Mitoulas217 4th–52nd
wk T 9.2 (0.2)* 37.4 (0.6)* 61.4 (0.6)* 19
NHMRC227 mature T 12.7 40 74 21# Wojcik228 DM 11.6 (2.5) 32.2 (10) 78 (8.8) 20 (3) Saarela226 1st wk DM 19.8 (2.8) 31.3 (9.4) 74.7 (6.6) 20 (3) Saarela226 4th wk DM 14.5 (1.9) 34.6 (9.6) 76.6 (6.4) 21 (3) Saarela226 4th-24th wk DM 11.4-14.5 (1.1-1.9) 32.4-34.6 (9.6-11.1) 72.9-76.6 (3.6-6.4) 21-19 (3)
PT preterm; T term; DM donor milk; Data: mean or mean range (SD); *mean (SE); #derived, using Atwater values (kcal (KJ) g-1): protein 4 (16); fat 9 (37); lactose 4 (16)
48
protein analysis should not be influenced by amino acid composition or have a
dependency on specific proteins being present229. Spectrophotometric methods can
potentially be influenced by the amino acid composition and possibly the tertiary
structure of proteins. Thus, equal sensitivity to different proteins is compromised. This
means that no one single protein standard can represent all the proteins found in
different milks. Atwood and Hartmann230 showed that the concentration of protein in
sows milk determined by two spectrophometric methods (Bradford and Lowry; bovine
albumin standard) correlated well with true protein measured by Kjeldahl (conversion
6.37). Therefore, Jensen229 concluded that calibrating these methods to the milk of the
species being studied may result in accurate determinations of protein content.
Kjeldahl is the method most commonly used to measure milk protein229. This method
determines the amount of N through a series of organic reactions, including the
digestion of protein by a strong acid at high temperature to release nitrogen. The
solution is then made alkaline to convert the nitrogen to free ammonia and the ammonia
is removed by distillation and trapped in a boric acid solution to prevent its loss. The
amount of ammonia is determined by titration and the percentage of nitrogen present in
the milk sample is calculated. As nitrogen may also be derived from non-protein (NPN)
compounds (eg. urea, free amino acids, uric acid, ammonia, nucleotides, peptides,
creatinine, glucosamine)231, the true percentage of nitrogen from protein needs to be
determined. This requires the removal of protein (deproteinisation) from another
sample of the milk by either acid precipitation or by dialysis232. Non-protein nitrogen is
determined on this deproteinised sample and milk protein N (PN) is then calculated as
the difference between Total and NPN233. Protein nitrogen is then multiplied by 6.25
(assuming protein is 16% N) to determine the true protein content of the milk119.
It is noteworthy that in some instances, the NPN fraction of milk is assumed rather than
accounted for by analysis. For example, the fraction of NPN in bovine milk and the
milk of most species is estimated between 5% to 6%119. Thus, the true protein content
of milk is sometimes estimated by multiplying Total N content of the milk (determined
by Kjeldahl) by a dairy protein conversion factor of 6.38 (assumes the milk protein is
15.7% N). If this conversion factor is used to estimate the protein content of human
milk, which has an estimated NPN content of 20-25% throughout the first month of
lactation231, protein will be overestimated.
49
The following describes and compares the protein composition of preterm milk
determined by different methods but recalculated to assume protein comprises 16% N
(6.25), after correcting for 25% NPN (i.e. calculated by dividing each mean protein
value by original conversion factor to determine total N, subtracting 25% for NPN and
multiplying by a conversion factor of 6.25):
Recently, Lai219 measured longitudinally, the protein, fat and lactose content of the milk
of mothers (n=25) delivering preterm, across days 10 to 60 of lactation (Table 1.5).
Like mothers of term infants, the milk composition between and within mothers varied
significantly over this period. Lai confirmed the finding shown earlier by some
investigators that early in lactation, the protein content of preterm milk is greater than
that of term milk. Specifically, in ten day intervals, Lai reported the median (IQR,
range) total protein content from the left and right breasts (respectively) of mothers and
demonstrated that the protein content of preterm milk draws closer to that of term milk
as lactation progresses: 10 d: 20.8 (17.3-24.6; 9.6-38.1), 20.6 (16.9-26.0; 9.9-37.1); 20
d: 18.1 (14.2-23.0, 7.9-53.3), 18.2 (15.4-22.5, 7.3-47.8); 30 d: 13.9 (11.6-17.7, 7.9-
36.1, 14.2 (11.4-17.5, 6.9-29.2); 40 d: 13.4 (10.9-16.4, 6.0-28.3), 13.7 (9.6-15.6; 6.3-
28.6); 50 d: 12.5 (10.1-15.7, 6.9-22.7), 12.2 (9.6-14.5, 5.3-23.2); 60 d: 11.4 (9.1-14.9,
5.0-22.6), 12.3 (9.3-14.1, 3.5-19.0). The average of the combined mean milk
concentrations reported by Lai219 for both breasts for days 15 and 30 and then days 15,
30 and 60 are 17.5 g/L and 15.7 g/L, respectively.
Lai219 determined the protein content of the milk samples by a modified Bradford
method234 using a commercial protein reagent (Bio-Rad Laboratories, Richmond. CA,
USA). The assay measures the binding of the dye to the amino acid residues of the
proteins and peptides in the milk sample. Human milk protein standards for the Bio-
Rad assay were prepared by subtracting the N content of deproteinised human milk
from the total N content of the milk233 (determined by modified-Kjeldahl). Protein N
was then converted to protein using the conversion factor of 6.25 (i.e. assuming protein
is 16%N).
Gross et al.235 estimated the protein concentration of samples of preterm milk expressed
in the morning by 33 preterm mothers (mean gestation 31.4 weeks) by multiplying
Total N (determined by Kjeldahl) by 6.38. According to Gross et al235, mean (SE)
protein content of preterm human milk (g 100 mL-1) at 3, 7, 14, 21 and 28 days was 3.2
50
(0.31), 2.4 (0.15), 2.2 (0.12), 1.8 (0.14) and 1.8 (0.11), respectively. Recalculating each
of these mean values to assume a NPN content of 25%, the mean protein content (g 100
mL-1) of expressed preterm human milk measured by Gross et al235 at 3, 7, 14, 21 and
28 days can be crudely recalculated to be 2.4, 1.8, 1.6, 1.3 and 1.3. The mean of these
average protein values of preterm milk expressed within the first 28 days of lactation is
1.7 g 100 mL-1 (i.e 16.9 g L-1), which is similar to the mean value determined by Lai219.
Anderson et al.218 measured the mean protein concentration of 24-hour collections (g
100 mL-1) from 17 preterm mothers (28.5 w gestation) on specific days over the same
period, by calculating TN by Kjeldahl and multiplying by a conversion factor of 6.25
(3-5 d: 2.1; 8-11 d: 1.9; 15-18 d: 1.7; 26-29 d: 1.35). Like others, these investigators
also demonstrated the gradual decline in protein content over the first month of
lactation. Adjusting these values to correct for a NPN fraction of 25%, the estimated
mean protein concentrations (g 100 mL-1) of the milk samples are: (3-5 d: 1.6; 8-11 d:
1.4; 15-18 d: 1.3; 26-29 d: 1.0). Across the month, the mean protein content can be
calculated at 1.3 g 100 mL-1 (i.e. 13.2 g L-1), 0.37 g 100 mL-1 lower than the
‘recalculated’ average protein values reported by Gross et al235 and Lai219 for preterm
milk collected over the same period of lactation.
Lemons et al.221 measured the protein concentration of 24-hour collections from 20
preterm mothers delivering at a mean gestation of 33 weeks. Protein N was determined
by Kjeldahl and a conversion factor of 6.25 was employed. This method differed from
the others, in that after acid precipitation of the milk samples, which were collected
weekly for the first month and then biweekly, this group determined protein nitrogen on
the precipitate. The mean protein content of the milk for the first 14, 28 and 42 days
respectively, was 2.6 (26 g L-1), 2.3 (23 g L-1), and 1.9 g (19 g L-1) g 100 mL-1, values
substantially higher than others219, 235.
Saarela et al.226 measured protein (g 100 mL-1) by determining total N by Kjeldahl
(conversion factor 6.38) in 24-h milk samples of 36 preterm mothers (mean gestation
31.4 weeks) at 1 week (2.01) and then monthly from one (1.51) to six (1.13) months of
lactation. At 7, 28 and 56 days, the recalculated mean protein content of the milk was
1.5 (15 g L-1), 1.1 (11.1 g L-1) and 0.8 (8.3 g L-1), and the mean over 28 d was 1.3 g (13
g L-1) 100 mL-1.
51
Variation in protein content of preterm milk, as described, may be due to the sampling
and expressing technique, stage of lactation, and also to the analytical methods and
correction factors employed in its determination. In the studies reviewed here, Kjeldahl,
and a spectrophotometric (human milk standard) method were used to derive protein
content of single and 24-h pooled expressions, or pooled, left or right breast, 24-h milk
expressions. Protein is determined by the Kjeldahl method by either converting Total N
by 6.25 or 6.38, calculating the difference between TN and NPN and converting derived
PN by 6.25 or in one study, measuring PN in the precipitant (conversion 6.25). In the
Kjeldahl method, peptides are included in the supernatant and incorporated into the
NPN measurement and therefore excluded from the derived protein measurement.
Conversely, dye binds to the amide bonds and therefore peptides are included in the raw
measurement obtained with the spectrophotometric method and thus, included in the
derived protein measurement. Mean protein content (g L-1) of milk expressed in the
first month of lactation, re-calculated (assuming 25%NPN and conversion factor 6.25)
for each of these studies is 18219, 17235, 13218, 23221 and 13226.
Donor preterm milk has a higher mean ± SD energy and macronutrient content236
compared to that of donor term milk228. Forty-five of forty-seven batches measured in
a Western Australian human milk bank236 were from 11 preterm donors and the protein
(1.35 ± 0.33), fat (4.16 ± 0.90), lactose (6.71 ± 0.60) and energy (69.7 ± 8.7) content
was considerably higher than the energy and macronutrient content of 415 sequential
samples from 273 single donors from milk banks across America: protein (1.16% ±
0.25%), fat (3.22% ± 1.00%), lactose (7.80% ± 0.88%), energy (65 ±
11 kcal 100 mL-1)228.
The measured variation becomes problematic when trying to achieve recommended
intakes for preterm infants. The protein content of milk reported in the 4th week of
lactation (Table 1.5) suggests that the PER approximates 2.0, and when fed at rates
between 150-180 mL kg-1d, a protein intake of 2.1 g to 2.8 g kg-1d-1 can be provided.
This is clearly below recommendations and therefore human milk must be routinely
fortified with protein and energy and other micronutrients to promote adequate growth.
Calcium and phosphorus supplementation is necessary to avoid rickets and promote
adequate bone mineralisation and supplementation with several trace elements, such as
zinc, copper and iron is also essential to prevent deficiency states218.
52
Commercially available human milk fortifiers all contain similar amounts of protein,
energy, calcium and phosphorus, though they differ in the amounts of fat, lactose,
sodium and vitamins they contain, as well as in the technical processing methods
applied during manufacture237 (i.e. hydrolysed protein vs. whole protein) and the form
in which the nutrients are provided (e.g. calcium gluconate, calcium lactate, calcium
glycerophosphate). The addition of fortifiers to human milk alters osmolality238, 239, but
not to the extent thought previously to be associated with necrotising enterocolitis240.
When added to expressed human milk according to manufacturer’s instructions, it has
been expected that the fortified human milk will meet the nutritional needs of preterm
infants130, resulting in short term increases in weight gain, linear growth and head
circumference241. However, given the variability in the composition of human milk and
the variation in volume intakes, it is unlikely that this expectation is always realised,
and reported growth outcomes, which fall short of targets, would certainly suggest that
this is the case.
Depending on the variability of the milk composition and the extent of the nutrient
deficit accumulated after birth, additional fortification to that which is recommended by
manufacturers is sometimes required for VLBW and ELBW infants and especially for
those who are sick and/or fluid restricted. Protein supplements, glucose polymers, long
and medium chain fats and combined carbohydrate and fat energy supplements have
been used to further increase the protein and energy density of fortified HM. However,
increased osmolality, renal solute load and feeding tolerance are important
considerations when further fortification is needed.
Since the composition of HM differs according to collection, sampling and feeding
practices and with the duration of lactation, the optimal method for HM fortification
remains undetermined; adding a fixed amount of supplement to expressed HM feeds
may result in some nutrients under or over-exceeding that which is recommended130 and
the arbitrary cessation of fortification at a certain age, weight or stage of admission is
likely to influence growth outcomes. Therefore, further research should be directed
towards determining best practice in the fortification of milk feeds that aims to achieve
preterm growth targets.
53
2.1.12 Current Nutritional Feeding Practices
Nutrition practices have changed in recent years in attempts to accommodate the
recommended increases in PER and total energy, especially for ELBW infants. These
changes have been the impetus for, and focus of, recent research. More aggressive
parenteral and enteral feeding regimes have been recommended242, 243 and trialled244-246.
Thureen et al.244 randomised 28 very preterm infants to commence parenteral nutrition
with amino acid concentrations providing either 1.0 g kg-1d-1 (n=13) or 3.0 g kg-1d-1
(n=15). Intralipid was provided simultaneously at a rate of 1 g kg-1d-1 and glucose was
administered at intakes to maintain serum glucose concentrations >80-100 mg 100 mL-1
but which avoided hyperglycaemia, defined as serum glucose concentrations above
120-150 mg 100 mL-1 with glycosuria. These authors found no significant differences
between groups in nitrogen-related metabolic derangement and the higher
administration of amino acids resulted in increased positive nitrogen on study day two
(185.6 vs. -41.6 mg N kg-1d-1) and thus, greater protein accretion. These outcomes were
primarily achieved by increased protein synthesis rather than proteolysis and appeared
well tolerated in the first days of life.
Ibrahim et al.245 infused 16 infants with glucose and 3.5 g amino acids and 3.0 g lipid
per kilogram of body weight within two hours of birth and compared nitrogen balance
and related metabolic indices with infants who only received glucose for the first
48-hours of life. Nitrogen balance was positive with the high amino acid infusion
without relevant clinical implications on day one of life, compared with infants in the
control group, who were in negative balance (400 vs. -180 mg N kg-1d-1).
Te Braake et al.246 randomised 132 infants to receive amino acids (2.4 g kg-1d-1) for the
first day of life (n=66) or no amino acids during the first day with a step-wise increase
in amino intake to 2.4 g kg-1d-1 on day three. In both groups, glucose intake was
initiated at 5.5 g kg-1d-1 on day one of life with increments to 7.1 g kg-1d-1 on day four
and lipid (1.4 g kg-1d-1) was introduced on day two to both groups and increased to
provide twice that amount from day three onwards. Age to regain birth weight was not
statistically different, but nitrogen balance on day two was improved in the infants
receiving amino acids on day one of life (145 vs. -84 mg N kg-1d-1). A year later, this
same group of authors247 conducted a leucine and glucose kinetics study in preterm
infants randomised to either a high amino acid intake (2.4 g kg-1d-1) with glucose
54
immediately after birth or only glucose. Their study showed that glucose oxidation rate
did not increase with amino acid administration and there was greater incorporation of
leucine into body protein and higher leucine oxidation rates. Release of leucine as a
result of proteolysis was not evident. These authors concluded, as Thureen et al.244 had
done three years earlier, that the energy required for the additional protein synthesis was
not sourced from the oxidation of glucose and that oxidation of amino acids may partly
be energising this process. If, as is seen in the fetus, amino acids can serve as a
significant energy source beyond the requirements for protein accretion in the ELBW
infant, an elevated urea concentration may reflect an acceptable metabolic by-product
rather than protein intolerance248. Even so, the infant must possess the metabolic
capacity to manage this by-product because high urea levels can be toxic.
Valentine et al.249 conducted a prospective intervention of early amino acid
supplementation beginning on day one of life (3 g kg-1d-1) in 308 preterm infants with a
mean (SD) gestational age and birth weight of 29 (0.13) wk and 1160 (13) g,
respectively. Weight gain, weight <10th percentile at discharge and time taken to cease
parenteral nutrition were outcomes assessed against a retrospective control
group (n=132) who received parenteral nutrition after day one of life. Clinical
confounders didn’t differ between groups and the earlier administration of amino acids
was found to improve weight gain, result in shorter administration of parenteral
nutrition and result in fewer infants having weights less than the 10th percentile at
36 weeks corrected gestation.
In each of these studies, outcome measures were short-term and as these feeding
regimens have only been implemented in recent years, there is no evidence to suggest
aggressive parenteral support in the first days of life confers any long-term benefit on
very preterm infants. At least, of the two randomised trials investigating the benefits of
early aggressive parenteral nutrition, the first found no evidence of improvements in
either total brain volume at corrected term age or developmental indices at three and
nine months after term250 and a secondary analysis of the second randomised control
trial revealed that improved weight gain at 36 weeks post-menstrual age did not
translate to improvements in neurodevelopmental outcome at 18 months of age251.
55
2.1.13 Fortification of Human Milk
Human milk is routinely fortified on an assumed macronutrient composition and
therefore the precise nutrient intake of infants is not known. The adequacy of nutrition
is commonly determined against anthropometric outcomes, such as gains in weight,
length and head circumference.
Three studies, between 1999 and 2006 investigated targeting milk fortification to the
individual needs of the infant, with the aim of achieving anthropometric growth targets.
Polberger et al.252 conducted a Swedish multi-centre study of 32 preterm infants
(Birth weight: 900 g -1750 g) randomised to receive HM feeds fortified with HM
protein (HMP) (n=16) or a bovine whey protein fortifier (BF) (n=16) for a period of
25.1 d ±7.7 and 22.9 d ± 7, respectively. Either the initiation of breastfeeding or a
weight of 2200 g defined the endpoint of an infant’s participation in the study.
The HMP concentrate was derived from the ultra-filtration of defatted, pasteurised DM
and consisted of 68% protein. The BF provided 1 g protein and 13 kcal per 100 mL
HM. Prior to fortification and during the study period, 24-hour milk collections of each
MOM were analysed weekly for protein content using infrared technology. Donor milk
of known composition was used when there was insufficient volume of MOM.
Fortification with HMP or BF to provide a targeted protein intake of 3.5 g kg-1d-1 was
based on infant weight, volume intake (150 mL kg-1d-1 to 170 mL kg-1d-1), feed
tolerance and measured protein content of the milk. A multivitamin preparation and
additional calcium, phosphorous and iron were also provided - dose and length of
administration were dependent on birth weight and type of fortifier. On completion of
the study, the total nitrogen content of daily, fortified milk samples pooled to weekly
samples was determined by Kjeldahl and the values multiplied by 6.25 (N 16% of
protein) to estimate mean protein concentration. The PER of the milk feeds was not
calculated. Nutritional biochemical markers and amino acid analyses were performed
on blood samples taken from the infant.
56
Mean protein intake (likely overestimated) in this study did not differ significantly
between groups (HMP: 3.13 g kg-1d-1 ± 0.14, BF: 3.05 g kg-1d-1 ± 0.15). Growth indices
[HMP (BF)]: Weight: 14.7 g kg-1d-1 ± 3.2 (15.6 g kg-1d-1 ±2.9); Length: 1.02 cm wk-1
(0.97 cm ± 0.34); Head Circumference: 1.02 cm wk-1 (1.06 cm ± 0.21). Amino acid
profiles (except threonine, proline and ornithine) and biochemical indices, including
urea, transthyretin, albumin and transferrin, were similar between groups.
The authors concluded that when protein intakes using either the HMP or BF were
similar, no differences in biochemical and growth outcomes between groups fed one or
the other were evident and that human milk feeding may be nutritionally beneficial. It
can be argued that this study demonstrated the superiority of HMP over bovine protein
as less digestible protein was consumed without compromised growth213.
Arslanoglu and colleagues253, 254 conducted a RCT in 2006 to assess and compare the
efficacy of an adjustable, HM fortification feeding regime (ADJ) with routine
fortification. Unfortified HM feeds were introduced to infants (n=32; gestation: 24-34
wk; birth weight: 600 g–1750 g) within the first three days after delivery, and when
milk intake increased to 90 mL kg-1d-1 the milk was fortified at half strength (providing
an extra 0.4 g protein and 9 kcal 100 mL-1 milk). Feeding volume was increased
gradually as tolerated, and when full volume intakes of 150 mL kg-1d-1 were achieved
the milk was fortified to full strength (providing an extra 0.8 g protein and 18 kcal 100
mL-1). Infants were also supplemented daily from day 15 of life with Vitamins A, D
and C and with both zinc and iron.
The level of fortification of each of the infants in the intervention group (n=16) was up
or downgraded according to the infant’s blood urea nitrogen (BUN) levels, either by
using different amounts of a bovine, whey protein concentrate or by adjusting the
routine amount of human milk fortifier (HMF) that was normally added, or both. The
degree to which this altered the protein and energy density of each infant’s feeds is
detailed in Table 1.6.
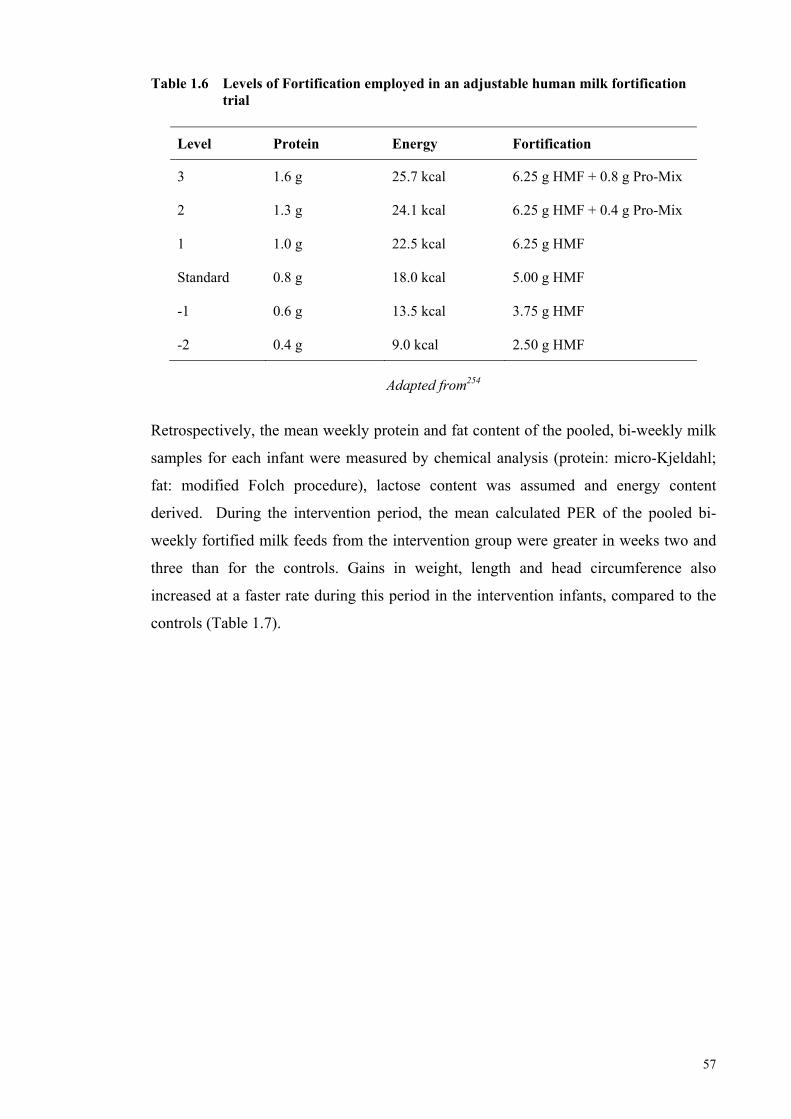
57
Table 1.6 Levels of Fortification employed in an adjustable human milk fortification trial
Level
Protein
Energy
Fortification
3
1.6 g 25.7 kcal 6.25 g HMF + 0.8 g Pro-Mix
2
1.3 g 24.1 kcal 6.25 g HMF + 0.4 g Pro-Mix
1
1.0 g 22.5 kcal 6.25 g HMF
Standard
0.8 g 18.0 kcal 5.00 g HMF
-1
0.6 g 13.5 kcal 3.75 g HMF
-2 0.4 g 9.0 kcal 2.50 g HMF
Adapted from254
Retrospectively, the mean weekly protein and fat content of the pooled, bi-weekly milk
samples for each infant were measured by chemical analysis (protein: micro-Kjeldahl;
fat: modified Folch procedure), lactose content was assumed and energy content
derived. During the intervention period, the mean calculated PER of the pooled bi-
weekly fortified milk feeds from the intervention group were greater in weeks two and
three than for the controls. Gains in weight, length and head circumference also
increased at a faster rate during this period in the intervention infants, compared to the
controls (Table 1.7).
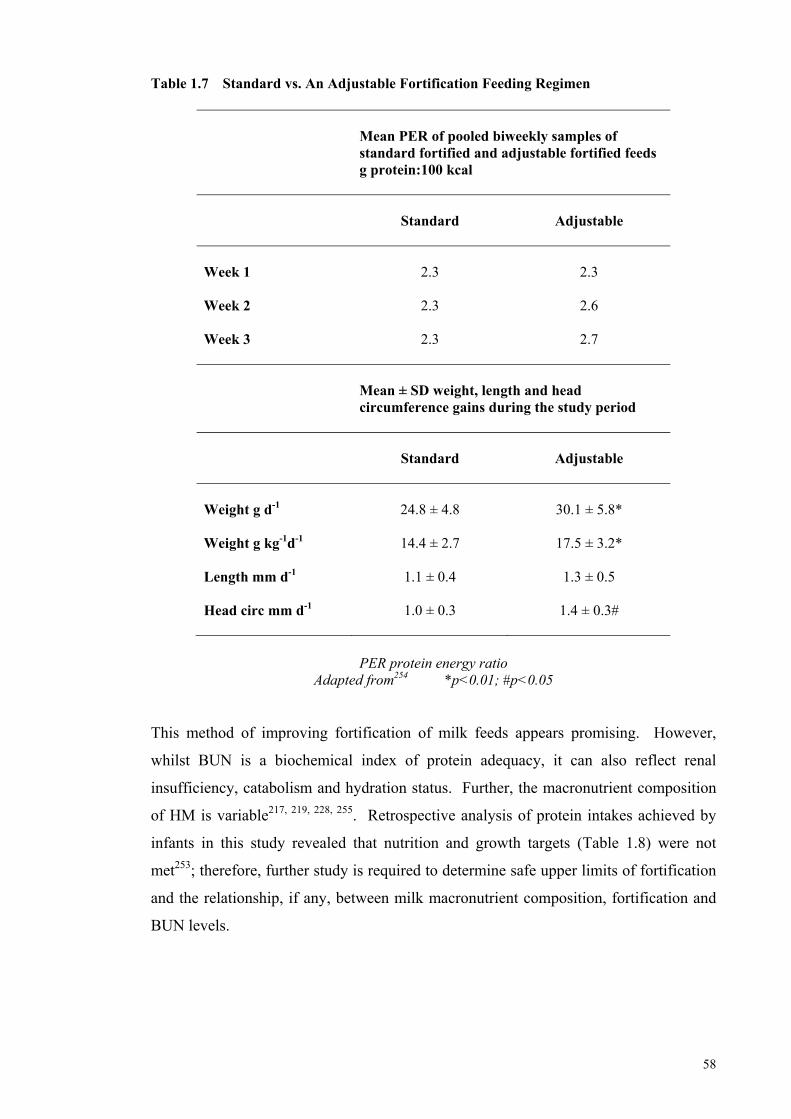
58
Table 1.7 Standard vs. An Adjustable Fortification Feeding Regimen
Mean PER of pooled biweekly samples of standard fortified and adjustable fortified feeds g protein:100 kcal
Standard
Adjustable
Week 1 2.3 2.3
Week 2 2.3 2.6
Week 3 2.3 2.7
Mean ± SD weight, length and head circumference gains during the study period
Standard
Adjustable
Weight g d-1
24.8 ± 4.8 30.1 ± 5.8*
Weight g kg-1d-1 14.4 ± 2.7 17.5 ± 3.2*
Length mm d-1 1.1 ± 0.4 1.3 ± 0.5
Head circ mm d-1 1.0 ± 0.3 1.4 ± 0.3#
PER protein energy ratio Adapted from254 *p<0.01; #p<0.05
This method of improving fortification of milk feeds appears promising. However,
whilst BUN is a biochemical index of protein adequacy, it can also reflect renal
insufficiency, catabolism and hydration status. Further, the macronutrient composition
of HM is variable217, 219, 228, 255. Retrospective analysis of protein intakes achieved by
infants in this study revealed that nutrition and growth targets (Table 1.8) were not
met253; therefore, further study is required to determine safe upper limits of fortification
and the relationship, if any, between milk macronutrient composition, fortification and
BUN levels.
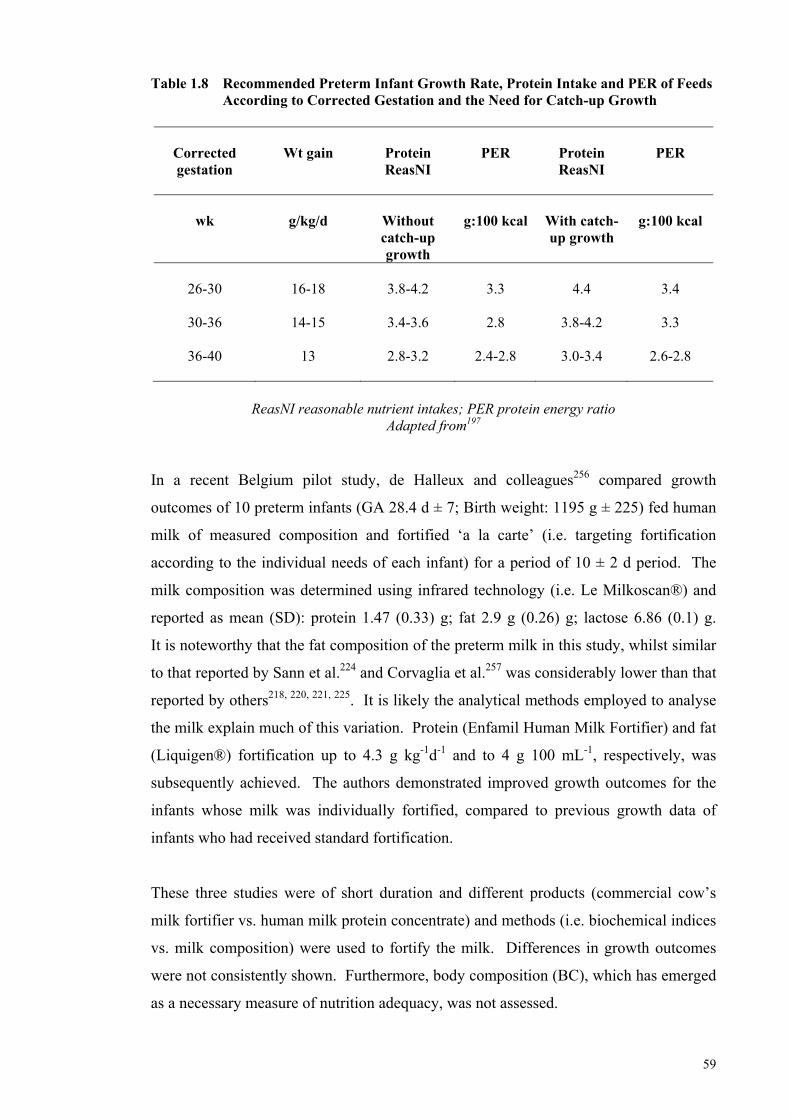
59
Table 1.8 Recommended Preterm Infant Growth Rate, Protein Intake and PER of Feeds According to Corrected Gestation and the Need for Catch-up Growth
Corrected gestation
Wt gain
Protein ReasNI
PER
Protein ReasNI
PER
wk
g/kg/d
Without catch-up growth
g:100 kcal
With catch-up growth
g:100 kcal
26-30
16-18
3.8-4.2
3.3
4.4
3.4
30-36
14-15 3.4-3.6 2.8 3.8-4.2 3.3
36-40
13 2.8-3.2 2.4-2.8 3.0-3.4 2.6-2.8
ReasNI reasonable nutrient intakes; PER protein energy ratio
Adapted from197 In a recent Belgium pilot study, de Halleux and colleagues256 compared growth
outcomes of 10 preterm infants (GA 28.4 d ± 7; Birth weight: 1195 g ± 225) fed human
milk of measured composition and fortified ‘a la carte’ (i.e. targeting fortification
according to the individual needs of each infant) for a period of 10 ± 2 d period. The
milk composition was determined using infrared technology (i.e. Le Milkoscan®) and
reported as mean (SD): protein 1.47 (0.33) g; fat 2.9 g (0.26) g; lactose 6.86 (0.1) g.
It is noteworthy that the fat composition of the preterm milk in this study, whilst similar
to that reported by Sann et al.224 and Corvaglia et al.257 was considerably lower than that
reported by others218, 220, 221, 225. It is likely the analytical methods employed to analyse
the milk explain much of this variation. Protein (Enfamil Human Milk Fortifier) and fat
(Liquigen®) fortification up to 4.3 g kg-1d-1 and to 4 g 100 mL-1, respectively, was
subsequently achieved. The authors demonstrated improved growth outcomes for the
infants whose milk was individually fortified, compared to previous growth data of
infants who had received standard fortification.
These three studies were of short duration and different products (commercial cow’s
milk fortifier vs. human milk protein concentrate) and methods (i.e. biochemical indices
vs. milk composition) were used to fortify the milk. Differences in growth outcomes
were not consistently shown. Furthermore, body composition (BC), which has emerged
as a necessary measure of nutrition adequacy, was not assessed.
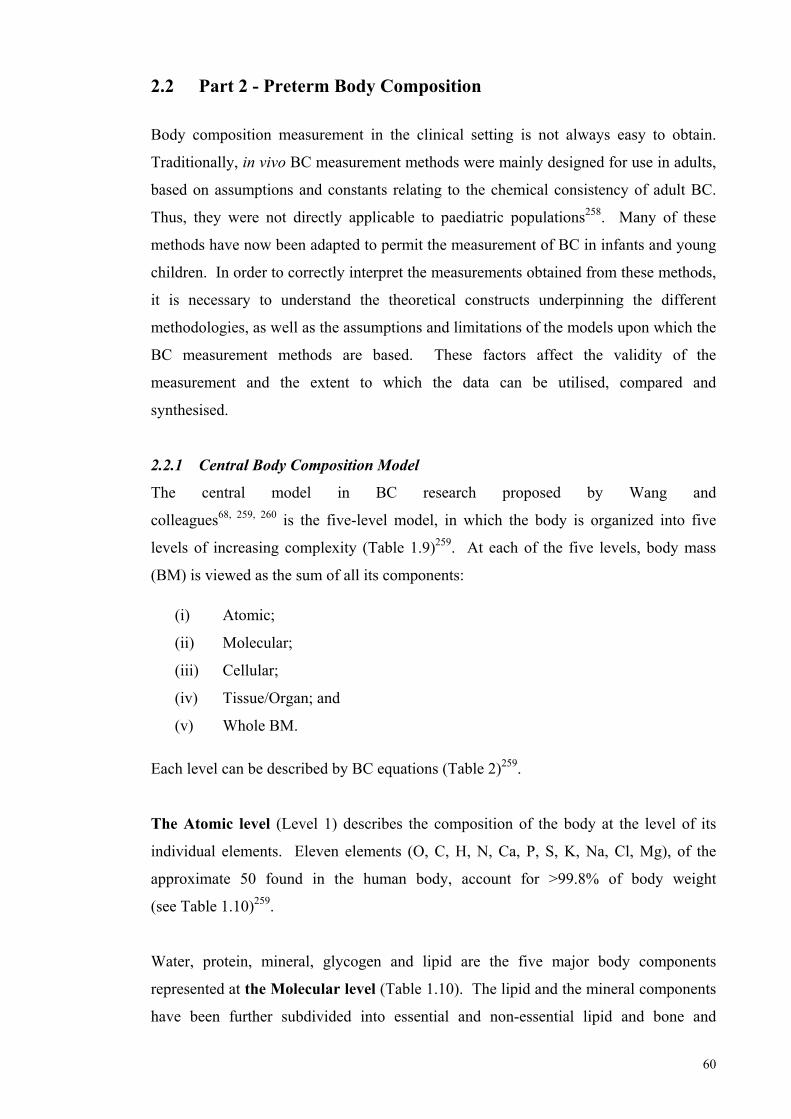
60
2.2 Part 2 - Preterm Body Composition
Body composition measurement in the clinical setting is not always easy to obtain.
Traditionally, in vivo BC measurement methods were mainly designed for use in adults,
based on assumptions and constants relating to the chemical consistency of adult BC.
Thus, they were not directly applicable to paediatric populations258. Many of these
methods have now been adapted to permit the measurement of BC in infants and young
children. In order to correctly interpret the measurements obtained from these methods,
it is necessary to understand the theoretical constructs underpinning the different
methodologies, as well as the assumptions and limitations of the models upon which the
BC measurement methods are based. These factors affect the validity of the
measurement and the extent to which the data can be utilised, compared and
synthesised.
2.2.1 Central Body Composition Model
The central model in BC research proposed by Wang and
colleagues68, 259, 260 is the five-level model, in which the body is organized into five
levels of increasing complexity (Table 1.9)259. At each of the five levels, body mass
(BM) is viewed as the sum of all its components:
(i) Atomic;
(ii) Molecular;
(iii) Cellular;
(iv) Tissue/Organ; and
(v) Whole BM.
Each level can be described by BC equations (Table 2)259.
The Atomic level (Level 1) describes the composition of the body at the level of its
individual elements. Eleven elements (O, C, H, N, Ca, P, S, K, Na, Cl, Mg), of the
approximate 50 found in the human body, account for >99.8% of body weight
(see Table 1.10)259.
Water, protein, mineral, glycogen and lipid are the five major body components
represented at the Molecular level (Table 1.10). The lipid and the mineral components
have been further subdivided into essential and non-essential lipid and bone and
61
soft-tissue mineral, respectively. Several of the BC models that have been created at
this level are applied in methods that are currently being used to assess BC of infants
and children (Table 1.9). These models, among others, are described in Table 1.10259.
Table 1.9 Multicomponent Models Representing the Five Levels of Body Composition
Level
Body Composition Model Number of components
Atomic
BM=H+O+N+C+Na+K+Cl+P+Ca+Mg+S+R
11
Molecular
BM=FM+TBW+Ptn+Mo+Ms+Gly BM=FM+TBWater+Ptn+M BM=FM+TBWater+nonfat solids BM=FM+Mo+SLT BM=FM+FFM
6 4 3 3 2
Cellular
BM=cells+ECF+ECS BM=FM+BCM+ Cells+ECF+ECS+EC solids
3 6
Tissue-organ
BM=AT+SM+bone+visceral organs+other
5
Whole-body
BM=head+trunk+limbs
3
BCM Body cell mass; BM Body mass; ECF Extracellular fluid;
ECS Extracellular solids; FM Fat mass; M Mineral; Mo Bone or Osseous mineral; Ms soft-tissue or non-osseous mineral; Ptn Protein; R residual;
SLT Soft lean tissue; TBWater Total body water
The two-compartment model (2-C), which partitions the body into FM and FFM, is the
most commonly applied model in BC methodology261. In this model, FM includes the
non-essential lipid (fat) and FFM comprises the essential lipid, water, protein, glycogen,
osseous (bone) mineral and non-osseous (soft-tissue) mineral. Densitometry methods
are based on the 2-C model. Other models created at the molecular level include the 3-
Compartment (3-C) model that is used in dual-energy x-ray absorptiometry (DXA)
equipment, where the FFM component comprises lean soft tissue and bone mineral
(Figure 1.3) and the 4-Compartment (4-C) model, often used to validate new methods,
which partitions FFM into protein, mineral and water.
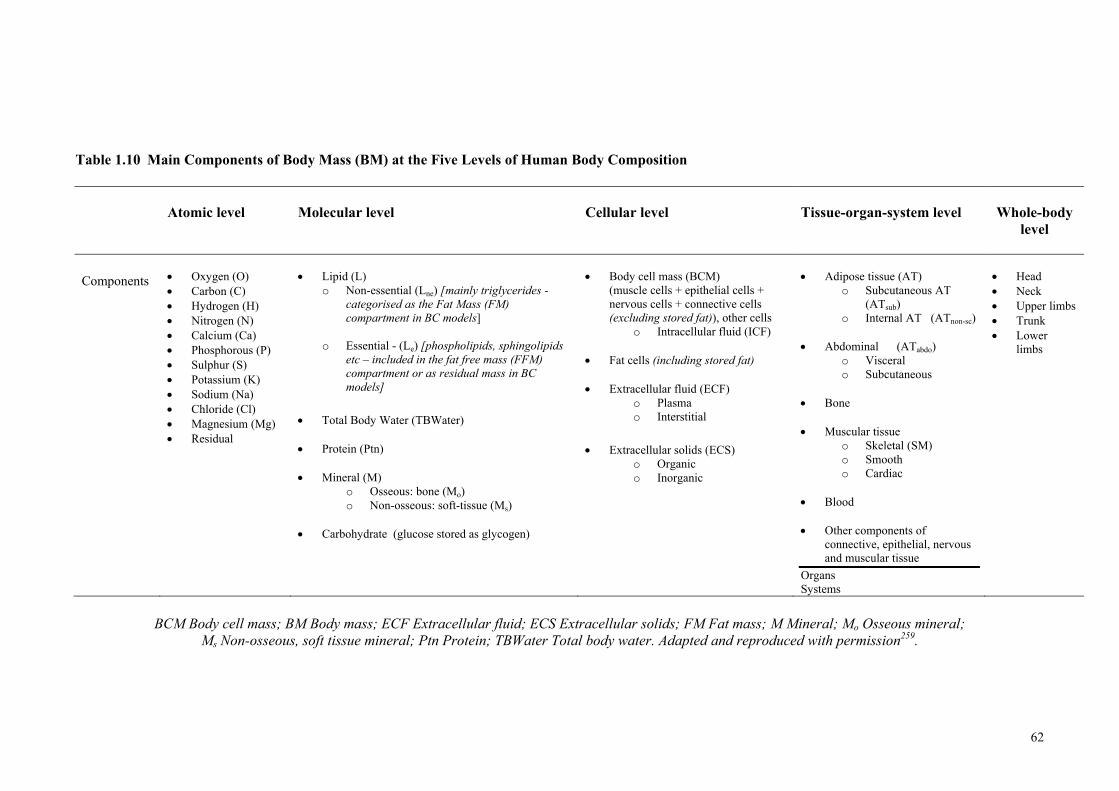
62
Table 1.10 Main Components of Body Mass (BM) at the Five Levels of Human Body Composition
Atomic level
Molecular level
Cellular level
Tissue-organ-system level
Whole-body
level
Components
Oxygen (O) Carbon (C) Hydrogen (H) Nitrogen (N) Calcium (Ca) Phosphorous (P) Sulphur (S) Potassium (K) Sodium (Na) Chloride (Cl) Magnesium (Mg) Residual
Lipid (L)
o Non-essential (Lne) [mainly triglycerides - categorised as the Fat Mass (FM) compartment in BC models]
o Essential - (Le) [phospholipids, sphingolipids etc – included in the fat free mass (FFM) compartment or as residual mass in BC models]
Total Body Water (TBWater)
Protein (Ptn)
Mineral (M)
o Osseous: bone (Mo) o Non-osseous: soft-tissue (Ms)
Carbohydrate (glucose stored as glycogen)
Body cell mass (BCM)
(muscle cells + epithelial cells + nervous cells + connective cells (excluding stored fat)), other cells
o Intracellular fluid (ICF)
Fat cells (including stored fat)
Extracellular fluid (ECF) o Plasma o Interstitial
Extracellular solids (ECS)
o Organic o Inorganic
Adipose tissue (AT)
o Subcutaneous AT (ATsub)
o Internal AT (ATnon-sc)
Abdominal (ATabdo) o Visceral o Subcutaneous
Bone
Muscular tissue
o Skeletal (SM) o Smooth o Cardiac
Blood
Other components of
connective, epithelial, nervous and muscular tissue
Organs Systems
Head Neck Upper limbs Trunk Lower
limbs
BCM Body cell mass; BM Body mass; ECF Extracellular fluid; ECS Extracellular solids; FM Fat mass; M Mineral; Mo Osseous mineral;
Ms Non-osseous, soft tissue mineral; Ptn Protein; TBWater Total body water. Adapted and reproduced with permission259.
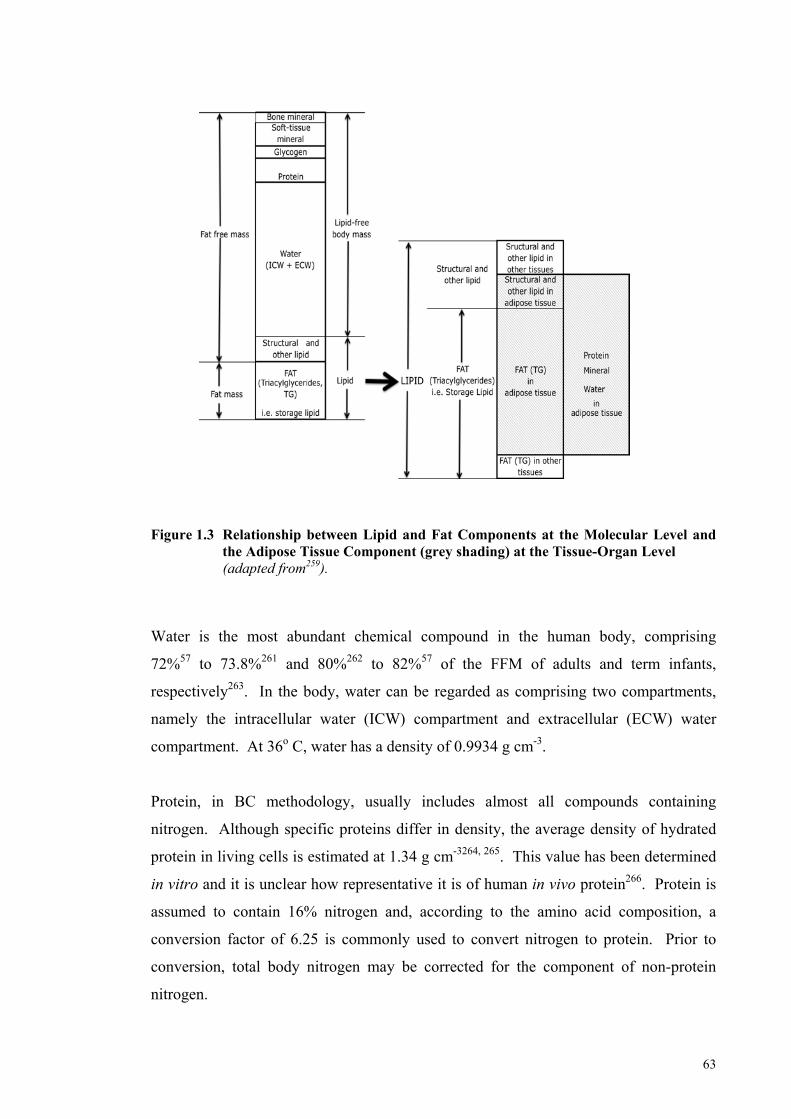
63
Figure 1.3 Relationship between Lipid and Fat Components at the Molecular Level and
the Adipose Tissue Component (grey shading) at the Tissue-Organ Level (adapted from259).
Water is the most abundant chemical compound in the human body, comprising
72%57 to 73.8%261 and 80%262 to 82%57 of the FFM of adults and term infants,
respectively263. In the body, water can be regarded as comprising two compartments,
namely the intracellular water (ICW) compartment and extracellular (ECW) water
compartment. At 36o C, water has a density of 0.9934 g cm-3.
Protein, in BC methodology, usually includes almost all compounds containing
nitrogen. Although specific proteins differ in density, the average density of hydrated
protein in living cells is estimated at 1.34 g cm-3264, 265. This value has been determined
in vitro and it is unclear how representative it is of human in vivo protein266. Protein is
assumed to contain 16% nitrogen and, according to the amino acid composition, a
conversion factor of 6.25 is commonly used to convert nitrogen to protein. Prior to
conversion, total body nitrogen may be corrected for the component of non-protein
nitrogen.
64
Mineral describes a category of inorganic compounds that is usually divided into two
subcategories: osseous (bone) mineral and non-osseous (soft-tissue) mineral. Bone
mineral, the largest component of which is calcium hydroxyapatite, contains >99% of
total body calcium and 86% of total body phosphorus267. The density of bone mineral is
2.982 g cm-368. Other elements, such as potassium, sodium and chloride are primarily
found in soft-tissue mineral, the density of which has been estimated at 3.317 g cm-368.
Ash, a term similar to mineral, is a common component described in chemical studies of
the human body. By definition, ash is the residue of a biological sample heated for a
prolonged period to >500o C259 and consists of the non-volatile portion of mineral
compounds. Total body ash is slightly lower in weight than mineral mass because of
the loss of carbon dioxide from some carbonate groups and the release of tightly bound
water during the heating period259, 264, 267.
The carbohydrate component of BC is in the form of glycogen with a density of
1.52 g cm-3. Cadaver studies do not consider glycogen because of its relative amount in
the body (~300 g to 500 g in an adult) and its rapid, post-mortem autolysis268.
Lipid includes all the biological matter in the body that is extractable with organic, lipid
solvents. There are approximately 50 different lipids present in the human body,
including triglycerides, phospholipids and sphingolipids, and steroids269.
Physiologically, lipids can be categorised as essential (e.g. structural lipids in
membranes) and non-essential (storage lipid), based on their distribution and function in
the body. However, the solubility of essential and non-essential lipids in organic
solvents are similar and therefore, approximate separation can only be accomplished by
careful selection of the type of tissue analysed, the type of solvent used and by the
extraction time and temperature269.
For example the simple lipid triglyceride, a term synonymous with fat, is considered a
non-essential or storage lipid; its role is to provide thermal insulation and a reserve
depot of mobilisable fuel. Triglycerides are non-polar and are usually bound in tissues
by weak Van der Waals forces or hydrophobic bonds and can be extracted with ether
and other non-polar solvents269, 270. In the adult, approximately 90% of the total body
lipid is triglyceride and it accounts for 99% of ether-extractable lipid. The average
density of fat is 0.9007 g cm-3 at 36o C and studies in animals suggest this is uniform
across body sites271 and is likely to be reasonably accurate and stable between
subjects68.
65
Structural and other lipids, such as sphingomyelin and phospholipids (essential lipid),
form part of cell membranes and comprise about 10% of total body lipid, but <1% of
ether, extractable lipid, assuming ideal body weight. They are more polar, and may in
part be bound to proteins by hydrogen bonds and electrostatic associations that require
polar solvents, such as acetone and methanol for disruption and extraction269, 270, 272.
Cellular Level
At the Cellular level (Level III), the body is categorised into three compartments:
(i) cells;
(ii) extracellular fluid; and
(iii) extracellular solids (mainly bone).
The cells can be further partitioned into two compartments, comprising fat and the
actively metabolising component at the cellular level of BC, body cell mass (BCM)
(Table 1.10).
Tissue-organ Level
At the Tissue-organ level (Level IV), the major components are adipose tissue, skeletal
muscle, visceral organs and bone. Although the terms ‘adipose tissue’ and ‘fat’ are
often used interchangeably, they are not synonymous. In the central model of BC, each
is represented at different levels and is distinct and different components. As mentioned
previously, storage fat is synonymous with the term triglyceride. It is found primarily
in adipose tissue, but also in skeletal muscle, the liver and other organs, particularly in
pathological conditions. Adipose tissue contains adipocytes, extracellular fluid, nerves,
connective tissue and blood vessels in addition to storage fat (Table 1.10 and Figure
1.3).
2.2.2 Principles of Body Composition Measurement
Wang et al.260 suggests that the basic principle of in vivo BC methods can be described
by the following formula: C = f (Q), where C is an unknown component,
Q a measurable quantity and f a mathematical function.
There are 3 types of components: C1: Property-based; C2: Component-based; and
C3: Combined, and two types of functions: Type I and Type II.
66
In property-based methods, the measurement of a property is used to estimate an
unknown component (C1). This method is illustrative of an indirect method of
assessment68. Property-based methods include the decay profile of radioactive isotopes,
impedance, x-ray attenuation, electrical resistance and skin folds. Two properties are
sometimes used together to discriminate between components, as in air displacement
plethysmography and hydrostatic weighing, in which body volume and weight are used
to estimate two unknown components, FM and FFM. Approximately half of the 30 or
more major body components can be measured in this way260.
Component-based methods allow an unknown component to be quantified from known
property-derived components; thus, a property-based method must first be used to
estimate the unknown component260. This method is illustrative of a doubly indirect
method of measuring BC. The underlying assumption of component-based methods is
that a stable quantitative relationship exists between unknown and known components.
For example, FFM can be derived from TBWater by assuming that for healthy adults,
73% of FFM is water264.
Combined-based methods use a combination of measurable properties and known
components to estimate unknown components260. Siri266 used this method in
quantifying total FM from body weight and volume, which are two measurable
properties, as well as the known component, TBWater.
In each of these methods, a mathematical function relates the measurable quantity to the
unknown component. Wang260 suggests there are two types of mathematical functions
used in in-vivo BC methodology: Type I and Type II.
Type I methods typically use a reference method to quantify the unknown component
and then use statistical methods, such as regression analysis, to develop an equation for
predicting the unknown component from a property or property-derived component
e.g. skin folds, or both. Type I methods are population and condition-specific and need
to be revalidated when either used in new populations or under different conditions
from which they were originally developed260.
Type II methods typically incorporate constant ratios or proportions into models that
relate the unknown component to the measurable property (known component). The
67
validity of Type II methods rests largely on the validity of the assumptions
underpinning the models260.
The application of these methods and principles has been applied to the in vivo BC
measurement of infants and children. The methods used to develop the first male and
female reference infants, and their changing BC from birth to 10 years, is the
quintessential example of how these basic principles can be applied to the study of BC.
These reference data have been used to develop software for current BC measurement
techniques and applied to the measurement of infants65, 262, 273.
2.2.3 The Reference Infant
Fomon and his colleagues262 estimated the changing BC of the male and female
reference infants from birth up to 10 years of age, using age-specific constants. The
authors reasoned that, by this method, increments in specific body components
associated with growth at various ages could be estimated.
Weight and length data of children from birth to 10 years were obtained by interpolating
between two datasets:
(i) the authors’ longitudinal data of both male and female infants from birth to
four months; and
(ii) the median weight and length data for children from three to 10 years from
the National Centre for Health Statistics274.
Using a variety of methods and other datasets, including that of the nine-year-old
reference boy, BC was specified at three-ages for each sex (males: birth, 6 months and
9 years, with extrapolation to 10 years; females: birth, 6 months and
10 years) and then interpolations were employed to obtain values for other ages.
The BC model used by Fomon et al.262 can be described by the equation:
BM = FM + W + Ptn + Mo + Ms + Gly
Using this model, the following assumptions were made:
68
(i) TBWater calculated from deuterium space requires an adjustment of 1.3%
for the exchange of deuterium with the rapidly exchangeable hydrogen of
organic molecules (Burmeister, 1962)275.
(ii) Body potassium and body water occur in a fixed ratio in the extracellular
compartment (4 mEq/kg) (Pitts, 1974) and in the cellular compartment (150
mEq kg-1) (Forbes, 1975)275.
(iii) The weight of the mineral concentration in ECW and ICW is 9.4 g kg-1 water
(Burmeister, 1961) and 9.0 g kg-1 water (Cheek, 1966), respectively275.
(iv) The ratio of body calcium to height is relatively constant from 7 to 14 years
of age (2.52 g cm-1) (Christiansen, 1975)275.
(v) The concentration of osseous (bone) mineral in FFM is constant from birth
to age 12 months262.
(vi) Calcium accounts for 34% of osseous mineral261.
(vii) The ratio of nitrogen to potassium concentration in the newborn is
469 mg mEq-1 65.
(viii) The ratio of nitrogen to potassium concentration in the adult is
461 mg mEq-1 276.
(ix) Protein is 16% nitrogen.
(x) Glycogen accounts for between 0.5% (Levine, 1964)275 and 0.6%262 of FFM.
(xi) Density of fat is 0.9007 g mL-1 261.
Specifically, at birth, the data of Widdowson277 were used to obtain values of fat,
protein (16% N) and calcium. As this data was not presented as gender-specific, FFM
was assumed to be the same in both sexes. The authors assumed that the ratio of fat to
body weight was the same as the ratio of truncal skin fold thickness to body weight, as
documented by McGowan et al.278. Total body water was calculated from the
deuterium dilution data of Yssing & Friis-Hansen279 and ECW from the thiosulfate
69
space data of Burmeister (1962 and 1961)262. Thiosulfate fails to penetrate the
transcellular space and therefore underestimates ECW280.
At six months, Fomon et al.262 estimated the BC of the male and female reference
infants using their own data on TBWater281 and the data of Romahn and Burmeister for
TBK (Romahn, 1977)282. This data ranged in age from 122 to 242 days, and clustered
mostly around the age of six months. The authors assumed the ratio of nitrogen to
potassium was equivalent to the adult and obtained total body protein by adding the
increment in total body protein from birth to age six months to the protein content at
birth. The concentration of bone (osseous) minerals in FFM was assumed to be
constant from birth to 12 months of age. Further, non-osseous minerals were calculated
from the known concentrations in ECW and ICW, the latter two components being
calculated from TBWater and TBK. Fat free mass was calculated as the sum of weights
of water, protein, minerals and glycogen, and FM was calculated by difference.
The male 9-year-old reference boy was established by Haschnke, Fomon and Zeigler275
using TBW and TBK data of boys aged 7 to 11 years, obtained by different
investigators over a period spanning more than a decade (Friss-Hansen, 1957; Forbes et
al., 1968; Cheek ,1966; Edelman et al., 1952)275. Based on the data from Dickerson283,
it was assumed the ratio of body calcium to height was relatively constant from 7 to 14
years of age284. Glycogen was incorporated into the water compartment, and utilising
the densities of body components, as summarised by Brozek261, the authors calculated
the 9-year-old reference boy’s body density, FFM density (FFMD), and derived FM.
Fomon et al.262 felt it could be reasonably assumed that at each age the fat content of the
body, expressed as a percentage of body weight, was proportional to the thickness of
truncal (subscapular and suprailiac) skin folds, as documented by Karlberg et al.
(1976)262. Thus, assuming the existence of a linear relationship between the proportion
of fat to body weight at 6 months and 9 years284, the authors obtained a value for body
fat based on skin fold thickness for each age from 3 months to 10 years. They also
assumed that the ratio of nitrogen to potassium concentration of tissue gained between
birth and age 9 years was 461 mg/mEq. Fomon et al.262 used the 9-year-old reference
boy275, interpolated the data from the 6-month-old reference male to obtain reference
data for the ages in-between, and then extrapolated the data to complete the reference
male from birth to 10 years of age.
70
The composition of the 10-year-old reference girl was developed in a similar way to the
9-year-old reference boy, using a variety of gender-appropriate data (Christiansen et al.
1975, Young et al. 1968, Forbes 1972)262. The authors then interpolated the data from
the 6-month female reference infant to obtain female reference data for the other ages,
and thus completed the reference female from birth to 10 years of age.
Their male reference term infant weighed 3545 g, was 51.6 cm in length and had a FM
of 486 g, contributing 13.7% to total body weight. Their female reference term infant
weighed a little less, at 3325 g, was 50.5 cm in length and her FM of 495 g contributed
14.9% to total body weight (Table 1.11).
Twenty years later, Butte and colleagues273 published an updated reference of BC
during the first two years of life, of infants with similar weights and lengths to those of
Fomon’s reference infants.
In choosing a prospective, longitudinal study design, these authors hoped to address
several of the limitations associated with the model of Fomon et al.262, which among
others were:
(i) the absence of data on TBWater, TBK and/or total body calcium at most
ages;
(ii) the necessity of using data from different laboratories;
(iii) the difficulty of relating 40K counts to TBK; and
(iv) the difficulty of translating results from two-dimensional photon
absorptiometry into total body calcium.
Butte et al.273 measured TBWater by deuterium dilution and TBK by 40K counting of
76 subjects at ages 0.5, 3, 6, 9, 12, 18 and 24 months. They determined BMC by DXA
at age 0.5, 12 and 24 months and prediction equations relating BMC to age, length and
TBK were derived to estimate BMC at other ages.
Similar assumptions to those made by Fomon et al.262 were used to derive
measurements for the other FFM components except in the model of Butte et al.273, a
4% adjustment was made for the deuterium exchange with the hydrogen in organic
71
molecules, glycogen was estimated as 0.45% of body weight and FM was calculated by
difference for all infants.
The authors presented data on FM, FFM and its components, as well as providing
calculated incremental growth rates partitioned into BC components (Table 1.11).
Their male reference infant at two-weeks weighed 3760 g, was 52.5 cm in length and
had a FM of 440 g, contributing 11.4% to total body weight. Their female
two-week-old reference infant weighed less, at 3640 g, was 52.0 cm in length and her
FM of 520 g contributed 14.2% to total body weight (Table 1.11). The BC of the
reference infant two weeks after term, is closer in composition to the reference fetus
than that of Fomon’s term infant (Table 1.11).
Fomon et al.282 acknowledged that the methods employed by Butte et al.273 to obtain
longitudinal measurements for TBWater and TBK and to measure BMC by DEXA were
superior to their own. However, on inspection of their dataset, Fomon and colleagues282
questioned whether female infants aged two weeks would have 22% greater fat content
than male infants and whether the 20% increase in the FM of males between two weeks
to three months of age was accurate, given it represented almost a gain in fat of 1.5 kg
in two and a half months and seemed to account for a very high percentage of the
weight gain over that period of time. The TBWater values of Butte et al.273 are almost
4% greater than those of Fomon et al. 282. Butte et al.273 argued that the underestimation
of deuterium exchange with the hydrogen in organic molecules in the study by Fomon
et al.282 may have accounted for these differences and suggested this could lead to an
underestimation of FM by 5-6%. Butte et al.273 estimated TBWater at 0.5 weeks by the
plateau method and for the remaining by back-extrapolation. In using the plateau
method, these authors failed to make adequate correction for water flux during the
equilibration period.
The validity of the bone mineral data of Butte et al.273 is dependent upon the validity of
BMC determinations by DXA and whilst these results have been defended by the
authors, the accuracy of the DXA measurement in estimating the BMC of children has
been questioned in recent times285-289. However, Butte and her colleagues273 reasoned
that by weight, BMC contributes only 2-4% of FFM and therefore contributes
substantially less error than that of TBWater, or indeed, TBK. Total body potassium
72
values for both males and females were up to 4% greater in the data of Fomon et al.262,
who used TBK data obtained during a time when equipment was unable to completely
resolve background interference during the 40K count, which may explain some of this
discrepancy. Fomon et al.262 and Butte et al.273 each derived protein content of the body
by assuming the ratio of nitrogen to potassium was 0.461 g/mEq and that protein
comprises 16% nitrogen. The discrepancies between their data have rather large
ramifications for correct interpretation of the two datasets.
As Fomon and colleagues262 had done 20 years earlier, Butte et al.273 used the densities
of body components, as summarised by Brozek261, and provided age and gender-
specific constants for converting body constituents into FFM density (FFMD) for
children during the first two years of life.
2.2.4 Air Displacement Plethysmography
Curvilinear equations using these FFMD constants262, 273 have been used in a
commercially available 2-C BC system (PEAPOD, Concord, Life Measurement Inc
[LMI], CA, USA) that uses air displacement plethysmography to measure the BC of
infants weighing between one to eight kilograms. Total body fat is estimated by the
direct measurements of body mass and volume and the application of gas laws and
densitometry principles. Correction by LMI is made for thoracic gas volume273, body
surface area290, surface area artefact (PEAPOD Infant Body Composition System
Operator’s Manual), as well as hydration changes291-297 that occur in the early days of
life. Body density is calculated from body mass (BM) and body volume (BV) and then
inserted into the standard formula for estimating the %FM. The age-specific FFMD
values of Fomon et al.282 have been used to create the default Fomon density model
used in the PEAPOD and the density values from Butte et al.273 have been used to create
the Butte density model as an alternative to the default. The precision and accuracy of
the PEAPOD has been evaluated298, 299 for use in infants.
Ma et al.298 conducted the first study in human infants using the PEAPOD. These
investigators attempted to validate the between and within day reliability of %FM
measurements obtained in infants of Asian and Caucasian ethnicity, using the Butte
density model273. The infants weighed between two and eight kilograms and
represented three weight groups (2-4 kg; 4-6 kg and 6-8 kg). Reliability was assessed
by comparing the %FM measurements obtained within the same day and between
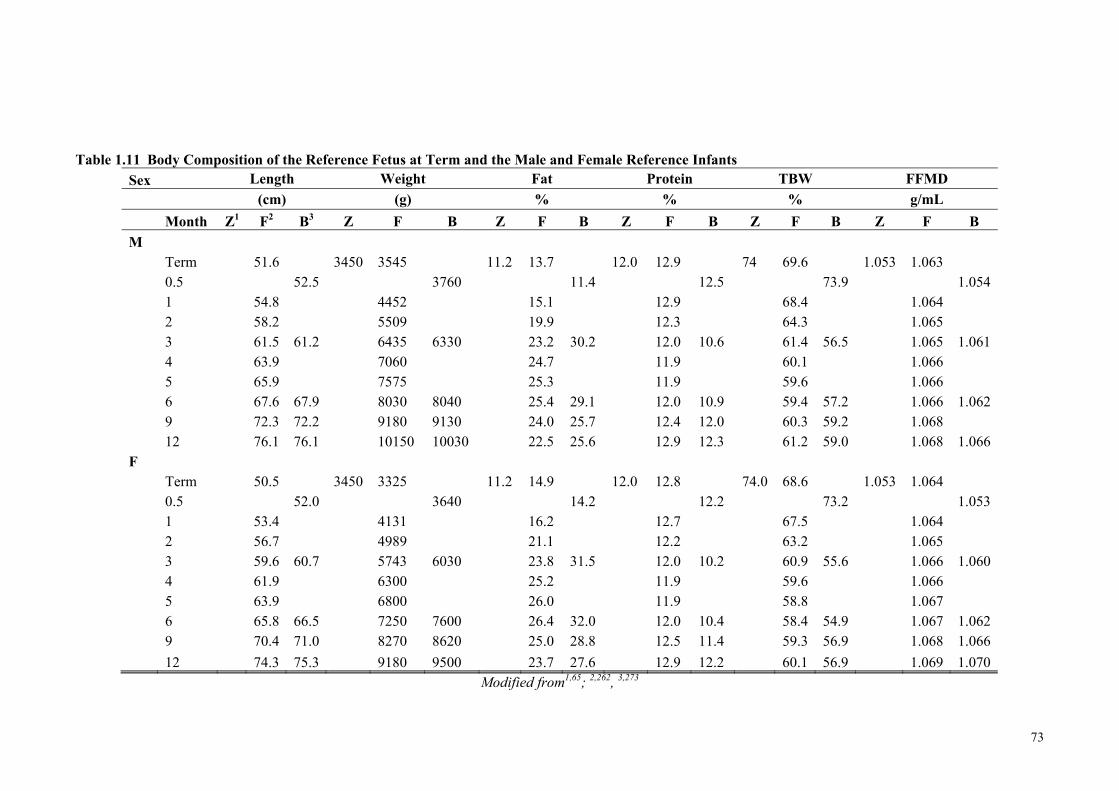
73
Table 1.11 Body Composition of the Reference Fetus at Term and the Male and Female Reference Infants
Sex Length Weight Fat Protein TBW FFMD
(cm) (g) % % % g/mL
Month Z1 F2 B3 Z F B Z F B Z F B Z F B Z F B
M Term 51.6 3450 3545 11.2 13.7 12.0 12.9 74 69.6 1.053 1.063 0.5 52.5 3760 11.4 12.5 73.9 1.054 1 54.8 4452 15.1 12.9 68.4 1.064 2 58.2 5509 19.9 12.3 64.3 1.065 3 61.5 61.2 6435 6330 23.2 30.2 12.0 10.6 61.4 56.5 1.065 1.061 4 63.9 7060 24.7 11.9 60.1 1.066 5 65.9 7575 25.3 11.9 59.6 1.066 6 67.6 67.9 8030 8040 25.4 29.1 12.0 10.9 59.4 57.2 1.066 1.062 9 72.3 72.2 9180 9130 24.0 25.7 12.4 12.0 60.3 59.2 1.068 12 76.1 76.1 10150 10030 22.5 25.6 12.9 12.3 61.2 59.0 1.068 1.066 F Term 50.5 3450 3325 11.2 14.9 12.0 12.8 74.0 68.6 1.053 1.064 0.5 52.0 3640 14.2 12.2 73.2 1.053 1 53.4 4131 16.2 12.7 67.5 1.064 2 56.7 4989 21.1 12.2 63.2 1.065 3 59.6 60.7 5743 6030 23.8 31.5 12.0 10.2 60.9 55.6 1.066 1.060 4 61.9 6300 25.2 11.9 59.6 1.066 5 63.9 6800 26.0 11.9 58.8 1.067 6 65.8 66.5 7250 7600 26.4 32.0 12.0 10.4 58.4 54.9 1.067 1.062 9 70.4 71.0 8270 8620 25.0 28.8 12.5 11.4 59.3 56.9 1.068 1.066
12 74.3 75.3 9180 9500 23.7 27.6 12.9 12.2 60.1 56.9 1.069 1.070 Modified from1,65; 2,262, 3,273
74
consecutive days of 36 term infants. Accuracy was evaluated by comparing %FM
measurements obtained by the PEAPOD with those obtained by deuterium dilution
technique, using age and sex-specific hydration coefficients for FFM, as derived by
Butte et al.273.
Mean difference in %FM PEAPOD measurements between (-0.501.21) and within
(0.161.44) days did not differ significantly. Between and within day differences in
%FM for individual subjects were (95% CI) -2.9, 1.9 %FM and -2.7, 3.1 %FM,
respectively, and the individual differences were not a function of FM. Mean within
subject standard deviations (SD) and coefficient of variations (CV) for %FM estimates
were 0.69 (0.60) %FM and 4.94 (0.62) %FM, respectively, for between day tests and
0.72 (0.72) %FM and 5.10 (0.65) %, respectively, for within-day tests. Behavioural
state and ethnicity (after correction for age, sex and body weight) did not appear to
significantly affect the reliability of the measurement. There were no significant
differences found within subject SD among the three body mass groups between or
within days. Interestingly, though, the corresponding within subject CVs for the 2-4 kg,
4-6 kg and 6-8 kg weight groups were 8.2 (7.5)%, 4.0 (2.3)% and 3.6 (2.9)%
respectively (P=0.09) for between day tests and 8.3 (9.5)%, 3.2 (3.3)% and 2.9 (1.5)%,
respectively (P=0.08), for within day tests, suggesting that the precision of the
measurement is a function of weight or size and the lighter or smaller the infant, the less
reliable the measurement.
Unfortunately, although the authors concluded that the PEAPOD is a reliable and
accurate instrument for determining %FM in infants, bias was introduced into their
methodology by utilising the data of Butte et al.273 in both methods to derive %FM.
Thus, whilst their study showed that the PEAPOD was able to provide reliable
measurements in infants weighing between two to eight kilograms, it is difficult to draw
any valid conclusions from this study with respect to the accuracy of the measurements.
In 2007, Ellis et al.299 obtained duplicate measurements with the PEAPOD, using the
Butte density model and compared the BC of 49 full-term male and female infants to
those measurements determined by a 6-C model, using the same model as Butte et al273,
but assuming the glycogen content was 0.5% of FFM. Fat mass was determined by
difference. Mean (SD) reliability of %FM values obtained for the PEAPOD was
0.4 1.3%. There was no significant difference between mean %FM determined by the
75
PEAPOD and by the 6-C method. The slope and intercept values obtained from linear
regression for % FM obtained by the two methods were 0.96 (95%CI: 0.80, 1.13) and
-0.005 (95% CI: -3.05, 3.04), respectively, with R2 = 0.73 and SEE = 3.7% BF.
Sex, age, ethnicity, body length and body weight had no significant effect on this
relation. The 95% limits of agreement from the Bland-Altman analysis were
-6.8 and 8.1% BF.
The authors concluded that the PEAPOD system provided a reliable and accurate
assessment of %FM in infants300. The accuracy of the PEAPOD measurement against
the 6-C model within individual infants was not reported.
It is noteworthy that initially, the Butte density model was the default density model in
the PEAPOD. In 2005, around the time when a group of investigators in northern Italy
began assessing the BC of preterm infants using the PEPAOD, it became apparent to
the manufacturers of this equipment that estimates of %FM calculated using the Butte
density model resulted in extremely low and sometimes even negative FM values301.
The manufacturers reviewed the methodology in the studies of both Fomon et al.262 and
Butte et al.273 and reasoned there were good grounds for changing the default to
Fomon’s density model:
(i) The infants participating in the study of Butte et al.273 were healthy, normally
growing, full term infants and the first BC measurements were not performed
until two weeks of age.
(ii) Whilst back extrapolation of density of FFM values determined at two weeks
and three months by Butte et al.273 would provide reasonable estimates of fat
(and this seems a reasonable mathematical approach), there is no direct
verification of its accuracy for preterm or term infants at birth nor for those with
restricted growth or birth abnormalities
(iii) The birth data used by Fomon et al.262 was based on chemical data from
Widdowson and Dickerson277.
Given that the reliability and accuracy of the PEAPOD measurements have been
evaluated298 and validated299 for infants weighing between 2-8 kg using the Butte
76
density model, it would seem that even in term infants, the PEAPOD is yet to
appropriately validated.
Over a recent period spanning over five years, Roggero and her group have studied the
BC of preterm infants, using the PEAPOD302-305. Gestational age and birth weight of
these infants were at most, 33 completed weeks and 1800 g, respectively.
Roggero et al.303 compared the growth of 35 growth restricted preterm infants with
26 appropriately grown preterm infants during the five-month period after discharge303.
All infants had been AGA at birth, and the parents recorded the daily volume of
enriched formula fed to their infants for the study period. Although not statistically
significant, the preterm infants who were growth restricted at corrected term age
consumed slightly higher intakes of protein and energy. The authors suggested that,
cumulatively, this difference in intake might have explained the post-discharge recovery
observed in the growth restricted infants by four and five months corrected age.
The effect of protein and energy intakes on the changing BC of 48 formula fed preterm
infants from term-corrected age to three months was studied by Roggero and her
colleagues305. Mean monthly intakes were calculated from daily records of formula
intake. The %FM increased significantly from 14.8 (4.3)% at term to 23.6 (6.1)%
during the first three months following discharge. Energy intakes were found to have
no effect on FM and a negative association was found with protein intake. During the
first month, infants with protein intakes of 2.6 g 100-1 kcal gained significantly less
weight than those who consumed less protein, but the change in FFM as a percentage of
weight gain was significantly higher. The authors concluded high protein intakes
resulted in a significantly different weight gain composition during the first month after
term-corrected age.
Rogerro et al.304 also compared the BC of 110 preterm infants with that of 87 term
infants to determine if postnatal growth and BC achieved by preterm infants was similar
to that of term infants at the equivalent term age. Parenteral and minimal enteral
feeding with expressed breast milk (assumed macronutrient composition) or preterm
formula was provided initially for a minimum of two weeks and, subsequently, fortified
breast milk (~2.7 g protein/100 kcal) or preterm formula (3 g protein/100 kcal), or both,
was fed until discharge. The PER of breast milk was assumed to be 1.56. Their results
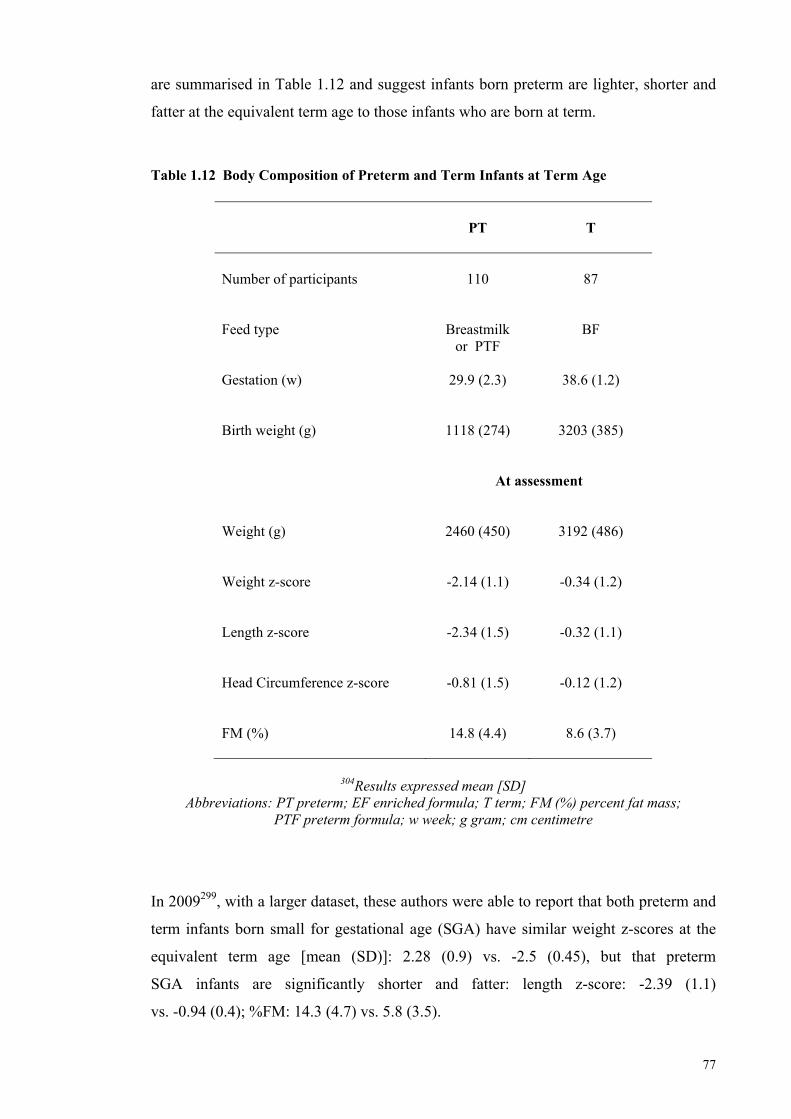
77
are summarised in Table 1.12 and suggest infants born preterm are lighter, shorter and
fatter at the equivalent term age to those infants who are born at term.
Table 1.12 Body Composition of Preterm and Term Infants at Term Age
PT
T
Number of participants
110
87
Feed type
Breastmilk
or PTF
BF
Gestation (w)
29.9 (2.3)
38.6 (1.2)
Birth weight (g)
1118 (274)
3203 (385)
At assessment
Weight (g)
2460 (450)
3192 (486)
Weight z-score
-2.14 (1.1)
-0.34 (1.2)
Length z-score
-2.34 (1.5)
-0.32 (1.1)
Head Circumference z-score
-0.81 (1.5)
-0.12 (1.2)
FM (%)
14.8 (4.4)
8.6 (3.7)
304Results expressed mean [SD]
Abbreviations: PT preterm; EF enriched formula; T term; FM (%) percent fat mass; PTF preterm formula; w week; g gram; cm centimetre
In 2009299, with a larger dataset, these authors were able to report that both preterm and
term infants born small for gestational age (SGA) have similar weight z-scores at the
equivalent term age [mean (SD)]: 2.28 (0.9) vs. -2.5 (0.45), but that preterm
SGA infants are significantly shorter and fatter: length z-score: -2.39 (1.1)
vs. -0.94 (0.4); %FM: 14.3 (4.7) vs. 5.8 (3.5).
78
In spite of its limitations, the PEAPOD offers a more direct measurement of BC than
that derived by skin folds, as body density is calculated from the direct measurements of
body mass and body volume.
2.2.5 Anthropometry
Dauncey et al.306 attempted to estimate the total FM of term infants by partitioning the
body and modelling it as five distinct cylinders. Using measurements of calliper skin
fold thicknesses, circumferences and lengths, they calculated the volume of the layer of
subcutaneous fat covering the body. The authors used the 2-C BC model, assumed
subcutaneous fat equated to total FM and assigned the density value of fat
(0.9 g mL-1 307) to derive FM. They employed the data of Brans et al.284 and determined
FFM by difference. In partitioning the body into connected cylinders to calculate body
volume, (volume of a cylinder = thickness of skinfold x length x circumference), the
following assumptions were made in relation to length and circumference
measurements:
Trunk = crown-rump length (minus the head sphere) and chest
circumference.
Lower limbs = supine length minus the crown-rump length and mean of the
circumferences measured at mid-thigh and calf.
Upper limbs = sum of the lengths of upper and lower arms and of the
circumferences of the upper and lower arms.
Dauncey and his colleagues306 assumed subcutaneous fat thickness was the skin fold
thickness minus a 2 mm allowance for the double layer of skin in the skin fold. They
further assumed that the subscapular skin fold was representative of the fat layer
covering the trunk, and that the triceps skin fold was representative of the subcutaneous
fat covering both the upper and lower limbs. Skin fold measurements by these authors
were slightly greater in female than male term infants and resulted in mean (SD)
estimates of %FM of 13 (1.7)% and 11 (2.0)%, respectively.
In 1993, Kabir and Forsum308 estimated total FM by measuring subcutaneous adipose
tissue (AT) by callipers and ultrasound and by measuring TBWater with 18O (hydration
constant 0.80262). They used the method of Dauncey et al.306 and then twice modified
79
the method after obtaining poor comparisons for estimation of %FM by callipers with
those obtained by body water dilution. Their first modification was to divide the skin
fold by two to obtain a single skin fold and to deduct 1 mm for the skin layer. Their
second modification was more technical. The trunk circumference became the mean of
hip and chest circumferences and arm circumference became the mean of upper arm and
forearm circumferences. Ten skin folds from 10 body sites were taken, each divided by
two, and 1 mm, representing the skin layer, was subtracted. The mean of the 10 skin
folds was taken as the thickness of the subcutaneous adipose tissue layer and the fat
content of adipose tissue was calculated at 0.66 g fat mL-1. Assuming TBW accurately
predicted TBF (1% correction for oxygen exchange not reported), Kabir and Forsum
concluded that skin fold measurements taken by callipers were poor predictors of TBF.
Kabir and Forsum308 repeated the subcutaneous fat measurements on these same infants,
using ultrasound. They compared the mean values for each of the 10 calliper skin folds
(including skin) divided by two, with those obtained by ultrasound (including skin) and
found no significant mean difference between the two sets of measurements. However,
ultrasound appeared to overestimate the calliper measurement at sites where the skin
was thick and underestimate the calliper measurement at the sites where the skin was
relatively thin. Calliper skin fold tissue compression at these sites may, in part, explain
these disparities, because ultrasound applies minimal tissue compression; however, it
cannot be determined from this study which method had greater accuracy. It is also not
known how relevant these results are today, as ultrasound technology has developed
substantially since 1990 and is now used extensively to measure fat thickness.
Olhager and Forsum309 also used calliper skin folds to derive estimates of total FM in
term infants (n=9) and preterm infants near term equivalent age (n=8), and calculated
body density and derived total FM according to the method of Westrate and
Durenberg310. They compared this data with reference estimates of total FM for the
same infants, derived from total FM measurement, using the doubly labelled water
technique. The authors had also estimated adipose tissue volume (ATV) by magnetic
resonance imaging (MRI) for these infants.
The retrospective analysis showed that total FM, measured by calliper skin folds and
total FM and ATV measured by MRI, yielded estimates for the term infant that
corresponded well to those for the preterm infant at near term equivalent age. However,
80
the difference in the estimation of total FM by calliper skin folds was significantly
different to that derived by isotope dilution. In general, these authors found the skin
fold method overestimated FM in lean individuals and underestimated it in fatter
infants. However, the authors derived FM from the difference between body mass and
FFM. They calculated the latter for both term and preterm infants by dividing TBWater
by age and gender-specific FFM hydration constants using the data of Fomon et al262.
The validity of this strategy is unclear, as it is not known how well the composition of
preterm FFM compares to that of the term infant. Further, as documented by
Schoeller280, the correction factor Fomon et al262 used to adjust for the exchange of
deuterium with the exchangeable hydrogen of organic molecules was underestimated,
resulting in an overestimate of TBWater and an underestimate of %FM273, 280. These
considerations may potentially confound the strength of these authors’ evaluations309.
2.2.6 Magnetic Resonance Imaging (MRI)
A limitation of assessing adipose tissue (AT) and FM using calliper skin folds, air
displacement plethysmography and to some extent, ultrasound, is that these methods
fail to differentiate and quantify depots of fat within the body. Adipose tissue MRI
permits assessment at the molecular and tissue/organ levels of the central BC model (p
p 60, Table 1.9) by enabling the direct quantification of adipose tissue located both
subcutaneously and internally, with further differentiation in the abdominal and non-
abdominal regions311.
The MRI technique has been validated in adults using human cadavers and chemical
analysis of weighed and dissected tissue312. Abate et al.312 estimated subcutaneous and
adipose tissue mass of three human cadavers with MRI and compared the results to
those obtained by direct weighing of the same subcutaneous and intra-abdominal
adipose tissue after dissection. Using the values for fat, water and protein content of
adipose tissue, obtained by Thomas in 1962313, Abate and colleagues claimed high
congruency between the two methods, with a mean difference of 76 g
(95% CI): 5 g -147 g) and limits of agreement between 66 g and 318 g. The precision
with which estimates of adipose tissue mass were made by MRI in the subcutaneous,
intra-abdominal, intra and retro-peritoneal regions ranged from 0.4 to 13.7%.
Researchers in Sweden and London have used MRI to assess the BC of preterm and
term infants314-319. The MRI equipment, spin-echo sequence and slice and interslice
81
thickness has varied between studies, as have the methods of AT assessment and the
way in which results are presented. For example, Olhager and her colleagues used a
Signa, General Electric, 1.5 tesla. Their scanning procedure started from the cervical
spine (C7) and 16 transaxial images (T1-weighted, spin echo imaging sequence,
repetition time 700 ms, echo time 12 ms 2 acquisition, matrix 512 x 256,
8 mm thick) were taken during a six minute period. Adipose tissue area was identified
using computer software that required definition of the AT area by an observer. In their
first two studies315, 320, these authors estimated %FM of infants on the assumption that
adipose tissue volume comprised 0.66 g fat mL-1308. This assumption is based on
limited data and is perhaps the reason why the authors reported fat depot distribution in
relation to total ATV rather than FM in a later study308.
Harrington et al.316, 319 and Uthaya et al.311, both members of the London research
group, used an Eclipse 15T Marconi Medical System scanner and a Phillips 1.5 Tesla
system, respectively, to perform their scans. Forty to fifty whole body, transverse
images (T1-weighted, spin echo imaging sequence, repetition time 600 ms, echo time
16 ms, field of view 24 cm, number of signals average 2, 256 x 256 matrix, 5 mm thick
transverse images, 5 mm gaps between slices) were taken in each study. Interactive
computer software was used to identify adipose tissue area and, in accordance with
Olhager’s earliest studies315, 320, Harrington et al.316 assumed AT contained
0.66 g fat mL-1. Later, both Harrington et al.319 and Uthaya et al.311 assumed the density
of AT was 0.9 g cm-3 and that one gram of adipose tissue contained 0.45 g lipid321.
Harrington et al.319 expressed their results both in terms of absolute AT content and then
calculated AT mass and expressed it as a percentage of body weight. Uthaya et al.311
reported results in relation to total AT mass.
In a comparison study of 25 appropriately grown (AGA) and 10 growth restricted (GR)
term born infants, Harrington et al.319 found that whilst intra-abdominal adipose tissue is
not reduced in GR infants (AGA: 23.43.85% vs. GR: 17.72.17%; p=0.003), their
lower mean proportion of adipose tissue could be mainly attributed to a smaller
proportion of subcutaneous AT mass (AGA: 21.443.81 vs. GR: 16.132.2; p=0.004).
No gender differences were found in AT mass in either group. These preliminary
studies in preterm infants suggest total adiposity is similar to term infants at an
equivalent term age, but that AT distribution is altered, with more located
intra-abdominally318.
82
Over time, reported intra-observer coefficients of variation would suggest the precision
of MRI methodology and technique is improving. In recent months, a new quantitative
nuclear magnetic resonance (QMR) instrument (QMR, EchoMRI-AH small)
specifically designed to measure BC in infants and adults within a weight range
between 3-49 kg, was calibrated and validated, using piglets, and found to provide both
precise and accurate measures of FM, FFM and TBWater in piglets weighing between
3-50 kg322. However, assessment of the MRI images is a time consuming task and is
open to bias. For example, the area and volume of AT can be defined by computer
software integrated into or external to the MRI equipment, mapped by an observer, or
both.
To date, there has been no validation of AT MRI measurement in infants against a
criterion method and therefore, the accuracy of the measurement is still to be
determined. It is not clear if the accuracy of the AT measurement is affected by the
measurement procedure employed, however this consideration needs some exploration,
as an interslice thickness of 3.2 mm was recently found to be more sensitive than
7.5 mm for detecting liver lesions323.
Whilst further developing and progressing the AT-MRI technique would appear to be
the way forward, especially as it can quantify and assess whole body AT distribution, it
remains an expensive method with which to assess BC. It lacks portability; an
important limitation for preterm infants.
2.2.7 Ultrasound
In recent years, ultrasound has increasingly been applied to the quantification of adipose
and muscle tissue at the molecular level of the central BC model, using the 2-C model
(p 61, Table 1.9). The ultrasound image is created by high frequency sound waves
(2-18 MHz), which are attenuated as they travel through tissue and are reflected back to
the transducer. Unlike calliper skin folds, ultrasound has been used to measure the
depth (cm) and area (cm2) of both adipose and muscle tissue at defined anatomical sites
in both fetuses324-326 and infants, and it can also be used to measure abdominal fat
distribution327.
In 1997, Bernstein and colleagues328 studied the accretion of skeletal muscle tissue and
deposition of subcutaneous AT in 25 fetuses through gestations 19 to 40 weeks, who
83
subsequently delivered with normal birth weight distribution at term. Specifically,
these authors examined adipose and muscle tissue accretion in the mid-upper arm and
mid-thigh regions. They chose to model the data with 2nd order polynomial equations
and concluded that in the limbs, both adipose (p<0.001, R2=0.80) and muscle tissue
(p<0.0001, R2 0.86) accretes with increasing gestational age and that maternal age and
pre-pregnancy weight were significant covariates in the accretion of adipose tissue.
In a cross-sectional Italian study, Larciprete et al.325 performed ultrasound scans on
218 women who were considered healthy on the basis of a negative glucose tolerance
test. Scans of the subcutaneous tissue in the subscapular, mid-arm, mid-thigh and
abdominal regions were taken from 20 weeks gestation in three-weekly ranges
(i.e. 20-22 weeks; 23-25 weeks, 26-28 weeks etc.) until delivery at term. These authors
constructed time specific reference ranges for the areas of adipose and muscle tissue
accretion at the mid-arm and mid-thigh and for the depth of subcutaneous AT.
Larciprete et al.324 later demonstrated in growth restricted fetuses, that subcutaneous
abdominal and subscapular AT and mid-arm adipose and muscle tissue were sensitive
to metabolic impairment, thus indicating site-specific changes in fetal body
compartments as a result of chronic metabolic aberrations.
In 2009, as part of the Generation R, prospective cohort study, Holzhauer et al.327
adapted the ultrasound method that was used to measure abdominal AT distribution in
adults329, 330, to infants and studied its reliability. Measurements of depth and area
of one and two centimetre lengths were taken of the AT layer to assess preperitoneal
and subcutaneous AT thickness. Reproducibility of intra and inter-observer agreement
ranged between 0.89 to 0.97 and 0.90 to 0.96, respectively. Female infants had greater
amounts of subcutaneous AT compared to male and in the second year of life, compared
to the 45% increase in the thickness of the preperitoneal AT layer, the subcutaneous AT
layer showed very little change. The authors concluded that their adapted method of
measuring central subcutaneous and preperitoneal AT by ultrasound was reproducible
and was potentially useful for investigating AT distribution in the early years of life.
In 2009, Ahmad and colleagues331 used ultrasound to show that area measurements of
adipose and muscle tissue in the right lower calf of term infants was significantly
greater than in preterm infants at the equivalent term age and that the measurements
84
correlated well with regional and whole body estimates of FFM and FM obtained by
DXA.
These studies suggest that ultrasound can be used to measure BC and distribution, and
may potentially be a practical way forward for providing a means for routine early
assessment of BC. Ultrasound equipment is portable; the images can be taken at the
bedside, the method is non-invasive, free from radiation, and (compared to other
imaging techniques), is relatively efficient and inexpensive. For these reasons the use
of ultrasound to determine BC in preterm infants would seem an obvious next step by
which to explore suitable methods for measuring preterm infant BC.
2.2.8 Dual Energy X-ray Absorptiometry
DXA measures soft tissue, bone and FM at the molecular level of the central BC model,
and thus is based on the 3-C model. For some time, it was considered the ‘gold
standard’ for measuring BC. However, instrument specific calibration is a problem and
the method is subject to error if an infant moves. Furthermore, the DXA measurement
assumes a constant hydration, and therefore may inaccurately assess the lean tissue
component of some subject groups, including preterm infants. Discrepancies in
paediatric and infant software and scan acquisition techniques leading to incorrect bone
mineral and lean and FM assessment have been identified285, 287-289, 332, 333. As recently
as this year, DXA (using the infant and adult scan programs) was found to overestimate
FM by an average of 15% when compared to whole body chemical analysis of
piglets322.
Nonetheless in 1998, Rigo et al.334 validated DXA against chemical studies of piglets
with body weights between 1408 and 5151 g and determined an equation (specific to
their instrument) to correct the FM measurement. Using DXA, Rigo and his colleagues
established reference values of BC of healthy preterm infants at birth, which were
comparable to fetal reference values.
In accordance with MRI data318, the most recent preterm infant BC data obtained by
DXA suggests that compared with infants born at term, preterm infants have altered BC
at an equivalent age335. Cooke and his colleague335 found that both global and central F
near term were greater in the more immature infants and in females compared with
85
males. As opposed to the British reference standards for term infants, preterm infants
near term had greater FM and %FM.
Further development of this methodology is required before it can again be considered
‘the gold standard’ for measuring BC in neonatal and paediatric settings. Regardless, its
use may be limited because it exposes the infant to small amounts of ionising radiation
and the equipment is not portable and expensive.
2.2.9 Bioelectrical Impedance
Bioelectrical impedance analysis (BIA) is a method that is used for the measurement of
ionic electrical conduction of soft tissue. It is based on the assumption that the body is a
cylinder of constant length (in adults at least) and cross-sectional area and the
impedance (Z) to an electric current through the body is directly related to the length of
the conductor and inversely related to its cross-sectional area336. Tissues rich in water
and electrolytes are more resistant to the passage of an electrical current compared with
adipose tissue337. The capacity of impedance to estimate change in BC in adults has
been challenged338 and data are influenced by the hydration coefficient of FFM, so that
the precision and accuracy of measurements obtained by BIA have been questioned339.
In preterm neonates, weight was found to be a more effective predictor of FFM, as
assessed by DXA, than impedance index. However, as previously discussed, DXA is
not a criterion method and further evaluation of the BIA method for use in the neonatal
setting is warranted and would be welcomed, as it represents a method that could be
used at the bedside from birth.
2.2.10 Other Techniques
Underwater weighing, computed tomography and neutron activation are other methods
currently being used to measure BC, but their application is less than ideal for
measuring the BC of infants and therefore will not be discussed in this thesis.
In summary, the in vivo measurement of BC at the different levels of the central BC
model can be achieved using a variety of techniques. Many of these techniques were
originally designed to measure the BC of adults. More recently, several have been
adapted to the measurement of infants and children. The methodologies underpinning
each of these methods differ, and the results are derived using various reference data,
86
constants and assessment techniques, making synthesis of data difficult. Specific
reasons for erroneous interpretation and synthesis of data are summarised below:
All methods lack appropriate validation.
Anatomical and regional landmarks used for calliper measurements and imaging
techniques are not well defined and differ between studies.
Hardware and software arrangements and algorithms differ within and between
instruments and sites; lack of cross-validation of instruments means that
generated data cannot be directly compared (e.g. direct comparison of data
between DXA, PEAPOD and MRI).
Scanning procedures differ between instruments and between sites (e.g. MRI
scanning sequence; regional vs. whole-body scanning).
Quantification of body compartments may be computer based, observer based or
an interaction of both, depending on equipment and research site (e.g. MRI).
New techniques have used constants based on infant reference data262, 273. Some
reference data have been acknowledged by the authors themselves to be
“preliminary and crude”262 and the accuracy of the updated reference data has
been questioned 273.
The value used to represent the fat content of adipose tissue varies between
studies.
Results from studies are not presented in a standardised form, making synthesis
of data difficult (e.g. ATV from MRI vs. FM from PEAPOD).
Reference data is not standardised within and between methods (e.g. Data
generated from PEAPOD measurements may have used either the Fomon
density model or the Butte density model).
Body composition assessment will have greater applicability to the assessment of
nutrition adequacy if the methods are appropriately validated against an agreed criterion
method, if standardised measurement procedures and standardised units of measurement
87
are developed and implemented and if results are presented in a form that permits
meaningful comparison between datasets.
Further development of safe, efficient, portable and inexpensive BC techniques, based
on sound methodology and validated against criterion methods will permit more
accurate and precise assessments of nutrition adequacy and growth outcomes of all
infants.
Meanwhile, the data generated from current techniques employed for BC measurements
in infants need to be carefully interpreted. Longitudinal data obtained from serial
measurements of infants using the same instrument, mapping changes in composition of
growth over time, are most useful.
2.3 Conclusion
Survival at increasingly younger gestations51 translates to increased risk of morbidity
and mortality340, protracted and recurrent hospital stays341 and high economic
burden342-347. More than one million infants die every year because they are born
preterm, and those who survive are at increased risk of cerebral palsy, blindness,
hearing loss and delayed brain development348. The implications are greater for those
who are born small for gestational age (SGA) or growth restricted, or both349-351. In
Australia, infants born weighing less than 1000 g incur average costs of up to
$AUS 150,000 and average length of stay is 78 days352. Infants born before 26 weeks
gestation can spend at least 111 days in hospital and accrue intensive care costs of more
than $US 160,000353. Whilst research is needed to find the interventions that are
effective at preventing preterm births, it is imperative that low cost and effective care is
provided for surviving preterm babies, including the provision of adequate nutrition348.
Although advances in technology and clinical expertise have resulted in improved
medical management, knowledge about how best to nourish and grow preterm infants is
limited. The frequency with which preterm nutrition guidelines are reviewed130, 148-153
and the notable lack of evidence upon which these recommendations are based, is
testimony to this. Protein and energy intakes are not accurately measured in routine
clinical care, though it is suggested nutrition targets are rarely achieved and protein
intakes are suboptimal253. As a result, nutrition deficits accrue and growth restriction
rates are high, features common across centres354. As fortified human milk is
88
recommended108, 109 and is the feed of choice98, closer scrutiny of how best to fortify
milk feeds is warranted to ensure the quantity and proportion of energy and protein
provided to preterm infants meet targets65. Attempts to catch-up growth rather than
preventing growth delay results in altered adiposity325, 326 and current theories35-38
suggest suboptimal growth and altered BC early in life increases risk for obesity,
metabolic abnormalities and late-onset chronic disease. Latest nutrition
recommendations109, 130 consider BC an important measure of nutrition adequacy, but its
measurement in preterm infants is difficult in the clinical setting, especially in the
neonatal intensive care unit. Research focus is now directed towards improving preterm
growth outcomes with feeding regimens that will deliver adequate nutrition from birth.
Ideally, BC measurement methods will continue to be improved, such that the success
of these feeding regimens can be assessed in relation to the type of growth achieved.
Developing new methods to assess serial changes in BC from birth are needed.
89
2.4 References (Literature Review)
1. McCance RA, Widdowson EM. The determinants of growth and form. Proc R Soc Lond B Biol Sci. 1974; 185: 1-17. 2. Widdowson EM, RA M. Some effects of accelerating growth. I. General somatic development. Proc R Soc Lond B Biol Sci. 1960; 152: 188-206. 3. Kennedy GC. The development with age of hypothalamic restraint upon the appetite of the rat. J Endocrinol. 1957a; 16: 9-17. 4. Widdowson EM. Changes in pigs due to undernutrition before birth, and for one, two, and three years afterwards, and the effects of rehabilitation. Adv Exp Med Biol. 1974; 49: 165-81. 5. Ozanne SE, Hales CN. Lifespan: catch-up growth and obesity in male mice. Nature. 2004; 427(6973): 411-2. 6. Cleal JK, Poore KR, Boullin JP, Khan O, Chau R, Hambidge O, et al. Mismatched pre- and postnatal nutrition leads to cardiovascular dysfunction and altered renal function in adulthood. Proc Natl Acad Sci U S A. 2007; 104(22): 9529-33. 7. Widdowson E. Changes in body proportions and composition during growth. In: Davis J, Dobbing J, editors. Scientific foundations of paediatrics. Philadelphia: WB Saunders Co; 1974. 8. Widdowson EM, McCance RA. A review: new thoughts on growth. Pediatr Res. 1975; 9(3): 154-6. 9. McCance RA. Critical periods of growth. Proc Nutr Soc. 1976; 35(3): 309-13. 10. McCance RA. The effect of malnutrition on growth, metabolism and final form. Indian J Med Res. 1971; 59(6 Suppl): 123=31. 11. Winick M, Noble A. Cellular response in rats during malnutrition at various ages. J Nutr. 1966; 89(3): 300-6. 12. McCance RA, Mount LE. Severe undernutrition in growing and adult animals. 5. Metabolic rate and body temperature in the pig. Br J Nutr. 1960; 14: 509-18. 13. Ablett JG, McCance RA. Severe undernutrition in growing and adult animals. 19. The metabolic rates and body temperature of calorie-deficient and protein-deficient pigs. Br J Nutr. 1969; 23(2): 265-9. 14. Mount LE, Lister D, McCance RA. Severe undernutrition in growing and adult animals. 11. The final effects of rehabilitation on the metabolic rate and body temperature. Br J Nutr. 1963; 17: 407-13. 15. Widdowson E. Intrauterine growth retardation in the pig. 1. Organ size and cellular development at birth and after growth to maturity. Biol Neonate. 1971; 19: 329-40. 16. Widdowson E, Mavor W, McCance R. The effect of undernutrition and rehabilitation on the development of the reproductive organs: rats. J Endocrinol. 1964; 29: 119-26. 17. Dobbing J, Sands J. Comparative aspects of the brain growth spurt. Early Hum Dev. 1970; 3: 79-83. 18. Kyle UG, Pichard C. The Dutch Famine of 1944-1945: a pathophysiological model of long-term consequences of wasting disease. Curr Opin Clin Nutr Metab Care. 2006; 9: 388-94. 19. Ravelli AC, van Der Meulen JH, Osmond C, Barker DJ, Bleker OP. Obesity at the age of 50 y in men and women exposed to famine prenatally. Am J Clin Nutr. 1999; 70(5): 811-6. 20. Roseboom TJ, van der Meulen JH, Osmond C, Barker DJ, Ravelli AC, Schroeder-Tanka JM, et al. Coronary heart disease after prenatal exposure to the Dutch famine, 1944-45. Heart (British Cardiac Society). 2000; 84(6): 595-8.
90
21. Roseboom TJ, van der Meulen JH, Osmond C, Barker DJ, Ravelli AC, Bleker OP. Plasma lipid profiles in adults after prenatal exposure to the Dutch famine. Am J Clin Nutr. 2000; 72(5): 1101-6. 22. Susser E, Hoek HW, Brown A. Neurodevelopmental disorders after prenatal famine: The story of the Dutch Famine Study. Am J Epidemiol. 1998; 147: 213-6. 23. Ravelli AC, van der Meulen JH, Osmond C, Barker DJ, Bleker OP. Infant feeding and adult glucose tolerance, lipid profile, blood pressure, and obesity. Arch Dis Child. 2000; 82(3): 248-52. 24. Roseboom TJ, van der Meulen JH, van Montfrans GA, Ravelli AC, Osmond C, Barker DJ, et al. Maternal nutrition during gestation and blood pressure in later life. Journal of Hypertension. 2001; 19(1): 29-34. 25. Painter RC, Roseboom TJ, van Montfrans GA, Bossuyt PM, Krediet RT, Osmond C, et al. Microalbuminuria in adults after prenatal exposure to the Dutch famine. J Am Soc Nephrol. 2005; 16: 189-94. 26. Lopuhaa CE, Roseboom TJ, Osmond C, Barker DJ, Ravelli AC, Bleker OP, et al. Atopy, lung function, and obstructive airways disease after prenatal exposure to famine. Thorax. 2000; 55: 555-61. 27. Brown AS, van Os J, Driessens C, Hoek HW, Susser ES. Further evidence of relation between prenatal famine and major affective disorder. Am J Psychiatry. 2000; 157: 190-5. 28. Elias SG, van Noord PA, Peeters PH, den Tonkelaar I, Grobbee DE. Caloric restriction reduces age at menopause: the effect of the 1944-1945 Dutch famine. Menopause. 2003; 10(5): 399-405. 29. Elias SG, Keinan-Boker L, Peeters PH, Van Gils CH, Kaaks R, Grobbee DE, et al. Long term consequences of the 1944-1945 Dutch famine on the insulin-like growth factor axis. Int J Cancer. 2004; 108(4): 628-30. 30. Elias SG, Peeters PH, Grobbee DE, van Noord PA. Breast cancer risk after caloric restriction during the 1944-1945 Dutch famine. J Natl Cancer Inst. 2004; 96(7): 539-46. 31. Barker DJ, Osmond C, Simmonds SJ, Wield GA. The relation of small head circumference and thinness at birth to death from cardiovascular disease in adult life. BMJ. 1993: 422-6. 32. Barker DJP, Osmond C, Winter PD, Margetts B, Simmonds SJ. Weight in infancy and death from ischaemic heart disease. The Lancet. 1989; 334(8663): 577-80. 33. Barker DJ, Bull AR, Osmond C, Simmonds SJ. Fetal and placental size and risk of hypertension in adult life. BMJ. 1990; 301(6746): 259-62. 34. Sallout B, Walker M. The fetal origin of adult diseases. Journal of Obstetrics and Gynaecology. 2003; 23(5): 555-60. 35. Barker DJ, Gluckman PD, Godfrey KM, Harding JE, Owens JA, Robinson JS. Fetal nutrition and cardiovascular disease in adult life. Lancet. 1993: 938-41. 36. Hales CN, Barker DJ. The thrifty phenotype hypothesis. Br Med Bull. 2001; 60: 5-20. 37. Gluckman PD, Cutfield W, Hofman P, Hanson MA. The fetal, neonatal, and infant environments--the long-term consequences for disease risk. Early Human Development. 2005; 81(1): 51-9. 38. Gluckman PD, Hanson MA, Bateson P, Beedle AS, Law CM, Bhutta ZA, et al. Towards a new developmental synthesis: adaptive developmental plasticity and human disease. The Lancet. 2009; 373(9675): 1654-7. 39. Zambrano E, Bautista CJ, Deas M, Martinez-Samayoa PM, Gonzalez-Zamorano M, Ledesma H, et al. A low maternal protein diet during pregnancy and lactation has sex and window of exposure specific effects on offspring growth and food intake, glucose metabolism and serum leptin. J Physiol. 2005.
91
40. Newnham JP, Moss TJ, Nitsos I, Sloboda DM, Challis JR. Nutrition and the early origins of adult disease. Asia Pac J Clin Nutr. 2002; 11(Supp 3): S537-42. 41. Adair LS, Cole TJ. Rapid child growth raises blood pressure in adolescent boys who were thin at birth. Hypertension. 2003; 41(3): 451-6. 42. Eriksson JG, Forsen T, Tuomilehto J, Winter PD, Osmond C, Barker DJP. Catch-up growth in childhood and death from coronary heart disease: longitudinal study. BMJ. 1999; 318(7181): 427-31. 43. Rotteveel J, van Weissenbruch MM, Twisk JW, Delemarre-Van de Waal HA. Infant and childhood growth patterns, insulin sensitivity, and blood pressure in prematurely born young adults. Pediatrics. 2008; 122(2): 313-21. 44. Regan FM, Cutfield WS, Jefferies C, Robinson E, Hofman PL. The impact of early nutrition in premature infants on later childhood insulin sensitivity and growth. Pediatrics. 2006; 118: 1943-9. 45. Hovi P, Andersson S, Eriksson JG, Jarvenpaa AL, Strang-Karlsson S, Makitie O, et al. Glucose regulation in young adults with very low birth weight. N Engl J Med. 2007; 356(20): 2053-63. 46. Johansson S, Iliadou A, Bergvall N, Tuvemo T, Norman M, Cnattingius S. Risk of high blood pressure among young men increases with the degree of immaturity at birth. Circulation. 2005; 112(22): 3430-6. 47. Singhal A, Cole TJ, Lucas A. Early nutrition in preterm infants and later blood pressure: two cohorts after randomised trials. Lancet. 2001; 357(9254): 413-9. 48. Singhal A, Cole TJ, Fewtrell M, Lucas A. Breastmilk feeding and lipoprotein profile in adolescents born preterm: follow-up of a prospective randomised study. Lancet. 2004; 363(9421): 1571-8. 49. Singhal A, Farooqi IS, O'Rahilly S, Cole TJ, Fewtrell M, Lucas A. Early nutrition and leptin concentrations in later life. Am J Clin Nutr. 2002; 75(6): 993-9. 50. Singhal A, Fewtrell M, Cole TJ, Lucas A. Low nutrient intake and early growth for later insulin resistance in adolescents born preterm. Lancet. 2003; 361(9363): 1089-97. 51. Field DJ, Dorling JS, Manktelow BN, Draper ES. Survival of extremely premature babies in a geographically defined population: prospective cohort study of 1994-9 compared with 2000-5. BMJ. 2008; 336(7655): 1221-3. 52. Givens M, Macy I. The chemical composition of the human fetus. J Biol Chem. 1933; 102: 7-17. 53. Iob V, Swanson W. Mineral growth of the human fetus. American Journal of Diseases in Children. 1934; 47: 302-6. 54. Kelly HJ, Sloan RE, Hoffman W, Saunders C. Accumulation of nitrogen and six minerals in the human fetus during gestation. Hum Biol. 1951; 23(1): 61-74. 55. Scammon R, Calkins L. The development and growth of the external dimensions of the human body in the fetal period. Minneapolis: University Minnesota Press; 1929. 56. Widdowson E, Spray C. Chemical development in utero. Arch Dis Child. 1951; 26: 205-14. 57. Widdowson E, Dickerson J. Chemical composition of the body. In: Comar C, Bronner F, editors. Mineral metabolism An advanced treatise. New York: Academic Press; 1964. p. 1-247. 58. Fee B, Weil WJ. Body composition of infants of diabetic mothers by direct analysis. Ann NY Acad Sci. 1963; 110: 869-97. 59. Apte S, Iyengar L. Composition of the human foetus. Br J Nutr. 1972; 27: 305-12. 60. Sparks J. Human intrauterine growth and nutrient accretion. Seminars in Perionatology. 1984; 8(2): 74-92.
92
61. Arey L. Simple formulae for estimating the age and sie of human embryos. Anat Rec. 1925; 30: 289-96. 62. Mall F. Determination of the age of human embryos and fetuses. Manual of human embryology. Philadelphia: JB Lippincott Co; 1910. 63. Fehling H. Beitrage zur Physiologic das placentaren stoffverkhers. Archiv Gynakologie. 1877: 2523. 64. McCance RA, Widdowson EM. Fat. Pediatr Res. 1977; 11(10 Pt 2): 1081-3. 65. Ziegler E, O'Donnell A, Nelson S, Fomon S. Body composition of the reference fetus. Growth. 1976; 40: 329-41. 66. Ziegler E. Analytical methods used to determine lipid content of reference fetus. In: McLeod G, editor.; 2008. 67. Holt L, Courtney A, Fales H. A method for the determination of fat in dried feces and its distribution as soap, free fatty acids and neutral fat. American Journal of Diseases in Children. 1919; 17: 38-42. 68. Wang Z, Shen W, Withers R, Heymsfield S. Multicomponet molecular-level models of body composition analysis. In: Heymsfield S, Lohman T, Wang Z, Going S, editors. Human Body Composition. Champaign, IL: Human Kinetics; 2005. p. 163-76. 69. Kloosterman G. On intrauterine growth. The significance of prenatal care. Int J Gynecol Obstet. 1970; 8: 895-912. 70. Costarino AJ, Baumgart S. Water as nutrition. In: Tsang R, Lucas A, Uauy R, Zlotkin S, editors. Nutritional needs of the preterm infant Scientific basis and practical guidelines. Pawling, NY: Caduceus Medical Publishers, Inc; 1993. 71. James DK, Dryburgh EH, Chiswick ML. Foot length--a new and potentially useful measurement in the neonate. Arch Dis Child. 1979; 54(3): 226-30. 72. Putet G. Energy. In: Tsang RC, A L, RD U, Zlotkin SH, editors. Nutritional needs of the preterm infant Scientific basis and practical guidelines. NY: Caduceus Medical Publishers, Inc; 1993. p. 15-28. 73. Mena P, Llanos A, Uauy R. Insulin homeostasis in the extremely low birth weight infant. Semin Perinatol. 2001; 25: 436-46. 74. Friis-Hansen B. Body composition during growth. In vivo measurements and biochemical data correlated to differential anatomical growth. Pediatrics. 1971; 47: Suppl 2:264-74. 75. Herrera E. Implications of dietary fatty acids during pregnancy on placental, fetal and postnatal development--a review. Placenta. 2002; 23 Suppl A: S9-19. 76. McCance RA. Food, growth and development. J Coll Gen Pract. 1963; 6: SUPPL2:5-10. 77. Cleal J, Lewis R. The mechanisms and regulation of placental amino acid transport to the human foetus. J Neuroendocrinology. 2008; 20: 419-26. 78. Menon R, Sperling M. Carbohydrate metabolism. Semin Perinatol. 1988; 12: 157-62. 79. Widdowson E. Food intake and growth in the newly born. Proceedings of the Nutrition Society. 1971; 30: 127-35. 80. Nualart F, Godoy A, reinicke K. Expression of the hexose transporters GLUT1 and GLUT2 during the early development of the human brain. Brain Res. 1999; 824: 97-104. 81. Platt M, Deshpande S. Metabolic adaptation at birth. Semin Fetal Neonatal Med. 2005; 10: 341-50. 82. Galan HL, Marconi AM, Paolini CL, Cheung A, Battaglia FC. The transplacental transport of essential amino acids in uncomplicated human pregnancies. Am J Obstet Gynecol. 2009; 200(1): 91 e1-7.
93
83. Hanebutt FL, Demmelmair H, Schiessl B, LarquÈ E, Koletzko B. Long-chain polyunsaturated fatty acid (LC-PUFA) transfer across the placenta. Clinical Nutrition. 2008; 27: 685-93. 84. Jackson A. The glycine story. Eur J Clin Nutr. 1991; 45: 59-65. 85. Riedijk MA, van Beek RH, Voortman G, de Bie HM, Dassel AC, van Goudoever JB. Cysteine: a conditionally essential amino acid in low-birth-weight preterm infants? Am J Clin Nutr. 2007; 86: 1120-5. 86. Magnusson AL, Waterman IJ, Wennergren M, Jansson T, Powell TL. Triglyceride Hydrolase Activities and Expression of Fatty Acid Binding Proteins in the Human Placenta in Pregnancies Complicated by Intrauterine Growth Restriction and Diabetes. J Clin Endocrinol Metab. 2004; 89: 4607-14. 87. Uauy R, Treen M, Hoffman DR. Essential fatty acid metabolism and requirements during development. Semin Perinatol. 1989; 13(2): 118-30. 88. Uauy RD, Birch DG, Birch EE, Tyson JE, Hoffman DR. Effect of dietary omega-3 fatty acids on retinal function of very low birth weight neonates. Pediatr Res. 1990; 28(5): 485-92. 89. Larque E, Krauss-Etschmann S, Campoy C, Hartl D, Linde J, Klingler M, et al. Docosahexaenoic acid supply in pregnancy affects placental expression of fatty acid transport proteins. Am J Clin Nutr. 2006; 84(4): 853-61. 90. Herrera E, Amusquivar E, Lopez-Soldado I, Ortega H. Maternal lipid metabolism and placental lipid transfer. Horm Res. 2006; 65 Suppl 3: 59-64. 91. Hay WW. Early postnatal nutritional requirements of the very preterm infant based on a presentation at the NICHD-AAP workshop on research in neonatology. Journal of Perinatology. 2006; 26 Suppl 2: S13-8. 92. Widdowson E, Southgate D, Hey E. Body composition of the fetus and infant. In: Visser H, editor. Nutrition and metabolism of the fetus and infant Fifth Nutricia Symposium. Rotterdam: Kluwer Boston Inc; 1979. 93. Hay WW, Jr. Strategies for feeding the preterm infant. Neonatology. 2008; 94(4): 245-54. 94. Heird WC. Amino acids in pediatric and neonatal nutrition. Curr Opin Clin Nutr Metab Care. 1998; 1(1): 73-8. 95. Hans DM, Pylipow M, Long JD, Thureen PJ, Georgieff MK. Nutritional practices in the neonatal intensive care unit: analysis of a 2006 neonatal nutrition survey. Pediatrics. 2009; 123(1): 51-7. 96. Collins C, Chua MC, Rajadurai VS, McPhee AJ, Miller LN, Gibson RA, et al. Higher protein and energy intake is associated with increased weight gain in pre-term infants. JPCH. 2010; 46: 96-102. 97. Putet G. Lipid metabolism of the micropremie. Clin Perinatol. 2000; 27(1): 57-69. 98. Patole S, Muller R. Enteral feeding of preterm neonates: a survey of Australian neonatologists. J Matern Fetal Neonatal Med. 2004; 16: 309-14. 99. Bombell S, McGuire W. Early trophic feeding for very low birth weight infants. Cochrane Database Syst Rev. 2009; (3): CD000504. 100. Berseth CL. Effect of early feeding on maturation of the preterm infant's small intestine. J Pediatr. 1992; 120(6): 947-53. 101. Owens L, Burrin DG, Berseth CL. Minimal enteral feeding induces maturation of intestinal motor function but not mucosal growth in neonatal dogs. J Nutr. 2002; 132(9): 2717-22. 102. Berseth CL, Nordyke C. Enteral nutrients promote postnatal maturation of intestinal motor activity in preterm infants. Am J Physiol. 1993; 264(6 Pt 1): G1046-51. 103. Berseth CL. Minimal enteral feedings. Clin Perinatol. 1995; 22: 195-205.
94
104. Meetze WH, Valentine C, McGuigan JE, Conlon M, Sacks N, Neu J. Gastrointestinal priming prior to full enteral nutrition in very low birth weight infants. J Pediatr Gastroenterol Nutr. 1992; 15: 163-70. 105. Dunn L, Hulman S, Weiner J, Kliegman R. Beneficial effects of early hypocaloric enteral feeding on neonatal gastrointestinal function: preliminary report of a randomized trial. J Pediatr. 1988; 112(4): 622-9. 106. Slagle TA, Gross SJ. Effect of early low-volume enteral substrate on subsequent feeding tolerance in very low birth weight infants. J Pediatr. 1988; 113(3): 526-31. 107. Patole S. Strategies for prevention of feed intolerance in preterm neonates: a systematic review. J Matern Fetal Neonatal Med. 2005; 18(1): 67-76. 108. American Academy of Pediatrics. Breastfeeding and the Use of Human Milk. Pediatrics. 2005; 115(2): 496-506. 109. Agostoni C, Buonocore G, Carnielli VP, De Curtis M, Darmaun D, Decsi T, et al. Enteral nutrient supply for preterm infants: commentary from the European Society of Paediatric Gastroenterology, Hepatology and Nutrition Committee on Nutrition. J Pediatr Gastroenterol Nutr. 2010; 50(1): 85-91. 110. Pang W, Hartmann P. Initiation of Human Lactation: Secretory Differentiation and Secretory Activation. J Mammary Gland Biol Neoplasia. 2007; 12: 211-21. 111. Lucas A, Morley R, Cole TJ. Randomised trial of early diet in preterm babies and later intelligence quotient. BMJ. 1998; 317(7171): 1481-7. 112. Horwood LJ, Darlow BA, Mogridge N. Breast milk feeding and cognitive ability at 7-8 years. Arch Dis Child Fetal Neonatal Ed. 2001; 84: F23-7. 113. Hylander MA, Strobino DM, Dhanireddy R. Human milk feedings and infection among very low birth weight infants. Pediatrics. 1998; 102(3): E38. 114. Lucas A, Cole TJ. Breast milk and neonatal necrotising enterocolitis. Lancet. 1990; 336: 1519-23. 115. Blaymore Bier J, Oliver T, Ferguson A, Vohr B. Human milk reduces outpatient upper respiratory symptoms in premature infants during their first year of life. J Perinatol. 2002; 22: 354-9. 116. Bier JA, Oliver T, Ferguson AE, Vohr BR. Human milk improves cognitive and motor development of premature infants during infancy. J Hum Lact. 2002; 18(4): 361-7. 117. Valenti P, Antonini G. Lactoferrin: an important host defence against microbial and viral attack. Cell Mol Life Sci. 2005; 62(22): 2576-87. 118. Adkins Y, Lonnerdal B. Potential host-defense role of a human milk vitamin B-12-binding protein, haptocorrin, in the gastrointestinal tract of breastfed infants, as assessed with porcine haptocorrin in vitro. Am J Clin Nutr. 2003; 77(5): 1234-40. 119. Lonnerdal B. Nutritional and physiologic significance of human milk proteins. Am J Clin Nutr. 2003; 77(Suppl): 1537S-43S. 120. Lonnerdal B. Human milk proteins: key components for the biological activity of human milk. Adv Exp Med Biol. 2004; 554: 11-25. 121. Iyer S, Lonnerdal B. Lactoferrin, lactoferrin receptors and iron metabolism. Eur J Clin Nutr. 1993; 47(4): 232-41. 122. Lonnerdal B, Iyer S. Lactoferrin: molecular structure and biological function. Annu Rev Nutr. 1995; 15: 93-110. 123. Adkins Y, Lonnerdal B. Mechanisms of vitamin B(12) absorption in breast-fed infants. J Pediatr Gastroenterol Nutr. 2002; 35(2): 192-8. 124. Hernell O, Blackberg L. Digestion of human milk lipids: physiologic significance of sn-2-monoacylglycerol hydrolysis by bile salt stimulated lipase. Pediatr Res. 1983; 16: 882-5. 125. Bode L. Human milk oligosaccharides: prebiotics and beyond. Nutr Rev. 2009; 67 Suppl 2: S183-91.
95
126. Dvorak B. Milk epidermal growth factor and gut protection. J Pediatr. 2010; 156(2 Suppl): S31-5. 127. Klaus M. Mother and infant: early emotional ties. Pediatrics. 1998; 102(5 Suppl E): 1244-6. 128. Mezzacappa ES. Breastfeeding and maternal stress response and health. Nutr Rev. 2004; 62(7 Pt 1): 261-8. 129. Koletzko B, von Kries R, Closa R, Escribano J, Scaglioni S, Giovannini M, et al. Lower protein in infant formula is associated with lower weight up to age 2 y: a randomized clinical trial. Am J Clin Nutr. 2009; 89(6): 1836-45. 130. Tsang RC, Uauy R, Koletzko B, Zlotkin SH, editors. Nutrition of the preterm infant. Scientific basis and practical guidelines. 2nd Edition ed. Cincinnati, Ohio: Digital Educational Publishing, Inc.; 2005. 131. Cormack B, Sinn J, Lui K, Tudehope D. Australasian neonatal intensive care enteral nutrition practices: analysis of a 2008 survey. JPCH. 2010; 46 Supplement 1: 12 [Abstract]. 132. Ehrenkranz RA. Growth outcomes of very low-birth weight infants in the newborn intensive care unit. Clin Perinatol. 2000; 27(2): 325-45. 133. Cooke RJ, Ford A, Werkman S, Conner C, Watson D. Postnatal growth in infants born between 700 and 1,500 g. J Pediatr Gastroenterol Nutr. 1993; 16(2): 130-5. 134. Embleton NE, Pang N, Cooke RJ. Postnatal malnutrition and growth retardation: an inevitable consequence of current recommendations in preterm infants? Pediatrics. 2001; 107(2): 270-3. 135. Lemons JA, Bauer CR, Oh W, Korones SB, Papile LA, Stoll BJ, et al. Very low birth weight outcomes of the National Institute of Child Health and Human Development Neonatal Research Network, January 1995 through December 1996. NICHD Neonatal Research Network. Pediatrics. 2001; 107(1): E1. 136. Clark R, Thomas P, Peabody J. Extrauterine growth restriction remains a serious problem in prematurely born neonates. Pediatrics. 2003; 111: 986-90. 137. Shah PS, Wong KY, Merko S, Bishara R, Dunn M, Asztalos E, et al. Postnatal growth failure in preterm infants: ascertainment and relation to long-term outcome. J Perinat Med. 2006; 34(6): 484-9. 138. Ehrenkranz RA, Younes N, Lemons JA, Fanaroff AA, Donovan EF, Wright LL, et al. Longitudinal growth of hospitalised very low birth weight infants. Pediatrics. 1999; 104(2 Pt 1): 280-9. 139. Kitchen W, Robinson H, Dickinson A. Revised intrauterine growth curves for an Australian hospital population. Aust Paediatr J. 1983; 19(3): 157-61. 140. Usher R, McLean F. Intrauterine growth of live-born Caucasian infants at sea level: standards obtained from measurements in 7 dimensions of infants born between 25 and 44 weeks of gestation. J Pediatr. 1969; 74(6): 901-10. 141. Lubchenco LO, Hansman C, Boyd E. Intrauterine growth in length and head circumference as estimated from live births at gestational ages from 26 to 42 weeks. Pediatrics. 1966; 37: 403. 142. Lubchenco LO, Hansman C, Dressler M, Boyd E. Intrauterine growth as estimated from liveborn birth-weight data at 24 to 42 weeks of gestation. Pediatrics. 1963; 32: 793-800. 143. Alexander GR, Himes JH, Kaufman RB, Mor J, Kogan M. A United States national reference for fetal growth. Obstet Gynecol. 1996; 87(2): 163-8. 144. Thomas P, Peabody J, Turnier V, Clark RH. A new look at intrauterine growth and the impact of race, altitude, and gender. Pediatrics. 2000; 106(2): E21. 145. Babson SG, Benda GI. Growth graphs for the clinical assessment of infants of varying gestational age. J Pediatr. 1976; 89(5): 814-20.
96
146. De Curtis M, Rigo J. Extrauterine growth restriction in very-low-birthweight infants. Acta Paediatr. 2004; 93: 1563-8. 147. Ehrenkranz R, Dusick A, Vohr B, Wright L, Wrage L, Poole WK. Growth in the neonatal intensive care unit influences neurodevelopmental and growth outcomes of extremely low birth weight infants. Pediatrics. 2006; 117: 1253-61. 148. American Academy of Pediatrics Committee on Nutrition. Nutritional needs of low-birth-weight infants. Pediatrics. 1985; 75(5): 976-86. 149. Committee on Nutrition of the Preterm Infant European Society of Paediatric Gastroenterology and Nutrition. Nutrition and feeding of preterm infants. Acta Paediatr Scand Suppl. 1987; 336: 1-14. 150. Nutrition Committee Canadian Paediatric Society. Nutrient needs and feeding of premature infants. Nutrition Committee. CMAJ. 1995; 152(11): 1765-85. 151. American Academy of Pediatrics. Nutritional needs of preterm infants. In: Kleinman R, editor. Pediatric Nutrition Handbook. 4th ed. Elk Grove Village: American Academy of Pediatrics; 1998. 152. Klein CK. Nutrient requirements for preterm infant formulas. J Nutr. 2002; 132: 1395S-577S. 153. Tsang RC, Lucas A, Uauy R, Zlotkin S, editors. Nutritional needs of the preterm infant. Scientific basis and practical guidelines. Pawling, NY, USA: Caduceus Medical Publishers, Inc.; 1993. 154. Committee on F, Newborn. Age Terminology During the Perinatal Period. Pediatrics. 2004; 114(5): 1362-4. 155. Rigo J, Senterre J. Nutritional needs of premature infants: current isues. J Pediatrics. 2006; 149: S80-S8. 156. Lee PA, Chernausek SD, Hokken-Koelega AC, Czernichow P. International Small for Gestational Age Advisory Board consensus development conference statement: management of short children born small for gestational age, April 24-October 1, 2001. Pediatrics. 2003; 111(6 Pt 1): 1253-61. 157. Clayton PE, Cianfarani S, Czernichow P, Johannsson G, Rapaport R, Rogol A. Management of the child born small for gestational age through to adulthood: a consensus statement of the International Societies of Pediatric Endocrinology and the Growth Hormone Research Society. J Clin Endocrinol Metab. 2007; 92: 804-10. 158. Bertino E, Milani S, Fabris C, De Curtis M. Neonatal anthropometric charts: what they are, what they are not. Arch Dis Child Fetal Neonatal Ed. 2007; 92: F7-F10. 159. Soothill PW, Bobrow CS, Holmes R. Small for gestational age is not a diagnosis. Ultrasound Obstet Gynecol. 1999; 13(4): 225-8. 160. Fenton TR. A new growth chart for preterm babies: Babson and Benda's chart updated with recent data and a new format. BMC Pediatr. 2003; 3: 13. 161. Leitch C, Denne S. Energy. In: Tsang RC UR, Koletzko B, Zlotkin SH, editor. Nutrition of the preterm infant Scientific basis and practical guidelines. 2nd ed. Ohio: Digital Educational Publishing Inc; 2005. p. 23-44. 162. Freymond D, Schutz Y, Decombaz J, Micheli JL, Jequier E. Energy balance, physical activity, and thermogenic effect of feeding in premature infants. Pediatr Res. 1986; 20(7): 638-45. 163. Reichman BL, Chessex P, Putet G, Verellen GJ, Smith JM, Heim T, et al. Partition of energy metabolism and energy cost of growth in the very low-birth-weight infant. Pediatrics. 1982; 69(4): 446-51. 164. Sauer PJ, Dane HJ, Visser HK. Longitudinal studies on metabolic rate, heat loss, and energy cost of growth in low birth weight infants. Pediatr Res. 1984; 18(3): 254-9. 165. Thureen PJ, Phillips RE, Baron KA, DeMarie MP, Hay WW, Jr. Direct measurement of the energy expenditure of physical activity in preterm infants. J Appl Physiol. 1998; 85(1): 223-30.
97
166. Mok Q, Bass CA, Ducker DA, McIntosh N. Temperature instability during nursing procedures in preterm neonates. Arch Dis Child. 1991; 66(7 Spec No): 783-6. 167. Kashyap S, Forsyth M, Zucker C, Ramakrishnan R, Dell RB, Heird WC. Effects of varying protein and energy intakes on growth and metabolic response in low birth weight infants. J Pediatr. 1986; 108(6): 955-63. 168. Bauer J, Maier K, Linderkamp O, Hentschel R. Effect of caffeine on oxygen consumption and metabolic rate in very low birth weight infants with idiopathic apnea. Pediatrics. 2001; 107(4): 660-3. 169. Bauer J, Maier K, Muehlbauer B, Poeschl J, Linderkamp O. Energy expenditure and plasma catecholamines in preterm infants with mild chronic lung disease. Early Hum Dev. 2003; 72(2): 147-57. 170. de Gamarra E. Energy expenditure in premature newborns with bronchopulmonary dysplasia. Biol Neonate. 1992; 61(6): 337-44. 171. de Meer K, Westerterp K, Howuwen R, Brouwers H, Berger R, Okken A. Total energy expenditure in infants with bronchopulmonary dysplasia is associated with respiratory status. Eur J Pediatr. 1997; 156: 299-304. 172. Garza JJ, Shew SB, Keshen TH, Dzakovic A, Jahoor F, Jaksic T. Energy expenditure in ill premature neonates. Journal of Pediatric Surgery. 2002; 37(3): 289-93. 173. Yeh TF, McClenan DA, Ajayi OA, Pildes RS. Metabolic rate and energy balance in infants with bronchopulmonary dysplasia. J Pediatr. 1989; 114(3): 448-51. 174. Bauer J, Hentschel R, Linderkamp O. Effect of sepsis syndrome on neonatal oxygen consumption and energy expenditure. Pediatrics. 2002; 110(6): e69. 175. Gudinchet F, Schutz Y, Micheli JL, Stettler E, Jequier E. Metabolic cost of growth in very low-birth-weight infants. Pediatr Res. 1982; 16(12): 1025-30. 176. van Goudoever JB, Sulkers EJ, Lafeber HN, Sauer PJ. Short-term growth and substrate use in very-low-birth-weight infants fed formulas with different energy contents. Am J Clin Nutr. 2000; 71(3): 816-21. 177. Schulze KF, Stefanski M, Masterson J, Spinnazola R, Ramakrishnan R, Dell RB, et al. Energy expenditure, energy balance, and composition of weight gain in low birth weight infants fed diets of different protein and energy content. J Pediatr. 1987; 110(5): 753-9. 178. Catzeflis C, Schutz Y, Micheli JL, Welsch C, Arnaud MJ, Jequier E. Whole body protein synthesis and energy expenditure in very low birth weight infants. Pediatr Res. 1985; 19(7): 679-87. 179. Whyte RK, Haslam R, Vlainic C, Shannon S, Samulski K, Campbell D, et al. Energy balance and nitrogen balance in growing low birthweight infants fed human milk or formula. Pediatr Res. 1983; 17(11): 891-8. 180. Reichman B, Chessex P, Verellen G, Putet G, Smith JM, Heim T, et al. Dietary composition and macronutrient storage in preterm infants. Pediatrics. 1983; 72(3): 322-8. 181. Putet G, Senterre J, Rigo J, Salle B. Nutrient balance, energy utilization, and composition of weight gain in very-low-birth-weight infants fed pooled human milk or a preterm formula. J Pediatr. 1984; 105(1): 79-85. 182. Putet G, Rigo J, Salle B, Senterre J. Supplementation of pooled human milk with casein hydrolysate: energy and nitrogen balance and weight gain composition in very low birth weight infants. Pediatr Res. 1987; 21(5): 458-61. 183. Whyte RK, Campbell D, Stanhope R, Bayley HS, Sinclair JC. Energy balance in low birth weight infants fed formula of high or low medium-chain triglyceride content. J Pediatr. 1986; 108(6): 964-71. 184. Kashyap S, Schulze KF, Forsyth M, Dell RB, Ramakrishnan R, Heird WC. Growth, nutrient retention, and metabolic response of low-birth-weight infants fed
98
supplemented and unsupplemented preterm human milk. Am J Clin Nutr. 1990; 52(2): 254-62. 185. Roberts SB, Lucas A. Energetic efficiency and nutrient accretion in preterm infants fed extremes of dietary intake. Hum Nutr Clin Nutr. 1987; 41(2): 105-13. 186. Kashyap S, Schulze KF, Forsyth M, Zucker C, Dell RB, Ramakrishnan R, et al. Growth, nutrient retention, and metabolic response in low birth weight infants fed varying intakes of protein and energy. J Pediatr. 1988; 113(4): 713-21. 187. Fairey AK, Butte NF, Mehta N, Thotathuchery M, Schanler RJ, Heird WC. Nutrient accretion in preterm infants fed formula with different protein:energy ratios. J Pediatr Gastroenterol Nutr. 1997; 25: 37-45. 188. Kashyap S, Heird W. Protein requirements of low birthweight, very low birthweight and small for gestational age infants. In: Raiha N, editor. Protein metabolism during infancy New York: Raven Press; 1994. 189. Bell EF. Diet and body composition of preterm infants. Acta Paediatr Suppl. 1994; 405: 25-8. 190. Leitch CA, Ahlrichs J, Karn C, Denne SC. Energy expenditure and energy intake during dexamethasone therapy for chronic lung disease. Pediatr Res. 1999; 46(1): 109-13. 191. Towers HM, Schulze KF, Ramakrishnan R, Kashyap S. Energy expended by low birth weight infants in the deposition of protein and fat. Pediatr Res. 1997; 41(4 Pt 1): 584-9. 192. Roberts SB, Young VR. Energy costs of fat and protein deposition in the human infant. Am J Clin Nutr. 1988; 48: 951-5. 193. Kashyap S, Towers HM, Sahni R, Ohira-Kist K, Abildskov K, Schulze KF. Effects of quality of energy on substrate oxidation in enterally fed, low-birth-weight infants. Am J Clin Nutr. 2001; 74(3): 374-80. 194. Collins CT, Gibson RA, Miller J, McPhee AJ, Willson K, Smithers LG, et al. Carbohydrate intake is the main determinant of growth in infants born <33 weeks' gestation when protein intake is adequate. Nutrition. 2008; 24: 451-7. 195. Kashyap S, Ohira-Kist K, Abildskov K, Towers HM, Sahni R, Ramakrishnan R, et al. Effects of quality of energy intake on growth and metabolic response of enterally fed low-birth-weight infants. Pediatr Res. 2001; 50(3): 390-7. 196. Bauer J, Werner C, Gerss J. Metabolic rate analysis of healthy preterm and full-term infants during the first weeks of life. Am J Clin Nutr. 2009; 90(6): 1517-24. 197. Rigo J. Protein, amino acid and other nitrogen compounds. In: Tsang R, Uauy R, Koletzko B, Zlotkin S, editors. Nutrition of the preterm infant Scientific basis and practical guidelines. 2nd ed. Cincinati: Digital Educational Publishing Inc; 2005. 198. Lucas A, Morley R, Cole TJ, Gore SM, Lucas PJ, Crowle P, et al. Early diet in preterm babies and developmental status at 18 months. Lancet. 1990; 335(8704): 1477-81. 199. Young V, El-Khoury A, Sanchez M, Castillo L. The biochemistry and physiology of protein and amino acid metabolism, with reference to protein nutrition. In: Raiha N, editor. Protein metabolism during infancy Nestle nutrition worshop series. Vevey, Switzerland: Nestec Ltd.; 1994. 200. Mahan L, Escott-Stump S. Krause's Food, nutrition and diet therapy. Philadelphia: WB Saunders; 1996. 201. Bennett F, Jackson A. Glycine is not formed through the amino-transferase reaction in human or rat placenta. Placenta. 1998; 19: 329-31. 202. Garlick PJ. Protein requirements of infants and children. Nestle Nutr Workshop Ser Pediatr Program. 2006; 58: 39-47; discussion - 50. 203. Waterlow J. Free amino acids: their pools, kinetics and transport. Protein turnover. Oxfordshire, UK: CABI International; 2006.
99
204. Micheli J, Schutz Y. Protein. In: Tsang R, Lucas A, Uauy R, Zlotkin SH, editors. Nutritional needs of the preterm infant Scientific basis and practical guidelines. Pawling, NY: Caduceus Medical Publishers. Incs; 1993. 205. Pencharz PB. The 1987 Borden Award lecture. Protein metabolism in premature human infants. Can J Physiol Pharmacol. 1988; 66(10): 1247-52. 206. Rigo J, Putet G, Picaud JC, Pieltain C, De Curtis M, Salle BL, et al. Protein and amino acid metabolism in ELBW infants. Nestle nutrition workshop series Nutrition of the very low birth weight infant. Vevey, Switzerland: Nestec Ltd.; 1998. 207. Zello GA, Menendez CE, Rafii M, Clarke R, Wykes LJ, Ball RO, et al. Minimum protein intake for the preterm neonate determined by protein and amino acid kinetics. Pediatr Res. 2003; 53: 338-44. 208. Lonnerdal B. Bioactive proteins in human milk: mechanisms of action. J Pediatr. 2010; 156(2 Suppl): S26-30. 209. Lonnerdal B, Atkinson S. Nitrogenous components of milk. Human milk proteins. In: Jensen R, editor. Handbook of milk composition. San Diego: Academic Press Inc; 1995. 210. Lee YH. Food-processing approaches to altering allergenic potential of milk-based formula. J Pediatr. 1992; 121(5 Pt 2): S47-50. 211. Rudloff S, Lonnerdal B. Solubility and digestibility of milk proteins in infant formulas exposed to different heat treatments. J Pediatr Gastroenterol Nutr. 1992; 15(1): 25-33. 212. Donovan SM, Lonnerdal B, Atkinson SA. Bioavailability of urea nitrogen for the low birthweight infant. Acta Paediatr Scand. 1990; 79(10): 899-905. 213. Jackson AA. Urea as a nutrient: bioavailability and role in nitrogen economy. Arch Dis Child. 1994; 70: 3-4. 214. Kalhan SC. Urea and its bioavailability in newborns. Arch Dis Child Fetal Neonatal Ed. 1994; 71(3): F233. 215. Chuang C, Lin S, Lee H, Wang T, Shih Y, Huang F, et al. Free amino acids in full term and preterm human milk and infant formula. J Pediatr Gastroenterol Nutr. 2005; 40(4): 496-500. 216. Reichman B, Chessex P, Putet G, Verellen G, Smith JM, Heim T, et al. Diet, fat accretion, and growth in premature infants. N Engl J Med. 1981; 305(25): 1495-500. 217. Mitoulas LR, Kent JC, Cox DB, Owens RA, Sherriff JL, Hartmann PE. Variation in fat, lactose and protein in human milk over 24 h and throughout the first year of lactation. Br J Nutr. 2002; 88(1): 29-37. 218. Anderson GH, Atkinson SA, Bryan MH. Energy and macronutrient content of human milk during early lactation from mothers giving birth prematurely and at term. Am J Clin Nutr. 1981; 34(2): 258-65. 219. Lai C. Production and composition of milk from 10 - 60 days of lactation in mothers who delivered prematurely. Nedlands: University of Western Australia; 2007. 220. Gross SJ, Geller J, Tomarelli RM. Composition of breast milk from mothers of preterm infants. Pediatrics. 1981; 68(4): 490-3. 221. Lemons JA, Moye L, Hall D, Simmons M. Differences in the composition of preterm and term human milk during early lactation. Pediatr Res. 1982; 16(2): 113-7. 222. Hibberd C, Brooke OG, Carter ND, Wood C. A comparison of protein concentrations and energy in breast milk from preterm and term mothers. J Hum Nutr. 1981; 35: 189-98. 223. Bitman J, Wood L, Hamosh M, Hamosh P, Mehta NR. Comparison of the lipid composition of breast milk from mothers of term and preterm infants. Am J Clin Nutr. 1983; 38: 300-12.
100
224. Sann L, Bienvenu F, Lahet C, Bienvenu J, Bethenod M. Comparison of the composition of breast milk from mothers of term and preterm infants. Acta Paediatr Scand. 1981; 70(1): 115-6. 225. Butte NF, Garza C, Johnson CA, Smith EO, Nichols BL. Longitudinal changes in milk composition of mothers delivering preterm and term infants. Early Hum Dev. 1984; 9(2): 153-62. 226. Saarela T, Kokkonen J, Koivisto M. Macronutrient and energy contents of human milk fractions during the first six months of lactation. Acta Paediatr. 2005; 94(9): 1176-81. 227. National Health and Medical Research Council. Nutrient reference values for Australia and New Zealand including Recommended Dietary Intakes. Canberra: Commonwealth of Australia; 2006. 228. Wojcik KY, Rechtman DJ, Lee ML, Montoya A, Medo ET. Macronutrient analysis of a nationwide sample of donor breast milk. J Am Diet Assoc. 2009; 109(1): 137-40. 229. Oftedal O, Iverson S. Comparative analysis of nonhuman milks. Phylogenetic variation in the gross composition of milks. In: Jensen R, editor. Handbook of milk composition. San Diego, California: Academic Press; 1995. 230. Atwood CS, Hartmann PE. Collection of fore and hind milk from the sow and the changes in milk composition during suckling. J Dairy Res. 1992; 59: 287-98. 231. Atkinson S, Anderson G, Bryan M. Human milk: comparison of the nitrogen composition in milk from mothers of premature and full-term infants. AJCN. 1980; 33: 811-15. 232. Sherriff JL. The energy output in human milk: its relationship to maternal energy intake and changes in maternal anthropometry [Doctor of Philosophy]. Nedlands, WA: University of Western Australia; 1994. 233. Casadio Y, Williams T, Lai C, Olsson S, Hepworth A, Hartmann P. Evaluation of a Mid-Infrared Analyzer for the determination of the macronutrient composition of human milk. The Journal of Human Lactation. 2010; In Press. 234. Bradford M. A rapid and sensitive method for the quantitation of microgram quantities of protein utilising the principle of protein-dye binding. Analytical Biochemistry. 1976; 72: 248-54. 235. Gross SJ, David RJ, Bauman L, Tomarelli RM. Nutritional composition of milk produced by mothers delivering preterm. J Pediatr. 1980; 96(4): 641-4. 236. Hartmann BT, Pang WW, Keil AD, Hartmann PE, Simmer K. Best practice guidelines for the operation of a donor human milk bank in an Australian NICU. Early Hum Dev. 2007; 83: 667-73. 237. Simmer K. Neonatology for the Generalist: Choice of formula and human milk supplement for preterm infants in Australia. J Paediatr Child Health. 2000; 36: 593-5. 238. Agarwal R, Singal A, Aggarwal R, Deorari AK, Paul VK. Effect of fortification with human milk fortifier (HMF) and other fortifying agents on the osmolality of preterm breast milk. Indian Pediatr. 2004; 41: 63-7. 239. Janjindamai W, Chotsampancharoen T. Effect of fortification on the osmolality of human milk. J Med Assoc Thai. 2006; 89: 1400-3. 240. Book L, Herbst J, Atherton S, Jung A. Necrotising enterocolitis in low birthweight infants fed an elemental formula. Pediatrics. 1975; 87: 602-5. 241. Kuschel CA, Harding JE. Multicomponent fortified human milk for promoting growth in preterm infants. Cochrane Database Syst Rev. 2004; 2: CD000343. 242. Thureen PJ. Early aggressive nutrition in very preterm infants. Nestle Nutr Workshop Ser Pediatr Program. 2007; 59: 193-204; discussion -8. 243. Ehrenkranz RA. Early, aggressive nutritional management for very low birth weight infants: what is the evidence? Semin Perinatol. 2007; 31(2): 48-55.
101
244. Thureen PJ, Melara D, Fennessey PV, Hay WW, Jr. Effect of low versus high intravenous amino acid intake on very low birth weight infants in the early neonatal period. Pediatr Res. 2003; 53(1): 24-32. 245. Ibrahim HM, Jeroudi MA, Baier RJ, Dhanireddy R, Krouskop RW. Aggressive early total parental nutrition in low-birth-weight infants. J Perinatol. 2004; 24(8): 482-6. 246. te Braake FW, van den Akker CH, Wattimena DJ, Huijmans JG, van Goudoever JB. Amino acid administration to premature infants directly after birth. J Pediatr. 2005; 147(4): 457-61. 247. van den Akker CH, te Braake FW, Wattimena DJ, Voortman G, Schierbeek H, Vermes A, et al. Effects of early amino acid administration on leucine and glucose kinetics in premature infants. Pediatr Res. 2006; 59: 732-5. 248. Thureen PJ. Early aggressive nutrition in the neonate. Pediatrics in Review. 1999; 20(9): e45-55. 249. Valentine CJ, Fernandez S, Rogers LK, Gulati P, Hayes J, Lore P, et al. Early amino-acid administration improves preterm infant weight. J Perinatol. 2009; 29(6): 428-32. 250. Tan M, Abernethy L, Cooke R. Improving head growth in preterm infants--a randomised controlled trial II: MRI and developmental outcomes in the first year. Arch Dis Child Fetal Neonatal Ed. 2008; 93(5): F342-6. 251. Poindexter BB, Langer JC, Dusick AM, Ehrenkranz RA. Early provision of parenteral amino acids in extremely low birth weight infants: relation to growth and neurodevelopmental outcome. J Pediatr. 2006; 148(3): 300-5. 252. Polberger S, Raiha NC, Juvonen P, Moro GE, Minoli I, Warm A. Individualized protein fortification of human milk for preterm infants: comparison of ultrafiltrated human milk protein and a bovine whey fortifier. J Pediatr Gastroenterol Nutr. 1999; 29(3): 332-8. 253. Arslanoglu S, Moro G, Ziegler E. Preterm infants fed fortified human milk receive less protein than they need. J Perinatol. 2009; 29: 489-92. 254. Arslanoglu S, Moro GE, Ziegler EE. Adjustable fortification of human milk fed to preterm infants: does it make a difference?[see comment]. Journal of Perinatology. 2006; 26(10): 614-21. 255. Mitoulas LR, Sherriff JL, Hartmann PE. Short-and long term variation in the production, content, and composition of human milk fat. Adv Exp Med Biol. 2000; 478: 401-2. 256. de Halleux V, Close A, Stalport S, Stdzinski F, Habibi F, Rigo J. Advantages of individualised fortification of human milk for preterm infants. Archives de pediatrie. 2007; 14: S5-S10. 257. Corvaglia L, Battistini B, Paoletti V, Aceti A, Capretti MG, Faldella G. Near-infrared reflectance analysis to evaluate the nitrogen and fat content of human milk in neonatal intensive care units. Arch Dis Child Fetal Neonatal Ed. 2008; 93(5): F372-5. 258. Sopher A, Shen W, Pietrobelli A. Pediatric body composition methods. In: Heymsfield SB, Lohman TG, Wang Z, Going S, editors. Human body composition. Champaign, IL: Human Kinetics; 2005. p. 129-39. 259. Wang Z, Pierson RJ, Heymsfield S. The five-level model: a new approach to organising body composition research. Am J Clin Nutr. 1992; 56: 19-28. 260. Wang ZM, Heshka S, Pierson RN, Jr., Heymsfield SB. Systematic organization of body-composition methodology: an overview with emphasis on component-based methods. Am J Clin Nutr. 1995; 61(3): 457-65. 261. Brozek J, Grande F, Anderson JT, Keys A. Densitometric analysis of body composition: revision of some quantitative assumptions. Ann N Y Acad Sci. 1963; 110: 113-40.
102
262. Fomon SJ, Haschke F, Ziegler EE, Nelson SE. Body composition of reference children from birth to age 10 years. The American Journal Of Clinical Nutrition. 1982; 35(5 Suppl): 1169-75. 263. Widdowson EM. Growth and composition of the fetus and newborn. In: Assali N, editor. Biology of gestation. New York: Academic Press; 1968. p. 1-49. 264. Heymsfield SB, Waki M, Kehayias J, Lichtman S, Dilmanian FA, Kamen Y, et al. Chemical and elemental analysis of humans in vivo using improved body composition models. Am J Physiol. 1991; 261(2 Pt 1): E190-8. 265. Kleiber M. The fire of life. New York: Robert E Kreiger; 1975. 266. Siri W. Body composition from fluid spaces and density: anlaysis of methods. 1961. Nutrition. 1993; 9(5): 480-91. 267. Snyder W, Cook M, Nasset E, Karhausen L, Howells O, IH T. Report of the task group on Reference Man. Oxford: Pergamon Press; 1884. 268. Heymsfield S, Wang Z, Withers R. Multicomponent molecular level models of body composition analysis. In: Roche A, Heymsfild S, Lohman T, editors. Human Body Composition. Champaign. USA: Human Kinetics; 1996. 269. Gurr M, Harwood J, Frayne K. Lipid biochemistry. Osford: Malden, MA: Blackwell Science; 2002. 270. Christie W. Lipid Analysis. 2nd ed. Oxford: Pergamon; 1982. 271. Fidanza F, Keys A, Anderson J. Desnity of body fat in man and other mammals. J Appl Physiol. 1953; 6: 252-6. 272. Comizio R, Pietrobelli A, Tan Y, Wang Z, Withers R, Heymsfield S, et al. Total body lipid and triglyceride response to energy deficit: relevance to body composition models . Am J Physiol. 1998; 274: E860-E6. 273. Butte NF, Hopkinson JM, Wong WW, Smith EO, KJ E. Body composition during the first 2 years of life. An updated reference. Pediatr Res. 2000; 47: 578-85. 274. Hamill P, Drizd T, Johnson C, Reed R, Roche A, Moore W. Physical growth: National Center for Health Statistics percentiles. Am J Clin Nutr. 1979; 32: 607-29. 275. Haschke F, Fomon SJ, Ziegler EE. Body composition of a nine-year-old reference boy. Pediatr Res. 1981; (5): 847-9. 276. Forbes G. Methods for determining composition of the human body. With a note on the effect of diet on body composition. Pediatrics. 1962; 29: 477-94. 277. Widdowson E. Importance of nutrition in development, with special reference to feeding low-birth-weight infants. In: HS S, Bachhuber W, LA L, editors. Meeting nutritional goals for low-birth-weight infants. Columbus, OH: Ross Lab; 1982. p. 4-11. 278. McGowan A, Jordan M, MacGregor J. Skinfold thickness in neonates. Biol Neonate. 1975; 25: 66-84. 279. Yssing M, Friis-Hansen B. Body composition of newborn infants. Acta Paediatr Scand. 1965; 159 (Suppl): 117-18. 280. Schoeller D. Hydrometry. In: Heymsfield S, Lohman TG, Wang Z, Going S, editors. Human body composition. Champaign, USA: Human Kinetics; 2005. p. 35-49. 281. Owen GM, Jensen RL, Fomon SJ. Sex-related difference in total body water and exchangeable chloride during infancy. J Pediatr. 1962; 60: 858-68. 282. Fomon S, Nelson S. Body composition of the male and female reference infants. Annu Rev Nutr. 2002; 22: 1-17. 283. Dickerson J. Changes in the composition of the human femur during growth. Biochem J. 1962; 82: 56-61. 284. Brans YW, Sumners JE, Dweck HS, Cassady G. A noninvasive approach to body composition in the neonate: dynamic skinfold measurements. Pediatr Res. 1974; 8: 215-22.
103
285. Ellis KJ, Shypailo RJ, Pratt JA, Pond WG. Accuracy of dual-energy x-ray absorptiometry for body-composition measurements in children. Am J Clin Nutr. 1994; 60(5): 660-5. 286. Koo WW, Hammami M, Hockman EM. Interchangeability of pencil-beam and fan-beam dual-energy X-ray absorptiometry measurements in piglets and infants. Am J Clin Nutr. 2003; 78: 236-40. 287. Picaud JC, Lapillonne A, Pieltain C, Reygrobellet B, Claris O, Salle BL, et al. Software and scan acquisition technique-related discrepancies in bone mineral assessment using dual-energy X-ray absorptiometry in neonates. Acta Paediatr. 2002; 91: 1189-93. 288. Roubenoff R, Kehayias JJ, Dawson-Hughes B, Heymsfield SB. Use of dual-energy x-ray absorptiometry in body-composition studies: not yet a "gold standard". Am J Clin Nutr. 1993; 58(5): 589-91. 289. Koo WW, Hammami M, Shypailo RJ, Ellis KJ. Bone and body composition measurements of small subjects: discrepancies from software for fan-beam dual energy X-ray absorptiometry. J Am Coll Nutr. 2004; 23(6): 647-50. 290. Boyd E. Experimental error inherent in meeasuring growing human body. Am J Phys Anthropol. 1930; 13: 389-432. 291. Rodriguez G, Venture P, Samper M, Moreno L, Sarria A, Perez-Gonzalez J. Changes in body composition during the initial hours of life in breast-fed healthy term newborns. Biol Neonate. 2000; 77: 12-6. 292. Bauer K, Cowett RM, Howard GM, vanEpp J, Oh W. Effect of intrauterine growth retardation on postnatal weight change in preterm infants. J Pediatr. 1993; 123(2): 301-6. 293. Singhi S, Sood V, Bhakoo ON, Ganguly NK. Effect of intrauterine growth retardation on postnatal changes in body composition of preterm infants. Indian J Med Res. 1995; 102: 275-80. 294. Tang W, Ridout D, Modi N. Influence of respiratory distress syndrome on body composition after preterm birth. Arch Dis Child Fetal Neonatal Ed. 1997; 77(1): F28-31. 295. Bauer K, Bovermann G, Roithmaier A, Gotz M, Proiss A, Versmold HT. Body composition, nutrition, and fluid balance during the first two weeks of life in preterm neonates weighing less than 1500 grams. J Pediatr. 1991; 118(4 ( Pt 1)): 615-20. 296. Shaffer S, Bradt S, Hall R. Postnatal changes in total body water and extracellular volume in the preterm infant with respiratory distress syndrome. J Pediatr. 1986; 109: 509-14. 297. Heimler R, Doumas B, Jendrzejczak B, Nemeth P, Hoffman R, Nelin L. Relationship between nutrition, weight change and fluid compartments in preterm infants during the first week of life. J Pediatr. 1993; 1993(122). 298. Ma G, Yao M, Liu Y, Lin A, Zou H, Urlando A, et al. Validation of a new pediatric air-displacement plethysmograph for assessing body composition in infants. Am J Clin Nutr. 2004; 79: 653=60. 299. Ellis K, Yao M, Shypailo R, Urlando A, Wong W, Heird W. Body composition assessment in infancy: air-displacement plethysmography versus a four compartment criterion model. Am J Clin Nutr. 2007; 85: 90-5. 300. Ellis K, Yao M, Shypailo R, Urlando A, Wong W, Heird W. Body-composition assessment in infancy: air-displacement plethysmography compared with a reference 4-compartment model. Am J Clin Nutr. 2007; 85: 90-5. 301. Raghuraman M. Negative values for estimates of percent fat using the Butte density model. In: McLeod G, editor.; 2008.
104
302. Gianni ML, Roggero P, Taroni F, Liotto N, Piemontese P, Mosca F. Adiposity in small for gestational age preterm infants assessed at term equivalent age. Arch Dis Child Fetal Neonatal Ed. 2009; 94(5): F368-72. 303. Roggero P, Gianni ML, Amato O, Orsi A, Piemontese P, Cosma B, et al. Postnatal growth failure in preterm infants: recovery of growth and body composition after term. Early Hum Dev. 2008; 84(8): 555-9. 304. Roggero P, Gianni ML, Amato O, Orsi A, Piemontese P, Morlacchi L, et al. Is term newborn body composition being achieved postnatally in preterm infants? Early Hum Dev. 2009; 85(6): 349-52. 305. Roggero P, Gianni ML, Amato O, Orsi A, Piemontese P, Puricelli V, et al. Influence of protein and energy intakes on body composition of formula-fed preterm infants after term. J Pediatr Gastroenterol Nutr. 2008; 47(3): 375-8. 306. Dauncey M, Gandy G, Gairdner D. Assessment of total body fat from skinfold thickness measurements. Arch Dis Child 1977; 52(223-7). 307. Keys A, Brozek J. Body fat in adult man. Physiol Rev. 1953; 33: 245-325. 308. Kabir N, Forsum E. Estimation of total body fat and subcutaneous adipose tissue in full-term infants less than 3 months old. Pediatr Res. 1993; 34: 448-54. 309. Olhager E, Forsum E. Assessment of total body fat using the skinfold technique in full-term and preterm infants. Acta Paediatrica (Oslo, Norway: 1992). 2006; 95: 21-8. 310. Weststrate JA, Deurenberg P. Body composition in children: proposal for a method for calculating body fat percentage from total body density or skinfold-thickness measurements. Am J Clin Nutr. 1989; (5): 1104-15. 311. Uthaya S, Bell J, Modi N. Adipose tissue magnetic resonance imaging in the newborn. Horm Res. 2004; 62 Suppl 3: 143-8. 312. Abate N, Burns D, Peshock RM, Garg A, Grundy SM. Estimation of adipose tissue mass by magnetic resonance imaging: validation against dissection in human cadavers. Journal Of Lipid Research. 1994; 35(8): 1490-6. 313. Thomas LW. The chemical composition of adipose tissue of man and mice. Q J Exp Physiol Cogn Med Sci. 1962; 47: 179-88. 314. Olhager E, Forsum E. Total energy expenditure, body composition and weight gain in moderately preterm and full-term infants at term postconceptional age. Acta Paediatrica (Oslo, Norway: 1992). 2003; 92(11): 1327-34. 315. Olhager E, Thuomas KA, Wigstrom L, Forsum E. Description and evaluation of a method based on magnetic resonance imaging to estimate adipose tissue volume and total body fat in infants. Pediatr Res. 1998; 44: 572-7. 316. Harrington TAM, Thomas EL, Modi N, Frost G, Coutts GA, Bell JD. Fast and reproducible method for the direct quantitation of adipose tissue in newborn infants. Lipids. 2002; 37(1): 95-100. 317. Modi N, Thomas EL, Harrington TAM, Uthaya S, Doré CJ, Bell JD. Determinants of adiposity during preweaning postnatal growth in appropriately grown and growth-restricted term infants. Pediatric Research. 2006; 60(3): 345-8. 318. Uthaya S, Thomas EL, Hamilton G, Dore CJ, Bell J, Modi N. Altered adiposity after extremely preterm birth. Pediatr Res. 2005; 57(2): 211-5. 319. Harrington TA, Thomas EL, Frost G, Modi N, Bell JD. Distribution of adipose tissue in the newborn. Pediatr Res. 2004; 55: 437-41. 320. Olhager E, Flinke E, Hannerstad U, Forsum E. Studies on human body composition during the first 4 months of life using magnetic resonance imaging and isotope dilution. Pediatric Research. 2003; 54(6): 906-12. 321. Ross R, Leger L, Guardo R, De Guise J, Pike BG. Adipose tissue volume measured by magnetic resonance imaging and computerized tomography in rats. J Appl Physiol. 1991; 70(5): 2164-72.
105
322. Andres A, Mitchell AD, Badger TM. QMR: validation of an infant and children body composition instrument using piglets against chemical analysis. Int J Obes (Lond). 2010; 34(4): 775-80. 323. Smith JT, Hawkins RM, Guthrie JA, Wilson DJ, Arnold PM, Boyes S, et al. Effect of slice thickness on liver lesion detection and characterisation by multidetector CT. J Med Imaging Radiat Oncol. 2010; 54: 188-93. 324. Larciprete G, Valensise H, Di Pierro G, Vasapollo B, Casalino B, Arduini D, et al. Intrauterine growth restriction and fetal body composition. Ultrasound Obstet Gynecol. 2005; 26(3): 258-62. 325. Larciprete G, Valensise H, Vasapollo B, Novelli GP, Parretti E, Altomare F, et al. Fetal subcutaneous tissue thickness (SCTT) in healthy and gestational diabetic pregnancies. Ultrasound Obstet Gynecol. 2003; 22: 591-7. 326. Padoan A, Rigano S, Ferrazzi E, Beaty BL, Battaglia FC, Galan HL. Differences in fat and lean mass proportions in normal and growth-restricted fetuses. American Journal of Obstetrics and Gynecology. 2004; 191(4): 1459-64. 327. Holzhauer S, Zwijsen RM, Jaddoe VW, Boehm G, Moll HA, Mulder PG, et al. Sonographic assessment of abdominal fat distribution in infancy. Eur J Epidemiol. 2009; 24(9): 521-9. 328. Bernstein I, Goran M, Amini S, Catalano P. Differential growth of fetal tissues during the second half of pregnancy. Am J Obstet Gynecol. 1997; 176: 28-32. 329. Armellini F, Zamboni M, Rigo L, Todesco T, Bergamo-Andreis IA, Procacci C, et al. The contribution of sonography to the measurement of intra-abdominal fat. J Clin Ultrasound. 1990; 18(7): 563-7. 330. Suzuki R, Watanabe S, Hirai Y, Akiyama K, Nishide T, Matsushima Y, et al. Abdominal wall fat index, estimated by ultrasonography, for assessment of the ratio of visceral fat to subcutaneous fat in the abdomen. Am J Med. 1993; 95(3): 309-14. 331. Ahmad I, Nemet D, Eliakim A, Koeppel R, Grochow D, Coussens M, et al. Body composition and its components in preterm and term newborns: A cross-sectional, multimodal investigation. Am J Hum Biol. 2010; 22: 69-75. 332. Ellis KJ, Shypailo RJ, Pratt JA, Pond WG. Accuracy of DXA-based body composition measurements for pediatric studies. Basic Life Sci. 1993; 60: 153-6. 333. Shypailo RJ, Butte NF, Ellis KJ. DXA: can it be used as a criterion reference for body fat measurements in children? Obesity (Silver Spring). 2008; 16(2): 457-62. 334. Rigo J, Nyamugabo K, Picaud JC, Gerard P, Pieltain C, De Curtis M. Reference values of body composition obtained by dual energy X-ray absorptiometry in preterm and term neonates. J Pediatr Gastroenterol Nutr. 1998; 27(2): 184-90. 335. Cooke RJ, Griffin I. Altered body composition in preterm infants at hospital discharge. Acta Paediatr. 2009; 98(8): 1269-73. 336. Dung NQ, Fusch G, Armbrust S, Jochum F, Fusch C. Body composition of preterm infants measured during the first months of life: bioelectrical impedance provides insignificant additional information compared to anthropometry alone. Eur J Pediatr. 2007; 166(3): 215-22. 337. Roggero P, Gianni ML, Amato O, Agosti M, Fumagalli M, Mosca F. Measuring the body composition of preterm and term neonates: from research to clinical applications. J Pediatr Gastroenterol Nutr. 2007; 45 Suppl 3: S159-62. 338. Forbes GB, Simon W, Amatruda JM. Is bioimpedance a good predictor of body-composition change? Am J Clin Nutr. 1992; 56: 4-6. 339. Lafeber HN. Nutritional assessment and measurement of body composition in preterm infants. Clin Perinatol. 1999; 26: 997-1005. 340. Westby Wold SH, Sommerfelt K, Reigstad H, Ronnestad A, Medbo S, Farstad T, et al. Neonatal mortality and morbidity in extremely preterm small for gestational age
106
infants: a population based study. Arch Dis Child Fetal Neonatal Ed. 2009; 94(5): F363-7. 341. Elder DE, Hagan R, Evans SF, Benninger HR, French NP. Hospital admissions in the first year of life in very preterm infants. J Paediatr Child Health. 1999; 35(2): 145-50. 342. Petrou S. Economic consequences of preterm birth and low birthweight. BJOG. 2003; 110 Suppl 20: 17-23. 343. Petrou S, Mehta Z, Hockley C, Cook-Mozaffari P, Henderson J, Goldacre M. The impact of preterm birth on hospital inpatient admissions and costs during the first 5 years of life. Pediatrics. 2003; 112(6 Pt 1): 1290-7. 344. Clements KM, Barfield WD, Ayadi MF, Wilber N. Preterm birth-associated cost of early intervention services: an analysis by gestational age. Pediatrics. 2007; 119(4): e866-74. 345. Commonwealth Department of Health and Ageing. National Hospital Cost Data Collection Cost Report Round 11 (2006-2007) Canberra: Australia. 2008. 346. Kirkby S, Greenspan JS, Kornhauser M, Schneiderman R, Kirkby S, Greenspan JS, et al. Clinical outcomes and cost of the moderately preterm infant. Advances in Neonatal Care. 2007; 7(2): 80-7. 347. Mistry H, Dowie R, Franklin R, Jani B. Costs of neonatal care for low-birthweight babies in English hospitals. Acta Paediatr. 2009; 98: 1123-9. 348. The global burden of preterm birth. Lancet. 2009; 374(9697): 1214. 349. Regev R, Lusky A, Dolfin T, Litmanovitz I, Arnon S, Reichman B. Excess mortality and morbidity among small for gestational age premature infants: a population based study. J Pediatr. 2003; 143: 186-91. 350. de Bie HM, Oostrom KJ, Delemarre-van de Waal HA. Brain development, intelligence and cognitive outcome in children born small for gestational age. Horm Res Paediatr. 2010; 73(1): 6-14. 351. Shand AW, Hornbuckle J, Nathan E, Dickinson JE, French NP. Small for gestational age preterm infants and relationship of abnormal umbilical artery Doppler blood flow to perinatal mortality and neurodevelopmental outcomes. Aust N Z J Obstet Gynaecol. 2009; 49(1): 52-8. 352. Commonwealth Department of Health and Ageing in conjunction with the States and Territories. National Hospital Cost Data Collection Cost Report Round 11 (2006-2007) Public Sector: AR-DRG 5.1 Private Sector: AR-DRG 4.2 and AR-DRG 5.1 . Canberra: Commonwealth of Australia; 2008. 353. Yeaney NK, Murdoch EM, Lees CC. The extremely premature neonate: anticipating and managing care. BMJ. 2009; 338: b2325. 354. Cooke R, Ainsworth S, Fenton A. Postnatal growth retardation: a universal problem in preterm infants. Arch Dis Child Fetal Neonat Ed. 2004; 89: F428-F30.
107
PAPER 1 – NUTRITIONAL AUDIT STUDY
Four-Week Nutritional Audit of Preterm Infants
Born <33 Weeks Gestation
Authors
Ms Gemma McLeod, APD, PhD Candidate, Centre for Neonatal Research and King
Edward Memorial Hospital.
Education, School of Women and Infants’ Health, The University of Western Australia.
Associate Professor Jill Sherriff, AdvAPD, School of Public Health, Curtin University,
Western Australia.
Ms Elizabeth Nathan, Biostatistician, Women and Infants Research Foundation,
Western Australia
Professor Peter Hartmann, Winthrop Professor, School of Biomedical, Biomolecular
and Chemical Sciences, The University of Western Australia.
Professor Karen Simmer, Winthrop Professor Newborn Medicine, Neonatal Research
and Education, School of Women’s and Infants’ Health, The University of Western
Australia and King Edward Memorial Hospital.
Corresponding author: Ms Gemma McLeod, Centre for Neonatal Research and Education, School of Women’s and Infants’ Health, M550, The University of Western Australia, Subiaco, WA, 6008, Australia. Email: [email protected]; Fax 61 8 9340 1266; Tel 61 8 9340 1256 A version of this paper, uploaded after submission of the thesis for examination, has been accepted for publication by the Journal of Paediatrics and Child Health. Impact Factor 1.221.
108
Abstract
Introduction Preterm nutritional audits have previously been conducted using assumed
milk composition. We audited preterm protein and energy intakes in the first 28 days of
life using both assumed milk composition and milk analysis to assess their effect on
weight gain and to determine if the recommended reasonable range of intakes (ReasNI)
were met.
Methods Parenteral (PN) and enteral (EN) intakes and weight gain were recorded daily
for infants (n=63) born <33 weeks gestation, using assumed milk composition.
Macronutrient composition was determined by milk analysis for a subset of infants
(n=36). Linear mixed models analysis was used to assess the influence of energy and
protein intakes on weight gain.
Results [Data median (range)]: Infants (n=63) gestation and birth weight were 30 (24-
32) weeks and 1400 (540-2580) g, respectively. Macronutrient milk composition was
variable: protein 16.6 (13.4-27.6) g/L, fat 46.1 (35.0-62.4) g/L, lactose 68.0 (50.9-74.8)
g/L, energy 3074 (2631-3761) kJ/L. Intakes based on measured composition differed
from assumed. Protein intake was significantly associated with weight gain. Compared
to infants with longer gestations, those born <28 weeks gestation were fed lower
volumes, were more reliant on PN, took an additional seven days to transition to
fortified feeds and median weight gain velocity took a fortnight longer to reach targets.
Conclusion Preterm milk composition is variable and routine fortification using
assumed composition may result in inappropriate nutrition. Fortification regimens
stratified by birth gestation may be necessary to achieve preterm nutrition and growth
targets. Milk analysis is required for accurate nutritional audit.
Keywords Premature birth; clinical audit; nutritional support; human milk; nutritional requirements
109
Introduction
Over the past decade, the study of preterm nutrition has been directed towards
addressing the poor growth outcomes that are commonly seen at discharge1 and which
are related to nutrition intakes during hospital stay, especially in the first few weeks of
life2.
As part of this focus, in 2005, the ad hoc expert panel reached consensus3 and
recommended higher intakes of protein4 and energy5 than were previously considered
necessary to achieve a rate of weight gain equivalent to that of the fetus in the last
trimester of pregnancy (~15 g kg-1d-1)6. In reaching their consensus recommendations3,
the ad hoc expert panel considered:
(i) earlier recommendations;
(ii) the accumulated growth deficit and the need for catch up growth;
(iii) both the quality and quantity of the protein source;
(iv) the amino acid requirement; and
(v) the fetal growth reference.
In the same year, the American Academy of Pediatrics7 revised its breastfeeding policy
and affirmed human milk (HM) as the recommended enteral feed for preterm infants,
with the caveat that fortification may be needed to increase its nutrient content.
In clinical practice, it is routine to fortify HM using an assumed macronutrient milk
composition and to audit nutritional intakes using assumed data8-10. Prior to 2005, the
standard enteral feeding practice in the tertiary neonatal clinical care unit (NCCU) in
Western Australia was to preferentially feed infants their own mother’s milk (MOM)
when available and to fortify the milk using commercial fortifiers, as directed by
manufacturers. Glucose polymer was further added when weight gain velocity did not
meet growth targets. Term and preterm infant formula (IF) was fed when MOM was
unavailable.
Following the release of the international consensus guidelines3, a review of routine
practice revealed that these fortified feeds were unlikely to meet the revised reasonable
nutrient intakes (ReasNI) for protein4 and energy5 recommended for very preterm
110
infants. Thus, the fortification practice was revised to reflect more accurately the needs
of the neonatal population11, the osmolalities of the feeds were measured12, and the
feeds were integrated into standard clinical practice. In 2006, using assumed
macronutrient composition data, the nutrition intakes and weight gain of infants
achieved with these feeds during the first 28 days of life was audited. In a subset of
infants, samples of milk were measured to determine macronutrient milk composition,
allowing a comparison to be made between assumed and measured protein and energy
intakes on days when milk supply permitted sampling of an infant’s milk feeds.
Methods
Infants born <33 weeks gestation, who were admitted to the NCCU at King Edward
Memorial Hospital (KEMH) in Perth, Western Australia within the first 24 hours of life
and who remained in the nursery for at least seven days, participated in this
observational study. Infants with congenital abnormalities were excluded. Milk
samples (when available), daily weights and feeding data were prospectively collected
for one to four completed weeks for each infant, depending on length of stay. Informed
consent was obtained from each infant’s primary carer prior to commencing the study,
which was approved by the Ethics Committee at KEMH.
Feeding Protocol
Infants were fed according to the KEMH NCCU’s 2005 feeding protocol, which was to
provide intravenous (IV) glucose on admission to all infants and to progress to
parenteral nutrition (PN) (Baxter, Glucose 20% 1L, Baxter Primine™ 10% 1L;
Baxter™ Intralipid™ 20% 1L) and initiation of minimal enteral feeds (MEF), usually
within two to five days, or, if clinically stable, to progress directly to enteral feeding
(HM or IF).
Amino acids in parenteral nutrition and lipid were initially infused at 0.5 g kg-1d-1, with
step-wise daily increments until parenteral ReasNI targets were met3. If mothers own
milk (MOM) was unavailable, formula was provided.
Human milk was fortified at 150 mL kg-1d-1 using the macronutrient composition
assumed by the hospital at the time of the audit (protein 12 g L-1, fat 38 g L-1,
lactose 70 g L-1, energy 2800 kJ L-1, 20 kcal 30 mL-1). Fortification to Level 1 was
111
achieved using a commercial human milk fortifier (Wyeth Nutritionals, Askeaton, Co.
Limerick, Ireland, 4.0 g powder 100 mL-1 milk) and a protein supplement (Promod,
Ross Nutrition, Abbott Laboratories, Columbus, Ohio, 0.3 g powder 100 mL-1 milk). If
an infant’s fluid intake was restricted to ≤150 mL kg-1d-1, fortification was upgraded to
Level 2, using the protein powder (Promod, as previous, total 0.8 g 100 mL-1 milk) and
an energy supplement (Duocal, SHS International, Liverpool, UK, 3.0 g powder 100
mL-1 milk). The anticipated macronutrient intakes achieved with these levels of
fortification are summarised in Table 1. Fortification was ceased near discharge.
HM Feeds and Sampling
Macronutrient content was determined on an infant’s preterm milk feeds, which, for the
majority of infants, were made up from their own mothers’ individual and pooled
collections of expressed milk and may have included milk expressions from different
days. Mothers were encouraged to begin expressing milk for their infants soon after
giving birth (usually within 24 hours). For quality control, mothers used one container
per milk expression, but in the home, mothers pooled their milk. A mother’s milk was
delivered to the hospital’s central milk room and depending on stage of lactation and
volume, the milk was frozen in 14 mL, 50 mL and 200 mL containers (Figure 1). The
policy in the nursery was (and still is) to make up an infant’s milk feeds (for at least the
first 14 days of enteral feeding), using mother’s milk in the order in which it was
expressed. This policy of feeding early frozen milk is extended to <30 weeks corrected
gestation for infants born <26 weeks gestation. This policy was instituted because
freezing may reduce risk of postnatal transmission of cytomegalovirus13 and because it
is protective for those infants needing prolonged intravenous feeding; it ensures all
milk-fed infants benefit from the recognized benefits of colostrum and transitional
milk14, 15. Any residual samples of early milk that have not been used prior to an infant
receiving fresh milk may be added to fresh milk feeds over time, until completely
utilized. Thus, on any given day, the composition of the milk feed fed to some infants
(which may have been as little 2 mL/d when feeds were first initiated) may not reflect
the composition of their mothers milk expressed ‘in real lactation time’, unless the
infant has transitioned quickly to full enteral feeds, the early and transitional milk has
been exhausted and the infant‘s feeds are being made using only freshly expressed
mother’s own milk
112
On the days when supply permitted, a well-mixed sample (1-3 mL) from each infant’s
unfortified milk feed was collected in 5 mL polypropylene vials (Disposable Products
Pty Ltd, Adelaide, Australia) and frozen in a commercial freezer at -200 C until
analysed.
Biochemical HM Analysis
Macronutrient composition of milk feeds was determined by routine laboratory assay in
the Hartmann Human Milk Research Laboratory at The University of Western Australia
(Perth, Australia).
Milk Protein
The protein content of the milk feeds was determined by a modified Bradford method16
using a commercial protein reagent (Bio-Rad Laboratories, Richmond. CA, USA). The
Bio-Rad Protein Assay is a dye-binding assay in which a differential colour change of a
dye occurs in response to various concentrations of protein. The assay measures the
binding of the dye to the (mainly basic and aromatic) amino acid residues of the
proteins. Thus, the modified Bradford protein assay is a measurement of protein and not
total nitrogen (N).
Human milk protein standard for the Bio-Rad assay was determined by the modified
Kjeldahl method, as previously described by Sherriff17, Hitchcock18 and Atwood and
Hartmann19. This method determines the amount of N from milk protein through a
series of organic reactions, including the digestion of protein by a strong acid at high
temperature to release nitrogen. The solution is then made alkaline to convert the
nitrogen to free ammonia and the ammonia is removed by distillation and trapped in a
boric acid solution to prevent its loss. The amount of ammonia is determined by
titration and the percentage of nitrogen present in the milk sample is calculated. As
nitrogen may also be derived from non-protein (NPN) compounds (eg. urea, free amino
acids, nucleotides), the true percentage of nitrogen from protein needs to be determined.
This requires the removal of protein (deproteinisation) from another sample of the milk
by either acid precipitation or by dialysis. Non-protein nitrogen is determined on this
deproteinised sample and milk protein N is then calculated as the difference between
Total and NPN20. Protein nitrogen is then multiplied by 6.25 to determine the true
protein content of the milk21.
113
The Bio-Rad assay has been described previously by Mitoulas et al22, The dye-reagent
concentrate was diluted 1 in 5 with double deionised water (DDI) and filtered through
Whatman No.1 filter paper (Whatman International Ltd, Springfield Mill, Kent,
England). Defatted milk samples (warmed to 370 C) were diluted 1 in 30 with DDI and
pipetted (5 μL) in duplicate, with the human milk standards of known protein
concentration (0-1.03 g L-1), on to a 96-well micro-titre plate. The prepared BioRad
reagent (250 μL) was added to each well and the plate was mixed (WellMix 2, Denley
Welltech WellMix 2, Cytosystems, Castle Hill, Australia) for approximately one minute
and left to stand at room temperature for five minutes. Absorbance was read at 620 nm
using a plate spectrophotometer (Biotek Powerwave XS, Winooski, VT, USA) until
peak absorbances were reached (<20 minutes). The recovery of a known amount of
protein added to milk samples was [mean ± SD] 97.83% ± 5.26 (n=5). The detection
limit of the assay was 0.75 g L-1 (n=12) and the inter-assay coefficient of variation (CV)
was 2.76% (n=12).
Milk Fat
The fat concentration of unfortified human milk feeds was determined using the adapted
calorimetric spectrophotometric method of Stern and Shapiro23. Briefly, 2.5 µL of milk
feed samples, warmed to 370 C, together with triolein standards (0-200 mM), were
added to ethanol (500 µL) and well-mixed. Hydroxylamine hydrochloride
(2 M; 100 µL) and sodium hydroxide (3.5 M; 100 µL) were subsequently added to each
sample and the samples mixed and left for 20 minutes at room temperature.
Hydrochloric acid (4 M; 100 µL) was then added to each sample and colour production
achieved with the addition of iron chloride tetra carboxylic acid solution
(7.5 g TCA in 10 mL 0.37 M FeCl3-0.1 M-HCL; 100 µL). The tube contents were
mixed well and from each tube 250 µL was pipetted in duplicate onto a 96-well micro-
titre plate. Absorbance was determined at 540 nm using a plate spectrophotometer
(Biotek Powerwave XS, Winooski, VT, USA). The detection limit of the assay was
0.82 g L-1 (n=12) and the inter-assay CV was 4.9 % (n=24).
Milk Lactose
The concentration of lactose in human milk feeds was determined using the modified
method of Kuhn24. Defatted milk samples and lactose standards (0-300 mM) were
diluted (1:150) with DDI. Duplicate diluted standards and samples (5 µL) were pipetted
into wells on a 96-well micro-titre plate. To each well, lactose reagent (β-galactosidase,
114
0.1 M Potassium phosphate buffer, pH 7.2; 50 μL) was added; the plate was well-mixed
and incubated at 370 C for one hour. After incubation, glucose reagent
(9.6U glucose oxidase mL-1, 2.5U peroxidase/mL, 300 μL 2.2-azino-di-[3-ethyl-
benzthiazolin-sulfonate]-6-sulfonate/mL; 200 μL) was added to each well and the
absorbance measured at 405 nm on a plate spectrophotometer at five minute intervals
until a peak absorbance was reached at approximately 45 minutes. The recovery of a
known amount of lactose added to milk samples was 99.04 ± 3.2% (n=10). The
detection limit of the assay was 0.98 g L-1 (n=12) and the inter-assay CV was 6.5%
(n=12).
Milk Energy
The metabolisable energy content of unfortified milk was calculated using the Atwater
conversion factors: protein (16 kJ g-1), fat (37 kJ g-1) and lactose (16 kJ g-1).
Nutrition Intake Data
Protein and energy intakes for each infant were calculated using assumed macronutrient
milk composition data and product nutrient composition data. Data relating to
parenteral (separated into nutritional and non-nutritional) and enteral fluid intakes were
obtained from the daily observational charts from midnight on day two of life up to four
completed weeks. Intake data on day one were excluded, as these were not
representative of a complete 24-hour period. If breastfed, and the feed was recorded as
‘breastfeed without top-up’, the volume consumed during a breastfeed was estimated to
be equal to the infant’s prescribed feed volume. If a top-up was required, the amount
given was subtracted from the prescribed volume and the balance estimated to be the
volume of milk consumed during the breastfeed. The composition data obtained from
the protein, fat and lactose assays were used to recalculate nutrient intakes for
comparison between measured and assumed intake.
Growth Data
In keeping with nursery protocol, infants requiring intensive care (NICU) were weighed
daily either in their incubator or with digital scales (g; SECA, Germany 10/20 kg) and
those in special care were weighed twice weekly, with daily weight derived by
interpolation between the two time points. Daily weight gain velocity (g kg-1d-1) was
calculated each week of the audit using an exponential model that has been validated in
preterm infants: [1000*Ln(Wn/W1)]/(Dn - D1)], where Ln is the natural logarithm,
115
W is the weight in grams, D is day, 1 is the beginning of the time interval and n is the
end of the time interval25, 26. Birth weight was converted to z-score using Australian
national birth weight data27.
Statistical Analysis
Descriptive statistics for continuous data were based on medians, interquartile ranges
(IQR) and ranges (R) or mean and standard deviation, according to normality.
Categorical data were summarised using frequency distributions. Univariate
comparisons between gestation groups, <28 weeks vs. ≥ 28 weeks, were made using
Mann-Whitney tests for continuous data and Chi-square or Fisher exact tests for
categorical outcomes. Linear mixed models regression analysis was used to determine
the association of weight gain with nutritional intake across the four weeks of the audit.
Candidate predictors of growth included energy and protein intakes and clinical factors
such as respiratory support, antibiotics and days to full enteral feeds were also assessed
for their influence on growth. Adjustment was made for gestational age, birth weight
z-score and days to fortification of feeds. All tests were two-sided and p-values <0.05
were considered statistically significant. SPSS© 14.01 statistical software was used to
analyse the data.
Results
Subjects
Seventy-two infants born <33 weeks were admitted to the NCCU at KEMH during the
two-month recruitment period between 1 October and 30 November 2006. Within the
first week of life, five infants died and four infants were transferred to the NCCU’s
surgical wing at Princess Margaret Hospital for Children, located in Perth, Western
Australia. Sixty-three infants (male: n=33) participated in the audit. Their median
(IQR; R) gestation and birth weight were 30 weeks (27-32; 24-32) and 1400 g
(965-1750; 540-2580), respectively. Infants born < 28 weeks gestation received more
respiratory support (<28 weeks: 48 d, 27-65; 1-90 vs. ≥28 weeks: 11 d, 3-21, 1-35,
p<0.001) and remained in hospital for longer (85 d, 68-114, 57-215 vs. 25 d, 15-36, 9-
73, p<0.001) than older infants (Table 2).
116
Feeding
Infants received nutrition from the following combinations of fluid sources [PN:
parenteral nutrition, IV: intravenous dextrose, HM: human milk, IF: infant formula]:
PN, IV & HM (n=30), PN, IV & IF (n=2), IV & HM (n=12), IV, HM & IF (n=18) and
IV & IF (n=1). Parenteral nutrition was the predominant source in the first two weeks
of life for preterm infants who were born <28 weeks gestation and continued to provide
over 40% and 20% of nutrition to these infants during the third and fourth weeks of life,
respectively. Conversely, no more than 20% of the nutrition provided to older infants in
the first week of life was sourced from PN and by week two, infants born ≥ 28 weeks
gestation received over 80% of their nutrition enterally (Figure 2). Compared to older
infants, those born <28 weeks gestation were delayed in commencing (minimal) enteral
feeds by two days (≥ 28 weeks: 2 days vs. <28 weeks: 4 days, p<0.001), took an
additional 12 days to achieve full enteral feeds (≥ 28 weeks:
5 days vs. <28 weeks: 17 days, p<0.001) and an additional seven days before
transitioning to fortified feeds (≥ 28 weeks: 9 days vs. <28 weeks: 16 days, p=0.008).
Milk Composition
Samples of milk feeds (n=341) were collected for 36 infants (<28 weeks n=11;
≥ 28 weeks n=25). The number of samples of milk feeds collected for each of these
infants (n=1-17) was dictated by a mother’s milk supply, the number of days an infant
was enterally fed human milk in the first 28 days of life and by the number of weeks the
infant participated in the audit. The macronutrient composition of the milk feeds was
variable over the four-week audit period and median values for protein and fat (and
therefore energy) were higher than the assumed values (Table 3). The variations in the
mean weekly protein, fat and lactose concentrations and energy content of each infant’s
unfortified milk feeds are depicted in Figure 3.
ASSUMED Protein and Energy Intakes and Weight Gain
The assumed protein and energy intakes of infants from the different and combined
sources of nutrition during each week of the audit, and the infants unadjusted weekly
rates of weight gain, are described in Tables 4a (infants <28 weeks gestation) and 4b
(infants ≥ 28 weeks gestation).
Median estimated enteral and combined energy and protein intakes of infants born
<28 weeks gestation did not meet recommended ReasNI for any week of the audit, and
117
fluid intakes were low in weeks two to four, relative to levels targeted for fortification,
to the levels achieved by older infants and to recommended ReasNI. The median
protein energy ratio (PER) of enteral feeds did not fall within the recommended range
until week four but the PER achieved with combined nutrition was within the range
recommended.
Conversely, after week one, most infants ≥28 weeks gestation were enterally fed and
although fluid intake did not reach levels targeted for fortification, their fluid and
energy intakes, and the PER were within the recommended ranges of ReasNI. Infants
met the ReasNI for protein by week three.
Infants born <28 weeks gestation did not match the third trimester fetal rate of weight
gain until week four of the audit (week 1: -2.7 g, week 2: 8.1 g, week 3: 12.0 g and
week 4: 17.2 g), whereas the rate of weight gain of infants born ≥ 28 weeks gestation
approached the fetal rate by week two (week 1: -10 g, week 2: 14.6 g, week 3: 15.0 g
and week 4: 16.6 g) - (Tables 4a-b).
MEASURED Protein and Energy Intake
The measured enteral intakes, calculated on days when milk samples were available,
were compared to assumed intakes on corresponding days (Table 5). The weekly
median (range) weight gain reported in Table 5 for each week corresponds to those
infants for whom milk samples were available in that week. Only one of the 36 infants
for whom milk samples were available transitioned to Level 2 fortification during the
audit period.
Median enteral fluid intakes for infants in both gestational age groups ranged from
139 to 152 mL kg-1d-1. Generally, measured enteral protein and energy intakes were
greater than those assumed for infants in both gestational age groups. Infants born <28
weeks achieved the ReasNI for enteral protein in week three but not week four of the
audit, and the energy ReasNI was met by week three. An enteral PER of at least 2.8,
which is within the recommended range, was achieved throughout the four-week audit
period. Conversely, older infants met the ReasNI for energy in week two of the audit
and exceeded it in weeks three and four. In these latter weeks, protein ReasNI was met
and from week two, the achieved PER was within the range recommended (Table 5).
118
The combined measured macronutrient intakes for these 36 infants were modelled
against their weekly weight gain (Figure 4). Total measured protein intake was found to
have a positive effect on weight gain, after adjustment was made for gestational age,
birth weight z-score and day of fortification; i.e. for every g increase in total protein
intake there was an associated average 1.0 g kg-1d-1 increase in weight gain
(95% CI 0.07-1.84, p=0.035).
Infants <28 weeks gestation did not show significant weight gain from the first to the
second week (13.0 g kg-1d-1, 95% CI -3.8-29.8, p=0.107), although weight gain in
weeks three and four, relative to week one, approached significance (15.1, 95% CI -8.0-
30.9, p=0.059 and 15.5, -0.4-31.3, p=0.054 respectively) (Table 6). Infants ≥ 28 weeks
gestation gained significantly more weight in weeks two (24.0, 95% CI 13.5-34.6,
p=0.001), three (22.8, 95% CI 12.5-33.1, p=0.002) and four (24.1, 95% CI 13.6-34.6,
p=0.001) compared to week one.
Discussion
To our knowledge, this is the first Australian audit28 to assess the influence of protein
and energy intakes on weight gain in the first four weeks of preterm life using measured
macronutrient milk analyses.
The mean macronutrient composition of the milk feeds was higher than the assumed
values upon which our routine fortification was based, including protein, which was
5.1 g/L (42%) higher than the assumed value. This discrepancy in the mean value for
protein is not surprising, as the assumed value more closely represents the protein
content of preterm milk expressed after two29 to three30 months of lactation or of term
milk31, rather than of milk feeds made from milk expressed in the early weeks after
preterm delivery, which was when the milk used for the feeds measured in this study
was expressed. The measured protein content of the milk feeds, was in close agreement
with that of others who have measured the composition of preterm human milk during
the first 1529, 32-34 to 3029, 34days of lactation.
Lai29 measured the macronutrient content of preterm mothers' individual milk samples
from left and right breasts of each expression within a 24-hour period on several days
spanning the first 60 days of lactation, and found it varied considerably between and
119
within mothers, between milk expressions and between breasts. Similar variations were
found in the 24-hour unfortified milk intakes of the infants in this study which were
made up from their own mothers’ individual and pooled collections of milk expressed
in the early postnatal period (1 to 4 weeks) and may have included milk from different
days. This variation in the composition of the feeds has implications if the milk feeds
are then routinely fortified using an assumed composition. Unless the macronutrient
composition of milk is standardised prior to fortification or the milk is fortified on
measured composition, infants’ protein and energy intakes are likely to be highly
variable and in variance to assumed intakes.
Each of our two levels of fortification is optimised to achieve recommended reasonable
protein (~3.6-4.4 g kg-1d-1) and energy intakes (~460-630 kJ kg-1d-1) and target PER3,
each within a specific range of fluid intake; (i.e. Level 1, 160-180 mL kg-1d-1, Level 2,
130-150 mL kg-1d-1). It is assumed that at the upper limit of each of these fluid ranges,
protein and energy intakes will meet the upper limit of their respective, recommended
ranges3. In this audit, the majority of infants prescribed Level 1 consumed lower fluid
volumes than anticipated and the younger infants averaged considerably lower volume
intakes compared to older infants. Since milk composition was highly variable and
fluid intakes lower than expected, nutritional intakes, calculated using either the
assumed or measured macronutrient composition, rarely achieved targets. That is, using
assumed data to calculate intakes, the majority of infants <28 weeks gestation did not
meet protein and energy targets any week of the audit (Table 4a); and using measured
milk data, energy targets were met in weeks three and four but protein targets were met
only in week three (Table 5). Using assumed composition data, the majority of older
infants met energy and PER targets from week two and protein targets from week three
(Table 4b), but whilst median protein intakes were within the recommended range in
weeks three and four using the measured data, median energy intakes exceeded the
recommended range (Table 5). It is noteworthy that at least 25% of protein intakes in
infants ≥ 28 weeks gestation were at or above the upper limit of the reasonable
recommended range; thus, had fluid intakes reached anticipated upper targets the
potential existed for infants to consume protein in amounts exceeding requirements and
possibly, even metabolic capacity.
The risk of over-feeding may be avoided by fortifying milk on measured milk
composition and new methods have been evaluated20, 35, 36 and are now available to
120
facilitate its easy measurement. However, milk analysis is a time-consuming task and,
in a busy tertiary neonatal unit, its clinical application in routine practice may be
limited. Adjusting protein fortification on blood urea nitrogen (BUN) and using
assumed macronutrient composition has proven a relatively simple and successful
strategy for fortifying milk and for ensuring the metabolic capacity of infants is not
exceeded; however, retrospective milk analysis, in a trial utilising this method, revealed
that infants often received less protein than recommended and intakes were lower than
assumed37. In this study, for every 1 g increase in total protein, there was an associated
average 1.0 g kg-1d-1 increase in weight gain. Thus, safe upper limits of protein
fortification need to be determined and then easily implemented and safe fortification
regimens need to be developed to facilitate clinicians in maximising fortification to
achieve nutrition and growth targets.
Certainly, the adjusted estimates of weight gain modelled in this audit suggest that rate
of weight gain is increased in infants once milk feeds are fortified. It is concerning
however, that both the unadjusted and adjusted weight gain of the older infants
exceeded the fetal rate. Accelerated postnatal weight gain has the potential to overload
an infant’s metabolism. If this is disparate with the infant’s metabolic capacity38, then
the risk for early inducement of risk factors associated with later metabolic disease39-44,
including aberrant FM44, 45, may be increased. It is difficult to get the balance right,
however, evidenced by the large variation in weight change of infants in both
gestational age groups in this audit (Tables 4a-b). Further, despite weekly increments in
median rate of weight gain, the intrauterine rate was only achieved by week four in
infants born <28 weeks, whilst older infants achieved the intrauterine rate by week two.
This disparity is not entirely unexpected given the differences in their clinical history.
Infants born <28 weeks gestation had greater respiratory support, were more reliant on
parenteral nutrition and took longer to transition to both full enteral feeds and
fortification. Nevertheless, it is interesting that infants born <28 weeks gained rather
than lost weight in the first week of life, compared to older infants. Delayed diuresis is
one likely explanation for this difference46. However, it is possible that nutrition also
played a part47. In the last trimester of pregnancy, the age-matched fetus accretes
protein at a rate of approximately 1.5 g kg-1d-148 to 2.0 g kg-1d-149, 50, and most of the
nitrogen reaching the fetus is supplied as amino acids. Approximately 1% of body
protein stores are lost daily if no exogenous nitrogen is fed in the days following birth51.
In this study, infants born <28 weeks gestation were fed at a higher PER and their
121
nitrogen intakes, sourced mainly from the amino acids in parenteral solutions, were
higher than those of older infants, whose N intakes were sourced mainly from protein
and the free amino acids in unfortified HM. The amino acid preparation in the
parenteral solution attempted to mimic the amino acid concentration in the cord blood
of the last trimester of pregnancy (Baxter Primene™ 10%). Early high dose amino acid
infusions soon after birth (targets: day 1: 3.5 g kg-1d-152; on day 2: 2.4 g kg1d153 and
2.5 g kg-1d-154) have been shown to reverse negative nitrogen balance without adverse
effect52-54 and improve short-term growth outcomes55-57. Indeed, data suggests that
early parenteral nutrition of only a few days may influence later cognition56, 58. In this
audit, over 30% of total fluid intake in the first week of life for all infants was sourced
from intravenous fluids other than PN, mostly due to the delay in prescribing PN or to
ensure fluid targets were achieved whilst upgrading to full enteral feeds. Therefore,
changes to current PN practice have been recommended59 and may improve growth of
infants during the first week of life, avoiding the need for catch-up growth and the
concerns relating to it60-62, including increased risk of metabolic alterations63-65 and later
chronic health outcomes66.
The short audit period limited the capacity of this study to determine the influence of
macronutrient intake and PER on discharge and longer-term growth outcomes,
including body composition. Further studies are required to assess this in view of
current nutrition guidelines3, 67.
Recommendations
On the basis of this audit, the following changes to nutrition practice are recommended:
Parenteral Nutrition
(i) Initiate ‘Starter PN’ as first fluids to all preterm infants <32 weeks
requiring intravenous fluids on admission, targeting nitrogen intakes
equivalent to (at least) 2.0 g protein kg-1d-159. Subsequently,
individualise PN and introduce lipid according to metabolic capacity.
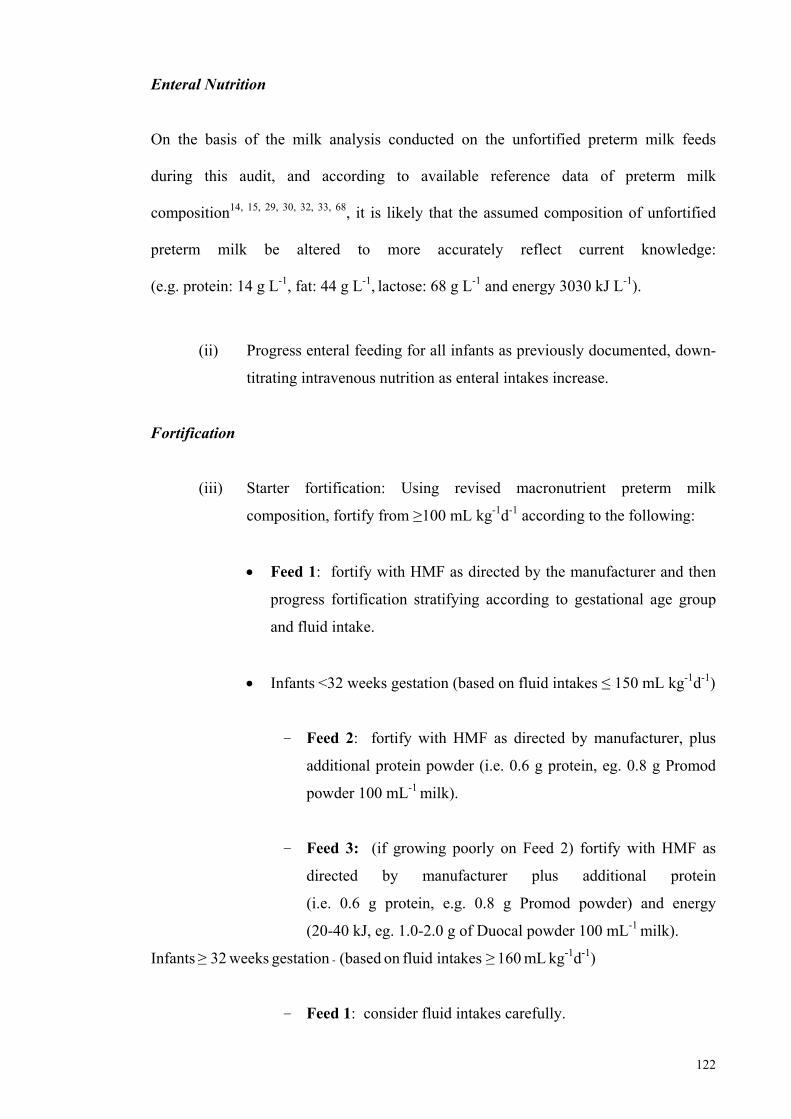
122
Enteral Nutrition
On the basis of the milk analysis conducted on the unfortified preterm milk feeds
during this audit, and according to available reference data of preterm milk
composition14, 15, 29, 30, 32, 33, 68, it is likely that the assumed composition of unfortified
preterm milk be altered to more accurately reflect current knowledge:
(e.g. protein: 14 g L-1, fat: 44 g L-1, lactose: 68 g L-1 and energy 3030 kJ L-1).
(ii) Progress enteral feeding for all infants as previously documented, down-
titrating intravenous nutrition as enteral intakes increase.
Fortification
(iii) Starter fortification: Using revised macronutrient preterm milk
composition, fortify from ≥100 mL kg-1d-1 according to the following:
Feed 1: fortify with HMF as directed by the manufacturer and then
progress fortification stratifying according to gestational age group
and fluid intake.
Infants <32 weeks gestation (based on fluid intakes ≤ 150 mL kg-1d-1)
- Feed 2: fortify with HMF as directed by manufacturer, plus
additional protein powder (i.e. 0.6 g protein, eg. 0.8 g Promod
powder 100 mL-1 milk).
- Feed 3: (if growing poorly on Feed 2) fortify with HMF as
directed by manufacturer plus additional protein
(i.e. 0.6 g protein, e.g. 0.8 g Promod powder) and energy
(20-40 kJ, eg. 1.0-2.0 g of Duocal powder 100 mL-1 milk).
Infants ≥ 32 weeks gestation - (based on fluid intakes ≥ 160 mL kg-1d-1)
- Feed 1: consider fluid intakes carefully.

123
- Feed 2: consider if growing poorly and fluid restricted to
≤150 mL kg-1d-1.
Anticipated intakes achieved with these changes to nutrition practice are described in
Table 7. Regular measured auditing is necessary to assess that nutritional and growth
targets are being achieved.
124
References (Paper 1)
1. Cooke R, Ainsworth S, Fenton A. Postnatal growth retardation: a universal problem in preterm infants. Arch Dis Child Fetal Neonat Ed. 2004; 89: F428-F30. 2. Embleton NE, Pang N, Cooke RJ. Postnatal malnutrition and growth retardation: an inevitable consequence of current recommendations in preterm infants? Pediatrics. 2001; 107(2): 270-3. 3. Tsang RC, Uauy R, Koletzko B, Zlotkin SH, editors. Nutrition of the preterm infant. Scientific basis and practical guidelines. 2nd Edition ed. Cincinnati, Ohio: Digital Educational Publishing, Inc.; 2005. 4. Rigo J. Protein, amino acid and other nitrogen compounds. In: Tsang R, Uauy R, Koletzko B, Zlotkin S, editors. Nutrition of the preterm infant Scientific basis and practical guidelines. 2nd ed. Cincinati: Digital Educational Publishing Inc; 2005. 5. Leitch C, Denne S. Energy. In: Tsang RC UR, Koletzko B, Zlotkin SH, editor. Nutrition of the preterm infant Scientific basis and practical guidelines. 2nd ed. Ohio: Digital Educational Publishing Inc; 2005. p. 23-44. 6. American Academy of Pediatrics CON. Nutritional needs of low-birth-weight infants. Pediatrics. 1985; 75(5): 976-86. 7. American Academy of Pediatrics. Breastfeeding and the Use of Human Milk. Pediatrics. 2005; 115(2): 496-506. 8. Cormack BE, Bloomfield FH. Audit of feeding practices in babies<1200 g or 30 weeks gestation during the first month of life. J Paediatr Child Health. 2006; 42: 458-63. 9. Cormack B, Sinn J, Lui K, Tudehope D. Australasian neonatal intensive care enteral nutrition practices: analysis of a 2008 survey. JPCH. 2010; 46 Supplement 1: 12 [Abstract]. 10. Martin CR, Brown YF, Ehrenkranz RA, O'Shea TM, Allred EN, Belfort MB, et al. Nutritional practices and growth velocity in the first month of life in extremely premature infants. Pediatrics. 2009; 124(2): 649-57. 11. McLeod G, Skrapac A, Hartmann B, K S. Fortification of human milk for preterm infants. Proceedings of the Perinatal Society of Australia and New Zealand (PSANZ). 2006; April 3-6, Perth, Australia [Abstract] 2006. 12. McLeod G, Hartmann B, Sherriff J, Simmer K. Effect of fortification on osmolality of feeds in the NICU. Proceedings of the Perinatal Society of Australia and New Zealand (PSANZ). April 3-6, Perth, Australia [Abstract]. 2006. 13. Friis H, Andersen HK. Rate of inactivation of cytomegalovirus in raw banked milk during storage at -20 degrees C and pasteurisation. Br Med J (Clin Res Ed). 1982; 285: 1604-5. 14. Anderson GH, Atkinson SA, Bryan MH. Energy and macronutrient content of human milk during early lactation from mothers giving birth prematurely and at term. Am J Clin Nutr. 1981; 34(2): 258-65. 15. Gross SJ, Geller J, Tomarelli RM. Composition of breast milk from mothers of preterm infants. Pediatrics. 1981; 68(4): 490-3. 16. Bradford M. A rapid and sensitive method for the quantitation of microgram quantities of protein utilising the principle of protein-dye binding. Analytical Biochemistry. 1976; 72: 248-54. 17. Sherriff JL. The energy output in human milk: its relationship to maternal energy intake and changes in maternal anthropometry [Doctor of Philosophy]. Nedlands, WA: University of Western Australia; 1994. 18. Hitchcock N. Feeding practices and growth of Australian infants [Degree of Master of Science]. Perth: University of Western Australia; 1983.
125
19. Atwood CS, Hartmann PE. Collection of fore and hind milk from the sow and the changes in milk composition during suckling. J Dairy Res. 1992; 59: 287-98. 20. Casadio Y, Williams T, Lai C, Olsson S, Hepworth A, Hartmann P. Evaluation of a Mid-Infrared Analyzer for the determination of the macronutrient composition of human milk. The Journal of Human Lactation. 2010; In Press. 21. Lonnerdal B. Nutritional and physiologic significance of human milk proteins. Am J Clin Nutr. 2003; 77(Suppl): 1537S-43S. 22. Mitoulas LR, Kent JC, Cox DB, Owens RA, Sherriff JL, Hartmann PE. Variation in fat, lactose and protein in human milk over 24 h and throughout the first year of lactation. Br J Nutr. 2002; 88(1): 29-37. 23. Stern I, Shapiro B. A rapid and simple method for the determination of esterified fatty acids and for total fatty acids in blood. J Clin Pathol. 1953; 6(2): 158-60. 24. Kuhn NJ. Progesterone withdrawal as the lactogenic trigger in the rat. J Endocrinol. 1969; 44(1): 39-54. 25. Patel AL, Engstrom JL, Meier PP, Kimura RE. Accuracy of methods for calculating postnatal growth velocity for extremely low birth weight infants. Pediatrics. 2005; 116(6): 1466-73. 26. Patel AL, Engstrom JL, Meier PP, Jegier BJ, Kimura RE. Calculating postnatal growth velocity in very low birth weight (VLBW) premature infants. J Perinatol. 2009; 29(9): 618-22. 27. Roberts C, Lancaster P. Australian national birthweight percentiles by gestational age. MJA. 1999; 170: 114-18. 28. McLeod G, Sherriff J, Simmer K, Tompkins J, Hartmann PE. Audit of nutrition intake and growth of preterm infants in the NCCU JPCH. 2007; 43: A44 [Abstract]. 29. Lai C. Production and composition of milk from 10 - 60 days of lactation in mothers who delivered prematurely. Nedlands: University of Western Australia; 2007. 30. Saarela T, Kokkonen J, Koivisto M. Macronutrient and energy contents of human milk fractions during the first six months of lactation. Acta Paediatr. 2005; 94(9): 1176-81. 31. National Health and Medical Research Council. Nutrient reference values for Australia and New Zealand including Recommended Dietary Intakes. Canberra: Commonwealth of Australia; 2006. 32. Butte NF, Garza C, Johnson CA, Smith EO, Nichols BL. Longitudinal changes in milk composition of mothers delivering preterm and term infants. Early Hum Dev. 1984; 9(2): 153-62. 33. Lemons JA, Moye L, Hall D, Simmons M. Differences in the composition of preterm and term human milk during early lactation. Pediatr Res. 1982; 16(2): 113-7. 34. Gross SJ, David RJ, Bauman L, Tomarelli RM. Nutritional composition of milk produced by mothers delivering preterm. J Pediatr. 1980; 96(4): 641-4. 35. Menjo A, Mizuno K, Murase M, Nishida Y, Taki M, Itabashi K, et al. Bedside analysis of human milk for adjustable nutrition strategy. Acta Paediatr. 2009; 98(2): 380-4. 36. Sauer CW, Kim JH. Human milk macronutrient analysis using point-of-care near-infrared spectrophotometry. J Perinatol. 2010. 37. Arslanoglu S, Moro G, Ziegler E. Preterm infants fed fortified human milk receive less protein than they need. J Perinatol. 2009; 29: 489-92. 38. Wells JC. Historical cohort studies and the early origins of disease hypothesis: making sense of the evidence. Proc Nutr Soc. 2009; 68: 179-88. 39. Ong KK, Ahmed ML, Emmett PM, Preece MA, Dunger DB. Association between postnatal catch-up growth and obesity in childhood: prospective cohort study. BMJ. 2000; 320(7240): 967-71.
126
40. Singhal A, Cole TJ, Fewtrell M, Deanfield J, Lucas A. Is slower early growth beneficial for long-term cardiovascular health? Circulation. 2004; 109(9): 1108-13. 41. Singhal A, Kennedy K, Lanigan J, Fewtrell M, Cole TJ, Stephenson T, et al. Nutrition in infancy and long-term risk of obesity: evidence from 2 randomized controlled trials. Am J Clin Nutr. 2010; 92: 1133-44. 42. Lo H, Tsao L, Shu W, Chi C, Tsai F. Changes in serum insulin-like growth factors, not leptin, are associated with postnatal weight gain in preterm neonates. JPEN. 2005; 29(2): 89-91. 43. Holzhauer S, Hokken Koelega AC, Ridder M, Hofman A, Moll HA, Steegers EA, et al. Effect of birth weight and postnatal weight gain on body composition in early infancy: The Generation R Study. Early Hum Dev. 2009; 85( ): 285-90. 44. Cooke RJ, Griffin I. Altered body composition in preterm infants at hospital discharge. Acta Paediatr. 2009; 98(8): 1269-73. 45. Uthaya S, Thomas EL, Hamilton G, Dore CJ, Bell J, Modi N. Altered adiposity after extremely preterm birth. Pediatr Res. 2005; 57(2): 211-5. 46. Costarino AJ, Baumgart S. Water as nutrition. In: Tsang R, Lucas A, Uauy R, Zlotkin S, editors. Nutritional needs of the preterm infant Scientific basis and practical guidelines. Pawling, NY: Caduceus Medical Publishers, Inc; 1993. 47. Heimler R, Doumas B, Jendrzejczak B, Nemeth P, Hoffman R, Nelin L. Relationship between nutrition, weight change and fluid compartments in preterm infants during the first week of life. J Pediatr. 1993; 1993(122). 48. van den Akker CH, Vlaardingerbroek H, van Goudoever JB. Nutritional support for extremely low-birth weight infants: abandoning catabolism in the neonatal intensive care unit. Curr Opin Clin Nutr Metab Care. 2010; 13: 327-35. 49. Widdowson EM. Growth and composition of the fetus and newborn. In: Assali N, editor. Biology of gestation. New York: Academic Press; 1968. p. 1-49. 50. Ziegler E, O'Donnell A, Nelson S, Fomon S. Body composition of the reference fetus. Growth. 1976; 40: 329-41. 51. Kashyap S, Heird W. Protein requirements of low birthweight, very low birthweight and small for gestational age infants. In: Raiha N, editor. Protein metabolism during infancy New York: Raven Press; 1994. 52. Ibrahim HM, Jeroudi MA, Baier RJ, Dhanireddy R, Krouskop RW. Aggressive early total parental nutrition in low-birth-weight infants. J Perinatol. 2004; 24(8): 482-6. 53. te Braake FW, van den Akker CH, Wattimena DJ, Huijmans JG, van Goudoever JB. Amino acid administration to premature infants directly after birth. J Pediatr. 2005; 147(4): 457-61. 54. Thureen PJ, Melara D, Fennessey PV, Hay WW, Jr. Effect of low versus high intravenous amino acid intake on very low birth weight infants in the early neonatal period. Pediatr Res. 2003; 53(1): 24-32. 55. Kotsopoulos K, Benadiba-Torch A, Cuddy A, Shah PS. Safety and efficacy of early amino acids in preterm <28 weeks gestation: prospective observational comparison. Journal of Perinatology. 2006; 26(12): 749-54. 56. Poindexter BB, Langer JC, Dusick AM, Ehrenkranz RA. Early provision of parenteral amino acids in extremely low birth weight infants: relation to growth and neurodevelopmental outcome. J Pediatr. 2006; 148(3): 300-5. 57. Valentine CJ, Fernandez S, Rogers LK, Gulati P, Hayes J, Lore P, et al. Early amino-acid administration improves preterm infant weight. J Perinatol. 2009; 29(6): 428-32. 58. Stephens BE, Walden RV, Gargus RA, Tucker R, McKinley L, Mance M, et al. First-week protein and energy intakes are associated with 18-month developmental outcomes in extremely low birth weight infants. Pediatrics. 2009; 123(5): 1337-43.
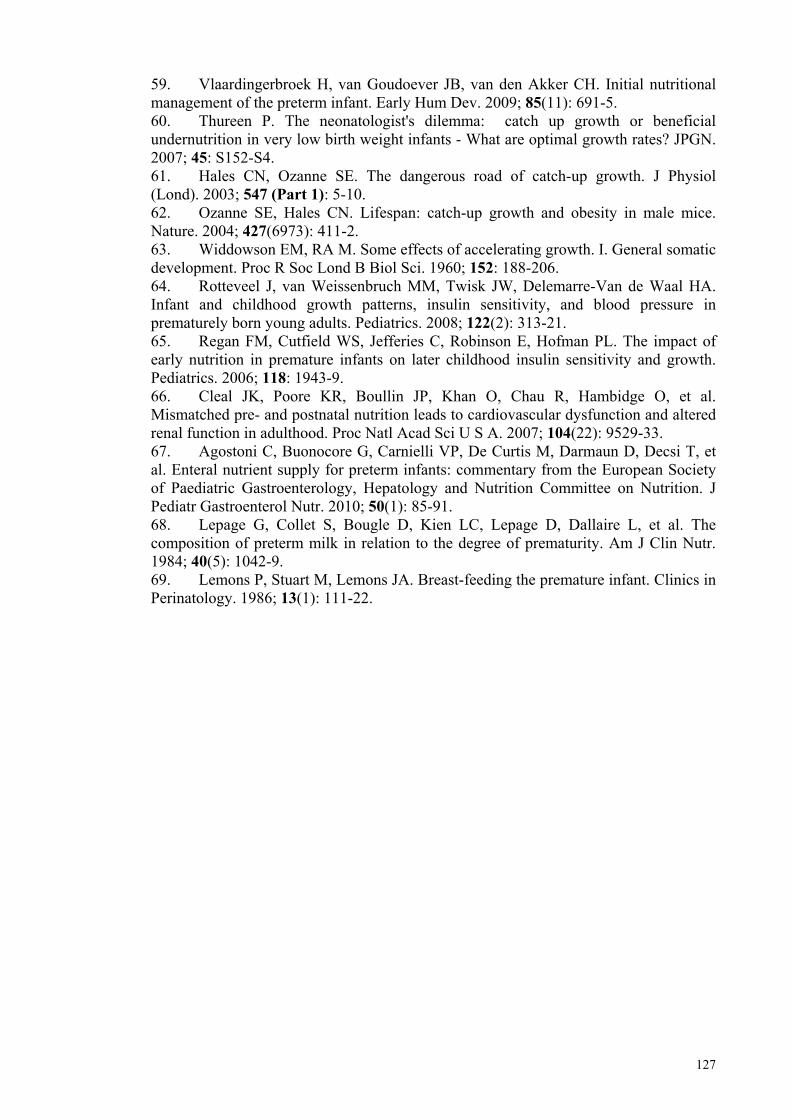
127
59. Vlaardingerbroek H, van Goudoever JB, van den Akker CH. Initial nutritional management of the preterm infant. Early Hum Dev. 2009; 85(11): 691-5. 60. Thureen P. The neonatologist's dilemma: catch up growth or beneficial undernutrition in very low birth weight infants - What are optimal growth rates? JPGN. 2007; 45: S152-S4. 61. Hales CN, Ozanne SE. The dangerous road of catch-up growth. J Physiol (Lond). 2003; 547 (Part 1): 5-10. 62. Ozanne SE, Hales CN. Lifespan: catch-up growth and obesity in male mice. Nature. 2004; 427(6973): 411-2. 63. Widdowson EM, RA M. Some effects of accelerating growth. I. General somatic development. Proc R Soc Lond B Biol Sci. 1960; 152: 188-206. 64. Rotteveel J, van Weissenbruch MM, Twisk JW, Delemarre-Van de Waal HA. Infant and childhood growth patterns, insulin sensitivity, and blood pressure in prematurely born young adults. Pediatrics. 2008; 122(2): 313-21. 65. Regan FM, Cutfield WS, Jefferies C, Robinson E, Hofman PL. The impact of early nutrition in premature infants on later childhood insulin sensitivity and growth. Pediatrics. 2006; 118: 1943-9. 66. Cleal JK, Poore KR, Boullin JP, Khan O, Chau R, Hambidge O, et al. Mismatched pre- and postnatal nutrition leads to cardiovascular dysfunction and altered renal function in adulthood. Proc Natl Acad Sci U S A. 2007; 104(22): 9529-33. 67. Agostoni C, Buonocore G, Carnielli VP, De Curtis M, Darmaun D, Decsi T, et al. Enteral nutrient supply for preterm infants: commentary from the European Society of Paediatric Gastroenterology, Hepatology and Nutrition Committee on Nutrition. J Pediatr Gastroenterol Nutr. 2010; 50(1): 85-91. 68. Lepage G, Collet S, Bougle D, Kien LC, Lepage D, Dallaire L, et al. The composition of preterm milk in relation to the degree of prematurity. Am J Clin Nutr. 1984; 40(5): 1042-9. 69. Lemons P, Stuart M, Lemons JA. Breast-feeding the premature infant. Clinics in Perinatology. 1986; 13(1): 111-22.
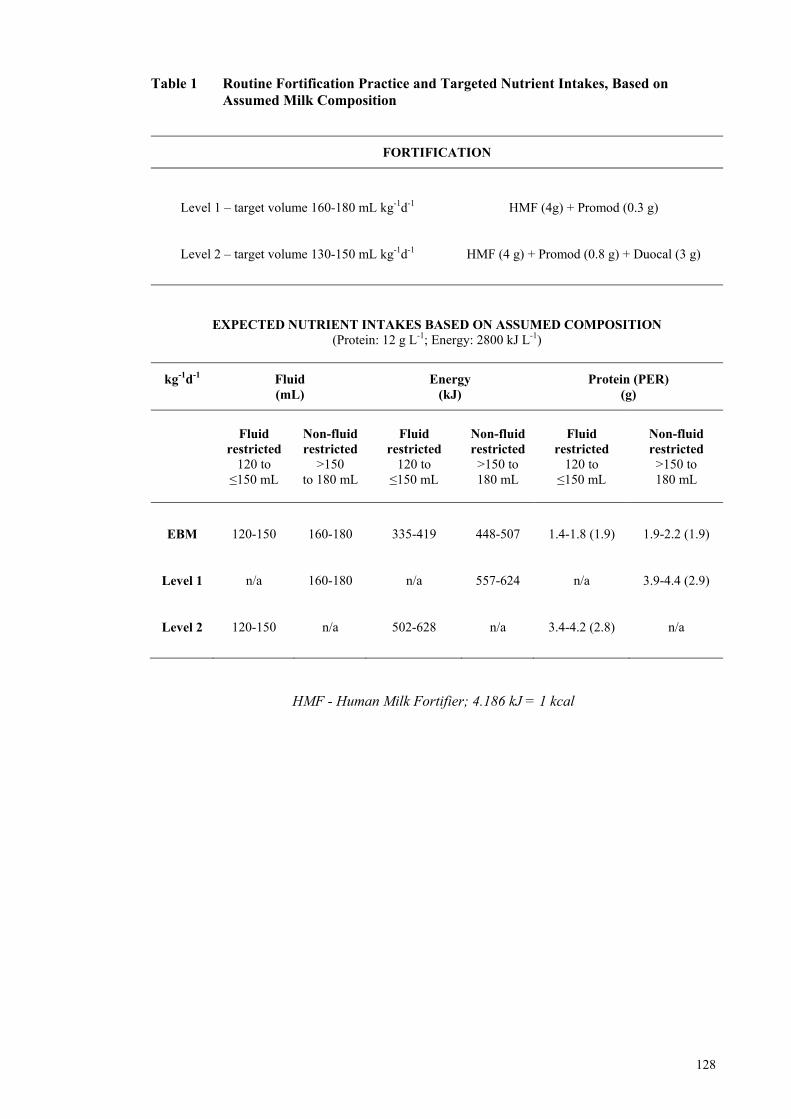
128
Table 1 Routine Fortification Practice and Targeted Nutrient Intakes, Based on Assumed Milk Composition
FORTIFICATION
Level 1 – target volume 160-180 mL kg-1d-1
HMF (4g) + Promod (0.3 g)
Level 2 – target volume 130-150 mL kg-1d-1
HMF (4 g) + Promod (0.8 g) + Duocal (3 g)
EXPECTED NUTRIENT INTAKES BASED ON ASSUMED COMPOSITION (Protein: 12 g L-1; Energy: 2800 kJ L-1)
kg-1d-1 Fluid (mL)
Energy (kJ)
Protein (PER) (g)
Fluid
restricted 120 to
≤150 mL
Non-fluid restricted
>150 to 180 mL
Fluid
restricted 120 to
≤150 mL
Non-fluid restricted
>150 to 180 mL
Fluid
restricted 120 to
≤150 mL
Non-fluid restricted
>150 to 180 mL
EBM 120-150 160-180 335-419 448-507 1.4-1.8 (1.9) 1.9-2.2 (1.9)
Level 1
n/a
160-180
n/a
557-624
n/a
3.9-4.4 (2.9)
Level 2
120-150
n/a
502-628
n/a
3.4-4.2 (2.8)
n/a
HMF - Human Milk Fortifier; 4.186 kJ = 1 kcal
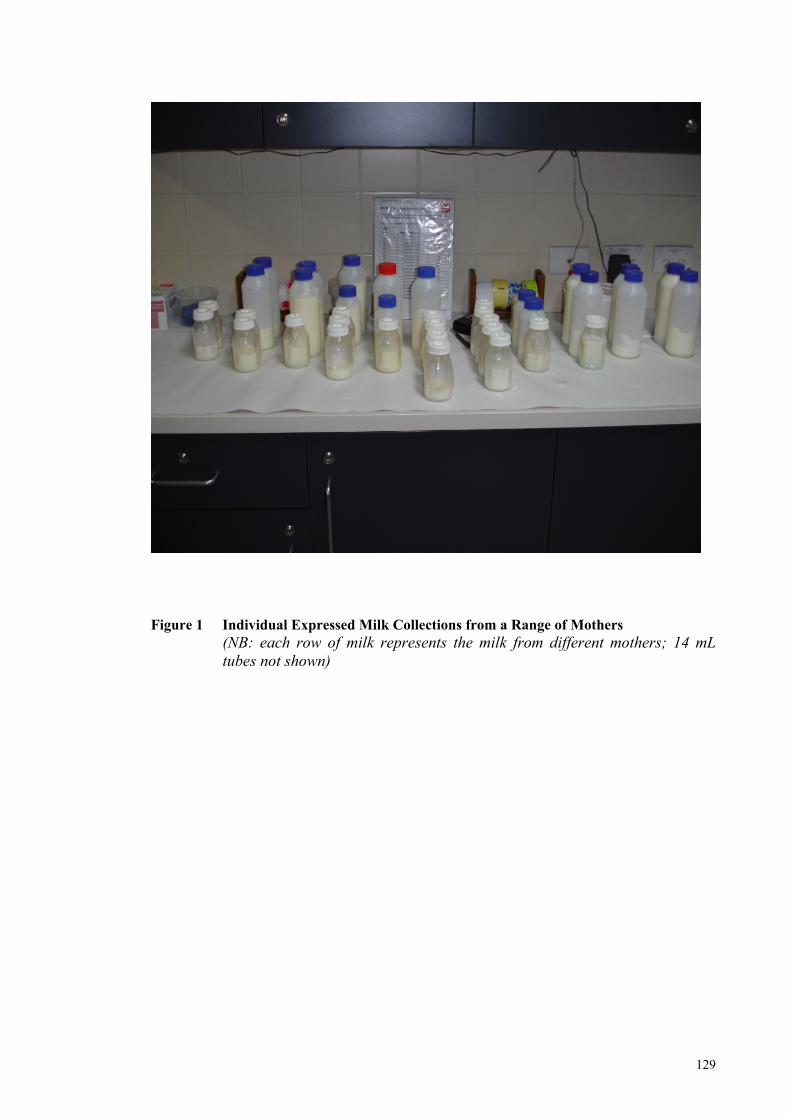
129
Figure 1 Individual Expressed Milk Collections from a Range of Mothers (NB: each row of milk represents the milk from different mothers; 14 mL
tubes not shown)
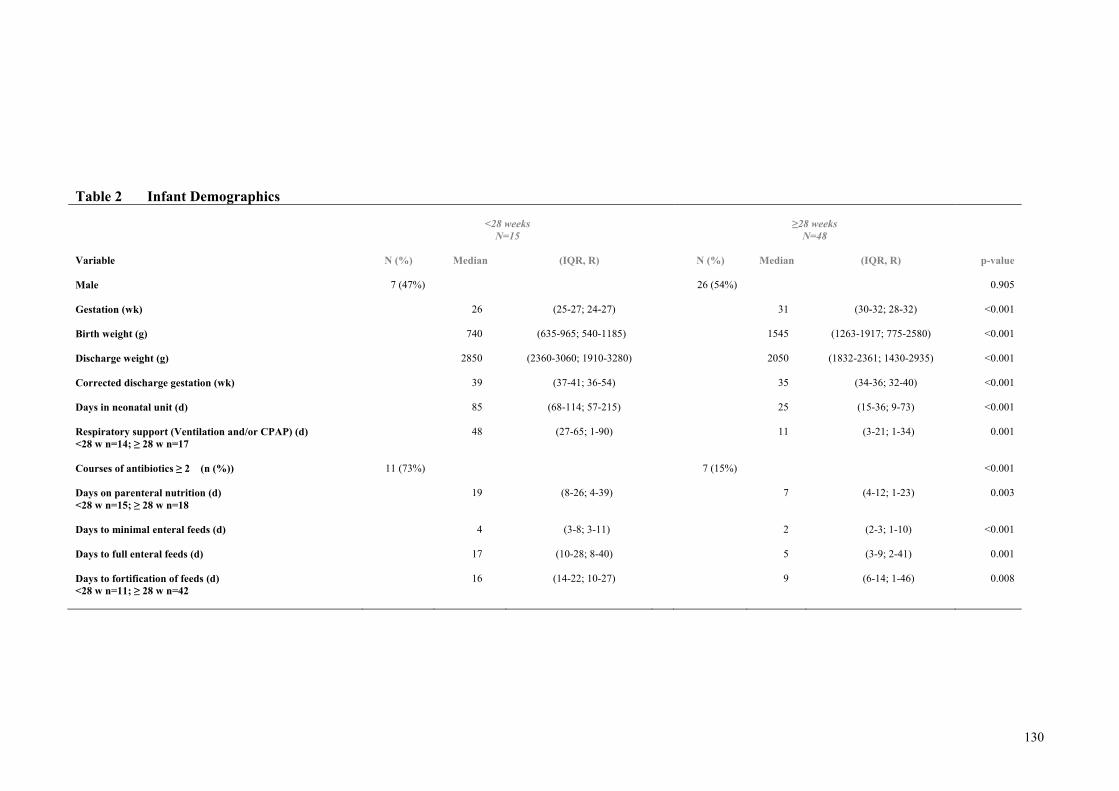
130
Table 2 Infant Demographics
<28 weeks N=15
≥28 weeks
N=48
Variable
N (%) Median (IQR, R) N (%) Median (IQR, R) p-value
Male
7 (47%) 26 (54%) 0.905
Gestation (wk)
26 (25-27; 24-27) 31 (30-32; 28-32) <0.001
Birth weight (g)
740 (635-965; 540-1185) 1545 (1263-1917; 775-2580) <0.001
Discharge weight (g)
2850 (2360-3060; 1910-3280) 2050 (1832-2361; 1430-2935) <0.001
Corrected discharge gestation (wk)
39 (37-41; 36-54) 35 (34-36; 32-40) <0.001
Days in neonatal unit (d)
85 (68-114; 57-215) 25 (15-36; 9-73) <0.001
Respiratory support (Ventilation and/or CPAP) (d) <28 w n=14; ≥ 28 w n=17
48 (27-65; 1-90) 11 (3-21; 1-34) 0.001
Courses of antibiotics ≥ 2 (n (%))
11 (73%) 7 (15%) <0.001
Days on parenteral nutrition (d) <28 w n=15; ≥ 28 w n=18
19 (8-26; 4-39) 7 (4-12; 1-23) 0.003
Days to minimal enteral feeds (d)
4 (3-8; 3-11) 2 (2-3; 1-10) <0.001
Days to full enteral feeds (d)
17 (10-28; 8-40) 5 (3-9; 2-41) 0.001
Days to fortification of feeds (d) <28 w n=11; ≥ 28 w n=42
16 (14-22; 10-27) 9 (6-14; 1-46) 0.008
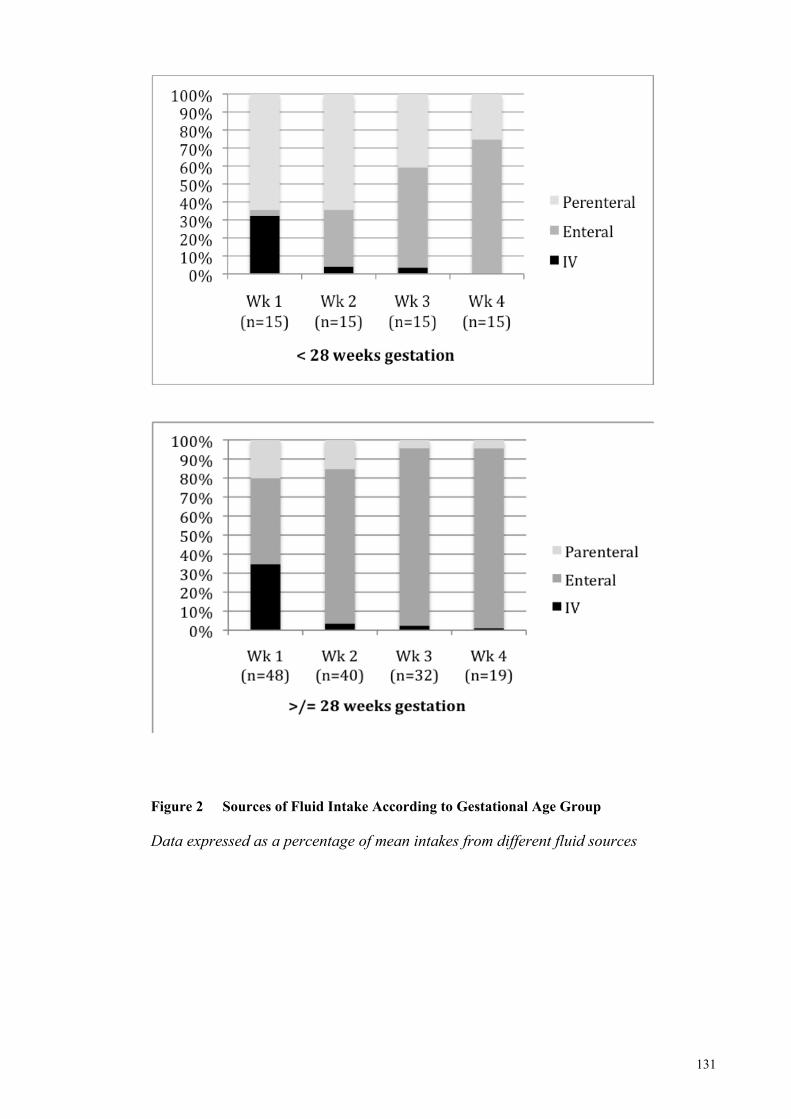
131
Figure 2 Sources of Fluid Intake According to Gestational Age Group Data expressed as a percentage of mean intakes from different fluid sources
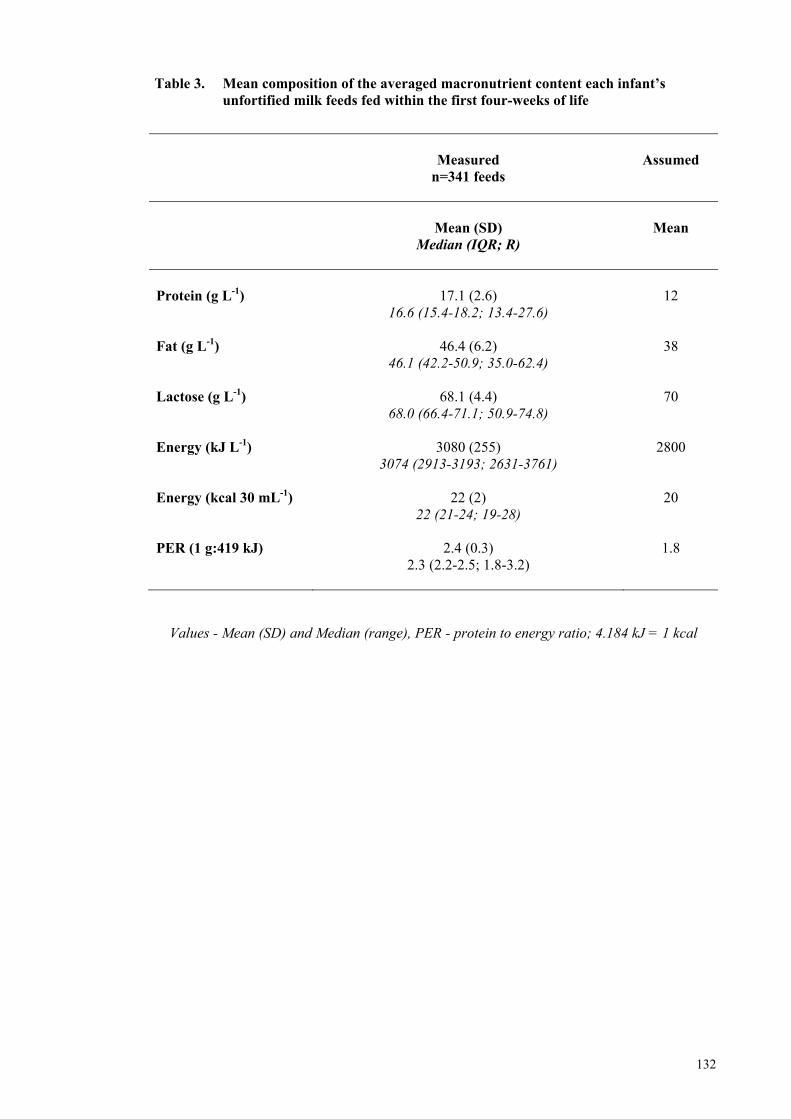
132
Table 3. Mean composition of the averaged macronutrient content each infant’s unfortified milk feeds fed within the first four-weeks of life
Measured
n=341 feeds
Assumed
Mean (SD)
Median (IQR; R)
Mean
Protein (g L-1)
17.1 (2.6)
16.6 (15.4-18.2; 13.4-27.6)
12
Fat (g L-1)
46.4 (6.2) 46.1 (42.2-50.9; 35.0-62.4)
38
Lactose (g L-1)
68.1 (4.4) 68.0 (66.4-71.1; 50.9-74.8)
70
Energy (kJ L-1)
3080 (255) 3074 (2913-3193; 2631-3761)
2800
Energy (kcal 30 mL-1)
22 (2) 22 (21-24; 19-28)
20
PER (1 g:419 kJ)
2.4 (0.3) 2.3 (2.2-2.5; 1.8-3.2)
1.8
Values - Mean (SD) and Median (range), PER - protein to energy ratio; 4.184 kJ = 1 kcal
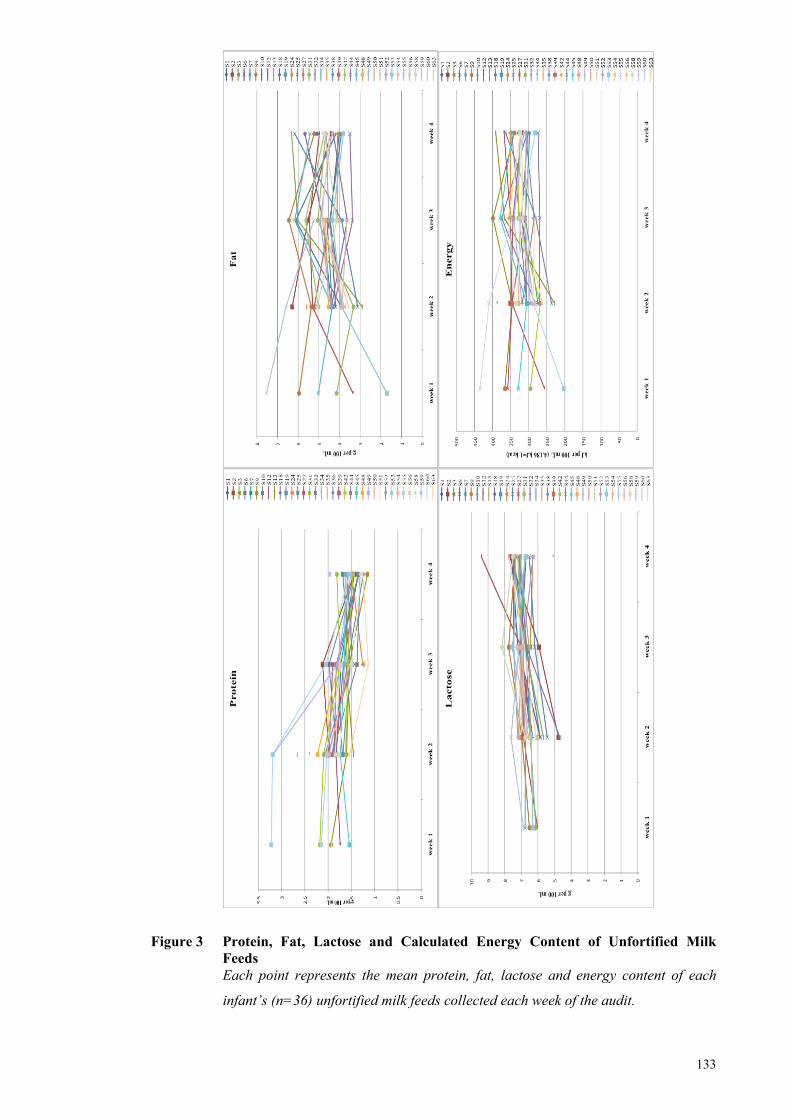
133
Figure 3 Protein, Fat, Lactose and Calculated Energy Content of Unfortified Milk Feeds Each point represents the mean protein, fat, lactose and energy content of each
infant’s (n=36) unfortified milk feeds collected each week of the audit.
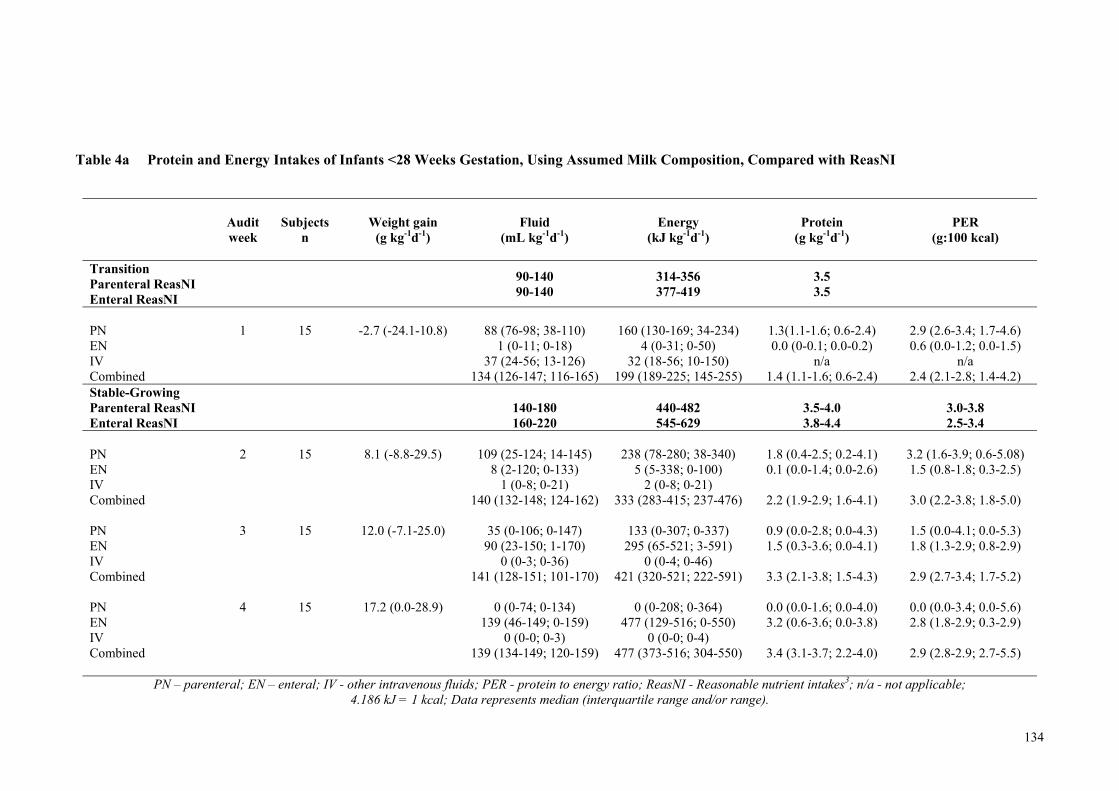
134
Table 4a Protein and Energy Intakes of Infants <28 Weeks Gestation, Using Assumed Milk Composition, Compared with ReasNI
Audit week
Subjects
n
Weight gain
(g kg-1d-1)
Fluid
(mL kg-1d-1)
Energy
(kJ kg-1d-1)
Protein
(g kg-1d-1)
PER
(g:100 kcal)
Transition Parenteral ReasNI Enteral ReasNI
90-140 90-140
314-356 377-419
3.5 3.5
PN 1
15
-2.7 (-24.1-10.8) 88 (76-98; 38-110) 160 (130-169; 34-234) 1.3(1.1-1.6; 0.6-2.4) 2.9 (2.6-3.4; 1.7-4.6) EN 1 (0-11; 0-18) 4 (0-31; 0-50) 0.0 (0-0.1; 0.0-0.2) 0.6 (0.0-1.2; 0.0-1.5) IV 37 (24-56; 13-126) 32 (18-56; 10-150) n/a n/a Combined 134 (126-147; 116-165) 199 (189-225; 145-255) 1.4 (1.1-1.6; 0.6-2.4) 2.4 (2.1-2.8; 1.4-4.2) Stable-Growing Parenteral ReasNI Enteral ReasNI
140-180 160-220
440-482 545-629
3.5-4.0 3.8-4.4
3.0-3.8 2.5-3.4
PN 2
15
8.1 (-8.8-29.5) 109 (25-124; 14-145) 238 (78-280; 38-340) 1.8 (0.4-2.5; 0.2-4.1) 3.2 (1.6-3.9; 0.6-5.08) EN 8 (2-120; 0-133) 5 (5-338; 0-100) 0.1 (0.0-1.4; 0.0-2.6) 1.5 (0.8-1.8; 0.3-2.5) IV 1 (0-8; 0-21) 2 (0-8; 0-21) Combined 140 (132-148; 124-162) 333 (283-415; 237-476) 2.2 (1.9-2.9; 1.6-4.1) 3.0 (2.2-3.8; 1.8-5.0) PN 3
15
12.0 (-7.1-25.0) 35 (0-106; 0-147) 133 (0-307; 0-337) 0.9 (0.0-2.8; 0.0-4.3) 1.5 (0.0-4.1; 0.0-5.3) EN 90 (23-150; 1-170) 295 (65-521; 3-591) 1.5 (0.3-3.6; 0.0-4.1) 1.8 (1.3-2.9; 0.8-2.9) IV 0 (0-3; 0-36) 0 (0-4; 0-46) Combined 141 (128-151; 101-170) 421 (320-521; 222-591) 3.3 (2.1-3.8; 1.5-4.3) 2.9 (2.7-3.4; 1.7-5.2) PN 4
15
17.2 (0.0-28.9) 0 (0-74; 0-134) 0 (0-208; 0-364) 0.0 (0.0-1.6; 0.0-4.0) 0.0 (0.0-3.4; 0.0-5.6) EN 139 (46-149; 0-159) 477 (129-516; 0-550) 3.2 (0.6-3.6; 0.0-3.8) 2.8 (1.8-2.9; 0.3-2.9) IV 0 (0-0; 0-3) 0 (0-0; 0-4) Combined 139 (134-149; 120-159) 477 (373-516; 304-550) 3.4 (3.1-3.7; 2.2-4.0) 2.9 (2.8-2.9; 2.7-5.5)
PN – parenteral; EN – enteral; IV - other intravenous fluids; PER - protein to energy ratio; ReasNI - Reasonable nutrient intakes3; n/a - not applicable; 4.186 kJ = 1 kcal; Data represents median (interquartile range and/or range).
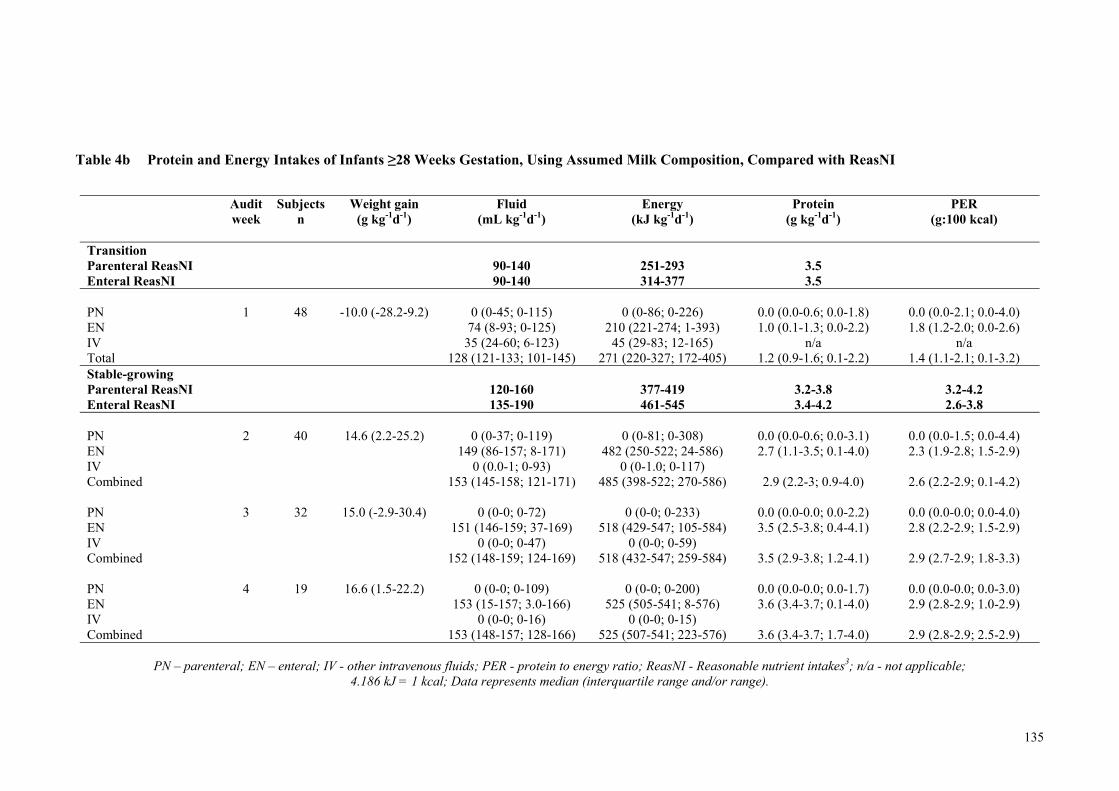
135
Table 4b Protein and Energy Intakes of Infants ≥28 Weeks Gestation, Using Assumed Milk Composition, Compared with ReasNI
Audit week
Subjects n
Weight gain (g kg-1d-1)
Fluid (mL kg-1d-1)
Energy (kJ kg-1d-1)
Protein (g kg-1d-1)
PER (g:100 kcal)
Transition Parenteral ReasNI Enteral ReasNI
90-140 90-140
251-293 314-377
3.5 3.5
PN 1
48 -10.0 (-28.2-9.2) 0 (0-45; 0-115) 0 (0-86; 0-226) 0.0 (0.0-0.6; 0.0-1.8) 0.0 (0.0-2.1; 0.0-4.0)
EN 74 (8-93; 0-125) 210 (221-274; 1-393) 1.0 (0.1-1.3; 0.0-2.2) 1.8 (1.2-2.0; 0.0-2.6) IV 35 (24-60; 6-123) 45 (29-83; 12-165) n/a n/a Total 128 (121-133; 101-145) 271 (220-327; 172-405) 1.2 (0.9-1.6; 0.1-2.2) 1.4 (1.1-2.1; 0.1-3.2) Stable-growing Parenteral ReasNI Enteral ReasNI
120-160 135-190
377-419 461-545
3.2-3.8 3.4-4.2
3.2-4.2 2.6-3.8
PN 2
40 14.6 (2.2-25.2) 0 (0-37; 0-119) 0 (0-81; 0-308) 0.0 (0.0-0.6; 0.0-3.1) 0.0 (0.0-1.5; 0.0-4.4)
EN 149 (86-157; 8-171) 482 (250-522; 24-586) 2.7 (1.1-3.5; 0.1-4.0) 2.3 (1.9-2.8; 1.5-2.9) IV 0 (0.0-1; 0-93) 0 (0-1.0; 0-117) Combined 153 (145-158; 121-171) 485 (398-522; 270-586) 2.9 (2.2-3; 0.9-4.0) 2.6 (2.2-2.9; 0.1-4.2) PN 3
32 15.0 (-2.9-30.4) 0 (0-0; 0-72) 0 (0-0; 0-233) 0.0 (0.0-0.0; 0.0-2.2) 0.0 (0.0-0.0; 0.0-4.0)
EN 151 (146-159; 37-169) 518 (429-547; 105-584) 3.5 (2.5-3.8; 0.4-4.1) 2.8 (2.2-2.9; 1.5-2.9) IV 0 (0-0; 0-47) 0 (0-0; 0-59) Combined 152 (148-159; 124-169) 518 (432-547; 259-584) 3.5 (2.9-3.8; 1.2-4.1) 2.9 (2.7-2.9; 1.8-3.3) PN 4
19 16.6 (1.5-22.2) 0 (0-0; 0-109) 0 (0-0; 0-200) 0.0 (0.0-0.0; 0.0-1.7) 0.0 (0.0-0.0; 0.0-3.0)
EN 153 (15-157; 3.0-166) 525 (505-541; 8-576) 3.6 (3.4-3.7; 0.1-4.0) 2.9 (2.8-2.9; 1.0-2.9) IV 0 (0-0; 0-16) 0 (0-0; 0-15) Combined 153 (148-157; 128-166) 525 (507-541; 223-576) 3.6 (3.4-3.7; 1.7-4.0) 2.9 (2.8-2.9; 2.5-2.9)
PN – parenteral; EN – enteral; IV - other intravenous fluids; PER - protein to energy ratio; ReasNI - Reasonable nutrient intakes3; n/a - not applicable;
4.186 kJ = 1 kcal; Data represents median (interquartile range and/or range).
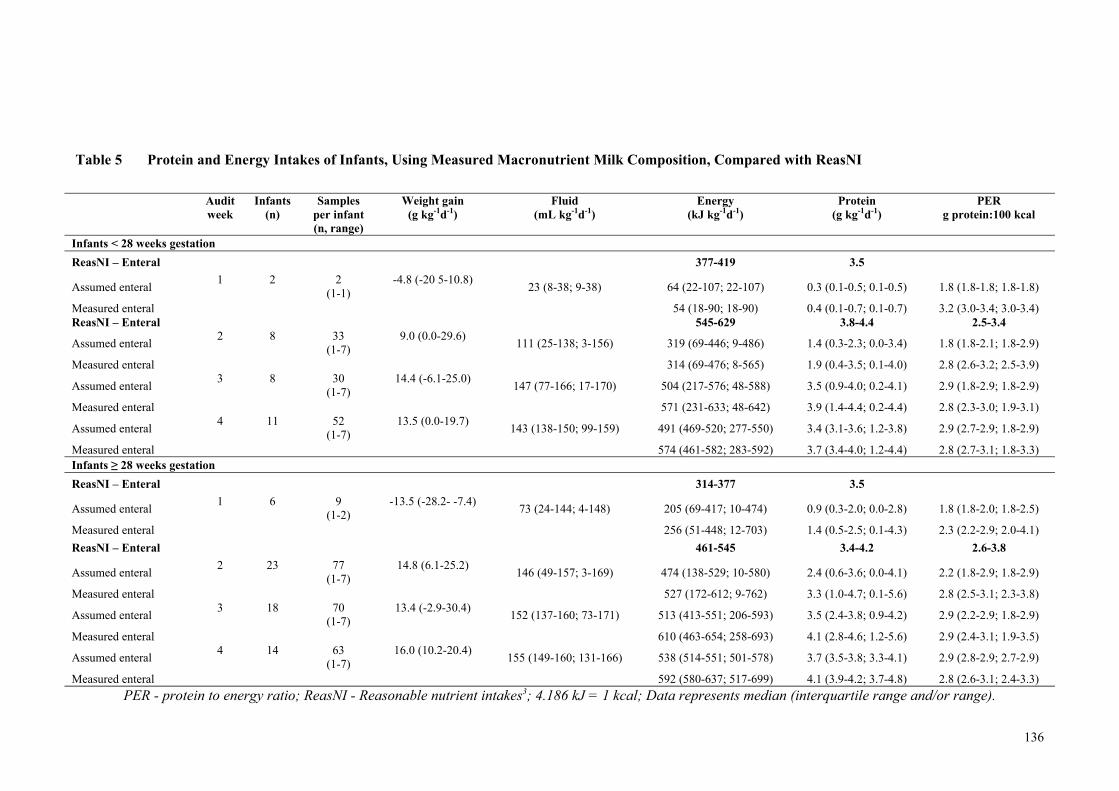
136
Table 5 Protein and Energy Intakes of Infants, Using Measured Macronutrient Milk Composition, Compared with ReasNI
Audit week
Infants (n)
Samples per infant (n, range)
Weight gain (g kg-1d-1)
Fluid (mL kg-1d-1)
Energy (kJ kg-1d-1)
Protein (g kg-1d-1)
PER g protein:100 kcal
Infants < 28 weeks gestation
ReasNI – Enteral 377-419 3.5
Assumed enteral 1 2 2
(1-1) -4.8 (-20 5-10.8)
23 (8-38; 9-38) 64 (22-107; 22-107) 0.3 (0.1-0.5; 0.1-0.5) 1.8 (1.8-1.8; 1.8-1.8)
Measured enteral 54 (18-90; 18-90) 0.4 (0.1-0.7; 0.1-0.7) 3.2 (3.0-3.4; 3.0-3.4) ReasNI – Enteral 545-629 3.8-4.4 2.5-3.4
Assumed enteral 2 8 33
(1-7) 9.0 (0.0-29.6)
111 (25-138; 3-156) 319 (69-446; 9-486) 1.4 (0.3-2.3; 0.0-3.4) 1.8 (1.8-2.1; 1.8-2.9)
Measured enteral 314 (69-476; 8-565) 1.9 (0.4-3.5; 0.1-4.0) 2.8 (2.6-3.2; 2.5-3.9)
Assumed enteral 3 8 30
(1-7) 14.4 (-6.1-25.0)
147 (77-166; 17-170) 504 (217-576; 48-588) 3.5 (0.9-4.0; 0.2-4.1) 2.9 (1.8-2.9; 1.8-2.9)
Measured enteral 571 (231-633; 48-642) 3.9 (1.4-4.4; 0.2-4.4) 2.8 (2.3-3.0; 1.9-3.1)
Assumed enteral 4 11 52
(1-7) 13.5 (0.0-19.7)
143 (138-150; 99-159) 491 (469-520; 277-550) 3.4 (3.1-3.6; 1.2-3.8) 2.9 (2.7-2.9; 1.8-2.9)
Measured enteral 574 (461-582; 283-592) 3.7 (3.4-4.0; 1.2-4.4) 2.8 (2.7-3.1; 1.8-3.3) Infants ≥ 28 weeks gestation
ReasNI – Enteral 314-377 3.5
Assumed enteral 1 6 9
(1-2) -13.5 (-28.2- -7.4)
73 (24-144; 4-148) 205 (69-417; 10-474) 0.9 (0.3-2.0; 0.0-2.8) 1.8 (1.8-2.0; 1.8-2.5)
Measured enteral 256 (51-448; 12-703) 1.4 (0.5-2.5; 0.1-4.3) 2.3 (2.2-2.9; 2.0-4.1)
ReasNI – Enteral 461-545 3.4-4.2 2.6-3.8
Assumed enteral 2 23 77
(1-7) 14.8 (6.1-25.2)
146 (49-157; 3-169) 474 (138-529; 10-580) 2.4 (0.6-3.6; 0.0-4.1) 2.2 (1.8-2.9; 1.8-2.9)
Measured enteral 527 (172-612; 9-762) 3.3 (1.0-4.7; 0.1-5.6) 2.8 (2.5-3.1; 2.3-3.8)
Assumed enteral 3 18 70
(1-7) 13.4 (-2.9-30.4)
152 (137-160; 73-171) 513 (413-551; 206-593) 3.5 (2.4-3.8; 0.9-4.2) 2.9 (2.2-2.9; 1.8-2.9)
Measured enteral 610 (463-654; 258-693) 4.1 (2.8-4.6; 1.2-5.6) 2.9 (2.4-3.1; 1.9-3.5)
Assumed enteral 4 14 63
(1-7) 16.0 (10.2-20.4)
155 (149-160; 131-166) 538 (514-551; 501-578) 3.7 (3.5-3.8; 3.3-4.1) 2.9 (2.8-2.9; 2.7-2.9)
Measured enteral 592 (580-637; 517-699) 4.1 (3.9-4.2; 3.7-4.8) 2.8 (2.6-3.1; 2.4-3.3)
PER - protein to energy ratio; ReasNI - Reasonable nutrient intakes3; 4.186 kJ = 1 kcal; Data represents median (interquartile range and/or range).
137
Figure 4 Modelled Estimates of Growth for Infants in each Age Group, Based on Total Intakes Calculated on Days when Measured Milk Composition was Available, Adjusted for Birth Weight Z-Score, Days to Fortification and Mean Total Protein Intake
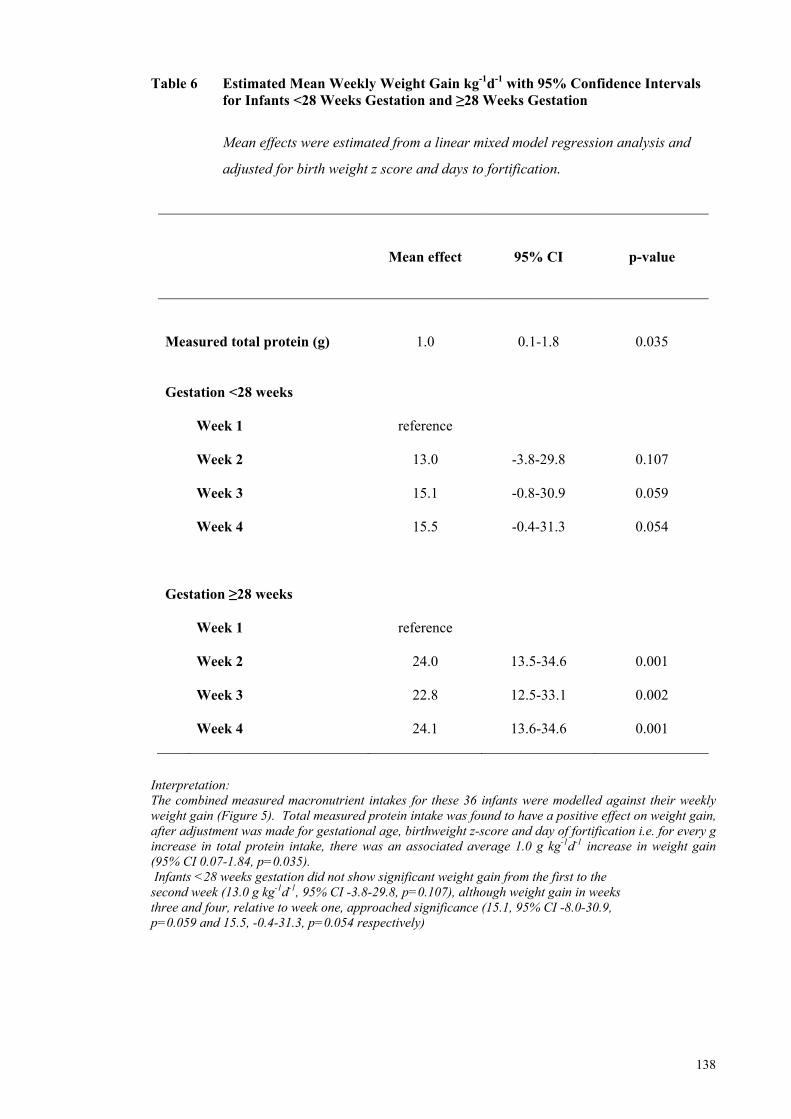
138
Table 6 Estimated Mean Weekly Weight Gain kg-1d-1 with 95% Confidence Intervals for Infants <28 Weeks Gestation and ≥28 Weeks Gestation
Mean effects were estimated from a linear mixed model regression analysis and
adjusted for birth weight z score and days to fortification.
Mean effect
95% CI
p-value
Measured total protein (g)
1.0
0.1-1.8
0.035 Gestation <28 weeks
Week 1
reference
Week 2 13.0
-3.8-29.8 0.107
Week 3 15.1
-0.8-30.9 0.059
Week 4
15.5 -0.4-31.3 0.054
Gestation ≥28 weeks
Week 1 reference
Week 2 24.0
13.5-34.6 0.001
Week 3 22.8
12.5-33.1 0.002
Week 4
24.1 13.6-34.6 0.001
Interpretation: The combined measured macronutrient intakes for these 36 infants were modelled against their weekly weight gain (Figure 5). Total measured protein intake was found to have a positive effect on weight gain, after adjustment was made for gestational age, birthweight z-score and day of fortification i.e. for every g increase in total protein intake, there was an associated average 1.0 g kg-1d-1 increase in weight gain (95% CI 0.07-1.84, p=0.035). Infants <28 weeks gestation did not show significant weight gain from the first to the second week (13.0 g kg-1d-1, 95% CI -3.8-29.8, p=0.107), although weight gain in weeks three and four, relative to week one, approached significance (15.1, 95% CI -8.0-30.9, p=0.059 and 15.5, -0.4-31.3, p=0.054 respectively)
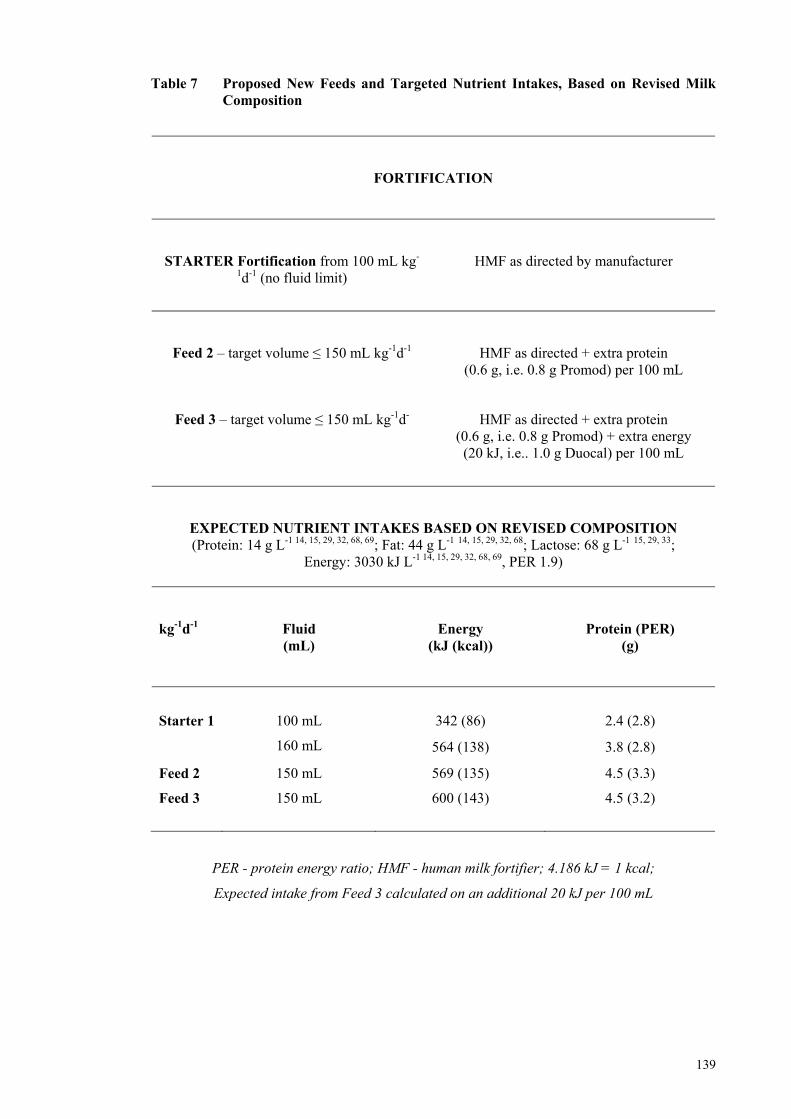
139
Table 7 Proposed New Feeds and Targeted Nutrient Intakes, Based on Revised Milk Composition
FORTIFICATION
STARTER Fortification from 100 mL kg-
1d-1 (no fluid limit)
HMF as directed by manufacturer
Feed 2 – target volume ≤ 150 mL kg-1d-1
HMF as directed + extra protein (0.6 g, i.e. 0.8 g Promod) per 100 mL
Feed 3 – target volume ≤ 150 mL kg-1d-
HMF as directed + extra protein (0.6 g, i.e. 0.8 g Promod) + extra energy
(20 kJ, i.e.. 1.0 g Duocal) per 100 mL
EXPECTED NUTRIENT INTAKES BASED ON REVISED COMPOSITION (Protein: 14 g L-1 14, 15, 29, 32, 68, 69; Fat: 44 g L-1 14, 15, 29, 32, 68; Lactose: 68 g L-1 15, 29, 33;
Energy: 3030 kJ L-1 14, 15, 29, 32, 68, 69, PER 1.9)
kg-1d-1
Fluid (mL)
Energy (kJ (kcal))
Protein (PER) (g)
Starter 1 100 mL
160 mL
342 (86) 2.4 (2.8)
564 (138) 3.8 (2.8)
Feed 2 150 mL 569 (135) 4.5 (3.3)
Feed 3 150 mL 600 (143) 4.5 (3.2)
PER - protein energy ratio; HMF - human milk fortifier; 4.186 kJ = 1 kcal;
Expected intake from Feed 3 calculated on an additional 20 kJ per 100 mL
140
PAPER 2 – BODY COMPOSITION FEASIBILITY STUDY
Feasibility study: Assessing the influence of macronutrient
intakes on the body composition of hospitalised preterm
infants, using air displacement plethysmography
Authors
Ms Gemma McLeod, MSc, APD, Centre for Neonatal Research and Education, School
of Women’s and Infants Health, The University of Western Australia and King Edward
Memorial Hospital
Professor Karen Simmer, PhD, FRACP, Winthrop Professor Newborn Medicine,
Centre for Neonatal Research and Education, School of Women’s and Infants Health,
The University of Western Australia and King Edward Memorial Hospital.
Associate Professor Jill Sherriff, PhD, AdvAPD, School of Public Health, Curtin
University, Western Australia.
Ms Elizabeth Nathan, Biostatistician, BSc, Women and Infants’ Research
Foundation, Western Australia
Dr Donna Geddes, PhD, Research Assistant Professor, School of Biomedical,
Biomolecular and Chemical Sciences, The University of Western Australia.
Professor Peter Hartmann, PhD, Winthrop Professor, School of Biomedical,
Biomolecular and Chemical Sciences, The University of Western Australia.
Corresponding author: Ms Gemma McLeod MSc APD, Centre for Neonatal Research and Education, School of Women and Infants’ Health, M550, The University of Western Australia, Subiaco, WA, 6008, Australia. Email: [email protected]; Fax 61 8 9340 1266; Tel 61 8 9340 1256 A version of this paper, uploaded after submission of the thesis for examination, is under review by Early Human Development. Impact factor 1.587
141
Abstract
Introduction Nutrition guidelines target intrauterine growth, yet at term equivalent age,
preterm infants may have an altered phenotype compared to term infants. Monitoring
early changes in body composition in response to macronutrient intakes may facilitate
our understanding of the determinants of growth and how best to meet preterm nutrition
and growth targets.
Method Macronutrient intakes of infants born <33 weeks gestation were calculated
from birth from milk composition analysis. Body composition (BC) was measured in
the PEAPOD when infants were free of intravenous lines, independent of respiratory
support and were maintaining temperature. Subsequent measurements were taken at
least fortnightly until term age. Regression analysis was used to assess macronutrient
influences on changes in BC. The BC of term infants recruited opportunistically in the
postnatal wards was compared to preterm infants at term age.
Results Preterm infants (n=27) born at a median (range) gestation of 29 (25-32) weeks
and weighing 1395 (560-2148) g were recruited. The youngest corrected (cGA) and
postnatal ages that infants qualified for a PEAPOD measurement were 31.86 and 1.43
weeks, respectively. Fat and total energy intakes were positively associated with
increasing fat mass (FM). Protein (with carbohydrate) intake was positively associated
with increasing fat free mass. Preterm infants had significantly greater FM (16.7%)
compared with term infants (8.4%) at the equivalent term age (p<0.001).
Conclusion Preterm infants can be measured in the PEAPOD as early as 31 weeks
corrected gestational age and, at term, appear to have a greater percentage FM than term
infants. Air displacement plethysmography appears sufficiently sensitive to detect BC
changes in response to alterations in nutrition.
Keywords: Body composition; air displacement plethysmography; preterm infant;
preterm nutrition
142
Introduction
Preterm infants have an altered phenotype1 compared to healthy term infants at the
equivalent corrected age2-4. Despite recommendations to increase protein and energy
intakes5 and to feed earlier and more aggressively6-8, nutrition intakes fall short of
targets9-12 and matching intrauterine growth remains an elusive goal13. It is difficult to
get the balance right14, 15. A recent measured audit (p 107, Audit Paper, Thesis) in a
busy neonatal clinical care unit (NCCU) revealed recommended reasonable intakes
were not being achieved by very preterm infants, whilst some older infants exceeded
recommended intakes and achieved weight gains greater than intrauterine rates. The
health consequences of postnatal undernutrition or accelerated growth, or both, are
unclear, but remain of concern. Epidemiological and experimental animal16-20 and
human studies21-25 suggest these outcomes may have adverse metabolic and neuro-
developmental consequences13 and may be associated with chronic morbidities.
Body composition (BC) is an important index of nutrition adequacy and warrants
further study in this vulnerable population. However, measurement methods apply
different theoretical constructs based on various assumptions, employ different
reference data, algorithms and constants to derive results and measurements are
expressed in a variety of forms. All methods have limitations26, 27. Few BC methods
have been evaluated for use in children against a four-compartment (4-C) reference
method, which is more robust in the face of inter-individual variability in the
composition of FFM28, and none has been appropriately validated for BC measurement
of preterm and term infants.
In the past five years, air displacement plethysmography technology (PEAPOD) has
been applied to the measurement of infant BC29-32 and can be used to measure infants
weighing between one and eight kilograms. The method is non-invasive and portable
and has been evaluated in term infants against a 4-C body-composition model, which
was based on measurements of total body water, bone mineral content and total body
potassium29. As a first step, we explored the feasibility of using the PEAPOD to
measure the BC of hospitalised preterm infants and assess the influences of measured
macronutrient intake on changes in BC. We compared preterm BC measured at term
corrected-age with a small reference group of term infants.
143
Methods
Preterm Infant Body Composition
All infants born <33 weeks gestation at King Edward Memorial Hospital (KEMH) in
Perth, Western Australia from 1 September to 15 October 2007, were eligible from birth
to participate in this prospective, observational study if maternal intention was to feed
human milk, if consent was given for milk analysis and if mothers agreed to their
infants participating in PEAPOD measurements. Infants were excluded if they were
born with congenital abnormalities or developed gastrointestinal illness.
Fourteen term infants were opportunistically recruited as a reference group from the
postnatal wards at KEMH.
The Ethics Committee at KEMH approved the study protocol. Prior to the study
commencing, written informed consent was obtained from each infant’s mother.
Nutrition Practice
Preterm infants were fed according to the KEMH NCCU’s 2005 feeding and
fortification practices, as previously described (pp 110-111, Audit Paper 1, Thesis).
The protocol was updated to accommodate nutritional product changes that occurred as
a result of the State-wide tender as well as to incorporate donor milk, which had
recently been introduced to the NCCU as an alternative to formula when mothers’ own
milk (MOM) was unavailable. Briefly, intravenous (IV) glucose was provided on
admission to all infants, who then either:
(i) progressed to parenteral nutrition (PN) (Baxter, Glucose 20% 1L, Baxter
Primine™ 10% 1L; Baxter™ Clinoleic™ 20% 1L) and minimal enteral
feeds (MEF) usually within two to five days of admission; or
(ii) if stable, progressed directly to enteral feeding.
Amino acids in parenteral nutrition and lipid were initially infused at 0.5 g kg-1d-1, with
step-wise daily increments until parenteral reasonable nutrient intakes (ReasNI) targets
were met5. If MOM was unavailable, donor milk (DM) (if consent was granted and
donor supply permitted) or formula was provided.
144
Human milk (HM) was fortified at 150 mL kg-1d-1 using the macronutrient composition
assumed by the hospital at the time of the study (protein 12 g L-1, fat 38 g L-1,
lactose 70 g L-1, energy 2800 kJ L-1, 20 kcal 30 mL-1). Initial fortification to Level 1
was achieved using a commercial human milk fortifier (Nutriprem, Cow & Gate,
Trowbridge, Wiltshire, 0.8 g protein 100 mL-1 milk) and a protein supplement
(Beneprotein, Novartis, Minneapolis, MN USA, 0.5 g 100 mL-1). If an infant’s fluid
intake was restricted to volumes ≤150 mL kg-1d-1, fortification was upgraded to Level 2
using additional protein (Beneprotein, as previous, total 1.0 g per 100 mL-1) and an
energy supplement (Duocal, SHS International, Liverpool, UK, 3.0 g 100 mL-1).
Fortification was ceased near discharge.
HM Feeds and Sampling
Macronutrient content was determined on an infant’s preterm milk feeds, which, for the
majority of infants, were made up from their own mothers’ individual and pooled
collections of expressed milk and may have included milk expressions from different
days. Mothers were encouraged to begin expressing milk for their infants soon after
giving birth (usually within 24 hours). For quality control, mothers used one container
per milk expression, but in the home, mothers pooled their milk. A mother’s milk was
delivered to the hospital’s central milk room and depending on stage of lactation and
volume, the milk was frozen in 14 mL, 50 mL and 200 mL containers. The policy in
the nursery was (and still is) to make up an infant’s milk feeds (for at least the first 14
days of enteral feeding), using mother’s milk in the order in which it was expressed.
This policy of feeding early frozen milk is extended to <30 weeks corrected gestation
for infants born <26 weeks gestation. This policy was instituted because freezing may
reduce risk of postnatal transmission of cytomegalovirus13 and because it is protective
for those infants needing prolonged intravenous feeding; it ensures all milk-fed infants
benefit from the recognized benefits of colostrum and transitional milk14, 15. Any
residual samples of early milk that have not been used prior to an infant receiving fresh
milk may be added to fresh milk feeds over time, until completely utilized. Thus, on
any given day, the composition of the milk feed fed to some infants (which may have
been as little 2 mL/d when feeds were first initiated) may not reflect the composition of
their mothers milk expressed ‘in real lactation time’, unless the infant has transitioned
quickly to full enteral feeds, the early and transitional milk has been exhausted and the
infant‘s feeds are being made using only freshly expressed mother’s own milk
145
On the days when supply permitted, a well-mixed sample (1-3 mL) from each infant’s
unfortified milk feed was collected in 5 mL polypropylene vials (Disposable Products
Pty Ltd, Adelaide, Australia) and frozen in a commercial freezer at -200 C until
analysed.
Biochemical BM Analysis
Macronutrient composition of milk feeds was determined by routine laboratory assay in
the Hartmann Human Milk Research Laboratory at The University of Western Australia
(Perth, Australia).
Milk Protein
The protein content of the milk feeds was determined by a modified Bradford method36
using a commercial protein reagent (Bio-Rad Laboratories, Richmond. CA, USA). The
Bio-Rad Protein Assay is a dye-binding assay in which a differential colour change of a
dye occurs in response to various concentrations of protein. The assay measures the
binding of the dye to the (mainly basic and aromatic) amino acid residues of the
proteins.
Human milk protein standard for the Bio-Rad assay were determined by the modified
Kjeldahl method, as previously described by Sherriff37, Hitchcock38 and Atwood and
Hartmann39 (p 112, Audit paper, Thesis). Briefly, after determining Total N on a sample
of milk and non-protein N (NPN) on a deproteinised sample of the milk, protein N was
calculated by subtracting the N content of deproteinised human milk from the total N
content of the milk40. Protein nitrogen was then multiplied by the Kjeldahl protein
nitrogen value of 6.25 to obtain the true protein content of the milk41.
The Bio-Rad assay has been described previously by Mitoulas et al42, The dye-reagent
concentrate was diluted 1 in 5 with double deionised water (DDI) and filtered through
Whatman No.1 filter paper (Whatman International Ltd, Springfield Mill, Kent,
England). Defatted milk samples (warmed to 370 C) were diluted 1 in 30 with DDI and
pipetted (5 μL) in duplicate, with the human milk standards of known protein
concentration (0-1.03 g L-1), on to a 96-well micro-titre plate. The prepared BioRad
reagent (250 μL) was added to each well and the plate was mixed (WellMix 2, Denley
Welltech WellMix 2, Cytosystems, Castle Hill, Australia) for approximately one minute
and left to stand at room temperature for five minutes. Absorbance was read at 620 nm
146
using a plate spectrophotometer (Biotek Powerwave XS, Winooski, VT, USA) until
peak absorbances were reached (<20 minutes). The recovery of a known amount of
protein added to milk samples was [mean ± SD] 101.42% ± 2.89 (n=10). The detection
limit of the assay was 0.7 g L-1 (n=25) and the inter-assay co-efficient of variation (CV)
was 3.26% (n=25).
Milk Fat
The milk fat concentration was determined by Stern and Shapiro’s43 spectroscopic
esterified fatty acid. Briefly, 2.5 µL of milk feed samples warmed to 370 C, together
with triolein standards (0-200 mM), were added to ethanol (500 µL) and well-mixed.
Hydroxylamine hydrochloride (2 M; 100 µL) and sodium hydroxide (3.5 M; 100 µL)
were subsequently added to each sample. The samples were mixed and left for
20 minutes at room temperature. Hydrochloric acid (4 M; 100 µL) was added to each
sample and colour production was achieved with the further addition of iron chloride
tetra-carboxylic acid solution (7.5 g TCA in 10 mL 0.37 M FeCl3-0.1 M-HCL; 100 µL).
The tube contents were mixed well and, from each tube, 250 µL was pipetted in
duplicate onto a 96-well micro-titre plate. Absorbance was determined at 540 nm, using
a plate spectrophotometer (Biotek Powerwave XS, Winooski, VT, USA). The detection
limit of the assay was 1.22 g L-1 (n=21) and the inter-assay CV was 11.5 % (n=21).
Milk Lactose
The concentration of lactose in human milk feeds was determined using the modified,
enzymatic spectroscopic method of Kuhn44. Defatted milk samples and lactose
standards (0-300 mM) were diluted (1:150) with DDI. Duplicate portions of diluted
standards and samples (5 µL) were pipetted into wells on a 96-well micro-titre plate.
To each well, lactose reagent (β-galactosidase, 0.1 M potassium phosphate buffer,
pH 7.2; 50 μL) was added, the plate was well-mixed and incubated at 370 C for one
hour. At the completion of the incubation period, glucose reagent
(9.96U glucose oxidase mL-1, 3.3U peroxidase mL-1, 300 μL 2.2-azino-di-
[3 ethyl benzthiazolin-sulfonate]-6-sulfonate mL-1; 200 μL) was added to each well and
the absorbance measured at 405 nm on a plate spectrophotometer at five minute
intervals until a peak absorbance was reached at approximately 30 minutes. The
recovery of a known amount of lactose added to milk samples was 100.9 ± 1.5% (n=8).
The detection limit of the assay was 0.97 g L-1 (n=21) and the inter-assay CV was
3.04% (n=21).
147
Milk Energy
The energy content of each unfortified milk feed was calculated using the Atwater
conversion values: protein (16 kJ g-1), fat (37 kJ g-1) and lactose (16 kJ g-1).
Nutrient Intake Data
Feeding data, from day two until discharge, were obtained retrospectively from the
daily observation charts for infants with ≥2 BC measurements, for whom milk samples
could be obtained. Intakes on day one were excluded as they were not representative of
a complete 24-hour period. The macronutrient and energy intakes for each infant’s
feeds were calculated using milk analysis data and the nutrient profiles of commercial
products. If there was insufficient milk to always obtain a sample, the most recent
macronutrient composition data was used. If a breastfeed was given and recorded as
‘breastfeed without top-up’, the amount consumed during the breastfeed was estimated
to be equivalent to that amount normally given at a scheduled feed. If a top-up was
given, the volume given was subtracted from the prescribed amount and the balance
taken as the amount of milk consumed during a breastfeed.
Body Composition (BC)
The PEAPOD (Life Measurement Inc (LMI), Concord, CA, USA) was employed to
measure the BC of the preterm infants. The BC system utilises air displacement
plethysmography technology and is designed to measure infants weighing between one
and eight kilograms. The technical design and the methodology underpinning a
PEAPOD measurement has been described elsewhere45, 46. Briefly, the PEAPOD
applies the classic, two-compartment (2-C) BC model. Total body density is estimated
from the direct measurements of body mass and volume and gas laws and densitometry
principles are applied. Correction is made for thoracic gas volume47, body surface
area48 and surface area artefact (PEAPOD Infant Body Composition System Operator’s
Manual). Percentage FM and FFM are estimated by applying the constant FM density
value of 0.9007 g mL-1, as well as predetermined FFM density values derived from
back-extrapolated, curvilinear equations modelled from the age-specific FFMD values
of Fomon et al.49 and Butte et al.47. The FFM density models, referred to as the Fomon
and Butte Density Models have been adjusted for redistribution of body water that
occurs in the early days of life. This undisclosed adjustment factor has been derived by
LMI from reference data50-56. The precision and accuracy of the PEAPOD has been
148
evaluated in term infants29, using the Butte Model and the method has also been used to
measure the BC of preterm infants2, 30, 57.
PEAPOD measurements were taken according to the LMI’s technical instruction, using
the default density model derived from the data of Fomon and colleagues58, which are
based on measurements combined from several studies, including fetal chemical data of
Widdowson et al.59. Oil was used to flatten head-hair to reduce surface area artefact.
The PEAPOD was calibrated with identification bracelets and a feeding tube if in situ at
the time of measurement. First measurements were taken as soon as the infant was
clinically and thermogenically stable (incubator <310C), free from continuous
respiratory and intravenous support and on bolus feeds. Saturation monitoring was
temporarily suspended for clinically stable infants who underwent a PEAPOD
measurement. Final measurements were taken near discharge or at the term follow-up
clinic if infants attended. Infants were measured naked, at least 30 minutes after
feeding. Recumbent length (perspex length board), weighing and volume
measurements took approximately 10 minutes.
Anthropometric Data
Infants requiring intensive care (NICU) were weighed daily, either in their incubator or
with digital scales (g; SECA, Germany 10/20 kg). Those in special care were weighed
twice weekly, with daily weight derived by interpolation between the two time points.
Weight gain velocity (g kg-1d-1) was calculated using an exponential model that has
been validated in preterm infants - [1000*Ln(Wn/W1)]/(Dn - D1), where Ln is the natural
logarithm, W is the weight in grams, D is day, 1 is the beginning of the time interval and
n is the end of the time interval60, 61. Birth weight was converted to z-score using
Australian national birth weight data62.
Statistical Analysis
Descriptive statistics were based on means and standard deviations or medians,
interquartile ranges and ranges, according to data normality, for continuous data.
Frequency distributions were used to summarise categorical data. Univariate
comparisons of body composition measurements between term and preterm infants
were analysed using Mann-Whitney tests for continuous outcomes and Fisher exact
tests for categorical outcomes. Patterns of growth and body composition parameters for
preterm infants were analysed using linear mixed models to account for the correlation
149
between repeated measurements. Intake of carbohydrate, protein and lipid, and clinical
characteristics including gender, hours on ventilation, continuous positive air pressure
(CPAP), supplemental oxygen, phototherapy, number of course of antibiotics, patent
ductus arteriosus, days to full enteral feeds and days to fortified feeds were assessed for
their effect on weight gain, FM, FFM, length and head circumference. All models were
assessed for a quadratic time component and adjustment was made for gestational age at
birth and corrected gestational age at time of test. SAS 9.1 statistical software was used
for data analysis. All tests were two-tailed and p-values <0.05 were considered
statistically significant.
Results
Recruitment
Fifty-one preterm infants were born <33 weeks at KEMH during a six-week period
from 1 September 2007. Infants were excluded due to death (n=4), congenital
abnormality (n=1) and necrotising enterocolitis (n=1). Consent was refused for six
infants, three mothers withdrew consent and incomplete data for nine infants (early
transfer n=5; early discharge n=4) were not analysed. Twenty-seven preterm infants
(male n=7, Caucasian n=21, Aboriginal n=3, Asian n=3) participated in the study
(appropriate for gestational age (AGA) n=23; small for gestational age (SGA) n=4),
comprising one set of triplets, two sets of twins and 20 singletons. Nutrition intake
data, comprehensive milk analysis and serial BC data were available for 20 infants, and
term BC data only were available for the remaining seven infants. The gestational age
and birth weight of the infants ranged from 25 to 32 weeks and from 560 to 2148 g,
respectively. Infants were parenterally fed for a median of 15 days (n=17), took
between one and 35 days to achieve full enteral feeds and feeds were fortified on day
14. The clinical characteristics of the preterm infants are summarised in Table 1.
Qualifying for a BC Measurement
All infants were measured in the PEAPOD at least once but up to six times during their
admission, meeting our criteria for measurement at a range of corrected
[median, IQR, range] (33.57, 33.0-35.43; 31.86-42.0 wk) and postnatal (3.57, 2.0-7.28;
1.43-8.43 wk) ages. This includes the youngest infant, born at 25 weeks and three days,
whose mother preferred to delay her infant’s first PEAPOD measurement until
corrected-term age. The next youngest infant, born at a gestation of 25 weeks and six
150
days, was measured at 45 days of age, at a cGA of 32 weeks and two days. Sixty days
was the longest time taken by an infant, born at 27 weeks gestation, to meet the criteria
for a measurement, at a cGA of 35 weeks and four days. The most mature infant, born
at a gestation of 32 weeks and three days, qualified for measurement at 25 days of age
(i.e. cGA 36 weeks). Up to four measurements were used for each infant (n=20) who
participated in serial measurements: 20 measurements were available for time point 1
(mean postnatal age 4.3 weeks) and time point 2 (5.4 weeks); 16 for time point 3
(6.4 weeks) and 12 for time point 4 (7.2 weeks) (Figure 3). The BC of 17 preterm
infants was measured at term corrected age, including 10 infants for whom serial BC
measurements and milk analysis were performed.
Milk Composition
Samples of milk feeds (n=503) were collected for the 20 infants who participated in
serial measurements. Sixteen mothers provided the milk for these feeds. The median
(range) number of milk feed samples per infant was 27 (11-50). The mean composition
of each infant’s averaged unfortified milk feed composition was variable and similar to
the mean composition of averaged milk feeds previously measured in our Unit (p 132,
Audit Paper, Thesis). The median (range) protein (g), fat (g), carbohydrate (g) mL) and
energy (kJ) content of the feeds were 16 (12-19) g L-1, 44 (35-60) g L-1, 63 (55-72) g L-1
and 3020 kJ L-1 (22 kcal per 30 mL), respectively (Table 2).
Nutrition and Body Composition
Eighty-five percent, by volume, of the total nutrition consumed by infants was fed
enterally. The major component (88% by volume) was human milk. The mothers of
the infants provided 93% of the milk and the remaining portion was donor milk.
Combined intakes were fed at an average rate of 150 mL kg-1d-1 and the mean protein,
fat, carbohydrate and energy intakes achieved were 3.4 g kg-1d-1, 6.0 g kg-1d-1,
12.9 g kg-1d-1 and 500 kJ kg-1d-1 (119 kcal kg-1d-1), respectively. The mean combined
protein to energy ratio was 2.9 (Table 3).
At a mean postnatal age of 4.3 weeks, these 20 preterm infants had an unadjusted mean
percentage FM of 7.9%. By 7.2 weeks, their percentage FM had almost doubled to
14.7% (Figure 2). The mean (SD) rate of weight gain achieved by these infants from
birth to a postnatal age of seven weeks was 11.5 (2.5) g kg-1d-1. Mixed model
151
regression analysis showed that total energy (kJ kg-1d-1) and fat (g kg-1d-1) intake
increased FM (1.6 g, 95% CI 0.0-2.3, p<0.001 and 22 g, 95%CI 7.0-37.0, p=0.038),
respectively. However, hours on continuous positive airway pressure (CPAP)
moderated their respective effects (-0.2 g, 95%CI -0.3- (-0.1), p=0.037 and -0.2 g,
95%CI -0.3- (-0.1), p=0.003). Fat intake (0.6, 95% CI 0.2-1.0, p=0.004) was
significantly associated with increased length. Protein intake positively affected rate of
weight gain (6.6 g, 95% CI 4.0-9.2, p<0.001), which tapered with increasing age
(p=0.020). With the inclusion of carbohydrate in the model, protein was also positively
associated with FFM (p=0.032). Hours on CPAP negatively affected growth and
nutrient accretion (Table 4).
Preterm versus Term Body Composition
The 17 preterm infants (SGA n=4) measured in the PEAPOD at corrected term-age and
a median postnatal age of 65 days, were significantly different in BC from term infants
(n=14, SGA n=1, AGA n=13) measured at: median age (2 days);
weight (2696 g vs. 3245 g, p=0.032); length (47.6 cm vs. 49.8 cm, p=0.041);
estimated fat (414 g vs. 226 g, p=0.000) and %FM (15.4% vs. 6.8%, p=0.000).
Five preterm infants had weights below the 10th percentile at measurement and the
weight of another was above the 90th percentile.
When only the AGA preterm (n=13) and term (n=13) infants were compared at the term
measurement, there were no longer significant differences in their median weights
(2871 g vs. 3262 g, p=0.106) and lengths (48.2 cm vs. 49.9 cm, p=0.182) but the
significant differences in their median FM (442 g vs. 239 g, p=0.003) and %FM
(15.1% vs. 6.9%, p=0.001) remained.
Discussion
The PEAPOD is a relatively new device that can measure the BC of infants weighing
between one to eight kilograms. It has been programmed with undisclosed curvilinear
density models that have been developed by LMI (Concord, CA, USA), using the age
and gender-specific FFM density constants of Fomon et al.58 or Butte et al47. Two
studies have evaluated the reliability and accuracy of the PEAPOD BC measurement
using Butte’s density model. One study employed the deuterium dilution method63,
using the FFM hydration coefficients of Butte et al.47, and the second used a multi-
152
component model incorporating measurement of total body water (TBWater),
whole-body potassium counting and measurement of bone mineral content using
DXA29. Ma et al63 found the PEAPOD measurement to be more precise the heavier the
infant63, which may relate to the volume of air surrounding the infant in the chamber, as
Garrow64 suggests the smaller the volume of air surrounding a subject, the more precise
the body volume measurement. The investigators of both studies concluded however,
that the PEAPOD is able to provide accurate estimates of FM in term infants29, 63. By
backward extrapolation of these Density models, LMI (Concord, CA, USA) have
derived estimates of FFM density constants for younger infants, permitting the
assessment of preterm BC in the 2-C system. The usefulness and accuracy of this
method in determining the fat mass of preterm infants is yet to be evaluated.
This pilot study is the first in Australia to report the BC of preterm infants using the
PEAPOD and to assess the influence of macronutrient intakes on preterm BC using
analysed milk. The mean protein and energy content and PER of the milk feeds were
similar in composition to those analysed during a recent audit of early nutrition practice
(p 132, Audit Paper, Thesis). The audit showed that protein intake was associated with
weight gain, a finding confirmed in this present study, which also revealed that protein
intakes were below those recommended to achieve growth targets5, 65. These findings
highlight the need to review the NCCU’s feeding protocols and supports the
recommendation arising from the audit to increase the protein content and PER of feeds.
Regression modelling showed that carbohydrate worked synergistically with protein to
increase FFM. The mechanism for this synergy may be mediated through the action of
insulin, which is secreted in response to feeding both glucose and protein66. Insulin acts
through signalling pathways to stimulate the translocation of the glucose transporter,
Glut4 in skeletal muscle, thereby promoting uptake of glucose67. Insulin also inhibits
muscle proteolysis and promotes uptake of the branched chain amino acids, leucine,
iso-leucine and valine into muscle. Leucine may also modulate glucose uptake68 and
appears to play a regulatory role in muscle protein metabolism69. Interestingly, fat
intake promoted an increase in length, perhaps by providing an alternative energy
source, thus sparing protein for growth. Fat and energy intakes, but not protein, were
both associated with increasing FM. Notably, being on continuous positive airway
pressure appeared to reduce all parameters of an infant’s growth, perhaps because the
work of breathing is relatively hard on CPAP, compared to ventilation and normal work
153
of breathing. At corrected term age, preterm infants were lighter, shorter and fatter than
their term peers, outcomes observed by others2, 30 who have measured and compared the
BC of preterm and term infants using this method (Table 5). Thus, the protein intake
achieved, and the ratio of protein, fat and carbohydrate to total energy are important
determinants of growth and body composition. It is crucial that these factors are
considered then, by scientists who formulate commercial human milk fortifiers and
formulae, and by clinicians who are involved in developing fortification and parenteral
and enteral preterm feeding regimens.
The inclusion of a large proportion of SGA infants in their preterm cohort may explain
why the infants measured by Roggero et al2 had lower mean body weight and lower
%FM compared with the preterm infants measured in this current study. This seems
plausible, as the mean %FM of SGA infants reported in an earlier study published by
these Italian investigators30 was lower than that of the mixed cohort of SGA and AGA
preterm infants in a recent paper2. As well, the difference in the weight of the preterm
and term infants in this present study was no longer significant when the data were
reanalysed excluding the SGA infants. The mean estimates of %FM of the
term corrected preterm infants in these three studies were in the range of
14.3% to 16.7%, and were in reasonable agreement to reference data for term infants
(~14%58 to 16%59). This result is not entirely unexpected, given Fomon et al.58 used the
BC data of Widdowson et al.59 to describe the composition of the reference infant at
birth and Fomon’s density model was chosen to measure the infants in this study.
It is notable, however, that in each of these studies the mean %FM of the term infants
measured in the PEAPOD in the first week of life was significantly lower than that of
the preterm groups and also lower than that of the reference term infant derived by
Fomon et al58. Another group of Australian investigators who measured term infants at
the same age using this method, reported similar, low estimates of %FM70, as have
Roggero et al71, who recently reported longitudinal BC data for a group of breastfed
term infants. Interestingly, the 40% increase from birth, in the mean %FM of the
infants measured at two weeks of age71, is much greater than that which occurs in the
reference infant, whose %FM at one month is only 10% greater than the percentage FM
of the reference term infant at birth. Roggero’s estimate of the mean percentage FM of
two week-old, breastfed term-born infants is in good agreement with the mean estimate
154
reported by a Swedish group of investigators, who also measured the BC of breastfed
infants in the second week of life using this method32.
According to the manufacturers, a correction factor, accounting for average fluctuations
in hydration levels of infants during the first six days of life72, has already been applied
to the density models used in the PEAPOD. However, one might speculate that the
disparities in %FM measurements between term infants measured in the first and
second weeks of life, and between preterm and term infants measured at the equivalent
term age, may be partly explained by the abrupt contraction of the extracellular
compartment and the loss of excess extravascular fluid and limited intake that occurs in
the immediate postpartum period73. At birth, the percentage body water of preterm
infants is higher than that for term infants74 and it is not uncommon in the first few
weeks of life, during the adaptation to the extrauterine environment, for sick, very
preterm infants to lose up to 20% of their body weight before regaining birth weight75.
However, in this and previous studies2, 30, preterm infants have been measured in the
PEAPOD, at the equivalent term age, when they are consuming reasonable nutrient
intakes and achieving steady weight gain. The FM and %FM of infants in these studies
have been compared to that of term infants who were measured in the PEAPOD within
the first week of life. It is possible that infants born at term are still adjusting to the
extrauterine environment and fluid shifts that occur during this time (i.e. term infants
may lose up to 10% of their birth weight in the first week or two of life73). It is
postulated therefore, that measuring term infants in the PEAPOD in the first week of
life may produce spurious results, leading to misinterpretation of the extent to which the
preterm vs the term phenotype is altered at the equivalent age of term.
According to the PEAPOD manufacturers (LMI, Concord, CA, USA), the reference
data50, 51, 53-56, 76 that they employed to derive the correction factor that has been applied
to the density models in the PEAPOD were obtained from published bioelectrical
impedance studies 50, 53 and studies based on dilution methods. Data obtained by BIA
are influenced by the hydration coefficient of FFM, so that the precision and accuracy
of measurements have been questioned77. The dilution studies used a variety of tracers
to measure extracellular and total body water (TBW), including antipyrene55, bromide55,
deuterium oxide51, 54 and sucrose54. The behaviour of these infused tracers affects the
validity of the assumptions underlying the dilution principle and the accuracy of the
measurement78. For example, as documented by Schoeller78, non-isotopic tracers
155
including antipyrine and sucrose are rapidly metabolised, resulting in significant
elimination from the body during equilibration78. Further, deuterium is incorporated
into organic molecules54; failing to correct for this54 results in an overestimation of
TBW. Fomon and colleagues58 underestimated the deuterium correction factor when
using TBW values determined by deuterium dilution to construct the reference infant78,
possibly resulting in an underestimation of FM at all ages47. These hydration
coefficients have since been recalculated by Schoeller78, assuming an original 4%
overestimation [(eg. males - original vs. corrected): Birth 80.6, 1 m 80.5 vs. 80.1, 2 m
80.3 vs. 79.8, 3 m 80.0 vs. 79.6, 6 m 79.6 vs. 79.2; (females - original vs. corrected):
Birth 80.6 1 m 80.5 vs. 80.1, 2 m 80.2 vs. 79.7, 3 m 79.9 vs. 79.5, 6 m 79.4 vs. 78.9],
but corrections to the infant FFMD values of Fomon et al. 58 have yet to be published.
The age and gender-specific FFM densities of Fomon et al.58 developed for term infants
and modelled and back extrapolated by LMI (Concord, CA, USA) to create the Fomon
Density Model for the PEAPOD, were calculated using predicted mean values for each
of the variables making up the FFM compartment; i.e. protein, water and mineral
(glycogen was assumed). The potential error inherent in using Fomon’s predicted mean
values cannot be assessed58, but it is likely that the PEAPOD measurement has limited
capacity to detect inter-individual variability. As well, the assumption underlying the
‘Fomon’ (and ‘Butte’) Density Models is that preterm infants grow and accrue nutrients
at a similar rate to the healthy fetus delivered at term. However, preterm birth is often
the end result of a compromised pregnancy1 and postnatal nutrition starkly contrasts that
of the healthy fetus who develops in an anabolic environment, taking up high amounts
of amino acids, moderate amounts of glucose and small amounts of lipid across the
placenta79, 80. In contrast, the preterm infant is initially fed intravenous solutions,
containing low amounts of amino acids, varying amounts of glucose and high amounts
of lipid12, 81. Progression to full and fortified feeds can take weeks to achieve and
recommended reasonable targets of intake5 are often not met, due to a number of
factors. Furthermore, disease state, mineral loss, hydration status and degree of
maturity are other factors pertinent to the preterm infant that can potentially affect the
composition of fat free mass. When we accept these backward extrapolated estimates of
FFM density for preterm infants, an awareness of the limitations and the assumptions
upon which the estimates are based is helpful in interpreting the data.
156
The capacity to measure infants in the PEAPOD was constrained by (i) the age at which
infants met the criteria for a measurement, which was influenced by clinical stability
and prematurity; (ii) the length of an infant’s stay and attendance at the corrected-term
age follow-up clinic; and (iii) the sufficiency of the mothers’ milk supply, thus enabling
milk analysis. These factors are difficult to control. The measurement protocol used in
this study was appropriate for hospitalised preterm infants. Infants were measured as
soon as the criteria for measurement were met; however, as can be expected in infants
born <33 weeks gestation, immaturity, chronic lung disease, feeding intolerance and
late-onset sepsis can extend the requirement for a temperature controlled environment,
respiratory support, intravenous access and continuous feeds, delaying the time to first
measurement. It remains to be tested whether the size of an infant in the measurement
chamber affects the precision or accuracy of the measurement, but it is noteworthy that
Ma et al.63 found the PEAPOD measurement to be more precise the heavier the infant,
and Garrow64 suggests the smaller the volume of air surrounding a subject in an air
displacement plethysmograph, the more precise the body volume measurement. Small
infants in this study were at risk of becoming cold when weight and length
measurements were being taken, prior to measuring their body volume in the test
chamber, where the temperature of the circulating air is maintained constant by the
PEAPOD system at 310C. In retrospect, undressing the infant and taking the length
measurement under the warmth of a radiant heater would assist in keeping infants warm
just prior to taking the measurement.
The PEAPOD was found to be a safe and efficient method of measuring body
composition of preterm infants. The method was sensitive to assessing the influence of
macronutrients and total energy on changes in composition of growth. Protein intakes
achieved by the infants in this study were below those recommended to achieve growth
targets5, 65 and the preterm infants were fatter than term infants at an equivalent age,
highlighting the need to review standard fortification and the Unit’s routine parenteral
and enteral feeding practices. It is believed further evaluation of the PEAPOD is
required, preferably against methods that do not employ the FFM hydration constants
derived by either Butte et al.47 or Fomon et al58, as this reduces the rigor of the
assessment. Additional evaluation of the PEAPOD is also required in relation to BC
measurements taken in the first week of life and when applied to the measurement of
hospitalised preterm infants.
157
References (Paper 2)
1. Vasu V, Modi N. Assessing the impact of preterm nutrition. Early Human Development. 2007; 83(12): 813-8. 2. Roggero P, Gianni ML, Amato O, Orsi A, Piemontese P, Morlacchi L, et al. Is term newborn body composition being achieved postnatally in preterm infants? Early Hum Dev. 2009; 85(6): 349-52. 3. Cooke RJ, Griffin I. Altered body composition in preterm infants at hospital discharge. Acta Paediatr. 2009; 98(8): 1269-73. 4. Uthaya S, Thomas EL, Hamilton G, Dore CJ, Bell J, Modi N. Altered adiposity after extremely preterm birth. Pediatr Res. 2005; 57(2): 211-5. 5. Tsang RC, Uauy R, Koletzko B, Zlotkin SH, editors. Nutrition of the preterm infant. Scientific basis and practical guidelines. 2nd Edition ed. Cincinnati, Ohio: Digital Educational Publishing, Inc.; 2005. 6. Ehrenkranz RA. Early, aggressive nutritional management for very low birth weight infants: what is the evidence? Semin Perinatol. 2007; 31(2): 48-55. 7. Thureen PJ. Early aggressive nutrition in very preterm infants. Nestle Nutr Workshop Ser Pediatr Program. 2007; 59: 193-204; discussion -8. 8. Thureen PJ, Hay WW, Jr. Early aggressive nutrition in preterm infants. Seminars in Neonatology. 2001; 6(5): 403-15. 9. Arslanoglu S, Moro G, Ziegler E. Preterm infants fed fortified human milk receive less protein than they need. J Perinatol. 2009; 29: 489-92. 10. Martin CR, Brown YF, Ehrenkranz RA, O'Shea TM, Allred EN, Belfort MB, et al. Nutritional practices and growth velocity in the first month of life in extremely premature infants. Pediatrics. 2009; 124(2): 649-57. 11. Cormack B, Sinn J, Lui K, Tudehope D. Australasian neonatal intensive care enteral nutrition practices: analysis of a 2008 survey. JPCH. 2010; 46 Supplement 1: 12 [Abstract]. 12. van den Akker CH, Vlaardingerbroek H, van Goudoever JB. Nutritional support for extremely low-birth weight infants: abandoning catabolism in the neonatal intensive care unit. Curr Opin Clin Nutr Metab Care. 2010; 13: 327-35. 13. Cooke RJ. Postnatal growth and development in the preterm and small for gestational age infant. Nestle Nutr Workshop Ser Pediatr Program. 2010; 65: 85-95; discussion 6-8. 14. Rubin LP. Postnatal growth in preterm infants: too small, too big, or just right? J Pediatr. 2009; 154(4): 473-5. 15. Thureen P. The neonatologist's dilemma: catch up growth or beneficial undernutrition in very low birth weight infants - What are optimal growth rates? JPGN. 2007; 45: S152-S4. 16. Baird A, Widdowson E, Cowley J. Effects of calorie and protein deficiencies early in life on the subsequent learning ability of rats. Br J Nutr. 1971; 25: 391-403. 17. Widdowson EM. Changes in pigs due to undernutrition before birth, and for one, two, and three years afterwards, and the effects of rehabilitation. Adv Exp Med Biol. 1974; 49: 165-81. 18. Widdowson EM, RA M. Some effects of accelerating growth. I. General somatic development. Proc R Soc Lond B Biol Sci. 1960; 152: 188-206. 19. Ozanne SE, Hales CN. Lifespan: catch-up growth and obesity in male mice. Nature. 2004; 427(6973): 411-2. 20. Cleal JK, Poore KR, Boullin JP, Khan O, Chau R, Hambidge O, et al. Mismatched pre- and postnatal nutrition leads to cardiovascular dysfunction and altered renal function in adulthood. Proc Natl Acad Sci U S A. 2007; 104(22): 9529-33.

158
21. Ong KK, Ahmed ML, Emmett PM, Preece MA, Dunger DB. Association between postnatal catch-up growth and obesity in childhood: prospective cohort study. BMJ. 2000; 320(7240): 967-71. 22. Singhal A, Kennedy K, Lanigan J, Fewtrell M, Cole TJ, Stephenson T, et al. Nutrition in infancy and long-term risk of obesity: evidence from 2 randomized controlled trials. Am J Clin Nutr. 2010; 92: 1133-44. 23. Singhal A, Fewtrell M, Cole TJ, Lucas A. Low nutrient intake and early growth for later insulin resistance in adolescents born preterm. Lancet. 2003; 361(9363): 1089-97. 24. Ehrenkranz R, Dusick A, Vohr B, Wright L, Wrage L, Poole WK. Growth in the neonatal intensive care unit influences neurodevelopmental and growth outcomes of extremely low birth weight infants. Pediatrics. 2006; 117: 1253-61. 25. Singhal A, Cole TJ, Fewtrell M, Kennedy K, Stephenson T, Elias-Jones A, et al. Promotion of faster weight gain in infants born small for gestational age: Is there an adverse effect on later blood pressure? Circulation. 2007; 115: 213-20. 26. Ellis K. Evaluation of body composition in neonates and infants. Semin Fetal Neonatol Med in press: doi:101016/jsiny200610011. 2006 27. Rigo J. Body composition during the first year of life. In: Rigo J, Ziegler E, editors. Protein and energy requirements in infancy and childhood Nestle Nutr Workshop Ser Pediatr Program. Vevey S Karger AG, Basel: Nestec Ltd; 2006. p. 65-78. 28. Wells JC, Fuller NJ, Dewit O, Fewtrell MS, Elia M, Cole TJ. Four-component model of body composition in children: density and hydration of fat-free mass and comparison with simpler models. Am J Clin Nutr. 1999; 69(5): 904-12. 29. Ellis K, Yao M, Shypailo R, Urlando A, Wong W, Heird W. Body composition assessment in infancy: air-displacement plethysmography versus a four compartment criterion model. Am J Clin Nutr. 2007; 85: 90-5. 30. Gianni ML, Roggero P, Taroni F, Liotto N, Piemontese P, Mosca F. Adiposity in small for gestational age preterm infants assessed at term equivalent age. Arch Dis Child Fetal Neonatal Ed. 2009; 94(5): F368-72. 31. Roggero P, Gianni ML, Amato O, Orsi A, Piemontese P, Puricelli V, et al. Influence of protein and energy intakes on body composition of formula-fed preterm infants after term. J Pediatr Gastroenterol Nutr. 2008; 47(3): 375-8. 32. Eriksson B, Lof M, Forsum E. Body composition in full-term healthy infants measured with air displacement plethysmography at 1 and 12 weeks of age. Acta Paediatr. 2010; 99(4): 563-8. 33. Friis H, Andersen HK. Rate of inactivation of cytomegalovirus in raw banked milk during storage at -20 degrees C and pasteurisation. Br Med J (Clin Res Ed). 1982; 285: 1604-5. 34. Anderson GH, Atkinson SA, Bryan MH. Energy and macronutrient content of human milk during early lactation from mothers giving birth prematurely and at term. Am J Clin Nutr. 1981; 34(2): 258-65. 35. Gross SJ, Geller J, Tomarelli RM. Composition of breast milk from mothers of preterm infants. Pediatrics. 1981; 68(4): 490-3. 36. Bradford M. A rapid and sensitive method for the quantitation of microgram quantities of protein utilising the principle of protein-dye binding. Analytical Biochemistry. 1976; 72: 248-54. 37. Sherriff JL. The energy output in human milk: its relationship to maternal energy intake and changes in maternal anthropometry [Doctor of Philosophy]. Nedlands, WA: University of Western Australia; 1994. 38. Hitchcock N. Feeding practices and growth of Australian infants [Degree of Master of Science]. Perth: University of Western Australia; 1983.
159
39. Atwood CS, Hartmann PE. Collection of fore and hind milk from the sow and the changes in milk composition during suckling. J Dairy Res. 1992; 59: 287-98. 40. Casadio Y, Williams T, Lai C, Olsson S, Hepworth A, Hartmann P. Evaluation of a Mid-Infrared Analyzer for the determination of the macronutrient composition of human milk. The Journal of Human Lactation. 2010; In Press. 41. Lonnerdal B. Nutritional and physiologic significance of human milk proteins. Am J Clin Nutr. 2003; 77(Suppl): 1537S-43S. 42. Mitoulas LR, Kent JC, Cox DB, Owens RA, Sherriff JL, Hartmann PE. Variation in fat, lactose and protein in human milk over 24 h and throughout the first year of lactation. Br J Nutr. 2002; 88(1): 29-37. 43. Stern I, Shapiro B. A rapid and simple method for the determination of esterified fatty acids and for total fatty acids in blood. J Clin Pathol. 1953; 6(2): 158-60. 44. Kuhn NJ. Progesterone withdrawal as the lactogenic trigger in the rat. J Endocrinol. 1969; 44(1): 39-54. 45. Urlando A, Dempster P, Aitkens S. A new air displacement plethysmograph for the measurement of body composition in infants. Pediatric Research. 2003; 53(3): 486-92. 46. Sainz R, Urlando A. Evaluation of a new pediatric air-displacement plethysmograph for body-composition assessment by means of chemical analysis of bovine tissue phantoms. 2003. 47. Butte NF, Hopkinson JM, Wong WW, Smith EO, KJ E. Body composition during the first 2 years of life. An updated reference. Pediatr Res. 2000; 47: 578-85. 48. Boyd E. Experimental error inherent in meeasuring growing human body. Am J Phys Anthropol. 1930; 13: 389-432. 49. Fomon S, Nelson S. Body composition of the male and female reference infants. Annu Rev Nutr. 2002; 22: 1-17. 50. Rodriguez G, Venture P, Samper M, Moreno L, Sarria A, Perez-Gonzalez J. Changes in body composition during the initial hours of life in breast-fed healthy term newborns. Biol Neonate. 2000; 77: 12-6. 51. Bauer K, Cowett RM, Howard GM, vanEpp J, Oh W. Effect of intrauterine growth retardation on postnatal weight change in preterm infants. J Pediatr. 1993; 123(2): 301-6. 52. Singhi S, Sood V, Bhakoo ON, Ganguly NK. Effect of intrauterine growth retardation on postnatal changes in body composition of preterm infants. Indian J Med Res. 1995; 102: 275-80. 53. Tang W, Ridout D, Modi N. Influence of respiratory distress syndrome on body composition after preterm birth. Arch Dis Child Fetal Neonatal Ed. 1997; 77(1): F28-31. 54. Bauer K, Bovermann G, Roithmaier A, Gotz M, Proiss A, Versmold HT. Body composition, nutrition, and fluid balance during the first two weeks of life in preterm neonates weighing less than 1500 grams. J Pediatr. 1991; 118(4 ( Pt 1)): 615-20. 55. Shaffer S, Bradt S, Hall R. Postnatal changes in total body water and extracellular volume in the preterm infant with respiratory distress syndrome. J Pediatr. 1986; 109: 509-14. 56. Heimler R, Doumas B, Jendrzejczak B, Nemeth P, Hoffman R, Nelin L. Relationship between nutrition, weight change and fluid compartments in preterm infants during the first week of life. J Pediatr. 1993; 1993(122). 57. Roggero P, Gianni ML, Amato O, Orsi A, Piemontese P, Cosma B, et al. Postnatal growth failure in preterm infants: recovery of growth and body composition after term. Early Hum Dev. 2008; 84(8): 555-9.
160
58. Fomon SJ, Haschke F, Ziegler EE, Nelson SE. Body composition of reference children from birth to age 10 years. The American Journal Of Clinical Nutrition. 1982; 35(5 Suppl): 1169-75. 59. Widdowson E, Dickerson J. Chemical composition of the body. In: Comar C, Bronner F, editors. Mineral metabolism An advanced treatise. New York: Academic Press; 1964. p. 1-247. 60. Patel AL, Engstrom JL, Meier PP, Kimura RE. Accuracy of methods for calculating postnatal growth velocity for extremely low birth weight infants. Pediatrics. 2005; 116(6): 1466-73. 61. Patel AL, Engstrom JL, Meier PP, Jegier BJ, Kimura RE. Calculating postnatal growth velocity in very low birth weight (VLBW) premature infants. J Perinatol. 2009; 29(9): 618-22. 62. Roberts C, Lancaster P. Australian national birthweight percentiles by gestational age. MJA. 1999; 170: 114-18. 63. Ma G, Yao M, Liu Y, Lin A, Zou H, Urlando A, et al. Validation of a new pediatric air-displacement plethysmograph for assessing body composition in infants. Am J Clin Nutr. 2004; 79: 653-60. 64. Garrow JS. Validation of air-displacement plethysmography to measure body fat. Am J Clin Nutr. 2003; 77: 1338-9; author reply 9-40. 65. Agostoni C, Buonocore G, Carnielli VP, De Curtis M, Darmaun D, Decsi T, et al. Enteral nutrient supply for preterm infants: commentary from the European Society of Paediatric Gastroenterology, Hepatology and Nutrition Committee on Nutrition. J Pediatr Gastroenterol Nutr. 2010; 50(1): 85-91. 66. Garlick PJ, Grant I. Amino acid infusion increases the sensitivity of muscle protein synthesis in vivo to insulin. Effect of branched-chain amino acids. Biochem J. 1988; 254: 579-84. 67. Watson RT, Pessin JE. Intracellular organization of insulin signaling and GLUT4 translocation. Recent Prog Horm Res. 2001; 56: 175-93. 68. Iwanaka N, Egawa T, Satoubu N, Karaike K, Ma X, Masuda S, et al. Leucine modulates contraction- and insulin-stimulated glucose transport and upstream signaling events in rat skeletal muscle. J Appl Physiol. 2010; 108: 274-82. 69. Garlick PJ. The role of leucine in the regulation of protein metabolism. J Nutr. 2005; 135(6 Suppl): 1553S-6S. 70. Carberry A, Colditz P, Lingwood B. Body composition from birth to 4.5 months in infants born to non-obese women. Pediatr Res. 2010; 68: 84-8. 71. Roggero P, Gianni ML, Orsi A, Piemontese P, Amato O, Liotto N, et al. Quality Of Growth In Exclusively Breast-Fed Infants In the First Six Months Of Life: An Italian Study. Pediatr Res. 2010 72. Raghuraman M. PEAPOD Software Version 3.0.1 Release notification addendum. Personal email communication March 2009. 73. Feigelman S. The first year. In: Kliegman R, Behrman R, Jenson H, Stanton B, editors. Nelson Textbook of Pediatrics. 18th ed. Philadephia, PA: Saunders, Elsevier; 2007. p. 43. 74. Widdowson EM. Growth and composition of the fetus and newborn. In: Assali N, editor. Biology of gestation. New York: Academic Press; 1968. p. 1-49. 75. Cruz H, Guzman N, Rosales M, Bastidas J, Garcia J, Hurtado I, et al. Early hospital discharge of preterm very low birth weight infants. J Perinatol. 1997; 17(1): 29-32. 76. Tang W, Ridout D, Modi N. Assessment of total body water using bioelectrical impedance analysis in neonates receiving intensive care. Arch Dis Child Fetal Neonatal Ed. 1997; 77(2): F123-6.

161
77. Lafeber HN. Nutritional assessment and measurement of body composition in preterm infants. Clin Perinatol. 1999; 26: 997-1005. 78. Schoeller D. Hydrometry. In: Heymsfield S, Lohman TG, Wang Z, Going S, editors. Human body composition. Champaign, USA: Human Kinetics; 2005. p. 35-49. 79. Hay WW. Early postnatal nutritional requirements of the very preterm infant based on a presentation at the NICHD-AAP workshop on research in neonatology. Journal of Perinatology. 2006; 26 Suppl 2: S13-8. 80. Vlaardingerbroek H, van Goudoever JB, van den Akker CH. Initial nutritional management of the preterm infant. Early Hum Dev. 2009; 85(11): 691-5. 81. Hay WW, Jr. Strategies for feeding the preterm infant. Neonatology. 2008; 94(4): 245-54.
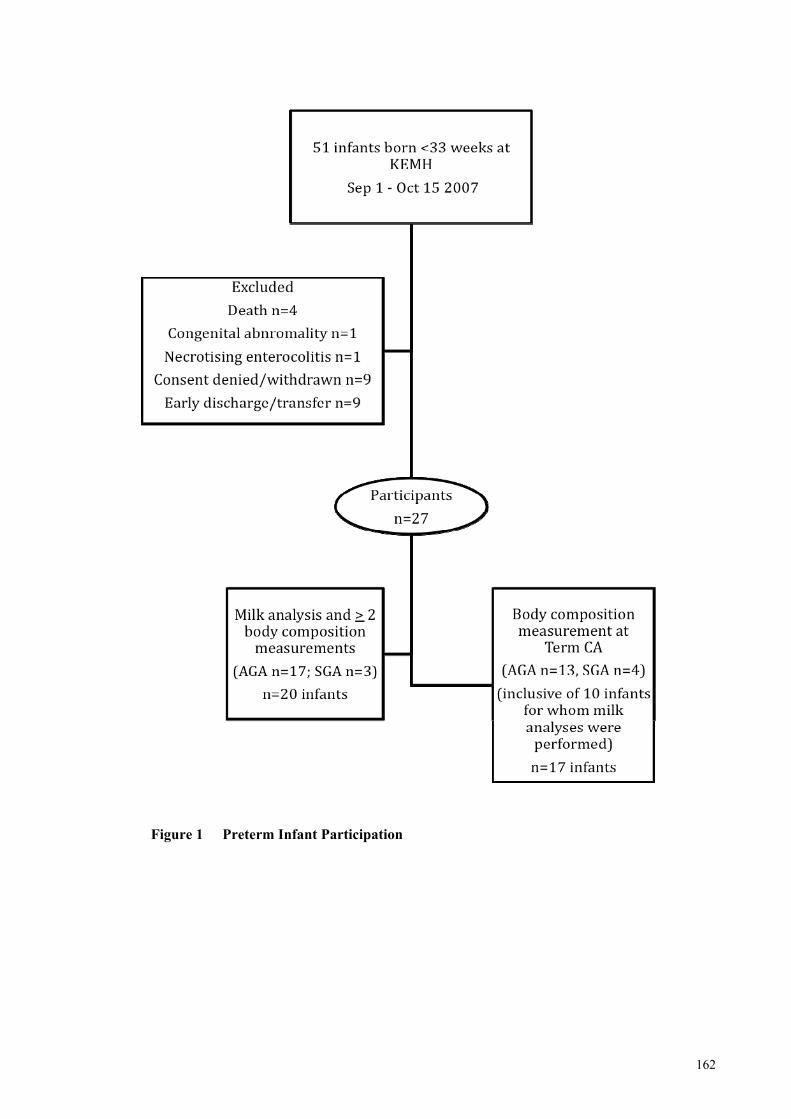
162
Figure 1 Preterm Infant Participation
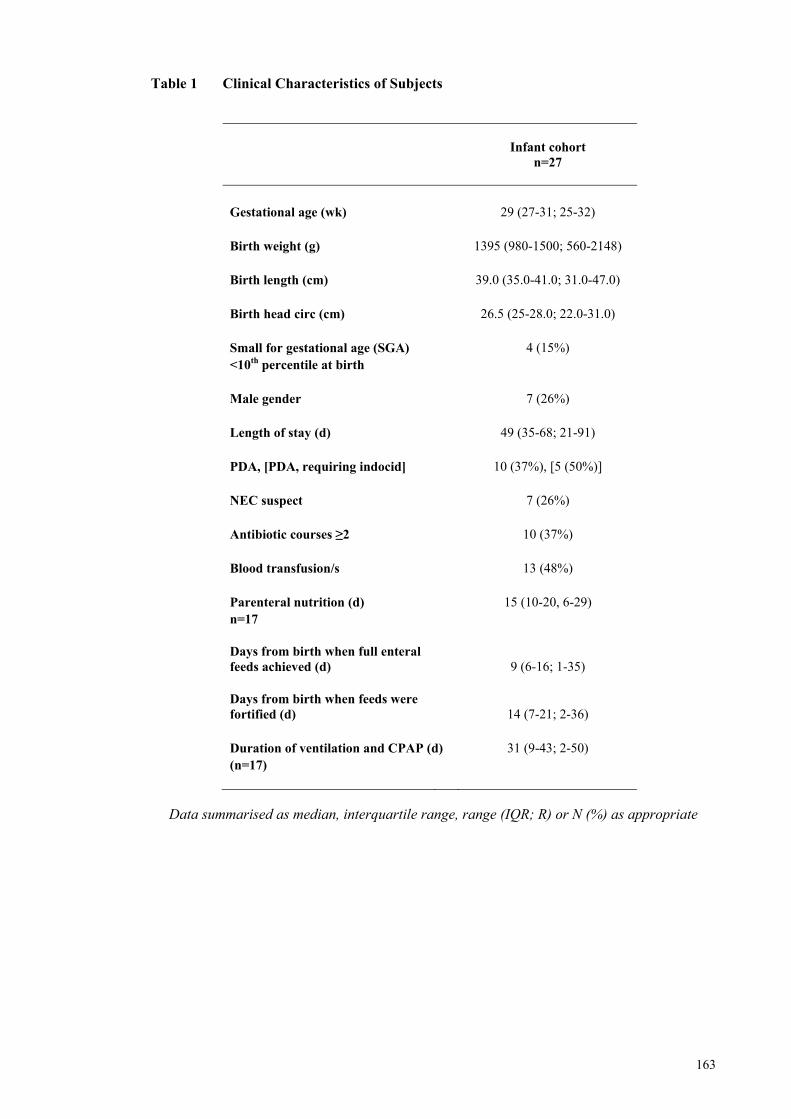
163
Table 1 Clinical Characteristics of Subjects
Data summarised as median, interquartile range, range (IQR; R) or N (%) as appropriate
Infant cohort
n=27
Gestational age (wk) 29 (27-31; 25-32) Birth weight (g) 1395 (980-1500; 560-2148) Birth length (cm) 39.0 (35.0-41.0; 31.0-47.0) Birth head circ (cm) 26.5 (25-28.0; 22.0-31.0) Small for gestational age (SGA) 4 (15%) <10th percentile at birth Male gender 7 (26%) Length of stay (d) 49 (35-68; 21-91) PDA, [PDA, requiring indocid] 10 (37%), [5 (50%)] NEC suspect 7 (26%) Antibiotic courses ≥2 10 (37%) Blood transfusion/s 13 (48%) Parenteral nutrition (d) 15 (10-20, 6-29) n=17 Days from birth when full enteral feeds achieved (d) 9 (6-16; 1-35) Days from birth when feeds were fortified (d) 14 (7-21; 2-36) Duration of ventilation and CPAP (d) 31 (9-43; 2-50) (n=17)
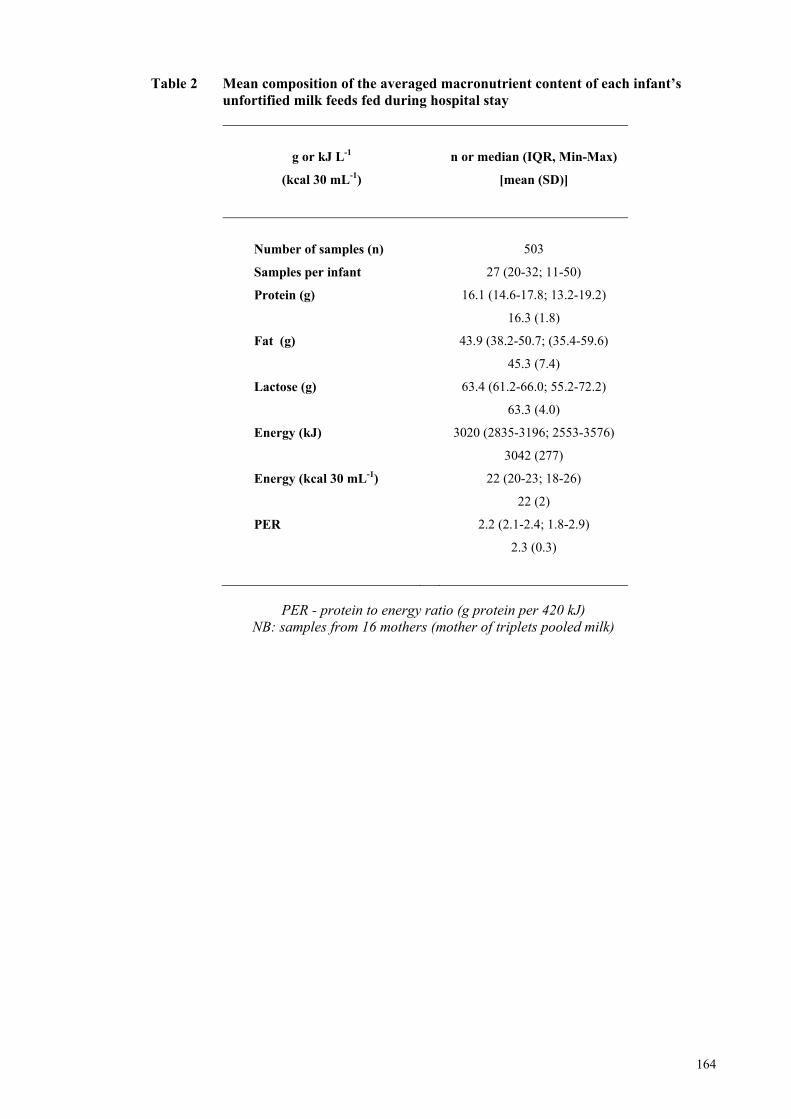
164
Table 2 Mean composition of the averaged macronutrient content of each infant’s unfortified milk feeds fed during hospital stay
g or kJ L-1
(kcal 30 mL-1)
n or median (IQR, Min-Max)
[mean (SD)]
Number of samples (n)
503
Samples per infant 27 (20-32; 11-50)
Protein (g) 16.1 (14.6-17.8; 13.2-19.2)
16.3 (1.8)
Fat (g) 43.9 (38.2-50.7; (35.4-59.6)
45.3 (7.4)
Lactose (g) 63.4 (61.2-66.0; 55.2-72.2)
63.3 (4.0)
Energy (kJ)
Energy (kcal 30 mL-1)
3020 (2835-3196; 2553-3576)
3042 (277)
22 (20-23; 18-26)
22 (2)
PER 2.2 (2.1-2.4; 1.8-2.9)
2.3 (0.3)
PER - protein to energy ratio (g protein per 420 kJ)
NB: samples from 16 mothers (mother of triplets pooled milk)
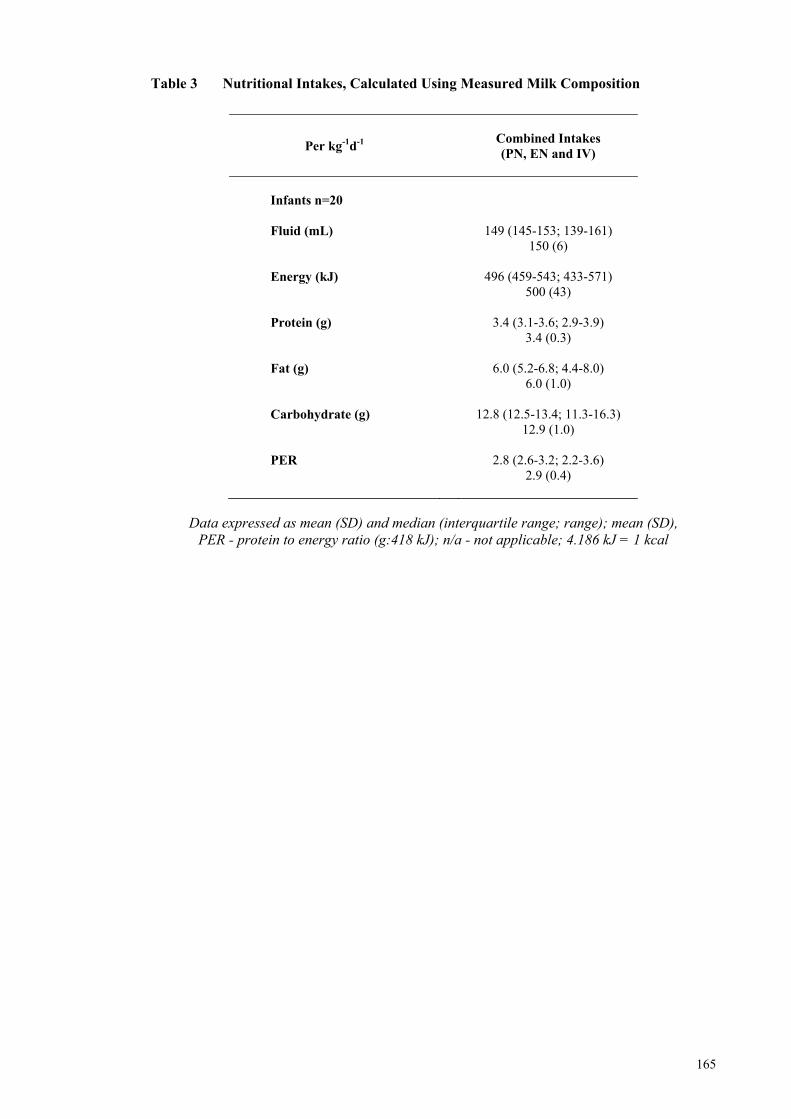
165
Table 3 Nutritional Intakes, Calculated Using Measured Milk Composition
Per kg-1d-1
Combined Intakes (PN, EN and IV)
Infants n=20
Fluid (mL) 149 (145-153; 139-161)
150 (6) Energy (kJ) 496 (459-543; 433-571)
500 (43) Protein (g) 3.4 (3.1-3.6; 2.9-3.9)
3.4 (0.3) Fat (g) 6.0 (5.2-6.8; 4.4-8.0)
6.0 (1.0) Carbohydrate (g) 12.8 (12.5-13.4; 11.3-16.3)
12.9 (1.0) PER 2.8 (2.6-3.2; 2.2-3.6)
2.9 (0.4)
Data expressed as mean (SD) and median (interquartile range; range); mean (SD),
PER - protein to energy ratio (g:418 kJ); n/a - not applicable; 4.186 kJ = 1 kcal
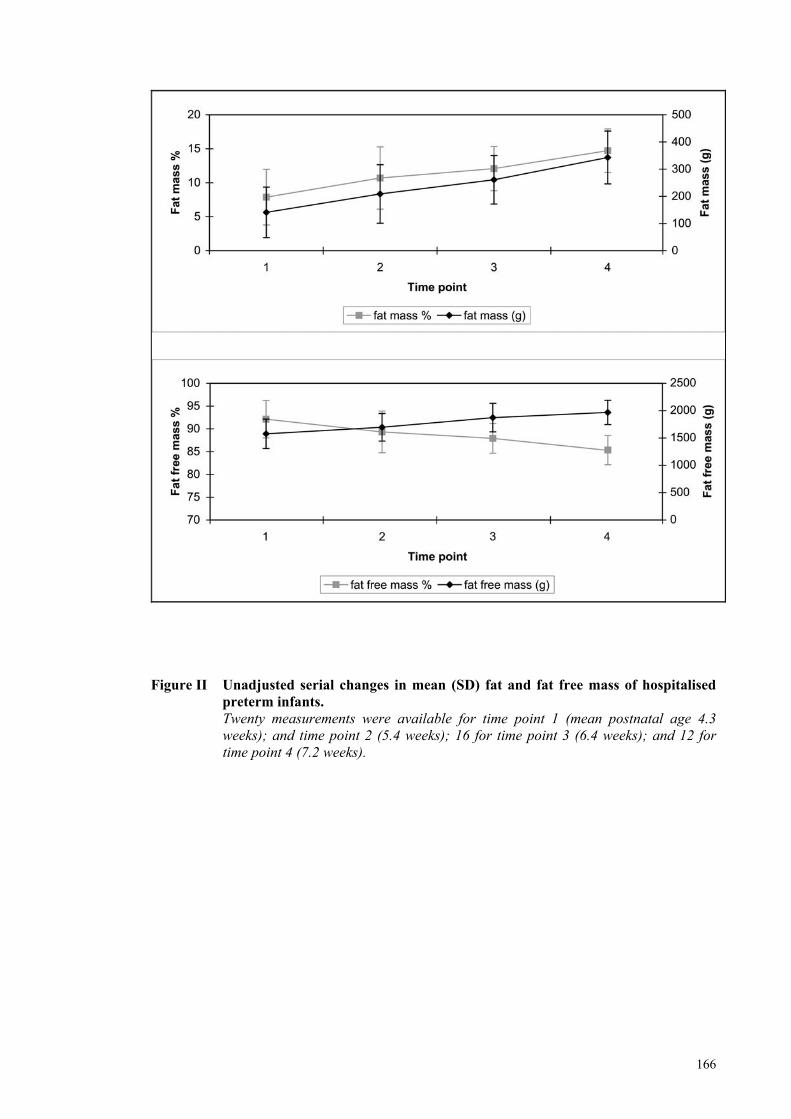
166
Figure II Unadjusted serial changes in mean (SD) fat and fat free mass of hospitalised
preterm infants. Twenty measurements were available for time point 1 (mean postnatal age 4.3
weeks); and time point 2 (5.4 weeks); 16 for time point 3 (6.4 weeks); and 12 for time point 4 (7.2 weeks).
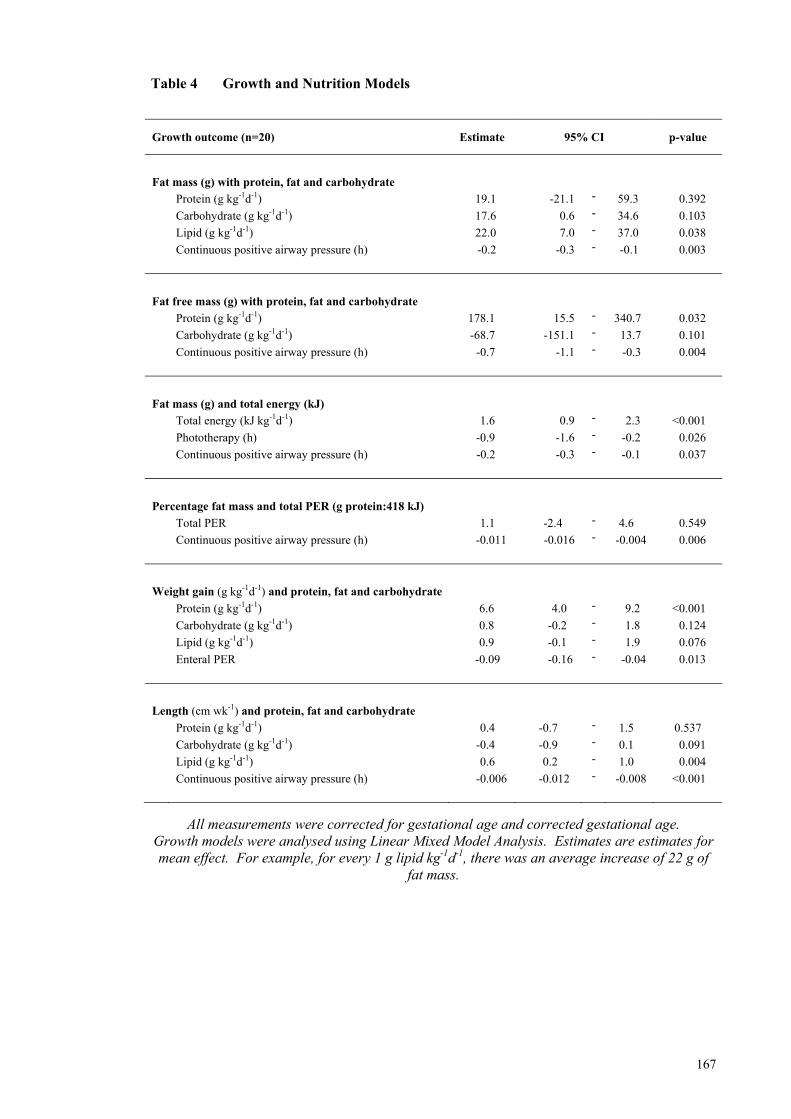
167
Table 4 Growth and Nutrition Models
Growth outcome (n=20) Estimate 95% CI p-value
Fat mass (g) with protein, fat and carbohydrate
Protein (g kg-1d-1) 19.1 -21.1 - 59.3 0.392
Carbohydrate (g kg-1d-1) 17.6 0.6 - 34.6 0.103
Lipid (g kg-1d-1) 22.0 7.0 - 37.0 0.038
Continuous positive airway pressure (h) -0.2 -0.3 - -0.1 0.003
Fat free mass (g) with protein, fat and carbohydrate
Protein (g kg-1d-1) 178.1 15.5 - 340.7 0.032
Carbohydrate (g kg-1d-1) -68.7 -151.1 - 13.7 0.101
Continuous positive airway pressure (h) -0.7 -1.1 - -0.3 0.004
Fat mass (g) and total energy (kJ)
Total energy (kJ kg-1d-1) 1.6 0.9 - 2.3 <0.001
Phototherapy (h) -0.9 -1.6 - -0.2 0.026
Continuous positive airway pressure (h) -0.2 -0.3 - -0.1 0.037
Percentage fat mass and total PER (g protein:418 kJ)
Total PER 1.1 -2.4 - 4.6 0.549
Continuous positive airway pressure (h) -0.011 -0.016 - -0.004 0.006
Weight gain (g kg-1d-1) and protein, fat and carbohydrate
Protein (g kg-1d-1) 6.6 4.0 - 9.2 <0.001
Carbohydrate (g kg-1d-1) 0.8 -0.2 - 1.8 0.124
Lipid (g kg-1d-1) 0.9 -0.1 - 1.9 0.076
Enteral PER -0.09 -0.16 - -0.04 0.013
Length (cm wk-1) and protein, fat and carbohydrate
Protein (g kg-1d-1) 0.4 -0.7 - 1.5 0.537
Carbohydrate (g kg-1d-1) -0.4 -0.9 - 0.1 0.091
Lipid (g kg-1d-1) 0.6 0.2 - 1.0 0.004
Continuous positive airway pressure (h) -0.006 -0.012 - -0.008 <0.001
All measurements were corrected for gestational age and corrected gestational age. Growth models were analysed using Linear Mixed Model Analysis. Estimates are estimates for mean effect. For example, for every 1 g lipid kg-1d-1, there was an average increase of 22 g of
fat mass.
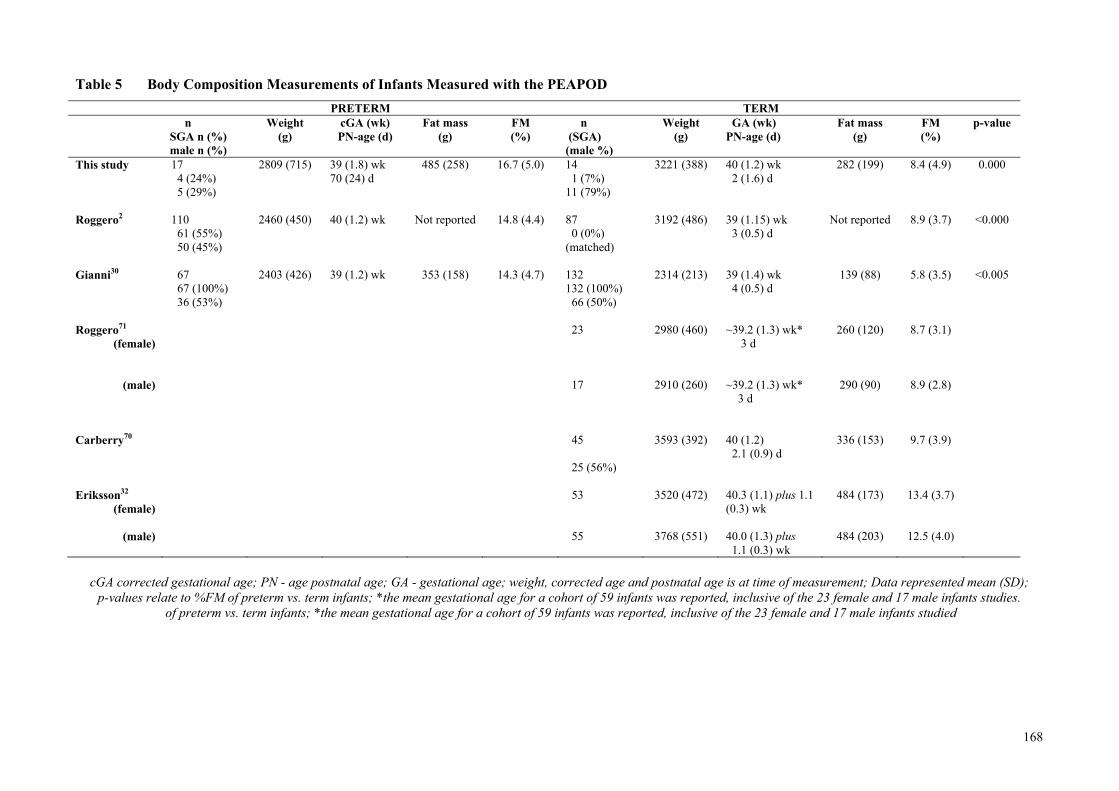
168
Table 5 Body Composition Measurements of Infants Measured with the PEAPOD
cGA corrected gestational age; PN - age postnatal age; GA - gestational age; weight, corrected age and postnatal age is at time of measurement; Data represented mean (SD);
p-values relate to %FM of preterm vs. term infants; *the mean gestational age for a cohort of 59 infants was reported, inclusive of the 23 female and 17 male infants studies. of preterm vs. term infants; *the mean gestational age for a cohort of 59 infants was reported, inclusive of the 23 female and 17 male infants studied
PRETERM TERM n
SGA n (%) male n (%)
Weight (g)
cGA (wk) PN-age (d)
Fat mass (g)
FM (%)
n (SGA) (male %)
Weight (g)
GA (wk) PN-age (d)
Fat mass (g)
FM (%)
p-value
This study 17 4 (24%) 5 (29%)
2809 (715) 39 (1.8) wk 70 (24) d
485 (258) 16.7 (5.0) 14 1 (7%) 11 (79%)
3221 (388) 40 (1.2) wk 2 (1.6) d
282 (199) 8.4 (4.9) 0.000
Roggero2 110
61 (55%) 50 (45%)
2460 (450) 40 (1.2) wk
Not reported 14.8 (4.4) 87 0 (0%) (matched)
3192 (486)
39 (1.15) wk 3 (0.5) d
Not reported 8.9 (3.7) <0.000
Gianni30
67 67 (100%) 36 (53%)
2403 (426) 39 (1.2) wk
353 (158) 14.3 (4.7) 132 132 (100%) 66 (50%)
2314 (213) 39 (1.4) wk 4 (0.5) d
139 (88) 5.8 (3.5) <0.005
Roggero71
(female) 23
2980 (460) ~39.2 (1.3) wk* 3 d
260 (120) 8.7 (3.1)
(male)
17
2910 (260) ~39.2 (1.3) wk* 3 d
290 (90) 8.9 (2.8)
Carberry70 45
25 (56%)
3593 (392) 40 (1.2) 2.1 (0.9) d
336 (153) 9.7 (3.9)
Eriksson32
(female) 53
3520 (472) 40.3 (1.1) plus 1.1
(0.3) wk 484 (173) 13.4 (3.7)
(male) 55
3768 (551) 40.0 (1.3) plus
1.1 (0.3) wk 484 (203) 12.5 (4.0)
169
PAPER 3 – TARGET FORTIFICATION STUDY
Targeting Human Milk Fortification to Achieve Preterm
Infant Growth Targets
Ms Gemma McLeod, APD, PhD Candidate, Centre for Neonatal Research and
Education, The University of Western Australia and King Edward Memorial Hospital
Associate Professor Jill Sherriff, AdvAPD, School of Public Health, Curtin
University, Western Australia.
Professor Peter Hartmann, Winthrop Professor, School of Biomedical, Biomolecular
and Chemical Sciences, The University of Western Australia.
Ms Elizabeth Nathan, Biostatistician, Women and Infants Research Foundation,
Western Australia
Dr Donna Geddes, Research Assistant Professor, School of Biomedical, Biomolecular
and Chemical Sciences, The University of Western Australia.
Professor Karen Simmer, Winthrop Professor Newborn Medicine, Centre for
Neonatal Research and Education, The University of Western Australia and King
Edward Memorial Hospital.
The trial is registered, number ACTRN12610000443099; U1111-115-4183.
Ms Gemma McLeod MSc APD, Centre for Neonatal Research and Education, M550, The University of Western Australia, Subiaco, WA, 6008, Australia. Email: [email protected]; Fax 61 8 9340 1266; Tel 61 8 9340 1256 This paper is being prepared for submission to the Journal of Pediatrics. Impact factor 4.092

170
Abstract
Objectives
To determine if fortifying milk based on measured macronutrient composition
according to reasonable nutrient intakes (ReasNI) for corrected gestational age (cGA)
would achieve reference growth and body composition (BC)?
Study Design
Infants born <30 weeks were randomised to either targeted (Intervention Gpi) or routine
fortification (Control Gpc). Univariate comparisons of continuous data were conducted
using one-sample and independent t-tests or Mann-Whitney tests. Mixed model
analysis was used to assess the effect of macronutrient intakes and clinical factors on
growth rate. BC (PEAPOD) was compared using linear regression.
Results
[Data Gpi vs Gpc mean (SD)]: Weight gain [(13.5 (3.5) vs. 15.7 (3.0) g kg-1d-1,
p=0.042)] and protein [3.2 (0.4) vs. 3.9 (0.3) g kg-1d-1, p<0.001] and energy [510 (39)
vs. 559 (34) kJ kg-1d-1, p<0.001] intakes of intervention infants were significantly lower
than controls during the intervention period. Protein intake >3.4 g kg-1d-1 reduced
percentage fat mass (FM) by 2%. Macronutrient intakes from combined nutrition
sources, growth and %FM at discharge did not differ significantly between groups.
Conclusion
Fortifying milk on measured macronutrient composition targeting ReasNI for cGA did
not improve preterm growth outcomes. Further modification of fortification regimens is
necessary to help meet recommended intakes and to match fetal growth.
Keywords: protein intake; protein energy ratio; air displacement plethysmography;
human milk macronutrient composition.
171
Introduction
Human milk (HM) is the recommended feed for preterm infants1 because it offers
intrinsic benefits relating to absorption of nutrients2-4, improvements in neuro-
development5-7 and protection against infection8, 9 and necrotising enterocolitis10, 11.
The composition of human milk is variable12-14. Furthermore, early milk expressed by
mothers delivering preterm is generally higher in protein and energy content12, 15, 16 than
the milk of mothers delivering at term13. Nevertheless, without fortification, human
milk lacks sufficient protein, energy and micronutrients to support growth targets based
on intrauterine rates17, 18. Current clinical practice is to fortify on assumed composition,
but even with fortification, preterm infants may receive less protein and energy than
they need19, resulting in slower growth20, 21. Although the aetiology of this slower
growth is multifactorial20, variable human milk composition12-14, inadequate
fortification19 and current feeding practices22, 23 are likely contributors20. Whilst more
aggressive feeding and fortification regimens may reduce nutrient deficiencies24-27,
some caution must be exercised when adding nutrients to human milk as fortification
raises the osmolality of feeds28, 29, and may exceed the metabolic capacity of infants,
and increase the risk of feeding intolerance30 and necrotising enterocolitis31, 32.
Accretion rates of nutrients and composition of weight gain are dependent on the energy
and macronutrient intake33 and can be manipulated by adjusting protein and energy
intakes as well as the protein to energy ratio of feeds (PER)34, 35. The optimal PER for
feeding preterm infants is yet to be established. However, consensus guidelines base
energy requirement on birth weight and recommend protein is reduced with corrected
gestational age, such that protein intakes as high as 4.2 to 4.4 g kg-1d-1 and energy
intakes ranging between 460 and 630 kJ kg-1d-1 may be necessary to meet the nutritional
needs of preterm infants36. These targets are difficult to achieve with routine
fortification23 and attempts to improve nutritional and growth outcomes by trialling
different fortification regimens have had mixed results. Polberger et al.37 compared a
human milk-based fortifier with a commercial bovine-based product, fortified on
measured composition and found no benefit in growth or metabolic outcomes of
preterm infants. De Halleux et al.38 individualised fortification based on macronutrient
milk analysis for 10 infants using a bovine-based human milk fortifier and a fat
supplement. These authors confirmed the variability of human milk composition,
sometimes used less fortifier than was routinely recommended and demonstrated that
172
rate of weight gain in infants fed ‘a la carte’ was greater than that previously seen in
infants who received routine fortification. Arslanoglu and colleagues39 adjusted fortifier
on the basis of plasma urea using commercially prepared, bovine-based fortifiers39 and
demonstrated greater weight gain in those on the adjusted regime, compared to routine
fortification. Pasteurised donor milk supplied 40% of infants’ milk intake in this
study19 and retrospective nutrient analysis showed that protein intakes were
significantly and consistently lower than routinely assumed39. Composition of growth
was not determined, but those who have measured preterm infant body composition
(BC) have shown altered40 and increased adiposity when compared to infants who are
born at term40, 41.
A randomised study in a large, tertiary NCCU was conducted to test the hypothesis that
growth and BC of preterm infants would more closely match reference growth
(weight gain: 15 g kg-1d-1; 11-14 % fat mass (FM) at term cGA)42, 43 by fortifying milk
on measured rather than assumed macronutrient composition, and by targeting the range
of PER and protein and energy intakes according to consensus guidelines for birth
weight and cGA36.
Methods
Recruitment Criteria
Forty infants born at <30 weeks gestation admitted to the Level 3 nursery in King
Edward Memorial Hospital (KEMH) in Perth, Western Australia were recruited for the
study period from birth to near term corrected age if they were without congenital
abnormalities, if maternal intention was to feed human milk and if living remotely
would not prevent participation at the term assessment. Infants (n=21) who were
transferred to peripheral nurseries within a 30 km radius of KEMH before discharge
remained in the trial, as per the study protocol. Eight infants had discharge
measurements taken at the time of transfer. The Ethics Committees at both KEMH and
The University of Western Australia reviewed and approved the study protocol.
Informed consent was obtained from the infants’ mothers prior to commencing the
study.
173
Randomisation and Blinding
Infants were randomised to one of two treatment groups (Gpi intervention or
Gpc control). Twins were randomised as individuals. The clinical team prescribing
each infant’s fluid intake and feeding regimen, together with the nurses and parents
were blinded to group allocations. All clinical decisions, including fluid and feeding
status, were made independently of study investigators.
Nutrition
Until the initiation of fortified milk feeds, all infants were fed according to KEMH
NCCU’s 2009 standard feeding regimen, which is described as follows:
Parenteral Nutrition (PN)
On day one of life, 5% or 7.5% glucose and 1.5% amino acids were infused until day
two, when individualised parenteral nutrition, including lipid (20%, 1.0 g kg-1d-1),
electrolytes and micronutrients, was commenced. Subsequently, concentrations and
rates were increased, targeting the reasonable range of parenteral nutrient intakes
(ReasNI) for energy and protein recommended for preterm infants36.
Enteral Nutrition
Mothers began expressing their milk soon after giving birth. Minimal enteral feeds
(MEF), using mothers’ own frozen milk (MOM) in the sequence in which it was
expressed, were initiated as early as possible and increased, following a standardised
regimen. Parenteral nutrition was simultaneously reduced. If MOM was unavailable,
donor milk (DM) was available for the infants (if parents consented) until at least a
corrected age of 34 weeks. Fortification commenced when enteral intakes reached ≥100
mL kg-1d-1 and was ceased towards discharge.
The Intervention – Fortified Feeds
Intervention Group (Gpi)
Fortification for intervention infants was based on measured milk analysis, using the
weekly mean composition to target reasonable nutrient intakes (ReasNI) for energy,
protein and PER according to birth weight and cGA36 (Figure 1). Commercial multi-
component HMF (added as directed by the manufacturer, Wyeth Nutritionals, Askeaton,
Co. Limerick, Ireland) ± a protein powder (Beneprotein, Novartis, Minneapolis, MN
174
USA) and/or an energy supplement (Duocal, SHS International Limited, Liverpool,
UK) were used to target fortification. Fortification was aimed at intakes between
160 to 180 mL kg-1d-1 unless doctors requested a more concentrated feed for fluid
restricted infants, in which case fortification was increased further to target enteral
protein and energy ReasNI for birth weight and cGA at volumes between
130-150 mL kg-1d-1.
Control Group (Gpc)
Fortification during the intervention period was based on assumed milk composition
(protein: 1.4 g dL-1; fat: 4.4 g dL-1; lactose: 6.8 g dL-1) and the routine regimen had
recently been optimised to always target the upper limits of ReasNI36 for ELBW
(i.e. protein 3.8-4.4 g kg-1d-1; energy 544-630 kJ kg-1d-1) within two volume ranges
(Figure 1). The assumed composition was an estimate derived from macronutrient milk
analysis of preterm milk conducted in our Unit12, 44 and commonly cited literature
values15, 45, 46. The commercial multi-component HMF (Wyeth Nutritionals, as
previous) was used to fortify feeds at levels directed by the manufacturer to intakes
between 160-180 mL kg-1d-1 unless doctors requested a more concentrated feed for fluid
restricted infants, in which case the protein and energy supplements were used in
addition to the HMF to target fortification to intakes between 130-150 mL kg-1d-1.
The duration of the intervention period for each infant was defined by the number of
days between two time points (i.e. the initiation and cessation of the infant’s fortified
milk feeds).
Milk Sampling and Analysis
Mothers’ own milk feeds for infants were made daily, as described previously (p 145,
Methods, Feasibility BC Study, Thesis). A well-mixed sample (3-6 mL) of each
infant’s daily milk feed (MOM or DM), was labelled and frozen at minus 200 C. At the
end of each week, each milk sample was defrosted, warmed in a water bath to 400 C,
homogenised (1.5 seconds per mL of sample; Sonics Vibracell, Model VCX-130,
Sonics and Materials Inc, Newtown Ct, USA) and the protein, fat and lactose
concentration was determined using the Human Milk Analyser (HMA: processes milk
setting), based on mid-infrared transmission spectroscopy. The method has been
described and evaluated elsewhere47, 48.
175
Nutrition Data
Fluid and macronutrient intake data from all sources were obtained retrospectively from
the observation charts and recorded from midnight on day one of life until the discharge
measurement. If a breastfeed was given and recorded as ‘breastfeed without tube top-
up’, the amount consumed during the breastfeed was estimated to be equivalent to that
amount normally given at a scheduled feed. If a top-up was given, the volume of milk
consumed during a breastfeed was estimated as the balance of that normally given at a
scheduled feed after subtracting the volume given as a top-up.
Macronutrient intakes were calculated using the daily milk composition data obtained
with the HMA and energy intakes were derived using the Atwater values
[kJ g-1 (kcal g-1)] for protein, fat and lactose of 16 (4), 37 (9), 16 (4), adopted by the
National Health and Medical Research Council49.
Body Composition
BC was measured using air displacement plethysmography (PEAPOD, LMI, Concord,
CA, USA). Measurements were taken at discharge (n=32) or on transfer to outlying
Level 2 nurseries (n=8) and again at the final assessment, if infants were discharged
before term corrected age (n=25). The PEAPOD is designed to measure BC of infants
weighing between one and eight kilograms. It has been evaluated in term infants50,
using the fat free mass (FFM) density data of Butte et al51 and also used to measure the
BC of preterm infants41, 52, 53. The technical design and the methodology underpinning a
PEAPOD measurement has been described elsewhere54, 55. Briefly, the PEAPOD
utilises the classic 2-compartment BC model. Total body density is calculated from the
direct measurements of body mass (electronic scale) and volume (air displacement).
The software provided by LMI incorporates algorithms to derive percent body fat and
FFM. These algorithms use the constant FM density value of 0.9007 g mL-1 and
predetermined FFM density values modelled and back-extrapolated from the age and
gender-specific FFM reference values of either Butte et al.51 or Fomon et al.43. A
correction factor has been applied to the algorithms to adjust for the redistribution of
body water that occurs in the initial period after birth. LMI derived this undisclosed
correction factor from a range of reference data56-63.
PEAPOD measurements were taken according to the technical instruction (LMI), using
the default density model derived from the reference infant of Fomon et al43, which is
176
based on Widdowson’s fetal chemical data43. Oil was used to flatten head-hair to
reduce surface area artefact. The PEAPOD was calibrated with identification bracelets
and a feeding tube if in situ in the infant at the time of measurement. At least
30 minutes after feeding, infants were undressed and lengths were measured under the
warmth of a radiant heater to reduce the risk of temperature instability. Each naked
weighing and volume measurement took approximately seven minutes and, when
possible, measurements were taken in duplicate and the mean used.
Anthropometry
In accordance with the NCCU’s measurement policy, weight, taken in the infants
incubator or with digital scales (g; SECA, Germany 10/20 kg; d = 5/10 g or PEAPOD),
crown-heel length and occipital-frontal head circumference were measured at birth,
discharge and at term cGA. Infants requiring intensive care (NICU) were weighed daily
and those in special care were weighed twice weekly, with daily weight derived by
interpolation between each of the time-points. Weight gain velocity, calculated using
an exponential model that has been validated in preterm infants, was used:
[1000*Ln(Wn/W1)]/(Dn - D1)], where W is the weight in grams, D is day, 1 is the
beginning of the time interval and n is the end of the time interval64, 65. Recumbent
length was measured with a perspex length board and head circumference was
measured with a non-stretchable measuring tape. Weight, length and head
circumference measurements were converted to z-scores, using Fenton’s data66, 67..
Statistical Analysis
Descriptive statistics for continuous data were summarised using means and standard
deviations or medians, interquartile ranges and ranges. Categorical data were
summarised using frequency distributions. Univariate comparisons of continuous
clinical data, nutritional intakes and anthropometric measures were conducted using
one-sample t-tests, independent t-tests or Mann-Whitney tests according to normality,
and Chi-square or Fisher exact tests were used for categorical comparisons. Reliability
of percent FM measurements for PEAPOD was determined by calculating the standard
deviation, coefficient of variation and technical error. The technical error was defined
as the √Σd2/2n, where d is the difference between two repeated tests for the paired
observations.
Comparisons of BC, measured as percentage body FM, were assessed at discharge and
177
at term cGA using linear regression modelling after adjustment for corrected gestational
age (discharge only), weight z-score at measurement and residuals from a linear
regression of length on weight at time of measurement.
Linear mixed models analysis was conducted to produce growth curve models for
weight gain velocity to discharge. A natural logarithm transformation was applied to
the outcome to achieve normality, as indicated by residual diagnostics. Protein,
carbohydrate and lipid intakes and clinical variables were modelled univariately and
multivariably to assess their effects on the rate of growth. Adjustment was made for
birth weight z score, corrected gestational age at time of measurement and
chronological age. Model selection was made by multivariable testing of covariates
with univariate p-values ≤ 0.1, using the forward method to avoid over-fitting. SAS 9.1
statistical software and PASW® 17 was used for data analysis. All tests were two-tailed
and p-values <0.05 were considered statistically significant.
Power
Estimation of sample size was based on data from a previous audit44 using a mean
growth rate of 12.8 g kg-1d-1 and standard deviation of 5 g kg-1d-1. A sample size of
20 in each group was sufficient to achieve 80% power to detect a difference of
3.4 g kg-1d-1 in a repeated measures design with an alpha level of 0.05 (Power Analysis
and Sample Size (PASS) Statistical�Software, 2008)44.
Results
Subject Demographics
Ninety-one of the 691 infants admitted to the NCCU between 26 January and
9 June 2009 were born <30 weeks gestation. Fifty-one infants were excluded from the
study for reasons including congenital renal abnormality (n=1), withheld consent (n=8),
living remotely (n=13), paused recruitment (due to an investigator’s absence) (n=19)
and death (n=10). Forty infants (Caucasian n=36, Aboriginal n=2, Asian n=1,
Other n=1) born from either singleton (n=24) or twin (n=16) births at a median
(IQR; range) age of 27 (25-28; 23-29) weeks and a birth weight of
1022 (730-1268; 480-1475) g were randomly assigned to either the intervention
(Gpi=20) or the control group (Gpc=20).
178
The clinical characteristics of the infants did not significantly differ between groups
(Table 1). All infants were AGA, with the exception of two control infants whose birth
weights were on the 6th weight percentile. Infants regained birth weight in a median
(IQR, range) of 10 (8-15; 1-25) days. On average, there was no difference in the
number of days infants were fed in the nursery [Gpi 75 (26), Gpc 75 (26), p=0.962].
Infants achieved full enteral and fortified feeds by day 18 (11-22; 8-29) and
day 20 (15-26; 10-39), respectively, and the duration of the intervention period
(i.e. fortified milk feeds with or without breastfeeding) was similar [Gpi n=45 (24) days,
Gpc n=42 (23) days, p=0.720). The cGA age range of infants in each group measured at
discharge was Gpi 33-43 wk and Gpc 33-42 wk, and then at the term cGA assessment,
Gpi 37-43 wk and Gpc 38-42 wk. Comparisons between ‘transferred’ vs ‘not
transferred’ infants showed no baseline differences and no growth outcome differences
within each treatment group.
Composition of Milk Feeds
The mean (SD) protein, fat and lactose concentration and the derived energy content
and PER of milk feeds is reported in Table 2 as:
(i) mean composition of the average composition of each infant’s milk feeds for
the first 14 days of enteral feeding;
(ii) mean composition of the average composition of each infant’s milk feeds fed
after the first 14 days of enteral feeding; and
(iii) combined mean composition of the average composition of each infant’s
milk feeds
The lactose concentration of milk feeds fed in the first 14 days of feeding (p=0.015) but
not after 14 days of feeding (p=0.133) milk significantly differed between groups (Table
2).
Nutrition Intakes
On average, 17% by volume of the total fluids received by infants while in hospital
were given intravenously and human milk constituted 93% of the enteral intakes
(84% MOM-Gpi n=18, Gpc n=19; 16% DM-Gpi n=5, Gpc n=4)), and an estimated 7% of
179
MOM was breastfed (Figure 2). Fortification was suspended for one infant during the
intervention period due to suspected necrotising enterocolitis (NEC) and parenteral
nutrition was reinstituted for a period of 30 days before recommencing fortification.
Fortified feeds were prematurely ceased for two control infants (n1=day 14; n2=day 32)
due to the re-institution of parenteral nutrition for oesophageal atresia and NEC,
respectively and also for two intervention infants who were each changed to an
elemental formula because of feeding intolerance (n1=day 15; n2= day 47). Another
Gpi infant was transferred on the first day feeds were fortified and the feed was changed
to preterm formula. Fortified milk feeds were not reintroduced for any of these five
infants prior to discharge and the infant who had fortified feeds for <1 day was excluded
from the analysis during the intervention period. In total, 11 infants (Gpi n=6, Gpc n=5)
received some infant formula (IF) during their stay (Figure 2) and 16 infants were
consuming some IF at term CA.
The intervention period was of similar duration between groups (Gpi n=44 (24) days;
Gpc n=42 (23) days, p=0.801), and occurred for 59 (18)% and 57 (17)% of the days
Gpi and Gpc infants were fed up until discharge (p=0.767). During the intervention
period (excluding PN for Gpi n=1), Gpi infants consumed significantly less protein
[3.2 (0.4) vs. 3.9 (0.3) g kg-1d-1, p<0.001] and energy [510 (39) vs. 559 (34) kJ kg-1d-1,
p<0.001] than Gpc infants (Table 3). Overall, when intakes from all sources were
combined, that is parenteral, intravenous and enteral nutrition, the protein and energy
and the PER of their respective combined intakes during hospital stay did not differ
between groups (Table 3).
Growth
During the intervention period, the unadjusted mean (SD) rate of weight gain achieved
by infants in the intervention group (13.5 (3.5) g kg-1d-1) was significantly slower than
the rate achieved by the controls (15.7 (3.0) g kg-1d-1, p=0.042), though neither group
differed significantly from the fetal rate of weight gain in the last trimester of pregnancy
(~15 g kg-1d-1, Gpi p=0.081, Gpc p=0.300).
At discharge and term cGA, weight (g), length (cm) head circumference (cm) and
weight gain velocity were similar between groups (Table 5). When adjusted for
corrected gestational age, chronological age and birth weight z score, no significant
difference in weight gain velocity was found between treatment groups (p=0.140).
180
There was an average 9% increase in weight gain velocity (g kg-1d-1) for every
additional g kg-1d-1 of enteral protein (95% CI 1.01-1.18), p=0.024). However, the rates
of weight gain achieved by each group, calculated both from birth and after recovering
birth weight, were significantly slower than the fetal rate (birth to discharge:
Gpi p<0.001; Gpc p<0.001; birth to term: Gpi p<0.001; Gpc p<0.001; post birth weight
recovery to discharge: Gpi p<0.001; Gpc p=0.051; post birth weight recovery to term:
Gpi p<0.001; Gpc p<0.001). Eighteen infants had weights below the 10th percentile
(Gpi n=11, Gpc n=7; p=0.204), and at the term assessment the weights of a further two
control infants had fallen below the 10th percentile (Gpi n=11, Gpc n=9, p=0.527).
Body Composition
At discharge (Gpi 38 (2) weeks; Gpc 38 (2) weeks), intervention and control infants had
similar percentage FM (%FM), demonstrated both univariately and after adjusting for
cGA and length at measurement (p=0.239) (Table 5). Female infants had an average
3% greater FM than males (95% CI 1-5%), p<0.001).
After inclusion of carbohydrate in the regression model, protein intake > 3.4 g kg-1 d-1
(from all nutrition sources) reduced FM by 2% (p=0.042). The energy intakes of the
10 infants (Gpi n=4, Gpc n=6; 25%) who consumed these higher protein intakes ranged
between 389 and 537 kJ kg-1d-1, and their mean rate of weight gain, calculated after
recovery of birth weight, was similar to the fetal rate (high protein - 14.7 g kg-1d-1
vs. fetal- 15 g kg-1d-1, p=0.514).
At discharge, preterm infants had a significantly greater %FM than the 38-week-old
reference fetus (Fetus: 9.5%, Gpi 13.7 (3.6)%; p<0.001, Gpc 13.6 (3.5)%, p<0.001)42.
At term cGA (Gpi 40 (1) weeks; Gpc 40 (1) weeks), univariate analysis showed no
significant difference in %FM between groups. However, after correcting for length,
intervention infants were found to have 1.4% more FM than controls and the difference
was significant (95% CI 0.04 – 2.8, p=0.044). Female infants were fatter than the males
(2%, 95% CI 1%-4%, p=0.004) (Table 5).
Both intervention and control infants at corrected term age were fatter than the reference
fetus at 40 weeks gestation (Fetus: 11.2%, Gpi 16.7 (3.7)%, p<0.000, Gpc 15.9 (4.4)%,
p=0.000) but at the same age, only the intervention infants were fatter than the reference
181
term infant constructed by Fomon and colleagues43 (Term infant 14.3%, Gpi 16.7%,
p=0.012, Gpc 15.9%, p=0.117).
For the infants (n=36) with repeated PEAPOD tests (n=58), the mean within subject SD
and CV were 1.23%FM and 7.93%FM, respectively, with a technical error of 1.2%FM.
Discussion
It was hypothesised that the growth and BC of very preterm infants would more closely
match reference growth if milk was fortified on measured composition to target protein
and energy ReasNI and PER according to birth weight and cGA36. However, infants in
the intervention group consumed lower intakes and achieved slower weight gain than
controls during the intervention period. These differences did not translate to
significant differences in combined nutritional intakes between groups during hospital
stay nor in discharge weight, length, head circumference or percent FM. The following
reasons for these observations are speculated.
Firstly, the mean protein content of preterm milk feeds fed to infants after 14 days of
enteral feeding was found on analysis to be higher (1.6 g 100 mL-1) than both the
assumed values in our Unit (1.4 g 100 mL-1) and the commonly cited value used by
others (1.2 g 100 mL-1)68. Therefore, lower amounts of HMF and protein powder were
added to the milk of intervention infants. Secondly, and combined with this, infants did
not always meet the volume intakes to which fortification was targeted and infants on
lower volumes were not always prescribed more concentrated feeds. Therefore, both
protein and energy intakes were lower than expected, especially in the intervention
group. Thirdly, fortification was not adjusted to compensate for the dilutionary effect of
breastfeeding (although contributing only an estimated 7% to milk intake), nor for the
small47, 48, but significant47, over-estimation of milk protein by the HMA (some
recommend adding 0.1 to 0.2 g of extra protein per 100 mL to adjust for this over-
estimation48). Finally, fortification for the intervention infants was tailored according to
birth weight and reduced with corrected gestational age, whereas fortification for
controls was always targeted to upper limits of ReasNI for ELBW infants. Thus, for
several reasons, protein and energy intakes were lower and rates of weight gain were
slower in the intervention group compared to controls, during the intervention period.
However, macronutrient and energy intakes during this period contributed < 60% of
total intakes. As combined intakes from all nutrition sources did not differ between
182
groups, it is not surprising that weight, length, head circumference and %FM did not
differ between groups at discharge.
The European Society of Paediatric Gastroenterology, Hepatology and Nutrition
Committee on Nutrition (ESPGHAN-CON) have recently commented on enteral
nutrition for preterm infants17. In its view, energy intakes should be maintained
between 460 and 565 kJ kg-1d-1 (110 to 130 kcal kg-1d-1) and PER ranges of 3.6 to 4.1
and 3.2 to 3.6 should be targeted for infants weighing less than 1000 g and between
1000 to 1800 g, respectively. These PER ranges are considerably higher than the
consensus targets36 (2.8-3.3) and well above the PER (Gpi 2.7, Gpc 2.9) that was
achieved with protein and energy fortification in this study. They are also higher than
the PER achieved by Arslanoglu et al39, who demonstrated that an extra 0.8 g of protein
powder could be added to fortified milk feeds (HMF) without adverse clinical
outcomes. Their method of adjusting fortification on the basis of plasma urea provided
an objective, practical method of assessing metabolic response to protein intake.
However, using this physiological biomarker to guide fortification still resulted in a
range of protein and energy intakes (2.9-3.4 g kg-1d-1 and 535 kJ kg-1d-1)19 below the
consensus guidelines36 and for protein at least, below the latest ESPGHAN targets17.
It is noteworthy that Arslanoglu et al19 did not use an energy supplement and achieved
these protein and energy intakes with HMF (sometimes in greater amounts than is
recommended by the manufacturer), and with additional protein powder. Thus, it would
seem that increasing the protein content of milk feeds even further, without adding an
energy supplement, may translate into meeting the latest ESPGHAN-CON
recommendations. Further, it has previously been shown that the osmolality of a
routine feed was not raised beyond 490 mOsm kg-1H20 with the addition of HMF (as
directed) plus 0.8 g of protein powder and 3.0 g of energy powder69, so these new
ESPGHAN recommendations may well be achievable without further added risk of
feeding intolerance and NEC. However, if these nutrition guidelines are to be adopted
in practice, more studies are required to determine a safe, maximum level of
fortification in the context of resulting osmolality, feeding tolerance and metabolic
outcomes.
Notably, intervention infants consumed lower amounts of carbohydrate compared to
control infants, possibly due to the intrinsically lower lactose content of their
183
transitional milk and to the smaller, added amounts of both HMF and energy
supplement (0.6 g CHO g-1 HMF; 0.73 g CHO g-1 Duocal). The clinical significance of
this lower carbohydrate intake is uncertain; however, carbohydrate has been shown to
have a protein-sparing effect over fat70, 71. Others, basing their calculation on assumed
milk composition, have shown that carbohydrate is the main determinant of preterm
growth when protein intake is adequate (estimated mean intake 3.6 g kg-1d-1 after full
feeds achieved)72. Combined protein intake > 3.4 g kg-1d-1 was achieved by 25%
(n=10) of infants. After recovering birth weight, infants consuming this level of protein
intake achieved a weight gain of 14.7 (1.5) g kg-1d-1, similar to the fetus42. The mean
(SD) PER of these infants’ feeds was 3.3 (0.5), which is aligned with the Consensus
Guideline36, 73 but is lower than the latest ESPGHAN guideline17. Regression modelling
showed that the FM of these infants was reduced by 2%, when carbohydrate was
included in the model, a finding supported by a previous study showing that protein
intake increased FFM when carbohydrate was included in the model (p 151, PEAPOD
Paper, Thesis). The mechanism for this synergy may be mediated through the action of
insulin, which is secreted in response to feeding both carbohydrate and protein74 and it
is possible leucine has a regulatory role in the process75, promoting glucose uptake into
muscle76. On this basis, it is postulated that lower carbohydrate intake may have
interfered in this synergy77, thus explaining the slower weight gain and greater FM that
was observed in the intervention infants at term. Further investigation of this
relationship may be warranted, especially if HMF formulations are to be reviewed in
light of the latest ESPGHAN recommendations. Revised macronutrient composition of
fortifiers and formula must contain sufficient amounts of protein and energy to achieve
recommended intakes at 150 mL/kg/d and the ratio of protein, fat and carbohydrate to
total energy needs to be carefully considered in order to optimise both the uptake of
protein into lean tissue and to ensure fat gain is not excessive.
Modelled fetal chemical data suggests the fetus doubles its percentage FM between
33 and 42 weeks gestation (7-15%)42, 78. After consuming protein intakes between
3.2 to 3.4 g kg-1d-1, energy intakes between 460 and 480 kJ kg-1d-1 (PER 3.0), the mean
FM of preterm infants (n=40) was 13.7% of body weight at 38 weeks
(range: 33-43 weeks cGA) and 16.2% at term (range: 37-43 weeks cGA). Interestingly,
no difference was detected between the groups at term until the measurements were
corrected for length, a finding that highlights the importance of adjusting for length
when assessing body fatness. Whilst these BC data for preterm infants are greater than
184
those of the reference fetus at 38 (%FM 9.9%) and 40 weeks (%FM 11.2%)42, they
accord well with Widdowson’s estimate of the percent body fat of the fetus at the
equivalent ages79. They are also aligned with those PEAPOD measurements of preterm
infants at term age obtained by Roggero and colleagues41 and with those of mostly
breastfed, term infants measured in the second80, but not the first week of life41.
Body composition and nutritional outcomes are difficult to measure in very preterm
infants due to both the lack of suitable measuring methods available for use in the
neonatal setting and to the unpredictability of an infant’s clinical course. The latter
invariably dictates an infant’s feeding course, length of admission and age at discharge,
all of which influence when an infant’s measurement can be taken. Similarly,
measuring the true effect of different fortification regimens on growth outcomes is
logistically challenging because, despite randomisation, adjusting adequately for the
variable metabolic and biological responses by individuals to feeding and
environmental stimuli is difficult. Further, combined nutrition intakes (and not solely
fortified milk intakes) need to be considered when assessing growth and developmental
outcomes at discharge and corrected term age. A larger sample size and portable,
bedside methods for measuring changes in BC from birth would assist in addressing
these confounders.
We conclude from this pragmatic, clinical trial that fortifying milk based on
macronutrient milk analysis is a labour-intensive and time-consuming task that did not
result in improved growth outcomes of infants. Our intervention resulted in lower
intakes and slower weight gain compared to already optimised routine fortification,
outcomes attributed to the down-titration of protein with corrected gestational age and
to the lower than expected volume intakes. The positive relationship between an
achieved protein intake and BC suggests that fortification regimens that target higher
protein intakes may improve growth.
185
References (Paper 3)
1. American Academy of Pediatrics. Breastfeeding and the Use of Human Milk. Pediatrics. 2005; 115(2): 496-506. 2. Hernell O, Blackberg L. Digestion of human milk lipids: physiologic significance of sn-2-monoacylglycerol hydrolysis by bile salt stimulated lipase. Pediatr Res. 1983; 16: 882-5. 3. Adkins Y, Lonnerdal B. Mechanisms of vitamin B(12) absorption in breast-fed infants. J Pediatr Gastroenterol Nutr. 2002; 35(2): 192-8. 4. Iyer S, Lonnerdal B. Lactoferrin, lactoferrin receptors and iron metabolism. Eur J Clin Nutr. 1993; 47(4): 232-41. 5. Lucas A, Morley R, Cole TJ. Randomised trial of early diet in preterm babies and later intelligence quotient. BMJ. 1998; 317(7171): 1481-7. 6. Horwood LJ, Darlow BA, Mogridge N. Breast milk feeding and cognitive ability at 7-8 years. Arch Dis Child Fetal Neonatal Ed. 2001; 84: F23-7. 7. Vohr BR, Poindexter BB, Dusick AM, McKinley LT, Wright LL, Langer JC, et al. Beneficial effects of breast milk in the neonatal intensive care unit on the developmental outcome of extremely low birth weight infants at 18 months of age. Pediatrics. 2006; 118(1): e115-23. 8. Blaymore Bier J, Oliver T, Ferguson A, Vohr B. Human milk reduces outpatient upper respiratory symptoms in premature infants during their first year of life. J Perinatol. 2002; 22: 354-9. 9. Valenti P, Antonini G. Lactoferrin: an important host defence against microbial and viral attack. Cell Mol Life Sci. 2005; 62(22): 2576-87. 10. Lucas A, Cole TJ. Breast milk and neonatal necrotising enterocolitis. Lancet. 1990; 336: 1519-23. 11. Sullivan S, Schanler RJ, Kim JH, Patel AL, Trawoger R, Kiechl-Kohlendorfer U, et al. An exclusively human milk-based diet is associated with a lower rate of necrotizing enterocolitis than a diet of human milk and bovine milk-based products. J Pediatr. 2010; 156(4): 562-7 e1. 12. Lai C. Production and composition of milk from 10 - 60 days of lactation in mothers who delivered prematurely. Nedlands: University of Western Australia; 2007. 13. Mitoulas LR, Kent JC, Cox DB, Owens RA, Sherriff JL, Hartmann PE. Variation in fat, lactose and protein in human milk over 24 h and throughout the first year of lactation. Br J Nutr. 2002; 88(1): 29-37. 14. Wojcik KY, Rechtman DJ, Lee ML, Montoya A, Medo ET. Macronutrient analysis of a nationwide sample of donor breast milk. J Am Diet Assoc. 2009; 109(1): 137-40. 15. Gross SJ, Geller J, Tomarelli RM. Composition of breast milk from mothers of preterm infants. Pediatrics. 1981; 68(4): 490-3. 16. Atkinson SA, Bryan MH, Anderson GH. Human milk feeding in premature infants: protein, fat, and carbohydrate balances in the first two weeks of life. J Pediatr. 1981; 99: 617-24. 17. Agostoni C, Buonocore G, Carnielli VP, De Curtis M, Darmaun D, Decsi T, et al. Enteral nutrient supply for preterm infants: commentary from the European Society of Paediatric Gastroenterology, Hepatology and Nutrition Committee on Nutrition. J Pediatr Gastroenterol Nutr. 2010; 50(1): 85-91. 18. Pediatrics AAo. Breastfeeding and the use of human milk. Pediatrics. 2005; 115: 496-506. 19. Arslanoglu S, Moro G, Ziegler E. Preterm infants fed fortified human milk receive less protein than they need. J Perinatol. 2009; 29: 489-92.
186
20. Embleton NE, Pang N, Cooke RJ. Postnatal malnutrition and growth retardation: an inevitable consequence of current recommendations in preterm infants? Pediatrics. 2001; 107(2): 270-3. 21. Cooke R, Ainsworth S, Fenton A. Postnatal growth retardation: a universal problem in preterm infants. Arch Dis Child Fetal Neonat Ed. 2004; 89: F428-F30. 22. Hans DM, Pylipow M, Long JD, Thureen PJ, Georgieff MK. Nutritional practices in the neonatal intensive care unit: analysis of a 2006 neonatal nutrition survey. Pediatrics. 2009; 123(1): 51-7. 23. Cormack B, Sinn J, Lui K, Tudehope D. Australasian neonatal intensive care enteral nutrition practices: analysis of a 2008 survey. JPCH. 2010; 46 Supplement 1: 12 [Abstract]. 24. Thureen PJ, Melara D, Fennessey PV, Hay WW, Jr. Effect of low versus high intravenous amino acid intake on very low birth weight infants in the early neonatal period. Pediatr Res. 2003; 53(1): 24-32. 25. Ibrahim HM, Jeroudi MA, Baier RJ, Dhanireddy R, Krouskop RW. Aggressive early total parental nutrition in low-birth-weight infants. J Perinatol. 2004; 24(8): 482-6. 26. van den Akker CH, te Braake FW, Wattimena DJ, Voortman G, Schierbeek H, Vermes A, et al. Effects of early amino acid administration on leucine and glucose kinetics in premature infants. Pediatr Res. 2006; 59: 732-5. 27. Valentine CJ, Fernandez S, Rogers LK, Gulati P, Hayes J, Lore P, et al. Early amino-acid administration improves preterm infant weight. J Perinatol. 2009; 29(6): 428-32. 28. Fenton TR, Belik J. Routine handling of milk fed to preterm infants can significantly increase osmolality. J Pediatr Gastroenterol Nutr. 2002; 35(3): 298-302. 29. Janjindamai W, Chotsampancharoen T, Janjindamai W, Chotsampancharoen T. Effect of fortification on the osmolality of human milk. Journal of the Medical Association of Thailand. 2006; 89(9): 1400-3. 30. Patole S. Strategies for prevention of feed intolerance in preterm neonates: a systematic review. J Matern Fetal Neonatal Med. 2005; 18(1): 67-76. 31. Chauhan M, Henderson G, McGuire W. Enteral feeding for very low birth weight infants: reducing the risk of necrotising enterocolitis. Archives of Disease in Childhood Fetal & Neonatal Edition. 2008; 93(2): F162-6. 32. Bombell S, McGuire W, Bombell S, McGuire W. Delayed introduction of progressive enteral feeds to prevent necrotising enterocolitis in very low birth weight infants.[update of Cochrane Database Syst Rev. 2000;(2):CD001970; PMID: 10796276]. Cochrane Database of Systematic Reviews. 2008; (2): CD001970. 33. Reichman B, Chessex P, Verellen G, Putet G, Smith JM, Heim T, et al. Dietary composition and macronutrient storage in preterm infants. Pediatrics. 1983; 72(3): 322-8. 34. Kashyap S, Forsyth M, Zucker C, Ramakrishnan R, Dell RB, Heird WC. Effects of varying protein and energy intakes on growth and metabolic response in low birth weight infants. J Pediatr. 1986; 108(6): 955-63. 35. Kashyap S, Schulze KF, Forsyth M, Zucker C, Dell RB, Ramakrishnan R, et al. Growth, nutrient retention, and metabolic response in low birth weight infants fed varying intakes of protein and energy. J Pediatr. 1988; 113(4): 713-21. 36. Tsang RC, Uauy R, Koletzko B, Zlotkin SH, editors. Nutrition of the preterm infant. Scientific basis and practical guidelines. 2nd Edition ed. Cincinnati, Ohio: Digital Educational Publishing, Inc.; 2005. 37. Polberger S, Raiha NC, Juvonen P, Moro GE, Minoli I, Warm A. Individualized protein fortification of human milk for preterm infants: comparison of ultrafiltrated human milk protein and a bovine whey fortifier. J Pediatr Gastroenterol Nutr. 1999; 29(3): 332-8.
187
38. de Halleux V, Close A, Stalport S, Studzinski F, Habibi F, Rigo J. [Advantages of individualized fortification of human milk for preterm infants]. Archives de Pediatrie. 2007; 14 Suppl 1: S5-10. 39. Arslanoglu S, Moro GE, Ziegler EE. Adjustable fortification of human milk fed to preterm infants: does it make a difference?[see comment]. Journal of Perinatology. 2006; 26(10): 614-21. 40. Uthaya S, Thomas EL, Hamilton G, Dore CJ, Bell J, Modi N. Altered adiposity after extremely preterm birth. Pediatr Res. 2005; 57(2): 211-5. 41. Roggero P, Gianni ML, Amato O, Orsi A, Piemontese P, Morlacchi L, et al. Is term newborn body composition being achieved postnatally in preterm infants? Early Hum Dev. 2009; 85(6): 349-52. 42. Ziegler E, O'Donnell A, Nelson S, Fomon S. Body composition of the reference fetus. Growth. 1976; 40: 329-41. 43. Fomon SJ, Haschke F, Ziegler EE, Nelson SE. Body composition of reference children from birth to age 10 years. The American Journal Of Clinical Nutrition. 1982; 35(5 Suppl): 1169-75. 44. McLeod G, Sherriff J, Simmer K, Tompkins J, Hartmann PE. Audit of nutrition intake and growth of preterm infants in the NCCU JPCH. 2007; 43: A44 [Abstract]. 45. Anderson GH, Atkinson SA, Bryan MH. Energy and macronutrient content of human milk during early lactation from mothers giving birth prematurely and at term. Am J Clin Nutr. 1981; 34(2): 258-65. 46. Lepage G, Collet S, Bougle D, Kien LC, Lepage D, Dallaire L, et al. The composition of preterm milk in relation to the degree of prematurity. Am J Clin Nutr. 1984; 40(5): 1042-9. 47. Casadio Y, Williams T, Lai C, Olsson S, Hepworth A, Hartmann P. Evaluation of a Mid-Infrared Analyzer for the determination of the macronutrient composition of human milk. The Journal of Human Lactation. 2010; In Press. 48. Menjo A, Mizuno K, Murase M, Nishida Y, Taki M, Itabashi K, et al. Bedside analysis of human milk for adjustable nutrition strategy. Acta Paediatr. 2009; 98(2): 380-4. 49. National Health and Medical Research Council. Nutrient reference values for Australia and New Zealand including Recommended Dietary Intakes. Canberra: Commonwealth of Australia; 2006. 50. Ellis K, Yao M, Shypailo R, Urlando A, Wong W, Heird W. Body composition assessment in infancy: air-displacement plethysmography versus a four compartment criterion model. Am J Clin Nutr. 2007; 85: 90-5. 51. Butte NF, Hopkinson JM, Wong WW, Smith EO, KJ E. Body composition during the first 2 years of life. An updated reference. Pediatr Res. 2000; 47: 578-85. 52. Gianni ML, Roggero P, Taroni F, Liotto N, Piemontese P, Mosca F. Adiposity in small for gestational age preterm infants assessed at term equivalent age. Arch Dis Child Fetal Neonatal Ed. 2009; 94(5): F368-72. 53. Roggero P, Gianni ML, Amato O, Orsi A, Piemontese P, Cosma B, et al. Postnatal growth failure in preterm infants: recovery of growth and body composition after term. Early Hum Dev. 2008; 84(8): 555-9. 54. Urlando A, Dempster P, Aitkens S. A new air displacement plethysmograph for the measurement of body composition in infants. Pediatric Research. 2003; 53(3): 486-92. 55. Sainz R, Urlando A. Evaluation of a new pediatric air-displacement plethysmograph for body-composition assessment by means of chemical analysis of bovine tissue phantoms. 2003.
188
56. Shah PS, Wong KY, Merko S, Bishara R, Dunn M, Asztalos E, et al. Postnatal growth failure in preterm infants: ascertainment and relation to long-term outcome. J Perinat Med. 2006; 34(6): 484-9. 57. Rodriguez G, Venture P, Samper M, Moreno L, Sarria A, Perez-Gonzalez J. Changes in body composition during the initial hours of life in breast-fed healthy term newborns. Biol Neonate. 2000; 77: 12-6. 58. Tang W, Ridout D, Modi N. Influence of respiratory distress syndrome on body composition after preterm birth. Arch Dis Child Fetal Neonatal Ed. 1997; 77(1): F28-31. 59. Bauer K, Bovermann G, Roithmaier A, Gotz M, Proiss A, Versmold HT. Body composition, nutrition, and fluid balance during the first two weeks of life in preterm neonates weighing less than 1500 grams. J Pediatr. 1991; 118(4 ( Pt 1)): 615-20. 60. Shaffer S, Bradt S, Hall R. Postnatal changes in total body water and extracellular volume in the preterm infant with respiratory distress syndrome. J Pediatr. 1986; 109: 509-14. 61. Bauer K, Cowett RM, Howard GM, vanEpp J, Oh W. Effect of intrauterine growth retardation on postnatal weight change in preterm infants. J Pediatr. 1993; 123(2): 301-6. 62. Singhi S, Sood V, Bhakoo ON, Ganguly NK. Effect of intrauterine growth retardation on postnatal changes in body composition of preterm infants. Indian J Med Res. 1995; 102: 275-80. 63. Heimler R, Doumas B, Jendrzejczak B, Nemeth P, Hoffman R, Nelin L. Relationship between nutrition, weight change and fluid compartments in preterm infants during the first week of life. J Pediatr. 1993; 1993(122). 64. Patel AL, Engstrom JL, Meier PP, Kimura RE. Accuracy of methods for calculating postnatal growth velocity for extremely low birth weight infants. Pediatrics. 2005; 116(6): 1466-73. 65. Patel AL, Engstrom JL, Meier PP, Jegier BJ, Kimura RE. Calculating postnatal growth velocity in very low birth weight (VLBW) premature infants. J Perinatol. 2009; 29(9): 618-22. 66. Fenton TR. A new growth chart for preterm babies: Babson and Benda's chart updated with recent data and a new format. BMC Pediatr. 2003; 3: 13. 67. Fenton TR, Sauve RS. Using the LMS method to calculate z-scores for the Fenton preterm infant growth chart. Eur J Clin Nutr. 2007; 61(12): 1380-5. 68. Maggio L, Costa S, Gallini F. Human milk fortifiers in very low birth weight infants. Early Human Development. 2009; 85(10, Supplement 1): S59-S61. 69. McLeod G, Hartmann B, Sherriff J, Simmer K. Effect of fortification on osmolality of feeds in the NICU. Proceedings of the Perinatal Society of Australia and New Zealand (PSANZ). April 3-6, Perth, Australia [Abstract]. 2006. 70. Kashyap S, Ohira-Kist K, Abildskov K, Towers HM, Sahni R, Ramakrishnan R, et al. Effects of quality of energy intake on growth and metabolic response of enterally fed low-birth-weight infants. Pediatr Res. 2001; 50(3): 390-7. 71. Munro HN. Carbohydrate and fat as factors in protein utilization and metabolism. Physiol Rev. 1951; 31: 449-88. 72. Collins CT, Gibson RA, Miller J, McPhee AJ, Willson K, Smithers LG, et al. Carbohydrate intake is the main determinant of growth in infants born <33 weeks' gestation when protein intake is adequate. Nutrition. 2008; 24: 451-7. 73. Rigo J. Protein, amino acid and other nitrogen compounds. In: Tsang R, Uauy R, Koletzko B, Zlotkin S, editors. Nutrition of the preterm infant Scientific basis and practical guidelines. 2nd ed. Cincinati: Digital Educational Publishing Inc; 2005.
189
74. Garlick PJ, Grant I. Amino acid infusion increases the sensitivity of muscle protein synthesis in vivo to insulin. Effect of branched-chain amino acids. Biochem J. 1988; 254: 579-84. 75. Garlick PJ. The role of leucine in the regulation of protein metabolism. J Nutr. 2005; 135(6 Suppl): 1553S-6S. 76. Iwanaka N, Egawa T, Satoubu N, Karaike K, Ma X, Masuda S, et al. Leucine modulates contraction- and insulin-stimulated glucose transport and upstream signaling events in rat skeletal muscle. J Appl Physiol. 2010; 108: 274-82. 77. paper P. Feasibility of Using Air Displacement Plethysmography to Assess Macronutrient Influence on Changes in Body Composition of Preterm Infants in the NICU. 78. Widdowson E, Southgate D, Hey E. Body composition of the fetus and infant. In: Visser H, editor. Nutrition and metabolism of the fetus and infant Fifth Nutricia Symposium. Rotterdam: Kluwer Boston Inc; 1979. 79. Widdowson EM. Growth and composition of the fetus and newborn. In: Assali N, editor. Biology of gestation. New York: Academic Press; 1968. p. 1-49. 80. Eriksson B, Lof M, Forsum E. Body composition in full-term healthy infants measured with air displacement plethysmography at 1 and 12 weeks of age. Acta Paediatr. 2010; 99(4): 563-8.
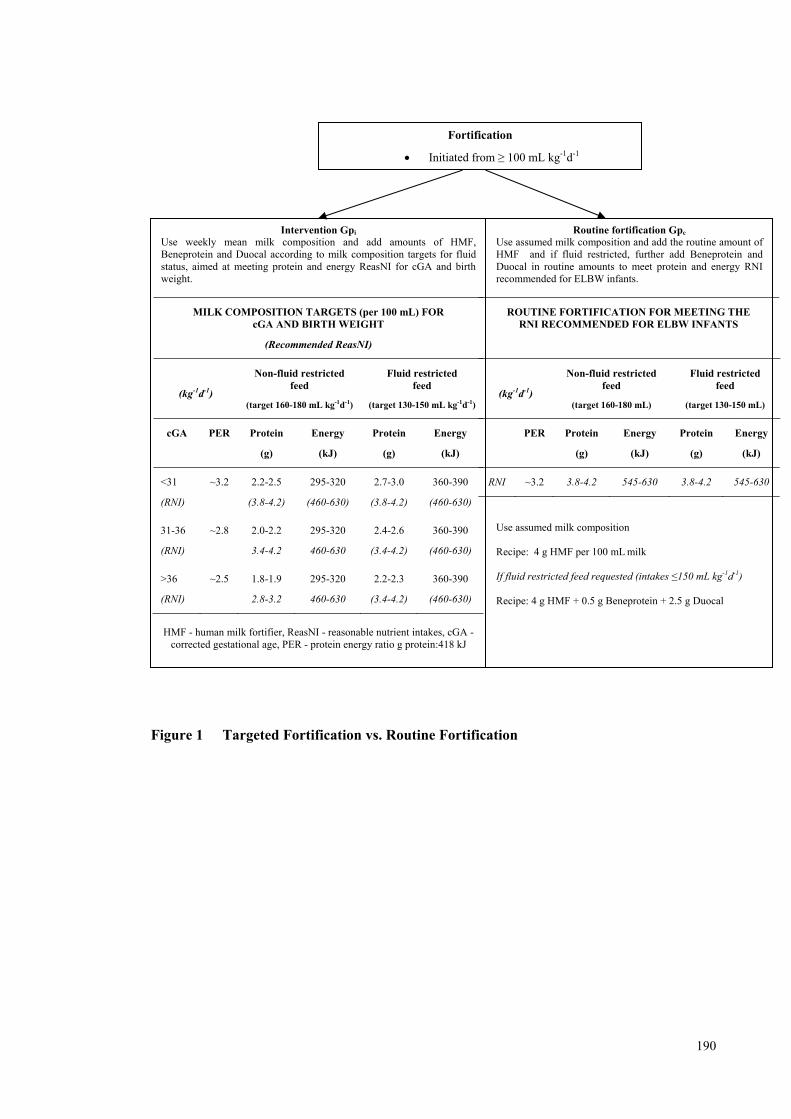
190
Figure 1 Targeted Fortification vs. Routine Fortification
Fortification
Initiated from ≥ 100 mL kg-1d-1
Intervention Gpi
Use weekly mean milk composition and add amounts of HMF, Beneprotein and Duocal according to milk composition targets for fluid status, aimed at meeting protein and energy ReasNI for cGA and birth weight.
MILK COMPOSITION TARGETS (per 100 mL) FOR cGA AND BIRTH WEIGHT
(Recommended ReasNI)
(kg-1d-1)
Non-fluid restricted feed
(target 160-180 mL kg-1d-1)
Fluid restricted feed
(target 130-150 mL kg-1d-1)
cGA PER Protein
(g)
Energy
(kJ)
Protein
(g)
Energy
(kJ)
<31
(RNI)
~3.2 2.2-2.5
(3.8-4.2)
295-320
(460-630)
2.7-3.0
(3.8-4.2)
360-390
(460-630)
31-36
(RNI)
~2.8 2.0-2.2
3.4-4.2
295-320
460-630
2.4-2.6
(3.4-4.2)
360-390
(460-630)
>36
(RNI)
~2.5 1.8-1.9
2.8-3.2
295-320
460-630
2.2-2.3
(3.4-4.2)
360-390
(460-630)
HMF - human milk fortifier, ReasNI - reasonable nutrient intakes, cGA -
corrected gestational age, PER - protein energy ratio g protein:418 kJ
Routine fortification Gpc Use assumed milk composition and add the routine amount of HMF and if fluid restricted, further add Beneprotein and Duocal in routine amounts to meet protein and energy RNI recommended for ELBW infants.
ROUTINE FORTIFICATION FOR MEETING THE RNI RECOMMENDED FOR ELBW INFANTS
(kg-1d-1)
Non-fluid restricted feed
(target 160-180 mL)
Fluid restricted feed
(target 130-150 mL)
PER Protein
(g)
Energy
(kJ)
Protein
(g)
Energy
(kJ)
RNI ~3.2 3.8-4.2 545-630 3.8-4.2 545-630
Use assumed milk composition Recipe: 4 g HMF per 100 mL milk If fluid restricted feed requested (intakes ≤150 mL kg-1d-1) Recipe: 4 g HMF + 0.5 g Beneprotein + 2.5 g Duocal
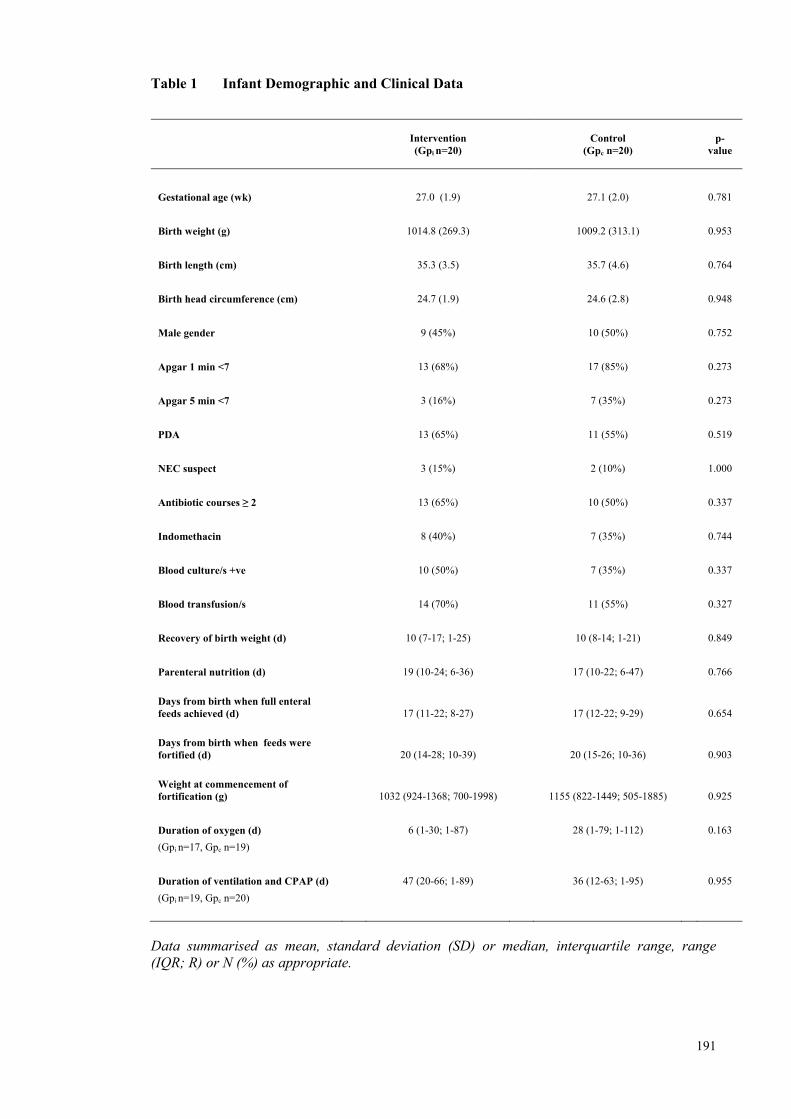
191
Table 1 Infant Demographic and Clinical Data
Intervention (Gpi n=20)
Control (Gpc n=20)
p-
value
Gestational age (wk) 27.0 (1.9) 27.1 (2.0) 0.781
Birth weight (g) 1014.8 (269.3) 1009.2 (313.1) 0.953
Birth length (cm) 35.3 (3.5) 35.7 (4.6) 0.764
Birth head circumference (cm) 24.7 (1.9) 24.6 (2.8) 0.948
Male gender 9 (45%) 10 (50%) 0.752
Apgar 1 min <7 13 (68%) 17 (85%) 0.273
Apgar 5 min <7 3 (16%) 7 (35%) 0.273
PDA 13 (65%) 11 (55%) 0.519
NEC suspect 3 (15%) 2 (10%) 1.000
Antibiotic courses ≥ 2 13 (65%) 10 (50%) 0.337
Indomethacin 8 (40%) 7 (35%) 0.744
Blood culture/s +ve 10 (50%) 7 (35%) 0.337
Blood transfusion/s 14 (70%) 11 (55%) 0.327
Recovery of birth weight (d) 10 (7-17; 1-25) 10 (8-14; 1-21) 0.849
Parenteral nutrition (d) 19 (10-24; 6-36) 17 (10-22; 6-47) 0.766
Days from birth when full enteral feeds achieved (d) 17 (11-22; 8-27) 17 (12-22; 9-29) 0.654
Days from birth when feeds were fortified (d) 20 (14-28; 10-39) 20 (15-26; 10-36) 0.903
Weight at commencement of fortification (g) 1032 (924-1368; 700-1998) 1155 (822-1449; 505-1885) 0.925
Duration of oxygen (d) 6 (1-30; 1-87) 28 (1-79; 1-112) 0.163
(Gpi n=17, Gpc n=19)
Duration of ventilation and CPAP (d) 47 (20-66; 1-89) 36 (12-63; 1-95) 0.955
(Gpi n=19, Gpc n=20)
Data summarised as mean, standard deviation (SD) or median, interquartile range, range (IQR; R) or N (%) as appropriate.
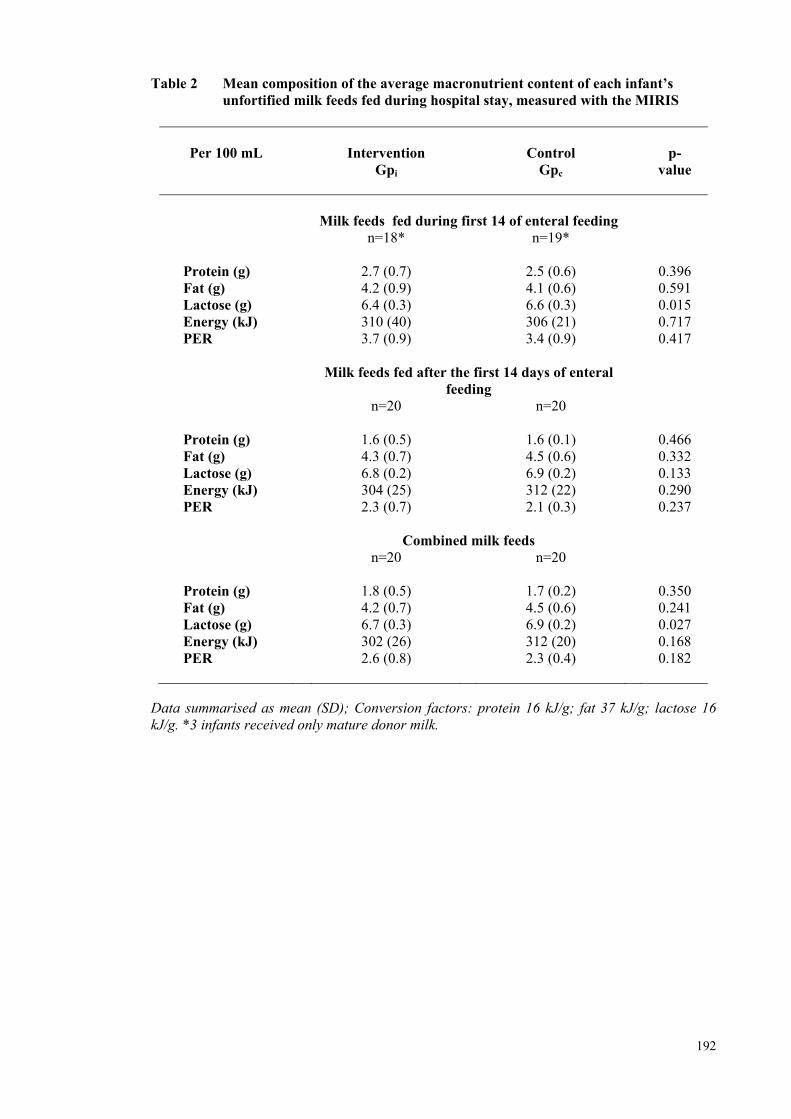
192
Table 2 Mean composition of the average macronutrient content of each infant’s unfortified milk feeds fed during hospital stay, measured with the MIRIS
Per 100 mL
Intervention
Gpi
Control Gpc
p-
value
Milk feeds fed during first 14 of enteral feeding n=18* n=19*
Protein (g) 2.7 (0.7) 2.5 (0.6) 0.396 Fat (g) 4.2 (0.9) 4.1 (0.6) 0.591 Lactose (g) 6.4 (0.3) 6.6 (0.3) 0.015 Energy (kJ) 310 (40) 306 (21) 0.717 PER 3.7 (0.9) 3.4 (0.9) 0.417 Milk feeds fed after the first 14 days of enteral
feeding
n=20 n=20 Protein (g) 1.6 (0.5) 1.6 (0.1) 0.466 Fat (g) 4.3 (0.7) 4.5 (0.6) 0.332 Lactose (g) 6.8 (0.2) 6.9 (0.2) 0.133 Energy (kJ) 304 (25) 312 (22) 0.290 PER 2.3 (0.7) 2.1 (0.3) 0.237 Combined milk feeds n=20 n=20 Protein (g) 1.8 (0.5) 1.7 (0.2) 0.350 Fat (g) 4.2 (0.7) 4.5 (0.6) 0.241 Lactose (g) 6.7 (0.3) 6.9 (0.2) 0.027 Energy (kJ) 302 (26) 312 (20) 0.168 PER 2.6 (0.8) 2.3 (0.4) 0.182
Data summarised as mean (SD); Conversion factors: protein 16 kJ/g; fat 37 kJ/g; lactose 16 kJ/g. *3 infants received only mature donor milk.
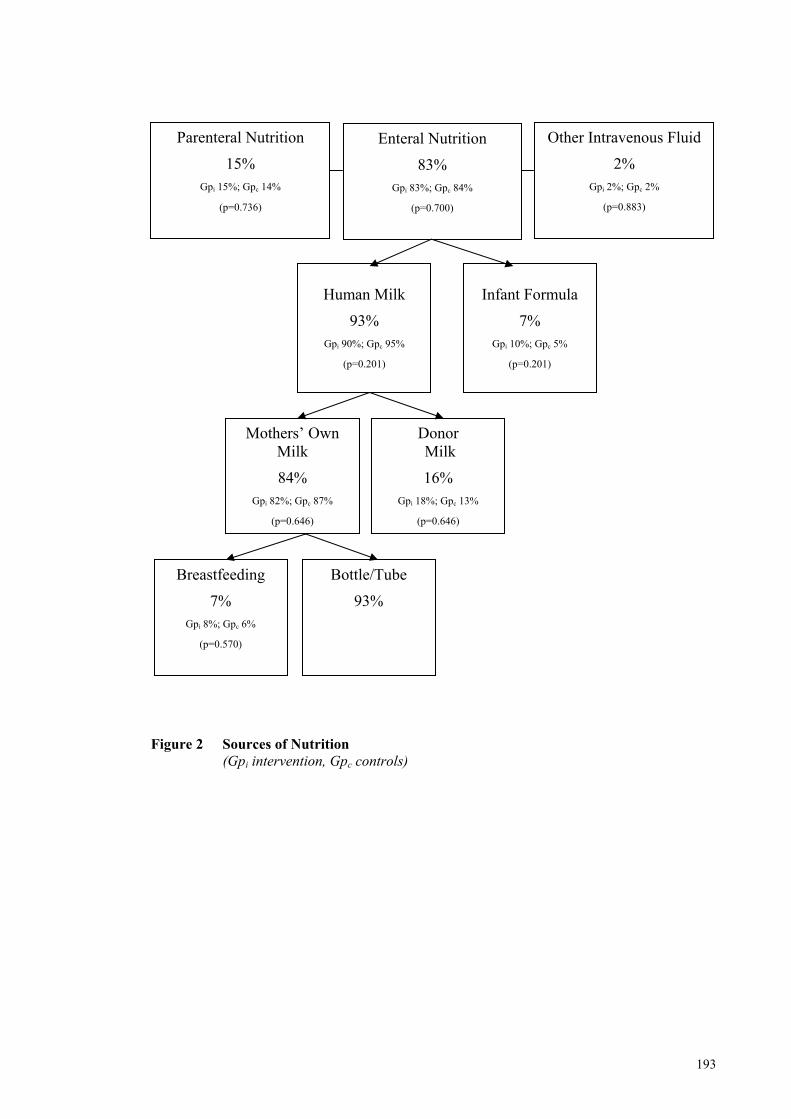
193
Figure 2 Sources of Nutrition
(Gpi intervention, Gpc controls)
Donor Milk
16% Gpi 18%; Gpc 13%
(p=0.646)
Mothers’ Own Milk
84% Gpi 82%; Gpc 87%
(p=0.646)
Breastfeeding
7% Gpi 8%; Gpc 6%
(p=0.570)
Bottle/Tube
93%
Human Milk
93% Gpi 90%; Gpc 95%
(p=0.201)
Infant Formula
7% Gpi 10%; Gpc 5%
(p=0.201)
Enteral Nutrition
83% Gpi 83%; Gpc 84%
(p=0.700)
Other Intravenous Fluid
2% Gpi 2%; Gpc 2%
(p=0.883)
Parenteral Nutrition
15% Gpi 15%; Gpc 14%
(p=0.736)
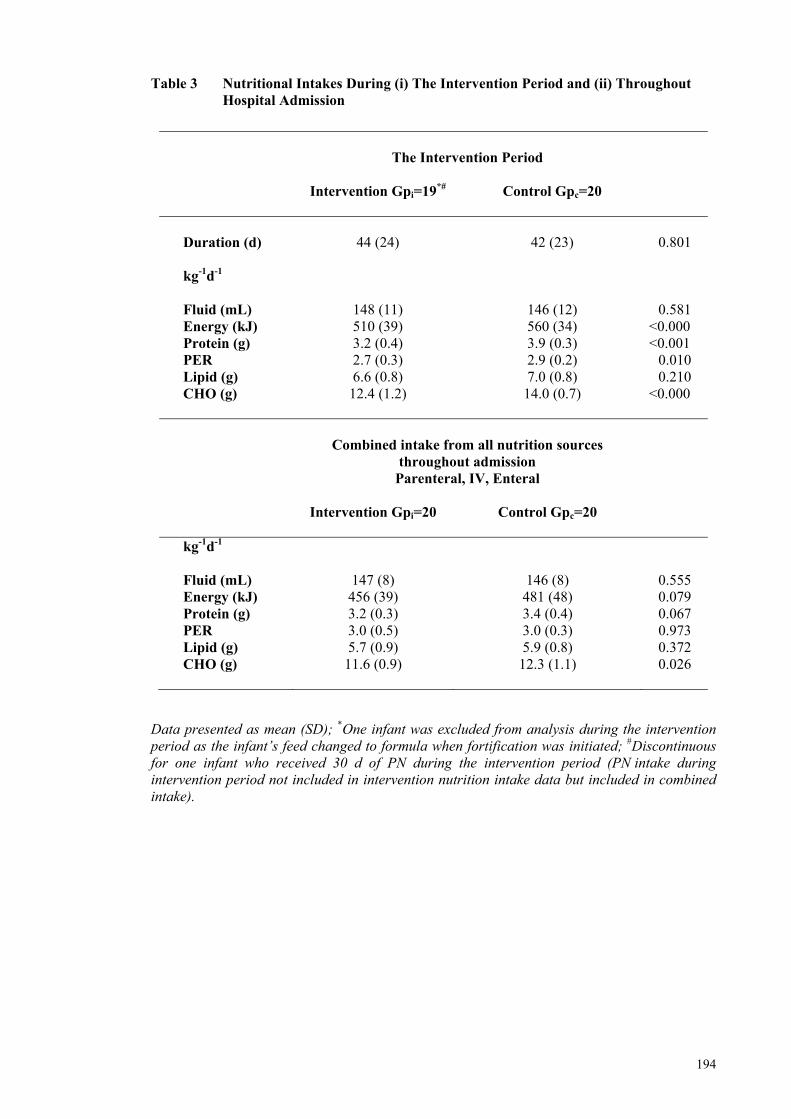
194
Table 3 Nutritional Intakes During (i) The Intervention Period and (ii) Throughout Hospital Admission
The Intervention Period
Intervention Gpi=19*# Control Gpc=20
Duration (d) 44 (24) 42 (23) 0.801 kg-1d-1
Fluid (mL)
148 (11)
146 (12)
0.581 Energy (kJ) 510 (39) 560 (34) <0.000 Protein (g) 3.2 (0.4) 3.9 (0.3) <0.001 PER 2.7 (0.3) 2.9 (0.2) 0.010 Lipid (g) 6.6 (0.8) 7.0 (0.8) 0.210 CHO (g) 12.4 (1.2) 14.0 (0.7) <0.000
Combined intake from all nutrition sources
throughout admission Parenteral, IV, Enteral
Intervention Gpi=20 Control Gpc=20
kg-1d-1 Fluid (mL) 147 (8) 146 (8) 0.555 Energy (kJ) 456 (39) 481 (48) 0.079 Protein (g) 3.2 (0.3) 3.4 (0.4) 0.067 PER 3.0 (0.5) 3.0 (0.3) 0.973 Lipid (g) 5.7 (0.9) 5.9 (0.8) 0.372 CHO (g) 11.6 (0.9) 12.3 (1.1) 0.026
Data presented as mean (SD); *One infant was excluded from analysis during the intervention period as the infant’s feed changed to formula when fortification was initiated; #Discontinuous for one infant who received 30 d of PN during the intervention period (PN intake during intervention period not included in intervention nutrition intake data but included in combined intake).
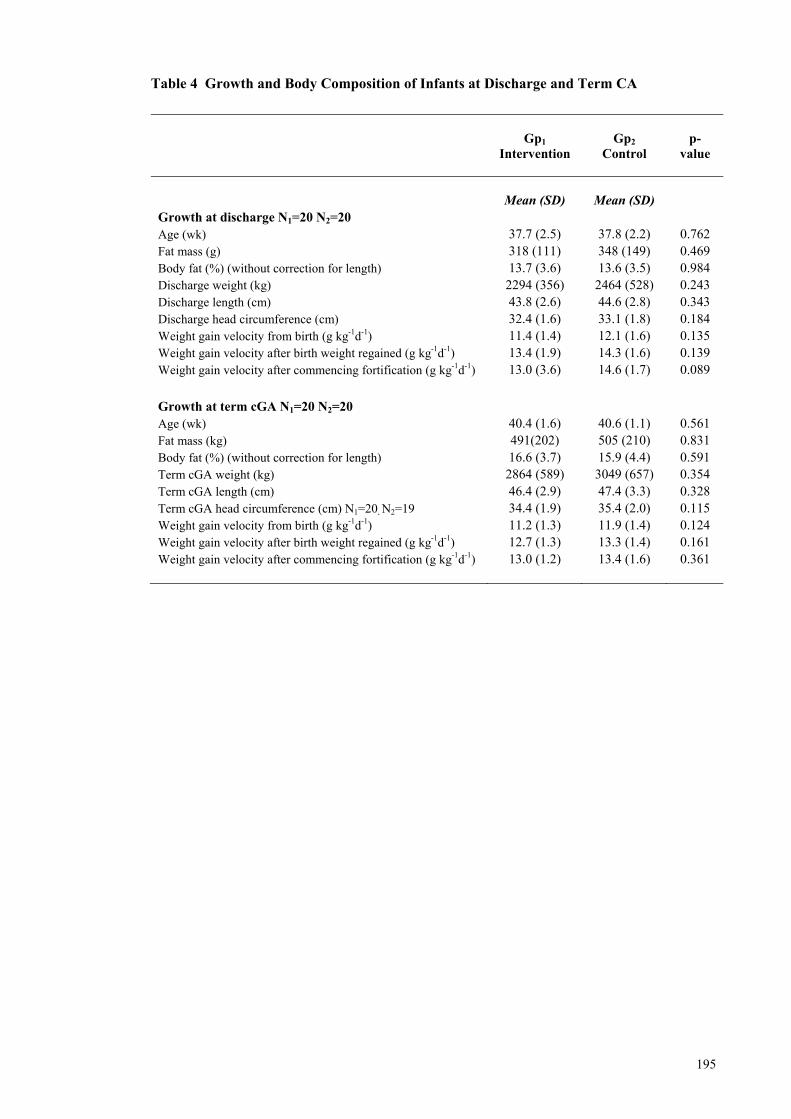
195
Table 4 Growth and Body Composition of Infants at Discharge and Term CA
Gp1
Intervention
Gp2
Control p-
value
Mean (SD) Mean (SD) Growth at discharge N1=20 N2=20 Age (wk) 37.7 (2.5) 37.8 (2.2) 0.762 Fat mass (g) 318 (111) 348 (149) 0.469 Body fat (%) (without correction for length) 13.7 (3.6) 13.6 (3.5) 0.984 Discharge weight (kg) 2294 (356) 2464 (528) 0.243 Discharge length (cm) 43.8 (2.6) 44.6 (2.8) 0.343 Discharge head circumference (cm) 32.4 (1.6) 33.1 (1.8) 0.184 Weight gain velocity from birth (g kg-1d-1) 11.4 (1.4) 12.1 (1.6) 0.135 Weight gain velocity after birth weight regained (g kg-1d-1) 13.4 (1.9) 14.3 (1.6) 0.139 Weight gain velocity after commencing fortification (g kg-1d-1) 13.0 (3.6) 14.6 (1.7) 0.089
Growth at term cGA N1=20 N2=20 Age (wk) 40.4 (1.6) 40.6 (1.1) 0.561 Fat mass (kg) 491(202) 505 (210) 0.831 Body fat (%) (without correction for length) 16.6 (3.7) 15.9 (4.4) 0.591 Term cGA weight (kg) 2864 (589) 3049 (657) 0.354 Term cGA length (cm) 46.4 (2.9) 47.4 (3.3) 0.328 Term cGA head circumference (cm) N1=20, N2=19 34.4 (1.9) 35.4 (2.0) 0.115 Weight gain velocity from birth (g kg-1d-1) 11.2 (1.3) 11.9 (1.4) 0.124 Weight gain velocity after birth weight regained (g kg-1d-1) 12.7 (1.3) 13.3 (1.4) 0.161 Weight gain velocity after commencing fortification (g kg-1d-1) 13.0 (1.2) 13.4 (1.6) 0.361
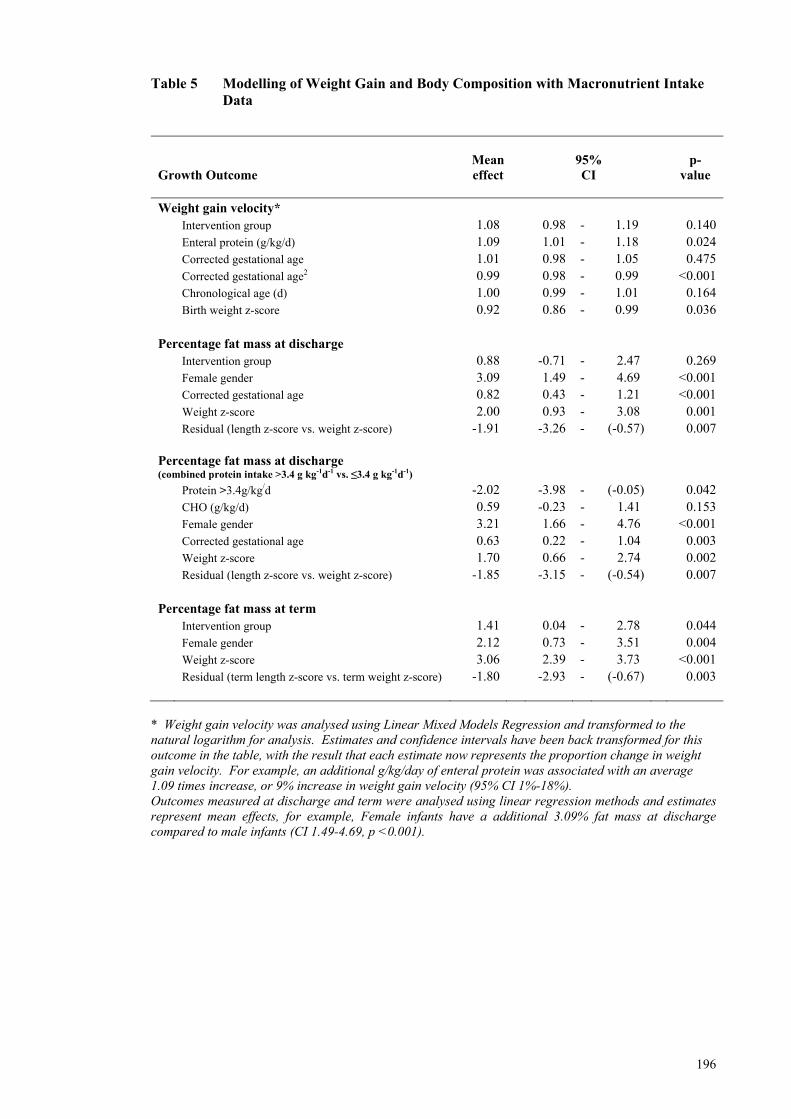
196
Table 5 Modelling of Weight Gain and Body Composition with Macronutrient Intake Data
Growth Outcome
Mean effect
95% CI
p-
value
Weight gain velocity* Intervention group 1.08 0.98 - 1.19 0.140 Enteral protein (g/kg/d) 1.09 1.01 - 1.18 0.024 Corrected gestational age 1.01 0.98 - 1.05 0.475 Corrected gestational age2 0.99 0.98 - 0.99 <0.001 Chronological age (d) 1.00 0.99 - 1.01 0.164 Birth weight z-score 0.92 0.86 - 0.99 0.036 Percentage fat mass at discharge Intervention group 0.88 -0.71 - 2.47 0.269 Female gender 3.09 1.49 - 4.69 <0.001 Corrected gestational age 0.82 0.43 - 1.21 <0.001 Weight z-score 2.00 0.93 - 3.08 0.001 Residual (length z-score vs. weight z-score) -1.91 -3.26 - (-0.57) 0.007 Percentage fat mass at discharge (combined protein intake >3.4 g kg-1d-1 vs. ≤3.4 g kg-1d-1) Protein >3.4g/kg/d -2.02 -3.98 - (-0.05) 0.042 CHO (g/kg/d) 0.59 -0.23 - 1.41 0.153 Female gender 3.21 1.66 - 4.76 <0.001 Corrected gestational age 0.63 0.22 - 1.04 0.003 Weight z-score 1.70 0.66 - 2.74 0.002 Residual (length z-score vs. weight z-score) -1.85 -3.15 - (-0.54) 0.007 Percentage fat mass at term Intervention group 1.41 0.04 - 2.78 0.044 Female gender 2.12 0.73 - 3.51 0.004 Weight z-score 3.06 2.39 - 3.73 <0.001 Residual (term length z-score vs. term weight z-score) -1.80 -2.93 - (-0.67) 0.003
* Weight gain velocity was analysed using Linear Mixed Models Regression and transformed to the natural logarithm for analysis. Estimates and confidence intervals have been back transformed for this outcome in the table, with the result that each estimate now represents the proportion change in weight gain velocity. For example, an additional g/kg/day of enteral protein was associated with an average 1.09 times increase, or 9% increase in weight gain velocity (95% CI 1%-18%). Outcomes measured at discharge and term were analysed using linear regression methods and estimates represent mean effects, for example, Female infants have a additional 3.09% fat mass at discharge compared to male infants (CI 1.49-4.69, p <0.001).
197
PAPER 4 – ULTRASOUND STUDY
Feasibility of Using Ultrasound to Assess Macronutrient
Influences on the Body Composition of Preterm Infants
Authors
Ms Gemma McLeod, APD, PhD Candidate, Centre for Neonatal Research and
Education, The University of Western Australia and King Edward Memorial Hospital.
Dr Donna Geddes, Research Assistant Professor, School of Biomedical, Biomolecular
and Chemical Sciences, The University of Western Australia.
Ms Elizabeth Nathan, Biostatistician, Women and Infants Research Foundation,
Western Australia
Associate Professor Jill Sherriff, AdvAPD, School of Public Health, Curtin
University, Western Australia.
Professor Karen Simmer, Winthrop Professor Newborn Medicine, Centre for
Neonatal Research and Education, The University of Western Australia and King
Edward Memorial Hospital.
Professor Peter Hartmann, Winthrop Professor, School of Biomedical, Biomolecular
and Chemical Sciences, The University of Western Australia.
Ms Gemma McLeod MSc APD, Centre for Neonatal Research and Education, School of Women and Infants’ Health, The University of Western Australia, Subiaco, WA, 6008, Australia. Email: [email protected]; Fax 61 8 9340 1266; Tel 61 8 9340 1256
This paper is being prepared for submission to Early Human Development. Impact factor 1.587
198
Abstract
Objective
To assess the early application of serial ultrasound monitoring to measure subcutaneous
tissue accretion and the influence of measured macronutrient intakes on body
composition (BC) of preterm infants.
Study design
Preterm ultrasound studies of four sites (mid-arm, mid-thigh, abdominal and
subscapular) were performed approximately every three weeks from birth to corrected-
term age. Measurements were compared to fetal reference data. Duplicate scans were
taken on a subset of infants to test the reproducibility of the method, assessed as the
coefficient of variation (CV). The influence of macronutrient intakes on preterm BC
was assessed by regression analysis.
Results
Median (range) gestation and birth weight of 40 preterm infants were 27 (23-29) weeks
and 1022 (480-1475) g, respectively. Accretion rates of adipose and muscle tissues
were not uniform across the four anatomical sites. Relative to the fetus, preterm
adipose tissue thickness was reduced at an equivalent (corrected) gestation, but towards
term, a faster accretion rate of abdominal adipose tissue and limb muscle tissue was
evident. Timing of fortification (P=0.012), enteral carbohydrate intake (p=0.008) and
the protein energy ratio of intakes (p=0.038) modulated the ratio of adipose to muscle
tissue accretion over the four sites by -0.004, -0.048 and -0.042, respectively.
Conclusion
Ultrasound provides a non-invasive, portable method of assessing changes in
subcutaneous adipose tissue and muscle accretion and appears sufficiently sensitive to
detect influences of macronutrient intakes on accretion rates from birth. The method
warrants further investigation as a bedside tool for measuring BC of preterm infants.
Keywords Ultrasound; body composition; preterm infant; macronutrient intake;
preterm nutrition
199
Introduction
Early body composition (BC) measurements of preterm infants are difficult to obtain
but are important for assessing growth and development; which are influenced by,
among other things, the energy consumed and the macronutrient composition of the
diet1-3.
A variety of methods, including densitometry, dual energy x-ray absorptiometry (DXA)
and magnetic resonance imaging (MRI) are used for BC measurement. Since many
were originally designed to measure the BC of adults and only recently have been
adapted to the measurement of infants and children, none is appropriately validated for
measuring the BC of preterm infants. The technology underpinning each of these
methods differs and cross-validation of equipment, scanning procedures and
measurements is scarce and inadequate. Commonly, BC measurements are based on
derived algorithms and mathematical models that vary in both assumptions and
reference data, making it difficult to accurately compare and interpret the emerging
preterm BC data in the literature.
Few methods employed to measure BC are able to assess adipose tissue (AT)
distribution. Calliper skin folds represents the cheapest, most portable means by which
to assess distribution of subcutaneous AT, however, the accuracy of a skin fold
measurement is influenced by the variability in skin thickness and in the compressibility
of the skin fold at different body sites4. In preterm infants, this method has produced
inaccurate and biased estimates of total FM, as assessed by total body water (TBWater)
dilution5. Other methods, such as computed tomography and DXA, expose the infant to
radiation and, together with MRI, are expensive and lack portability, making them
unsuitable for beside use in a neonatal nursery.
Ultrasound has been used in adults to measure intra-abdominal AT6, 7 and is emerging
as an alternative method for assessing BC of the fetus8, 9 and young infants10. Larciprete
et al.8 used ultrasound to measure the area of fetal adipose and muscle tissue at the mid-
arm and mid-thigh and the depth of AT at the abdominal and the subscapular sites.
These authors found significantly greater area and depth of AT in the fetuses of mothers
who had gestational diabetes compared to those of healthy mothers8, particularly in late
gestation. Subsequently, they were able to show that in growth restricted fetuses
200
(i.e. intrauterine growth restriction, IUGR), subcutaneous abdominal and subscapular
AT and subcutaneous mid-arm adipose and muscle tissue were sensitive to metabolic
impairment, but mid-thigh adipose and muscle tissue were spared9. Holzhauer et al.10
developed a standardised protocol and defined specific measurement areas to
differentiate and quantify subcutaneous and preperitoneal abdominal AT in one and
two-year-old infants. These authors demonstrated that distribution was not gender-
specific and the method itself was reliable (intra and inter-observer correlation
coefficients of 0.93-0.97 and 0.89-0.95, respectively). More recently, ultrasound
measurements of adipose and muscle tissue in the lower calf of infants born at term
were found to be significantly different for those of preterm infants assessed at the
equivalent corrected age (CA). These measurements were moderately correlated to
regional and whole-body estimates of fat free mass (FFM) and fat mass (FM) obtained
by DXA, after adjustment for corrected gestational age (cGA), though the significance
of this is unclear as the accuracy of the DXA measurement in predicting FM has been
questioned11-13.
Ultrasound has the advantage of recording a permanent image, applies little or no tissue
compression to the infant, is non-invasive, relatively inexpensive and is routinely used
as a diagnostic tool in neonatal settings. As a first step, ultrasound was used in this
study to assess early changes in BC of a cohort of hospitalised preterm infants, by
applying the method of Larciprete et al8. Patterns of change in both preterm adipose
and muscle tissues were compared to the observations by Larciprete et al8 of the fetus in
the second half of gestation6, 7.
The influence of postnatal nutrition on early changes in BC of preterm infants was also
assessed.
Method
Subjects
Infants participating in this study were recruits of a randomised study investigating the
efficacy of targeting milk fortification, using measured milk analysis, to achieve
reference growth outcomes. Infants were born <30 weeks gestation at King Edward
Memorial Hospital (KEMH) and admitted to the only State-wide, Level III tertiary care
nursery, also located in Perth, Western Australia. Inclusion criteria included absence of
201
congenital abnormalities, maternal intention to feed human milk and an ability to attend
three-weekly assessments until term corrected age (CA). Informed written consent was
obtained and the ethics committees of both KEMH and The University of Western
Australia reviewed and approved the study protocol.
Randomisation
All infants, from either singleton (n=24) or twin (n=16) births were randomised as
individuals to receive milk, either fortified on measured milk composition (Intervention
group) or on assumed composition (Control group). As macronutrient intakes were
similar between groups, the groups were collapsed for this study.
Body Composition
Ultrasound studies of four sites, according to the method described by Larciprete8, were
performed approximately every three weeks from birth to corrected term age using the
TITAN (Sonosite, Bothell, WA, USA) machine. A high-resolution (5-10 MHz) linear
array transducer (L38) was employed and the small-parts setting was used to attain the
highest resolution. The average gain setting was 61 db and adjustments were made
depending on the weight of the infant to provide optimal ultrasound images. Sterile,
water-based gel was placed between the probe and the infant’s skin to facilitate
penetration of the ultrasound beam and often to act as a ‘stand off’ to minimise tissue
compression and enhance imaging in the superficial region. Measurements were taken
on the left side of the body.
Mid-arm and mid-thigh AT area (outer area minus inner area, cm2) and mid-arm and
mid-thigh muscle tissue area (inner area, cm2), anterior and posterior arm and thigh AT
thickness (mm), abdominal and subscapular adipose and muscle tissue thickness (mm),
and femoral and humeral widths (mm) were measured using a Universal desktop ruler
(v3.3.3268, 2002-2009, AVPSoft.com) (Figure 1). The coefficients of variation (CV)
between pairs of 14 measurements obtained from ultrasound images of four anatomical
sites were calculated to assess intra-observer agreement on a subset of 34 infants.
Measurements were log transformed and the percentage CV was calculated using the
formula CV=100*(exp(s)-1), where s is the standard deviation of the difference in log
transformed measurements divided by the square root of two.
202
Percentage FM (%FM) prediction equations were developed by regressing %FM
measurements obtained at term by PEAPOD (p 195, Targeted Fortification Paper 3,
Thesis) on six aggregated depth measurements taken from four anatomical sites. The
PEAPOD is designed to measure the BC of infants weighing between one to eight
kilograms. The technical design and the methodology underpinning a PEAPOD
measurement has been described elsewhere14, 15. Briefly, the PEAPOD utilises the
classic 2-compartment BC model. Total body density is calculated from the direct
measurements of body mass (electronic scale) and volume (air displacement). The
software provided by LMI incorporates algorithms to derive percent body fat and FFM.
These algorithms employ the constant FM density value of 0.9007 g mL-1 and
predetermined FFM density values modelled from either the age and gender-specific
FFM reference values of Butte et al.16 or Fomon et al.17. A correction factor has been
applied to the algorithms to adjust for the redistribution of body water that occurs in the
initial period after birth. LMI derived this undisclosed correction factor from a range of
reference data18-25.
The measurement protocol has been previously described (pp 147-148, BC Feasibility
Study, Paper 2 and p 174-175, RCT Paper 3, Thesis).
Anthropometry
In accordance with the NCCU’s measurement policy, weight, taken in the infant’s
incubator or with digital scales (g; SECA, Germany 10/20 kg; d = 5/10 g), crown-heel
length and occipital-frontal head circumference were measured at birth and discharge
and again at the term follow-up appointment (if infants were discharged before term).
Infants requiring intensive care were weighed daily and those not requiring intensive
nursing were weighed twice weekly, with daily weight derived by interpolation between
each of the time-points.
Statistical Analysis
Descriptive statistics for continuous data were summarised using means and standard
deviations or medians, interquartile ranges and ranges. Categorical data were
summarised using frequency distributions. Univariate comparisons of continuous
clinical data, nutritional intakes and anthropometric measures were conducted using
independent t-tests or Mann-Whitney tests according to normality, and Chi-square or
Fisher exact tests were used for categorical comparisons.
203
Corrected gestational age-specific 90 percent reference ranges were constructed for each
SCTT parameter, according to the method described by Royston26. Logarithmic
transformations of SCTT parameters were made to correct skewness and
heteroscedasticity. Polynomial time-based curves were fitted to the SCTT parameters
using regression analysis with data weighted according to the number of ultrasound
measurements taken. Normality and homoscedasticity of residual errors within tertiles
for each parameter were assessed visually and statistically according to Royston’s
method. Reference ranges were constructed from 23 weeks gestation to term corrected
gestational age in three-week intervals and illustrated alongside reference ranges for
fetal SCTT parameters in a healthy pregnant group8.
Linear mixed models analysis was conducted to produce a growth curve model for BC.
Macronutrient intakes and clinical variables were modelled univariately and
multivariably to assess their effects on BC measurements of subcutaneous adipose and
muscle tissue obtained from birth to near term, in three weekly intervals, using
ultrasound. Adjustment was made for corrected gestational age, chronological age and
weight at time of measurement. Model selection was made by multivariable testing of
covariates with univariate p-values ≤0.1, using the forward method to avoid over-fitting.
All growth outcomes were assessed for a group by time interaction. Linear regression
was used to obtain prediction models for term PEAPOD BC measurements using six
aggregated ultrasound depth measurements from four anatomical sites. Agreement
between PEAPOD and ultrasound measurements was assessed using Bland-Altman
methods. SAS 9.1 statistical software and PASW® 17 was used for data analysis. All
tests were two-tailed and p-values <0.05 were considered statistically significant.
Results
Subject Demographics
Infants (n=40) were born at a mean (SD) gestation and birth weight of 27 (1.9) weeks
and 1010 (289) g, respectively. The infants were mostly of Caucasian (n=36) origin
(Aboriginal n=2, Asian n=1, Other n=1). With the exception of two infants whose birth
weights fell on the 6th percentile, all had birth weights appropriate for gestational age.
The infants had achieved a mean weight of 2736 (565) g when the term ultrasound
measurements (37-42 weeks) were obtained. When stratified by gestation, infants born
<26 weeks weighed approximately 400 g less than infants born between
204
26 and 28 weeks and 570 g less than infants born at 29 weeks gestation. Fifty percent
of infants (n=20) weighed <10th percentile at term. The clinical characteristics of the
infants are described in Table 1.
Body Composition
Initial ultrasound measurements for 85% of infants (n=34) were taken in the first week
post-partum and by day 15 for the remaining infants (n=6). Subsequent measurements
were taken at ~three-week intervals until near term corrected age. The coefficient of
variation (CV) between 14-paired measurements from duplicate scans of four sites
ranged between 3.2-14.7% (Table 2).
Body Composition - Patterns of Accretion
The percentile curves for subcutaneous tissue structures at the four measured sites are
illustrated against Larciprete’s fetal reference percentiles (5th, 50th, 95th) in Figure 2. As
the sample size was small, the preterm percentiles represent all the infants born
<30 weeks gestation and the group was not differentiated for gender and ethnicity.
The percentile graphs illustrate that patterns and rates of adipose and muscle tissue
accretion are not uniform across all sites and, further, that the preterm pattern of
accretion at some sites differs from the fetal pattern. For example, there are marked
increases in the rate of muscle tissue accretion from ~32 weeks cGA in both the
mid-arm and mid-thigh percentiles of preterm infants, compared with the fetus. These
rate increases are most marked in the mid-thigh after 35 weeks cGA, evidenced by the
steep upward trajectory in the slope of the curve at this time, contrasting the subtle
downward trend observed in the fetal percentiles. Interestingly, accretion of
subscapular adipose tissue in preterm infants appears similar to that observed in the
fetus, but the upward trajectory of their adipose tissue percentiles at the abdomen and
mid-thigh appears to contrast those of the fetus, suggesting a different pattern of
accretion at these sites. Indeed, in late gestation, preterm infants appear to accrete
abdominal adipose tissue rapidly. Further differences in accretion patterns are
discernible when the data are stratified according to birth gestation (not shown).
Subcutaneous tissue was not evenly distributed on the limbs of preterm infants. There
was a statistically significant difference between posterior (i.e. triceps and hamstring)
and anterior (i.e. bicep and quadriceps) arm and mid-thigh measurements, with posterior
205
measurements being higher in both the arm (average difference - 0.01 mm,
p=0.018) and the thigh (average difference - 0.08, p<0.001).
Body Composition - Nutrition Intakes
Mean (SD) protein (g kg-1d-1) and energy (kJ kg-1d-1) intakes of infants were 3.3 (0.4)
and 468 (45), respectively, and a mean protein energy ratio of 3.0 (0.4) was achieved
(Table 3). Early patterns of change detected in the subcutaneous tissue structures of
preterm infants were influenced by macronutrient intakes and timing of fortification
(Table 5). Relative to the mid-arm, the ratio of thickness of subcutaneous adipose to
muscle tissue did not significantly differ in the abdomen but it was significantly lower
than the ratio of adipose to muscle tissue in the mid-thigh (-0.30, 95% CI -0.38-(-0.22)
p=<0.001), and greater than the ratio at the subscapular (0.35, 95% CI 0.27-0.42,
p=<0.001) site. The ratio of adipose to muscle thickness at each site increased with
increasing volume of enteral nutrition (0.004, 95% CI 0.002-0.007, p=0.002) but this
increase was moderated by both the timing of fortification (-0.004, 95% CI -0.008-
(-0.001), p=0.012) and the amount of carbohydrate fed enterally (-0.048, 95% CI
-0.084-(-0.013), p=0.008). For every one-unit increase in protein energy ratio
(i.e. 1g protein per 419 kJ) there was a reduction in the ratio of adipose to muscle
thickness at each site (-0.042, 95% CI -0.081-(-0.002) p=0.038). Weight gain was not
significantly associated with increased adipose to muscle tissue ratio (p=0.146).
Body Composition – Predicting Percent Fat Mass
Gender-specific prediction equations were developed by regressing %FM
(mean (SD): 16.3 (4.0)%) obtained by measuring the infants with the PEAPOD at term
corrected age (p 195, Targeted Fortification Paper 3, Thesis) on the sum of six
ultrasound measurements taken at four sites (Table 5). Fomon’s density model was
employed. The predicted models, adjusted for gender, gestational age at birth (weeks)
and postnatal age (weeks), explained 51% of the variation in the estimates of %FM
(Figure 3).
Males: %FM = -3.932 + 0.065 (gestational age at birth) + 0.221 (postnatal age in weeks) +
0.552 (abdominal adipose tissue depth + subscapular adipose tissue depth + mid-
arm anterior adipose tissue mass + mid-arm posterior adipose tissue mass + mid-
thigh posterior adipose tissue mass + mid- thigh anterior adipose tissue mass).
206
Females: %FM = -0.882+ 0.065 (gestational age at birth) + 0.221 (postnatal age in weeks) +
0.552 (abdominal adipose tissue depth + subscapular adipose tissue depth + mid-
arm anterior adipose tissue mass + mid-arm posterior adipose tissue mass + mid-
thigh posterior adipose tissue mass + mid- thigh anterior adipose tissue mass).
These prediction models overestimate the %FM estimated by the PEAPOD for lower
BC values and underestimate the %FM measurement estimated by the PEAPOD for
higher BC values (Figure 4).
Discussion
This is the first study to apply ultrasound to the serial assessment of BC in preterm
infants from birth. Imaging of subcutaneous tissue structures revealed that preterm
accretion rates of adipose and muscle tissues are not fixed across sites and both
nutritional and clinical interventions influenced patterns of accretion.
When compared to the reference fetal data in the last trimester of pregnancy, as
illustrated by Larciprete et al.8, it is evident that subcutaneous tissue patterning in
preterm infants differs from that of the fetus (Figure 2). For example, this study has
shown that, relative to the fetus, the thickness of subcutaneous preterm AT is reduced.
After 31 weeks corrected gestation, the accretion rate at the abdomen and on the lower
limbs appears to be faster in preterm infants than in the fetus, suggesting a different
pattern of accretion at these sites. Indeed, towards term, preterm infants appear to
accrete abdominal AT rapidly whereas it appears to taper off in the fetus in late
gestation. Interestingly, in this study, there was little difference observed between fetal
and preterm subscapular AT patterning. Within the preterm group, distribution of AT
was uneven on the limbs, being higher posteriorly on both the mid-upper arm and the
mid-thigh.
It is possible that the disparities between fetal and preterm accretion are due to the
composition of the tissue, perhaps reflecting the distinguishing features between the
fetal and postnatal environments. The fetus is bathed in fluid, is usually well hydrated
and at 40 weeks gestation its AT contains about 46% water27. At six months of age the
water content of infant AT falls to less than 30% and by adulthood it remains
reasonably constant and close to 20%28. The water content of preterm AT is not
207
reported, but in the early post-partum period preterm infants experience a natural
diuresis that may contract their subcutaneous tissue for a period of time (~one week).
Fluid restriction for patent ductus arteriosus and other clinical conditions may further
potentiate this ‘dry’ status, thus resulting in less water content and a thinner thickness of
AT.
The fat content of subcutaneous abdominal tissue may also influence its thickness. Fat
located in abdominal AT of well nourished term infants was shown to average 45% but
to vary between 39% to 62%4. Fat is an energy reserve and the amount stored by the
body can vary according to the substrates available and to nutritional status. Both the
composition and quantity of substrates available to the preterm infant differ from those
available to the fetus. Glucose29, 30, amino acids31, 32 and lactate33 are the main energy
substrates and, in a healthy pregnancy, are available to the fetus in a continuous,
uninterrupted supply. Glucose concentration in the fetal circulation is lower than in the
maternal circulation; a proportion of it is converted to lactate which is both oxidised by
the fetus and used for glucose synthesis33 and plasma amino acids can be oxidised, used
for protein synthesis and assimilated into new tissue. In the last trimester of pregnancy
there is a rapid accumulation of fat, which is supported by low rates of fatty acid
oxidation, a preferential channelling of fatty acids to AT for triglyceride synthesis and a
continuous transplacental supply of glucose, approximately 70% of which is converted
to fat34.
With premature birth, this placental supply of nutrients ceases earlier than expected. In
the immediate post-partum period, nutrient delivery is limited. The infants in this study
received varying amounts of glucose and low amounts of amino acids on day one of
life, followed by low amounts of lipid on day two. Minimal enteral feeds were
introduced soon after as small increments in parenteral nutrition reached targets over
several days (at a minimum). Full enteral feeds were not achieved until a median of
17 days and birth weight was not regained for a median of 10 but by as many as 25 days
(Table 1). Restricted nutrient supply may account for the early pattern of adipose and
muscle tissue accretion in preterm infants, especially in the thigh, where the rate of
accretion falls compared to that of the age-matched fetus (Figure 2). Skeletal muscle
acts as a pool of amino acids that, in times of fasting and physiological stress, can be
utilised for oxidation or protein synthesis35, processes which are mediated by nutrition
and regulated by cytokines, hormones and innervation35, 36. In contrast to the healthy
208
fetus that lives in an anabolic environment, the preterm infant enters a catabolic state for
a period of time following birth and it can be many days before macronutrient intakes
are high enough to arrest catabolism.
However, after 31 weeks corrected age, it can be noted from the percentile curves that
the preterm infants accreted arm and thigh muscle tissue at a much faster rate than the
fetus so that by term, the areas of arm muscle tissue in both the fetal and preterm groups
were of similar magnitude whilst the area of muscle tissue spanning the preterm infant’s
mid-thigh exceeded that of the fetus.
Regression modelling showed that the ratio of protein to energy intake, the volume of
enteral nutrition and associated carbohydrate intake and the timing of fortification all
appeared to play a significant role in influencing adipose and muscle tissue accretion of
the infants in this study. Fortification, which was not initiated until a median of
20 days, increased the energy density of milk mainly by increasing the protein and
carbohydrate content of the milk. Added carbohydrate was in the form of glucose
polymer. Protein and glucose stimulate insulin secretion37, which promotes uptake of
glucose38, inhibits muscle-proteolysis39 and mediates uptake of the branched chain
amino acids (e.g. leucine), into muscle40. Leucine may also modulate glucose uptake41
and appears to have a regulatory role in muscle-protein metabolism42-44. Thus,
carbohydrate content and the amount and quality of protein in fortifiers and formulae
appear to be crucial in influencing body composition.
In this study, human milk was the predominant source of enteral nutrition and enteral
volumes were positively associated with adipose to muscle ratio. The fat content of
milk, which constitutes 50% of its total energy value45, is a source of fuel for oxidation
and storage by the infant. When energy substrates for muscle cell metabolism are in
plentiful supply, glucose is stored as muscle glycogen46. Thus, the ratio of fat,
carbohydrate and protein to total energy is important in influencing composition of
growth. Future research should focus on determining optimal ratio of macronutrients to
total energy. Greater attention must be paid to ensuring commercial nutrition product
formulations and fortification and feeding regimens achieve these target ratios and then,
that nutrition and growth targets can be achieved at volume intakes of 150 mL/kg/d.
209
Among other constituents of human milk are many growth factors47 and although the
relationship between neonatal growth and growth factors is unclear, three of four
recently measured, including IGF-1, were found in significantly higher amounts in
preterm than in term milk over the first 28 days post-partum when it was measured48. It
is possible these growth factors also account for some of the differences seen between
preterm and fetal tissue accretion. As expected, rate of weight gain was accelerated
during the period of fortification relative to when intravenous nutrition or unfortified
milk, or both were fed, although weight gain velocity postnatally (before discharge) was
lower than intrauterine rates (p 179 and p 195, Targeted Fortification Paper 3, Thesis)
and was not significant in the model.
Differences between fetal and preterm muscle tissue accretion may also partly and
potentially be accounted for by examining differences in the intra and extra-uterine
environments. The clinical practice of maintaining a continuous positive airway
pressure (CPAP) to support the respiratory effort of preterm infants influenced their
capacity to accrete tissue. Hours on CPAP have been shown to negatively modulate fat
and fat free mass (FFM), as measured by PEAPOD (p 167, BC Feasibility Study Paper
2, Table 4, Thesis). Being surrounded and buoyed by fluid, there is considerable
movement of the fetus early in the second half of the pregnancy (20-26 weeks), which
gradually decreases towards term as the fetus outgrows the placenta. After the 26th
gestation week, the fetus is exposed to considerable mechanical stress due to
gravitational forces and has 60-80% apparent weight49. The degree of this stress is
significantly different during the last four weeks of gestation compared to the four-week
period directly preceding the 36th week. During this time, fetal muscle composition
changes markedly50, 51. For example, from the 32nd week of gestation to term, (or
possibly a little longer), the number of sartorius muscle fibres in the thigh alone,
doubles50. In this study, from as early as 23 weeks gestation, the preterm infants were
mostly lying horizontally on a relatively rigid surface. They were not buoyed by fluid,
they were exposed to considerable handling and they were subjected to all the forces of
gravity.
The majority of preterm infants (n=38) at birth were an appropriate size for age but by
discharge the weights of 20 infants were below the 10th percentile and their mean
weight (2736 565 g) was almost 550 g less than that of the fetuses (3283 395 g
39 3 weeks) measured by Larciprete et al.8 at term. Thus, as observed by others52-55
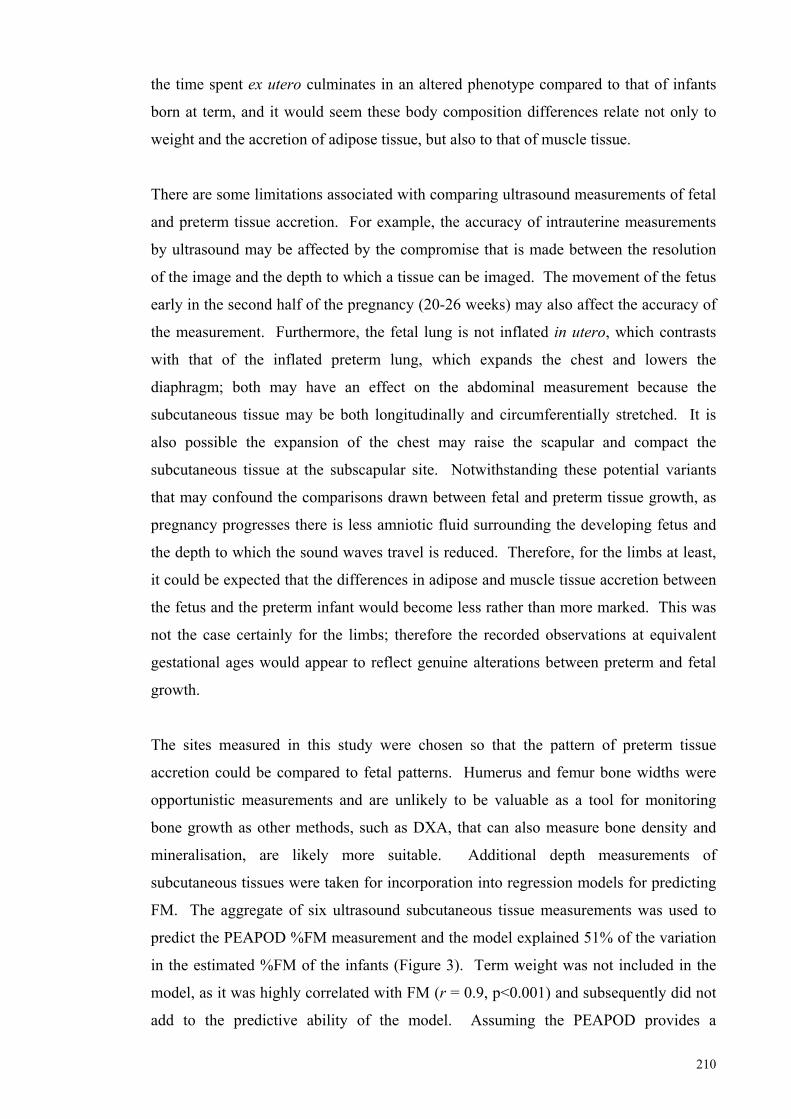
210
the time spent ex utero culminates in an altered phenotype compared to that of infants
born at term, and it would seem these body composition differences relate not only to
weight and the accretion of adipose tissue, but also to that of muscle tissue.
There are some limitations associated with comparing ultrasound measurements of fetal
and preterm tissue accretion. For example, the accuracy of intrauterine measurements
by ultrasound may be affected by the compromise that is made between the resolution
of the image and the depth to which a tissue can be imaged. The movement of the fetus
early in the second half of the pregnancy (20-26 weeks) may also affect the accuracy of
the measurement. Furthermore, the fetal lung is not inflated in utero, which contrasts
with that of the inflated preterm lung, which expands the chest and lowers the
diaphragm; both may have an effect on the abdominal measurement because the
subcutaneous tissue may be both longitudinally and circumferentially stretched. It is
also possible the expansion of the chest may raise the scapular and compact the
subcutaneous tissue at the subscapular site. Notwithstanding these potential variants
that may confound the comparisons drawn between fetal and preterm tissue growth, as
pregnancy progresses there is less amniotic fluid surrounding the developing fetus and
the depth to which the sound waves travel is reduced. Therefore, for the limbs at least,
it could be expected that the differences in adipose and muscle tissue accretion between
the fetus and the preterm infant would become less rather than more marked. This was
not the case certainly for the limbs; therefore the recorded observations at equivalent
gestational ages would appear to reflect genuine alterations between preterm and fetal
growth.
The sites measured in this study were chosen so that the pattern of preterm tissue
accretion could be compared to fetal patterns. Humerus and femur bone widths were
opportunistic measurements and are unlikely to be valuable as a tool for monitoring
bone growth as other methods, such as DXA, that can also measure bone density and
mineralisation, are likely more suitable. Additional depth measurements of
subcutaneous tissues were taken for incorporation into regression models for predicting
FM. The aggregate of six ultrasound subcutaneous tissue measurements was used to
predict the PEAPOD %FM measurement and the model explained 51% of the variation
in the estimated %FM of the infants (Figure 3). Term weight was not included in the
model, as it was highly correlated with FM (r = 0.9, p<0.001) and subsequently did not
add to the predictive ability of the model. Assuming the PEAPOD provides a
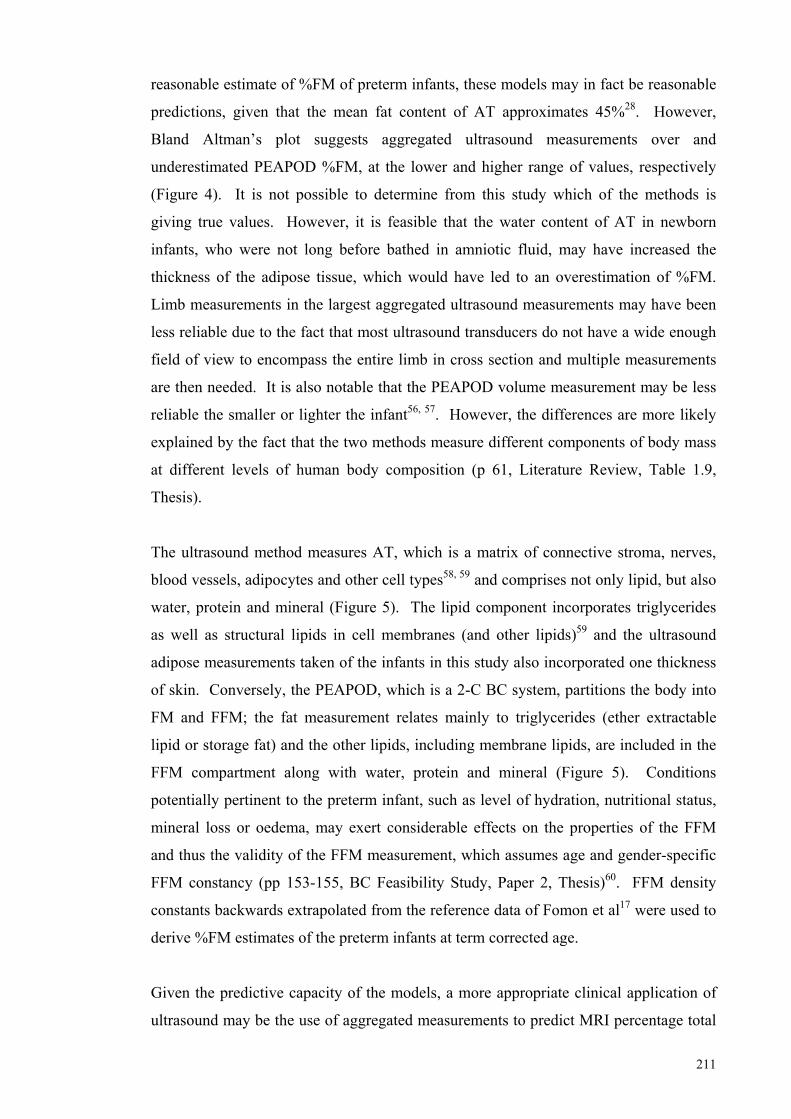
211
reasonable estimate of %FM of preterm infants, these models may in fact be reasonable
predictions, given that the mean fat content of AT approximates 45%28. However,
Bland Altman’s plot suggests aggregated ultrasound measurements over and
underestimated PEAPOD %FM, at the lower and higher range of values, respectively
(Figure 4). It is not possible to determine from this study which of the methods is
giving true values. However, it is feasible that the water content of AT in newborn
infants, who were not long before bathed in amniotic fluid, may have increased the
thickness of the adipose tissue, which would have led to an overestimation of %FM.
Limb measurements in the largest aggregated ultrasound measurements may have been
less reliable due to the fact that most ultrasound transducers do not have a wide enough
field of view to encompass the entire limb in cross section and multiple measurements
are then needed. It is also notable that the PEAPOD volume measurement may be less
reliable the smaller or lighter the infant56, 57. However, the differences are more likely
explained by the fact that the two methods measure different components of body mass
at different levels of human body composition (p 61, Literature Review, Table 1.9,
Thesis).
The ultrasound method measures AT, which is a matrix of connective stroma, nerves,
blood vessels, adipocytes and other cell types58, 59 and comprises not only lipid, but also
water, protein and mineral (Figure 5). The lipid component incorporates triglycerides
as well as structural lipids in cell membranes (and other lipids)59 and the ultrasound
adipose measurements taken of the infants in this study also incorporated one thickness
of skin. Conversely, the PEAPOD, which is a 2-C BC system, partitions the body into
FM and FFM; the fat measurement relates mainly to triglycerides (ether extractable
lipid or storage fat) and the other lipids, including membrane lipids, are included in the
FFM compartment along with water, protein and mineral (Figure 5). Conditions
potentially pertinent to the preterm infant, such as level of hydration, nutritional status,
mineral loss or oedema, may exert considerable effects on the properties of the FFM
and thus the validity of the FFM measurement, which assumes age and gender-specific
FFM constancy (pp 153-155, BC Feasibility Study, Paper 2, Thesis)60. FFM density
constants backwards extrapolated from the reference data of Fomon et al17 were used to
derive %FM estimates of the preterm infants at term corrected age.
Given the predictive capacity of the models, a more appropriate clinical application of
ultrasound may be the use of aggregated measurements to predict MRI percentage total
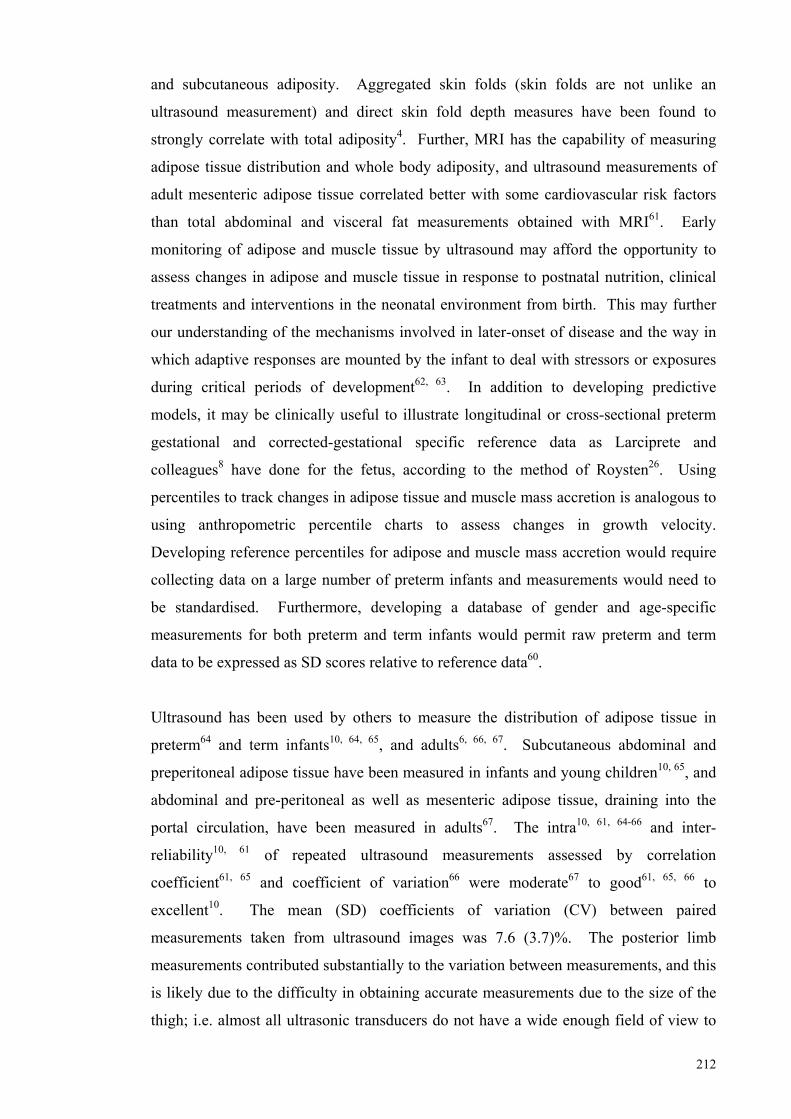
212
and subcutaneous adiposity. Aggregated skin folds (skin folds are not unlike an
ultrasound measurement) and direct skin fold depth measures have been found to
strongly correlate with total adiposity4. Further, MRI has the capability of measuring
adipose tissue distribution and whole body adiposity, and ultrasound measurements of
adult mesenteric adipose tissue correlated better with some cardiovascular risk factors
than total abdominal and visceral fat measurements obtained with MRI61. Early
monitoring of adipose and muscle tissue by ultrasound may afford the opportunity to
assess changes in adipose and muscle tissue in response to postnatal nutrition, clinical
treatments and interventions in the neonatal environment from birth. This may further
our understanding of the mechanisms involved in later-onset of disease and the way in
which adaptive responses are mounted by the infant to deal with stressors or exposures
during critical periods of development62, 63. In addition to developing predictive
models, it may be clinically useful to illustrate longitudinal or cross-sectional preterm
gestational and corrected-gestational specific reference data as Larciprete and
colleagues8 have done for the fetus, according to the method of Roysten26. Using
percentiles to track changes in adipose tissue and muscle mass accretion is analogous to
using anthropometric percentile charts to assess changes in growth velocity.
Developing reference percentiles for adipose and muscle mass accretion would require
collecting data on a large number of preterm infants and measurements would need to
be standardised. Furthermore, developing a database of gender and age-specific
measurements for both preterm and term infants would permit raw preterm and term
data to be expressed as SD scores relative to reference data60.
Ultrasound has been used by others to measure the distribution of adipose tissue in
preterm64 and term infants10, 64, 65, and adults6, 66, 67. Subcutaneous abdominal and
preperitoneal adipose tissue have been measured in infants and young children10, 65, and
abdominal and pre-peritoneal as well as mesenteric adipose tissue, draining into the
portal circulation, have been measured in adults67. The intra10, 61, 64-66 and inter-
reliability10, 61 of repeated ultrasound measurements assessed by correlation
coefficient61, 65 and coefficient of variation66 were moderate67 to good61, 65, 66 to
excellent10. The mean (SD) coefficients of variation (CV) between paired
measurements taken from ultrasound images was 7.6 (3.7)%. The posterior limb
measurements contributed substantially to the variation between measurements, and this
is likely due to the difficulty in obtaining accurate measurements due to the size of the
thigh; i.e. almost all ultrasonic transducers do not have a wide enough field of view to
213
encompass the entire thigh in cross-section, necessitating the acquisition of multiple
images. This could be improved by the production of a specialised probe or the
investigation of an alternative site associated with a landmark such as the greater
trochanter.
Conclusion
Ultrasound imaging is a non-invasive body composition method that can demarcate
skin, muscle and adipose tissue compartments whilst imaging all three simultaneously.
The method can be employed at the bedside to monitor changes in preterm BC from
birth and, as was shown in the fetus in response to physiological influences8, 9, is
sufficiently sensitive to detect serial changes in the accretion of adipose and muscle
tissue. Adipose and muscle tissue play an important role in whole-body metabolism
and there is compelling evidence, given the adaptive plasticity of the organs, that they
may also influence the later-onset of metabolic disease. Preterm infants may be
especially vulnerable to the implications of adaptive, developmental plasticity62. There
are few, if any, comparable BC methods that can be employed to prospectively assess
the impact of clinical and nutritional management on early growth outcomes.
Furthermore, ultrasound is a portable, proven diagnostic tool that is routinely used in the
NICU, thus making the method practical for measuring the BC of preterm infants in the
clinical setting. Further evaluation of the ultrasound method against another imaging
method such as MRI is recommended.
214
References (Paper 4)
1. Reichman B, Chessex P, Verellen G, Putet G, Smith JM, Heim T, et al. Dietary composition and macronutrient storage in preterm infants. Pediatrics. 1983; 72(3): 322-8. 2. Schulze K, Stefanski M, Masterson J, Kashyap S, Sanocka U, Forsyth M, et al. An analysis of the variability in estimates of bioenergetic variables in preterm infants. Pediatr Res. 1986; 20(5): 422-7. 3. Kashyap S, Schulze KF, Forsyth M, Zucker C, Dell RB, Ramakrishnan R, et al. Growth, nutrient retention, and metabolic response in low birth weight infants fed varying intakes of protein and energy. J Pediatr. 1988; 113(4): 713-21. 4. Clarys JP, Provyn S, Marfell-Jones MJ. Cadaver studies and their impact on the understanding of human adiposity. Ergonomics. 2005; 48(11-14): 1445-61. 5. Olhager E, Forsum E. Assessment of total body fat using the skinfold technique in full-term and preterm infants. Acta Paediatrica (Oslo, Norway: 1992). 2006; 95: 21-8. 6. Hirooka M, Kumagi T, Kurose K, Nakanishi S, Michitaka K, Matsuura B, et al. A technique for the measurement of visceral fat by ultrasonography: comparison of measurements by ultrasonography and computed tomography. Intern Med. 2005; 44: 794-9. 7. Stolk R, Wink O, Zelissen P, Meijer R, van Gils A, Grobbee D. Validity and reporducibility of ultrasonography for the measurement of intra-abdominal adipose tissue. Int J Obesity. 2001; 25: 1346-51. 8. Larciprete G, Valensise H, Vasapollo B, Novelli GP, Parretti E, Altomare F, et al. Fetal subcutaneous tissue thickness (SCTT) in healthy and gestational diabetic pregnancies. Ultrasound Obstet Gynecol. 2003; 22: 591-7. 9. Larciprete G, Valensise H, Di Pierro G, Vasapollo B, Casalino B, Arduini D, et al. Intrauterine growth restriction and fetal body composition. Ultrasound Obstet Gynecol. 2005; 26(3): 258-62. 10. Holzhauer S, Zwijsen RM, Jaddoe VW, Boehm G, Moll HA, Mulder PG, et al. Sonographic assessment of abdominal fat distribution in infancy. Eur J Epidemiol. 2009; 24(9): 521-9. 11. Shypailo RJ, Butte NF, Ellis KJ. DXA: can it be used as a criterion reference for body fat measurements in children? Obesity (Silver Spring). 2008; 16(2): 457-62. 12. Godang K, Qvigstad E, Voldner N, Isaksen GA, Froslie KF, Notthellen J, et al. Assessing Body Composition in Healthy Newborn Infants: Reliability of Dual-Energy X-Ray Absorptiometry. J Clin Densitom. 2010. 13. Andres A, Mitchell AD, Badger TM. QMR: validation of an infant and children body composition instrument using piglets against chemical analysis. Int J Obes (Lond). 2010; 34(4): 775-80. 14. Urlando A, Dempster P, Aitkens S. A new air displacement plethysmograph for the measurement of body composition in infants. Pediatric Research. 2003; 53(3): 486-92. 15. Sainz R, Urlando A. Evaluation of a new pediatric air-displacement plethysmograph for body-composition assessment by means of chemical analysis of bovine tissue phantoms. 2003. 16. Butte NF, Hopkinson JM, Wong WW, Smith EO, KJ E. Body composition during the first 2 years of life. An updated reference. Pediatr Res. 2000; 47: 578-85. 17. Fomon SJ, Haschke F, Ziegler EE, Nelson SE. Body composition of reference children from birth to age 10 years. The American Journal Of Clinical Nutrition. 1982; 35(5 Suppl): 1169-75.
215
18. Shah PS, Wong KY, Merko S, Bishara R, Dunn M, Asztalos E, et al. Postnatal growth failure in preterm infants: ascertainment and relation to long-term outcome. J Perinat Med. 2006; 34(6): 484-9. 19. Rodriguez G, Venture P, Samper M, Moreno L, Sarria A, Perez-Gonzalez J. Changes in body composition during the initial hours of life in breast-fed healthy term newborns. Biol Neonate. 2000; 77: 12-6. 20. Tang W, Ridout D, Modi N. Influence of respiratory distress syndrome on body composition after preterm birth. Arch Dis Child Fetal Neonatal Ed. 1997; 77(1): F28-31. 21. Bauer K, Bovermann G, Roithmaier A, Gotz M, Proiss A, Versmold HT. Body composition, nutrition, and fluid balance during the first two weeks of life in preterm neonates weighing less than 1500 grams. J Pediatr. 1991; 118(4 ( Pt 1)): 615-20. 22. Shaffer S, Bradt S, Hall R. Postnatal changes in total body water and extracellular volume in the preterm infant with respiratory distress syndrome. J Pediatr. 1986; 109: 509-14. 23. Bauer K, Cowett RM, Howard GM, vanEpp J, Oh W. Effect of intrauterine growth retardation on postnatal weight change in preterm infants. J Pediatr. 1993; 123(2): 301-6. 24. Singhi S, Sood V, Bhakoo ON, Ganguly NK. Effect of intrauterine growth retardation on postnatal changes in body composition of preterm infants. Indian J Med Res. 1995; 102: 275-80. 25. Heimler R, Doumas B, Jendrzejczak B, Nemeth P, Hoffman R, Nelin L. Relationship between nutrition, weight change and fluid compartments in preterm infants during the first week of life. J Pediatr. 1993; 1993(122). 26. Royston P. Constructing time-specific reference ranges. Stat Med. 1991; 10: 675-90. 27. Kabir N, Forsum E. Estimation of total body fat and subcutaneous adipose tissue in full-term infants less than 3 months old. Pediatr Res. 1993; 34: 448-54. 28. Baker GL. Human adipose tissue composition and age. Am J Clin Nutr. 1969; 22(7): 829-35. 29. Widdowson E. Food intake and growth in the newly born. Proceedings of the Nutrition Society. 1971; 30: 127-35. 30. Hay WW, Jr. Recent observations on the regulation of fetal metabolism by glucose. J Physiol. 2006; 572: 17-24. 31. Herrera E. Implications of dietary fatty acids during pregnancy on placental, fetal and postnatal development--a review. Placenta. 2002; 23 Suppl A: S9-19. 32. Hay WW, Jr. Energy and substrate requirements of the placenta and fetus. Proc Nutr Soc. 1991; 50: 321-36. 33. Platt M, Deshpande S. Metabolic adaptation at birth. Semin Fetal Neonatal Med. 2005; 10: 341-50. 34. Van Aerde J, Feldman M, Clandinin M. Accretion of lipid in the fetus and newborn. In: Polin R, Fox W, editors. Fetal and neonatal physiology. 2nd ed. Philadelphia: WB Saunders Co; 1998. p. 458-77. 35. Maltin CA, Delday MI, Sinclair KD, Steven J, Sneddon AA. Impact of manipulations of myogenesis in utero on the performance of adult skeletal muscle. Reproduction. 2001; 122: 359-74. 36. Grizard J, Picard G, Dardevet D, Balage M, Rochon C. Regulation of muscle growth and development. In: GE Lobely, A White, JC MacRae, editors. In Protein metabolism and nutrition: Proceedings of the VIIIth International Symposium on Protein Metabolism and Nutrition. United Kingdom: EAAP Publication No 96 Aberdeen
216
. p. 177-203. 37. Garlick PJ, Grant I. Amino acid infusion increases the sensitivity of muscle protein synthesis in vivo to insulin. Effect of branched-chain amino acids. Biochem J. 1988; 254: 579-84. 38. Watson RT, Pessin JE. Intracellular organization of insulin signaling and GLUT4 translocation. Recent Prog Horm Res. 2001; 56: 175-93. 39. Magkos F, Wang X, Mittendorfer B. Metabolic actions of insulin in men and women. Nutrition. 2010; 26: 686-93. 40. Berg J, Tymoczko J, Stryer L. Biochemistry. 5th ed. New York: WH Freeman and Company; 2002. 41. Iwanaka N, Egawa T, Satoubu N, Karaike K, Ma X, Masuda S, et al. Leucine modulates contraction- and insulin-stimulated glucose transport and upstream signaling events in rat skeletal muscle. J Appl Physiol. 2010; 108: 274-82. 42. Garlick PJ. The role of leucine in the regulation of protein metabolism. J Nutr. 2005; 135(6 Suppl): 1553S-6S. 43. Blomstrand E, Eliasson J, Karlsson HK, Kohnke R. Branched-chain amino acids activate key enzymes in protein synthesis after physical exercise. J Nutr. 2006; 136(1 Suppl): 269S-73S. 44. Rennie MJ, Bohe J, Smith K, Wackerhage H, Greenhaff P. Branched-chain amino acids as fuels and anabolic signals in human muscle. J Nutr. 2006; 136(1 Suppl): 264S-8S. 45. Lai C. Production and composition of milk from 10 - 60 days of lactation in mothers who delivered prematurely. Nedlands: University of Western Australia; 2007. 46. Wells GD, Selvadurai H, Tein I. Bioenergetic provision of energy for muscular activity. Paediatr Respir Rev. 2009; 10: 83-90. 47. Lonnerdal B. Bioactive proteins in human milk: mechanisms of action. J Pediatr. 2010; 156(2 Suppl): S26-30. 48. Ozgurtas T, Aydin I, Turan O, Koc E, Hirfanoglu IM, Acikel CH, et al. Vascular endothelial growth factor, basic fibroblast growth factor, insulin-like growth factor-I and platelet-derived growth factor levels in human milk of mothers with term and preterm neonates. Cytokine. 2010; 50: 192-4. 49. Sekulic SR, Lukac DD, Naumovic NM. The fetus cannot exercise like an astronaut: gravity loading is necessary for the physiological development during second half of pregnancy. Med Hypotheses. 2005; 64: 221-8. 50. Montgomery RD. Growth of human striated muscle. Nature. 1962; 195: 194-5. 51. Widdowson E. Changes in body composition during growth. In: Davis J, Dobbing J, editors. Scientific foundations of paediatrics. 2nd ed. London: Heinemann Medical; 1981. p. 330-42. 52. Vasu V, Modi N. Assessing the impact of preterm nutrition. Early Human Development. 2007; 83(12): 813-8. 53. Roggero P, Gianni ML, Amato O, Orsi A, Piemontese P, Morlacchi L, et al. Is term newborn body composition being achieved postnatally in preterm infants? Early Hum Dev. 2009; 85(6): 349-52. 54. Cooke RJ, Griffin I. Altered body composition in preterm infants at hospital discharge. Acta Paediatr. 2009; 98(8): 1269-73. 55. Uthaya S, Thomas EL, Hamilton G, Dore CJ, Bell J, Modi N. Altered adiposity after extremely preterm birth. Pediatr Res. 2005; 57(2): 211-5. 56. Garrow JS. Validation of air-displacement plethysmography to measure body fat. Am J Clin Nutr. 2003; 77: 1338-9; author reply 9-40. 57. Ma G, Yao M, Liu Y, Lin A, Zou H, Urlando A, et al. Validation of a new pediatric air-displacement plethysmograph for assessing body composition in infants. Am J Clin Nutr. 2004; 79: 653-60.
217
58. Shen W, St-Onge M, Wang ZM, SB H. Study of body composition: an overview. In: Heymsfield SB, Lohman TG, Wang Z, Going S, editors. Human body composition. 2nd ed. Champaign, IL: Human Kinetics; 2005. p. 3-14. 59. Garrow J. Energy balance and obesity in man. 2 ed. Amsterdam, The Netherlands: Elservier/North-Holland Biomedical Press; 1978. 60. Wells JC. A critique of the expression of paediatric body composition data. Arch Dis Child. 2001; 85: 67-72. 61. Liu KH, Chan YL, Chan WB, Kong WL, Kong MO, Chan JC. Sonographic measurement of mesenteric fat thickness is a good correlate with cardiovascular risk factors: comparison with subcutaneous and preperitoneal fat thickness, magnetic resonance imaging and anthropometric indexes. Int J Obes Relat Metab Disord. 2003; 27: 1267-73. 62. Gluckman PD, Cutfield W, Hofman P, Hanson MA. The fetal, neonatal, and infant environments-the long-term consequences for disease risk. Early Hum Dev. 2005; 81: 51-9. 63. Gluckman PD, Hanson MA, Bateson P, Beedle AS, Law CM, Bhutta ZA, et al. Towards a new developmental synthesis: adaptive developmental plasticity and human disease. The Lancet. 2009; 373(9675): 1654-7. 64. Ahmad I, Nemet D, Eliakim A, Koeppel R, Grochow D, Coussens M, et al. Body composition and its components in preterm and term newborns: A cross-sectional, multimodal investigation. Am J Hum Biol. 2010; 22: 69-75. 65. Durmus B, Mook-Kanamori DO, Holzhauer S, Hofman A, van der Beek EM, Boehm G, et al. Growth in foetal life and infancy is associated with abdominal adiposity at the age of 2 years: the generation R study. Clin Endocrinol (Oxf). 2010; 72: 633-40. 66. Ribeiro-Filho FF, Faria AN, Azjen S, Zanella M-T, Ferreira SRG. Methods of estimation of visceral fat: advantages of ultrasonography. Obesity Research. 2003; 11(12): 1488-94. 67. Liu KH, Chan YL, Chan JC, Chan WB, Kong WL. Mesenteric fat thickness as an independent determinant of fatty liver. Int J Obes (Lond). 2006; 30: 787-93. 68. Wang Z, Pierson RJ, Heymsfield S. The five-level model: a new approach to organising body composition research. Am J Clin Nutr. 1992; 56: 19-28.
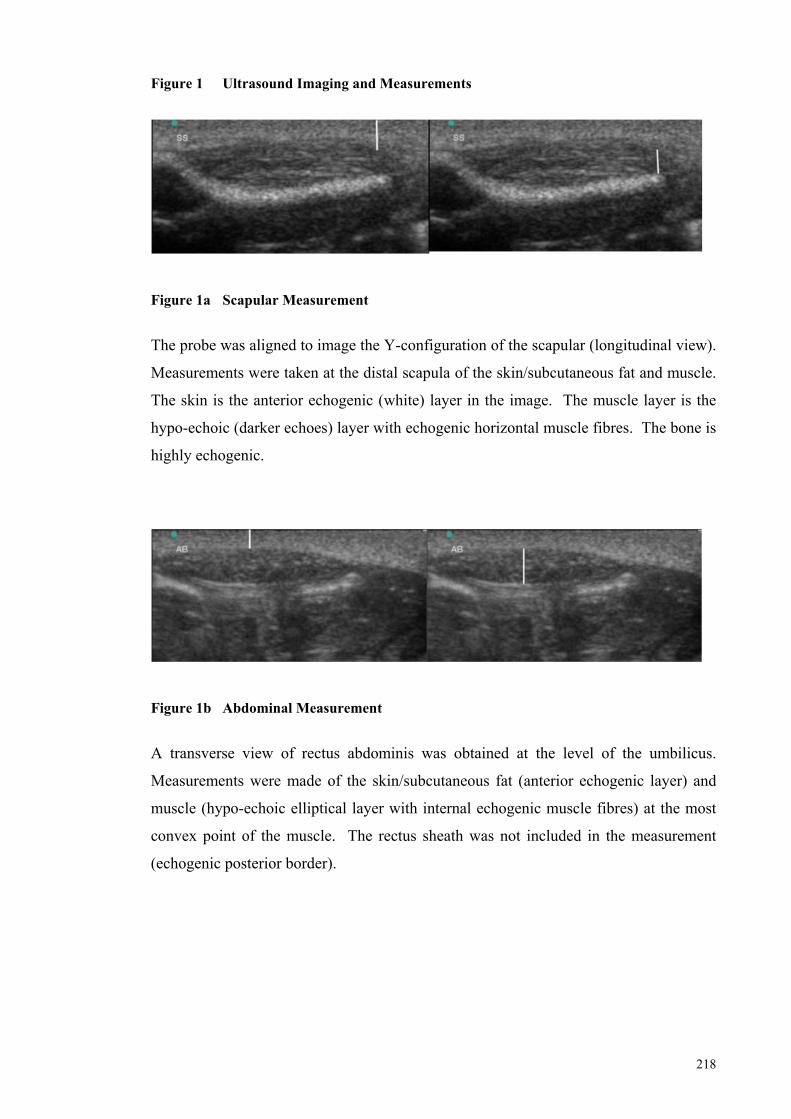
218
Figure 1 Ultrasound Imaging and Measurements
Figure 1a Scapular Measurement
The probe was aligned to image the Y-configuration of the scapular (longitudinal view).
Measurements were taken at the distal scapula of the skin/subcutaneous fat and muscle.
The skin is the anterior echogenic (white) layer in the image. The muscle layer is the
hypo-echoic (darker echoes) layer with echogenic horizontal muscle fibres. The bone is
highly echogenic.
Figure 1b Abdominal Measurement
A transverse view of rectus abdominis was obtained at the level of the umbilicus.
Measurements were made of the skin/subcutaneous fat (anterior echogenic layer) and
muscle (hypo-echoic elliptical layer with internal echogenic muscle fibres) at the most
convex point of the muscle. The rectus sheath was not included in the measurement
(echogenic posterior border).
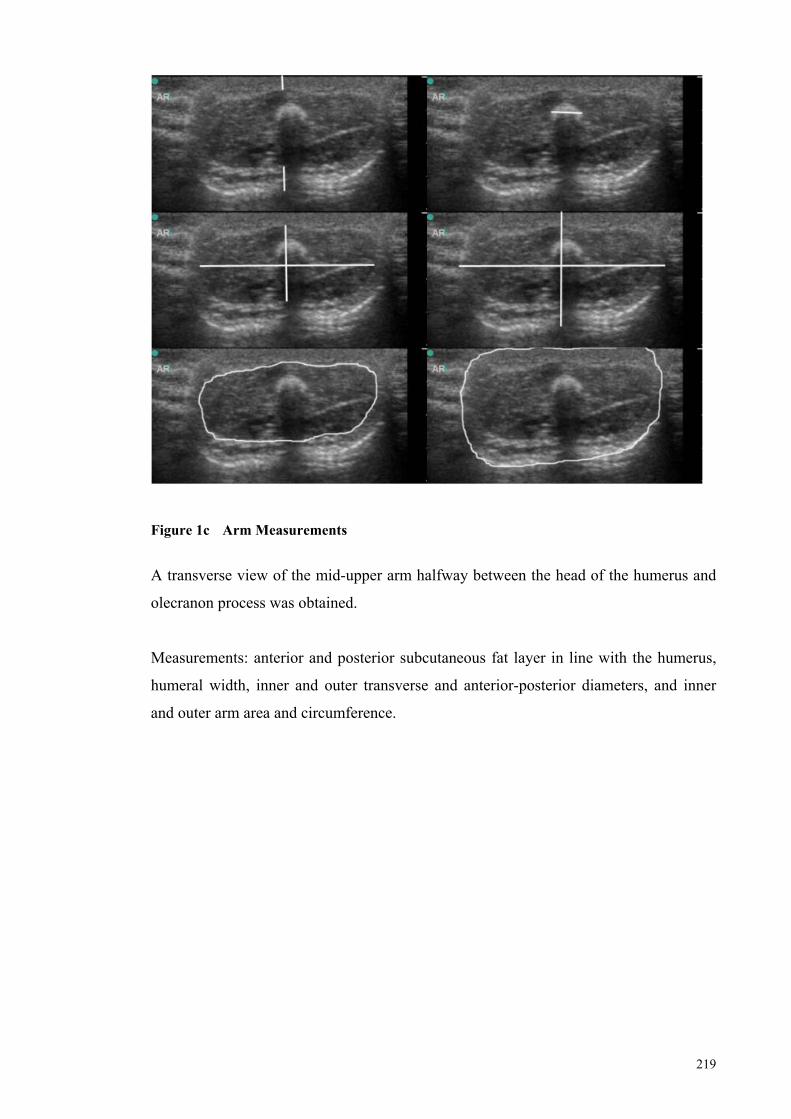
219
Figure 1c Arm Measurements
A transverse view of the mid-upper arm halfway between the head of the humerus and
olecranon process was obtained.
Measurements: anterior and posterior subcutaneous fat layer in line with the humerus,
humeral width, inner and outer transverse and anterior-posterior diameters, and inner
and outer arm area and circumference.
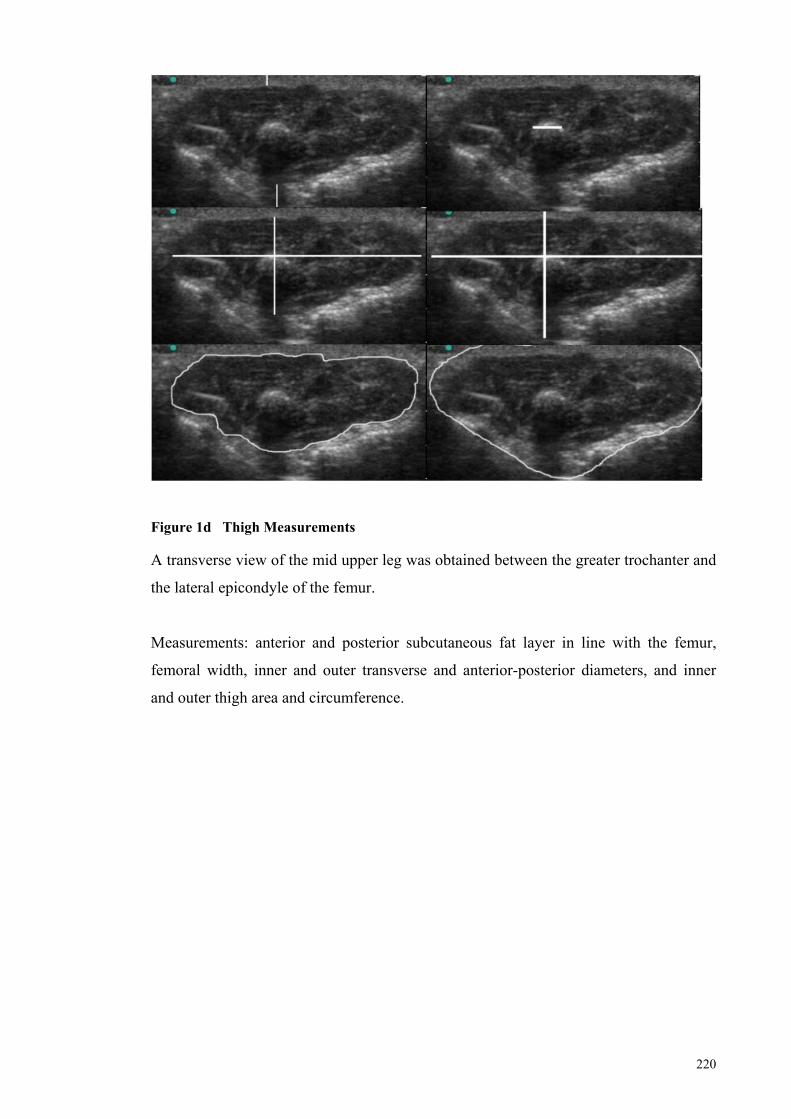
220
Figure 1d Thigh Measurements A transverse view of the mid upper leg was obtained between the greater trochanter and
the lateral epicondyle of the femur.
Measurements: anterior and posterior subcutaneous fat layer in line with the femur,
femoral width, inner and outer transverse and anterior-posterior diameters, and inner
and outer thigh area and circumference.
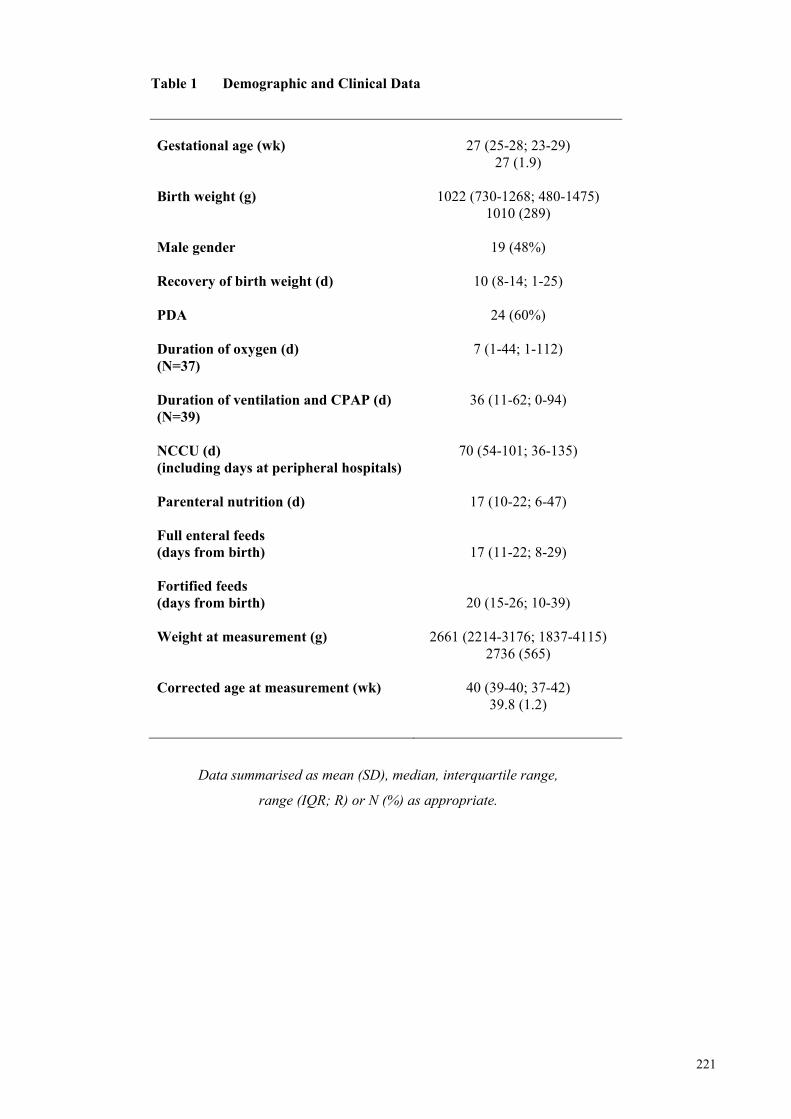
221
Table 1 Demographic and Clinical Data
Gestational age (wk) 27 (25-28; 23-29) 27 (1.9) Birth weight (g) 1022 (730-1268; 480-1475) 1010 (289) Male gender 19 (48%) Recovery of birth weight (d) 10 (8-14; 1-25) PDA 24 (60%) Duration of oxygen (d) 7 (1-44; 1-112) (N=37) Duration of ventilation and CPAP (d) 36 (11-62; 0-94) (N=39) NCCU (d) 70 (54-101; 36-135) (including days at peripheral hospitals) Parenteral nutrition (d) 17 (10-22; 6-47) Full enteral feeds (days from birth) 17 (11-22; 8-29) Fortified feeds (days from birth) 20 (15-26; 10-39) Weight at measurement (g) 2661 (2214-3176; 1837-4115) 2736 (565) Corrected age at measurement (wk) 40 (39-40; 37-42) 39.8 (1.2)
Data summarised as mean (SD), median, interquartile range,
range (IQR; R) or N (%) as appropriate.
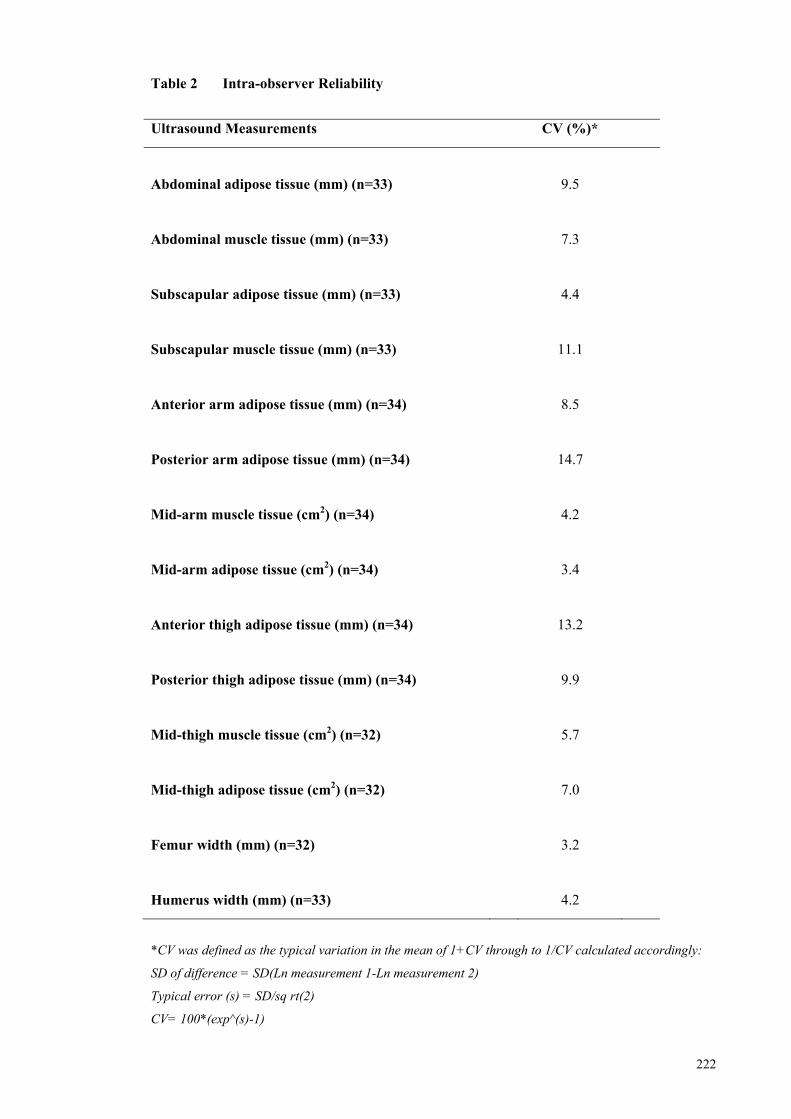
222
Table 2 Intra-observer Reliability
Ultrasound Measurements CV (%)*
Abdominal adipose tissue (mm) (n=33) 9.5
Abdominal muscle tissue (mm) (n=33) 7.3
Subscapular adipose tissue (mm) (n=33) 4.4
Subscapular muscle tissue (mm) (n=33) 11.1
Anterior arm adipose tissue (mm) (n=34) 8.5
Posterior arm adipose tissue (mm) (n=34) 14.7
Mid-arm muscle tissue (cm2) (n=34) 4.2
Mid-arm adipose tissue (cm2) (n=34) 3.4
Anterior thigh adipose tissue (mm) (n=34) 13.2
Posterior thigh adipose tissue (mm) (n=34) 9.9
Mid-thigh muscle tissue (cm2) (n=32) 5.7
Mid-thigh adipose tissue (cm2) (n=32) 7.0
Femur width (mm) (n=32) 3.2
Humerus width (mm) (n=33) 4.2
*CV was defined as the typical variation in the mean of 1+CV through to 1/CV calculated accordingly:
SD of difference = SD(Ln measurement 1-Ln measurement 2)
Typical error (s) = SD/sq rt(2)
CV= 100*(exp^(s)-1)
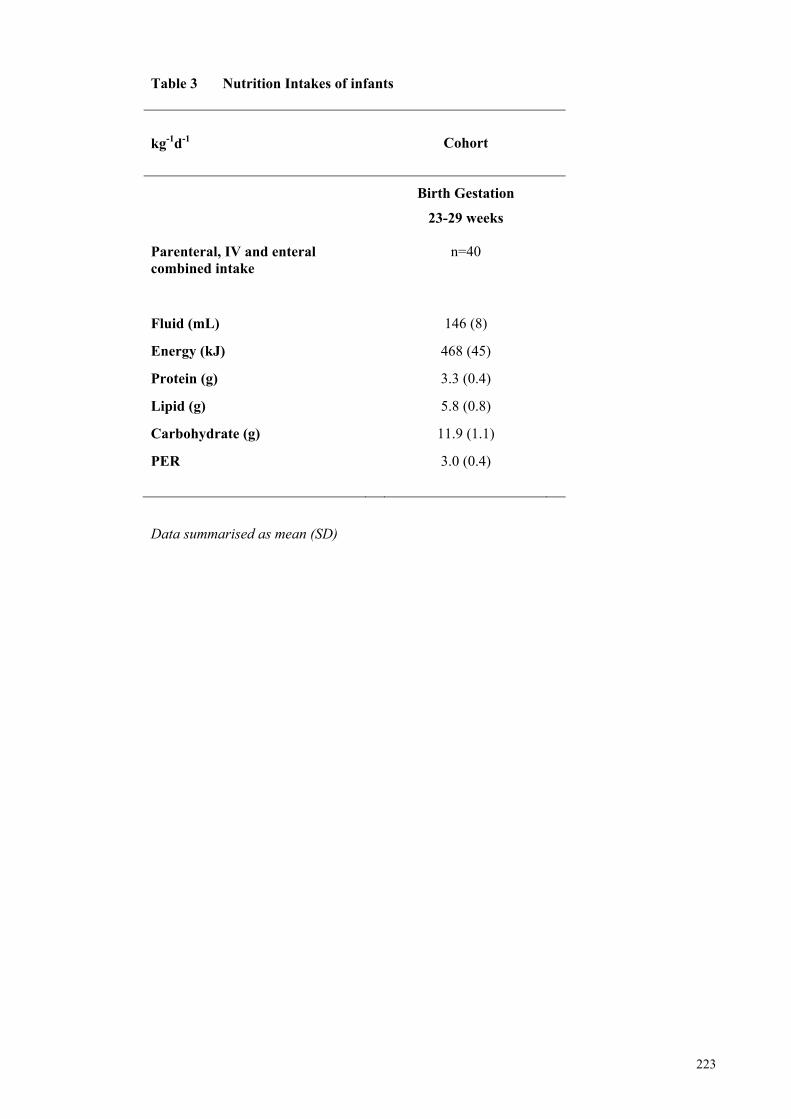
223
Table 3 Nutrition Intakes of infants
kg-1d-1
Cohort
Birth Gestation
23-29 weeks
Parenteral, IV and enteral combined intake
n=40
Fluid (mL)
146 (8)
Energy (kJ)
468 (45)
Protein (g)
3.3 (0.4)
Lipid (g)
5.8 (0.8)
Carbohydrate (g)
11.9 (1.1)
PER
3.0 (0.4)
Data summarised as mean (SD)
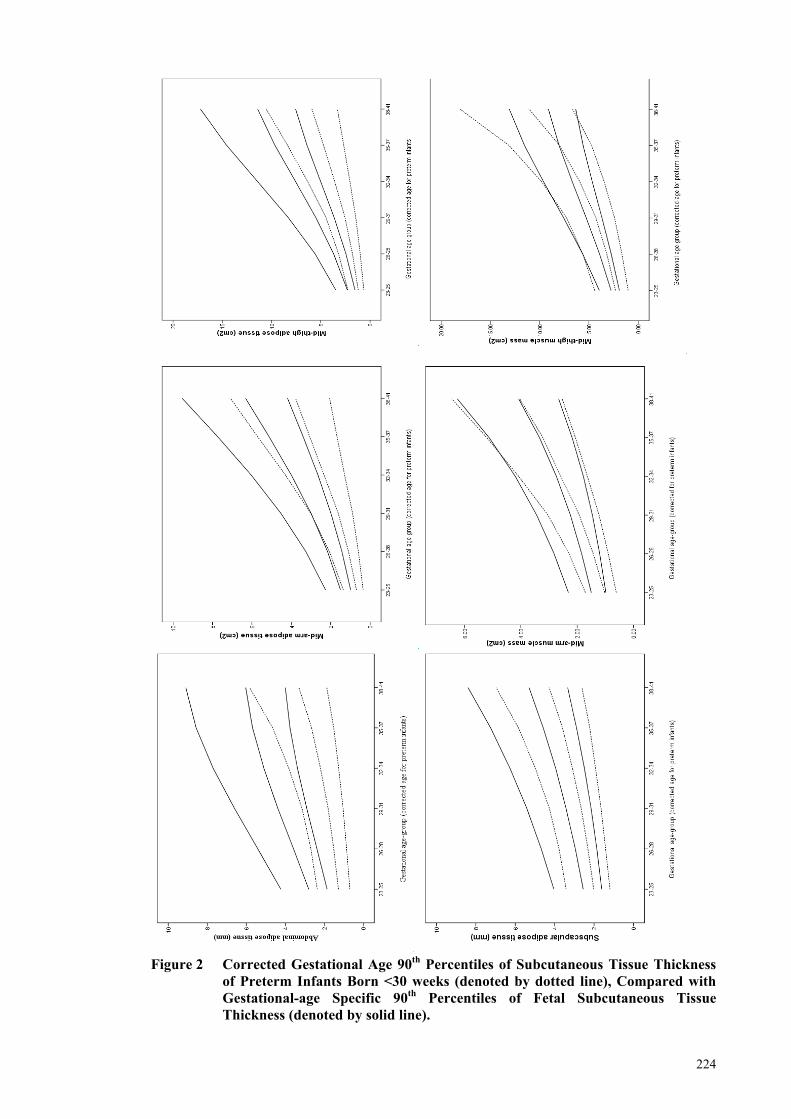
224
Figure 2 Corrected Gestational Age 90th Percentiles of Subcutaneous Tissue Thickness
of Preterm Infants Born <30 weeks (denoted by dotted line), Compared with Gestational-age Specific 90th Percentiles of Fetal Subcutaneous Tissue Thickness (denoted by solid line).
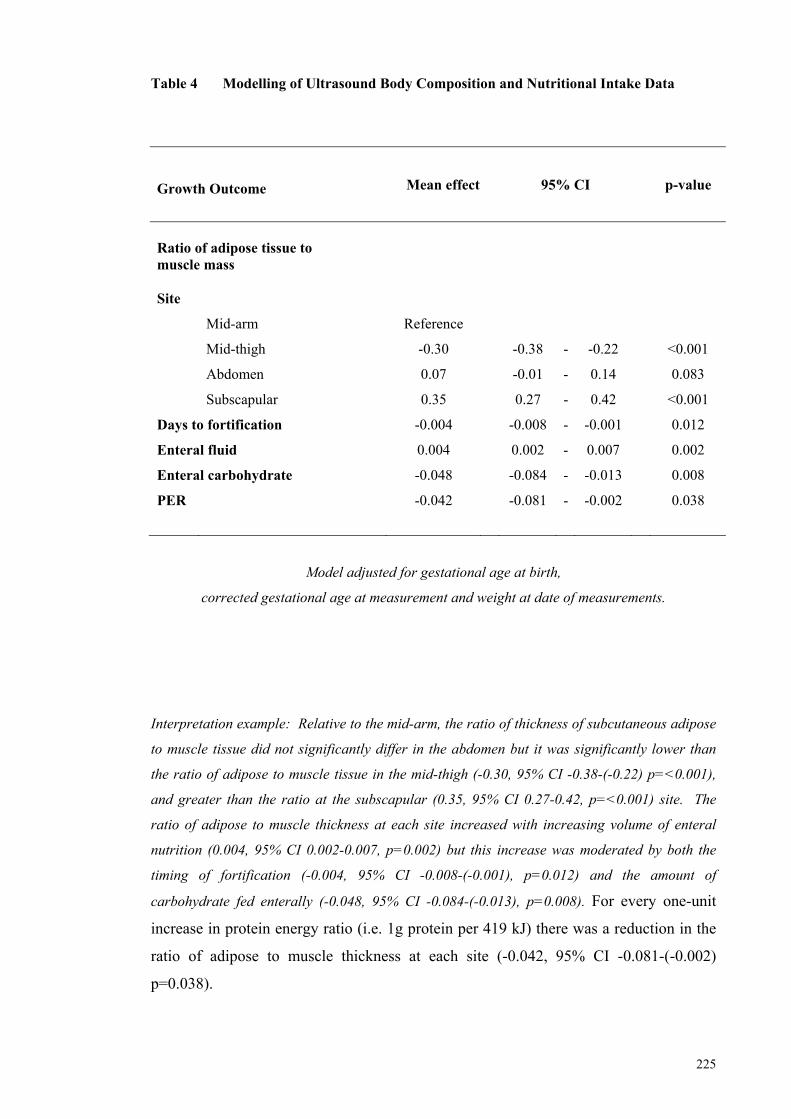
225
Table 4 Modelling of Ultrasound Body Composition and Nutritional Intake Data
Growth Outcome
Mean effect 95% CI p-value
Ratio of adipose tissue to muscle mass Site
Mid-arm Reference
Mid-thigh -0.30 -0.38 - -0.22 <0.001
Abdomen 0.07 -0.01 - 0.14 0.083
Subscapular 0.35 0.27 - 0.42 <0.001
Days to fortification -0.004 -0.008 - -0.001 0.012
Enteral fluid 0.004 0.002 - 0.007 0.002
Enteral carbohydrate -0.048 -0.084 - -0.013 0.008
PER -0.042 -0.081 - -0.002 0.038
Model adjusted for gestational age at birth,
corrected gestational age at measurement and weight at date of measurements.
Interpretation example: Relative to the mid-arm, the ratio of thickness of subcutaneous adipose
to muscle tissue did not significantly differ in the abdomen but it was significantly lower than
the ratio of adipose to muscle tissue in the mid-thigh (-0.30, 95% CI -0.38-(-0.22) p=<0.001),
and greater than the ratio at the subscapular (0.35, 95% CI 0.27-0.42, p=<0.001) site. The
ratio of adipose to muscle thickness at each site increased with increasing volume of enteral
nutrition (0.004, 95% CI 0.002-0.007, p=0.002) but this increase was moderated by both the
timing of fortification (-0.004, 95% CI -0.008-(-0.001), p=0.012) and the amount of
carbohydrate fed enterally (-0.048, 95% CI -0.084-(-0.013), p=0.008). For every one-unit
increase in protein energy ratio (i.e. 1g protein per 419 kJ) there was a reduction in the
ratio of adipose to muscle thickness at each site (-0.042, 95% CI -0.081-(-0.002)
p=0.038).
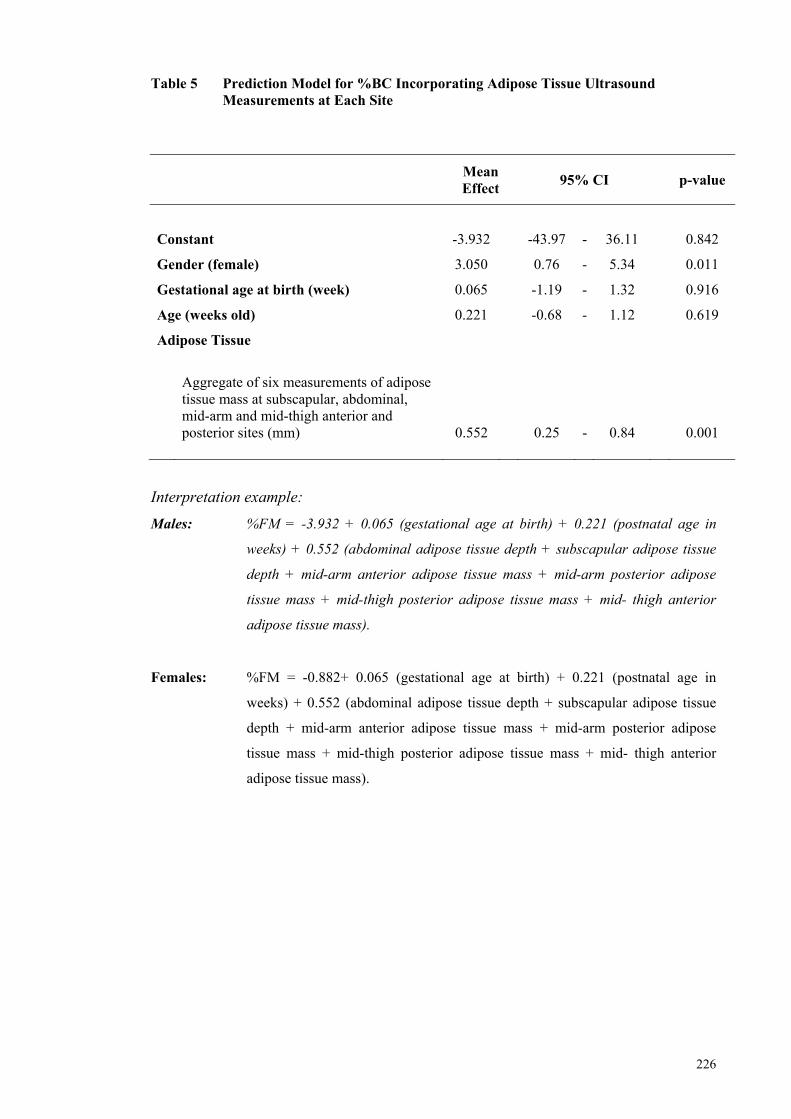
226
Table 5 Prediction Model for %BC Incorporating Adipose Tissue Ultrasound Measurements at Each Site
Mean Effect
95% CI p-value
Constant -3.932 -43.97 - 36.11 0.842
Gender (female) 3.050 0.76 - 5.34 0.011
Gestational age at birth (week) 0.065 -1.19 - 1.32 0.916
Age (weeks old) 0.221 -0.68 - 1.12 0.619
Adipose Tissue
Aggregate of six measurements of adipose tissue mass at subscapular, abdominal, mid-arm and mid-thigh anterior and posterior sites (mm) 0.552 0.25 - 0.84 0.001
Interpretation example:
Males: %FM = -3.932 + 0.065 (gestational age at birth) + 0.221 (postnatal age in
weeks) + 0.552 (abdominal adipose tissue depth + subscapular adipose tissue
depth + mid-arm anterior adipose tissue mass + mid-arm posterior adipose
tissue mass + mid-thigh posterior adipose tissue mass + mid- thigh anterior
adipose tissue mass).
Females: %FM = -0.882+ 0.065 (gestational age at birth) + 0.221 (postnatal age in
weeks) + 0.552 (abdominal adipose tissue depth + subscapular adipose tissue
depth + mid-arm anterior adipose tissue mass + mid-arm posterior adipose
tissue mass + mid-thigh posterior adipose tissue mass + mid- thigh anterior
adipose tissue mass).
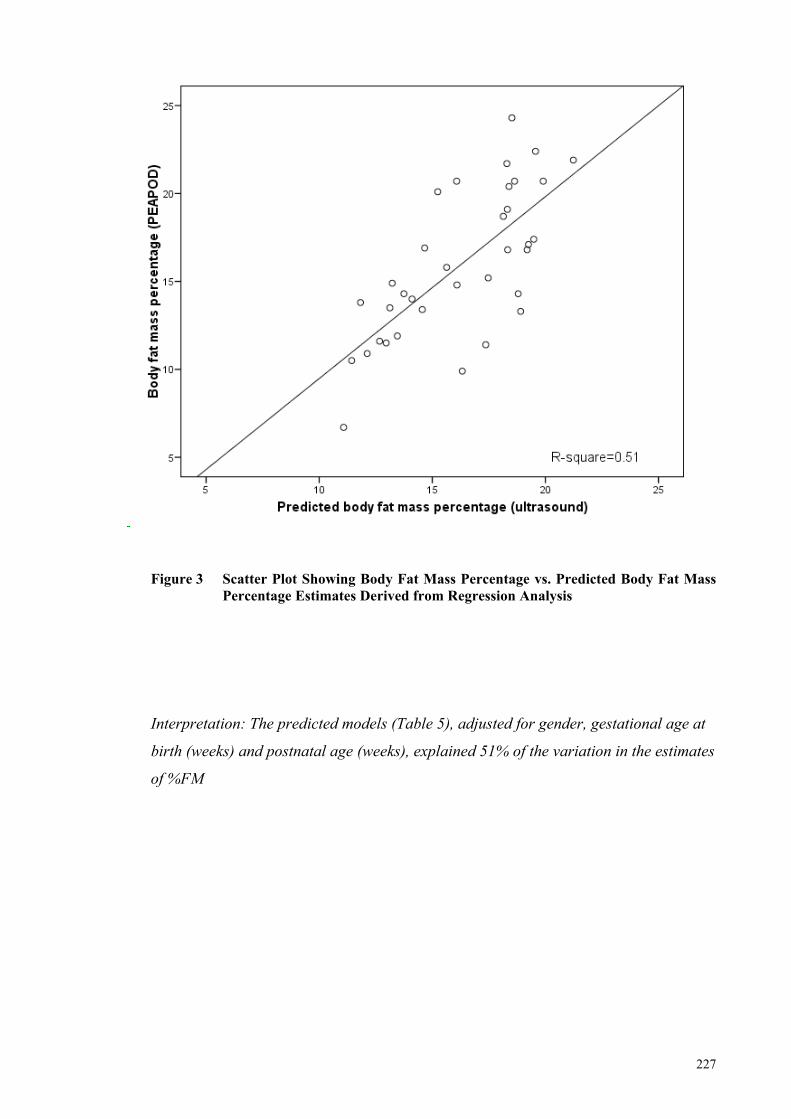
227
Figure 3 Scatter Plot Showing Body Fat Mass Percentage vs. Predicted Body Fat Mass Percentage Estimates Derived from Regression Analysis
Interpretation: The predicted models (Table 5), adjusted for gender, gestational age at
birth (weeks) and postnatal age (weeks), explained 51% of the variation in the estimates
of %FM
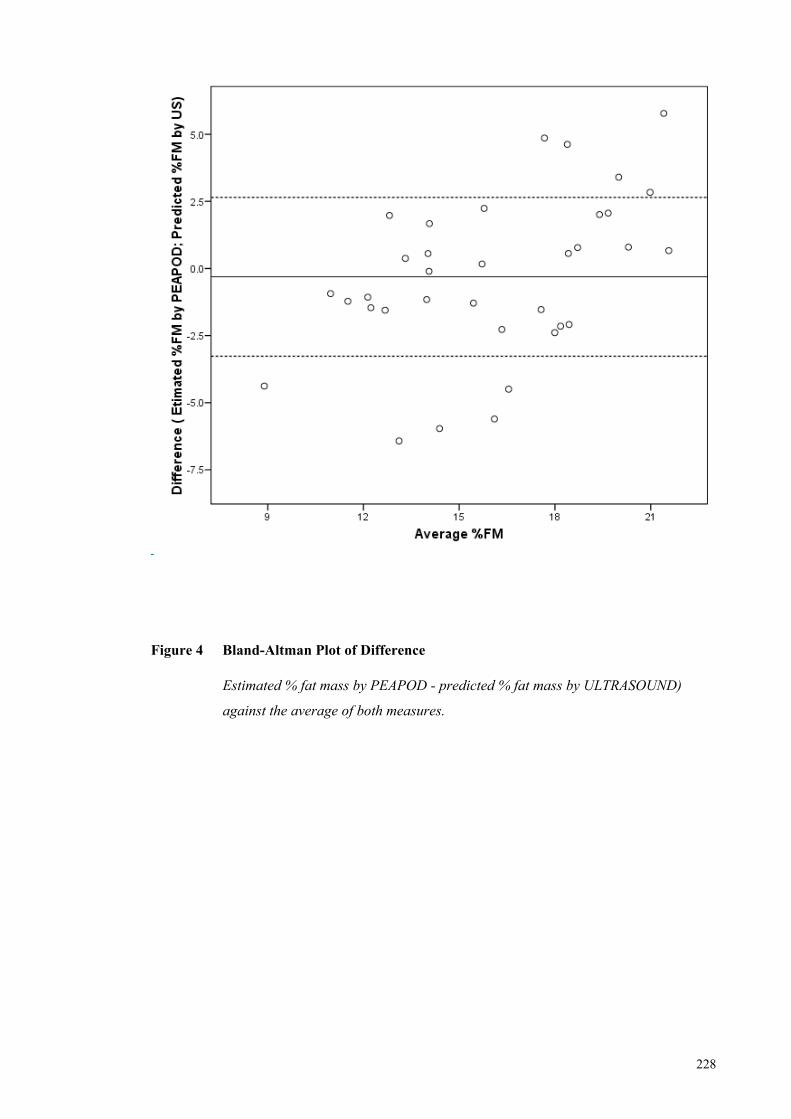
228
Figu Figure 4 Bland-Altman Plot of Difference
Estimated % fat mass by PEAPOD - predicted % fat mass by ULTRASOUND)
against the average of both measures.
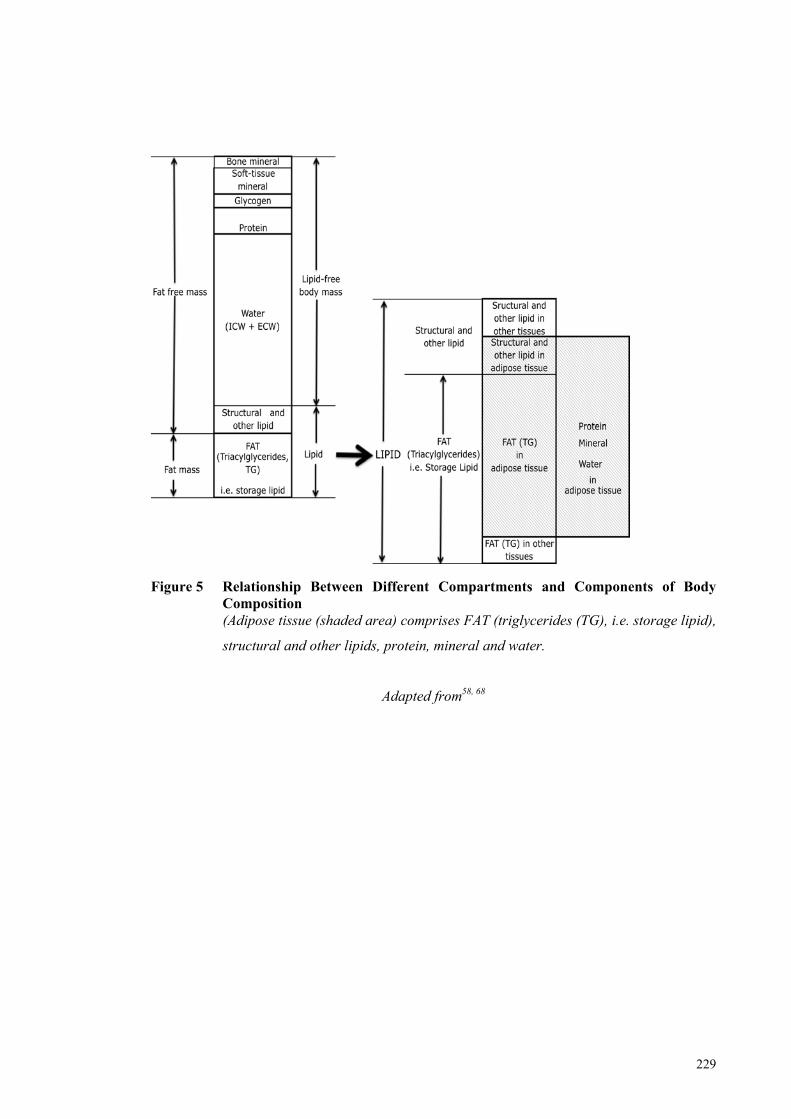
229
Figure 5 Relationship Between Different Compartments and Components of Body Composition (Adipose tissue (shaded area) comprises FAT (triglycerides (TG), i.e. storage lipid),
structural and other lipids, protein, mineral and water.
Adapted from58, 68
230
3.0 General Discussion
Fetal and preterm nutrition and the intra and extrauterine environments differ markedly.
It is not surprising that, by term, preterm infants present a different phenotype to that of
the healthy fetus born at 40 weeks gestation, defined by a lower body weight and altered
adiposity. Despite these differences, intrauterine growth remains the reference standard
for preterm infants and the continued challenge facing neonatal clinicians is how to
achieve desired growth with extrauterine nutrition. Physiological and metabolic
adaptation, firstly to parenteral glucose, amino acids and lipid, and then to minimal and
full enteral feeds, takes time to achieve. Limited nutrient intake and slow growth is
common in the first two to three weeks of life until birth weight is regained and the
infant has adapted to fortified milk feeds. Variation in the composition of human milk
between mothers and across lactation means that routine fortification based on reference
milk composition may produce feeds with wide variation in macronutrient content,
leading to relative under and overnutrition in some infants, thus risking retarded or
accelerated growth, or both. This mismatch between fetal and postnatal nutrition could
potentially have metabolic consequences that affect the health of preterm infants as they
grow and develop through life.
My thesis addressed two aspects of this topic:
(i) targeted human milk fortification to achieve desired growth, based on milk
analysis; and
(ii) evaluation and development of measurement methods to assess change in
preterm body composition in response to macronutrient intake.
Collectively, the studies described in this thesis represent the only studies that have used
milk analysis to calculate macronutrient intakes of preterm infants and then assess
intakes in terms of their influence on preterm body composition measured using both air
displacement plethysmography (PEAPOD) and ultrasound.
A notable result reported in this thesis was the large variation in the 24-hour unfortified
milk intakes of the infants, which were made up from their own mothers’ individual and
pooled collections of expressed milk. There has been no other Australian study to
231
report the macronutrient composition of preterm milk feeds based on chemical analysis,
nor has there been an Australian study that has demonstrated that milk feeds routinely
fortified using an assumed composition result in highly variable intakes that are in
variance to those commonly assumed. A striking pattern of intake stratified by
gestational age appeared to emerge at least in the first 28 days of life. Very preterm
infants averaged considerably lower fluid intakes per kilogram of body weight than
older infants and were reliant on intravenous fluids for longer. As fortification of milk
feeds based on an assumed macronutrient composition was targeted towards an
expected range of volume intakes, very preterm infants did not always achieve
recommended energy and protein intakes once feeds were fortified. Therefore, it is
recommended that early feeding is more aggressive, with amino acids introduced on day
one, at least at rates of 2.0 g kg-1d-1. Furthermore, in addition to fortifying milk as
directed by manufacturers, two new feeds have been created, each fortified with
additional and increased amounts of protein that will meet latest enteral
recommendations at lower volume intakes.
An unexpected finding reported in this thesis was that fortifying feeds for infants born
<30 weeks gestation on the basis of measured macronutrient composition resulted in
lower protein and energy intakes, and slower weight gain compared to what was then
considered to be already ‘optimised’ routine fortification. This outcome was attributed
in part to the particular intervention, that differentiated energy requirement according to
birth weight and which targeted the consensus guideline for protein by down-titrating
protein fortification with corrected gestational age. This strategy was employed to
achieve a composition of weight gain that mimicked fetal composition, but
recommended intakes and target growth were not achieved. Interestingly, the
2010 Enteral Feeding Commentary has not reaffirmed the 2005 consensus guideline that
energy requirements should be differentiated on birth weight, nor that protein intake
should be reduced with increasing corrected gestational age, recommending instead that
protein requirement be based on current weight and that protein intake be higher per
unit of energy than that which has previously been recommended.
Of particular interest in this thesis was the reported synergy between protein and
carbohydrate, which was evident when calculated intakes were based on milk analysis
by chemical or infrared methods, and whether body composition was measured by
PEAPOD or ultrasound method. Protein’s positive association with carbohydrate in
232
reducing the ratio of adipose to muscle tissue, of increasing FFM and of reducing %FM
at an achieved level of intake suggests that a concomitant increase in carbohydrate
fortification may also be necessary when increasing protein fortification in order to
promote uptake of branched chain amino acids into skeletal muscle, a hypothesis that
requires further study.
Another notable outcome of this thesis was the insight that was gained about the
difficulties and complexities associated with applying real-time milk analysis to the
individualised fortification of milk feeds to achieve recommended consensus intakes
and desired growth. Theoretically, if human milk fortification targets energy and
protein intakes within the reasonable ranges that were recommended by consensus in
2005, then consideration must simultaneously be given to an infant’s birth weight,
current weight and corrected gestation. In order to facilitate best nutrition and growth
outcomes, fortification then needs to be continually and actively modified according to
the rate of weight gain, to the type and volume of fluids prescribed, to the progression
and pattern of breastfeeding, including breast milk volume intake (preferably by test
weighing), and to the type and duration of respiratory support. Clearly in a large,
tertiary neonatal centre, it may be that fortifying milk on the basis of milk analysis and
then modifying fortification according to these influences is not a practical or realistic
solution for achieving desired growth. It was certainly not possible to account for all of
these influences during the trial. Based on the intervention reported in this thesis, which
proved to be both labour intensive and time-consuming, it may be that such a method
cannot be justified.
The alternative fortification method of adjusting fortification according to blood urea
nitrogen (BUN) appears to be a far more pragmatic approach to optimising fortification
to achieve desired growth. Before this method is routinely applied in clinical practice,
further study of its use as a biomarker for protein adequacy is necessary, as BUN is also
influenced by hydration status, illness severity, renal function, and its use for the
purpose of adjusting protein fortification in the study of Arslanoglu et al.1 did not
culminate in ensuring adequate protein intakes. A clinical trial is necessary to
determine safe upper limits of fortification prior to implementing this method to ensure
the metabolic capacity of infants is not exceeded. Until further study is undertaken, it
seems likely a cautious approach to fortification will persist, mainly because of the
metabolic consequences associated with excessive nitrogen loads and because of the
233
fear that upwardly adjusting fortification increases the osmolality of feeds and the risk
of developing necrotising enterocolitis. It would seem, given the latest enteral
commentary and the current interest in this topic, that it may be a prudent time for
industry to address the formulation of their human milk fortifiers. Unlike formula,
review of human milk fortifiers has been overlooked and is long overdue.
Perhaps the most noteworthy results reported in this thesis are those pertaining to
preterm body composition measurement, in which ultrasound was applied for the first
time to the serial measurement of preterm body composition. The measurements
obtained from birth revealed patterns of preterm subcutaneous adipose and muscle
tissue accretion that differed within and across sites, and there were marked differences
between fetal and preterm patterns of abdominal adipose accretion and of thigh skeletal
muscle accretion. The method was shown to be sufficiently sensitive to detect the
adaptive response of subcutaneous tissues to nutritional influences. The benefits may
extend even further than that, permitting the effect of nutritional and clinical
interventions on adipose tissue distribution and possibly even organ development.
Animal studies have shown that undernutrition adversely affects organ growth2 and
substantial differences between adipose tissue depots exist in relation to adipokine
production, physiological function and strength of association with adverse health
outcomes3-6. Furthermore, ultrasound is an established tool in fetal monitoring, thus
providing an opportunity to compare metabolic development between the fetus and the
preterm infant. Early monitoring of adipose and muscle tissue may further our
understanding of the mechanisms involved in later-onset of disease and the way in
which adaptive responses are mounted by the infant to deal with stressors or exposures
during critical periods of development7, 8.
Equally important are the results reported in this thesis relating to air displacement
plethysmography (PEAPOD), which was assessed for its capacity to measure preterm
infant body composition. In accordance with the findings of others, preterm percentage
FM (%FM) at the equivalent term age was greater than that of term infants who were
measured in the PEAPOD in the first week of life. It was argued that the disparity
between mean %FM of term infants measured in the PEAPOD in the first and second
weeks after birth, and between term and preterm infants at the equivalent age of term,
may be due in part to differences between groups in the hydration status of their
respective FFM during this period. It was also argued that the volume of air that
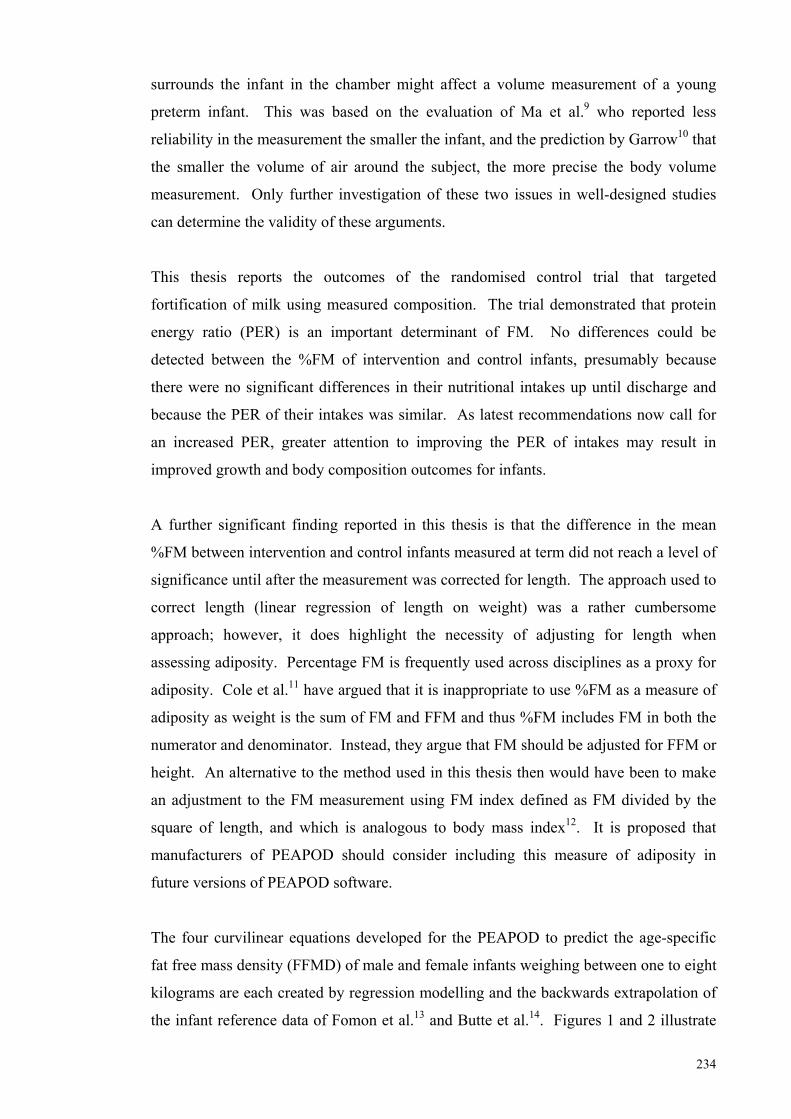
234
surrounds the infant in the chamber might affect a volume measurement of a young
preterm infant. This was based on the evaluation of Ma et al.9 who reported less
reliability in the measurement the smaller the infant, and the prediction by Garrow10 that
the smaller the volume of air around the subject, the more precise the body volume
measurement. Only further investigation of these two issues in well-designed studies
can determine the validity of these arguments.
This thesis reports the outcomes of the randomised control trial that targeted
fortification of milk using measured composition. The trial demonstrated that protein
energy ratio (PER) is an important determinant of FM. No differences could be
detected between the %FM of intervention and control infants, presumably because
there were no significant differences in their nutritional intakes up until discharge and
because the PER of their intakes was similar. As latest recommendations now call for
an increased PER, greater attention to improving the PER of intakes may result in
improved growth and body composition outcomes for infants.
A further significant finding reported in this thesis is that the difference in the mean
%FM between intervention and control infants measured at term did not reach a level of
significance until after the measurement was corrected for length. The approach used to
correct length (linear regression of length on weight) was a rather cumbersome
approach; however, it does highlight the necessity of adjusting for length when
assessing adiposity. Percentage FM is frequently used across disciplines as a proxy for
adiposity. Cole et al.11 have argued that it is inappropriate to use %FM as a measure of
adiposity as weight is the sum of FM and FFM and thus %FM includes FM in both the
numerator and denominator. Instead, they argue that FM should be adjusted for FFM or
height. An alternative to the method used in this thesis then would have been to make
an adjustment to the FM measurement using FM index defined as FM divided by the
square of length, and which is analogous to body mass index12. It is proposed that
manufacturers of PEAPOD should consider including this measure of adiposity in
future versions of PEAPOD software.
The four curvilinear equations developed for the PEAPOD to predict the age-specific
fat free mass density (FFMD) of male and female infants weighing between one to eight
kilograms are each created by regression modelling and the backwards extrapolation of
the infant reference data of Fomon et al.13 and Butte et al.14. Figures 1 and 2 illustrate
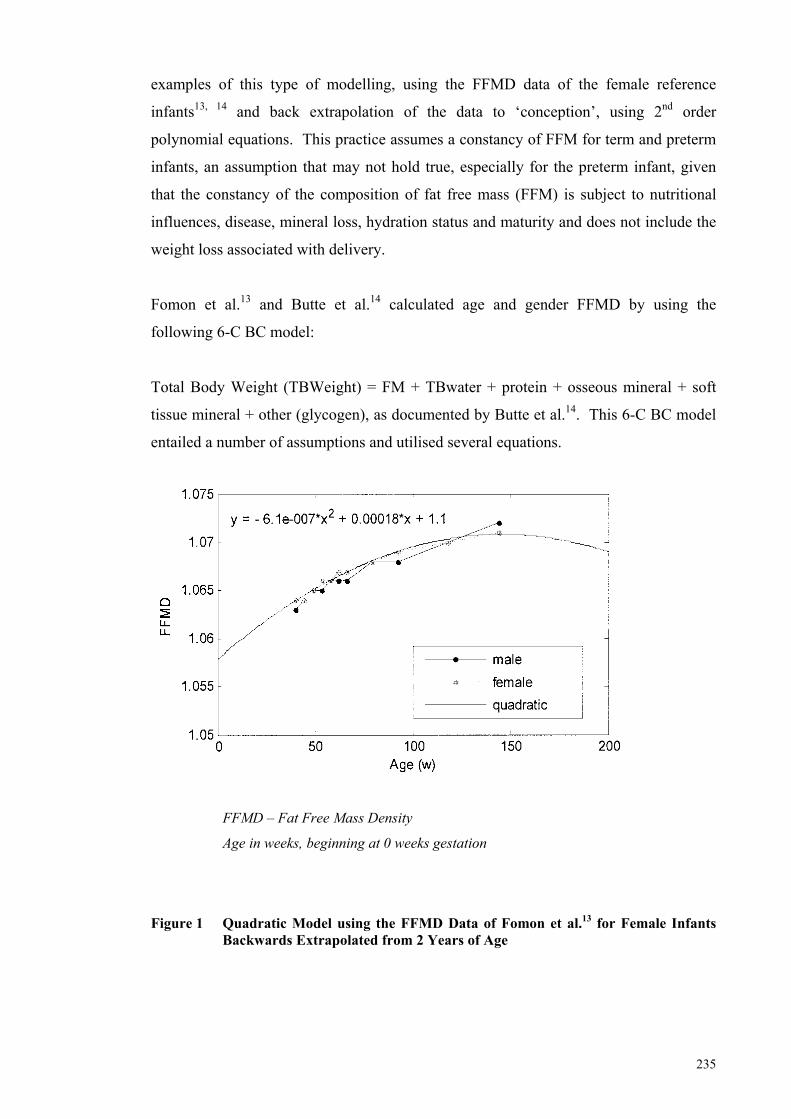
235
examples of this type of modelling, using the FFMD data of the female reference
infants13, 14 and back extrapolation of the data to ‘conception’, using 2nd order
polynomial equations. This practice assumes a constancy of FFM for term and preterm
infants, an assumption that may not hold true, especially for the preterm infant, given
that the constancy of the composition of fat free mass (FFM) is subject to nutritional
influences, disease, mineral loss, hydration status and maturity and does not include the
weight loss associated with delivery.
Fomon et al.13 and Butte et al.14 calculated age and gender FFMD by using the
following 6-C BC model:
Total Body Weight (TBWeight) = FM + TBwater + protein + osseous mineral + soft
tissue mineral + other (glycogen), as documented by Butte et al.14. This 6-C BC model
entailed a number of assumptions and utilised several equations.
FFMD – Fat Free Mass Density
Age in weeks, beginning at 0 weeks gestation
Figure 1 Quadratic Model using the FFMD Data of Fomon et al.13 for Female Infants Backwards Extrapolated from 2 Years of Age
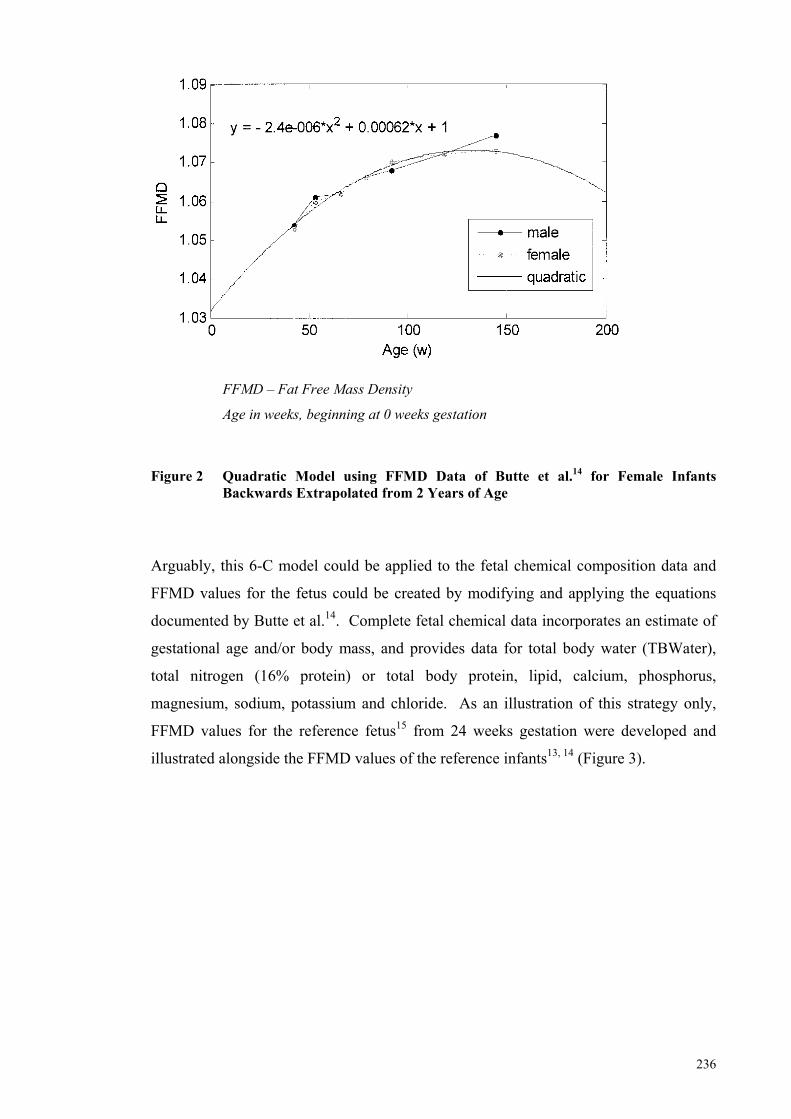
236
FFMD – Fat Free Mass Density
Age in weeks, beginning at 0 weeks gestation
Figure 2 Quadratic Model using FFMD Data of Butte et al.14 for Female Infants
Backwards Extrapolated from 2 Years of Age
Arguably, this 6-C model could be applied to the fetal chemical composition data and
FFMD values for the fetus could be created by modifying and applying the equations
documented by Butte et al.14. Complete fetal chemical data incorporates an estimate of
gestational age and/or body mass, and provides data for total body water (TBWater),
total nitrogen (16% protein) or total body protein, lipid, calcium, phosphorus,
magnesium, sodium, potassium and chloride. As an illustration of this strategy only,
FFMD values for the reference fetus15 from 24 weeks gestation were developed and
illustrated alongside the FFMD values of the reference infants13, 14 (Figure 3).
237
LEGENDS: Vertical axis- FFMD – Fat Free Mass Density
Horizontal axis- Age in weeks, beginning at 20 weeks gestation to 120 weeks post-term
Red- FFMD values for the fetus from 24 weeks gestation to term, calculated from the
Reference Fetus created by Ziegler et al.15.
Blue and Green- age and gender specific FFMD values for the male and female infants
taken from Butte et al.14(continuous lines) and Fomon et al.13 (broken lines).
(NB: the Fetal FFMD values calculated from the Reference Fetus15 align more closely with
the FFMD values calculated by Butte et al14 for the 2-week old male and female infants than
with the FFMD values calculated by Fomon et al.13 for the term male and female infants).
Calculated FFMD values for the Reference Fetus were based on the following assumptions: Osseous mineral = calcium + phosphorus + 50% magnesium Non-osseous mineral =summation of the remaining mineral Glycogen = 0.45% body weight Fat free mass (FFM) =Body mass – Fat mass (FM)
(FFM comprises TBWater + Protein + Glycogen + Mineral (Osseous + Non-osseous) The volumes of the body and the FFM, and their respective densities were calculated according to the following equations: Body volume = FM/0.9007 + TBWater/0.99371 + Osseous mineral/2.982 + protein/1.34 + glycogen/1.52 + Non-osseous mineral/3.317 Body density = Body mass/body volume FFM volume = Total body water/0.99371 + Osseous mineral/2.982 + protein/1.34 + glycogen/1.52 + Non-osseous mineral/3.317 FFMD = FFM/FFM volume.
Figure 3 Age-specific FFMD Values Calculated from the Reference Fetus15 and Illustrated Alongside Male and Female age-specific FFMD values calculated for the Reference Infants by Fomon et al.15 and Butte et al.14.
238
It must be emphasised that the reference fetus represents a model constructed using the
complete chemical data of only 22 fetuses. The investigators who created the reference
fetus15 have acknowledged the limitations associated with its construction. However,
these are possibly no less limiting than those of the two male and female reference
infants. It may be a worthwhile exercise therefore, to create an alternative combined
FFMD model for the PEAPOD, by using FFMD estimates calculated from raw fetal
chemical data and the FFMD values of the reference infants. Fat free mass density
estimates for the ‘reference infant from conception’ could possibly be created if the data
of Widdowson, Spray and Dickerson16 (where gestational age was estimated on foot
length) were also included. In the future, it may be possible to develop age- and gender
specific FFMD values for the ‘reference’ preterm infant from birth and these too could
then be incorporated into a preterm FFMD model for use in the PEAPOD.
This thesis has raised at least as many questions as it has answered. Further study of
how best to nourish the preterm infant to achieve desired growth, and indeed, whether
desired growth should target intrauterine growth and nutrient accretion, is required. It
would appear the more pragmatic method of using BUN to adjust protein fortification
may be preferable to fortifying milk on the basis of milk analysis. With ultrasound and
other emerging imaging methods, such as MRI, it may be possible to study more closely
the plasticity of the adipose and skeletal muscle tissues and the growth of organs, as
well as to assess their response to nutritional and clinical interventions. The PEAPOD
remains an efficient means by which to measure body composition. With further
evaluation and perhaps modification, the PEAPOD has the potential to become a useful
method by which to measure preterm body composition. Employing measurement
methods such as these to measure outcomes in clinical trials may assist in better
defining preterm nutritional requirements, in gaining greater insight into the
determinants of preterm growth and metabolic development, and in facilitating changes
to clinical practice that will positively shape the health of preterm infants.
3.1 Limitations
1. Body composition measurement methods in preterm infants have not been
validated due to the difficulties associated with measuring the BC of sick
preterm infants and to the ethical considerations associated with whole-body
carcass analysis. All methods are limited by the reference data upon which their
algorithms are based. The PEAPOD, which utilises the FFM Density values of
239
Fomon et al13 to create a Density model, assumes that preterm FFMD is
captured in part, by applying a 2nd order polynomial equation to these values and
by back extrapolation of the data. The algorithms could be improved if FFM
Density values could be determined by in vivo studies on preterm infants from
birth.
2. The ultrasound method for the early and non-intrusive measurement of preterm
BC would appear to have great potential but interpretation of the measurements
was hampered by the lack of reference data. Ultrasonic transducers do not have
a wide enough field of view to encompass the entire limb in cross-section,
necessitating the acquisition of multiple images.
3. The protein algorithm used in the MIRIS was calibrated against human milk
protein that had been corrected for the estimated NPN fraction of bovine milk
(6.38). Thus, the protein content of human milk in the Intervention Study may
have been overestimated. Further, the in-built factory function of slope and bias
correction could have conceivably resulted in a gradual drift in the accuracy of
the protein and other measurements over time. It was a limitation of the
fortification study that improved calibration checks beyond those recommended
by the company in their technical instructions, were not employed.
3.2 Future Directions
Future research direction should focus on:
1. Further development and evaluation of rapid and accurate methods to measure
the composition of small milk samples in the clinical setting. This would
include evaluating the degree to which the factory recommended calibration
adjustments affect the accuracy of the MIRIS measurement over time.
2. Exploration of targeted fortification for infants who are born of mothers
producing milk of low protein content and identification of the protein or
proteins that are low. ‘Low protein’ status may be dependent on corrected
gestational-age as protein requirement is higher for extremely preterm infants
weighing below 1000 g.
240
3. Quantification of optimal ratios of fat, carbohydrate and protein to total energy,
in commercial fortifiers, formula and NICU fortification protocols to achieve
reference body composition.
4. In vivo, longitudinal or cross-sectional isotope studies to quantify the changing
distribution of body water with corrected gestational age i.e. TBWater (eg.
deuterium), extracellular (eg. bromide) and intracellular (eg. by difference)
water. These studies will assist in assessing the validity of algorithms used in
the PEAPOD and in calculating an appropriate correction factor.
5. Metabolic (i.e. energy and nitrogen balance) and body composition studies on
preterm infants fed mothers own milk, donor milk and recently developed
formulae, to inform clinical practice (i.e. fortification and feeding protocols) and
to assist in establishing evidence-based, preterm protein and energy
requirements.
6. Further development, evaluation and validation (if possible) of BC measurement
methods for preterm and term infants, including standardisation of measurement
sites. Measurement sites selected to measure internal and subcutaneous fat and
muscle tissue need to be standardised across studies to permit the integration and
analysis of datasets obtained by various methods. For example, further study
could explore the most appropriate sites that will allow ultrasound to accurately
predict total adiposity, as determined by MRI.
7. Development of a specialised ultrasonic transducer that has the capacity to span
the cross-section of limbs.
8. Gender and age-specific reference data for preterm and term adipose and muscle
tissue accretion using a standardised ultrasound method and the subsequent
development of 90th percentile reference curves for infants from birth.
9. The development of an electronic nutrition program to facilitate further
nutritional and growth studies that are based on accurate feeding and
compositional data. The execution of these four studies was physically and
mentally demanding due to the extensive milk analysis and the manual

241
collection of detailed longitudinal nutrient intake and growth data for each of the
infants studied. This work could not have been undertaken without first
developing a rudimentary, electronic tool that automatically calculated
macronutrient and energy intakes from the milk composition data and the
collected growth and intravenous and enteral feeding data.
242
3.3 References (General Discussion)
1. Arslanoglu S, Moro G, Ziegler E. Preterm infants fed fortified human milk receive less protein than they need. J Perinatol. 2009; 29: 489-92. 2. Widdowson EM. Changes in pigs due to undernutrition before birth, and for one, two, and three years afterwards, and the effects of rehabilitation. Adv Exp Med Biol. 1974; 49: 165-81. 3. Ordovas JM, Corella D. Metabolic syndrome pathophysiology: the role of adipose tissue. Kidney Int Suppl. 2008; (111): S10-4. 4. Asferg C, Mogelvang R, Flyvbjerg A, Frystyk J, Jensen JS, Marott JL, et al. Leptin, not adiponectin, predicts hypertension in the Copenhagen City Heart Study. Am J Hypertens. 2010; 23: 327-33. 5. Cnop M, Landchild MJ, Vidal J, Havel PJ, Knowles NG, Carr DR, et al. The concurrent accumulation of intra-abdominal and subcutaneous fat explains the association between insulin resistance and plasma leptin concentrations : distinct metabolic effects of two fat compartments. Diabetes. 2002; 51: 1005-15. 6. Liu KH, Chan YL, Chan WB, Kong WL, Kong MO, Chan JC. Sonographic measurement of mesenteric fat thickness is a good correlate with cardiovascular risk factors: comparison with subcutaneous and preperitoneal fat thickness, magnetic resonance imaging and anthropometric indexes. Int J Obes Relat Metab Disord. 2003; 27: 1267-73. 7. Gluckman PD, Cutfield W, Hofman P, Hanson MA. The fetal, neonatal, and infant environments-the long-term consequences for disease risk. Early Hum Dev. 2005; 81: 51-9. 8. Gluckman PD, Hanson MA, Bateson P, Beedle AS, Law CM, Bhutta ZA, et al. Towards a new developmental synthesis: adaptive developmental plasticity and human disease. The Lancet. 2009; 373(9675): 1654-7. 9. Ma G, Yao M, Liu Y, Lin A, Zou H, Urlando A, et al. Validation of a new pediatric air-displacement plethysmograph for assessing body composition in infants. Am J Clin Nutr. 2004; 79: 653-60. 10. Garrow JS. Validation of air-displacement plethysmography to measure body fat. Am J Clin Nutr. 2003; 77: 1338-9; author reply 9-40. 11. Cole TJ, Fewtrell MS, Prentice A. The fallacy of using percentage body fat as a measure of adiposity. Am J Clin Nutr. 2008; 87: 1959. 12. Wells JC. A critique of the expression of paediatric body composition data. Arch Dis Child. 2001; 85: 67-72. 13. Fomon SJ, Haschke F, Ziegler EE, Nelson SE. Body composition of reference children from birth to age 10 years. The American Journal Of Clinical Nutrition. 1982; 35(5 Suppl): 1169-75. 14. Butte NF, Hopkinson JM, Wong WW, Smith EO, KJ E. Body composition during the first 2 years of life. An updated reference. Pediatr Res. 2000; 47: 578-85. 15. Ziegler E, O'Donnell A, Nelson S, Fomon S. Body composition of the reference fetus. Growth. 1976; 40: 329-41. 16. Widdowson E, Dickerson J. Chemical composition of the body. In: Comar C, Bronner F, editors. Mineral metabolism An advanced treatise. New York: Academic Press; 1964. p. 1-247.