indonesia - home · financial inclusion insights by …finclusion.org/uploads/file/reports/2016 data...
TRANSCRIPT
INDONESIA
December 2016
QUICKSIGHTS REPORT
FII TRACKER SURVEY WAVE 3Fieldwork Conducted September through November 2016
INDONESIA
Access – Access to a bank account or mobile money account means an
individual can use bank/mobile money services either via their own
account or via an account of another person.
Active account holder – An individual who has a registered account and
has used it in the last 90 days.
Active user – An individual who has used any financial services account
for any type of transaction in the past 90 days via his/her own account or
somebody else’s account.
Adults with DFS access – Adults (15+) who either own a DFS account
or have access to someone else’s account.
Advanced use of DFS – Advanced use of DFS includes activities beyond
basic cash-in/cash-out and person-to-person transfers (e.g., savings, bill
pay, investment, insurance, etc.).
Arisan – Informal, rotating credit savings group.
Bank Perkreditan Rakyat (BPR) – Rural credit bank.
Below the poverty line – In this particular study, adults living on less than
$2.50 per day, as classified by the Grameen PPI.
Cooperative – Typically, a business or other professional organization that
is owned and run jointly by its members, who share the profits or benefits.
Cooperatives can release some of the profits/funds as loans to its
members.
Digital financial services (DFS) – Financial services provided through
an electronic platform (mobile phones, electronic cards, the internet, etc.).
Dormant accounts –Registered accounts that have never been used or
that have not been active (e.g., used in the past 90 days).
Financially included –Included individuals are those who have an
account with an institution that provides a full suite of financial services
and comes under some form of government regulation. Services include
savings, money transfers, insurance or investment. Institutions that only
offer loans to consumers, such as some MFIs, are not considered to be
full-service institutions.
Full-service nonbank financial institutions – Financial institutions that
offer their customers at least one of the following services: savings, money
transfers, insurance, or investment.
Grameen Progress out of Poverty Index (PPI) – A poverty
measurement tool from the Grameen Foundation wherein a set of
country-specific questions are used to compute the likelihood that a
household is living below the poverty line.
Microfinance institution (MFI) – An organization that offers financial
services to low-income populations. Almost all give loans to their
members, and many offer insurance, deposit and other services.
Mobile money (MM) – A service in which a mobile phone is used to
access financial services.
Nonbank financial institution (NBFI) – A financial organization that is
not formally licensed as a bank or a mobile money provider, but whose
activities are regulated, at least to some extent, by the central bank within
the country. Such financial institutions include rural credit banks,
cooperatives, Post Office Banks, and savings and credit cooperatives.
Non-full-service financial institution – Institution that offers a limited
range of financial products or services, often in an informal setting. These
institutions are not included in the financial rate calculation and include
arisans, money lenders, money guards and other savings groups.
Registered active user – Individual who holds a registered financial
services account and has used it in the last 90 days.
Services beyond basic wallet – DFS transactions that go beyond simple
deposits, withdrawals or money transfers.
Unregistered/over-the-counter (OTC) user – An individual who has
used a financial service through someone else’s account, including an
agent’s account or the account of a family member or a neighbor.
Urban/rural – Urban and rural persons are defined according to their
residence in urban or rural areas as prescribed by the national bureau of
statistics.
Key definitions
2
INDONESIA
Country context
• In November 2016, the Indonesian government announced the creation of a National Strategy for Financial Inclusion (SNKI) to expand bank
account ownership to 75 percent of the adult population by 2019, among other goals.* While Indonesia is a bank-led financial services market,
this goal is nonetheless very ambitious, given that less than 25 percent of adult Indonesians currently hold a bank account.
– Achieving the SNKI objective is complicated by the concentration of bank account ownership in specific demographic groups – men, residents
of urban areas, and households with incomes above the poverty line. Bank account ownership is rising among underserved groups – women,
residents of rural areas, and those below the poverty line – at a rate that outpaces their counterparts; however, the gap remains significant.
– Unbanked or otherwise underserved individuals use financial products and services, including digital ones, but these offerings tend to be
informal and/or not full-service in nature. For example, 20 percent of Indonesian adults who do not hold a formal, full-service financial
account instead use arisans, or other types of informal rotating savings groups. Successful implementation of the SNKI, therefore, requires
competing with a widespread set of non-full-service institutions that are already catering to the needs of the unbanked.
• In August 2016, the Indonesian Financial Services Authority (OJK) announced that more progressive financial technology (fintech)
regulations were under development.
– Current regulations are structured such that fintech does not fall under a single regulatory authority. This structure inhibits growth in the
fintech sector, as a commercial entity dealing in fintech has to be compliant with multiple and occasionally competing or contradictory sets of
regulations.
– These new regulations will consolidate regulatory authority while also creating a regulatory environment that actively encourages fintech
expansion. For example, the new regulations will establish a “regulatory sandbox,” or the ability for companies to test new products without
establishing full compliance with existing regulations. This change would lower barriers to market entry and provide regulators with an
opportunity to adapt regulations to new technologies and consumption patterns.**
• Over 25 percent of Indonesians have used digital financial services (DFS) and products (full and non-full service), including 6 percent of the
financially excluded population. OJK has signaled support for expanding use of DFS by promoting fintech through various means including:
– Hosting the first Indonesia Fintech Festival and Conference in August 2016. The event featured talks by both established institutions (e.g.,
Bank Indonesia) and start-up corporations (e.g., Go-Jek) on how to apply fintech to businesses, as well as by Indonesian and international
government representatives, including Queen Maxima of the Netherlands.
– Launching a Fintech Innovation Hub, a “one-stop contact center” where fintech companies can network and collaborate.**
* Parlina, I. (2016, November 18). Indonesia promotes financial inclusion with new strategy. Retrieved from
http://www.thejakartapost.com/news/2016/11/18/indonesia-promotes-financial-inclusion-with-new-strategy.html.
**OJK. (2016, October 6). Press Release: OJK Drafts Regulations on Fintech Development3
INDONESIA
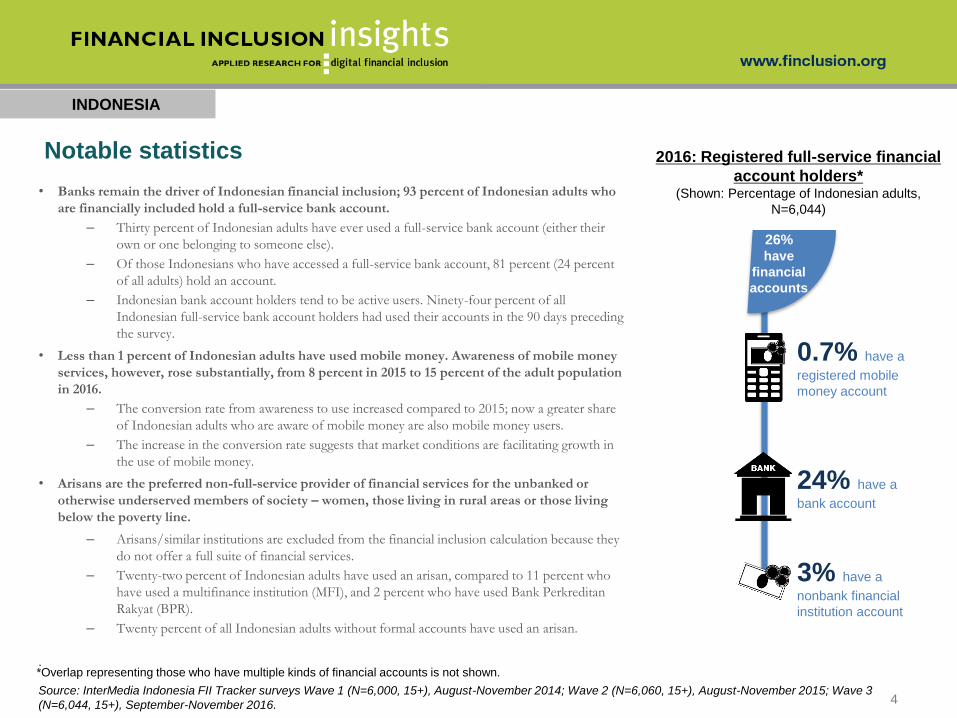
26%have
financial
accounts
3% have a
nonbank financial
institution account
24% have a
bank account
0.7% have a
registered mobile
money account
2016: Registered full-service financial
account holders*(Shown: Percentage of Indonesian adults,
N=6,044)
.
Notable statistics
Source: InterMedia Indonesia FII Tracker surveys Wave 1 (N=6,000, 15+), August-November 2014; Wave 2 (N=6,060, 15+), August-November 2015; Wave 3
(N=6,044, 15+), September-November 2016.
*Overlap representing those who have multiple kinds of financial accounts is not shown.
4
• Banks remain the driver of Indonesian financial inclusion; 93 percent of Indonesian adults who
are financially included hold a full-service bank account.
– Thirty percent of Indonesian adults have ever used a full-service bank account (either their
own or one belonging to someone else).
– Of those Indonesians who have accessed a full-service bank account, 81 percent (24 percent
of all adults) hold an account.
– Indonesian bank account holders tend to be active users. Ninety-four percent of all
Indonesian full-service bank account holders had used their accounts in the 90 days preceding
the survey.
• Less than 1 percent of Indonesian adults have used mobile money. Awareness of mobile money
services, however, rose substantially, from 8 percent in 2015 to 15 percent of the adult population
in 2016.
– The conversion rate from awareness to use increased compared to 2015; now a greater share
of Indonesian adults who are aware of mobile money are also mobile money users.
– The increase in the conversion rate suggests that market conditions are facilitating growth in
the use of mobile money.
• Arisans are the preferred non-full-service provider of financial services for the unbanked or
otherwise underserved members of society – women, those living in rural areas or those living
below the poverty line.
– Arisans/similar institutions are excluded from the financial inclusion calculation because they
do not offer a full suite of financial services.
– Twenty-two percent of Indonesian adults have used an arisan, compared to 11 percent who
have used a multifinance institution (MFI), and 2 percent who have used Bank Perkreditan
Rakyat (BPR).
– Twenty percent of all Indonesian adults without formal accounts have used an arisan.
INDONESIA
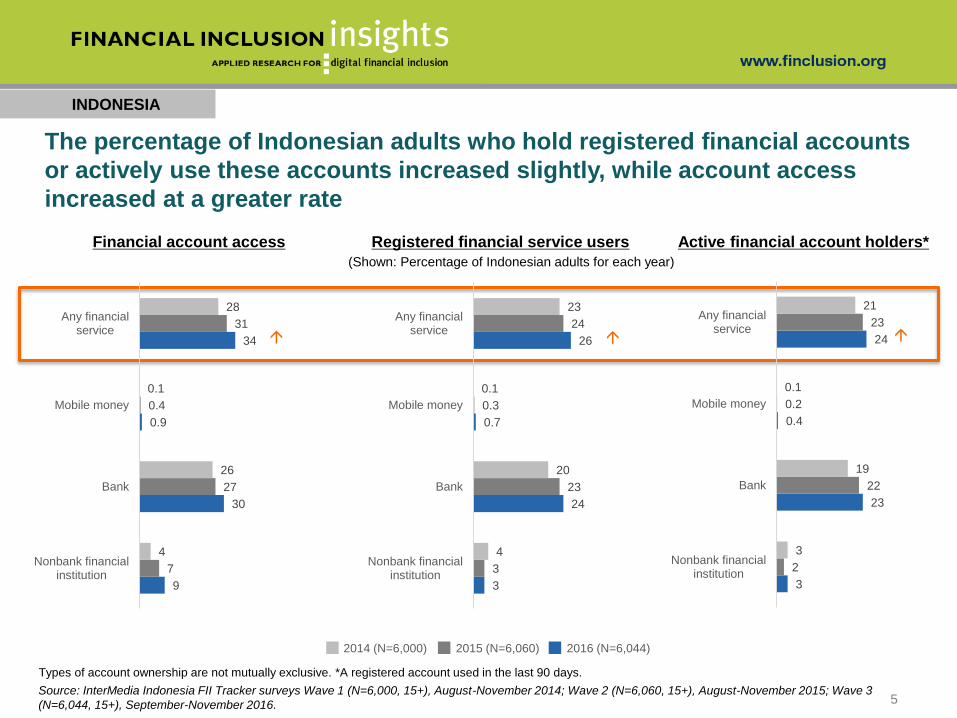
The percentage of Indonesian adults who hold registered financial accounts
or actively use these accounts increased slightly, while account access
increased at a greater rate
Financial account access Registered financial service users
(Shown: Percentage of Indonesian adults for each year)
Active financial account holders*
Types of account ownership are not mutually exclusive. *A registered account used in the last 90 days.
Source: InterMedia Indonesia FII Tracker surveys Wave 1 (N=6,000, 15+), August-November 2014; Wave 2 (N=6,060, 15+), August-November 2015; Wave 3
(N=6,044, 15+), September-November 2016.
2014 (N=6,000) 2015 (N=6,060) 2016 (N=6,044)
9
30
0.9
34
7
27
0.4
31
4
26
0.1
28
Nonbank financialinstitution
Bank
Mobile money
Any financialservice
3
24
0.7
26
3
23
0.3
24
4
20
0.1
23
Nonbank financialinstitution
Bank
Mobile money
Any financialservice
3
23
0.4
24
2
22
0.2
23
3
19
0.1
21
Nonbank financialinstitution
Bank
Mobile money
Any financialservice
5
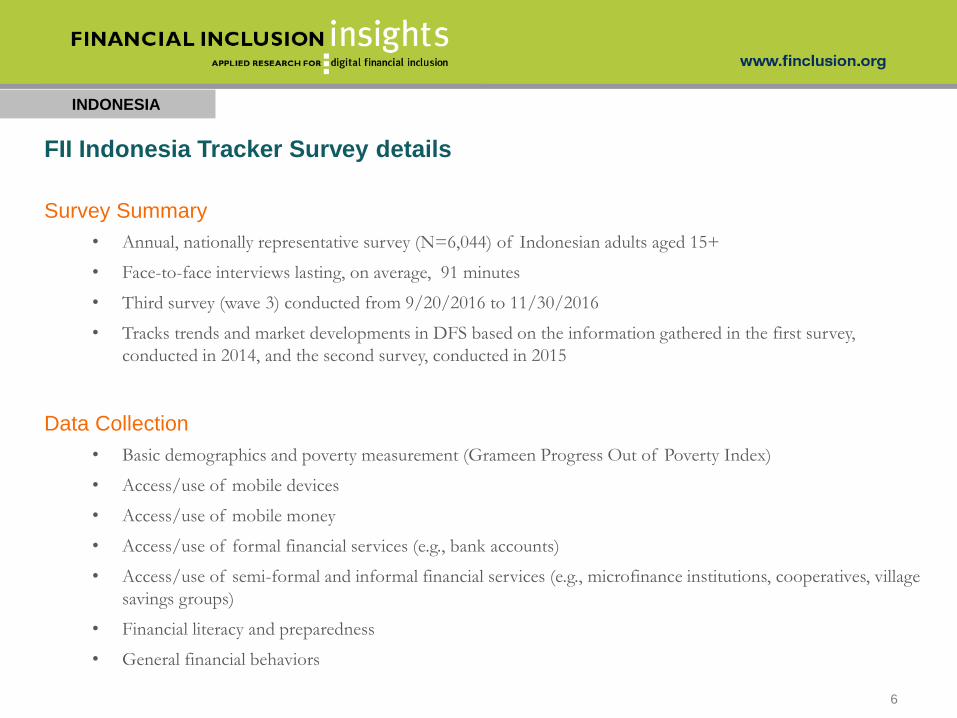
Survey Summary
• Annual, nationally representative survey (N=6,044) of Indonesian adults aged 15+
• Face-to-face interviews lasting, on average, 91 minutes
• Third survey (wave 3) conducted from 9/20/2016 to 11/30/2016
• Tracks trends and market developments in DFS based on the information gathered in the first survey,
conducted in 2014, and the second survey, conducted in 2015
Data Collection
• Basic demographics and poverty measurement (Grameen Progress Out of Poverty Index)
• Access/use of mobile devices
• Access/use of mobile money
• Access/use of formal financial services (e.g., bank accounts)
• Access/use of semi-formal and informal financial services (e.g., microfinance institutions, cooperatives, village
savings groups)
• Financial literacy and preparedness
• General financial behaviors
INDONESIA
FII Indonesia Tracker Survey details
6
INDONESIA
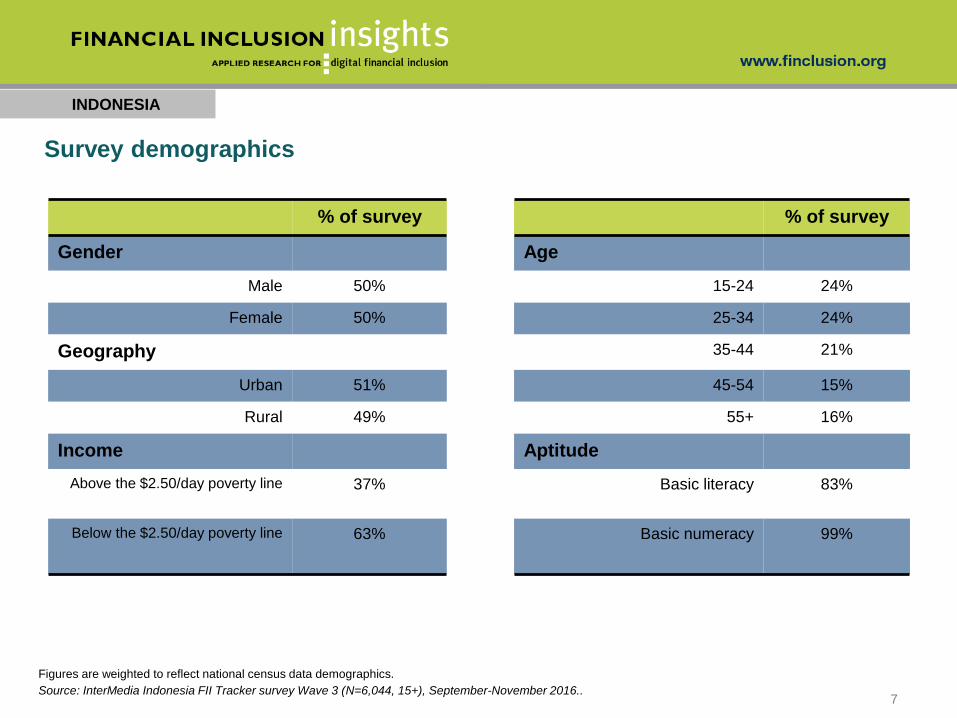
Survey demographics
Figures are weighted to reflect national census data demographics.
Source: InterMedia Indonesia FII Tracker survey Wave 3 (N=6,044, 15+), September-November 2016..
% of survey % of survey
Gender Age
Male 50% 15-24 24%
Female 50% 25-34 24%
Geography 35-44 21%
Urban 51% 45-54 15%
Rural 49% 55+ 16%
Income Aptitude
Above the $2.50/day poverty line 37% Basic literacy 83%
Below the $2.50/day poverty line 63% Basic numeracy 99%
7
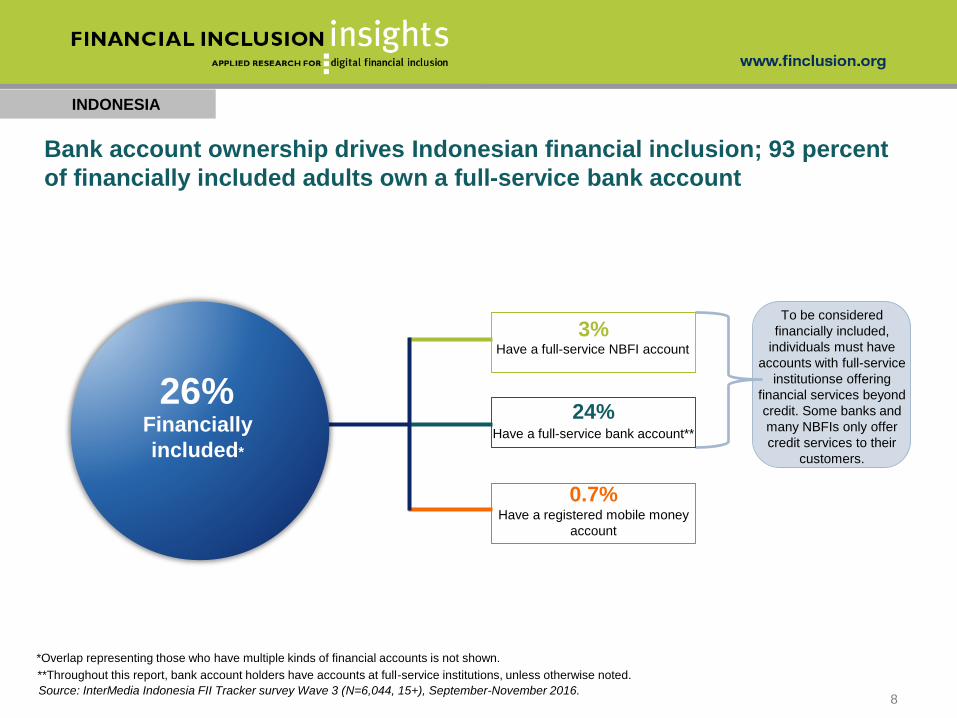
To be considered
financially included,
individuals must have
accounts with full-service
institutionse offering
financial services beyond
credit. Some banks and
many NBFIs only offer
credit services to their
customers.
INDONESIA
Have a full-service NBFI account
Have a full-service bank account**
Have a registered mobile money
account
24%
3%
0.7%
*Overlap representing those who have multiple kinds of financial accounts is not shown.
**Throughout this report, bank account holders have accounts at full-service institutions, unless otherwise noted.
Source: InterMedia Indonesia FII Tracker survey Wave 3 (N=6,044, 15+), September-November 2016.
26%Financially
included*
Bank account ownership drives Indonesian financial inclusion; 93 percent
of financially included adults own a full-service bank account
8

INDONESIA
Access to financial services(Shown: Percentage of Indonesian adults for each year)
Types of accounts are not mutually exclusive.
Source: InterMedia Indonesia FII Tracker surveys Wave 1 (N=6,000, 15+), August-November 2014; Wave 2 (N=6,060, 15+), August-November 2015; Wave 3
(N=6,044, 15+), September-November 2016.
2014 (N=6,000) 2015 (N=6,060) 2016 (N=6,044)
An additional 3 percent of the Indonesian adult population gained access to
financial services between 2015 and 2016
9
30
0.9
34
7
27
0.4
31
4
26
0.1
28
Nonbank financialinstitution
Bank
Mobile money
Any financialservice
9
INDONESIA
Types of accounts are not mutually exclusive.
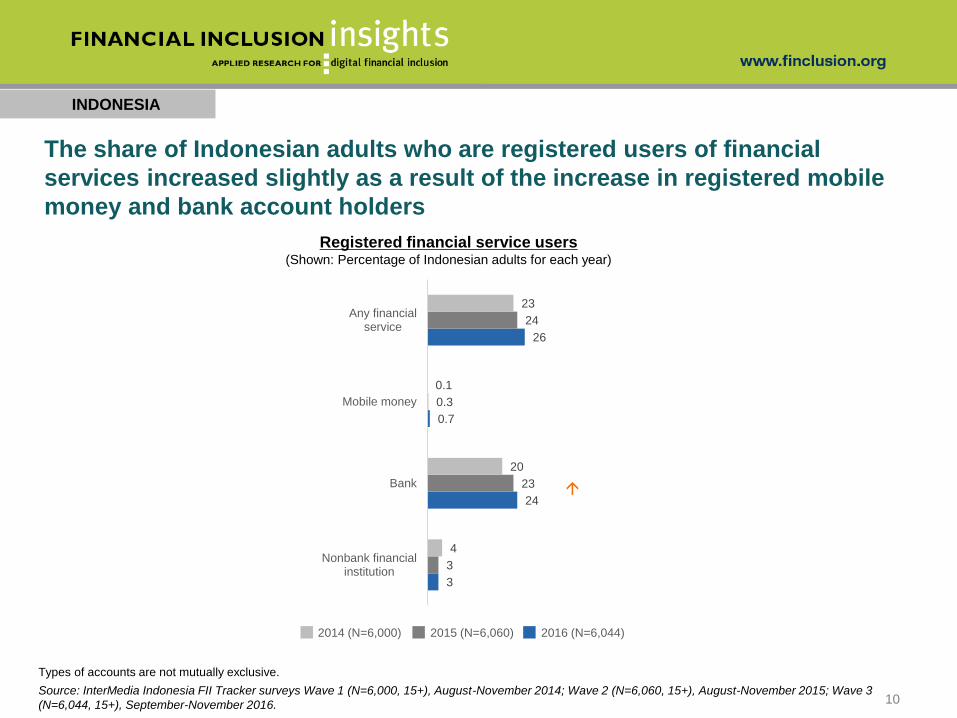
Registered financial service users(Shown: Percentage of Indonesian adults for each year)
Source: InterMedia Indonesia FII Tracker surveys Wave 1 (N=6,000, 15+), August-November 2014; Wave 2 (N=6,060, 15+), August-November 2015; Wave 3
(N=6,044, 15+), September-November 2016.
The share of Indonesian adults who are registered users of financial
services increased slightly as a result of the increase in registered mobile
money and bank account holders
2014 (N=6,000) 2015 (N=6,060) 2016 (N=6,044)
3
24
0.7
26
3
23
0.3
24
4
20
0.1
23
Nonbank financialinstitution
Bank
Mobile money
Any financialservice
10
INDONESIA
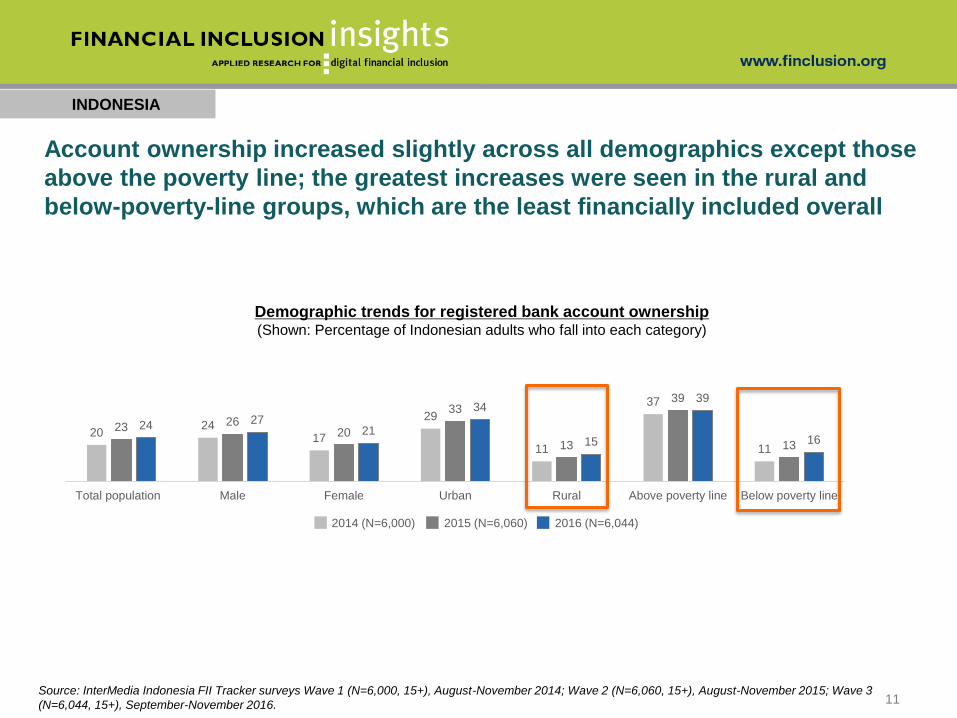
2024
17
29
11
37
11
23 2620
33
13
39
13
24 2721
34
15
39
16
Total population Male Female Urban Rural Above poverty line Below poverty line
Demographic trends for registered bank account ownership (Shown: Percentage of Indonesian adults who fall into each category)
Source: InterMedia Indonesia FII Tracker surveys Wave 1 (N=6,000, 15+), August-November 2014; Wave 2 (N=6,060, 15+), August-November 2015; Wave 3
(N=6,044, 15+), September-November 2016.
2014 (N=6,000) 2015 (N=6,060) 2016 (N=6,044)
Account ownership increased slightly across all demographics except those
above the poverty line; the greatest increases were seen in the rural and
below-poverty-line groups, which are the least financially included overall
11
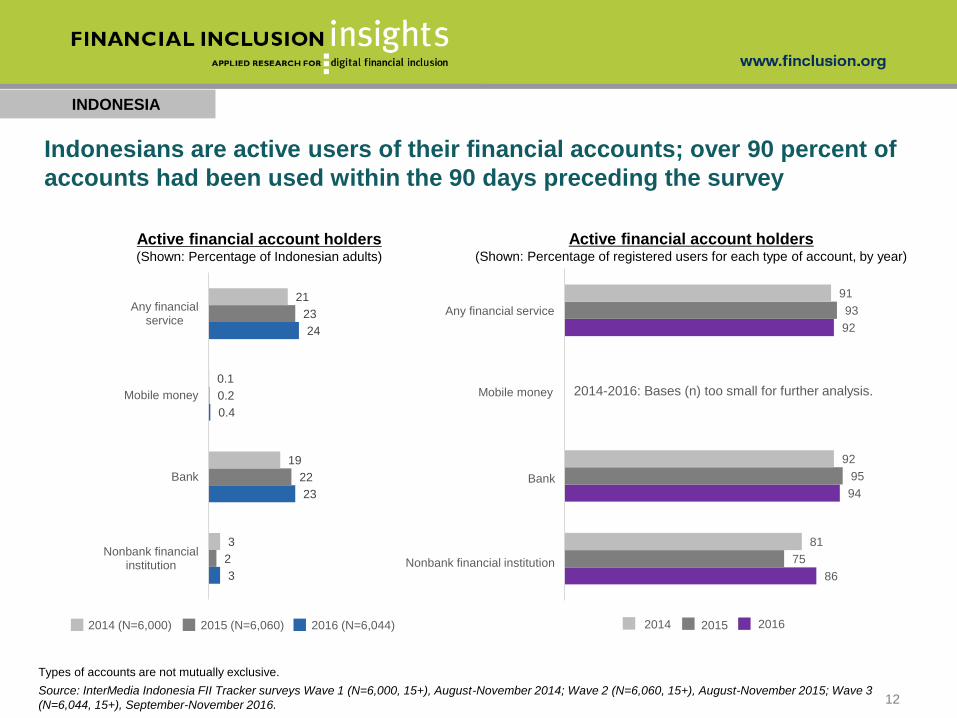
86
94
92
75
95
93
81
92
91
Nonbank financial institution
Bank
Mobile money
Any financial service
INDONESIA
Active financial account holders(Shown: Percentage of Indonesian adults)
Active financial account holders(Shown: Percentage of registered users for each type of account, by year)
2014 2016
Source: InterMedia Indonesia FII Tracker surveys Wave 1 (N=6,000, 15+), August-November 2014; Wave 2 (N=6,060, 15+), August-November 2015; Wave 3
(N=6,044, 15+), September-November 2016.
2014-2016: Bases (n) too small for further analysis.
Any financial service
Bank
Mobile money
Nonbank financial institution
2014 (N=6,000) 2015 (N=6,060) 2016 (N=6,044) 2015
Indonesians are active users of their financial accounts; over 90 percent of
accounts had been used within the 90 days preceding the survey
Types of accounts are not mutually exclusive.
3
23
0.4
24
2
22
0.2
23
3
19
0.1
21
Nonbank financialinstitution
Bank
Mobile money
Any financialservice
12
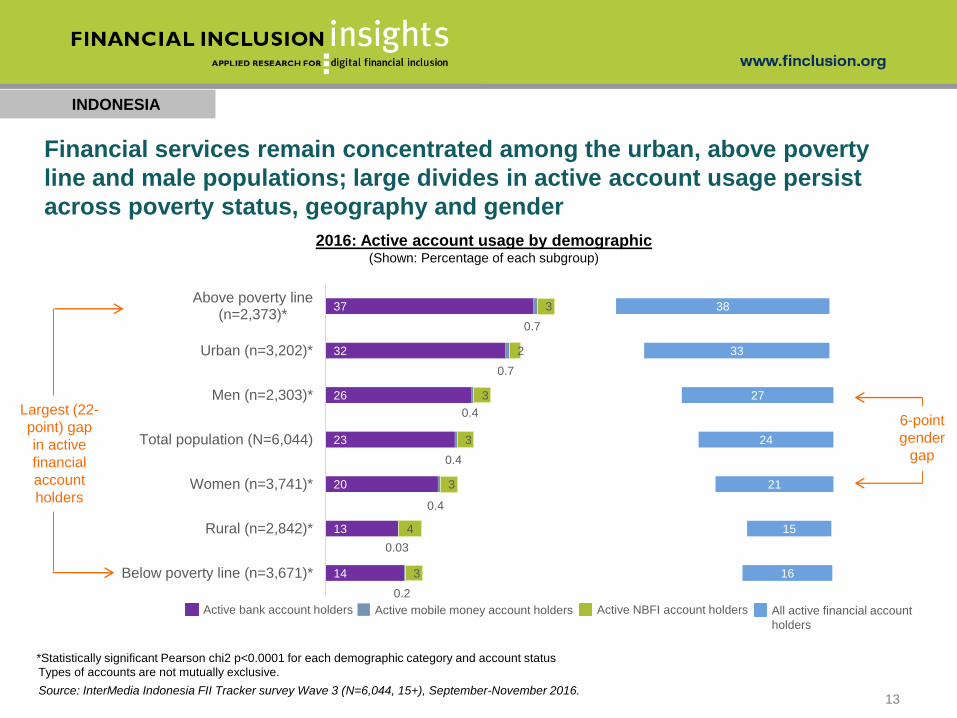
14
13
20
23
26
32
37
0.2
0.03
0.4
0.4
0.4
0.7
0.7
3
4
3
3
3
2
3
16
15
21
24
27
33
38
Below poverty line (n=3,671)*
Rural (n=2,842)*
Women (n=3,741)*
Total population (N=6,044)
Men (n=2,303)*
Urban (n=3,202)*
Above poverty line(n=2,373)*
INDONESIA
2016: Active account usage by demographic(Shown: Percentage of each subgroup)
Types of accounts are not mutually exclusive.
Active mobile money account holders Active NBFI account holdersActive bank account holders All active financial account
holders
Source: InterMedia Indonesia FII Tracker survey Wave 3 (N=6,044, 15+), September-November 2016.
Financial services remain concentrated among the urban, above poverty
line and male populations; large divides in active account usage persist
across poverty status, geography and gender
*Statistically significant Pearson chi2 p<0.0001 for each demographic category and account status
6-point
gender
gap
Largest (22-
point) gap
in active
financial
account
holders
13

INDONESIA
Bank uses, by type(Shown: Percentage of active bank account holders)
.
Due to the changes in the questionnaire some data points may not be directly comparable across years.
28
14
29
6
8
6
65
77
65
2014 (n=1,100)
2015 (n=1,291)
2016 (n=1,302)
Basic activities and P2P onlyAt least one advanced activity
(i.e., bill pay, loan activities)
Basic activities only
(CICO and account management)
Source: InterMedia Indonesia FII Tracker surveys Wave 1 (N=6,000, 15+), August-November 2014; Wave 2 (N=6,060, 15+), August-November 2015; Wave 3
(N=6,044, 15+), September-November 2016.14
Fewer active bank account holders are undertaking advanced banking
activities compared to 2015; however, the majority still use their accounts
for advanced activities
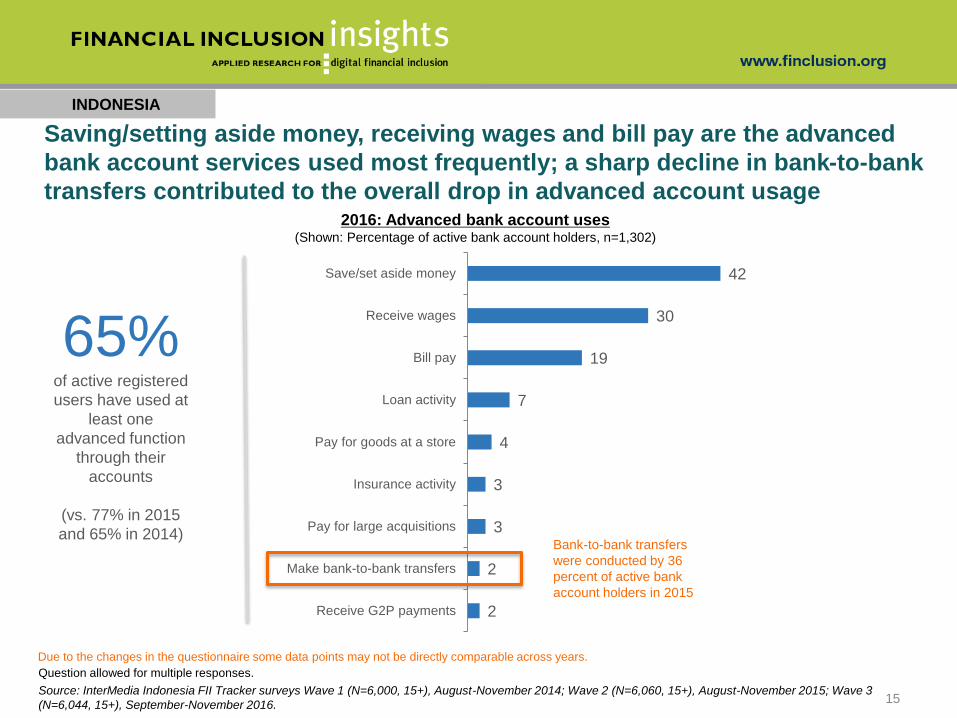
2
2
3
3
4
7
19
30
42
Receive G2P payments
Make bank-to-bank transfers
Pay for large acquisitions
Insurance activity
Pay for goods at a store
Loan activity
Bill pay
Receive wages
Save/set aside money
INDONESIA
2016: Advanced bank account uses(Shown: Percentage of active bank account holders, n=1,302)
65%of active registered
users have used at
least one
advanced function
through their
accounts
(vs. 77% in 2015
and 65% in 2014)
Due to the changes in the questionnaire some data points may not be directly comparable across years.
Question allowed for multiple responses.
Source: InterMedia Indonesia FII Tracker surveys Wave 1 (N=6,000, 15+), August-November 2014; Wave 2 (N=6,060, 15+), August-November 2015; Wave 3
(N=6,044, 15+), September-November 2016.15
Saving/setting aside money, receiving wages and bill pay are the advanced
bank account services used most frequently; a sharp decline in bank-to-bank
transfers contributed to the overall drop in advanced account usage
Bank-to-bank transfers
were conducted by 36
percent of active bank
account holders in 2015
INDONESIA
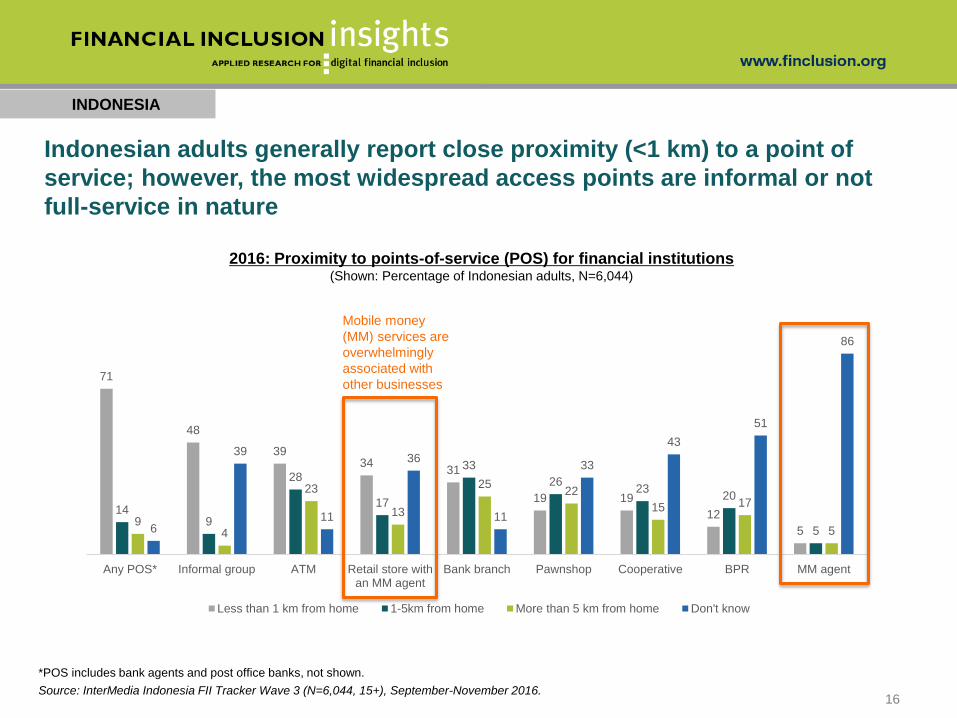
2016: Proximity to points-of-service (POS) for financial institutions(Shown: Percentage of Indonesian adults, N=6,044)
*POS includes bank agents and post office banks, not shown.
Indonesian adults generally report close proximity (<1 km) to a point of
service; however, the most widespread access points are informal or not
full-service in nature
71
48
3934
31
19 19
12
5
149
28
17
33
2623
20
59
4
23
13
2522
15 17
56
39
11
36
11
33
43
51
86
Any POS* Informal group ATM Retail store withan MM agent
Bank branch Pawnshop Cooperative BPR MM agent
Less than 1 km from home 1-5km from home More than 5 km from home Don't know
Mobile money
(MM) services are
overwhelmingly
associated with
other businesses
Source: InterMedia Indonesia FII Tracker Wave 3 (N=6,044, 15+), September-November 2016.16
INDONESIA
2015
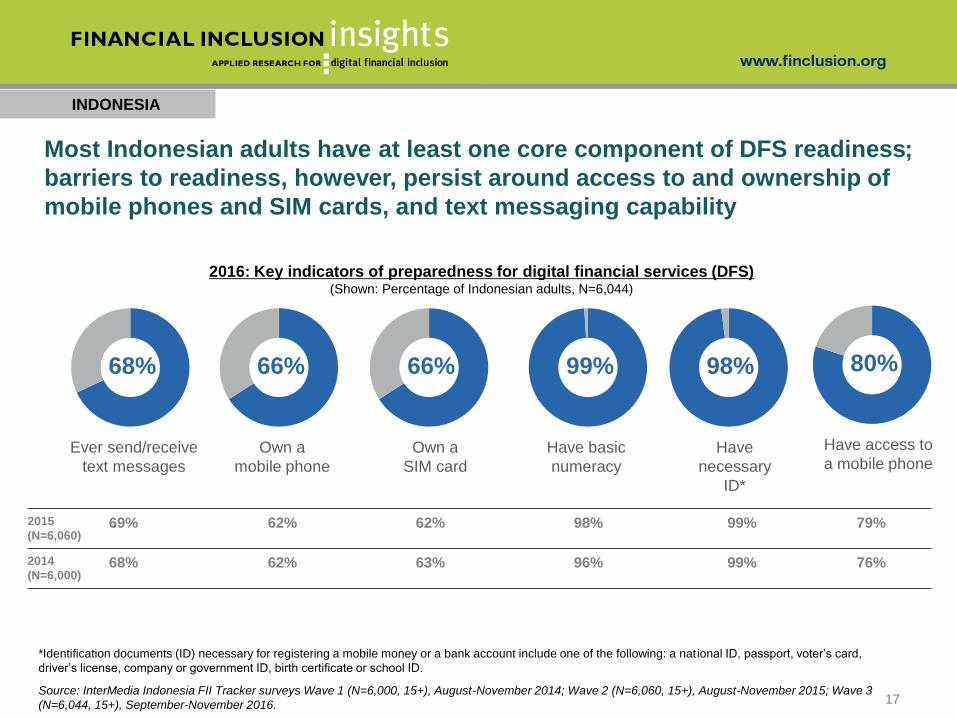
(N=6,060)69% 62% 62% 98% 99% 79%
2014
(N=6,000)68% 62% 63% 96% 99% 76%
80%
Have access to
a mobile phone
68%
Ever send/receive
text messages
99%
Have basic
numeracy
98%
Have
necessary
ID*
66%
Own a
SIM card
66%
Own a
mobile phone
*Identification documents (ID) necessary for registering a mobile money or a bank account include one of the following: a national ID, passport, voter’s card,
driver’s license, company or government ID, birth certificate or school ID.
Source: InterMedia Indonesia FII Tracker surveys Wave 1 (N=6,000, 15+), August-November 2014; Wave 2 (N=6,060, 15+), August-November 2015; Wave 3
(N=6,044, 15+), September-November 2016.
Most Indonesian adults have at least one core component of DFS readiness;
barriers to readiness, however, persist around access to and ownership of
mobile phones and SIM cards, and text messaging capability
2016: Key indicators of preparedness for digital financial services (DFS)(Shown: Percentage of Indonesian adults, N=6,044)
17
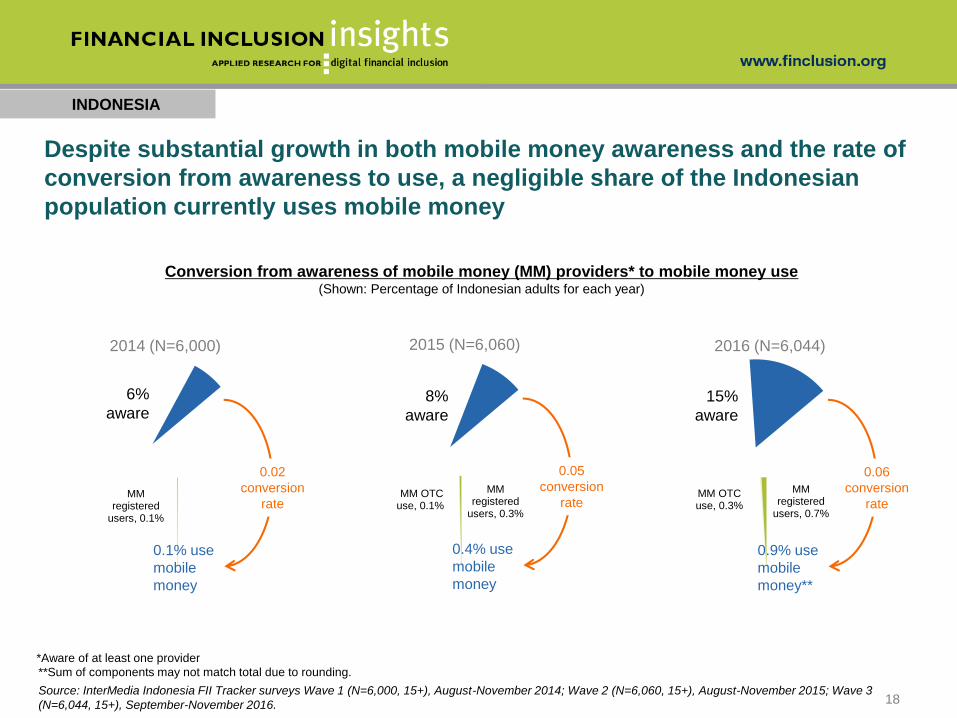
MM OTC use, 0.1%
MM registered
users, 0.3%
INDONESIA
2014 (N=6,000) 2015 (N=6,060)
MM registered
users, 0.1%
0.02
conversion
rate
6%
aware
0.1% use
mobile
money
0.05
conversion
rate
8%
aware
0.4% use
mobile
money
MM OTC use, 0.3%
MM registered
users, 0.7%
2016 (N=6,044)
0.06
conversion
rate
15%
aware
0.9% use
mobile
money**
Despite substantial growth in both mobile money awareness and the rate of
conversion from awareness to use, a negligible share of the Indonesian
population currently uses mobile money
Conversion from awareness of mobile money (MM) providers* to mobile money use(Shown: Percentage of Indonesian adults for each year)
Source: InterMedia Indonesia FII Tracker surveys Wave 1 (N=6,000, 15+), August-November 2014; Wave 2 (N=6,060, 15+), August-November 2015; Wave 3
(N=6,044, 15+), September-November 2016.
**Sum of components may not match total due to rounding.
*Aware of at least one provider
18
INDONESIA
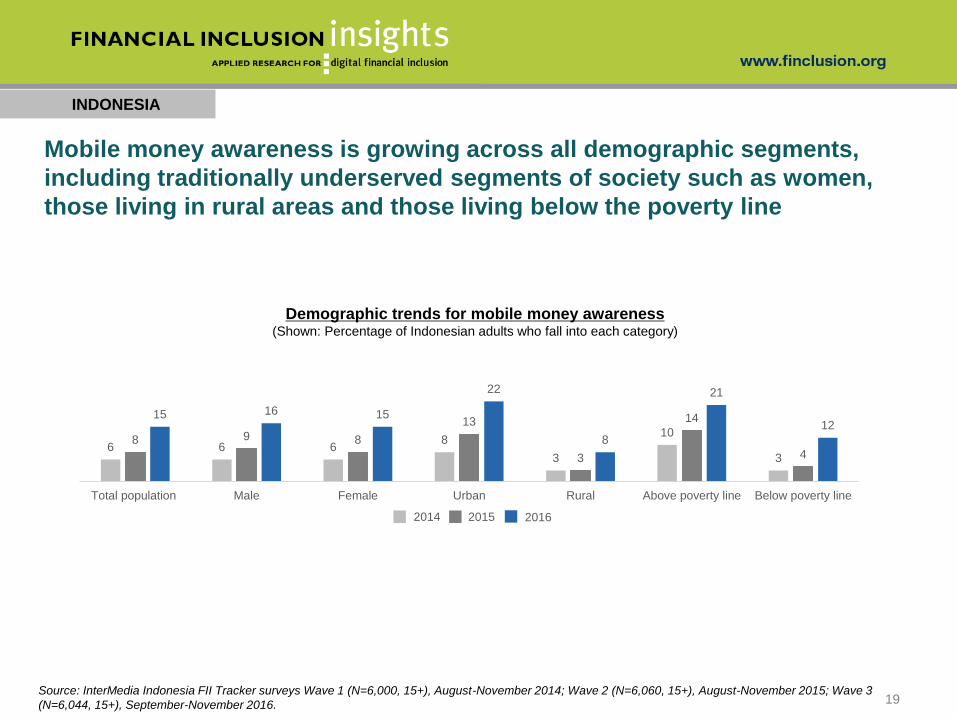
6 6 68
3
10
3
8 9 8
13
3
14
4
15 16 15
22
8
21
12
Total population Male Female Urban Rural Above poverty line Below poverty line
2014 2015 2016
Mobile money awareness is growing across all demographic segments,
including traditionally underserved segments of society such as women,
those living in rural areas and those living below the poverty line
Demographic trends for mobile money awareness(Shown: Percentage of Indonesian adults who fall into each category)
Source: InterMedia Indonesia FII Tracker surveys Wave 1 (N=6,000, 15+), August-November 2014; Wave 2 (N=6,060, 15+), August-November 2015; Wave 3
(N=6,044, 15+), September-November 2016. 19
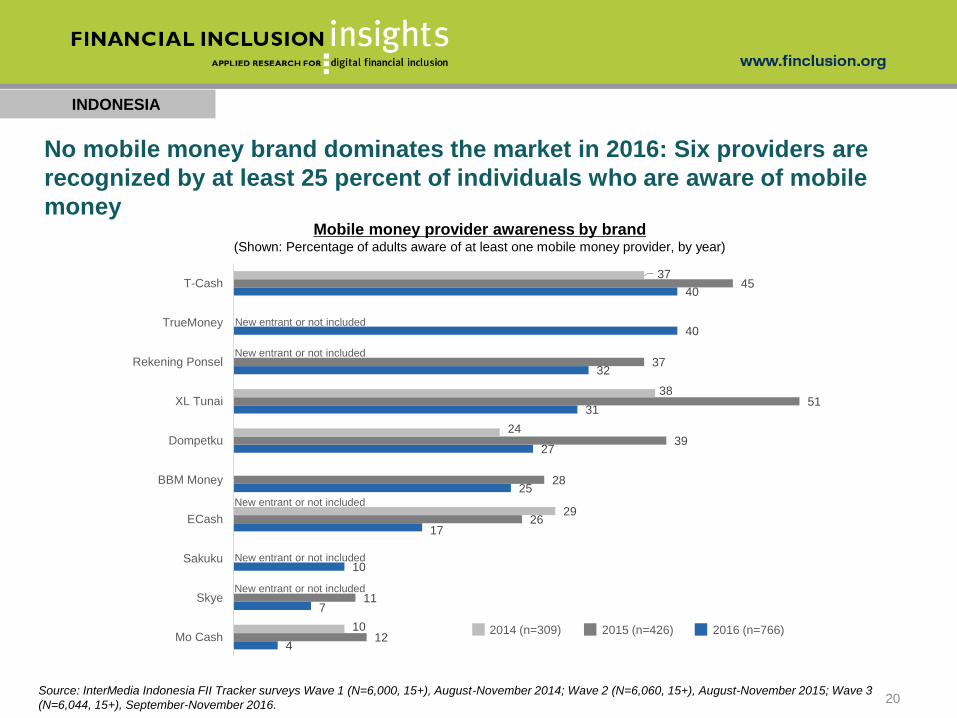
4
7
10
17
25
27
31
32
40
40
12
11
26
28
39
51
37
45
10
29
24
38
37
Mo Cash
Skye
Sakuku
ECash
BBM Money
Dompetku
XL Tunai
Rekening Ponsel
TrueMoney
T-Cash
New entrant or not included
New entrant or not included
New entrant or not included
New entrant or not included
New entrant or not included
INDONESIA
Mobile money provider awareness by brand(Shown: Percentage of adults aware of at least one mobile money provider, by year)
Source: InterMedia Indonesia FII Tracker surveys Wave 1 (N=6,000, 15+), August-November 2014; Wave 2 (N=6,060, 15+), August-November 2015; Wave 3
(N=6,044, 15+), September-November 2016.
2014 (n=309) 2015 (n=426) 2016 (n=766)
20
No mobile money brand dominates the market in 2016: Six providers are
recognized by at least 25 percent of individuals who are aware of mobile
money

INDONESIA
Question allowed for multiple responses. Not all response options shown.
Source: InterMedia Indonesia FII Tracker survey Wave 3 (N=6,044, 15+), September-November 2016.
2014 (n=305) 2015 (n=401) 2016 (n=727)
21
A lack of understanding of the purpose and use(s) of mobile money drives
nonuse among those who are aware of mobile money
4
4
14
40
2
4
14
28
2
8
12
27
I do not trust thatmy money is safe
I never have moneyto make
transactions withthe service
I don't need (anaccount), I don't
make anytransactions
I don't know what itis for
Top reasons for mobile money nonuse among MM-aware individuals(Shown: Percentage of Indonesian adults who are aware, but do not use, MM by year)
INDONESIA
22
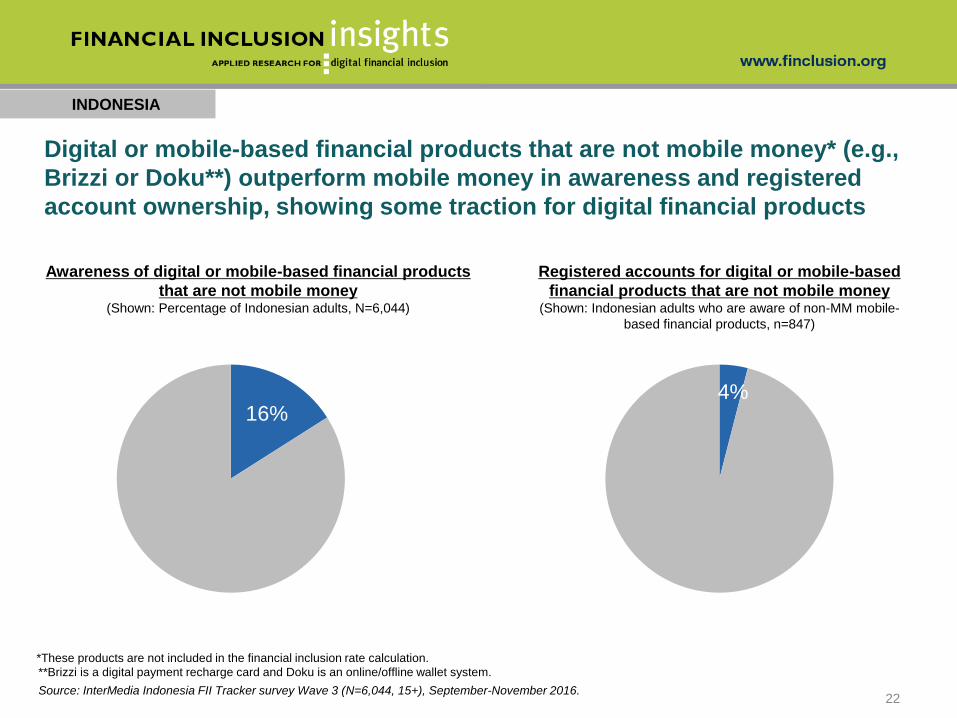
Digital or mobile-based financial products that are not mobile money* (e.g.,
Brizzi or Doku**) outperform mobile money in awareness and registered
account ownership, showing some traction for digital financial products
16%
Awareness of digital or mobile-based financial products
that are not mobile money(Shown: Percentage of Indonesian adults, N=6,044)
Registered accounts for digital or mobile-based
financial products that are not mobile money(Shown: Indonesian adults who are aware of non-MM mobile-
based financial products, n=847)
4%
Source: InterMedia Indonesia FII Tracker survey Wave 3 (N=6,044, 15+), September-November 2016.
**Brizzi is a digital payment recharge card and Doku is an online/offline wallet system.
*These products are not included in the financial inclusion rate calculation.
INDONESIA
23
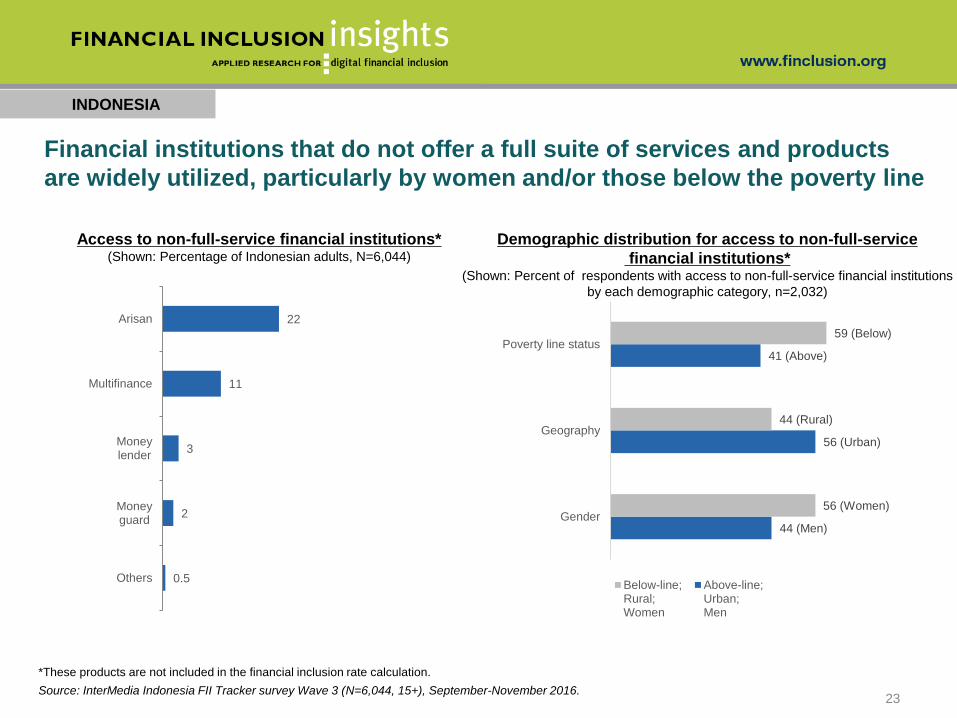
Financial institutions that do not offer a full suite of services and products
are widely utilized, particularly by women and/or those below the poverty line
Source: InterMedia Indonesia FII Tracker survey Wave 3 (N=6,044, 15+), September-November 2016.
Access to non-full-service financial institutions*(Shown: Percentage of Indonesian adults, N=6,044)
0.5
2
3
11
22
Others
Moneyguard
Moneylender
Multifinance
Arisan
Demographic distribution for access to non-full-service
financial institutions*(Shown: Percent of respondents with access to non-full-service financial institutions
by each demographic category, n=2,032)
44 (Men)
56 (Urban)
41 (Above)
56 (Women)
44 (Rural)
59 (Below)
Gender
Geography
Poverty line status
Below-line;Rural;Women
Above-line;Urban;Men
*These products are not included in the financial inclusion rate calculation.
INDONESIA
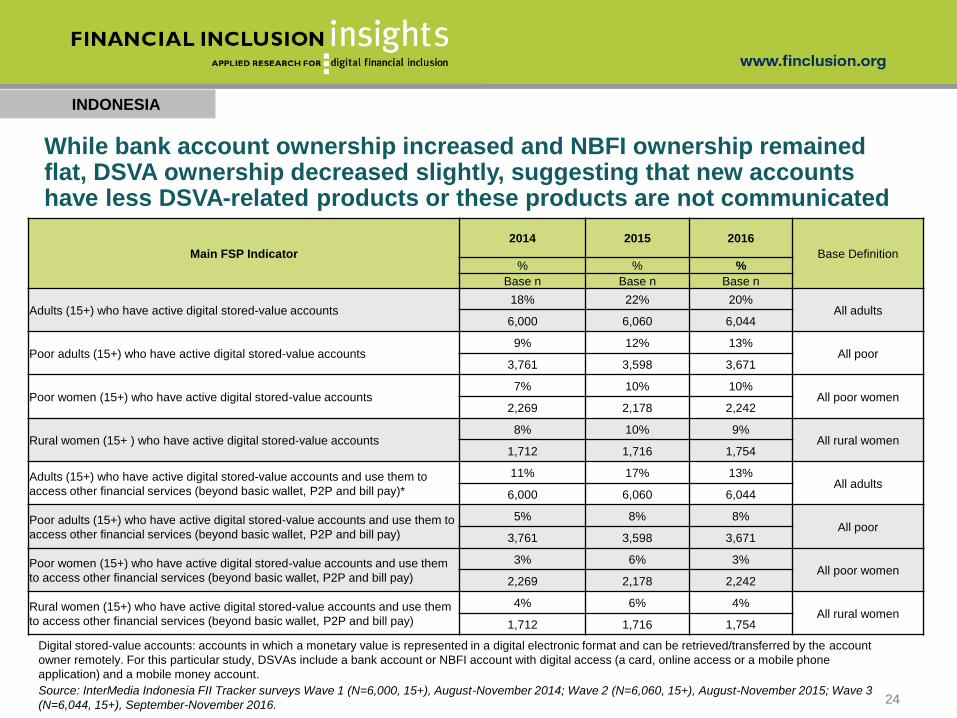
Digital stored-value accounts: accounts in which a monetary value is represented in a digital electronic format and can be retrieved/transferred by the account
owner remotely. For this particular study, DSVAs include a bank account or NBFI account with digital access (a card, online access or a mobile phone
application) and a mobile money account.
Main FSP Indicator
2014 2015 2016
Base Definition% % %
Base n Base n Base n
Adults (15+) who have active digital stored-value accounts18% 22% 20%
All adults6,000 6,060 6,044
Poor adults (15+) who have active digital stored-value accounts9% 12% 13%
All poor3,761 3,598 3,671
Poor women (15+) who have active digital stored-value accounts7% 10% 10%
All poor women2,269 2,178 2,242
Rural women (15+ ) who have active digital stored-value accounts 8% 10% 9%
All rural women1,712 1,716 1,754
Adults (15+) who have active digital stored-value accounts and use them to
access other financial services (beyond basic wallet, P2P and bill pay)*
11% 17% 13%All adults
6,000 6,060 6,044
Poor adults (15+) who have active digital stored-value accounts and use them to
access other financial services (beyond basic wallet, P2P and bill pay)
5% 8% 8%All poor
3,761 3,598 3,671
Poor women (15+) who have active digital stored-value accounts and use them
to access other financial services (beyond basic wallet, P2P and bill pay)
3% 6% 3%All poor women
2,269 2,178 2,242
Rural women (15+) who have active digital stored-value accounts and use them
to access other financial services (beyond basic wallet, P2P and bill pay)
4% 6% 4%All rural women
1,712 1,716 1,754
Source: InterMedia Indonesia FII Tracker surveys Wave 1 (N=6,000, 15+), August-November 2014; Wave 2 (N=6,060, 15+), August-November 2015; Wave 3
(N=6,044, 15+), September-November 2016.
While bank account ownership increased and NBFI ownership remained flat, DSVA ownership decreased slightly, suggesting that new accounts have less DSVA-related products or these products are not communicated
24
For more information, contact:
Alex Moler, Research Manager [email protected]
Sam Schueth, Director of Research [email protected]