indonesia’s education for all - home |...
TRANSCRIPT

National Plan of Action
INDONESIA’S
EDUCATION FOR ALL
2003/2015
(DRAFT)

National Coordination Forum Education for All 2003
2
CHAPTER 2 EARLY CHILDHOOD EDUCATION AND CARE
1. Introduction
Early childhood is a period of development and growth that is very influential for the future of a nation. Various studies show that early childhood development can improve academic achievement and productivity in later period of life. Erickson who traced children’s development from infancy to adulthood concluded that “childhood provides an early picture of an adult human being. Different behaviors in adults may be detected in childhood.” Psychologists are of the opinion that pre-school development stage from the ages of 2 to 5 are the most important stage of all the development stages. It is at this stage that the foundation for the complex behavioral structure is laid.
Children are an essential capital for the development of a nation’s human resources. Neuroscience research shows that the fastest development of human brain takes place within the first years of human life. Until the age of 4, a child’s intelligence has developed by 50%, and by the age of 8, it has increased to 80%. Hence, the early childhood age is also called the golden age as it is at this stage of development that most of the brain cell tissues that control human activities and qualities are formed. Optimal brain development can be stimulated by providing sufficient nutrition, health care, and education that stimulates creativity. As every development stage takes place only once in a lifetime, developmental deprivation in the golden age means a great loss of a lifetime.
As a participant of the World Summit for Children (WSC) held by the United Nations on September 30, 1990, Indonesia is committed to providing a better future for children, which includes improving children’s health and nutrition, ensuring that children receive proper education, providing children with the opportunity to find their identity and instill awareness of their value in a secure and supportive environment through the family.
The optimal care as part of an intervention program to guarantee children’s life sustainability, growth, protection and participation will form a strong basis for the development of human capacity. Human resources hold a strategic role in a nation’s effort to position itself among other nations. Relevant to this, educational intervention to early childhood which has been implemented in a number of developed countries should immediately be implemented and widely socialized so that children from conception to the age of 6 receive early education services. This policy is consistent with the effort to improve the quality of human resources in preparation for a more competitive era of the future. Statistics shows that the number of Indonesian children who has received pre-school educational services, both from school and out of school, is still very low. Out of 12.6 million children of the ages of 4 to 6, only about 1.7 million (13%) have received pre-school educational services. This means that 10.9 million children (87%) have not received pre-school education. This condition may be related to the results of a study conducted by the Research and Development Bureau of the Ministry of National Education in 1997 revealing a far higher percentage of repeating students in early grades (6.57%) than that of Junior High School’s level (0.51%). Children’s unreadiness for
National Coordination Forum Education for All 2003
3
school education that results from the lack of stimulation received in their early age is believed to be the main predictor of this situation. The results of this study also show that, in addition to its significance to academic achievement, early childhood education also drives a high economic return booster as an impact of a low social cost, high work productivity and higher level of endurance.
Realizing that one’s success is closely related to the development of intellectual readiness and emotional, social, spiritual, and psychomotor maturity since an early age, it is deemed necessary that children be developed from an early age. The Indonesian government’s serious commitment to early childhood education is evidenced in the various regulations on early childhood educational services that it has issued, e.g. the amended 1945 Constitution, 1998 Guidelines of the State’s Policy (GBHN), Law number 4 of 1979 on Children’s Welfare, Law number 2 of 1989 on the National Education System, and Government Regulation number 27 of 1990 on Pre-school Education. The Indonesian government through the Presidential Decree number 36 of 1990 dated August 25th, 1990, has also ratified the Convention on Children’s Rights, in which one of its points states that every child has the right for protection, care, and education. The Indonesian government has also taken part in various conventions, e.g. “Millennium Development Goals”, “A World Fit for Children” and “World Declaration for Children 1990”. As a member of the UNESCO, Indonesia has also consented to the Dakar Framework for Action – April 2000 in which one of its statements declares the importance of “the expansion and improvement of the overall care and education for Young Children, especially for those who are vulnerable and deprived”.
2. Situational Analysis of Early Childhood Services, Care, and Education
2.1 Dakar Target : “Expansion and improvement of the overall care and education for Young Children, especially for those who are disadvantaged in the many aspects of life”
Early Childhood Education is an effort to provide educational services in an environment influential on a child’s developmental processes (family, school, child care institution) with the purpose of preparing children for basic education. Early Childhood Care is another effort in the provision of care, protection, and support for children against the threats of diseases, malnutrition, abuse, neglect, and other acts that prevent children’s needs --physical, emotional, or social -- from being properly fulfilled.
Comprehensive care and education expansion and improvement has the objective of first, providing an extensive opportunity for young children to receive care and education as part of their basic rights so that they may grow properly; second, improving the quality of care and education for young children in an effort to provide a more optimum service; third, providing opportunities to young to be happy at home, school, and in society.
National Coordination Forum Education for All 2003
4
2.2 Indicators
a) Care Performance Indicator for young children is a proportion of the number of 0 – 6 year-old children receiving care services to the overall population of children of that age range.
0-6 children receiving services from the care program Care Performance: 0-6. children population
x 100
b) Educational Performance Indicator for young children is a proportion of the number of children aged 0 to 6 receiving educational services to the whole population of children in this age group.
0-6 children receiving services from the education program Education Performance: 0-6 children population
x 100
2.3 Early Childhood Care Services and Education Programs
2.3.1 Access
a) Care Services
• POSYANDU (Integrated Health Services Center)
Health and nutrition services for children are provided both by the government through the “PUSKESMAS” (Community Health Center) and by the community through the “POSYANDU” (Integrated Health Services Center). POSYANDU is a welfare means for mother and child that functions as a center providing an integrated service of health and nutrition, especially for expecting mothers and children aged 0-5 years. POSYANDU is an activity from the community, for the community, and by the community with supervision from a medical personnel. POSYANDU activities are aimed at supporting the healthy growth and development of children in general. It is a monthly activity which includes weighing and distribution of vitamins and supplementary foods. Immunization as well as child and maternity health services is given by the medical personnel. In the case where further medical services are needed, patients are sent to the Community Medical Center (PUSKESMAS). POSYANDU is developed as a means to fulfill the needs of parents and young children. Specifically this center is designed to achieve the following objectives: (1) to monitor child growth and development; (2) to provide oral rehydration; (3) to promote breast-feeding (ASI); (4) to administer immunization for children; (5) to educate the mothers; (6) to provide supplementary foods for children (PMT); and (7) to improve family nutrition (UPGK).
The POSYANDU Program constitutes a basic intervention that is preventive in nature by providing services to improve the health and nutrition of children under five years old. The POSYANDU’s most important programs are (1) Expanded Immunization Program which provides immunizations against tetanus, typhus, diphtheria, polio, and measles; (2) Diarrhea Control Program of which the purpose is to abate diarrhea by providing oral rehydration therapy, and (3) Intervention Program which takes the form of supervision/maintenance of child growth and development and nutrition education in which vitamin A, iron, iodine are given to children and the mothers. All these programs are part of the community’s monthly activities where mothers take their children to the

National Coordination Forum Education for All 2003
5
center to receive those services from the health personnel with the help of trained cadres/volunteers. These activities may take place at the house of the village head, the village hall, a meeting hall, or any other place that suits the need.
In an effort to support the development of POSYANDU, Padjadjaran University in cooperation with the World Health Organization (WHO), Collaborating Center for Prenatal Care, Maternal and Child Health is conducting a pilot project with the objective of giving an educational touch to children through a program called “Taman POSYANDU” (POSYANDU Garden). As a community empowerment project, the so called ADITUKA Project is implemented with the purpose of (a) improving the mother and child life sustainability program in maintaining the quality of pregnancy; (b) reducing the prevalence of malnutrition and mal-micronutrient in mothers and young children; (c) improving the psychosocial development stage of young children and preparing children for school. Therefore, in the future POSYANDU is expected to be truly functional as an integrated health services center for young children. It should provide services on nutrition, health, and psychosocial aspects of their development while at the same time it is also a playground for the children.
The leading sector for the development of POSYANDU lies with the Ministry of Home Affairs while the technical responsibility lies with the Ministry of Health. The operational guidance, meanwhile, is to be provided by the Family Empowerment and Welfare Motivational Team (TP-PKK) of the central government down to the lowest administrative unit of Neighborhood Association (Rukun Tetangga/RT).
• Children Daycare Center (TPA)
TPA or Children Daycare Center is a social welfare unit that functions as a limited time family substitute for children whose parents are working. The target of Children Daycare Center (TPA) services are children of the ages of 3 months to 6 years or until the child is ready to be left at home (at the age of 7 or 8). A child is usually staying at the Daycare Center for 8 to 10 hours per day for 5 to 6 days a week.
In general the Children Daycare Center (TPA) is established with the purpose of providing children with the social welfare services to help them grow and develop healthily appropriate to their developmental stage. Specifically, the Children Daycare Center aims at (1) providing children with the opportunity to get the necessary upbringing, care, socialization guidance, and optimal education to ensure their life sustainability and growth; (2) protecting children from being abused or receiving other kinds of treatment that will disturb or threaten their life sustainability, growth, and personality development; (3) helping the parents (family) in carrying out the eight functions of a family, especially carrying out child welfare development function within and outside the family; (4) helping parents who have children under five years old to feel peace of mind in carrying out their duties to accomplish optimal achievement in their job; (5) to educate the society, in particular parents who have no opportunity in giving guidance and care for their infants, on the importance of social welfare services for children under five years of age.
The Children Daycare Center (TPA) provides various services. The educational services are provided in the forms of care, upbringing, education and health services. Parents services are given in the forms of family consultation, social counseling on children welfare programs which covers topics such as children growth and development and pre-
National Coordination Forum Education for All 2003
6
school education. Community services are given in the form of social counseling on the importance of children upbringing, care, and education, infant socialization, and the role of Children Daycare Center. In addition to these, as part of its community service program, TPA also provides research and job training facilities for college students and the community in general.
There are four approaches in the implementation of Children Daycare Center (TPA) programs. The Survival Approach focuses on fulfilling the children’s needs for life sustainability and growth such as providing foods and health care. The Developmental Approach focuses on developing the children’s creativity and initiative potentials and their personality development. The Preventive Approach aims at preventing the aberration of growth and personality development.
In general, the Children Daycare Center (TPA) currently developing in the society can be categorized into two different types. The first type that develops in the lower level of the society, such as those in the market, hospital and social institutions, generally functions only as a daycare center. The second type that develops in the middle to the upper class of the society serves more than just a daycare center. It also functions as an educational institution equipped with various facilities and are commonly found in large urban centers where a daycare center has become a necessity.
There are four indicators for the success of the TPA program First is the increase in the number of children served. Second, the increase in the number of TPAs. Third, the increase in the number of organizations that administer TPA, and fourth the society’s acceptance of this program as indicated by the support and assistance that this program has received
Two ministries supervise the implementation of this program, i.e. the Ministry of Social Affairs and the Ministry of National Education. The Ministry of Social Affairs is responsible for the children welfare aspect and the Ministry of National Education is responsible for the educational aspect. Other ministries may administer TPA on the condition that they refer to the guidelines set by the Ministry of National Education. TPA is commonly organized by a foundation or an NGO. Only a small number is organized by the government.
b) Educational Services
• Development of Family with Infants (Bina Keluarga Balita – BKB)
BKB is an activity that is carried out by the society with the purpose of providing the necessary knowledge and skills to parents and other family members on how to promote optimal infant growth and monitor their growth and development. BKB also serves as a means for parents and other family members to improve their understanding and ability to provide care and education to their children. The main target of BKB is families with infants and pre-school children (ages 0 to 6 years).
As an organization, BKB is a group whose membership is parents who have children aged 0 to 6 years. BKB is a non government organization (NGO) whose management is carried out by its cadres. A BKB cadre is usually also a cadre of POSYANDU (Integrated Health

National Coordination Forum Education for All 2003
7
Services Center). In many places BKB activities have even been integrated with those of the POSYANDU.
The BKB program has the general objective of empowering families in providing care to their infants in order to help realize quality, competitive, and religious human resources. Specifically, this program is aimed at (a) improving the knowledge, attitude and awareness of family members on the importance of providing care to infants, (b) improving the society’s knowledge, concern, and participation in providing care to infants, (c) improving the quality of managers, administrators, and cadres in providing services to infants, and (d) making the efforts to achieve optimal infant growth through interactions between parents and children.
The direct target of BKB are parents/families who have children under five years old, while indirectly it also targets the BKB managers, administrators, and cadres, community and religious leaders, non government organizations (NGO), professional organizations, the private sector, and the local government administration.
BKB activities essentially center on providing holistic services for the development of children under five years old which cover four aspects, i.e. (1) health (infants’ physical strength and health that affect their growth and fitness), (2) nutrition status (the nutrition that infants need for the continuous development of their brain cells from prenatal period until the ages of 3 to 5 years), (3) psychosocial (mental, emotional, social, and spiritual stimulation that infants need for the development of their personality), and (4) elementary skills training.
Parents’ role in the development of children under five years old is very important. Therefore, through this program it is expected that parents will have a healthy concept of themselves that will prepare them to receive counseling to improve their knowledge and skills in providing care and guidance for their infant children appropriate to the children’s age and abilities. In addition to this, parents will also need to know how to communicate harmoniously with their children to be able to apply an effective care pattern.
Relevant to the development of BKB program for families who have children of ages 5 – 6 years old, an educational/counseling program that helps parents and other family members prepare their children for primary school has also been established. This program, called BKB Kesiapan Masuk Sekolah (BKB Kemas ) or Infants’ Family Development Program for Schooling Readiness, involve both parents and their children (aged 5 – 6), so that the children can get used to the school learning atmosphere.
Responsibilities for the BKB program lies with the Ministry of Women Empowerment which formulates the overall policy for BKB. The operational responsibilities, meanwhile, rest with National Coordinating Body for Family Planning (BKKBN). Activities include counseling and home visit.

National Coordination Forum Education for All 2003
8
• Taman Kanak-kanak/TK (Kindergarten)
TK or kindergarten is a preschool education for children of the ages of four to six years old prior to entering primary education (Government Regulation No. 27 of 1990). Kindergarten is established with the objective of helping to lay the foundation for the development of children’s attitude, behavior, knowledge, skills, and creativity that will be needed for their subsequent growth and development (The Minister of Education and Culture Ministerial Decree No. 0486/U/1992, Chapter II, Article 3, Paragraph 1). This type of education is expected to prepare children for primary education. TK or kindergarten targets children of the ages of 4 to 6 years old, who are classified two study groups according to their ages, i.e. group A for children of the ages of 4 to 5, and group B for the children of the ages of 5 to 6.
TK functions to provide educational services for children aged 4 to 6 with the objective of (a) developing the children’s overall potentials which include Pancasila morality, religion, discipline, language skills, logic, creativity, emotion, socialization skills, and physical skills appropriate to their developmental stage; (b) instilling good conduct through daily habituation, (c) introducing children to the world around them, (d) developing children’s socialization skills, (e) introducing children to rules and instilling in them discipline, and (f) providing children with the opportunity to play and learn or learn and play.
TK is given the tasks of (a) administering teaching and learning activities in accordance with the existing Learning Activity Program (PKB), (b) providing guidance and counseling to children and the parents who need them, (c) providing children with nutritional and health services. The health services include promotive aspect, i.e. promoting clean and healthy life behavior and environment, and preventive aspect, i.e. early detection of diseases and treatment, which is conducted with the help of the local Community Health Center (PUSKESMAS).
Kindergarten education is supervised by the government together with professional associations, and the society. The government is represented by the Ministry of National Education and its provincial and district/municipal offices. Professional associations are represented by the Association of Kindergarten Organizer (GOPTKI) and the Association of Indonesian Kindergarten Teachers-Indonesian Teachers Union (IGTKI-PGRI), and the society is represented by the Kindergarten Committee. Currently 99.43 percent of kindergartens are organized by the society and only 0.57% are organized by the government.
The Ministry of National Education’s policy on kindergarten education covers four aspects. The first aspect is the improvement in the distribution and expansion of opportunities for children of kindergarten ages to attend kindergarten by building new school units of pilot project public kindergartens, pioneering one-roof kindergarten-primary school model, pioneering rural kindergarten through various alternative model services, such as Foster Kindergarten (TK Asuh), Nature Kindergarten (TK Alam), Kindergarten within the premises of places of worship (TK di lingkungan tempat ibadah), Mobile Kindergarten (TK Keliling), Children of the Beach Kindergarten (TK Anak Pantai), Kindergarten in the place of work (TK di Lingkungan Kerja), Children of
National Coordination Forum Education for All 2003
9
the Stilted House Kindergarten (TK Panggung), University Students’ Community Service Internship Kindergarten (TK KKN Mahasiswa), Koranic Kindergarten (TK Al Quran) dan TK Bina Anaprasa.
The second aspect is the improvement in the educational quality through Professional Development System in the education and training of kindergarten teachers and supervisors, improvement of kindergarten teachers qualification through two-year diploma kindergarten teachers education (DII-PGTK), improvement of kindergarten/primary school supervisors’ performance through specialization training for kindergarten/primary school supervisors.
The third aspect is the improvement of the educational relevance among others through the implementation of life-skill oriented education. The fourth aspect is improvement in the efficiency and effectiveness of educational management among others through the development of Minimum Service Standard for the organization of kindergarten education, implementation of Professional Development System through kindergarten clustering, application of school-based management, improvement of cooperation among the parties involved in kindergarten education, i.e. the government (the Ministry of National Education), GOPTKI, and IGTKI-PGRI, and improvement of the role of kindergarten School Committee and kindergarten School Board in the management of kindergarten, and public relation and information dissemination.
The success of kindergarten educational services are measured against the following indicators: (a) kindergarten learning activities program (the curriculum) and its application, (b) the pupils/participants which include Gross Participation Number (APK), Net Participation Number and classes, (c) workforce, (d) infrastructure and facilities, (e) organization, (f) financing, which includes teacher, administrative personnel, and other educational workforce and pupil attendance rate, and school performance and supervision, and (h) community involvement, which includes the support of school committee, parents, community leaders, and businesses.
• Children Daycare Center (TPA)
TPA or Children Daycare Center is a social welfare unit that functions as a limited time family substitute for children whose parents are working. The target of Children Daycare Center (TPA) services are children of the ages of 3 months to 6 years or until the child is ready to be left at home (at the age of 7 or 8). A child is usually staying at the Daycare Center for 8 to 10 hours per day for 5 to 6 days a week.
In general the Children Daycare Center (TPA) is established with the purpose of providing children with the social welfare services to help them grow and develop healthily appropriate to their developmental stage. Specifically, the Children Daycare Center aims at (1) providing children with the opportunity to get the necessary upbringing, care, socialization guidance, and optimal education to ensure their life sustainability and growth; (2) protecting children from being abused or receiving other kinds of treatment that will disturb or affect their life sustainability, growth, and personality development; (3) helping the parents (family) in carrying out the eight functions of a family, especially carrying out child welfare development function within and outside the family; (4) helping

National Coordination Forum Education for All 2003
10
parents who have children under five years old to feel peace of mind in carrying out their duties to accomplish optimal achievement in their job; (5) to educate the society, in particular parents who have no opportunity in giving guidance and care for their infants, on the importance of social welfare services for children under five years of age.
The Children Daycare Center (TPA) provides various services. The educational services are provided in the forms of care, upbringing, education and health services. Parents services are given in the forms of family consultation, social counseling on children welfare programs which covers topics such as children growth and development and pre-school education. Community services are given in the form of social counseling on the importance of children upbringing, care, and education, infant socialization, and the role of Children Daycare Center. In addition to these, as part of its community service program, TPA also provides research and job training facilities for college students and the community in general.
The Children Daycare Center (TPA) program is carried out with four approaches. The Survival Approach focuses its attention on fulfilling the children’s needs for life sustainability and growth such as providing foods and health care. The Developmental Approach focuses its attention on developing the children’s creativity and initiative potentials and their personality development. The Preventive Approach aims at preventing growth and personality development aberration.
In general, the Children Daycare Center (TPA) developing in the society can be categorized into two different types. The first type that develops in the lower level of the society, such as those in the market, hospital and social institutions, generally functions only as a daycare center. The second type that develops in the middle to the upper class of the society serves more than just a daycare center. It also functions as an educational institution equipped with various facilities and are commonly found in large urban centers where a daycare center has become a necessity.
Four indicators seem to point out the success of the TPA program First is the increase in the number of children served. Second, the increase in the number of TPA. Third, the increase in the number of organizations that administer TPA, and fourth the society’s acceptance of this program as is indicated by the support and assistance that this program has received
Two ministries supervise the implementation of this program, i.e. the Ministry of Social Affairs and the Ministry of National Education. The Ministry of Social Affairs is responsible for the children welfare aspect and the Ministry of National Education is responsible for the educational aspect. Other Ministries may administer TPA on the condition that they refer to the guidelines set by the Ministry of National Education. TPA is commonly organized by a foundation or an NGO. Only a small number of it are organized by the government.

National Coordination Forum Education for All 2003
11
• Raudhatul Atfal (RA)
RA resembles the kindergarten in many aspects. An Islamic kindergarten can even be said to have no difference with RA. The difference between RA and the kindergarten (TK) is in the religious atmosphere that the former has. In RA the Islamic atmosphere is very strong and becomes the spirit of the overall teaching and learning process.
As with the kindergarten, RA is established with the objectives of helping to lay the foundation for the development of children’s attitude, behavior, knowledge, skills, and creativity that will be needed for their subsequent growth and development. RA target is the same as that of the kindergarten, i.e. children of the ages of 4 to 6 or until the children are ready to begin their primary education. RA falls under the supervision of the Ministry of Religious Affairs.
• Playgroup
Playgroup is a type of educational service given to children from the age of 3 until they are ready for primary education. Its activities aim at developing the children’s potential to the optimum appropriate to their developmental stage through playing while learning and learning while playing activities. Playgroup targets three age groups, i.e. 3 – 4 years old, 4 –5 years old, and 5 – 6 years old groups. The learning activities are classified into two categories, i.e. (1) those whose objective is to instill basic values such as religious values and good conduct, and (2) those whose objective is to develop language skills, broad and refined motoric skills, sensitivity/emotion, socialization skills, and creativity across all the developmental aspects.
Playgroups are generally organized by a foundation (yayasan) or a non- governmental organization (NGO). Only a few of them are organized by the government, such as those developed by Center for the Development of Learning Activities (BPKB) and Learning Activities Clubs in some regions. Play groups are supervised by the Ministry of Social Affairs/its regional offices and the Ministry of National Education/its regional offices. The Ministry of Social Affairs is responsible for the development of the children welfare aspects and the Ministry of National Education is responsible for the development of its educational aspects. Other Ministries may also organize playgroups on the condition that they refer to the regulations issued by the Ministry of National Education.
c) Quality
Improvement of human resources quality should begin from a very early age (0 – 6 years) and, if necessary, from the womb, so that children can grow and develop optimally and in turns ready for primary education and the subsequent stages in their life. Improvement of human resources quality should also go hand in hand with the improvement in the quality of care and educational services, which include the availability of qualified and competent personnel, fund, facilities and infrastructure, and a management system that fits the minimal standard services.
Efforts to improve the quality of very-young-children care and education have long been made by the Indonesian people and government. Various policies have been issued (e.g.
National Coordination Forum Education for All 2003
12
through GBHN, Laws, Government Regulations, and other regulations) to provide opportunities for parents, the community, and organizations to organize various care and educational programs for very young children. Health, nutritional, and educational services for very young children, including guidance and counseling for parents and the community, and training programs for the members of the community who are directly involved in the management of the program, have also been carried out.
Several factors have impeded optimal improvement in the care and educational services of very young children. Various policies that have been issued by the government have not been well-socialized, and the support that the government and the community give for the care and educational services for very young children has also been limited, especially since the outset of the extended economic crisis in 1997. Other factors have also contributed to this situation, e.g. (1) the lack of appropriate qualification and competence of some of the personnel involved in the care and educational services for the very young children; (2) the lack of integration of the educational, health and nutrition aspects in the implementation of the program; (3) the lack of socialization to the community, Ministries, and other organizations involved in the program, of the importance of the program.
d) Management
Care and educational program for the very young children is a cross-sectoral program whose management involves various Ministrys, organizations, and institutions of the central and regional government administration. At the central government level, the care and educational program for very young children becomes the responsibility of various government offices such as the Ministry of National Education, the Ministry of Health, the National Coordinating Body for Family Planning, the Ministry of Social Affairs, the office of the State Ministry for PP, the Ministry of Home Affairs, etc. At the provincial and district/municipal level this program involves various relevant offices, institution, and organizations. At the sub-district and village levels, this program involves various offices and organizations, the community at large and the program’s managers and organizers.
To achieve an integrative and holistic management system of the care and educational program for the very young children, the following steps need to be taken:
• Empowering the Educational Committee and School Committee to improve access to and quality of the kindergarten.
• Designing and formulating short term, mid term, and long term (e.g. 2003-2004, 2005-2009, and 2010-2015) programs, objectives, and budget for the care and educational program for the very young children together with the relevant stakeholders.
• Socializing the various care and educational programs for the very young children by means of counseling and information dissemination.
• Improving cooperation among the relevant Ministries, offices, and sectors, and the community in the management/implementation of the program, particularly in the supervision, coordination, monitoring, evaluation, and the future improvement of the program.
• Empowering the participation of the community, GOPTKI, IGTKI, PGRI in order to improve the quality of and access to the services of the care and educational program for the very young children relevant to the community’s needs and demands.

National Coordination Forum Education for All 2003
13
• Exploring funding resources, be it from the internal sources such as the government budgets (APBN and APBD), the community contribution, and from overseas sources such as assistance (grants) and loans from international bodies/organizations (the World Bank, ADB, UNICEF, etc.)
2.4 Performance for the Year 2000
2.4.1 General Description
The Indonesian government has long realized the importance of human resources development from the early ages as is apparent from the policies outlined in the Guidelines of the State Policies (GBHN) of 1993 and reiterated in the Guidelines of the State Policies of 1999. The Indonesian government has also made it its policy that the development of human quality has to begin with children of the ages of 0-6, even before the children are born. From the psychological point of view, it has been established that the developmental treatment of children of the early ages (0-6 years old) yields more optimal results. The development of children since the very early ages (0-6) has multidimensional advantages (i.e. scientific, moral, economical, educational, and social) for the improvement of a nation’s quality. In a number of countries, various programs have been developed to improve the quality of children, and hence the nation, as part of the effort to eradicate poverty. The results of such programs have been proven (see, for example, the Head Start Program in The United States, Dalmau Program in India, Promesa Program in Columbia, etc.).

National Coordination Forum Education for All 2003
15
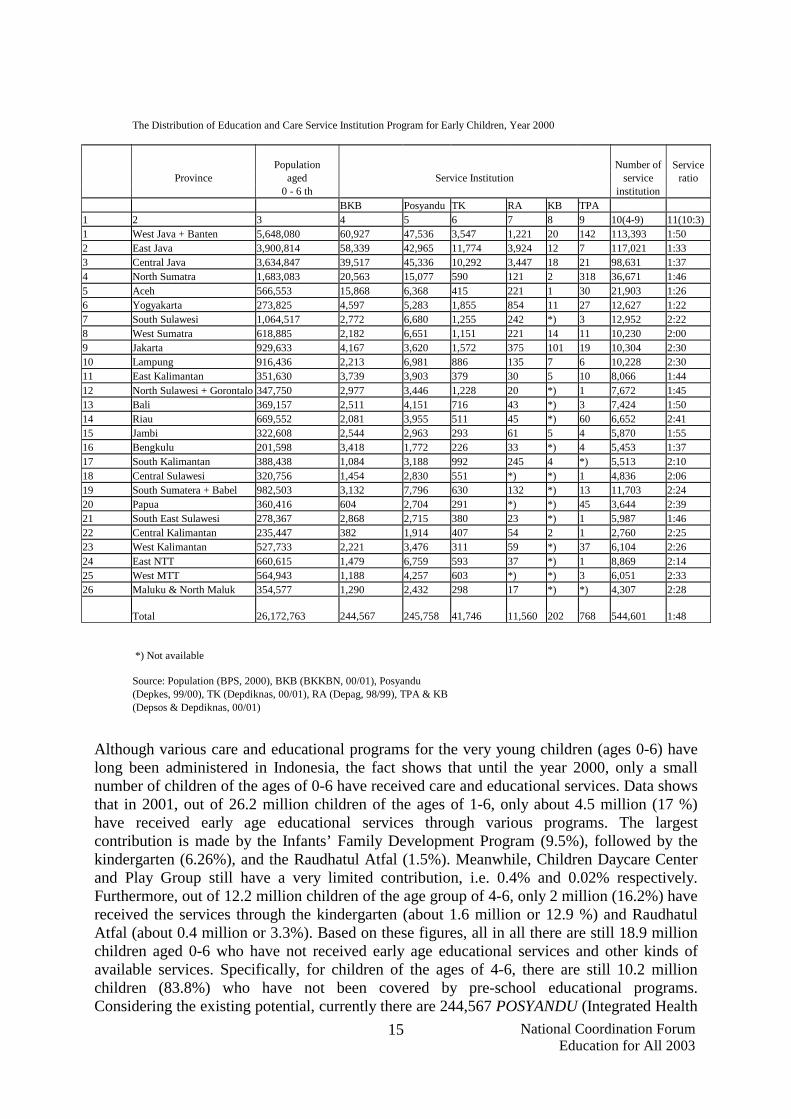
The Distribution of Education and Care Service Institution Program for Early Children, Year 2000
Population Number of
Service Province aged Service Institution service ratio 0 - 6 th institution BKB Posyandu TK RA KB TPA 1 2 3 4 5 6 7 8 9 10(4-9) 11(10:3) 1 West Java + Banten 5,648,080 60,927 47,536 3,547 1,221 20 142 113,393 1:50 2 East Java 3,900,814 58,339 42,965 11,774 3,924 12 7 117,021 1:33 3 Central Java 3,634,847 39,517 45,336 10,292 3,447 18 21 98,631 1:37 4 North Sumatra 1,683,083 20,563 15,077 590 121 2 318 36,671 1:46 5 Aceh 566,553 15,868 6,368 415 221 1 30 21,903 1:26 6 Yogyakarta 273,825 4,597 5,283 1,855 854 11 27 12,627 1:22 7 South Sulawesi 1,064,517 2,772 6,680 1,255 242 *) 3 12,952 2:22 8 West Sumatra 618,885 2,182 6,651 1,151 221 14 11 10,230 2:00 9 Jakarta 929,633 4,167 3,620 1,572 375 101 19 10,304 2:30 10 Lampung 916,436 2,213 6,981 886 135 7 6 10,228 2:30 11 East Kalimantan 351,630 3,739 3,903 379 30 5 10 8,066 1:44 12 North Sulawesi + Gorontalo 347,750 2,977 3,446 1,228 20 *) 1 7,672 1:45 13 Bali 369,157 2,511 4,151 716 43 *) 3 7,424 1:50 14 Riau 669,552 2,081 3,955 511 45 *) 60 6,652 2:41 15 Jambi 322,608 2,544 2,963 293 61 5 4 5,870 1:55 16 Bengkulu 201,598 3,418 1,772 226 33 *) 4 5,453 1:37 17 South Kalimantan 388,438 1,084 3,188 992 245 4 *) 5,513 2:10 18 Central Sulawesi 320,756 1,454 2,830 551 *) *) 1 4,836 2:06 19 South Sumatera + Babel 982,503 3,132 7,796 630 132 *) 13 11,703 2:24 20 Papua 360,416 604 2,704 291 *) *) 45 3,644 2:39 21 South East Sulawesi 278,367 2,868 2,715 380 23 *) 1 5,987 1:46 22 Central Kalimantan 235,447 382 1,914 407 54 2 1 2,760 2:25 23 West Kalimantan 527,733 2,221 3,476 311 59 *) 37 6,104 2:26 24 East NTT 660,615 1,479 6,759 593 37 *) 1 8,869 2:14 25 West MTT 564,943 1,188 4,257 603 *) *) 3 6,051 2:33 26 Maluku & North Maluk 354,577 1,290 2,432 298 17 *) *) 4,307 2:28
Total 26,172,763 244,567 245,758 41,746 11,560 202 768 544,601 1:48
*) Not available
Source: Population (BPS, 2000), BKB (BKKBN, 00/01), Posyandu (Depkes, 99/00), TK (Depdiknas, 00/01), RA (Depag, 98/99), TPA & KB (Depsos & Depdiknas, 00/01)
Although various care and educational programs for the very young children (ages 0-6) have long been administered in Indonesia, the fact shows that until the year 2000, only a small number of children of the ages of 0-6 have received care and educational services. Data shows that in 2001, out of 26.2 million children of the ages of 1-6, only about 4.5 million (17 %) have received early age educational services through various programs. The largest contribution is made by the Infants’ Family Development Program (9.5%), followed by the kindergarten (6.26%), and the Raudhatul Atfal (1.5%). Meanwhile, Children Daycare Center and Play Group still have a very limited contribution, i.e. 0.4% and 0.02% respectively. Furthermore, out of 12.2 million children of the age group of 4-6, only 2 million (16.2%) have received the services through the kindergarten (about 1.6 million or 12.9 %) and Raudhatul Atfal (about 0.4 million or 3.3%). Based on these figures, all in all there are still 18.9 million children aged 0-6 who have not received early age educational services and other kinds of available services. Specifically, for children of the ages of 4-6, there are still 10.2 million children (83.8%) who have not been covered by pre-school educational programs. Considering the existing potential, currently there are 244,567 POSYANDU (Integrated Health
National Coordination Forum Education for All 2003
16
Services Centers) that can integrate the implementation of early-age educational program, and 148,516 primary schools which can organize one-roof kindergarten and primary school services model. If all these POSYANDU and primary schools can be optimally utilized to provide educational and nutritional services for the very young children, 12 million children (45% of the whole children population) or the average of 50 children of the ages of 0-6 for every POSYANDU can be served.
The low rate of the educational and care services for the very young children can among others be attributed to the limited number of organizations that provide the educational and care services to the very young children in comparison to the number of children aged 0-6 who are supposed to receive the services. In general, these organizations are located in the urban areas, while most of the very young children who need the services live in the rural areas.
These data show that almost 13% or 26.1 million of the whole Indonesia’s population of 202.8 million (National Census of 2000) are children of the ages of 0-6 and most of these children (60%) live in the rural areas. Most of the service programs, especially the kindergarten, play group, and children daycare center, however, are available in the urban areas.
With regard to the number of the individual service programs, the largest proportion is that of the POSYANDU (45.13%), followed by Infants’ Family Development Program or BKB (44.91%), the kindergarten (7.67%), Raudhatul Atfal (2.12%), the children daycare center or TPA (0.14%) and play group (0.04%). Across the provinces the availability of these programs shows a great variability, from the lowest of 2,760 in Central Kalimantan to the highest of 117,021 in East Java. About 60% of the available service programs are concentrated in the three most-densely populated provinces, i.e. East Java, West Java and Banten, and Central Java. This is consistent with the number of children population that needs to be served in these provinces.
The availability rate of these services programs at the provincial level varies greatly. This variation is indicated by the average number of children that needs to be served by the existing programs after taking into account the possibility of children receiving multiple services from different programs such as the Infants’ Family Development or BKB and the POSYANDU. With regard to the proportion of the availability of services to the number of children that need to be served, the highest availability level exists in the province of Yogyakarta (the proportion is 1:22) and the lowest in Riau (1:101). The national average is 1:48. This means that if all the available programs can provide educational and care services at the same time to the children, then to be able to serve all the children, every program unit has to serve on average 48 children, with the differential range across the provinces stands from 22 to 110 children. However, considering the real condition on the field in which the BKB program is integrated with the POSYANDU program, then the proportion is actually larger.
The limited number of institutions that provides educational and care services to the very young children at the present time will seriously hinder the children’s opportunity to get the educational and care services. Whereas, ideally, educational and care services should be available to all the children of the ages of 0-6. Considering this fact, the utilization of vacant primary schools as preparatory classes for children prior to their admission to the primary
National Coordination Forum Education for All 2003
17
school should be prioritized to improve educational access for the children of the very young ages.
A study conducted by the Ministry of National Education in cooperation with the World Bank in 1996-1997 discovered that only 55% of children under five years old in the provinces of West Sumatra, West Kalimantan, and South Sulawesi have received POSYANDU services. Whereas the POSYANDU services have covered 80% of all the villages in Indonesia. The BKB (Infants’ Family Development) program which is expected to complement the POSYANDU in providing the holistic services (health, nutrition, and psychosocial) has not been much enjoyed by parents, both in Java and outside Java. The Children Daycare Center (TPA) program has not been considered as an important necessity as this kind of service can still be provided by one’s own family members. The trend, however, is that this facility is going to be increasingly needed as the family is shifting from extended family to the nuclear family.
Furthermore the study also discovered a low access rate to the various educational services for the very young children, especially to those that provide cognitive stimulation (i.e. infants’ family development or BKB program, the kindergarten, play group, and children daycare center). As a result of this, there is a significant gap in the children’s readiness to enter the primary school between the children who come from the low-income families and those who come from the higher income families. This finding is relevant to the fact that only 16% of the children in the sample of this study participated in the various pre-school education programs, and only 6% of the families claimed to have made use of the BKB program. In this study, exception is made for the POSYANDU program which provides basic health intervention services for the children for free.
Eighty nine percent (89%) of the sample in this study was reported to have made use of the POSYANDU, (It should be noted, however, that the immunization coverage estimate which has reportedly been mostly conducted through the POSYANDU is found to be lower, that is only 60% of the total participation.) In addition to this, baby weighing activity at the POSYANDU was found to be not very effective. The study also revealed a significant gap in the participation of children who come from the low income families and those who come from higher income families. Furthermore, demands for kindergarten from those whose income belong to the higher quartile were found to be twice as much as from those whose income belong to the lowest quartile.
The children’s lack of opportunity to attend various programs for the very young children has been found to affect their success at the primary school. The data available at the Research and Development Center of the Ministry of National Education (1995) show that repeating students at the first grade of primary school stands at around 15% to 16%. The school has also been indicated not to provide a conducive environment, especially to the first-grader children who have no previous experience in attending various service activities for the very young children, such as the kindergarten. Therefore, the pioneering of the PADU model through play groups, children daycare centers, alternative kindergartens, will become a means of adjustment for children to enter the first grade of the primary school.

National Coordination Forum Education for All 2003
18
An effective developmental program for the very young children has to include a combination of health, nutrition, and psychosocial (educational) intervention. Health and nutritional intervention will reduce the children’s mortality rate, the incidence of defect and permanent disability and the need for rehabilitation and improve life expectancy. Educational intervention to the very young children will improve their physical, intellectual, and emotional development. The integration of these three aspects of developmental intervention (i.e. health, nutrition, and education) will result in a holistic development.
2.4.2 The Present Condition of Care Services
The level of care services for the very young children, especially those provided through the POSYANDU and the Children Daycare Center (TPA) are still very low (table 2.1). It can generally be said that care services for the very young children has not been designed as an integrative program which at the same time include the educational, care, nurture, health, and nutritional aspects. The contribution of TPA as the only institution designed for the purpose of providing both care and education for the very young children is still very low. In general, most TPAs are currently available in urban areas.
Table 1.2 shows that only 10.8 million (41%) out of 26.2 million very young children (ages 0-6 years) have received care services. Most of these care services are provided by the POSYANDU, the number of children who receive the care services through the TPA being less than 1%. Therefore there are still about 15.4 million (about 59%) children of the ages of 0-6 who have not received care services.
The data show that, across the provinces, the proportion of children who have received the services varies significantly. The largest proportion is found in North Sulawesi and Gorontalo (72%) and the lowest is found in Nangro Aceh Darussalam (23%), with the national average stands at 41%. These figures may actually be higher we take into account the fact that families of middle and upper classes have made their own efforts in providing cares for their children.
The low rate of care services for the very young children, particularly for those who come from the less fortunate families, up to the year 2000 is a direct consequence of the extended economic crisis which has hit Indonesia since 1997. The crisis has reduced some people’s purchasing power, especially those who live in the rural areas. Among the groups most affected by the diminishing family income are the babies. They suffer from malnutrition as their parents can no longer supply them with adequate nutrition. Malnutrition in babies can generally cause a permanent damage, especially to their brain development. Failure to protect the very young children from the impacts of the economic crisis may result in these children’s permanent physical and mental development retardation
National Coordination Forum Education for All 2003
19
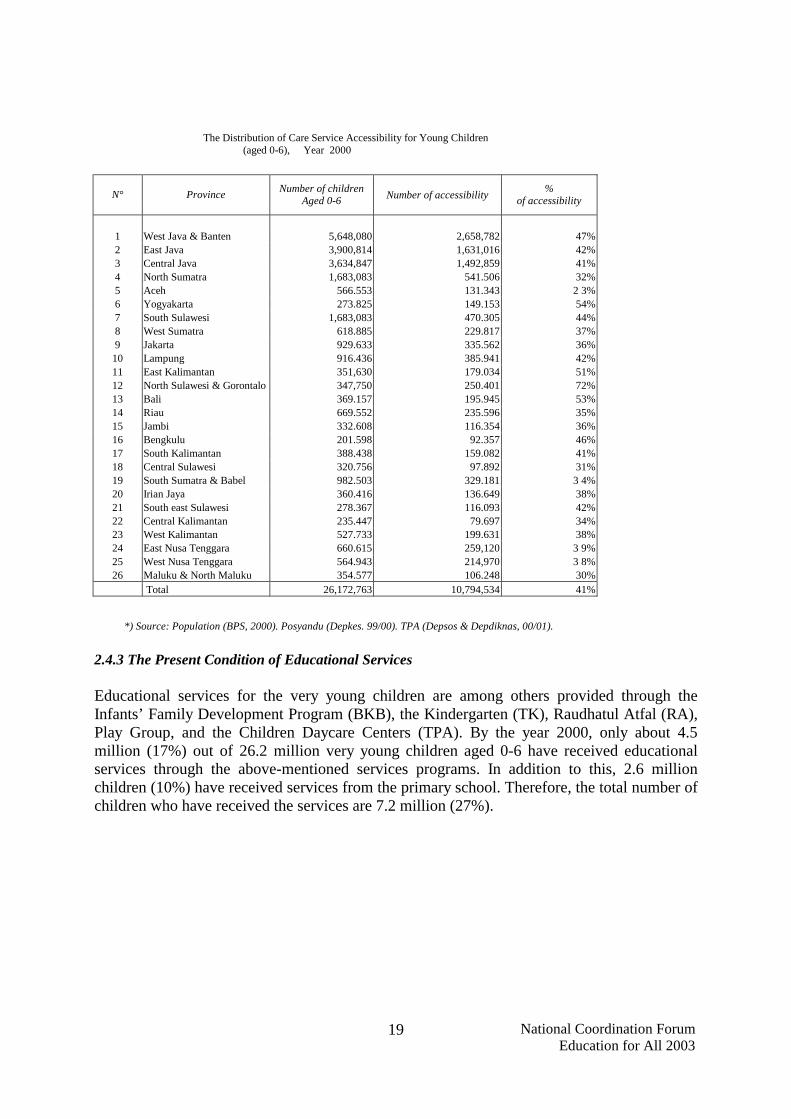
The Distribution of Care Service Accessibility for Young Children (aged 0-6), Year 2000
Number of accessibility N° Province Number of children Aged 0-6
% of accessibility
1 West Java & Banten 5,648,080 2,658,782 47% 2 East Java 3,900,814 1,631,016 42% 3 Central Java 3,634,847 1,492,859 41% 4 North Sumatra 1,683,083 541.506 32% 5 Aceh 566.553 131.343 2 3% 6 Yogyakarta 273.825 149.153 54% 7 South Sulawesi 1,683,083 470.305 44% 8 West Sumatra 618.885 229.817 37% 9 Jakarta 929.633 335.562 36%
10 Lampung 916.436 385.941 42% 11 East Kalimantan 351,630 179.034 51% 12 North Sulawesi & Gorontalo 347,750 250.401 72% 13 Bali 369.157 195.945 53% 14 Riau 669.552 235.596 35% 15 Jambi 332.608 116.354 36% 16 Bengkulu 201.598 92.357 46% 17 South Kalimantan 388.438 159.082 41% 18 Central Sulawesi 320.756 97.892 31% 19 South Sumatra & Babel 982.503 329.181 3 4% 20 Irian Jaya 360.416 136.649 38% 21 South east Sulawesi 278.367 116.093 42% 22 Central Kalimantan 235.447 79.697 34% 23 West Kalimantan 527.733 199.631 38% 24 East Nusa Tenggara 660.615 259,120 3 9% 25 West Nusa Tenggara 564.943 214,970 3 8% 26 Maluku & North Maluku 354.577 106.248 30%
Total 26,172,763 10,794,534 41%
*) Source: Population (BPS, 2000). Posyandu (Depkes. 99/00). TPA (Depsos & Depdiknas, 00/01).
2.4.3 The Present Condition of Educational Services
Educational services for the very young children are among others provided through the Infants’ Family Development Program (BKB), the Kindergarten (TK), Raudhatul Atfal (RA), Play Group, and the Children Daycare Centers (TPA). By the year 2000, only about 4.5 million (17%) out of 26.2 million very young children aged 0-6 have received educational services through the above-mentioned services programs. In addition to this, 2.6 million children (10%) have received services from the primary school. Therefore, the total number of children who have received the services are 7.2 million (27%).

National Coordination Forum Education for All 2003
20
Out of the five aforementioned programs, only BKB (Infants’ Family Development Program) does not provide direct services to the children, but to their parents or their caretakers; therefore, it is difficult to trace the number of children who have received services from this program. The data from the National Coordinating Body for Family Planning (BKKBN) show that in 2001, there were 244,567 BKB groups with an estimated 2,526,204 children receiving its services. This is based on the assumption that every family taking part in the BKB program has one child receiving the BKB services.
The proportion of children who have received the educational services varies significantly across the provinces. The highest proportion was found in Yogyakarta (52%) and the lowest proportion in the province of East Nusa Tenggara (12%), with the national average standing at 27%. If the primary school is not accounted for as a form of early age educational services, the figures will be lower. The quality of the services should also be taken into account considering that those who have received the services have not received them on a continuous basis. Ideally, every child receives a continuous educational service both from within the family and from outside the family circle, since the child is born. Considering that many families have not yet know how to educate and help their children grow optimally, a through-the-parent intervention program such as the BKB and the like is necessary. Educational services programs conducted outside the family, e.g. the TPA, Play Group, the Kindergarten, Raudhatul Atfal, etc. have adequately been available
The primary school gives the highest contribution of the educational services with 2.6 million participants (10%) followed by the BKB with 2,5 million participants (9.5%), the kindergarten with 1.6 million participants (6.1%) and the Raudhatul Atfal with 287 thousand participants (1.1%). The TPA and the playgroup’s contribution is still very low, i.e. 9.2 thousand (0.04%) and 4.9 thousand (0.02%) respectively. Hence, there are still 18.9 million children aged 0-6 (73%) who have not received educational services from the various services available (see Table 2.3).

National Coordination Forum Education for All 2003
21
The Distribution of Education Service Accessibility for Young Children (aged 0-6), Year 2000
N ° Province Number of children aged 0-6
Number of Education Service Accessibility for Young Children (aged 0-6) Total
% of accessibility
SD BKB TK RA KB TPA 1 2 3 4 5 6 7 8 9 10 11
1 West Java & Banten 5,648,080 498.777 629.333 148.424 15.798 480 1.704 1,329,209 24%
2 East Java 3,900,814 338.815 602,600 508.576 123.891 288 84 1,585,803 41% 3 Central Java 3,634,847 420.648 408.183 286,060 78.804 432 252 1,242,044 34%
4 North Sumatra 1,683,083 171.163 212.401 37.375 2.483 48 3.816 431.047 26%
5 Aceh 556.553 45.798 163.905 24,470 928 24 360 232.613 41% 6 Yogyakarta 273.825 33.744 47.484 57.551 7.051 264 324 142.622 52%
7 South Sulawesi 1,064,517 91.562 28.633 51,288 12.359 * ) 36 185.285 17%
8 West Sumatra 618.885 57.322 22.539 37.512 1.871 336 132 126.571 20% 9 Jakarta 929.633 121.131 47,690 83.038 14.256 2.424 228 269.709 29% 1 Lampung 916.436 105.516 22.859 43.071 1.847 168 72 185.465 20%
1 East Kalimantan 351,630 44.056 38.621 20.614 * ) 120 120 106.682 30%
1North Sulawesi & Gorontalo 347,750 46.554 30,750 26.806 954 * ) 12 106.385 31%
1 Bali 367.157 42.903 25.937 34.289 329 * ) 36 108.659 29% 1 Riau 669.552 78.886 21.495 28.111 1.099 * ) 720 136.862 20% 1 Jambi 322.608 35.881 26.278 11,280 1.192 120 48 77.525 24% 1 Bengkulu 201.598 25.411 35.306 8.783 1,320 * ) 48 71.742 36%
1 South Kalimantan 388.438 45.047 11.197 25.899 3.328 96 * ) 102.347 26%
1 Central Sulawesi 320.756 32.965 15,020 17.964 3.683 * ) 12 68.992 22%
1South Sumatra & Babel 982.503 120.718 32.351 29,040 8.276 * ) 156 189.641 19%
2 Irian Jaya 360.416 37.472 6.239 12.916 3.065 * ) 540 58.559 16%
2 South east Sulawesi 278.367 34.112 29.624 12.721 1.893 * ) 12 78,300 28%
2 Central Kalimantan 235.447 25.067 3.946 10.407 958 48 12 42.379 18%
2 West Kalimantan 527.733 64.095 22.941 11.422 1.823 * ) 444 101.487 19%
2 East Nusa Tenggara 660.615 40.568 15.277 18.787 68 * ) 12 77.502 12%
2 West Nusa Tenggara 564.943 45.578 12.271 25.274 * ) * ) 36 84,050 15%
2 Maluku & North Maluku 354.577 37.473 13.325 11.789 502 * ) * ) 58.511 17%
Total 26,172,763 2,641,262 2,526,204 1,583,467 287.778 4.848 9.216 7,199,990 27%
Data on gender distribution are not sufficiently available for the purpose of analysis as this kind of data is only provided by the kindergarten and the RA. However, if we are to use the data available from the kindergarten and the RA to estimate the gender distribution of the other services programs, then the proportion of girls who have received the services is larger that that of the boys. Therefore it can be said that there is no gender bias in the educational services for the very young children (see Table 2.4). With regard to the differences in the availability of services between the urban and rural areas, both for boys and girls, the data show that the level of service availability in the urban areas is better than that in the rural areas.
National Coordination Forum Education for All 2003
22
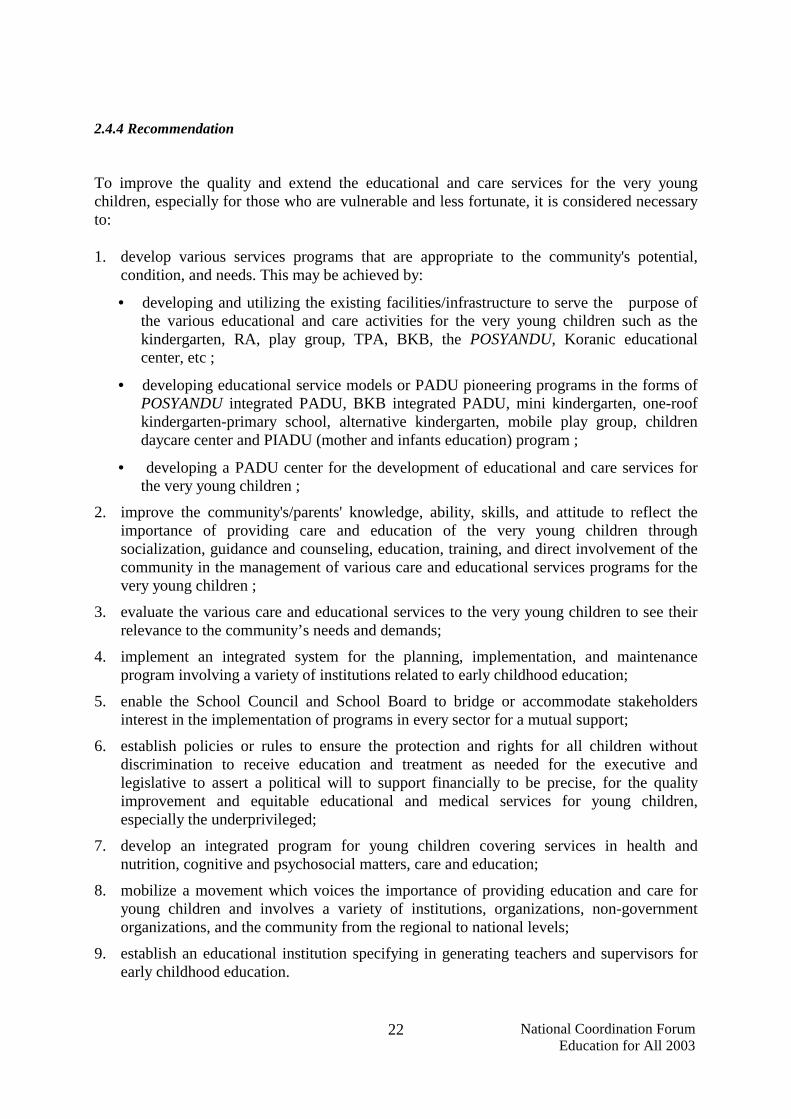
2.4.4 Recommendation
To improve the quality and extend the educational and care services for the very young children, especially for those who are vulnerable and less fortunate, it is considered necessary to:
1. develop various services programs that are appropriate to the community's potential, condition, and needs. This may be achieved by:
• developing and utilizing the existing facilities/infrastructure to serve the purpose of the various educational and care activities for the very young children such as the kindergarten, RA, play group, TPA, BKB, the POSYANDU, Koranic educational center, etc ;
• developing educational service models or PADU pioneering programs in the forms of POSYANDU integrated PADU, BKB integrated PADU, mini kindergarten, one-roof kindergarten-primary school, alternative kindergarten, mobile play group, children daycare center and PIADU (mother and infants education) program ;
• developing a PADU center for the development of educational and care services for the very young children ;
2. improve the community's/parents' knowledge, ability, skills, and attitude to reflect the importance of providing care and education of the very young children through socialization, guidance and counseling, education, training, and direct involvement of the community in the management of various care and educational services programs for the very young children ;
3. evaluate the various care and educational services to the very young children to see their relevance to the community’s needs and demands;
4. implement an integrated system for the planning, implementation, and maintenance program involving a variety of institutions related to early childhood education;
5. enable the School Council and School Board to bridge or accommodate stakeholders interest in the implementation of programs in every sector for a mutual support;
6. establish policies or rules to ensure the protection and rights for all children without discrimination to receive education and treatment as needed for the executive and legislative to assert a political will to support financially to be precise, for the quality improvement and equitable educational and medical services for young children, especially the underprivileged;
7. develop an integrated program for young children covering services in health and nutrition, cognitive and psychosocial matters, care and education;
8. mobilize a movement which voices the importance of providing education and care for young children and involves a variety of institutions, organizations, non-government organizations, and the community from the regional to national levels;
9. establish an educational institution specifying in generating teachers and supervisors for early childhood education.
National Coordination Forum Education for All 2003
23
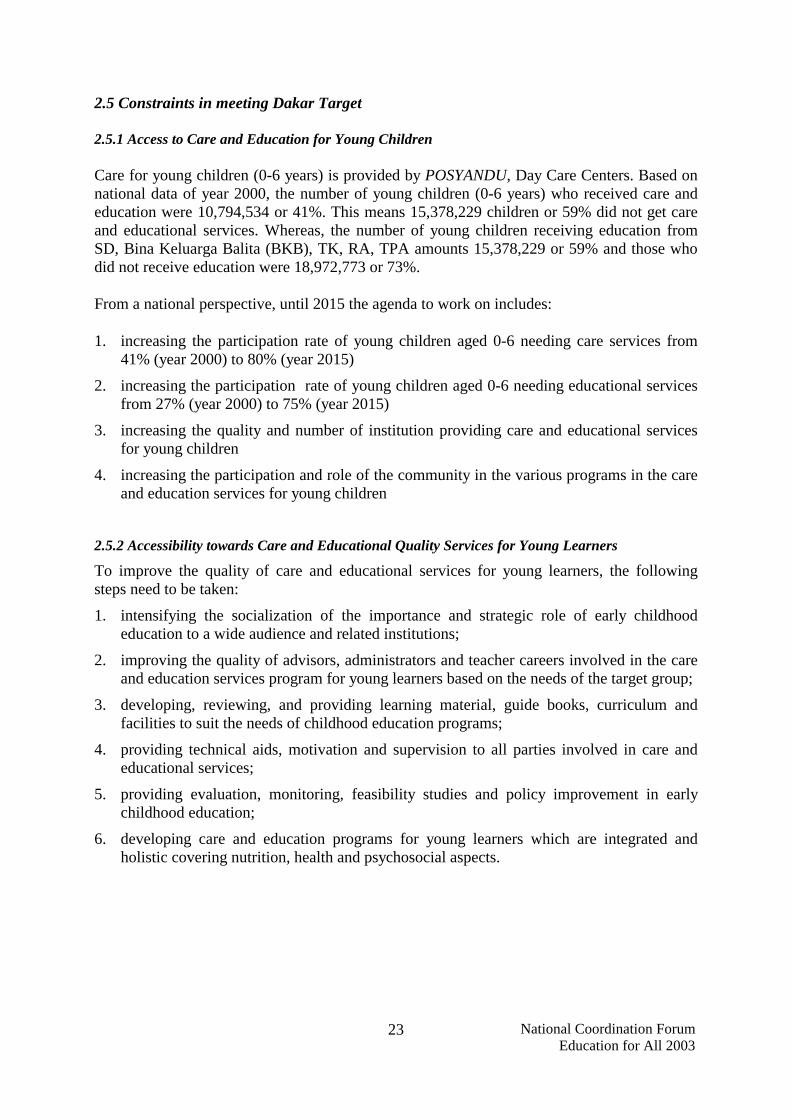
2.5 Constraints in meeting Dakar Target
2.5.1 Access to Care and Education for Young Children
Care for young children (0-6 years) is provided by POSYANDU, Day Care Centers. Based on national data of year 2000, the number of young children (0-6 years) who received care and education were 10,794,534 or 41%. This means 15,378,229 children or 59% did not get care and educational services. Whereas, the number of young children receiving education from SD, Bina Keluarga Balita (BKB), TK, RA, TPA amounts 15,378,229 or 59% and those who did not receive education were 18,972,773 or 73%.
From a national perspective, until 2015 the agenda to work on includes:
1. increasing the participation rate of young children aged 0-6 needing care services from 41% (year 2000) to 80% (year 2015)
2. increasing the participation rate of young children aged 0-6 needing educational services from 27% (year 2000) to 75% (year 2015)
3. increasing the quality and number of institution providing care and educational services for young children
4. increasing the participation and role of the community in the various programs in the care and education services for young children
2.5.2 Accessibility towards Care and Educational Quality Services for Young Learners
To improve the quality of care and educational services for young learners, the following steps need to be taken:
1. intensifying the socialization of the importance and strategic role of early childhood education to a wide audience and related institutions;
2. improving the quality of advisors, administrators and teacher careers involved in the care and education services program for young learners based on the needs of the target group;
3. developing, reviewing, and providing learning material, guide books, curriculum and facilities to suit the needs of childhood education programs;
4. providing technical aids, motivation and supervision to all parties involved in care and educational services;
5. providing evaluation, monitoring, feasibility studies and policy improvement in early childhood education;
6. developing care and education programs for young learners which are integrated and holistic covering nutrition, health and psychosocial aspects.

National Coordination Forum Education for All 2003
24
2.5.3 Funding Sources
The implementation of the National Action Plans for Care and Educational Services for Young Learners would need an amount of 10.1 trillion rupiahs derived from:
1. Allocation from the state budget for various sectors such as; Ministry of National Education to fund among others Kindergartens, Play groups, Child Care Centers; Ministry of Health to fund POSYANDU; Ministry of Social Welfare to fund child welfare via play groups and child care centers; National Coordinating Body for Family Planning to fund Raudhatul Atfal; other Ministries to contribute to their programs
2. Allocations from Regional Budgets at the province and regency/municipality levels distributed via General Allocation Fund (DAU)
3. Non-funding resources from both in-country and overseas

National Coordination Forum Education for All 2003
25
“NATIONAL PLANS OF ACTION”: ACTIONS, TARGETS, AND FUNDS
EARLY CHILDHOOD CARE AND EDUCATION PROGRAMS (2003-2015) No Programs Unit Unit cost Annual target Total target Total cost 2003-2004 2005-2010 2011-2015 Total 2003-2004 2005-2010 2011-2015 Total 1. NUMBER OF CHILDREN AGED 0-6
a. Care b. Education
26 172,763 (year 2000) 10,730,833
41,00 7,199,990
27,51
27,540,274
13,770,137 50,00
8,262,082 30,00
29,249,664
19,012,281 65,00
14,624,832 50,00
31,300,931
25,040,745 80,00
23,475,698 75,00
31,300,931 1,302,588,280 4,420,676,540 4,467,704,495 10,190,969,315
I PLAY GROUP A. ACCESSIBILITY Support for the increase of PADU service
accessibility Institution 25,000 567 1,134 2,835 4,536 14,175,000 28,350,000 70,875,000 113,400,000
Support for the provision of care and education for young children
Children 500 11,340 204,120 453,600 669,060 5,670,000 102,060,000 226,800,000 334,530,000
B. QUALITY 1. Development of Policy Materials a. Guidelines for minimum service standards
for curriculum & learning programs Type 50,000 4 4 4 12 200,000 200,000 200,000 600,000
b. Compilation of learning materials/APE Type 100.000 4 4 4 12 200,000 200,000 200,000 600,000 c. Developing modules for the Training of
Teachers and Administrators Modul 150.000 2 2 2 6 2,250,000 300,000 300,000 2,850,000
d. Developing Socialization Materials and KIE PADU (TV, video cassette, audio cassette, leaflets, and posters).
100.000 5 5 5 15 500,000 500,000 500,000 1,500,000
e. Provision and distribution of socialization materials
Set 250 3,200 3,200 3,200 9,600 800,000 800,000 800,000 2,400,000
2.Quality Improvement for Personnel 150 150 150 450 450,000 450,000 450,000 1,350,000 a. Training of Trainers for Teachers and
Administrators Person 1,134 2,268 5,670 9,072 567,000 1,134,000 2,835,000 4,536,000
b. Training for Teachers and Supervisors Person c. Implementation of Socialization and KIE 1 6 5 12 500,000 3,000,000 2,500,000 6,000,000 d. National level Location 500,000 1 6 5 12 500,000 3,000,000 2,500,000 6,000,000 e. Provincial level Location 200,000 27 162 135 324 5,400,000 32,400,000 27,000,000 64,800,000 f. Regency / municipality level Location 50,000 365 2,190 1,825 4,380 18,250,000 109,500,000 91,250,000 219,000,000 C. ADMINISTRATION 1. Monitoring and Evaluation a. National level Location 100,000 1 2 6 5 13 200,000 600,000 500,000 1.300,000 b. Provincial level Location 25,000 30 60 180 150 390 1,500,000 4,500,000 3,750,000 9,750,000 c. Regency / municipality level Location 5,000 365 730 2,190 1,825 4,745 3,650,000 10,950,000 9,125,000 23,725,000 TOTAL 54,312,000 294,944,000 437,085,000 786,341,000 II. CHILD CARE CENTERS A. ACCESSIBILITY a. Support for the increase of PADU service
accessibility Institution 25,000 768 1,536 3,840 6,144 19,200,000 38,400,000 96,000,000 153,600,000
b. Support for the provision of care and education for young children
Children 600 614,400 906,240 9,216,000 165,888,000 368,640,000 543,744,000

National Coordination Forum Education for All 2003
26
B. QUALITY 1. Development of Policy Materials a. Guidelines for minimum service standards
for curriculum & learning programs Type 50,000 4 4 4 12 200,000 200,000 200,000 600,000
b. Compilation of learning materials/APE Type 100,000 2 2 2 6 200,000 200,000 200,000 600,000 c. Developing modules for the Training of
Teachers and Administrators Modul 150,000 15 2 2 19 300,000 300,000 300,000 2,850,000
d. Developing Socialization Materials and KIE PADU (TV, video cassette, audio cassette, leaflets, and posters).
Type 100,000 5 5 5 15 500,000 500,000 500,000 1,500,000
e. Provision and distribution of socialization materials
Set 250 3,200 3,200 3,200 9,600 480,000 480,000 480,000 1,440,000
2. Quality Improvement for Personnel a. Training of Trainers for Teachers and
Administrators Person 3,000 150 150 150 450 450,000 450,000 450,000 1,350,000
b. Training for Teachers and Supervisors Person 500 1,536 3,072 7,680 12,288 768,000 1,536,000 3,840,000 6,144,000 c. Implementation of Socialization and KIE − National level Location 500,000 1 6 5 12 500,000 3,000,000 2,500,000 6,000,000 − Provincial level Location 200,000 27 162 135 324 5,400,000 32,400,000 27,000,000 64,800,000 − Regency / municipality level Location 50,000 365 2,190 1,825 4,380 18,250,000 109,500,000 91,250,000 219,000,000 C. ADMINISTRATION 1. Monitoring and Evaluation − National level Location 100,000 1 2 6 5 13 200,000 600,000 500,000 1,300,000 − Provincial level Location 25,000 30 60 180 150 390 1,500,000 4,500,000 3,750,000 9,750,000 − Regency / municipality level Location 5,000 365 730 2,190 1,825 4,745 3,650,000 10,950,000 9,125,000 23,725,000 TOTAL 63,084,000 369,224,000 605,055,000 1,037,363,000 III. RAUDATHUL ATHFAL (RA) A. ACCESSIBILITY a. Support for the increase of PADU service
accessibility Institution
10,000
b. Support for the provision of care and education for young children
Children 250 11,560 730 365 12,655 7,300,000 3,650,000 10,950,000
B. QUALITY 231,200 1,474,800 1,265,500 2,971,500 57,800,000 368,700,000 316,375,000 742,875,000 1. Development of Policy Materials a. Guidelines for minimum service standards
for curriculum & learning programs Type 50,000
b. Compilation of learning materials/APE Type 100,000 c. Developing modules for the Training of
Teachers and Administrators Modul 150,000
d. Developing Socialization Materials and KIE PADU (TV, video cassette, audio cassette, leaflets, and posters).
Type 100,000
e. Provision and distribution of socialization materials
Set 150
2. Quality Improvement for Personnel a. Training of Trainers for Teachers and
Administrators Person 3,000 150 150 150 450 450,000 450,000 450,000 1,350,000
b. Training for Teachers and Supervisors Person 350 23,120 1,460 730 25,310 8,092,000 511,000 2,555,000 8,858,500 c. Implementation of Socialization and KIE - National level Location 250,000 1 6 5 12 250,000 1,500,000 1,250,000 3,000,000

National Coordination Forum Education for All 2003
27
- Provincial level Location 50,000 27 162 135 324 1,350,000 8,100,000 6,750,000 16,200,000 - Regency / municipality level Location 10,000 365 2,190 1,825 4,380 3,650,000 21,900,000 18,250,000 43,800,000 C. ADMINISTRATION 1. Monitoring and Evaluation a. National level Location 100,000 1 2 6 5 13 200,000 600,000 500,000 1,300,000 b. Provincial level Location 25,000 30 60 180 150 390 1,500,000 4,500,000 3,750,000 9,750,000 c. Regency / municipality level Location 2,500 365 730 2,190 1,825 4,745 1,825,000 5,475,000 4,562,500 11,862,500 TOTAL 78,747,000 420,716,000 357,473,000 856,936,000 IV. KINDERGARTENS A. ACCESSIBILITY 1. Support for the increase of PADU service
accessibility Institution
25,000 41,746 730 730 43,206 18,250,000 18,250,000 36,500,000
2. Support for the provision of care and education for young children
Children 400 834,920 5,097,120 4,320,600 10,252,640 333,968,000 2,038,848,000 1,728,240,000 4,101,056,000
B. QUALITY 1. Development of Policy Materials a. Guidelines for minimum service standards
for curriculum & learning programs Type 50,000 4 4 4 12 200,000 200,000 200,000 600,000
b. Compilation of learning materials/APE Type 100,000 2 2 2 6 200,000 200,000 200,000 600,000 c. Developing modules for the Training of
Teachers and Administrators Modul 150,000 15 2 2 19 2,250,000 300,000 300,000 2,850,000
d. Developing Socialization Materials and KIE PADU (TV, video cassette, audio cassette, leaflets, and posters).
Type 100,000 5 5 5 15 500,000 500,000 500,000 1,500,000
e. Provision and distribution of socialization materials
Set 250 3,200 3,200 3,200 9,600 800,000 800,000 800,000 2,400,000
2. Quality Improvement for Personnel a. Training of Trainers for Teachers and
Administrators Person 3,000 150 150 150 450 450,000 450,000 450,000 1,350,000
b. Training for Teachers and Supervisors Person 500 83,492 1,460 1,460 86,412 41,746,000 730,000 730,000 43,206,000 3. Implementation of Socialization and KIE - National level Location 500,000 1 6 5 12 500,000 3,000,000 2,500,000 6,000,000 - Provincial level Location 200,000 27 162 135 324 5,400,000 32,400,000 27,000,000 64,800,000 - Regency / municipality level Location 50,000 365 2,190 1,825 4,380 18,250,000 109,500,000 91,250,000 219,000,000 C. ADMINISTRATION 1. Monitoring and Evaluation - National level Location 100,000 1 2 6 5 13 200,000 600,000 500,000 1,300,000 - Provincial level Location 25,000 30 60 180 150 390 1,500,000 4,500,000 3,750,000 9,750,000 - Regency / municipality level Location 5,000 365 730 2,190 1,825 4,745 3,650,000 10,950,000 9,125,000 23,725,000 TOTAL 409,614,000 2,221,228,000 1,883,795,000 4,514,637,000 V SUPPORT FOR FAMILY WITH INFANTS
(BKB)
A. ACCESSIBILITY 1. Coverage increase of BKB
2001 data: 4,863,196 for families with young children + 51.7 % (2,526,204)
Family Children
341,824 1,709,120
341,824 1,709,120
341,824 1,709,120
341,824 5,127,360
1,025,472 8,545,600
2. Developing BKB groups Year 2000: 244,567 groups Serving 2,526,204 children
Groups 250 254,158 359,657 359,657 901,541 127,079,000 71,931,500 89,914,250 288,924,750
B. QUALITY
National Coordination Forum Education for All 2003
28
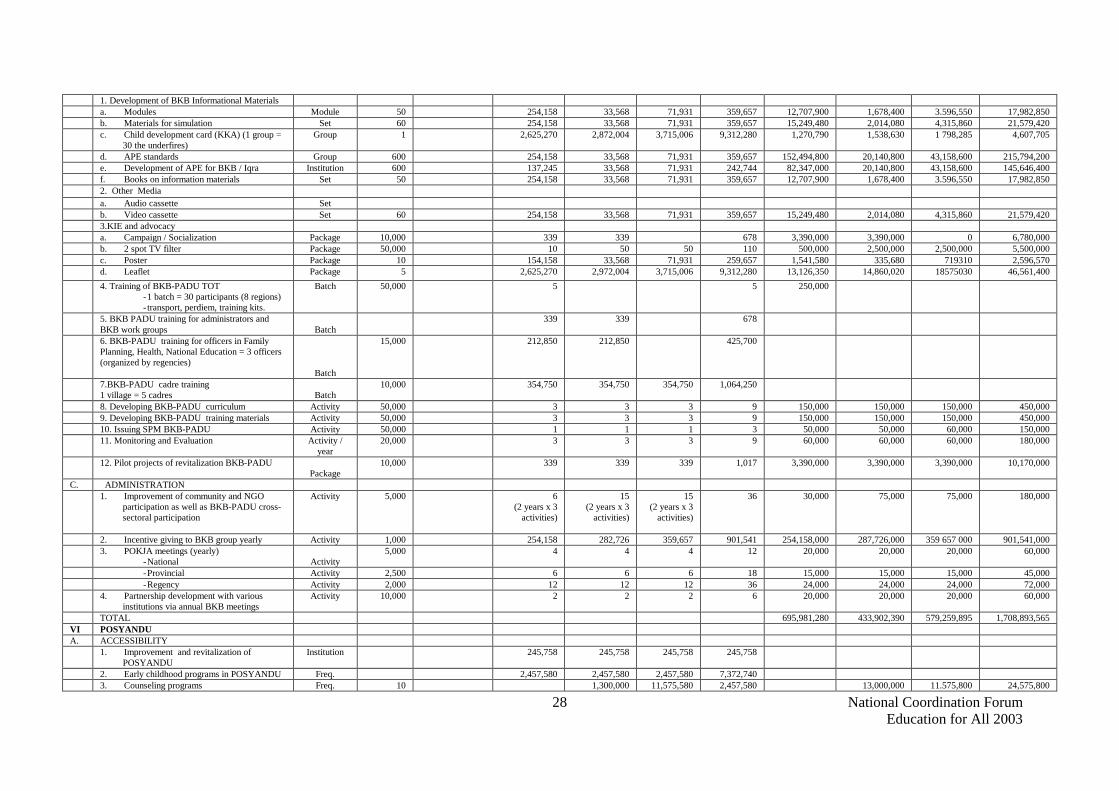
1. Development of BKB Informational Materials a. Modules Module 50 254,158 33,568 71,931 359,657 12,707,900 1,678,400 3.596,550 17,982,850 b. Materials for simulation Set 60 254,158 33,568 71,931 359,657 15,249,480 2,014,080 4,315,860 21,579,420 c. Child development card (KKA) (1 group =
30 the underfires) Group 1 2,625,270 2,872,004 3,715,006 9,312,280 1,270,790 1,538,630 1 798,285 4,607,705
d. APE standards Group 600 254,158 33,568 71,931 359,657 152,494,800 20,140,800 43,158,600 215,794,200 e. Development of APE for BKB / Iqra Institution 600 137,245 33,568 71,931 242,744 82,347,000 20,140,800 43,158,600 145,646,400 f. Books on information materials Set 50 254,158 33,568 71,931 359,657 12,707,900 1,678,400 3.596,550 17,982,850 2. Other Media a. Audio cassette Set b. Video cassette Set 60 254,158 33,568 71,931 359,657 15,249,480 2,014,080 4,315,860 21,579,420 3.KIE and advocacy a. Campaign / Socialization Package 10,000 339 339 678 3,390,000 3,390,000 0 6,780,000 b. 2 spot TV filter Package 50,000 10 50 50 110 500,000 2,500,000 2,500,000 5,500,000 c. Poster Package 10 154,158 33,568 71,931 259,657 1,541,580 335,680 719310 2,596,570 d. Leaflet Package 5 2,625,270 2,972,004 3,715,006 9,312,280 13,126,350 14,860,020 18575030 46,561,400 4. Training of BKB-PADU TOT
- 1 batch = 30 participants (8 regions) - transport, perdiem, training kits.
Batch 50,000 5 5 250,000
5. BKB PADU training for administrators and BKB work groups
Batch
339 339 678
6. BKB-PADU training for officers in Family Planning, Health, National Education = 3 officers (organized by regencies)
Batch
15,000 212,850 212,850 425,700
7.BKB-PADU cadre training 1 village = 5 cadres
Batch
10,000 354,750 354,750 354,750 1,064,250
8. Developing BKB-PADU curriculum Activity 50,000 3 3 3 9 150,000 150,000 150,000 450,000 9. Developing BKB-PADU training materials Activity 50,000 3 3 3 9 150,000 150,000 150,000 450,000 10. Issuing SPM BKB-PADU Activity 50,000 1 1 1 3 50,000 50,000 60,000 150,000 11. Monitoring and Evaluation Activity /
year 20,000 3 3 3 9 60,000 60,000 60,000 180,000
12. Pilot projects of revitalization BKB-PADU Package
10,000 339 339 339 1,017 3,390,000 3,390,000 3,390,000 10,170,000
C. ADMINISTRATION 1. Improvement of community and NGO
participation as well as BKB-PADU cross-sectoral participation
Activity 5,000 6 (2 years x 3
activities)
15 (2 years x 3
activities)
15 (2 years x 3
activities)
36 30,000 75,000 75,000 180,000
2. Incentive giving to BKB group yearly Activity 1,000 254,158 282,726 359,657 901,541 254,158,000 287,726,000 359 657 000 901,541,000 3. POKJA meetings (yearly)
- National
Activity 5,000 4 4 4 12 20,000 20,000 20,000 60,000
- Provincial Activity 2,500 6 6 6 18 15,000 15,000 15,000 45,000 - Regency Activity 2,000 12 12 12 36 24,000 24,000 24,000 72,000 4. Partnership development with various
institutions via annual BKB meetings Activity 10,000 2 2 2 6 20,000 20,000 20,000 60,000
TOTAL 695,981,280 433,902,390 579,259,895 1,708,893,565 VI POSYANDU A. ACCESSIBILITY 1. Improvement and revitalization of
POSYANDU Institution 245,758 245,758 245,758 245,758
2. Early childhood programs in POSYANDU Freq. 2,457,580 2,457,580 2,457,580 7,372,740 3. Counseling programs Freq. 10 1,300,000 11,575,580 2,457,580 13,000,000 11.575,800 24,575,800

National Coordination Forum Education for All 2003
29
4. House-visitation Freq. 10 650,000 578,790 1,228,790 6,500,000 5,787,900 12,287,900 5. Exemplary food Freq. 10 650,000 578,790 1,228,790 6,500,000 5,787,900 12,287,900 6. Training Freq. 10 780,000 694,548 1,474,548 7,800,000 6,945,480 14,745,480 7. POSYANDU services for young children Person B. QUALITY 5 50,000 50,000 1. Meeting of the Team for the Guidelines
Development of Care Revitalization Freq. 10,000 5
2. Multiplication Piece 10 10,000 10,000 100,000 100,000,000 3. TOT Trainings for Cadre Revitalization at
the level of Province/Regency/Municipality Person 2,500 200 200 400 500,000 500,000 1,000,000
4. TOT Trainings for Cadre Revitalization at the level of PUSKESMAS
Person 50 4,000 3,243 7,243 200,000 162,150 362,150
5. Cadre Revitalization Posyandu 100 130,000 115,758 245,758 13,000,000 11,575,800 24,575,800 C. ADMINISTRATION
1. Village level meetings Package 100 40,000 30,950 70,950 4,000,000 3,095,000 7,095.00 2. Incentive giving to BKB group yearly - 3. Weighing scale (1x2) Piece 50 260,000 231,516 491,516 13,000,000 11,575,800 24,575,800 4. Weighing sling (1x2) Piece 10 520,000 463,032 983,032 5,200,000 4,630,320 9,830,320 5. Height scale (1x2) Piece 20 260,000 231,516 491,516 5,200,000 4,630,320 9,830,320 6. Health check card for the under-fives
(50x12) Piece 2 78,000,000 69,454,800 156,000,000 138,909,600 294,909,600
7. Registration book (1x12) Piece 10 1,560,000 1,389,096 2,949,096 15,600,000 13,890,960 29,490,960 8. Cadre guidelines (10x3) Piece 10 3,900,000 3,472,740 7,372,740 39,000,000 34,727,400 73,727,400 9. Counseling media (3x3) Set 10 1,170,000 1,041,822 2,211,822 11,700,000 10,418,220 22,118,220 10. Informational aid materials (3x3) Set 10 1,170,000 1,041,822 2,211,822 11,700,000 10,418,220 22,118,220 11. Cadre uniforms (10x10) Piece 25 13,000,000 11,575,800 24,575,800 325,000,000 289,395,000 614,395,000 12. High doze vit. A capsule Capsule 0 156,000,000 138,909,600 46,800,000 41,672,880 88,472,880 TOTAL 850,000 680,662,150 605,036,600 1,386,448,750 OVERALL COST 1,302,588,280 4,420,676,540 4,467,704,495 10,290,619,315

National Coordination Forum Education for All 2003
30
CHAPTER 3 BASIC EDUCATION
1. Introduction
Human resources development is one of the strategic efforts for national development. Experiences of the new emerging industrialized countries in East Asia have indicated the necessity that there be a critical mass in the area of education for the improvement of a national development. This means that there should be an attempt to build a certain percentage of the population with a specified level of education to nationally prepare a fast national economic and social development which can only be achieved with the support from high quality human resources.
The nine-year basic education program is one of the government’s efforts to create the critical mass. The program is implemented to build an Indonesian nation with, at least, basic knowledge and skills. This basic competence should enable graduates to either continue their schooling or start earning a living in the society. With the competence, people should be able to choose and utilize high-tech products, to interact and compete with others as well as with other nations. Therefore, the implementation of the nine year basic education program is aimed not only at reaching a targeted maximum participation rate but also at improving the quality of basic education which, at present, is below the national standard.
The nine year education program, set up in 1994, was planned for completion by the end of 2003/2004. This was intended as preparation for Indonesia to enter the global market: AFTA (Asia Free Trade Area) in 2003 and APEC in 2010. With the national crises the country is now facing, it seems that the plan will not materialize and a number of constraints arises including:
• The high rate of children aged 7-15 without education (3.6 millions) including the graduates from primary schools (SD/MI) who did not continue to junior high schools (SLTP/MT). This makes up 26% of the overall number of the graduates annually.
• The very high rate of dropouts from the nine-year basic education program. In year 2000/2001, there were approximately 1,267,000 dropouts: 929,700 from primary schools (SD/MI) and 338,000 from junior high schools (SLTP/MTs.).
• The high rate of retention among SD/MI students (1.51 millions in year 2000/2001) in comparison to the rate of retention among SLTP/Mts. students which was 23.600 in the same year.
• The low quality of basic education (both school and out-of school programs) as measured from students’ academic achievement –one of quality indicators for education.
These constraints have necessitated that the finalization target be extended into, at least, another five years. This means that the nine year basic education program should be finalized, at the latest, in year 2008/2009.
The action plan is intended as a reorientation towards the strategy for finalizing the nine-year basic education program by considering the condition and problems arising in the

implementation of compulsory education and proposing policies, strategies, and program for the finalization of the next basic education program with targets as follows:
• A minimum of 95% from the school age children (7-15 years old), especially girls, poor and marginalized children should get basic education covering the minimal standard for quality education in the year 2008/2009.
• Gender-equity in basic education, particularly in relation to access, learning qualities including curriculum content, learning materials, and the chances to continue to a higher level of education.
• Enhancement of all quality supporting aspects in basic education, especially those related to educational staff, teaching facilities, learning processes, and students’ learning achievements.
2. Framing primary education
This section will elaborate on the indicators of basic education which describe the conditions and levels of achievement of the basic education development as implemented by the central and local governments together with parents and society. The indicators include rates of participation, dropouts and retention as well as the quality level of education.
2.1 Participation Rates
• Primary School Level (SD/MI)
The rate of participation indicates that the primary school education program (SD/MI) has provided a relatively big number of educational services for children aged 7-12. The level of SD/MI nett participation in 2000/2001 was 94,56%. This means there were about 5.44% children aged 7-12 –about 1,515,000 children- who got partial or no primary
murnieducation, the rest got educational services in the SLTP/MTs. level.
If the age criterion is disregarded, SD/MI has provided education for more children than those in the age range of 7-12 years old. In year 2000/2001 the rate of gross participation for SD/MI would be 112,87. The higher rate of gross from nett participation indicates that there were children outside the 7-12 age range who studied at SD/MI. They were the
kasarNational Coordination Forum Education for All 2003
31
below 7 years old children comprising 10,28 % and the above 12 which made up 4.89%. Thus, 15.17% of SD/MI students were out of the 7-12 years age range.
In line with the priority of the compulsory basic education , children below 7 studying at SD/MI indicated that the school had the capacity to admit them. On the other hand, student above 12 who were still studying in SD/MI could mean 1) they started school late or above 7 years. About 42,18% new grade 1 students from 3.433.220 children in year 2000/2001 were above 8 years old. 2) they were grade repeaters who completed their primary education above 12 years old.

National Coordination Forum Education for All 2003
32
• Junior High School Level (SLTP/MTs.)
Education access to the SLTP/MTs. level was not as good as the SD/MI level. Out of 12,972,000 children aged 13-15 years old, ony 56,57 % had access to SLTP/MTs. However, in the same year all students from SD/MI to SLTA, school participation rate (APS) of 13-15 years old children reached 74,36%. This means that there were quite a number of children in that age range who did not get education (25,64%). Meanwhile, gross estimates for SLTP/MTs. I year 2000/2001 showed 73% of children out of the age range 13-15 years got education services in SLTP/MTs.
The low participation rate in the SLTP/MTs. level was due to the number of SD/MI graduates who continued to SLTP/MTs which in 2000/2001 reached 72,12%. Unlike SD/MI school age children who can automatically enroll to SD once they reach the standard school age, 13 years old children cannot automatically enroll to SLTP/MTs. Only graduates from SD/MI levels can be admitted to SLTP/MTs. Nonetheless, gross participation rates from 1998/1999 to 2000/2001 indicate a significant increase from 70.43% to 73.00%, with a yearly increase of 1.24% and 1.33%.
2.2 Graduation Rates
Graduation rates of the basic education program is presented in the form of a student flow in the basic education program (Figure 1). The flow should illustrate the proportion of students graduating from a certain educational cycle. The proportion of graduates implicitly indicates the achievement level of the implementation of the compulsory education program. In addition, the data from the two cycles in Fig. 1 show the progress in finalization of the basic education program in the different periods. The analysis on the two different perspectives of the finalization level of basic education programs is presented below.
First, the data of the student flow enrolling to SD in 1982/1983 and in 1992/1993 shows an improvement in the finalization level in the two periods. In two years’ time the graduation rate has increased 13.5%. The graduation rate from 1983/1983 was 32.1% which means from all first graders in 1982/1983 only 32.1% graduated from junior high schools (SLTP/MTs.) 9 years later. The cycle 1992/1993 to 2000/2001 the graduation level increased to 45.6%.

National Coordination Forum Education for All 2003
33
Figure 1
Flow of Students in the Basic Education Program
SD/MI SLTP/MTs. TIME INTERVAL
I VI Grad. MB I II Grad.
• 1982/83 – 1990/91
82/83
87/88
100%
68.8%
55.4%
88/89
42.3 42.8
90/91 34.6 32.1
• 1992/93 – 2000/01
92/93
97/98
100%
75.1
71.8
98/99
51.2 51.3
00/01 48.8 45.6

National Coordination Forum Education for All 2003
34
Second, from each flow chart it can be seen that there are students who have not finished the basic education program within the 9 years’ time. Only 32,2 % from all first graders of the 1982/83 elementary schools graduated from junior high schools (SLTP/MTs.) in 1990/1991. This means that the other 67.9% do not or have not completed their schooling within 9 years. The same phenomena recurred in the cycle of 1992/93 – 2000/01. Only 45.6% of the enrolled elementary school students graduated from junior high schools as scheduled. 54.4% could not finish their schooling within the nine year scheme of the basic education program.
These are probably due to three possible causes. One, there are students who had to repeat classes so they needed more than nine years to complete their basic education. Two, there are student dropouts, both at the primary and junior high levels, who are not accommodated in alternative education programs. Three, there are SD/MI graduates who do not continue their schooling to SLTP/MTs. These children who are not able to complete their basic education, especially those from SD/MI, have the potential to be illiterate citizens and become the future’s social burden.
Nevertheless, the student flow in the cycles of 1982/83 – 1990/91 and 1992/93 reveal an improvement in the graduation level of the basic education program as evidenced in the grade-repeater rates, dropout rates and rates of graduates continuing to higher educational levels, or a combination of each. The improvements are the positive impacts from the implementation on the nine-year basic education programs. However, the significant improvement should not deny the fact that the high rates of retention and dropouts –especially in the elementary level (SD/MI)- and the low percentage of primary school students continuing to SLTP/MTs. In year 2000/2001 dropout rates at the elementary schools were 2,62% and junior high schools 4,39%, anf rates of retention and dropouts were 5,90% and 0,31% respectively. Whereas the rate of SD/MI students continuing to SLTP/MTs. was only 72.12%.
2.3 Grade-repeater Rates
In year 2000/2001 the rate of retention for SD was 5.90%, whereas the same rate for SLTP/MTs. was considerably much lower : 0.45% for grade 1, 0.42% for grade 2 and 0.03% for grade 3. The high rate of retention, particularly in SD/MI, needs special attention because of the following reasons. First, high rates of retention would certainly affect the school completion level. Second, retention rates have an influential impact on dropout rates. Therefore, the high dropout rates in SD/MI and SLTP/MTs. should be dealt with seriously by an effective utilization of alternative educational institutions so that dropout problems do not necessarily mean cutting the access to basic education for children aged 7-15 year.

National Coordination Forum Education for All 2003
35
Grade-repeater Rates in Primary Schools (SD/MI) by Province
Above the National Rate (>5.9%) Below the National Rate (<5.9%)
1. East Kalimantan (6.00) 2. Nanggroe Aceh Darussalam (6.55) 3. Riau (6.71) 4. Central Java (6.77) 5. South Sulawesi (6.80) 6. West Nusa Tenggara (6.91) 7. Jambi (7.08) 8. North Sulawesi (7.30) 9. South Sumatera (7.37) 10. South East Sulawesi (7.51) 11. Bengkulu (7.72) 12. Central Kalimantan (8.21) 13. West Sumatera (8.95) 14. Central Sulawesi (9.07) 15. South Kalimantan (9.77) 16. West Kalimanatan (11.07) 17. Maluku (11.29) 18. East Nusa Tenggara (13.31) 19. Papua (13.48)
1. West Java (2.67) 2. Yogyakarta (2.79) 3. Jakarta (2.81) 4. Bali (3.39) 5. Lampung (5.04) 6. East Java (5.11) 7. North Sumatera (5.11)
Source: Primary School Statistics, 2001, PSP Balitbangdiknas
At the provincial level, the rate for elementary school dropouts varies ranging from a low 0.58% to as high as 8.53%. On the other hand, there are 8 provinces with dropout rates below the national rate (2.62%). West Java has the lowest rate below the national rate (0,58%) and West Nusa Tenggara has the highest (2.14%).
2.4 Drop-out Rates
Provincial dropout rates for SLTP/MTs. are also varied. Only 7 out of 27 provinces have dropout rates lower than the national rate (4.47%). Papua is one province with dropouts rate lower and number of graduates continuing to SLTP higher than the national rate. Among the provinces with rates below the national rate are Jakarta (1.86%) and West Sumatra (4.43%). At the same time, two provinces have higher dropout rates than the national rate (9%). They are the provinces of Riau (9.04%) and Bengkulu (9.58%).
2.5 Rate of Students’ Continuing to SLTP/MTs.
The number of SD/MI graduates continuing to SLTP/MTs. significantly increases. In 1994/1995, the rate was 66.84% and in 1999/2000 it increases to 71.83%. In year 2000/2001, the rate became 74.35%.
The relatively low rate of students’ continuing from SD/MI to SLTP/MTs. indicates that a percentage of 25.65% SD/MI graduates has not got access to SLTP/MTs. If they did not continue to any alternative educational institutions, then in 2000/2001 there would be 742,600 SD/MI graduates who terminated their education from the schooling system. (Balitbang Diknas, 2001).

National Coordination Forum Education for All 2003
36
Rates of Students Continuing to SLTP/MTs across Provinces
No Lower than National Rate Higher than National Rate
1 West Java Jakarta 2 Central Java Yogyakarta 3 West Sumatera East Java 4 R i a u Nanggroe Aceh Darrusalam 5 J am b i North Sumatera 6 South Sumatera Bengkulu 7 Lampung East Kalimantan 8 West Kalimantan North Sulawesi 9 Central Kalimantan South East Sulawesi
10 South Kalimantan Maluku 11 Central Sulawesi B a l I 12 South Sulawesi Papua 13 West Nusa Tenggara 14 East Nusa Tenggara
Source: Primary School Statistics, 2001, PSP Balitbangdiknas
Yet, on the other hand, there are 14 provinces with lower rates of students continuing to SLTP than the national rate. South Kalimantan has the lowest rate of 57.80%. It should be noted that the rates of Jakarta and Yogyakarta are above 100% as they become destinations of graduates from other provinces to continue their schooling. This might explain the lower rates of the Provinces of West Java and Central Java.
3. Education Quality
3.1 Primary School Level (SD/MI)
The indicator for the quality of education is the Index of National Exit Exam (NEM). Based on the NEM data of 1997/1998 , the national average NEM for all subject was 6.11. Education quality among provinces is quite varied. Out of 26 provinces, 15 provinces (58%) had higher NEM than the national score.
From another perspective, an analysis on the mastery of learning materials could also be conducted by using the indicator on the 60% mastery of the national curriculum. A NEM of 6.0 would represent a 60% mastery of the learning materials. Then, this means that 17 provinces on the average fitted into the classification with the highest NEM was achieved by North Sumatera. Nine other provinces have, on the average, a lower than 60% mastery of learning materials among their SD graduates.
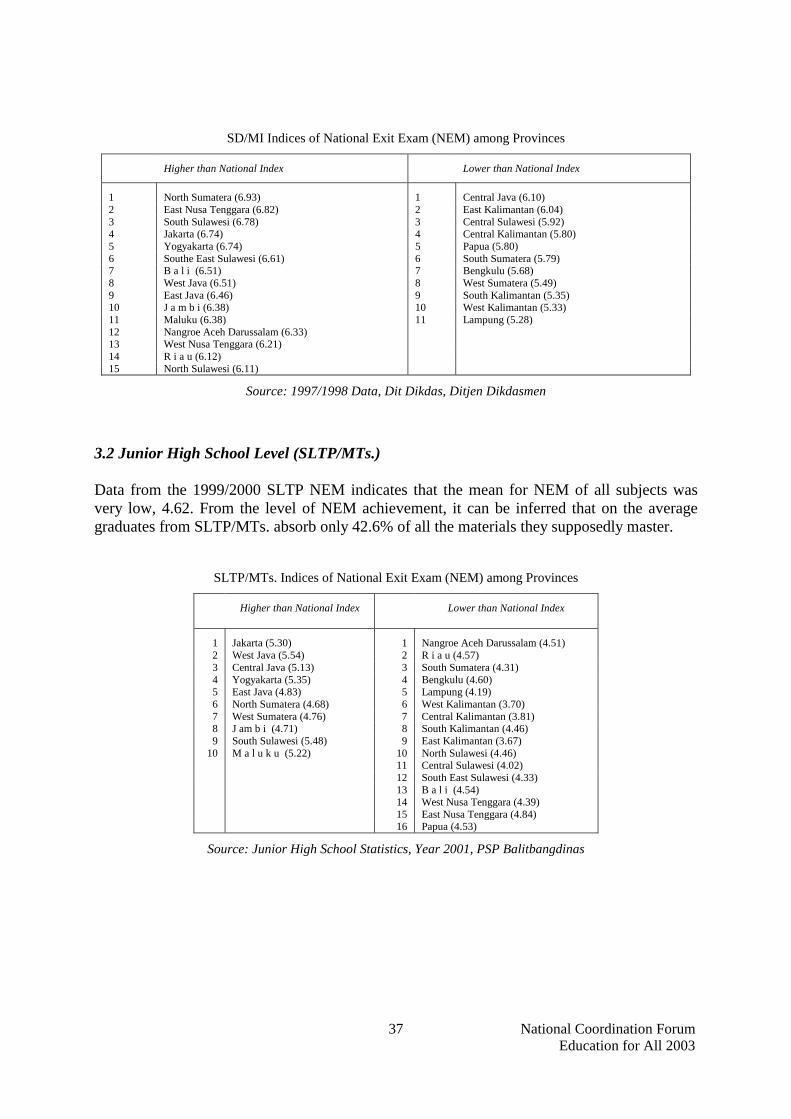
National Coordination Forum Education for All 2003
37
SD/MI Indices of National Exit Exam (NEM) among Provinces
Higher than National Index Lower than National Index
1 North Sumatera (6.93) 1 Central Java (6.10) 2 East Nusa Tenggara (6.82) 2 East Kalimantan (6.04) 3 South Sulawesi (6.78) 3 Central Sulawesi (5.92) 4 Jakarta (6.74) 4 Central Kalimantan (5.80) 5 Yogyakarta (6.74) 5 Papua (5.80) 6 Southe East Sulawesi (6.61) 6 South Sumatera (5.79) 7 B a l i (6.51) 7 Bengkulu (5.68) 8 West Java (6.51) 8 West Sumatera (5.49) 9 East Java (6.46) 9 South Kalimantan (5.35) 10 J a m b i (6.38) 10 West Kalimantan (5.33) 11 Maluku (6.38) 11 Lampung (5.28) 12 Nangroe Aceh Darussalam (6.33) 13 West Nusa Tenggara (6.21) 14 R i a u (6.12) 15 North Sulawesi (6.11)
Source: 1997/1998 Data, Dit Dikdas, Ditjen Dikdasmen
3.2 Junior High School Level (SLTP/MTs.)
Data from the 1999/2000 SLTP NEM indicates that the mean for NEM of all subjects was very low, 4.62. From the level of NEM achievement, it can be inferred that on the average graduates from SLTP/MTs. absorb only 42.6% of all the materials they supposedly master.
SLTP/MTs. Indices of National Exit Exam (NEM) among Provinces
Higher than National Index Lower than National Index
1 Jakarta (5.30) 1 Nangroe Aceh Darussalam (4.51) 2 West Java (5.54) 2 R i a u (4.57) 3 Central Java (5.13) 3 South Sumatera (4.31) 4 Yogyakarta (5.35) 4 Bengkulu (4.60) 5 East Java (4.83) 5 Lampung (4.19) 6 North Sumatera (4.68) 6 West Kalimantan (3.70) 7 West Sumatera (4.76) 7 Central Kalimantan (3.81) 8 J am b i (4.71) 8 South Kalimantan (4.46) 9 South Sulawesi (5.48) 9 East Kalimantan (3.67)
10 M a l u k u (5.22) 10 North Sulawesi (4.46) 11 Central Sulawesi (4.02) 12 South East Sulawesi (4.33)
13 B a l i (4.54) 14 West Nusa Tenggara (4.39) 15 East Nusa Tenggara (4.84) 16 Papua (4.53)
Source: Junior High School Statistics, Year 2001, PSP Balitbangdinas

National Coordination Forum Education for All 2003
38
The level of SLTP/MTs. education quality varies among provinces. Out of 26 provinces, only ten (38%) had a NEM average higher than the national NEM. Six provinces reached NEM scores higher than 5 with West Java as the highest NEM getter of 5.54 and West Kalimantan had the lowest NEM score of 3.67. The nationally low mean of NEM score indicates the necessity to placing a higher priority on the efforts of improving education quality at the SLTP/MTs. level. This low achievement in the six provinces means that a concerted effort is necessary for the improvement of education quality in the provinces with NEM scores lower than the national NEM.
The SLTP/MTs. national exam results can be categorized into (a) very good for NEM>7.5, (b) good for NEM between 6.5 - 7.5, (c) average for NEM 5.5 - <6.5, (d) poor for NEM 4.5 - <5.5, (e) very poor for NEM below 4.5. Data from year 2000/2001 shows that only 0.03% (6 SLTP/MTs.) can be categorized as very good; 2.14% (380 schools) fall into good; 21.95% (3882 schools) average:; 68,37% (12,089 schools) poor. The rest or 7.84% falls into the category very poor.
If NEM in the average category is considered as reflecting the results of quality education, then access to education in year 2000/2001 was very limited. Only 24.12% from all existing junior high schools fall into the average category and above. This means any effort for the improvement of quality education should be focused on the 75.88% which leaves 2.17% as a reflection of the available access to quality education.
4. Access for girls and children with special needs
4.1 Educational Access for Girls
Nationwide, the access to education in general shows a fair distribution for both boys and girls. In year 1999/2000 gross Participation Rate for girls in SD/MI was 104.84% and in SLTP/MTs. 70.88% which reveals a very slight difference from the Participation Rate for boys (108.82% in SD/MI and 72.66% in SLTP/MTs.)

National Coordination Forum Education for All 2003
39
Participation Rate for Girls in SD/MI 1999/2000
Participation Rate Province >94.20 <94.20
1. Jakarta 2. West Java 3. Central Java 4. Yogyakarta 5. East Java 6. N Aceh Darussalam 7. North Sumatra 8. West Sumatra 9. Riau 10. Jambi 11. South Sumatera 12. Bengkulu 13. Lampung 14. West Kalimantan 15. Central Kalimantan 16. South Kalimantan 17. East Kalimantan 18. North Sulawesi 19. Central Sulawesi 20. South Sulawesi 21. South East Sulawesi 22. Maluku 23. Bali 24. West Nusa Tenggara 25. East Nusa Tenggara 26. Papua
96.70 97.60 97.70 98.80
99.70 94.20
95.00
97.30 96.40
94.50
95.00 98.80
96.60 99.20
88.00 93.50
93.00 92.70
90.90 91.00 90.10
87.90
91.10
93.60
83.80 73.90
Number of Provinces 14 12
Source:National education Information Internationalization, PSP Balitbang Diknas
The number of students shows that female students comprise 48.33% of the population. The annual progress shows a relatively stable rate with an insignificant increase from 48.26% in 1993/1994 to 48.33% in 1999/2000. The same thing happens in the SLTP/MTs. level. The percentage of female students shows a relatively slight increase from 46.52% in 1993/1994 to 48.22% in 1999/2000.
Analyses of participation rates among provinces disclose that there are 12 provinces with lower participation rates than the national rate for female students aged 7-12, and 14 other provinces have higher participation rates. The highest rate was for Riau (99.70%) and the lowest for Papua (73.90%) which shows a comparatively big gap from the participation rate for male students in Papua (91.40%).
The varied levels of access to education for girls in SD/MI indicate the necessity of a nationally concerted effort to increase the access to education for girls. Provinces with the lower rates should get a higher priority in the effort of increasing access to education for girls.
4.2 Educational Access for Children with Special Needs
In year 2000/2001 there were 1,287 educational institutions for Children with Special Needs comprising Schools for Children with Special Needs (Sekolah Luar Biasa/SLB), Elementary Schools for Children with Special Needs (Sekolah Dasar Luar Biasa) and Integrated Schools (Sekolah Terpadu). 32.56% of them are public schools. This means education for children with special needs is provided by non-government (private) institutions. The number of students having access to the three types of educational institutions is 49.647 children.

National Coordination Forum Education for All 2003
40
Schools and Students with Specials Needs
Govern. Private Total School Schools for Children with Special Needs (Sekolah Luar Biasa/SLB) Elementary Schools for Children with Special Needs (Sekolah Dasar Luar Biasa) Integrated Schools (Sekolah Terpadu)
38
228
153
419
837
0
31
868
875
228
184
1,287
Student Schools for Children with Special Needs (Sekolah Luar Biasa/SLB) Elementary Schools for Children with Special Needs (Sekolah Dasar Luar Biasa) Integrated Schools (Sekolah Terpadu)
3,162
9,868
874
13,904
35,665
0
78
35,743
38,827
9,868
952
49.647
Source: Staticitics of Education for Children with Special Needs, 2001, PSP Balitbangdiknas
The 875 Schools for the Special Needs consist of 52 schools for the visually impaired, 106 schools for the hearing impaired, 15 schools for the mentally impaired, 12 schools for …………….., 5 schools for the ……… and 517 schools for children with various special needs.
The number of students in Schools for Children with Special Needs from 1998/1999 to 2000/2001 indicates an increase. The total number of students in those years respectively were 36.849, 37.460, and 38.827. Whereas the increase for Elementary School for Children with Special Needs in the same years were 9,090, 9,621 and 9,868. Integrated Schools show a more fluctuating increase in the same years the numbers were 961, 922 and 952.
5. Policies and finalization strategies
Even though the implementation of the nine year basic education, especially in the first four years of its implementation, was relatively successful, some constraints and problems need resolutions as discussed in the previous sections. Therefore, the policies, strategies, and programs for the finalization scheme for the next basic education program should take the above discussion into account.
5.1 Policies for Basic Education
Conditions and problems as described in the previous sections necessitate the formulation of policies for basic education as follows:
• Opening up more access and opportunities for all children in the basic education age, especially those from poor and isolated areas and communities;
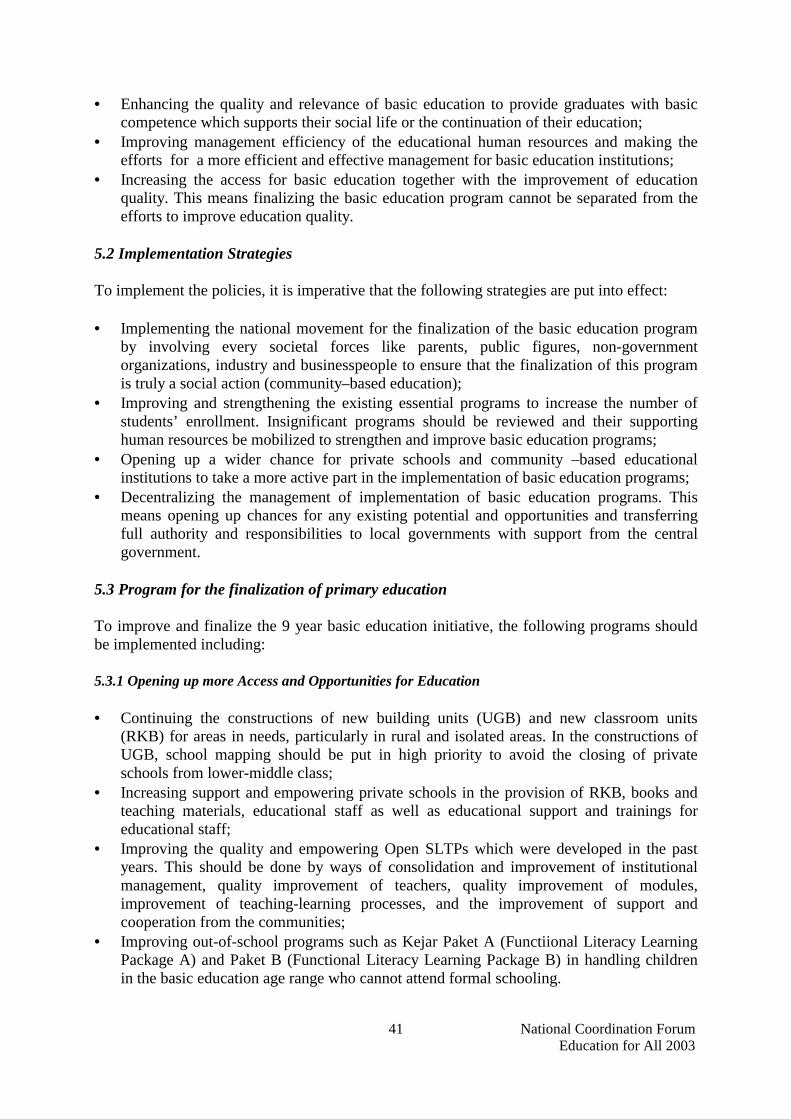
National Coordination Forum Education for All 2003
41
• Enhancing the quality and relevance of basic education to provide graduates with basic competence which supports their social life or the continuation of their education;
• Improving management efficiency of the educational human resources and making the efforts for a more efficient and effective management for basic education institutions;
• Increasing the access for basic education together with the improvement of education quality. This means finalizing the basic education program cannot be separated from the efforts to improve education quality.
5.2 Implementation Strategies
To implement the policies, it is imperative that the following strategies are put into effect:
• Implementing the national movement for the finalization of the basic education program by involving every societal forces like parents, public figures, non-government organizations, industry and businesspeople to ensure that the finalization of this program is truly a social action (community–based education);
• Improving and strengthening the existing essential programs to increase the number of students’ enrollment. Insignificant programs should be reviewed and their supporting human resources be mobilized to strengthen and improve basic education programs;
• Opening up a wider chance for private schools and community –based educational institutions to take a more active part in the implementation of basic education programs;
• Decentralizing the management of implementation of basic education programs. This means opening up chances for any existing potential and opportunities and transferring full authority and responsibilities to local governments with support from the central government.
5.3 Program for the finalization of primary education
To improve and finalize the 9 year basic education initiative, the following programs should be implemented including:
5.3.1 Opening up more Access and Opportunities for Education
• Continuing the constructions of new building units (UGB) and new classroom units (RKB) for areas in needs, particularly in rural and isolated areas. In the constructions of UGB, school mapping should be put in high priority to avoid the closing of private schools from lower-middle class;
• Increasing support and empowering private schools in the provision of RKB, books and teaching materials, educational staff as well as educational support and trainings for educational staff;
• Improving the quality and empowering Open SLTPs which were developed in the past years. This should be done by ways of consolidation and improvement of institutional management, quality improvement of teachers, quality improvement of modules, improvement of teaching-learning processes, and the improvement of support and cooperation from the communities;
• Improving out-of-school programs such as Kejar Paket A (Functiional Literacy Learning Package A) and Paket B (Functional Literacy Learning Package B) in handling children in the basic education age range who cannot attend formal schooling.
National Coordination Forum Education for All 2003
42
• Optimizing the implementation of basic education in traditional religious schooling like salafiah pesantren, madrasah diniyah ula (primary school level), madrasah dinyah wustha (junior high school level) by adding three core subject matters: Bahasa Indonesia, Mathematics and Natural Science;
• Consolidating Small SD (SD Kecil), One Teacher Primary School (SD Satu Guru), Small SLTP (SLTP Kecil) and Integrated SLTP (SLTP Terpadu) to enable and empower these schools in the efforts for the improvement of the provision of educational services for those who need schooling;
• Improvement of educational services for 7-15 years old children who constitute the special targets in the nine-year basic education: children from remote areas, slums, street children, and children who have no access to education.
5.3.2 Enhancing Education Quality and Relevance
• Revising basic education curriculum so as to provide students with minimum basic skills, implement mastery learning and instill as well as raise in students creativity, innovative attitudes, sense of democracy and independence, and revise the educational evaluation system;
• Giving skills instructions to students in the basic education program so that they master a certain skill or more to survive in real life;
• Improving the qualification, competence and professionalism of educational staff to suit the need of basic education by ways of education and training in teachers; training institutions (LPTK) and professional training institutions. To prepare prospective teachers, LPTK has to improve its system in the provision of educational staff covering the systems of recruitment, learning, and field-practice;
• Continuing the efforts to improve the qualifications of teachers in SD/MI and SLTP/MTs., and provide certification for teachers who do not teach their own specific subject so that they can get at least a college level education. These efforts should be made in collaboration with the government and local universities with required qualifications or by way of distance learning;
• Continuing the provision of contract teachers to overcome the shortage of teachers in areas in need. However, the provision of contract teachers is focused on meeting the required qualifications and competence;
• Setting the standards for the quality of and necessary facilities as requirements for every basic education institution for optimum teaching-learning processes;
• Continuing the pilot project of School-based Quality Improvement Management (MPMBS) in SD/MI and SLTP/MTs. so that schools can plan for a continuous and gradual achievement of the quality targeted;
• Creating a competitive and cooperative atmosphere among schools for the quality advancement and improvement of schools and students.
5.3.3 Improving the Efficiency of Educational Management
• To make the efforts that students do not drop out of schools by providing scholarships for SD and SLTP students in need, providing operational support funds (DBO) for schools in poor areas;
• To reduce as much as possible the number of grade repeaters, especially in the SD/MI level, so that the number of dropouts can be decreased as well. This should be done without sacrificing the quality of education the students supposedly receive;
National Coordination Forum Education for All 2003
43
• Continuing programs for the consolidations and revitalization of schools, in particular primary schools in close distance with relatively a small number of students, to ensure an optimally efficient and effective utility of educational human resources in those schools;
• Consolidating school leadership as the major component of educational management in implementing educational activities at the school level for more independent, creative and innovative schools;
• Improving educational management at the regional level by strengthening and improving the capacity and professionalism of educational administrators at the regency/municipality level;
• Socializing and establishing School Councils at the regencies/municipalities and School Committees in SD/MI and SLTP/MTs. levels to function as an advisory board in educational policy makings, to support the implementation and management of educational programs, to supervise school performance, and to mediate between education communities and educational administrators.
5.3.4 Financing basic education
Basic education is financed based on two major indicators: (1) operational costs, and (2) investments costs for SD/MI and SLTP/MTs. levels both at school and out-of-school tracks including pesantren.
Operational costs consist of production costs (teachers’ salaries and incentives, books, teaching aids and learning facilities, school maintenance and sanitary costs, service fees), and extra costs for the improvement of education quality (improvement programs for teacher qualification, competence, and programs for the improvement of school libraries).
Investment costs comprise provisions of new school units (USB), new classroom units (RKB), libraries, laboratories and their equipment, school rehabilitation, provision of teacher aides, library books, scholarship programs to take care of children-at-risk and to open up more access to educational facilities.
Details for the financing of basic education is calculated yearly beginning from 2004 to 2008 at the national, provincial and district levels. If the finalization of the nine-year basic education program targeted for 2008/2009 is, at least, the same as the SD/MI level Gross Participation Rate (APK) target in year 2001, while for SLTP/MTs. level the APK is 95% or APS 98%, then the financing of basic education would need 247 trillion rupiahs (including 122 trillion rupiahs for teachers’ salary) which consist of the financing of SD/MI and its equivalence (140 trillions) and SLTP/MTs. (122 trillions). If we exclude teachers’ salary, which is included in the local government routine budget, then the country would have to provide 125 trillion for basic education in the five years to come (year 2004-2998) for the finalization of quality basic education programs. This means an average of 25 trillions a year. This amount of funding is yet to be divided among regional, provincial and central governments, including the public’s share.
Unit costs for each activity in the basic education program up to year 2008/2009 can be checked in the enclosed documents.

National Coordination Forum Education for All 2003
44
CHAPTER 4 LITERACY EDUCATION
1. Introduction
Essentially, Dakar Convention refers to “the attainment of 50 percent increase in adult literacy, particularly women, in the year 2015. It also provides equal access to elementary and continuous education (pendidikan berkelanjutan) for all adults.”
For Indonesia, the target to be met in 2015 is “the attainment of 50 percent increase in adult literacy, namely women and people aged 15 and over, as well as the provision of equal access to elementary and continuous education for all adults.”
To evaluate the implementation of literacy education, literacy indicator is used, that is, the ratio of literates aged 15 and over to the total adult population (aged 15 and over).
Number of literates aged 15 and over Literacy rate of population aged 15 and over : Total population aged 15 and over
x 100%
Another indicator used is illiteracy rate, which refers to the ratio of illiterates to the total population falling into a certain age group. Illiteracy rate can be calculated by subtracting 100 percent by literacy rate (or vice versa).
Number of illiterates aged 15 and over Illiteracy rate of populacion aged 15 and over : Total population aged 15 and over
x 100%
Or Illiteracy rate of population aged 15 and over = 100% - literacy rate of population aged 15 and over
2. National Implementation in the year 2000
2.1 Current Literacy Condition
In the year 2000, 10.81 percent of adult population, that is 15.51 million people, was still illiterate (Table 3). If we classify them according to age groups, literacy rates among the youths were higher than those of the elderly. In 2000, illiteracy rate of people between 15-25 years old was only 1.57 percent, while illiteracy rate of people aged 45 and over was still 28.57 percent. Low illiteracy rates among the youths were mainly due to bigger participation of formal education.
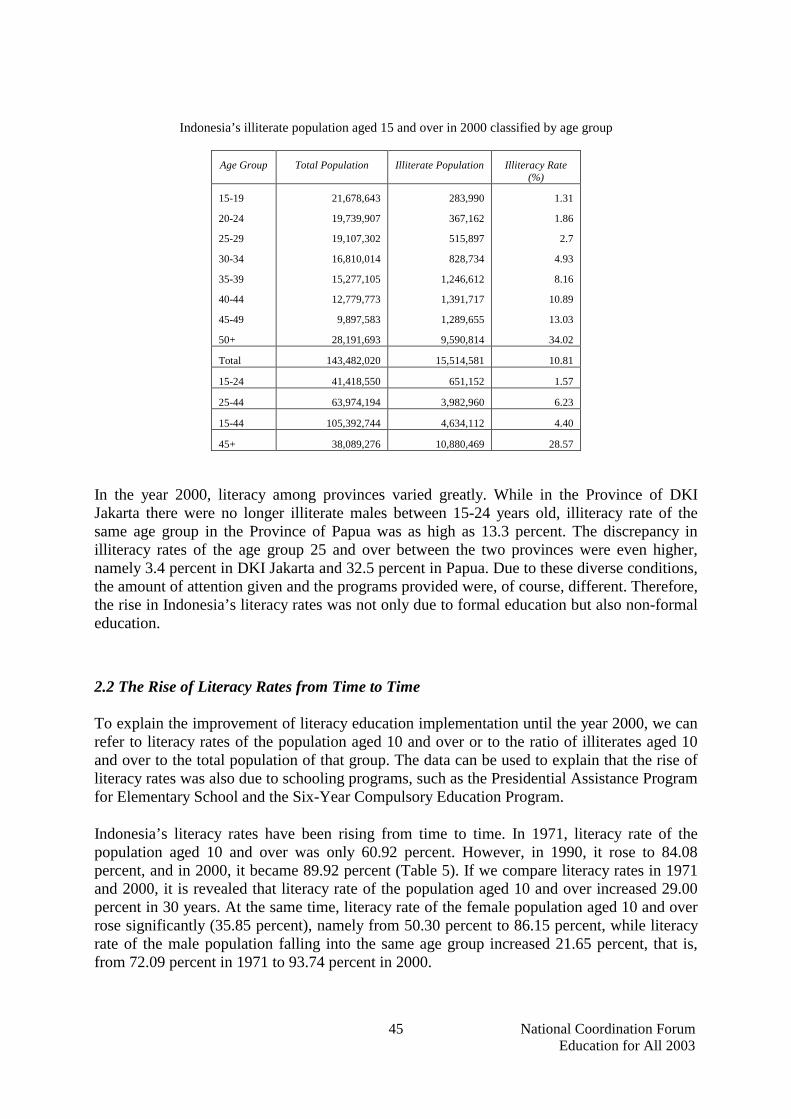
National Coordination Forum Education for All 2003
45
Indonesia’s illiterate population aged 15 and over in 2000 classified by age group
Age Group Total Population Illiterate Population Illiteracy Rate
(%)
15-19
20-24
25-29
30-34
35-39
40-44
45-49
50+
21,678,643
19,739,907
19,107,302
16,810,014
15,277,105
12,779,773
9,897,583
28,191,693
283,990
367,162
515,897
828,734
1,246,612
1,391,717
1,289,655
9,590,814
1.31
1.86
2.7
4.93
8.16
10.89
13.03
34.02
Total 143,482,020 15,514,581 10.81
15-24 41,418,550 651,152 1.57
25-44 63,974,194 3,982,960 6.23
15-44 105,392,744 4,634,112 4.40
45+ 38,089,276 10,880,469 28.57
In the year 2000, literacy among provinces varied greatly. While in the Province of DKI Jakarta there were no longer illiterate males between 15-24 years old, illiteracy rate of the same age group in the Province of Papua was as high as 13.3 percent. The discrepancy in illiteracy rates of the age group 25 and over between the two provinces were even higher, namely 3.4 percent in DKI Jakarta and 32.5 percent in Papua. Due to these diverse conditions, the amount of attention given and the programs provided were, of course, different. Therefore, the rise in Indonesia’s literacy rates was not only due to formal education but also non-formal education.
2.2 The Rise of Literacy Rates from Time to Time
To explain the improvement of literacy education implementation until the year 2000, we can refer to literacy rates of the population aged 10 and over or to the ratio of illiterates aged 10 and over to the total population of that group. The data can be used to explain that the rise of literacy rates was also due to schooling programs, such as the Presidential Assistance Program for Elementary School and the Six-Year Compulsory Education Program.
Indonesia’s literacy rates have been rising from time to time. In 1971, literacy rate of the population aged 10 and over was only 60.92 percent. However, in 1990, it rose to 84.08 percent, and in 2000, it became 89.92 percent (Table 5). If we compare literacy rates in 1971 and 2000, it is revealed that literacy rate of the population aged 10 and over increased 29.00 percent in 30 years. At the same time, literacy rate of the female population aged 10 and over rose significantly (35.85 percent), namely from 50.30 percent to 86.15 percent, while literacy rate of the male population falling into the same age group increased 21.65 percent, that is, from 72.09 percent in 1971 to 93.74 percent in 2000.
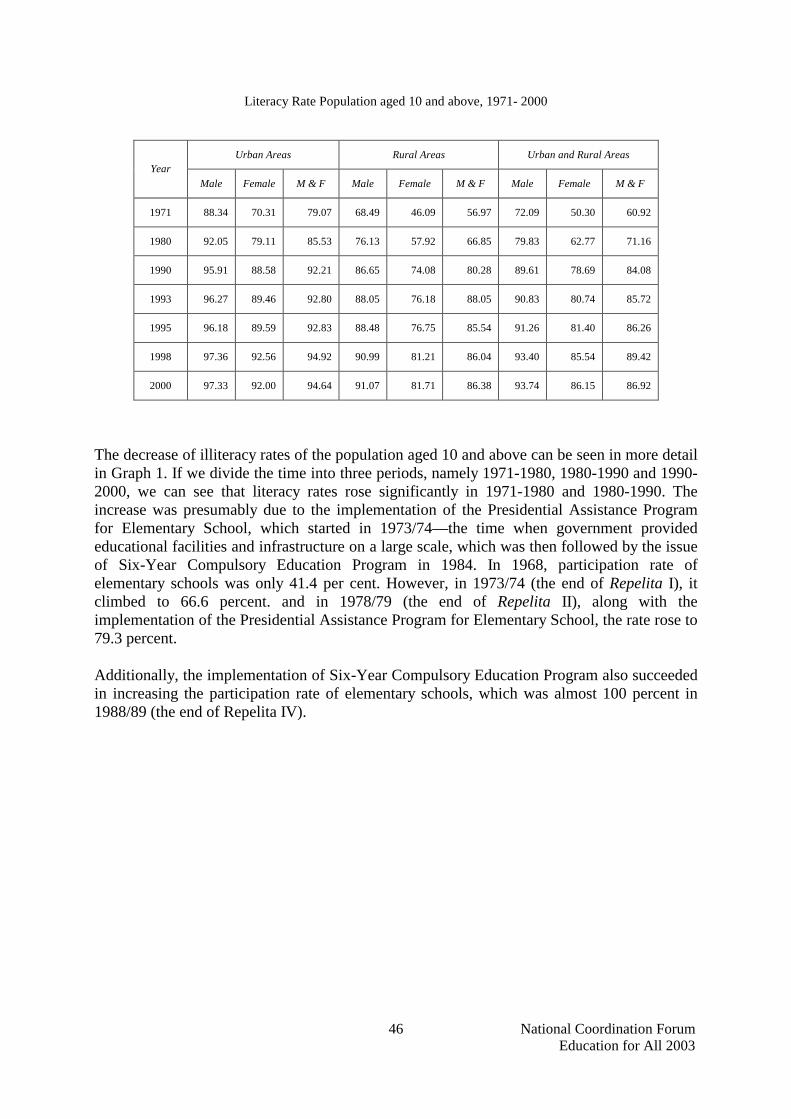
National Coordination Forum Education for All 2003
46
Literacy Rate Population aged 10 and above, 1971- 2000
Urban Areas Rural Areas Urban and Rural Areas Year
Male Female M & F Male Female M & F Male Female M & F
1971 88.34 70.31 79.07 68.49 46.09 56.97 72.09 50.30 60.92
1980 92.05 79.11 85.53 76.13 57.92 66.85 79.83 62.77 71.16
1990 95.91 88.58 92.21 86.65 74.08 80.28 89.61 78.69 84.08
1993 96.27 89.46 92.80 88.05 76.18 88.05 90.83 80.74 85.72
1995 96.18 89.59 92.83 88.48 76.75 85.54 91.26 81.40 86.26
1998 97.36 92.56 94.92 90.99 81.21 86.04 93.40 85.54 89.42
2000 97.33 92.00 94.64 91.07 81.71 86.38 93.74 86.15 86.92
The decrease of illiteracy rates of the population aged 10 and above can be seen in more detail in Graph 1. If we divide the time into three periods, namely 1971-1980, 1980-1990 and 1990-2000, we can see that literacy rates rose significantly in 1971-1980 and 1980-1990. The increase was presumably due to the implementation of the Presidential Assistance Program for Elementary School, which started in 1973/74—the time when government provided educational facilities and infrastructure on a large scale, which was then followed by the issue of Six-Year Compulsory Education Program in 1984. In 1968, participation rate of elementary schools was only 41.4 per cent. However, in 1973/74 (the end of Repelita I), it climbed to 66.6 percent. and in 1978/79 (the end of Repelita II), along with the implementation of the Presidential Assistance Program for Elementary School, the rate rose to 79.3 percent.
Additionally, the implementation of Six-Year Compulsory Education Program also succeeded in increasing the participation rate of elementary schools, which was almost 100 percent in 1988/89 (the end of Repelita IV).

National Coordination Forum Education for All 2003
47
Graph 1. Decline of illiteracy rates (population aged 10 and above)
Considering that reading and writing skills are largely acquired by children in elementary school, it is therefore obvious that the increase in participation rate of elementary education plays an important role in enhancing literacy among people aged 10 and above. This fact is proven by the dramatic decrease in illiteracy rates among youths between 10-14 years old (Graph 2). The graph shows that illiteracy rates decrease significantly until late 1980s, when the participation rate of elementary schools reached almost 100 percent. Besides that, the discrepancy in literacy rates between males and females continued to decline, which among others was due to the increasing number of females participating in education, particularly in elementary schools.
The graph also indicates that illiteracy rates of older age groups, especially women, also dropped significantly. People between 25-29 years old experienced a dramatic decrease in illiteracy rate, dropping from 44.86 percent in 1971 to 12.81 percent in 1990. The lowest decline occurred among people between 40-44 years old. The percentage of illiterate women belonging to this age group dropped from 73.58 in 1971 to 31.2 in 1990.
60 50 40 30 20 10 0
1971 1980 1990 1993 1995 1998 2000
laki-laki perempuan laki-laki & perempuan

National Coordination Forum Education for All 2003
48
Graph 2. Illiteracy rates of population aged 10-14
Graph 3. Illiteracy rates of female population aged 25-44
Based on the data above, it is assumed that the sluggish decline of illiteracy rate since 1990 was due to the existence of resisting group in the society. The resisting group consists of the middle-aged and the elderly (45 years old and above), the disabled and the people residing in remote areas; hence, it is difficult to provide educational services to these people. The difficulty arises from both internal factors, such as lack of motivation and ability to learn, and external factors, such as inefficiency of formal and non-formal education as well as limited

National Coordination Forum Education for All 2003
49
literacy education services. It is difficult to provide literacy education, which is usually done in learning groups, to illiterates living in dispersed, remote areas. Another resisting group consists of people who are not yet aware of the importance of literacy as basic competence to gain an added value in daily life, including in enhancing productivity.
2.3. Diverse Literacy Rates
2.3.1 Based on household expenditure
Based on the National Socio-economic Census in 1995, 1998 and 2002, it is revealed that people’s economic status, measured by the amount of household expenditure, has a great impact on literacy rates. Chart 4 indicates that the higher economic status in the society, the higher the literacy rate. Sex also influences literacy rates. In 1995, when literacy rate of the poorest male population (quintile 1) was only 80 percent, literacy rate of the richest male population (quintile 5) already reached 96.2 percent. Literacy rates of all groups increased consistently; hence, in 2002, the poorest group reached 86.6 percent, while the richest one rose to 97.9 percent.
Chart 4. Literacy rates of population aged 15 and above classified by sex 1995-2002

National Coordination Forum Education for All 2003
50
At the same time, literacy rates of the female population (of all groups) also increased remarkably. While literacy rate of the poorest group increased from 64.2 percent to 75.7 percent, the wealthiest one rose from 90.4 percent to 93.5 percent. Nevertheless, comparing by sex, it is revealed that, in general, female literacy rates were still much lower than those of males. Women falling into the poorest group had the lowest literacy rate.
Literacy rates classified by household expenditure can also be compared to those by residence (urban vs. rural areas). Chart 5 shows that literacy rates in urban areas are generally higher than those in rural areas. Nevertheless, literary rates of people in urban and rural areas increased simultaneously from 1995 until 2002. In 1995, literacy rate of the poorest group aged 15 and above in urban areas was 78.8 percent and the richest group 95.0 percent, while in 2002, the rate rose to 83.7 percent for the poorest group and 97.2 percent for the wealthiest group.
Chart 5. Literacy rates of population aged 15 and above classified by residence, 1995-2002
If literacy rates were measured specifically among people between 15-24 years old, we would find that the rates of this age group remained stagnant. This was due to the high literacy rates of that age group, and those who were still illiterate are presumed to be the disabled and the ones residing in remote places, where educational services were unavailable. In 1995, literacy rates of the people aged 15-24 living in urban areas already reached 96.5 percent for the poorest group and 99.3 percent for the richest group. In rural areas, the rates reached up to 93.0 percent for the poorest group and 99.3 percent for the wealthiest group. Through various efforts made by the people falling into that age group, in 2002 literacy rates in urban areas climbed to 97.9 percent for the poorest group and 99.6 percent for the richest group, whereas in rural areas the rates rose to 96.3 percent for the poorest group and 98.8 percent for the wealthiest group.

National Coordination Forum Education for All 2003
51
Chart 6. Literacy rates of population aged 15-24 classified by residence. 1995-2002
If we compare literacy rates of the male population between 15-24 years old to those of female falling into the same age group, we can see that their literacy rates do not differ much (Chart 7). However, measured according to their income, it is revealed that literacy rates of the female population aged 15-24 were still much lower in comparison to those of the male population. This is shown in the data obtained in the year 2002, which indicates 99.3 percent literacy rate of the female population falling into the highest-expenditure group and 96.3 percent literacy rate of the female population falling into the lowest-expenditure group.
National Coordination Forum Education for All 2003
52
Chart 7. Literacy rates of population aged 15-24 classified by sex, 1995-2002
2.3.2 Based on provinces
Literacy rates of the population between 10-44 years old varied from province to province, as illustrated by Graph 8. The graph shows that in the year 2000, there were seven provinces whose literacy rates, both of the male and female populations, were below the national average. These seven provinces were Papua, Nusa Tenggara Barat, Nusa Tenggara Timur, Kalimantan Barat, Sulawesi Selatan, Sulawesi Tenggara and Jawa Timur. Meanwhile, Bali was the province whose literacy rate of the female population was lower than the national average, whereas Kalimantan Tengah was the one with male literacy rate was lower than the national average.
Graph 8. Diversity in literacy rates of population aged 10-44 among provinces in the year 2000

National Coordination Forum Education for All 2003
53
While the data concerning illiterates between 15-24 years old classified by provinces and sex are illustrated in the form of quadrant, their dispersion can be seen in Picture 9. Since the national average of female illiteracy rate was 1.9 percent and male illiteracy rate 1.3 percent, there were, therefore, eight provinces whose illiteracy rates of male and female populations were higher than the national average. These provinces were Papua, Nusa Tenggara Timur, Nusa Tenggara Barat, Sulawesi Selatan, Kalimantan Barat, Jawa Timur, Sulawesi Tenggara and Sulawesi Tengah. Meanwhile, Bali and Bengkulu had higher illiteracy rates of female population but lower male illiteracy rates than those of the national average.
Picture 9. Diversity in literacy rates of population aged 15-24 among provinces in the year 2000
2.4 Continuous education for all adults
Elementary education for adults is implemented through “equivalent education” (pendidikan kesetaraan). Continuous education, on the other hand, is basically retraining to adjust people’s skills, knowledge and insights to the development taking place in skill courses, apprenticeship and learning groups. These three patterns will be further discussed under “Life Skills”.
Elementary education for adults is divided into two programs, namely Package A program (equivalent to elementary school/SD) and Package B program (equivalent to junior high school/SLTP). Package A and Package B are learning programs consisting of three patterns of learning, namely independent learning, peer-group learning and guided learning. Unlike the learning process at school, which relied heavily on teachers, the materials of Package A and Package B programs were given in the form of modules, hence reinforcing independent learning processes. Meetings with tutors to discuss difficult materials were held three times a week.
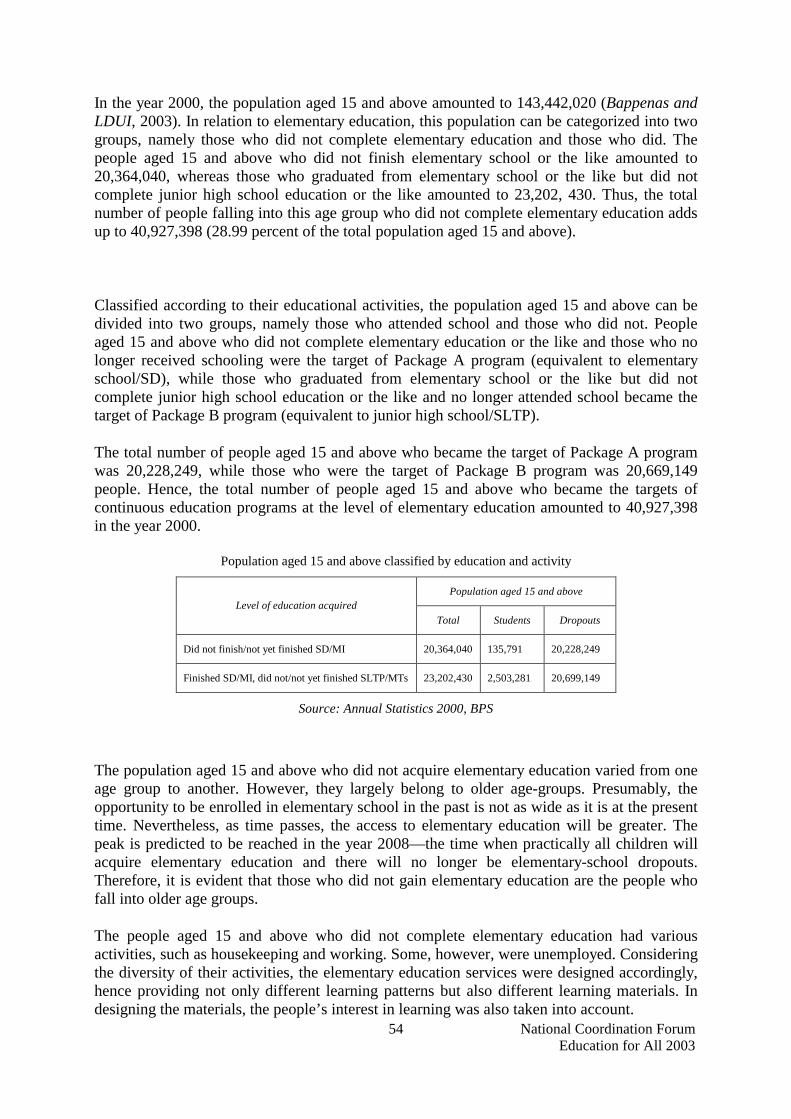
National Coordination Forum Education for All 2003
54
In the year 2000, the population aged 15 and above amounted to 143,442,020 (Bappenas and LDUI, 2003). In relation to elementary education, this population can be categorized into two groups, namely those who did not complete elementary education and those who did. The people aged 15 and above who did not finish elementary school or the like amounted to 20,364,040, whereas those who graduated from elementary school or the like but did not complete junior high school education or the like amounted to 23,202, 430. Thus, the total number of people falling into this age group who did not complete elementary education adds up to 40,927,398 (28.99 percent of the total population aged 15 and above).
Classified according to their educational activities, the population aged 15 and above can be divided into two groups, namely those who attended school and those who did not. People aged 15 and above who did not complete elementary education or the like and those who no longer received schooling were the target of Package A program (equivalent to elementary school/SD), while those who graduated from elementary school or the like but did not complete junior high school education or the like and no longer attended school became the target of Package B program (equivalent to junior high school/SLTP).
The total number of people aged 15 and above who became the target of Package A program was 20,228,249, while those who were the target of Package B program was 20,669,149 people. Hence, the total number of people aged 15 and above who became the targets of continuous education programs at the level of elementary education amounted to 40,927,398 in the year 2000.
Population aged 15 and above classified by education and activity
Population aged 15 and above Level of education acquired
Total Students Dropouts
Did not finish/not yet finished SD/MI 20,364,040 135,791 20,228,249
Finished SD/MI, did not/not yet finished SLTP/MTs 23,202,430 2,503,281 20,699,149
Source: Annual Statistics 2000, BPS
The population aged 15 and above who did not acquire elementary education varied from one age group to another. However, they largely belong to older age-groups. Presumably, the opportunity to be enrolled in elementary school in the past is not as wide as it is at the present time. Nevertheless, as time passes, the access to elementary education will be greater. The peak is predicted to be reached in the year 2008—the time when practically all children will acquire elementary education and there will no longer be elementary-school dropouts. Therefore, it is evident that those who did not gain elementary education are the people who fall into older age groups.
The people aged 15 and above who did not complete elementary education had various activities, such as housekeeping and working. Some, however, were unemployed. Considering the diversity of their activities, the elementary education services were designed accordingly, hence providing not only different learning patterns but also different learning materials. In designing the materials, the people’s interest in learning was also taken into account.
National Coordination Forum Education for All 2003
55
Until 2001, Package A and Package B programs were still focused on the provision of education equivalent to elementary and junior high schools for the sake of the Nine-Year Compulsory Education Program. Thus, the targets of these programs were youths between 7 and 15 years old. Although there might have been people above 15 years old participating in these programs, until the year 2001 the government had, in fact, not designed these programs for people beyond the compulsory education age group.
Nonetheless, since 2002 Package A and Package B programs have been provided for adults as well. Considering the diversity of their activities, elementary education services provided should be relevant to their needs, that is, the education acquired should be useful and relevant to their activities. Consequently, elementary education for adults should be based on skills or functional Package A and Package B. Pioneering programs have been given to adults working in the agricultural sector (farmers).
3. Action Plan
3.1 . Projection of Indonesia’s population in 2015
In the year 2015, the population of Indonesia is projected as in the following table:
Projection of Indonesia’s population classified by age group in 2015
Total Percentage Age Group Male Female M+F Male Female M+F
Sex Ratio
0-4 10,040,520 9,668,663 19,709,183 8.3 8.0 8.1 104 5-9 10,059,520 9,714,755 19,774,275 8.3 8.0 8.1 104 10-14 9,875,180 9,559,636 19,434,816 8.1 7.9 8.0 103 15-19 10,314,870 10,080,529 20,395,390 8.5 8,3 8,4 102 20-24 10,446,520 10,166,830 20,652,200 8,6 8,4 8,5 103 25-29 10,445,520 10,051,040 20,497,560 8,6 8,3 8,4 104 30-34 10,570,440 10,501,800 21,072,240 8,7 8,7 8,7 101 35-39 9,122,435 9,965,675 19,088,110 7,5 8,2 7,9 92 40-44 8,945,227 9,389,760 18,334,987 7,4 7,7 7,6 95 45-49 7,910,947 7,999,009 15,909,956 6,5 6,6 6,6 99 50-54 6,969,271 7,157,440 14,126,711 5,7 5,9 5,8 97 55-59 5,760,926 5,611,844 11,372,770 4,7 4,6 4,7 103 60-64 4.236,271 4,049,864 8,286,135 3,5 3,3 3,4 105 65-69 2,821,451 2,939,056 5,760,507 2,3 2,4 2,4 96 70-74 1,801,810 1,989708 3,791,518 1,5 1,6 1,6 91 75+ 1,947,005 2,526,455 4,473,460 1,6 2,1 1,8 77
In relation to manpower, it is estimated that there will be an increase in terms of quantity and quality. However, it is also predicted that there will be a rise in the number of poorly educated, aging workforce as a result of a higher average age in the population. In 2015, it is estimated that the population aged 15 and above reaches 183. 76 millions (see table below). As the target in the year 2000 was 50 percent decrease in illiteracy rate (10. 81 percent or 15. 51 million people), it is predicted that there will be 9. 93 million illiterates at the most (aged 15 and above) by the year 2015 (a decrease of 5. 58 million people).

National Coordination Forum Education for All 2003
56
Population aged 15 and above, 2000-2015
Age Group Illiteracy Rate
The Illiterate 2000 Total Population Age Group Total
Population (1) (2) (3) (4) (5) (6)
15-19 1.31 283,990 21,678,643 15-19 20,395,390 20-24 1.86 367,162 19,739,907 20-24 20,652,200 25-29 2.7 515,897 19,107,302 25-29 20,497,560 30-34 4.93 828,734 16,810,014 30-34 21,072,240 35-39 8.16 1,246,612 15,277,105 35-39 19,088,110 40-44 10.89 1,391,717 12,779,773 40-44 18,334,987 45-49 13.03 1,289,655 9,897,583 45-49 15,909,956 50-54 34.02 2,575,221 7,569,727 50-54 14,126,711 55-59 34.02 1,980,214 5,820,735 55-59 11,372,770
60+ 34.02 5,035,379 14,801,231 60-64 8,286,135 65-69 5,760,507 70-74 3,791,518 75+ 4,473,460
15+ 10.81 15,514,581 143,482,020 183,761,544 15-44 4.40 4,634,112 105,392,744 120,040,487 15-24 1.57 651,152 41,418,550 41,047,590 25-44 6.23 3,982,960 63,974,194 78,992,897
45+ 28.57 10,880,469 38,089,276 63,721,057
To attain the desirable condition in 2015, measures to be taken should also take into account the population aged 0-14, which in the year 2000 amounted to 58.92 millions, for in the year 2015, they will probably dominate the population of Indonesia.
3.2 Changes of Population Structures in 2000-2015
In the year 2000, Indonesia’s population structure was categorized into youth population since 30.4 percent of the total population was under 15 years old. The number, however, will gradually decline in 2005, 2010 and 2015, dropping to 27.9 percent, 25.9 percent and 24.3 percent respectively. At the same time, the percentage of the population between 15 and 44 years old increases from 31.0 percent in 2000 to 32.6 percent in 2015. Indonesia’s population structures from the year 2000 until 2015 are shown below:
Chart. Indonesia’s population structure in the year 2000
National Coordination Forum Education for All 2003
57
Chart. Indonesia’s population structure in the year 2005
Chart. Indonesia’s population structure in the year 2010

National Coordination Forum Education for All 2003
58
Chart. Indonesia’s population structure in the year 2015
As shown in the charts above, a significant change in population structure is evident; the population structure changes from youth population to aging population, which is as a result of declining birth rate and rising life expectancy.
The population aged 0-14, which in the year 2000 amounted to 62.78 millions, should be given serious attention in terms of education since in 2015 they will fall into the adult population, which are all expected to be literate by the year 2015. This age group should, therefore, be the focus of pre-school and elementary education.
The change in population structure poses a challenge for the government as they should be able to provide educational services for the adult population, which continues to rise in terms of quantity as well as quality (longer life expectancy).
3.3 Targets for Illiteracy Rate Decline
To attain 50 percent decline in illiteracy rate of the population aged 15 and above in 2015, a decrease in the number of illiterates (as many as 5.58 millions) is necessary. Targets for decline per year are described in the table below. Considering that the people who have acquired literacy education can become illiterate again, in determining the target of literacy

National Coordination Forum Education for All 2003
59
programs, it is assumed that 10 percent of literacy education graduates will become illiterate again. Thus, over a span of 15 years, participants of literacy programs will at least reach 6. 14 millions.
Year Target for
illiteracy decline per year
Annual cumulative illiteracy decline
annually
Target for decline per
period
Target of literacy
programs
Cumulative target of literacy programs
Programs’ target per
period 2001 12,273 12,273 13,500 13,500 2002 45,455 57,727 50,000 63,500 2003 181,818 239,545 200,000 263,500 2004 445,004 684,550 489,505 753,005 2005 445,004 1,129,554 1,129,554 489,505 1,242,509 1,242,509 2006 445,004 1,574,558 487,505 1,732,014 2007 445,004 2,019,562 489,505 2,221,519 2008 445,004 2,464,567 489,505 2,711,023 2009 445,004 2,909,571 487,505 3,200,528 2010 445,004 3,354,575 2,225,021 489,505 3,690,033 2,447,523 2011 445,004 3,799,579 489,505 4,179,537 2012 445,004 4,244,584 487,505 4,669,042 2013 445,004 4,689,588 489,505 5,158,547 2014 445,004 5,134,592 489,505 5,648,051 2015 445,004 5,579,596 2,225,021 487,505 6,137,556 2,447,523 TOTAL 5,579,596 6,137,556
Indonesia’s literacy rates from the year 2000 until 2015 can be seen in the graph below. In 2000, literate population aged 15 and above was only 127. 97 millions. In 2015, however, it rises to 175. 83 millions.
Graph. Overall development of population aged 15 and above, 2000-2015
3.4 Targets of Literacy Education
In reducing illiteracy rates, groups that should be given the most attention are females, adults, especially those aged 45 and above, and people residing in poor, rural areas. Eradication of illiteracy has been done through the provision of different literacy programs which are relevant to each group’s needs, hence optimizing the programs’ effectiveness. The programs

National Coordination Forum Education for All 2003
60
are intended to provide a basis for acquiring skills and knowledge to enhance their own welfare.
Eradication of illiteracy can be done through formal education and non-formal education, which has been adjusted to the age group. While formal education and equivalent education prioritize the eradication of illiteracy of school-age population, functional literacy education is intended for productive adult illiterates.
3.5 Targets of Equivalent Education
Elementary education services, that is, functional Package A and Package B, for people aged 15 and above will be provided in the year 2004 onwards. Each service is initially intended for 100,000 people. The number, however, will be raised by 100,000 annually. Therefore, in 2015, it is estimated that each package will serve around 7. 8 million people aged 15 and above, as detailed in the following table:
Plan for Package A and Package B services for adults
Year Package A service per year
Cumulative Package A service
Package B service per year
Cumulative Package B service
2004 2005 2006 2007 2008 2009 2010 2011 2012 2013 2014 2015
100,000 200,000 300,000 400,000 500,000 600,000 700,000 800,000 900,000
1,000,000 1,100,000 1,200,000
100,000 300,000 600,000
1,000,000 1,500,000 2,100,000 2,800,000 3,600,000 4,500,000 5,500,000 6,600,000 7,800,000
100,000 200,000 300,000 400,000 500,000 600,000 700,000 800,000 900,000
1,000,000 1,100,000 1,200,000
100,000 300,000 600,000
1,000,000 1,500,000 2,100,000 2,800,000 3,600,000 4,500,000 5,500,000 6,600,000 7,800,000
3.6 Policy
Without overlooking various population tendencies, a policy was made to meet the target set. The policy covers the attainment of 50 percent decrease in illiteracy rate in 2015 by means of (1) widening the access to education and improving the implementation of literacy education for people aged 15 and above. Additionally, the implementation of elementary education for school-age group will also be enhanced; and (2) the provision of equal access to elementary education for all adults through equivalent education services that are relevant to their needs.
3.7 Strategies
The policy was followed up by five main strategies, namely (1) improving the implementation of elementary education for school-age group, (2) reducing illiterate population, (3) providing communication, education and information, (4) reforming information and management systems, and (5) enhancing the capacity of education managers, whether at the central, provincial or regency/district level.
National Coordination Forum Education for All 2003
61
A strategy for improving the implementation of elementary education for school-age group is crucial so as to avoid the emergence of a new illiterate group. Therefore, illiterate population will not keep increasing. The programs implemented include formal and non-formal education. A greater detail of this strategy is covered in National Action Plan for Elementary Education.
Thus, National Action Plan for Literacy Education is emphasized on widening the access to education and improving the implementation of literacy education for adults.
3.7.1 Reducing illiterate population
The reduction of illiterate population can be approached in two ways:
• widening the access to literacy education through (1) the provision of functional literacy programs with specific targets, whether in terms of age group, region, sex or income ; (2) the determination of national policy; thus, functional literacy programs can become an affirmative policy in eradicating poverty.
• improving the implementation of literacy education to increase the efficiency and effectiveness of the programs, including retaining literacy competence of the people who have acquired literacy education, which is done by means of (1) formulating innovative and specific functional literacy programs with an emphasis on its functional aspect for each age group, hence giving them a significant added value. Specially for productive age groups, functional literacy programs should be related to productivity enhancement; therefore, illiterates will be more interested in joining the programs. Knowledge about child-rearing can also become a relevant functional topic, especially related to early childhood education programs ; (2) for the elderly, literacy education services should be given in accordance with their interests and needs. The learning process can be divided into several stages; for instance, at the first stage, writing lesson is taught using the local language (the language used in daily communication); the second stage can then include the introduction of Bahasa Indonesia related to its functional education. With these stages, people are expected to learn more easily and to apply their knowledge in daily life; (3) formulating supporting programs to retain learners’ literacy competence so as to avoid their being illiterate again, which, among others, can be done by developing reading corners.
3.7.2 Providing Communication, Education and Information
The importance of literacy competence should be disseminated to all groups in the society and to various education organizers. Apart from that, establishing continuous cooperation with various parties is necessary to improve the implementation of literacy education. Main activities included in this strategy are as follows:
• familiarization of the importance of literary competence to the general public and all stakeholders involved.
• improvement of cooperation among sectors, societies, higher education and international institutions, including NGO. Cross-sector cooperation is needed in designing functional literacy programs; hence, the services provided will be relevant to the betterment of manpower’s productivity in the related sector.
National Coordination Forum Education for All 2003
62
3.7.3 Reforming information and management systems
To ensure successful literacy education programs, information and management systems should be strengthened by enhancing monitoring and evaluation systems, which are needed to retain the effectiveness of the programs being implemented. The activities include:
• recording various literacy education services provided by the public and government ; • locating literacy education services and mapping illiterate population to facilitate the
formulation of the program targets.
3.7.4 Enhancing Capacity
The capacity of education organizers, especially those involved in the reduction of illiterate population, (whether at the central, provincial or regency/district level) should be enhanced so that they have sufficient competence to plan and organize literacy education programs.
3.7.5 Executing Policy
Various studies should be conducted to improve the implementation of literacy education in the framework of fulfilling local needs.
3.8 Activities
Activities that should be carried out until 2015 include:
3.8.1 Eradication of illiteracy
To attain Dakar’s target in 2015, the following activities are necessary :
• Educating as many as 5,579,000 learners up to the year 2015. Thus, approximately 489,505 illiterates will be eradicated annually. Components that should be provided each year cover : (1) learning materials for learners ; (2) group management ; (3) tutors’ incentives ;
• Training 557,900 tutors, assuming that the ratio of tutors to learners is 1:10.
Consequently, around 48,951 tutors are needed each year. The following are prior to tutor training : (1) designing training guidelines and other relevant guidelines; (2) training master trainers; (3) recruiting tutors.
• Publicizing and familiarizing :
Considering that literacy and HDI (Human Development Index) improvement are interrelated, eradication of illiteracy should, therefore, be supported by all parties. Thus, it is necessary to raise public awareness on the issue of human resources development. Publication and familiarization have been done continuously through the media.
• Assisting learning groups : In order to attain the target set for eradication of illiteracy, it is necessary to provide a guide for each learning group. Through functional skill activities, learners are expected to maintain their literacy competence and, eventually, to improve their standard of living. These guided activities are organization-oriented and are directed toward establishing
National Coordination Forum Education for All 2003
63
working groups. These activities are intended to help learning groups retain their literacy competence.
3.8.2 Developing learning materials
Due to differences in locations (i.e. village vs. city), sex and functions of the learning materials, it is crucial to develop learning materials that are relevant to the learners’ needs, conditions and characteristics. Consequently, learning materials that have been used should be revised and improved according to learners’ interests and needs as well as to the basic skills to be mastered.
3.8.3 Monitoring and evaluating
Functioning as control, monitoring and evaluation have been done continuously in the planning, implementation and follow-up stages. From time to time, monitoring and evaluation should also be carried out to discover learners’ conditions, learning facilities, process and content. Monitoring and evaluation should be done regularly, hence facilitating problem-solving and improvement of the programs. In monitoring and evaluation, the following activities are necessary:
• recording locations, sex and age groups; • continuously directing support system personnel (PB, SKB, supervisors and tutors)
3.8.4 Retaining literacy competence
To retain learners’ literacy competence, reading corners (TBM) and learning centers in every learning location should be enhanced, both in terms of quality and quantity. Reading corners will be established in regions where KF program is located, while in areas where reading corners are already available, the following should be done :
• The provision of reading materials that are relevant to the learners’ needs :
The provision of relevant reading materials is intended to improve the learners’ literacy competence and functional skills. The provision and development of these reading materials should be compiled according to topics to be learnt and further skills to be acquired.
Updating reading materials, including exchanging books, articles and the like with other reading corners, is intended to complete and improve reading materials per se. Besides that, reading materials may be provided by donors. Hence, book collections in reading corners will always be up-to-date, which in turn, will arouse learners’ motivation to go there.
Reading corners should be managed professionally and transparently as they have educative and informative functions, without overlooking their function as a recreational center for people, hence establishing reading corners as an educational institution which provides various education activities.

National Coordination Forum Education for All 2003
64
• Training TBM managers
Since TBM managers are responsible in managing and preserving TBM and in fulfilling the public’s reading demands, they should, therefore, receive training that will arouse their motivation and enhance their ability to improvise in managing TBM. They, in turn, are expected to be able to arouse people’s interest in reading. Eventually, it is expected that reading culture will be created.
• Executing policies and programs
Various studies are required to obtain a comprehensive picture of functional literacy programs at the lasting/continuous learning stage (tahap pelesarian). These studies are intended to measure the success of program implementation, noting its strengths, weaknesses, challenges encountered and efforts that should be made to improve and further develop the programs. Hence, the programs implemented will be useful for the learners and will help them to improve their standard of living.
• Monitoring and evaluating
Monitoring and evaluation should be done regularly, hence facilitating problem-solving. Activities that support monitoring and evaluation cover the following : (1) discovering learners’ competence and functional skills at the lasting/continuous stage ; (2) continuously directing support system personnel (PB, SKB, supervisors. tutors).

National Coordination Forum Education for All 2003
65
4. Funding
4.1 Required funds for literacy education
From 2004 until 2015, the target of literacy education is as many as 5. 874 million people. To provide literacy education services, a fund amounting to 2. 797 quintillion rupiahs is required, detailed as follows:
No. Activity Cost unit Target Total expenditure A. Illiteracy eradication
1. Course 2. Tutors’ training 1 x 2 yrs 3. Tutors’ incentives 4. Provision of learning materials 5. Incentives for tutors’ organizers
400,000 500,000 600,000
10,000 600,000
5,674,060
73,426. 146,852
5,874,060 14,685
2,349,624,000,000
36,712,875,000 88,110,900,000 58,740,600,000
8,811,090,000
B. Preservation 1. TBM (1 TBM = 60 people) 2. TBM managers. training 3. Assistance for 40 locations/yr
4,000,000 500,000
30,000,000
97901 97902
480
391,604,000,000 48,950,500,000 14,400,000,000
C. Support services 1. Publication and familiarization 2. Monitoring and evaluation a. monev from center to province 2 x 1 yr b. provincial monev 4 x 1 yr c. district/regency monev 4x 1 yr 3. Policies and programs a. education development for developing innovative and effective literacy education b. local material development 4. Coordination of programs 2 x 1 yr 5. Provision of program implementation guidelines a. designing guidelines b. multiplying and distributing guidelines 6. Supervisors’ training 7. Communication forums a. regency/district level b. provincial level c. national level
2.500.000.000
3.500.000
250,000
10,000
500,000,000
200,000,000 250,000,000
30,000,000 9,000
500,000
250,000 500,000
3,500,000
12
720
20,640
2,349,624
12
360 24
24 3,830,000
14,400
154,800
51,600 720
30,000,000,000
2,520,000,000
5,160,000,000
23,496,240,000
6,000,000,000
72,000,000,000 6,000,000,000
720,000,000 34,470,000,000
7,200,000,000
38,700,000,000 25,800,000,000
2,520,000,000
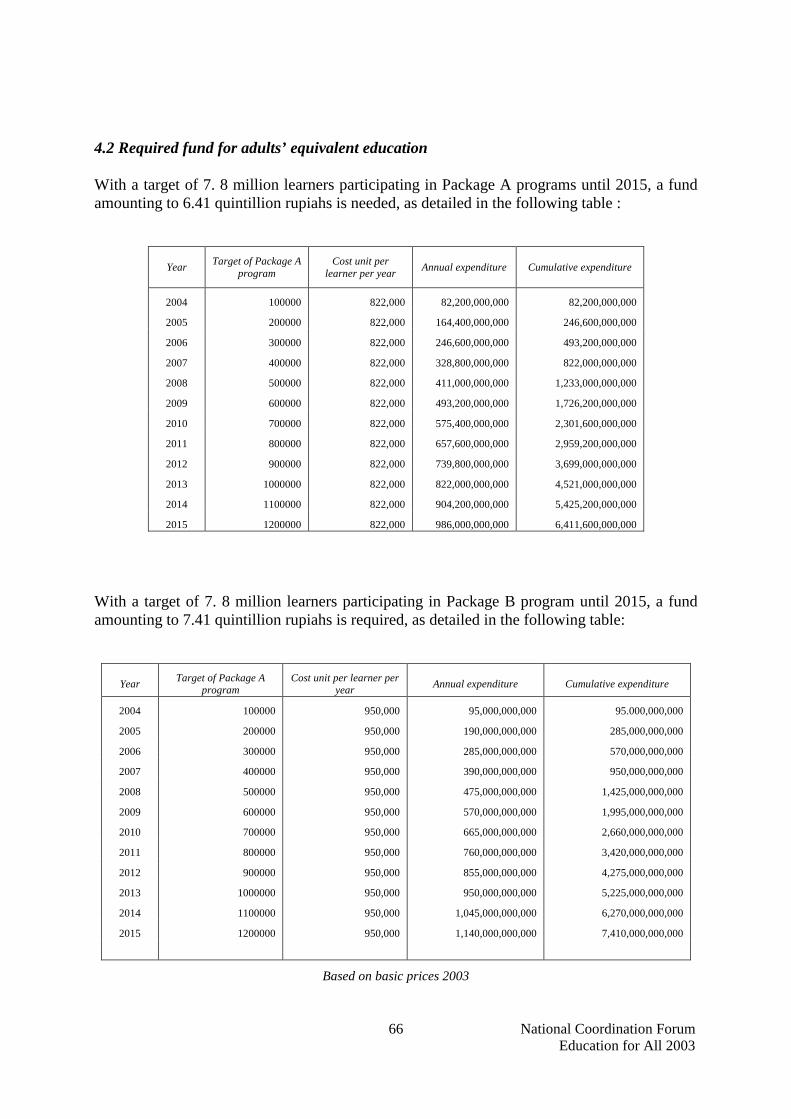
National Coordination Forum Education for All 2003
66
4.2 Required fund for adults’ equivalent education
With a target of 7. 8 million learners participating in Package A programs until 2015, a fund amounting to 6.41 quintillion rupiahs is needed, as detailed in the following table :
Year Target of Package A program
Cost unit per learner per year Annual expenditure Cumulative expenditure
2004 100000 822,000 82,200,000,000 82,200,000,000
2005 200000 822,000 164,400,000,000 246,600,000,000
2006 300000 822,000 246,600,000,000 493,200,000,000
2007 400000 822,000 328,800,000,000 822,000,000,000
2008 500000 822,000 411,000,000,000 1,233,000,000,000
2009 600000 822,000 493,200,000,000 1,726,200,000,000
2010 700000 822,000 575,400,000,000 2,301,600,000,000
2011 800000 822,000 657,600,000,000 2,959,200,000,000
2012 900000 822,000 739,800,000,000 3,699,000,000,000
2013 1000000 822,000 822,000,000,000 4,521,000,000,000
2014 1100000 822,000 904,200,000,000 5,425,200,000,000
2015 1200000 822,000 986,000,000,000 6,411,600,000,000
With a target of 7. 8 million learners participating in Package B program until 2015, a fund amounting to 7.41 quintillion rupiahs is required, as detailed in the following table:
Year Target of Package A program
Cost unit per learner per year Annual expenditure Cumulative expenditure
2004 100000 950,000 95,000,000,000 95.000,000,000
2005 200000 950,000 190,000,000,000 285,000,000,000
2006 300000 950,000 285,000,000,000 570,000,000,000
2007 400000 950,000 390,000,000,000 950,000,000,000
2008 500000 950,000 475,000,000,000 1,425,000,000,000
2009 600000 950,000 570,000,000,000 1,995,000,000,000
2010 700000 950,000 665,000,000,000 2,660,000,000,000
2011 800000 950,000 760,000,000,000 3,420,000,000,000
2012 900000 950,000 855,000,000,000 4,275,000,000,000
2013 1000000 950,000 950,000,000,000 5,225,000,000,000
2014 1100000 950,000 1,045,000,000,000 6,270,000,000,000
2015 1200000 950,000 1,140,000,000,000 7,410,000,000,000
Based on basic prices 2003

National Coordination Forum Education for All 2003
67
CHAPTER 5 LIFE SKILLS
1. Introduction
Indonesian economic development is now faced with the problem of people’s low level of education, high rate of unemployment and poverty. This condition results in low productivity, income, competitive ability, quality, and value of individual and social life. Therefore, there is a need for a national effort to develop and institutionalize education for humanity, a sort of education that is able to supply knowledge, skills, attitudes, and ability for self-development, work, professions, entrepreneurship, and further study.
The role of education that can provide life skills for interaction with ever-changing social dynamics, life skills for future challenges needs to be improved and maintained. Society- based education provides an access to societies and is oriented to societies in the future.
What have been presented above are some points that become rationales for the national plan of action of life skills in formal and non-formal education. The life skills education is based on the learning concept: “learning to know, learning to do, learning to live together with others, and learning to be”. Based on the four learning concepts, life skills education is prefigured to bring about positive impacts on an effort of coping with the problems of unemployment and poverty.
2. General description
2.1 Recent condition
Indonesian economic condition has not fully recovered from the impacts of economic crisis that started to hit Indonesia in early June 1997. The worst impacts of the crisis are decreasing production capacities and even vacuum production activities that cause to lay off employees, boosting prices of daily needs paradoxically coming with decreasing people’s incomes, uncontrollable inflation, highly boosting interest rate, and low rate of investment. This accelerates unreasonably high prices and forces economic growth to go into a slump in a negative point. The poverty rate sets back to 1970’s when it reached 40% of the total population, increasing the number of unemployment and school dropouts. Indonesian economy in 2001-2002 has shown a betterment, yet it is still unable to cope with unemployment. 4% - 5% of the recent economic growth is only able to provide a provision for 2 – 2,5 millions of job seekers, while the total number of the unemployed has reached 5,4 millions and semi-unemployment has reached 44,59 millions. This huge number of unemployment, in most part, results from inefficient schooling system and school dropouts – 1,3 millions of people.

National Coordination Forum Education for All 2003
68
Such an economic condition provides no additional significant value for the elimination of the unemployed and the poor. Here, imperative is a reliable strategy that can accelerate economic growth; therefore, minimize the unemployment rate. The strategy is associated with the improvement of human resources through the investment in education. From an economic perspective, investment in education is aimed at improving a society’s quality and ability, creating work fields, increasing income and savings, capital accumulation, and technological changes. Education is developed toward the improvement of life skills, quality of commands in science and technology, achievements, work ethic, discipline, responsibility, and entrepreneurship skills. In accordance with economic development, the development in education is oriented to meet demands or job markets by supplying learned, skilful graduates matching with economic-based and natural resource-based industrial activities.
2.2 Problems with Indonesian human resources
• Low level of education:
The educational level of a nation determines its position and competitive ability. One factor that indicates low level of Indonesian education is Indonesian Human Development Index (HDI) ranked 102 of 106 nations. Understandably, most of the Indonesian (of the total Indonesian population – 203. 5 millions) are graduates of primary schools or even are not graduated. Indonesian people at the age of 15 and above who never attend schooling, based on BPS (source of data on workforces), are 11.5 millions, while many are dropouts of primary schools (50. 3 millions), junior high schools (SLTP) (29 millions), senior high schools (SLTA) (17 millions), vocational schools (9.1 millions), diploma I/II/III/academies (3millions), and universities (3millions).
• High rate of unemployment:
The total of the unemployment aged 15 – 18 is 5.8 millions of 95.65 millions of workforces. And the unemployment aged 18 and above is 5.4 millions of people. The number of semi-unemployment is 44.59 millions of people (Susenas, 2000). The highly accumulated number of unemployment is associated with the problem of skills. Further problems emerge in terms of: (1) increasing number of criminals, (2) increasing number of street boys, threatening beggars, street robbers, (3) increasing number of drugs, alcohol, and additive users, (4) advocating the intense fighting among groups, villages, and further districts.
• High rate of poverty:
The rate of poverty is miserable. Before the monetary crisis, the number of poor people was 22 millions. This number drastically increased to 78 millions in 1998. Although in 2000 and 2001 Indonesian economic condition was in the process of recovering from the crisis, and the national movement of poverty eradication was intensified, the number of poor people was still 38.3 millions. This rate was still greater in number than that of 1996. The high rate of poverty in fact caused social crisis such as crime, environment, disappointment, and social hatred, which, at times, advocate chaos and anarchy.

National Coordination Forum Education for All 2003
69
• Geographical difficulties:
The distribution of poor people in particular places with certain geographical conditions determine the way in which public service is provided. A particular geographical condition of a place influences the ability to provide access to the poor and the unemployed to gain education services. Bad access to education services affects badly distributed education services. This is, at times, perceived as justice problem of education services that may cause to lose society’s trust in the programs of education. The emergence of marginalized society is the direct effect of the geographical problems. The increasing number of the marginalized people is an impetus of unpredictable social crisis and disharmonious society.
• Insufficient budget:
The government’s ability to provide sufficient budget for education remains a problem, which causes limited education services. This further results in the disproportional educational services with the number of people in demand. One difficulty is the quantity and quality of teaching staff especially in villages and remote areas. Another difficulty is the unavailability of facilities, the access for people to education services. A government center of education and training, for example, is just established in few districts. Some private centers of education and training are located in the capitals of provinces or district towns. Learning materials such as books, handouts, which are provided by the government and educational institutions are limited in numbers.
Such a condition hinders an effort of the improvement of productivity, working quality, competitive ability, and technological literacy. This will set a difficult position for Indonesia to pose its competitive ability to its neighboring countries such as ASEAN, and moreover Asia – Pasific. Low level of people’s education is the hindrance such as in developing their prominent work and their industrial technology, in appreciating the recent rapid social changes, and in transforming dynamic social changes.
To be able to compete in the global competition arena, Indonesia has tried to develop the sector of education for all with no discrimination. However, considering the difficult condition in Indonesia, the governments and society focus on several aspects in the development of education: the wide distribution of opportunity to attend schoolings, the improvement of the quality of education, the vitalization of relevance between education and social demands, and the enforcement of efficiency and effectiveness in the implementation of education. In an effort to distribute the opportunity of education, and its services for all citizens, the governments enforce a national 9-year compulsory education. This compulsory education is realized through primary schooling program or of the same level, and through non-formal education such as “package A program” (Program Paket A) equal primary schools and “package B program” (Program Paket B) equivalent to junior high schools.
Focusing on improving the quality of human resources and providing equitable opportunities for education, which represent an important step in decreasing the number of unemployment, the governments and society should intensify the implementation of education and training. More specifically, the education and training should focus on improving human life skills with the following major purposes: firstly, to cope with economic crisis and accelerate

National Coordination Forum Education for All 2003
70
national economic growth, the governments and society empower human sectors in villages by way of the establishment of positive, constructive, and productive attitudes, professionalism in the sectors of agribusiness and agro-industry; secondly, to improve the productivity of small scale industries (home industries), education and training are directed to the natural resource-based industries and the development of people’s small scale industries.
3. National plan of action
3.1 National policy of life skills education
In accordance with Dakar’s targets, national policies of life skills education have been issued since early 2001. The purpose of life skills education is to empower education to work on the development of students’ potencies and humanity for future challenges, to encourage educational institutions to develop flexible learning materials, to use the available human potencies in a society based on the principles of broad-based education and school-based management, and to equip graduates with functional life skills.
Life skills education is not new. Principally, it is a kind of education, which provides individuals or learning groups the opportunities to learn. The rapid growth of small scale industries such as embroidery industries, hand-made jewelry industries, tile industries, batik industries represents examples of life skills rooted and developed in a society. That is a sort of education that allows skills and abilities to positively adapt and respond to the demands and challenges in the society. Life skills education is implemented in both formal and non-formal education.
Life skills educational programs have been implemented in primary and secondary education (kindergarten, primary education, junior high schools, senior high schools and vocational high schools). Life skills programs at the primary school level focus on general life skills: (a) getting students to familiarize with real life in their environments; (b) encouraging students’ awareness of life values; (c) teaching skills mastery; (d) tapping students’ creativity; (e) empowering social roles; (f) building self-confidence, responsibility, and discipline. At the level of senior high school (SMU), vocational skills are added to academic and general life skills. This is designed to provide students an ability to anticipate employment challenges if they do not continue their schoolings or if they drop out. Life skills education in vocational schools focuses on vocational and academic skills to either anticipate employment challenges or challenges at the further level of schooling.
The implementation of life skills education has been proliferated since 2002. Schools with autonomous management have developed life skills education in accordance with their own unique contextual needs. They have established cooperation with industries, professionals, experts, and local resources. Schools have welcome inputs or feedbacks that become an impetus toward creating dynamic learning processes. Schools become inclusive and school environments become conducive to the productive implementation of such programs. Life skills education, in other words, is consistent with the principles of broad-based schooling system and society-based schooling system in which it advocates relevance with social demands and market trends.

National Coordination Forum Education for All 2003
71
3.2 Policy strategies in life skills education
3.2.1 Aims
• to improve the quality and to increase the number of job seekers who have earned life skills by which they are ready to enter job markets and to become entrepreneurs.
• to improve the quality and to increase the number of job seekers who are able to work in local, domestic, and international contexts.
• to encourage people’s productivity whose products are marketable and in demands. • to support economic activities that can recruit job seekers and are able to contribute to the
growth of industries and people’s economy. • to minimize the number of the unemployed and the poor. • to accelerate an increase of income and social prosperity. • to improve workforces’ competitive ability to seize the opportunities in the global job
market, and to encourage the manufacturing of products that can penetrate local, domestic, and international markets.
3.2.2 Policy Strategies The development and the institutionalization of life skills education in the macro framework of Education For All and lifelong education have been stated in the national policy, which has become normative and operational bases for the implementation of life skills education. The policy strategies are as follows:
• An attempt, with a significant budget, to expand and equitably distribute the opportunities for quality education for all Indonesian people.
• The improvement of quality and relevance of life skills education.
• The implementation of efficient education by empowering and improving quality formal and non-formal educational institutions through which families and societies could participate in perpetuating good values, attitudes, and ability.
• The realization of democratic educational climates and a quality system to produce creative, innovative, intellectual, healthy, disciplined, responsible, skilful Indonesian people.
• An integrated attempt to accelerate the eradication of poverty and to minimize the number of unemployment resulting from long economic crisis.
• The realization of an integrated educational system relevant with the demands of job market by emphasizing on synergic cooperation with societies.
3.2.3 Implementation strategies
• Developing and institutionalizing life skills education according to the principles of society-based education and broad-based education.
• Developing and institutionalizing life skills education in formal and non-formal educational system.
• Developing market oriented life skills education.

National Coordination Forum Education for All 2003
72
• Developing life skills educational program that prepares lifelong learners.
• Developing life skills educational program that focuses on local economy and industry and integrates them with local potencies.
• Optimally using all elements and potencies in a society for developing life skills education.
• Providing local people with facilities and incentives to develop life skills education.
• Integrating the implementation of life skills education with national development in villages, cities, and isolated areas.
• Developing quality assurance system for life skills education based on standards of competencies.
3.3 Action Program
3.3.1 Expansion and Equitable Distribution of Opportunities for life skills education
a. Target
The expansion of access for young children – adults to life skills education is aimed at:
• Assuring that learning needs of all learners from all age groups can be fulfilled by the access to life skills education, which provides skills for self-development, work, entrepreneurship, and further studies.
• Designing types and menus of life skills education program responsive to the demands in a society, local potencies, demands of job market.
• Creating a life skills education service system necessary for all walks of societies, for all different characteristics of local people.
• Stabilizing national agenda in the development and institutionalization of life skills formal and non-formal education.
• Vitalizing the roles of societies in and their contribution to the implementation of life skills education.
The expansion of access to life skills education focuses on minimizing the unemployed. 5.400.064 people in non-formal education will be the target of life skills education’s service in the period of 2003 – 2015. Considering the increase in the number of job seekers each year, the service of life skills educational program increases the target of 2003 by 15% in the following year. Then, the service in 2004, which has targeted 477.250 people, now becomes 548.838 people. The following years are described as in the Table below:

National Coordination Forum Education for All 2003
73
No. Years Targets (people)
1. 2003 415.000 2. 2004 477.250 3. 2005 584.837 4. 2006 631.163 5. 2007 725.836 6. 2008 834.713 7. 2009 959.920 8. 2010 1.103.90 9. 2011 1.269.49
10. 2012 1.459.91 11. 2013 1.678.90 12. 2014 1.930.74 13. 2015 2.220.35
The target of life skills education service in formal education is detailed in the Table below:
The picture of target of service
2003 – 2015
No. Years Targets (schools)
1. 2003 6.000 2. 2004 13.000 3. 2005 20.000 4. 2006 27.000 5. 2007 34.000 6. 2008 41.000 7. 2009 48.000 8. 2010 55.000 9. 2011 62.000
10. 2012 69.000 11. 2013 76.000 12. 2014 83.000 13. 2015 90.000
The prediction above applies for all levels of education: kindergarten or of the same levels (TK/RA), primary education or of the same level (SD/MI), open junior high education or of the same level (SLTP terbuka), vocational high school (SMK), abnormal education (PLB)
b. Activities of life-skills education
Directorate of non-formal education plans 8 main programs in the implementation of life skills education with special emphasis on an effort to minimize the unemployment.
• Skills and vocational courses • Courses in villages • Entrepreneurships • Work training responsive to job market • Skill training to increase production

National Coordination Forum Education for All 2003
74
• Business learning group • Entrepreneurship training and education • Vocational education
Life skills educational programs are developed and aimed at (1) meeting the demands in job market, and (2) entrepreneurships. The sectors being concerned in life skills educational programs are agriculture, fishery, animal husbandry, maritime, forestry, plantation, construction, industries, trading, hotel and restaurant, manufacturing, transportation, services, and other local businesses. Meanwhile, life skills programs of formal education focus on the shifts of orientations from subject matter oriented to life skills oriented learning, from supply driven learning to competence based learning and job market oriented learning.
c. Resources
Resources are the access to life skills education given to all citizens especially to those of schooling ages. Resources include all existing educational institutions available in a society. In non-formal education, life skills educational programs include:
• Private owned courses • Private training institutions • Job training institutions • Center of job training for working overseas • Center of job training for industries • Center of job training for local industries • Center of learning activities • Center of learning activity development • Vocational high schools • Center of society’ s learning activities • Industries
Staff members who help implement the life skills educational programs are as follows:
• Teachers (supplied from relevant institutions such as job training courses, industries, professionals, and businessmen)
• Competence examiners • Professionals in the establishment of courses and industries, local motivators, and
local people. • Governments and private supervisors
Other supports necessary for the implementation of the programs are skills learning books, skills modules, equipment for practicum, building and other facilities.

National Coordination Forum Education for All 2003
75
d. Management
At least four actors are involved in the implementation of life skills educational programs: central governments, local governments (at the levels of provinces, districts, sub-districts, villages), Social organizations, and local people. The management includes planning, program implementation, coordination, monitoring, control, and evaluation.
The management of life skills education focuses on education services, and management of resources. More specifically, it is concerned with the followings: • Curriculum development • Development, production, and distribution of learning materials (books and modules) • Technical assistance in learning development The management of resources includes: • Teacher management • Information system management • Social participation, and contribution management • Social activity management School committee is formed to accommodate the roles of societies in every level of education.
e. Budgeting
The expansion of access requires great amounts of money. Some components of program below need financial supports: • Learning budget or scholarships for learning societies • Educational facilities and infrastructures • Learning materials, skill modules, and other supplementary materials • Teacher and manager salary • Evaluation and competence assessment • Budget for business exercises • Socialization, promotion, and advocating • Monitoring, technical supports, and studies
Financial resources include the budget of central governments, local governments, private business, foreign aids, and international institutions. For example, in 2001 Directorate general of non-formal education and youth, Department of national education contributed 25.6 billions rupiahs to support the implementation of life skills educational programs in 160 institutions. This financial support was quoted to 8.000 learners, 1.900 people in 38 social development institutions, 750 people in 15 woman institutions, and 1.575 in 45 youth organizations. Directorate of primary and secondary school departments of national education in 2002 contributed 350 billions rupiahs to 8173 educational institutions of all levels. It has been

National Coordination Forum Education for All 2003
76
planned that in 2003, 267.401 billions rupiahs would be contributed to 6173 institutions of all levels. 3.3.2 The improvement of quality and relevance in life skills educational programs a. Targets
The targets, which are concerned with the improvement of life skills educational quality include:
• Improving quality of all educational aspects and assuring potencies in all learners of
life skills education • Standardizing quality assurance at the levels of nation, provinces, districts, sub-
districts, and villages. • Planning quality improvement in all aspects of life skills educational aspects in order
to produce qualified graduates. • Establishing a minimum service standard, competence standard with reference to
national and international standard. • Re-evaluating life skills educational implementation system, which should work on
eradicating poverty, minimizing the number of unemployment, solving social problems, meeting job market, and developing people’s industries and economic activities.
b. Programs of quality improvement
Below are the integral parts of quality improvement in life skills educational system: • Training for teachers and skill instructors • Training for the managers of life skills educational institutions • Providing educational facilities • Developing educational programs, competence standard, competence evaluation
system and certification. • Developing, providing, and distributing learning materials • Developing educational standardization • Managing and developing planning and mechanism system, implementation, and
control programs • Improving the quality of graduates, especially, focusing on developing skills for
entrepreneurships. c. Resources
Resources required for the development of quality in life skills education include:
• Professional teachers • Physical infrastructures such as classrooms, practicum building, workshop center,
and library • Skilful teachers • Educational institutions who are ready to convert to life skills educational institutions • Institutions that provide good resources.
National Coordination Forum Education for All 2003
77
d. Management
The management of sources determines the improvement of quality. The management of life skills education focuses on:
• The management of educational and training programs for teachers. • Technical supports for the implementation of programs, learning material
development, competence assessment, competence implementation and certification. • The development of competence standard, curriculum and learning materials.
The management of life skills education includes:
• The management of quality development plan • The management of quality control system • The management of system of monitoring, evaluation, technical supports, and
reporting • The management of information system.
e. Budget
Some life skills education components require budgeting:
• Constructing and developing curriculum • Providing and distributing learning materials • Providing the facilities of education • Training teachers and management staff • Providing budget for learning and scholarships • Budget for business exercises • Management
The budget resources come from central government, local and provincial governments, district government, city council, and society’s contribution.
3.3.3 Improvement in efficiencies of life skills educational management a. Targets The targets of life skills educational management include:
• The planning system of life skills educational management • The planning and realization of financial rewards, career, and materials given to
teachers and communities who have successfully taken a role in the implementation of life skills educational programs
• Creating pedagogical and resource service system in life skills educational programs • Re-evaluating the programs in order to adjust to social changes. • Initiating the establishment of resource center in districts. • Developing competence standard and certification.

National Coordination Forum Education for All 2003
78
b. Activities
The implementation of the programs which is concerned with the eradication of the poor and minimizing the number of the unemployed includes the following activities:
• Planning and providing minimum service standard of all life skills educational
programs. • Socializing, advocating, and implementing life skills educational programs using
printing or electronic devices • Doing a research on the relevance of life skills educational programs with the
demands in societies. • Improving the qualification of teachers in villages. • Campaigning education for all societies. • Renovating learning environments, especially those of life skills educational
institutions c. Budget
The resources required to implement life skills educational programs include:
• Experts in the program management and development of life skills education. • Experts in competence based curriculum and program of life skills education. • Institutions/agencies/association that assess competence and provide certificates. • Legal institutions for life skills education. • Committee of management institutions for life skills education at the level of
provinces, districts, towns, sub-districts, and villages. • Development and institutionalization of life skills education. • Research and development institutions of life skills education.
d. Budget
Budget is required for the following purposes: • Research and development • Backstopping • Incentives • Program development and educational components • Campaign, socialization, and educational advocates • Promotion of life skills education • Management system
The sources of budget are governments, societies, and overseas aids.
National Coordination Forum Education for All 2003
79
5. Summary of action plan (2003 – 2005)
4.1 General overview
Life skills education does not simply serve as vocational schools, but also is concerned about the subjects of humanity. It plays a significant role especially in trying to solve the following problems: (1) high rate of poverty, (2) high rate of unemployment, (3) high rate of school dropouts, (4) low level of education graduates (only 14% of graduates study at higher education or universities), (5) low quality of skills, (6) lack of visionary and appreciative attitude to respond to social changes, (7) lack of competitive and innovative ability. Life skills education should be implemented in formal or non-formal education in order to provide access expansively.
4.2 Special overview
Life skills education, especially, focuses on solving the problem of unemployment, which becomes more complicated considering: (1) the increasing number of job seekers, (2) the number of school dropouts is unsolvable, (3) the recruitment of job seekers is disproportional with their existing number, (4) the irrelevance between skills learned at educational institutions and skills necessary in job market, (5) the increasing number of unemployment in villages and towns. Based on the problems above, life skills education focuses on: (1) minimizing the number of unemployment including those at the ages of early schooling and, especially, those of productive adults, (2) preparing students to have commands to compete in job market or to be entrepreneurs, (3) being implemented in villages and towns, (4) involving roles of industries and other businesses, (5) empowering local people, (6) optimally integrating the roles of other educational institutions especially vocational schools, courses, and training or courses in villages. Supports of national policy, budget, facilities and infrastructure, teachers, and professionals are absolutely necessary to have life skills education well established.
4.3 Stages of life skills program implementation
4.3.1 Stages of the implementation in non-formal education The preliminary survey is carried out to reveal the information about the targets, learning needs, implementation, teachers/instructors, conducive facilities and infrastructure, and sponsorships.
National Coordination Forum Education for All 2003
80
• Stage of implementation: implementing activities related to life skills educational programs, financial contribution, technical supports for graduates to establish business groups, or to find a job.
• Monitoring, evaluation, and reporting: intensively and skillfully carried out. • Follow up: developing life skills educational programs to achieve quantitative and
qualitative targets in 2006 – 2015. 4.3.2 Stages of the implementation in formal education • Forming BBE team, an organization that manages and prepares equipment for the
implementation. • Socializing BBE concept with all related elements for the purpose of developing human
resources at the level of nation, provinces, districts/towns. • Selecting schools that are able to implement life skills education. • Distributing block grand budget to schools that implement BBE program in their district. • Affirming the preparation for the implementation of BBE program.

National Coordination Forum Education for All 2003
81
CHAPTER 6 GENDER - EQUITY EDUCATION
1. Introduction
In connection with gender-equity education, Dakar Convention has the following goals as a target:
• Assurance that by year 2015 all children, especially females, who are in hardship and belong to minority ethnicities, have access to and complete their basic education provided for them free of charge, compulsory and in a good quality.
• Improvement up to 50% of adults’ illiteracy rates by year 2015, especially for women, and assurance of equal access to basic education and continuous education for all adults.
• Eradication of the gender-gap in basic and secondary education in 2005 and adoption of gender-equity education in 2015 focusing on assurance for all female children of access to quality basic education.
The educational gender-gap could be identified through three aspects: access, quality and relevance, and management. In order to analyze the educational access gap, School Participation Rates (SPR), proportion of students in accordance with gender and educational levels, and literacy levels are used as indicators. The other indicators are Parity Index (PI) and Disparity towards SPR in Elementary School (SD), Junior High School (SLTP), and Senior High School (SLTA) as well as percentages of the illiterate population. Aspects of quality and relevance would be analyzed through qualitative data.
2. National Performance in 2000
National performance in 2000 is measured through three aspects: (1) access to education, including literacy education; (2) quality and relevance; and (3) management.
2.1 Access to education
Gender disparity in education would be detailed based on variety across regions from villages to cities, across provinces and groups of people’s expenses based on the SPR in accordance with age levels.
SPR (School Participation Rates) is used as an indicator to see the irrelevant accesses to education which reflect the percentages of population in certain age levels taking their formal education. Table 5.1 describes the access development to education between males and females from 1996 to 1999. The data show that the participation rates of population aged 7-12 in 1996 did not reflect differences between males and females.

National Coordination Forum Education for All 2003
82
School Participation Rates (SPR), 1996-1999 Age Category/ Gender 1996 1997 1998 1999
7-12 years old - Female - Male - Total
94.8 94.3 94.5
95.7 95.3 95.5
95.4 95.0 95.2
95.7 95.0 95.3
13-15 years old - Female - Male - Total
75.3 76.4 75.9
76.8 78.3 77.5
77.0 77.3 77.2
78.7 79.3
79 16-18 years old
- Female - Male - Total
45.2 49.9 47.6
47.4 49.9 48.6
48
50.5 49.3
50.8 51.5 51.5
19-24 years old - Female - Male - Total
10.1 14.1 12.0
9.9
13.7 11.6
10.3 14.1 12.1
11.2 14.3 12.7
Source: BPS, Data Kor Susenas (1996-1999)
Differences in school participation happened in the age 13-15 group in which in 1996 male participation was 76.4 percent while female participation was 75.3 percent. Through the average improvement of SPR up to 79 percent in 1999, the males’ SPR (79.3 percent) was still higher than that of females’ (78.7 percent).
The gap of SPR between males and females was wider in the age 16-18 group. When males’ SPR was 49.9 percent in 1996, the females’ was only 45.2 percent. In 1999 the gap was smaller in which the males’ SPR was 51.5 percent and females’ was 50.8 percent.
Meanwhile, in the age 19-24 group, males’ SPR was far higher than females’. In 1996, 14.1 percent of males’ SPR and 10.1 percent of females’ showed that the school participation ratio between males and females was 10 : 7. The condition in 1999 was better when the males’ SPR was 14.3 percent and females’ was 11.2 percent or in ratio 10 : 8.
2.1.1 School Participation Rates (SPR) of Children Aged 7-12
a. Variety across cities and villages
As in 1999, the average of females’ SPR aged 7-12 in 2000 was better than that of males’ in the same age category (Table 5.2). However, when the SPR was compared across regions in villages and cities, the gap was relatively big. When males’ SPR aged 7-12 in the cities reached 98.0 percent, the females’ in villages reached 95 percent. Differences also happened to males in cities and villages, with the SPR 97.2 percent in cities and 93.6 in villages.

National Coordination Forum Education for All 2003
83
School Participation Rates (SPR) of Population Aged 7-12, 2000
SPR 7 – 12 Years old Lowest Average Highest
Male - Villages - Cities
82.6 87.7
93.6 97.2
96.9
100.0 Female
- Villages - Cities
84.7 94.3
95.0 98.0
100.0 100,0
Parity Index *) - Villages - Cities
1.01 1.01
*) Females’ SPR divided by Males’ SPR
b. Variety across provinces
When the SPR was compared, it became evident that there was an educational participation gap across regions in cities and villages. An analysis about the access levels for children aged 7-12 in villages showed that there were 15 provinces in which their accesses were still lower than the national average, for both males and females. Included in 15 provinces were Papua, South Sulawesi, East Nusa Tenggara, East Kalimantan, West Kalimantan, Bengkulu, West Java & Banten, and North Sulawesi & Gorontalo (Figure 5.1).
Variety of access levels to education for children aged 7-12 in villages, across provinces, 2000

National Coordination Forum Education for All 2003
84
c. Variety across levels of family expenses
Social and economic status of people was measured through family expenses that had influenced to the SPR of population aged 7-12. National census (Susenas) data in 1995, 1998, and 2002 showed that the higher the social and economic status, the higher the school participation of population aged 7-12 (Table 5.3). Very interesting phenomenon from the three data comparisons was that each category of females’ school participation expenses was better than that of males’.
School Participation Rates (SPR) of Population Aged 7-12 Years Old in Accordance with Expenses Category and Gender
1995 1998 2002 Expenses Category Male Female Male Female Male Female
Quintile 1 90.10 91.13 91.60 92.24 92.71 94.24 Quintile 2 93.60 94.48 94.74 95.19 95.78 96.47 Quintile 3 94.66 94.95 96.09 96.20 96.67 97.17 Quintile 4 95.66 96.05 96.52 97.09 97.23 97.44 Quintile 5 96.75 97.12 97.67 98.16 97.75 98.26 Average 93.73 94.38 94.98 95.45 95.75 96.49
Note: Quintile 1 is 20 % of the poorest and Quintile 5 is 20 % of the richest
2.1.2 School Participation Rates (SPR) of Population Aged 13-15
a. Variety between cities and villages
The SPR differences of population aged 13-15 were more obvious. In 2000, the average of females’ SPR aged 13-15 in the cities had reached 87.4 percent, while males’ SPR in cities reached 88.2 percent (Table 5.4). On the other hand, the average of females’ SPR in villages reached 72.6 percent and the average of males’ was 72.5 percent. In general, it could be determined that females’ SPR aged 13-15 in villages was a little better than that in cities, while the SPR of males in cities was better than that in villages.
Education Participation Rates of Population Aged 13-15 Years Old, 2000
SPR 13 – 15 Years Old Lowest Average Highest
Male - Villages - Cities
61.3 73.5
72.5 88.2
93.2 96.4
Female - Villages - Cities
61.1 76.1
72.6 87.4
92.1 97.0
Parity Index *) - Villages - Cities
1.01 1.00
*) Females’ SPR divided by males’ SPR
Source: BPS, 2000

National Coordination Forum Education for All 2003
85
b. Variety across provinces
The result of analysis especially in villages, it was found that there were five provinces in which the access levels—both for males and females—was lower than the national average. They were South Sulawesi, North Sulawesi & Gorontalo, South Kalimantan, West Java & Banten, Central Sulawesi, East Nusa Tenggara, South Sumatera, and Bangka Belitung.
Of the two analyses, four provinces were found to have lower access levels than the national average for population aged 7-12 and 13-15 domiciled in villages. The four provinces needed more attention and should be given high priority. They were South Sulawesi, North Sulawesi & Gorontalo, West Java & Banten, and East Nusa Tenggara.
c. Variety across levels of family expenses
Social and economic status of people determined by family expenses had influenced the school participation of population aged 13-15. Data of Susenas (National Census) in 1995, 1998, and 2002 showed that the higher the social and economic status, the higher the school participation of the population aged 13-15 (Table 5.5). The comparisons of data show that, in general, the females’ participation was lower than that of males’.
School Participation Rates (SPR) of Population Aged 13-15 Years Old in Accordance with the Population Expenses and Gender
1995 1998 2002 Expenses
Category Male Female Male Female Male Female Quintile 1 60.78 60.30 65.48 67.36 67.58 70.69 Quintile 2 71.01 68.89 74.28 73.86 76.69 77.72 Quintile 3 76.17 74.43 79.71 78.89 80.48 80.49 Quintile 4 80.89 78.89 82.96 82.21 85.74 84.54 Quintile 5 86.07 82.83 88.56 85.81 89.93 88.03 Average 74.01 72.38 77.32 77.02 78.94 79.50
Note: Quintile 1 is 20 % of the poorest and Quintile 5 is 20 % of the richest
There was an interesting phenomenon in this analysis that 40% of the poorest (Quintile 1 and 2) of females’ school participation of population aged 13-15 was higher than that of males’ (Figure 5.2). Meanwhile, 40% of the richest, the school participation of males was higher than that of females. It was estimated that there were many males coming from poor families who had to work to support their families’ economy.
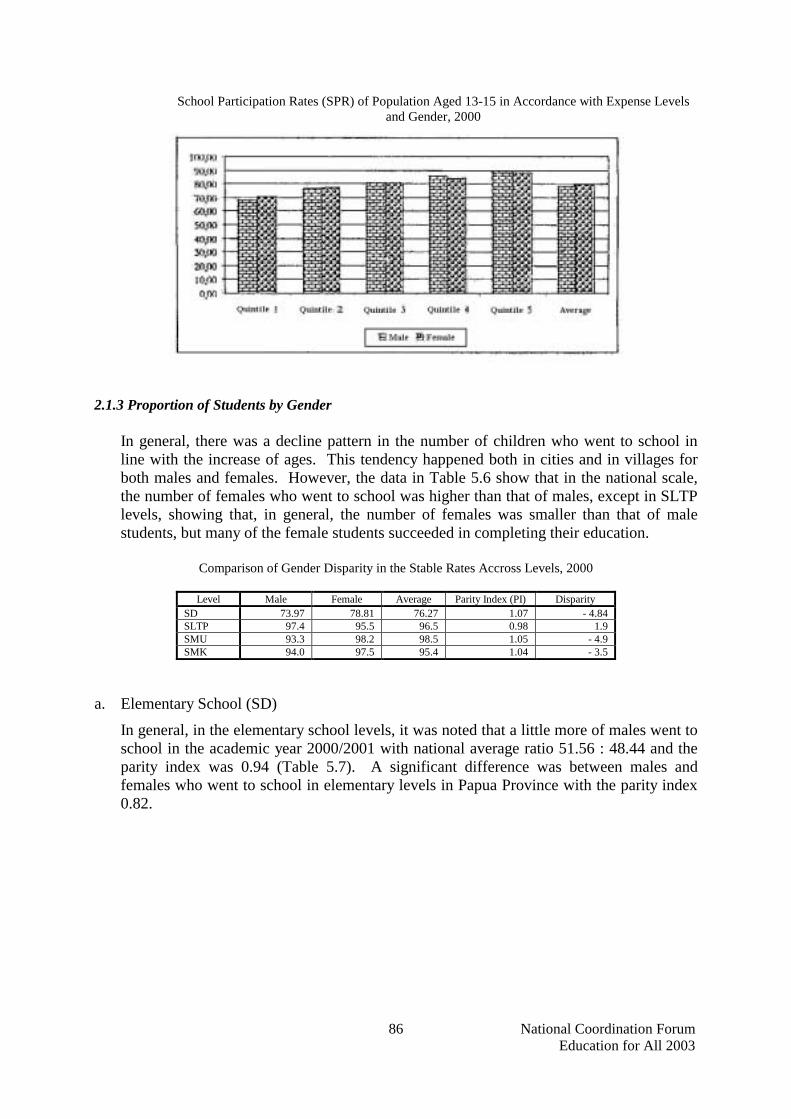
National Coordination Forum Education for All 2003
86
School Participation Rates (SPR) of Population Aged 13-15 in Accordance with Expense Levels and Gender, 2000
2.1.3 Proportion of Students by Gender
In general, there was a decline pattern in the number of children who went to school in line with the increase of ages. This tendency happened both in cities and in villages for both males and females. However, the data in Table 5.6 show that in the national scale, the number of females who went to school was higher than that of males, except in SLTP levels, showing that, in general, the number of females was smaller than that of male students, but many of the female students succeeded in completing their education.
Comparison of Gender Disparity in the Stable Rates Accross Levels, 2000
Level Male Female Average Parity Index (PI) Disparity SD 73.97 78.81 76.27 1.07 - 4.84 SLTP 97.4 95.5 96.5 0.98 1.9 SMU 93.3 98.2 98.5 1.05 - 4.9 SMK 94.0 97.5 95.4 1.04 - 3.5
a. Elementary School (SD)
In general, in the elementary school levels, it was noted that a little more of males went to school in the academic year 2000/2001 with national average ratio 51.56 : 48.44 and the parity index was 0.94 (Table 5.7). A significant difference was between males and females who went to school in elementary levels in Papua Province with the parity index 0.82.

National Coordination Forum Education for All 2003
87
Percentages of Elementary School Males and Females Per Province in the
academic year 2000/2001
Percentage Indicator No Province Male Female PI Disparity 1 DKI Jakarta 51.69 48.31 0.93 -3.38 2 West Java 51.22 48.78 0.95 -2.44 3 Central Java 51.71 48.29 0.93 -3.42 4 DI Yogyakarta 51.96 48.04 0.92 -3.92 5 East Java 51.95 48.05 0.92 -3.90 6 Nangroe Aceh Darussalam 50.90 49.10 0.96 -1.79 7 North Sumatera 51.87 48.13 0.93 -3.73 8 West Sumatera 51.61 48.39 0.94 -3.21 9 Riau 51.67 48.33 0.94 -3.33 10 Jambi 51.59 48.41 0.94 -3.18 11 South Sumatera 51.27 48.73 0.95 -2.53 26 Bengkulu 51.29 48.71 0.95 -2.58 12 Lampung 51.79 48.21 0.93 -3.58 13 West Kalimantan 51.39 48.61 0.95 -2.77 14 Central Kalimantan 50.64 49.36 0.97 -1.28 15 South Kalimantan 51.41 48.59 0.95 -2.83 16 Kalimantan 51.67 48.33 0.94 -3.34 17 North Sulawesi 51.37 48.63 0.95 -2.73 18 Central Sulawesi 51.68 48.32 0.94 -3.35 19 South Sulawesi 50.59 49.41 0.98 -1.17
20 South-East Sulawesi 50.95 49.05 0.96 -1.09 21 Maluku 52.22 47.78 0.91 -4.44 27 North Maluku 52.08 47.92 0.92 -4.16 22 Bali 51.92 48.08 0.93 -3.83 23 West Nusa Tenggara 51.46 48.54 0.94 -2.92 24 East Nusa Tenggara 51.42 48.58 0.94 -2.85 25 Papua 55.08 44.92 0.82 -10.16 Indonesia 51.56 48.44 0.94 -3.12
Source: Indonesia Education Statistics in Brief (2001)
The following position was closely related to the wide gap between males and females who went to school in the elementary levels (SD) that were placed by Maluku, North Maluku, DI Yogyakarta, East Java, and Bali province. A little difference was between males and females who went to school in the elementary levels (SD) in South Sulawesi Province with the Parity Index (PI) 0.98, followed by Central Kalimantan, Nangroe Aceh Darussalam (NAD), South-East Sulawesi, and West Java.
b. Junior High School (SLTP)
In a national scale, the Parity Index (PI) of SD and SLTP students in the academic year 2000/2001 showed the same number (0.94), however each province showed rather big differences (Table 5.8). The lowest PI (parity index) was 0.83 (West Nusa Tenggara) while the highest was 1.08 (West Sumatera). In addition, there were nine provinces that had lower parity index than that of the national rate.
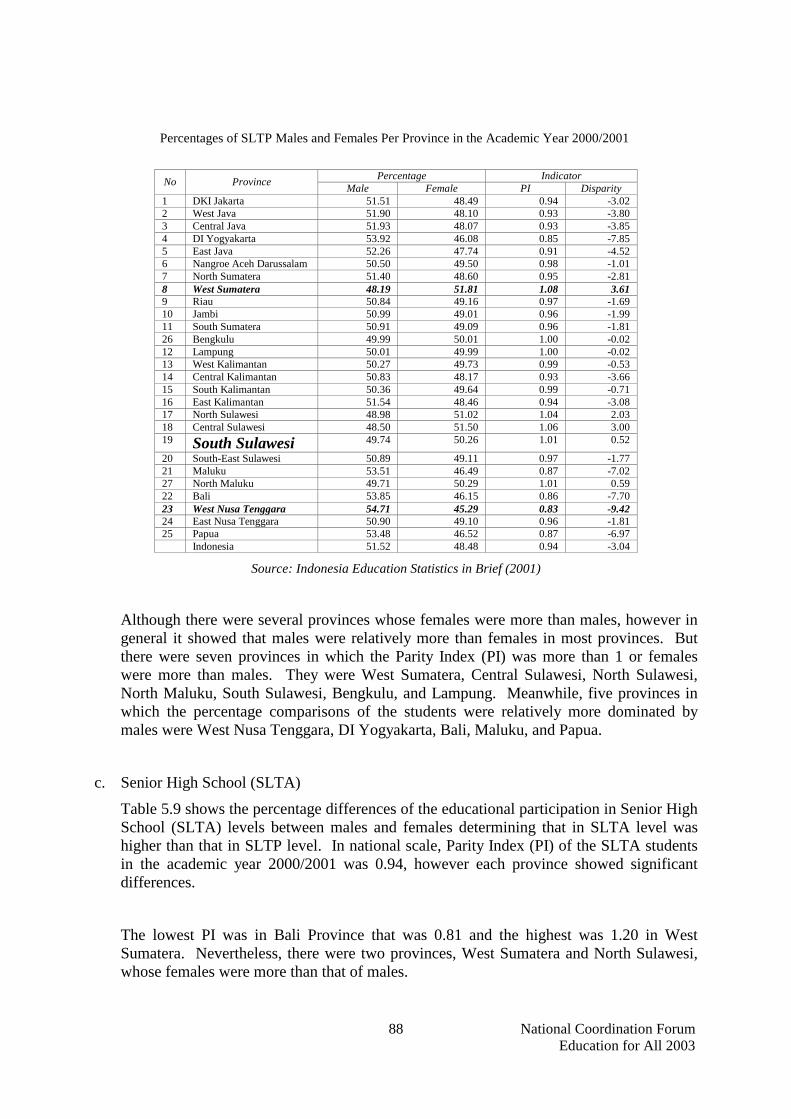
National Coordination Forum Education for All 2003
88
Percentages of SLTP Males and Females Per Province in the Academic Year 2000/2001
Percentage Indicator No Province Male Female PI Disparity 1 DKI Jakarta 51.51 48.49 0.94 -3.02 2 West Java 51.90 48.10 0.93 -3.80 3 Central Java 51.93 48.07 0.93 -3.85 4 DI Yogyakarta 53.92 46.08 0.85 -7.85 5 East Java 52.26 47.74 0.91 -4.52 6 Nangroe Aceh Darussalam 50.50 49.50 0.98 -1.01 7 North Sumatera 51.40 48.60 0.95 -2.81 8 West Sumatera 48.19 51.81 1.08 3.61 9 Riau 50.84 49.16 0.97 -1.69 10 Jambi 50.99 49.01 0.96 -1.99 11 South Sumatera 50.91 49.09 0.96 -1.81 26 Bengkulu 49.99 50.01 1.00 -0.02 12 Lampung 50.01 49.99 1.00 -0.02 13 West Kalimantan 50.27 49.73 0.99 -0.53 14 Central Kalimantan 50.83 48.17 0.93 -3.66 15 South Kalimantan 50.36 49.64 0.99 -0.71 16 East Kalimantan 51.54 48.46 0.94 -3.08 17 North Sulawesi 48.98 51.02 1.04 2.03 18 Central Sulawesi 48.50 51.50 1.06 3.00 19 South Sulawesi 49.74 50.26 1.01 0.52
20 South-East Sulawesi 50.89 49.11 0.97 -1.77 21 Maluku 53.51 46.49 0.87 -7.02 27 North Maluku 49.71 50.29 1.01 0.59 22 Bali 53.85 46.15 0.86 -7.70 23 West Nusa Tenggara 54.71 45.29 0.83 -9.42 24 East Nusa Tenggara 50.90 49.10 0.96 -1.81 25 Papua 53.48 46.52 0.87 -6.97 Indonesia 51.52 48.48 0.94 -3.04
Source: Indonesia Education Statistics in Brief (2001)
Although there were several provinces whose females were more than males, however in general it showed that males were relatively more than females in most provinces. But there were seven provinces in which the Parity Index (PI) was more than 1 or females were more than males. They were West Sumatera, Central Sulawesi, North Sulawesi, North Maluku, South Sulawesi, Bengkulu, and Lampung. Meanwhile, five provinces in which the percentage comparisons of the students were relatively more dominated by males were West Nusa Tenggara, DI Yogyakarta, Bali, Maluku, and Papua.
c. Senior High School (SLTA)
Table 5.9 shows the percentage differences of the educational participation in Senior High School (SLTA) levels between males and females determining that in SLTA level was higher than that in SLTP level. In national scale, Parity Index (PI) of the SLTA students in the academic year 2000/2001 was 0.94, however each province showed significant differences.
The lowest PI was in Bali Province that was 0.81 and the highest was 1.20 in West Sumatera. Nevertheless, there were two provinces, West Sumatera and North Sulawesi, whose females were more than that of males.

National Coordination Forum Education for All 2003
89
In accordance with the four tables above, there were interesting tendencies. First, there was no a single province whose females were higher than that of males in SD levels. Second, provinces such as West Sumatera, North Sulawesi, and South Sulawesi were always ranked on the top position in which their females were more dominant than that of males both in the SLTP and in SLTA levels.
Papua Province ranked highest with males bigger in number than that of females in Kindergarten (TK), SD, SLTP, and Secondary Schools (SM). Meanwhile West Sumatera placed the first position whose PI was the highest in SLTP and SLTA levels. High value of females in the society and the importance of education were consistent reasons of the provinces placing the highest ranks. The disparity of females and males tended to be in line with the increase of educational levels.
Table 5.9 Percentages of Males and Females of SLTA Students Per Province in the
Academic Year 2000/2001
Percentage Indicator No Province Male Female PI Disparity
1 DKI Jakarta 50.63 49.37 0.97 -1.27 2 West Java 53.80 46.20 0.86 -7.60 3 Central Java 53.33 46.67 0.88 -6.67 4 DI Yogyakarta 51.88 48.12 0.93 -3.77 5 East Java 54.08 45.92 0.85 -8.17 6 Nangroe Aceh Darussalam 50.47 49.53 0.98 -0.94 7 North Sumatera 48.22 51.78 1.07 3.55 8 West Sumatera 45.38 54.62 1.20 9.24 9 Riau 50.24 49.76 0.99 -0.49
10 Jambi 50.65 49.35 0.97 -1.31 11 South Sumatera 49.26 50.74 1.03 1.48 26 Bengkulu 48.56 51.44 1.06 2.88 12 Lampung 48.76 51.24 1.05 2.49 13 West Kalimantan 49.72 50.28 1.01 0.56 14 Central Kalimantan 50.68 49.32 0.97 -1.37 15 South Kalimantan 52.03 47.97 0.92 -4.06 16 East Kalimantan 52.03 47.97 0.92 -4.05 17 North Sulawesi 47.54 52.46 1.10 4.93 18 Central Sulawesi 48.93 51.07 1.04 2.15 19 South Sulawesi 49.48 50.52 1.02 1.03
20 South-East Sulawesi 50.01 49.99 1.00 -0.02 21 Maluku 53.44 46.56 0.87 -6.89 27 North Maluku 52.54 47.46 0.90 -5.09 22 Bali 55.15 44.85 0.81 -10.30 23 West Nusa Tenggara 54.71 45.29 0.83 -9.41 24 East Nusa Tenggara 50.43 49.57 0.98 -0.86 25 Papua 55.05 44.95 0.82 -10.11
Indonesia 51.70 48.30 0.93 -3.39
Source: Indonesia Education Statistics in Brief (2001)
Using the Parity Index (PI) of the females’ participation in education across educational levels, the provinces in Indonesia could be categorized into four groups:
• First Group, the higher the educational levels, the lower the Parity Index (PI). Provinces included in this group were Papua, Bali, Maluku, and Central Java.
• Second Group was a province in which its PI was higher in line with the increase of its educational levels. The province included in this category was Bengkulu.
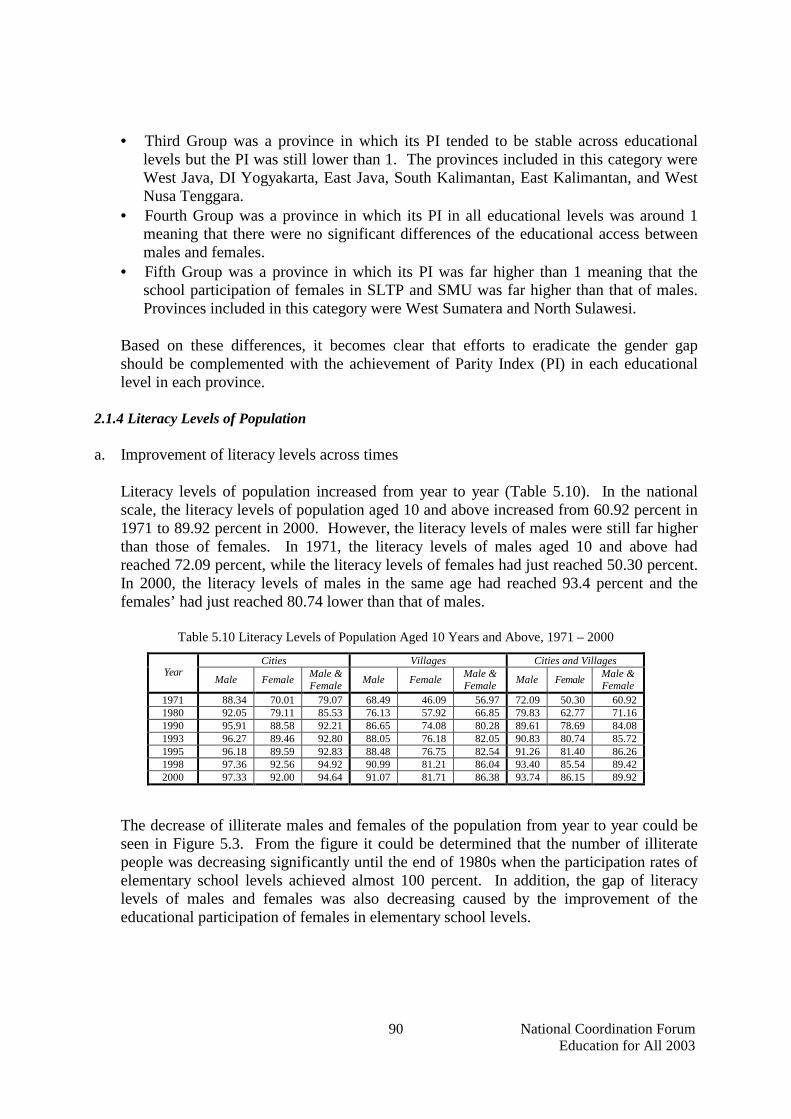
National Coordination Forum Education for All 2003
90
• Third Group was a province in which its PI tended to be stable across educational levels but the PI was still lower than 1. The provinces included in this category were West Java, DI Yogyakarta, East Java, South Kalimantan, East Kalimantan, and West Nusa Tenggara.
• Fourth Group was a province in which its PI in all educational levels was around 1 meaning that there were no significant differences of the educational access between males and females.
• Fifth Group was a province in which its PI was far higher than 1 meaning that the school participation of females in SLTP and SMU was far higher than that of males. Provinces included in this category were West Sumatera and North Sulawesi.
Based on these differences, it becomes clear that efforts to eradicate the gender gap should be complemented with the achievement of Parity Index (PI) in each educational level in each province.
2.1.4 Literacy Levels of Population
a. Improvement of literacy levels across times
Literacy levels of population increased from year to year (Table 5.10). In the national scale, the literacy levels of population aged 10 and above increased from 60.92 percent in 1971 to 89.92 percent in 2000. However, the literacy levels of males were still far higher than those of females. In 1971, the literacy levels of males aged 10 and above had reached 72.09 percent, while the literacy levels of females had just reached 50.30 percent. In 2000, the literacy levels of males in the same age had reached 93.4 percent and the females’ had just reached 80.74 lower than that of males.
Table 5.10 Literacy Levels of Population Aged 10 Years and Above, 1971 – 2000 Cities Villages Cities and Villages
Year Male Female Male &
Female Male Female Male & Female Male Female Male &
Female 1971 88.34 70.01 79.07 68.49 46.09 56.97 72.09 50.30 60.92 1980 92.05 79.11 85.53 76.13 57.92 66.85 79.83 62.77 71.16 1990 95.91 88.58 92.21 86.65 74.08 80.28 89.61 78.69 84.08 1993 96.27 89.46 92.80 88.05 76.18 82.05 90.83 80.74 85.72 1995 96.18 89.59 92.83 88.48 76.75 82.54 91.26 81.40 86.26 1998 97.36 92.56 94.92 90.99 81.21 86.04 93.40 85.54 89.42 2000 97.33 92.00 94.64 91.07 81.71 86.38 93.74 86.15 89.92
The decrease of illiterate males and females of the population from year to year could be seen in Figure 5.3. From the figure it could be determined that the number of illiterate people was decreasing significantly until the end of 1980s when the participation rates of elementary school levels achieved almost 100 percent. In addition, the gap of literacy levels of males and females was also decreasing caused by the improvement of the educational participation of females in elementary school levels.

National Coordination Forum Education for All 2003
91
The Decrease of illiteracy levels of population aged 10 and above
b. Literacy levels by age groups
The data also showed that the decrease of illiteracy levels was significant for older people, especially females. The dramatic decrease happened in the age group of 10-14 whose literacy levels decreased approximately 30 percent in 1971 to less than 3 percent since early 1990s (Figure 5.4). Illiteracy levels of population aged 25-29 showed very significant decrease from about 45 percent to 12.8 percent. The lowest decrease happened in the ages from 40 to 44. The proportion of illiterate females in this age category decreased from 73.58 to 31.2 percent in the same period.
Illiteracy Levels of Population in Indonesia Aged 10-14
Source: Indonesia Human Development Report, 2001

National Coordination Forum Education for All 2003
92
c. Literacy levels according to family expenses
Literacy levels of females showed significant improvement in all categories of family expenses. Literacy levels of females increased from 64.2 percent in 1995 to 75.7 percent in 2002 for the poorest groups and from 90.4 percent to 93.5 percent for the richest groups (Figure 5.5). However, in each category the literacy levels for males aged 15 and above were always higher than that of females. In 2002, the literacy levels of the males’ poorest quintile (perlimaan termiskin laki-laki) reached 86.6 percent while the females’ participation rates had just reached 75.7 percent. In the same period, literacy levels of males’ richest quintile (perlimaan terkaya laki-laki) had reached 92.8 percent while the literacy levels for females had just reached 84.5 percent.
Literacy levels of population aged 15 and above in accordance with gender, 1995-2002
d. Variety of literacy levels across provinces
The literacy levels of population aged 10-14 in Indonesia were various across provinces as indicated in Figure 5.6. The figure shows that in 2000 there were seven provinces whose literacy levels were lower than the national average both for males and females. The seven provinces were Papua, West Nusa Tenggara, East Nusa Tenggara, West Kalimantan, South Sulawesi, South-East Sulawesi, and East Java. Meanwhile, the province whose literacy levels for females was lower than the national average was Bali and for males was Central Kalimantan.
When the illiteracy levels of the population aged 15-24 in accordance with provices and gender were described in form of quadrant, their dissemination could be seen in Figure 5.7. Since the national average of illiterate females was 1.9 percent and the illiterate males was 1.3 percent, there were eight provinces whose literacy levels for females and males were higher than the national average, they were Papua, East Nusa Tenggara, West Nusa Tenggara, South Sulawesi, West Kalimantan, East Java, South-East Sulawesi, and Central Sulawesi. Meanwhile, Bali and Bengkulu females’ illiteracy levels were higher

National Coordination Forum Education for All 2003
93
than the national average but the males’ illiteracy levels were still lower than the national average.
Variety of literacy levels of population aged 10-44 across provinces in 2000
Source: Processed from Susenas data, BPS, 2000
Figure 5.7 Variety of literacy levels of population aged 15-24 across provinces in 2000
Source: Processed from Susenas data, BPS, 2000
2.1.5 Various Factors Causing the Differences of Educational Access
In improving the access and equity of education, the government had done various efforts, among others were building schools in poor regions, providing alternative educational services, giving scholarships to students coming from poor families, and so forth. However, these efforts had not completely improved the access of females to education for various reasons. The data from the Susenas Module of Education conducted in 1998 showed the reasons of population who did not go to schools as presented in Table 5.11 – 5.13.

National Coordination Forum Education for All 2003
94
The data in Table 5.11 indicated that 59.79% of males and females in villages did not complete their elementary schools caused by financial problem, 13.95% caused by low motivation, and 10.98% caused by working or taking care of the house. While the reasons determining that they did not finish their SLTP, 55.56% caused by financial problem, 14.66% caused by low motivation, and 8.83% caused by working or taking care of their houses. An important point to consider was that there were many females who did not continue their study both in cities and in villages caused by financial problem, working, taking care of children and getting married.
Percentages of population aged 5-39 in villages who did not go to school and had completed their last educational levels categorized into “not continuing their schools”
Reason Financial Problem Low Motivation Married/ Having a
Family Working and Taking
care of the house SD Male 63.34 13.51 2.06 9.25 Female 56.24 14.39 7.55 12.71 Average 59.79 13.95 4.81 10.98 Parity Index 0.88 1.06 3.66 1.37 Disparity -7.1 0.88 5.49 3.46 SLTP Male 59.95 14.75 2.59 7.71 Female 51.16 14.57 15.86 9.95 Average 55.56 14.66 9.23 8.83 Parity Index 0.85 0.98 6.12 1.29 Disparity -8.79 -0.18 13.27 2.24 SM Male 50.86 21.09 4.2 5.25 Female 41.92 23.65 16.49 5.36 Average 46.39 44.74 10.35 10.61 Parity Index 0.82 1.12 3.92 1.02 Disparity -8.94 2.56 12.29 0.11
Source: Modul Pendidikan Susenas, BPS, 1998
The reasons of population living in cities for not continuing thier education were rather different from those living in villages. In general it could be concluded that males living in cities have higher number of dropouts caused by lack of motivation in all levels of education compared to those living in villages. Drop outs resulting from financial difficulties in villages were more than those residing in cities. However, dropout rates at SLTA levels which were caused by marriage problems were higher in cities than those in villages (Table 5.12).
Percentages of population aged 5-39 in cities who did not go to schools and had not completed their last education levels categorized into “stopping their schools”
Reason Financial Problem Low Motivation Married/ Having a
Family Working and Taking Care of the House
SD Male 54.72 22.32 0.50 6.41 Female 56.72 15.04 4.14 10.77 Average 55.72 18.68 2.32 8.59 Parity Index 1.04 0.67 8.28 1.68 Disparity 2.00 -7.28 3.64 4.36 SLTP Male 54.10 20.43 2.20 5.38 Female 51.94 10.40 17.49 7.72 Average 53.02 15.42 9.85 6.55 Parity Index 0.96 0.50 7.95 1.43 Disparity -2.16 -10.03 15.29 2.34 SM Male 41.60 22.47 5.95 3.76 Female 35.38 16.06 29.81 5.35 Average 38.49 19.27 17.88 9.11 Parity Index 0.85 0.71 5.01 1.42 Disparity -6.22 -6.41 23.86 1.59
Source: Modul Pendidikan Susenas, BPS, 1998

National Coordination Forum Education for All 2003
95
The overall data showed that there was a tendency that the higher the females’ educational levels, the lower the percentages of females who did not continue studying because of financial problems, out-of-house employment and taking care of children at home. On the contrary, the higher the educational levels, the higher the percentages of those quitting education caused by marriage problems (Table 5.13).
The other reason limiting the access of females to education was that long distances from their addresses to schools as indicated by RAND’s study (1995). This reason was negative for females since parents tended not to allow their female children to study at long-distance schools. Several conditions considered to be reasons for females’ low access to education were the negative view held by society towards females who had high educational levels, limited opportunities for going to schools because of the society’s preference for women’s roles in taking care of the family at home, and financial difficulties.
Table 5.13 Percentages of population aged 5-39 in villages and cities who did not go to schools and had not completed their last educational levels categorized into “stopping their schools”
Reason Financial Problem Low Motivation Married/ Having a
Family Working and Taking Care of the House
SD Male 46.31 22.99 1.07 12.96 Female 45.97 19.16 5.13 17.04 Average 46.14 21.08 3.10 15.00 Parity Index 0.99 0.83 4.79 1.31 Disparity -0.34 -3.83 4.06 4.08 SLTP Male 52.20 21.08 1.78 8.09 Female 48.01 13.14 16.72 9.67 Average 50.11 17.11 9.25 8.88 Parity Index 0.92 0.62 9.39 1.20 Disparity -4.19 -7.94 14.94 1.58 SM Male 46.25 21.93 5.78 4.50 Female 38.04 13.09 30.76 6.58 Average 42.15 17.51 18.27 5.54 Parity Index 0.82 0.60 5.23 1.46 Disparity -8.21 -8.84 24.98 2.08
Source: Modul Pendidikan Susenas, BPS, 1998
In family circles, not all fathers as heads of family realized the importance of gender equity, so the decision makers in the family were dominated by husbands/fathers. For instance, in selecting a school, study program and even the priority setting for obtaining education, especially for poor families, the family decision-makers gave priority to males rather than females.
From individual point of view, especially the children’s motivation to go to schools had significantly influenced to gender-gaps. Table 5.13 showed that apart from inadequate funds that should be paid to schools, motivation was also a significant factor for males who dropped out from SD to SMU levels. In addition, getting married in the early ages was one of the indicators that caused females not to continue their education to SMU levels and this condition had caused high gender-gaps.

National Coordination Forum Education for All 2003
96
2.2 Quality and Relevance
In the educational development, symptoms of gender segregation prevail in a department or study program as one form of gender voluntarily discrimination forms in division of expertise and various works. This results from values and behaviors influenced by society’s social and cultural factors that have institutionally segregated the gender in various social roles. The selection of departments for females are closely related to domestic functions, meanwhile these female students are expected to play roles in supporting the economy of family, consequently they have to opt for more hard sciences, technology, and industry.
2.3 Management
In general, educational policies were not gender-biased, but in their implementation the gap prevailed. Up to present, women’s participation in the decision making process was still low, as a result, there were many educational policies less sensitive to gender. However, gender-equity efforts in education had succeeded to change several regulations giving attention explicitly to gender equity. In 2000, there were several regulations made that had been responsive to gender. In addition, policies in giving scholarships for students coming from poor families had explicitly given a side to females. The gender-equity policies had actually not materialized in practice. An evaluation on this phenomenon had not been deeply and systematically made.
3. Recommendation
Considering the presently existing educational condition, there are several points to be taken into account:
• Increasing the educational participation by improving the educational access and capacity, decreasing the number of females’ dropouts and improving the number of those continuing their education after graduation through giving special attention to those coming from low social and economic status and those living in poor regions. These efforts should be supported by integrated services to grow their awareness and responsibility as well as to help the poor families getting education for their children. Various efforts that would be done in eliminating the gender-gap should be associated with the situation and problems of each region or territorial and should be coordinated with all stakeholders.
• Improving the quality and relevance of education through perfecting curriculum and revising teaching materials that are more gender-sensitive, increasing the quality of educators so that they have adequate understanding about the gender-issues and gender-sensitive and implement them in the teaching and learning process.
• Developing management of education which is gender-responsive by way of implementing various analyses of policies and regulations that are still gender-biased; formulating and determining policies and regulations of gender-equitable education; improving the capacity of educational management institutions in order to have skills in planning and making policies, strategies, and programs of gender-equitable education

National Coordination Forum Education for All 2003
97
effectively and efficiently; and developing female study centers and empowering the other study centers as counterparts to the central and local governments in developing the gender-equitable education.
4. National Plan of Action
4.1 Policies
In achieving the Dakar targets, the policies adopted are (1) realizing the same rights of qualified and gender-based educational access for all males and females; (2) decreasing the illiteracy levels of adults especially females through improving their educational performances in every level of education both through schools and non-schools education, functional equity and literacy education for adults; and (3) improving the ability of the educational institutions in managing and promoting gender-based education.
4.2 Strategies
The above policies would be implemented by way of five main strategies: (1) providing qualified educational access especially in elementary schools evenly for both males and females and both through schools and through non-schools education; (2) providing equal educational access for adults who did not follow the school education; (3) improving the adequacy of literacy educational services for adults especially women; (4) increasing the coordination, information, and education in promoting the gender-based education; and (5) developing educational institution boards both in central and in local governments about the gender-based education.
The strategy of “Providing equitably educational access especially to quality basic education for both males and females through both schools and out-of-school education”, “providing educational equivalent-programs for adults who did not attend formal school-based education”, and “improving the adequacy of literacy education programs for adults especially women” are deeply explored in the National Plan of Action for Basic Education and National Plan of Action for Literacy Education. Strategies in connection with coordination, information, and education as well as institutional development are detailed in the following:
• Improving coordination, dissemination of information and education in order to give priorities to gender-based education. These strategies are very important considering the gender-issues relatively new in Indonesia, consequently the people’s understanding, including decision makers both in the central and in local governments, has not been the same. The understanding of all stakeholders including the general public about gender-equitable education should be broadened not only in providing equal educational access for both males and females, but also in issues relative to quality, efficiency, and relevance including the educational management that has not yen been gender-responsive. Supervision and evaluation of gender-sensitive policies and programs should be implemented in order to ensure that their implementations have been relevant with their objectives.
• Capacity building of gender-equitable education is needed to strengthen the educational institution’s decision makers so that they become able to effectively and efficiently plan
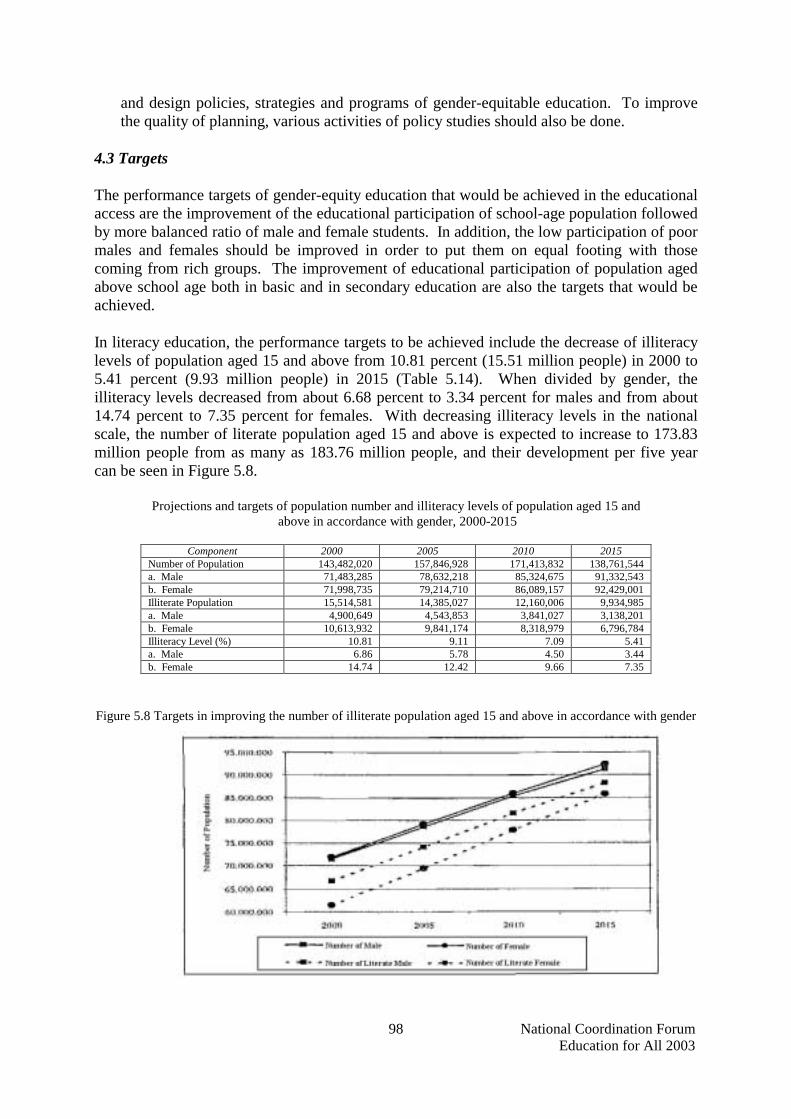
National Coordination Forum Education for All 2003
98
and design policies, strategies and programs of gender-equitable education. To improve the quality of planning, various activities of policy studies should also be done.
4.3 Targets
The performance targets of gender-equity education that would be achieved in the educational access are the improvement of the educational participation of school-age population followed by more balanced ratio of male and female students. In addition, the low participation of poor males and females should be improved in order to put them on equal footing with those coming from rich groups. The improvement of educational participation of population aged above school age both in basic and in secondary education are also the targets that would be achieved.
In literacy education, the performance targets to be achieved include the decrease of illiteracy levels of population aged 15 and above from 10.81 percent (15.51 million people) in 2000 to 5.41 percent (9.93 million people) in 2015 (Table 5.14). When divided by gender, the illiteracy levels decreased from about 6.68 percent to 3.34 percent for males and from about 14.74 percent to 7.35 percent for females. With decreasing illiteracy levels in the national scale, the number of literate population aged 15 and above is expected to increase to 173.83 million people from as many as 183.76 million people, and their development per five year can be seen in Figure 5.8.
Projections and targets of population number and illiteracy levels of population aged 15 and above in accordance with gender, 2000-2015
Component 2000 2005 2010 2015
Number of Population 143,482,020 157,846,928 171,413,832 138,761,544 a. Male 71,483,285 78,632,218 85,324,675 91,332,543 b. Female 71,998,735 79,214,710 86,089,157 92,429,001 Illiterate Population 15,514,581 14,385,027 12,160,006 9,934,985 a. Male 4,900,649 4,543,853 3,841,027 3,138,201 b. Female 10,613,932 9,841,174 8,318,979 6,796,784 Illiteracy Level (%) 10.81 9.11 7.09 5.41 a. Male 6.86 5.78 4.50 3.44 b. Female 14.74 12.42 9.66 7.35
Figure 5.8 Targets in improving the number of illiterate population aged 15 and above in accordance with gender

National Coordination Forum Education for All 2003
99
4.4 Priority Targets
Based on the analysis we made on the available data it was found that in general the participation of females in education was still lower than that of males, however from a deeper evaluation it was known that there were certain regions and certain groups of people, e.g., category of age 13-15 from poor family, whose males’ participation was lower than that of females’. Various conditions would also need various forms of intervention as a result the various implemented programs could truly decrease the educational gap between males and females.
In the elementary school levels, population aged 7-12, in which the ratio of male and female students was good, therefore, the priority determination should consider the variety across regions or provinces and income categories. Provinces that have relatively lower PI in SD levels were Bengkulu (PI 0.85) and West Sumatera (PI 0.95).
In the SLTP-MTs levels, population aged 13-15, it was determined that their participation was still low. Therefore, participation improvement efforts should be made both for males and females. However, when it was known that the educational participation of males included in the category of 40% of the poorest was lower than that of females, therefore more intensive efforts to improve this category was very needed. Assumptions considering that the lower educational participation, one of them was caused by working, efforts to make them back to schools were very important. Provinces whose PI-s were far lower than 1 (<0.9) were DI Yogyakarta (PI 0.85), Maluku (PI 0.87), Bali (PI 0.86), West Nusa Tenggara (PI 0.83), and Papua (PI 0.87) should be interfered to improve their females’ participation.
In SLTA and College levels in which the participation was still very low in national scale, the efforts to improve their participation should be done in each group of society and in all regions with the emphasis on population whose economic status was low. Provinces whose PI-s were far lower than 1 were East Java, Central Java, West Java, Maluku, Bali, East Nusa Tenggara, and Papua, therefore they should be given attention in improving their females’ participation. In the same period, provinces whose PI-s were far higher than 1 were West Sumatera and North Sulawesi, therefore they should be interfered to improve their males’ participation.
It was obvious that the literacy levels of females were far lower than that of males both in villages and in cities, in each of age category of adults, and in every group of family expenses. However, main priorities were given to efforts in improving their literacy levels of poor females living in villages and aged more than 25 since this group had the lowest literacy level, then followed by females in the same age category who were poor and lived in villages.
All efforts to improve the educational participation and literacy levels of the population mentioned above were supported by efforts to improve the ability of the educational capacity, therefore they have skills in planning the gender-responsive education, in addition to improve the understanding of all parties about the importance of education both for males and females.

National Coordination Forum Education for All 2003
100
4.5 Main Activities
4.5.1 Capacity Building of Gender-based Institutions
• Increasing the gender-based network for mainstreaming across sectors in regencies and provinces
• Holding communication forum that allows opportunities to educational practitioners to share experiences and best practices from local to central governments.
• Cooperating with non-government organization (LSM) and women/ educational-based organizations to facilitate poor families or parents to give rights to each child to get education.
• Intensifying the use of information system and educational data collection in accordance with gender and analyze the data to determine the gender-based educational performances and plans from the central to local governments in order to formulate the gender-based educational policies and programs.
• Developing instruments for gender-equitable educational plans. • Developing standardized messages about gender-equitable education. • Improving new women study centers or broadening the scope of study centers that have
been in operation in local governments or gender-issues as counterparts to the local governments in the gender-based educational management.
• Increasing the roles of the available study centers to study various gender issues in educational fields.
• Developing study programs of gender in the development from bachelor and masters, to doctor degrees in universities that have women studies in order to provide gender-based human resources in the development that would become gender-based researchers, decision makers, planners, and executors in the development programs.
• Analyzing policies that are still gender-biased in their various forms: regulations, curricula and teaching materials.
• Doing various studies on practices that have resulted in the exiting gender-irresponsive education and following up the findings and proposed recommendations
• Perfecting the regulations, curriculum, and teaching materials that are still gender-biased. • Monitoring the implementation of gender-mainstreaming programs from the levels of
central to local governments. • Evaluating the implemented practices and giving feedbacks for revisions.
4.5.2 The Improvement of Gender-based Educational Dissemination
• Developing educational strategies to the society about various fields of technology, environment, and information adequately followed by women.
• Implementing advocate and KIE programs about the importance of equity and gender-equity in the family as early as possible.
• Socializing gender mainstreaming to the executors (or program implementers) and decision makers in the central and local governments.
• Developing the commitment of decision makers in the educational fields in realizing the gender-equity and optimizing the implementation of gender-responsive programs.
• Realizing the availability of websites and internet in educational fields in each educational office and sub-office provided by accurate and up to date data.
• Improving the roles of mass media for education as a means for educators, government, and LSM to develop women and development to generate their learning motivation.
National Coordination Forum Education for All 2003
101
4.5.3 Gender-based Family Education
• Formulating the pilot project of the gender-based family educational model for poor families.
• Making estimation and up dating the poor families’ data. • Implementing the pilot project of the gender-based family education for poor families in
several selected cities and villages. • Evaluating and perfecting the concept of the pilot project of the gender-based family
education. • Implementing the gender-based family education for poor families both in villages and in
cities in the national scale.

National Coordination Forum Education for All 2003
102
CHAPTER 7 QUALITY OF EDUCATION
1. Introduction
Dakar’s commitment to the quality of education is stated below:
The attainment of the quality of education for all students, and the quality can be reified by the reliable measurements of learning outcome. Some main criteria used to measure the quality of education are the ability of reading, writing, and counting, as well as essential life skills.
Qualified human resources determine national economic, legal, politic, and social development. Potential human resources will succeed in the global competition. The competition in this globalizing world is simply the contestation of human resources --- the products of a variety of educational institutions. Therefore, improving the quality of education should absolutely be supported by all social components such as the management of education at national level, provincial level, schools, and villages.
Generally, educational system works in the framework of input-process-output. Input, which is processed by certain methods and with a particular composition will become two different products. The short-term product is called output and the long-term product is called outcome. Input in the system of education consists of curriculum, students, teachers, facilities, fund, and many others. An educational process is the whole learning processes involving the interaction of all components of input. The educational output includes students’ capability that can be analysed by identifying students’ achievements. The educational outcome is the improvement of educational quality that can be analysed by identifying the number of graduates who continue their schooling or who are able to earn a living. Thus, the quality of input and process determines the quality of products of either short-term products or long-term products.
Some factors that can be categorized into educational input are home or family, schools, and students. School is one of the factors that is tightly related to an educational policy. Therefore, this study will focus on school.
Some research has identified that teachers and books are the most dominant elements of schools. Understandably, at the lower level of education, teachers’ ability to teach and guide students absolutely determines the success of students’ mastery of learning materials. At the higher level of education, teachers’ role is less dominating due to higher level of students’ ability in understanding learning materials such as those in a book.
Standard and curriculum are the main references in teaching and learning processes. The selection of learning materials refers to curriculum and teachers should refer to the standard of ability in their teaching.
National Coordination Forum Education for All 2003
103
2. Indicators in use
The indicators used to monitor the quality of education are the criteria of educational input and output (short-term educational products), which are detailed as presented below:
2.1 Indicators of educational input
• The availability of textbooks; • Good proportion of teachers with adequate expertise and relevant training; • The adequacy of school condition and available support system.
2.2 Indicators of educational output
• The level of students’ academic achievement: • The level of school’s achievement:
3. The condition of educational quality
3.1 Access to textbooks
3.1.1 Primary/Basic Education (SD) As shown in the following table, the percentage of access of primary education to some textbooks such as Indonesian language, maths, and natural science textbooks in Indonesia varied. Access to Indonesian language textbooks ranked the highest percentage (85.30% on an average) compared to that of maths textbooks (82.87% on an average), and natural science (57.43% on an average).
Generally, each province’s ability to provide textbooks varied. 13 provinces had access to Indonesian language textbooks. 13 provinces and 11 provinces respectively had access to maths textbooks and natural science textbooks. The province, which provided the highest percentage of access to Indonesian language and maths textbooks was D.I. Yogyakarta. Meanwhile, DKI Jakarta provided the highest percentage of access to natural science textbooks. In contrast, East Nusa Tenggara (NTT) provided the lowest percentage of access to Indonesian language, maths, and natural science textbooks. Below is the Table showing the percentage of primary school students and their compulsory school textbooks in the academic year 2000/2001.

National Coordination Forum Education for All 2003
104
Students’ percentage and their compulsory school textbooks, 2000
Provinces Indonesian Lang. Maths Natural science
Aceh - - - North Sumatra 90.60 86.20 63.70 Riau 84.10 80.80 56.80 West Sumatra 87.00 87.50 54.70 Jambi 84.50 83.40 53.00 South Sumatra 90.30 88.90 57.20 Lampung 83.10 79.80 52.60 Bengkulu 93.30 86.70 62.70 Jakarta 95.30 95.60 75.80 West Java 85.80 82.60 54.40 Central Java 92.30 89.20 59.40 Yogya 99.30 98.30 68.10 East Java 95.10 93.40 66.40 West Kalimantan 82.80 77.50 45.70 South Kalimantan 83.10 79.60 51.00 Central Kalimantan 79.30 78.30 54.20 East Kalimantan 88.80 88.60 65.60 Bali 96.80 95.30 65.40 West Nusa Tenggara 81.10 78.20 56.20 East Nusa Tenggara 58.80 55.20 38.80 North Sulawesi 83.20 79.80 59.80 Central Sulawesi 70.50 66.20 47.00 South Sulawesi 88.30 85.10 59.50 South East Sulawesi 86.00 86.00 64.20 Maluku - - - Papua 66.90 66.60 45.50 Average 85.30 82.87 57.43
3.1.2 Junior high schools (SLTP)
The percentage of junior high school’s access to Indonesian language, maths, English language, natural science, physics, and biology textbooks in Indonesia varied. Access to Indonesian language textbooks reached the percentage of 90.25% on the average, access to maths textbooks was 89.35 , and access to natural science, English language, and social science was respectively 53.92%, 75.24% and 77.04%.
Generally, the ability to provide textbooks varies from one province to another . 14 provinces possess a collection above the national average . These provinces had access to Indonesian language textbooks, 15 provinces to maths textbooks, 10 provinces to English language textbooks, 13 provinces to social science textbooks, and 10 provinces to natural science textbooks. The province, which provided the highest percentage of access to Indonesian language, maths, English language, social science textbooks was D.I. Yogyakarta province. In contrast, East Nusa Tenggara (NTT) provided the lowest percentage of access to Indonesian language, maths, English language and social science textbooks. Meanwhile, DKI Jakarta provided the highest percentage of access to natural science textbooks, but Jambi province had the lowest percentage of access to natural science textbooks. Below is the Table showing the proportion of junior high school students and compulsory school textbooks in the academic year 2000/2001.
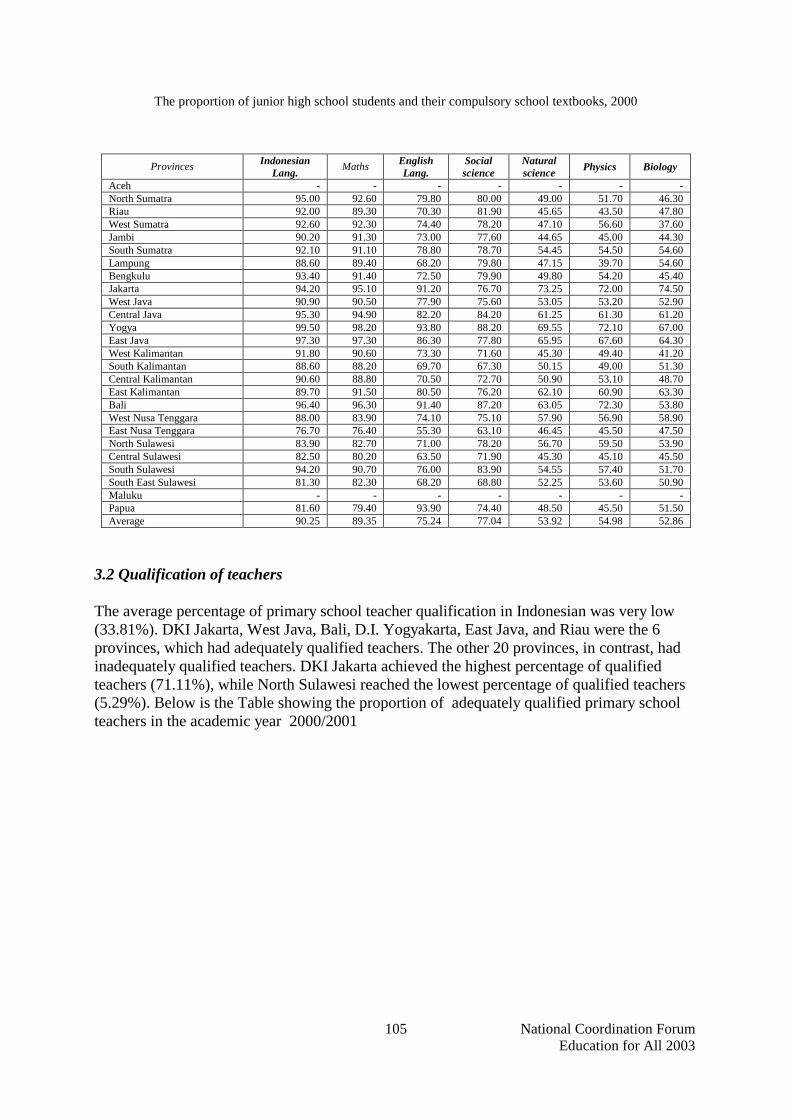
National Coordination Forum Education for All 2003
105
The proportion of junior high school students and their compulsory school textbooks, 2000
Provinces Indonesian Lang. Maths English
Lang. Social science
Natural science Physics Biology
Aceh - - - - - - - North Sumatra 95.00 92.60 79.80 80.00 49.00 51.70 46.30 Riau 92.00 89.30 70.30 81.90 45.65 43.50 47.80 West Sumatra 92.60 92.30 74.40 78.20 47.10 56.60 37.60 Jambi 90.20 91.30 73.00 77.60 44.65 45.00 44.30 South Sumatra 92.10 91.10 78.80 78.70 54.45 54.50 54.60 Lampung 88.60 89.40 68.20 79.80 47.15 39.70 54.60 Bengkulu 93.40 91.40 72.50 79.90 49.80 54.20 45.40 Jakarta 94.20 95.10 91.20 76.70 73.25 72.00 74.50 West Java 90.90 90.50 77.90 75.60 53.05 53.20 52.90 Central Java 95.30 94.90 82.20 84.20 61.25 61.30 61.20 Yogya 99.50 98.20 93.80 88.20 69.55 72.10 67.00 East Java 97.30 97.30 86.30 77.80 65.95 67.60 64.30 West Kalimantan 91.80 90.60 73.30 71.60 45.30 49.40 41.20 South Kalimantan 88.60 88.20 69.70 67.30 50.15 49.00 51.30 Central Kalimantan 90.60 88.80 70.50 72.70 50.90 53.10 48.70 East Kalimantan 89.70 91.50 80.50 76.20 62.10 60.90 63.30 Bali 96.40 96.30 91.40 87.20 63.05 72.30 53.80 West Nusa Tenggara 88.00 83.90 74.10 75.10 57.90 56.90 58.90 East Nusa Tenggara 76.70 76.40 55.30 63.10 46.45 45.50 47.50 North Sulawesi 83.90 82.70 71.00 78.20 56.70 59.50 53.90 Central Sulawesi 82.50 80.20 63.50 71.90 45.30 45.10 45.50 South Sulawesi 94.20 90.70 76.00 83.90 54.55 57.40 51.70 South East Sulawesi 81.30 82.30 68.20 68.80 52.25 53.60 50.90 Maluku - - - - - - - Papua 81.60 79.40 93.90 74.40 48.50 45.50 51.50 Average 90.25 89.35 75.24 77.04 53.92 54.98 52.86
3.2 Qualification of teachers
The average percentage of primary school teacher qualification in Indonesian was very low (33.81%). DKI Jakarta, West Java, Bali, D.I. Yogyakarta, East Java, and Riau were the 6 provinces, which had adequately qualified teachers. The other 20 provinces, in contrast, had inadequately qualified teachers. DKI Jakarta achieved the highest percentage of qualified teachers (71.11%), while North Sulawesi reached the lowest percentage of qualified teachers (5.29%). Below is the Table showing the proportion of adequately qualified primary school teachers in the academic year 2000/2001

National Coordination Forum Education for All 2003
106
The proportion of adequately qualified primary school teachers
No Provinces % 1. Jakarta 71.11 2. West Java 62.26 3. Bali 54.64 4. Yogyakarta 52.47 5. East Java 46.12 6. Riau 42.61 Average 33.81 7. Central Java 33.23 8. Bengkulu 32.83 9. South Kalimantan 25.59 10. West Nusa Tenggara 25.37 11. East Kalimantan 24.74 12. South Sulawesi 23.26 13. Lampung 22.52 14. Jambi 19.66 15. Central Kalimantan 19.47 16. West Sumatra 17.97 17. Aceh 16.81 18. North Sumatra 13.88 19. South Sumatra 13.50 20. South East Sulawesi 12.59 21. Maluku 11.16 22. West Kalimantan 10.06 23. Central Sulawesi 9.25 24. East Nusa Tenggara 7.09 25. Papua 5.85 26. North Sulawesi 5.29
The average percentage of junior high school subject teacher qualification in Indonesian varied, for example, Indonesian language teachers (46.99%), English language teachers (45.45%), Maths teachers (50.93%), natural science teachers (54.62%), and social science teachers (48.29%). Seven provinces were identified to have qualified Indonesian language teachers above average. Six provinces, 8 provinces, 10 provinces, and 9 provinces were identified to have adequately qualified teachers in—reflectively--English language subject, Maths subject, natural science subject, and social science subject. Below is the Table showing the proportion of adequately qualified junior high school (SLTP) teachers in the academic year 2000/2001
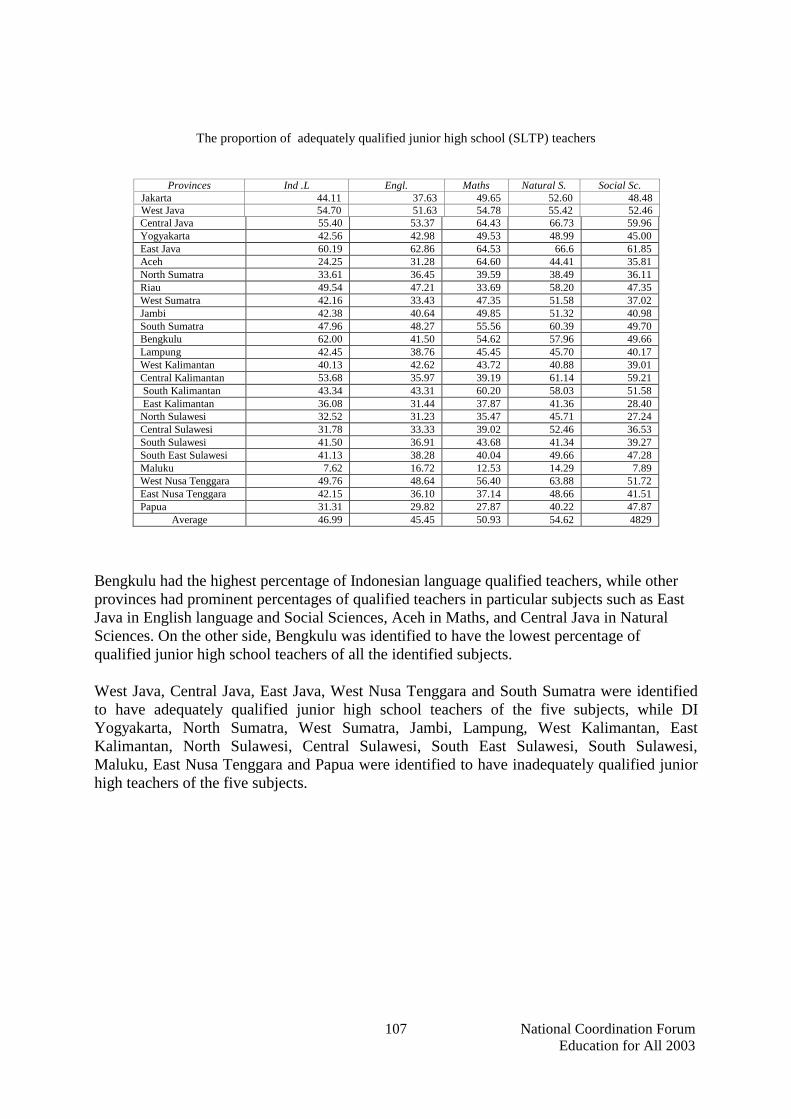
National Coordination Forum Education for All 2003
107
The proportion of adequately qualified junior high school (SLTP) teachers
Central Java 55.40 53.37 64.43 66.73 59.96 Yogyakarta 42.56 42.98 49.53 48.99 45.00 East Java 60.19 62.86 64.53 66.6 61.85 Aceh 24.25 31.28 64.60 44.41 35.81 North Sumatra 33.61 36.45 39.59 38.49 36.11 Riau 49.54 47.21 33.69 58.20 47.35 West Sumatra 42.16 33.43 47.35 51.58 37.02 Jambi 42.38 40.64 49.85 51.32 40.98 South Sumatra 47.96 48.27 55.56 60.39 49.70 Bengkulu 62.00 41.50 54.62 57.96 49.66 Lampung 42.45 38.76 45.45 45.70 40.17 West Kalimantan 40.13 42.62 43.72 40.88 39.01 Central Kalimantan 53.68 35.97 39.19 61.14 59.21 South Kalimantan 43.34 43.31 60.20 58.03 51.58 East Kalimantan 36.08 31.44 37.87 41.36 28.40 North Sulawesi 32.52 31.23 35.47 45.71 27.24 Central Sulawesi 31.78 33.33 39.02 52.46 36.53 South Sulawesi 41.50 36.91 43.68 41.34 39.27 South East Sulawesi 41.13 38.28 40.04 49.66 47.28 Maluku 7.62 16.72 12.53 14.29 7.89 West Nusa Tenggara 49.76 48.64 56.40 63.88 51.72 East Nusa Tenggara 42.15 36.10 37.14 48.66 41.51 Papua 31.31 29.82 27.87 40.22 47.87
Average 46.99 45.45 50.93 54.62 4829
Bengkulu had the highest percentage of Indonesian language qualified teachers, while other provinces had prominent percentages of qualified teachers in particular subjects such as East Java in English language and Social Sciences, Aceh in Maths, and Central Java in Natural Sciences. On the other side, Bengkulu was identified to have the lowest percentage of qualified junior high school teachers of all the identified subjects.
West Java, Central Java, East Java, West Nusa Tenggara and South Sumatra were identified to have adequately qualified junior high school teachers of the five subjects, while DI Yogyakarta, North Sumatra, West Sumatra, Jambi, Lampung, West Kalimantan, East Kalimantan, North Sulawesi, Central Sulawesi, South East Sulawesi, South Sulawesi, Maluku, East Nusa Tenggara and Papua were identified to have inadequately qualified junior high teachers of the five subjects.
Provinces Ind .L Engl. Maths Natural S. Social Sc. Jakarta 44.11 37.63 49.65 52.60 48.48 West Java 54.70 51.63 54.78 55.42 52.46

National Coordination Forum Education for All 2003
108
3.3 Adequacy of school and library
Below is the Table showing that vocational schools were almost physically in a good condition, while only few primary school buildings were considered decent.
The percentage of physically good classrooms of educational institutions 1999/2000 and 2000/2001
Level of education %
Primary education (SD) 41.59 Junior high schools (SLTP) 87.59 Senior high schools (SLTA) 92.61 Vocational high schools (SMK) 94.49
Below is another Table showing the percentage of the number of libraries for junior high schools (SLTP), senior high schools (SLTA), and vocational high schools (SMK). The total percentage of libraries for all the types of schools was 70.
The percentage of the number of libraries 2000/2001
Level of education %
Primary education (SD) - Junior high schools (SLTP) 73.42 Senior high schools (SLTA) 64.43 Vocational high schools (SMK) 73.21
3.4 Academic achievement
3.4.1 International comparison
Timss-R is designed to study 13-year old learners’ ability and knowledge in Maths and natural sciences.
One reason for Indonesia’s joining this study is to gain information about students’ ability in Maths and natural sciences through the global competition. This study is expected to bring about significant impacts on the improvement of Maths and Natural Sciences’ quality educational policy making.
In the subject of Natural Sciences, Indonesia ranks 32nd of 38 participants. Taiwan, Singapore, Hungary, Japan, and South Korea are the best five countries. Indonesian position is, however, better than Turk, Tunisia, Chile, Philippines, Morocco, and South Africa.
In Maths, Indonesia ranks 34th of 38 participants. Singapore, South Korea, Taiwan, Japan, and Belgium are the five best countries in this subject. Nevertheless, Indonesia’s position is still far better than Chile, Philippines, Morocco, and south Africa.
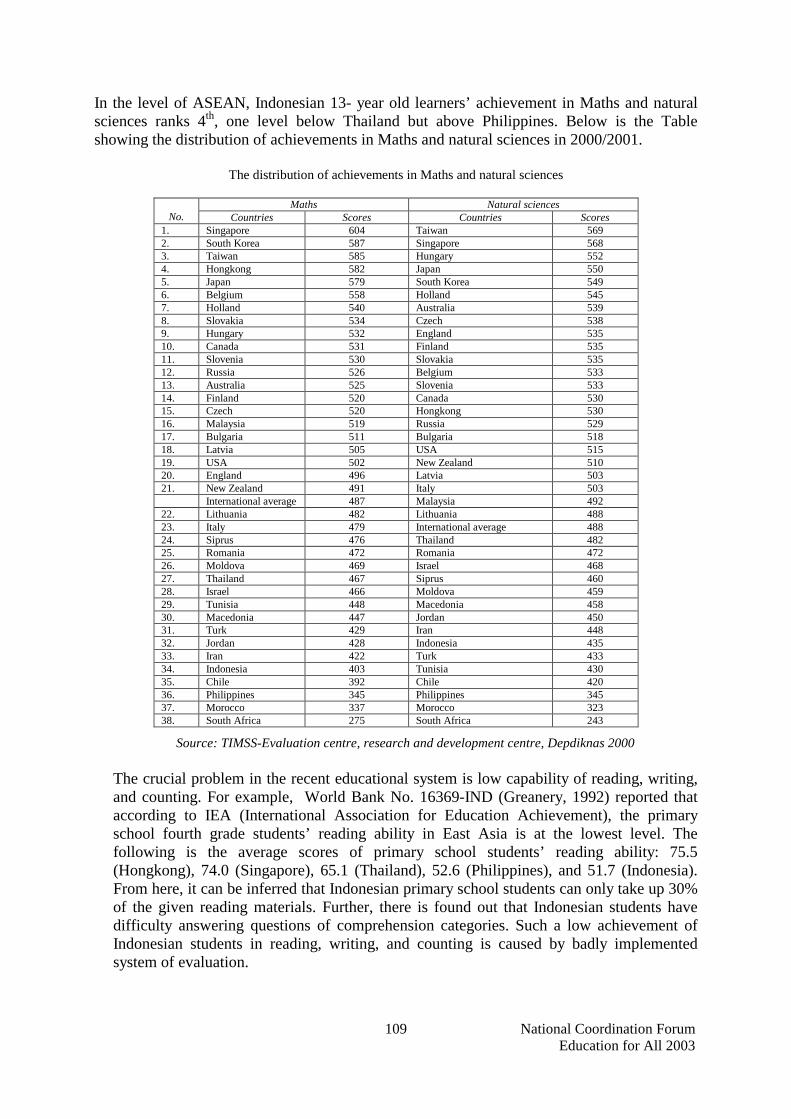
National Coordination Forum Education for All 2003
109
In the level of ASEAN, Indonesian 13- year old learners’ achievement in Maths and natural sciences ranks 4th, one level below Thailand but above Philippines. Below is the Table showing the distribution of achievements in Maths and natural sciences in 2000/2001.
The distribution of achievements in Maths and natural sciences
Maths Natural sciences No. Countries Scores Countries Scores
1. Singapore 604 Taiwan 569 2. South Korea 587 Singapore 568 3. Taiwan 585 Hungary 552 4. Hongkong 582 Japan 550 5. Japan 579 South Korea 549 6. Belgium 558 Holland 545 7. Holland 540 Australia 539 8. Slovakia 534 Czech 538 9. Hungary 532 England 535 10. Canada 531 Finland 535 11. Slovenia 530 Slovakia 535 12. Russia 526 Belgium 533 13. Australia 525 Slovenia 533 14. Finland 520 Canada 530 15. Czech 520 Hongkong 530 16. Malaysia 519 Russia 529 17. Bulgaria 511 Bulgaria 518 18. Latvia 505 USA 515 19. USA 502 New Zealand 510 20. England 496 Latvia 503 21. New Zealand 491 Italy 503 International average 487 Malaysia 492 22. Lithuania 482 Lithuania 488 23. Italy 479 International average 488 24. Siprus 476 Thailand 482 25. Romania 472 Romania 472 26. Moldova 469 Israel 468 27. Thailand 467 Siprus 460 28. Israel 466 Moldova 459 29. Tunisia 448 Macedonia 458 30. Macedonia 447 Jordan 450 31. Turk 429 Iran 448 32. Jordan 428 Indonesia 435 33. Iran 422 Turk 433 34. Indonesia 403 Tunisia 430 35. Chile 392 Chile 420 36. Philippines 345 Philippines 345 37. Morocco 337 Morocco 323 38. South Africa 275 South Africa 243
Source: TIMSS-Evaluation centre, research and development centre, Depdiknas 2000
The crucial problem in the recent educational system is low capability of reading, writing, and counting. For example, World Bank No. 16369-IND (Greanery, 1992) reported that according to IEA (International Association for Education Achievement), the primary school fourth grade students’ reading ability in East Asia is at the lowest level. The following is the average scores of primary school students’ reading ability: 75.5 (Hongkong), 74.0 (Singapore), 65.1 (Thailand), 52.6 (Philippines), and 51.7 (Indonesia). From here, it can be inferred that Indonesian primary school students can only take up 30% of the given reading materials. Further, there is found out that Indonesian students have difficulty answering questions of comprehension categories. Such a low achievement of Indonesian students in reading, writing, and counting is caused by badly implemented system of evaluation.
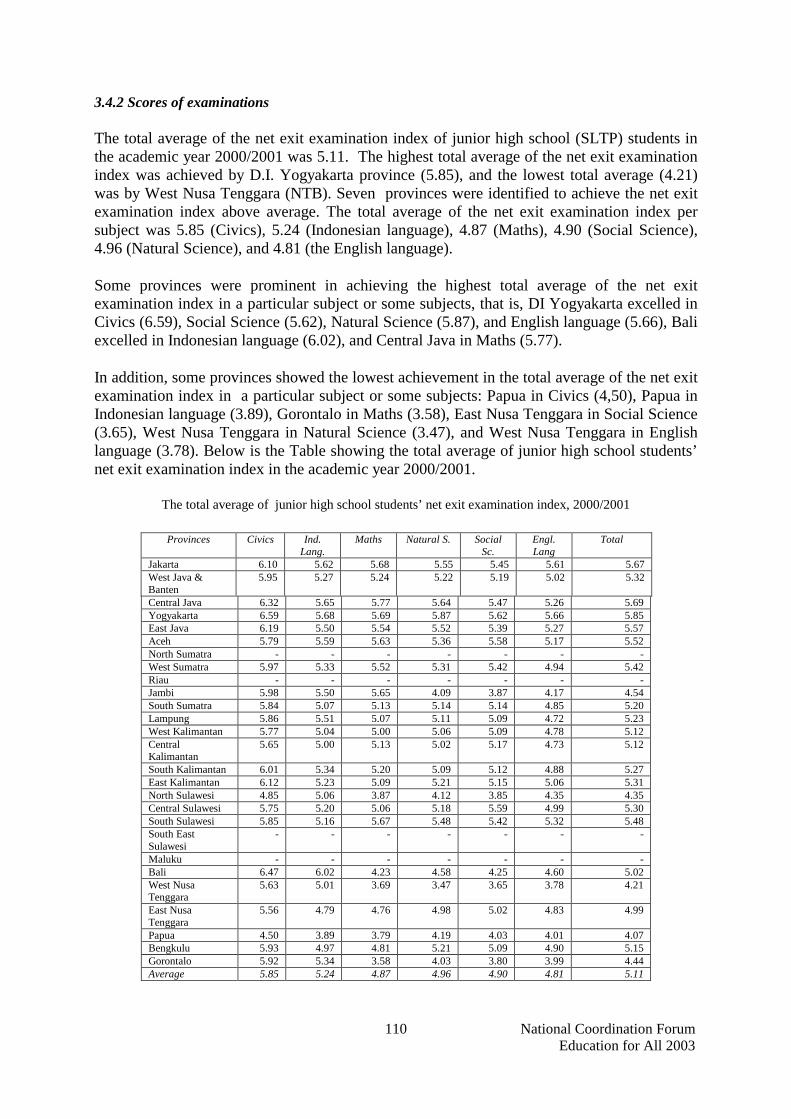
National Coordination Forum Education for All 2003
110
3.4.2 Scores of examinations
The total average of the net exit examination index of junior high school (SLTP) students in the academic year 2000/2001 was 5.11. The highest total average of the net exit examination index was achieved by D.I. Yogyakarta province (5.85), and the lowest total average (4.21) was by West Nusa Tenggara (NTB). Seven provinces were identified to achieve the net exit examination index above average. The total average of the net exit examination index per subject was 5.85 (Civics), 5.24 (Indonesian language), 4.87 (Maths), 4.90 (Social Science), 4.96 (Natural Science), and 4.81 (the English language).
Some provinces were prominent in achieving the highest total average of the net exit examination index in a particular subject or some subjects, that is, DI Yogyakarta excelled in Civics (6.59), Social Science (5.62), Natural Science (5.87), and English language (5.66), Bali excelled in Indonesian language (6.02), and Central Java in Maths (5.77).
In addition, some provinces showed the lowest achievement in the total average of the net exit examination index in a particular subject or some subjects: Papua in Civics (4,50), Papua in Indonesian language (3.89), Gorontalo in Maths (3.58), East Nusa Tenggara in Social Science (3.65), West Nusa Tenggara in Natural Science (3.47), and West Nusa Tenggara in English language (3.78). Below is the Table showing the total average of junior high school students’ net exit examination index in the academic year 2000/2001.
The total average of junior high school students’ net exit examination index, 2000/2001
Central Java 6.32 5.65 5.77 5.64 5.47 5.26 5.69 Yogyakarta 6.59 5.68 5.69 5.87 5.62 5.66 5.85 East Java 6.19 5.50 5.54 5.52 5.39 5.27 5.57 Aceh 5.79 5.59 5.63 5.36 5.58 5.17 5.52 North Sumatra - - - - - - - West Sumatra 5.97 5.33 5.52 5.31 5.42 4.94 5.42 Riau - - - - - - - Jambi 5.98 5.50 5.65 4.09 3.87 4.17 4.54 South Sumatra 5.84 5.07 5.13 5.14 5.14 4.85 5.20 Lampung 5.86 5.51 5.07 5.11 5.09 4.72 5.23 West Kalimantan 5.77 5.04 5.00 5.06 5.09 4.78 5.12 Central Kalimantan
5.65 5.00 5.13 5.02 5.17 4.73 5.12
South Kalimantan 6.01 5.34 5.20 5.09 5.12 4.88 5.27 East Kalimantan 6.12 5.23 5.09 5.21 5.15 5.06 5.31 North Sulawesi 4.85 5.06 3.87 4.12 3.85 4.35 4.35 Central Sulawesi 5.75 5.20 5.06 5.18 5.59 4.99 5.30 South Sulawesi 5.85 5.16 5.67 5.48 5.42 5.32 5.48 South East Sulawesi
- - - - - - -
Maluku - - - - - - - Bali 6.47 6.02 4.23 4.58 4.25 4.60 5.02 West Nusa Tenggara
5.63 5.01 3.69 3.47 3.65 3.78 4.21
East Nusa Tenggara
5.56 4.79 4.76 4.98 5.02 4.83 4.99
Papua 4.50 3.89 3.79 4.19 4.03 4.01 4.07 Bengkulu 5.93 4.97 4.81 5.21 5.09 4.90 5.15 Gorontalo 5.92 5.34 3.58 4.03 3.80 3.99 4.44 Average 5.85 5.24 4.87 4.96 4.90 4.81 5.11
Provinces Civics Ind. Lang.
Maths Natural S. Social Sc.
Engl. Lang
Total
Jakarta 6.10 5.62 5.68 5.55 5.45 5.61 5.67 West Java & Banten
5.95 5.27 5.24 5.22 5.19 5.02 5.32

National Coordination Forum Education for All 2003
111
The total average of the net exit examination index of senior high school (SLTA) students of natural science program in the academic year 2000/2001 was 4,78. The highest total average of the net exit examination index was achieved by West Sumatra province (5,34), and the lowest total average (4,21) was by Papua province. 7 Provinces were identified to achieve the net exit examination index above average. The total average of the net exit examination index per subject was 6,36 (Civics), 5,24 (Indonesian language), 5,39 (English language), 3,45 (Maths), 3,49 (Physics), 4,83 (Biology), and 4,71 (Chemistry).
Some provinces were prominent in achieving the highest total average of the net exit examination index in a particular subject or some subjects: West Sumatra excelled in Civics (6,88), Indonesian language (6,41), and Chemistry (5,15); DKI Jakarta in English language (5,95), Biology (5,25); and Central Sulawesi in Maths (4,48), and Physics (4,11).
In addition, some provinces showed the lowest achievement in the total average of net exit examination index in a particular subject or some subjects: Papua in Civics (4,65), Indonesian language (4,25), English (3,23), Maths (3,23), Physics (2,39), Biology (3,20), and Chemistry (3,13). Below is the Table showing the total average of senior high school students’ (of natural science program) net exit examination index in the academic year 2000/2001.
The total average of senior high school students’ (of natural science program) net exit examination index, 2000/2001
Provinces
Civics Ind. Lang.
English Physics Bio. Chem Maths Total
Central Java 6.86 5.51 5.13 3.92 5.01 4.90 3.75 5.01 Yogyakarta 6.74 5.98 5.54 3.57 4.94 4.95 3.60 5.05 East Java 6.78 5.48 5.58 3.84 5.06 5.08 3.96 5.11 Aceh 6.31 5.47 4.56 3.5 4.94 4.76 3.79 4.76 North Sumatra - - - - - - - - West Sumatra 6.88 6.41 5.72 3.92 5.19 5.15 4.10 5.34 Riau 6.43 5.04 4.74 3.14 4.52 4.25 3.38 4.50 Jambi 5.89 4.53 4.10 2.91 4.08 3.81 2.84 4.02 South Sumatra 6.06 5.07 4.48 3.27 4.36 4.31 3.23 4.40 Lampung 6.18 5.09 4.14 3.71 4.20 3.91 3.74 4.42 West Kalimantan 6.31 5.11 4.25 2.80 4.19 3.81 2.84 4.19 Central Kalimantan 5.70 4.41 3.50 2.51 3.69 3.40 2.43 3.66 South Kalimantan 6.12 5.67 4.26 2.90 4.16 4.00 2.84 4.19 East Kalimantan 6.19 5.39 4.69 3.31 4.36 4.21 3.50 3.66 North Sulawesi 5.92 4.92 4.92 3.11 4.13 4.15 2.94 4.28 Central Sulawesi 6.47 5.82 5.82 4.11 5.15 4.91 4.48 5.10 South Sulawesi 6.10 4.81 4.81 3.71 4.84 4.81 3.86 4.72 South East Sulawesi 5.90 4.85 4.85 3.90 4.66 4.96 3.63 4.65 Maluku - - - - - - - - Bali 6.45 5.85 5.41 3.96 5.16 4.84 4.11 5.11 West Nusa Tenggara 5.44 4.57 3.48 2.65 3.76 3.41 266 3.71 East Nusa Tenggara 5.69 4.70 3.42 2.49 3.58 3.27 2.36 3.64 Papua 4.65 4.25 3.23 2.39 3.2 3.13 2.19 3.23 Bengkulu 5.80 5.32 3.73 2.64 3.78 3.64 2.60 3.93 North Maluku - - - - - - - - Gorontalo 5.94 5.05 4.82 3.19 4.40 4.38 2.91 4.38
Average 6.36 5.24 5.39 3.49 4.83 4.71 3.45 4.78
Jakarta 6.78 5.42 5.95 3.79 5.25 5.03 3.98 5.17 West Java & Banten 6.46 5.27 4.77 3.33 4.42 4.30 4.19 4.53

National Coordination Forum Education for All 2003
112
The total average of the net exit examination index of senior high school students (of social science program) in the academic year 2000/2001 was 4.49. The highest total average of the net exit examination index was achieved by DKI Jakarta province (5.16), and the lowest total average (3.57) was by West Nusa Tenggara. Seven provinces were identified to achieve the net exit examination index above average. The total average of the net exit examination index per subject was 5.58 (Civics), 4.95 (Indonesian language), 4.00 (the English language), 4.16 (Economics), 4.29 (Sociology), and 4.38 (State Administration).
Some provinces were prominent in achieving the highest total average of net exit examination index in a particular subject or some subjects: DKI Jakarta excelled in Civics (6.43), Economics (4.55), and the English language (4.99); Central Sulawesi in Indonesian language (6.12), West Java and Banten in Sociology (5.11), and West Sumatra in state administration (5.12).
In addition, some provinces showed the lowest achievement in the total average of net exit examination index in a particular subject or some subjects: Papua in Civics (4.52); West Nusa Tenggara in Indonesian language (3.74), English language (2.46), Sociology (3.45), State Administration (3.68); and DI Yogyakarta in Economics (2.26). Presented below is the table showing the total average of senior high school students’ (of social science program) net exit examination index in the academic year 2000/2001.
The total average of senior high school students’ (of social science program) net exit examination index, 2000/2001
Provinces Civics Ind. Lang. English Eco. Sos. State
adm. Total
Jakarta 6.43 4.93 4.99 4.55 5.06 5.00 5.16 West Java & Banten 5.97 4.63 3.78 4.41 5.11 4.49 4.73 Central Java 6.33 4.86 3.96 4.27 4.83 5.08 4.89 Yogyakarta 6.12 5.21 4.03 2.26 4.65 4.90 4.86 East Java 6.21 4.82 4.22 4.35 4.86 4.98 4.90 Aceh 5.08 4.75 3.55 3.82 4.41 4.27 4.31 North Sumatra - - - - - - - West Sumatra 6.10 5.58 4.03 4.03 4.68 5.12 5.02 Riau 5.71 5.23 3.31 3.57 4.30 4.31 4.24 Jambi 5.25 3.86 3.12 3.36 3.80 3.82 3.87 South Sumatra 5.51 4.36 3.39 3.73 4.15 4.34 4.25 Lampung 5.61 4.42 3.15 3.49 4.12 4.28 4.18 West Kalimantan 5.60 4.30 3.08 3.35 4.06 4.24 4.11 Central Kalimantan 5.13 3.79 2.75 2.93 3.86 3.63 3.86 South Kalimantan 5.53 4.98 3.15 3.56 4.23 4.36 4.30 East Kalimantan 5.52 4.63 3.55 3.63 3.99 4.21 4.26 North Sulawesi 5.20 4.16 3.54 3.45 3.56 4.12 4.01 Central Sulawesi 5.51 6.12 4.82 4.49 4.70 4.81 5.08 South Sulawesi 5.56 4.28 3.94 4.22 4.04 4.55 4.43 South East Sulawesi 5.20 4.04 3.57 3.87 3.69 4.28 4.11 Maluku - - - - - - - Bali 5.50 4.86 3.62 3.91 4.16 4.60 4.44 West Nusa Tenggara 4.74 3.74 2.64 3.08 3.53 3.68 3.57 East Nusa Tenggara 5.00 4.02 2.68 3.13 3.45 3.85 3.69 Papua 4.52 3.84 2.75 2.94 3.75 3.99 3.63 Bengkulu 5.28 4.66 2.85 3.35 4.00 4.23 4.06 North Maluku - - - - - - - Gorontalo 4.72 4.18 3.01 3.76 3.51 3.76 3.82 Average 5.58 4.95 4.00 4.16 4.29 4.38 4.49

National Coordination Forum Education for All 2003
113
The total average of the net exit examination index of senior high school students (of language program) in the academic year 2000/2001 was 4.75. The highest total average of net exit examination index was achieved by D.I. Yogyakarta (5,85), and the lowest total average (3.99) was by West Nusa Tenggara. Eleven provinces were identified to achieve the net exit examination index above average. The total average of the net exit examination index per subject was 5.79 (Civics), 4.69 (Indonesian language), 4.64 (English language), 4.36 (Indonesian Literature), 4.98 (Foreign Languages), and 4.04 (Culture and History).
Some provinces were prominent in achieving the highest total average of the net exit examination index in a particular subject or some subjects: D.I. Yogyakarta excelled in Civics (6.58), Indonesian Language (6.14), English language (6.09), and Culture and History (5.12); Central Sulawesi in Indonesian Literature (5.42); and East Java and South Sumatra in Foreign Languages (6.25).
In addition, some provinces showed the lowest achievement in the total average of net exit examination index in a particular subject or some subjects: Gorontalo in Civics (5.09); Papua in Indonesian language (3.83), English language (3.16), Indonesian Literature (3.79), Foreign Languages (3.50); and Aceh in Culture and History (3.38). Below is the Table showing the total average of senior high school students’ (of language program) net exit examination index in the academic year 2000/2001.
The total average of senior high school students’ (of language program) net exit examination index, 2000/2001
Provinces Civics Ind.
Lang. English Ind.. Lit. For. Lang.
Culture Hist.. Total
Jakarta 6.49 5.40 5.709 4.70 5.56 4.51 5.39 West Java & Banten 6.21 5.25 5.16 4.72 5.06 4.55 5.16 Central Java 6.56 5.74 5.47 5.01 6.03 4.92 5.62 Yogyakarta 6.58 6.14 6.09 5.14 6.04 5.12 5.85 East Java 6.55 5.69 5.62 4.86 6.25 4.79 5.63 Aceh 5.33 4.41 3.97 4.52 4.00 3.38 4.27 North Sumatra - - - - - - - West Sumatra 6.11 5.53 4.6 5.13 5.16 4.9 5.24 Riau 6.08 4.97 4.21 4.47 4.95 4.17 4.81 Jambi 5.39 4.69 4.19 4.35 4.09 3.54 4.38 South Sumatra 6.47 4.73 5.57 4.73 6.25 4.84 5.43 Lampung 6.44 5.38 4.2 4.61 4.91 4.36 4.98 West Kalimantan 6.03 4.86 3.9 4.41 3.89 4.22 4.55 Central Kalimantan 5.62 4.54 3.44 3.93 3.85 3.50 4.15 South Kalimantan 5.77 4.95 4.01 4.68 4.51 4.32 4.71 East Kalimantan 5.99 5.02 4.51 4.52 4.35 3.92 4.72 North Sulawesi 5.29 4.40 4.18 4.01 4.89 3.76 4.42 Central Sulawesi 5.8 4.67 4.50 5.42 4.93 5.08 5.07 South Sulawesi 5.77 4.82 4.71 4.20 5.03 4.06 4.77 South East Sulawesi 5.38 4.83 4.41 4.33 5.43 4.53 4.82 Maluku - - - - - - - Bali 5.73 5.23 4.46 5.32 5.03 4.84 5.10 West Nusa Tenggara 5.13 4.13 3.27 3.91 3.82 3.67 3.99 East Nusa Tenggara 5.43 4.52 3.44 3.97 3.76 3.7 4.14 Papua 5.37 3.83 3.16 3.79 3.5 4.56 4.04 Bengkulu 5.44 4.67 3.58 4.50 4.17 4.75 4.52 North Maluku - - - - - - - Gorontalo 5.09 3.98 3.57 4.02 4.39 3.57 4.10 Average 5.79 4.69 4.64 4.36 4.98 4.04 4.75 The highest 6.49 5.40 5.70 4.70 5.56 4.51 5.39 The lowestr 5.09 3.98 3.57 4.02 4.39 3.57 4.10

National Coordination Forum Education for All 2003
114
3.4.3 Classification of schools based on academic achievements
Based on academic achievements, schools are classified with reference to the criteria below:
Classification Net exit examination index Code Predicates
N > 7.50 A Very satisfactory 6,50 < N ≤ 7,50 B Satisfactory 5,50 < N ≤ 6,50 C Adequate 4,50 < N ≤ 5,50 D Inadequate N ≤ 4,50 E Very inadequate
Based on 2000/2001 net exit examination index, Public and private junior high schools (SLTP) were mostly (84.40%) categorised as “inadequate and very inadequate”, while the rest of the schools (15.60%) were categorized as “adequate and satisfactory”. Below is the Figure showing the classification of public and private junior high schools based on the net exit examination index in 2000/2001.
Figure 1
As seen from the Figure above, in 2000/2001, most of public junior high schools (78.94) were classified as “inadequate and very inadequate”, while 21.06% of public junior high schools was classified as “adequate”. Below is the Figure showing the classification of public junior high schools based on the net exit examination index in 2000/2001.
Figure 2
Similarly, most of private junior high schools (90.20%) were classified as “inadequate and very inadequate”, while only 9.70% of the total private junior high schools was classified as
National Coordination Forum Education for All 2003
115
“satisfactory and adequate”. Below is the Figure showing the classification of private junior high schools based on the net exit examination index in 2000/20001.
Figure 3
Public and private senior high schools (SLTA), based on the 2000/2001 net exit examination index, were mostly (88.95%) classified as “inadequate and very inadequate”, while 10.97% of the total senior high schools was classified as “adequate and satisfactory”, and only 0.08% was classified as very satisfactory.
Presented below is the figure showing the classification of senior high schools (of natural science program) based on the 2000/2001 net exit examination index.
Figure 4
Similarly, private senior high schools (of social science program), based on the 2000/2001 net exit examination index, were mostly (89.54%) categorised as “inadequate and very inadequate”, while 10. 46% of the private senior high schools was considered “satisfactory and adequate”. None of the schools was categorized as “very satisfactory”.
Below is the Figure showing the classification of public and private senior high schools (of social science program) based on the 2000/2001 net exit examination index.

National Coordination Forum Education for All 2003
116
Figure 5
Based on the 2000/2001 net exit examination index public and private senior high schools (of language program) were mostly (74.67%) classified as inadequate and very inadequate, while 25.33% of the senior high schools was classified as adequate and satisfactory, and none of the schools was considered very satisfactory. Below is the Figure showing the classification of public and private senior high schools (of language program) based on the 2000/2001 net exit examination index.
Figure 6
4. Discrepancy with Dakar’s input
4.1 Quality of input
Apart from the identified factors that shape the quality of input, textbooks/compulsory school textbooks are considered the strategically effectual factors. Textbooks, as identified previously), seem inadequate in terms of numbers and distribution. In addition, the content of textbooks is still questionable in terms of its quality. More are about the availability of teachers, the relevance between teachers’ expertise and their teaching specialization, and teachers’ general ability, which are still problematic.
4.2 Quality of output
Although net exit examination index is not the only criteria to measure the quality of output, the description above shows that the mastery of learning materials is very unsatisfactory.

National Coordination Forum Education for All 2003
117
Besides, most schools’ academic achievements are classified inadequate or even very inadequate.
4.3 Quality of outcome
Based on the analysis above, there is no indication that educational processes that prepare students for their further studies have been successful as there are no particular criteria as the requirements to earn certifications. Further more, there is no enough data to claim that school graduates possess competitive ability in job market.
5. Action plan
National action plan, therefore, is imperative to improve the quality of education. Accordingly, president of Indonesia, on May 2, 2002 (National Education Day), campaigned for a national movement toward the improvement of educational quality. This becomes a momentum and an impetus to systematically start making any real efforts to improve the quality of education. These efforts should include the following aspects: 1) the quality control standard for educational quality; 2) the empowerment of institutional capacities; 3) the improvement of the quality of educational implementation; and 4) the promotion of stakeholders’ awareness about and commitment to improving the quality of education.
5.1 The standard and quality control
The establishment of standard and quality control is achieved by way of the following initiatives:
• Establishing and using the standard of graduate abilities in any types and levels of education and constructing curriculum based on the established standard.
• Applying a system of final examination as a quality control device. • Constructing a minimum feasibility standard for schools, society learning center, and
other educational institutions. • Establishing and applying a minimum competence standard for teachers. • Applying quality assurance system and school accreditation. • Providing assessment for reading, writing and arithmetic in primary education • Monitoring the quality of education by way of survey and study, especially in reading
literacy, numerical literacy, and scientific literacy.
5.2 Empowering and improving institutional capacity building
• Doing a data survey to determine the minimal requirements of schools and non-formal education center.
• Renovating and improving school facilities to accord to the minimum standard of requirements.
• Increasing the number and improving the quality of teachers to accord to the minimum competence standard.
• Increasing the number of school textbooks to provide access to a greater number of students.

National Coordination Forum Education for All 2003
118
• Increasing schools’ operational budget to accord to a minimum standard of budgeting.
5.3 Improving the quality of educational processes by way of the following efforts:
• Implementing school based management. • Improving the quality of learning processes by intensifying effectiveness of learning
hours. • Monitoring the process of education, which focuses on the monitoring of quality and
learning outcomes.
5.4 Promoting stakeholders’ awareness about and commitment to improving the quality of education through the following programs:
• Encouraging governments, legislative institution, and society at large to make a policy, which is concerned about access expansion to and quality improvement of education.
• Campaigning for a movement toward the improvement of educational quality through a variety of forum and media.