indoor air quality control for improving passenger health...
TRANSCRIPT
lable at ScienceDirect
Building and Environment 92 (2015) 407e417
Contents lists avai
Building and Environment
journal homepage: www.elsevier .com/locate/bui ldenv
Indoor air quality control for improving passenger health in subwayplatforms using an outdoor air quality dependent ventilation system
MinJeong Kim a, b, Richard D. Braatz a, Jeong Tai Kim c, ChangKyoo Yoo b, *
a Department of Chemical Engineering, Massachusetts Institute of Technology, Cambridge, MA 02139, USAb Department of Environmental Science and Engineering, Center for Environmental Studies, Kyung Hee University, Yongin 446-701, South Koreac Department of Architectural Engineering, Center for Sustainable Healthy Buildings, Kyung Hee University, Yongin 446-701, South Korea
a r t i c l e i n f o
Article history:Received 24 February 2015Received in revised form20 April 2015Accepted 5 May 2015Available online 19 May 2015
Keywords:Ventilation control systemIndoor air qualityIndoor air pollution controlOutdoor air qualityPassenger health promotionVentilation energy
* Corresponding author. Tel.: þ82 31 201 3824; faxE-mail address: [email protected] (C. Yoo).
http://dx.doi.org/10.1016/j.buildenv.2015.05.0100360-1323/© 2015 Elsevier Ltd. All rights reserved.
a b s t r a c t
Indoor air quality (IAQ) ventilation systems are widely used to control air pollutants in subway platforms.When outdoor air is heavily contaminated by particulate matters (PMs), it enters the subway platformthrough the ventilation system, resulting in the deterioration of platform IAQ and adverse effects onpassenger health. In this study, a new IAQ ventilation system that takes into account the outdoor airquality used for ventilating platform is proposed to control the platform PM10 concentration. For this, theamount of PM10 that flows from the outdoors into the subway platform is considered a manipulatedvariable of the proposed ventilation system. The influence of the platform PM10 on passengers' healthrisk is evaluated using a comprehensive indoor air-quality index (CIAI). The CIAI level of platform PM10 iscompared using the manual and proposed ventilation systems, where the manual system operates atfixed ventilation inverter frequency without regard to the outdoor air quality. Experimental results froman underground subway platform showed that the proposed ventilation system can improve the plat-form PM10 level, leading to the passengers’ exposure to the reduced PM10 concentration (i.e., health riskreduction), and reduce the ventilation energy compared to the manual system by adjusting the venti-lation inverter frequency and inflow of outdoor PM10 into the subway platform depending on the out-door air quality.
© 2015 Elsevier Ltd. All rights reserved.
1. Introduction
Millions of people in metropolitan areas depend on the con-venience of subway systems for transportation, which have beendescribed as the “lifeline of urban development” by reducingtraffic congestion above ground and providing environment-friendly transit [1e3]. Notwithstanding these advantages, therehas been a growing concern over indoor air quality (IAQ) in sub-way systems, since people spend a considerable amount of time inthe subway systems daily [4,5]. Most subway systems are under-ground in a confined space where air pollutants are generatedinternally as well as enter from the outside atmosphere.Furthermore, due to heavy use and overcrowding, various types ofhazardous pollutants which present a health risk to passengersand subway working staff are accumulated in subway systems[3,6]. Therefore, to ensure passengers and subway workers good
: þ82 31 202 8854.
health, ventilation systems are necessary for controlling hazard-ous air pollutants in the subway systems.
Recently, several studies on ventilation of indoor air pollutantsin different building spaces have been reported [7e12]. Chao andHu [8] have established a dual-mode demand control ventilationstrategy that maintains the occupant-related and non-occupant-related indoor air pollutants at acceptable levels. Kolokotsa et al.[9] have proposed a bilinear model-based ventilation system toachieve the optimum indoor environmental conditions whileminimizing energy cost. Liu et al. [10] have developed a modelpredictive control (MPC) based ventilation system in the subwaystation. They also have applied a multi-objective optimization al-gorithm to determine optimal set-points of the ventilation systemwhich concurrently improve the IAQ and ventilation energy effi-ciency. Lim et al. [12] have proposed a new ventilation index, NetEscape Velocity (NEV), which directly provides information inbehavior of the contaminants to the ventilation system. These re-searchers have assumed that the polluted indoor air is replacedwith clean outdoor air by increasing the ventilation rate. In fact, ifthe outdoor air is strongly contaminated due to aeolian

M. Kim et al. / Building and Environment 92 (2015) 407e417408
transportation of dust particles or yellow dust, its entry into thebuilding spaces through the ventilation systems increases the airpollutants inside the building spaces [13,14]. This article proposes anew approach that considers the outdoor air quality used fordiluting indoor air pollutants. The development of ventilationcontrol system, which takes the changes of outdoor air quality intoaccount, is the central theme of the present study.
The ventilation under contaminated outdoor air conditions canincrease the potential that the passengers in the subway systemswillbe exposed to health risk. Suppose the concentration of particulatematters (PMs) in the outdoor air is higher than usual (for example onmegacities where the PMs concentration is far above the recom-mendations due to yellow dust etc., see Refs. [15,16]). If the venti-lation system is operated with the identical ventilation rate to theusual, then a larger amount of PMs enters the subway systemthrough the ventilation under such contaminated outdoor air con-ditions [14,17]. The PMs with aerodynamic diameters less than10 mm (PM10) and 2.5 mm (PM2.5) deposit to trachea-bronchialcompartment of the human respiratory system, and then, causerespiratory illnesses such as bronchial asthma, rhinitis and chronicbronchitis [18,19]. As such, the ventilation with contaminated out-door air has a large influence on the passengers' health risk. There-fore, to protect the passengers' health inside the subway systems, itis necessary to evaluate the influence of IAQ that is ventilated withthe contaminated outdoor air. Another theme of this study is theevaluation of the influence of the ventilated IAQ on the passengers’health risk depending on the consideration of outdoor air quality.
In the first part of this study, the ventilation control system isdeveloped to keep the PM10 concentration in the subway system ata comfortable and healthy range. To take the changes of outdoor airquality into account, the amount of PM10 that is introduced fromthe outdoors to the subway system is used for developing theventilation control system. Feedback and feed-forward ventilationcontrol strategies are proposed to compensate for dynamic varia-tions of the PM10 concentration in the subway systems and effectsof disturbances on the subway system's PM10 concentration,respectively (for background on feedback and feed-forward control,see Bequette [20] and Seborg et al. [21]).
This article uses a comprehensive indoor air-quality index (CIAI)to evaluate the influence of the ventilated IAQ on the passengers'health risk inside the subway system. The CIAI describes ambientair quality based on the health risk of the air pollutants [18]. Thevariations of PM10 level in the subway system are evaluated usingthe ventilation control system with and without the considerationof outdoor air quality, respectively. Then, the influence of PM10 levelon the passengers’ health risk is investigated using the CIAI. Thesemethods are applied to an underground subway station at SeoulMetro, South Korea.
Table 1Comprehensive indoor air quality index (CIAI) suggested by the U.S. Environmental Prot
Level of health concern Good Moderate Unhealthsensitive
CIAI 0-50 51-100 101-150
ILO 0 51 101
IHI 50 100 150
Conc. level BPLO BPHI BPLO BPHI BPLONO2 (ppm) 0 0.03 0.031 0.05 0.051CO (ppm) 0 5 5.01 10 10.01CO2 (ppm) 0 500 501 1000 1001PM10 (ppm) 0 50 51 150 151PM2.5 (ppm) 0 15 16 40 41
Note: ILO is the index breakpoint corresponding to BPLO, IHI is the index breakpoint correslevel.
2. Comprehensive indoor air-quality index (CIAI)
A comprehensive indoor air-quality index (CIAI), of which theaim is to help the public understand the condition of current indoorair and the associated health effects, determines the health risk ofindoor air pollutants using six levels of concern (good, moderate,unhealthy for sensitive groups, unhealthy, very unhealthy, andhazardous) [18,22]. The CIAI value of each indoor air pollutant isrepresented as:
CIAI ¼ IHI � ILOBPHI � BPLO
ðCP � BPLOÞ þ ILO (1)
where CP is the current concentration of air pollutants (mg/m3);BPLO and BPHI are the concentration breakpoints of each healthconcern level (mg/m3); and ILO and IHI are the index breakpoints ofeach health concern level [18]. Specifications of the CIAI are shownin Table 1.
3. Description of the IAQ ventilation control system
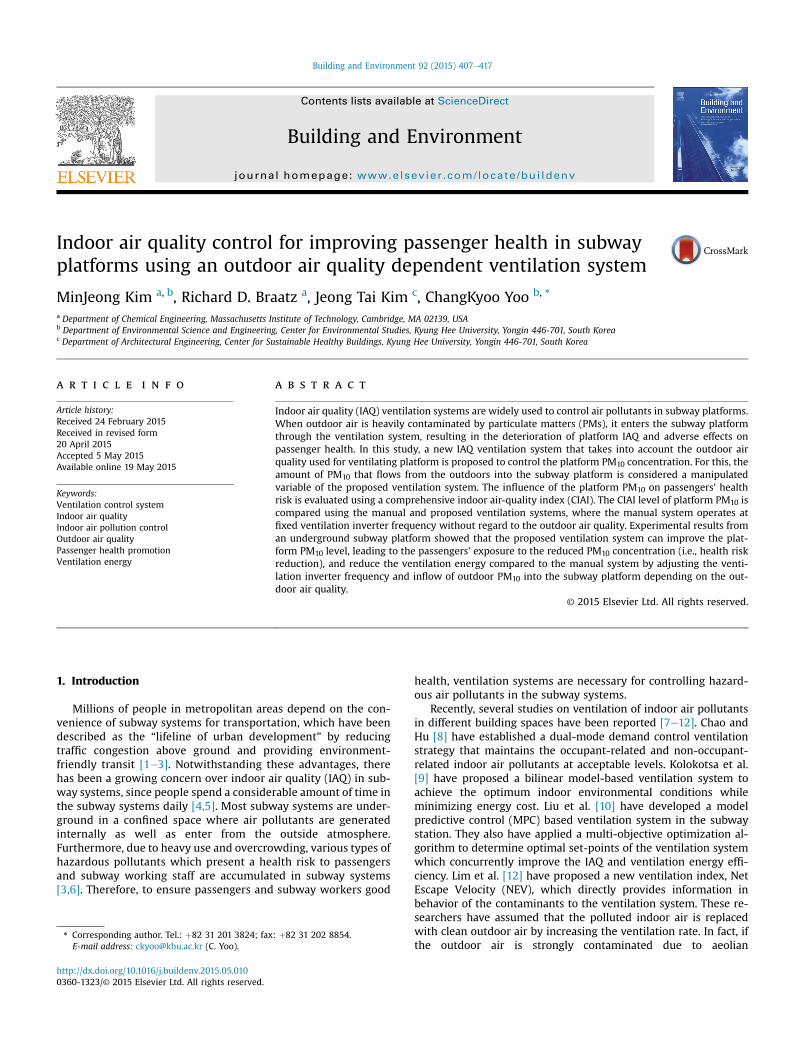
Fig. 1 shows a schematic diagram of the IAQ ventilation controlsystem in a subway platform. The ventilation control system gen-erates control signals to ventilation inverter frequency to controlthe air pollutants inside the platform, where the inverter is anelectronic device that regulates revolution speed of ventilation fanmotor. Then, depending on the controlled inverter frequency, out-door air with the massive PMs filtered out is distributed to theplatform to dilute the polluted indoor air [23].
In this study, a controlled variable taken for the ventilationcontrol system is the PM10 concentration at the subway platform. Amanipulated variable is the amount of PM10 (mg/h) introducedfrom the outdoors to the platform through the ventilation system,which is calculated as:
PM10 amount¼�Q
HzHzmax
�nð1�aÞPM10 conc: inoutdoorair=10
3
(2)
where Q is the air volume of the ventilation system (m3outdoor air/h);
Hz is the inverter frequency of the ventilation system; Hzmax is themaximum inverter frequency of the ventilation system; n is thenumber of ventilation systems installed in the subway platform; ais an average filter efficiency; and PM10 conc. in outdoor air is theoutdoors PM10 concentration (mg/m3). In Eq. (2), the filter efficiencya dependent on the filters' efficiencies could be an important factor,since it affects both of the IAQ and filtration cost in the subwayplatform. Table 2 compares the filtration cost of PM10 filters with
ection Agency.
y forgroups
Unhealthy Very unhealthy Hazardous
151-250 251-350 351-500
151 251 351
250 350 500
BPHI BPLO BPHI BPLO BPHI BPLO BPHI0.15 0.151 0.25 0.251 0.5 0.501 220 20.01 30 30.01 40 40.01 501500 1501 2000 2001 3000 3001 5000250 251 350 351 450 451 600140 141 250 251 350 351 500
ponding to BPLO, and BPLO and BPHI are the concentration breakpoints of each health
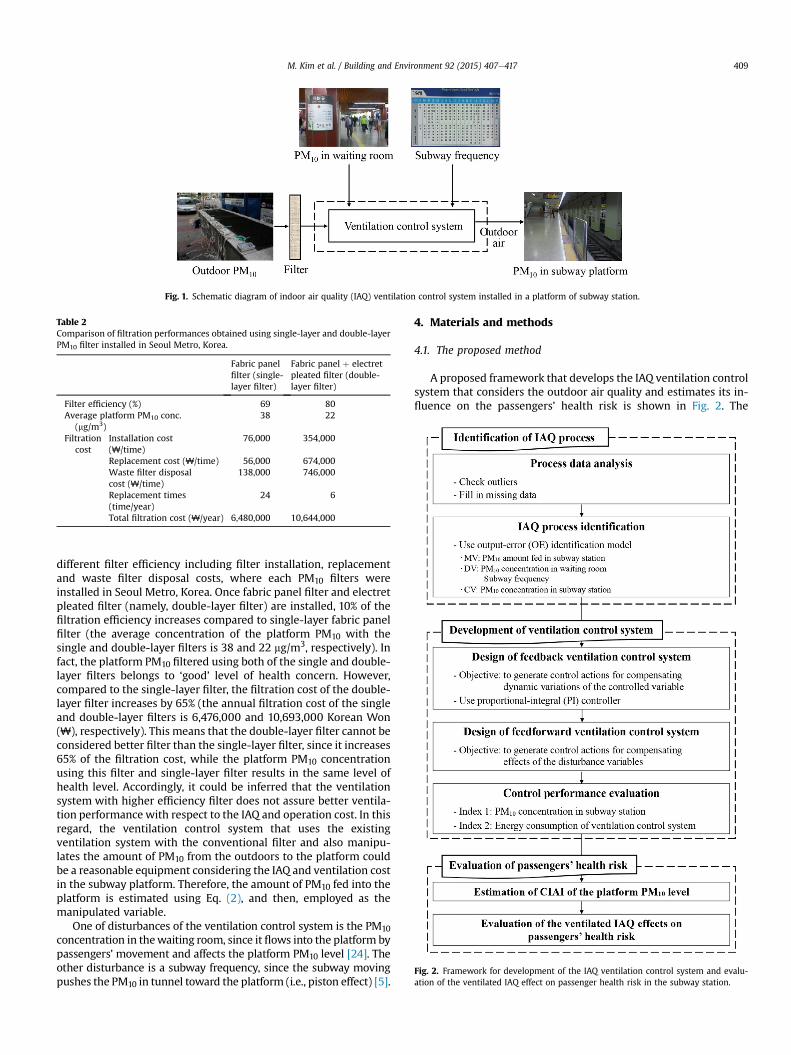
Fig. 1. Schematic diagram of indoor air quality (IAQ) ventilation control system installed in a platform of subway station.
Table 2Comparison of filtration performances obtained using single-layer and double-layerPM10 filter installed in Seoul Metro, Korea.
Fabric panelfilter (single-layer filter)
Fabric panel þ electretpleated filter (double-layer filter)
Filter efficiency (%) 69 80Average platform PM10 conc.
(mg/m3)38 22
Filtrationcost
Installation cost(₩/time)
76,000 354,000
Replacement cost (₩/time) 56,000 674,000Waste filter disposalcost (₩/time)
138,000 746,000
Replacement times(time/year)
24 6
Total filtration cost (₩/year) 6,480,000 10,644,000
Fig. 2. Framework for development of the IAQ ventilation control system and evalu-ation of the ventilated IAQ effect on passenger health risk in the subway station.
M. Kim et al. / Building and Environment 92 (2015) 407e417 409
different filter efficiency including filter installation, replacementand waste filter disposal costs, where each PM10 filters wereinstalled in Seoul Metro, Korea. Once fabric panel filter and electretpleated filter (namely, double-layer filter) are installed, 10% of thefiltration efficiency increases compared to single-layer fabric panelfilter (the average concentration of the platform PM10 with thesingle and double-layer filters is 38 and 22 mg/m3, respectively). Infact, the platform PM10 filtered using both of the single and double-layer filters belongs to ‘good’ level of health concern. However,compared to the single-layer filter, the filtration cost of the double-layer filter increases by 65% (the annual filtration cost of the singleand double-layer filters is 6,476,000 and 10,693,000 Korean Won(₩), respectively). This means that the double-layer filter cannot beconsidered better filter than the single-layer filter, since it increases65% of the filtration cost, while the platform PM10 concentrationusing this filter and single-layer filter results in the same level ofhealth level. Accordingly, it could be inferred that the ventilationsystem with higher efficiency filter does not assure better ventila-tion performance with respect to the IAQ and operation cost. In thisregard, the ventilation control system that uses the existingventilation system with the conventional filter and also manipu-lates the amount of PM10 from the outdoors to the platform couldbe a reasonable equipment considering the IAQ and ventilation costin the subway platform. Therefore, the amount of PM10 fed into theplatform is estimated using Eq. (2), and then, employed as themanipulated variable.
One of disturbances of the ventilation control system is the PM10concentration in thewaiting room, since it flows into the platform bypassengers’ movement and affects the platform PM10 level [24]. Theother disturbance is a subway frequency, since the subway movingpushes the PM10 in tunnel toward the platform (i.e., piston effect) [5].
4. Materials and methods
4.1. The proposed method
A proposed framework that develops the IAQ ventilation controlsystem that considers the outdoor air quality and estimates its in-fluence on the passengers’ health risk is shown in Fig. 2. The
M. Kim et al. / Building and Environment 92 (2015) 407e417410
implementation of the proposedmethod consists of three parts: (1)identification of the IAQ process in the subway platform, (2)development of the IAQ ventilation control system, and (3) evalu-ation of the effects of the ventilated IAQ on passenger health risk.
4.1.1. Identification of the IAQ process in the subway platformTo control the PM10 concentration inside the subway platform,
an identification of dynamics of the platform PM10 concentrationplays an important role. Therefore, a development of the dynamicmodels that describe the variations in platform PM10 concentration(i.e., process identification) is carried out first. Due to the highcomplexity required to model the dynamics of PMs in a subwayplatform using first-principles, this study uses the prediction-errorminimization (PEM) method that derives empirical dynamicmodels from experimental data [21,25].
A first-order plus time-delay (FOPTD) process model identifiedusing the PEM method is represented as:
GðsÞ ¼ yðsÞuðsÞ ¼
K1þ ts
expð � qsÞ (3)
where u is the input variable; y is the output variable; K is theprocess gain; t is the time constant; and q is the time delay [21]. It iswell known that the PM10 concentration at the subway platform isaffected by the subway frequency and PM10 concentrations in theoutdoor air and waiting room [5,24]. Therefore, the input variablestaken for the PM10 process identification are the subway frequency,the PM10 amount introduced from the outdoors to the subwayplatform (calculated using Eq. (2)), and the waiting room PM10concentration. Then, using each input variable, three FOPTD pro-cess models that capture the dynamics of the platform PM10 con-centration are identified.
4.1.2. Development of the IAQ ventilation control systemTo keep the PM10 concentration inside the subway platform at a
comfortable and healthy range, the IAQ ventilation control systemconsisting of feedback and feed-forward control strategies isdeveloped. The feedback control generates a control action whenthe controlled variable deviates from a set point [20,21]. To reduce adifference between the set point and the measured platform PM10value (i.e., control error), the feedback based ventilation controlsystem is designed first. The manipulated and controlled variablesof the feedback control system are the PM10 amount introducedfrom the outdoors to the subway platform and platform PM10concentration, respectively. In this study, a proportional-integral(PI) controller is used, which generates the control action as be-ing proportional to a weighted sum of the control error and itsintegral. The transfer function of the PI controller is
GFBðsÞ ¼uðsÞeðsÞ ¼ kc
�1þ 1
tis
�(4)
where GFB(s) is the PI controller transfer function; u(s) is the controlaction; e(s) is the control error; kc is the proportional controlparameter; and ti is the integral control parameter [21]. To tune thecontrol parameters, an integral of the time-weighted absolute error(ITAE) tuning rule is applied:
kc ¼ 0:859K
ðq=tÞ�0:977
ti ¼t
0:674ðq=tÞ�0:680
(5)
where K, t, and q are the process gain, time constant, and time delayof the process model obtained using the manipulated variable
during the identification period [21]. The identification period isnothing but the term of dataset used for identifying the system.
The feed-forward based ventilation control system is designedfor rejecting the effects of the disturbances (subway frequency andwaiting room PM10 concentration) on the platform PM10 concen-tration. The feed-forward control system makes control movesbefore the disturbances upset the process, and is designed by
GFFðsÞ ¼uðsÞdðsÞ ¼ �GdðsÞ
GpðsÞ (6)
where GFF(s) is the feed-forward controller transfer function; u(s) isthe control action; d(s) is the disturbance signal; and Gp(s) and Gd(s)are the process models for the manipulated and disturbance vari-ables, respectively [20].
Performances of the IAQ ventilation control system are evalu-ated using two indices: (1) average PM10 concentration at thesubway platform and (2) ventilation energy consumption. The PM10inside a subway platform relates to increased respiratory and car-diovascular diseases of the passengers [6]. Thus, a good ventilationcontrol system should maintain low platform PM10 concentration;accordingly, the average platform PM10 value is considered the firstperformance index. The energy consumption of the ventilationcontrol system is taken as the second performance index, sincepowered equipment (e.g., fans and blowers) installed in theventilation system is responsible for significant energy consump-tion [3]. The ventilation energy consumption (kWh) is estimatedusing a third-order polynomial proposed by Liu et al. [10]:
Energy consumption ¼ 0:0007 Hz3 � 0:046 Hz2 þ 2:01 Hz
þ 8:8
(7)
where Hz is the inverter frequency of the IAQ ventilation controlsystem.
4.1.3. Evaluation of the passenger health riskThe influence of ventilated platform PM10 on the passengers'
health risk is evaluated using the CIAI. In order to investigate theeffect of IAQ ventilation that takes the outdoor air quality into ac-count, the platformPM10 values that are ventilated using themanualcontrol system (i.e., without the consideration of outdoor air quality)and the proposed control system (i.e., with the consideration ofoutdoor air quality) are estimated, respectively. Then, to assess thepassengers’ health risk under two different control conditions, theCIAI values of the ventilated platform PM10 are compared.
4.2. Subway station in Seoul metro system
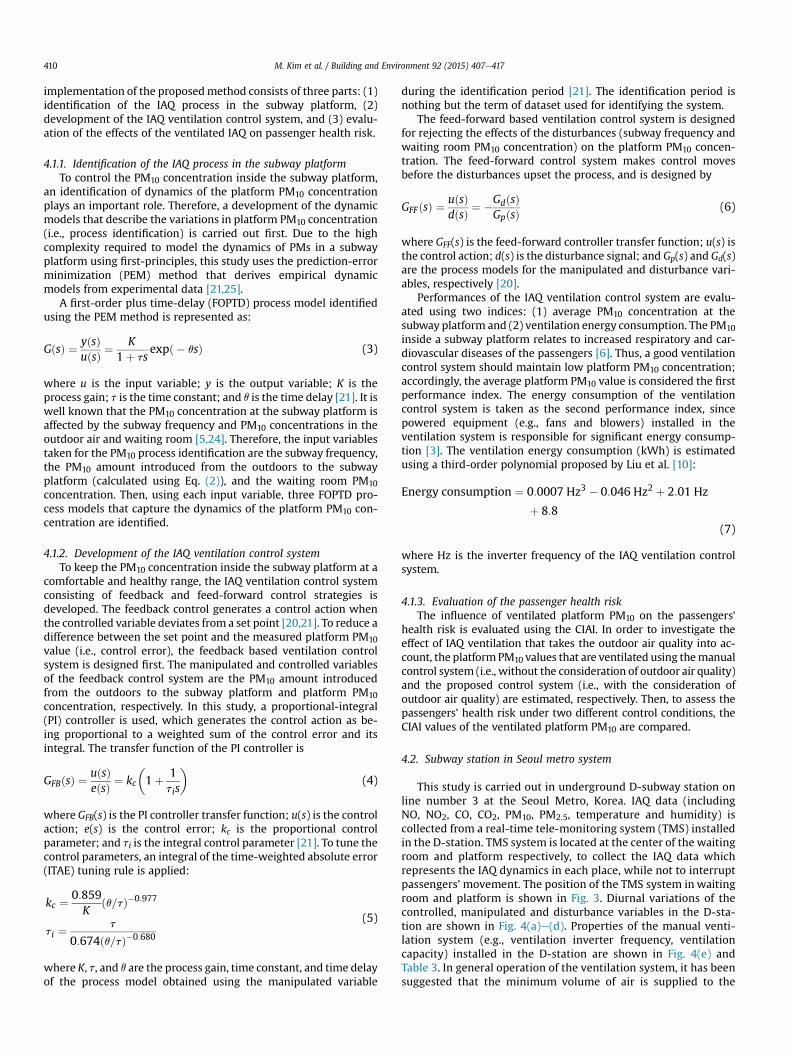
This study is carried out in underground D-subway station online number 3 at the Seoul Metro, Korea. IAQ data (includingNO, NO2, CO, CO2, PM10, PM2.5, temperature and humidity) iscollected from a real-time tele-monitoring system (TMS) installedin the D-station. TMS system is located at the center of the waitingroom and platform respectively, to collect the IAQ data whichrepresents the IAQ dynamics in each place, while not to interruptpassengers’movement. The position of the TMS system in waitingroom and platform is shown in Fig. 3. Diurnal variations of thecontrolled, manipulated and disturbance variables in the D-sta-tion are shown in Fig. 4(a)e(d). Properties of the manual venti-lation system (e.g., ventilation inverter frequency, ventilationcapacity) installed in the D-station are shown in Fig. 4(e) andTable 3. In general operation of the ventilation system, it has beensuggested that the minimum volume of air is supplied to the
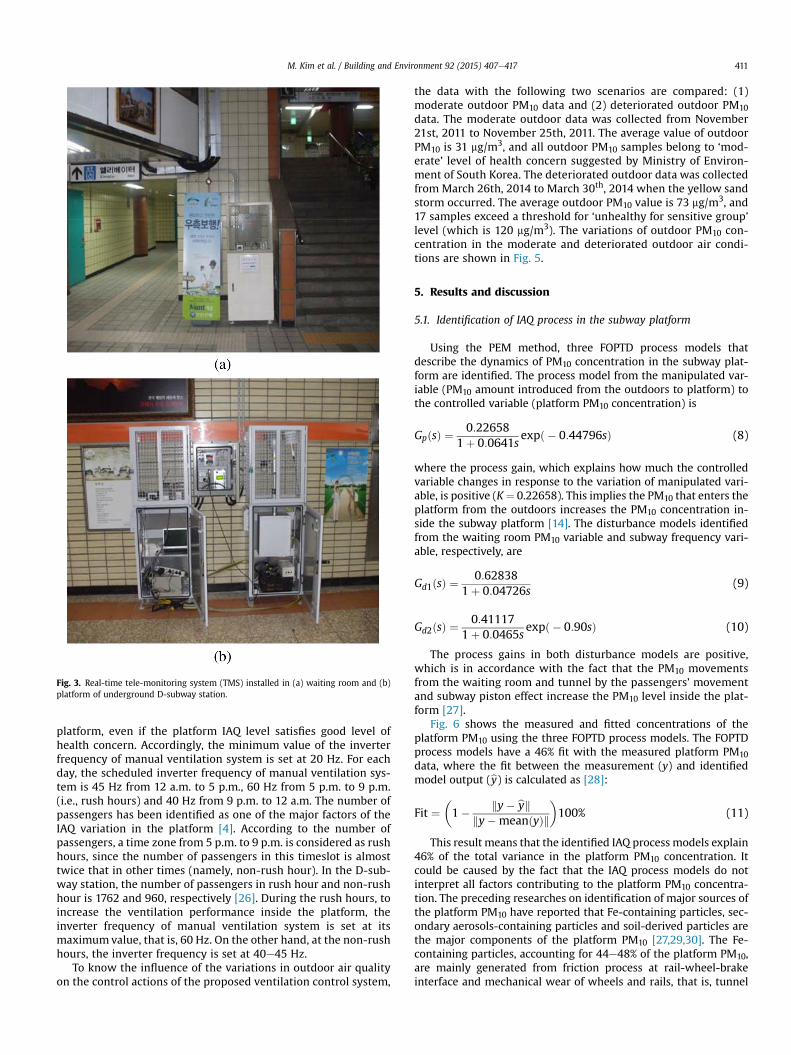
Fig. 3. Real-time tele-monitoring system (TMS) installed in (a) waiting room and (b)platform of underground D-subway station.
M. Kim et al. / Building and Environment 92 (2015) 407e417 411
platform, even if the platform IAQ level satisfies good level ofhealth concern. Accordingly, the minimum value of the inverterfrequency of manual ventilation system is set at 20 Hz. For eachday, the scheduled inverter frequency of manual ventilation sys-tem is 45 Hz from 12 a.m. to 5 p.m., 60 Hz from 5 p.m. to 9 p.m.(i.e., rush hours) and 40 Hz from 9 p.m. to 12 a.m. The number ofpassengers has been identified as one of the major factors of theIAQ variation in the platform [4]. According to the number ofpassengers, a time zone from 5 p.m. to 9 p.m. is considered as rushhours, since the number of passengers in this timeslot is almosttwice that in other times (namely, non-rush hour). In the D-sub-way station, the number of passengers in rush hour and non-rushhour is 1762 and 960, respectively [26]. During the rush hours, toincrease the ventilation performance inside the platform, theinverter frequency of manual ventilation system is set at itsmaximum value, that is, 60 Hz. On the other hand, at the non-rushhours, the inverter frequency is set at 40e45 Hz.
To know the influence of the variations in outdoor air qualityon the control actions of the proposed ventilation control system,
the data with the following two scenarios are compared: (1)moderate outdoor PM10 data and (2) deteriorated outdoor PM10data. The moderate outdoor data was collected from November21st, 2011 to November 25th, 2011. The average value of outdoorPM10 is 31 mg/m3, and all outdoor PM10 samples belong to ‘mod-erate’ level of health concern suggested by Ministry of Environ-ment of South Korea. The deteriorated outdoor data was collectedfrom March 26th, 2014 to March 30th, 2014 when the yellow sandstorm occurred. The average outdoor PM10 value is 73 mg/m3, and17 samples exceed a threshold for ‘unhealthy for sensitive group’level (which is 120 mg/m3). The variations of outdoor PM10 con-centration in the moderate and deteriorated outdoor air condi-tions are shown in Fig. 5.
5. Results and discussion
5.1. Identification of IAQ process in the subway platform
Using the PEM method, three FOPTD process models thatdescribe the dynamics of PM10 concentration in the subway plat-form are identified. The process model from the manipulated var-iable (PM10 amount introduced from the outdoors to platform) tothe controlled variable (platform PM10 concentration) is
GpðsÞ ¼ 0:226581þ 0:0641s
expð � 0:44796sÞ (8)
where the process gain, which explains how much the controlledvariable changes in response to the variation of manipulated vari-able, is positive (K¼ 0.22658). This implies the PM10 that enters theplatform from the outdoors increases the PM10 concentration in-side the subway platform [14]. The disturbance models identifiedfrom the waiting room PM10 variable and subway frequency vari-able, respectively, are
Gd1ðsÞ ¼0:62838
1þ 0:04726s(9)
Gd2ðsÞ ¼0:41117
1þ 0:0465sexpð � 0:90sÞ (10)
The process gains in both disturbance models are positive,which is in accordance with the fact that the PM10 movementsfrom the waiting room and tunnel by the passengers’ movementand subway piston effect increase the PM10 level inside the plat-form [27].
Fig. 6 shows the measured and fitted concentrations of theplatform PM10 using the three FOPTD process models. The FOPTDprocess models have a 46% fit with the measured platform PM10
data, where the fit between the measurement (y) and identifiedmodel output (by) is calculated as [28]:
Fit ¼�1� ky� byk
ky�meanðyÞk�100% (11)
This result means that the identified IAQ process models explain46% of the total variance in the platform PM10 concentration. Itcould be caused by the fact that the IAQ process models do notinterpret all factors contributing to the platform PM10 concentra-tion. The preceding researches on identification of major sources ofthe platform PM10 have reported that Fe-containing particles, sec-ondary aerosols-containing particles and soil-derived particles arethe major components of the platform PM10 [27,29,30]. The Fe-containing particles, accounting for 44e48% of the platform PM10,are mainly generated from friction process at rail-wheel-brakeinterface and mechanical wear of wheels and rails, that is, tunnel
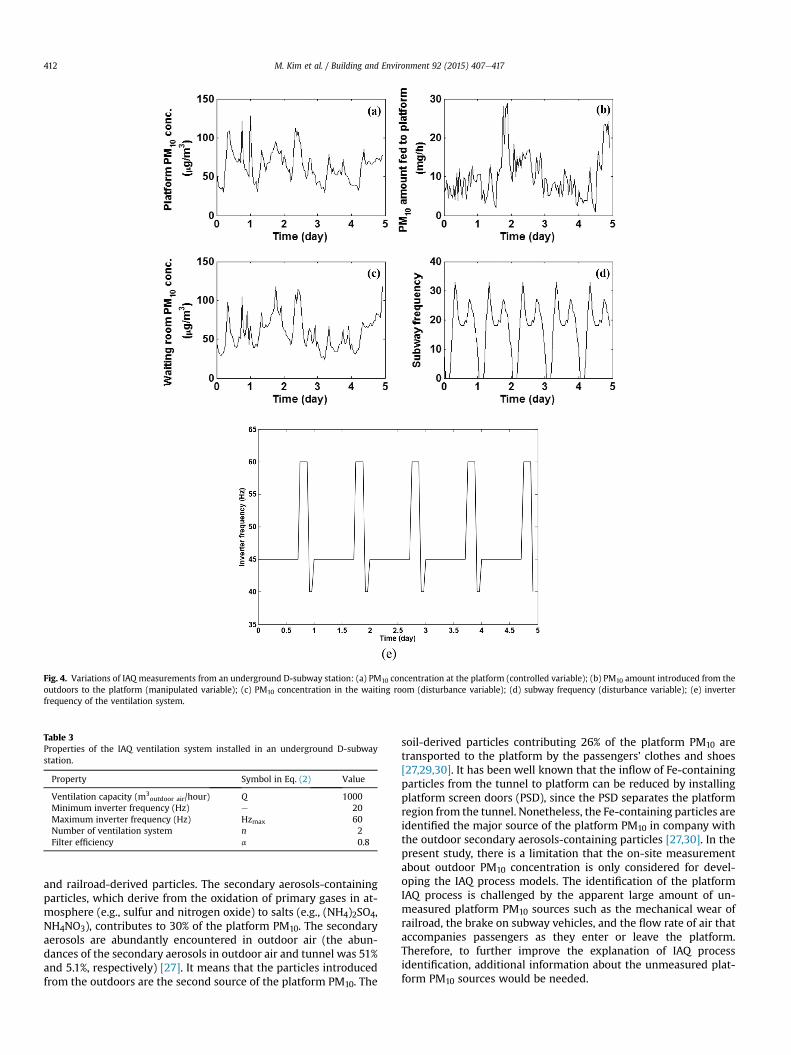
Fig. 4. Variations of IAQ measurements from an underground D-subway station: (a) PM10 concentration at the platform (controlled variable); (b) PM10 amount introduced from theoutdoors to the platform (manipulated variable); (c) PM10 concentration in the waiting room (disturbance variable); (d) subway frequency (disturbance variable); (e) inverterfrequency of the ventilation system.
Table 3Properties of the IAQ ventilation system installed in an underground D-subwaystation.
Property Symbol in Eq. (2) Value
Ventilation capacity (m3outdoor air/hour) Q 1000
Minimum inverter frequency (Hz) e 20Maximum inverter frequency (Hz) Hzmax 60Number of ventilation system n 2Filter efficiency a 0.8
M. Kim et al. / Building and Environment 92 (2015) 407e417412
and railroad-derived particles. The secondary aerosols-containingparticles, which derive from the oxidation of primary gases in at-mosphere (e.g., sulfur and nitrogen oxide) to salts (e.g., (NH4)2SO4,NH4NO3), contributes to 30% of the platform PM10. The secondaryaerosols are abundantly encountered in outdoor air (the abun-dances of the secondary aerosols in outdoor air and tunnel was 51%and 5.1%, respectively) [27]. It means that the particles introducedfrom the outdoors are the second source of the platform PM10. The
soil-derived particles contributing 26% of the platform PM10 aretransported to the platform by the passengers’ clothes and shoes[27,29,30]. It has been well known that the inflow of Fe-containingparticles from the tunnel to platform can be reduced by installingplatform screen doors (PSD), since the PSD separates the platformregion from the tunnel. Nonetheless, the Fe-containing particles areidentified the major source of the platform PM10 in company withthe outdoor secondary aerosols-containing particles [27,30]. In thepresent study, there is a limitation that the on-site measurementabout outdoor PM10 concentration is only considered for devel-oping the IAQ process models. The identification of the platformIAQ process is challenged by the apparent large amount of un-measured platform PM10 sources such as the mechanical wear ofrailroad, the brake on subway vehicles, and the flow rate of air thataccompanies passengers as they enter or leave the platform.Therefore, to further improve the explanation of IAQ processidentification, additional information about the unmeasured plat-form PM10 sources would be needed.
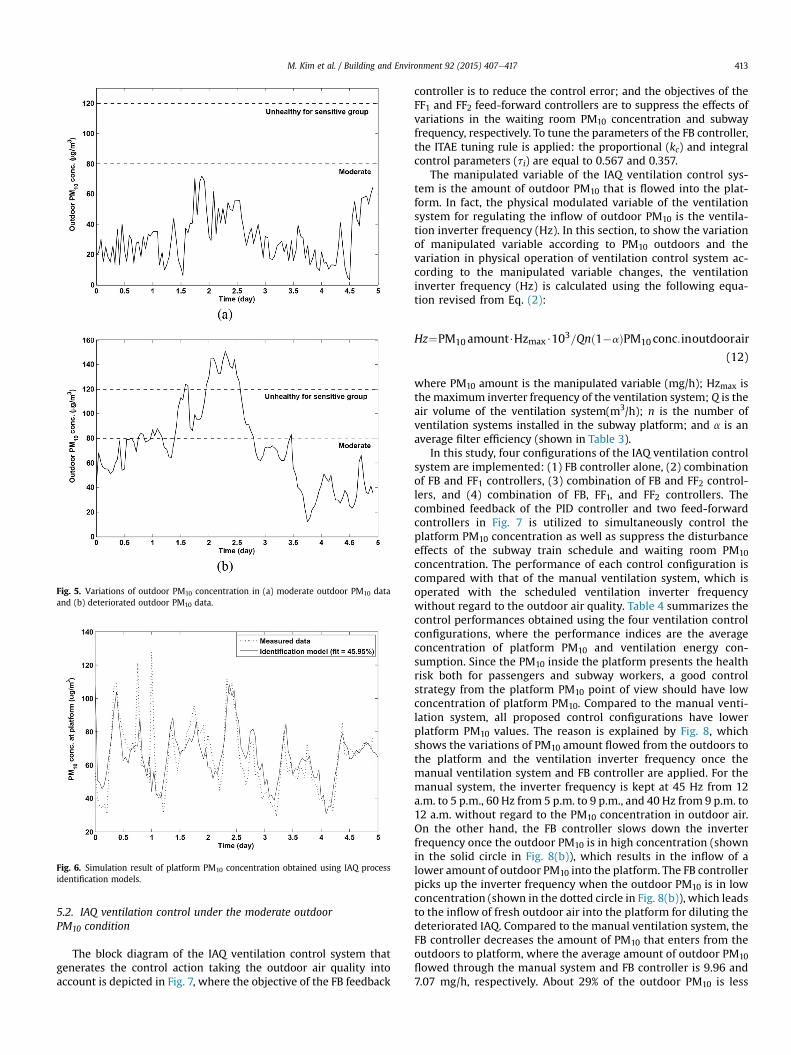
Fig. 5. Variations of outdoor PM10 concentration in (a) moderate outdoor PM10 dataand (b) deteriorated outdoor PM10 data.
Fig. 6. Simulation result of platform PM10 concentration obtained using IAQ processidentification models.
M. Kim et al. / Building and Environment 92 (2015) 407e417 413
5.2. IAQ ventilation control under the moderate outdoorPM10 condition
The block diagram of the IAQ ventilation control system thatgenerates the control action taking the outdoor air quality intoaccount is depicted in Fig. 7, where the objective of the FB feedback
controller is to reduce the control error; and the objectives of theFF1 and FF2 feed-forward controllers are to suppress the effects ofvariations in the waiting room PM10 concentration and subwayfrequency, respectively. To tune the parameters of the FB controller,the ITAE tuning rule is applied: the proportional (kc) and integralcontrol parameters (ti) are equal to 0.567 and 0.357.
The manipulated variable of the IAQ ventilation control sys-tem is the amount of outdoor PM10 that is flowed into the plat-form. In fact, the physical modulated variable of the ventilationsystem for regulating the inflow of outdoor PM10 is the ventila-tion inverter frequency (Hz). In this section, to show the variationof manipulated variable according to PM10 outdoors and thevariation in physical operation of ventilation control system ac-cording to the manipulated variable changes, the ventilationinverter frequency (Hz) is calculated using the following equa-tion revised from Eq. (2):
Hz¼PM10 amount$Hzmax$103=Qnð1�aÞPM10 conc:inoutdoorair
(12)
where PM10 amount is the manipulated variable (mg/h); Hzmax isthe maximum inverter frequency of the ventilation system; Q is theair volume of the ventilation system(m3/h); n is the number ofventilation systems installed in the subway platform; and a is anaverage filter efficiency (shown in Table 3).
In this study, four configurations of the IAQ ventilation controlsystem are implemented: (1) FB controller alone, (2) combinationof FB and FF1 controllers, (3) combination of FB and FF2 control-lers, and (4) combination of FB, FF1, and FF2 controllers. Thecombined feedback of the PID controller and two feed-forwardcontrollers in Fig. 7 is utilized to simultaneously control theplatform PM10 concentration as well as suppress the disturbanceeffects of the subway train schedule and waiting room PM10concentration. The performance of each control configuration iscompared with that of the manual ventilation system, which isoperated with the scheduled ventilation inverter frequencywithout regard to the outdoor air quality. Table 4 summarizes thecontrol performances obtained using the four ventilation controlconfigurations, where the performance indices are the averageconcentration of platform PM10 and ventilation energy con-sumption. Since the PM10 inside the platform presents the healthrisk both for passengers and subway workers, a good controlstrategy from the platform PM10 point of view should have lowconcentration of platform PM10. Compared to the manual venti-lation system, all proposed control configurations have lowerplatform PM10 values. The reason is explained by Fig. 8, whichshows the variations of PM10 amount flowed from the outdoors tothe platform and the ventilation inverter frequency once themanual ventilation system and FB controller are applied. For themanual system, the inverter frequency is kept at 45 Hz from 12a.m. to 5 p.m., 60 Hz from 5 p.m. to 9 p.m., and 40 Hz from 9 p.m. to12 a.m. without regard to the PM10 concentration in outdoor air.On the other hand, the FB controller slows down the inverterfrequency once the outdoor PM10 is in high concentration (shownin the solid circle in Fig. 8(b)), which results in the inflow of alower amount of outdoor PM10 into the platform. The FB controllerpicks up the inverter frequency when the outdoor PM10 is in lowconcentration (shown in the dotted circle in Fig. 8(b)), which leadsto the inflow of fresh outdoor air into the platform for diluting thedeteriorated IAQ. Compared to the manual ventilation system, theFB controller decreases the amount of PM10 that enters from theoutdoors to platform, where the average amount of outdoor PM10flowed through the manual system and FB controller is 9.96 and7.07 mg/h, respectively. About 29% of the outdoor PM10 is less
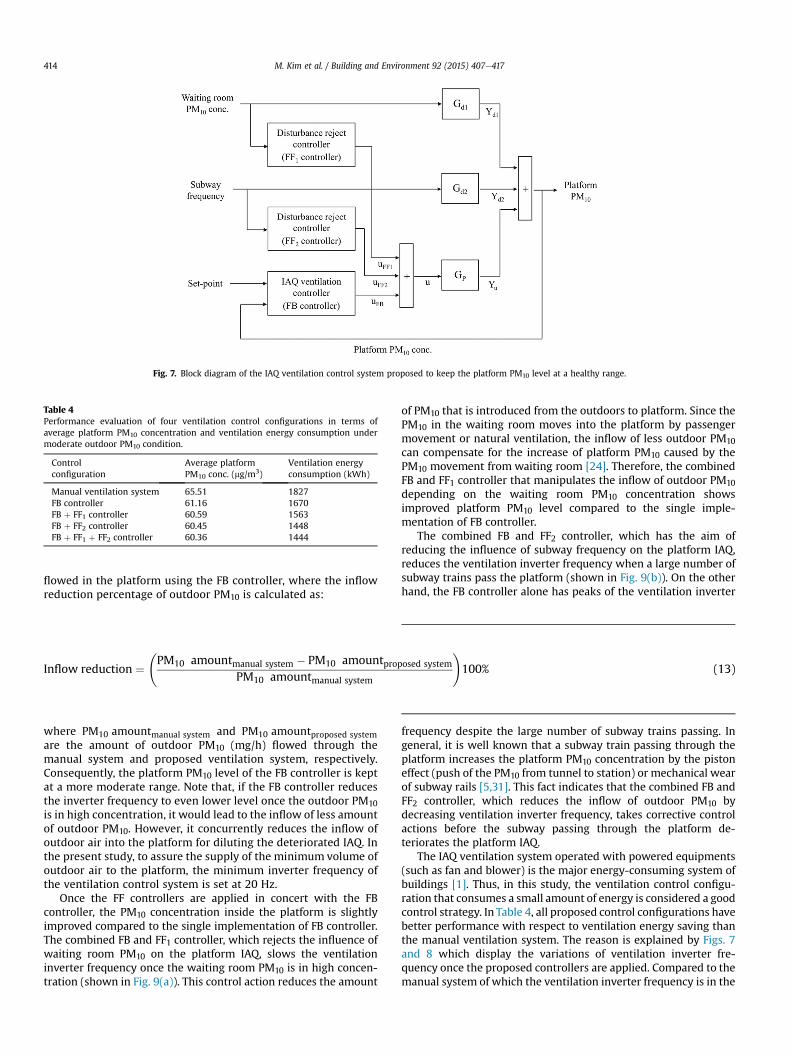
Fig. 7. Block diagram of the IAQ ventilation control system proposed to keep the platform PM10 level at a healthy range.
Table 4Performance evaluation of four ventilation control configurations in terms ofaverage platform PM10 concentration and ventilation energy consumption undermoderate outdoor PM10 condition.
Controlconfiguration
Average platformPM10 conc. (mg/m3)
Ventilation energyconsumption (kWh)
Manual ventilation system 65.51 1827FB controller 61.16 1670FB þ FF1 controller 60.59 1563FB þ FF2 controller 60.45 1448FB þ FF1 þ FF2 controller 60.36 1444
M. Kim et al. / Building and Environment 92 (2015) 407e417414
flowed in the platform using the FB controller, where the inflowreduction percentage of outdoor PM10 is calculated as:
Inflow reduction ¼ PM10 amountmanual system � PM10 amountproposed system
PM10 amountmanual system
!100% (13)
where PM10 amountmanual system and PM10 amountproposed systemare the amount of outdoor PM10 (mg/h) flowed through themanual system and proposed ventilation system, respectively.Consequently, the platform PM10 level of the FB controller is keptat a more moderate range. Note that, if the FB controller reducesthe inverter frequency to even lower level once the outdoor PM10is in high concentration, it would lead to the inflow of less amountof outdoor PM10. However, it concurrently reduces the inflow ofoutdoor air into the platform for diluting the deteriorated IAQ. Inthe present study, to assure the supply of the minimum volume ofoutdoor air to the platform, the minimum inverter frequency ofthe ventilation control system is set at 20 Hz.
Once the FF controllers are applied in concert with the FBcontroller, the PM10 concentration inside the platform is slightlyimproved compared to the single implementation of FB controller.The combined FB and FF1 controller, which rejects the influence ofwaiting room PM10 on the platform IAQ, slows the ventilationinverter frequency once the waiting room PM10 is in high concen-tration (shown in Fig. 9(a)). This control action reduces the amount
of PM10 that is introduced from the outdoors to platform. Since thePM10 in the waiting room moves into the platform by passengermovement or natural ventilation, the inflow of less outdoor PM10
can compensate for the increase of platform PM10 caused by thePM10 movement from waiting room [24]. Therefore, the combinedFB and FF1 controller that manipulates the inflow of outdoor PM10depending on the waiting room PM10 concentration showsimproved platform PM10 level compared to the single imple-mentation of FB controller.
The combined FB and FF2 controller, which has the aim ofreducing the influence of subway frequency on the platform IAQ,reduces the ventilation inverter frequency when a large number ofsubway trains pass the platform (shown in Fig. 9(b)). On the otherhand, the FB controller alone has peaks of the ventilation inverter
frequency despite the large number of subway trains passing. Ingeneral, it is well known that a subway train passing through theplatform increases the platform PM10 concentration by the pistoneffect (push of the PM10 from tunnel to station) or mechanical wearof subway rails [5,31]. This fact indicates that the combined FB andFF2 controller, which reduces the inflow of outdoor PM10 bydecreasing ventilation inverter frequency, takes corrective controlactions before the subway passing through the platform de-teriorates the platform IAQ.
The IAQ ventilation system operated with powered equipments(such as fan and blower) is the major energy-consuming system ofbuildings [1]. Thus, in this study, the ventilation control configu-ration that consumes a small amount of energy is considered a goodcontrol strategy. In Table 4, all proposed control configurations havebetter performance with respect to ventilation energy saving thanthe manual ventilation system. The reason is explained by Figs. 7and 8 which display the variations of ventilation inverter fre-quency once the proposed controllers are applied. Compared to themanual system of which the ventilation inverter frequency is in the
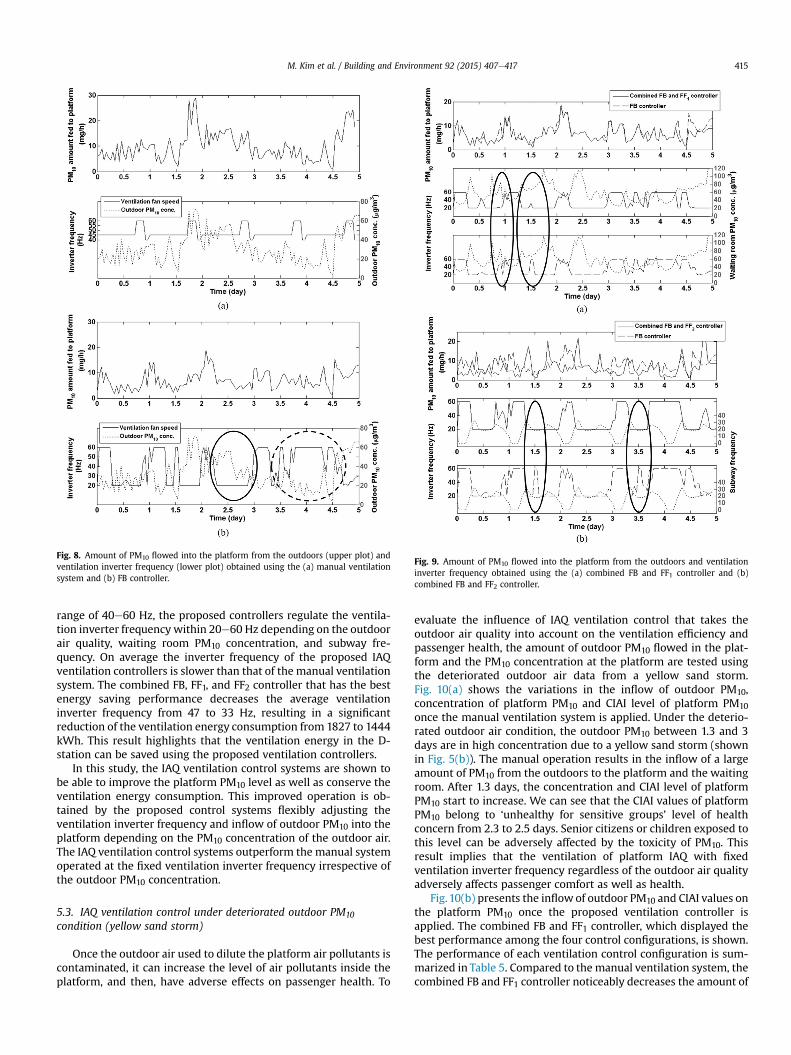
Fig. 8. Amount of PM10 flowed into the platform from the outdoors (upper plot) andventilation inverter frequency (lower plot) obtained using the (a) manual ventilationsystem and (b) FB controller.
Fig. 9. Amount of PM10 flowed into the platform from the outdoors and ventilationinverter frequency obtained using the (a) combined FB and FF1 controller and (b)combined FB and FF2 controller.
M. Kim et al. / Building and Environment 92 (2015) 407e417 415
range of 40e60 Hz, the proposed controllers regulate the ventila-tion inverter frequency within 20e60 Hz depending on the outdoorair quality, waiting room PM10 concentration, and subway fre-quency. On average the inverter frequency of the proposed IAQventilation controllers is slower than that of the manual ventilationsystem. The combined FB, FF1, and FF2 controller that has the bestenergy saving performance decreases the average ventilationinverter frequency from 47 to 33 Hz, resulting in a significantreduction of the ventilation energy consumption from 1827 to 1444kWh. This result highlights that the ventilation energy in the D-station can be saved using the proposed ventilation controllers.
In this study, the IAQ ventilation control systems are shown tobe able to improve the platform PM10 level as well as conserve theventilation energy consumption. This improved operation is ob-tained by the proposed control systems flexibly adjusting theventilation inverter frequency and inflow of outdoor PM10 into theplatform depending on the PM10 concentration of the outdoor air.The IAQ ventilation control systems outperform the manual systemoperated at the fixed ventilation inverter frequency irrespective ofthe outdoor PM10 concentration.
5.3. IAQ ventilation control under deteriorated outdoor PM10
condition (yellow sand storm)
Once the outdoor air used to dilute the platform air pollutants iscontaminated, it can increase the level of air pollutants inside theplatform, and then, have adverse effects on passenger health. To
evaluate the influence of IAQ ventilation control that takes theoutdoor air quality into account on the ventilation efficiency andpassenger health, the amount of outdoor PM10 flowed in the plat-form and the PM10 concentration at the platform are tested usingthe deteriorated outdoor air data from a yellow sand storm.Fig. 10(a) shows the variations in the inflow of outdoor PM10,concentration of platform PM10 and CIAI level of platform PM10once the manual ventilation system is applied. Under the deterio-rated outdoor air condition, the outdoor PM10 between 1.3 and 3days are in high concentration due to a yellow sand storm (shownin Fig. 5(b)). The manual operation results in the inflow of a largeamount of PM10 from the outdoors to the platform and the waitingroom. After 1.3 days, the concentration and CIAI level of platformPM10 start to increase. We can see that the CIAI values of platformPM10 belong to ‘unhealthy for sensitive groups’ level of healthconcern from 2.3 to 2.5 days. Senior citizens or children exposed tothis level can be adversely affected by the toxicity of PM10. Thisresult implies that the ventilation of platform IAQ with fixedventilation inverter frequency regardless of the outdoor air qualityadversely affects passenger comfort as well as health.
Fig.10(b) presents the inflow of outdoor PM10 and CIAI values onthe platform PM10 once the proposed ventilation controller isapplied. The combined FB and FF1 controller, which displayed thebest performance among the four control configurations, is shown.The performance of each ventilation control configuration is sum-marized in Table 5. Compared to the manual ventilation system, thecombined FB and FF1 controller noticeably decreases the amount of
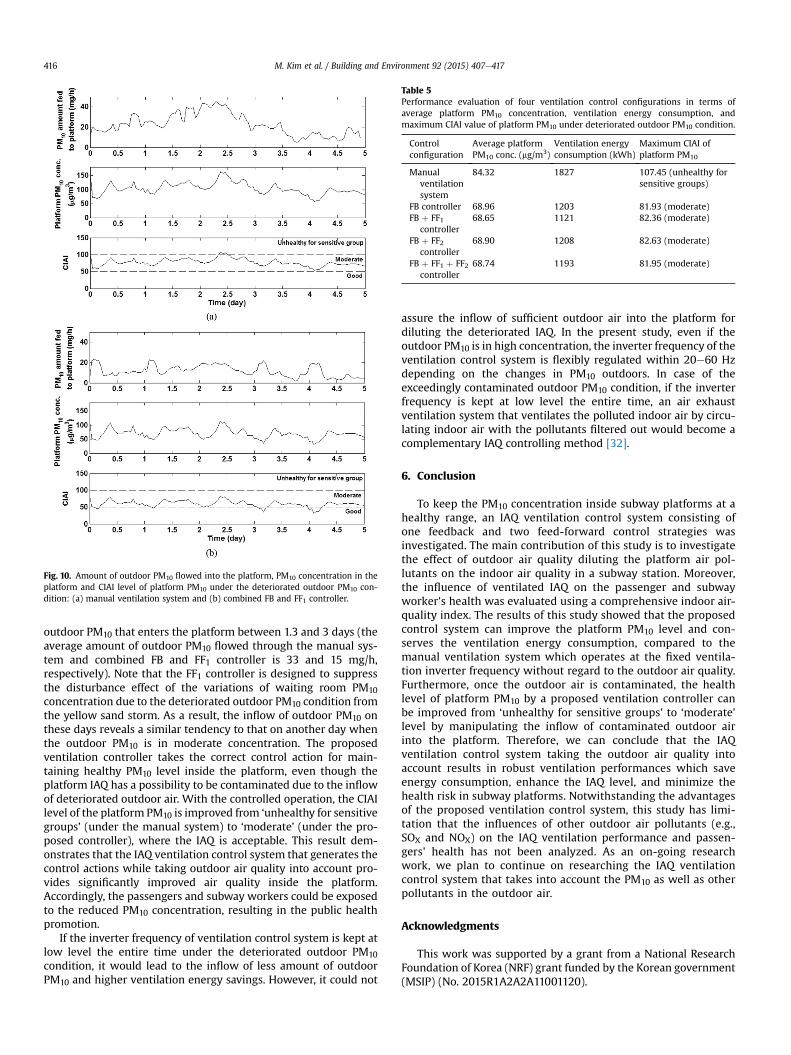
Fig. 10. Amount of outdoor PM10 flowed into the platform, PM10 concentration in theplatform and CIAI level of platform PM10 under the deteriorated outdoor PM10 con-dition: (a) manual ventilation system and (b) combined FB and FF1 controller.
Table 5Performance evaluation of four ventilation control configurations in terms ofaverage platform PM10 concentration, ventilation energy consumption, andmaximum CIAI value of platform PM10 under deteriorated outdoor PM10 condition.
Controlconfiguration
Average platformPM10 conc. (mg/m3)
Ventilation energyconsumption (kWh)
Maximum CIAI ofplatform PM10
Manualventilationsystem
84.32 1827 107.45 (unhealthy forsensitive groups)
FB controller 68.96 1203 81.93 (moderate)FB þ FF1
controller68.65 1121 82.36 (moderate)
FB þ FF2controller
68.90 1208 82.63 (moderate)
FB þ FF1 þ FF2controller
68.74 1193 81.95 (moderate)
M. Kim et al. / Building and Environment 92 (2015) 407e417416
outdoor PM10 that enters the platform between 1.3 and 3 days (theaverage amount of outdoor PM10 flowed through the manual sys-tem and combined FB and FF1 controller is 33 and 15 mg/h,respectively). Note that the FF1 controller is designed to suppressthe disturbance effect of the variations of waiting room PM10concentration due to the deteriorated outdoor PM10 condition fromthe yellow sand storm. As a result, the inflow of outdoor PM10 onthese days reveals a similar tendency to that on another day whenthe outdoor PM10 is in moderate concentration. The proposedventilation controller takes the correct control action for main-taining healthy PM10 level inside the platform, even though theplatform IAQ has a possibility to be contaminated due to the inflowof deteriorated outdoor air. With the controlled operation, the CIAIlevel of the platform PM10 is improved from ‘unhealthy for sensitivegroups’ (under the manual system) to ‘moderate’ (under the pro-posed controller), where the IAQ is acceptable. This result dem-onstrates that the IAQ ventilation control system that generates thecontrol actions while taking outdoor air quality into account pro-vides significantly improved air quality inside the platform.Accordingly, the passengers and subway workers could be exposedto the reduced PM10 concentration, resulting in the public healthpromotion.
If the inverter frequency of ventilation control system is kept atlow level the entire time under the deteriorated outdoor PM10condition, it would lead to the inflow of less amount of outdoorPM10 and higher ventilation energy savings. However, it could not
assure the inflow of sufficient outdoor air into the platform fordiluting the deteriorated IAQ. In the present study, even if theoutdoor PM10 is in high concentration, the inverter frequency of theventilation control system is flexibly regulated within 20e60 Hzdepending on the changes in PM10 outdoors. In case of theexceedingly contaminated outdoor PM10 condition, if the inverterfrequency is kept at low level the entire time, an air exhaustventilation system that ventilates the polluted indoor air by circu-lating indoor air with the pollutants filtered out would become acomplementary IAQ controlling method [32].
6. Conclusion
To keep the PM10 concentration inside subway platforms at ahealthy range, an IAQ ventilation control system consisting ofone feedback and two feed-forward control strategies wasinvestigated. The main contribution of this study is to investigatethe effect of outdoor air quality diluting the platform air pol-lutants on the indoor air quality in a subway station. Moreover,the influence of ventilated IAQ on the passenger and subwayworker's health was evaluated using a comprehensive indoor air-quality index. The results of this study showed that the proposedcontrol system can improve the platform PM10 level and con-serves the ventilation energy consumption, compared to themanual ventilation system which operates at the fixed ventila-tion inverter frequency without regard to the outdoor air quality.Furthermore, once the outdoor air is contaminated, the healthlevel of platform PM10 by a proposed ventilation controller canbe improved from ‘unhealthy for sensitive groups’ to ‘moderate’level by manipulating the inflow of contaminated outdoor airinto the platform. Therefore, we can conclude that the IAQventilation control system taking the outdoor air quality intoaccount results in robust ventilation performances which saveenergy consumption, enhance the IAQ level, and minimize thehealth risk in subway platforms. Notwithstanding the advantagesof the proposed ventilation control system, this study has limi-tation that the influences of other outdoor air pollutants (e.g.,SOX and NOX) on the IAQ ventilation performance and passen-gers' health has not been analyzed. As an on-going researchwork, we plan to continue on researching the IAQ ventilationcontrol system that takes into account the PM10 as well as otherpollutants in the outdoor air.
Acknowledgments
This work was supported by a grant from a National ResearchFoundation of Korea (NRF) grant funded by the Korean government(MSIP) (No. 2015R1A2A2A11001120).
M. Kim et al. / Building and Environment 92 (2015) 407e417 417
References
[1] Hong W, Kim S. A study on the energy consumption unit of subway stations inKorea. Build Environ 2004;39:1497e503.
[2] Nieuwenhuijsen MJ, Gomez-Perales JE, Colvile RN. Levels of particulate airpollution, its elemental composition, determinants and health effects in metrosystems. Atmos Environ 2007;41:7996e8006.
[3] Kim M, Liu H, Kim JT, Yoo C. Sensor fault identification and reconstruction ofindoor air quality (IAQ) data using a multivariate non-Gaussian model inunderground building space. Energy Build 2013;66:384e94.
[4] Kim M, SankaraRao B, Kang O, Kim J, Yoo C. Monitoring and prediction ofindoor air quality (IAQ) in subway or metro systems using season dependentmodels. Energy Build 2012;46:48e55.
[5] Moreno T, Perez N, Reche C, Martins V, Miguel E, Capdevila M, et al. Subwayplatform air quality: assessing the influences of tunnel ventilation, train pistoneffect and station design. Atmos Environ 2014;92:461e8.
[6] Brauner EV, Frederiksen M, Kolarik B, Gunnarsen L. Typical benign indooraerosol concentrations in public spaces and designing biosensors for pathogendetection: a review. Build Environ 2014;82:190e202.
[7] Ke M-T, Cheng T-C, Wang W-P. Numerical simulation for optimizing thedesign of subway environmental control system. Build Environ 2002;37:1139e52.
[8] Chao CYH, Hu JS. Development of a dual-mode demand control ventilationstrategy for indoor air quality control and energy saving. Build Environ2004;39:385e97.
[9] Kolokotsa D, Pouliezos A, Stavrakakis G, Lazos C. Predictive control techniquesfor energy and indoor environmental quality management in buildings. BuildEnviron 2009;44:1850e63.
[10] Liu H, Lee S, Kim M, Shi H, Kim JT, Wasewar KL, et al. Multi-objective opti-mization of indoor air quality control and energy consumption minimizationin a subway ventilation system. Energy Build 2013;66:553e61.
[11] Dutton SM, Fisk WJ. Energy and indoor air quality implications of alterna-tive minimum ventilation rates in California offices. Build Environ 2014;82:121e7.
[12] Lim E, Ito K, Sandberg M. Performance evaluation of contaminant removal andair quality control for local ventilation systems using the ventilation index netescape Velocity. Build Environ 2014;79:78e89.
[13] Marsik T, Johnson R. HVAC air-quality model and its use to test a PM2.5 controlstrategy. Build Environ 2008;43:1850e7.
[14] Yu CKH, Li M, Chan V, Lai ACK. Influence of mechanical ventilation system onindoor carbon dioxide and particulate matter concentration. Build Environ2014;76:73e80.
[15] Yu H-L, Yang C-H, Chien L-C. Spatial vulnerability under extreme events: acase of Asian dust storm's effects on children's respiratory health. Environ Int2013;54:35e44.
[16] Oh H-R, Ho C-H, Kim J, Chen D, Lee S, Choi Y-S, et al. Long-range transport ofair pollutants originating in China: a possible major cause of multi-day high-PM10 episodes during cold season in Seoul, Korea. Atmos Environ 2015;109:23e30.
[17] Chan AT. Indoor-outdoor relationships of particulate matter and nitrogenoxides under different outdoor meteorological conditions. Atmos Environ2002;36:1543e51.
[18] Kim M, Liu B, Kim JT, Yoo C. Evaluation of passenger health risk assessment ofsustainable indoor air quality monitoring in metro systems based on a non-Gaussian dynamic sensor validation method. J Hazard Mater 2014;278:124e33.
[19] Kim K-H, Kabir E, Kabir S. A review on the human health impact of airborneparticulate matter. Environ Int 2015;74:136e43.
[20] Bequette BW. Process control e modeling, design and simulation. India:Prentice-Hall Inc.; 2003.
[21] Seborg DE, Edgar TF, Mellichamp DA, Doyle FJ. Process dynamics and control.3rd ed. John Wiley & Sons Inc.; 2010.
[22] U.S. Environmental Protection Agency (EPA). Air quality index (AQI) e a guideto air quality and your health. USA. 2009.
[23] Li Q-Q, You S-J. A new system to reduce air pollution in metro platform.Procedia Environ Sic 2011;11:1454e8.
[24] Lee S, Liu H, Kim M, Kim JT, Yoo C. Online monitoring and interpretation ofperiodic diurnal and seasonal variations of indoor air pollutants in a subwaystation using parallel factor analysis (PARAFAC). Energy Build 2014;68:87e98.
[25] Ljung L. Prediction error estimation methods. Circuits Syst Signal Process2002;21:11e21.
[26] Retrieved from http://www.seoulmetro.co.kr/eng/.[27] Park D, Oh M, Yoon Y, Park E, Lee K. Source identification of PM10 pollution in
subway passenger cabins using positive matrix factorization. Atmos Environ2012;49:180e5.
[28] Liu H, Lee S, Kim M, Shi H, Kim JT, Yoo C. Finding the optimal set points of athermal and ventilation control system under changing outdoor weatherconditions. Indoor Built Environ 2014;21:118e32.
[29] Lee T-J, Jeon J-S, Kim S-D, Kim D-S. A comparative study on PM10 sourcecontributions in a Seoul metropolitan subway station before/after installingplatform screen doors. J Kor Soc Atmos Environ 2010;26:543e53.
[30] Jung H-J, Kim B, Ryu J, Maskey S, Kim J-C, Sohn J, et al. Source identification ofparticulate matter collected at underground subway stations in Seoul, Koreausing quantitative single-particle analysis. Atmos Environ 2010;44:2287e93.
[31] Gonzalez ML, Vega MG, Oro JMF, Marigorta EB. Numerical modeling of thepiston effect in longitudinal ventilation systems for subway tunnels. TunnUndergr Space Tech 2014;40:22e37.
[32] Shahsavar A, Salmanzadeh M, Ameri M, Telebizadeh P. Energy saving inbuildings by using the exhaust and ventilation air for cooling of photovoltaicpanels. Energy Build 2011;43:2219e26.