indoor-outdoor volatile organic compounds (vocs) levels in ...€¦ · indoor-outdoor volatile...
TRANSCRIPT
Journal of Modern Science and Technology
Vol. 4. No. 1. September 2016 Issue. Pp. 97 – 127
Indoor-Outdoor Volatile Organic Compounds (VOCs) levels: The Case of Dhaka Urban and Industrial Area
Mitali Parvin1, Herman Van Langenhove2, Christophe Walgraeve3 and Do Hoai Duc4
Volatile organic compounds (VOCs) are of concern both as indoor and outdoor air pollutants for their potential adverse impact on health of people who are exposed and ability to create photochemical smog under certain conditions. Although VOCs are expected to be an important environmental and health risk factor for the rapidly industrializing countries like Bangladesh but there are limited studies on the outdoor and indoor air levels of VOCs in different environments such as industrial and urban areas. On the other hand, there is no known published data yet to assess the indoor VOCs of residential houses in Bangladesh. Therefore, the presence and concentration levels of VOCs were investigated for urban (Mirpur) and industrial (Tejgaon) areas of Dhaka city, Bangladesh in this study. For this purpose six places were selected in two areas (urban and industrial area) for sampling campaigns from 30 of August 2013 to 11 September 2013. Outdoor and indoor samples from both areas were obtained by means of active sampling using Tenax TA tubes as sorbent material during the sampling time. Analysis and quantification were done by thermal desorption-gas chromatography-mass spectrometry (TD-GC-MS) and internal standard calibration. A total set of 44 VOCs consisting of (cyclo)-alkanes, aromatic compounds, halogenated compounds, oxygenated compounds and terpenes were identified from the six sampling sites. Considering safe sampling volume (SSV) 5 VOCs excluded from the data interpretation. Data were interpreted in terms of total volatile organic compounds(TVOCs) which is the sum of 39 VOCs, individual groups and subgroups of TVOCs. The highest mean of TVOCs was measured in the roadside of the industrial street (mean: 96μg/m3; maximum: around 151μg/m3). The lowest mean of TVOCs was measured in the park of the urban area (mean: 28μg/m3; minimum: around 14μg/m3). Although this work has brought forward new data on VOCs concentrations level on wide range of VOCs, further studies concerning more sites and seasonal variations are recommended.
Keywords: VOC,TVOCs, Active Sampling, Indoor, Outdoor, BTEX, TD-GC-MS.
1. Introduction Poor air quality is one of the most serious environmental problems in different urban areas around the world, especially in developing countries. Bangladesh is a south Asian country with a total population of 156.6 million in 2013 and population density 1203 per sq. km (http://data.worldbank.org) is facing the same problem (Azad and Kitada, 1998). The urban environmental problems in Bangladesh are numerous and inter-related. _____________________
1*Research Associate at Bangladesh Institute of Development Studies and Graduate of Ghent University Belgium, Belgium, Email: [email protected], [email protected] 2 Prof. dr. ir. Herman Van Langenhove, Professor and Department Head, Department of Sustainable Organic Chemistry and Technology, Ghent University, Belgium. 3Post doctorate student, Department of Sustainable Organic Chemistry and Technology, Ghent University, Belgium. 4Doctorate student, Department of Sustainable Organic Chemistry and Technology, Ghent University, Belgium. Research Group, Department of Sustainable Organic Chemistry and Technology, Ghent University, Belgium.
Parvin, Langenhove, Walgraeve & Duc
98
Localized urban areas and along with the major roads, poor vehicle maintenance and enforcement mechanisms, and ineffective regulation of industrial emission were identified as the major causes of air pollution in urbanized Bangladesh (Rab, 2001). According to World Bank (WB) Bangladesh Country Environmental Analysis report (2006), if exposure to urban air pollution(particulate matter) is reduced by 20% to 80%, between 1,200 to 3,500 lives can be saved and 80 to 230 million cases of respiratory diseases can be avoided per annum. In economic terms, this is equivalent to an estimated US$170 to 500 million in savings due to reduced health care costs and increased productivity per annum (WB, Bangladesh Country Environmental Analysis report, 2006). Recent studies of WB (2006) that assess and value the adverse health impacts of exposure to air pollution reveal the magnitude of the costs to society that calls for immediate actions. Thus, air pollution impedes the overall development in the urbanized areas that again impedes to the sustainable development of Bangladesh. Monitoring the air pollution is a very recent phenomenon in Bangladesh. Since April 2002 upto 2007, there was only one Continuous Air Monitoring Station (CAMS) that established during Air Quality Management Project (AQMP) of the Department of Environment (DoE) financed by WB. At present in Bangladesh, real-time measurements of ambient level criteria/common pollutants at 11 CAMS are made at 8 major cities (namely, Dhaka, Narayangonj, Gazipur, Chittagong, Rajshahi, Khulna, Barisal and Sylhet) of Bangladesh by the Clean Air and Sustainable Environment (CASE) project of DoE which is the follow-up of the former project AQMP. Concentration of common ambient air pollutants e.g., carbon monoxide (CO), oxides of nitrogen (NOX), sulfur dioxide (SO2), ozone (O3), PM10 (particulate matter with an aerodynamic diameter less than 10 micrometers) and PM2.5 (particulate matter with an aerodynamic diameter less than 2.5 micrometers) are measured at the CAMS stations and Hydrocarbons (HC) emission are regulated in transportation sector by vehicle emission standards and I/M(in-use vehicle emission inspection and maintenance) program of the CASE project. The data that generated used to define the nature and severity of pollution in the cities; identify pollution trends in the country; and develop air models and emission inventories. The CASE project of the DoE operates air quality monitoring program in Dhaka through 3 CAMS from 2010. Monitoring results of the CAMS have shown that particulate matter is the main pollutant of concern for Dhaka city. The concentration of the key air pollutant of concern (Particulate Matter or PM) in Dhaka and other major cities has been steadily increasing in recent years, with an annual average much higher than the World Health Organization (WHO) guidelines, 2005. Ministry of Environment and Forest (MoEF), Government of People’s Republic of Bangladesh has been adopted the United States Environmental Protection Agency’s (USEPA) National Ambient Air Quality Standards (NAAQS) as an ambient air quality standard for Bangladesh that includes the standards for both PM10 and PM2.5, CO, NOX, SO2, O3 while vehicle emission standards includes the standards for CO, HC/NMHC, SO2, NOX and PM are in line with Euro 2 limits for the light duty vehicles (CNG and gasoline vehicles) and Euro 1 for the heavy duty vehicles (Diesel vehicles) (The Bangladesh Gazette, 2005). From July 2014, separate vehicle emission standards have been implemented for Dhaka and Chittagong to meet more cost effective stringent emission regulations depending on the vehicle type and fuel type use, Euro 3 limits for the light duty vehicles (CNG and gasoline vehicles) and Euro 2 for the heavy duty vehicles (Diesel vehicles)(http://www.case-moef.gov.bd). Dhaka, the capital city, is the center of all administrative, economic and cultural activities. Dhaka is one of the most populated cities of the country. Dhaka has an
Parvin, Langenhove, Walgraeve & Duc
99
estimated population of more than 15 million people, making it the largest city in Bangladesh and the 8th largest city in the world (http://en.wikipedia.org). Population density of Dhaka is 45,000 per sq. km (http://en.wikipedia.org). Among the environmental issues, air quality is one of the burning issues in Bangladesh as well as in urbanized Dhaka as all are interrelated. There are a lot of reports of measured primary pollutants (such as PM) in Dhaka and alarming levels of pollutants at roadside locations (Azad and Kitada, 1998; Karim, 1999; Begum et.al., 2006; Begum et.al., 2011). According to MoEF, there are two major sources of air pollution in Bangladesh, vehicular emissions and industrial emissions (http://www.moef.gov.bd). It has been started that Dhaka city has VOC beyond tolerable limits, some of which cause cancer (http://www.banglapedia.org). It was found that the emissions from two-stroke auto-rickshaws in Dhaka were contained 4 to 7 times the maximum permissible level of VOC (http://www.banglapedia.org). In rural areas, wood, coal, and biomass are used as sources of energy. In rural areas, the principal air contaminants are particulate matter and VOCs (http://www.moef.gov.bd). The measures taken by Government of Bangladesh, the shift from gasoline/diesel fuelled engines to CNG (compressed natural gas), which began in 1999–2000 (Bose and Rahman, 2009 and Iqbal et al., 2011). In Bangladesh, the number of CNG vehicles is currently estimated to be around 200,000 (GVR, 2011) of which about 95% are located in Dhaka and 58.5% of the total vehicles in Dhaka (325,000) are thought to be running on CNG (Jeeranut et al., 2012). Moreover, enforcement of the regulations which prohibit the use of poor condition vehicles that do not pass annual inspections, banning the use of old buses (over 20 years) and trucks (over 25 years), phasing out diesel-run two-stroke three wheeler vehicles (Bose and Rahman, 2009), and introducing environmental friendly brick kiln technologies (Hossain, 2008) is believed to have resulted in a significant decrease of airborne fine particle concentrations during the year 2000–2003 (Begum et al., 2006), while ambient VOCs remained unregulated and are rarely monitored in Bangladesh as well as in Dhaka. There is no existing indoor and ambient air standard for volatile organic compounds (VOCs) such as benzene concentration limit in Bangladesh except vehicle emission standards for HC. Among the different anthropogenic pollutants emitted into the troposphere, VOCs contribute to two of the most serious air quality problems as major precursors for the formation of photochemical smog and ground level ozone. In the presence of VOCs, NOX and sunlight O3 is photochemically produced which is known to be harmful to living organisms as well as a powerful greenhouse gas (Jeeranut et al., 2012). Several VOCs directly affect the health conditions of humans as some VOCs found in urban air are classified as carcinogens (Barletta et al., 2008). Some VOCs such as benzene, toluene, ethylbenzene and xylenes (BTEX) have gained interest in the field of both indoor and outdoor air quality (Cocheo et al., 2000; Borton et al., 2002). There were only 2 published studies on VOCs: 1. Jeeranut et al., 2012. In their paper (Influence of extensive compressed natural gas (CNG) usage on air quality) they report continuous observations of the atmospherically important trace gases O3, CO, SO2, NOx and volatile organic compounds (VOC), in ambient air in Dhaka City, Bangladesh, during May 2011. They took only 2 road sites sample of VOCs and indoor, park, industry and residential sites samples are still missing and 2. Do et al., 2015. In their paper (Airborne volatile organic compounds in urban and industrial locations in four developing countries), they took the result of the master thesis of Barai, K. R. (2012) ‘Analysis of atmospheric VOCs emission in Dhaka city of Bangladesh’. In Barai, K. R. (2012), she took samples from Tajgeon, Farmgate and Mohakhali which are representing again the industrial site than urban site or the sites

Parvin, Langenhove, Walgraeve & Duc
100
have more influences of industrial sources. As there are limited studies on the ambient and indoor air levels of VOCs in the different environments such as industrial and urban areas have been done in Bangladesh. VOCs are expected to be an important environmental and health risk factor for the rapidly industrializing countries (Han and Naeher, 2006). But there is still very lack of knowledge and measurement of indoor and ambient concentration levels of the VOCs. On the other hand, there is no known published data yet to assess the indoor VOCs of residential houses in Bangladesh. Beyond this, proper information on VOC levels for urban and industrial areas in the Bangladesh is still lacking. Dhaka still need to assess the indoor and ambient level of VOCs concentration to reduce the health impact of air pollution, to address the accurate emission control measures and to take effective policy implication to combat further air pollution and improve quality of life. As Volatile organic compounds (VOCs) are of concern both as indoor and outdoor air pollutants for their potential adverse impact on health of people who are exposed and ability to create photochemical smog under certain conditions. Although VOCs are expected to be an important environmental and health risk factor for the rapidly industrializing countries like Bangladesh but there are limited studies on the outdoor and indoor air levels of VOCs in different environments such as industrial and urban areas. The main focus of this study is to determine the presence and concentrations levels of VOCs in outdoor ambient and indoor levels of VOCs, their source profile identification and effect on health due to exposure. The presence and concentrations levels of VOCs are necessary in creating development programs, planning efficient and effective implementing regulations, improving the air quality and increase the awareness about pollution impacts. This study therefore aimed to investigate the levels and nature of VOCs in urban and industrial areas of Dhaka city, Bangladesh as well to provide information that would be useful in environmental and health policy making process in Bangladesh. The scope and objectives of this study is based on the problems are formulated and the information discussed in the introduction and literature review of the study. Considering the high population density, incremental environmental issues, alarming levels of pollutants due to high levels of traffic jam and lack of awareness of environmental impacts it can be said that there is a scope to measure the ambient level of VOCs in relation to different sources is a vital issue. Again to reduce further worsening air quality, provide information on the ambient level of VOCs level of both as primary and secondary pollutants in the capital city Dhaka is necessary for efficient regulations and suitable policy formulation to combat the air pollution. As the presence and concentrations levels of VOCs are necessary in creating development programs, planning efficient and effective implementing regulations, improving the air quality and increase the awareness about pollution impacts and the provided information would be useful in environmental and health policy making process in Bangladesh considering their potential impact on human health and environment, this study therefore aimed to investigate the levels and nature of VOCs in urban and industrial areas of Dhaka city, Bangladesh. The main objective of the research was to investigate the presence and ambient concentration levels of VOCs in both indoor and outdoor environment in urban and industrial areas Dhaka city, Bangladesh. The paper is organized as follows. Section 1 presents Introduction; Section 2 presents the literature review on this issue. Section 3 describes Materials and Methods with the mathematical notation and formulas in such
Parvin, Langenhove, Walgraeve & Duc
101
logistic problem. Section 4 explains the results and discussions. Section 5 presents a general conclusion.
2. Literature Review
2.1 Volatile Organic Compounds As VOCs is a relatively minor component of the atmosphere but yet are widely recognized to have important roles in air quality and climate (Guenther, A., 2012). It is stated as an important greenhouse gas, atmospheric VOCs are primarily of interest because of their impact on other atmospheric constituents, including oxidants and aerosol but with the exception of methane (Guenther, A., 2012). Methane is often considered separately as it is an organic gas and much less reactive than other hydrocarbons in the troposphere (Demeestere et al., 2007; USEPA, 2010). On the other hand, VOCs are as concern both as indoor and outdoor pollutants to USEPA considering the health impacts. The USEPA regulates VOCs outdoors mainly because of their ability to create photochemical smog under certain conditions whereas main concern indoors VOCs is the potential for VOCs to adversely impact the health of people that are exposed (http://www.epa.gov). Because VOCs have become essential ingredients in many products and materials they are usually present in both indoor and outdoor environments (http://www.epa.gov). In indoors VOCs are mostly released into the air from the use of products and materials containing VOCs whereas outdoors, VOCs are volatized or released into the air mostly during manufacture or use of everyday products and materials (http://www.epa.gov). Due to the overwhelming number of compounds, a comprehensive characterization of atmospheric VOC is challenging (Guenther, A., 2012). According to Goldstein and Galbally (2007), tens of thousands of VOC have been measured in the atmosphere and there may be hundreds of thousands more that have not been measured. There are many ways of classifying VOC including source types, chemical characteristics, and atmospheric impacts. Surface-atmosphere exchange behaviour is typically not considered when categorizing VOC (Guenther, A., 2012).
2.2 Definitions The general definition of VOCs is used in the scientific literature which is consistent with the definition used for indoor air quality of the USEPA. According to USEPA in their regulations for indoor air, Volatile organic compounds or VOCs are organic chemical compounds whose composition makes it possible for them to evaporate under normal indoor atmospheric conditions of temperature and pressure. Volatility is indicated by a substance's vapor pressure. As the volatility of a compound is generally higher, the lower its boiling point temperature and that’s why the volatility of organic compounds are sometimes defined and classified by their boiling points. The European Union uses the boiling point, rather than its volatility in its definition of VOCs. According to the EU Paint Directive, 2004/42/EC (EU, 2004), defines VOC as an organic compound having an initial boiling point lower than or equal to 250 °C at an atmospheric pressure of 101.3kPa. Similarly, the European Eco-Labelling scheme (2002/739/EC amending 1999/10/EC) for paints and varnishes defines a VOC as an organic compound with a boiling point (or initial boiling point) lower than or equal to 250ºC.
Parvin, Langenhove, Walgraeve & Duc
102
2.3 Sources The emission sources of VOCs can be divided into two main source such as natural and anthropogenic emission sources (Kansal, 2009; Talapatra and Srivastava, 2011; Sahu, 2012). The anthropogenic sources can be subdivided into two such as stationary sources and mobile sources (Talapatra and Srivastava, 2011). 2.3.1 Natural Sources The natural sources of atmospheric VOCs include emissions from vegetation, specifically rural forested areas, oceans, marine phytoplankton’s, soil microbiota and geological hydrocarbon reservoirs (Stavrakou et al., 2009; Sahu, 2012). It is found that on the global scale, vegetation is the dominant source among the natural sources; natural emissions of nonmethane hydrocarbons (NMHCs) and VOCs exceed anthropogenic emissions (Talapatra and Srivastava, 2011). 2.3.2 Anthropogenic Sources It is found that anthropogenic sources of VOCs usually dominate in urban areas (Kansal, 2009). Ambient anthropogenic sources of VOCs mainly include mobile sources emissions (transport sector), and stationary sources (industrial solvent use, production and storage processes, combustion processes). Vehicle emissions is often the main source of VOCs in urban areas (Theloke and Friedrich, 2007; Huang et al., 2011; Talapatra and Srivastava, 2011). 2.3.2.1 Stationary Sources Stationary anthropogenic sources of VOCs are grouped into several categories which include energy production, industries, solvent evaporation, waste treatment and disposal and agriculture and food industries and among them, use of organic solvents is the most important (Van Langenhove, 2010). Industrial zones can be a significant source of stationary VOCs as it involves emissions from all these categories. For instance, high concentrations of BTEX were observed at many industrial locations (Tiwari et al., 2010). Emission of VOCs from dye industry (Jo et al., 2004), petroleum refinery (Lin et al., 2004) and printing industry (Leung et al., 2005) have been published. Industrial process also cited as important industrial sources of VOCs after industrial combustion for example polymer industry, rendering industry and pulp and paper industry (Van Langenhove, 2010). 2.3.2.2 Mobile Sources It is found that the largest anthropogenic source of organic gases including NMHCs and VOCs related to emission from mobile source (Kansal, 2009). Whereas according to Do et. al. (2013), the most common source of emission is considered from vehicle exhaust. Among the exhaust VOCs, approximately half of the mass emitted is unburned fuel (Caplain et al., 2006). Traffic related VOCs include alkanes, alkenes, alkynes and aromatic hydrocarbons. Among traffic related VOCs, aromatic compounds, including BTEX, have public health importance and are of great concern because of their relative abundance (Han and Naeher, 2006; Buczynska et al., 2009). Vehicular VOC emission depends on a variety of factors. For instance, composition of exhaust was also found to be dependent on the type of vehicle and use of catalytic
Parvin, Langenhove, Walgraeve & Duc
103
converters (Verma and des Tombe, 2002). Light alkanes and alkenes were reported to constitute the highest proportions of VOCs from catalyst-equipped, gasoline-driven passenger cars (Stemmler et al., 2005; Lai and Peng, 2012). The BTEX level in exhaust was also reported to decrease for all vehicles fuelled with methanol/gasoline blends but increase in formaldehyde levels was also noted (Zhao et al., 2011). On the other hand, vehicles using unleaded fuels without catalytic converters were observed to generate more VOCs (Wang and Zhao, 2008). The influence of the type of fuel and fuel composition was also reported (Watson, et al., 2001). Chemical composition and magnitude of vehicle exhaust emissions was shown to be directly related to the gasoline composition used (Schuetzle et al., 1994). Decrease of aromatic compounds in vehicle exhaust was reported by shifting from Euro 1 to Euro 3 fuel standards (Caplain et al., 2006). 2.3.2.3 Indoor Sources According to Logue et al. (2011), the meta-analysis of 77 surveys of VOCs in homes in the US found the top ten riskiest indoor air VOCs were acrolein, formaldehyde, benzene, hexachlorobutadiene, acetaldehyde, 1,3-butadiene, benzyl chloride, 1,4-dichlorobenzene, carbon tetrachloride, acrylonitrile, and vinyl chloride. These compounds in most homes exceeded health standards (Logue et al., 2011). Human activities such as cooking and smoking also contribute to indoor VOCs (Talapatra and Srivastava, 2011). Other contributors had been cited which includes, solid fuel combustion (Duricova et al., 2010), emissions following house renovations (Herbarth and Matysik, 2010), poor ventilation (Dimitroulopoulou, 2012) and insecticide application (Bukowski and Meyer, 1995; Pentamwa et al., 2011). Outdoor sources (e.g. industrial emissions, exhaust from vehicles) also contribute to indoor VOCs (Adgate et al., 2004; Talapatra and Srivastava, 2011). In indoor, the main sources of VOCs are building materials, furnishings, cleaning products, dry cleaning agents, paints, varnishes, waxes, solvents, glues, aerosol propellants, refrigerants, fungicides, germicides, cosmetics and textiles, appliances, air fresheners and clothing (Weschler, 2009; Sarigiannis et al., 2011; Talapatra and Srivastava 2011). Attention to ambient and indoor VOCs has been increased ever since with the growing concern for quality life in safe and clean environment (Kumar and Víden, 2007).
2.4 Effects of VOCs Airborne VOCs deserve special attention mainly because of the growing awareness of the impact of VOCs on both human health and global environment (Demeestere et al., 2007; Do et al., 2013). VOCs play a vital role in a number related issues such as (i) pose potential risks to human health as some VOCs are toxic (ii) halogenated VOCs can deplete O3 in the stratosphere (iii) global-scale increase in VOCs can also induce greenhouse effects and (iv) they can serve as precursors of ground-level photochemical formation of O3 (Demeestere et al., 2007; Goldstein and Galbally, 2007; Sahu, 2012). 2.4.1 Health Effects The health effects of VOCs can be considered both direct and indirect. The direct health effects such as benzene can cause cancer in humans and the key symptoms associated with exposure to VOCs include conjunctival irritation, nose and throat discomfort, headache, allergic skin reaction, dyspnoea, declines in serum
Parvin, Langenhove, Walgraeve & Duc
104
cholinesterase levels, nausea, emesis, epistaxis, fatigue, and dizziness (IARC, 2013; USEPA, 2013). Human exposure to benzene can have acute and long-term adverse health effects and diseases such as cancer; it can have also toxic effects on the blood and marrow (Lan et al., 2004). The threshold limit for benzene according to the EU Directive/2008/50 ambient benzene concentration is 5µg/m3 and according to the Flemish indoor quality guidelines 2007, benzene concentration is 2µg/m3. Benzene is classified as Group 1 that means carcinogenic to human (IARC, 2013). General guideline of the concentrations of airborne benzene associated with an excess lifetime risk of leukaemia of 10-4 for 17µg/m3, 10-5 for 1.7µg/m3 and 10-6 for 0.17µg/m3 (WHO, 2010). Indirect impacts via photochemical ozone formation which is also associated with health risks (Choi et al., 2011). 2.4.2 Environmental Effects Among the major environmental problems such as global warming, stratospheric ozone depletion, tropospheric ozone formation by photochemical smog and to the enforcement of the greenhouse effect, VOCs has considerable contribution (Demeestere et al., 2007, Theloke and Friedrich, 2007). 2.4.2.1 Stratospheric Ozone Depletion In the stratosphere there is limited number of VOCs. The VOCs that contribute to ozone depletion are termed ozone depleting substances (ODS) which include many chlorinated solvents and refrigerants, and bromine-containing fire retardants and fire extinguishers (Van Langenhove, 2010). The stratospheric photolysis of VOCs containing chlorine or bromine substituent leads to the release of active radicals that destroy ozone. 2.4.2.2 Tropospheric Ozone Formation Tropospheric ozone and other secondary pollutants are formed during the oxidation of reactive VOCs in the presence of NOx and intense UV radiation (Grant et al., 2008; Mao et al., 2010; Van Langenhove, 2010; Butler et al., 2011). Photochemical ozone formation depends on the relative abundances of both VOCs and NOx (Elshorbany et al., 2009). VOCs and nitrogen oxides (NOx) combine photochemically to produce tropospheric ozone (Goldstein and Galbally, 2007; Carla et al., 2014). 2.4.2.3 Global Warming Through Greenhouse Effect The Intergovernmental Panel on Climate Change (IPCC) called Tropospheric ozone is as "third greenhouse gas" due to the relative large effect (Akimoto et al., 2006). For example, Stevenson et al. (2000) presented a range of estimates for future radioactive forcing due to changes in tropospheric ozone in relation with climate change. The behaviour of ozone in the urban atmosphere in relation with VOCs and NOx is very complex (Sadanaga et al., 2008).
Parvin, Langenhove, Walgraeve & Duc
105
3. Materials and Methods
3.1 Sample Preparation 3.1.1 Tenax TA Tube Description Marks International Limited stainless steel sorbent tubes are suitable across a wide range of compound types and atmospheric concentrations for the majority of VOC air monitoring applications (Markes International Limited, 2014). Markes International Limited stainless steel sorbent tubes (Tenax TA) were used to sample ambient air by pump. According to Markes International Limited, the Tenax TA tube can be recycled about 100 times. 3.1.2 Conditioning of Tenax TA Tubes On 24 June 2013, a total 42 Tenax tubes were conditioned for 1h using a continuous flow of 22-34mL/ min of pure helium (He) gas at elevated temperature of 300°C in an oven to clean the tubes and remove all residuals. Helium gas (less than 1ppm of oxygen) was used because oxygen can be detrimental to the adsorbent (SIS, 2014). Maximum nine and minimum six desorption tubes were conditioned during one run. During conditioning the tubes were attached to the oven with heat resistant black ferrules. After conditioning, the tubes were warped with aluminium foil and stored them in desiccator. 3.1.3 Preparation of Closed Two-Phase System (CTS) On 24 June 2013, Gaseous standards were prepared by preparing a closed two-phase system (CTS). In CTS a stock solution containing 223.68ng/μL of 2H8Toluene (Tol-d8) was used that was prepared on 07 December 2011 by dissolving 24μL of Tol-d8
(Figure 3.1) in 100mL methanol (MeOH). The stock solution was stored in the dark at temperature of -18°C. The stock solution was kept half an hour at room temperature before use. To prepare the CTS 20μL of stock solution was added to 20mL of deionized water present in 119.8mL glass bottle. The bottle was gas tightly sealed with a minimart valve and wrapped into aluminium foil. The CTS was incubated in a thermostatic water bath at 25.01 ± 0.2°C for at least 12h. 3.1.4 Loading with Internal Standard (Tol-d8) On 25 June 2013, all tubes were loaded with Tol-d8. At first 0.5mL of headspace was taken from the CTS with 0.5mL gastight pressure-Lock VICI precision analytical syringe. Then the desired volume was loaded on to the sorbent tubes through a homemade heated (150°C) injection system flushed with He flow rate of 100mL/min (Figure 3.3). Finally, the He stream was held on for 3 minutes before the tubes were sealed with .inch brass long-term storage end caps, equipped with inch one – piece PTFE ferrules.
Parvin, Langenhove, Walgraeve & Duc
106
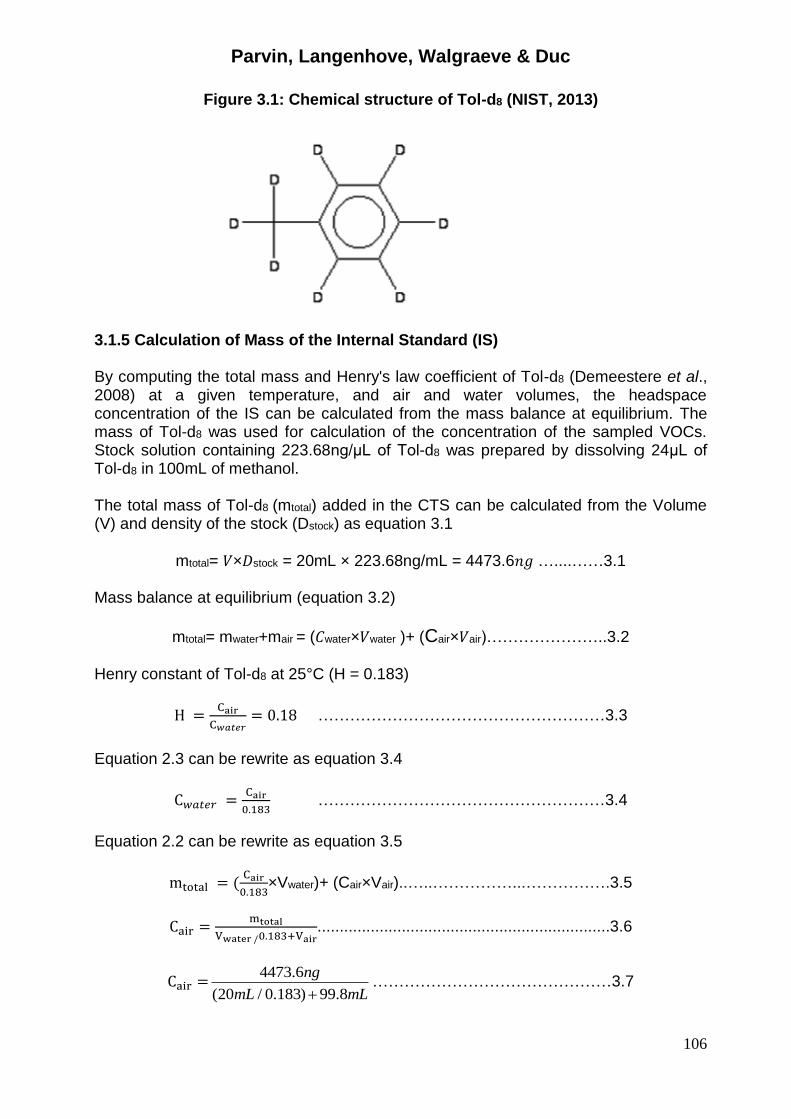
Figure 3.1: Chemical structure of Tol-d8 (NIST, 2013)
3.1.5 Calculation of Mass of the Internal Standard (IS) By computing the total mass and Henry's law coefficient of Tol-d8 (Demeestere et al., 2008) at a given temperature, and air and water volumes, the headspace concentration of the IS can be calculated from the mass balance at equilibrium. The mass of Tol-d8 was used for calculation of the concentration of the sampled VOCs. Stock solution containing 223.68ng/μL of Tol-d8 was prepared by dissolving 24μL of Tol-d8 in 100mL of methanol. The total mass of Tol-d8 (mtotal) added in the CTS can be calculated from the Volume (V) and density of the stock (Dstock) as equation 3.1
mtotal= 𝑉×𝐷stock = 20mL × 223.68ng/mL = 4473.6𝑛𝑔 …....……3.1 Mass balance at equilibrium (equation 3.2)
mtotal= mwater+mair = (𝐶water×𝑉water )+ (Cair×𝑉air)…………………..3.2
Henry constant of Tol-d8 at 25°C (H = 0.183)
H =Cair
C𝑤𝑎𝑡𝑒𝑟= 0.18 ………………………………………………3.3
Equation 2.3 can be rewrite as equation 3.4
C𝑤𝑎𝑡𝑒𝑟 =Cair
0.183 ………………………………………………3.4
Equation 2.2 can be rewrite as equation 3.5
mtotal = (Cair
0.183×Vwater)+ (Cair×Vair)..…..……………...…………….3.5
Cair =mtotal
Vwater /0.183+Vair..................................................................3.6
Cair =4473.6
(20 / 0.183) 99.8
ng
mL mL………………………………………3.7
Parvin, Langenhove, Walgraeve & Duc
107
Where Vwater = 20mL Vair = 99.8mL Cair = 21.4ng/mL
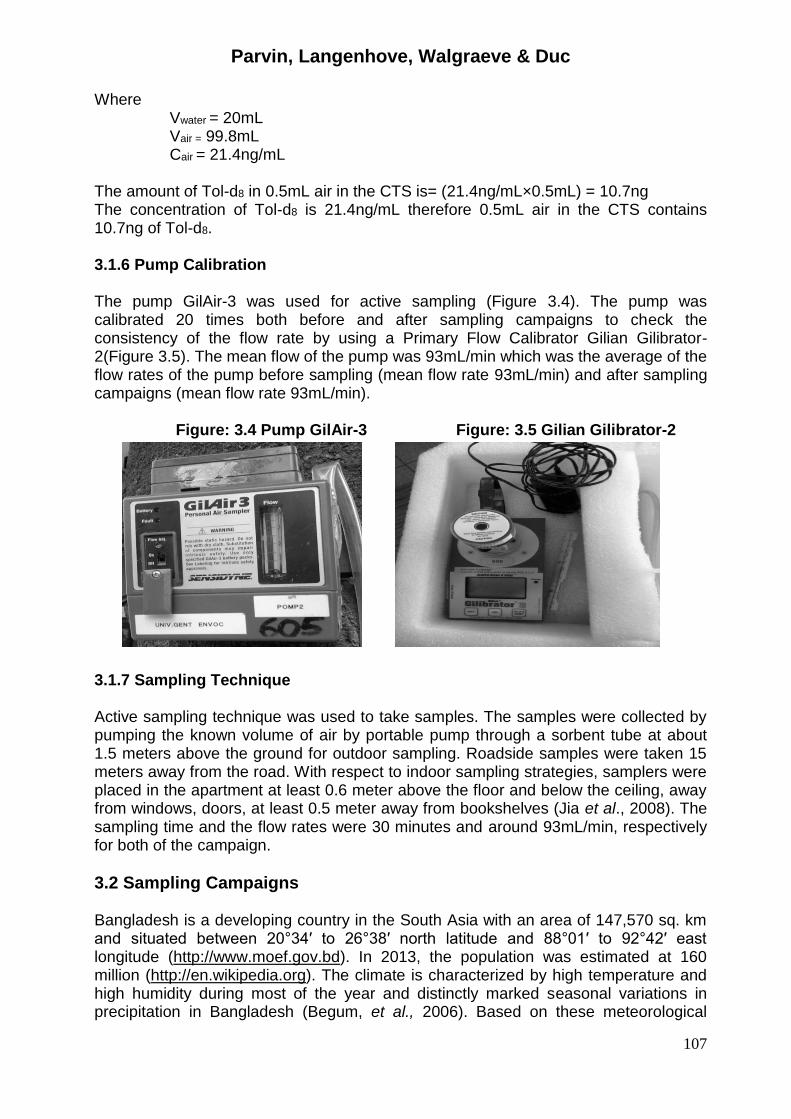
The amount of Tol-d8 in 0.5mL air in the CTS is= (21.4ng/mL×0.5mL) = 10.7ng The concentration of Tol-d8 is 21.4ng/mL therefore 0.5mL air in the CTS contains 10.7ng of Tol-d8. 3.1.6 Pump Calibration The pump GilAir-3 was used for active sampling (Figure 3.4). The pump was calibrated 20 times both before and after sampling campaigns to check the consistency of the flow rate by using a Primary Flow Calibrator Gilian Gilibrator-2(Figure 3.5). The mean flow of the pump was 93mL/min which was the average of the flow rates of the pump before sampling (mean flow rate 93mL/min) and after sampling campaigns (mean flow rate 93mL/min). Figure: 3.4 Pump GilAir-3 Figure: 3.5 Gilian Gilibrator-2
3.1.7 Sampling Technique Active sampling technique was used to take samples. The samples were collected by pumping the known volume of air by portable pump through a sorbent tube at about 1.5 meters above the ground for outdoor sampling. Roadside samples were taken 15 meters away from the road. With respect to indoor sampling strategies, samplers were placed in the apartment at least 0.6 meter above the floor and below the ceiling, away from windows, doors, at least 0.5 meter away from bookshelves (Jia et al., 2008). The sampling time and the flow rates were 30 minutes and around 93mL/min, respectively for both of the campaign.
3.2 Sampling Campaigns Bangladesh is a developing country in the South Asia with an area of 147,570 sq. km and situated between 20°34′ to 26°38′ north latitude and 88°01′ to 92°42′ east longitude (http://www.moef.gov.bd). In 2013, the population was estimated at 160 million (http://en.wikipedia.org). The climate is characterized by high temperature and high humidity during most of the year and distinctly marked seasonal variations in precipitation in Bangladesh (Begum, et al., 2006). Based on these meteorological

Parvin, Langenhove, Walgraeve & Duc
108
conditions according to Salam et al., 2003, the year can be divided into four seasons, pre-monsoon (March–May), monsoon (June–September), post-monsoon (October–November) and winter (December–February).The capital of Bangladesh is Dhaka (Figure 3.6). Dhaka has an estimated population of more than 15 million people, making it the largest city in Bangladesh and the 8th largest city in the world(http://en.wikipedia.org). Population density of Dhaka is 45,000/km2 (http://en.wikipedia.org). Dhaka is located in central of Bangladesh at 23°42′0″N and 90°22′30″E (http://en.wikipedia.org). The city lies on the lower reaches of the Ganges Delta and covers a total area of 360 square kilometres (140 sq. mile).
Figure 3.6: Location of Campaign Sites in Dhaka, Bangladesh: (1) Urban Area;
(2) Industrial Area.
Source: https://maps.google.com
Two sampling campaigns were carried out in Dhaka city. One sample campaigns was for urban area and the other one for industrial area of Dhaka city for determination of ambient VOCs levels. Mirpur area was selected as urban area and Tejgaon Area was selected for industrial area for sampling (Figure 3.6). Each sampling campaign has 3 locations both indoor and outdoor. Therefore, six locations were selected in two areas (urban and industrial area) for sampling campaigns from 30 of August 2013 to 11 September 2013(Figure 3.7). The sampling period of Dhaka was under monsoon influence and clean marine air mass are known to govern the area blowing from the south-west between May and September and bringing rain (the wet monsoon). During the whole sampling period the temperature was ranged between 28.1°C to 33.3°C and humidity ranged between 92.1% to more than 100%. Sample were taken each day two times-morning and evening (7.00 am to 11.00 am and 4.30 to 8.30 pm) for three days- one weekend and two weekdays for each campaign. Overview of the sampling
Parvin, Langenhove, Walgraeve & Duc
109
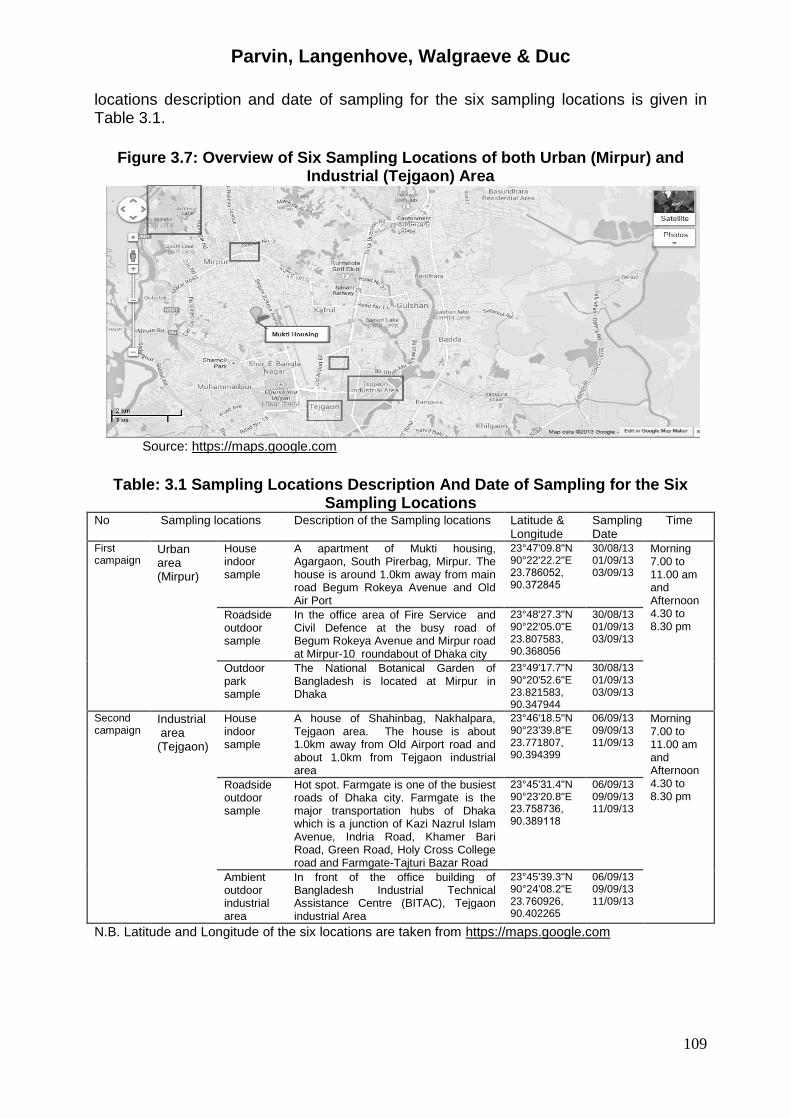
locations description and date of sampling for the six sampling locations is given in Table 3.1.
Figure 3.7: Overview of Six Sampling Locations of both Urban (Mirpur) and
Industrial (Tejgaon) Area
Source: https://maps.google.com
Table: 3.1 Sampling Locations Description And Date of Sampling for the Six
Sampling Locations No Sampling locations Description of the Sampling locations Latitude &
Longitude Sampling Date
Time
First campaign
Urban area (Mirpur)
House indoor sample
A apartment of Mukti housing, Agargaon, South Pirerbag, Mirpur. The house is around 1.0km away from main road Begum Rokeya Avenue and Old Air Port
23°47'09.8"N 90°22'22.2"E 23.786052, 90.372845
30/08/13 01/09/13 03/09/13
Morning 7.00 to 11.00 am and Afternoon 4.30 to 8.30 pm
Roadside outdoor sample
In the office area of Fire Service and Civil Defence at the busy road of Begum Rokeya Avenue and Mirpur road at Mirpur-10 roundabout of Dhaka city
23°48'27.3"N 90°22'05.0"E 23.807583, 90.368056
30/08/13 01/09/13 03/09/13
Outdoor park sample
The National Botanical Garden of Bangladesh is located at Mirpur in Dhaka
23°49'17.7"N 90°20'52.6"E 23.821583, 90.347944
30/08/13 01/09/13 03/09/13
Second campaign
Industrial area (Tejgaon)
House indoor sample
A house of Shahinbag, Nakhalpara, Tejgaon area. The house is about 1.0km away from Old Airport road and about 1.0km from Tejgaon industrial area
23°46'18.5"N 90°23'39.8"E 23.771807, 90.394399
06/09/13 09/09/13 11/09/13
Morning 7.00 to 11.00 am and Afternoon 4.30 to 8.30 pm
Roadside outdoor sample
Hot spot. Farmgate is one of the busiest roads of Dhaka city. Farmgate is the major transportation hubs of Dhaka which is a junction of Kazi Nazrul Islam Avenue, Indria Road, Khamer Bari Road, Green Road, Holy Cross College road and Farmgate-Tajturi Bazar Road
23°45'31.4"N 90°23'20.8"E 23.758736, 90.389118
06/09/13 09/09/13 11/09/13
Ambient outdoor industrial area
In front of the office building of Bangladesh Industrial Technical Assistance Centre (BITAC), Tejgaon industrial Area
23°45'39.3"N 90°24'08.2"E 23.760926, 90.402265
06/09/13 09/09/13 11/09/13
N.B. Latitude and Longitude of the six locations are taken from https://maps.google.com
Parvin, Langenhove, Walgraeve & Duc
110
3.3 Sample Analysis 3.3.1 Loading of Calibration Mixture The 4 Tenax TA conditioned tubes were loaded with mixture (Target VOCs + Tol-d8) 2 USEPA and 2 EnVOC stock solution precision analytical syringe. The desired volume was loaded on to the sorbent tubes through a homemade heated (150°C) injection system flushed with He flow rate of 96 mL/min. The He stream was held on for 3 minute before the tubes were sealed with inch brass long-term storage end caps equipped with inch one –piece PTFE ferrules. 3.3.2 Calibration of the TD-GC-MS The thermal desorption-gas chromatography-mass spectrometry(TD-GC-MS) calibration was carried out in the EnVOC lab on 26 September 2013 and 7 February 2014. Two mixtures were used for the calibration of the TD-GC-MS. The first mixture was EPA 502/524 Volatiles Organic Calibration Mix A (without gases) 200μg/mL each component in 1mL methanol, analytical standard (www.sigmaaldrich.com) containing 53VOCs. The first mixture were volumetrically taken by a micropipette and dissolved and further diluted in methanol (LC–MS grade, 99.95%, Biosolve, Valkenswaard, The Netherlands) to obtain final concentrations of 50ng/µL for each individual target compound for each VOC in Mix A (Tol-d8 in MixA: 69.9ng/μL). The second mixture (Mix B) containing 31 target VOCs was prepared in the same way as documented in the previous study (Do et al., 2013). The final concentrations in this case range from 32.7 to 54.4ng/μL for the target VOCs (Tol-d8 in MixB: 46.6ng/μL). Target compounds were purchased having a purity of at least 99.8%. [2H8]Toluene (Tol-d8; 99.5+ atom%D; Acros Organics, Geel, Belgium) was used as an internal standard. 3.3.3 Analysis of Tenax TA Sampling Tubes After sampling on 26, 27 and 30 September 2013 all the Tenax TA tubes used for the sampling were analysed by using TD-GC-MS system using the method described by Do et al. (2013). In full scan mode masses from m/z 29 to 300 were recorded (200 ms per scan) on a Trace DSQ Quadrupole MS (Thermo Finnigan, Austin, TX, USA), hyphenated to the GC, and operating at an electron impact energy of 70eV. Chromatograms and mass spectra were processed using X-calibur software (Thermo Finnigan, version 1.4). For quantification, data were processed in both by Selective ion monitoring (SIM) and Total ion current (TIC) mode of chromatogram. Identification of the VOCs were based on (i) their fragmentation patterns and by comparison of their mass spectra with the US National Institute of Science and Technology (NIST, Gaithersburg, MD, USA) V2.0 database [NIST/US Environmental Protection Agency (EPA)/US National Institutes of Health (NIH) Mass Spectral Library], and (ii) comparison of their retention time with the standards. Therefore, identification of the VOCs were based on chromatogram, mass spectrum, both TIC and SIM mode, Standard Calibration and Library using X-calibur. 3.3.4 Determination of RSRF In the gas chromatography, the signal output per unit of mass of a substance injected is defined as the sample response factor (SRF) and can be calculated using the equation 3.8.
Parvin, Langenhove, Walgraeve & Duc
111
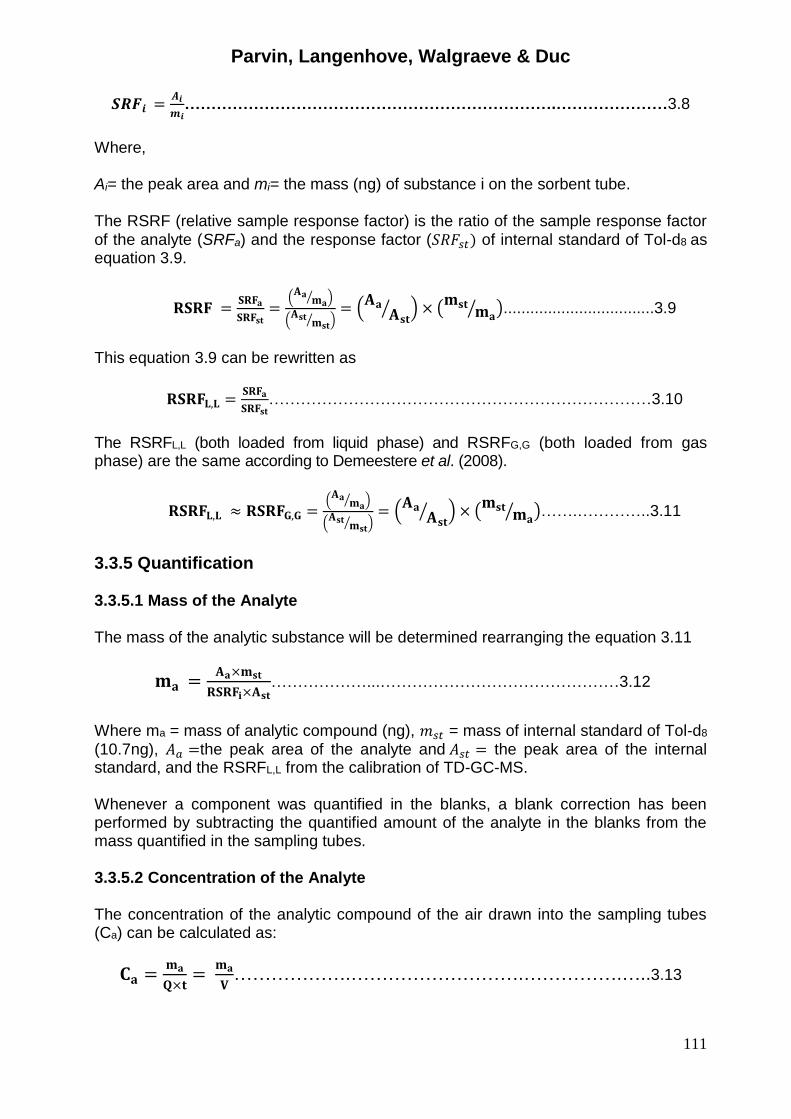
𝑺𝑹𝑭𝒊 =𝑨𝒊
𝒎𝒊…………………………………………………………….…………………3.8
Where, Ai= the peak area and mi= the mass (ng) of substance i on the sorbent tube. The RSRF (relative sample response factor) is the ratio of the sample response factor of the analyte (SRFa) and the response factor (𝑆𝑅𝐹𝑠𝑡) of internal standard of Tol-d8 as equation 3.9.
𝐑𝐒𝐑𝐅 =𝐒𝐑𝐅𝐚
𝐒𝐑𝐅𝐬𝐭=
(𝐀𝐚
𝐦𝐚⁄ )
(𝐀𝐬𝐭
𝐦𝐬𝐭⁄ )
= (𝐀𝐚
𝐀𝐬𝐭⁄ ) × (
𝐦𝐬𝐭𝐦𝐚
⁄ )..................................3.9
This equation 3.9 can be rewritten as
𝐑𝐒𝐑𝐅𝐋,𝐋 =𝐒𝐑𝐅𝐚
𝐒𝐑𝐅𝐬𝐭………………………………………………………………3.10
The RSRFL,L (both loaded from liquid phase) and RSRFG,G (both loaded from gas phase) are the same according to Demeestere et al. (2008).
𝐑𝐒𝐑𝐅𝐋,𝐋 ≈ 𝐑𝐒𝐑𝐅𝐆,𝐆 =(
𝐀𝐚𝐦𝐚
⁄ )
(𝐀𝐬𝐭
𝐦𝐬𝐭⁄ )
= (𝐀𝐚
𝐀𝐬𝐭⁄ ) × (
𝐦𝐬𝐭𝐦𝐚
⁄ )…….…………..3.11
3.3.5 Quantification
3.3.5.1 Mass of the Analyte The mass of the analytic substance will be determined rearranging the equation 3.11
𝐦𝐚 =𝐀𝐚×𝐦𝐬𝐭
𝐑𝐒𝐑𝐅𝐢×𝐀𝐬𝐭………………...………………………………………3.12
Where ma = mass of analytic compound (ng), 𝑚𝑠𝑡 = mass of internal standard of Tol-d8 (10.7ng), 𝐴𝑎 =the peak area of the analyte and 𝐴𝑠𝑡 = the peak area of the internal standard, and the RSRFL,L from the calibration of TD-GC-MS. Whenever a component was quantified in the blanks, a blank correction has been performed by subtracting the quantified amount of the analyte in the blanks from the mass quantified in the sampling tubes. 3.3.5.2 Concentration of the Analyte The concentration of the analytic compound of the air drawn into the sampling tubes (Ca) can be calculated as:
𝐂𝐚 =𝐦𝐚
𝐐×𝐭=
𝐦𝐚
𝐕……………….……………………….…………….…..3.13
Parvin, Langenhove, Walgraeve & Duc
112
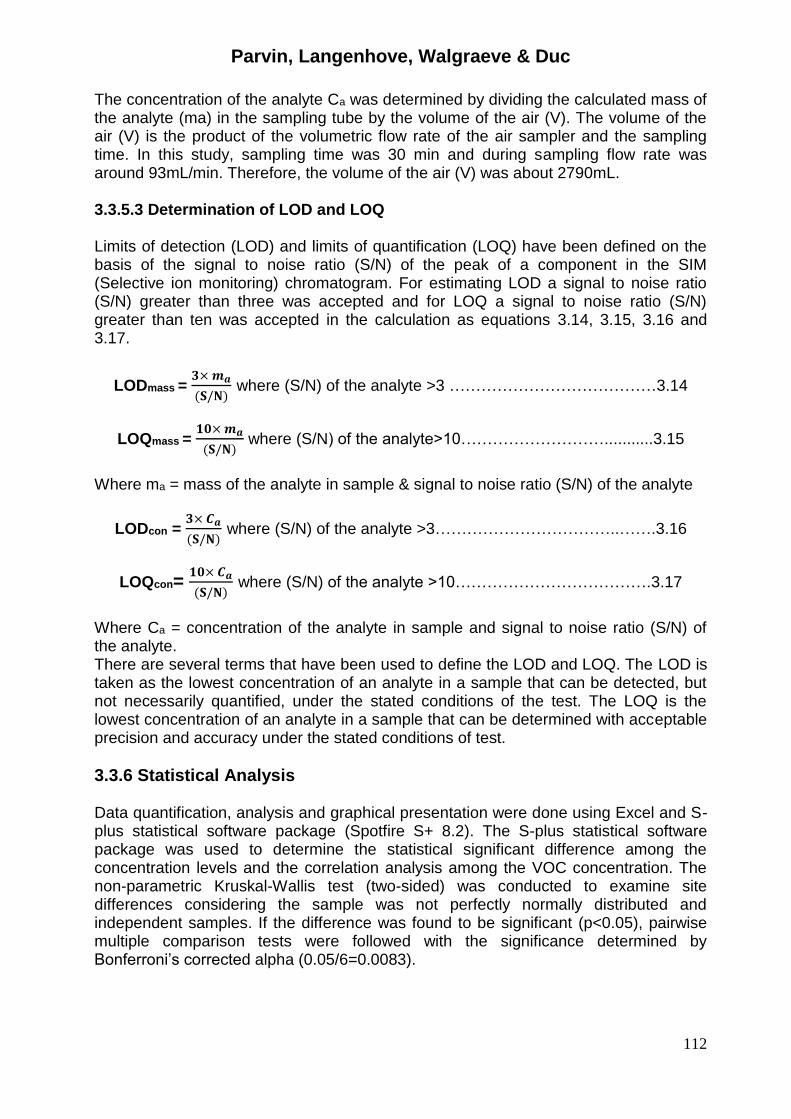
The concentration of the analyte Ca was determined by dividing the calculated mass of the analyte (ma) in the sampling tube by the volume of the air (V). The volume of the air (V) is the product of the volumetric flow rate of the air sampler and the sampling time. In this study, sampling time was 30 min and during sampling flow rate was around 93mL/min. Therefore, the volume of the air (V) was about 2790mL. 3.3.5.3 Determination of LOD and LOQ Limits of detection (LOD) and limits of quantification (LOQ) have been defined on the basis of the signal to noise ratio (S/N) of the peak of a component in the SIM (Selective ion monitoring) chromatogram. For estimating LOD a signal to noise ratio (S/N) greater than three was accepted and for LOQ a signal to noise ratio (S/N) greater than ten was accepted in the calculation as equations 3.14, 3.15, 3.16 and 3.17.
LODmass = 𝟑× 𝒎𝒂
(𝐒/𝐍) where (S/N) of the analyte >3 …………………………………3.14
LOQmass = 𝟏𝟎× 𝒎𝒂
(𝐒/𝐍) where (S/N) of the analyte>10………………………...........3.15
Where ma = mass of the analyte in sample & signal to noise ratio (S/N) of the analyte
LODcon = 𝟑× 𝑪𝒂
(𝐒/𝐍) where (S/N) of the analyte >3……………………………..…….3.16
LOQcon= 𝟏𝟎× 𝑪𝒂
(𝐒/𝐍) where (S/N) of the analyte >10……………………………….3.17
Where Ca = concentration of the analyte in sample and signal to noise ratio (S/N) of the analyte. There are several terms that have been used to define the LOD and LOQ. The LOD is taken as the lowest concentration of an analyte in a sample that can be detected, but not necessarily quantified, under the stated conditions of the test. The LOQ is the lowest concentration of an analyte in a sample that can be determined with acceptable precision and accuracy under the stated conditions of test.
3.3.6 Statistical Analysis Data quantification, analysis and graphical presentation were done using Excel and S-plus statistical software package (Spotfire S+ 8.2). The S-plus statistical software package was used to determine the statistical significant difference among the concentration levels and the correlation analysis among the VOC concentration. The non-parametric Kruskal-Wallis test (two-sided) was conducted to examine site differences considering the sample was not perfectly normally distributed and independent samples. If the difference was found to be significant (p<0.05), pairwise multiple comparison tests were followed with the significance determined by Bonferroni’s corrected alpha (0.05/6=0.0083).
Parvin, Langenhove, Walgraeve & Duc
113
4. Results and Discussions In this chapter, the results of the VOCs identification and quantification analysis are presented. Data are interpreted, presented, discussed and compared in terms of Total Volatile Organic Compounds (TVOCs), subgroup of TVOCs.
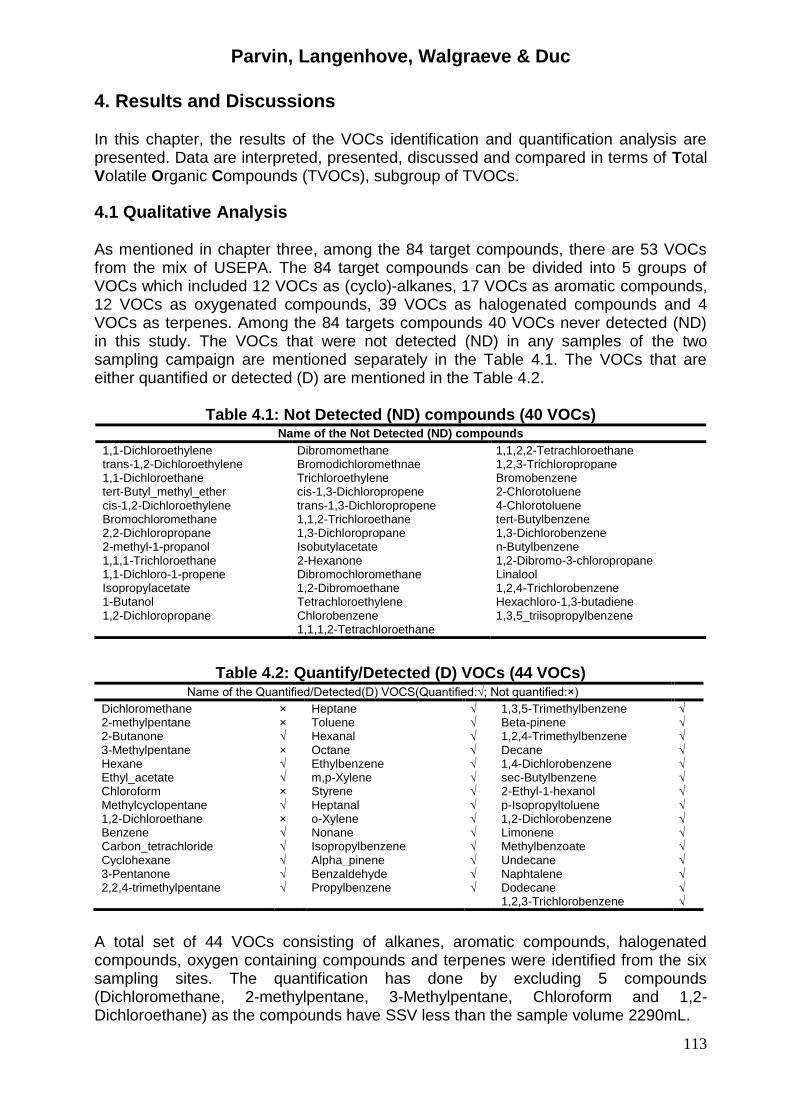
4.1 Qualitative Analysis As mentioned in chapter three, among the 84 target compounds, there are 53 VOCs from the mix of USEPA. The 84 target compounds can be divided into 5 groups of VOCs which included 12 VOCs as (cyclo)-alkanes, 17 VOCs as aromatic compounds, 12 VOCs as oxygenated compounds, 39 VOCs as halogenated compounds and 4 VOCs as terpenes. Among the 84 targets compounds 40 VOCs never detected (ND) in this study. The VOCs that were not detected (ND) in any samples of the two sampling campaign are mentioned separately in the Table 4.1. The VOCs that are either quantified or detected (D) are mentioned in the Table 4.2.
Table 4.1: Not Detected (ND) compounds (40 VOCs) Name of the Not Detected (ND) compounds
1,1-Dichloroethylene Dibromomethane 1,1,2,2-Tetrachloroethane trans-1,2-Dichloroethylene Bromodichloromethnae 1,2,3-Trichloropropane 1,1-Dichloroethane Trichloroethylene Bromobenzene tert-Butyl_methyl_ether cis-1,3-Dichloropropene 2-Chlorotoluene cis-1,2-Dichloroethylene trans-1,3-Dichloropropene 4-Chlorotoluene Bromochloromethane 1,1,2-Trichloroethane tert-Butylbenzene 2,2-Dichloropropane 1,3-Dichloropropane 1,3-Dichlorobenzene 2-methyl-1-propanol Isobutylacetate n-Butylbenzene 1,1,1-Trichloroethane 2-Hexanone 1,2-Dibromo-3-chloropropane 1,1-Dichloro-1-propene Dibromochloromethane Linalool Isopropylacetate 1,2-Dibromoethane 1,2,4-Trichlorobenzene 1-Butanol Tetrachloroethylene Hexachloro-1,3-butadiene 1,2-Dichloropropane Chlorobenzene 1,3,5_triisopropylbenzene 1,1,1,2-Tetrachloroethane
Table 4.2: Quantify/Detected (D) VOCs (44 VOCs)
Name of the Quantified/Detected(D) VOCS(Quantified:√; Not quantified:×)
Dichloromethane × Heptane √ 1,3,5-Trimethylbenzene √ 2-methylpentane × Toluene √ Beta-pinene √ 2-Butanone √ Hexanal √ 1,2,4-Trimethylbenzene √ 3-Methylpentane × Octane √ Decane √ Hexane √ Ethylbenzene √ 1,4-Dichlorobenzene √ Ethyl_acetate √ m,p-Xylene √ sec-Butylbenzene √ Chloroform × Styrene √ 2-Ethyl-1-hexanol √ Methylcyclopentane √ Heptanal √ p-Isopropyltoluene √ 1,2-Dichloroethane × o-Xylene √ 1,2-Dichlorobenzene √ Benzene √ Nonane √ Limonene √ Carbon_tetrachloride √ Isopropylbenzene √ Methylbenzoate √ Cyclohexane √ Alpha_pinene √ Undecane √ 3-Pentanone √ Benzaldehyde √ Naphtalene √ 2,2,4-trimethylpentane √ Propylbenzene √ Dodecane √ 1,2,3-Trichlorobenzene √
A total set of 44 VOCs consisting of alkanes, aromatic compounds, halogenated compounds, oxygen containing compounds and terpenes were identified from the six sampling sites. The quantification has done by excluding 5 compounds (Dichloromethane, 2-methylpentane, 3-Methylpentane, Chloroform and 1,2-Dichloroethane) as the compounds have SSV less than the sample volume 2290mL.
Parvin, Langenhove, Walgraeve & Duc
114
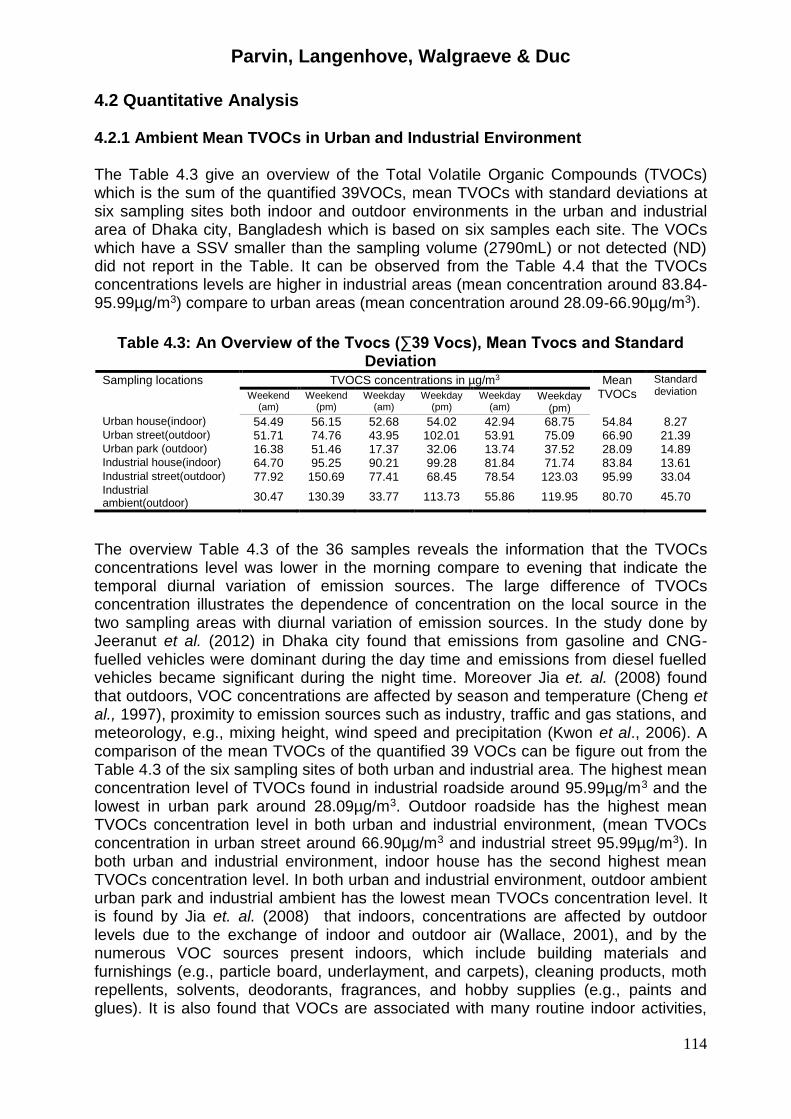
4.2 Quantitative Analysis 4.2.1 Ambient Mean TVOCs in Urban and Industrial Environment The Table 4.3 give an overview of the Total Volatile Organic Compounds (TVOCs) which is the sum of the quantified 39VOCs, mean TVOCs with standard deviations at six sampling sites both indoor and outdoor environments in the urban and industrial area of Dhaka city, Bangladesh which is based on six samples each site. The VOCs which have a SSV smaller than the sampling volume (2790mL) or not detected (ND) did not report in the Table. It can be observed from the Table 4.4 that the TVOCs concentrations levels are higher in industrial areas (mean concentration around 83.84-95.99µg/m3) compare to urban areas (mean concentration around 28.09-66.90µg/m3).
Table 4.3: An Overview of the Tvocs (∑39 Vocs), Mean Tvocs and Standard
Deviation Sampling locations TVOCS concentrations in µg/m3 Mean
TVOCs
Standard deviation Weekend
(am) Weekend
(pm) Weekday
(am) Weekday
(pm) Weekday
(am) Weekday
(pm)
Urban house(indoor) 54.49 56.15 52.68 54.02 42.94 68.75 54.84 8.27 Urban street(outdoor) 51.71 74.76 43.95 102.01 53.91 75.09 66.90 21.39 Urban park (outdoor) 16.38 51.46 17.37 32.06 13.74 37.52 28.09 14.89 Industrial house(indoor) 64.70 95.25 90.21 99.28 81.84 71.74 83.84 13.61 Industrial street(outdoor) 77.92 150.69 77.41 68.45 78.54 123.03 95.99 33.04 Industrial ambient(outdoor)
30.47 130.39 33.77 113.73 55.86 119.95 80.70 45.70
The overview Table 4.3 of the 36 samples reveals the information that the TVOCs concentrations level was lower in the morning compare to evening that indicate the temporal diurnal variation of emission sources. The large difference of TVOCs concentration illustrates the dependence of concentration on the local source in the two sampling areas with diurnal variation of emission sources. In the study done by Jeeranut et al. (2012) in Dhaka city found that emissions from gasoline and CNG-fuelled vehicles were dominant during the day time and emissions from diesel fuelled vehicles became significant during the night time. Moreover Jia et. al. (2008) found that outdoors, VOC concentrations are affected by season and temperature (Cheng et al., 1997), proximity to emission sources such as industry, traffic and gas stations, and meteorology, e.g., mixing height, wind speed and precipitation (Kwon et al., 2006). A comparison of the mean TVOCs of the quantified 39 VOCs can be figure out from the Table 4.3 of the six sampling sites of both urban and industrial area. The highest mean concentration level of TVOCs found in industrial roadside around 95.99µg/m3 and the lowest in urban park around 28.09µg/m3. Outdoor roadside has the highest mean TVOCs concentration level in both urban and industrial environment, (mean TVOCs concentration in urban street around 66.90µg/m3 and industrial street 95.99µg/m3). In both urban and industrial environment, indoor house has the second highest mean TVOCs concentration level. In both urban and industrial environment, outdoor ambient urban park and industrial ambient has the lowest mean TVOCs concentration level. It is found by Jia et. al. (2008) that indoors, concentrations are affected by outdoor levels due to the exchange of indoor and outdoor air (Wallace, 2001), and by the numerous VOC sources present indoors, which include building materials and furnishings (e.g., particle board, underlayment, and carpets), cleaning products, moth repellents, solvents, deodorants, fragrances, and hobby supplies (e.g., paints and glues). It is also found that VOCs are associated with many routine indoor activities,
Parvin, Langenhove, Walgraeve & Duc
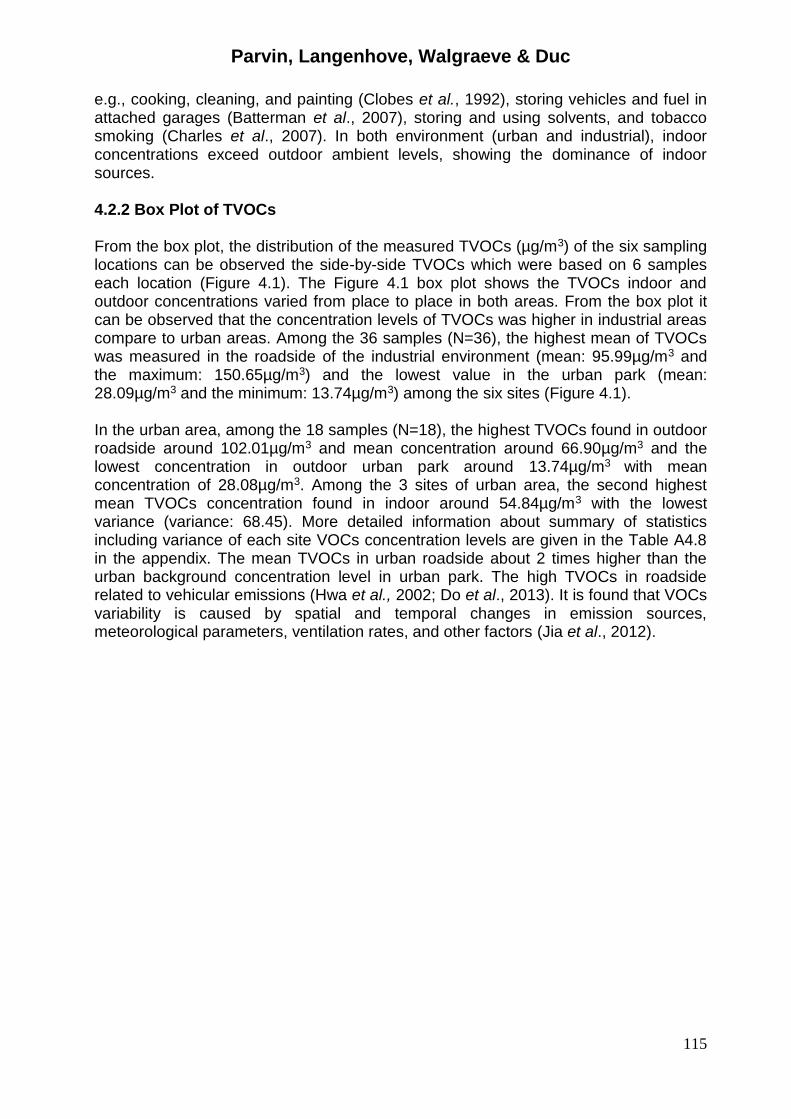
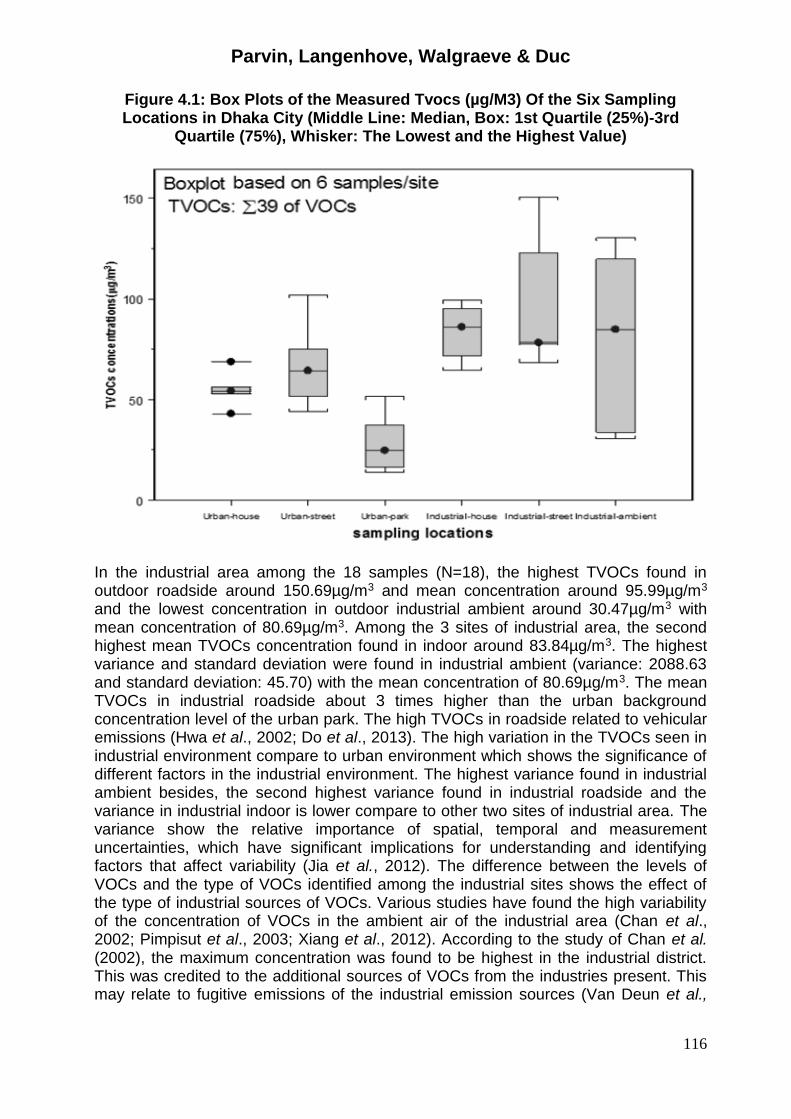
115
e.g., cooking, cleaning, and painting (Clobes et al., 1992), storing vehicles and fuel in attached garages (Batterman et al., 2007), storing and using solvents, and tobacco smoking (Charles et al., 2007). In both environment (urban and industrial), indoor concentrations exceed outdoor ambient levels, showing the dominance of indoor sources. 4.2.2 Box Plot of TVOCs From the box plot, the distribution of the measured TVOCs (µg/m3) of the six sampling locations can be observed the side-by-side TVOCs which were based on 6 samples each location (Figure 4.1). The Figure 4.1 box plot shows the TVOCs indoor and outdoor concentrations varied from place to place in both areas. From the box plot it can be observed that the concentration levels of TVOCs was higher in industrial areas compare to urban areas. Among the 36 samples (N=36), the highest mean of TVOCs was measured in the roadside of the industrial environment (mean: 95.99µg/m3 and the maximum: 150.65µg/m3) and the lowest value in the urban park (mean: 28.09µg/m3 and the minimum: 13.74µg/m3) among the six sites (Figure 4.1). In the urban area, among the 18 samples (N=18), the highest TVOCs found in outdoor roadside around 102.01µg/m3 and mean concentration around 66.90µg/m3 and the lowest concentration in outdoor urban park around 13.74µg/m3 with mean concentration of 28.08µg/m3. Among the 3 sites of urban area, the second highest mean TVOCs concentration found in indoor around 54.84µg/m3 with the lowest variance (variance: 68.45). More detailed information about summary of statistics including variance of each site VOCs concentration levels are given in the Table A4.8 in the appendix. The mean TVOCs in urban roadside about 2 times higher than the urban background concentration level in urban park. The high TVOCs in roadside related to vehicular emissions (Hwa et al., 2002; Do et al., 2013). It is found that VOCs variability is caused by spatial and temporal changes in emission sources, meteorological parameters, ventilation rates, and other factors (Jia et al., 2012).
Parvin, Langenhove, Walgraeve & Duc
116
Figure 4.1: Box Plots of the Measured Tvocs (µg/M3) Of the Six Sampling Locations in Dhaka City (Middle Line: Median, Box: 1st Quartile (25%)-3rd
Quartile (75%), Whisker: The Lowest and the Highest Value)
In the industrial area among the 18 samples (N=18), the highest TVOCs found in outdoor roadside around 150.69µg/m3 and mean concentration around 95.99µg/m3 and the lowest concentration in outdoor industrial ambient around 30.47µg/m3 with mean concentration of 80.69µg/m3. Among the 3 sites of industrial area, the second highest mean TVOCs concentration found in indoor around 83.84µg/m3. The highest variance and standard deviation were found in industrial ambient (variance: 2088.63 and standard deviation: 45.70) with the mean concentration of 80.69µg/m3. The mean TVOCs in industrial roadside about 3 times higher than the urban background concentration level of the urban park. The high TVOCs in roadside related to vehicular emissions (Hwa et al., 2002; Do et al., 2013). The high variation in the TVOCs seen in industrial environment compare to urban environment which shows the significance of different factors in the industrial environment. The highest variance found in industrial ambient besides, the second highest variance found in industrial roadside and the variance in industrial indoor is lower compare to other two sites of industrial area. The variance show the relative importance of spatial, temporal and measurement uncertainties, which have significant implications for understanding and identifying factors that affect variability (Jia et al., 2012). The difference between the levels of VOCs and the type of VOCs identified among the industrial sites shows the effect of the type of industrial sources of VOCs. Various studies have found the high variability of the concentration of VOCs in the ambient air of the industrial area (Chan et al., 2002; Pimpisut et al., 2003; Xiang et al., 2012). According to the study of Chan et al. (2002), the maximum concentration was found to be highest in the industrial district. This was credited to the additional sources of VOCs from the industries present. This may relate to fugitive emissions of the industrial emission sources (Van Deun et al.,
Parvin, Langenhove, Walgraeve & Duc
117
2007). Irregular and intermittent emissions which are related to manufacturing activities may also be a factor in the observed variability of concentrations. In the urban area, the highest variance was found in the urban roadside. The high variances in the roadside of both areas indicate the influence of fuel types. According to the study Jeeranut et al. (2012) which is done in Dhaka found that the extensive uses of CNG heavily influence the atmospheric composition. The relative high contribution of toluene in the roadside environment could be related to vehicular emissions (Balanay and Lungu, 2009). Several studies in the world indicated that the dominant anthropogenic sources in the urban areas are vehicle exhaust, gasoline evaporation, emissions from the commercial and industrial use of solvents and from liquefied petroleum gas (Na et al., 2004; Barletta et al., 2008; Parra et al., 2009; Crala et al., 2014). On the other hand, outdoors VOCs levels show both long- and short-term trends, seasonal and diurnal patterns (McCarthy et al., 2007), and spatial differences across industrial, urban (Jia et al., 2008a; Logue et al., 2010 and Miller et al., 2009). Indoors VOCs concentrations depend on season (Schlink et al., 2004), the presence of strong indoor sources such as an attached garage (Batterman et al., 2007), mothballs, air fresheners, dry cleaned clothing (D’Souza et al., 2009), personal activities such as smoking (Baek and Jenkins, 2004), among many other factors. Jia et al. (2012) found that concentrations of VOCs and other pollutants reflect emissions, environmental factors that disperse or remove pollutants, e.g., mixing, wind speed, temperature and humidity, and measurement uncertainty. The climate is characterized by high temperature and high humidity during most of the year and distinctly marked seasonal variations in precipitation in Bangladesh (Begum, et al., 2006). During the sampling period of urban area, the temperature was ranged between 28.6°C to 33.3°C and humidity ranged between 99.9% to more than 100%. While in industrial area, the temperature was ranged between 28.1°C to 31.4°C and humidity ranged between 92.1% to more than 100%. It should be noted that at the time of sampling Bangladesh was under monsoon influence and clean marine air mass are known to govern the area blowing from the south-west between May and September and bringing rain (the wet monsoon). Furthermore, the meteorological factors such as wind strength and the direction should also be considered. In the industrial ambient for example, the wind speed and direction may have affected the concentration of TVOCs since the sample was taken in the ambient air and wind direction and speed was changing during the sampling.
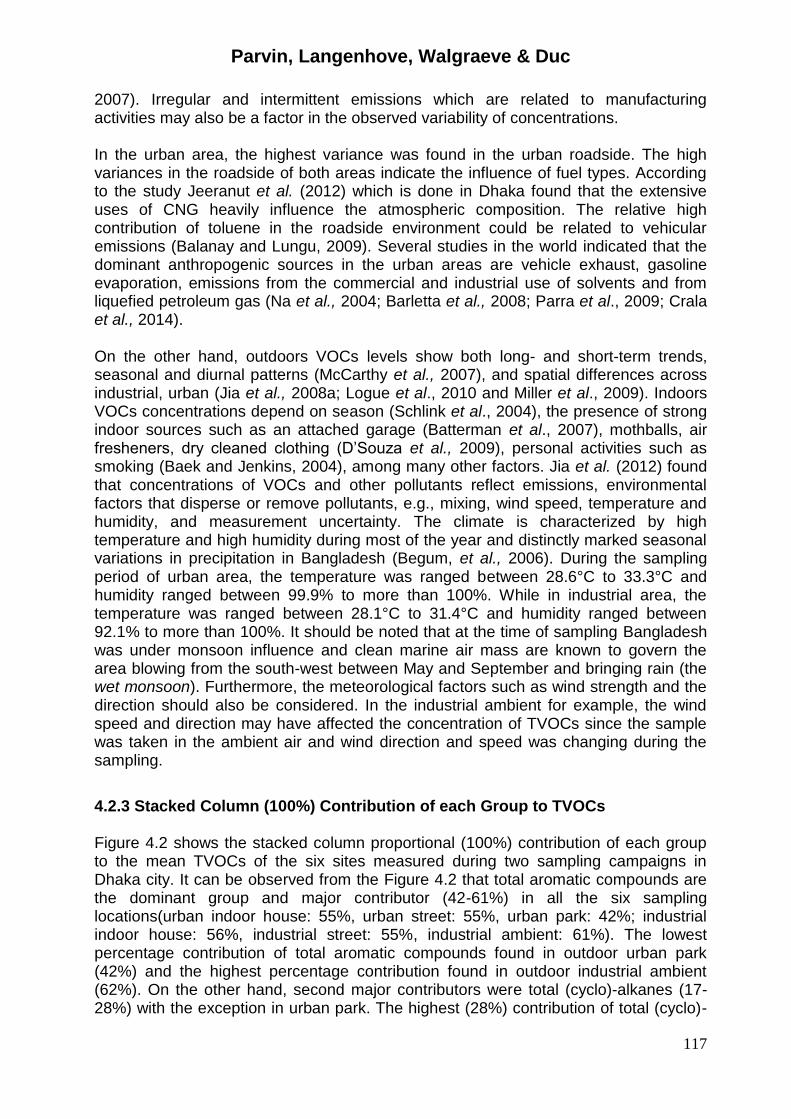
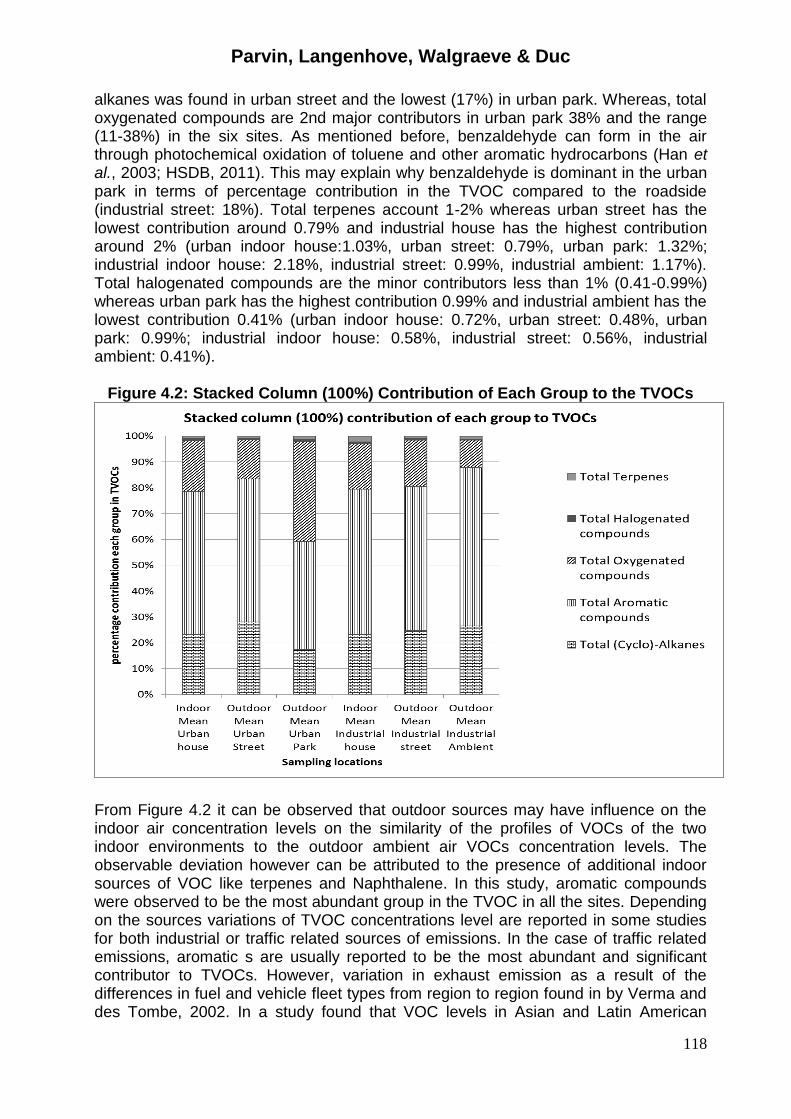
4.2.3 Stacked Column (100%) Contribution of each Group to TVOCs Figure 4.2 shows the stacked column proportional (100%) contribution of each group to the mean TVOCs of the six sites measured during two sampling campaigns in Dhaka city. It can be observed from the Figure 4.2 that total aromatic compounds are the dominant group and major contributor (42-61%) in all the six sampling locations(urban indoor house: 55%, urban street: 55%, urban park: 42%; industrial indoor house: 56%, industrial street: 55%, industrial ambient: 61%). The lowest percentage contribution of total aromatic compounds found in outdoor urban park (42%) and the highest percentage contribution found in outdoor industrial ambient (62%). On the other hand, second major contributors were total (cyclo)-alkanes (17-28%) with the exception in urban park. The highest (28%) contribution of total (cyclo)-
Parvin, Langenhove, Walgraeve & Duc
118
alkanes was found in urban street and the lowest (17%) in urban park. Whereas, total oxygenated compounds are 2nd major contributors in urban park 38% and the range (11-38%) in the six sites. As mentioned before, benzaldehyde can form in the air through photochemical oxidation of toluene and other aromatic hydrocarbons (Han et al., 2003; HSDB, 2011). This may explain why benzaldehyde is dominant in the urban park in terms of percentage contribution in the TVOC compared to the roadside (industrial street: 18%). Total terpenes account 1-2% whereas urban street has the lowest contribution around 0.79% and industrial house has the highest contribution around 2% (urban indoor house:1.03%, urban street: 0.79%, urban park: 1.32%; industrial indoor house: 2.18%, industrial street: 0.99%, industrial ambient: 1.17%). Total halogenated compounds are the minor contributors less than 1% (0.41-0.99%) whereas urban park has the highest contribution 0.99% and industrial ambient has the lowest contribution 0.41% (urban indoor house: 0.72%, urban street: 0.48%, urban park: 0.99%; industrial indoor house: 0.58%, industrial street: 0.56%, industrial ambient: 0.41%).
Figure 4.2: Stacked Column (100%) Contribution of Each Group to the TVOCs
From Figure 4.2 it can be observed that outdoor sources may have influence on the indoor air concentration levels on the similarity of the profiles of VOCs of the two indoor environments to the outdoor ambient air VOCs concentration levels. The observable deviation however can be attributed to the presence of additional indoor sources of VOC like terpenes and Naphthalene. In this study, aromatic compounds were observed to be the most abundant group in the TVOC in all the sites. Depending on the sources variations of TVOC concentrations level are reported in some studies for both industrial or traffic related sources of emissions. In the case of traffic related emissions, aromatic s are usually reported to be the most abundant and significant contributor to TVOCs. However, variation in exhaust emission as a result of the differences in fuel and vehicle fleet types from region to region found in by Verma and des Tombe, 2002. In a study found that VOC levels in Asian and Latin American
Parvin, Langenhove, Walgraeve & Duc
119
countries showed that aromatic levels in fuels used in Asian countries are higher than those used in Latin American cities which they correlated with the higher BTEX levels in ambient air in Asian cities (Gee and Sollars, 1998). On the other hand, the difference in profiles of vehicle exhausts depending on the fuel type (Schuetzle et al., 1994; Caplain et al., 2006). It also found that emission of VOCs from vehicle depends on vehicle condition, speed and type of fuel used (Watson et al., 2001, Do et al., 2013). In Bangladesh, CNG is an inexpensive, indigenous energy resource which currently accounts for the majority of automobile and domestic energy consumption (Jeeranut et al., 2012). In the study done by Jeeranut et al.(2012) found that emissions from gasoline and CNG-fuelled vehicles were dominant during the daytime; emissions from these vehicles only became significant during the night while in contrast due to restrictions imposed on diesel fuelled vehicles entering Dhaka City. Within the capital city the extensive CNG usage heavily influences the atmospheric composition (Jeeranut et al., 2012). The Bangladeshi government has implemented various mitigation measures aiming to assess the anticipated escalated air pollution problem and improve air quality. These measures include the shift from gasoline/diesel fuelled engines to CNG, which began in 1999–2000 (Bose and Rahman, 2009 and Iqbal et al., 2011). In Bangladesh, the number of CNG vehicles is currently estimated to be around 200,000 (GVR, 2011) of which about 95% are located in Dhaka and 58.5% of the total vehicles in Dhaka (325,000) are thought to be running on CNG (Jeeranut et al., 2012). Moreover, other factors such as metrological conditions such as season, wind speed, road conditions and other possible non-traffic sources of VOCs could be affecting factors (Do et al., 2013).
5. Conclusions Volatile organic compounds (VOCs) are of concern both as indoor and outdoor air pollutants for their potential adverse impact on health of people who are exposed and ability to create photochemical smog under certain conditions. The presence and concentration levels of VOCs were investigated for urban and industrial areas Dhaka city, Bangladesh. For this purpose six places were selected in two areas (urban and industrial area) for sampling campaigns from 30 of August 2013 to 11 September 2013. Ambient/outdoor and indoor samples from both areas were obtained by means of active sampling using Tenax TA tubes as sorbent material during the sampling time. Mirpur and Tejgaon were taken as urban and industrial sampling campaign respectively. Each sampling campaign has 3 locations both indoor and outdoor. Sample were taken each day two times in the morning and evening (7.00 am to 11.00 am and 4.30 to 8.30 pm) for three days where one weekend and two weekdays. During the sampling period the temperature was ranged between 28.1°C to 33.3°C and humidity was high (minimum: 92.1%). Analysis and quantification were done by TD-GC-MS and internal standard calibration. A total set of 44 VOCs consisting of alkanes, aromatic compounds, halogenated compounds, oxygen containing compounds and terpenes were identified among the 84 target compounds from the six sampling sites. Considering safe sampling volume 5 compounds excluded. Data were interpreted in terms of TVOCs, subgroup of TVOCs. Although the limited data set, the following conclusions can be drawn from the research. The highest mean of TVOCs was measured in the roadside of the industrial street (mean: 96μg/m3; maximum: around 151μg/m3). The lowest mean of TVOCs was measured in the park of the urban area (mean: 28μg/m3; minimum: around 14μg/m3). All the sites of industrial area have higher level of TVOCs compare to urban areas. Total Aromatic compounds was observed to be the most abundant group in all sampling sites ranging from 42 to 61%
Parvin, Langenhove, Walgraeve & Duc
120
of the TVOC in all the six sampling locations. The lowest percentage contribution (42%) of total aromatic compounds found in outdoor urban park and the highest percentage contribution (42%) of total aromatic compounds found in outdoor industrial ambient (62%). This study brought information a total set of 44 VOCs consisting of alkanes, aromatic compounds, halogenated compounds, oxygen containing compounds and terpenes were identified among the 84 target compounds from the six sampling sites. This study provide the information of the presence and concentrations levels of the 84 target compounds VOCs which are indispensable in creating development programs, planning efficient and effective implementing regulations, improving the air quality and increase the awareness about pollution impacts in Dhaka city. Again the provided information would be very useful in environmental and health policy making process in Bangladesh considering their potential impact on human health and environment. All over again, so far the best of our knowledge, there is no specific guidelines for ambient levels of emissions of VOCs are provided in Bangladesh. According to the findings of this study, traffic and industries emit significant amount of VOCs that could cause substantial risks to health such of population expose to be present in near the emission sources which have to control. It is recommended that VOCs be included in the list of criteria pollutants that are monitored and regulated. This study may provide helpful information in assessing current environmental policies for air quality and can serve as reference when hypothesising development programs, planning and implementing regulations and pollution reduction strategies. Studies including more sites and including seasonal and temporal variations over a longer period of time are recommended as the sampling time was under the influence of monsoon considering the initial findings of this work and the reported spatial and temporal variability of VOC concentrations can be considered to further demonstrate and to have appropriate data set for human health risks assessment on the exposure to some toxic VOCs.
References Adgate JL, TR Church, AD Ryan, G Ramachandran, AL Fredrickson, TH Stock, MT
Morandi and K Sexton 2004, ‘Outdoor, indoor, and personal exposure to VOCs in children’, Environmental Health Perspectives, vol. 112, no.14, pp.1386-1392.
Akimoto, H 2003, Impacts of ozone pollution from East Asia on Japan (in Japanese), Measures of Resources and the Environment, Vol.39, No.11, pp. 90-96.
Akimoto, H, T Izuta, H Ueda, I Uchiyama, T Ohara, Y Kohno, K Kobayashi and S Wakamatsu, 2006,‘Tropospheric Ozone: A Growing Threat’, Acid Deposition and Oxidant Research Center, 1182 Sowa, Niigata-City, Niigata, 950-2144, Japan.
Amare, AN 2013, ‘Micro-chemical analysis of volatile organic compounds in urban and airport areas of Mekelle, Ethiopia’, Master thesis, Ghent University, Belgium.
Atkinson, R 1985, ‘Kinetics and mechanisms of the gas-phase reactions of the hydroxyl radical with organic compounds under atmospheric conditions’, Chemical Reviews, vol.86, no. 1, pp. 69-201.
Atkinson, R and J Arey 2003, ‘Atmospheric degradation of volatile organic compounds’, Chemical Reviews, vol.103, no.12, pp. 4605-4638.
Azad, AK and Kitada, T 1998, ‘Characteristics of the Air Pollution in the City of Dhaka, Bangladesh in Winter’, Atmospheric Environment, vol. 32, pp.1991-2005.
Parvin, Langenhove, Walgraeve & Duc
121
Baek, SO, YS Kim and R Perry 1997, ‘Indoor air quality in homes, offices and restaurants in Korean urban areas -Indoor/outdoor relationships’, Atmospheric Environment, vol. 31, no.4, pp.529-544.
Balanay, JAG and CT Lungu 2009, ‘Exposure of Jeepney Drivers in Manila, Philippines, to Selected Volatile Organic Compounds (VOCs)’, Industrial Health, vol.47, no.1, pp. 33-42.
Barai, KR 2012, ‘Analysis of atmospheric VOCs emission in Dhaka city of Bangladesh’, Master thesis, Ghent University, Belgium.
Barletta, B, S Meinardi, IJ Simpson, S Zou, FS Rowland, and DR Blake 2008, ‘Ambient mixing ratios of non-methane hydrocarbons (NMHCs) in two major urban centers of the Pearl River Delta (PRD) region: Guangzhou and Dongguan’, Atmospheric Environment, vol. 42, no.18, pp. 4393-4408.
Batterman, S, C. Jia and G. Hatzivailis 2007, ‘Migration of volatile organic compounds from attached garages to residences: a major exposure source’, Environmental Research, vol.104, no.2, pp. 224–240.
Begum, BA, SK Biswas and PK Hopke 2006, ‘Temporal variations and spatial distribution of ambient PM2.2 and PM10 concentrations in Dhaka, Bangladesh’, Science of the Total Environment, vol. 358, no.1-3, pp. 36–45.
Borton, A, N Locoge, M Veillerot, JC Galloo, and R Guillermo 2002, ‘Characterization of NMHCs in a French urban atmosphere: overview of the main sources’, The Science of the Total Environment, vol. 292, no. 3, pp.177–191.
Bose, SK and N Rahman 2009, ‘Country Presentation on EST Bangladesh Fourth Regional EST Forum in Asia’, United Nations Centre for Regional Development, 24–26 February.
Buczynska, AJ, A Krata, M Stranger, AFL Godoi, V Kontozova-Deutsch, L Bencs, I Naveau, E Roekens and RV Grieken 2009, ‘Atmospheric BTEX-concentrations in an area with intensive street traffic’, Atmospheric Environment, vol. 43, no. 2, pp. 311-318.
Caplain, I, F Cazier, H Nouali, A Mercier, JC Déchaux, V Nolleta, R Joumard, JM André and R Vidon 2006, ‘Emissions of unregulated pollutants from European gasoline and diesel passenger cars’, Atmospheric Environment, vol. 40, no. 31, pp. 5954-5966.
Carla, F, F Incoronato, S Baiguera, R Schiro and D Brocco 2014, ‘Volatile organic compound levels at one site in Rome urban air’, Atmospheric Pollution Research, vol. 5, pp. 303–314.
Chan, WC, SC Lee, Y Chen, B Mak, K Wong, CS Chan, C Zheng and X Guo 2009, ‘Indoor air quality in new hotels' guest rooms of the major world factory region’, International Journal of Hospitality Management, vol. 28, no. 1, pp. 26-32.
Cheng, L, L Fu, RP Angle and HS Sandhu 1997, ‘Seasonal variations of volatile organic compounds in Edmonton, Alberta’, Atmospheric Environment, vol. 31, pp. 239–246.
Choi, E, K Choi and SM Yi 2011, ‘Non-methane hydrocarbons in the atmosphere of a Metropolitan City and a background site in South Korea: Sources and health risk potentials’, Atmospheric Environment, vol.45, no. 40, pp. 7563-7573.
Clobes, AL, GP Ananth, AL Hood, JA Schroeder and KA Lee 1992, ‘Human activities as sources of volatile organic compounds in residential environments’, Annals of the New York Academy of Sciences, vol.641, pp.79–86.
Cocheo, V, P Sacco, C Boaretto, ED Saeger, PP Ballesta, H Skov, E Goelen, N Gonzalez and AB Caracena 2000, ‘Urban benzene and population exposure’, Nature, vol.404, pp.141-142.
Parvin, Langenhove, Walgraeve & Duc
122
D’Souza, JC, C Jia, B Mukherjee and S Batterman 2009, ‘Ethnicity, housing and personal factors as determinants of VOC exposures’, Atmospheric Environment, vol. 43, pp. 2884–2892.
Demeestere, K, J Dewulf, BD Witte and HV Langenhove 2007, ‘Sample preparation for the analysis of volatile organic compounds in air and water matrices’, Journal of Chromatography A, vol.1153, no.1-2, pp.130-144.
Demeestere, K, J Dewulf, KD Roo, PD Wispelaere and HV Langenhove 2008, ‘Quality control in quantification of volatile organic compounds analysed by thermal desorption-gas chromatography-mass spectrometry’, Journal of Chromatography A, vol.1186, no.1-2, pp. 348-357.
Dimitroulopoulou, C 2012, ‘Ventilation in European dwellings: A review’, Building and Environment, vol. 47, pp.109-125.
Do, DH, HV Langenhove, C Walgraeve, SF Hayleeyesus, PD Wispelaere, J Dewulf and K Demeestere 2013, ‘Volatile organic compounds in an urban environment: A comparison among Belgium, Vietnam and Ethiopia’, International Journal of Environmental Analytical Chemistry, vol. 93, no. 3, pp. 298–314.
Do, DH, C Walgraevea, AN Amarea, KR Baraia, AE Paraoa, K Demeesterea and HV Langenhovea 2015, ‘Airborne volatile organic compounds in urban and industrial locations in four developing countries’, Atmospheric Environment, Vol. 119, pp.330–338.
Elshorbany, YF, J Kleffman, R Kurtenbach, M Rubio, E Lissi, G. Villena, E Gramsch, AR Rickard, MJ Pilling and P Wiesen 2009, ‘Summer time photochemical ozone formation in Santiago, Chile’, Atmospheric Environment, vol.43, no. 40, pp. 6398-640.
EU (European Union) 2008, ‘Directive 2008/50/EC of the European Parliament and of the Council’, viewed 31 July 2014, <http://eur-lex.europa.eu/LexUriServ/LexUriServ.do?uri=OJ:L:2008:152:0001:0044:EN:PDF>
EU 2004, ‘Directive 2004/42/CE of the European Parliament and of the Council of 21 April 2004 on the limitation of emissions of volatile organic compounds due to the use of organic solvents in certain paints and varnishes and vehicle refinishing products and amending Directive 1999/13/EC’, Official Journal L, vol.143, pp. 0087–0096, viewed on 31 July 2014, <http://eur-lex.europa.eu/legal-content/EN/TXT/?uri=CELEX:32004L0042>
Gee, IL and CJ Sollars 1998, ‘Ambient air levels of volatile organic compounds in Latin American and Asian cities’, Chemosphere, vol.36, no. 11, pp. 2497-2506.
Goldstein, AH and IE Galbally 2007, ‘Known and Unexplored Organic Constituents in the Earth's Atmosphere’, Environmental Science & Technology, vol. 41, no. 5, pp. 1514-1521.
Grant, DD, JD Fuentes, S Chan, WR Stockwell, D Wang and SA Ndiaye 2008, ‘Volatile organic compounds at a rural site in western Senegal’, Journal of Atmospheric Chemistry, vol. 60, no.1, pp. 19-35.
Guenther, A 2012, ‘Bidirectional exchange of volatile organic compounds’, Atmospheric Chemistry Division, National Center for Atmospheric Research, Boulder CO USA.
Guenther, A, CN Hewitt, D Erickson, R Fall, C Geron, T Graedel, P Harley, L Klinger, Manuel Lerdau, W. A. Mckay, Tom Pierce, Bob Scholes, Rainer Steinbrecher, R Tallamraju, J Taylor and P Zimmerman 1995, ‘A global-model of natural volatile organic-compound emissions’, Journal of Geophysical Research-Atmospheres, vol. 100, no. D5, pp. 8873-8892.
Parvin, Langenhove, Walgraeve & Duc
123
Gurjar, BR, A Jain, A Sharma, A Agarwal, P Gupta, AS Nagpure and J Lelieveld 2010, ‘Human health risks in megacities due to air pollution’, Atmospheric Environment, vol. 44, no. 36, pp. 4606–4613.
GVR 2011, Gas Vehicles Report Worldwide NGV Statistics (September 2011) the GVR 10, 116.
Han, X and LP Naeher 2006, ‘A review of traffic-related air pollution exposure assessment studies in the developing world’, Environment International, vol. 32, no.1, pp.106-120.
Herbarth, O and S Matysik 2010, ‘Decreasing concentrations of volatile organic compounds (VOC) emitted following home renovations’, Indoor Air, vol. 20, no. 2, pp.141-146.
Hossain 2008, Impact of Brick Kiln Pollution on Dhaka City, Chemical Engineering Department, BUET, viewed on 31 July 2014, <http://centers.iub.edu.bd/chpdnew/chpd/download/seminar/2008/April17.pdf>
HSDB 2011, ‘HSDB a toxnet database: NIH: US National Library of Medicine, Hazardous Substances Data Bank’, viewed 12 April 2014, <http://toxnet.nlm.nih.gov/newtoxnet/hsdb.htm>
Huang, C, CH Chen, L Li, Z Cheng, HL Wang, HY Huang, DG Streets, YJ Wang, GF Zhang and YR Chen 2011, ‘Emission inventory of anthropogenic air pollutants and VOC species in the Yangtze River Delta region, China’, Atmospheric Chemistry and Physics, vol. 11, no.9, pp. 4105-4120.
Hwa, MY, CC Hsieh, TC Wub and LFW Changa 2002, ‘Real-world vehicle emissions and VOCs profile in the Taipei tunnel located at Taiwan Taipei area’, Atmospheric Environment, vol. 36, no. 12, pp.1993-2002.
IARC 2012, ‘List of classifications by alphabetical order’ International Agency for Research on Cancer, viewed on 31 July 2014, <http://monographs.iarc.fr/ENG/Classification/index.php>
IARC 2013, ‘Agents Classified by the IARC Monographs’, International Agency for Research on Cancer, Vol. 1–108, viewed on 31 July 2014, <http://monographs.iarc.fr/ENG/Classification/ClassificationsAlphaOrder.pdf.>
Iqbal, SA, Iqbal, M and Salauddin AFM 2011, ‘Present Scenario of Compressed Natural Gas (CNG) as a Vehicular fuel in Bangladesh’, Proceeding 2nd international Conference on Industrial Engineering and Operations Management(IEOM, 2011), Shahjalal University of Science & Technology, Sylhet, Bangladesh, viewed on 31 July 2014, <http://www.iieom.org/ieom2011/pdfs/IEOM034.pdf>
Jeeranut, S, HA Sikder, CE Jones, SKH Kunimi, ANMH Kabir and Y Kajii 2012, ‘Influence of extensive compressed natural gas (CNG) usage on air quality’, Atmospheric Environment, vol.54, pp. 296–307.
Jia, C, S Batterman and C Godwin 2008a, ‘VOCs in industrial, urban and suburban neighborhoods, Part 1: Indoor and outdoor concentrations, variation, and risk drivers’, Atmospheric Environment, vol.42, no.9, pp. 2083-2100. viewed 31 July 2014, <http://www.sciencedirect.com/science/article/pii/S1352231007011028>
Jia, C, SA Battermanb and GE Relyea 2012, ‘Variability of indoor and outdoor VOC measurements: An analysis using variance components’, Environmental Pollution, vol.169, pp. 152–159.
Jia, CS Batterman and C Godwin 2008b, ‘VOCs in industrial, urban and suburban neighborhoods, Part 2: Factors affecting indoor and outdoor concentrations’, Atmospheric Environment, vol. 42, pp. 2101–2116.
Kansal, A 2009, ‘Sources and reactivity of NMHCs and VOCs in the atmosphere: A review’, Journal of Hazardous Materials, vol.166, no.1, pp. 17-26.
Parvin, Langenhove, Walgraeve & Duc
124
Karim, MM 1999, ‘Traffic pollution inventories and modelling in metropolitan Dhaka, Bangladesh’, Transportation Research Part D: Transport and Environment, vol. 4, no. 5, pp. 291–312.
Kumar, A and I Víden 2007, ‘Volatile Organic Compounds: Sampling Methods and Their Worldwide Profile in Ambient Air’, Environmental Monitoring and Assessment, vol.131, no.1, pp. 301-321.
Kwon, J, CP Weisel, BJ Turpin, JF Zhang, LR Korn, MT Morandi, TH Stock and S Colome 2006,‘Source proximity and outdoor-residential VOC concentrations: results from the RIOPA study’, Environmental Science and Technology, vol. 40, no. 13, pp. 4074–4082.
Lai, CH and YP Peng 2012, ‘Volatile hydrocarbon emissions from vehicles and vertical ventilations in the Hsuehshan traffic tunnel, Taiwan’, Environmental Monitoring and Assessment, vol. 184, no.7, pp. 4015-4028.
Leung, MK, CH Liu and AH Chan 2005, ‘Occupational exposure to volatile organic compounds and mitigation by push-pull local exhaust ventilation in printing plants’, Journal of Occupational Health, vol.47, no. 6, pp. 540-547.
Logue, JM, McKone, TE, Sherman, MH and Singer, BC, 2011, ‘Hazard assessment of chemical air contaminants measured in residences’, Indoor Air, vol. 21, no. 2, pp. 92-109.
Mao, J, X Rena, S Chena, WH Brunea, Z Chena, M Martinezb, H Harderb, B Leferc, B Rappenglückc, J Flynnc and M Leuchner 2010, ‘Atmospheric oxidation capacity in the summer of Houston 2006: Comparison with summer measurements in other metropolitan studies’, Atmospheric Environment, vol.44, no. 33, pp. 4107-4115.
Markes International Limited 2006, ‘Note 20: Determining and Validating Safe Sampling Volumes, Thermal Desorption Technical Support’.
Marks International Limited 2014, viewed on 31 July 2014, <http://www.markes.com/Products/Sampling-accessories/Sorbent-tubes/Inert.aspx>
McCarthy, MC, HR Hafner, LR Chinkin and JG Charrier 2007, ‘Temporal variability of selected air toxics in the United States’, Atmospheric Environment, Vol 41, pp.7180–7194.
Na, K, YP Kim, Yong PK, Il Moona and KC Moonc 2004, ‘Chemical composition of major VOC emission sources in the Seoul atmosphere’, Chemosphere, vol. 55, no. 4, pp. 585-594.
Na, K, YP Kim, Yong PK and KC Moona 2003, ‘Diurnal characteristics of volatile organic compounds in the Seoul atmosphere’, Atmospheric Environment, vol. 37, no. 6, pp. 733-742.
Parao, AE 2012, ‘Volatile Organic Compounds in Urban and Industrial Areas in the Philippines’, Master thesis, Ghent University, Belgium.
Parra, MA, Elustondo, D, Bermejo, R and Santamaria, JM 2009, ‘Ambient air levels of volatile organic compounds (VOC) and nitrogen dioxide (NO2) in a medium size city in Northern Spain’, Science of the Total Environment, Vol.407, pp. 999–1009.
Pentamwa, P, N Kanaratanadilok and Oanh NT 2011, ‘Indoor pesticide application practices and levels in homes of Bangkok Metropolitan Region’, Environmental Monitoring and Assessment, vol.181, no.1, pp.363-372.
Pimpisut, D, W Jinsart and M Hooper 2003, ‘Ambient Air Levels and Sources of BTEX at a Petrochemical Complex in Thailand’, Proceedings of the 2nd Regional Conference on Energy Technology Towards a Clean Environment 12-14 February, Phuket, Thailand.
Parvin, Langenhove, Walgraeve & Duc
125
Rab, MA 2001, ‘Automotive Air Pollution in Dhaka City’, France Bangladesh Association of Scholars and Trainees (FBAST), Bangladesh.
Sadanaga, Y, S Shibata, M Hamana, N Takenaka and H Bandow 2008, ‘Weekday/weekend difference of ozone and its precursors in urban areas of Japan, focusing on nitrogen oxides and hydrocarbons’, Atmospheric Environment, vol. 42, no.19, pp. 4708-4723.
Sahu, LK 2012, ‘Volatile organic compounds and their measurements in the troposphere’, Current Science vol.102, no.12, pp. 1645-1649.
Salam, A, Bauer, H, Kassin, K, Ullah, SM and Puxbaum, H 2003, ‘Aerosol chemical characteristics of a mega-city in Southeast Asia (Dhaka, Bangladesh)’, Atmospheric Environment, vol.37, pp.2517-2528.
Sarigiannis, DA, Karakitsios SP, Gotti A, Liakos IL and Katsoyiannis A 2011, ‘Exposure to major volatile organic compounds and carbonyls in European indoor environments and associated health risk’, Environment International, vol.37, no.4, pp.743-765.
Schlink, U, M Rehwagen, M Damm, M Richter, M Borte and O Herbarth 2004, ‘Seasonal cycle of indoor-VOCs: comparison of apartments and cities’, Atmospheric Environment, Vol. 38, pp. 1181–1190.
Schuetzle, D, Siegl WO, Jensen TE, Dearth MA, Kaiser EW, Gorse R, Kreucher W and Kulik E 1994, ‘The Relationship between Gasoline Composition and Vehicle Hydrocarbon Emissions - a Review of Current Studies and Future-Research Needs’, Environmental Health Perspectives, vol.102, pp. 3-12.
Sigma-Aldrich 2010, ‘Active sampling’, viewed on July 31, 2014, <http://www.sigmaaldrich.com/analyticalchromatography/air-monitoring/activesampling.html>
SIS 2014, ‘Tenax® TA Adsorbent Resin Physical Properties’, Scientific Instrument Services, viewed on July 31, 2014, <http://www.sisweb.com/index/referenc/tenaxtam.htm>
SIS 2014, ‘Tenax® TA Back Pressure Versus Flow Data’, Scientific Instrument Services, viewed on July 31, 2014, http://www.sisweb.com/index/referenc/tentaprs.htm
Srivastava, PK, GG Pandit, S Sharma and AM Mohan Rao 2000, ‘Volatile organic compounds in indoor environments in Mumbai, India’, Science of The Total Environment vol. 255, no. 1–3, pp. 161-168.
Stavrakou, T, JF Muller, ID Smedt, MV Roozendael, GRvd Werf, L Giglio and A Guenther 2009, ‘Evaluating the performance of pyrogenic and biogenic emission inventories against one decade of space-based formaldehyde columns’, Atmospheric Chemistry and Physics, vol. 9, no. 3, pp.1037-1060.
Stemmler, K, S Bugmann, B Buchmanna, S Reimanna and J Staehelinc 2005, ‘Large decrease of VOC emissions of Switzerland's car fleet during the past decade: results from a highway tunnel study’, Atmospheric Environment, vol.39, no.6, pp.1009-1018.
Stevenson, DS, CE Johnson, WJCollins, RG Derwent and JM Edwards 2000, ‘Future estimates of tropospheric ozone radiative forcing and methane turnover -The impact of climate change’, Geophysical Research Letters, vol.27, no.14, pp. 2073-2076.
Talapatra A and Srivastava A 2011, ‘Ambient Air Non-Methane Volatile Organic Compound (NMVOC) Study Initiatives in India–A Review’, Journal of Environmental Protection, vol.2, no. 1, pp. 21-36.
Parvin, Langenhove, Walgraeve & Duc
126
Theloke, J and R Friedrich 2007, ‘Compilation of a database on the composition of anthropogenic VOC emissions for atmospheric modelling in Europe’, Atmospheric Environment, vol.41, no. 19, pp. 4148-4160.
Tiwari, V, Y Hanai and S Masunaga 2010, ‘Ambient levels of volatile organic compounds in the vicinity of petrochemical industrial area of Yokohama, Japan’, Air Quality Atmosphere and Health, vol.3, no.2, pp. 65-75.
USEPA 2009, ‘United States Environmental Protection Agency , Technology Transfer Network / National Ambient Air Quality Standards, Ozone Implementation: Definition of Volatile Organic Compounds (VOC)’, viewed on 31 July 2014,
< http://www.epa.gov/ttn/naaqs/ozone/ozonetech/def_voc.htm> USEPA 2010, ‘Conversion Factors for Hydrocarbon Emission Components NR-
002d)’, viewed on 31 July 2014 <http://www.epa.gov/oms/models/nonrdmdl/nonrdmdl2010/420r10015.pdf.>
USEPA 1988, ‘Formation and control technology’, viewed on 15 July 2014, <http://www.epa.gov/OMS/regs/toxics/airtox1b.pdf>
USEPA 2003, ‘National emissions standards for hazardous air pollutants: municipal solid waste landfills’, U.S. Environmental Protection Agency (USEPA), Office of Air Quality Planning and Standards, Report 68/FR/2227-2229 Washington, DC.
USEPA 2009, ‘Biogenic emissions characterization’, viewed on 31 July 2014 <http://www.epa.gov/appcdwww/apb/biogenic.html>
USEPA 2012, ‘United State Environmental Protection Agency, Indoor Air Quality : Volatile Organic Compounds (VOCs) Technical Overview’, viewed on 31July 2014, <http://www.epa.gov/iaq/voc.html.>
USEPA 2012a, ‘Volatile organic compounds (VOCs)’, viewed on 31 July 2014, <http://www.epa.gov/iaq/voc2.html>
US-EPA 2012b, ‘An Introduction to indoor air quality (IAQ)’, viewed on 31 July 2014, <http://www.epa.gov/iaq/voc.html>
USEPA 2012c, ‘Ozone generators that are sold as air cleaners’, viewed on 31 July 2014, <http://www.epa.gov/iaq/pubs/ozonegen.html>
USEPA 2012d, ‘Global warming and climate change’, viewed on 31 July 2014, <http://www.epa.gov/airtrends/aqtrnd95/globwarm.html>
USEPA 2013, ‘Definition of Volatile Organic Compounds (VOC)’, viewed on 30 July 2014, < http://www.epa.gov/ttn/naaqs/ozone/ozonetech/def_voc.htm>.
USEPA 2013, ‘Volatile Organic Compounds (VOCs)’, United States Environmental Protection Agency, viewed on 30 July 2014, <http://www.epa.gov/iaq/voc2.html>
Van Deun, J, R De Fré I Bilsen, R Baert and M Blondeel 2007, ‘Measuring fugitive emission in the printing sector as a verification of the solvent management plan according to the EU Solvent Directive’, In C. Borrego and C. A. Brebbia (Eds.), Air Pollution XV Volume 101 of WIT Transactions on Ecology and the Environment: WIT Press.
Van Langenhove, H 2010, ‘Volatile Organic Compounds (VOCs)’, Environmental Chemistry Course Notes, University of Ghent, Faculty of Bioscience Engineering, pp.1-44.
Verma, DK and KD Tombe 2002, ‘Benzene in gasoline and crude oil: Occupational and environmental implications’, Aihaj, vol.63, no.2, pp. 225-230.
Wallace, LA 2001, ‘Human exposure to volatile organic pollutants: implications for indoor air studies’, Annual Review of Energy and the Environment, vol.26, pp. 269–301.
Wang, B, SC Lee and KF Ho 2007, ‘Characteristics of carbonyls: concentrations and source strengths for indoor and outdoor residential microenvironments in China’, Atmospheric Environment, vol.41, no.13, pp. 2851-2861.
Parvin, Langenhove, Walgraeve & Duc
127
Wang, P and W Zhao 2008, ‘Assessment of ambient volatile organic compounds (VOCs) near major roads in urban Nanjing, China’, Atmospheric Research, vol.89, no.3, pp. 289-297.
Wang, X, G Sheng, J Fua, C Chanb, SC Leeb, LY Chanb and Z Wangc 2002, ‘Urban roadside aromatic hydrocarbons in three cities of the Pearl River Delta, People's Republic of China’, Atmospheric Environment, vol.36, no. 33, pp. 5141-5148.
Wang, Y, X Ren, J D, Zhang J, Sun J and Wu F 2012, Characterization of volatile organic compounds in the urban area of Beijing from 2000 to 2007, Journal of Environmental Sciences, vol.24, no.1, pp. 95-101.
Watson, JG, JC Chow and EM Fujita 2001, ‘Review of volatile organic compound source apportionment by chemical mass balance’, Atmospheric Environment, vol.35, no.9, pp. 1567-1584.
WB 2006, Bangladesh Country Environmental Analysis, Bangladesh Development Series Paper No: 12, The World Bank Office, Dhaka, viewed on 30 July 2014, <http://siteresources.worldbank.org/BANGLADESHEXTN/Resources/295759-1173922647418/complete.pdf>
Weschler, CJ 2009, ‘Changes in indoor pollutants since the 1950s’, Atmospheric Environment, vol. 43, no.1, pp. 153-169.
WHO 2000, ‘WHO regional publications, Air quality guidelines for Europe’, Second edition, No. 91: 62-65.
WHO 2002, ‘Partnership for clean fuels and vehicles’, viewed on 31 July 2014, <http://www.unep.org/transport/pcfv/pdf/InfSheet.pdf>
WHO 2005, ‘Health effects of transport-related air pollution’, Edited by Michal Krzyzanowski, Birgit Kuna-Dibbert and Jurgen Schneiderpage, pp. 125-165.
WHO 2006, ‘WHO Air quality guidelines for particulate matter, ozone, nitrogen dioxide and sulfur dioxide’, Global update 2005, Summary of risk assessment’, pp.14-15.
WHO 2010, ‘World Health Organization (WHO) benzene guidelines’, viewed on 20 April 2014, < http://www.who.int/ipcs/features/benzene.pdf>
Xiang, Y, H Delbarre, Sauvage S, Léonardis T, Fourmentin M, Augustin P and Locoge N 2012, ‘Development of a methodology examining the behaviours of VOCs source apportionment with micro-meteorology analysis in an urban and industrial area’, Environmental Pollution,Vol.162, pp. 15-28.
Zhao, H, Y Ge, J Tan, H Yin, J Guo, W Zhao and P Dai 2011, ‘Effects of different mixing ratios on emissions from passenger cars fuelled with methanol/gasoline blends’, Journal of Environmental Sciences, vol.23, no. 11, pp. 1831-1838.