indot overview acec indiana luncheon brandye l. hendrickson commissioner, indot september 3, 2015
TRANSCRIPT

INDOT Overview
ACEC Indiana Luncheon
Brandye L. HendricksonCommissioner, INDOT
September 3, 2015

Six district offices 3,378 employees $1 billion/annual capital
expenditures $462 million annual operating
budget 11,170 total centerline miles 28,800 total roadway lane miles 5,600 INDOT-owned bridges Assists 42 railroads in planning &
development of more than 3,880 miles of active rail lines
Supports 69 Indiana State Aviation System Plan airports
INDOT Overview
Slide 2
Governor’s Priorities for INDOT Take Care of What We Have Finish What We Started Plan for the Future
Slide 3
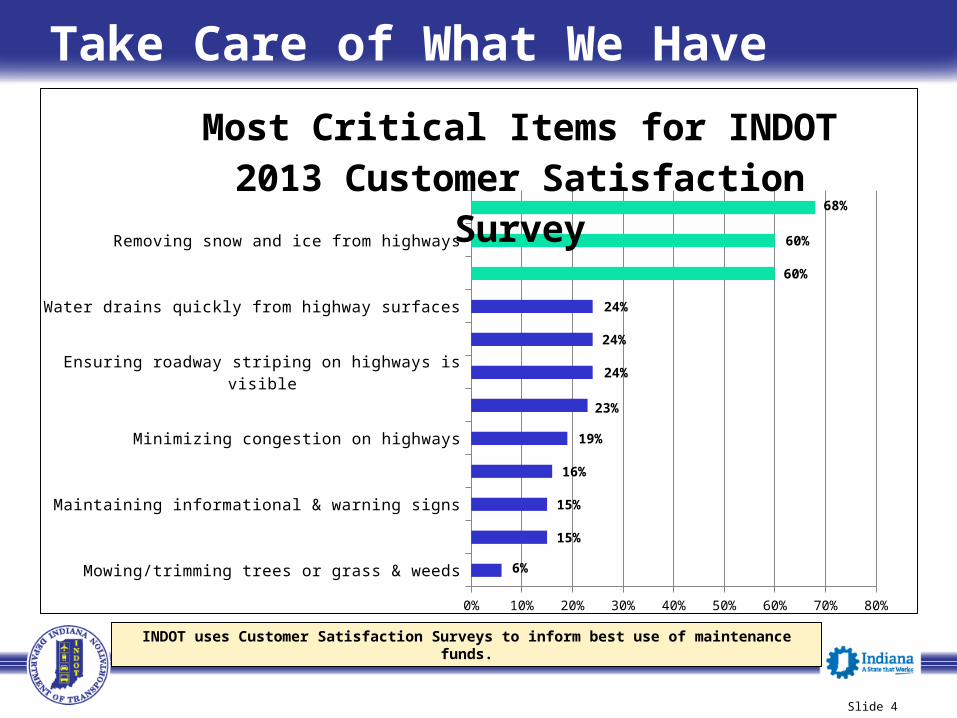
Mowing/trimming trees or grass & weeds
Keeping guardrails in good condition
Maintaining informational & warning signs
Adding lanes to existing highways
Minimizing congestion on highways
Removing debris from highways
Ensuring roadway striping on highways is visible
Keeping shoulders on highways in good condition
Water drains quickly from highway surfaces
Repairing and maintaining bridges
Removing snow and ice from highways
Repairing and maintaining existing highways
0% 10% 20% 30% 40% 50% 60% 70% 80%
6%
15%
15%
16%
19%
23%
24%
24%
24%
60%
60%
68%
Most Critical Items for INDOT2013 Customer Satisfaction
Survey
Take Care of What We Have
INDOT uses Customer Satisfaction Surveys to inform best use of maintenance funds.
Slide 4

Take Care of What We HavePreservation
Transitioning to preserving and maintaining existing roads, bridges and infrastructure
Reflects wishes of taxpayers Best use of taxpayer dollars Regularly scheduled preservation and
maintenance activities preserve and protect pavement and bridges, extending the life of these assets ensuring safety of motorists
Contracts Let FY 2010-14: 1,390; $5.08 billionContracts Let FY 2015-19: 1,657; $3.61 billion
Slide 5

Finish What We Started – Completed
Completed Projects Open to Traffic
I-74 & US 421 Interchange (Honda)
July 2008
I-80/94 Borman Expressway August 2011
US 24 Fort to Port November 2012
I-69 Evansville to Crane November 2012
Accelerate 465 December 2012
US 231 Tippecanoe County September 2013
SR 25 Hoosier Heartland October 2013
I-69 & 116th Street November 2013
US 31 Kokomo November 2013
Milton-Madison Bridge April 2014
US 31 Plymouth to South Bend August 2014
I-465 & I-65 Marion County December 2014
Slide 6

Finish What We Started – Active I-65 & Worthsville Road
Added travel lanes $16.1M Open to Traffic: November 2015
I-69, Section 4, Crane toBloomington New interstate $471M Open to Traffic: December 2015
US 31 Hamilton County Upgrade to interstate standards $342M Open to Traffic: December 2015
Slide 7
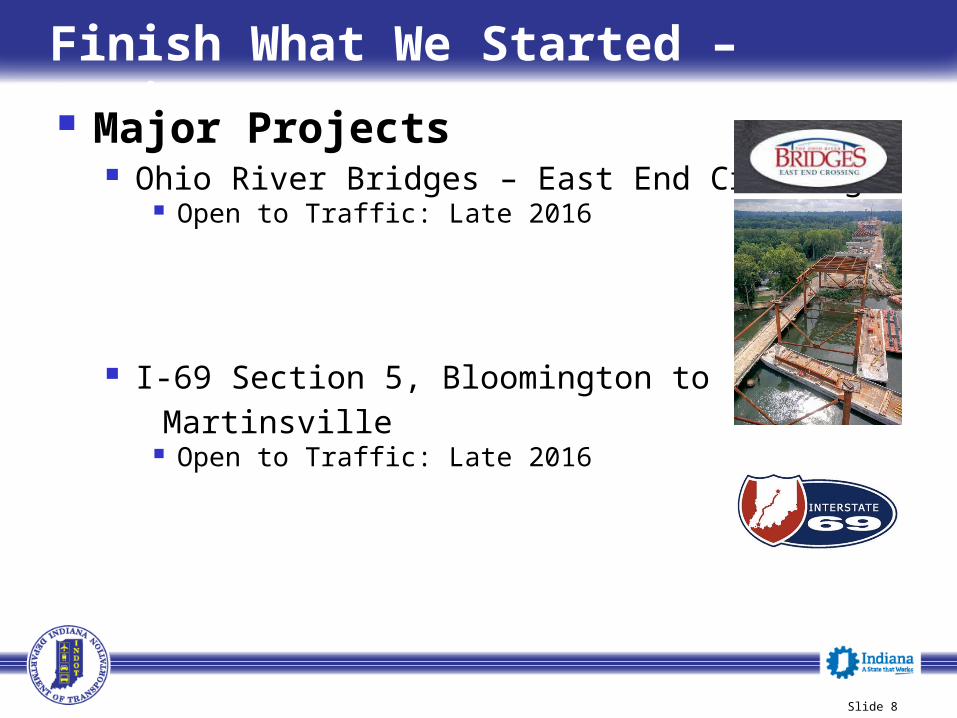
Finish What We Started – Active Major Projects
Ohio River Bridges – East End Crossing Open to Traffic: Late 2016
I-69 Section 5, Bloomington to Martinsville
Open to Traffic: Late 2016
Slide 8
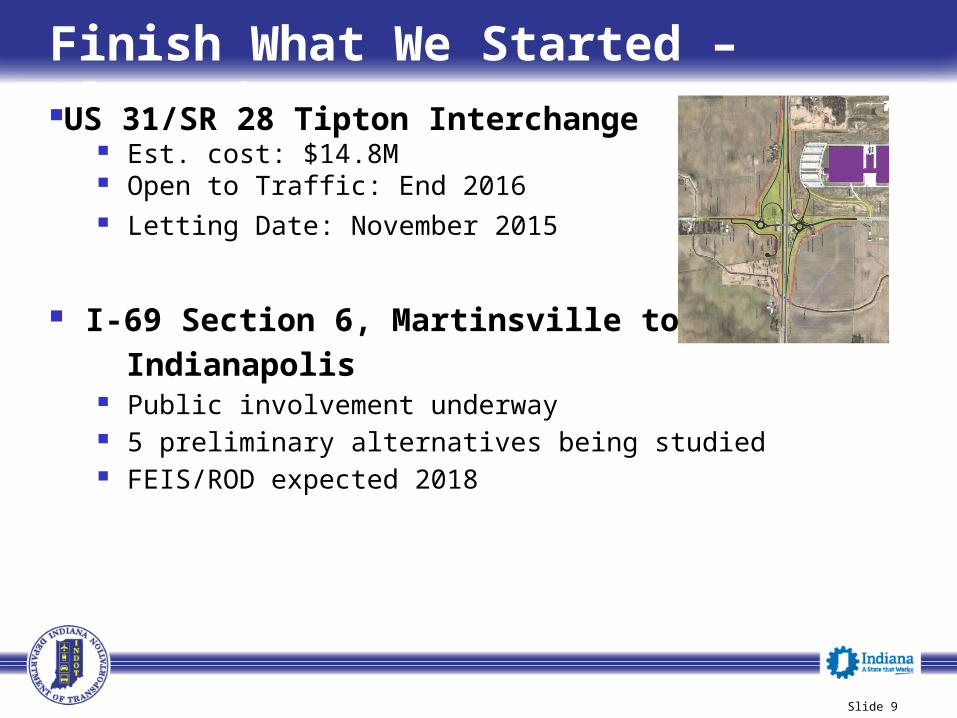
Finish What We Started – PlannedUS 31/SR 28 Tipton Interchange
Est. cost: $14.8M Open to Traffic: End 2016 Letting Date: November 2015
I-69 Section 6, Martinsville to Indianapolis
Public involvement underway 5 preliminary alternatives being studied FEIS/ROD expected 2018
Slide 9

Plan for the Future Blue Ribbon Panel
Members appointed by Governor Pence Co-Chaired by Lt. Gov. Sue Ellsperman and Cathy Langham,
of Langham Logistics Members included representatives from state and local
government, higher education, manufacturing, logistics, and technology firms
Directive: Recommend priority projects for short-term Provide long-term vision of Indiana’s transportation
infrastructure
Conexus Regional Plan Facilitating six regional “mini” blue ribbon panels Looking at regional and local projects across all modes Prioritizing recommendations into four tiers Providing cost estimates for project delivery
Slide 10

State Project Milestones
I-65: Added travel lanesCounty Line Rd to Southport Rd – Greenfield DistrictMain St to County Line Rd – Seymour District
Substantially complete December 2015
I-65: Added travel lanesSR 38 to SR 26 & SR 26 to SR 25 – Crawfordsville District
Substantially complete December 2017
Road reconstructionLafayette Center Road/CR 900 – Fort Wayne District
Substantially complete December 2017
First $200 Million 2020 Funds
Plan for the Future – Major Moves 2020
State Project Milestones
I-65: Added travel lanesWhiteland Rd to Main Street & SR 44 to Whiteland Rd – Greenfield District
Substantially complete December 2016
I-69: Added travel lanesSR 37 (N. Jct.) to Exit 210 (old SR 238) with interchange modification to ? – Greenfield District
October 2015 letting
I-65: Added travel lanesOld SR 311 to Memphis Rd – Seymour District
Substantially complete December 2017
Second $200 Million 2020 Funds
FY16-17 $100M x 2 = $200M
Slide 11

Plan for the Future
Cambridge Systematics Study Authorized by 2014 General Assembly INDOT contracted for study in October
2014
Study Goals: Evaluate current transportation funding Evaluate transportation needs &
performance Analyze most promising funding
mechanisms
Report to Legislature Anticipated Fall 2015 Slide 12

Five Year Funding Utilization
2014 2015 2016 2017 2018 2019 2020 $-
$500.0
$1,000.0
$1,500.0
$2,000.0
$2,500.0
4 4 3 3 3 2 2
30 15 16
243 322 342
407313
262 275
72
58
60
54
35
15 15
Debt Service Operations P3 Major New Preservation Contingency 2020 Trust Fund LPA/MPO
Revenue
Millions
Contracts to Be Let
Slide 13

One INDOT Results
On-Time and On-Budget Take Care of What We Have Customer Satisfaction
Slide 14
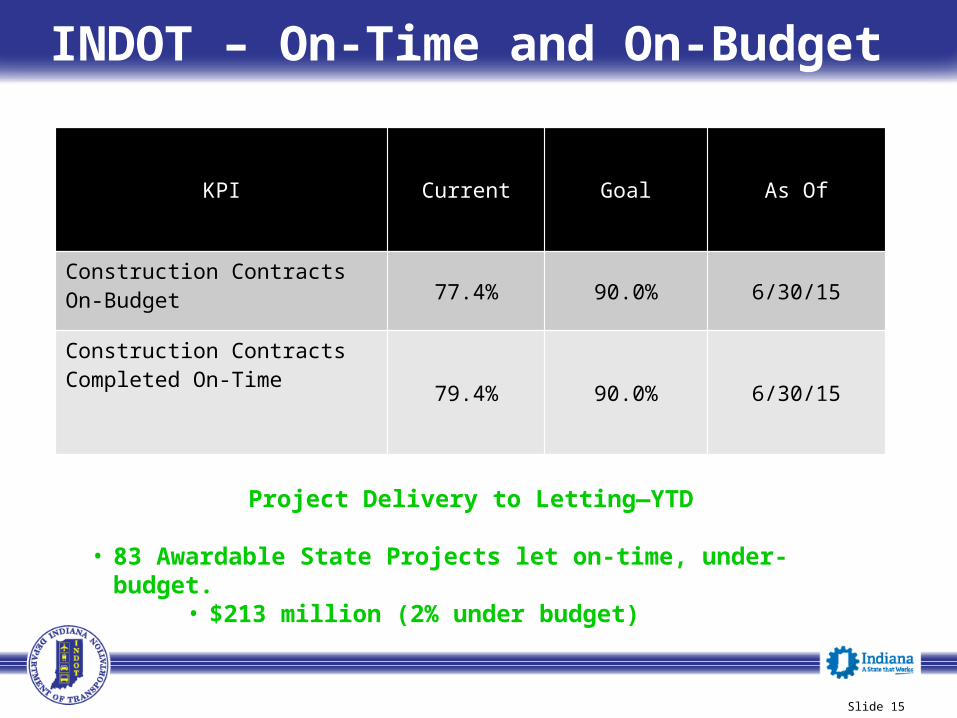
INDOT – On-Time and On-Budget
KPI Current Goal As Of
Construction ContractsOn-Budget 77.4% 90.0% 6/30/15
Construction Contracts Completed On-Time
79.4% 90.0% 6/30/15
Slide 15
Project Delivery to Letting—YTD
• 83 Awardable State Projects let on-time, under-budget.• $213 million (2% under budget)

Take Care of What We Have: Bridges
Bridge quality will decline within the next 5 years at current funding levels.
Fair category is growing, which is more costly down the line.
Outcomes of Bridge Quality at Currently Programmed Funding Levels
Through 2018 and at $300M from 2019-2024.
2014 2016 2018 2020 2022 2024 -
1,000
2,000
3,000
4,000
5,000
6,000
373 335 597 719 646 682
1,007 1,197
1,694 1,409 1,444 1,705
2,059 1,873
1,712 2,394 2,515
2,455
1,996 2,046 1,448
913 830 593
Poor Fair Satisfactory Good+
Slide 16

Pavement Surface Conditions Over 10-Years for Current Funding Trends
Pavement condition should remain relatively static at the current investment levels.
IN policy for CAFR reporting, minimum requirement (12.2%)
100%
1000%
9,4
86
9,4
72
9,5
13
9,5
26
9,4
74
9,3
95
9,3
56
9,3
18
9,2
79
9,2
40
9,2
02
Poor Fair Good
Miles
of
Roadw
ay
$299M $275M $417M $380MAssumes Flat $322M Annual Investments 2018-2024
2014 2015 2016 2017 2018 2019 2020 2021 2022 2023 2024
Take Care of What We Have: Roadways
Slide 17

Take Care of What We Have
Challenges of Preservation Public Satisfaction Work Zone Safety – Active Traffic Resource Allocation
Scheduling / Planning Getting Projects to Letting Contract Administration Construction Inspection
Slide 18
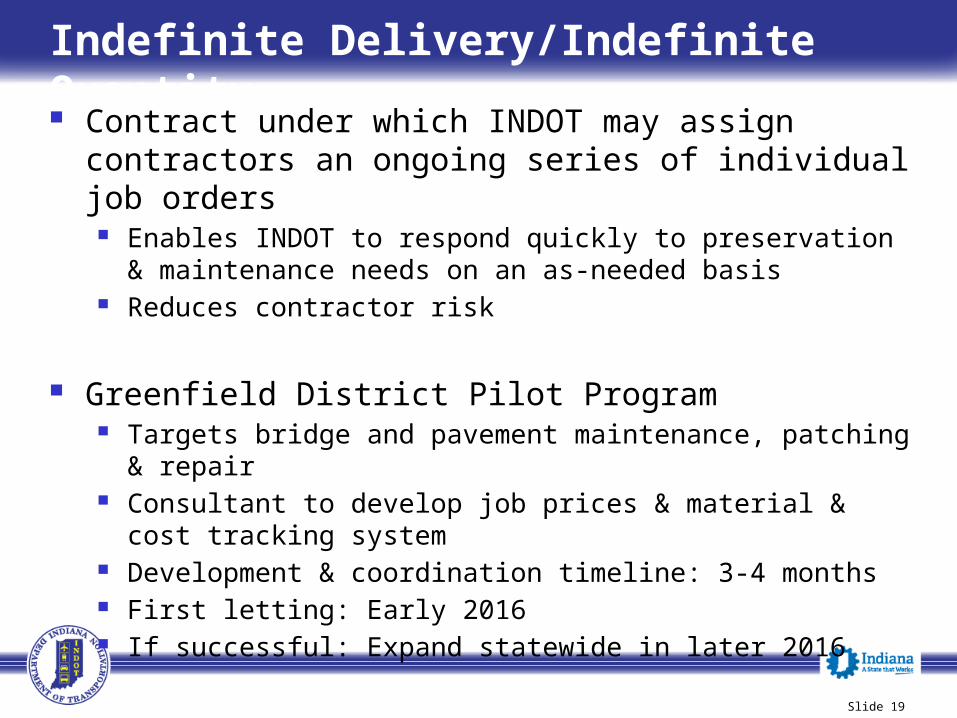
Indefinite Delivery/Indefinite Quantity Contract under which INDOT may assign
contractors an ongoing series of individual job orders
Enables INDOT to respond quickly to preservation & maintenance needs on an as-needed basis
Reduces contractor risk
Greenfield District Pilot Program Targets bridge and pavement maintenance, patching &
repair Consultant to develop job prices & material & cost tracking
system Development & coordination timeline: 3-4 months First letting: Early 2016 If successful: Expand statewide in later 2016
Slide 19

Take Care of What We Have - Employees Be an employer of choice Attract & retain talent Develop new talent Improve INDOT’s culture
Slide 20

Customer Satisfaction Collaborative Partnership –
Stakeholders Motorists/Taxpayers INDOT Employees FHWA Local Elected Officials Indiana Legislature/U.S. Congress Business Community Governor’s Office Media Consultant/Contractor Industry Cities & Towns
Slide 21
Working Better Together
Teamwork……….the fuel that allows common people to attain uncommon results.
‒ Andrew Carnegie
Slide 22