induced seismicity associated with enhanced geothermal systems
TRANSCRIPT

Geothermics 36 (2007) 185–222
Induced seismicity associated with EnhancedGeothermal Systems
Ernest L. Majer a,∗, Roy Baria b, Mitch Stark c, Stephen Oates d,Julian Bommer e, Bill Smith f, Hiroshi Asanuma g
a Lawrence Berkeley National Laboratory, #1 Cyclotron Road, MS 90-R1116, Berkeley, CA 94720, USAb MIL-TECH UK Ltd., 62 Rosewood Way, West End, Woking, Surrey GU24 9PF, UK
c Calpine Corp., 10350 Socrates Mine Road, Middletown, CA 95461, USAd Shell International Exploration and Production, Kesslerpark 1, 2288-GS Rijswijk-ZH, The Netherlands
e Civil and Environmental Engineering, Imperial College London, South Kensington Campus, London SW7 2AZ, UKf Northern California Power Agency, Middletown, P.O. Box 663, Middletown, CA 95461, USA
g Graduate School of Environmental Studies, Tohoku University, 980-8579 Sendai, Japan
Received 21 September 2006; accepted 20 March 2007Available online 3 May 2007
Abstract
Enhanced Geothermal Systems (EGS) have the potential to make a significant contribution to the worldenergy inventory. One controversial issue associated with EGS, however, is the impact of induced seismicityor microseismicity, which has been the cause of delays and threatened cancellation of at least two EGS projectsworldwide. Although microseismicity has in fact had few (or no) adverse physical effects on operations oron surrounding communities, there remains public concern over the amount and magnitude of the seismicityassociated with current and future EGS operations. The primary objectives of this paper are to present anup-to-date review of what is already known about the seismicity induced during the creation and operationof EGS, and of the gaps in our knowledge that, once addressed, should lead to an improved understanding ofthe mechanisms generating the events. Several case histories also illustrate a number of technical and publicacceptance issues. We conclude that EGS-induced seismicity need not pose a threat to the development ofgeothermal energy resources if site selection is carried out properly, community issues are handled adequatelyand operators understand the underlying mechanisms causing the events. Induced seismicity could indeedprove beneficial, in that it can be used to monitor the effectiveness of EGS operations and shed light ongeothermal reservoir processes.© 2007 CNR. Published by Elsevier Ltd. All rights reserved.
Keywords: Induced seismicity; Enhanced Geothermal Systems (EGS); The Geysers; Cooper Basin; Berlın; Soultz-sous-Forets
∗ Corresponding author. Tel.: +1 510 486 6709; fax: +1 510 486 5686.E-mail address: [email protected] (E.L. Majer).
0375-6505/$30.00 © 2007 CNR. Published by Elsevier Ltd. All rights reserved.doi:10.1016/j.geothermics.2007.03.003

186 E.L. Majer et al. / Geothermics 36 (2007) 185–222
1. Introduction
1.1. Objectives
To produce geothermal energy economically on a commercial scale, sufficient fluid and per-meability must be present in the targeted subsurface hot rock masses. In many cases, there is aneed to increase permeability and/or fluid content, i.e. to enhance the natural geothermal sys-tems. One of the issues associated with Enhanced Geothermal Systems (EGS) is the effect androle of the seismicity (or microseismicity) induced during the creation, or improvement in theproperties, of an underground reservoir and subsequent extraction of geothermal energy (i.e. hotfluids) (Majer et al., 2005). Microseismicity has been successfully dealt with in a variety of envi-ronments. Cypser and Davis (1998) set out the legal responsibilities of reservoir impoundmentprojects, as well as oil and gas, mining and geothermal operations. In this paper, we review ourcurrent knowledge on the seismicity induced during the development and operation of enhancedgeothermal systems, and highlight the gaps in knowledge that are an obstacle to a thorough under-standing of the mechanisms generating the seismic events; we also present information that willhopefully prove useful when drafting and implementing protocols for monitoring and addressingcommunity issues associated with induced seismicity.
1.2. History and motivation for the study
Naturally fractured hydrothermal systems are the easiest sources from which to extract heatstored in the subsurface rocks, but the total resource and its availability tend to be restricted tocertain areas. Their development proceeds where conditions are ideal for cost-efficient extraction.These hydrothermal systems are sometimes difficult to locate and also run a high risk of not beingcommercially feasible, if their geological, physical and chemical characteristics are not favourable.
The reasons for developing EGS technology are two-fold: (1) to bring uneconomic hydrother-mal systems into production by improving their underground conditions (stimulation); and (2) toengineer an underground condition that creates a hydrothermal system, whereby injected fluidscan be heated by circulation through a hot fractured region at depth and then brought to the surfaceto deliver the captured heat for power conversion or other uses. The second approach expands theavailable heat resource significantly and reduces the uncertainty of exploitation costs. However,the process of enhancing permeability and the subsequent extraction of energy may often generatemicroseismic events.
Induced seismicity is an important reservoir management tool, especially for EGS projects, butit is also perceived as a problem in some communities near geothermal fields. Events of magnitude2 and above near certain projects (e.g. the Soultz project in France; Baria et al., 2005) have raisedresidents’ concern related to both damage from single events and their cumulative effects (Majeret al., 2005). Some residents believe that the induced seismicity may result in structural damagesimilar to that caused by larger natural earthquakes. There is also fear that the small events maybe the precursors of larger ones to come, that not enough resources have been invested in findingsolutions to the problems associated with larger induced events, or in providing for independentmonitoring of the seismicity prior to large-scale fluid injection and production operations. Duringthe final phases of preparing this paper (December 2006–January 2007), a number of perceptibleevents (of magnitude1 3.4 or less) occurred in Basel, Switzerland, in the vicinity of the Deep
1 Unless indicated otherwise all “magnitudes” correspond to local magnitudes (i.e. Local Richter Magnitude).

E.L. Majer et al. / Geothermics 36 (2007) 185–222 187
Heat Mining project (http://www.dhm.ch/dhm-drillingInBasel.html). No structural damage wasreported but the local authorities suspended operations until investigations were completed; itis not certain whether this project will be allowed to continue (see Section 9 below). This is anexample of how a more comprehensive site selection study and understanding of the nature of theseismicity would have benefited the community at large, as well as the operators liaising with thepublic.
In recognition of the large potential of the geothermal resource worldwide, and in acknowledge-ment of the misunderstandings that might arise with regard to induced seismicity, the InternationalEnergy Agency (IEA) drafted a Geothermal Implementing Agreement (GIA), which took the formof an international collaboration (Majer et al., 2005). The mission of this collaboration, as statedin the “Environmental Impacts of Geothermal Development, Sub Task D, Seismic Risk fromFluid Injection into Enhanced Geothermal Systems Implementing Agreement (IEA/GIA)”, is asfollows:
Participants will pursue a collaborative effort to address an issue of significant concern to theacceptance of geothermal energy in general but EGS in particular. The issue is the occurrenceof seismic events in conjunction with EGS reservoir development or subsequent extraction ofheat from underground. These events have been large enough to be felt by populations livingin the vicinity of current geothermal development sites. The objective is to investigate theseevents to obtain a better understanding of why they occur so that they can either be avoided ormitigated. Understanding requires considerable effort to assess and generate an appropriatesource parameter model, testing of the model, and then calculating the source parametersin relation to the hydraulic injection history, stress field and the geological background.An interaction between stress modeling, rock mechanics and source parameter calculationis essential. Once the mechanism of the events is understood, the injection process, thecreation of an engineered geothermal reservoir, or the extraction of heat over a prolongedperiod may need to be modified to reduce or eliminate the occurrence of large events.
As an initial starting point for achieving a consensus, three international workshops wereorganized with participants from a variety of backgrounds, including geothermal companies andoperators. They were held during the Annual Meeting of the Geothermal Resources Council, Reno,NV, USA, in October 2005, and the annual Workshop on Geothermal Reservoir Engineering,Stanford University, Stanford, CA, USA, held in February 2005 and February 2006 (Majer et al.,2005; Baria et al., 2006). We present the results of these workshops, along with recent updatesand recommendations for future studies and fieldwork.
2. Relevant seismological concepts and history of non-geothermal-induced seismicity
Seismicity has been linked to a number of human activities, such as mining/rock removal(McGarr, 1976; Richardson and Jordan, 2002), fluid extraction in the oil and gas industry (Segall,1989; Grasso, 1992; Segall et al., 1994), fluid injection (Raleigh et al., 1972; Seeber et al., 2004),reservoir impoundment (Simpson, 1976), and cavity collapses as a result of underground nuclearexplosions (Boucher et al., 1969).
Seismicity in general occurs over many different time and spatial scales. Growth faults in theoverpressurized zones of the Gulf Coast of the United States are one example of a slow earthquake,as is creep along an active fault zone (Mauk et al., 1981). The size of an earthquake (or how muchenergy is released from it) depends on how much slip occurs along the fault, how much stressthere is on the fault before slipping, how fast it fails, and over how large an area it occurs (Brune

188 E.L. Majer et al. / Geothermics 36 (2007) 185–222
and Thatcher, 2002). Damaging earthquakes (usually greater than magnitude 4 or 5; Bommer etal., 2001) require the surfaces to slip over relatively large distances (in the order of kilometres).In most regions where there are commercial-size geothermal resources, there is tectonic activity.These areas of high tectonic activity are more prone to seismicity than more stable areas suchas the centre of continents (Brune and Thatcher, 2002) (note, however, that one of the largestearthquakes ever to occur in the U.S. was the New Madrid, Missouri, series of events in the early1800s, near the geographic centre of North America). It must also be noted that seismic activityis only a risk if (1) it is of sufficient magnitude and (2) it is close enough to a population orinfrastructure.
Large or damaging earthquakes tend to take place on developed or active fault systems. In otherwords, large earthquakes rarely occur where no fault exists, and the small ones do not last longenough to release substantial energy. It is also difficult to create a large, new fault, because there isusually a pre-existing fault that will slip first. For example, all significant historical activity abovemagnitude 5.0 that has been observed in California has occurred on pre-existing faults (Bulletinsof the Seismographic Stations, University of California, Berkeley).
Another noteworthy aspect of earthquake activity is that the magnitude of an event is determinedby the size of the fault rupture (in addition to the forces available) and the strength of the rock.It has been shown that, in almost all cases, large earthquakes (magnitude 6 and above) start atdepths of at least 5–10 km (Brune and Thatcher, 2002). It is only at depth that enough energy canbe stored to provide the force required to move the large volumes of rock needed to trigger a largeearthquake.
Water injection seems to be one of the most common causes of induced seismicity. Almosthalf a century ago, Hubbert and Rubey (1959) suggested that an increase in pore pressure wouldreduce the “effective strength of rock” and thus weaken a fault. The seismicity (many events over a10-year period, the largest having a magnitude of 5.3) associated with fluid disposal operations atthe Rocky Mountain Arsenal in Colorado, USA (with injection rates of up to 30 million L/monthover a 4-year period) was directly related to this phenomenon, involving a significant increase inthe pore pressure at depth, which reduced the “effective strength” of the rocks in the subsurface(Brune and Thatcher, 2002).
The size, rate, and manner of seismicity are controlled by the rate and amount of fluid injected,the orientation of the stress field relative to the pore-pressure increase, the extensiveness of thelocal fault system, and (last but not least) the deviatoric stress field in the subsurface, i.e. howmuch excess stress is available to cause an earthquake (Cornet et al., 1992; Cornet and Scotti,1992; Cornet and Julien, 1993; Cornet and Jianmin, 1995; Brune and Thatcher, 2002).
3. Description of Enhanced Geothermal Systems (EGS)
An Enhanced Geothermal System (EGS) is an engineered subsurface heat exchanger designedeither to extract geothermal energy under circumstances in which conventional production isuneconomic, or to improve and potentially expand the heat extraction operations so that theybecome more economic. Most commonly, an EGS is needed wherever the reservoir rocks arehot but their permeability is low. In such systems, permeability may be enhanced by hydraulicfracturing, high-rate water injection, and/or chemical stimulation (Allis, 1982; Batra et al., 1984;Fehler, 1989; Beauce et al., 1991). Once permeability is increased, production can be sustained byinjecting the heat-depleted geothermal water (supplemented as required from external sources)back into the reservoir and circulating it through the newly created permeability, where it is heatedas it travels from the injection to the production wells. As circulation proceeds, the rocks in contact
E.L. Majer et al. / Geothermics 36 (2007) 185–222 189
with the water will cool and crack and some minerals will dissolve, creating new permeability,expanding the reservoir further and exposing new rock surfaces from which to mine the heatstored in the subsurface rock masses.
Other EGS schemes focus on improving the chemistry of the natural reservoir fluid. Steamimpurities such as non-condensable gases decrease the efficiency of the power plants, and acidconstituents (principally HCl and H2SO4) cause corrosion in wells, pipelines, and turbines (Bariaet al., 2005). Water injection is again an important EGS tool for tackling these fluid chemistryproblems.
3.1. Induced seismicity within EGS applications
Each of the major EGS techniques, i.e. hydrofracturing, fluid injection, or acidization, has beenused to some extent in selected geothermal fields, and in most cases there is some information onthe seismicity (or lack thereof) induced by these operations. Specific examples are discussed inthe case histories given below.
Hydrofracturing, by definition and design, is a form of induced seismicity. This technique hasbeen used extensively in the oil and gas industry to engineer permeability in tight rock formations.Hydrofracturing takes place when the fluid-injection pressure exceeds the rock fracture gradientand tensile failure occurs, creating a “driven” fracture. The failure should end when the pressure isno longer above the fracture gradient. However, shear failure has also been observed in associationwith hydrofracturing operations. In many instances, because of the very high frequency signalsof tensile failure (seismic source at the crack tip only), microseismic monitoring can detect shearfailure only. We do not know of any cases where hydrofracturing induced damaging earthquakes(Majer et al., 2005; Baria et al., 2006).
Injection at sub-hydrofracture pressures can also induce seismicity, as documented in a numberof EGS projects (e.g. Mauk et al., 1981; Ludwin et al., 1982; Stevenson, 1985; Sherburn et al.,1990; O’Connell and Johnson, 1991). These studies of low-pressure injection-induced seismicityin geothermal fields have concluded that the events are predominantly of low magnitude. (Thelargest recorded event so far was a 4.6 earthquake at The Geysers field in Northern California inthe 1980s, when fluid production was at its peak. Since then, there have been a few magnitude 4events, but none as large as the event in the early 1980s. Almost all other induced seismicity atother geothermal fields has been in the range of magnitude 3 or less.)
3.2. Mechanisms of induced seismicity in geothermal environments
Induced seismicity has been documented in a number of operating geothermal fields and EGSprojects. In the most significant of these, thousands of small events are generated annually. Theseare predominantly microearthquakes (MEQs) not felt by people, but also include earthquakes ofmagnitudes up to the 4–5 range. At other sites, the induced seismicity may be entirely of verylow magnitudes, or a short-lived transient phenomenon. These MEQ events have led to little orno damage in most of the operating hydrothermal fields around the world.
There are several different mechanisms that have been hypothesized to explain the occurrenceof induced seismicity in geothermal settings.
3.2.1. Pore-pressure increaseAs explained above, in a process known as effective stress reduction, increased fluid pressure
can decrease static friction and thereby facilitate seismic slip in the presence of a deviatoric

190 E.L. Majer et al. / Geothermics 36 (2007) 185–222
stress field. In such cases, the seismicity is driven by the local stress field, but triggered on anexisting fracture by the pore-pressure increase. In many instances, the pore pressure requiredto shear favourably oriented joints can be very low, and vast numbers of microseismic eventsoccur as the pressure migrates away from the wellbore in a preferred direction associated withthe direction of maximum principal stress. In a geothermal field, one obvious mechanism is fluidinjection, which can increase pore pressure locally and thus may account for high seismicityaround injection wells, if there are local regions of low permeability. At higher pressures, fluidinjection can exceed the rock strength, actually creating new fractures in the rock (as discussedabove).
3.2.2. Temperature decreaseCool fluids interacting with hot rocks can cause contraction of fracture surfaces, in a process
known as thermoelastic strain. As with effective stress, the slight opening of the fracture reducesstatic friction and triggers slip along a fracture that is already near failure in a regional stressfield. Alternatively, cool fluid–hot rock interactions can create fractures and seismicity directlyrelated to thermal contraction. In some cases, researchers have detected non-shear components,indicating tensile failure, contraction, or spalling mechanisms.
3.2.3. Volume change due to fluid withdrawal/injectionAs fluid is produced from (or injected into) an underground resource, the reservoir rock may
compact or be stressed. These volume changes cause a perturbation in local stress conditions,which are already close to the failure state (geothermal systems are typically located withinfaulted regions under high states of stress). This situation can lead to seismic slip within or aroundthe reservoir. A similar phenomenon occurs where solid material is removed underground, suchas in mines, leading to “rockbursts,” as the surrounding rock adjusts to the newly created voidspace.
3.2.4. Chemical alteration of fracture surfacesInjecting non-native fluids into the formation (or allowing “outside fluids” to flow into the
reservoir in response to pressure drawdown) may cause geochemical alteration of fracture surfaces,thus changing the coefficient of friction on those surfaces. In the case of reduced friction, MEQs(smaller events) would be more likely to occur. Pennington et al. (1986) hypothesized that ifseismic barriers evolve and asperities form (resulting in increased friction), events larger thanMEQs may become more common.
All four mechanisms we have just described are of concern for EGS applications. The extentto which these subsurface phenomena are active within any specific situation is influenced by anumber of local and regional geologic conditions that can include the following:
1. Orientation and magnitude of the deviatoric stress field in relation to existing faults.2. Extent of faults and fractures: the magnitude of an earthquake is related to the area of fault
slippage and the stress drop across the fault. Larger faults have more potential for a largerseismic event, with the dominant frequency of the event related to the length of the shearingfault (i.e. in general, the longer the fault, the lower the dominant emitted frequency, and thewider the range of frequencies over which there is strong shaking, the greater the likelihood ofstructural damage). Larger earthquakes on larger faults also tend to be more damaging becauseof longer duration and increased energy content. Larger-magnitude events (3–4) can also begenerated by high stress drops on smaller faults, but the frequency emitted is too high to cause

E.L. Majer et al. / Geothermics 36 (2007) 185–222 191
structural damage. Observations at the Soultz site (see Section 8) showed that events in the localmagnitude range of 2–2.7 had dominant frequencies at around 90–100 Hz on the down-holebroad-band seismic sensors (4–1000 Hz). As a general rule, EGS projects should be carefulin conducting any operation that includes direct physical contact or hydraulic communicationwith large seismically active faults.
3. Rock mechanical properties (e.g. compaction coefficient, shear modulus, and ductility).4. Hydrologic factors (e.g. static pressure profile, existence of aquifers and aquacludes, and rock
permeability and porosity).5. Historical natural seismicity: in some cases, induced seismicity has occurred in places where
there was little or no baseline record of natural activity. In other instances, exploitation ofunderground resources in areas of high background seismicity has resulted in little or noinduced seismicity. Still, any assessment of induced seismicity potential should include astudy of historical earthquake activity.
It is clear from the above that large magnitude events are not a common phenomenon, sincethis requires that a variety of factors all come together at the right time (enough energy is storedin the subsurface to be released) and in the right place (on a fault large enough to produce a largeevent) for a significant earthquake to take place. It is also easy to understand why seismicity maytake the form of many small events.
Several conditions must therefore be met for significant (damaging) earthquakes to occur.There must be a fault system large enough to allow significant slip, forces must be presentto cause this slip along the fault (as opposed to some other direction), and these must begreater than the forces holding the fault together (the sum of the forces perpendicular to thefault, plus the strength of the material in the fault). Also, larger earthquakes, i.e. big enoughto cause damage to a structure, can usually only occur at depths greater than 5 km. Eventhough the fault ruptures extend to the ground surface, it is only the rupture at depth that isthought to produce significant seismic radiation; indeed, some ground-motion prediction equa-tions discount the contribution from ruptures within the uppermost 2–3 km (e.g. Campbell, 1997).The low seismogenic potential of the near-surface crust is also reflected in the finding thatburied fault ruptures produce stronger shaking than surface rupturing events (Kagawa et al.,2004).
4. Geothermal case studies
The case studies presented in the following sections describe different experiences with EGSprojects, and the technical and public perception issues that have been encountered. These projectsare representative of a variety of conditions (see also Knoll, 1992; Talebi, 1998; Guha, 2000).
4.1. Technical approach
The objective of fluid injection is to increase the productivity of the reservoir. Each case historywill have different technical specifications and conditions. Important parameters in the design ofinjection programs are: (1) injection pressure, (2) injection volume, (3) injection rate, (4) temper-ature of the injected fluids, (5) chemistry of the injectate, (6) continuity of injection, (7) locationand depth of injection, (8) in situ stress magnitudes and patterns, (9) rock fracture/permeability,and (10) historical seismicity.

192 E.L. Majer et al. / Geothermics 36 (2007) 185–222
4.2. Public concerns
Each site will also differ in the level and type of community concern. Some geothermal areasare very remote, so that there is little public anxiety with regard to induced seismicity. Some sites,on the other hand, are near or close to urban areas. Felt seismicity may be perceived as an isolatedannoyance, but there also may be concern about the cumulative effects of repeated events and thepossibility of larger earthquakes in the future.
4.3. Commonalities and lessons learned
To formulate recommendations on how to mitigate the effects of induced seismicity, we mustfirst examine the aspects common to the different environments and any lessons learned to date.In some cases a preliminary examination of the data revealed an emerging pattern of larger eventsoccurring on the edges of the injection areas, even after injection had ended. In other instances,there was an initial burst of seismicity as injection commenced, but then seismicity decreased oreven ceased as the injection rate stabilized.
The case histories discussed in this study are The Geysers (USA), Cooper Basin (Australia),Berlın (El Salvador), Soultz-sous-Forets (France), and briefly, Basel (Switzerland).
4.3.1. The Geysers, USAA large body of seismic and production/injection data has been compiled over the last 35
years, and induced seismicity at The Geysers has been tied to both steam production andwater injection. Supplemental injection projects met strong community opposition, despiteprior studies predicting less than significant impact. The opposition has abated somewhatbecause of improved communications with residents and actual experience with the increasedinjection.
4.3.2. Cooper Basin, AustraliaCooper Basin is an example of a new project with the potential for massive injection. Test
injections have triggered seismic events with magnitude above 3.0. The project is, however, in aremote area, and there is little or no community concern.
4.3.3. Berlın, El SalvadorAt Berlın the EGS project is on the margins of a producing geothermal field. The proponents
have developed and implemented a procedure for managing injection-induced seismicity thatinvolves simple criteria to determine whether injection should continue (see detailed case historybelow). This procedure could prove applicable to other EGS projects.
4.3.4. Soultz-sous-Forets, FranceSoultz is a well-studied example, with many types of data collected over the last 15 years in
addition to the seismic data. The EGS reservoirs were created at two depths (3500 and 5000 m),with the deeper reservoir aimed at proving the concept at great depth and high temperature(200 ◦C). Concern about induced seismicity has curtailed activities, and no further large-scalehydraulic stimulations are planned until the issues raised by the local community have beenresolved (i.e. microseismicity and possible damage to structures from an event of around localmagnitude 2.9).

E.L. Majer et al. / Geothermics 36 (2007) 185–222 193
4.3.5. Basel Deep Heat Mining, SwitzerlandThis very recent project at Basel was suspended during the revision of this paper as a result
of induced seismicity. It is too early to include a detailed report, but given the relevance of theproject to the issues being discussed here, we have provided a brief overview.
5. The Geysers geothermal field, USA
The Geysers vapour-dominated geothermal field is located about 120 km north of San Fran-cisco, California (Fig. 1). The area is in the Coastal Ranges and is influenced by the generalstrike-slip tectonics of Northern California. Oppenheimer (1986) described the tectonic setting asextensional, with the regional stress field predominating over locally induced stresses, mainly asa result of reservoir contraction. Note that, although there are several faults nearby, there are nomapped through-going faults (Oppenheimer, 1986).
The Geysers is a good case study for several reasons. Seismicity has been monitored fora number of years, creating one of the most comprehensive data sets available. In addition,two large injection projects over the last 9 years have provided the opportunity to examine theseismicity (and changes in seismicity) resulting from large influxes of water. Finally, but of no lessimportance, seismic arrays have been deployed over the entire field, not just the planned injectionregion, to examine the field-wide response to injection.
The increased microearthquake activity at The Geysers results from a diverse set of mech-anisms: that is, there is not one “triggering” mechanism, but rather a variety of processes inoperation, working independently, together, or superimposed on one another to enhance or reduce
Fig. 1. Location of seismic events in Northern California with magnitudes greater than 3.0 and less than 5.0, from January1900 to mid-May 2004. M: Local magnitude (source: The Berkeley Seismographic Laboratory, Northern CaliforniaEarthquake Data Center; NCEDC).

194 E.L. Majer et al. / Geothermics 36 (2007) 185–222
seismicity. For example, as water is injected into the reservoir, there is an obvious cooling, a changein pore pressure (at least locally around the injection wells), and possibly wider-ranging stresseffects. A long-held hypothesis is that volume change caused by fluid withdrawal (or injection)causes local stress redistribution. In an area already near to failure, MEQ activity could thereforebe activated.
Vapour-dominated and very hot “sealed ” geothermal reservoirs, by their very nature, are water-short systems. Without the injected water, the geothermal resources of these areas would be under-utilized. High-temperature, water-short systems are prime candidates for enhanced geothermalactivities. The increases in injection rates and the spatial extent of injection, however, have raisedlocal community concern regarding the social and economic impact of injection-related seismicity.
Injection operations have been carried out at The Geysers for many years, but there have beentwo particularly large increases in the injection rates since the mid 1980s. The first started in1997, when a 46.4 km long pipeline began delivering treated wastewater and lake water fromLake County (to the north) at a rate of about 22 million L/day. The second started in 2003 withthe delivery of about 30 million L/day of treated wastewater from the city of Santa Rosa to TheGeysers through a 64 km pipeline.
Many studies have demonstrated that MEQs at The Geysers are associated with water injectionand steam extraction (Majer and McEvilly, 1979; Eberhart-Phillips and Oppenheimer, 1984;Oppenheimer, 1986; Enedy et al., 1992; Stark, 1992, 2003; Foulger et al., 1997; Kirkpatricket al., 1999; Ross et al., 1999; Smith et al., 2000; Antony Mossop, personal communication,July 2004; Majer and Peterson, 2005). These investigations conclude that there is a definitecorrelation of spatial and temporal MEQ distributions with injection/production data. The eventsthat occur are consistent with the regional stress field, but there are also studies that suggest thatnon-double-couple events are also occurring (e.g. Ross et al., 1996).
Pore fluid depletion has also been shown to correlate with seismicity at The Geysers(Gunasekera et al., 2003). Antony Mossop (personal communication, July 2004) makes a compre-hensive correlation study based on induced seismicity and operational data from 1976 to 1998.He identified three types of induced seismicity of high significance: (1) shallow production-induced seismicity that has a long time lag (on the order of 1 year); (2) deep injection-inducedseismicity with a short time lag (<2 months); and (3) deep production-induced seismicity withshort time lag, <2 months, that appears to diminish in the late 1980s. Studying one specific casein detail, he found that shallow MEQs are well correlated to injection, rather than production,and with a relatively short time lag of about one week. For shallow MEQs, there might be along-term effect caused by the overall steam production and local short-term responses related toinjections.
Fig. 1 shows the historical seismicity of Northern California over the last 100 years betweenmagnitudes 3.0 and 5.0 (there have been no events located at The Geysers greater than 5.0). As canbe seen from this figure, the historical seismicity of events over 3.0 in the area has not been highduring this 100-year period. The seismicity since 1965 (roughly the date of significant productionat The Geysers) is given in Fig. 2, which reveals that the seismicity below magnitude 3.0 has beenincreasing significantly over the years. The steam production and seismicity trends clearly divergeafter additional sources of water (other than condensed steam) were used for injection, starting inthe late 1980s. The level of seismicity is shown to have very little (if any) direct relationship withproduction. Also, the “injection” chart is scaled such that the injection and seismicity values, at thetime of the injection peak in 1998, plot more or less together. What is striking is that the injectionand seismicity plots are now very similar for every year thereafter (including the recent periodof increasing Santa Rosa wastewater deliveries), as well as being quite similar for all the years

E.L. Majer et al. / Geothermics 36 (2007) 185–222 195
Fig. 2. Historical seismicity from 1965 to October 2006 at The Geysers. Data are from the Northern California EarthquakeData Center (NCEDC). The two arrows indicate the increases in fluid injection in 1997 and 2002 (Bill Smith, personalcommunication, June 2006). M: Local magnitude; 1 billion lbs: ∼454 × 106 tons.
previous to 1998. This finding clearly indicates a remarkably strong correlation of seismicity withfluid injection, a correlation that has been rather consistent throughout the past 30 years.
These data seem to confirm that shallow and deep induced MEQs occurring after the 1980sare correlated to local injection rates, after a certain time lag (Enedy et al., 1992; Stark, 1992,2003; Romero et al., 1995; Kirkpatrick et al., 1999; Smith et al., 2000). For example, Stark (1992)showed that plumes of MEQs are clustered around many injection wells, and the seismic activityaround each of these wells correlates with its injection rate.
The location of the wells and pipelines for the two large injection projects at The Geysers,and of the various seismic arrays [the Northern California Seismic Network (NCSN) of the U.S.Geological Survey (USGS), the geothermal operator’s array (Calpine Corporation; Calpine), andthe Lawrence Berkeley National Laboratory (LBNL) array installed in 2001] is shown in Fig. 3.Each of these arrays was designed for a different sensitivity and purpose.
Fig. 2 shows that seismicity increases with injection, but not at all levels. Taking the largerevents only (i.e. those with magnitudes of around 3), the seismicity has remained fairly constantsince 1985.
Definite patterns emerge from The Geysers data gathered by the LBNL array. Fig. 4 showsall of the events located by this array in October 2003 (1 month prior to the start of injectionof treated Santa Rosa wastewaters); the seismicity in March 2004 (after the injection start-up inDecember 2003) is given in Fig. 5. Also shown in these figures is the location of the magnitude 4.4event of 18 February 2004. These two periods were chosen because the seismic array was fullyoperational throughout. The plots clearly show an increase in overall seismicity in the injectionarea. As stated before, this is typical of seismicity at The Geysers, and some or all of the increasemay just be normal seasonal variation as the non-Santa Rosa water injection ramps up.
Low-magnitude seismicity increased in the Southeast (SE) Geysers when supplemental injec-tion began there (Beall et al., 1999; Kirkpatrick et al., 1999; Smith et al., 2000), and it is notsurprising that it is occurring now. If past experience is any indication, the system will reachequilibrium as time goes on, and seismicity will level off and possibly decrease. It has been our

196 E.L. Majer et al. / Geothermics 36 (2007) 185–222
Fig. 3. Location of seismic stations, pipelines, and injection wells at The Geysers. SEGEP: South East Geysers EffluentProject; SRGRP: Santa Rosa Geothermal Reinjection Project; NCSN: Northern California Seismic Network of the U.S.Geological Survey (USGS); CALPINE: Calpine Corporation; LBNL: Lawrence Berkeley National Laboratory; MGD:million gallons per day (1 gallon = 3.785 L).
experience that the initial injections will perturb the system, cause an increase in seismicity, thenlevel off and/or decrease. The time to reach equilibrium will be a function of the size of thedisturbance and the volume of the affected area.
Injection rate also seems to be an important factor. One hypothesis worth considering is that,if the rate of increase in injection is varied (giving the system a chance to equilibrate), theremay be less initial seismicity. Also, as pointed out with respect to the historical seismicity at TheGeysers, the yearly seismic energy release is actually decreasing (Majer and Peterson, 2005).The recent injections may reverse this trend, but it is too early in the monitoring process to drawconclusions.
There have been queries about the trend of the maximum event. The largest recorded so far atThe Geysers occurred in 1982 (4.6 magnitude), but during 2006 there were three of magnitudegreater than 4.0 (see Fig. 2). The maximum event will depend upon the size of the fault availablefor slippage, as well as the stress redistribution caused by fluid injection and production. To date,there have been no faults mapped in The Geysers that would generate an event of magnitude 5.0or greater. This is not an absolute guarantee that one would not happen, but it does lower thelikelihood of larger events. There are several possible approaches to this issue, one of which is tocarry out fractal analysis (Henderson et al., 1999) or use probabilistic seismic analysis. However,

E.L. Majer et al. / Geothermics 36 (2007) 185–222 197
Fig. 4. Location of all seismic events in The Geysers field in October 2003, 2 months prior to start of injection of treatedSanta Rosa wastewaters. Squares: location of injection wells. Large star: approximate location of the magnitude 4.4 eventof 18 February 2004. LBNL: Lawrence Berkeley National Laboratory; NCSN: Northern California Seismic Network ofthe USGS.
it is not clear whether, in cases of induced seismicity, probabilistic seismic hazard analysis wouldbe reliable (Bommer and Abrahamson, 2006).
In terms of public response, the community around The Geysers is worrying more about thenumber of MEQs and the largest-magnitude event. In light of this anxiety, the following consensusopinion was presented to the local seismic advisory board by David Oppenheimer (USGS), ErnestMajer (LBNL), Mitch Stark (Calpine) and William Smith (Northern California Power Agency,NCPA), which reflected their current understanding of The Geysers seismicity and should beconsidered a work in progress. As more data are collected, interpretations may change.2
1. The region surrounding The Geysers is tectonically stressed, cut by numerous faults, andsubject to a high level of earthquake activity. In The Geysers field, there are no mapped faultsactive in the last 10,000 years (as determined by geologic mapping). The Collayomi Fault,running approximately 1.6 km NE of the field limit, is mapped as an inactive fault. The nearestactive fault is the Mayacamas Fault, located about 6 km SW of the field limit. On the LakeCounty side, the active Konocti Bay fault system is located approximately 13 km north of thefield limit.
2. Pre-production baseline data sets, though incomplete, strongly indicate that little seismicityoccurred in the field for at least 10 years prior to the 1960 start-up of commercial production.
2 The observations that follow are not endorsed by Calpine, LBNL, NCPA or USGS. They represent the professionalopinions of the authors, based on many years of studying seismicity at The Geysers, and on relevant publications.

198 E.L. Majer et al. / Geothermics 36 (2007) 185–222
Fig. 5. Location of all seismic events in The Geysers field in March 2004. Squares: injection wells. Large star: approximatelocation of the magnitude 4.4 event of 18 February 2004. LBNL: Lawrence Berkeley National Laboratory. NCSN: NorthernCalifornia Seismic Network of the USGS.
3. Seismicity has become more frequent and has expanded as field development expanded.Scientists who have studied The Geysers’ seismicity universally agree that most of theseearthquakes have been induced by geothermal activities. It is likely that both injection andproduction operations have contributed to induced seismicity.
4. Earthquake frequency and magnitude distributions at The Geysers have been approximatelystable since 1985. Since 1980, two or three events per decade of magnitude ≥4.0 haveoccurred, along with an average of about 18 events per year of magnitude ≥3.0. In the 2 years(2004 and 2005) after starting injection of the Santa Rosa wastewater, the number of eventswith magnitudes higher than 4.0 increased. The largest Geysers earthquake ever recorded hada magnitude 4.6 in 1982. Based on Greensfelder’s (1996) analysis of historical seismicity, andsupported by the intensive fracturing, the absence of continuous long faults, and the lack ofalignment of earthquake epicentres, it has been tentatively inferred that the largest earthquakepossible at The Geysers would be of magnitude 5.0.
5. Production-induced seismicity is very evident on a field-wide scale, but is not tied to specificwells. That is because there are hundreds of producing wells, and the mechanical effects ofsteam production (principally reservoir pressure decline and heat extraction) are diffuse andspread out into the reservoir. Indeed, seismicity occurs in reservoir regions well beyond thelocation of geothermal production and fluid injection wells. Since 1987, steam productionhas declined substantially, but seismicity has remained stable.
6. Injection-induced seismicity is very evident on a field-wide scale, but is not tied to beingprimarily downward from some injection wells. At such a well, the seismic clouds gener-ally appear shortly after injection begins, and earthquake activity within each cloud shows

E.L. Majer et al. / Geothermics 36 (2007) 185–222 199
good temporal correlation with injection rates. It has been demonstrated in several papersand environmental analyses (Raleigh et al., 1972; Majer and McEvilly, 1979; Allis, 1982;Ludwin et al., 1982; Oppenheimer, 1986; Fehler, 1989; Foulger et al., 1997; Kirkpatrick etal., 1999; Majer and Peterson, 2005; Bommer et al., 2006) that injection-induced seismicity isgenerally of low magnitude (≤3.0). On a field-wide basis, seismicity of magnitude ≥1.5 hasgenerally followed injection trends, but this correlation has not been observed for earthquakesof magnitude ≥3.0.
7. Seismicity in the vicinity of Power Plant 15 (located SW of injection well OF45A12; seeFig. 3), which ceased production in 1989, had also stopped by the end of 1990. However, thishas not been the case in the vicinity of the CCPA plant (located NE of injection well DX19;see Fig. 3), where production ceased in 1996, but seismicity has continued up to the present.
8. Since 1989, the SE Geysers area has experienced a long-term increase in earthquakes ofmagnitude ≥1.5. Magnitude 1.5 is the minimum magnitude of uniform detection thresholdsince 1979. The same general trend has been observed in the part of the SE Geysers study areawithin 3.2 km of Anderson Springs (the general location of this town is shown in Figs. 4 and 5).
9. Injection rates in the SE Geysers doubled starting in late 1997, owing to the introduction ofSE Geysers Effluent Pipeline (SEGEP) water from Lake County. This injection-rate doublingdid not lead to any significant change in the continuing rate of increase for seismic eventsof magnitude ≥1.5 in the SE Geysers area. Events of magnitude ≥2.5 initially continued atabout the pre-pipeline rate for the next 4 years, but they have increased more recently, alongwith events of magnitude 1.5 and greater, even though injection in the area has been reduced.Consequently, the seismicity observed in this area during the 2000–2006 period is apparentlynot directly related to the injection of wastewater from these pipeline operations.
10. A preliminary analysis of the amplitudes of recorded earthquakes in the Anderson Springsarea suggests that, theoretically, shaking large enough to be felt by residents occurs about1.5 times per day on the average. Measured peak accelerations are generally consistent withthe observations reported by residents; i.e. in the Modified Mercalli Scale II to VI range.However, reports of higher-intensity damage, such as the fall of a large tree and a retainingwall, are clearly not consistent with seismicity as the singular cause.
6. Cooper Basin, Australia
Cooper Basin is an example of a geothermal resource under development, located in thenortheast of South Australia, close to Moomba (not in the figure), in a sparsely populated region(Fig. 6). In 2003, Geodynamics Limited, Australia, drilled the first injection well (Habanero-1)into a granitic basement to a depth of 4421 m (754 m into granite) (Asanuma et al., 2005a; Baischet al., 2006). The granite basement is overlain by 3.6 km of sediments. The main stimulation of thiswell, i.e. water injected into a hot zone to induce fracturing, took place after several tests to initiatefractures in the granite (Fracture Initiation Tests, FIT) and evaluate their hydraulic characteristics(long-term flow test, LFT). The total amount of liquid injected was 20,000 m3, with a maximumpumping rate of 48 L/s. Temperature and flow profiles taken in the open-hole section indicatedan outflow zone at 4254 m depth. The main stimulation started on 30 November and ended on 9December 2003. The casing was then perforated between 3994 and 4136 m depth and pressurizedin several cycles between 12 and 22 December 2003 (Asanuma et al., 2005a; Baisch et al., 2006).
Seismic events were detected by the network from the initial stage of the FIT, when the pumpingrate was around 8 L/s. The monitoring array was a local eight-station network of three-componentgeophones in boreholes between 88 and 1793 m depth (see Fig. 6). The recording system was a

200 E.L. Majer et al. / Geothermics 36 (2007) 185–222
Fig. 6. Location of Cooper Basin and of the seismic stations at the site. The 4421-m deep Habanero-1 injection well islocated at the origin of the local coordinate system (27◦48′59′′S/140◦45′35′′E). Depth of instrument shown in parentheses(Baisch et al., 2006).
16 bit, 5 kHz system in triggered mode (Asanuma et al., 2005a). Seismic signals were picked upby the deep detector (at 1700 m depth) and in most cases also by the near-surface stations, withclear onsets of P and S waves. Asanuma et al. (2005a) recorded 32,000 triggers, with 11,724 ofthem located in 3D space and time on site during the stimulations.
During the FIT, LFT, and the main injection tests, Asanuma et al. (2005a) observed severalevents approaching magnitudes of 3.7. The largest event occurred at 00:03 on 14 November 2003.This event was detected by the Australian national earthquake-monitoring network of GeoscienceAustralia (GA) and had a moment magnitude M (as defined by Hanks and Kanamori, 1979) of3.7. Because of the unexpectedly large seismic vibration, the trace was saturated just after theP-wave onset, and most of the information on the trace after the saturation was lost. Consequently,the length of the coda was used to estimate the local magnitude and calibrated to the momentmagnitude by means of two reference events. One is the previously mentioned largest event thathad a duration time of 180 s. The other reference event was one that had a critical amplitude forsaturation with a duration time of 63 s. From experience with the same detectors at Japanese HotDry Rock (HDR) sites (Asanuma et al., 2005a), where the configuration of the seismic sourceand detector is similar to the one at the site in the Cooper Basin, such critically saturated eventshave a moment magnitude M of 1.0, although the attenuation in the Australian and Japanese sitesmay be different.
These results were used to calibrate the moment magnitude of all the events to the frequencydistribution of the moment magnitude. Following the Gutenberg–Richter law (Richter, 1958),

E.L. Majer et al. / Geothermics 36 (2007) 185–222 201
Fig. 7. Plan view of seismicity at the Cooper Basin site associated with the injection of fluids. (a) Location of eventsbefore the M3 event (large star), (b) location after the M3 event. The size of the symbols (stars and dots) are correlated tomagnitude. The circles are the radii of the source area of a magnitude 3 event (Asanuma et al., 2005b).
the accumulated histogram of event magnitudes plotted on a logarithmic scale should define alinear relationship. In this case, however, there is an apparent inflection point at around M 1.0,suggesting that the seismic origin or mechanism may be different for events with magnitudehigher than M 1.0. Hence the designation of such events as “big events ” (30 of such events in theFIT and LFT were analyzed). We assume that these bigger events were caused by rapid fractureextension.
Microseismic events were manually clustered in the FIT and LFT by their location and theorigin time, because the extension of the seismic cloud at the Cooper Basin site was heterogeneous.An example of the location of the events before and after the big events, where an extensionof the seismic cloud was clearly seen after the 3.0 event, is shown in Fig. 7. The size of thecircle at the location of the MEQs shows the source radius of the event estimated from themoment magnitude. In this case, the seismic cloud subsequently extends beyond the magnitude3.0 events, which occurs at the edge of the seismic cloud. In a recent study, Baisch et al. (2006)find that “the hypocenter distribution exhibits a high degree of spatio-temporal ordering, withthe seismic activity systematically migrating away from the injection well with increasing time.Previously activated regions become seismically quiet, indicating relaxation processes. High-resolution relative hypocenter locations determined for clusters of “similar” events locally reducethe apparent thickness of the structure to the level of a few tens of meters, indicating that thereservoir is dominated by a single fracture zone only.”
In view of the above, the physical processes responsible for the big events at the Cooper Basinsite are similar to those responsible for the smaller events, namely:
- The induced slip of the existing sub-horizontal fracture at this site can be modelled by slip on aplane containing heterogeneously distributed asperities. It has been revealed that the size of theasperity is correlated to the moment magnitude of the earthquake in the case of repeating eventsat a tectonic plate boundary. Assuming that scaling applies, one would expect the same to holdtrue on most faults. In the same manner, the magnitude of the earthquakes may be correlated tothe size of the asperity, and the “aftershock ” MEQs within the source radius of the big events

202 E.L. Majer et al. / Geothermics 36 (2007) 185–222
may be correlated to the non-geometrical shape of the asperity or asperities remaining afterthose larger events.
- It is reasonable to assume that, prior to the larger events, water could not flow easily beyondthe asperity, and that the subsequent extension of the seismic cloud after those events indicatesan improvement in permeability.
- The fact that larger events occurred after shut-in lends support to the theory that the initial stressstate of the fractures was critical/overcritical.
There was no distinct change in wellhead pressure associated with the larger events, whichmay indicate that reservoir capacity at this site in the Cooper Basin is very large compared to theimprovement in permeability caused by a big event.
In terms of public acceptance, the site is remote, with few inhabitants in the vicinity; thus thereis little cause for concern as regards the possible effects of induced seismicity.
7. Berlın, El Salvador
The Berlın case history is an example of a project with a built-in warning system for monitoring,quantifying and controlling the risk associated with induced seismicity. The system is summarizedhere; full details are given in Bommer et al. (2006).
In 2003, hydraulic stimulations were carried out at the Berlın geothermal field (Fig. 8), as partof a feasibility study for hot fractured rock (HFR) power generation. The HFR project at Berlınpresented an unusual problem, in terms of induced ground shaking. El Salvador is in a region ofvery high seismic activity, affected by two principal sources of earthquakes: the subduction ofthe Cocos Plate beneath the Caribbean Plate in the Middle America Trench, producing Benioff-Wadati zones, and shallow crustal events coincident with the chain of Quaternary volcanoes (e.g.Dewey et al., 2004).
Fig. 8. Location of the most important geothermal areas in El Salvador.

E.L. Majer et al. / Geothermics 36 (2007) 185–222 203
Fig. 9. Berlın geothermal field. Location of wells, including the trace of injection well TR8A, and of seismic stations,and elevations in metres above sea level (Bommer et al., 2006).
Large-magnitude earthquakes in the subduction zone tend to cause moderately intense shakingacross large parts of southern El Salvador, an example of such an event being the 13 January 2001earthquake of moment magnitude (M) 7.7. Greater risk is represented by the smaller-magnitudeshallow, crustal earthquakes that occur along the Salvadoran volcanic chain, close to populationcentres. The Berlın field is not in the vicinity of the larger destructive earthquakes that haveaffected other locations along that chain, although the area experienced shaking during the 1951Jucuapa-Chinameca earthquakes to the east (Ambraseys et al., 2001) and the M 6.6 earthquakeof 13 February 2001 to the west (Bommer et al., 2002).
The geothermal field, located on the flanks of the Cerro Tecapa volcano (last eruption thoughtto have been in 1878), was developed in the 1990s. The Comision Hidroelectrica del Rıo Lempa(CEL), the state electricity company, began electricity production at Berlın in 1992. At the moment,54 MWe are being generated from eight production wells; water separated from the steam is beingdisposed of at a temperature of 183 ◦C using 10 injection wells. The depths range from about700 m for some of the shallow injection wells down to approximately 2500 m for the deeperproduction and injection wells.
The field development activities at Berlın included a surface seismic monitoring array, theBerlın Surface Seismic Network (BSSN) (see Fig. 9), which was brought into use in 1996 tomonitor events in and around the field. Since long-term seismic monitoring began after the startof commercial-scale fluid extraction and injection, it is difficult to say with any confidence whetherthe observed seismic activity is triggered by the ongoing field exploitation activities, or is rather amanifestation of the hydrothermal activity around the volcano. There is the suggestion within theBSSN catalogue that seismicity rates can be correlated with production and injection rates (Rivaset al., 2005). That is, fluid production increased at Berlın shortly before the large earthquakes of

204 E.L. Majer et al. / Geothermics 36 (2007) 185–222
13 January and 13 February 2001, and these events led to a step change in the observed localseismicity rate. The second possibility, that local seismicity is a manifestation of the field’s naturalhydrothermal state, supports the theory that, in a fracture-dominated geothermal field, it is only thestill seismically active faults or fractures that will remain permeable, by virtue of their continuedmovement (rather than becoming sealed by mineralization). In this way, one could argue thatmicroseismic monitoring is a valid geothermal exploration tool.
Fracture stimulation was expected to generate only small-magnitude earthquakes, if any, and theproject took place in a region that had been strongly shaken by major earthquakes less than 3 yearsearlier. However, the need to ensure that the HFR geothermal project would be environmentallyfriendly in all aspects, and the highly vulnerable nature of many of the local buildings, madeit necessary to consider any perceptible ground motions that might be generated locally by therock fracturing process. A key requisite was that the induced seismicity associated with thereservoir stimulation at depths of 1–2 km should not produce levels of surface ground shakingthat would present a threat or serious disturbance to those living in and around the geothermalfield.
The specific context and conditions of the Berlın HFR project required the development ofa calibrated control system, dubbed “traffic light”, in order to enable real-time monitoring andmanagement of the induced seismic vibrations. An important factor in this case is the high naturalseismicity of the region, and the fact that it is perfectly feasible for an earthquake to occur duringor after the injection operations without there being any direct connection to these activities. Amost delicate situation would arise were damage to occur as a result of such a natural earthquake,because it would be difficult to establish the degree to which the damage was exacerbated by struc-tural weakening of the houses in the area resulting from ground shaking induced by the injectionprocess up to that time. Similarly, if a natural earthquake does cause damage, the vulnerabilityassessment information used for the baseline seismic risk assessment and the upper thresholdson the traffic lights may both need to be revised. Cypser and Davis (1998), in their discussionof liability under U.S. law for the effects of induced seismicity, state the following: “Seismicityinduced by one source might accelerate failure of support originating from another source, leavingboth of the parties at fault proportionally liable to the injured parties.”
The first step was to estimate the likely dominant frequency of any ground motions thatmight occur as a result of the HFR project. Accelerograph recordings of small-magnitude earth-quakes were used for this purpose, particularly those recorded in the 1985 swarms in Berlınand nearby Santiago de Marıa; information on these swarms can be found on the Internet(http://www.snet.gob.sv/Geologia/Sismologia/1enjamb.htm). The response spectra from theserecordings consistently showed a pronounced peak at a period close to 0.1 s; hence, 10 Hz wasadopted as the central frequency and used to infer thresholds. This may appear to be a rather highfrequency for buildings, but it is appropriate to the heavy, low-rise dwellings common in the area.
The final stage in designing the monitoring system was to infer a series of Peak Ground Velocity(PGV) thresholds based on those indicated in Fig. 10 for lower levels of shaking (controlledby human response) and on vulnerability curves defined for the local buildings for the higherlevels (controlled by structural damage). In both cases, the inferred levels were checked againstthe implied intensity levels for each PGV threshold and the consequent human or structuralresponses, using the data and relationship of Wald et al. (1999). There was inevitably a significantdegree of “expert judgment” involved in making these inferences, and, in the face of uncertainty,conservative decisions were made; this was particularly the case since, as explained below, thetraffic light operated on the basis of median predicted PGV values and did not account for thealeatory variability in the ground-motion predictions.

E.L. Majer et al. / Geothermics 36 (2007) 185–222 205
Fig. 10. (a) Levels of human sensitivity to vibration caused by blasting (adapted from USACE, 1972); (b) reference levelsfor traffic-induced vibration (adapted from Barneich, 1985); (c) thresholds for vibrations caused by pile-driving (adaptedfrom Athanasopoulos and Pelekis, 2000) (Bommer et al., 2006).
The seismic monitoring system (supplied by ISS International) deployed around injection wellTR8A (Fig. 9) allowed real-time monitoring and processing of the recorded seismicity, so thatthe traffic light program (Fig. 11) could be executed automatically at specified time intervals,reading the event catalogue for a specified number of days up to the time of execution. For eachevent, a PGV-equivalent magnitude, Mequiv, was calculated using a predictive equation for PGVs
Fig. 11. “Traffic light ” boundaries superimposed on event recurrence defined in terms of magnitudes adjusted to producethe epicentral Peak Ground Velocity (PGV) if their focal depths were exactly 2 km. Triangles represent the cumulativerecurrence data from the three episodes of fluid injection (totalling 54 days of pumping) normalized to a period of 30 days(adapted from Bommer et al., 2006); see text for further details.

206 E.L. Majer et al. / Geothermics 36 (2007) 185–222
based on recordings from seismic swarms in El Salvador. The median values of the equation,which relates PGV to magnitude and hypocentral distance, were used to estimate the magnitude,Mequiv, required for an event located at a depth of 2 km to produce the observed epicentral PGVof a given event. A Gutenberg–Richter type plot of log10[N(Mequiv)] against Mequiv was then con-structed for the data and plotted in a window on the monitoring system’s computer. The thresholdsof PGV were expressed in terms of Mequiv, so that they could then be displayed on this pseudo-Gutenberg–Richter plot to allow a rapid assessment of the environmental compliance of the ongo-ing fluid injection operation using high-capacity, high-pressure pumps. The boundaries on the traf-fic light were then interpreted as follows, in terms of guiding decisions regarding these operations:
• Red: The lower magnitude bound of the red zone is the level of ground shaking at which damageto buildings in the area is expected to set in. Injection is suspended immediately.
• Amber: The amber zone is defined by ground-motion levels at which people would be aware ofthe seismic activity associated with the hydraulic stimulation, but damage would be unlikely.Pumping proceeds with caution, possibly at reduced flow rates, and observations are intensified.
• Green: The green zone is characterized by levels of ground motion that are either below thethreshold of general detectability or, at higher ground-motion levels, at occurrence rates lowerthan the already-established background activity level in the area. Injection operations proceedas planned.
The sloping part of the boundary between the green and amber zones (Fig. 11) reflects therecurrence data over a 30-day period for the background seismicity prior to the initiation of theHFR project. The rationale behind this boundary was that if the induced activity did not exceedthe natural levels of microseismicity, there would be no problem with continuing the hydraulicstimulations.
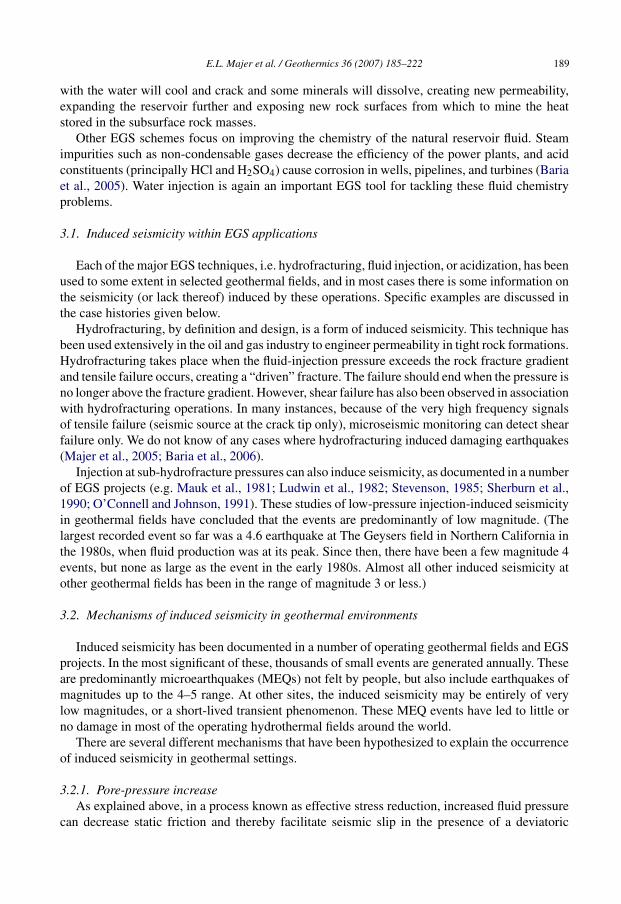
Preliminary analysis of the seismicity and injection rates at the Berlın field showed an approxi-mate doubling of the seismic event rate during periods of fluid injection. However, the correlationobserved was much less convincing than at Soultz (see Section 8). This finding was in partreflected in the conservative decision to consider a large area of interest for the traffic-light cal-culations, because of possible general ambiguity regarding the cause of seismic events in thegeothermal field. Closer inspection of the seismicity revealed two distinct zones of activity, one inthe general area of the producing geothermal field and another (which only became notably activeduring injection) directly around well TR8A. Plotting the cumulative seismic moment release ofthis cluster of events around that injection well against the cumulative pumped volume for thethree periods of injections between July 2003 and January 2004 showed a remarkable correlation(Fig. 12), leaving little doubt that this seismic activity was induced directly by the fluid injectionaimed at rock fracture stimulation.
The strongest recorded ground motion was produced by a magnitude 4.4 event on 16 September2003, occurring about 3 km to the south of injection well TR8A, two weeks after shut-in of thesecond period of injection. This large event had a preferred fault-plane solution corresponding toa nearly east-west, right-lateral, strike-slip rupture. An important question that arises is whetherthis event, located on the opposite side of the producing geothermal field from TR8A, couldnevertheless have been triggered by the pumping operations in that well. Given the location,timing, and low level of induced seismicity observed around TR8A, this seems unlikely, but alsoof relevance in this respect is the observation that in some other reported cases of injection-inducedseismicity, the largest triggered events have been observed after the shut-in of injection operations(Raleigh et al., 1972).
E.L. Majer et al. / Geothermics 36 (2007) 185–222 207
Fig. 12. Comparison of cumulative pumped (injected) fluid volume at the Berlın geothermal field and induced seismicityexpressed in terms of cumulative seismic movement, using seismicity data from the immediate vicinity of injection wellTR8A (adapted from Bommer et al., 2006).
During the reservoir stimulation activities, generally a much lower level of induced seismicitywas encountered than had been anticipated, such that the boundaries of the traffic-light systemwere not tested. The major shortcoming of this type of approach is that it does not address theissue of seismicity that occurs after the end of the injection period.
The results of the Berlın study show that the seismic hazard presented by ground shaking,caused by small-magnitude earthquakes induced by anthropogenic activities, presents a verydifferent problem from the usual considerations of seismic danger in the engineering design ofnew structures. On the one hand, the levels of ground shaking that may be generated, particularlyin an environment such as rural El Salvador (where the buildings are very vulnerable), are belowthe levels that would normally be considered of relevance to engineering design. Indeed, inprobabilistic seismic hazard analysis (PSHA) for engineering purposes, it is common practiceto specify a lower bound of magnitude 5, on the basis that smaller events are not likely to be ofengineering significance (e.g. Bommer et al., 2001). On the other hand, unlike the risks associatedwith natural seismicity, we have the possibility of actually controlling, to some degree, the inducedhazard by reducing or terminating the activity that is generating the small events.
8. Soultz-sous-Forets, France
Research at the European Hot Dry Rock (HDR) site at Soultz-sous-Forets (hereafter referredto as Soultz only) started in 1987, following encouragement by the European Commission to poolFrance’s limited available funds to form a coordinated multinational team. The main task was todevelop the technology needed to access the vast HDR energy resource at the site, about 50 kmnorth of Strasbourg, in Alsace, France (Fig. 13). Various authors (e.g. Baria et al., 1993, 1995,2000, 2004, 2005; Garnish et al., 1994; Baumgartner et al., 1995, 1998; Gerard et al., 2006) haveprovided summaries of the various stages of development of this technology at Soultz since 1987.It should be noted that the site is located in a zone of minor natural earthquake hazard, as definedby the seismic risk authority in France (Fig. 14).
The European HDR test site lies on the northern flank of the Rhine Graben, which forms partof the Western European rift system (Villemin, 1986). The rift extends approximately N–S for300 km from Mainz (central Germany) to Basel (Switzerland). The Soultz granite that intrudes the

208 E.L. Majer et al. / Geothermics 36 (2007) 185–222
Fig. 13. Location and schematic geology for the Hot Dry Rock project at Soultz-sous-Forets, Alsace, France. Concentriccircles correspond to well GPK1 (adapted from Baria et al., 2005).
Devonian–Early Carboniferous rocks is part of the same structural block that forms the crystallinebasement in the Northern Vosges.
The geology of the Soultz site and its tectonic setting have been described by Cautru (1987).The pre-Oligocene rocks that form the graben were down-thrown by a few hundred metres duringthe formation of this depressed crustal unit, which is about 320 million years old. The Soultzgranitic horst (above which the site is located) has subsided less than the graben. At the site thegranitic basement is overlain by a roughly 1400-m thick sedimentary column.
The geothermal research program at Soultz started with the drilling of well GPK-1 downto 2002 m depth in 1987, with the assumption that bottom-hole temperature would be around175 ◦C, but the actual temperature was around 140 ◦C. The basic properties of the rock mass wereacquired from hydro-fracture stress measurements and small-scale hydraulic injection tests. In1990, an attempt was made to carry out continuous coring in well EPS1 to a depth of 3200 m toattain 175 ◦C, but drilling had to be abandoned at 2227 m because the well had deviated in excessof 20◦. In 1992–1993, GPK-1 was deepened to 3590 m (Baria et al., 1993; Baumgartner et al.,1995) and has a 6 1/4-in. diameter open-hole about 780 m in length. The bottom-hole temperaturewas found to be 160 ◦C instead of the anticipated 175 ◦C.About 3 years later (in 1995), GPK-2was drilled to 3890 m, approximately 450 m south of GPK-1, and was subsequently deepened to5084 m in 1999 to attain a temperature of 202 ◦C. Another well, GPK3, is a 5000 m deviated welldrilled in 2002–2003, whose bottom is located about 600 m south of that of GPK2 (Fig. 15); thecasing shoe was set at 4556 m depth. GPK4, the second deviated production well, was drilled in

E.L. Majer et al. / Geothermics 36 (2007) 185–222 209
Fig. 14. Position of the Soultz Hot Dry Rock project (arrow) relative to seismically active zones in France.
2004 to a depth of 5260 m (true vertical depth: 4982 m), with its bottom-hole about 1200 m fromthe wellhead (Baumgartner et al., 2005).
The temperature gradient in the Soultz area has been determined based on numerous boreholemeasurements. It starts at about 10.5 ◦C/100 m in the upper 900 m, decreasing to 1.5 ◦C/100 mdown to 2350 m, then increasing to 3 ◦C/100 m from around 3500 m to the maximum depthmeasured (5000 m), where the mean temperature is about 200 ◦C.Well GPK1 was hydraulicallystimulated in 1993, and GPK2 in 1995 and 1996, increasing the injectivity of the reservoir at3200 m depth to ∼0.4 L/(s-bar), the best achieved for an HDR/EGS project at that time (Baria etal., 1999a). Following the deepening of well GPK2 from 3890 to 5084 m in 1999, stimulation wascarried out in 2000 and the injectivity of GPK-2 improved from 0.02–0.03 to ∼0.4–0.6 L/(s-bar).Following the stimulation of GPK2, injection well GPK3 was targeted on the basis of informationgathered using various methods (including microseismic, hydraulic, stress, and jointing charac-teristics). Similarly, GPK4 (second production well) was also targeted on a similar basis to thatused for GPK3 (Baria et al., 2005; Baumgartner et al., 2005).
The first successful forced circulation test, of 4 months duration, was carried out in 1997between GPK-1 and GPK-2. This test demonstrated that the HDR/EGS concept works with a

210 E.L. Majer et al. / Geothermics 36 (2007) 185–222
Fig. 15. Layout of the boreholes at the Soultz Hot Dry Rock project in 2004 (Baria et al., 2005).
bottom-hole separation of 450 m (Baria et al., 1995; Baumgartner et al., 1998). It was possible tocirculate continuously about 25 kg/s of brine, at more than 140 ◦C, without any water losses andusing 250 kWe pumping power only, compared to a thermal output of up to 10 MW. Tracer testsindicated a breakthrough volume of some 6500 m3; that is, 20 times higher than that achieved inRosemanowes (UK) and about 70 times higher than in the Hijiori (Japan) project (Baria et al.,1999a,b).
Information on the joint network at the Soultz site has been obtained from continuous cores inEPS1 and borehole imaging logs in GPK1 (Genter and Traineau, 1992a,b). The observations sug-gest that there are two principal joint sets striking N10E and N170E and dipping 65◦W and 70◦E,respectively. The granite is pervasively fractured, with a mean joint spacing of about 3.2 joints/m,but with considerable variations in fracture density.
The local stress regime was obtained using the hydrofracture stress measurement method(Rummel, 2004). The stress magnitude at Soultz as a function of depth (for 1458–3506 m depth)can be summarized as:
Sh = 15.8 + 0.0149 × (z − 1458)
SH = 23.7 + 0.0336 × (z − 1458)
Sv = 33.8 + 0.0255 × (z − 1377)

E.L. Majer et al. / Geothermics 36 (2007) 185–222 211
where Sh (minimum horizontal stress), SH (maximum horizontal stress) and Sv (overburden) aregiven in MPa, and z (depth) in metres.
A recent interpretation of the data suggests that the overburden stress may still be the maximumstress up to 5000 m depth, being very close to SH (Francois Cornet, personal communication,February 2005).
A microseismic network has been installed at the site (Fig. 15) to detect microseismic eventsduring fluid injection and locate their origins. The equipment consists of three 4-axis down-holeaccelerometers and two 3-axis down-hole geophones, linked to a fast seismic data acquisitionand processing system. The instruments were deployed at the bottom of wells 4550, 4601, EPS1,OPS4, and GPK1, between 1400 and 3600 m depth, where the temperatures are about 120 and160 ◦C, respectively. In addition, a surface network of about 35 seismic stations was installed by theEcole et Observatoire des Sciences de la Terre (EOST) in order to characterize larger events.Anindustrial consortium decided that a temperature of ∼200 ◦C would be more appropriate forproducing electrical power, so the decision was taken to drill deeper. GPK-2 was thus deepened to5084 m, where it encountered a temperature of 202 ◦C.In 2000, the open-hole section of GPK-2(4431–5084 m depth) was stimulated. Approximately 23,000 m3 of water were injected in stepsof 30, 40, and 50 L/s for 7 days. Seven days later, on 16 July 2002, a microseismic event ofmoment magnitude 2.4 occurred, during a small-volume injection test (Figs. 16 and 17). Thelocal inhabitants heard and felt it, and were concerned by the incident. A public meeting was heldwith the support of local mayors, during which the public was assured that further such eventswould be prevented wherever possible.
Following the triggering of the 2.4 M microseismic event, a committee of French experts wasset up to investigate the incident and find ways to avoid inducing events of similar, or greater,magnitude in the future. One of the various findings of this committee was that the larger eventswere generated by a sharp increase or decrease in pressure. This was written into the proceduresrequired for the stimulation of GPK3 and subsequent stimulations of deep wells at Soultz, althoughno evidence was given to substantiate the recommendations.
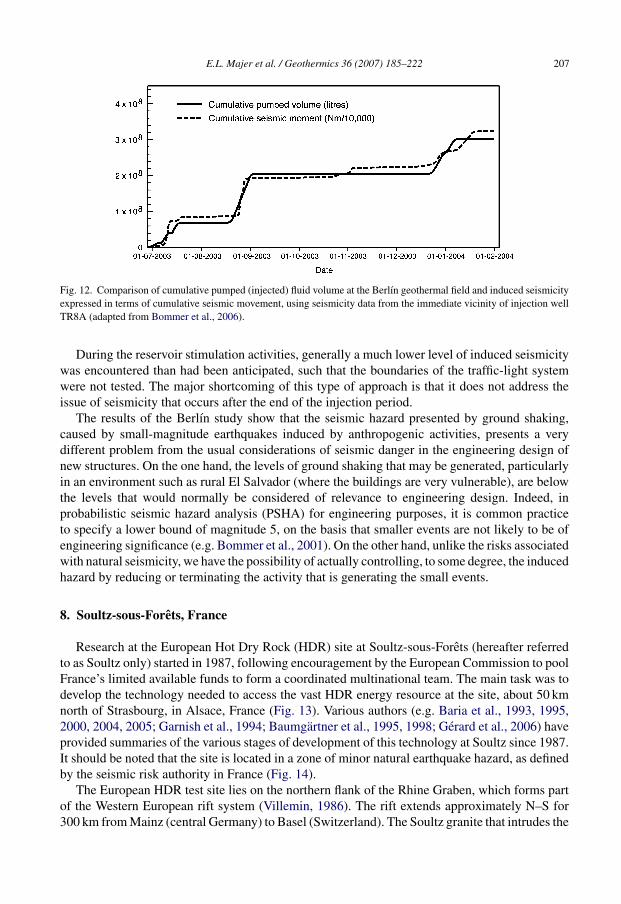
Abiding by these new procedures, the subsequent stimulation of GPK3 took longer and usedsignificantly more fluid. That is, about 40,000 m3 of water were injected into the reservoir at a rateof 20–80 L/s over about 11 days. During this injection, more than 400 events above magnitude 1.0were generated; about 30 were above 2.0. The largest, a magnitude 2.9 MEQ (Figs. 18 and 19),occurred about 2 days after shut-in (i.e. on 10 June 2003 at 22:54 GMT time).
These later events caused even greater unrest among the local population. Various publicmeetings were held to explain the situation, but this left the project with a credibility problem thathas been difficult to overcome. Fortunately, no structural damage was caused by these MEQs,but a number of residents did put in claims to insurance companies, which were turned downafter close examination. Seismic data from the down-hole sensors indicated that the predominantfrequency was around 90 Hz, which is unlikely to cause any structural damage. The reservoir wasput into production at lower fluid pressures to reduce the likelihood of generating further largemicroseismic events. Not surprisingly, the incident has made project management extremelysensitive to the generation of larger events. Attempts at stimulating GPK4, the third deep well (orthe second production well), have been unsuccessful so far, because of the curtailed activity andthe problems involved in finding alternative means of improving the hydraulic interconnectionbetween GPK3 and GPK4 (Baria et al., 2006).
The upshot is that, after finally breaking new ground in HDR technology (Baria et al., 1999b),the Soultz project is beginning to falter, largely because of the public outcry over the triggeredseismicity and the inability of existing management to break the impasse.

212 E.L. Majer et al. / Geothermics 36 (2007) 185–222
Fig. 16. Seismicity induced by the hydraulic stimulation of borehole GPK2 at Soultz-sous-Forets. Borehole traces arealso shown (Baria et al., 2005).
9. Basel Deep Heat Mining project, Switzerland
The Basel Deep Heat Mining project (http://www.dhm.ch/dhm-drillingInBasel.html) is a verypertinent case in point, as induced seismicity here has led to the suspension (and possible termi-nation) of the project; this has clearly important implications for the future development of EGStechnology. The project has two distinct features, one of which is its location in the middle of thecity of Basel; secondly, Basel itself is located in a high-stress region associated with the largestand most destructive earthquake in the history of Switzerland; in 1356 the city was in fact largelydestroyed by an earthquake of magnitude 6.5 or greater. One could also argue that Switzerland hasone of the most risk-adverse populations in Europe, if not in the world. With this background, itis surprising that a thorough seismic risk investigation/analysis was not done before going aheadwith the project.
The choice of site for the project, within the city, is related to the physics and economics of theheat mining energy extraction process. Energy conversion economics at 200 ◦C are marginal if itinvolves drilling 5-km deep wells into hard rock, as was the case in Basel. To make it economic, therejected heat from the conversion process has to be used too, and the most effective way of doing

E.L. Majer et al. / Geothermics 36 (2007) 185–222 213
Fig. 17. Injection rates and microseismic data for the hydraulic stimulation of borehole GPK2 at Soultz-sous-Forets.Arrow shows when the magnitude 2.4 event occurred. M: Local magnitude (Baria et al., 2005).
so is in district heating. A district heating grid requires a high population density since relativelylow-grade heat (<200 ◦C) cannot be transported long distances economically. The optimum sitefor this type of HFR geothermal project is in or very close to a city like Basel. A further incentivefor siting the well close to the consumer is that the temperature of the produced fluids decreaseswith time.
In areas where the population is sparse and, in some cases, economically dependent on thegeothermal extraction activities, we can expect a much higher tolerance of seismic risk. It isour opinion that until the citizens of Basel appreciate the benefits in terms of cheaper powerand district heating, they are unlikely to be easily convinced that the worst that can happen isperceptible ground shaking.
The Basel Deep Heat Mining project adopted the general framework of the “traffic light”system used at Berlın (see Section 7), but, in light of the sensitivities at Basel, used very lowthresholds for ground motion; for example, in Berlın “red” (i.e. suspension of fluid injection) wasdefined by a PGV threshold of 60 mm/s, whereas at Basel this threshold was specified as 5 mm/s(or a magnitude of 2.9). It is worth noting that in Berlın the threshold for appreciable damage wasdefined as 120 mm/s, but this reflects the highly vulnerable building stock in rural El Salvador;for engineered structures, damaging motions will generally need to have PGV values in excessof 200 mm/s (Martınez-Pereira and Bommer, 1998). We might add that at Basel the public was
214 E.L. Majer et al. / Geothermics 36 (2007) 185–222
Fig. 18. Seismicity induced by the stimulation of borehole GPK3 at Soultz-sous-Forets. Borehole traces are also shown(Baria et al., 2005).
provided with little in the way of information and advice with regard to the seismic aspects of sucha project in such a difficult environment, although a version of the IEA/GIA protocol was draftedand submitted for consideration to the IEA; the public was also informed of the local population’sreaction to smaller induced seismic events at Soultz. Blind faith in a technical procedure is not avalid substitute for proper site investigation and a due process of informing local residents. Bothare essential and should have been implemented vigorously.
The project at Basel began with a pre-simulation test, designed to determine the formationstrength at the borehole. The main stimulation started on 2 December 2006, when a total of11,566 m3 of water was injected. The maximum wellhead pressure reached 296 bar and injectionrates were ramped up to a maximum of 62.5 L/s. At 16:48 Universal Time Coordinated (UTC)on 8 December, a magnitude 3.4 earthquake occurred in very close proximity to the injectionwell; the event was widely felt throughout Basel and led to a bleed-off of the well. The maximumrecorded PGV value in the vicinity of the well was 9.3 mm/s, placing the motions in the “red”zone of the traffic light system as implemented, and leading to suspension of the pumping; the5 mm/s threshold was also exceeded at three other monitoring stations. The largest recordedpeak ground acceleration (PGA), at the station near the well, was 0.05 g (Nicolas Deichmann,personal communication, December 2006); PGA values in excess of 0.2 g are generally viewed as

E.L. Majer et al. / Geothermics 36 (2007) 185–222 215
Fig. 19. Injection rates and microseismic data for the stimulation of borehole GPK3, Soultz-sous-Forets (Baria et al.,2005).
a necessary, but not sufficient, condition for damaging motions (Martınez-Pereira and Bommer,1998).
10. Gaps in knowledge
As stated in the Introduction, following the three international technical workshops on inducedEGS seismicity held under the auspices of the IEA/GIA, it has been shown that existing scientificresearch, case histories, and industrial standards provide a solid basis for characterizing inducedseismicity and planning its monitoring. The focus for additional study should therefore be onthe beneficial use of induced seismicity as a tool for creating, sustaining, and characterizingthe enhanced subsurface heat exchangers, whose performance is crucial to the success of futureEGS projects. The following is a list of the primary scientific issues that were discussed at theseworkshops. They are listed in no particular order of priority, and are not meant to exclude others;they are merely the issues most discussed at the meetings.
1. Do the larger induced seismic events triggered during EGS operations exhibit patterns orcharacteristics that differ with respect to those of the natural seismicity in the area? It waspointed out that at Soultz, The Geysers, and other sites, the largest events tend to occur on thefringes, even outside the “main cloud ” of events and often well after injection ceases. Why isthis and what is the relation of this finding to the smaller events and to the stimulated reservoir?Moreover, large, apparently triggered events are often observed after shut-in of EGS injectionoperations, making such events still more difficult to control. The fact that such events areoften the largest seen in a particular seismic catalogue means that it is essential to develop a

216 E.L. Majer et al. / Geothermics 36 (2007) 185–222
solid understanding of the processes underlying the occurrence of post-shut-in seismicity. Thedevelopment and use of suitable coupled reservoir fluid flow/geomechanical simulation codeswill be a great help in this respect, and advances are being made in this area (see for example,Hazzard et al., 2002; Kohl and Megel, 2005; and Ghassemi et al., in press). Building detailedsubsurface models, and then running numerical simulations of the progress of the injected frontthrough these models, with simultaneous calculation of the corresponding triggered seismicity,would simulate likely conditions in which larger post-shut-in events could occur and thusprovide an explanation for the mechanism involved. Close analysis of an extensive suite ofsuch models should make it possible to identify the features required for this phenomenon tooccur. Laboratory acoustic-emission work would greatly help in this effort, by complementingthe numerical studies and helping to calibrate the models utilized.
2. What are the source parameters and mechanisms of induced events? The issue of stress dropversus fault size and moment is important. There is some evidence that large stress drops maybe occurring on small faults, resulting in larger-magnitude events than the conventional modelswould predict (Brune and Thatcher, 2002; Kanamori and Rivera, 2004). It was pointed out thatstress heterogeneity may be a key to understanding EGS seismicity. There are results to supportthis hypothesis (Baria et al., 2005). For example, the regional stress field must be determinedbefore any stability analysis is done, which (it was concluded) requires integration of varioustechniques such as borehole stress tests and source mechanism studies. It was also found thatinduced seismicity does not prove that the rock mass is close to failure; it merely pinpointslocal stress concentrations (Cornet et al., 1995). In addition, it was determined that, at Soultz,it took a 4–5 MPa pore-pressure increase over the in situ stress, at around 3500 m depth, toinduce seismicity in a freshly created fault, ignoring large-scale, pre-existing fractures. Finally,it is difficult to identify the failure criterion of large-scale, pre-existing faults, many of whichdo not have significant cohesion.
3. Can experiments be designed and performed to shed light on the key mechanisms causing EGSseismicity? Based on years of observing and studying induced seismicity in geothermal fields,many different mechanisms have been suggested: pore-pressure increase, thermal stresses,volume change, hydrothermal alteration, stress redistribution, and subsidence, to name justa few. Are repeating events a good sign or not? Does similarity of signals provide clues tooverall mechanisms? One proposed experiment is to study the injection of hot water versuscold water to determine whether thermal effects are the cause of seismicity. If we could comeup with a few key experiments to either eliminate or determine the relative effects of differentmechanisms, we would be heading in the right direction.
4. How does induced seismicity differ in naturally fractured systems from hydrofracturing envi-ronments? The variability of natural systems is quite large, from systems such as The Geysersto low-temperature systems, each differing in geologic and structural complexity. Do similarmechanisms apply, will it be necessary to start afresh with each geothermal area, or can welearn from each system, such that the seismicity of other sites will be easier to address?
5. Is it possible to mitigate the effects of induced seismicity and optimize production at the sametime? In other words, can EGS fracture networks be engineered to have both the desirableproperties for efficient heat extraction (large fracture surface area, reasonable permeability,etc.) and yet be generated by a process in which the associated induced seismicity does notexceed well-defined thresholds of tolerable ground shaking? The traffic-light system devel-oped by Bommer et al. (2006) goes some way to achieving this end, but the idea of fracturenetwork engineering, as introduced in Hazzard et al. (2002), should be further investigated.Microearthquake activity could be a sign of enhanced fluid paths, fracture opening/movement,

E.L. Majer et al. / Geothermics 36 (2007) 185–222 217
and possibly permeability enhancement (especially in hydrofracturing operations) or a repeatedmovement on an existing fault, or parts of a fault. The generation of seismicity is a measure ofhow we are perturbing an already dynamic system as a result of fluid injection or extraction.
6. What levels of induced ground motions are tolerable, in terms of amplitude and duration,and also frequency of occurrence, for exposed populations? At what levels of shaking do themotions become a threat to buildings and to the safety of their occupants? Robust answers tothese questions will require that ground motions be expressed in more complex forms thansingle parameters such as PGV, and will probably require the simultaneous use of two or moreparameters in vector combination.
7. Does a geothermal reservoir reach equilibrium? Steady state may be the wrong term, butenergy can be released in many different ways. Extraction of geothermal fluids (steam/hotwater) releases energy, as does seismicity, creep, subsidence, etc. (local and regional stressare the energy inputs or storage). It has been pointed out that, while the number of eventsat The Geysers is increasing, the average energy release (as measured by cumulative seismicmoment of events) is actually constant or slightly decreasing (Majer and Peterson, 2005). Ifthis decrease in energy occurs as the result of many small events, then it is a good thing, but if itoccurs as the result of a few big events, it would be undesirable. Hence the need to understandseismic magnitude distribution in both space and time.
11. Summary and conclusions
Three international workshops have been convened to date to address the issue of EGS-inducedseismicity. The learnings from a number of EGS projects should provide a firm foundation onwhich to build a clear understanding of, and a protocol for dealing with, induced seismicityassociated with EGS operations. To date there is no known instance of any large seismic eventassociated with EGS projects having caused any major damage or injury. However, the Soultz andBasel cases demonstrate that non-damaging but perceptible motions can impede the developmentof this technology for as long as the exposed population is not adequately informed and convincedof the cost–benefit balance between a green energy source and the inconvenience of occasional,but non-threatening, ground shaking. Indeed, in the case of the Basel project, the events that causeddisquiet among the city inhabitants were a long way from the thresholds for onset of damage.This, however, contrasts with a small number of cases in which seismicity induced by damming(Koyna, India), hydrocarbon production (Gazli, Uzbekistan) and waste disposal activities (RockyMountain Arsenal, USA) caused significant damage.
It is clear that there is no case for complacency in managing the EGS-induced seismicity issue.It appears that the occurrence of felt events may be a characteristic of EGS operations and itremains to be seen how such systems will behave seismically over the long term, after the initialperiod of stimulation. This is as yet uncharted territory since no EGS project has yet gone intolong-term production. Additional research and experience as well as the adoption and applicationof accepted best practices are required to prevent induced seismicity from delaying or hinderingthe acceptance of EGS.
During these workshops, scientists and engineers working on EGS seismicity have developedshort- and long-term guidelines. In the short term we have to ensure that there is open commu-nication between the geothermal energy producer and the local population and authorities. Thisinvolves early establishment of a monitoring and reporting plan, communication of the plan to theaffected community, and diligent follow-up in the form of reporting and meeting commitments.The establishment of good working relationships between the geothermal producer and the local
218 E.L. Majer et al. / Geothermics 36 (2007) 185–222
inhabitants is essential. Education in terms of the nature of MEQs and the difference betweenperceptible and damaging ground motions is an important feature of this outreach. Adoption ofbest practices from other industries should also be considered. For example, in the Netherlandsgas producers adopt a good-neighbour policy, based on a pro-active approach to seismic mon-itoring, reporting, investigating and, if necessary, compensating for any damage (NAM, 2002).Similarly, geothermal operators in Iceland have consistently shown that it is possible to gainpublic acceptance and even vocal support for field development operations by ensuring that thelocal population sees the direct economic benefit of the field activities (Gudni Axelsson, personalcommunication, September 2006).
For the long term we must aim at achieving a step-by-step improvement in our understandingof the processes governing induced seismicity, duly acknowledging any benefits and mitigatingany risks along the way. At the same time, our final objective is to engineer subsurface fracturenetworks with the desired properties. Seismicity is a key item of information for understandingsubsurface fracture networks and is now being used routinely to understand the dynamics offracturing and the all-important relationship between fractures and fluid behaviour. Futureresearch efforts will reap the benefits of international cooperation through data exchange, sharingthe results of field studies and research at regular meetings, and engaging industry in the researchprojects. Additional experience, and application of the practices discussed above, will providefurther knowledge, helping us to successfully utilize EGS-induced seismicity and achieve thefull potential of the enhanced systems.
Acknowledgments
This work was primarily funded by the Assistant Secretary for Energy Efficiency andRenewable Energy, Geothermal Technologies Program of the U.S. Department of Energy, underContract No. DE-AC02-05CH11231, at Lawrence Berkeley National Laboratory, which alsofunded the organization and implementation of the three EGS-induced seismicity workshops.The authors thank Markus Haring, Florentin Ladner and Bob Worrall from GeoPower Basel andNico Deichmann from ETH, Zurich, for information and data related to the Basel project. Theywould also like to acknowledge the many participants at these workshops for their input andefforts in identifying key issues, and their help in developing and reviewing this paper. Thanksare also due to Gillian Foulger, Marcelo Lippmann and Joe Moore for editing and reviewingdifferent versions of the manuscript. The authors are grateful to Walter Denn (LBNL) for draftingand revising many of the figures.
References
Allis, R.G., 1982. Mechanisms of induced seismicity at The Geysers geothermal reservoir, California. Geophys. Res. Lett.9, 629–632.
Ambraseys, N.N., Bommer, J.J., Buforn, E., Udıas, A., 2001. The earthquake sequence of May 1951 at Jucuapa, ElSalvador. J. Seismol. 5, 23–39.
Asanuma, H., Nozaki, H., Niitsuma, H., Wyborn, D., 2005b. Interpretation of microseismic events with larger magnitudecollected at Cooper Basin, Australia. Geotherm. Resour. Counc. Trans. 29, 87–91.
Asanuma, H., Soma, N., Kaieda, H., Kumano, Y., Izumi, T., Tezuka, K., Niitsuma, H., Wyborn, D., 2005a. Microseismicmonitoring of hydraulic stimulation at the Australian HDR project in Cooper Basin. In: Proceedings of the WorldGeothermal Congress 2005, Antalya, Turkey, Paper 1615, 5 pp.
Athanasopoulos, G.A., Pelekis, P.C., 2000. Ground vibrations from sheetpile driving in urban environment: measurements,analysis and effects on buildings and occupants. Soil Dyn. Earthquake Eng. 19, 371–387.

E.L. Majer et al. / Geothermics 36 (2007) 185–222 219
Baisch, S., Weidler, R., Voros, R., Wyborn, D., de Graaf, L., 2006. Induced seismicity during the stimulation of ageothermal HFR reservoir in the Cooper Basin, Australia. Bull. Seismol. Soc. Am. 96, 2242–2256.
Baria, R., Baumgartner, J., Gerard, A., Garnish, J., 2000. The European HDR Programme: main targets and results of thedeepening of the well GPK2 to 5000 m. In: Proceedings of the World Geothermal Congress 2000, Kyushu/Tohoku,Japan, pp. 3643–3652.
Baria, R., Baumgartner, J., Gerard, A., Jung, R., 1993. Heat mining in the Rhine Graben. Socomine Internal ProjectReport, 40 pp.
Baria, R., Baumgartner, J., Gerard, A., Jung, R., 1999a. European Hot Dry Rock geothermal research programme1996–1997. European Commission Final Report (DGXII) EUR15925ER, 144 pp.
Baria, R., Garnish, J., Baumgartner, J., Gerard, A., Jung, R., 1995. Recent development in the European HDR researchprogramme at Soultz-sous-Forets (France). In: Proceedings of the World Geothermal Congress 1995, Florence, Italy,pp. 2631–2637.
Baria, R., Baumgartner, J., Rummel, F., Pine, R.J., Sato, Y., 1999b. HDR/HWR reservoirs: concepts, understanding andcreation. Geothermics 28, 533–552.
Baria, R., Majer, E., Fehler, M., Toksoz, N., Bromley, C., Teza, D., 2006. International cooperation to address inducedseismicity in geothermal systems. In: Proceedings of the 31st Workshop on Geothermal Reservoir Engineering,Stanford University, Stanford, CA, USA, 3 pp.
Baria, R., Michelet, S., Baumgartner, J., Dyer, B., Gerard, A., Nicholls, J., Hettkamp, T., Teza, D., Soma, N., Asanuma,H., 2004. Microseismic monitoring of the world’s largest potential HDR reservoir. In: Proceedings of 29th Workshopon Geothermal Reservoir Engineering, Stanford University, Stanford, CA, USA, pp. 194–201.
Baria, R., Michelet, S., Baumgartner, J., Dyer, B., Nicholls, J., Hettkamp, T., Teza, D., Soma, N., Asanuma, H., Garnish,J., Megel, T., 2005. Creation and mapping of 5000 m deep HDR/HFR reservoir to produce electricity. In: Proceedingsof the World Geothermal Congress 2005, Antalya, Turkey, Paper 1627, 8 pp.
Barneich, J., 1985. Vehicle induced ground motion. Vibration Problems in Geotechnical Engineering. In: Gazetas, G.,Selig, E. (Eds.), Proceedings of Symposium Held by the Geotechnical Engineering Division in conjunction with theASCE Convention. 22 October 1985, Detroit, MI, USA, pp. 187–202.
Batra, R., Albright, J.N., Bradley, C., 1984. Downhole seismic monitoring of an acid treatment in the Beowawe geothermalfield. Geotherm. Resour. Counc. Trans. 8, 479–483.
Baumgartner, J., Gerard, A., Baria, R., Jung, R., Tran-Viet, T., Gandy, T., Aquilina, L., Garnish, J., 1998. Circulating theHDR reservoir at Soultz; maintaining production and injection flow in complete balance. In: Proceedings of the 23rdWorkshop on Geothermal Reservoir Engineering, Stanford University, Stanford, CA, USA, pp. 11–20.
Baumgartner, J., Moore, P., Gerard, A., 1995. Drilling of hot and fractured granite at Soultz. In: Proceedings of the WorldGeothermal Congress 1995, Florence, Italy, pp. 2657–2663.
Baumgartner, J., Teza, D., Hettkamp, T., Homeier, G., Baria, R., Michelet, S., 2005. Electricity production from hot rocks.In: Proceedings of the World Geothermal Congress 2005, Antalya, Turkey, Paper 1624, 6 pp.
Beall, J.J., Stark, M.A., Smith, J.L. (Bill), Kirkpatrick, A., 1999. Microearthquakes in the SE Geysers before and afterSEGEP injection. Geotherm. Resour. Counc. Trans. 23, 253–257.
Beauce, A., Fabriol, H., LeMasne, D., Cavoit, C., Mechler, P., Chen, X.K., 1991. Seismic studies on the HDR site ofSoultz-sous-Forets (Alsace, France). Geotherm. Sci. Tech. 3, 239.
Bommer, J.J., Abrahamson, N.A., 2006. Why do modern probabilistic seismic-hazard analyses often lead to increasedhazard estimates? Bull. Seismol. Soc. Am. 96, 1967–1977.
Bommer, J., Benito, B., Ciudad-Real, M., Lemoine, A., Lopez-Menjivar, M., Madariaga, R., Mankelow, J., Mendez deHasbun, P., Murphy, W., Lovo-Nieto, M., Rodrıguez-Pineda, C., Rosa, H., 2002. The El Salvador earthquakes ofJanuary and February 2001: context, characteristics and implications for seismic risk. Soil Dyn. Earthquake Eng. 22,389–418.
Bommer, J.J., Georgallides, G., Tromans, I.J., 2001. Is there a near field for small-to-moderate-magnitude earthquakes?J. Earthquake Eng. 5, 395–423.
Bommer, J.J., Oates, S.J., Cepeda, M., Lindholm, C., Bird, J., Torres, R., Marroquın, G., Rivas, J., 2006. Control of hazarddue to seismicity induced by a hot fractured rock geothermal project. Eng. Geol. 83, 287–306.
Boucher, G., Ryall, A., Jones, A.E., 1969. Earthquakes associated with underground nuclear explosions. J. Geophys. Res.74, 3808–3818.
Brune, J., Thatcher, W., 2002. International Handbook of Earthquake and Engineering Seismology, vol. 81A. InternationalAssociation of Seismology and Physics of Earth’s Interior, Committee on Education, pp. 569–588.
Campbell, K.W., 1997. Empirical near-source attenuation relationships for horizontal and vertical components of peakground acceleration, peak ground velocity, and pseudo-absolute acceleration response. Seismol. Res. Lett. 68,154–179.

220 E.L. Majer et al. / Geothermics 36 (2007) 185–222
Cautru, J.P., 1987. Coupe geologique passant par le forage GPJI calee sur la sismique reflection. BRGM/IMRG document,31 pp.
Cornet, F.H., Jianmin, Y., 1995. Analysis of induced seismicity for stress field determination. Pure Appl. Geophys. 145,677–700.
Cornet, F.H., Julien, P., 1993. Stress determination from hydraulic test data and focal mechanisms of induced seismicity.Int. J. Rock Mech. Min. Sci. Geomech. Abstr. 26, 235–248.
Cornet, F.H., Scotti, O., 1992. Analysis of induced seismicity for fault zone identification. Int. J. Rock Mech. Min. Sci.Geomech. Abstr. 30, 789–795.
Cornet, B., Bonmatin, J.M., Hetru, C., Hoffmann, J.A., Ptak, M., Vovelle, F., 1995. Refined three-dimensional solutionstructure of insect defensin A. Structure 3, 435–448.
Cornet, F.H., Jianmin, Y., Martel, L., 1992. Stress heterogeneities and flow paths in a granite rock mass. In:Pre-Workshop Volume for the Workshop on Induced Seismicity, 33rd U.S. Symposium on Rock Mechanics,p. 184.
Cypser, D.A., Davis, S.D., 1998. Induced seismicity and the potential for liability under U.S. law. Tectonophysics 289,239–255.
Dewey, J.W., White, R.A., Hernandez, D.A., 2004. Seismicity and tectonics of El Salvador. In: Rose, P., et al. (Eds.),Natural Hazards in El Salvador. Geological Society of America Special Paper 375, pp. 363–378.
Eberhart-Phillips, D., Oppenheimer, D.H., 1984. Induced seismicity in The Geysers geothermal area, California. J.Geophys. Res. 89, 1191–1207.
Enedy, S.L., Enedy, K.L., Maney, J., 1992. Reservoir response to injection in the Southeast Geysers. Geotherm. Res.Counc. Spec. Rep. 17, 211–219.
Fehler, M., 1989. Stress control of seismicity patterns observed during hydraulic fracturing experiments at the Fen-ton Hill hot dry rock geothermal energy site, New Mexico. Int. J. Rock Mech. Min. Sci. Geomech. Abstr. 26,211–219.
Foulger, G.R., Grant, C.C., Julian, B.R., Ross, A., 1997. Industrially induced changes in Earth structure at The Geysersgeothermal area, California. Geophys. Res. Lett. 24, 135–137.
Garnish, J., Baria, R., Baumgartner, J., Gerard, A., 1994. The European Hot Dry Rock Programme 1994–1995. Geotherm.Resour. Counc. Trans. 18, 431–438.
Genter, A., Traineau, H., 1992a. Hydrothermally altered and fractured granite in an HDR reservoir in the EPSI borehole,Alsace, France. In: Proceedings of the 17th Workshop on Geothermal Reservoir Engineering, Stanford University,Stanford, CA, USA, pp. 33–38.
Genter, A., Traineau, H., 1992b. Borehole EPS-1, Alsace, France; preliminary geological results from granite core analysisfor Hot Dry Rock research. Sci. Drill. 3, 205–214.
Gerard, A., Genter, A., Kohl, T., Lutz, P., Rose, P., Rummel, F., 2006. The deep EGS (Enhanced Geothermal System)project at Soultz-sous-Forets (Alsace, France). Geothermics 35, 473–484.
Ghassemi, A., Tarasovs, S., Cheng, A.H.-D. A three-dimensional study of the effects of thermo-mechanical loads onfracture slip in enhanced geothermal reservoirs. Int. J. Rock Mech. Min. Sci. Geomech. Abstr., in press.
Grasso, J., 1992. Mechanics of seismic instabilities induced by the recovery of hydrocarbons. Pure Appl. Geophys. 139,507.
Greensfelder, R. 1996. Induced Seismicity Study – Geysers Recharge Alternative – Santa Rosa Subregional Long-TermWastewater Project, vol. VI, Section F-2 of the Environmental Impact Report prepared for the city of Santa Rosa andthe U.S. Army Corps of Engineers by Greensfelder & Associates and Parsons Engineering Science Inc. for HarlandBartholomew and Associates Inc., 100+ pp.
Guha, S.K., 2000. Induced Earthquakes. Kluwer Academic Publishers, Dordrecht, The Netherlands, 314 pp.Gunasekera, R.C., Foulger, G.R., Julian, B.R., 2003. Three-dimensional tomographic images of progressive pore-fluid
depletion at The Geysers geothermal area, California. J. Geophys. Res. 108 (B3), 2134, doi:10.1029/2001JB000638.Hanks, T.C., Kanamori, H., 1979. A moment magnitude scale. J. Geophys. Res. 84, 2348–2350.Hazzard, J.F., Young, R.P., Oates, S.J., 2002. Numerical modeling of seismicity induced by fluid injection in a fractured
reservoir. In: Mining and Tunnel Innovation and Opportunity, Proceedings of the 5th North American Rock MechanicsSymposium, Toronto, Canada, pp. 1023–1030.
Henderson, J.R., Barton, D.J., Foulger, G.R., 1999. Fractal clustering of induced seismicity in The Geysers geothermalarea, California. Geophys. Res. Lett. 139, 317–324.
Hubbert, M.K., Rubey, W.W., 1959. Role of fluid pressure in mechanics of overthrust faulting: parts I and II. Geol. Soc.Am. Bull. 70, 115–205.
Kagawa, T., Irikura, K., Somerville, P.G., 2004. Differences in ground motion and fault rupture process between thesurface and buried rupture earthquakes. Earth Planets Space 56, 3–14.

E.L. Majer et al. / Geothermics 36 (2007) 185–222 221
Kanamori, H., Rivera, L., 2004. Static and dynamic scaling relations for earthquakes and their implications for rupturespeed and stress drop. Bull. Seismol. Soc. Am. 94, 314–319.
Kirkpatrick, A., Peterson, J.E., Majer, E.L., Nadeau, R., 1999. Characteristics of microseismicity in the DV11 injectionarea, Southeast Geysers, California. In: Proceedings of the 24th Workshop on Geothermal Reservoir Engineering,Stanford University, Stanford, CA, USA, pp. 236–242.
Knoll, P. (Ed.), 1992. Induced Seismicity. A.A. Balkema, Rotterdam, The Netherlands, 17 pp.Kohl, T., Megel, T., 2005. Coupled hydro-mechanical modelling of the GPK3 reservoir stimulation at the European
EGS site Soultz-sous-Forets. In: Proceedings of the 30th Workshop on Geothermal Reservoir Engineering, StanfordUniversity, Stanford, CA, USA, pp. 320–327.
Ludwin, R.S., Cagnetti, V., Bufe, C.G., 1982. Comparison of seismicity in The Geysers geothermal area with thesurrounding area. Bull. Seismol. Soc. Am. 72, 863.
Majer, E.L., McEvilly, T.V., 1979. Seismological investigations at The Geysers geothermal field. Geophysics 44, 246–269.
Majer, E.L., Peterson, J.E., 2005. Application of microearthquake monitoring for evaluating and managing the effects offluid injection at naturally fractured EGS sites. Geotherm. Resour. Counc. Trans. 29, 103–107.
Majer, E., Baria, R., Fehler, M., 2005. Cooperative research on induced seismicity associated with enhanced geothermalsystems. Geotherm. Resour. Counc. Trans. 29, 99–101.
Martınez-Pereira, A., Bommer, J.J., 1998. What is the near field? In: Booth, E. (Ed.), Seismic Design Practice into theNext Century. Balkema, Leiden, The Netherlands, pp. 245–252.
Mauk, F., Sorrells, G.G., Kimball, B., 1981. Microseismicity associated with development of Gulf Coast geopressured-geothermal wells: two studies. Pleasant Bayou No. 2 and Dow L. R. Sweezy No. 1. In: Bebout, D.G., Bachman, A.L.(Eds.), Geopressured-Geothermal Energy, 105, Proceedings of the Fifth U.S. Gulf Coast Geopressured-GeothermalEnergy Conference. Baton Rouge, LA, USA, 12 pp.
McGarr, A., 1976. Seismic moment and volume change. J. Geophys. Res. 81, 1487–1494.NAM, 2002. Aardtrillingen. Nederlandse Aardolie Maatschappij (NAM) public information leaflet, September 2002
(www.nam.nl).O’Connell, D.R., Johnson, L.R., 1991. Progressive inversion for hypocenters and P-wave and S-wave velocity structure:
application to The Geysers, California, geothermal field. J. Geophys. Res. 96 (B4), 6223–6236.Oppenheimer, D.C., 1986. Extensional tectonics at The Geysers geothermal area, California. J. Geophys. Res. 91,
11463–11476.Pennington, W.D., Davis, S.D., Carlson, S.M., DuPree, J., Ewing, T.E., 1986. The evolution of seismic barriers and
asperities caused by the depressuring of fault planes in oil and gas fields of South Texas. Bull. Seismol. Soc. Am. 76,939–948.
Raleigh, C.B., Healy, J.H., Bredehoeft, J.D., 1972. Faulting and crustal stress at Rangely, Colorado. AGU Geophys.Monogr. 16, 275–284.
Richardson, E., Jordan, T., 2002. Seismicity in deep gold mines of South Africa: implications for tectonic earthquakes.Bull. Seismol. Soc. Am. 92, 1766–1782.
Richter, C.H., 1958. Elementary Seismology. W.H. Freeman, San Francisco, CA, USA, 768 pp.Rivas, J.A., Castellon, J.A., Maravilla, J.N., 2005. Seven years of reservoir seismic monitoring at Berlın Geothermal Field,
Usulutan, El Salvador. In: Proceedings of the World Geothermal Congress 2005, Antalya, Turkey, April 24–29, 2005,Paper 0215, 8 pp.
Romero, A.E., McEvilly, T.V., Majer, E.L., Vasco, D., 1995. Characterization of the geothermal system beneath theNorthwest Geysers steam field, California, from seismicity and velocity patterns. Geothermics 23, 111–126.
Ross, A., Foulger, G.R., Julian, B.R., 1996. Non-double couple earthquake mechanisms at The Geysers geothermal area,California. Geophys. Res. Lett. 23, 877–880.
Ross, A., Foulger, G.R., Julian, B.R., 1999. Source processes of industrially-induced earthquakes at The Geysers geother-mal area, California. Geophysics 64, 1877–1889.
Rummel, F. (Ed.), 2004. Rock Mechanics with Emphasis on Stress. Taylor and Francis, Oxford, UK, 243 pp.Seeber, L., Armbruster, J.G., Kim, W.-Y., 2004. A fluid-injection-triggered earthquake sequence in Ashtabula, Ohio:
implications for seismogenesis in stable continental regions. Bull. Seismol. Soc. Am. 94, 76–87.Segall, P., 1989. Earthquakes triggered by fluid extraction. Geology 17, 942–946.Segall, P., Grasso, J.R., Mossop, A., 1994. Poroelastic stressing and induced seismicity near the lacq gas field, Southwestern
France. J. Geophys. Res. 99, 15423–15438.Sherburn, S., Allis, R., Clotworthy, A., 1990. Microseismic activity at Wairakei and Ohaaki geothermal fields. In:
Proceedings of the 12th New Zealand Geothermal Workshop. Auckland, New Zealand, pp. 51–55.Simpson, D.W., 1976. Seismicity changes associated with reservoir loading. Eng. Geol. 10, 123–138.

222 E.L. Majer et al. / Geothermics 36 (2007) 185–222
Smith, J.L.B., Beall, J.J., Stark, M.A., 2000. Induced seismicity in the SE Geysers field. Geotherm. Resour. Counc. Trans.24, 24–27.
Stark, M.A., 1992. Microearthquakes—a tool to track injected water in The Geysers reservoir. Geothermal ResearchCouncil, Special Report, pp. 111–117.
Stark, M., 2003. Seismic evidence for a long-lived enhanced geothermal system (EGS) in the Northern Geysers Reservoir.Geotherm. Resour. Counc. Trans. 24, 24–27.
Stevenson, D.A., 1985. Louisiana Gulf Coast seismicity induced by geopressured-geothermal well development. In:Dorfman, M.H., Morton, R.A. (Eds.), Proceedings of the 6th Conference Geopressured-Geothermal Energy. Universityof Texas, Austin, TX, USA, pp. 319–326.
Talebi, S. (Ed.), 1998. Seismicity Associated with Mines, Reservoirs and Fluid Injections. Birkhauser Verlag,Basel/Boston/Berlin, 233 pp.
USACE, 1972. Systematic drilling and blasting for surface excavations. Engineering Manual EM 1110-2-3800, U.S.Army Corps of Engineers, 145 pp.
Villemin, T., 1986. Tectonique en extension, fracturation et subsidence: le Fosse Rhenan et le Bassin de Sarre-Nahe. Thesede doctorat de l’Univ. Pierre et Marie Curie, Paris VI, 98 pp.
Wald, D.J., Quitoriano, V., Heaton, T.H., Kanamori, H., 1999. Relationships between peak ground acceleration, peakground velocity, and modified Mercalli intensity in California. Earthquake Spectr. 15, 557–564.