inducible astrocytic glucose transporter-3 contributes to
TRANSCRIPT
Instructions for use
Title Inducible astrocytic glucose transporter-3 contributes to the enhanced storage of intracellular glycogen duringreperfusion after ischemia
Author(s) Iwabuchi, Sadahiro; Kawahara, Koichi
Citation Neurochemistry International, 59(2), 319-325https://doi.org/10.1016/j.neuint.2011.06.006
Issue Date 2011-08
Doc URL http://hdl.handle.net/2115/47134
Type article (author version)
File Information NI59-2_319-325.pdf
Hokkaido University Collection of Scholarly and Academic Papers : HUSCAP
Neurochemistry International
1
Inducible Astrocytic Glucose Transporter-3 Contributes to the
Enhanced Storage of Intracellular Glycogen during Reperfusion after
Ischemia
SADAHIRO IWABUCHI, KOICHI KAWAHARA*
Laboratory of Cellular Cybernetics, Graduate School of Information
Science and Technology, Hokkaido University, Sapporo, Japan
Address correspondence to:
Koichi Kawahara, PhD
Professor of the Laboratory of Cellular Cybernetics, Graduate School of
Information Science and Technology, Hokkaido University, Sapporo
060-0814, Japan
PHONE&FAX: +81-11-706-7591
E-mail: [email protected]

Neurochemistry International
2
Abstract
Glucose is a necessary source of energy to sustain cell activities and
homeostasis in the brain, and enhanced glucose transporter (GLUT)
activities are protective of cells during energy depletion including brain
ischemia. Here we investigated whether and if so how the astrocytic
expression of GLUTs crucial for the uptake of glucose changes in ischemic
conditions. Under physiological conditions, cultured astrocytes primarily
expressed GLUT1, and GLUT3 was only detected at extremely low levels.
However, exposure to ischemic stress increased the expression of not only
GLUT1 but also GLUT3. During ischemia, cultured astrocytes
significantly increased production of the transcription factor nuclear
factor-B (NF-B), leading to an increase in GLUT3 expression. Moreover,
astrocytic GLUT3 was responsible for the enhanced storage of intracellular
glucose during reperfusion, resulting in increased resistance to lethal
ischemic stress. These results suggested that astrocytes promptly increase
GLUT3 production in situations such as ischemia, and much glucose is
quickly taken up, possibly contributing to the protection of astrocytes from
ischemic damage.
Key words
Astrocytes, GLUT3, GLUT1, Ischemic stress, Glycogen
Neurochemistry International
3
Abbreviations
GLUT: glucose transporter, HE: Hoechst 33342, IKK: inhibitor of B
kinase, NF-B: nuclear factor-B, OGD: oxygen glucose deprivation, PC:
preconditioning
Neurochemistry International
4
1. Introduction
Energy-independent glucose transporters (GLUTs), which contain 12
membrane-spanning domains and span the plasma membrane, mediate the
entry or exit of glucose. Thirteen facilitative GLUTs have been identified
(Wood and Trayhurn, 2003), the predominant cerebral GLUTs being
GLUT1 and GLUT3. GLUT2, GLUT4, GLUT5, and GLUT7 have also
been detected at low levels in the brain (Vannucci et al., 1997). Under
physiological conditions, GLUT1 is mainly expressed at plasma
membranes in astrocytes, and GLUT3 is expressed not in astrocytes but in
neurons (Maher et al., 1994). The parameters of neuronal GLUT3 activities
such as kinetics or catalytic center activity (CCA) determined by
conducting assays using a non-metabolizable glucose analog show that the
entry-mode velocity (CCA value) of GLUT1 and GLUT3 is 123 and 853
(s-1), respectively, revealing that GLUT3 transports extracellular glucose
about 7 times faster than GLUT1 (Maher et al., 1996). GLUT3 only takes
up extracellular glucose: it does not release intracellular glucose to the
extracellular space even if the intracellular glucose concentration is higher
than the extracellular concentration. Therefore, it seems reasonable that
neurons strongly express GLUT3 under physiological conditions, because
glucose is a necessary source of energy to sustain neuronal activities.
A number of studies have demonstrated that enhanced glucose
transporter activities are protective of cells during energy depletion
(Vannucci et al., 1997; Vannucci et al., 1998; Yu et al., 2008). Hypoxic
insults increase GLUT1 mRNA and protein levels in astrocytic cultures,
Neurochemistry International
5
and sublethal hypoxic insults, i.e., hypoxic preconditioning, up-regulates
the expression of neuronal GLUT1 and GLUT3 mRNA as well as
astrocytic GLUT1 mRNA, leading to the development of hypoxic tolerance
(Vannucci et al., 1998). However, it is still unknown whether GLUT3 is
actually expressed in astrocytes under pathological conditions or not.
Astrocytes are reactive in response to ischemic stress: they become
hypertrophic and glial fibrillary acidic protein (GFAP) expression is
increased. Such reactive astrocytes possibly contribute to the induction of
neuronal migration or the growth of axons during development (Rakic,
1971), and have a protective role in the central nervous system under
pathological conditions (Li et al., 2008). Our previous study showed that
the exposure of cultured astrocytes to sublethal ischemia, preconditioning
(PC), results in a marked increase in GFAP, and such astrocytes have
increased resistance to subsequent lethal ischemic stress (Iwabuchi and
Kawahara, 2009). In contrast, controversial results suggest that reactive
astrocytes interfere with axonal regeneration in the injured spinal cord
(Brown and Mc, 1947). In addition, it is unclear whether changes in the
expression and activity of GLUT3 are involved in the PC-induced ischemic
tolerance in astrocytes.
In this study, we found that in cultured astrocytes, the expression of
GLUT3 increased under ischemic conditions, and the increase was
responsible for an increase in the amount of glycogen deposited during
reperfusion, contributing to the development of resistance to subsequent
lethal ischemic stress.

Neurochemistry International
6
2. Materials and methods
2.1 Cell culture
The animal experiments were carried out in accordance with The Guide for
the care and use of laboratory animals, Hokkaido University School of
Medicine. The methods used to obtain primary astrocytic cultures were
described previously in detail (Iwabuchi and Kawahara, 2011; Kawahara et
al., 2002). In brief, the cortical hemispheres of postnatal 2 to 3-day-old rats,
were isolated and digested at 37 °C for 30 min with a 0.01%
papain-cysteine solution. Primary astrocytes were plated onto
polyethyleneimine-coated glass coverslips/plastic dishes at 20,000
cells/cm2. Cells were maintained with a culture medium (CM) (80%
Dulbecco’s modified Eagle’s medium (Gibco, Grand Island, USA)
supplemented with 10% Ham’s F-12 nutrient mixture and 10% fetal bovine
serum) with 1% penicillin/streptmycin at 37 °C in a 5% CO2 incubator.
Cultured astrocytes were fed a cooled CM twice a week. The experiments
were performed with cultures maintained for 14-21 days.
2.2 Oxygen-glucose deprivation (OGD)
Cultures were washed two times with a glucose-free balanced salt solution
(BSS: supplemented with 142 mM NaCl, 0.8 mM MgSO4, 5.4 mM KCl,
1.0 mM NaH2PO4, 4 mM NaHCO3, 1.8 mM CaCl2 and 0.01 mM glycine),
Neurochemistry International
7
and placed in an anaerobic chamber containing the de-oxygenation reagent
(an O2 concentration of < 1% during 1 h; Mitsubishi Gas Chemical, Tokyo,
Japan) at 37 °C. To terminate the OGD treatment, the BSS buffer in each
culture was removed carefully and cultures were incubated with fresh or
warm CM at 37 °C in a 5% CO2 incubator for 1 h or 1 day (reperfusion
period). The intracellular glycogen concentration in astrocytes was assessed
with assay an EnzyChromTM Glycogen Assay Kit (BioAssay Systems,
Hayward, USA) according to the manufacturer’s instructions. The reagent
combines the enzymatic break down of glycogen, detecting glucose. The
luminescence intensity of each well at 570 nm was determined using a
microplate reader (Infinite®200; Tecan Austria GmbH, Salzburg, Austria).
2.3 Real-time Reverse transcription polymerase chain reaction
(RT-PCR)
Total RNA in each astrocytic culture was obtained using the RNA
extraction reagent: ISOGEN (Molecular Research Center, Cincinnati,
USA), and then complementary DNA (cDNA) product was synthesized by
PrimeScript® Reverse Transcriptase (Takara Bio, Shiga, Japan), oligo
(dT)12-18 primer and deoxy nucleotide triphosphate (dNTP) mixture
(Promega, Madison, USA), according to the manufacturer’s instructions.
The PCR primer pairs and probes for GLUT1, GLUT3, an IB-nuclear
factor-B (NF-B), and -actin were designed as follows; GLUT1 [NCBI
reference sequence: NM_138827.1; (sense)
Neurochemistry International
8
5’-AGTATCGTGGCCATCTTTGG-3’, (antisense)
5’-GCCACAATGAACCATGGAA-3’, (probe) 5’-GGCCCTGG-3’],
GLUT3[NM_017102.2; (sense) 5’-TCTCTGGGATCAATGCTGTG-3’,
(antisense) 5’-CCAATCGTGGCATAGATGG-3’, (probe)
5’-GTGTCCAG-3’], NF-B[XM_342346.4; (sense) 5’-ATCGCTCA
-GGCCCACTTG-3’, (antisense)
5’-TGTCATTATCTCGGAGCTCATCT-3’, (probe) 5’-CTCCTCCA-3’],
-actin [NM_017008.3; (sense) 5’-AATGTATCCGTTGTGGATCTGA-3’,
(antisense) 5’-GCTTCACCACCTTCTTGATGT-3’, (probe)
5’-CCTGGAGA-3’]. AmpliTaq Gold® PCR Master Mix (Life
Technologies, California, USA) was added to each sample, and then cDNA
was amplified with a thermal cycler. -actin was used as the housekeeping
gene to standardize GLUT1, GLUT3, and NF-B mRNA levels.
2.4 Western blot analysis
Western blotting was performed as described previously in detail (Iwabuchi
and Kawahara, 2009, 2011). In brief, cell lysate in a sodium dodecyl sulfate
(SDS) sample buffer was electrophoresed on SDS Tris-HCl gels (DRC,
Tokyo, Japan), and transferred to PVDF membranes (Amersham, Arlington
Heights, USA). The blots were blocked, and specific proteins were detected
by using as primary antibodies, anti-rabbit IgG anti-GLUT1 (IBL, Gunma,
Japan; 1:1000), GLUT3 (Abcam, Cambridge, UK; 1:1000) and anti-mouse
IgG anti--actin (Sigma-Aldrich, St. Louis, USA; 1:10000). The signals
Neurochemistry International
9
were visualized using an enhanced chemiluminescence system (NEN Life
Science Products, Boston, USA). Quantification of the immunoreactive
bands was done with Scion Image for Windows (Scion Corporation,
Frederick, USA). Quantitative evaluation of the expression of each protein
was performed as described (Iwabuchi and Kawahara, 2009). We measured
the density of these bands, and calculated the rate for total -actin in
control or OGD groups. We took the values in control groups to be 100%,
and then calculated the rate in OGD groups.
2.5 Immunocytochemistry
Cells were fixed with 4% paraformaldehyde and washed with
phosphate-buffered saline (PBS). To detect the positive reactions in the
cellular membranes, a detergent such as Triton-X was not used. Fixed-cells
were then treated with 1% normal goat serum for 30 min.
Immunofluorescent labeling was done with antibodies directed against
GLUT1 (IBL; 1:200), GLUT3 (Abcam; 1:200). Negative controls without
each primary antibody were also performed. Each primary antibody was
visualized with Alexa Fluor 488-conjugated anti-rabbit antibodies
(Invitrogen, Karlsruhe, Germany; 1:200). The fluorescent DNA-binding
dye, Hoechst 33342 (HE), was used to detect nuclei. The immunoreactivity
was observed with a confocal laser scanning microscope (FV300; Olympus,
Tokyo, Japan). The image analysis was identical for each culture. In single
astrocytic cultures, more than 94% cells were astrocytes as described
Neurochemistry International
10
previously (Iwabuchi and Kawahara, 2009; Kawahara et al., 2002).
2.6 RNA interference
RNA interference for newly synthesized GLUT3 mRNA was performed
with the use of small interfering RNA, mouse GLUT3 (Santa Cruz
Biotechnology, California, USA). When astrocytes were about 80%
confluent, the CM was replaced with a penicillin/streptomycin-free CM
and cultured for 1 day. siRNA Transfection Reagent mixture [about 98%
siRNA Transfection Medium (Santa Cruz Biotechnology) with 0.6-0.8%
GLUT3 siRNA or Control siRNA (Santa Cruz Biotechnology)
supplemented with 0.8% siRNA Transfection Reagent (Santa Cruz
Biotechnology)] was added to the cultures and incubated for 8 hours. Then
CM containing 2 times the volume of fetal bovine serum was added and
cultures were incubated for 1 day. Finally, the CM was aspirated and
replaced with fresh CM for 1day.
2.7 Cell survival assay
Cell viability was assessed by the 3-(4,5-Dimethyl
2-thiazol)-2,5-diphenyl-2H-tetrazolium bromide (MTT) assay (DOJINDO
Laboratories, Kumamoto, Japan), which is based on the reduction of the
yellow MTT tetrazolium salt by mitochondrial dehydrogenases to form a
blue MTT formazan. A MTT dissolved-solution was added to each well and
Neurochemistry International
11
incubated for 3 h, and the medium was removed completely and a 40 mM
HCl-isopropanol lysis buffer was added. The optical density of each well at
560 nm was determined using a microplate reader (Infinite®200; Tecan
Austria GmbH).
2.8 Data analysis
The data are expressed as the mean ± standard error of the mean (S.E.M.).
Comparisons were performed using the ANOVA followed by a paired
Student’s t-test or Student’s t-test alone. Differences at p < 0.05 were
considered significant.

Neurochemistry International
12
3. Results
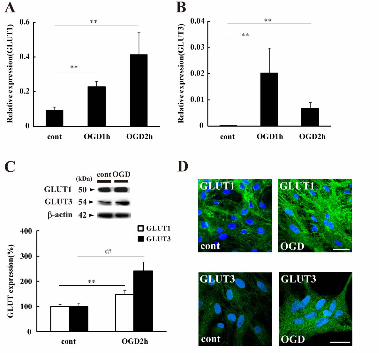
3.1 OGD-induced increase in astrocytic GLUT3 expression
The Real-time PCR analysis showed that both GLUT1 and GLUT3 mRNA
levels increased significantly during the simulated ischemia (oxygen and
glucose deprivation: OGD) (Fig.1A&B). The expression of GLUT1 mRNA
increased with the duration of OGD. GLUT1 mRNA was readily detected
in cultured astrocytes in the control group; however, astrocytic GLUT3
mRNA was rarely detected (0.00007 ± 0.0001, mean ± S.E.M.). In contrast
to GLUT1 mRNA, the relative GLUT3 mRNA levels were significantly
higher at 1 h of OGD (0.002 ± 0.09, mean ± S.E.M.) than 2 h of OGD
(0.007 ± 0.002).
The Western blot analysis revealed that the expression of the 50kDa
form of GLUT1 at 2 h of OGD was 147.3 ± 17.3% (mean ± S.E.M.), and a
significant increase in GLUT1 expression was observed as compared to the
control groups (100.0 ± 6.4%) (Fig.1C, white bars). The expression of the
54kDa form of GLUT3 in OGD groups was also significantly increased, by
2.3-fold (Fig.1C, black bars). To further confirm the OGD-induced increase
in GLUTs expression in astrocytes, an immunofluorescent analysis was
performed. Two hours of OGD treatment enhanced both GLUT1 and
GLUT3-positive reactions (green) as compared to the control (Fig.1D).
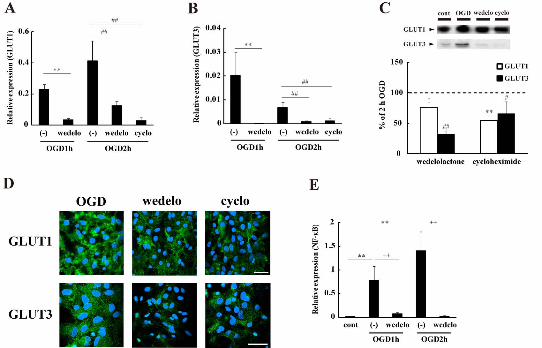
3.2 The transcription factor NF-B regulates the increase in GLUT3
Neurochemistry International
13
expression
It has been reported that the activation of an IB-nuclear factor-B
(NF-B) pathway causes the upregulation of GLUT3 mRNA expression in
mouse embryonic fibroblasts (Kawauchi et al., 2008). In addition,
endothelin-1’s induction of GLUT1 transcription is mediated by NF-B in
cultured adipocytes (Kao and Fong, 2008). Therefore, we speculated that
NF-B might regulate the synthesis of astrocytic GLUTs during OGD. An
inhibitor of IKK and IKK, wedelolactone (50 M), was added to the
glucose-free BSS and the cultures were exposed to OGD. As expected, the
increase in both GLUT1 (Fig.2A) and GLUT3 (Fig.2B) mRNA levels was
significantly attenuated in the OGD groups treated with wedelolactone.
Western blotting and immunofluorescence analyses revealed that
wedelolactone significantly suppressed astrocytic GLUTs expression in the
OGD groups (Fig. 2C&D). Notably, the increase in GLUT3 expression was
strongly attenuated by wedelolactone treatment [OGD2h with or without
wedelolactone: 32.4 ± 5.5 or 100.0 ± 1.4% (mean ± S.E.M.)]. Fig. 2E
shows that OGD significantly increased NF-B mRNA levels as compared
to the control, and the increase was dependent on the duration of OGD.
Wedelolactone itself inhibited the synthesis of NF-B mRNA (Fig. 2E).
When an inhibitor of protein synthesis, cycloheximide (50 M), was added
to the BSS and exposed to OGD, both mRNA and protein levels of GLUTs
were significantly decreased (Fig. 2A-2D).
Neurochemistry International
14
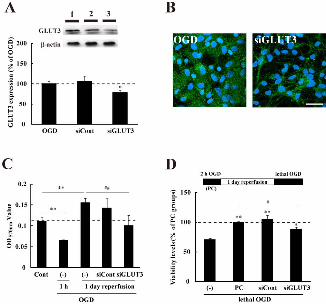
3.3 Functional significance of GLUT3 expression in astrocytes
Treatment of astrocytes with GLUT3 siRNA resulted in a significant
decrease of GLUT3 expression as revealed by both Western blot and
immunocytochemical analyses (Fig. 3A&B). The intracellular glycogen
levels at 1 h reperfusion after OGD were significantly lower than control
values (Fig. 3C). However, the levels at 1 day of reperfusion after OGD
were significantly increased as compared to the control. In contrast, the
increase in intracellular glycogen was suppressed in the GLUT3
siRNA-treated groups. We then investigated whether the increase in
intracellular glycogen deposition was involved in the protection of
astrocytes from subsequent lethal ischemic stress. After 1 day of
reperfusion following 2 h of OGD, the cultures were again exposed to
OGD stress. As shown in Fig. 3D, preconditioned (PC) astrocytes exhibited
resistance to subsequent lethal OGD. Eight hours of lethal OGD
significantly increased astrocytic cell damage as compared to that in the PC
astrocytes. The PC-induced increased resistance was significantly
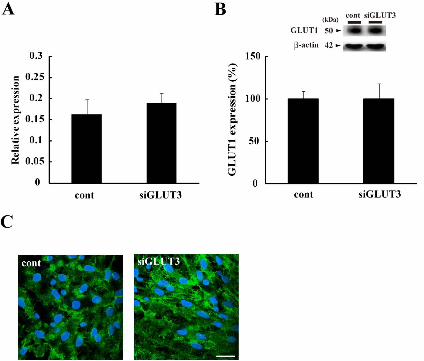
attenuated in cells treated with GLUT3 siRNA. In addition, GLUT3
siRNA treatment did not affect the expression of GLUT1 mRNA and
protein (Fig. 4), further supporting our inference that the PC-induced
increase in GLUT3 was crucial to the increased glucose uptake, leading to
the development of resistance to lethal ischemia.
Neurochemistry International
15
4. Discussion
4.1 Ischemic stress induces GLUT3 expression via NF-B’s signaling
pathways
Our findings demonstrate that astrocytes enhance not only GLUT1 but also
GLUT3 protein expression under ischemic conditions. NF-B’s signaling
pathways increase both astrocytic GLUT3 mRNA and protein levels in
astrocyte-enriched cultures. GLUT3 only takes up extracellular glucose, it
does not release intracellular glucose even if its concentration is higher than
that of extracellular glucose ([GLU]e). Therefore, it seems reasonable that
neurons strongly express GLUT3 under physiological conditions, because
glucose is a necessary source of energy to sustain neuronal activities. What
if neuronal GLUTs expression occurs under pathological conditions?
Immediately after anoxic or ischemic insults, stressed neurons increase
their own GLUT3 gene expression, and additionally, enhanced GLUT1
mRNA expression is also observed (Vannucci et al., 1998; Yu et al., 2008).
These phenomena imply that glucose transport is critical for neurons to
survive under pathological conditions. In contrast, glucose is mainly taken
up through GLUT1 in astrocytes. When the extracellular concentration of
glucose is low, astrocytes also increase their GLUT1 mRNA both in vivo
and in vitro (Vannucci et al., 1998; Yu et al., 2008), suggesting this inherent
response to be pivotal for astrocytes to avoid acute or delayed cell death
under anoxic or ischemic conditions. In addition, GLUT3 mRNA is not
Neurochemistry International
16
detectable in astrocytes after hypoxic stress (Yu et al., 2008). However,
using established techniques for anoxic or ischemic insults, the loading
period for the anoxic gas mixture is generally determined by the neuronal
response to the stress, i.e., the stress is sublethal or lethal to neurons, but
these conditions may be less than sublethal to astrocytes.
Contrary to in previous studies (Vannucci et al., 1998; Yu et al., 2008),
GLUT3 protein was detected at low levels in control astrocytes (Fig.1). The
immunofluorescent analysis also showed the translocation of GLUT3 from
the cytoplasm to plasma membrane after OGD (Fig. 1D: lower figure).
Though primary neurons were used as GLUT3-positive controls, we
initially suspected that the antibody used was not specific to the GLUT3
protein. Therefore, a Western blot analysis of GLUT3 expression with
another anti-GLUT3 antibody (IBL, Gunma, Japan) was performed.
Nevertheless, GLUT3 expression was similarly observed in the control
groups although the expression was low, and 2 h of OGD increased the
level about 1.3 fold (data not shown). Additional evidence for the
enhancement of astrocytic GLUT3 expression comes from another report.
Cidad P et al. showed that the endotoxin lipopolysaccharide (LPS)
increased intracellular nitrite (NO2-) concentrations, and GLUT3 expression
in rat astrocytic cultures was enhanced, leading to an increase in glucose
uptake activity (Cidad et al., 2001). These results seem meaningful, but the
astrocytic cytotoxicity of LPS (1 g/mL) and signal transduction regulating
the GLUT3 gene are unknown. The transcription factor Sp1 or NF-B
seems to play an important role in the regulation of the GLUT1 gene.

Neurochemistry International
17
Vasoconstrictor Endothelin-1 (ET-1) induced GLUT1 gene expression via
PKC or MAPK signaling pathways through Sp1 and NF-B in 3T3-L1
adipocytes (Kao and Fong, 2008). In addition, some oncogenes
down-regulate p53 activity, leading to the activation of IKK or IKK and
to NF-B downstream, resulting in the up-regulation of GLUT3 gene
expression (Kawauchi et al., 2008). In the present study, NF-B mRNA
levels increased markedly during OGD, and wedelolactone (50 M)
treatment induced significant decreases in GLUTs mRNA and protein, and
the protein synthesis inhibitor cycloheximide (100 M) also suppressed
GLUTs expression (Fig. 2). These results suggest that NF-B’s signaling
pathways contribute to the increase in not only mRNA but also protein
levels of GLUT3 in astrocytic cultures. Further research is needed to
investigate how levels of NF-B mRNA induce GLUT3 expression since
the transcription factor regulates both GLUT1 and GLUT3.
4.2 Functional significance of the ischemia-induced increase in GLUT3
expression
Astrocytes could transport extracellular glucose through enhanced GLUT
activities when they were recovered from the OGD. The glucose was
quickly consumed to recover or sustain the homeostasis of cells; therefore,
intracellular glycogen levels might be lower at 1 h of reperfusion (Fig. 3C).
The amount of glycogen was significantly increased at 1 day of reperfusion
as compared to the control. The results imply that inducible GLUT3 might
Neurochemistry International
18
support GLUT1 activities, leading to the enhancement of glucose uptake
into the astrocytes during reperfusion after ischemia. When astrocytes were
treated with siRNA for GLUT3 mRNA, the ischemia-induced increase in
intracellular glycogen was significantly attenuated: the intracellular
glycogen levels in siGLUT3-treated astrocytes were not significantly
different to those in cells of the control groups (Fig. 3C). These results are
unexpected since GLUT1 mRNA levels were more increased after OGD as
compared to GLUT3 mRNA levels (Fig. 1), and the primary GLUT in
astrocytes is GLUT1; therefore, we speculated that the increase in glycogen
was mainly regulated by enhanced GLUT1 expression, and inducible
GLUT3 expression might make a slight contribution. To understand the
precise role of GLUTs in glycogen deposition under pathological
conditions, additional experiments using siRNA for GLUT1 mRNA are
needed.
The question then arises as to why astrocytes need to accumulate
much more intracellular glycogen under pathological conditions. Our
previous report indicates many strongly GFAP-positive astrocytes at 1 day
of reperfusion after 2 h of OGD, and that such reactive astrocytes are more
resistant to subsequent lethal OGD (Iwabuchi and Kawahara, 2009).
Ischemic resistance to 8 h of lethal OGD was also seen in astrocytes treated
with scrambled RNA for GLUT3 mRNA (siCont), but the tolerance was
significantly attenuated in cells treated with siGLUT3 (Fig. 3D). These
findings suggest extracellular glucose to be transported through
enhanced-GLUT3 activity early in the reperfusion after OGD, leading to
Neurochemistry International
19
the acceleration of glycogen synthesis and/or storage during 1 day of
reperfusion, and much glycogen to be available to resist against subsequent
lethal OGD. Further studies are needed to investigate whether ischemic
stress enhances astrocytic GLUT3 expression and increases the
intracellular glycogen store in an in vivo ischemic model. Astrocytes with
ischemic tolerance would survive under severe ischemic conditions, and
probably contribute to the protection of neurons from ischemic damage in
the brain.
Neurochemistry International
20
Acknowledgements
The analysis of immunoreactivity was carried out with a confocal laser
scanning microscope; FV300 at the OPEN FACILITY, Hokkaido
University Sousei Hall. This research was supported by a Research
Fellowship of the Japan Society for the Promotion of Science to S. I. It was
also partly supported by grants-in-aid for scientific research from the
Ministry of Education, Science, and Culture of Japan (21650103 &
22300148) to KK.

Neurochemistry International
21
References
Brown, J.O., Mc, C.G., 1947. Abortive regeneration of the transected spinal
cord. The Journal of comparative neurology 87, 131-137.
Cidad, P., Garcia-Nogales, P., et al., 2001. Expression of glucose
transporter GLUT3 by endotoxin in cultured rat astrocytes: the role of
nitric oxide. Journal of neurochemistry 79, 17-24.
Iwabuchi, S., Kawahara, K., 2009. Possible involvement of extracellular
ATP-P2Y purinoceptor signaling in ischemia-induced tolerance of
astrocytes in culture. Neurochemical research 34, 1542-1554.
Iwabuchi, S., Kawahara, K., 2011. Functional significance of the
negative-feedback regulation of ATP release via pannexin-1
hemichannels under ischemic stress in astrocytes. Neurochemistry
international 58, 376-384.
Kao, Y.S., Fong, J.C., 2008. Endothelin-1 induces glut1 transcription
through enhanced interaction between Sp1 and NF-kappaB
transcription factors. Cellular signalling 20, 771-778.
Kawahara, K., Hosoya, R., et al., 2002. Selective blockade of astrocytic
glutamate transporter GLT-1 with dihydrokainate prevents neuronal
death during ouabain treatment of astrocyte/neuron cocultures. Glia 40,
337-349.
Kawauchi, K., Araki, K., et al., 2008. p53 regulates glucose metabolism
through an IKK-NF-kappaB pathway and inhibits cell transformation.
Nature cell biology 10, 611-618.
Neurochemistry International
22
Li, L., Lundkvist, A., et al., 2008. Protective role of reactive astrocytes in
brain ischemia. J Cereb Blood Flow Metab 28, 468-481.
Maher, F., Davies-Hill, T.M., et al., 1996. Substrate specificity and kinetic
parameters of GLUT3 in rat cerebellar granule neurons. The
Biochemical journal 315 ( Pt 3), 827-831.
Maher, F., Vannucci, S.J., et al., 1994. Glucose transporter proteins in brain.
Faseb J 8, 1003-1011.
Rakic, P., 1971. Neuron-glia relationship during granule cell migration in
developing cerebellar cortex. A Golgi and electronmicroscopic study
in Macacus Rhesus. The Journal of comparative neurology 141,
283-312.
Vannucci, S.J., Maher, F., et al., 1997. Glucose transporter proteins in brain:
delivery of glucose to neurons and glia. Glia 21, 2-21.
Vannucci, S.J., Reinhart, R., et al., 1998. Alterations in GLUT1 and
GLUT3 glucose transporter gene expression following unilateral
hypoxia-ischemia in the immature rat brain. Brain Res Dev Brain Res
107, 255-264.
Wood, I.S., Trayhurn, P., 2003. Glucose transporters (GLUT and SGLT):
expanded families of sugar transport proteins. The British journal of
nutrition 89, 3-9.
Yu, S., Zhao, T., et al., 2008. Hypoxic preconditioning up-regulates glucose
transport activity and glucose transporter (GLUT1 and GLUT3) gene
expression after acute anoxic exposure in the cultured rat hippocampal
neurons and astrocytes. Brain research 1211, 22-29.
Neurochemistry International
23
Figure Legends
Fig.1 OGD increases GLUT expression. A&B: The level of GLUT1 (A) or
GLUT3 (B) mRNA relative to -actin mRNA was determined by real-time
PCR. Data are expressed as the mean ± S.E.M. (n = 6, different cultures).
**p < 0.01 vs GLUT expression in control groups (cont). C: Western blot
analysis of GLUTs and -actin. A quantitative evaluation of GLUTs
expression relative to -actinwas performed, with level in control groups
taken to be 100%. Data are expressed as the mean ± S.E.M. (n = 10,
different cultures). **p < 0.01 vs GLUT1 expression (white bars), and ##p <
0.01 vs GLUT3 expression (black bars) in control groups. D:
Representative immunofluorescent images. GLUT1 (upper images) or
GLUT3 (lower images)-positive astrocytes (green) and cell nuclei stained
with Hoechst 33342 (blue) in control groups or OGD groups are shown.
Scale bars indicate 100 m.
Fig.2 OGD-induced GLUTs expression is regulated through NF-B’s
signaling pathways. During OGD, wedelolactone (50 M) or
cycloheximide (100 M) was added to the cultures and then a real-time
PCR or Western blot analysis of GLUTs was performed. A&B: Relative
expression of GLUT1 (A) or GLUT3 (B) mRNA. Data are expressed as the
mean ± S.E.M. (n = 4, different cultures). **p < 0.01 vs GLUTs expression
at 1 h of OGD (OGD1h), and ##p < 0.01 vs GLUTs expression at 2 h of
OGD (OGD2h). wedelo: wedelolactone treatment groups, cyclo:
Neurochemistry International
24
cycloheximide treatment groups. C: Upper images are representative
images of the control, 2 h of OGD with or without each inhibitor. Data are
expressed as the mean ± S.E.M. (n = 4, different cultures). The rate of
GLUTs/-actin expression at 2 h of OGD was taken to be 100%, and used
to calculate the rate of GLUTs/-actin expression at 2 h of OGD with each
inhibitor. These inhibitors significantly suppressed the increase in GLUT1
(white bars) and GLUT3 (black bars). *p < 0.05, **p < 0.01 or #p < 0.05, ##p
< 0.01 vs 2 h of OGD. D: Representative immunofluorescent images.
GLUTs-positive astrocytes (green) and their nuclei (blue) at 2 h of OGD
with or without the inhibitor. Scale bars indicate 200 m. E: Relative
expression of NK-B mRNA. Data are expressed as the mean ± S.E.M. (n
= 6, different cultures). **p < 0.01 vs control groups, and ++p < 0.01 vs each
OGD groups.
Fig.3 Sublethal ischemia-induced increase of GLUT3 expression
contributed to the development of tolerance against subsequent lethal
ischemic stress. A: GLUT3 expression was significantly down-regulated in
GLUT3 siRNA-treated astrocytes. Astrocytes were treated with scrambled
(siCont) or GLUT3 siRNA (siGLUT3), and then exposed to sOGD.
Representative results are shown. Lane 1; sOGD, lane 2; Control
siRNA-treated astrocytes, lane 3; GLUT3 siRNA-treated astrocytes. Data
are expressed as the mean ± S.E. (n = 8, different cultures). *p < 0.05 vs
sOGD groups. B: Representative GLUT3-immunofluorescent images.
GLUT3-positive astrocytes (green) and their nuclei (HE, blue) in sOGD

Neurochemistry International
25
groups or GLUT3 siRNA-treated groups. Scale bar indicates 100 m. C:
Levels of glycogen at 1 h or 1 day of reperfusion after 2 h of OGD
measured with a glycogen-assay kit. The data indicate optical density
values at 570 nm, and are expressed as the mean ± S.E. (n = 6, different
cultures). The levels were low at 1 h of reperfusion, but were increased as
compared to the control at 1 day of reperfusion. **p < 0.01 vs control (Cont)
groups, ##p < 0.01 vs 1 day of reperfusion. D: The increase in GLUT3
expression was associated with resistance to lethal OGD stress. Cell
viability was determined by MTT-assay. The diagram shows the
experimental protocol. The viability levels in PC (2 h of OGD)-treated
groups were taken to be 100%. Data are expressed as the mean ± S.E. (n =
7, different cultures). **p < 0.01 vs lethal OGD without PC, ##p < 0.01 vs
PC treatment.
Fig.4 Expression of GLUT1 was not affected by GLUT3 siRNA treatment.
A: Relative expression for -actin of GLUT1 mRNA was performed by
real-time PCR analysis. Data are expressed as the mean ± S.E.M. (n = 4,
different cultures). cont: control, siGLUT3: GLUT3 siRNA-treated groups.
B: Western blot analysis of GLUT1. A quantitative evaluation of GLUTs
expression for -actin was performed, and each level in control groups was
taken to be 100%. Upper images are representative blotting data of GLUT1
and -actin. Data are expressed as the mean ± S.E.M. (n = 3, different
cultures). C: Representative GLUT1-immunofluorescent images.
GLUT1-positive astrocytes (green) and their nuclei (HE, blue) in the
Neurochemistry International
26
control (cont) or GLUT3 siRNA-treated groups (siGLUT3). Scale bar
indicates 100 m.