industrial area growth strategy consulting report
TRANSCRIPT

REGION O FPEEL CUSHMAN & WAKEFIELD 1
INDUSTRIAL AREA GROWTH STRATEGY CONSULTING REPORT
THE CITY OF CALGARY
FEBRUARY 2021
CUSHMAN & WAKEFIELD 161 BAY ST., SUITE 1500 P.O. BOX 602 TORONTO, ONTARIO M5J 2S1 (416) 862-0611
FOXWOOD
February 26, 2021
To: Abdul Jaffari, RPP, MCIP Senior Growth Management Planner Calgary Growth Strategies The City of Calgary [email protected] Re: Industrial Area Growth Strategy Consulting Report Cushman & Wakefield partnered with metroeconomics and The Planning Partnership to undertake this Industrial Area Growth Strategy Consulting Report. The Consultant Team is appreciative of the considerable support received from City staff and input from the Industrial Strategy Working Group throughout this engagement. We are pleased to have once again demonstrated our real estate market intelligence, land supply and demand analysis, and strategic growth management capabilities to The City of Calgary.
If you have any questions, please contact the undersigned.
Respectfully submitted,
Cushman & Wakefield ULC
Andrew Browning Vice President, Valuation & Advisory Cushman & Wakefield [email protected] (416) 359-2510
INDUSTRIAL AREA GROWTH STRATEGY CONSULTING REPORT – THE CITY OF CALGARY
TABLE OF CONTENTS
Executive Summary ................................................................................................................................. i
1.0 Introduction ....................................................................................................................................... 1
1.1 Project Overview ........................................................................................................................ 1
1.2 Consultant Team Overview ........................................................................................................ 2
2.0 Understanding the Local Industrial Landscape and Market Trends ................................................. 3
2.1 Introduction ................................................................................................................................ 3
2.2 Industrial Market Overview ........................................................................................................ 3
2.3 Impacts of COVID-19 ................................................................................................................. 5
2.4 The Importance of Industrial/Employment Areas ....................................................................... 9
3.0 Industry Clusters ............................................................................................................................. 11
3.1 Introduction .............................................................................................................................. 11
3.2 Components of the Calgary CMA ............................................................................................ 11
3.3 Employment by Industry .......................................................................................................... 12
3.4 Site Selection Criteria and Land Requirements ....................................................................... 18
4.0 Issues Affecting Calgary’s Industrial Lands .................................................................................... 21
4.1 Introduction .............................................................................................................................. 21
4.2 Trends Impacting Industrial Real Estate and New Development ............................................ 21
4.3 Impact of Airport Vicinity Protection Area Changes ................................................................. 23
4.4 Climate Change and Industrial Development .......................................................................... 24
5.0 Land Supply/Demand Analysis and Leveraging Competitive Advantages .................................... 25
5.1 Introduction .............................................................................................................................. 25
5.2 Calgary’s Industrial Competitive Advantages .......................................................................... 25
5.3 Vacant Industrial Land Supply Analysis ................................................................................... 27
5.4 Occupied Industrial Land Supply Analysis ............................................................................... 40
5.5 Industrial Land Demand Projection .......................................................................................... 45
5.6 Land Supply and Demand Conclusions ................................................................................... 46
6.0 Competitive Markets Assessment – Calgary Metropolitan Region ................................................ 48
6.1 Introduction .............................................................................................................................. 48
6.2 Property Tax Rates Comparison .............................................................................................. 48
6.3 Off-Site Levies and Other Development-Related Charges/Fees Comparison ........................ 49
6.4 Municipal Reserve .................................................................................................................... 54
6.5 Partnership and Synergistic Relationship Opportunities.......................................................... 54

INDUSTRIAL AREA GROWTH STRATEGY CONSULTING REPORT – THE CITY OF CALGARY
7.0 Planning Policy Perspectives ......................................................................................................... 56
7.1 Introduction .............................................................................................................................. 56
7.2 Calgary Industrial Planning Framework Overview ................................................................... 56
8.0 Strategic Growth Management Recommendations ........................................................................ 58
8.1 Introduction .............................................................................................................................. 58
8.2 Industry Trends-Related Recommendations ........................................................................... 59
8.3 Site Selection-Related Recommendations .............................................................................. 60
8.4 Industry Clusters-Related Recommendations ......................................................................... 62
8.5 Planning Policy Recommendations ......................................................................................... 63
8.6 Land Supply Monitoring Recommendations ............................................................................ 67
8.7 Competitive Markets Assessment-Related Recommendations ............................................... 68
Appendix A – Employment Forecast Methodology ................................................................................. I
Appendix B – Competitive Markets Assessment – Western Canada and Pacific Northwest U.S. ....... IV
INDUSTRIAL AREA GROWTH STRATEGY CONSULTING REPORT – THE CITY OF CALGARY
i
EXECUTIVE SUMMARY
This Industrial Area Growth Strategy Consulting Report is one of several projects that are components of The City of Calgary’s overall growth management strategy. Together with the New Community Growth Strategy and the Established Area Growth and Change Strategy, this project provides insights and strategic directions for the Citywide Growth Strategy. Specifically, the purpose of this report is to articulate Calgary’s competitive advantages to exploit opportunities in its industrial areas, to identify the economic sectors and industries that The City is best positioned to attract, and to enable growth. This report explores a series of key topics/questions to assist The City of Calgary with its industrial land use planning and economic development strategy.
Industrial activities continue to be critical to the economic health of cities and regions. It is vital that municipalities plan for the provision of an adequate industrial land supply to provide a range of choice among prospective occupiers, given the competitive development market. The city’s industrial/employment areas are important for a number of reasons, including providing a source of jobs, supporting the tax base, facilitating expansion of the local economy, and providing a home to many of the activities that support the local population.
The 20 largest industrial-type employment clusters in Calgary span the range of industries from transportation and warehousing (warehousing and storage; general freight trucking; and specialized freight trucking) to wholesale trade (seven different industry groups) to manufacturing (accounting for 10 of the 20 largest industry groups). Looking forward, many of the largest industry groups in 2016 across the Calgary CMA are anticipated to drive employment growth over the next 25 years. Of the largest industry groups/clusters in 2016, 11 are among the top 20 largest in terms of industrial-type employment growth for the period from 2016-2041. Among the leading sectors for employment growth include warehousing and storage, general and specialized freight trucking, food merchant wholesalers, architectural and structural metals manufacturing, and recyclable material merchant wholesalers – a diverse range of uses with varied site selection requirements.
Calgary’s industrial competitive advantages include its strategic location in Western Canada, the diversity of its industrial employment base, the presence of Calgary International Airport, its large and growing labour force, and Alberta’s tax advantage. Calgary offers prospective industrial occupiers with the full breadth of required site selection attributes to start a new business – it has available lands for development, and a network of established industry that can serve as suppliers and buyers/end-users of goods and services. The city is well served by transportation to facilitate movement of raw materials and finished products to markets nearby, across Canada, and internationally.
Cushman & Wakefield collaborated with City staff to develop a data set of available industrial parcels across the city. This Vacant Industrial Land Inventory is comprised of both privately-owned lands, as well as City-owned lands. The overall vacant industrial land inventory totals approximately 2,400 net hectares. Based on the Consultant Team’s review of the vacant industrial land supply that is planned and designated, there is an adequate provision of lands across a range of geographic areas, Land Use Districts, and parcel sizes, to accommodate a spectrum of prospective occupiers and users. As well, there are lands in varying stages of servicing – from fully serviced, to partially serviced, to currently “raw” lands – such that this should not represent a constraint to accommodating industrial-type job growth for the foreseeable future.
INDUSTRIAL AREA GROWTH STRATEGY CONSULTING REPORT – THE CITY OF CALGARY
ii
The range of sites across the city provide suitable access and visibility to users that prioritize these attributes, and the Ring Road – upon completion – will greatly enhance goods movement. Linking back to the earlier discussion regarding the industry clusters that are prominent in the city, and which are poised to grow over the forecast horizon, it is the view of the Consultant Team that the present supply of planned industrial lands is capable of meeting the site selection requirements across a broad range of industry groups, and that there are no apparent obstacles from a land supply perspective to enabling growth and incubating new opportunities that are not already present in the local market. The city’s land supply itself is a competitive advantage that can be leveraged to foster economic development.
Cushman & Wakefield also collaborated with City staff to develop a data set of occupied industrial parcels across the city – properties with one or more buildings on them. By count of parcels, of the total of almost 3,200 parcels identified within the Strategic Industrial Areas, 83% are industrial, 14% are commercial, and the remaining land uses account for a 3% share. Among this data set, the Consultant Team has identified 160 existing industrial properties that meet the criteria of having less than 20% site coverage and which are also at least 2 hectares in size, which represent prospective properties that could be intensified in the future. Of course, it is not reasonable to assume that all “underutilized” sites will intensify – but only a small share of intensification has the effect of lessening the extent of new greenfield industrial development over time (and the associated cost of extending municipal services).
A forecast of employment by industry enabled Cushman & Wakefield to translate job growth into land demand by utilizing an employment density figure (number of employees per hectare of land). Two forecast approaches were used to estimate future land demand based on industrial-type employment growth: (a) we utilized the net new industrial-type employment in each industry sector over the 2016-2041 forecast horizon; and, (b) we only included industry groups that are anticipated to see increased employment during the forecast horizon (industry groups that are projected to see a decline in employment are not included in the total employment in each industry). The result is an anticipated need for roughly 600-900 net hectares of land to accommodate industrial growth from 2016 through 2041 within the City of Calgary.
One of the key objectives of this Industrial Area Growth Strategy Consulting Report is to evaluate how The City of Calgary is positioned for industrial land development relative to the Calgary Metropolitan Region (CMR). This examination provides a comparison of industrial property tax rates, off-site levies and other development-related charges/fees, and municipal reserve requirements. The City of Calgary had the highest non-residential (industrial) mill rate in 2020 among the CMR municipalities. An examination of off-site levies and other development-related costs reveals that an “apples-to-apples” comparison of a prospective industrial development located in the City of Calgary versus the East Balzac area within Rocky View County is a challenge because the two municipalities have differing approaches to recovering development-related costs. Overall, however, it is apparent that the costs to develop an industrial building in East Balzac are less than the same facility locating in the City of Calgary. Finally, higher land values in Calgary contribute to higher municipal reserve requirements compared to neighbouring East Balzac.
This Industrial Area Growth Strategy Consulting Report concludes with planning policy perspectives to assist City staff going forward, including a review of the Municipal Development Plan and Land Use Bylaw 1P2007. The Consultant Team’s strategic growth management recommendations cover the themes of industry trends, site selection, industry clusters, planning policy, land supply monitoring, and competitive markets.

INDUSTRIAL AREA GROWTH STRATEGY CONSULTING REPORT – THE CITY OF CALGARY
1
1.0 INTRODUCTION
1.1 Project Overview
This Industrial Area Growth Strategy Consulting Report is one of several projects that are components of the overall growth management strategy being undertaken by The City of Calgary. Together with the New Community Growth Strategy and the Established Area Growth and Change Strategy, this project will provide insights and strategic directions for the Citywide Growth Strategy. Specifically, the purpose of this Industrial Area Growth Strategy Consulting Report is to articulate Calgary’s competitive advantages to exploit opportunities in its industrial areas, to identify the economic sectors and industries that The City is best positioned to attract, and to enable growth. This reporting will feed into The City’s Industrial Area Growth Strategy, and provide short-term and long-term recommendations to foster growth, and attract and retain businesses.
Calgary’s Municipal Development Plan (MDP) provides direction for growth and change, prioritizing corporate initiatives and public investment. Further, the MDP provides direction and certainty to both business and communities, in support of private sector investment in housing, commercial, and industrial developments. The City’s five Industrial Area Structure Plans (ASP) refine and implement The City's broader planning objectives contained in the MDP (the industrial ASPs are for the Northeast, Shepard, Southeast 68 Street, Southeast, and Stoney areas). These plans help to shape the physical environment with the goal to achieve a pattern of orderly, economical, compatible development, in support of successful business and industrial sector growth. Ultimately, the objective of these analyses is to enable The City to plan for (anticipate) and manage growth (execute and monitor) to develop complete communities, meet population and employment growth targets, and manage associated infrastructure spending in a cost-effective manner.
Our approach to this project involved close collaboration among the experts from various disciplines that comprise the Consultant Team, to develop evidence-based conclusions and recommendations to guide industrial land planning in Calgary over the next several decades. We have identified actions that are required over the short term to address immediate needs, as well as longer-term planning issues that warrant monitoring by City staff as lands are absorbed, and as market conditions evolve.
The project deliverables include this comprehensive Industrial Area Growth Strategy Consulting Report, which describes our methodology, and includes all of our analysis supporting the strategic recommendations. This report presents our land supply and demand analysis; explores our assessment of market and industry trends; identifies Calgary’s competitive advantages compared to competitive markets; and provides strategic planning policy and growth management guidance. As well, we have delivered an up-to-date Industrial Land Inventory Database, and associated Mapping. A Presentation of the final report has also been prepared.
This report explores a series of key topics/questions to assist The City of Calgary with its industrial land use planning and economic development strategy, including:
From an industrial perspective, what is Calgary’s competitive advantage, and what economic sectors is Calgary best positioned to attract?
Identify the leading industry clusters in Calgary by determining their size, their contribution to the city and regional economy, and their potential for growth. As well, identify their site selection criteria and land needs.
How do industrial land uses benefit Calgary’s overall economy?
How is Calgary positioned for industrial land development relative to the Calgary Metropolitan Region?

INDUSTRIAL AREA GROWTH STRATEGY CONSULTING REPORT – THE CITY OF CALGARY
2
What are the trends of industrial development in North America?
What is the forecasted market demand for different categories of industrial land? Based on Calgary’s location and advantages, is there enough serviced or planned industrial land?
Recommend short-term and long-term solutions/actions to attract and retain capital investment in industrial land development in Calgary, and recommend actions that The City could take to respond to its weaknesses and capitalize on its strengths.
1.2 Consultant Team Overview
A multi-disciplinary Consultant Team was assembled to address the requirements of this project. The firms featuring wide-ranging experience across the multiple disciplines needed in order to undertake this work. Cushman & Wakefield (real estate market and employment trends, and land supply/demand analysis) is the Lead Consultant and Project Manager, partnered with Sub-Consultants metroeconomics (economic and employment forecasting) and The Planning Partnership (strategic land use recommendations and GIS/mapping).
INDUSTRIAL AREA GROWTH STRATEGY CONSULTING REPORT – THE CITY OF CALGARY
3
2.0 UNDERSTANDING THE LOCAL INDUSTRIAL LANDSCAPE AND MARKET TRENDS
2.1 Introduction
The following section explores the composition of the local industrial market, as well as key trends. A current and historic industrial market overview provides insights regarding inventory, vacancy, absorption, new supply, and rental rates, on a submarket basis. As well, we discuss the impacts of the COVID-19 crisis on the industrial market as an asset class as a whole, as well as offer local perspectives. Finally, we explore the importance of industrial/employment areas to cities.
Note that while the balance of this report is primarily expressed in metric units (hectares, square metres, etc.), this section utilizes imperial measures (square feet, dollars per square foot, etc.). This is because commercial real estate data is typically tracked in imperial units – including Cushman & Wakefield’s market survey data, which is presented below.
2.2 Industrial Market Overview
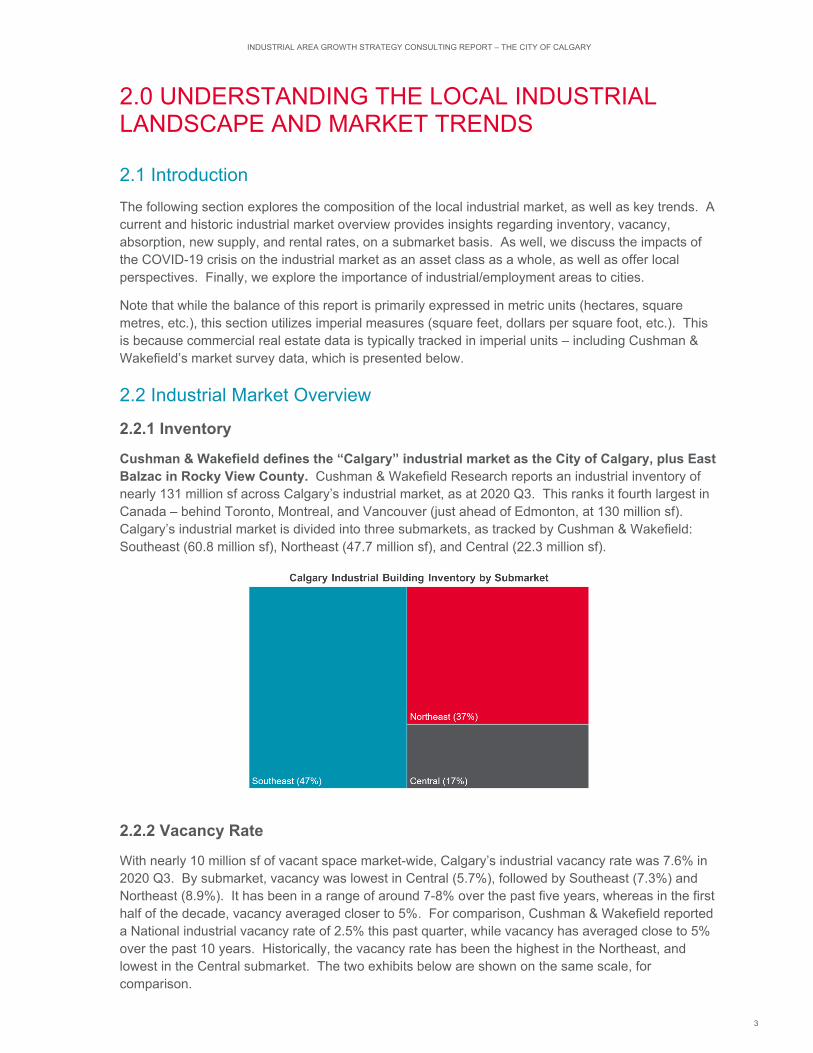
2.2.1 Inventory
Cushman & Wakefield defines the “Calgary” industrial market as the City of Calgary, plus East Balzac in Rocky View County. Cushman & Wakefield Research reports an industrial inventory of nearly 131 million sf across Calgary’s industrial market, as at 2020 Q3. This ranks it fourth largest in Canada – behind Toronto, Montreal, and Vancouver (just ahead of Edmonton, at 130 million sf). Calgary’s industrial market is divided into three submarkets, as tracked by Cushman & Wakefield: Southeast (60.8 million sf), Northeast (47.7 million sf), and Central (22.3 million sf).
2.2.2 Vacancy Rate
With nearly 10 million sf of vacant space market-wide, Calgary’s industrial vacancy rate was 7.6% in 2020 Q3. By submarket, vacancy was lowest in Central (5.7%), followed by Southeast (7.3%) and Northeast (8.9%). It has been in a range of around 7-8% over the past five years, whereas in the first half of the decade, vacancy averaged closer to 5%. For comparison, Cushman & Wakefield reported a National industrial vacancy rate of 2.5% this past quarter, while vacancy has averaged close to 5% over the past 10 years. Historically, the vacancy rate has been the highest in the Northeast, and lowest in the Central submarket. The two exhibits below are shown on the same scale, for comparison.

INDUSTRIAL AREA GROWTH STRATEGY CONSULTING REPORT – THE CITY OF CALGARY
4
2.2.3 Absorption and New Supply
The industrial market across Calgary has averaged just over 2 million sf of positive absorption annually over the past decade (absorption is defined as the change in occupied space from one period to another, such as year-over-year). 2016 was the only year in which negative absorption was recorded (a decline in the amount of occupied space). Despite the challenges associated with the current economic environment due to COVID-19, absorption has been positive through the first three quarters of 2020 (approximately 233,000 sf).
Over the past 10 years, the Calgary industrial market has averaged just over 2 million sf of new supply annually; this figure has ranged from a low of 324,000 sf in 2017, to a high of nearly 5.3 million sf added in 2019. Through the first three quarters of 2020, the market has seen close to 575,000 sf new supply added. There is a further 2.5 million sf presently under construction (approximately 2.1 million sf in the Northeast, and 0.4 million sf in the Southeast).
By submarket, the Northeast has accounted for approximately 60% of all new industrial supply completed during the past decade, while the Southeast has accounted 40% (the Central submarket has contributed a negligible 1% share of overall new supply, due to the built-up nature of the city’s centrally-situated industrial areas). Notably, from 2011-2017, new supply in the Northeast and Southeast was fairly balanced; the significant new supply added in 2019 in the Northeast (some 4 million sf) accounts for a sizable portion of the overall variance in new supply by geography.
Of the total 24.1 million sf of new industrial construction recorded across the Calgary industrial market since 2010, 18.6 million sf (77%) was in the City of Calgary, while 5.5 million sf (23%) was in East Balzac (Rocky View County). This new supply figure includes both properties that are included in the Cushman & Wakefield market survey data, as well as properties that were built but are excluded from our reported statistics (such as industrial condominiums, owner-occupied buildings, building size is too small, or other factors).

INDUSTRIAL AREA GROWTH STRATEGY CONSULTING REPORT – THE CITY OF CALGARY
5
2.2.4 Rental Rates
2020 Q1 represented the recent cyclical low rental rate for industrial space in Calgary, influenced by economic fears associated with the dawn of the COVID-19 crisis in Canada. However, rents have rebounded strongly over the past two quarters, and are back at the level seen during much of the past decade (roughly $8.75 net psf on average city-wide, with some variance among the submarkets).
2.3 Impacts of COVID-19
2.3.1 Overview
Cushman & Wakefield is a thought leader on the COVID-19 crisis and recovery process, from a commercial real estate perspective. We advise occupiers and landlords on a daily basis, and are knowledgeable about their needs, and site selection priorities. Cushman & Wakefield identifies the Industrial/Logistics sector as a clear “Winner” among the various commercial real estate asset classes. The “Winners” are those sectors that were already benefiting from long-term demographic and structural shifts in the economy, only to see those shifts accelerated by COVID-19. They are also benefiting from the rapid evolution of technology and its application to a specific set of challenges. Though the North American industrial market faces a bumpy 2020 and beyond linked to the pandemic and recession fallout, structural trends favour increased demand and strong performance in both the near- and long-term. Other notable real estate asset class “Winners” include Data Centres and Life Sciences.

INDUSTRIAL AREA GROWTH STRATEGY CONSULTING REPORT – THE CITY OF CALGARY
6
2.3.2 North American/Global Industrial Market Perspectives
The following are some perspectives drawn from recent Cushman & Wakefield Research publications exploring the impacts of the COVID-19 crisis on the industrial real estate market:
The move to online shopping has been happening for some time now. Internet sales were estimated to account for 16.7% of all core retail sales (defined as total sales minus auto, gasoline, and restaurants) at the end of 2019. Six months later, that share had surged to 22.5%, as large segments of the population remained at home to reduce health risks. In the second quarter of 2020, internet sales surged 44.5% year-over-year. In this environment, it is no surprise that demand for logistics space is nearly back to pre-crisis levels, and occupancy is near all-time highs. When have we ever seen a recession lead to higher demand for space of any kind?
− NOTE: While these rates of online sales reference U.S. data, a comparable dynamic is likely in Canada.
Logistics real estate fundamentals were healthy heading into the pandemic-induced slowdown. At 4.9%, market vacancy in the United States remained near its historic low of 4.8%, while in Canada the vacancy rate was a razor-thin 2.8% for all industrial product in 2020 Q1. Absorption came in at 47 million sf in 2020 Q1, the 40th consecutive quarter of North American occupancy growth. Extremely tight market conditions in both Canada and the U.S. warrant new development and minimize the risk of new supply undermining asset values.
As the world adjusts to life during the COVID-19 pandemic, we are seeing a marked acceleration in the adoption or improvement of supply chain innovations, and an opportunity to address some pain points that had been lower on the priority list for many industries.
Compared to prior economic downturns, the big differentiator for the industrial market this time around will be the growth of e-commerce/logistics space. With the boom of e-commerce, we have seen the industrial market excel in the current expansion – more than almost any other cycle. With the sale of more goods online, there is a need for the logistics space to house the goods outside of a traditional brick and mortar store. Especially in the COVID-19 era, consumers want goods shipped directly to them, cutting out the retail location as the middleman, going straight from business to consumer (B2C). This will drive the need for more industrial inventory in more locations, both for large box warehouse and last mile infill to reach the consumer faster.
The need for more North American logistics space will become apparent as the pandemic persists, and with that comes the need for faster e-commerce adoption. With the growing consumer demand for goods at a faster, more streamlined rate, and growing retailer demand, the answer for suppliers is to invest in an e-commerce model for direct to consumer shipments. Greater adoption of e-commerce will take serval years to implement across many markets, meaning demand will continue to be widespread for longer than just through the remainder of the pandemic.
Setting aside “panic buying” of certain food items, toilet paper, and cleaning products, the pandemic is raising questions and challenges around managing inventories. Beyond the immediate actions to sell through current seasonal inventories online – sometimes using closed stores as distribution points for “ship from store” – retailers and manufacturers are already contemplating longer-term changes to inventory “days of supply” to avoid disruptions wrought by upstream supply chain points being shuttered or severely reduced in production capacity. Just-in-time inventory management may need new buffers throughout the supply chain, and some sectors are considering supply chain diversity to rebalance their reliance on some geographies – especially those with longer transit times.

INDUSTRIAL AREA GROWTH STRATEGY CONSULTING REPORT – THE CITY OF CALGARY
7
COVID-19 has amplified awareness of the need for contactless technology far beyond payment and delivery solutions used by sellers and consumers. Optical and voice-enabled technology, automation, and robotics will find new adopters in warehouse material handling equipment, order pick technology, and shipping/receiving processes. Robotics in the warehouse may help limit contact among team members receiving goods, picking orders, and shipping them out. Autonomous vehicles may help to offset driver shortages to meet the increased demand for shipments to consumers, and to expedite the shipment of critical goods to rural or remote geographies with fewer transit options and with immunocompromised populations.
One of the most active property types in industrial real estate is cold storage. With online grocery more popular than ever before, restaurants and farmers forced to adjust their food supply chain, and the shutdown of processing plants despite being “essential,” the need for cold storage warehouse space is growing like never before. China, the UK, and the U.S. are all seeing companies looking for new cold storage warehouses, opportunities to expand their existing space, infill properties to better serve e-commerce consumer needs, or ways to modernize facilities to make their supply chains more adaptable.
Despite the strong tailwinds, the COVID-19 era is still a recessionary period, and any recession can cause pain for consumers and businesses. While consumers – the key driver of logistics demand – felt more at ease spending in recent months, recent virus flare-ups, uncertainty surrounding fiscal aid, and a cooling labour market could weigh on their willingness to spend.
While the risk of oversupply for the market is low, it does present a risk for some individual markets with large speculative pipelines.
− NOTE: This is not viewed as a concern for Calgary’s industrial market, which has brought manageable levels of new supply to market in recent years, with absorption tracking closely with new construction. There is currently 2.5 million sf of industrial space under construction (2020 Q3), compared to an annual average of 2 million sf of new supply this past decade.
Manufacturers are likely to hold more inventory as they seek more flexibility and less vulnerability to disruptions. Diversifying component sourcing, including an emphasis on localizing or regionalizing components to be closer to plants while holding more inventories, will require additional logistics real estate. Reshoring or nearshoring would shorten supply chains, effectively reducing long lead times, thereby giving manufacturers more control over production quantities to allow for greater flexibility in response to demand.
The economic health of Canada’s primary trading partner, the U.S., will play a key role in the speed of its recovery.
2.3.3 Calgary Industrial Market Perspectives
While the preceding commentary explored the industrial asset class broadly, the following perspectives pertain specifically to Calgary’s industrial market:
Real Estate Fundamentals
Calgary’s industrial market boasted relatively healthy market fundamentals leading into the COVID-19 pandemic. Absorption was just less than 5 million sf in 2019, and the overall vacancy rate has only seen a slight increase – registering 20 bps above the pre-COVID-19 figure of 7.4%, to close 2020 Q3 at 7.6%. Despite Calgary’s tax increase that went into effect January 2019 and some price-conscious tenants considering relocations to surrounding counties that offer lower operating costs and taxes, landlords have not had to lower their rents in order to compete.
Though the full effects remain to be seen, the timing of COVID-19 did hit the market with enough time to have an impact on first quarter fundamentals. Calgary’s construction cycle means that spring is when developers will often kick off new developments; however, the immediate economic slowdown that came with COVID-19 (and compounded by the stalled energy sector) resulted in many developers placing speculative ground breakings on hold.

INDUSTRIAL AREA GROWTH STRATEGY CONSULTING REPORT – THE CITY OF CALGARY
8
Economic Fundamentals
Calgary’s economy is led by the oil and gas sector, which has caused greater economic swings for the energy-dependent city. At the close of the first quarter of 2020, Calgary had one of the highest unemployment rates of Canada’s major cities, sitting at 8.6%. This is a dramatic turnaround from years past, when Calgary-based companies struggled to find employees, and Canadians flocked to the Western Canadian city. This in-migration grew the city’s population from 1.1 million in 2006 to 1.5 million in 2019.
The industrial market’s drivers have been less impacted by the oil and gas headwinds (with resource-related industrial activity focused further north, in Edmonton). Although year-over-year manufacturing job growth was down, the transportation and warehousing sector – which directly supports e-commerce demands – was up 5.2% versus pre-COVID-19.
Market Strengths
Though Calgary is widely associated with the oil and gas industry, the diversity of the city’s industrial market goes far beyond the energy sector. Connected by both east-west and north-south major truck routes, a robust railway system, and the Calgary International Airport (which counted 4,305 cargo landings in 2019), Calgary is the leading Western Canadian inland port. Calgary is already home to major distribution hubs for Canadian Tire, Walmart, Costco, and Amazon. Amazon, the e-commerce giant, opened its first fulfillment center in Alberta in December 2018 – a 600,000 sf facility which serves not only the Calgary metropolitan population, but is also the main hub for the entire Southern Alberta region. In June 2020, Lowes Canada announced plans for a 1.2 million sf build-to-suit distribution center in Calgary’s Northeast market, with delivery anticipated for 2021 Q4.
Furthering the strength of the city’s logistics network, The City of Calgary, in partnership with the Province of Alberta, has invested heavily in improved truck transportation routes in recent years. With a total of 101 kilometers of free-flow traffic that is set for completion in 2022, the Calgary Ring Road provides improved connection of the city’s peripheral industrial parks to major truck-transportation routes, and further positions the city to continue to leverage the growing demand for e-commerce and logistics.
Headwinds
Slowing demand and robust construction likely to hold vacancy rates – As developers responded to tenants’ increasing demands for newer, more efficient buildings (both from an operations standpoint and energy usage perspective), the flight-to-quality has left a hole in the market as older-generation buildings that are not able to compete with modern standards remain vacant. Given the softening fundamentals, at least in the near-term, the overall vacancy rate is expected to remain elevated.
Rising municipal taxes push tenants out – Following The City of Calgary’s increase of property and business taxes in 2018 and 2019, a number of businesses opted to relocate their operations to nearby communities that offered more competitive tax structures. Although many businesses are still tied to the city due to the proximity to the population and transportation routes, companies that can relocate in order to reduce their overall overhead will likely do so.
Protracted oil and gas recovery – Although Calgary has been through several boom and bust cycles due to the dynamics of the energy sector, and Calgarians pride themselves on their entrepreneurial spirit and adaptability, the protracted recovery from 2015 has certainly weighed on the city. With the additional downturn due to COVID-19, many Calgarians are tightening their wallets and monitoring their discretionary spending, which will certainly impact the warehouse/distribution and manufacturing sectors of the city’s industrial market.

INDUSTRIAL AREA GROWTH STRATEGY CONSULTING REPORT – THE CITY OF CALGARY
9
Tailwinds
Growing e-commerce – With an Amazon distribution center serving not only the metropolitan Calgary area but also the southern half of the province, demand for warehouse distribution properties is expected to grow. This is particularly the case for industrial parks near the Calgary International Airport and the Calgary Ring Road, which connects the city’s residents and businesses.
Tempered new construction keeps vacancy rates in check – Although Calgary’s industrial markets began to register softening fundamentals as new deliveries started to show signs of outpacing net absorption at the end of 2019, developers planning kick-off spring 2020 speculative construction were able to delay projects and retain current inventory, keeping future vacancy rates in check.
National demand continues to hold – The announcement of Lowes Canada’s decision to open a 1.23 million sf, build-to-suit distribution center in the High Plains Industrial Park within Rocky View County (in Calgary’s Northeast submarket, as tracked by Cushman & Wakefield) continues to prove that not only is the Calgary area the leading inland Western Canadian distribution hub, but that the population continues to demand quick deliveries of product.
Conclusions
Unlike in the prior Dot-Com and Global Financial Crisis downturns, Calgary was already weathering the impacts from a protracted economic downturn in the energy sector that began in 2015 when the COVID-19 pandemic began in early 2020. With softer market dynamics that were just showing signs of recovery, COVID-19 proved to be yet another blow to the city’s previously traditional boom-bust economy, and as a result, it will likely take longer to fully recover.
With pent-up e-commerce demand given Canadians’ slower adoption of online shopping (compared to other countries – particularly the U.S.), and growing employment in the transportation and warehouse sectors, the impacts of COVID-19 are anticipated to be comparably minimal on the industrial real estate sector, versus other asset classes.
Although Calgary’s industrial market faces softer market conditions in the near-term, the city’s increased adoption of e-commerce, improved transportation routes, and airport infrastructure, positions the sector well for a faster recovery.
2.4 The Importance of Industrial/Employment Areas
Industrial activities continue to be critical to the economic health of cities and regions. It is vital that municipalities plan for the provision of an adequate industrial land supply to provide a range of choice among prospective occupiers, given the competitive development market. The city’s Industrial/Employment Areas are important for a number of reasons, as follows:
Calgary’s industrial sector continues to be an important source of jobs. Industrial areas supply a huge number of employment opportunities for residents of the city and beyond. Having jobs in proximity to desirable residential communities creates an advantageous live-work relationship, reducing travel trips and times.
− In 2016, there were approximately 70,800 jobs across the Calgary CMA associated with industrial-type employment. This represented an 11% share of total employment.
More local dollars and jobs increase economic stability for the entire community, including the overall standard of living. Established industrial/employment areas are an important component of the existing tax base, helping to maintain and improve local infrastructure and investment.
A diversified industrial land base – with alternative locations, land costs, and contexts – helps accommodate and expand the local economy, and reduces a community’s vulnerability and dependence on a single industry sector.

INDUSTRIAL AREA GROWTH STRATEGY CONSULTING REPORT – THE CITY OF CALGARY
10
− While industrial-type jobs account for approximately an 11% share of total employment, they generated an estimated 14% of total GDP in the Calgary CMA in 2016. Industrial-type jobs have a higher average productivity of $230,000 of GDP per employee, compared to $183,000 of GDP per employee across all industries.
Employment areas are home to many of the activities that support the local population, such as auto repair shops, household repair services, wholesale distribution, and warehousing of consumer products. As well, these areas provide small, cost-effective, flexible spaces that are critical for business start-ups and high-tech incubators, as well as artist studios. Mature industrially-zoned areas remain important to a healthy, dynamic, and vital economy.
Freight-supportive transportation facilities are part of a larger logistics chain that moves goods across Canada, and internationally. Calgary is Western Canada’s leading inland port. While transportation and warehousing/distribution businesses may have comparably low employment densities, it is important to recognize they are a land use that is part of a network that needs to be protected.
− Employment in the transportation and warehousing sector – including freight-related jobs, and warehousing and storage, totaled approximately 11,200 jobs in 2016. This represented approximately one-sixth of total industrial-related employment in the Calgary CMA.
After years of industrial activity, sites may carry a legacy of contamination (on-site and off-site). Under current economic conditions and existing remediation techniques, these parcels are often unsuitable for residential and commercial developments. For such properties, ongoing industrial activity remains the highest and best use.
The historically lower levels of vacancy and higher rental rates achieved in the Central submarket are a testament to the enduring nature of industrial areas, and their ongoing appeal among many occupiers. Calgary’s industrial areas each feature different types of land and serve different functions across the range of industrial uses, and they need to be preserved going forward as an element of the local economic base.
INDUSTRIAL AREA GROWTH STRATEGY CONSULTING REPORT – THE CITY OF CALGARY
11
3.0 INDUSTRY CLUSTERS
3.1 Introduction
The following section identifies the geographic components of the Calgary CMA, and compares employment by industry – and industry groups within industries – to identify the prominent industry groups in Calgary. The site selection criteria of these industry groups are linked to land requirements.
3.2 Components of the Calgary CMA
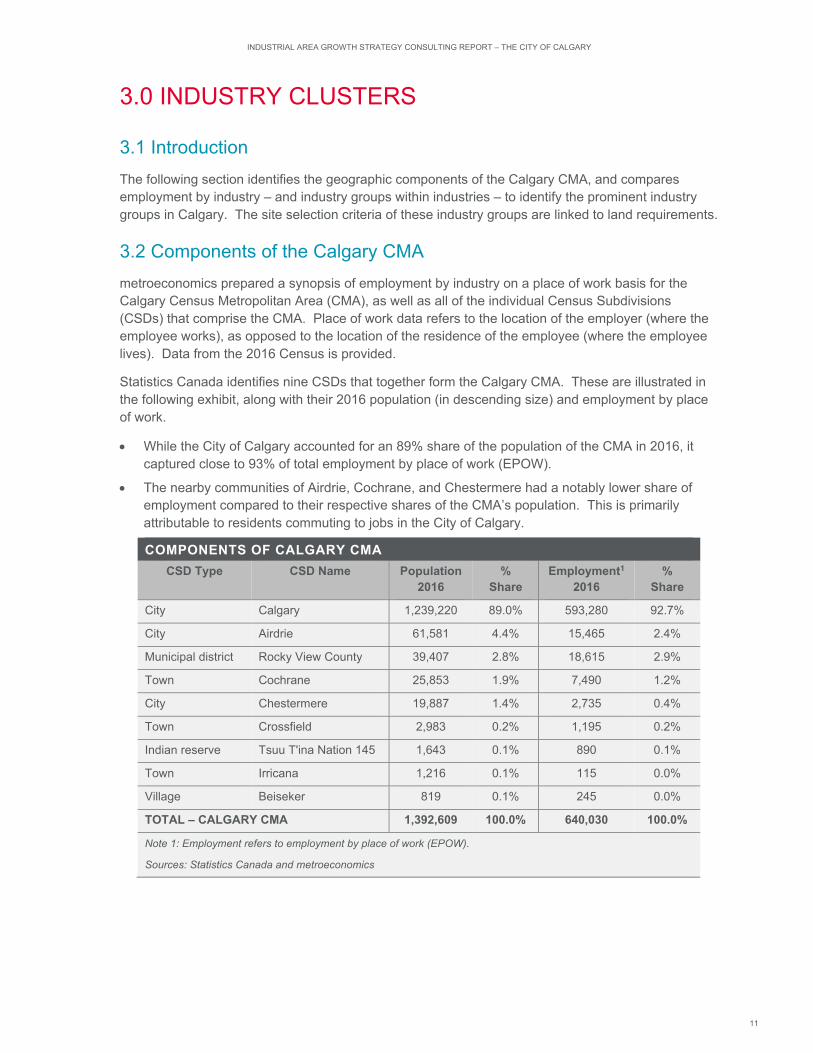
metroeconomics prepared a synopsis of employment by industry on a place of work basis for the Calgary Census Metropolitan Area (CMA), as well as all of the individual Census Subdivisions (CSDs) that comprise the CMA. Place of work data refers to the location of the employer (where the employee works), as opposed to the location of the residence of the employee (where the employee lives). Data from the 2016 Census is provided.
Statistics Canada identifies nine CSDs that together form the Calgary CMA. These are illustrated in the following exhibit, along with their 2016 population (in descending size) and employment by place of work.
While the City of Calgary accounted for an 89% share of the population of the CMA in 2016, it captured close to 93% of total employment by place of work (EPOW).
The nearby communities of Airdrie, Cochrane, and Chestermere had a notably lower share of employment compared to their respective shares of the CMA’s population. This is primarily attributable to residents commuting to jobs in the City of Calgary.
COMPONENTS OF CALGARY CMA
CSD Type CSD Name Population 2016
% Share
Employment1 2016
% Share
City Calgary 1,239,220 89.0% 593,280 92.7%
City Airdrie 61,581 4.4% 15,465 2.4%
Municipal district Rocky View County 39,407 2.8% 18,615 2.9%
Town Cochrane 25,853 1.9% 7,490 1.2%
City Chestermere 19,887 1.4% 2,735 0.4%
Town Crossfield 2,983 0.2% 1,195 0.2%
Indian reserve Tsuu T'ina Nation 145 1,643 0.1% 890 0.1%
Town Irricana 1,216 0.1% 115 0.0%
Village Beiseker 819 0.1% 245 0.0%
TOTAL – CALGARY CMA 1,392,609 100.0% 640,030 100.0%
Note 1: Employment refers to employment by place of work (EPOW).
Sources: Statistics Canada and metroeconomics

INDUSTRIAL AREA GROWTH STRATEGY CONSULTING REPORT – THE CITY OF CALGARY
12
3.3 Employment by Industry
3.3.1 Analysis of 2-Digit NAICS Categories (Industry Sectors)
Three NAICS categories generate the majority of the demand for industrial-type space: manufacturing; wholesale trade; and transportation and warehousing.
Manufacturing – Establishments in the Manufacturing sector are often described as plants, factories, or mills, and characteristically use power-driven machines and materials-handling equipment. The materials, substances, or components transformed by manufacturing establishments are raw materials that are products of agriculture, forestry, fishing, mining, or quarrying, as well as products of other manufacturing establishments.
− Cushman & Wakefield considers all subsectors/industry groups within the manufacturing sector to be drivers of industrial building and land demand.
Wholesale trade – The Wholesale Trade sector comprises establishments engaged in wholesaling merchandise, generally without transformation, and rendering services incidental to the sale of merchandise. The merchandise described in this sector includes the outputs of agriculture, mining, manufacturing, and certain information industries, such as publishing. Wholesalers sell merchandise to other businesses, and normally operate from a warehouse or office. These warehouses and offices are characterized by having little or no display of merchandise. In addition, neither the design nor the location of the premises is intended to solicit walk-in traffic. Wholesalers do not normally use advertising directed to the general public.
− Cushman & Wakefield considers all subsectors/industry groups within the wholesale trade sector to be drivers of industrial building and land demand.
Transportation, warehousing – The Transportation and Warehousing sector includes industries providing transportation of passengers and cargo, warehousing and storage for goods, scenic and sightseeing transportation, and support activities related to modes of transportation. Establishments in these industries use transportation equipment or transportation-related facilities as a productive asset. The type of equipment depends on the mode of transportation. The modes of transportation are air, rail, water, road, and pipeline. While jobs in the transportation industry are often associated with having “no fixed place of work”, the warehousing and storage-related jobs are linked with industrial-type buildings, along with the storage and maintenance of transportation equipment.
− The following industry groups are drivers of industrial building and land demand: general freight trucking; specialized freight trucking; freight transportation arrangement; and warehousing and storage. Employment in these industry groups accounted for a nearly 30% share of total transportation and warehousing sector employment in the City of Calgary in 2016.
The exhibit below presents the composition of employment by place of work (EPOW) across the 19 NAICS industry sectors for the Calgary CMA in 2016. Those industries associated with industrial-type land and building needs are not among the largest industry sectors, ranking 7th, 8th, and 13th. Together, industrial-type employment totaled approximately 70,800 jobs across the CMA in 2016, representing an 11% share of total employment by place of work. For the City of Calgary, industrial-type jobs exceeded 64,300, accounting for just less than 11% of total employment by place of work.

INDUSTRIAL AREA GROWTH STRATEGY CONSULTING REPORT – THE CITY OF CALGARY
13
The exhibit below illustrates the share of total employment by place of work (EPOW) for the 2-digit NAICS categories for both the City of Calgary, and the other CSDs that collectively comprise the balance of the Calgary CMA (referred to here as “Other CMA”). The following observations are notable:
Retail trade is the largest category of employment across the Calgary CMA. It accounts for a larger proportion of employment in the Other CMA geography (nearly 18%) compared to the City of Calgary (about 12%).
Health and social services is the second largest category, representing a 12.5% share of jobs in the City of Calgary, and a roughly 7% share in Other CMA.
Professional, scientific, and technical services accounts for the third largest share of total employment across the CMA. It accounts for over 11% of jobs in the City of Calgary, while just 6.5% of jobs in Other CMA.
The three categories of employment that are associated with industrial-type land demand account for a fairly similar share of employment in both the City of Calgary and Other CMA – generally in the range of 4-6% of total employment.
Most of the other industries have a similar share of total employment within the City of Calgary and the Other CMA geography, with the exceptions of mining, oil, and gas (higher in City of Calgary); finance and insurance (higher in City of Calgary); arts, entertainment, and recreation (notably higher in Other CMA); and agriculture and forestry (notably higher in Other CMA).

INDUSTRIAL AREA GROWTH STRATEGY CONSULTING REPORT – THE CITY OF CALGARY
14
3.3.2 Analysis of 4-Digit NAICS Categories (Industry Groups)
NAICS has a hierarchical structure. The preceding analysis examined the 2-digit level, which is referred to as “sectors”. At the 3-digit level, the classification is known as “subsectors”, while at the 4-digit level, the classification is known as “industry groups”. For the purposes of our clusters analysis, we will further explore the composition of employment by industry at the 4-digit level.
Example: While the 2-digit code “31” refers to Manufacturing as a “sector”, the 4-digit code “3111” refers to “Animal food manufacturing”, while the code “3112” refers to Grain and oilseed milling”, and so on.
In the preceding section, we discussed the three NAICS sectors that generate the majority of demand for industrial-type premises: manufacturing; wholesale trade; and transportation and warehousing. However, there are other industry groups that may be found in industrial areas – although the line is blurred in many cases between industrial uses and commercial uses. Note that the Consultant Team has not made a separate allocation for these industry groups; our land demand analysis focuses on the three primary industry sectors that drive industrial land and building demand. A list of these industry group is as follows:
Support activities for mining and oil and gas extraction.
− This industry group may have a component of industrial space needs (including some office space), but is primarily associated with activities at resource sites.
In general, the following are considered commercial uses, although some may seek sites in industrial/employment areas:
− Automotive dealers; other motor vehicle dealers; and automotive parts, accessories, and tire stores.
− Building material and supplies dealers.
− Lawn and garden equipment and supplies stores.
− Motion picture and video industries; sound recording industries; and radio and television broadcasting.
− Data processing, hosting, and related services.

INDUSTRIAL AREA GROWTH STRATEGY CONSULTING REPORT – THE CITY OF CALGARY
15
− Automotive equipment rental and leasing; and commercial and industrial machinery and equipment rental and leasing.
− Consumer goods rental; and general rental centres.
Waste treatment and disposal; and remediation and other waste management services.
− The inclusion of the collection of waste as a component of this category means that a portion of the employment is considered “no fixed place of work”. Also, employment growth in this category is likely linked to existing land uses/sites, and does not necessarily translate to additional future land requirements.
metroeconomics has prepared the following summary of the Calgary CMA’s largest industry groups, from an industrial-type land and buildings point of view for 2016, as illustrated in the exhibit below.
The top 10 industry groups associated with industrial type demand across the Calgary CMA account for 35% of all industrial-type jobs. This compares to a 37% share in the City of Calgary, and a 58% share across the balance of the CMA.
The 20 largest industry groups associated with industrial type demand across the Calgary CMA account for 58% of all industrial-type jobs. This compares to a 59% share for the City of Calgary, while the Other CMA share is much higher, at 76%.
− Of the 20 largest industry groups in the Calgary CMA, 19 are among the top 20 in the City of Calgary, with only minor adjustments to the rankings (this is as expected, since the City of Calgary accounted for a nearly 93% of total employment by place of work in the CMA in 2016).
There are several notable conclusions from this data:
The largest clusters span the range of industries from transportation and warehousing (warehousing and storage; general freight trucking; and specialized freight trucking) to wholesale trade (seven different industry groups) to manufacturing (accounting for 10 of the 20 largest industry groups).
The largest industrial-type employers in the CMA that are located outside of the City of Calgary have a disproportionately large impact on total industrial-type employment in these outlying areas, compared to the City of Calgary itself, which is more diversified across its industrial base.

INDUSTRIAL AREA GROWTH STRATEGY CONSULTING REPORT – THE CITY OF CALGARY
16
Looking forward, many of the largest industry groups in 2016 across the Calgary CMA are anticipated to drive employment growth over the next 25 years. Of the top 20 industry groups/clusters in 2016, 11 are among the top 20 largest in terms of industrial-type employment growth for the period from 2016-2041. The following exhibit presents the 20 industry groups that are anticipated to account for the largest gains in employment over the 25-year forecast horizon across the Calgary CMA, along with their 2016 ranking (refer to Appendix A for a full methodology of the employment projections).
TOP 20 INDUSTRY GROUPS BY EMPLOYMENT INCREASE (2016-2041) – CALGARY CMA
Industry Group Jobs 2016
Rank 2016
Jobs 2041
Rank 2041
Change 2016-2041
Rank 2016-2041
Warehousing and storage 4,130 1 12,327 1 8,197 1
General freight trucking 3,935 2 10,058 2 6,123 2
Food merchant wholesalers 3,120 4 6,079 3 2,959 3
Specialized freight trucking 2,125 7 3,654 4 1,529 4
Architectural and structural metals manufacturing 2,085 8 3,500 5 1,415 5
Other miscellaneous manufacturing 1,325 17 2,639 9 1,314 6
Recyclable material merchant wholesalers 815 27 2,066 11 1,251 7
Bakeries and tortilla manufacturing 1,520 14 2,657 8 1,137 8
Beverage merchant wholesalers 470 41 1,245 21 775 9
Petroleum and petroleum products merchant wholesalers
2,180 6 2,829 7 649 10
Beverage manufacturing 1,105 21 1,685 14 580 11
Glass and glass product manufacturing 480 40 956 26 476 12
Farm product merchant wholesaler 255 68 711 32 456 13
Household and institutional furniture and kitchen cabinet manufacturing
1,460 15 1,878 12 418 14
Other food manufacturing 610 36 952 27 342 15
Aerospace product and parts manufacturing 430 44 748 31 318 16
Meat product manufacturing 1,235 19 1,493 17 258 17

INDUSTRIAL AREA GROWTH STRATEGY CONSULTING REPORT – THE CITY OF CALGARY
17
Navigational, measuring, medical and control instruments manufacturing
1,190 20 1,436 20 246 18
Basic chemical manufacturing 855 25 1,094 24 239 19
Sawmills and wood preservation 355 53 586 39 231 20
Sources: Statistics Canada and metroeconomics
The following exhibit presents the 20 industry groups that are anticipated to account for the largest gains in employment over the 25-year forecast horizon across the City of Calgary, along with their 2016 ranking (refer to Appendix A for a full methodology of the employment projections, and Appendix B for a comparative analysis of the Calgary CMA versus other Western Canadian and Pacific Northwest U.S. metropolitan areas).
TOP 20 INDUSTRY GROUPS BY EMPLOYMENT INCREASE (2016-2041) – CITY OF CALGARY
Industry Group Jobs 2016
Rank 2016
Jobs 2041
Rank 2041
Change 2016-2041
Rank 2016-2041
Warehousing and storage 3,830 1 11,505 1 7,675 1
General freight trucking 2,810 3 7,400 2 4,590 2
Food merchant wholesalers 2,615 4 5,188 3 2,573 3
Specialized freight trucking 1,735 13 3,051 5 1,316 4
Architectural and structural metals manufacturing 1,765 11 2,963 6 1,198 5
Other miscellaneous manufacturing 1,190 17 2,370 9 1,180 6
Recyclable material merchant wholesalers 730 27 1,846 11 1,116 7
Bakeries and tortilla manufacturing 1,490 14 2,604 8 1,114 8
Beverage merchant wholesalers 470 37 1,245 20 775 9
Petroleum and petroleum products merchant wholesalers
2,125 6 2,759 7 634 10
Beverage manufacturing 1,085 20 1,654 13 569 11
Glass and glass product manufacturing 460 39 916 26 456 12
Farm product merchant wholesaler 245 67 687 32 442 13
Household and institutional furniture and kitchen cabinet manufacturing
1,405 15 1,807 12 402 14
Aerospace product and parts manufacturing 405 44 704 31 299 15
Other food manufacturing 465 38 726 30 261 16
Meat product manufacturing 1,170 18 1,414 16 244 17
Basic chemical manufacturing 845 25 1,081 22 236 18
Navigational, measuring, medical and control instruments manufacturing
1,125 19 1,358 19 233 19
Industrial machinery manufacturing 190 70 374 46 184 20
Sources: Statistics Canada and metroeconomics

INDUSTRIAL AREA GROWTH STRATEGY CONSULTING REPORT – THE CITY OF CALGARY
18
3.4 Site Selection Criteria and Land Requirements
3.4.1 Overview
Across the spectrum of industrial lands uses, there tends to be a consistent set of site selection criteria that are considered in location decision-making. The include the following:
Real estate factors – geographic location; availability and cost of business premises, or cost of land and new building construction; and location of customers and suppliers;
Economic factors – availability of raw materials and intermediate goods (production inputs); labour force availability; labour cost; and government incentives; and,
Infrastructure factors – transportation; telecommunications; and utilities.
Certain industry groups exhibit particular site selection requirements for their operations. The following are such examples:
Some businesses may be labour-intensive, while others may require far less labour input. Those with greater need for labour – particularly skilled labour – may be inclined to locate within or in close proximity to large population centres. However, even within an industry group, there may be significant variation (for example, comparing the employee density within an Amazon warehouse [relatively high] versus a warehouse for automotive parts [relatively low]). Non labour-intensive industrial businesses may seek to locate further from urban areas/population centres to take advantage of lower land costs, for example. A related consideration for labour-intensive businesses may be access to public transit, to provide commuting options for their workforce (particularly for lower-wage occupations).
Highway access is vital for certain businesses that have a high volume of shipping and receiving. On the other hand, businesses with fewer inputs to their production process – or those not reliant upon just-in-time delivery – will not require highway access/proximity (or at least, may not prioritize it to the same extent as other site selection factors).
Adjacency to a rail line may be an important site selection factor for some businesses – particularly those reliant upon commodities in their production process, or those that distribute finished goods across a large market area. However, it is challenging to associate specific industry groups with needed access to a rail spur. For many businesses, proximity to intermodal (container shipping via truck-to-rail facilities) satisfies their supply chain needs.
− CP’s Calgary Intermodal Facility is located in the southeast part of the city, in the vicinity of 114 Ave SE and 52 St SE.
− CN’s Calgary Logistics Park (opened in 2013) is located east of the city, in Rocky View County, off Township Road 250 near the hamlet of Conrich. This intermodal terminal relocated from CN's Sarcee Yard off Barlow Trail near 50 Ave SE, in southeast Calgary.
In reviewing the employment forecast for the top 20 industry groups across the CMA, many do not have distinguishing site selection characteristics of importance. However, the following list of attributes/needs are identified for select businesses within the forecasted higher growth industry groups identified below.

INDUSTRIAL AREA GROWTH STRATEGY CONSULTING REPORT – THE CITY OF CALGARY
19
INDUSTRIAL SITE SELECTION CRITERIA
Industry Group Proximity to
Highway
Very Large Sites
Outside Storage
Truck/ Vehicle Parking
Minimum Separation Distance
Heavy Industrial
Zoning
Warehousing and storage Yes Yes Yes
General freight trucking Yes Yes
Specialized freight trucking Yes Yes
Architectural and structural metals manufacturing Yes Yes
Meat product manufacturing Yes
Basic chemical manufacturing Yes Yes
Sawmills and wood preservation Yes Yes Yes Yes
3.4.2 Linkage to Industrial Land Use Districts
The City of Calgary currently has seven Land Use Districts/zones that apply to industrial uses, as summarized on the following exhibit. We have identified those of particular importance to the largest industry clusters in Calgary, tied to some of the industry groups (underlined) that are forecast to contribute to significant industrial land need over the forecast horizon (among the top 20 growth industry groups in the city).
INDUSTRIAL LAND USE DISTRICTS IN CITY OF CALGARY
Symbol Name Description
I-B Industrial – Business District
I-B is an industrial designation that is primarily for business park uses, with high quality buildings in a campus-like setting – typically in highly visible locations next to major roadways.
I-C Industrial – Commercial District
I-C is an industrial designation that allows light industrial and limited small-scale commercial uses that are compatible with adjacent industrial areas.
- A range of manufacturing establishments – such as Bakeries, Beverage, Glass and glass products, Furniture and kitchen cabinetry, Meat products, and Other foods – may seek to locate in an I-C zone in order to accommodate small-scale commercial uses that complement their core business activities.
I-E Industrial – Edge District
I-E is an industrial designation that allows a limited range of low impact light industrial uses that are suitable in close proximity to residential areas.
I-G Industrial – General District
I-G is an industrial designation that is primarily for a wide range of general industrial uses.
- I-G is the most prevalent industrial land use designation today across Calgary’s built-up industrial/employment areas, and this zone will continue to accommodate a broad range of industrial occupier needs going forward.
I-H Industrial – Heavy District
I-H is a heavy industrial designation that is primarily for large, purpose-built heavy industrial developments that typically locate close to hazardous goods routes and rail lines.
- I-H-designated lands will be required in the future for uses such as Basic chemical manufacturing, which is among the top 20 industry groups forecast for employment growth over the next 25 years.
INDUSTRIAL AREA GROWTH STRATEGY CONSULTING REPORT – THE CITY OF CALGARY
20
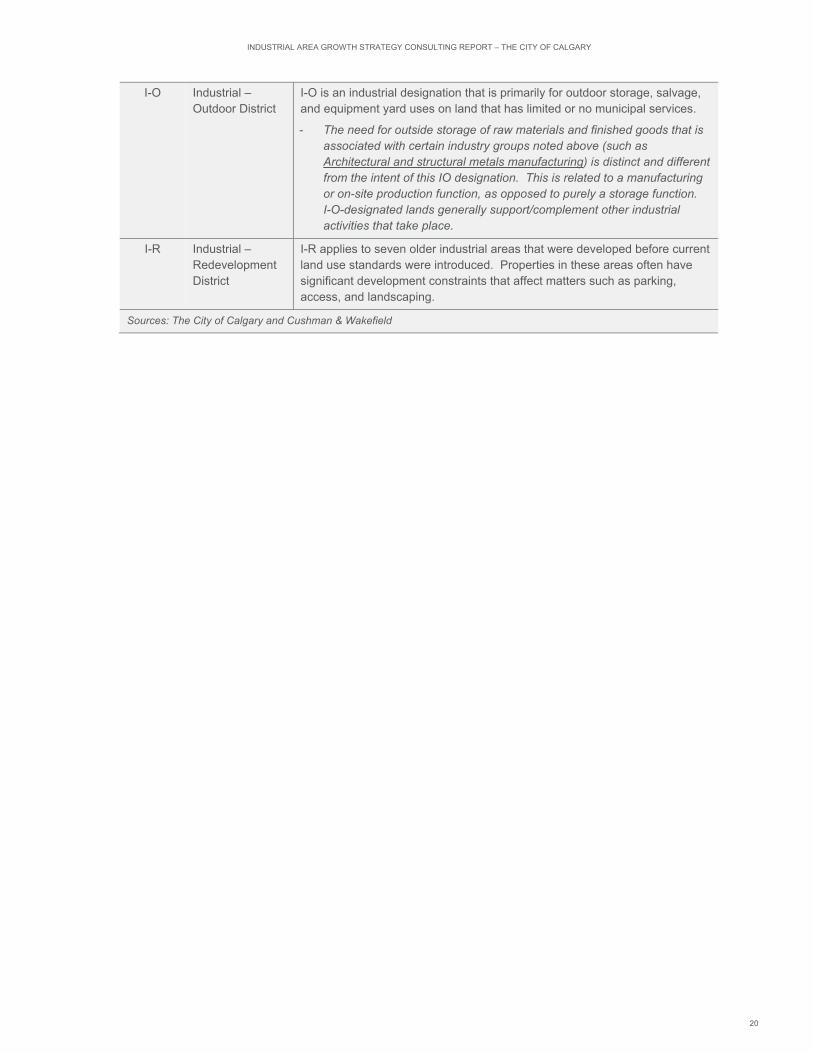
I-O Industrial – Outdoor District
I-O is an industrial designation that is primarily for outdoor storage, salvage, and equipment yard uses on land that has limited or no municipal services.
- The need for outside storage of raw materials and finished goods that is associated with certain industry groups noted above (such as Architectural and structural metals manufacturing) is distinct and different from the intent of this IO designation. This is related to a manufacturing or on-site production function, as opposed to purely a storage function. I-O-designated lands generally support/complement other industrial activities that take place.
I-R Industrial – Redevelopment District
I-R applies to seven older industrial areas that were developed before current land use standards were introduced. Properties in these areas often have significant development constraints that affect matters such as parking, access, and landscaping.
Sources: The City of Calgary and Cushman & Wakefield

INDUSTRIAL AREA GROWTH STRATEGY CONSULTING REPORT – THE CITY OF CALGARY
21
4.0 ISSUES AFFECTING CALGARY’S INDUSTRIAL LANDS
4.1 Introduction
In order to inform the strategic directions that underpin this Industrial Area Growth Strategy Consulting Report, the Consultant Team has provided research and analysis of various topics of interest related to industrial land development. The issues explored in the following section were identified in collaboration with City staff.
4.2 Trends Impacting Industrial Real Estate and New Development
The following section identifies a number of issues impacting demand for industrial real estate, including new development trends.
Industrial buildings are getting larger – There has been a trend of increasing building size in recent years – in large part influenced by the growth in very large distribution facilities that are in demand due to rising e-commerce activity. Cushman & Wakefield’s data for Calgary indicates an average building size of roughly 4,500-5,500 m2 for new supply added from 2010-2012, which increased considerably to an average of nearly 9,500 m2 for the period from 2015-2020.
Industrial buildings are getting taller – There is a strong correlation between industrial building age and ceiling clear height. Older vintage properties were often built with a clear height of 12’ to 20’, which suited user requirements at the time. Over the past several decades, the average ceiling clear height in new facilities has increased to 30’ to 40’. It is now not uncommon for new warehouse facilities to exceed 40’ clear height, in order to take advantage of taller racking system, and lift trucks that are capable of reaching such heights, while carrying heavier loads than in the past. While these facilities make more efficient use of land, there may be implications to municipalities that charge development fees based on new floorspace (whereas cubic space is arguably a more suitable measure, as floorspace is replaced by vertical space). Some facilities are designed with multiple mezzanines to take full advantage of the interior space available.
There is increasing demand for larger parcels of land – In recent years, supply chain modernization and rapid adoption of e-commerce has fueled demand for new industrial supply – particularly parcels that accommodate large warehouse and distribution facilities. Typically, these are located on the periphery of urban areas, offering ready access to the market, while taking advantage of lower land costs. These facilities are becoming increasingly large, as enterprises streamline their distribution networks into fewer, larger facilities. As well, distribution centres often seek large yards to accommodate on-site trailer storage in secured areas, so that drivers can drop their trailers and exit, rather than waiting to off-load goods (the goods are later off-loaded as needed).
There is growing demand for warehousing space – Post-pandemic, there is a view that manufacturers are likely to hold more inventory, as they seek greater flexibility and less vulnerability to disruptions. Diversifying component sourcing, including an emphasis on localizing or regionalizing components to be closer to plants while holding more inventories, will require additional logistics real estate. Reshoring or nearshoring would shorten supply chains, effectively reducing long lead times, thereby giving manufacturers more control over production quantities to allow for improved responsiveness to demand.

INDUSTRIAL AREA GROWTH STRATEGY CONSULTING REPORT – THE CITY OF CALGARY
22
There has been increased interest in centrally-located sites – With growing consumer demand for goods at a faster, more streamlined rate (same day/next day shipping), and growing retailer demand, the answer for suppliers is to invest in an e-commerce model for direct-to-consumer shipments. Greater adoption of e-commerce will take serval years to implement across many markets – including Calgary, although it has already seen considerable growth in this segment – meaning demand will continue to be widespread beyond the present COVID-19 pandemic. Opportunities to situate “last-mile” logistics facilities within urban areas that reduce shipping times and costs will continue to grow in appeal – particularly for time-sensitive shipments. This is likely to place upward pressure on industrial land values for centrally-situated zoned lands, as well as introduce adaptive reuse opportunities for existing properties that can suit this purpose, or demolition and new construction on sites that are well suited for such uses.
The integration of industrial uses into former retail spaces is an emerging phenomenon, as empty mall anchor units within underperforming shopping centres are repurposed as last-mile delivery centres, or even light industrial uses. There is nascent interest in exploring the repurposing of these spaces, but this is likely to be far more prevalent in “over-retailed” U.S. markets, compared to Canada.
The adoption of automation/robotics has accelerated – Modern industrial facilities are increasingly incorporating automation at different stages/performing different functions. This could include robotics (and “cobots” – collaborative robots) involved with receiving, inventorying, and storing materials; to managing inventories; to the distribution process – including autonomous, self-charging, laser-guided vehicles that find their own efficient pathways within the facility, and operate 24/7. Drones are being used inside facilities to monitor inventory, check temperatures in climate-sensitive facilities, and identify potential safety concerns (via video monitoring). Today, automated processes are putting finished goods onto freight vehicles; in the not too distant future, the freight vehicles themselves will be driverless. Increasingly, automation is being used to locate and bring the product to the warehouse employee for inspection, final packaging, and shipping. Overall, the shift is toward increased productivity, and less human involvement in industrial processes, as labour availability becomes more scarce. From an operations perspective, the goal is to reduce or eliminate bottlenecks, and leverage efficiencies. From a land needs perspective, this will mean that the same amount of land will employ fewer workers in the future. From a servicing perspective, this generates additional requirements for power.
One notable trend to consider is the much larger number of employees associated with consumer goods warehouses and distribution centres compared to manufacturing warehouses. These large distribution centres require significant labour, and therefore have different site selection needs (proximity to available labour force) versus those industrial businesses with a much lower employment density.
There has been an observed desire for greater on-site amenities – With the rise of larger and larger industrial facilities, in effect a small community is formed among the employees. Some employers are now implementing in-house features such as daycares, gyms/fitness studios, and prayer/meditation rooms, in order to attract and retain talent, and offer an appealing workplace environment. Major warehouse facilities have become “employment centres” with 24-hour operations.
INDUSTRIAL AREA GROWTH STRATEGY CONSULTING REPORT – THE CITY OF CALGARY
23
Some industrial-designated lands face conversion pressure – In many large, urban areas, undeveloped industrial lands face pressure for conversion to other uses – with industrial not viewed as the highest and best use, from a land economics perspective. Often, this is due to their relatively lower land cost (compared to commercial or residential lands). Sites that are occupied by industrial uses but which could be repurposed or demolished may face similar market pressures for land use conversion. This often applies to lands that are centrally located, and that are large (and therefore can potentially accommodate significant density, if redeveloped). In some instances, issues related to compatibility with adjacent uses may also be raised to justify such conversions.
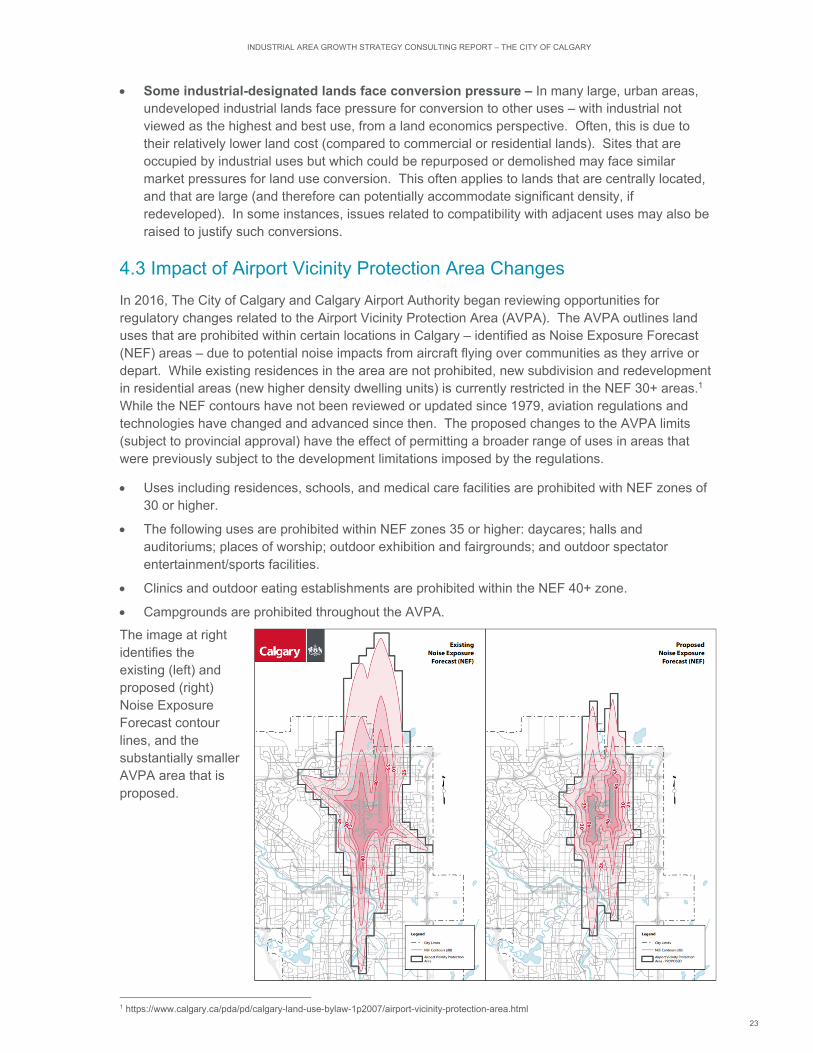
4.3 Impact of Airport Vicinity Protection Area Changes
In 2016, The City of Calgary and Calgary Airport Authority began reviewing opportunities for regulatory changes related to the Airport Vicinity Protection Area (AVPA). The AVPA outlines land uses that are prohibited within certain locations in Calgary – identified as Noise Exposure Forecast (NEF) areas – due to potential noise impacts from aircraft flying over communities as they arrive or depart. While existing residences in the area are not prohibited, new subdivision and redevelopment in residential areas (new higher density dwelling units) is currently restricted in the NEF 30+ areas.1 While the NEF contours have not been reviewed or updated since 1979, aviation regulations and technologies have changed and advanced since then. The proposed changes to the AVPA limits (subject to provincial approval) have the effect of permitting a broader range of uses in areas that were previously subject to the development limitations imposed by the regulations.
Uses including residences, schools, and medical care facilities are prohibited with NEF zones of 30 or higher.
The following uses are prohibited within NEF zones 35 or higher: daycares; halls and auditoriums; places of worship; outdoor exhibition and fairgrounds; and outdoor spectator entertainment/sports facilities.
Clinics and outdoor eating establishments are prohibited within the NEF 40+ zone.
Campgrounds are prohibited throughout the AVPA.
The image at right identifies the existing (left) and proposed (right) Noise Exposure Forecast contour lines, and the substantially smaller AVPA area that is proposed.
1 https://www.calgary.ca/pda/pd/calgary-land-use-bylaw-1p2007/airport-vicinity-protection-area.html

INDUSTRIAL AREA GROWTH STRATEGY CONSULTING REPORT – THE CITY OF CALGARY
24
Overall, the proposed changes would reduce the number of parcels and the total land area that is impacted under the current NEF contours, while continuing to protect airport operations. The current NEF contours impact 33,201 parcels (approximately 10,656 hectares) with some degree of development restrictions. The proposed contours would impact 12,309 parcels (approximately 7,777 hectares), resulting in a 63% reduction in the number of parcels, and a 27% reduction in the total land area affected.2
There are 263 parcels that are presently designated as an Industrial land use that would be removed from NEF contours under the proposed changes, while three would be added to the revised NEF contours. From the perspective of this Industrial Area Growth Strategy Consulting Report, a key takeaway is that some lands that previously faced restrictions regarding certain identified sensitive land uses would be subject to a wider range of permissions under the proposed changes. This may mean that an employment use is no longer the highest and best use of these lands, and they may face land use conversion pressure. However, the loosening of development restrictions pertains to lands furthest from the airport (the lowest NEF range), and employment lands in proximity to the airport itself – which are particularly well-suited for industrial development – remain viable.
4.4 Climate Change and Industrial Development
The industrial sector has opportunities to contribute to a healthier environment and to reduce its impacts. Increasingly, developers and occupiers are seeking LEED (Leadership in Energy and Environmental Design) certification for their new buildings as part of their overall corporate commitment to sustainability. LEED certification provides independent, third-party verification that a building, home, or community was designed and built using strategies aimed at achieving high performance in key areas of human and environmental health: location and transportation, sustainable site development, water savings, energy efficiency, materials selection, and indoor environmental quality. There are a number of LEED rating systems available to meet the needs of different building and project types. Each system consists of prerequisites and credits. Prerequisites are required elements, or green building strategies, that must be included in any LEED certified project, while credits are optional elements or strategies that projects can elect to pursue to gain points toward certification.3 With four possible levels of certification (certified, silver, gold and platinum), LEED is flexible enough to accommodate a wide range of green building strategies that best fit the constraints and goals of particular projects. Overall, environmentally-friendly construction initiatives – whether pursued to obtain LEED certification or not – are viewed as a modest development cost premium versus traditional industrial building construction approaches, with long-term value achieved through reduced energy consumption. Among the characteristics of green initiatives related to industrial development include:
More energy-efficient building envelopes, HVAC, and lighting;
Increased utilization of recycled building materials;
Reinforced roofs that can collect rainwater and store in a cistern for future use, and green roofs;
Installation of solar panels and wind turbines to collect/generate energy;
Electric vehicle charging stations – both for employee’s personal vehicles and equipment used within the premises; and,
Geothermal energy systems – although very expensive in industrial applications, given the size of buildings.
2 https://pub-calgary.escribemeetings.com/filestream.ashx?DocumentId=139525 3 https://www.cagbc.org/CAGBC/LEED/Certification_Process/CAGBC/Programs/LEED/LEED_Certification_Process.aspx?hkey=1ccc60d7-7815-428d-a7e3-cf78786a1902

INDUSTRIAL AREA GROWTH STRATEGY CONSULTING REPORT – THE CITY OF CALGARY
25
5.0 LAND SUPPLY/DEMAND ANALYSIS AND LEVERAGING COMPETITIVE ADVANTAGES
5.1 Introduction
Calgary Economic Development answers the question “Why Calgary?” by highlighting the attractive cost of living, cost of doing business, access to top talent, and overall quality of life.4 From an industrial point of view, these attributes are important, along with the city’s locational advantages and relative absence of physical geographic constraints, its role as a regional service and business centre, and proximity to natural resources. The low cost of doing business, exceptional infrastructure and commercial fibre networks, efficient road and transit systems, and regional transportation network centered on a globally connected airport, all contribute to boosting trade and investment and fostering growth among existing or emerging local companies.
The following section explores various attributes that contribute to Calgary’s competitive advantage from an industrial perspective, to ensure that these traits can be leverage for future growth, aligned with its industrial land supply and prospects for growth. In addition, characteristics of the city’s industrial land supply and occupied industrial areas are analyzed, and a land demand projection is provided, in order to understand land supply and demand dynamics.
5.2 Calgary’s Industrial Competitive Advantages
Strategically Location in Western Canada
Calgary is strategically positioned to function as a distribution hub to service other markets in Western Canada, including communities across Alberta, British Columbia, Saskatchewan, and Manitoba. Calgary functions as Western Canada’s largest inland port. The city is well connected by highways (including the new Ring Road, and Trans-Canada Highway), railways, and Calgary International Airport. Within one day’s drive, trucks can reach markets of 16 million people in Western Canada and the Pacific Northwest, and Alberta’s transport system brings over $122 billion of province-wide products to international markets each year.5 The City’s Goods Movement Strategy builds upon the Municipal Development Plan (MDP) and Calgary Transportation Plan (CTP) which recognize that efficient goods movement is essential to the city’s wellbeing and quality of life, as well as to the achievement of transportation, land use, economic, and environmental aspirations and goals.6
Diversity of Industrial Employment Base
The preceding analysis of industry clusters in Calgary reveals that a diverse range of industry groups account for the largest categories of employment. The 20 largest industry groups in terms of 2016 employment included Manufacturing (10 industry groups), Wholesale trade (7 industry groups), and Transportation and warehousing (3 industry groups), which together accounted for nearly 60% of total industrial-type employment. Notably, 12 of the 20 largest industry groups in 2016 are anticipated to be among the top 20 in terms of employment growth through 2041. This means that eight industry groups – which are not currently among the top 20 employers – will emerge among those experiencing the largest increase in employment over the next two decades or more.
4 https://calgaryeconomicdevelopment.com/why-calgary/ 5 https://www.calgary.ca/realestate/distribution-and-warehousing.html 6 The City of Calgary Goods Movement Strategy. p. 3.
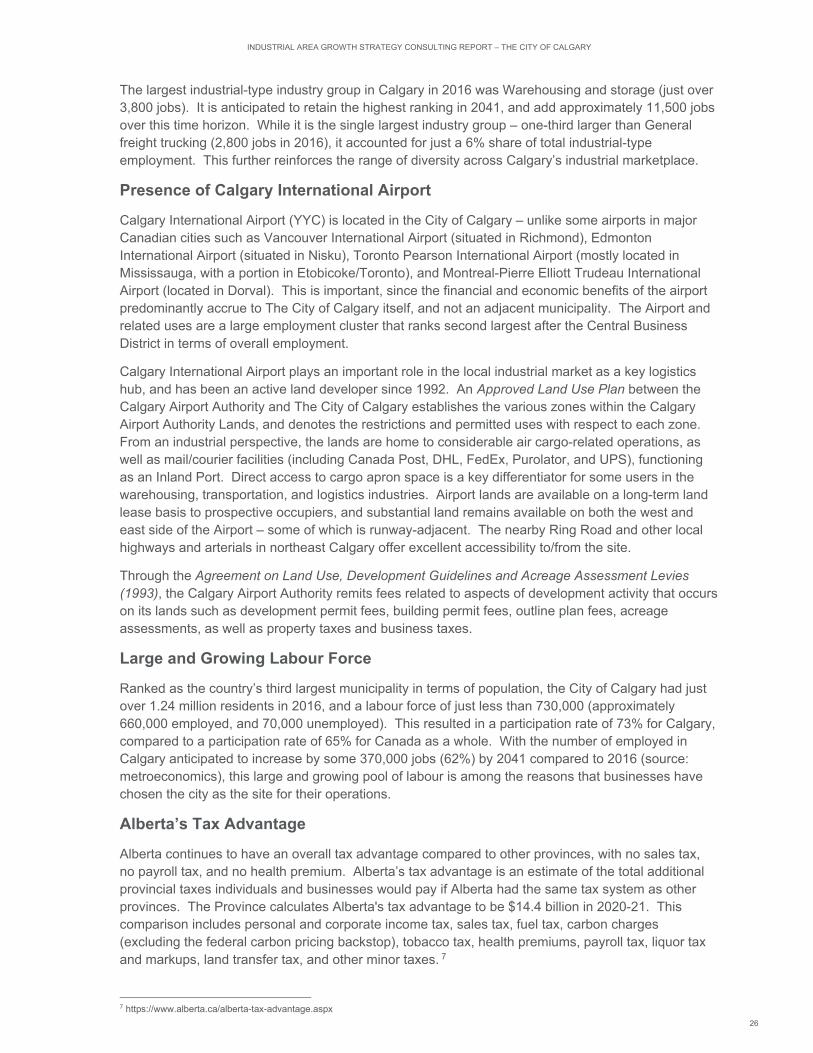
INDUSTRIAL AREA GROWTH STRATEGY CONSULTING REPORT – THE CITY OF CALGARY
26
The largest industrial-type industry group in Calgary in 2016 was Warehousing and storage (just over 3,800 jobs). It is anticipated to retain the highest ranking in 2041, and add approximately 11,500 jobs over this time horizon. While it is the single largest industry group – one-third larger than General freight trucking (2,800 jobs in 2016), it accounted for just a 6% share of total industrial-type employment. This further reinforces the range of diversity across Calgary’s industrial marketplace.
Presence of Calgary International Airport
Calgary International Airport (YYC) is located in the City of Calgary – unlike some airports in major Canadian cities such as Vancouver International Airport (situated in Richmond), Edmonton International Airport (situated in Nisku), Toronto Pearson International Airport (mostly located in Mississauga, with a portion in Etobicoke/Toronto), and Montreal-Pierre Elliott Trudeau International Airport (located in Dorval). This is important, since the financial and economic benefits of the airport predominantly accrue to The City of Calgary itself, and not an adjacent municipality. The Airport and related uses are a large employment cluster that ranks second largest after the Central Business District in terms of overall employment.
Calgary International Airport plays an important role in the local industrial market as a key logistics hub, and has been an active land developer since 1992. An Approved Land Use Plan between the Calgary Airport Authority and The City of Calgary establishes the various zones within the Calgary Airport Authority Lands, and denotes the restrictions and permitted uses with respect to each zone. From an industrial perspective, the lands are home to considerable air cargo-related operations, as well as mail/courier facilities (including Canada Post, DHL, FedEx, Purolator, and UPS), functioning as an Inland Port. Direct access to cargo apron space is a key differentiator for some users in the warehousing, transportation, and logistics industries. Airport lands are available on a long-term land lease basis to prospective occupiers, and substantial land remains available on both the west and east side of the Airport – some of which is runway-adjacent. The nearby Ring Road and other local highways and arterials in northeast Calgary offer excellent accessibility to/from the site.
Through the Agreement on Land Use, Development Guidelines and Acreage Assessment Levies (1993), the Calgary Airport Authority remits fees related to aspects of development activity that occurs on its lands such as development permit fees, building permit fees, outline plan fees, acreage assessments, as well as property taxes and business taxes.
Large and Growing Labour Force
Ranked as the country’s third largest municipality in terms of population, the City of Calgary had just over 1.24 million residents in 2016, and a labour force of just less than 730,000 (approximately 660,000 employed, and 70,000 unemployed). This resulted in a participation rate of 73% for Calgary, compared to a participation rate of 65% for Canada as a whole. With the number of employed in Calgary anticipated to increase by some 370,000 jobs (62%) by 2041 compared to 2016 (source: metroeconomics), this large and growing pool of labour is among the reasons that businesses have chosen the city as the site for their operations.
Alberta’s Tax Advantage
Alberta continues to have an overall tax advantage compared to other provinces, with no sales tax, no payroll tax, and no health premium. Alberta’s tax advantage is an estimate of the total additional provincial taxes individuals and businesses would pay if Alberta had the same tax system as other provinces. The Province calculates Alberta's tax advantage to be $14.4 billion in 2020-21. This comparison includes personal and corporate income tax, sales tax, fuel tax, carbon charges (excluding the federal carbon pricing backstop), tobacco tax, health premiums, payroll tax, liquor tax and markups, land transfer tax, and other minor taxes. 7
7 https://www.alberta.ca/alberta-tax-advantage.aspx

INDUSTRIAL AREA GROWTH STRATEGY CONSULTING REPORT – THE CITY OF CALGARY
27
While these taxes are not specific to the industrial sector, they have the effect of encouraging business investment in the province, and have a positive impact on the cost of living for the local labour force and their families.
Industrial Ecosystem is Present
Calgary offers prospective industrial occupiers with the full breadth of required site selection attributes to start a new business – it has available lands for development, and a network of established industry that can serve as suppliers and buyers/end-users of goods and services. The city is well served by transportation to facilitate movement of raw materials and finished products to markets nearby, across Canada, and internationally.
5.3 Vacant Industrial Land Supply Analysis
5.3.1 Vacant Industrial Land Inventory Overview
Cushman & Wakefield collaborated with City staff to develop a data set of available industrial parcels across the city. This Vacant Industrial Land Inventory is comprised of both privately-owned lands, as well as City-owned lands.
The privately-owned vacant lands have the following characteristics:
Lands that are situated in The City’s Strategic Industrial Areas, and/or;
Lands designated as Industrial in the Municipal Development Plan, and/or;
Lands within one of the seven existing Industrial Land Use Districts (I-B, I-C, I-E, I-G, I-H, I-O, or I-R), and/or;
Lands that are designated as a Direct Control District that has an industrial basis, and/or;
Future Urban Development Districts with an industrial component within an Area Structure Plan.
In addition, the inventory includes City-owned lands controlled by Real Estate & Development Services (RE&DS) that are considered to be suited for future industrial development – including vacant sites and redevelopment sites – as well as select other sites controlled by other City of Calgary entities (e.g. Transportation Infrastructure, Water Resources, etc.).
5.3.2 Methodology and Approach
The City of Calgary’s Geodemographics staff provided property attributes for all properties in the above-noted data set. This included the following:
Industrial Area – Central, Northeast, Northwest, Southeast, or Southwest;
Parcel size (hectares) – and the Consultant Team created size cohorts (e.g. <0.5 hectares, 0.5-1 hectare, 1-5 hectares, etc.);
MDP Designation;
Land Use Designation, and the Consultant Team added the Land Use/Zoning Type (Industrial, Industrial – Multiple [refer to detailed discussion below], Future Urban Development, or Direct Control);
Servicing (refer to detailed discussion below); and,
City-owned lands – yes or no.
The following section outlines the Consultant Team’s approach to addressing specific issues that were encountered, or our approach to classifying lands.

INDUSTRIAL AREA GROWTH STRATEGY CONSULTING REPORT – THE CITY OF CALGARY
28
Multiple Land Use Designations
There are a small number of parcels that have multiple Land Use Districts that are associated with them; it is assumed that this is because of their large size, or the fact that they have not yet be subdivided into development lots. There are four parcels – ranging in size from approximately 20 to 170 hectares – that have been included in the Vacant Industrial Land Inventory under the “Industrial – Multiple” zoning category due to one or more industrial LUDs being in place. While it is acknowledged that this may slightly overstate the actual portion of industrial land that could be developable, it has little impact on the overall size of the land inventory, and doesn’t affect the conclusions that are drawn by the Consultant Team. This is an item that requires ongoing monitoring by City staff as these parcels are absorbed over time.
Servicing
City staff has provided data which has allowed the Consultant Team to identify the status of servicing of the vacant lands, which points to their readiness for development. We have created three classifications, as follows:
“Serviced” – municipal services are in place at the property line/parcel boundary (and in the case of RE&DS sites, this means serviced land which is available for sale). These are considered to be “shovel-ready” lands suited for development – either in a state to allow building activity to commence, or site preparations to be advanced.
“Partially Serviced” – some municipal services are present, but not all. The timing (and cost) of bringing the additional required services to the site will vary on a site-by-site basis. In the case of RE&DS lands, these include sites that are unserviced (but funded), or those where servicing is in progress (and funded). These lands are not considered readily developable at this time. This is an item that requires ongoing monitoring by City staff as the level of servicing evolves over time.
“Unserviced” – this classification refers to sites where there are currently no municipal services in place. In the case of RE&DS sites, these are “raw” lands that are unserviced and unfunded. Again, this is an item that requires ongoing monitoring by City staff as the level of servicing evolves over time.
5.3.3 Attributes of the Vacant Industrial Land Inventory
Total Vacant Industrial Land Inventory
There is a total of close to 3,000 hectares of vacant industrial land city-wide, across nearly 350 individual parcels (please refer to map on following page). Importantly, a portion of this land supply is identified in “gross” hectares, meaning that there has not yet been any adjustment made for the future on-site land requirements for roads, utilities, or stormwater management ponds to service any eventual subdivided lands/lots, nor any adjustment made to account for the presence of natural features such as waterways, wetlands, or other physical features (slopes, valley lands, etc.) which could limit the “developable” land area.
In a land needs assessment, it is common to attribute a factor of 75% or 80% to represent the “net developable” portion of lands compared to the “gross” total land area. For the purposes of this analysis, the Consultant Team will utilize a factor of 80% to adjust the overall land inventory from “gross” to “net” (recognizing that some lands are already considered “net” – generally the smaller parcels already designated as an industrial LUD). This adjustment brings the overall estimated vacant industrial land inventory total to approximately 2,400 net hectares city-wide. This figure is of importance in comparing land supply to anticipated land demand (discussed in the following section). The balance of this examination of land inventory is on a “gross” basis, for illustrative purposes, since it is outside of the scope of this project to make a site-by-site assessment of “net” versus “gross” land area.

INDUSTRIAL AREA GROWTH STRATEGY CONSULTING REPORT – THE CITY OF CALGARY
29
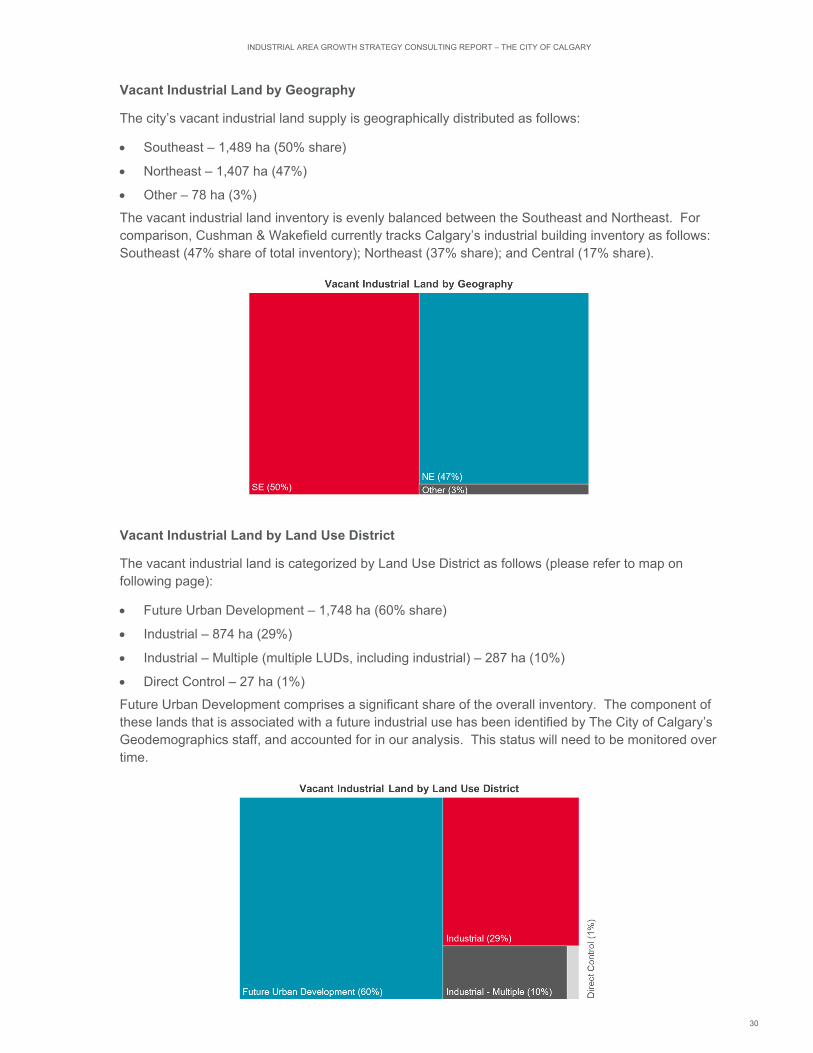
INDUSTRIAL AREA GROWTH STRATEGY CONSULTING REPORT – THE CITY OF CALGARY
30
Vacant Industrial Land by Geography
The city’s vacant industrial land supply is geographically distributed as follows:
Southeast – 1,489 ha (50% share)
Northeast – 1,407 ha (47%)
Other – 78 ha (3%)
The vacant industrial land inventory is evenly balanced between the Southeast and Northeast. For comparison, Cushman & Wakefield currently tracks Calgary’s industrial building inventory as follows: Southeast (47% share of total inventory); Northeast (37% share); and Central (17% share).
Vacant Industrial Land by Land Use District
The vacant industrial land is categorized by Land Use District as follows (please refer to map on following page):
Future Urban Development – 1,748 ha (60% share)
Industrial – 874 ha (29%)
Industrial – Multiple (multiple LUDs, including industrial) – 287 ha (10%)
Direct Control – 27 ha (1%)
Future Urban Development comprises a significant share of the overall inventory. The component of these lands that is associated with a future industrial use has been identified by The City of Calgary’s Geodemographics staff, and accounted for in our analysis. This status will need to be monitored over time.

INDUSTRIAL AREA GROWTH STRATEGY CONSULTING REPORT – THE CITY OF CALGARY
31

INDUSTRIAL AREA GROWTH STRATEGY CONSULTING REPORT – THE CITY OF CALGARY
32
Vacant Industrial Land by Ownership
Privately-owned land (2,033 ha) accounts for two-thirds of the total vacant industrial land in Calgary, while City-owned lands (940 ha) account for a one-third share (please refer to map on following page). The City, through its Real Estate & Development Services division, plays a key role in the local industrial land development marketplace.
The following exhibits illustrate the vacant industrial land supply by ownership and Land Use District. Privately-owned vacant industrial lands have the following distribution of LUDs:
Future Urban Development – 1,275 ha (63% share)
Industrial – 740 ha (36%)
Direct Control – 18 ha (1%)
City-owned vacant industrial lands have the following distribution of Land Use Districts:
Future Urban Development – 509 ha (54% share)
Industrial – Multiple (multiple LUDs, including industrial) – 287 ha (31%)
Industrial – 135 ha (14%)
Direct Control – 9 ha (1%)

INDUSTRIAL AREA GROWTH STRATEGY CONSULTING REPORT – THE CITY OF CALGARY
33

INDUSTRIAL AREA GROWTH STRATEGY CONSULTING REPORT – THE CITY OF CALGARY
34
Vacant Industrial Land by Status of Servicing
Calgary has a significant supply of serviced vacant industrial land, at nearly 900 hectares. There is also a considerable supply of partially-serviced lands – with varying timing to be brought to full servicing. Additionally, there are longer-term lands which are currently unserviced (i.e. “raw”). The following illustrates the distribution of lands by the status of servicing (please refer to map on following page):
Serviced – 887 ha (30% share)
Partially Serviced – 1,315 ha (44%)
Unserviced – 771 ha (26%)
Vacant Serviced Industrial Land by Geography
The following exhibit illustrates the distribution of the city’s vacant serviced industrial land supply by geographic location:
Northeast – 502 ha (57% share)
Southeast – 356 ha (40%)
Other – 29 ha (3%)
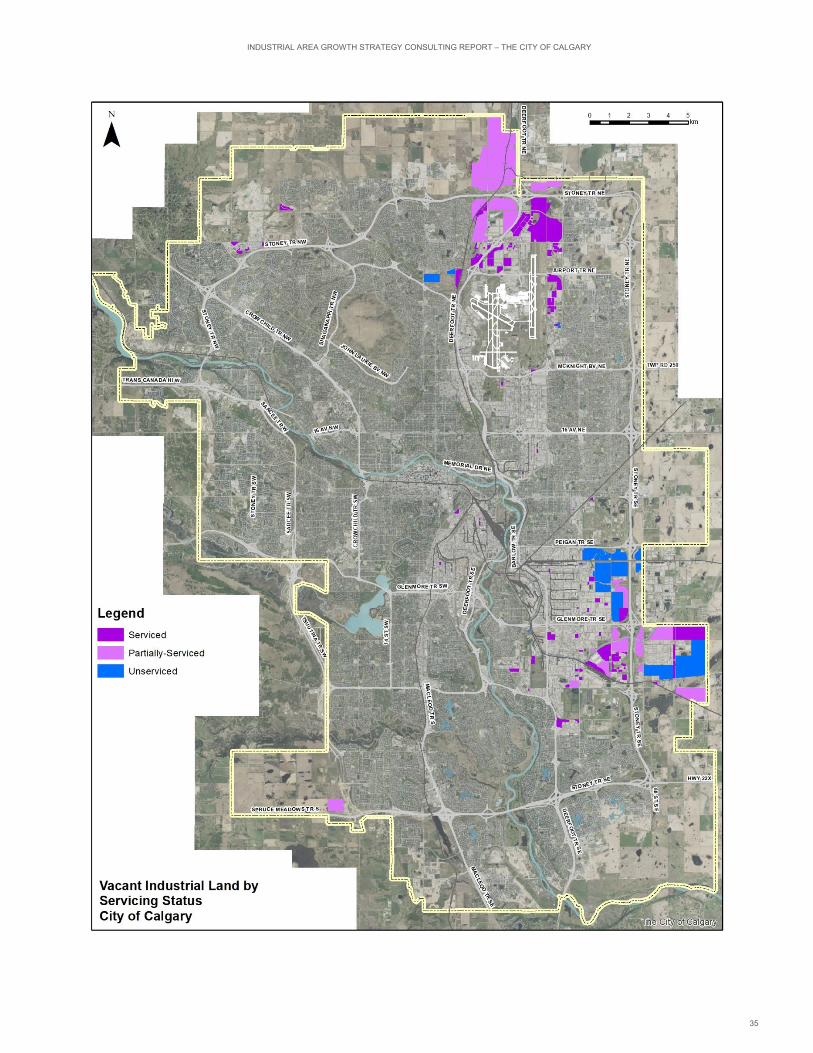
INDUSTRIAL AREA GROWTH STRATEGY CONSULTING REPORT – THE CITY OF CALGARY
35

INDUSTRIAL AREA GROWTH STRATEGY CONSULTING REPORT – THE CITY OF CALGARY
36
Vacant Serviced Industrial Land by Land Use District
The following exhibit illustrates the distribution of the city’s vacant serviced industrial land supply by Land Use District:
Industrial – General (I-G) – 372 ha (42% share)
Future Urban Development (S-FUD) – 209 ha (24%)
Industrial – Business (I-B) – 198 ha (22%)
Industrial – Commercial (I-C) – 88 ha (10%)
Other Industrial LUDs – 20 ha (6%)
This range of LUDs should provide considerable choice and site selection options for prospective users across the spectrum of industrial-type businesses that are seeking sites to expand, or to enter the Calgary market (please refer to map on following page).
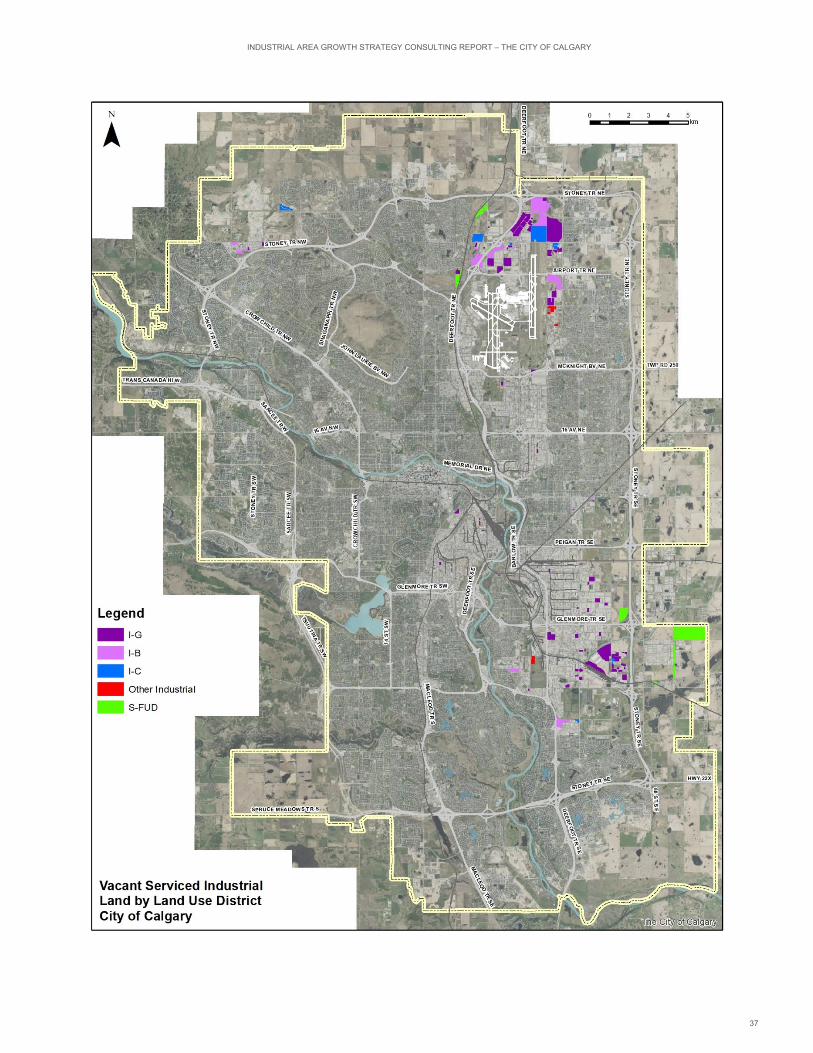
INDUSTRIAL AREA GROWTH STRATEGY CONSULTING REPORT – THE CITY OF CALGARY
37

INDUSTRIAL AREA GROWTH STRATEGY CONSULTING REPORT – THE CITY OF CALGARY
38
Vacant Serviced Industrial Land by Parcel Size
The Consultant Team has developed a set of parcel size cohorts to enable analysis of the vacant serviced land supply by parcel size – both the count of the number of parcels in each cohort, and the total size of each cohort in terms of land area. The following illustrates this distribution of the city’s vacant serviced industrial land supply by size of parcel:
<0.5 ha – 12 ha (21% share of count of parcels)
0.5 – 1 ha – 52 ha (27% share of count of parcels)
1-5 ha – 239 ha (37% share of count of parcels)
5-25 ha – 739 ha (12% share of count of parcels)
>25 ha – 1,932 ha (3% share of count of parcels)
There would appear to be a significant number of vacant serviced industrial parcels to accommodate the needs of prospective occupiers across the full range of property sizes (please refer to map on following page). For reference, a 1 hectare parcel can accommodate a 4,000 m2 building at a site coverage of 40%.

INDUSTRIAL AREA GROWTH STRATEGY CONSULTING REPORT – THE CITY OF CALGARY
39

INDUSTRIAL AREA GROWTH STRATEGY CONSULTING REPORT – THE CITY OF CALGARY
40
5.4 Occupied Industrial Land Supply Analysis
5.4.1 Occupied Industrial Land Inventory Overview
Cushman & Wakefield collaborated with City staff to develop a data set of occupied industrial parcels across the city – properties with one or more buildings on them. This data set includes lands that are situated across The City’s Strategic Industrial Areas. The land uses in these areas is not strictly industrial in nature; there are commercial, institutional, and a small number of other property types also situated in these areas. However, our primary focus is on industrial-type properties (please refer to map on following page which identifies occupied and vacant industrial-designated lands).
By count of parcels, of the total of almost 3,200 parcels identified within the Strategic Industrial Areas, 83% are industrial, 14% are commercial, and the remaining land uses account for a 3% share.
By land area, industrial uses represent an 84% share of the total lands (3,591 ha), followed by commercial at a 12% share (491 ha), with the remaining land uses account for a 4% share (183 ha).

INDUSTRIAL AREA GROWTH STRATEGY CONSULTING REPORT – THE CITY OF CALGARY
41
INDUSTRIAL AREA GROWTH STRATEGY CONSULTING REPORT – THE CITY OF CALGARY
42
5.4.2 Methodology and Approach
The City of Calgary’s Geodemographics staff provided property attributes for all lands in the above-noted data set. This included the following:
Industrial Area – Northeast, Northwest, Southeast, or Southwest;
Parcel size (hectares);
MDP Designation;
Land Use Designation;
Building footprint (m2); and,
Site coverage – (building footprint divided by parcel size).
From a land supply perspective, the Consultant Team is particularly interested in identifying the extent of “underutilized” lands within the existing built inventory. This is a reference to properties that are currently in use, but have a very low site coverage – hence the potential to accommodate additional uses over time (either through an addition to an existing building, the construction of another building on site, or perhaps a property severance to facilitate additional development). However, there are a number of limitations that must be considered, including:
Does the property exhibit a low site coverage because the remaining lands are being used for outside storage of raw or finished goods, equipment storage, or vehicle parking?
Does the orientation of the existing building(s) on the site encumber future development?
Does the parcel orientation limit future development (such as a triangular or pie-shaped property, which is not as well suited as a rectangular property for development, due to required setbacks, and creating a functional building layout)?
Is there an issue related to accessibility of the undeveloped portion of the property which makes it unlikely to intensify over time?
Is there a physical reason that the undeveloped lands have not been utilized to date (such as the presence of a waterway, wetlands, or other physical features [slopes, valley lands, etc.] which could limit the “developable” land area)?
Is the property owner motivated to intensify uses on the site?
5.4.3 Site Coverage Analysis
The Consultant Team has analyzed the data set and determined that the average site coverage for industrial uses city-wide is 40% (across over 2,600 industrial properties that were included in the analysis). The following illustrates the distribution of industrial property site coverage:
<20% site coverage – 579 properties on 1,208 hectares of land (22% share of total industrial property count)
20%-50% site coverage – 1,601 properties on 1,824 hectares of land (61% share)
>50% site coverage – 436 properties on 508 hectares of land (17% share)

INDUSTRIAL AREA GROWTH STRATEGY CONSULTING REPORT – THE CITY OF CALGARY
43
The properties within the “<20% site coverage” cohort are of the most interest to this analysis, since these represent sites that may be underutilized, and therefore capable of absorbing additional density through intensification over time. To the extent that more industrial space (and jobs) are accommodated on existing sites, there is correspondingly less requirement to bring new greenfield sites on stream. The preceding analysis considered all sites in the existing built inventory, regardless of size; however, it is most useful to assess the capacity of larger sites to intensify.
A 1 hectare site that is home to a 2,000 m2 building has a site coverage of 20%. If this site was intensified up to a 40% site coverage, an additional 2,000 m2 of building floor area would be created. This is obviously a nominal figure in the scope of the city’s overall industrial marketplace. In order to have a more meaningful impact on land needs going forward, we will limit the analysis to sites that are at least 2 hectares in size. A 2 hectare site at 20% site coverage accommodates 4,000 m2 of floorspace; if intensified to a coverage of 40%, an additional 4,000 m2 of floorspace is created (or a doubling of the building area to 8,000 m2). For sites that are below 20% site coverage, even more additional floorspace can be accommodated to bring them up to the 40% site coverage average across the city’s industrial areas.
The Consultant Team has identified 160 existing industrial properties that meet the criteria of having less than 20% site coverage and which are also at least 2 hectares in size (please refer to map on following page). If all of these sites were to intensify up to a 40% site coverage factor, then an additional 3.1 million m2 of floorspace would be created. This would reduce the requirement for up to 775 hectares of greenfield lands in the future (assuming 40% site coverage for new development). Of course, it is not reasonable to assume that all “underutilized” sites will intensify – but only a small share of intensification has the effect of lessening the extent of new greenfield industrial development over time (and the associated cost of extending municipal services).

INDUSTRIAL AREA GROWTH STRATEGY CONSULTING REPORT – THE CITY OF CALGARY
44

INDUSTRIAL AREA GROWTH STRATEGY CONSULTING REPORT – THE CITY OF CALGARY
45
5.5 Industrial Land Demand Projection
5.5.1 Overview
There are three principal industries that generate demand for industrial space: Manufacturing, Wholesale Trade, and Transportation and Warehousing. As discussed earlier, Cushman & Wakefield considers all subsectors/industry groups within the Manufacturing and Wholesale Trade sectors to be drivers of industrial building and land demand. 100% of future employment growth in these industry sectors is included in our land demand modeling. Within the Transportation and Warehousing sector, the following industry groups are associated with industrial-type demand: General freight trucking; Specialized freight trucking; Freight transportation arrangement; and Warehousing and storage. These industry groups are projected to represent 40% of the total increase in employment within the broader Transportation and Warehousing sector from 2016-2041, which is accounted for in our land demand modeling.
metroeconomics’ forecast of employment by industry enables Cushman & Wakefield to translate this job growth into land demand by utilizing an employment density figure (number of employees per hectare of land). This is influenced by the site coverage (ratio of building floor area to land area). An analysis of the city’s existing industrial building supply indicates that the average site coverage is 40% across all properties within the Industrial land use designation. This is in line with the Consultant Team’s observations in other major metropolitan markets in Canada. Notably, there has been an identified trend toward higher site coverage, as developers maximize site utilization, and seek to minimize land costs – although there are practical limits, in order to ensure suitable space for on-site storage, truck movements, employee parking, and required setbacks.
While The City of Calgary does not conduct an employer survey (which would enable the Consultant Team to link employment at businesses with a building’s municipal address, and thus use property data to calculate employee density), a benchmark range of 30-35 jobs per net hectare would be in line with observations in other major metro areas in Canada (a range of 25-40 is generally seen, with the upper end of the range including business parks with a considerable share of flex industrial properties with a higher component of office-type uses, and the lower end of the range reflecting a greater extent of outside storage of machinery, equipment, and raw and finished goods). Higher densities are generally associated with higher cost land markets (major cities), while lower densities are observed in lower cost land markets (secondary and tertiary markets).
5.5.2 Forecast Approaches
Cushman & Wakefield has developed two forecast approaches to estimate future land demand based on industrial-type employment growth.
Approach 1 – Net New Industrial-Type Employment
In this Approach, we have utilized the net new industrial-type employment in each industry sector over the 2016-2041 forecast horizon. Growth in many industry groups is partially offset by a decline in some segments within these industry groups, resulting in net new employment by industry. This net amount is the figure that is used in our modeling.
Approach 2 – Only Consider Growth Industries
In this Approach, we have only included industry groups that are anticipated to see increased employment during the forecast horizon. Consequently, industry groups that are projected to see a decline in employment are not included in the total employment in each industry. This recognizes that while total employment in an industry group may decline over time, these jobs may be replaced by increased productivity through process improvements and enhanced automation. Thus, industry output and demand for industrial premises may stay the same or even grow, despite declining employment.

INDUSTRIAL AREA GROWTH STRATEGY CONSULTING REPORT – THE CITY OF CALGARY
46
The exhibit below illustrates the outcomes of our two Approaches, using varied employment densities for comparative purposes.
LAND NEEDS PROJECTION APPROACH 1 – NET NEW INDUSTRIAL-TYPE EMPLOYMENT
Industry Sector Jobs (2016)
Jobs (2041)
Change (2016-2041)1
Land Need @ 30 Jobs
per Net Hectare
Land Need @ 35 Jobs
per Net Hectare
Manufacturing 31,450 34,132 2,682
Wholesale trade 23,520 27,825 4,305
Transportation, warehousing 9,375 23,118 13,743
TOTAL 64,345 85,076 20,731 691 592
Note 1: “Change 2016-2041” indicates the change in employment across all industry groups within each sector.
LAND NEEDS PROJECTION APPROACH 2 – ONLY CONSIDER GROWTH INDUSTRIES
Industry Sector Jobs (2016)
Jobs (2041)
Change (2016-2041)1
Land Need @ 30 Jobs
per Net Hectare
Land Need @ 35 Jobs
per Net Hectare
Manufacturing 31,450 34,132 7,390
Wholesale trade 23,520 27,825 6,060
Transportation, warehousing 9,375 23,118 13,743
TOTAL 64,345 85,076 27,193 906 777
Note 1: “Change 2016-2041” only indicates the change (increase) in employment in industry groups within each
sector that are forecast to add jobs over the forecast horizon.
5.5.3 Summary
The preceding land demand assessment explores two approaches to utilizing forecasted industrial-type employment to derive an estimate of land demand – and includes two employment densities (30 and 35 jobs per net hectare) to provide a range of outcomes. The result is an anticipated need for roughly 600-900 net hectares of land to accommodate industrial growth from 2016 through 2041 within the City of Calgary. This translates to absorption of approximately 24-36 hectares annually. As a “market reality check”, the overall Calgary market (as tracked by Cushman & Wakefield – which includes East Balzac) has seen an annual average of approximately 50-65 hectares of industrial land absorbed annually from 2011-2019 (this is based upon annual average new supply of approximately 2.1 million sf/195,000 m2, and an estimated site coverage of 30%-40%).
5.6 Land Supply and Demand Conclusions
Based on the Consultant Team’s review of the vacant industrial land supply that is planned and designated, there is an adequate provision of lands across a range of geographic areas, Land Use Districts, and parcel sizes, to accommodate a spectrum of prospective occupiers and users. As well, there are lands in varying stages of servicing – from fully serviced, to partially serviced, to currently “raw” lands – such that this should not represent a constraint to accommodating industrial-type job growth for the foreseeable future.

INDUSTRIAL AREA GROWTH STRATEGY CONSULTING REPORT – THE CITY OF CALGARY
47
The range of sites across the city provide suitable access and visibility to users that prioritize these attributes, and the Ring Road – upon completion – will greatly enhance goods movement. Linking back to the earlier discussion regarding the industry clusters that are prominent in the city, and which are poised to grow over the forecast horizon, it is the view of the Consultant Team that the present supply of planned industrial lands is capable of meeting the site selection requirements across a broad range of industry groups, and that there are no apparent obstacles from a land supply perspective to enabling growth and incubating new opportunities that are not already present in the local market. The city’s land supply itself is a competitive advantage that can be leveraged to foster economic development. Further, the ability of “underutilized” sites across the existing built inventory to intensify over time must also be considered – although we caution that this should not be relied upon in any significant way to take the place of new greenfield development, in terms of long-term growth management planning (due to the risks discussed earlier related to outside storage requirements, building orientation, parcel orientation, accessibility, and physical constraints – not to mention the owner’s intentions over the longer term).
To reiterate an important point discussed above, while there is a total of close to 3,000 hectares of vacant industrial land city-wide, the vast majority of this land supply is considered to be “gross” hectares (since there has not yet been any adjustment to account for roads, utilities, stormwater management, nor for the presence of natural features/physical features which could limit the “developable” land area). For the purposes of this analysis, the Consultant Team has applied a factor of 80% to adjust the overall land inventory from “gross” to “net”, which brings the total estimated vacant industrial land inventory total to approximately 2,400 net hectares city-wide. At present, there is nearly 900 hectares of serviced lands (a blend of “net” and “gross”), and a further 1,300 hectares of partially-serviced lands (again, a blend of “net” and “gross”). Based on anticipated demand for roughly 600-900 net hectares of land to accommodate industrial growth from 2016 through 2041, there is a suitable industrial land supply in the city.
Although land economics appear to be a challenge from the perspective of the local development community bringing sites to market at the present time, this is unrelated to the city’s supply of lands at an aggregate level (note: the topic of land development economics is explored in a later section of this report).
LAND SUPPLY SUMMARY
Land Use District/Type Land Area (Total ha)
Net or Gross
Adjustment Gross to Net
Land Area (Net ha)
Industrial-Designated 1,189 Blend of Net and Gross
Future Urban Development 1,784 Gross
TOTAL (ROUNDED) 3,000 80% 2,400
LAND DEMAND SUMMARY
Forecast Approaches Employment Growth
(2016-2041)
Land Need @ 30 Jobs per Net ha
Land Need @ 35 Jobs per Net ha
Approach 1 – Net New Industrial-Type Employment
20,731 691 592
Approach 2 – Only Consider Growth Industries
27,193 906 777
RANGE (ROUNDED) 700-900 600-800

INDUSTRIAL AREA GROWTH STRATEGY CONSULTING REPORT – THE CITY OF CALGARY
48
6.0 COMPETITIVE MARKETS ASSESSMENT – CALGARY METROPOLITAN REGION
6.1 Introduction
6.1.1 Components of Calgary Metropolitan Region
One of the key objectives of this Industrial Area Growth Strategy Consulting Report is to evaluate how The City of Calgary is positioned for industrial land development relative to the Calgary Metropolitan Region. This is intended to explore the land development economics of new industrial construction. The following section considers the competitive position of The City of Calgary compared to the other member municipalities that together form the Calgary Metropolitan Region (CMR). The CMR is comprised of:
City of Airdrie
City of Calgary
City of Chestermere
Town of Cochrane
Foothills County
Town of High River
Town of Okotoks
Rocky View County
Town of Strathmore
Wheatland County (a portion of the County)
The following section compares industrial property tax rates; off-site levies and other development-related charges/fees; municipal reserve requirements; and also explores partnership and synergistic relationship opportunities.
6.2 Property Tax Rates Comparison
The following exhibit compares the 2020 industrial/non-residential property tax rates for The City of Calgary and other Calgary Metropolitan Region municipalities, in descending order of non-residential mill rate. Also indicated is the 2020 residential mill rate, and the ratio of non-residential to residential mill rate.
The City of Calgary had the highest non-residential (industrial) mill rate in 2020, at 0.019407 (or a property tax bill of $19,407 per $1 million of assessed value).
− For comparison, Rocky View County – which surrounds the City of Calgary to the east, north, and west – had a mill rate that was 58% that of Calgary (resulting in a property tax bill of $11,265 per $1 million of assessed value).
− For a hypothetical industrial property valued at $143 psf (source: Altus Investment Trends Survey 2020 Q3 – average Calgary industrial building value), the property taxes in Calgary would be $2.78 psf, versus $1.61 psf in Rocky View County (or a savings of $1.17 psf).
The City of Calgary had the highest ratio of non-residential (industrial) mill rate to residential mill rate, at 2.58:1.00. This means that a non-residential (industrial) tax bill was 2.58 times higher per unit of assessed value compared to a residential tax bill.
− Elsewhere across the Calgary Metropolitan Region, this ratio ranged from a low of 1.28:1.00 in the Town of Strathmore, to a high of 2.22:1.00 in Rocky View County. The average was approximately 1.71:1.00 (this average excludes the City of Calgary itself).

INDUSTRIAL AREA GROWTH STRATEGY CONSULTING REPORT – THE CITY OF CALGARY
49
PROPERTY TAXES BY MUNICIPALITY
Municipality Non-Residential (Industrial) Mill
Rate 20202
Non-Residential (Industrial)
Property Taxes per $1,000,000 of Assessed Value
Residential Mill Rate
20202
Ratio of Non-Residential to
Residential Mill Rate
City of Calgary 0.019407 $19,407 0.007522 2.58:1.00
Town of Okotoks 0.016327 $16,327 0.008887 1.84:1.00
City of Airdrie1 0.013650 $13,650 0.007387 1.85:1.00
Town of High River 0.013131 $13,131 0.009612 1.37:1.00
Wheatland County1 0.012761 $12,761 0.006236 2.05:1.00
Foothills County 0.012223 $12,223 0.006220 1.97:1.00
Town of Strathmore1 0.011720 $11,720 0.009142 1.28:1.00
Rocky View County1 0.011265 $11,265 0.005077 2.22:1.00
City of Chestermere1 0.010963 $10,963 0.007667 1.43:1.00
Town of Cochrane 0.010236 $10,236 0.007418 1.38:1.00
Note 1: Some municipalities have an additional levy for Designated Industrial Properties (included in the rates above).
Note 2: The mill rates shown for Town of Okotoks and Foothills County are the 2019 rates.
Sources: Municipal websites.
6.3 Off-Site Levies and Other Development-Related Charges/Fees Comparison
6.3.1 Introduction
The City of Calgary is encountering direct competition from the thriving Nose Creek Business Park and High Plains Industrial Park located in East Balzac, in neighbouring Rocky View County. The Consultant Team has prepared a comparison of off-site levies and other development-related charges/fees for a hypothetical industrial development for each location. Given the limited extent of industrial development occurring elsewhere in the Calgary Metropolitan Region, this direct comparison is the most applicable for the purposes of this Industrial Area Growth Strategy Consulting Report.
The following describes the hypothetical industrial building to be constructed:
50,000 m2 building
12.5 hectares of land required
40% site coverage
6.3.2 City of Calgary
Within the City of Calgary, the off-site levy for storm sewer varies by watershed. The Nose Creek Area and the Shepard Area are the two locations that would attract the majority of industrial demand. Levies for sanitary sewer, water, treatment plant, and transportation are uniform city-wide. Together, these off-site levies range from $405,000 per hectare in the Nose Creek Area to $434,000 per hectare in the Shepard Area. For a 12.5-hectare site, these amounts total approximately $5.1-$5.4 million.

INDUSTRIAL AREA GROWTH STRATEGY CONSULTING REPORT – THE CITY OF CALGARY
50
In addition, there are other development-related costs such as the Community Service Charge, various fees, and the Developer Funded Infrastructure Stabilization Fund to take into consideration. When these elements are added to the off-site levies, the total costs are between $6.3-$6.7 million for 12.5 hectares of land. The following exhibit illustrates the off-site levies and other development-related costs for new greenfield industrial construction in Calgary.
OFF-SITE LEVIES AND OTHER DEVELOPMENT-RELATED COSTS – THE CITY OF CALGARY
Expense Cost per Hectare
Total Cost (12.5 ha)
Cost per m2 of Floor Area
Off-Site Levies
Storm Sewer Levy – Nose Creek $18,000
Storm Sewer Levy – Shepard $47,070
Sanitary Sewer Levy $53,490
Water Levy $46,326
Treatment Plant Levy $147,642
Transportation Levy $139,729
SUB-TOTAL OFF-SITE LEVIES – NOSE CREEK $405,000 $5,065,000
SUB-TOTAL OFF-SITE LEVIES – SHEPARD $434,000 $5,427,000
Charges
Community Services Charge $80,434
Fees
Traffic Signage & Road Markings $697
Inspection Fees $2,493
Surveys Act Base Map Fee $482
Developer Funded Infrastructure Stabilization Fund
Utility Oversize $5,500
Major Road Standard Oversize $10,500
TOTAL – NOSE CREEK AREA $505,000 $6,315,000 $126
TOTAL – SHEPARD AREA $534,000 $6,678,000 $134
Note: Sub-Totals and Totals are rounded.
6.3.3 East Balzac – Rocky View County
There are three off-site levies in place in Rocky View County that must be considered in evaluating development costs in East Balzac, as discussed below.
INDUSTRIAL AREA GROWTH STRATEGY CONSULTING REPORT – THE CITY OF CALGARY
51
Rocky View County’s Regional Stormwater Off-Site Levy Bylaw does not apply to lands in East Balzac.8 Instead, excess lands must be set aside to accommodate stormwater. While the County does not impose a fee/levy, the developer instead incurs the cost of providing land for stormwater management. Cushman & Wakefield estimates raw industrial lands to be valued in the range of $500,000 per acre/$1,235,000 per hectare in East Balzac (although this will vary over time as land values change, as it is a market-driven development expense). Stormwater management needs will vary on a site-by-site basis based on property and building characteristics.
Rock View County imposes off-site levies for Regional Transportation Infrastructure. The Urban Base Levy and Rural Base Levy are equivalent, at $11,354 per hectare. In addition, within the East Balzac area, the County requires specific upgrades to Regional Transportation Infrastructure to create road infrastructure connections to the Provincial Highway System to accommodate future development. The collection of the East Balzac Special Area 1 Levy will fund the necessary infrastructure. The levy calculation is $42,500 per hectare.9
With respect to Rocky View County’s Regional Water and Wastewater Off-Site Levy Bylaw, the County requires the developer to submit specific projected flows for both water and wastewater together with sufficient and acceptable justification for the projected flows for all proposed Development Permit applications or Subdivision applications. There are a number of levies and charges that apply to industrial development lands in East Balzac, including:
− Langdon Wastewater Treatment Plant Levy – $8,358.25 per m3/day
− ERVWWTM & Regional Lift Stations Levy – $7,599.49 per m3/day
− Graham Creek Water Treatment Plant (WTP) and Raw Water Reservoir (RWR) Levy – $9,715.50 per m3/day
− East Balzac Transmission Main (Base) – $926.12 per m3/day
− East Balzac Transmission Main (Oversize) – $244.23 per m3/day
− East Balzac Pump Station & Reservoir and RR293 Loop – $1,157.81 per m3/day
− Conrich Transmission Main (Oversize) = $141.92 per m3/day
− East Rocky View Back-Up Loop – $3,613.97 per m3/day
− Total – $31,757.29 per m3/day10
In discussion with Rocky View County staff, water and wastewater consumption varies depending on the type of industrial use – warehousing and distribution is lower than manufacturing, which typically has a higher staffing component, and also may consume water during the production process. For the purposes of this analysis, we have applied a figure of 10 m3/day, based on precedents indicated by County staff for a warehouse-type use (warehousing and distribution uses are common in this area, and several large facilities have been completed in recent years).
The cost of borrowing which has accrued up to and including December 31, 2019, is included within the calculation of the off-site levies. Rocky View County also levies the proportionate share of the future cost of water and wastewater capital financing costs (“cost of borrowing”) on all development, which is not accounted for in our model below. This depends on the remaining financing cost, the timing of development, and the anticipated water and wastewater consumption of each project as a share of the total system capacity.
8 https://www.rockyview.ca/Portals/0/Files/Government/Bylaws/C-8008-2020-Regional-Stormwater-Off-Site-Levy-Bylaw.pdf 9 https://www.rockyview.ca/Portals/0/Files/Government/Bylaws/C-8007-2020-Regional-Transportation-Off-Site-Levy-Bylaw.pdf 10 https://www.rockyview.ca/Portals/0/Files/Government/Bylaws/C-8009-2020-Regional-Water-Wastewater-Off-Site-Levy-Bylaw.pdf

INDUSTRIAL AREA GROWTH STRATEGY CONSULTING REPORT – THE CITY OF CALGARY
52
OFF-SITE LEVIES – EAST BALZAC, ROCKY VIEW COUNTY
Expense Cost per Hectare
Total Cost (12.5 ha)
Cost per m2 of Floor Area
Regional Stormwater Off-Site Levy
Not applicable to East Balzac1 $0
SUB-TOTAL N/A $772,0001
Regional Transportation Off-Site Levy
Urban/Rural Base Levy $11,354
East Balzac Special Area 1 Levy $42,500
SUB-TOTAL $53,854 $673,000
Regional Water and Wastewater Off-Site Levy
Modeled as a hypothetical warehouse facility (note: consumption would likely be greater for a manufacturing-type facility, with a higher employment density, and potentially water usage in the production process).2,3
Based on projected
consumption of 10 m3/day.
$318,000
TOTAL $1,763,000 $35
Note 1: While no Regional Stormwater Off-Site Levy is applicable in East Balzac, the property owner/developer
would need to set aside excess land for stormwater management purposes, and absorb this cost. However, this
will vary on a site-by-site basis based on property and building characteristics. If 5% of the site is required for
such uses, this translates to approximately two-thirds of a hectare. At a value of $1,235,000 per hectare in East
Balzac (Cushman & Wakefield estimate), this reflects a cost of approximately $7722,000.
Note 2: Projected consumption for other industrial-type uses may be 3-5 times greater than a warehousing and
distribution-type use, which typically has few employees and little water/wastewater demand.
Note 3: The expense related to capital financing costs for water/wastewater is not included in the figure above.
This amount depends on the remaining financing cost, the timing of development, and the anticipated water and
wastewater consumption of each project as a share of the total system capacity.
Note 4: Sub-Totals and Totals are rounded.
Within Rocky View County, the “voluntary recreation contribution” refers to a voluntary monetary donation by owners or developers applied to each new unit for residential or non-residential development. The 2020 Master Rates Bylaw indicates a rate of $800 per acre ($1,976 per hectare).11 This is far less than the Community Services Charge imposed by The City of Calgary, which is influenced by the disparity in the extent of community and recreation facilities within the City of Calgary versus the County. The City of Calgary Community Services Charge also includes charges that support services such as libraries, policing, transit, and emergency services.
Other points of comparison regarding development-related costs include the following:
Rocky View County requires the developer to undertake road marking. Therefore, this is not a cost levied by the County (unlike in Calgary) – it is a direct expense incurred as part of the development.
Inspection fees in Rocky View County are recovered through the Master Rates Bylaw, whereas The City of Calgary imposes such fees on a per hectare basis for new development.
11 https://www.rockyview.ca/Portals/0/Files/Government/Bylaws/RVC-Master-Rates-Bylaw.pdf

INDUSTRIAL AREA GROWTH STRATEGY CONSULTING REPORT – THE CITY OF CALGARY
53
Unlike The City of Calgary, Rocky View County does not have a Developer Funded Infrastructure Stabilization Fund. Instead, a developer that has front-ended the cost of infrastructure will recapture the portion of this project that is attributable to future development. The County collects the appropriate charges from the later developers and remits payment to the original developer that incurred the front-ended expense. These two approaches seek to accomplish the same thing, whereby the initial/leading developer is financially responsible for their portion of the infrastructure upgrade only.
6.3.4 Summary
The preceding examination of off-site levies and other development-related costs reveals that an “apples-to-apples” comparison of a prospective industrial development located in the City of Calgary versus the East Balzac area within Rocky View County is a challenge (refer to exhibit below). The two municipalities have differing approaches to recovering development-related costs. Many are on a land area basis; others are on a site-specific consumption basis (e.g. water/wastewater in RVC); land value influences some costs (e.g. excess land needed for stormwater management in RVC); and certain charges are imposed at a dramatically different rate, based on the disparity in municipal services provided (Calgary’s Community Services Charge versus RVC’s “voluntary recreation contribution”). Overall, however, it is apparent that the costs to develop an industrial building in East Balzac are less than the same facility locating in the City of Calgary.
COMPARISON – CALGARY VS EAST BALZAC
Expense Item City of Calgary (per ha)
City of Calgary (total)
East Balzac (per ha)
East Balzac (total)
Storm Sewer Levy $18,0001 $225,000 N/A $772,0002
Sanitary Sewer Levy $53,490 $669,000 N/A $318,0003,4
Water Levy $46,326 $579,000
Treatment Plant Levy $147,642 $1,846,000
Transportation Levy $139,729 $1,747,000 $53,854 $673,000
SUB-TOTAL (ROUNDED) $405,000 $5,065,000 N/A $1,763,000
Community Services Charge $80,434 $1,006,000 $1,976 $25,000
Various Fees $3,672 $46,000 N/A Note 5
Developer Funded Infrastructure Stabilization Fund
$16,000 $200,000 N/A Note 6
TOTAL (ROUNDED) $505,000 $6,315,000 $143,000** $1,788,000**
** It is necessary to review all notes below in order to compare City of Calgary and East Balzac.
Note 1: Storm Sewer Levy for City of Calgary is for Nose Creek area.
Note 2: Storm water management is undertaken on-site. Assumed extra 5% land area required @$1,235,000/ha.
Note 3: Water and Wastewater Off-Site Levy in Rocky View County is charged on a consumption basis. A rate of 10
m3/day is assumed for warehouse-type use.
Note 4: The expense related to capital financing costs for water/wastewater is not included in the figure above.
Note 5: Rocky View County requires the developer to undertake road marking. Therefore, this is not a cost levied by the
County (unlike in Calgary) – it is a direct expense incurred as part of the development. Inspection fees in Rocky View
County are recovered through the Master Rates Bylaw.
Note 6: Rocky View County does not have a Developer Funded Infrastructure Stabilization Fund. Instead, a developer that
has front-ended the cost of infrastructure will recapture the portion of this project that is attributable to future development
(The County collects the appropriate charges from the later developers and remits payment to the original developer).

INDUSTRIAL AREA GROWTH STRATEGY CONSULTING REPORT – THE CITY OF CALGARY
54
6.4 Municipal Reserve
The Province of Alberta’s Municipal Government Act requires municipal reserve to be provided when land is subdivided. The registered owner of land that is the subject of a proposed subdivision shall provide to the municipality, without compensation, land for municipal reserve. Land that is provided for municipal reserve shall not exceed 10 percent of the gross area of the lands that are subject to subdivision.12 Council may require the registered owner to provide money in place of municipal reserve (or a combination of land and money in place of municipal reserve). Referred to as “cash-in-lieu” of reserve, this money shall not exceed 10% of the appraised market value of the gross area of the land to be subdivided. If money is required to be provided in place of municipal reserve, the applicant must provide a market value appraisal. In situations where the subdivision results in large parcels that could be subdivided further, part or all of the municipal reserve may be deferred by caveat to the proposed parcels or remainder of the parcel.
Cushman & Wakefield estimates raw industrial land to be valued at $700,000 per acre ($1,729,000 per hectare) in Calgary, compared to $500,000 per acre ($1,235,000 per hectare) in East Balzac. Accordingly, the hypothetical required 12.5-hectare land parcel would generate a cash-in-lieu payment of $2,161,000 in the City of Calgary versus $1,544,000 in East Balzac. The variance in cash-in-lieu amounts to $617,000, or nearly $50,000 per hectare.
MUNICIPAL RESERVE CASH-IN-LIEU COMPARISON
Metric The City of Calgary
East Balzac – Rocky View County
Land Value (per acre) $700,000 $500,000
Land Value (per hectare) $1,729,000 $1,235,000
Parcel Size (hectares) 12.5 12.5
Land Value $21,613,000 $15,438,000
Cash-in-Lieu 10% of land value
Cash-in-Lieu $2,161,000 $1,544,000
6.5 Partnership and Synergistic Relationship Opportunities
6.5.1 Introduction
Municipalities within a larger economic region may be presented with opportunities to explore mutually beneficial opportunities to leverage their collective strengths, and to mitigate risk. The City of Calgary is a member of the Calgary Metropolitan Region Board (CMRB). The CMRB is comprised of elected officials from each of the Region’s 10 member municipalities (City of Airdrie, City of Calgary, City of Chestermere, Town of Cochrane, Foothills County, Town of High River, Town of Okotoks, Rocky View County, Town of Strathmore, and a portion of Wheatland County). The CMRB is committed to supporting the long-term social, environmental, and economic wellbeing of the Calgary Metropolitan Region by facilitating collaborative regional planning practices, optimizing shared services and land use, and fostering sustainable growth.13 The CMRB’s role is to ensure planning for regionally-significant growth is coordinated between municipalities.14 The following explores various synergistic relationships that may exist with respect to industrial land and employment.
12 https://www.rockyview.ca/Portals/0/Files/BuildingPlanning/SubRed/Redesignation-and-Subdivision-Guide.pdf 13 https://www.calgarymetroregion.ca/ 14 https://www.calgarymetroregion.ca/interim-growth-plan

INDUSTRIAL AREA GROWTH STRATEGY CONSULTING REPORT – THE CITY OF CALGARY
55
6.5.2 Joint Marketing Initiatives
Municipalities within a broader economic region can benefit by pooling funds in a collective marketing effort in order to promote local opportunities, and seek to attract investment. Such marketing efforts – branding/positioning the region as an entity – recognize shared locational attributes, local infrastructure, and natural resource opportunities, among other common features that may distinguish the region from competitive markets. The decision of a prospective investor to situate in one municipality versus another is viewed as a collective “win”, in the hopes that spin-off opportunities may materialize to benefit the greater region. This is contrary to the conventional view that expanding the municipal tax base by attracting investment and creating employment opportunities at the expense of a competing jurisdiction is desirable.
A central element of such as approach is harmonized development-related costs, such that the site selection decision is not predominantly influenced by financial considerations (and so that other factors are also evaluated in the process – including economic factors and infrastructure factors – and not dictated primarily by real estate factors [i.e., cost of land/cost of development/cost of occupancy]).
6.5.3 Regional Infrastructure Decision-Making
Collaboration on the part of adjacent municipalities is vital in ensuring sustainable growth management practices. Where feasible, infrastructure emplacement and upgrades should take into account the growth aspirations of communities, and consider the most efficient and effective means of providing the necessary infrastructure (roads, water, wastewater, stormwater management, community facilities, etc.) that is needed to support existing business and attract and enable growth. Regional partnership opportunities may exist in leveraging excess infrastructure capacity, and appropriate cost-sharing to enable extension of services and capacity upgrades over time.
CMRB is mandated to develop policies regarding the coordination of regional infrastructure investment and service delivery while ensuring environmentally responsible land-use planning, growth management, and efficient use of land.15 The Growth & Servicing Plan for the Calgary Metropolitan Region is in development, and will come into effect in 2021. The plan will serve as a best-practice guide for achieving long-term prosperity in the Calgary Metropolitan Region, providing policies and high-level guidance to municipalities on regionally significant topics including:
Residential, commercial, and industrial land use;
Corridors for transportation, recreation, energy transmission, utilities, and transit;
Infrastructure planning and development;
Water quality, water use, and management (including flood mitigation); and,
Environmental sustainability and the conservation of agricultural lands.16
6.5.4 Advocating as a Collective
Another synergistic benefit of inter-regional collaboration is the ability to communicate a collective goal, or vision, to other levels of government (provincial and federal). In particular, advocating for a fair share of infrastructure spending and program commitments is more likely to be successful when municipalities combine their resources (and voices). Aggregating and aligning a larger pool of influential voters can result in action on the part of upper levels of government. As well, pooling municipal capital to share in the cost of strategic investments alongside senior levels of government can make projects more likely to be realized and/or accelerate their delivery timeline.
15 https://www.calgarymetroregion.ca/about-cmrb 16 https://www.calgarymetroregion.ca/growth-and-servicing-plan

INDUSTRIAL AREA GROWTH STRATEGY CONSULTING REPORT – THE CITY OF CALGARY
56
7.0 PLANNING POLICY PERSPECTIVES
7.1 Introduction
As part of its ongoing work related to the Industrial Area Growth Strategy, City staff have conducted considerable work in exploring changes to the industrial land use framework in the city. To support this work completed to date, the Consultant Team has provided an assessment of The City’s prevailing planning policy.
7.2 Calgary Industrial Planning Framework Overview
7.2.1 Municipal Development Plan Review
The following presents a summary of key elements of Calgary’s Municipal Development Plan (MDP) that pertain to this Industrial Area Growth Strategy Consulting Report:
In Part 2 – City-wide Policies, the MDP sets the stage for establishing and achieving appropriate city-building objectives. Certainly, economic opportunity and development are fundamental topics, and are discussed at some length in Section 2.1. The objectives and policies within this part of the MDP are typically aspirational, and lay an appropriate foundation for the more detailed planning policies within the subsequent Parts of the Plan.
Of particular importance to this Industrial Area Growth Strategy Consulting Report is subsection 2.1.2 Creating a City Attractive to Business, which states that the "City can enact public policy to ensure that adequate locations for office, institutional, retail, and industrial development are protected in strategic an accessible areas that will meet the future needs of these businesses." This subsection goes on the state that, in support of manufacturing and industrial businesses more specifically that The City "ensure the availability of competitively priced, easily serviceable and developable land for industrial purposes; including opportunities for brownfield redevelopment." This policy subsection, which is relatively high level, does introduce the important concept of establishing and protecting a supply of land to accommodate future industrial growth. That is good planning policy, and a crucial economic development principle.
In Part 3 – Typologies for Calgary's Future Urban Structure, subsection 3.7 focuses on the policy framework for The City's Industrial Areas, which are identified on Map 1 – Urban Structure. Map 1 identifies three primary agglomerations of industrial land use activity that include Standard Industrial and Industrial – Employee Intensive designations, as well as other, smaller areas that are similarly designated. Map 1 also identifies a relatively large area as Industrial Greenfield. The largest geographical agglomeration is focused on the Calgary International Airport, although much of the designated land area is utilized by the airport function itself.
In Part 4 – Specific Use Policies, subsection 4.3.3 identifies the policy framework for the Airport Vicinity Protection Area (AVPA). Map 6 identifies both the Calgary International Airport/30 NEF and the Airport Vicinity Protection Area Boundary. In effect, the 30 NEF contour generally coincides (with some exceptions) with the Standard Industrial and Industrial – Employee Intensive designations (the Consultant Team notes that changes to the AVPA are presently under consideration).

INDUSTRIAL AREA GROWTH STRATEGY CONSULTING REPORT – THE CITY OF CALGARY
57
With respect to industrial land use, the policies contained within the MDP are not complex in structure; the policy framework is straight-forward. The Standard Industrial and Industrial – Employee Intensive designations are developed to recognize different objectives in terms of employment density, land use, mobility context, and public realm requirements. The Industrial Greenfield designation recognizes an undeveloped area, requiring additional planning work (an Area Structure Plan) to be done prior to actual development. The wording that describes the specific land use policies is considered to be very flexible, and an invitation to either intrusion – the introduction of non-industrial uses (such as major commercial or major institutional) into an industrial area – or larger applications for the conversion of the designated lands to non-industrial land uses, including residential uses.
The 30 NEF contour identified on Map 6 provides the associated industrial land areas with an added level of protection from conversion to non-industrial land uses simply because that contour provides a prohibition to sensitive land uses (residential, and some institutional). However, over time, NEF contours change (as the results of the current AVPA analysis indicate), and may be removed from some lands that are currently within the Standard Industrial and Industrial – Employee Intensive designations. The removal of that added level of protection from sensitive land uses could result in requests for conversion to non-industrial land uses.
7.2.2 Land Use Bylaw 1P2007 Review
The following comments reflect the Consultant Team’s review of The City’s Land Use Bylaw 1P2007:
With respect to industrial land uses, The City’s Land Use Bylaw is complex. It establishes seven separate categories for use within the Standard Industrial and Industrial – Employee Intensive designations of the MDP. These categories are as follows:
− I-B – Industrial – Business District
− I-C – Industrial – Commercial District
− I-E – Industrial – Edge District
− I-G – Industrial – General District
− I-H – Industrial – Heavy District
− I-O – Industrial – Outdoor District
− I-R – Industrial – Redevelopment District
The categories sometimes identify where they should be located – edge versus internal; sometimes the by the type of industry – light, medium, or heavy industry; and sometimes whether or not outside storage is permitted. Further, the lists of permitted and discretionary uses are also complex and very specific.

INDUSTRIAL AREA GROWTH STRATEGY CONSULTING REPORT – THE CITY OF CALGARY
58
8.0 STRATEGIC GROWTH MANAGEMENT RECOMMENDATIONS
8.1 Introduction
The purpose of this Industrial Area Growth Strategy Consulting Report is to articulate Calgary’s competitive advantages to exploit opportunities in its industrial areas, to identify the economic sectors and industries that the city is best positioned to attract, and to enable growth. The preceding research and market analysis explored the local industrial landscape and market trends, including using Cushman & Wakefield’s market survey data to paint a picture of the historic and current market performance, and provide insights regarding the impact of the COVID-19 pandemic on the industrial real estate sector. The Consultant Team also explored the key industry clusters that have been drivers of demand for industrial land and buildings, and provided an outlook for employment growth by sector. Further, the Consultant Team identified the site selection criteria for key industry sectors, and corresponding land requirements. As well, issues and trend impacting industrial real estate and new development were examined.
The Consultant Team has identified Calgary’s industrial competitive advantages, which includes its strategic location, diverse industrial employment base, presence of Calgary International Airport, large and growing labour force, and Alberta’s tax advantage. An analysis of the vacant industrial land supply, and opportunities for intensification of existing occupied sites, set the stage for an assessment of the ability of the city’s industrial land to accommodate forecast demand through 2041 – including a projection of industrial land demand. Additional components of this Industrial Area Growth Strategy Consulting Report include a competitive markets assessment comparing property tax rates, off-site levies, and other development-related charges/fees, as well as a review of existing planning policies related to industrial lands.
Calgary offers prospective industrial occupiers with the full breadth of required site selection attributes to start a new business – it has available lands for development, and a network of established industry that can serve as suppliers and buyers/end-users of goods and services. The city is well served by transportation to move raw materials and finished products to markets nearby, across Canada, and internationally. It is vital that municipalities plan for the provision of an adequate industrial land supply to provide a range of choice among prospective occupiers, given the competitive development market. This also facilitates the attraction of new/emerging economically productive clusters. The City needs to continue to offer a suitable land supply to accommodate occupier requirements, and ensure a supportive planning policy environment. A diversified industrial land base – with alternative locations, land costs, and contexts – helps accommodate and expand the local economy, and reduces a community’s vulnerability and dependence on a single industry sector.
To reiterate the Consultant Team’s land supply and demand conclusions, the present supply of planned industrial lands appears capable of meeting the site selection requirements across a broad range of industry groups, and there are no apparent obstacles from a land supply perspective to enabling growth and incubating new opportunities that are not already present in the local market. The city’s land supply itself is a competitive advantage that can be leveraged to foster economic development. The following section presents the Consultant Team’s recommendations regarding actions that The City could take to respond to its weaknesses, and actions that The City could take to capitalize on its strengths. We link back to the analysis presented earlier in our work, and provide recommendations to enable The City of Calgary to capitalize on its competitive advantages, to foster growth, attract and retain businesses, and undertake strategic growth management. These recommendations are organized by the same topics/themes that appear throughout this Industrial Area Growth Strategy Consulting Report.

INDUSTRIAL AREA GROWTH STRATEGY CONSULTING REPORT – THE CITY OF CALGARY
59
8.2 Industry Trends-Related Recommendations
Recognize Increasing Demand for Warehousing and Logistics Facilities
With the boom of e-commerce, we have seen the industrial market excel in the current expansion – it has been a bright light compared to many other commercial real estate sectors (retail and office in particular).
The move to online shopping has been happening for some time now, and has been accelerated by the COVID-19 pandemic, and retailer’s response to consumer behaviours.
With the sale of more goods online, there is a need for the logistics space to house the goods outside of a traditional brick and mortar store.
Greater adoption of e-commerce will take serval years to implement across many markets, meaning demand will continue to be widespread for longer than just through the remainder of the pandemic.
As the world adjusts to life during the COVID-19 pandemic, we are seeing a marked acceleration in the adoption or improvement of supply chain innovations, and an opportunity to address some pain points that had been lower on the priority list for many industries.
Manufacturers are likely to hold more inventory as they seek more flexibility and less vulnerability to disruptions. Reshoring or nearshoring would shorten supply chains, effectively reducing long lead times, thereby giving manufacturers more control over production quantities to allow for greater flexibility in response to demand.
RECOMMENDATIONS
Since warehousing and distribution facilities typically require large sites, The City should resist conversion requests for large industrial-designated sites – particularly those that offer superior access to arterials and highways. For the purposes of this recommendation, a “large” site can be considered to be in excess of 5 hectares (which could accommodate a 20,000 m2 building at 40% site coverage).
Continue to Ensure Efficient Goods Movement
Connected by both east-west and north-south major truck routes, a robust railway system, and the Calgary International Airport (which counted 4,305 cargo landings in 2019), Calgary is the leading Western Canadian inland port.
With a total of 101 kilometers of free-flow traffic that is set for completion in 2022, the Calgary Ring Road provides improved connection of the city’s peripheral industrial parks to major truck-transportation routes, and further positions the city to continue to leverage the growing demand for e-commerce and logistics.
Calgary’s Ring Road facilitates reliable goods movement into and around Calgary, and provides more options for people travelling around the city. It shortens the travel time between communities and popular destinations in and outside of Calgary. While this is beneficial to existing industrial occupiers in the city, the Ring Road also has the effect of increasing accessibility to other communities in the region, thus enhancing their desirability from an industrial site selection perspective by improving access to labour and goods movement.
RECOMMENDATIONS
Calgary has invested to enhance goods movement across the city, providing connections from businesses to markets. The City must ensure that goods can move efficiently by implementing its Goods Movement Strategy. This means continuing to make priority investments in transportation infrastructure, collaborating with external partners to enhance regional goods movement, enhancing last-mile delivery, and promoting planning for logistics centres and industrial areas (such as this Industrial Area Growth Strategy Consulting Report).
INDUSTRIAL AREA GROWTH STRATEGY CONSULTING REPORT – THE CITY OF CALGARY
60
The City should ensure that vacant and occupied industrial sites that are adjacent/in proximity to intermodal (truck-railway) facilities, as well as rail yards, are retained for industrial uses going forward. These sites have unique site selection attributes that should be preserved. Also, industrial lands that are served by a rail spur should also be protected for ongoing industrial use, to ensure that occupiers seeking this property feature can find sites that enable them to efficiently move goods to and from their operations.
8.3 Site Selection-Related Recommendations
Preserve Industrial/Employment Opportunities on Centrally-Situated Sites and Within Established Industrial Parks
Established industrial/employment areas are an important component of the existing tax base, helping to maintain and improve local infrastructure and investment.
Calgary’s industrial areas each feature different types of land and serve different functions across the range of industrial uses, and they need to be preserved going forward as a vital element of the local economic base.
Employment areas are home to many of the activities that support the local population, such as auto repair shops, household repair services, wholesale distribution, and warehousing of consumer products. As well, these areas provide small, cost-effective, flexible spaces that are critical for business start-ups and high-tech incubators, as well as artist studios. Eclectic, mature industrially-zoned areas remain important to a healthy, dynamic, and vital economy.
Of note, the historically lower levels of vacancy and higher rental rates achieved in the Central submarket are a testament to the enduring nature of industrial areas, and their ongoing appeal among many occupiers.
RECOMMENDATIONS
The City must weigh trade-offs regarding new development – particularly transit-oriented development (TOD) – versus the preservation of established industrial/employment areas. Where city-building priorities unlock TOD potential, The City should ensure that some extent of employment uses is incorporated within a redevelopment of industrial lands that is undertaken as part of a transit-oriented development project or another form of redevelopment. As well, The City should ensure that development that occurs on sites in industrial areas does not compromise the viability of remaining business in the area.
Recognize that Industrial Buildings are Getting Larger and there is Increasing Demand for Larger Parcels of Land
There has been a trend of increasing building size in recent years – in large part influenced by the growth in very large distribution facilities that are in demand due to rising e-commerce activity. Cushman & Wakefield’s data for Calgary indicates an average building size of roughly 4,500-5,500 m2 for new supply added from 2010-2012, which increased considerably to an average of nearly 9,500 m2 for the period from 2015-2020.
In recent years, supply chain modernization and rapid adoption of e-commerce has fueled demand for new industrial supply – particularly parcels that accommodate large warehouse and distribution facilities. Typically, these are located on the periphery of urban areas, offering ready access to the market, while taking advantage of lower land costs. These facilities are becoming increasingly large, as enterprises streamline their distribution networks into fewer, larger facilities. As well, distribution centres often seek large yards to accommodate on-site trailer storage in secured areas, so that drivers can drop their trailers and exit, rather than waiting to off-load goods (the goods are later off-loaded as needed).

INDUSTRIAL AREA GROWTH STRATEGY CONSULTING REPORT – THE CITY OF CALGARY
61
RECOMMENDATIONS
As discussed above, The City should resist conversion requests for large industrial-designated sites. For the purposes of this recommendation, a “large” site can be considered to be in excess of 5 hectares (which could accommodate a 20,000 m2 building at 40% site coverage).
Recognize Evolving Demands on Centrally-Situated Sites
Opportunities to situate “last-mile” logistics facilities within urban areas that reduce shipping times and costs will continue to grow in appeal – particularly for time-sensitive shipments. This is likely to place upward pressure on industrial land values for centrally-situated zoned lands, as well as introduce adaptive reuse opportunities for existing properties that can suit this purpose, or demolition and new construction on sites that are well suited for such uses.
The integration of industrial uses into former retail spaces is an emerging phenomenon, as empty mall anchor units within underperforming shopping centres are repurposed as last-mile delivery centres, or even light industrial uses.
RECOMMENDATIONS
The completion of the Ring Road will represent fulfilment of dramatically improved movement of labour and goods around the city. The need for “last mile” logistics solutions is less acute in a city the size of Calgary compared to other larger, more congested markets in North America. Although this is not considered an urgent matter, City staff should monitor demand for “last mile” facilities, and adapt land use policy as needed in the future to address this market segment.
While there is nascent interest in exploring the repurposing of former retail spaces (such as shopping centre anchor units) into industrial uses (such as “last mile” distribution points), in the Consultant Team’s view, this trend is likely to be far more prevalent in “over-retailed” U.S. markets, compared to Canada.
Continue to Support and Collaborate with Calgary International Airport
Calgary International Airport (YYC) is located in the City of Calgary – unlike some airports in major Canadian cities. This is important, since the financial and economic benefits of the airport predominantly accrue to The City of Calgary itself, and not an adjacent municipality.
The Airport and related uses are a large employment cluster that ranks second largest after the Central Business District in terms of overall employment.
Calgary International Airport plays an important role in the local industrial market as a key logistics hub, and has been an active land developer since 1992. An Approved Land Use Plan between the Calgary Airport Authority and The City of Calgary establishes the various zones within the Calgary Airport Authority Lands, and denotes the restrictions and permitted uses with respect to each zone.
RECOMMENDATIONS
The City should continue to liaise with the Calgary Airport Authority to understand its needs, and work collaboratively to ensure that the airport can be leveraged as a continuous competitive advantage. Ensuring efficient goods movement to and from the airport is one area of partnership that requires ongoing attention to take advantage of the Inland Port’s capacity. Improved public transit is another area that could enhance the airport’s function as an employment hub.

INDUSTRIAL AREA GROWTH STRATEGY CONSULTING REPORT – THE CITY OF CALGARY
62
8.4 Industry Clusters-Related Recommendations
Facilitate Opportunities for Growth of Key Industry Clusters and the Incubation of New Clusters
The analysis of Calgary’s largest industrial groups illustrates the breadth of industries and diversity of uses that are drivers of industrial-type land demand. It also emphasizes the need to provide for a range of industrial lands suited to the varied site selection factors of importance. While many industrial users have common requirements – such as access to labour; proximity to suppliers and customers; access to highway and intermodal distribution networks; suitable services/infrastructure, including utilities and telecommunications, and more – some of the industry groups that the city is forecast to see sizable employment growth in require specific site selection attributes including: availability of large sites; permission for outside storage and/or truck/vehicle parking on site; acceptable minimum separation distance from other land uses; and heavy industrial zoning, to name a few.
The top 10 industry groups associated with industrial type demand in the Calgary CMA currently account for 37% of all industrial-type jobs, while the top 20 account for a 59% share.
The largest clusters span the range of industries from transportation and warehousing (warehousing and storage; general freight trucking; and specialized freight trucking) to wholesale trade (seven different industry groups) to manufacturing (accounting for 10 of the 20 largest industry groups).
Looking forward, many of the largest industry groups in 2016 in Calgary are anticipated to drive employment growth over the next 25 years. Of the top 20 industry groups/clusters in 2016, 12 are among the top 20 largest in terms of industrial-type employment growth for the period from 2016-2041.
RECOMMENDATIONS
The need to provide for availability of large sites has been addressed previously – The City should resist conversion requests for large industrial-designated sites. Once again, for the purposes of this recommendation, a “large” site can be considered to be in excess of 5 hectares (which could accommodate a 20,000 m2 building at 40% site coverage).
Rear yard outside storage needs associated with building operations should be permitted on all industrial lands, without limitation due to land size/area/frontage. Outside storage must be adequately screened/landscaped from view from the roadway. The vacant land supply analysis indicates that there are eight sites zoned I-O – Industrial – Outdoor District (ranging from approximately 1-2 hectares in size) remaining undeveloped.
The City faces a potential shortage of Heavy Industrial-zoned lands (I-H). The vacant land supply analysis indicates that there are only two sites zoned I-H (0.6 hectares and 7.6 hectares) remaining undeveloped. While future employment growth in industry sectors that demand heavy industrial lands may take place primarily within established businesses, The City should identify additional sites that would be suited to accommodate I-H-type needs, and either (a) re-zone lands presently under another industrial LUD to I-H, or (b) expedite any pending/future applications for zoning amendments to allow I-H-type uses. Consideration for the designation of I-H lands within Future Urban Development Districts (S-FUD) should also be given. City staff should monitor the update/absorption of industrial lands and track all heavy industrial demand closely for site attributes (size and geographic location – and if possible, number of employees per new establishment).
It is important that The City ensure a suitable land supply to meet the needs of those industry clusters associated with the most significant share of projected employment growth through the 2041 forecast horizon. The following additional observations pertain to land use planning/zoning related to the city’s most prominent industry clusters:
INDUSTRIAL AREA GROWTH STRATEGY CONSULTING REPORT – THE CITY OF CALGARY
63
A range of manufacturing establishments – such as Bakeries, Beverage, Glass and glass products, Furniture and kitchen cabinetry, Meat products, and Other foods – may seek to locate in an I-C zone in order to accommodate small-scale commercial uses that complement their core business activities.
I-G is the most prevalent industrial land use designation today across Calgary’s built-up industrial/employment areas, and this zone will continue to accommodate a broad range of industrial occupier needs going forward.
I-H-designated lands will be required in the future for uses such as Basic chemical manufacturing, which is among the top 20 industry groups forecast for employment growth through the 2041 forecast horizon.
City staff should monitor the types of industry sectors that are becoming tenants/occupiers of its new industrial supply. This will enable the creation of site selection “profiles” of various sectors – in particular, those that are forecast to account for a significant share of future industrial demand. This will allow The City to proactively manage its industrial land supply to ensure that suitable lands remain available in term of zoning permissions, and to anticipate future servicing/infrastructure timing.
8.5 Planning Policy Recommendations
Municipal Development Plan Overall Recommendations
RECOMMENDATIONS
It is recommended that the land use policies within both subsection 3.7.1 and 3.7.2 be strengthened to:
Clearly specify the requirement that industrial uses must be the primary use within the Standard Industrial and Industrial – Employee Intensive designations;
Prohibit the intrusion of major retail and major institutional land uses within the Standard Industrial and Industrial – Employee Intensive designations. Intrusions can have a detrimental impact on the long-term viability of an industrial area. Intrusions are the beginning of the erosion of the industrial function of the area, and may lead to larger scale conversion requests in the longer term; and,
Require that any conversion application only be considered on the basis that the long-term viability of the industrial area will be maintained, and that there is a defined need for the conversion. The issue of need must be defined based on a clear understanding that the land is not required for the uses that it is designated for over the time horizon of the Plan, and that the land is needed for the proposed alternative use. The issue of need is crucial to ensure balanced growth management over time.
Land Use Bylaw Overall Recommendations
RECOMMENDATIONS
It is recommended that the land use policies Part 8 of the Land Use Bylaw be comprehensively reviewed to:
Reduce the number of zones to be more specifically linked to the location, design, scale, and potential impact of the permitted uses:
INDUSTRIAL AREA GROWTH STRATEGY CONSULTING REPORT – THE CITY OF CALGARY
64
− Development along the "edges" of the industrial areas would be more modestly scaled; would focus on light and medium industrial uses; would have permission for the broadest array of supportive non-industrial land uses; and would present a prestige image through enhanced landscape and building design features. Edge industrial uses are expected to be an appropriate transition between more sensitive land uses (e.g. a residential community) and the heavier industrial activities described below; and,
− Development "internal" to the industrial areas would include larger scale heavy industrial uses as well as light and medium industrial uses, with less emphasis on design and image, and less concern about mitigating industrial impacts. The range of permitted uses would be more restricted to the industrial function of the area. These lands are very important to attract heavy industrial uses, and it is equally important to protect those industrial users from the impact concerns of those more sensitive land uses. Ensuring minimum required separation distances is essential for those affected land uses.
Harmonize and simplify:
− The lists of permitted and discretionary land uses to remove confusion, and permit appropriate land use types in multiple locations – as well as facilitate a change of use as tenants/occupants vacate, and are replaced by new uses which are generally compatible; and,
− The landscape requirements, which are very specific and surprisingly similar among all of the zones.
The City’s proposed Guidebook for Great Communities includes Industrial Urban Form Categories which creates a new vision for industrial land use planning in the city. The Guidebook is a tool used by citizens, stakeholders, and The City to develop a local area plan by applying the urban form categories in Chapter 2. The local area plan reflects unique community characteristics, with policies that guide growth and redevelopment. After a local area plan is approved, the Guidebook also helps to guide planning applications. The Guidebook only applies to communities with local area plans that are completed using the Guidebook.
The Guidebook states that “There are two Industrial urban form categories – Industrial General and Industrial Heavy. These areas primarily include a range of industrial uses with off-site impacts. Block patterns and site layouts will prioritize large vehicle and goods movement along public streets. Industrial areas are critical to supporting economic diversity and decisions regarding encroachment of other uses into these areas must be carefully considered to minimize impacts on the operational requirements of industrial areas.” (p. 60) The simplicity of this approach is aligned with the Consultant Team’s recommendations.
The Guidebook identifies the policies of each urban form category, and describes the purpose; land use(s); and applicable site, building, and landscape design polices.
Industrial General – Industrial General areas are characterized by a range of light and medium industrial uses and represent the city’s primary industrial land supply. These areas allow for a range of building sizes and industrial uses, some of which may include outdoor activities and storage. Industrial General areas are expected to support a safe pedestrian experience that improves connectivity to and within these sites and to public transit. These areas may have limited off-site impacts. (p. 62)
Industrial Heavy – Industrial Heavy areas are characterized by a range of heavy industrial uses. A significant portion of industrial activities occur outdoors, and may generate off-site impacts on neighbouring parcels such as noise, dust, vibration, and odour. These activities generally require larger sites with buildings that may integrate heavy machinery. (p. 64)

INDUSTRIAL AREA GROWTH STRATEGY CONSULTING REPORT – THE CITY OF CALGARY
65
Industrial Transition – Additional policy guidance only applies to the following urban form categories which transition to an industrial urban form category: Neighbourhood Flex-Industrial, Neighbourhood Connector-Industrial, Neighbourhood Local-Industrial, and Commercial Corridor-Industrial. (p. 27)
With the rise of increasingly larger industrial facilities, in effect a small community is formed among the employees. In response, there has been an observed desire for greater on-site amenities. Some employers are now implementing in-house features such as daycares, gyms/fitness studios, and prayer/meditation rooms, in order to attract and retain talent, and offer an appealing workplace environment. It is important that the Zoning Bylaw reflect these evolving needs for on-site amenities for workers, which could even be shared among neighbouring/nearby businesses.
Anticipate Change due to AVPA Review/Update
In many large, urban areas, undeveloped industrial lands face pressure for conversion to other uses – with industrial not viewed as the highest and best use, from a land economics perspective. Often, this is due to their relatively lower land cost (compared to commercial or residential lands). Sites that are occupied by industrial uses but which could be repurposed or demolished may face similar market pressures for land use conversion. This often applies to lands that are centrally located, and that are large (and therefore can potentially accommodate significant density, if redeveloped). In some instances, issues related to compatibility with adjacent uses may also be raised to justify such conversions.
Proposed changes to NEF contours would have the effect of permitting a broader range of land uses compared to the prevailing Airport Vicinity Protection Area (AVPA). This may mean that an employment use is no longer the highest and best use of these lands, and they may face land use conversion pressure. However, the loosening of development restrictions pertains to lands furthest from the airport (the lowest NEF range), and employment lands in proximity to the airport itself – which are particularly well-suited for industrial development – remain viable. City staff has identified that nearly 590 hectares of Industrial-designated lands would move from a more restrictive contour level to NEF 30 or below. While a significant portion of these lands are already developed, there are vacant lands to the north and west of the airport that may be more likely to be subject to conversion pressure.
RECOMMENDATIONS
With respect to lands within the current AVPA, those sites designated Industrial that would move to a lower NEF contour such that a broader range of non-employment land uses could be supported (e.g. residential) which are not contiguous to established industrial uses could be suited to land use conversion. This applies in particular to lands west of Deerfoot Trail NE/south of 96 Ave NE, as well as lands in the vicinity of Metis Trail NE/128 Ave NE. Lands to the southwest and south of the airport are largely built-up and integral to industrial parks in this area, and therefore do not merit consideration for conversion. The potential for conversion of Industrial-designated lands on the east side of the airport along Metis Trail will require a site-by-site assessment to properly manage the interface between existing employment and residential uses, and whether the proposed new use(s) are appropriate/desirable from a land use planning perspective. Industrial-designated lands located north of the airport are well suited to meet the city’s industrial needs, given airport proximity and good highway access – and in some instances, offering larger parcels of land.
Prevent the Incursion of Major Commercial and Institutional Uses in Industrial Areas
By count of parcels, of the total of almost 3,200 parcels identified within the Strategic Industrial Areas, 83% are industrial, 14% are commercial, and the remaining land uses account for a 3% share.

INDUSTRIAL AREA GROWTH STRATEGY CONSULTING REPORT – THE CITY OF CALGARY
66
By land area, industrial uses represent an 84% share of the total lands (3,591 ha), followed by commercial at a 12% share (491 ha), with the remaining land uses account for a 4% share (183 ha).
RECOMMENDATIONS
While some commercial uses serve as an amenity to workers in industrial parks/business parks/employment areas, major retail uses are primarily intended to serve the residential population. Such uses can be intrusive within industrial areas, which should be preserved with industrial operations as their core land use function. Similarly, institutional-type land uses are suited to mixed-use areas or campus-style settings, as opposed to industrial zones. While some established industrial areas may not conform to this objective due to the established pattern of land use, the planning of new industrial areas should adhere to these principles.
Encourage Intensification on Established Industrial Sites
The Consultant Team has analyzed The City’s occupied industrial land data set and identified that there are 579 properties on 1,208 hectares of land (22% share of total industrial property count) that have a site coverage of less than 20%. For comparison, the average industrial site coverage in Calgary is 40%.
Properties within this “<20% site coverage” cohort are of the most interest to this Industrial Area Growth Strategy Consulting Report, since these represent sites that may be underutilized, and therefore capable of absorbing additional density through intensification over time.
This site coverage analysis considered all sites in the existing built inventory, regardless of size; however, it is most useful to assess the capacity of larger sites to intensify. The Consultant Team has identified 160 existing industrial properties that meet the criteria of having less than 20% site coverage and which are also at least 2 hectares in size.
− If all of these sites were to intensify up to a 40% site coverage factor, then an additional 3.1 million m2 of floorspace would be created. This would reduce the requirement for up to 775 hectares of greenfield lands in the future (assuming 40% site coverage for new development). Of course, it is not reasonable to assume that all “underutilized” sites will intensify – but only a small share of intensification has the effect of lessening the extent of new greenfield industrial development over time (and the associated cost of extending municipal services).
RECOMMENDATIONS
City staff should be receptive of initiatives by existing industrial landowners to intensify their sites, whether through building an addition, or sub-dividing land in order to create a new development lot that could be built upon (“unlocking” land for new development). In order to incentivize such development, The City could consider reduced or waived development-related fees, expedited planning approvals, or other initiatives to spur intensification within established industrial areas. This would lessen the need for new greenfield development, take advantage of existing servicing, provide employment in proximity to labour, and contribute to sustainable growth management.
The Consultant Team’s work constituted a “desktop” analysis of occupied lands and site coverage. The identified list of 160 existing industrial properties that meet the criteria of having less than 20% site coverage and which are also at least 2 hectares in size could be examined in more detail to assess the potential for intensification – including contacting the property owner to inquire about their motivations and strategic objectives. This proactive work could spur action on the part of select property owners to pursue intensification, or consider a property disposition which might unlock the site’s development potential to another user. The City could leverage its own land holdings in any negotiations. Understanding whether these sites are owner-occupied or leased to a tenant(s) by a landlord is a potential first step to exploring their capacity to contribute to accommodating a portion of the city’s future industrial-type employment growth.

INDUSTRIAL AREA GROWTH STRATEGY CONSULTING REPORT – THE CITY OF CALGARY
67
8.6 Land Supply Monitoring Recommendations
RECOMMENDATIONS
Building upon in-place activities that are being undertaken by City staff, the following land supply monitoring by City staff is recommended:
Monitor industrial land absorption to identify vacant industrial land by geography, and by status of servicing.
− Note: Presently, the vacant industrial land inventory is evenly balanced between the Southeast and Northeast.
− Note: Calgary has a significant supply of serviced vacant industrial land, at nearly 900 hectares. There is also a considerable supply of partially-serviced lands – with varying timing to be brought to full servicing. Additionally, there are longer-term lands which are currently unserviced (i.e. “raw”).
Monitor lands within Future Urban Development Districts to ensure that an accurate representation of the extent of industrial lands supply is known.
− Note: Future Urban Development comprises a significant share of the overall vacant industrial land inventory (60% share).
Monitor the uptake of City-owned versus privately-owned lands to understand the influence of The City on the local industrial land market.
− Note: Privately-owned land (2,033 ha) accounts for two-thirds of the total vacant industrial land in Calgary, while City-owned lands (940 ha) account for a one-third share. The City, through its Real Estate & Development Services division, plays a key role in the local industrial land development marketplace.
Monitor the uptake of industrial land by Land Use District to understand the characteristics of land demand by type of use, and to consider rezoning as needed to re-balance available supply by LUD.
− Note: The current range of LUDs should provide considerable choice and site selection options for prospective users across the spectrum of industrial-type businesses that are seeking sites to expand, or to enter the Calgary market.
Monitor the uptake of industrial land by parcel size, in order to assess whether RE&DS should participate in the market by bringing additional “shovel-ready” lands to suit particular demands by lot size (to ensure a more balanced supply of available lands by parcel size) – particularly if the private ownership land market appears to be under-serving this demand.
− Note: At present, there would appear to be a significant number of vacant serviced industrial parcels to accommodate the needs of prospective occupiers across the full range of property sizes.
Monitor the status of servicing of “Partially Serviced” and “Unserviced” industrial lands in order to maintain an up-to-date inventory.
− Note: The Industrial Land Inventory Database compiled by the Consultant Team represents a “snapshot” in time. Future servicing that occurs will need to be taken into account in monitoring/updating the Industrial Land Inventory Database.

INDUSTRIAL AREA GROWTH STRATEGY CONSULTING REPORT – THE CITY OF CALGARY
68
8.7 Competitive Markets Assessment-Related Recommendations
Overview
One of the key objectives of this Industrial Area Growth Strategy Consulting Report is to evaluate how The City of Calgary is positioned for industrial land development relative to the Calgary Metropolitan Region. In particular, East Balzac within Rocky View County has emerged as a significant competitor to The City of Calgary with respect to attracting new industrial development.
While solutions to these issues requires a deep understanding of The City’s municipal finances, and is inherently political in nature, the following outlines the Consultant Team’s examination of the City of Calgary’s competitive position from a land development economics and occupancy cost perspective.
Property Tax Rates Comparison
The City of Calgary had the highest non-residential (industrial) mill rate in 2020, at 0.019407 (or a property tax bill of $19,407 per $1 million of assessed value).
− For comparison, Rocky View County – which surrounds the City of Calgary to the east, north, and west – had a mill rate that was 58% that of Calgary (resulting in a property tax bill of $11,265 per $1 million of assessed value).
CONCLUSION
Industrial occupiers within the City of Calgary face a significantly greater industrial property expense versus comparable facilities elsewhere across the Calgary Metropolitan Region. This is among the reasons that East Balzac has attracted considerable new industrial growth in recent years. If this disparity is not addressed, The City could see existing businesses vacate to other markets, and its share of overall new industrial activity will continue to be affected.
Off-Site Levies and Other Development-Related Charges/Fees Comparison
The Consultant Team prepared a comparison of off-site levies and other development-related charges/fees for a hypothetical industrial development within the City of Calgary versus the East Balzac area of Rocky View County. The following describes the key attributes of the hypothetical industrial building to be constructed: a 50,000 m2 building requiring 12.5 hectares of land (based on an assumed 40% site coverage).
CONCLUSION
The examination of off-site levies and other development-related costs reveals that an “apples-to-apples” comparison of a prospective industrial development located in the City of Calgary versus the East Balzac area within Rocky View County is a challenge. The two municipalities have differing approaches to recovering development-related costs. Many are on a land area basis; others are on a site-specific consumption basis (e.g. water/wastewater in RVC); land value influences some costs (e.g. excess land needed for stormwater management in RVC); and certain charges are imposed at a dramatically different rate, based on the disparity in municipal services provided (Calgary’s Community Services Charge versus RVC’s “voluntary recreation contribution”). Overall, however, it is apparent that the costs to develop an industrial building in East Balzac are less than the same facility locating in the City of Calgary.
Combined with lower average industrial land costs (Cushman & Wakefield estimates raw industrial land to be valued at $500,000 per acre [$1,235,000 per hectare] in East Balzac, compared to $700,000 per acre [$1,729,000 per hectare] in Calgary) – which are not directly controllable by the municipality – lower development-related levies and costs make East Balzac an appealing location for new industrial development. Additionally, its location just north of the City of Calgary allows businesses to draw upon Calgary’s labour pool.

INDUSTRIAL AREA GROWTH STRATEGY CONSULTING REPORT – THE CITY OF CALGARY
I
APPENDIX A – EMPLOYMENT FORECAST METHODOLOGY
Introduction
metroeconomics has combined years of experience and extensive modeling capabilities to provide clients with a range of consulting services in assessing the economic and demographic potential of virtually any economic region in Canada. The system includes detailed projections at the all-U.S. and all-Canada level, and allocations of the national trends to the states, provinces, and metropolitan areas that define each country. This note briefly defines our system.
U.S. Projections
The future of the U.S. economy is a key determinant of the future of the Canadian economy, due to the strong trade ties between the two nations. The U.S. projections begin with an age-cohort model of the total population, and assumptions about fertility rates, mortality rates, and annual net immigration. The resulting age and gender projections are turned into projections of the future labour force, assuming future labour market participation rates by age. The future potential labour force is translated into projections of future total employment which, in turn, is translated into future potential real GDP (Gross Domestic Product, or total economic output in constant dollar terms). Real total GDP is translated into projections by industry based on past trends in growth by industry relative to the overall economy.
Canadian Projections
The Canadian projections are driven by the above described expectations regarding overall real GDP growth in the U.S. Canadian projected total real GDP is turned into a projection for total employment based on assumptions regarding future labour productivity growth. Future employment growth drives a national age cohort model of the population, based on assumptions regarding future fertility and mortality rates.
Future national net in-migration is determined by the future labour market requirements of the country. If labour is domestically under-supplied, net in-migration increases to bring the labour market into equilibrium (considering likely future labour market participation rates by age and gender, and likely future unemployment rates). If labour is domestically over-supplied, net in-migration decreases to balance the labour market. This linkage of future migration flows to the needs of the labour market is especially important these days, as Canada faces the gradual retirement of the Baby Boom generation from now through to the mid-2030s.
Projected total GDP for Canada is translated into projections by industry based on past trends in growth by industry relative to the overall economy. National GDP by industry is translated into GDP by industry by province, based on expected future shares of industrial expansion by province. Future GDP by province is translated into future employment by province, which in turn informs future migration flows by province. Migration patterns to and from provinces are determined by links to detailed provincial age cohort models.
In metroeconomics’ Base Case projections, metropolitan area growth within provinces is allocated based on past and expected future shares of metro growth by province.
Detailed projections of GDP by industry, employment by industry and population by age and gender at the provincial and metro level, are developed using models informed by the projected national and provincial projections for real GDP and employment by industry.

INDUSTRIAL AREA GROWTH STRATEGY CONSULTING REPORT – THE CITY OF CALGARY
II
Customized Projections of Sub-Provincial Areas
Employment by industry in any given area can be decomposed into economic base (EB) jobs (those that drive the overall economy) and community base (CB) jobs (those that serve the local population). The population growth of an area typically depends on its potential for growth in economic base employment, while an area’s growth in community base employment depends on its population growth.
In recognition of this interdependence between population and employment growth, metroeconomics has developed a community-based projection system that takes account of the economic and demographic factors influencing an area’s growth potential. The system takes these factors into account as follows:
The economic base of the community is identified through the de-composition of local jobs on a place of work basis by industry into those that are economic base jobs and those that are community base jobs; this is achieved using a location quotient process (described below).
Economic base industries produce goods and services consumed primarily by businesses or people outside of the local community; these industries – also called export-based industries – produce agriculture, mining, or manufactured products for consumption elsewhere, or provide tourism or higher-order education/health care services to visitors/temporary residents.
The potential for growth of a local community’s economic base jobs is identified through assessing how many such jobs exist today, and how many might exist in the future, drawing on metroeconomics’ extensive Base Case forecasts of economic base industrial job trends nation-wide and province-wide.
An assessment is also made of the potential for residents to commute to jobs in nearby employment locations, drawing on existing patterns, and on metroeconomics’ Base Case forecasts of such jobs by sub-provincial area in those commuter destinations.
The potential for job growth within the local area and for job growth in nearby locations determines the potential for job growth among residents.
The metroeconomics system ties this resident job growth potential to the demographic side of the community; if potential job growth among residents exceeds the current supply of workers (based on an age and gender assessment of the current population, age specific rates of labour force participation, the level of unemployment, and the need to replace retiring workers), in-migration occurs; thus, job growth potential determines population growth potential, since each new job-holding resident typically brings along one or two dependents.
The system further considers the fact that each new resident increases the need for workers who service the local population – the community base jobs – and that these additional community base jobs, in turn, create the need for more workers, more residents, etc.
Employed-residents growth, in other words, drives the community’s net in-migration requirements which, along with standard assumptions regarding fertility and mortality rates, provide the parameters needed to develop local area population projections by age and gender.
Projected economic base jobs by industry are added to projected community base jobs by industry to determine the total number of jobs by place of work that will exist in the community in the decades ahead.
The Location Quotient procedure is carried out at the 2-digit NAICS level (about 20 industries) for a local area (e.g. region, CMA, municipality) as follows:
All jobs in agriculture and forestry, in mining and oil and gas extraction, and in manufacturing, are considered economic base jobs, as most of their production is consumed by businesses and people outside of the area.

INDUSTRIAL AREA GROWTH STRATEGY CONSULTING REPORT – THE CITY OF CALGARY
III
The number of jobs per 1,000 residents in the area in all other industries is compared to that ratio for the relevant province. Where the ratio in an industry in an area exceeds that of the province, it is assumed the “excess” jobs are providing services to people or businesses outside of the area. These excess jobs, therefore, are considered as export-based service jobs, and their output as exportable services.
metroeconomics turns the 2-digit employment projections of employment for each of the 20 industries into projections at the 4-digit NAICS level for each of 300 industries (industry groups) as follows:
The average annual growth rate of employment between 2011 and 2016 for each of the 300 industries is calculated based on Census of Canada data.
The annual growth rates are applied to each industry each year in the future to develop preliminary projections of employment in the area for each of the 300 industry groups. Extreme growth rates are constrained within a reasonable range (for example, no industry is likely to grow over the long term at a 10% annual rate).
The preliminary employment projections at the 4-digit level (300 industries) are summarized to the 2-digit level industry (20 industries).
Based on the preliminary 4-digit details, the components of each 2-digit industry are constrained to the 2-digit projected totals developed for the area using the Location Quotient-based projection procedure described above.
INDUSTRIAL AREA GROWTH STRATEGY CONSULTING REPORT – THE CITY OF CALGARY
IV
APPENDIX B – COMPETITIVE MARKETS ASSESSMENT – WESTERN CANADA AND PACIFIC NORTHWEST U.S.
Introduction
Understanding Calgary’s strengths and weaknesses relative to other markets allows The City to leverage its competitive advantages, and act to mitigate or eliminate factors which impede growth. The analysis in the following section explores how Calgary’s industrial building inventory, real estate market indicators, employment, and industry clusters compare to a number of other major markets across Western Canada and the Pacific Northwest United States. The comparative markets are as follows:
Vancouver CMA (Census Metropolitan Area – as per Statistics Canada)
Edmonton CMA
Saskatoon CMA
Regina CMA
Winnipeg CMA
Seattle-Tacoma-Bellevue MSA (Metropolitan Statistical Area – as per U.S. Census Bureau)
Portland-Vancouver-Hillsboro MSA
Boise MSA
Since data collection methodologies vary between Statistics Canada and the U.S. Census Bureau, not all data can be compared among the markets.
As discussed earlier in this report, there tends to be a consistent set of site selection criteria that are considered in location decision-making among industrial users. The include the following:
Real estate factors – geographic location; availability and cost of business premises, or cost of land and new building construction; and location of customers and suppliers.
− From the perspective of comparing Calgary to other Western Canadian and Pacific Northwest U.S. industrial markets, the relative one-time cost of land and new building construction is less of a consideration than it is when considering a location within a select industrial market (i.e. City of Calgary versus a neighbouring municipality), as the other site selection factors are fairly uniform within a selected market, versus broader variations that will occur in other metro areas. Geographic location itself – tied to the location of a company’s customers and suppliers – is a primary consideration when evaluating one metro area versus another. Real estate occupancy costs differ from market to market, and are examined below, along with inventory size, space availability, and other key real estate metrics.
Economic factors – availability of raw materials and intermediate goods (production inputs); labour force availability; labour cost; and government incentives.
− Labour varies from market to market, and the presence of industrial employment clusters is profiled below for the comparative Western Canadian markets.
Infrastructure factors – transportation; telecommunications; and utilities.
− Since all of the comparative industrial markets are metropolitan areas, suitable infrastructure is already in place to foster economic growth. From a site selection perspective, insufficient infrastructure is more of a concern when comparing smaller markets.
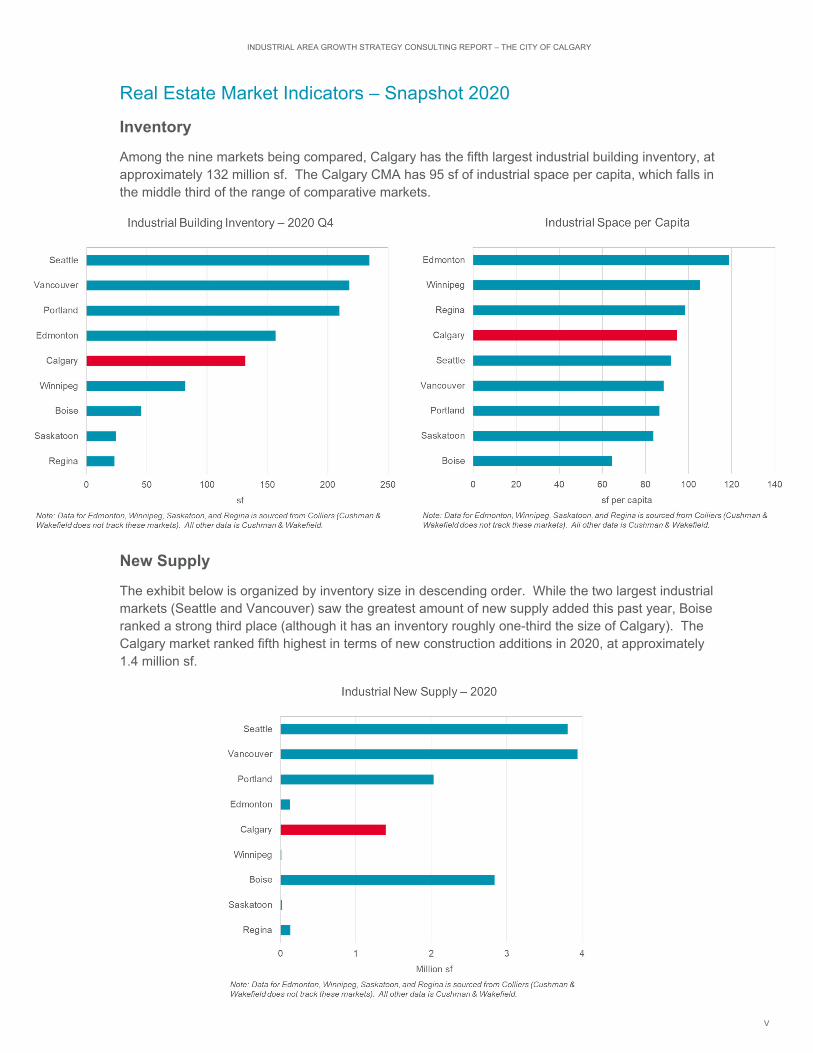
INDUSTRIAL AREA GROWTH STRATEGY CONSULTING REPORT – THE CITY OF CALGARY
V
Real Estate Market Indicators – Snapshot 2020
Inventory
Among the nine markets being compared, Calgary has the fifth largest industrial building inventory, at approximately 132 million sf. The Calgary CMA has 95 sf of industrial space per capita, which falls in the middle third of the range of comparative markets.
New Supply
The exhibit below is organized by inventory size in descending order. While the two largest industrial markets (Seattle and Vancouver) saw the greatest amount of new supply added this past year, Boise ranked a strong third place (although it has an inventory roughly one-third the size of Calgary). The Calgary market ranked fifth highest in terms of new construction additions in 2020, at approximately 1.4 million sf.

INDUSTRIAL AREA GROWTH STRATEGY CONSULTING REPORT – THE CITY OF CALGARY
VI
Vacancy Space and Vacancy Rate
Calgary had the highest year-end 2020 industrial vacancy rate among all the markets examined, at 7.7% (just ahead of Edmonton, at 7.6%). The effects of a prolonged slump in energy prices (and the associated decline in extraction activities) is evident in the performance of Alberta’s industrial markets. Calgary currently has over 10 million sf of vacant industrial space.
Rental Rate
Prevailing net rental rates in Calgary rank second lowest among the nine comparative markets. At around $9.10 psf, Calgary places ahead of just Winnipeg ($7.65 psf) in terms of average asking net rental rate at year-end 2020. Other markets examined range from $0.60 psf to over $4.00 psf more expensive compared to industrial space in Calgary.

INDUSTRIAL AREA GROWTH STRATEGY CONSULTING REPORT – THE CITY OF CALGARY
VII
Conclusions
For industrial occupiers seeking space (new premises, or potentially renewing an existing lease), conditions are currently favourable in the Calgary market compared to the other metro areas that have been analyzed. Calgary’s vacancy rate is the highest among the nine comparative markets, and its average asking net rental rate ranks second lowest (behind only Winnipeg). For comparison, while Vancouver’s industrial inventory is two-thirds larger than Calgary’s, it has one-third the amount of industrial vacant space – meaning there are far fewer site selection options for prospective users.
Employment
Comparison of Total Employment and Industrial-Type Employment
Among the comparative markets in Western Canada and the Pacific Northwest U.S., the Calgary CMA ranks fourth largest in terms of total employment, based upon 2016 Census data. Total employment by place of work was approximately 640,000 jobs in 2016.
In terms of industrial-type employment as a share of total employment, the Calgary CMA ranked third among the Canadian markets (analysis of the U.S. comparative markets is not possible, as detailed employment data by industry is compiled differently by Statistics Canada and the U.S. Census Bureau). The Calgary CMA had approximately 70,800 industrial-type jobs in 2016, representing a roughly 11% share of total employment. Notably, this share was the lowest among the Western Canadian comparative markets, which ranged from roughly 11% (Calgary CMA) to 15.5% (Winnipeg CMA). This is due to the presence of a sizable office market – particularly compared to the other CMAs examined here – which accounts for a significant share of overall employment in Calgary.
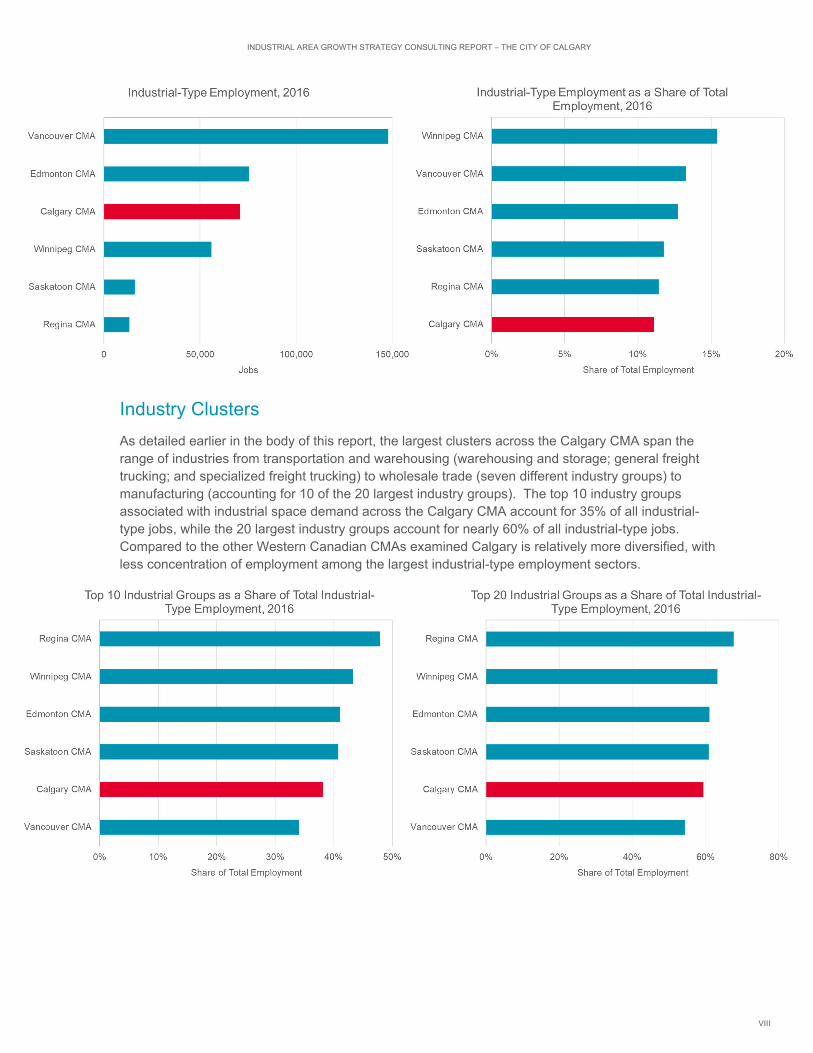
INDUSTRIAL AREA GROWTH STRATEGY CONSULTING REPORT – THE CITY OF CALGARY
VIII
Industry Clusters
As detailed earlier in the body of this report, the largest clusters across the Calgary CMA span the range of industries from transportation and warehousing (warehousing and storage; general freight trucking; and specialized freight trucking) to wholesale trade (seven different industry groups) to manufacturing (accounting for 10 of the 20 largest industry groups). The top 10 industry groups associated with industrial space demand across the Calgary CMA account for 35% of all industrial-type jobs, while the 20 largest industry groups account for nearly 60% of all industrial-type jobs. Compared to the other Western Canadian CMAs examined Calgary is relatively more diversified, with less concentration of employment among the largest industrial-type employment sectors.

INDUSTRIAL AREA GROWTH STRATEGY CONSULTING REPORT – THE CITY OF CALGARY
IX
Interestingly, the single largest industrial-type employment industry group is different in each of the comparative Western Canadian CMAs. The Calgary CMA’s largest industrial-type employment category is warehousing and storage, which represents a 5.8% share of overall industrial-type employment; this compares to a range of 6.3% to 8.5% for the top industry group in the other comparative Western Canadian CMAs. This further illustrates the breadth of industrial-type employment across the Calgary CMA.
TOP INDUSTRIAL-TYPE EMPLOYMENT INDUSTRY GROUP IN EACH CMA
CMA Category Employment (2016)
Share of Industrial-Type Employment
(2016)
Vancouver Food merchant wholesalers 9,295 6.3%
Edmonton Construction, forestry, mining, and industrial machinery, equipment and supplies merchant wholesalers
6,090 8.1%
Calgary Warehousing and storage 4,130 5.8%
Saskatoon Meat product manufacturing 1,110 6.9%
Regina Petroleum and coal product manufacturing 1,130 8.5%
Winnipeg General freight trucking 4,265 7.6%
The exhibit below identifies the 20 largest industry groups in the Calgary CMA in terms of industrial-type employment (the ten largest are highlighted), along with the ranking of those same industry groups across the comparative Western Canadian CMAs.
The following are some notable observations that can be drawn from this analysis:
Warehousing and storage is the Calgary CMA’s top industrial-type employment group, and ranks within the top six in Vancouver (3rd highest), Regina (4th), and Edmonton (6th). It is relatively less prominent as an employment category in Saskatoon (14th highest ranked) and Winnipeg (15th).
General freight trucking is among the top three industry groups in all comparative Western Canadian CMAs.
The other industry groups in the Calgary CMA’s top five are also prominent employment generators in the comparative municipalities (generally ranked within the top 5-10).
In examining the prevalence of the Calgary CMA’s top 10 and top 20 industrial-type employment groups compared to other Western Canadian CMAs, there is quite a bit of similarity to Vancouver, Edmonton, and Winnipeg (the larger metropolitan areas), while Saskatoon and Regina show a greater variance in the types of industry groups that are among the largest employers.

INDUSTRIAL AREA GROWTH STRATEGY CONSULTING REPORT – THE CITY OF CALGARY
X
TOP 10 INDUSTRIAL-TYPE EMPLOYMENT INDUSTRY GROUPS – RANKED
Category Cal
gar
y C
MA
Van
cou
ver
CM
A
Ed
mo
nto
n C
MA
Sas
kat
oo
n C
MA
Reg
ina
CM
A
Win
nip
eg C
MA
Warehousing and storage 1 3 6 14 4 15
General freight trucking 2 2 2 2 3 1
Construction, forestry, mining, and industrial machinery, equipment and supplies merchant wholesalers
3 8 1 3 2 9
Food merchant wholesalers 4 1 11 4 5 7
Lumber, millwork, hardware and other building supplies merchant wholesalers 5 4 8 7 10 14
Petroleum and petroleum products merchant wholesalers 6 90 21 22 39 68
Specialized freight trucking 7 18 3 5 9 10
Architectural and structural metals manufacturing 8 11 4 13 16 13
Printing and related support activities 9 7 14 22 21 5
Other machinery, equipment and supplies merchant wholesalers 10 12 7 17 13 19
Petroleum and coal product manufacturing 11 84 5 72 1 92
Computer and communications equipment and supplies merchant wholesalers 12 17 24 30 24 25
Electrical, plumbing, heating and air-conditioning equipment and supplies merchant wholesalers
13 15 13 8 12 20
Bakeries and tortilla manufacturing 14 5 16 38 17 18
Household and institutional furniture and kitchen cabinet manufacturing 15 9 31 10 26 3
Plastic product manufacturing 16 14 10 28 28 4
Other miscellaneous manufacturing 17 10 15 16 19 12
Other general-purpose machinery manufacturing 18 37 26 43 49 33
Meat product manufacturing 19 13 19 1 41 6
Navigational, measuring, medical and control instruments manufacturing 20 28 39 47 61 49
How many of Calgary CMA’s top 10 industry groups are in the respective CMA’s top 20? - 9 9 8 7 8
How many of Calgary CMA’s top 20 industry groups are in the respective CMA’s top 20? - 16 15 12 12 15
Conclusions
The comparative industrial markets across Western Canada all exhibit uniqueness in some aspects of their industrial employment clusters – for instance, all have a different #1 ranked industry from an industrial-type employment perspective. Overall, the larger metropolitan areas (Vancouver, Calgary, Edmonton, and Winnipeg) generate employment across a fairly similar scope of industry groups, while the smaller metros (Saskatoon and Regina) exhibit more variance. To different degrees, and varying among the industry groups, all of these comparative markets represent a competitive threat to the Calgary industrial market. Overall, it appears that the Edmonton CMA most closely reflects the range of industry clusters that are present in the Calgary CMA, as well as their relative contribution to industrial-type employment within the metro area.
INDUSTRIAL AREA GROWTH STRATEGY CONSULTING REPORT – THE CITY OF CALGARY
XI
Comparative Analysis Conclusions
The preceding examination that explores the Calgary CMA in the context of comparative markets reveals that there are certain aspects which are similar across most markets, but that all metro areas have defining elements of their industrial base. The broad-based appeal of Calgary as a location for industrial activities is evident in the diversity of the industrial-type employment clusters that call the city home. While Calgary’s industrial market has been impacted by energy prices and the COVID-19 pandemic-induced recession, future anticipated economic growth will see vacancy levels decline and underpin rental rates once again. The new industrial pipeline for the Calgary industrial market has remained healthy, while not introducing excess/speculative new supply to the market.
As stated earlier in this report, the present supply of planned industrial lands in Calgary appears capable of meeting the site selection requirements across a range of industry groups, and there are no apparent obstacles from a land supply perspective to enabling growth and incubating new opportunities that are not already present in the local market. The city’s land supply itself is a competitive advantage that can be leveraged to foster economic development. In response to industry trends – and together with the recommended refinements to planning policy to enhance economic development and monitor land supply – The City can support its industrial market to generate opportunities in industrial areas, capture the economic sectors and industries that The City is best positioned to attract, and enable growth.