industrial energy efficiency in developing countries: a
TRANSCRIPT

UNITED NATIONS INDUSTRIAL DEVELOPMENT ORGANIZATION
w o r k i n g p a p e r 0 3 /20 1 1
Industrial energy efficiency in developing countries: A background note


UNITED NATIONS INDUSTRIAL DEVELOPMENT ORGANIZATIONVienna, 2011
DEVELOPMENT POLICY, STATISTICS AND RESEARCH BRANCHWORKING PAPER 03/2011
Industrial energy efficiency in developing countries:
A background note
Mallory ComptonOverseas Development Institute

Acknowledgements This working paper was prepared by Mallory Compton, Overseas Development Institute, as background material for the UNIDO Industrial Development Report 2011, under the supervision of Ludovico Alcorta, Director, Development Policy, Statistics and Research Branch, UNIDO.
The designations employed, descriptions and classifications of countries, and the presentation of the material in this report do not imply the expression of any opinion whatsoever on the part of the Secretariat of the United Nations Industrial Development Organization (UNIDO) concerning the legal status of any country, territory, city or area or of its authorities, or concerning the delimitation of its frontiers or boundaries, or its economic system or degree of development. The views expressed in this paper do not necessarily reflect the views of the Secretariat of the UNIDO. The responsibility for opinions expressed rests solely with the authors, and publication does not constitute an endorsement by UNIDO. Although great care has been taken to maintain the accuracy of information herein, neither UNIDO nor its member States assume any responsibility for consequences which may arise from the use of the material. Terms such as “developed”, “industrialized” and “developing” are intended for statistical convenience and do not necessarily express a judgment. Any indication of, or reference to, a country, institution or other legal entity does not constitute an endorsement. Information contained herein may be freely quoted or reprinted but acknowledgement is requested. This report has been produced without formal United Nations editing.
This document reflects work in progress and, as such, has been edited neither in language nor in style. Its distribution is limited for the purposes of eliciting comments and reviews only.

iii
Table of contents
Executive summary....................................................................................................................... v
1 Introduction .......................................................................................................................... 1
2 Definitions, methods and trends ........................................................................................... 2
3 Causal effects of industrial energy efficiency on economic growth – benefits
of industrial energy efficiency ............................................................................................. 6
4 Barriers to entry of energy efficient technologies in industry ............................................ 13
5 Conclusions ........................................................................................................................ 17
References................................................................................................................................... 18
Appendix..................................................................................................................................... 22
iv
List of figures
Figure 1 Energy intensity of industry ...................................................................................... 4
Figure 2 Primary energy intensity by sector (1990 and 2006)................................................. 5
Figure 3 Energy efficiency in Africa, as a region.................................................................... 5
Figure 4 Trends in final energy intensity and GDP per capita (1990-2006)............................ 6
Figure 5 Barriers to investment and policy solutions ............................................................ 16
List of boxes
Box 1 What is energy productivity?.................................................................................... 3
Box 2 Cost effectiveness of general energy efficiency measures ..................................... 13
Box 3 Generalized model for developing new energy efficiency
investment delivery mechanisms in developing countries...................................... 15
List of tables
Table 1 Direct firm-level benefits of increased industrial energy-use efficiency .................. 9
Table 2 Indirect benefits of increased industrial energy-use efficiency
and increased productivity....................................................................................... 11
Table 3 Barriers to investment in efficient technologies in relevant industries
in developing countries........................................................................................... 14

v
Executive summary
Improved industrial energy efficiency has many potential benefits, yet an optimal level of
investment in efficient technologies is not achieved due to a variety of barriers. This report
provides a literature review on this particular issue. We first provide an overview of various
definitions, methods and current trends in industrial energy efficiency worldwide. We then
discuss the benefits of energy efficiency through the various linkages between energy efficiency
and productivity at the firm level, and between energy efficiency and growth at the macro level.
We also summarize the literature on the barriers to investment in industrial energy efficiency.
The appendix contains detailed findings and facts.
Though there are several definitions of energy efficiency measures, each with its respective
strengths and weaknesses, most studies use a measure of energy intensity or the inverse, energy
productivity.
Despite the clear benefits in theory, there is no clear consensus on the evidence linking energy
efficiency and macroeconomic growth. There is evidence of a link between efficiency and firm-
level productivity in the developed world, but little evidence exists from developing countries.
Even in the developed world, where data are widely available, there is a lack of “both time
series and plant level data on the appropriate mix of inputs by which we might more accurately
assess the productivity impacts” (Worrell et al 2001:15). Many reports assert linkages between
energy efficiency and benefits without clear evidence, thus clouding the discussion with
uncertainty and ambiguity. There is also a lack of information on the cost effectiveness of
industrial efficiency investments in developing countries.
Some of the most often cited barriers to investment in industrial energy efficiency, particularly
in developing countries, include informational barriers on available benefits, for example,
financial barriers such as an absence of credit, high risk of new technology, high transaction
costs, shortage of sufficiently trained staff to implement new technologies and an absence of
adequate policy and contracting institutions at the national level to encourage investment.

vi
One constraining factor in this field of study is the lack of firm-level data from developing
countries. The most relevant studies of developing countries on this subject use aggregated
numbers; only a few scattered case-studies deal with micro-level data. There is a plethora of
literature on potential benefits of improved productivity, but there seems to be no empirical or
theoretical consensus on magnitude of benefit or mechanism for realizing them. The
contradictions in empirical studies indicate the variation of conditions across countries that the
relationship between productivity and economic growth is heterogeneous.

1
1 Introduction
Demand for energy is rising worldwide at an unsustainable rate. The IEA’s 2008 World Energy
Outlook reference scenario estimates that world primary energy demand will grow 1.6 percent
per year on average between 2006 and 2030 to an overall increase of 45 percent. The majority
of this growth will take place in developing countries, 87 percent of the projected increase in
demand will come from non-OECD countries; 50 percent of total demand comes from China
and India alone (IEA, 2008).
In terms of the global potential for increased energy productivity, the McKinsey Global
Institute determines that 65 percent of all available positive return opportunities for investment
are located in developing regions (Farrell and Remes, 2009:2). An estimated investment of US$
90 billion in the next twelve years could save these developing countries US$600 billion by
2020 in energy savings per year (Farrell and Remes, 2009:2). This investment of US$ 90 billion
is projected to be only half of the required investment to keep up with energy demand growth
without improved efficiency measures (Farrell and Remes, 2009:2). Not only in these
developing countries, but at the global level as well, industrial efficiency improvements to
produce more economic output with less energy input is essential for reasons of energy supply
security, economic competitiveness through improved industry profitability, improvement in
livelihoods and environmental sustainability (Taylor et al, 2008:3).
Achieving greater economic output per unit of energy input can either be achieved from
changes in economic structure or through technical energy efficiency gains. This report focuses
on the benefits and barriers to technical energy efficiency gains, specifically in industry. Of the
total global potential for efficiency gains in industrial sectors, 80 percent of the opportunities lie
in developing countries (Farrell et al, 2008:13). This large potential is attributable to a number
of factors, including “the larger scope to increase energy productivity in low-efficiency legacy
assets in a number of regions […] and the fact that lower labor costs reduce capital
requirements for many initiatives and make a broader set of actions on energy productivity
economically viable” (Farrell et al 2008:13).
Improved industrial energy efficiency has many potential benefits, yet optimal investment in
efficient technologies is not taking place due to a variety of obstacles. This report seeks to
provide an overview and literature review to contribute to the discussion and research. The
following section is an overview of various definitions, methods and current trends in industrial
energy efficiency worldwide. Section three is a literature review of the suggested benefits

2
through the various linkages between energy efficiency and productivity at the firm level and
between energy efficiency and growth at the macro level. Section four summarizes cited
barriers to industrial energy efficiency. The extended Appendix is a summation of various
relevant findings and facts from literature which are too broadly defined for inclusion in the
report. The sections of the appendix correspond to the topics covered in Sections 2 through 4 of
this report.
2 Definitions, methods and trends
Though there are several definitions of energy efficiency measures, “energy intensity measures
are often used to measure energy efficiency and its change over time […]. Energy-intensity
measures are at best a rough surrogate for energy efficiency. This is because energy intensity
may mask structural and behavioural changes that do not represent “true” efficiency
improvements” (EIA, 2003). Energy intensity is simply a ratio of energy input to industrial
output; an economic-thermodynamic type of efficiency measure. “In comparison to the
application of thermal efficiency measurement, indices of energy consumption can be used to
assess and compare energy performance for a broader set of objects: processes, factories,
companies, and even countries” (Tanaka, 2008a:7). Most studies use a measure of energy
intensity, or the inverse, energy productivity.
Industrial output can be measured using some sort of common physical unit at lower levels of
aggregation, but will necessarily be measured in economic value taking account of purchasing
power parity at economic or national levels of aggregation. It is well noted in the literature that
even at the 2-digit SIC level of industrial classification, common physical output measures are
not possible. There are a number of ways to measure output of industry but “it seems that value
of production is the most desirable value-based output measure for use in an indicator of energy
intensity” (Freeman, Niefer, & Roop, 1997:713). Differences between intensity measures using
volume and those using value-based output may be attributable to measurement errors in price
indexes, errors in industry specialization and coverage, or industry redefinitions (Freeman,
Niefer, & Roop, 1997). Additional methodological issues (valuation & value judgements,
energy quality problems, boundary problem, joint production problem, technical or gross
energy efficiency) are summarized in Patterson (1993), and are not unique to energy intensity as
a measure of efficiency.

3
Box 1 What is energy productivity?
Source: Farrell et al, 2008:12
If dealing with economic or industry-wide data, it is also possible to use a decomposition
method. Applying the Laspeyres factorial decomposition method, energy use is decomposed
into an activity effect, structural effect and an intensity effect; each is measured by keeping the
other two constant (EIA, 2003). The commonly preferred index, however, is the Divisia index
(Liu & Ang, 2007). This approach may be used to decompose time trends into different factors,
such as structural factors and intensity, to measure energy savings over time, and uses time
trend data (EIA, 2003). “Index decomposition analysis is the most rigorous technique currently
available to address the issues of energy efficiency performance and to track its trend at the
industry-wise or economy-wide level” (Liu & Ang, 2007:612). An improvement on the Divisia
decomposition method is developed in Bor (2008).

4
Industrial Energy Efficiency Trends Over time
Figure 1 Energy intensity of industry
Source: WEC, 2008:26
The chart above demonstrates the trend in industrial energy intensity over the last two and a
half decades (WEC, 2008). It is clear that the trends differ between the various regions. The
global trend reveals decreasing energy intensity, which is to say an improvement in efficiency.
Some regions, however, such as Latin America, Africa and the Middle East demonstrate a rise
in intensity.
This second chart (below) shows that although total primary energy intensity is decreasing in
almost all regions, energy intensity is static or increased between 1990 and 2006 in others. In
developing countries, residential energy savings drive the reductions in aggregate energy
intensity decline, largely by a substitution of modern fuel for traditional ones.

5
Figure 2 Primary energy intensity by sector (1990 and 2006)
Source: WEC, 2008:22
Source: http://www.worldenergy.org/documents/afriq_1.pdf
“Industry is the main sector driving energy intensity reduction in industrialized countries. In
developing countries and regions, on the other hand, households are the main drivers. In China
and the CIS, energy productivity improvements were almost equally driven by industry, energy
conversion and households” (WEC, 2008:95). “If what has happened in industrial countries is
indicative of future developments of the developing countries, in particular the high income
ones, then it would be expected that the aggregate energy intensities of these countries will
Figure 3 Energy Efficiency in Africa, as a region

6
likely stabilize and/or decline as a result of the impacts from energy intensity change” (Liu &
Ang, 2007:631). There is some evidence of convergence in energy productivity growth levels
across developed and developing countries, which is conditional on country specific factors
(Miketa & Mulder, 2005).
Though representing total economy energy intensity and limited in its representation of
countries, the following chart is useful in identifying aggregate trends:
Figure 4 Trends in final energy intensity and GDP per capita (1990-2006)
Source: WEC, 2008:23
3 Causal effects of industrial energy efficiency on economic growth – benefits of industrial energy efficiency
The direction of causality in the relationship between economic growth and energy use is
unclear. Theoretically, neo-classical and endogenous theories both suggest that energy use and
efficiency are drivers of economic growth. Though there are many studies that find a direct
relationship between productivity and energy efficiency in the industrialized world (see Worrell
et al 2001), evidence from the developing world remains inconclusive. Few disaggregated
studies have been conducted on this issue and the studies using data aggregated at the national
or economic level indicate mixed findings. As quoted in Mishra et al (2009:212), Mehrara
(2007:2940) states:

7
[W]hen it comes to whether energy use is a result of, or a perquisite for,
economic growth, there are no clear trends in the literature. Depending on the
methodology, used, and country and time period studied, the direction of
causality between energy consumption and economic variables has remained
empirically elusive and controversial.
Further complicating the relationship is the extent to which economic growth and energy
consumption can theoretically be decoupled, a question raised by ecological economists who
argue thermodynamic laws limit such division. Below is a brief review of the various theories
on the relationship between energy consumption, energy efficiency and economic growth,
followed by a summary of a select list of empirical studies, and finally, a review of the main
arguments and claims made by various institutions on the matter.
Theory
By incorporating energy end-use efficiency gains into a Cobb-Douglas production function,
Wei (2007) theorizes about short-term and long-term effects of increased energy efficiency
beginning with the production function specification:
(eq. 1)
Here, X is defined as gross output, K and L are specifications of capital stock and labour
supply, respectively, and E is some measure of energy use, all of which are specified by input
factor x. τ is a technological parameter, the increase of which indicates an improvement in
energy efficiency. In the short term, energy use efficiency is found to lower the cost of non-
energy and increase the output of non-energy goods. A 100 percent rebound effect is evident
such that in the short term, energy efficiency gains have no effect on absolute energy use. In the
long term, the impact on non-energy output of energy end use efficiency is positive. The long-
term impact of energy use efficiency on total energy use is lower than the short-term impact.
Wei also finds that energy use efficiency will increase real energy price in the long term.
Van Zon and Yetkiner modify the Romer model to include energy consumption of
intermediates and to make them heterogeneous due to endogenous energy-saving technical
change (2003). They find that economic growth rate positively depends on the rate of embodied
energy-saving technical change, and that it also depends negatively on the rate of growth of real

8
energy prices, implying that continuously rising real energy prices will tend to slow growth.
Embodied technical change includes improvements in energy efficiency, thus positively linking
improvements in energy efficiency to economic growth. They conclude that in an environment
of rising energy prices, recycling energy tax proceeds in the form of R&D is necessary for both
energy efficiency growth and output growth.
Sorrell (2009) highlights the conflict between those known as “conventional economists” and as
“ecological economists” with regard to the effect of energy on growth. “The conventional
wisdom (as represented by both neoclassical and ‘endogenous’ growth theory) is that increases
in energy inputs play a relatively minor role in economic growth, largely because energy
accounts for a relatively small share of total costs” (Sorrell 2009:1460). This view has been
contested by ecological economists, who argue instead that the “increased availability of ‘high
quality’ energy inputs has been the primary driver of economic growth over the last two
centuries” (Sorrell 2009:1460). Ockwell further discusses this divide between conventional and
ecological economics: “[…] for ecological economists, energy is a fundamental factor enabling
economic production. Some commentators even argue that energy availability actually drives
economic growth, as opposed to economic growth resulting in increased energy use (e.g.
Cleveland et al., 1984). From this perspective, the possibility of decoupling energy use from
economic growth seems more limited” (2008:4601). A challenge to the resolution of this debate
is the absence of empirical consensus. “Sufficient empirical evidence does not yet exist to
provide conclusive support for the claims of either the ecological or neo-classical schools of
thought. Breaking down the evidence that does exist suggests that observed improvements in
GDP/energy use ratios may be better explained by shifts towards higher quality fuels than by
improvements in the energy efficiency of technologies” (Ockwell 2008:4604).
Empirical
Many studies on the link between aggregated energy efficiency/energy use and economic
growth in the developing world have mixed results and unclear findings (Akinlo 2008; Mishra
et al 2009; Lee and Chang 2008). While many studies from developed countries exist, only a
handful of case studies in the developing world have attempted to identify the link between firm
level energy use efficiency and productivity.
Table 1 below represents the direct firm-level benefits of greater energy use efficiency in
industry. The list is based on a survey of 77 case studies of manufacturing firms from six
OECD countries. When all of the savings (energy and productivity/non-energy) are

9
incorporated, the average payback period for efficiency improvement projects is 1.9 years for
this sample of case studies. When calculating energy savings only, the payback period is 4.2
years. Some benefits such as those involving valuation of emissions reductions and the work
environment are subject to some measurement error. It must be noted that the results of these
case studies are derived from developed economies’ industrial sectors.
Table 1 Direct firm-level benefits of increased industrial energy use efficiency
Waste Emissions Operation and Maintenance
− Use of waste fuels, heat, gas
− Reduced product waste
− Reduced waste water
− Reduced hazardous waste
− Materials reduction
− Reduced dust emissions
− Reduced CO, CO2, NOx, SOx emissions
− Reduced need for engineering controls
− Lowered cooling requirements
− Increased facility reliability
− Reduced wear and tear on equipment/machinery
− Reductions in labour requirements
Production Working Environment Other
− Increased product output/yields
− Improved equipment performance
− Shorter process cycle times
− Improved product quality/parity
− Increased reliability in production
− Reduced need for personal protective equipment
− Improved lighting
− Reduced noise levels
− Improved temperature control
− Improved air quality
− Decreased liability
− Improved public image
− Delayed or reducing capital expenditures
− Additional space
− Improve worker morale
Source: Worrell et al, 2001:2
A study of a US glass manufacturing subsector found support for a strong statistical link
between energy intensity and productivity and of the resultant non-energy benefits (Boyd
2000). However, they find that the effects are industry specific. Whether or not the relationship
is proportional depends on the industry subsector.
Adenikinju and Alaba (1999) sought to quantify the link between energy use and productivity
performance in the Nigerian manufacturing sector. Their data covers 1970–1990 and was
collected and provided by the Federal Office of Statistics; most variables are defined at the firm
level with the exception of energy consumption which is defined at the industry level. They find
a positive relationship between total factor productivity growth and energy consumption for

10
most industries. Heavily subsidized energy prices encouraged industry over this period to
depend on cheap energy for growth; industry therefore grew to be reliant on old and energy-
inefficient technologies. Increasing energy prices would likely encourage energy efficiency
investments, though a drastic increase in prices over a short period of time would risk mass firm
shutdowns.
A survey of small-scale bricks and foundry clusters in India found a negative relationship
between energy intensities and factor productivities. Using data created and collected for this
study, Subrahmanya (2006) finds that those enterprises which utilize energy more productively
are likely to use labour and capital more productively as well, although it may not lead to
greater value addition in the process. The analysis reveals that for energy intensive clusters,
greater energy use efficiency enables greater economization of production costs and the
achievement of higher productivities and greater competitiveness. Basically, the competiveness
of small enterprises in energy-intensive industries can be enhanced by improving their energy
efficiency through reductions in energy intensity.
The following chart categorizes some of the most often cited benefits of improved energy
efficiency. These are empirical claims published in a World Bank study, a McKinsey Global
Institute report and other various research reports; these cited benefits are empirical, and are not
solely based on theoretical grounds. Authors sometimes establish links between efficiency and
benefit without describing the mechanism, leaving the connection less clear; these more
ambiguous linkages are indicated by an asterisk in the table. A notable difference between Table
1 and 2 is the claim by Worrell et al. (2001) that greater energy efficiency will lead to
reductions in labour requirements at the firm level, but some sources claim (as in Table 2) that
overall employment would increase due to increased productivity and resulting growth.

11
Table 2 Indirect benefits of increased industrial energy use efficiency and increased productivity
Benefit Source Justification More economic output without requiring additional, possibly constrained, energy supply – firm and national level benefit
Taylor et al (2008), Semboya (1994), UNDP (2006), McKane et al (2007), Adenikinju & Alaba (1999); Boyd & Pang (2000)
This is particularly important in regions where electricity and energy supply are constrained, such as in many African and Asian countries. Not only will greater output be feasible without increasing energy demand, but less investment will be necessary in energy production capacity (WEC 2008:9).
Lower production/energy costs – at the firm level
UNDP-Kenya (2006), Farrell and Remes (2009), Semboya (1994), WEC (2008), McKane et al. (2007), Subrahmanya (2006)
“Costs vary among technologies and countries where energy efficiency measures are implemented, but often are only one-quarter to one-half the comparable costs of acquiring additional energy supply” (Taylor et al. 2008:27).
Economic competitiveness (through lower prices) – national and firm level benefit
Taylor et al. (2008), UNDP-Kenya (2006), Semboya (1994), WEC (2008), Surahmanya (2006)
At the firm level, higher efficiency will improve competitiveness via lower costs.
Creates jobs (indirectly) *
UNDP-Kenya (2006), IEA (2009),
By increasing use of high-tech efficient machinery, high-skill technicians will be in more demand. Also, by improving competitiveness, presumably the firm will grow and be able to employ more workers.
Improvement in livelihoods/ reduce poverty*
Taylor et al (2008), UNDP-Kenya (2006), WEC (2008)
Poverty is reduced by an increase in jobs.
Energy supply/price security and reduced uncertainty*
Taylor et al (2008), UNDP-Kenya (2006), World Bank (2006), IEA (2009), WEC (2008), McKane et al (2007), Farrell and Remes (2009)
Particularly for oil importing countries (WEC 2008:105).
Environmental sustainability
Taylor et al (2008), World Bank (2006), IEA (2009), UNDP (2006), WEC (2008) – extends availability of fossil resources
“Energy efficiency is favored in environmental improvement strategies because it reduces the need for energy development, transportation and distribution, onsite use, and all the associated environmental impacts” (Taylor et al. 2008:27)
Reduce import bill (nationally)
UNDP-Kenya (2006), Semboya (1994), UNDP (2000); Adenikinju & Alaba (1999); and improve balance of trade: UNDP-Kenya (2006), Semboya (1994), WEC (2008), Adenikinju & Alaba (1999)
”[E]nergy imports are replaced (in many countries) by domestically produced energy-efficient products and (energy) services” (UNDP 2000:185). Greater industrial outputs can increase exports.
12
Much effort has been devoted to understanding the existence and scope of potential “rebound”
effects of the Jevon’s/Khazzom-Brooks variety, which asserts that efficiency improvements
may not necessarily result in proportional decreases in total energy use. Sorrell and
Dimitropoulos (2008) find that direct rebound effects may be larger for producers (industry)
than for households. They also find that the effects may be larger in developing countries.
Ockwell (2008) also asserts that rebound effects (generally not specific to industry) will be
greater in developing countries. Direct rebound effects are defined as an increase in
consumption of an energy input as the price of that input decreases with increased efficiency.
Madlener et al. conclude their summary of debates on the rebound effect by determining that
“increases in energy efficiency are no panacea for either energy conservation or economic
growth and welfare” (2009:9).
Overall, there is no clear consensus on the evidence and theory linking aggregated growth and
energy efficiency. There is evidence of a link between efficiency and firm-level productivity in
the developed world, but little evidence from developing countries exists. Even in the developed
world, where data is much more available, there is a lack of “both time series and plant level
data on the appropriate mix of inputs by which we might more accurately assess the
productivity impacts” (Worrell et al 2001:15). Many reports assert linkages between energy
efficiency and benefits without clear evidence, thus clouding the discussion with uncertainty
and ambiguity. A clear idea of the cost effectiveness of industrial efficiency investments for the
developing world are lacking. The box below comes from a World Bank report and provides
helpful insights on the topic, though not specific to developing countries or industrial
investments.

13
Box 2 Cost effectiveness of general energy efficiency measures
Source: Shi 2007 in Taylor et al 2008:29
4 Barriers to entry of energy efficient technologies in industry
After reviewing the expected benefits of improved energy efficiency within industry, the
problem is now to overcome the many barriers preventing optimal investment. The chart below
documents some commonly cited barriers to entry of energy efficient technologies in industry,
particularly in developing countries. Some of the most often cited barriers include informational
barriers such as lack of knowledge of available benefits, financial barriers in the way of an
absence of credit, shortage of sufficiently trained staff to implement new technologies, and a
lack of adequate policy at the national level to encourage investments. This list may not be
comprehensive of all the literature, it is simply a starting point to understand the most
commonly identified barriers; the broader classifications in the left column are those suggested
by Praetorius & Bleyl (2006).

14
Table 3 Barriers to investment in efficient technologies in relevant to industries in developing
countries
Ignorance of technology availability & benefits
Reddy 1991; UNDP 2000; McKane 2007; Farrell 2009; Taylor et al 2008; Preaetorius & Bleyl 2006; WEC 2008;
Informational Barriers
Institutional barriers to knowledge, communication and technology flows
Meyers 1998;
Lack of available funds/ absence of credit Reddy 1991; UNDP 2000; Farrell 2009; Taylor et al 2008; Meyers 1998; WEC 2008;
Financial Barriers
First-price sensitivity/high capital costs (magnified by the lack of credit markets)
UNDP 2000; Reddy 1991; Behrens et al 2009; Meyers 1998; WEC 2008;
Unavailability of efficient equipment (technology available but not produced)
Reddy 1991; Meyers 1998;
Focus on individual component efficiency, not whole system efficiency
McKane et al 2007;
Misapplication of efficient technologies McKane et al 2007;
Technological barriers
Shortage of trained technical personnel to maintain/install new equipment
Reddy 1991; McKane et al 2007; Taylor et al 2008; UNDP 2000;
Uncertainty about future energy prices/economic uncertainty
Reddy 1991; McKane et al 2007; Taylor et al 2008;
High user discount rates Taylor et al 2008; Behrens et al 2009; Meyers 1998;
Slow rate of capital turnover/ infrequency of capital investments
McKane et al 2007;
Perceived risk of implementing the new/unfamiliar technology
McKane et al 2007; Taylor et al 2008; Meyers 1998; IEA 2009;
Indifference to energy costs/relative insignificance of energy costs to total costs
Reddy 1991; Meyers 1998;
Below long-run marginal cost pricing and other price distortions
Taylor et al 2008; Meyers 1998; IEA 2009;
Discrepancies in discount rate
High transaction costs Behrens et al 2009; Taylor et al 2008; Meyers 1998;
Inherited inefficient equipment/indirect purchase decisions
Reddy 1991; UNDP 2000; Meyers 1998; WEC 2008;
Limited fuel options/supply UNDP 2000; Historically or socially formed investment patterns
UNDP 2000; McKane 2007;
Mismatch of the incidence of investment costs and energy savings
Taylor et al 2008;
Diversity of investment criteria and limited resources
Import of inefficiently used plants and vehicles
UNDP 2000; Meyers 1998;
Political uncertainty/ policy instability Taylor et al 2008; Weak contracting institutions Taylor et al 2008; Meyers 1998; Absence of effective energy efficiency policy at national level
Reddy 1991; UNDP 2000; Behrens et al 2009; Taylor et al 2008;
Inappropriate energy pricing and cross-subsidising
UNDP 2000; Farrell 2009; Meyers 1998;
Skills-short government Reddy 1991; Meyers 1998; Government without adequate training facilities
Reddy 1991;
Policy/political barriers
Government without access to necessary hardware and software
Reddy 1991;

15
Meyers (1998) suggests that the barriers related to macroeconomic conditions, energy pricing,
international flows of technology, capital and knowledge, and institutional weaknesses are most
relevant to developing countries.
The World Bank sponsored the Three Country Energy Efficiency Programme, which sought to
finance energy efficiency in Brazil, China and India, and has considerably contributed to
understanding the factors that best foster investment in energy efficiency. In these countries, the
World Bank finds that “the core of the problem […] lies in the intertwined problems of
perceived high risk driving up implicit discount rates associated with projects, currently high
transaction costs, and difficulties in structuring workable contracts for preparing, financing, and
implementing energy efficiency investments” (Taylor, et al 2008:6). The report stresses that
barriers are related to institutional issues: “[…] two core economic functions that are dependent
upon the strength of prevailing market institutions are usually critical for efficient energy
efficiency investment: (i) outsourcing governed by contracts to allow sufficient specialization,
and (ii) deep and efficient financial markets for financing energy-efficient investments
(including both initial and retrofit investments)” (Taylor et al 2008:51-52). The policy solutions
to these barriers should be specific and tailored to local environments. The box below offers a
generalized guide to policymaking in the face of barriers to investments in energy efficiency.
Box 3 Generalized model for developing new energy efficiency investment delivery mechanisms in developing countries
Source: Taylor et al 2008:68.
The chart below pairs general types of investment barriers to energy efficiency by industry,
including a policy solution. Though not detailed, this chart from UNDP (2000) provides an idea
of the kind of policies required to overcome the above barriers. Many of the policy solutions

16
have multiple purposes. Voluntary agreements of mass producers, for example, are suggested to
resolve information/market transparency problems, disparity of profitable expectations,
investor/user dilemmas as well as incorporating externalities into costs. For more information
on voluntary agreements to spur investment in energy efficient technologies, see Oikonomou, et
al. 2009 and Price &Worrell 2002. It is important to note that some of the policy
recommendations in the table may be taken from successful experiences in the developed world
and may not be directly transferable to the developing world. A more detailed discussion of
barriers and their policy solutions with specific attention to developing countries can be found in
Reddy (1991).
Figure 5 Barriers to investment and policy solutions
Source: World Energy Assessment, UNDP 2000:206.
17
A further list of policies or steps to spur investment in efficiency measures for industry is found
in ESMAP (2006), however, this list is not specific to developing countries:
5 Conclusions
A constraining factor in this field of study is the lack of firm-level data. The most relevant
studies of developing countries use aggregated numbers; only a few scattered case studies deal
with micro-level data. There is a plethora of literature on potential benefits of improved
productivity, but there seems to be little empirical or theoretical consensus on the scope of the
benefits or the mechanism for realizing these. The contradictions in empirical studies indicate
the variation of conditions across countries, making the relationship between productivity and
economic growth heterogeneous.
Despite this ambiguity, there is some consensus on the barriers to optimal investment in
efficiency measures. Lack of available credit, high risk, high transaction costs, insecure
contracting institutions, and lack of sufficient technical skills are the most frequently cited
hurdles to productivity investments. There is also consensus that policies should be tailored to
individual specificities to ensure that the impact of these five factors is reduced.
− Regulation measures
− Tax incentives
− Energy efficiency funds and low interest loans
− Performance codes, standards, incentives and regulations
− Mandatory/compulsory energy efficiency targets
− Technical assistance and small business programmes
− Energy audits for factories
− Product labelling, rating, certification and retro-commissioning
− Energy conservation management
− Recognition programmes, technology adaptation and upgrades; and bulk procurements

18
References
Adenikinju, A., & Alaba, O. (1999). Energy use and productivity performance in the Nigerian manufacturing sector (1970-1990). OPEC Review (September), 251-264.
Akinlo, A. E. (2008). Energy consumption and economic growth: Evidence from 11 Sub-Saharan African countries. Energy Economics , 30, 2391-2400.
Andrews-Speed, P. (2009). China's ongoing energy efficiency drive: Origins, progress and prospects. Energy Policy , 37, 1331-1344.
Ang, B. (2006). Monitoring changes in economy-wide energy efficiency: From energy–GDP ratio to composite efficiency index. Energy Policy , 34, 574–582.
Ayers, R. U., Turton, H., & Casten, T. (2007). Energy Efficiency, sustainability and economic growth. Energy , 32 (5), 634-648.
Behrens, A., Bird, N., & Fischer, G. (2009). The financing of the Global Energy Efficiency and Renewable Energies Fund (GEEREF). Brussels: European Parliament.
Bernard, J.-T., & Cote, B. (2005). The measurement of the energy intensity of manufacturing industries: a principal components analysis. Energy Policy , 33, 221-233.
Boyd, G. A. (2000). Estimating the linkage between energy efficiency and productivity. Energy policy), 28 (5), 289-296.
Bor, Y. J. (2008). Consistent multi-level energy efficiency indicators and their policy implications. Energy Economics , 30, 2401-2419.
Brookes, L. (2000). Energy efficiency fallacies revisited. Energy Policy , 28, 355-366.
Cornillie, J., & Fankhauser, S. (2004). The energy intensity of transition countries. Energy Economics , 26, 283-295.
Department of Energy & Climate Change. (2009). The Road to Copenhage: The UK Government's case for an ambitous international agreement on climate change. Norwich: The Stationery Office.
Dimitropoulos, J. (2007). Energy productivity improvements and the rebound effect: An overview of the state of knowledge. Energy Policy , 35, 6354-6363.
EIA. (2003, June 02). Energy Efficiency Measurement Discussion. Retrieved July 9, 2009 from EIA: http://www.ei.doe.gov/emeu/efficiency/measure_discussion.htm
Energy Sector Management Assistance Program (ESMAP). (2006). Energy Efficiency Investment Forum: Scaling up Financing in the Developing World. Washington DC: The World Bank Group.
Fan, Y., Liao, H., & Wei, Y.-M. (2007). Can market oriented economic reforms contribute to energy efficiency improvement? Evidence from China. Energy Policy , 35, 2287-2295.
Farell, D., & Remes, J. (2009). Promoting energy efficiency in the developing world. McKinsey & Company.
Farrell, D., & Remes, J. (2008). How the World should invest in energy efficiency. McKinsey & Company.
Farrell, D., Remes, J., Bressand, F., Laabs, M., & Sundaram, A. (2008). The case for investing in energy productivity. McKinsey Global Institute.
Freeman, S. L., Niefer, M. J., & Roop, J. M. (1997). Measuring industrial energy intensity: practical issues and problems. Energy Policy , 25 (7-9), 703-714.

19
Gale, B., & Pang, J. (2000). Estimating the linkage between energy efficiency and productivity. Energy Policy , 28, 289-296.
Gardner, T. A., & Joutz, F. L. (1996). Economic Growth, Energy Prices and Technological Innovation. Souther Economic Journal , 62 (3), 653-666.
Geller, H., & Attali, S. (2005). The Experience with Energy Efficiency Policies and Programmes in IEA Countries: Learning from the Critics. Paris: IEA.
Geller, H., Harrington, P., Rosenfeld, A. H., Tanishima, S., & Unander, F. (2006). Policies for increasing energy efficiency: Thirty years of experience in OECD countries. Energy Policy , 34, 556-573.
Gillingham, K., Newell, R., & Palmer, K. (2006). Energy Efficiency Policies: a retrospective examination. Annual Review of Environmental Resources , 31, 161-192.
Howarth, R. B., Schipper, L., & Andersson, B. (1993). The Structure and Intensity of Energy Use: Trends in Five OECD Nations. The Energy Journal , 14 (2), 27-46.
Howarth, R., Haddad, B., & Paton, B. (1997). Energy Efficiency and Economic Growth. Contemporary Economic Policy , 15, 1-9.
Howarth, R., Haddad, B., & Paton, B. (2000). The economics of energy efficiency: insights from voluntary participation programs. Energy Policy , 28, 477-486.
Hu, J.-L., & Wang, S.-C. (2006). Total-factor energy efficiency of regions in China. Energy Policy , 34, 3206-3217.
IEA. (2009). Boosting the economy with energy efficiency financing. Paris: International Energy Agency.
IEA. (2007). Tracking Industrial Energy Efficiency and CO2 Emissions. Paris, France: IEA.
IEA. (2008). World Energy Outlook 2008: Executive Summary. Paris: International Energy Agency.
IEA. (2008). Worldwide Trends in Energy Use and Efficiency. Paris, France: IEA/OECD.
Jenne, C. A., & Cattell, R. K. (1983, April). Structural change and energy efficiency in industry. Energy Econonomics , 114-123.
Lee, C.-C., & Chang, C.-P. (2008). Energy consuption and economic growth in Asian economies: A more comprehensive analysis using panel data. Resource and Energy Economics , 30, 50-65.
Liu, N., & Ang, B. (2007). Factors shaping aggregate energy intensity trend for industry: Energy intensity versus product mix. Energy Economics , 29, 609-635.
Lovins, A. (2005, September). More profit with less carbon. Scientific American , 74-82.
Madlener, R., & Alcott, B. (2009). Energy Rebound and Economic Growth: A review of the main issues and research needs. Energy , 34 (4), 370-76.
McKane, A., Price, L., & de la Rue du Can, S. (2007). Policies for Promoting Industrial Energy Efficiency in Developing Countries and Transition Economies. Background Paper for the UNIDO Side Event on Sustainable Industrial Development (pp. 1-87). Vienna: UNIDO.
McKinsey & Company. (2009). Pathways to a Low-Carbon Economy: Version 2 of the Global Greenhouse Gas Abatement Cost Curve. McKinsey & Company.
Meyers, S. (1998). Improving energy efficiency: strategies for supporting sustained market evolution in developing and transitioning countries. Berkely: Lawurence Berkely Laboratory.

20
Miketa, A., & Mulder, P. (2005). Energy productivity across developed and developing countries in 10 manufacturing secors: Patterns of growth and convergence. Energy Economics , 27, 429-453.
Mills, E. (2003). Risk transfer via energy savings insurance. Energy Policy , 31, 273-281.
Mishra, V., Smyth, R., & Sharma, S. (2009). The energy-GDP nexus: Evidence from a panel of Pacific Island countries. Resource and Energy Economics , 31, 210-220.
Ockwell, D. (2008). Energy and economic growth: Grounding our understanding in physical reality. Energy Policy , 36, 4600-4604.
Oikonomou, V., Patel, M., van der Gaast, W., & Rietbergen, M. (2009). Voluntary agreements with white certificates for energy efficiency improvement as a hybrid policy instrument. Energy Policy , 37, 1970-1982.
Pandey, R. (2002). Energy policy modeling: agenda for developing countries. Energy Policy , 30, 97-106.
Patterson, M. G. (1996). What is energy efficiency?: Concepts, indicators and methodological issues. Energy Policy , 24 (5), 377-390.
Praetorius, B., & Bleyl, J. W. (2006). Improving the institutional structures for disseminating efficiency in emerging nations: a case study for energy agencies in South Africa. Energy Policy , 34, 1420-1531.
Price, L., & Worrell, E. (2002). Overview of Voluntary Agreements in the Industrial Sector,. Energy Analysis Department, Environmental Energy Technologies Division. Berkeley: Lawrence Berekely National Laboratory.
Reddy, A. K. (1991). Barriers to imporovements in energy efficiency. Energy Policy , 19 (10), 953-961.
Semboja, H. (1994). The effects of an increase in energy efficiency on the Kenya economy. Energy Policy , 22 (3), 217-225.
Smulders, J., & de Nooij, M. (2003). The impact of energy conservation on technology and economic growth . Resource and Energy Economics , 25 (1), 59-79.
Sorrell, S. (2009). Jevons' Paradox revisited: The evidence for backfire from improved energy efficiency. Energy Policy , 37, 2310-2317.
Sorrell, S., & Dimitropoulos, J. (2008). The rebound effect: Microeconomic definitions, limitations and extensions. Ecological Economics , 65, 636-649.
Stern, D. I., & Cleveland, C. J. (2004). Energy and Economic Growth. Rensselaer Polytechnic Institute. Troy: Rensselaer Working Papers in Economics.
Stern, N. (2007). The Economics of Climate Chnage: The Stern Review. Cambridge: Cambridge University Press.
Subrahmanya, B. (2006). Energy intensity and economic performance in small scale bricks and foundry clusters in India: does energy intensity matter? Energy Policy , 34, 489-497.
Taichen, C., & Jin-Li, H. (2007). Renewable energy and macroeconomic efficiency of OECD and non-OECD economeis. Energy Policy , 35, 3606-3615.
Tanaka, K. (2008). Assessing Measures of Energy Efficiency Performance and their Application in Industry. Paris, France: IEA.
Tanaka, K. (2008). Assessment of energy efficiency performance measures in industry and their application to policy. Energy Policy , 36, 2887-2902.

21
Taylor, R., Govindarajalu, C., Levin, J., Meyer, A. S., & Ward, W. A. (2008). Financing Energy Efficiency: Lessons from Brazil, China, India and Beyond. Washington DC: The World Bank Group.
Thompson, P. (1997). Evaluating energy efficiency investments: accounting for risk in the discounting process. Energy Policy , 25 (12), 989-986.
Tonn, B., & Peretz, J. (2007). State-Level benefits of energy efficiency. Energy Policy , 35, 3665-3674.
UNDP. (2006). Achieving Energy Efficiency in Malaysia. Kuala Lumpur: United Nations Development Programme, Malaysia.
UNDP. (2000). World Energy Assessment: Energy and the challenge of sustainability. New York, New York: United Nations Development Program.
UNDP-Kenya. (2006). Investors guide to energy efficiency. Nairobi: United Nations Development Programme.
UNESCAP. (2008). Statistical yearbook for Asia and the Pacific. Retrieved June 29, 2009 from http://www.unescap.org/stat/data/syb2008/28-Energy-supply-and-use.asp
van Zon, A., & Yetkiner, I. H. (2003). An endogenous growth model with embodied energy-saving technical change. Resource and Energy Economics , 25, 81-103.
Wei, T. (2007). Impact of energy efficiency gains on output and energy use with Cobb-Douglas production function. Enery Policy , 35, 2023-2030.
Wiel, S., & Ega, C. (2006). Energy efficiency standards and labels provide a solid foundation for economic growth, climate change mitigation, and regional change. Energy for Sustainable Development , 10 (3), 54-64.
Wiel, S., & McMahon, J. (2003). Governments should implement energy-efficiency standards and lables -- cautiously. Energy Policy , 31, 1403-1415.
World Bank. (2006). Improving Lives: World Bank Group Progress on Renewable Energy and Energy Efficiency Fiscal Year 2006. Washington DC: The World Bank Group.
World Bank. (2005). World Bank Group Progress on Renewable Energy and Energy Efficiency: 1990-2004. Washington DC: The World Bank Group.
World Energy Council. (2008). Energy Efficiency Policies around the World: Review and Evlauation. London: World Energy Council.
Worrell, E., Ruth, M., Laitner, J., & Finman, H. (2001). Productivity benefits of industrial energy efficiency measures. Ernest Orlando Lawrence Berkeley National Laboratory. Berkeley: Lawrence Berkeley National Laboratory.
Worrell, E., van Berkel, R., Fengqui, Z., Menke, C., Schaeffer, R., & Williams, R. O. (2001). Technology transfer of energy efficient technologies in industry: a review of trends and policy issues. Energy Policy , 29, 29-43.
Zhou, P., & Ang, B. W. (2008). Linear programming models for measuring economy-wide energy efficiency performance. Energy Policy , 36, 2911– 29

22
Appendix
Table 1 Indicators and measurement of industrial energy efficiency
Source Purpose Methodology Indicator definitions/types & Issues 1. Thermodynamic definitions: Useful energy output/sum of all energy inputs - for a particular system, process or sector. Only "useful" inputs and outputs are captured. Limited comparability without adjusting for energy quality. Actual efficiency/ideal efficiency will measure how close a real system comes to an ideal system, but is limited in applicability to real world systems. 2. Physical-thermodynamic definitions:
Output/Energy input. Advantages of this kind of measure: can be objectively measured; can reflect what consumers are actually requiring in terms of end use service; can be compared in
longitudinal/time series analyses. Must be defined on a sectoral basis in that the "output" measure will vary across industries (i.e., tonnes of bricks, litres of milk, cubic metres of wood, etc.). Therefore, economy-wide aggregates are not feasible. 3. Economic-thermodynamic: Energy: GDP ratio - Can be applied to various levels of aggregation but cannot differentiate between changes in technical energy efficiency and changes such as sectoral mix, energy-labour substitution, and changes in energy input mix. GDP should account for purchasing parity for comparisons.
Energy input: output ($) can be used at sectoral level but cannot always account for indirect energy use (i.e., sunlight in farming).
Energy productivity ratio - GDP/Energy: focuses attention on the productive use of energy, and complimentary measure to capital & labour productivity analyses. In conjunction with K&L productivity measures, it can provide insight into whether energy inputs act as complements or substitutes. GDP/Energy may change by substitution, not by changes in technical efficiency (see
technical or gross energy efficiency below) 4. Economic: Energy input (in $ value): Output $ - accounts for variations in energy quality: requires careful calculation of 'ideal prices' to reflect marg. rate of transformation in prod. or MRS in consumption of
inputs. Most common pure econ. indicator: national energy input ($)/national output ($GDP) - requires value judgments (see below).
Patterson, Murray G. "What is energy efficiency?: Concepts, indicators and methodological issues." Energy Policy 24, no. 5 (1996): 377-390.
Critical review of energy efficiency definitions and how they are operationalized; and methodological issues with each
Literature review
Methodological issues: 1) Valuation & value judgments - to define energy output requires defining "useful energy" which may fail to capture use of "waste heat," for example. Not all end uses are adequately included in measurement.
2) Energy quality problem - affects all indicators, occurs when different sources/end uses of energy are

23
compared. Enthalpic measurements only measure heat content and do not distinguish between high-low quality of energy source (i.e. electricity-coal). Causes difficulty in aggregating, but is equally problematic at the micro-level. OECD thermal equivalents or fossil fuel equivalents can be used to account for these differences. 3) Boundary problem - only certain inputs are considered, non-commercial inputs are often excluded from efficiency indicators (gathered wood, sunlight, etc are not measured). Also, how far back to trace primary energy inputs? Do you account for energy losses in capturing & refining oil when using
refined oil as an input? This latter issue can be accounted for by using the quality equivalent methodology (see Patterson 1993).
4) Joint production problem - arises when two different goods are produced using the same energy input, (raising a sheep produces both wool and meat), the problem is in differentiating input energy: output. Solving the problem requires arbitrary decisions about allocation. Regression analysis is
useful when inputs or outputs are produced in quantities not proportional to each other. 5) Technical or gross energy efficiency - most indicators (particularly economic-thermodynamic) measure gross energy efficiency in a system/process/sector, which can be affected by structural factors (sectoral mix, energy input mix, increased mechanisation, and energy-for-labor substitution changes); meaning that the indicator does not capture exclusively technical efficiency changes. Technical and gross energy efficiency indicators are meant to measure different things. “Thermal energy efficiency of equipment – This is expressed by: energy output/energy input, for end-use technology and energy conversion technology. For example, the energy efficiency of a steam boiler is energy amount as steam output divided by input heat to boil the water inside. In the case of motors, it should be power output divided by input electricity” (2888).
Tanaka, Kanako. "Assessment of energy efficiency performance measures in industry and their application to policy." Energy Policy 36 (2008): 2887-2902.
Describe indices of energy efficiency performance in industry, which will be used in policymaking/ implementation processes, and to clarify the characteristics of each index, noting advantages and disadvantages, political implications, and links to policy framework.
Literature review and case study of Japan's iron and steel industry
(1) “Energy consumption intensity (unit energy consumption, specific energy consumption) – For this index, the energy consumption is divided by the physical output value (or some economic value)
thereof. In a similar way to point (1), it can be expressed as energy input/output. In comparison to the application of thermal efficiency measurement, indices of energy consumption can be used to assess and compare energy performance for a broader set of objects: processes, factories, companies, and even countries. A recent IEA publication (IEA, 2007b) called a statistical tool, as one of MEEPs, “indicator”, which measures energy use based on physical production of industrial products.
This indicator is not influenced by price fluctuations (IEA, 2007a, b) and can be directly related to process operations and technology choice. The denominator of energy intensity is a physical value,
so comparison of energy use in different units and aggregate efficiency for the whole of manufacturing is effectively impossible without the conversion of the physical units into a common value. Even at
disaggregated levels like a single industry, the energy data corresponding to products and processes are not always forthcoming. Another problem related to the energy consumption intensity index is the
definition of proper and comparable boundaries (boundary definition) (see Appendix A)” (2888).

24
(2) “Absolute amount of energy consumption – heat value – This measure is sometimes used as MEEP. It loses its relevance from an energy efficiency perspective if it is not accompanied by an indication of production volumes. A problem similar to energy consumption intensity arises when we compare
various boundary definitions” (2888). (3) “Diffusion rates of energy-efficient facilities/types of equipment – This measure indicates the rate of deployment of a specific technology, which has been identified as being energy efficient. Individual
technologies share some common features including energy performance, with slight variations from one location of use to the other. The rate of diffusion of well-identified energy efficient technologies can therefore indicate progress towards enhanced energy efficiency – assuming that installation
implies actual use of the equipment. (The application of, and issues related to the measures are discussed in Section 5.2).” (2888).
Page2889:
“Energy intensity measures are often used to measure energy efficiency and its change over
time….[E]nergy-intensity measures are at best a rough surrogate for energy efficiency. This is because energy intensity may mask structural and behavioural changes that do not represent “true” efficiency
improvements such as a shift away from small cars to sport-utility jeep-like vehicles” (2) Energy intensity: ratio of energy consumption to some measure of demand for energy services
EIA. (2003, June 02). Energy Efficiency Measurement Discussion. Retrieved July 9, 2009, from EIA: http://www.ei.doe.gov/emeu/efficiency/measure_discussion.htm
Discusses implications/difficulties of various energy efficiency measures
Discussion, no formal methodology
Indices as a measure of relative changes include (1) market-based approaches,
(2) comprehensive approaches, (3) factorial decomposition approaches (Laspeyres indices: energy use is decomposed into an activity

25
effect, structural effect, and an intensity effect; each measured by holding the other 2 constant), and (4) divisia index approach (may be used to decompose time trends into different factors such as structural and intensity; measure energy savings over time and uses time trend data)
Best practice approach – difference between the current or average practice of producing and the “best practice” of production – see Handbook on International Comparisons of Energy Efficiency in
Manufacturing industry published by the Department of Science, Technology and Society, Utrecht University in April 1998 industrial energy intensity= energy input/industrial output (which is a economic-thermodynamic
definition of efficiency) The higher the level of aggregation, the more desirable is the use of market value of output relative to
volume of output in a measure of energy intensity. More heterogeneity of product makes it more difficult to measure output by volume. Energy intensity growth rates can vary greatly depending on the measure of output used. In a simple OLS regression [ ln(Otj) = α + βtj + vt ] with O = output for measure j; j=volume, value of
production, value of shipments, or value added; Beta is annual growth rate of output measure j. “A simple t-test of the equality of the point estimate for the growth rates of output volume and each of
the growth rates of value measures was calculated. The test indicated that the hypothesis of equality between the growth rate of volume of output and the growth rate of each of the value of output measures could not be rejected. Thus none of the value measures is preferred over the others by this test” (708). Possible causes of differences between volume and value of output: Measurement errors in price indexes - likely when there are multiple prices for a good, when an industry is composed of multiple goods, changes in data underlying industry price deflators, quality changes, and shipments and materials deflators (it is unlikely that prices of materials and products change at the same rate over time). Errors in industry specialization and coverage - difficulties occur, for example, when a single plant produces goods classified in more than one industry. Industry redefinitions - periodic redefinitions may make industry output values not strictly
comparable over time. ”The use of value-based demand indicators in an energy efficiency measure may serve to exaggerate
year-to-year changes in efficiency. Among the value-based demand indicators, value added appears likely to exaggerate year-to-year changes the most” (713).
Freeman, Scott L., Mark J. Niefer, and Joseph M. Roop. "Measuring industrial energy intensity: practical issues and problems." Energy Policy 25, no. 7-9 (1997): 703-714.
Given the available data, we examine the types of issues and problems that are likely to arise in the construction of commonly-used intensity indicators. We construct several measures of energy intensity based on alternative measures of energy use and output for several industries in order to illustrate these issues and problems.
OLS Regression; 1978-1992 US manufacturing industries. Data comes from US Standard Industrial Classification System
”The trend growth rate of value of production seems to match the trend growth rate of volume of output more closely than either value of shipments or value added; we are not, however, on the basis of the statistical tests reported above, able to assert that this relationship holds with much certainty. Given that it is less likely to exaggerate swings in energy efficiency in the short run, and that it more closely matches trend growth rates than other value‐based demand indicators, in the absence of serious

26
coverage or specialization problems, it seems that value of production is the most desirable value‐based output measure for use in an indicator of energy intensity” (713).
“The main objective of this paper is to put together the empirical results reported in [previous] studies in a coherent framework and identify possible systematic features.”
Literature review Decomposition index analysis: two commonly used indices – Laspeyres index and the Divisia index. The latter Divisia index is recommended over the former, due to its various characteristics (p. 611), and it has “emerged as the most preferred method among researchers and analysts” “Increasingly, energy efficiency performance tracking through chaining decomposition analysis has become a major application of index decomposition analysis. Index decomposition analysis is the
most rigorous technique currently available to address the issues of energy efficiency performance and to track its trend at the industry-wise or economy-wide level. Lately, it has also been found useful in
the development of energy efficiency indicators…” (p. 612). “In implementation, a common comment is that the kind and quality of data that are needed for a rigorous index decomposition analysis pose a far greater challenge to the analyst than issues on the choice of a decomposition method” (p. 632).
“In developing countries… depending on the decomposition time period, there are cases where increases or decreases in the aggregate energy intensity are observed.” (p. 623)
Liu, N., & Ang, B. (2007). Factors shaping aggregate energy intensity trend for industry: Energy intensity versus product mix. Energy Economics, 29, 609-635
“If what has happened in industrial countries is indicative of future developments of the developing countries, in particular the high income ones, then it would be expected that the aggregate energy intensities of these countries will likely stabilize and/or decline as a result of the impacts from energy intensity change” (p. 631)
This paper explores different measures of energy efficiency performance (hereafter referred to as "MEEP"): absolute energy consumption, energy intensity, diffusion of specific energy-saving technology and thermal efficiency.
Case study, literature review
Same functional definitions as Patterson (1993) above, except Diffusion rates of energy efficient facilities/types of equipment: “The diffusion rate indicates the rate of deployment of a specific
technology which has been identified as being energy efficient. Individual technologies share some common features, including energy performance, with slight variations from one location of use to the
other. The rate of diffusion of well-identified energy efficient technologies can therefore indicate progress towards enhanced energy efficiency, assuming that installation implies an actual use of the equipment” (8).
Tanaka, Kanako. Assessing Measures of Energy Efficiency Performance and their Application in Industry. Paris: IEA, 2008.
Much the same information/conclusions as Tanaka 2008a above.

27
Bor, Yunchang Jeffrey. "Consistent multi-level energy efficiency indicators and their policy implications." Energy Economics 30 (2008): 2401-2419.
'This paper has proposed the adoption of end-use energy efficiency indices and the weighted vertical effect decomposition of changes in energy efficiency indices between upstream and downstream industries, which enable policy-makers to trace and identify those downstream industries that lead to significant changes in energy efficiency in the upstream sector.'
Introduction of a new EEI and case study using Taiwan’s (Republic of China) industrial sectors (1994-2003)
The principal function of the end-use energy efficiency indicators lies in the evaluation of the secondary energy usage performance of a nation or a sector, as well as the estimation of energy conservation potential.
Economic-thermodynamic EEI:

28
(page 2404). Physical-thermodynamic EEI : energy consumption per unit of output volume; however, it is difficult to quantify the aggregated output of industrial production because such an operation meets with the
problem of inconsistency, in terms of the unit of measurement for individual product outputs. One possible, though not infallible solution is to use product prices instead of volume. Ang (1995) proposed a multi-level method, featuring the Divisia index, where energy efficiency is decomposed across multiple levels of sectors in terms of changes in energy intensity and energy
consumption, respectively. Benefit: reveal the existence of linkages in changes in energy efficiency indices between the upstream and downstream levels, and the same method can be used to study energy efficiency indices for industries further downstream. Problem: (i) the index is multiplicative rather than additative;
(ii) the sums of the index changes in all industries at the same level do not equal the change in the index for the upstream sector level.
The author presents an improved method of deriving an EEI, the process is, however, too complicated to adequately summarize here. 'The physical-thermodynamic EEIs developed in the present paper have two major contributions in that (i) they provide a definition and formula that are consistent with the economic-thermodynamic EEI, and (ii) they avoid the distortion of price fluctuations. Another benefit is that the EEIs can be calculated in either aggregated or disaggregated sectors' (2408). “Per capita energy use in developing countries tends to be higher where per capita incomes are higher
( in purchasing power parity terms), as in Latin America, India and Southeast Asia” (p.180) UNDP. (2000). World energy report: Energy and the challenge of
sustainability. New York, New York: United Nations Development Program.
Discussion of recent trends in energy intensity in both OECD and non-OECD countries
Literature and statistical review
Trend in higher-income developing countries: “Energy demand in industry has fallen in most higher-income developing countries, both as a result of higher energy prices in the 1970s and the 1980s and open borders to international competition” (p. 180). “In recent years many manufacturers in industrialised nations have moved energy-intensive industries
to developing countries, often to take advantage of cheaper labour, less stringent environmental regulation, and lower overhead and transportation costs”

29
“Overall, more efficient manufacturing does not dominate the increase in ratios of primary energy to GDP in higher-income developing countries (Argentina, Brazil, India, Mexico)” (p. 181).
Trend in lower-income developing countries: “Most of the technology used by industry in lower-income developing countries is imported from industrialized countries. Thus these industries should
continue to benefit from technological improvements that promote rational energy use. While this is expected to make energy demand fall, the use of obsolete and energy-inefficient technology imported from industrialized countries will drive the specific energy demand of industry” (p. 181) Issues in developing countries affecting positive benefits from transfer of energy efficient technology:
(1) proper technology assessment and selection, (2) adaptation and absorption capacity, (3) access to state-of-the-art technology and to capital, (4) the problems of small and medium-sized enterprises. There is much in this chapter on potential energy efficiency across regions (Africa p. 191), as well as obstacles/market imperfections preventing improvements, and suggested policy implications.
p. 197 Economic ratios, also referred to as energy intensities, are defined as ratios between energy
consumption, measured in energy units – tonnes of oil equivalent/(toe) – and indicators of economic activity, measured in monetary units at constant prices (GDP, value added, etc.) Techno-economic ratios are calculated at a disaggregated level by relating energy consumption to an
indicator of activity measured in physical terms or to a consumption unit – also referred to as unit consumption
World Energy Council. (2008). Energy Efficiency Policies around the World: Review and Evaluation. London: World Energy Council.
(section 1&2 of report)
“Review of recent energy efficiency trend by world region based on a set of homogenous energy efficiency indicators covering the period 1980-2006, with a greater focus on the last sixteen years (1990-2006)”
Data comes from ENERDATA world energy database (www.enerdata.fr)
“Since 1980, the general trend in industry in Europe, OECD Asia & Pacific, North America, China and India is a decrease in the energy required per unit of value added (industrial intensity)” (p. 25).

30
Energy productivity is defined as output divided by final energy use and is thus the inverse of energy intensity.
(p. 434) “In spite of the overall pattern of σ-convergence in nine manufacturing sectors, substantial cross-country variation in energy- productivity levels remains in existence, in particular in several energy-intensive sectors such as chemicals, iron and steel, and paper” (436).
Test for unconditional beta-convergence: where g is annual growth rate of energy productivity and y is initial level; regression w/ clustered standard errors, unbalanced sample, restricted to 1980-1990. In
short, the results of our test for b-coefficient provide evidence of lagging countries catching up in terms of energy-productivity performance within most industrial sectors, though very slow convergence, up to 397 years for the wood sector. Mostly significant findings, but very low r-squared. Summarized in
the large table 4.
(439).
Miketa, Asami, and Peter Mulder. "Energy productivity across developed and developing countries in
10 manufacturing sectors: Patterns of
growth and convergence." Energy Economics 27 (2005): 429-453.
Empirical analysis of energy-productivity convergence across 24 developed and 32 developing countries, in 10 manufacturing sectors, for the period 1971–1995
Panel regression of energy productivity at the sector level
Test for conditional beta-convergence- fixed effects regression. The results confirm the evidence of b -convergence: except for wood (WOD) in the Rest of World, all estimated b -coefficients are negative and highly significant. Moreover, the values of the R2 improved considerably, suggesting that country
effects indeed play an important role, and thus making Eq. (2) a much better model for explaining energy- productivity growth across countries than Eq. (1). From the higher values of the implied in
Table 5, it can be seen that allowing for country-specific effects also leads to a substantial increase in the speed of convergence. In short, our results show support for the hypothesis that, in terms of sectoral energy productivity, lagging countries tend to catch up with advanced nations, with convergence tending to be conditional on country-specific characteristics rather than unconditional or absolute.
(441).
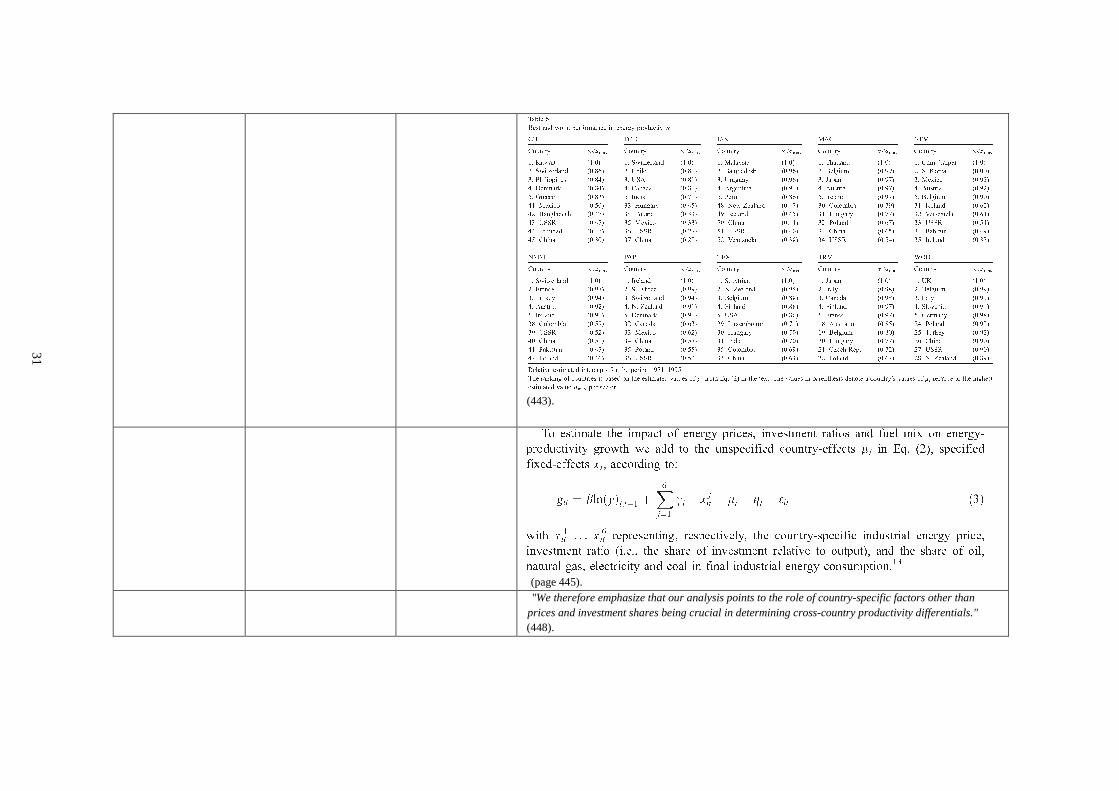
31
(443).
(page 445). "We therefore emphasize that our analysis points to the role of country-specific factors other than
prices and investment shares being crucial in determining cross-country productivity differentials." (448).

32
Table 2 Causal effects of industrial energy efficiency on economic growth
Source Purpose Methodology Data Findings Policy Implications “In short term… energy use efficiency gains will only increase non-energy output and have
no effect on energy use (or production)” (2929). Energy use efficiency will lower the prices of non-energy and increase the output of non-
energy goods, in the short run.
“The long term impact on energy use (or production) of energy use efficiency is far less than that of energy production efficiency. Thus on the basis of general equilibrium analysis, we conclude that measures to promote energy use efficiency is better than to promote energy production efficiency if our purpose is to limit total energy use.” (2029).
“In the GE framework, the long term impact on non-energy output and energy use of energy
production (or use) efficiency is larger when compared with the short term impact. The extent
depends on the elasticity parameters in the production functions.” (2029) “It is also interesting to notice that energy use efficiency gains implies some increase of
energy price in long term” (2029).
Beginning with the Cobb-Douglas PF with three primary resources K, L and E (energy):
where X is the gross output or rough GDP. It is
the technological parameter and its increase represents energy use efficiency gains. The CD
function exhibits constant returns to scale. Subscript x is for input factors.
Wei, T. (2007). Impact of energy efficiency gains on output and energy use with Cobb-Douglas production function. Energy Policy, 35, 2023-2030.
To apply the Cobb-Douglas production function to analyze the impact of energy efficiency gains on output and use
“first provides a partial equilibrium analysis… and then proceeds to an analysis on the issue in a two-sector general equilibrium system. In the latter analysis, energy price is internalized.” (2023)
n/a no data, the
theory is based on economy level definitions
Short-term impacts of energy use efficiency gains: In the general equilibrium model, energy use

33
always equals energy production. Thus, Wei finds that energy use efficiency gains t have no effect
on energy use:
which is a 100% rebound effect.
However, quantity of non-energy goods produced will increase and non-energy prices will
decrease due to energy efficiency gains, according to:
Long term impacts:
Wei finds the elasticity of energy price in the LT to be:
Which implies that energy use efficiency gains will increase the energy price, instead of
decreasing it, in the long run. The long-term impact of t on total non-energy output is
positive.
"The paper has two important findings. First, it shows that aggregate energy efficiency may be improved through stepping up basic research. Secondly, increasing real energy prices lead to
corresponding rises in the user costs of intermediates, and hence, to a fall in profits on
those intermediates." (p. 85).
“We conclude that in order to have energy efficiency growth and output growth under rising real energy prices, a combination of R&D and energy policy is called for” (81).
van Zon, A., & Yetkiner, I. H. (2003). An endogenous growth model with embodied energy-saving technical change. Resource and Energy Economics, 25, 81-103.
Extend the Romer model in two ways: include energy consumption of intermediates and to make intermediates become heterogeneous due to endogenous energy-saving technical change. “Our contribution to the discussion on endogenous growth then lies in the incorporation of energy as
Alteration of the Romer model addition of intermediate technologies
not relevant, the theory is abstract without empirical evidence; except the conclusion which makes policy recommendations exclusive to
In the case of rising growth of real energy prices, there will be less economic growth, unless policy measures are taken that counteract the negative effects on research incentives arising
from a positive growth rate of real energy prices.
"The introduction of an energy tax in the context of the revised Romer model is not enough by itself to spur R&D efforts. Rather, these are negatively affected, because either real

34
“Growth rate depends positively on the rate of embodied technical change, and that it is higher than the original growth rate in the original Romer model; the rate of growth also depends
negatively on the rate of growth of real energy prices, implying that continuously rising real
energy prices will tend to slow growth.” (98)
an explicit factor of production in an endogenous growth model based on Romer (1990)”.
the US;
can be used to link the growth rate of output to that of real energy prices.
The steady state growth rate is given by: Which implies that with continuous rises in real
energy prices (q > 0), a more intensive use of raw capital as a substitute for energy is called for. Moreover, the higher the effective capital
elasticity of energy (i.e. 1 − β) is, the stronger will be the decrease in the growth rate of output for a given growth rate of real energy prices.
energy price changes or the introduction of a tax lowers the present value of a blueprint, which in turn reduces the value marginal product of research labour. In that case, we would
expect a decrease in the allocation of labour to R&D.
However, the subsidy on wage cost in the R&D sector can actually more than compensate the fall in the value marginal product of R&D labour through the fall in profit flows, so that in this case, we could observe faster growth than before the tax." (98).
“Sustained economic growth is a mantra for governments worldwide and is seen as having a key role to play in poverty alleviation. But economic activity is predominantly linked to the use of energy, principally from fossil fuels, which account for over 60% of global
greenhouse gas emissions. This implies an urgent need to decouple economic growth from energy use.” (4600)
Ockwell, D. (2008). Energy and economic growth: Grounding our understanding in physical reality. Energy Policy , 36, 4600-4604.
This review provides an overview of our current understanding
of the relationship between energy use and economic growth.
Findings are analyzed with respect to an assumed goal of reducing emissions.
USA; literature review with an interest in economy wide results
“For ecological economists, energy is a fundamental factor enabling economic production. Some commentators even argue that energy availability actually drives economic
“The ecological economics worldview and some of the supporting empirical evidence suggests that the extent to which it is possible to decouple energy use from economic
growth may be more limited than has previously been assumed. This implies a need to focus on decarbonising energy supplies, as opposed to
focusing solely on developing and deploying energy-efficient

35
growth, as opposed to economic growth resulting in increased energy use (e.g. Cleveland et al., 1984). From this perspective, the possibility of decoupling energy use from
economic growth seems more limited.” (4601)
technologies”
“There is a distinct and unresolved divide between neo-classical and ecological economists as to how to treat the contribution of energy to economic growth, with ecological economists arguing that the non-classical
worldview fails to account for the physical limits implied by the laws of thermodynamics. If the ecological economics worldview holds, the
potential for decoupling energy from economic growth may be limited.” (4603).
“Sufficient empirical evidence does not yet exist to provide conclusive support for the claims of either the ecological or neo-classical schools of thought. Breaking down the evidence that does exist suggests that observed improvements in GDP/energy
use ratios may be better explained by shifts towards higher quality fuels than by improvements in the energy efficiency of technologies.” (4604)
“Direct rebound effects for household energy services in OECD countries are likely to be less than 30%. But they could be larger for producers and potentially much larger in developing countries.” (4603)

36
Granger causality test based on vector error correction model (VECM) shows bi-directional relationship between energy consumption and economic growth for Gambia, Ghana and Senegal. However, Granger causality test shows
that economic growth Granger causes energy consumption in Sudan and Zimbabwe. The
neutrality hypothesis is confirmed in respect of Cameroon and Cote D'Ivoire. The same result of no causality was found for Nigeria, Kenya and Togo.
The result shows that each country should formulate appropriate energy conservation policies taking into cognizance of her peculiar condition.
Gambia, Ghana and Senegal, there is bidirectional relationship between energy
consumption and economic growth. This finding seems to support Glasure and Lee (1997) result for Republic of Korea and Singapore.
“The implication of this finding is that a high level of economic growth leads to high level of energy demand and vice-versa. This means that investment and other efficient measures that increase energy supply can be implemented, but such measures should not be at the expense of the environment. Indeed, in order not to adversely affect economic growth, energy conservation policies that aim at reducing energy must rather find ways of reducing consumer demand [for energy]. This sort of policy could be achieved through an appropriate mix of energy taxes and subsidies.”
Akinlo, A. E. (2008). Energy consumption and economic growth: Evidence from 11 Sub-Saharan African countries. Energy Economics, 30, 2391-2400.
“…the objective of the paper is to investigate the cointegration and causality relationships between
energy consumption and income using ARDL bounds test and the Granger causality (GC) test based on vector error correction model (VECM).”
(2392)
Cameroon, Cote D'Ivoire, Congo, Gambia, Ghana, Kenya, Nigeria, Senegal, Sudan, Togo and Zimbabwe. For the period 1980–2003
Uses macro-level data for energy use and economic
growth
With respect to Sudan and Zimbabwe, the Wald test statistics that fall below the critical F values shows that the null hypothesis that energy consumption do not Granger cause economic
growth in the short run has been accepted.
The unidirectional causality running from economic growth to energy consumption may statistically suggest that energy consumption measures may be taken without jeopardizing

37
economic development. This is not to suggest however, that energy consumption level should be reduced. The option therefore might be for these countries to enhance the level of efficiency in the energy sector. “ (2396)
In the case of Cameroon and Cote D'Ivoire, the evidence suggests no causality in both directions supporting the so called ‘neutrality hypothesis’.
This would imply that energy conservation policies do not affect economic growth
The result indicates a unidirectional relationship between energy consumption and economic growth for Congo. The causality runs from economic growth to energy consumption. In
Nigeria, Kenya and Togo, no evidence of causality in either direction is found i.e.
‘neutrality hypothesis’.
Theoretically, for these countries energy conservation may be pursued without serious adverse effect on economic growth
No evidence was found of a unidirectional causal effect from energy consumption to growth.
Mishra, V., Smyth, R., & Sharma, S. (2009). The energy-GDP nexus: Evidence from a panel of Pacific Island countries. Resource and Energy Economics , 31, 210-220.
To test direction of causality between energy consumption and GDP, all at the aggregated, country, level.
Granger causality test
Panel of nine PICs (Fiji, French Polynesia, Kiribati,
New Caledonia, Papua New Guinea, Samoa, Solomon Islands, Tonga and Vanuatu)
“If there is unidirectional Granger causality running from GDP to energy consumption or no
Granger causality in either direction, it may be implied that energy conservation policies have
little or no adverse effect on economic growth. On the other hand, if unidirectional Granger causality runs from energy consumption to GDP,
it follows that reducing energy consumption could lead to a fall in income, while increases in energy consumption could contribute to high
rates of economic growth in the PICs. “ (212)
‘As Mehrara (2007, p. 2940) states, ‘‘when it comes to whether energy use is a result of, or a perquisite for, economic growth, there are no clear trends in the literature. Depending on the methodology, used, and country and time period studied, the direction of causality between energy consumption and economic variables has remained empirically elusive and

38
controversial’’.’ (212) “The main finding in terms of the energy-GDP nexus is that there is bidirectional Granger causality between energy consumption and GDP and that for the panel as a whole energy consumption and GDP have a positive effect on each other. A 1% increase in energy
consumption increases GDP by 0.11%, while a 1% increase in GDP increases energy
consumption by 0.23%. Bidirectional Granger causality implies that energy consumption and economic growth are jointly determined and affected at the same time. “ (219)
over the period 1980– 2005. Energy and GDP per capita are the data of interest and
use
“To this point, there are few studies that examine the relationship between energy consumption and GDP at a disaggregated level and no such panel-based studies. It would be
difficult to obtain disaggregated data on energy consumption for a panel of PICs…” (219)

39
Lee, C.-C., & Chang, C.-P. (2008). Energy consumption and economic growth in Asian economies: A more comprehensive analysis using panel data. Resource and Energy Economics , 30, 50-65.
The purpose is to “empirically examine long-run co-movement and the causal relationship between energy consumption and real GDP. It does so based on the aggregate
production function.”
Panel unit root tests and heterogeneous panel
cointegration tests, and a Granger causality test compares the relationship between energy consumption and real GDP while controlling for capital and labor input in Asian economic groups rather than individual countries
16 Asian economies from 1971 to 2002
Aggregated data at the national level is used.
China, Hong Kong, India, Indonesia, Iran, Japan, Jordan, Republic of Korea, Malaysia, Pakistan, the Philippines, Singapore, Sri Lanka, the Syrian Arab Republic, Thailand and Turkey
They use a Cobb-Douglas production function, where EC = Ln(energy consumption), LB = Ln(L), K = Ln(Capital stock), and GDP = Ln(Y)
When estimated with a fully modified OLS,
accounting for time and fixed effects, “all of the coefficients of EC, LB and K are statistically significant at the 5% level, and the effect is positive. Implicit here is that a 1% increase in energy consumption leads to a 0.32% increase in real GDP in our sample of Asian economies.”

40
“On the basis of the short-run and long-run dynamics of energy consumption and GDP, as concerns the energy-income relationship in these Asian economies, we refute the neutrality hypothesis that has previously been advanced. Energy consumption is found to Granger cause GDP in the long-run, but not vice versa. There is no short-run or long-run causal relationship running from GDP to EC.” (63)
“Energy price volatility, supply uncertainties, and environmental concerns are leading many countries to give greater consideration to
alternatives such as renewable energy and energy efficiency that can provide affordable energy
services and enhance energy security and reliability in an environmentally sustainable manner.” (page 7)
All policy implications are discussed with reference to household level efficiency improvements, not industry.
The energy efficiency potential of developing countries remains largely untapped.
World Bank. (2006). Improving Lives: World Bank Group Progress on Renewable Energy and Energy Efficiency Fiscal Year 2006. Washington DC: The World Bank Group.
Review purpose and success of WBG projects dealing with energy efficiency – however aside
from generalizations about benefits of greater efficiency, no specific attention to industry is
given.
Discussion, review of past projects
Developing countries; sectoral (residential) energy efficiency
definitions
Bonn target – WBG adopted a target of a 20% average annual growth in energy efficiency and new renewable energy commitments between fiscal years 2005 and 2009

41
“The energy security of countries can be enhanced in many ways with the help of
renewable energy and energy efficiency, including by diversifying fuels used and the
sources from which they come, enhancing availability by increasing supply and demand-
side energy efficiency, reducing energy infrastructure vulnerability through the use of
distributed energy, and promoting good governance and equitable energy sector rent distribution to reduce political and social divisions.” (8)
Benefits of energy efficiency: “At the national level it improves economic competitiveness, reduces the country’s import bill, improves the balance of trade, creates jobs, and thereby
reduces poverty. It also improves security of energy supply, a matter of particular interest to
Kenya which imports all her petroleum requirements.” (page 5)
Industries with the highest potential for benefits from improved efficiency: Iron and steel processing; Chemicals processing; Petroleum refining; Pulp and paper manufacturing; and Cement manufacturing.
UNDP-Kenya. (2006). Investors guide to energy efficiency.
Nairobi: United Nations Development Programme.
Discussion of benefits and best practices regarding energy efficiency investments, focus on industry
None… discussion only
Kenya; data is anecdotal
“The industrial and commercial sectors in Kenya are genuinely concerned that the high cost
of energy erodes the competitiveness of their products in the local, regional and international markets. Effective energy efficiency measures
would result in lower production costs of goods and services and thus improved competitiveness
of Kenyan products, higher productivity, increased profits, good prospects for new capacity investment and general strengthening of the manufacturing sector. This would also be reflected in increased job opportunities and generally improved economic activities within
the country. Energy efficiency would, moreover, reduce overall demand for energy and thereby defer capital investments needed to provide additional energy supplies. “ (5)
Much of Kenyan industry is characterized by “antiquated machinery.” “Energy Audits” are required to determine best policy or method to improve efficiency. An “energy audit” may be in the form of analysis of historical data, screening & survey, or detailed investigation and analysis.

42
“The first law of thermodynamics (the conservation law) implies the mass-balance principle (Ayres and Kneese, 1969). In order to obtain a given material output greater or equal quantities of matter must be used as inputs with the residual a pollutant or waste product. Therefore, there are minimal material input requirements for any production process producing material outputs. The second law of thermodynamics (the efficiency law) implies that a minimum quantity of energy is required to carry out the transformation of matter. All production involves the transformation or movement of matter in some way. Some form of matter must be moved or transformed though particular elements and chemicals may be substitutable. Therefore there must be limits to the substitution of other factors of production for energy. All economic processes must, therefore, require energy, so that energy is always an essential factor of production (Stern, 1997a). “ (page 4)
Stern, D. I., & Cleveland, C. J. (2004). Energy and Economic Growth. Rensselaer Polytechnic Institute.
Troy: Rensselaer Working Papers in Economics.
This paper reviews the relevant biophysical theory, models of growth, the critiques of models, and the various mechanisms that can weaken the links between energy and growth.
This paper surveys the literature on the effect of changes in energy supply on economic growth in general in both developing and developed countries.
Very little dealt directly with energy efficiency and/or industry.
“Howarth (1997) argues persuasively that the rebound effect is less than the initial innovation induced reduction in energy use, so improvements in energy efficiency do, in fact, reduce total energy demand. “ (21-22). “Energy is similarly indispensable for continued human development and economic growth. Providing adequate, affordable energy is
essential for eradicating poverty, improving human welfare, and raising living standards worldwide. And without economic growth, it will be difficult to address environmental challenges, especially those associated with poverty. “ (31)
Thus poverty alleviation in developing countries should involve the energy strategy of universal access to adequate, affordable, reliable, high-quality, safe, and
environmentally benign modern energy services, particularly for cooking, lighting, income generation, and transport. “ (59)
“In Africa per capita energy use has barely increased since 1970 and remains at less than 10 percent of per capita use in North America (annex table C2). The same is true for Asia despite a near-doubling in per capita energy use since 1970. In essence this means that most Africans and Asians have no access to commercial energy. Latin America saw little improvement, while China and especially the Middle East made above-average progress in providing access to modern energy services.” (33)
UNDP. (2000). World Energy Assessment. New York, NY, USA: United Nations Development Programme.
Relevant discussion to energy security concerns
Various Global Economy and sectoral data
“The link between energy use and economic activity is neither static nor uniform across regions. In the past, energy and economic development were closely related. But this relationship does not necessarily hold at higher levels of economic development. During 1960–78 changes in primary energy use and GDP grew at the same rate in OECD countries (figure 1.1). Thereafter, a change in elasticity between

43
energy and economic activity suggests that the often-postulated one-to-one relationship between primary energy use and economic activity can be changed, at least temporarily. Because of its versatility, convenience, cleanliness (at point of use), and productivity-enhancing features, the increase in electricity use has outpaced GDP growth in all regions—often by a large margin. In addition, the efficiency of converting electricity from final energy to energy services is the highest of all fuels. “ (34) It appears that economies are more sensitive to price changes than to price levels “Energy security—the continuous availability of energy in varied forms, in sufficient quantities, and at reasonable prices—has several aspects. It means limited vulnerability to transient or longer disruptions of imported supplies. It also means the availability of local and imported resources to meet growing demand over time and at reasonable prices” (112) Energy insecurity and shortages affect countries in two ways: they handicap productive activities, and they undermine consumer welfare. Energy insecurity discourages investors by threatening production and increasing costs. Shortages in electricity supplies (as in many developing countries) require more investment for on-site electricity production or standby supplies. For small investors, the cost of operation is increased, since electricity from private small-scale generation is more expensive than public national supplies (113) “For any economy, an unreliable energy supply results in both short- and long-term costs. The costs are measured in terms of loss of welfare and production, and the adjustments that consumers (such as firms) facing unreliable fuel and electric power supplies undertake to mitigate their losses. Interruptions in supply may trigger loss of production, costs related to product spoilage, and damage to equipment. The extent of these direct economic costs depends on a host of factors, such as advance notification, duration of the interruption, and timing of the interruption, which relates to the time of day or season and to the prevailing market conditions and demand for the firm’s output. These direct costs can be very high. In addition, the economy is affected indirectly because of the secondary costs that arise from the interdependence between one firm’s output and another firm’s input. “ (113)
Taylor, R., Govindarajalu, C., Levin, J., Meyer, A. S.,
& Ward, W. A. (2008). Financing Energy Efficiency: Lessons
This book reviews the reasons for the success or failure of a range of recent energy efficiency programs in developing countries and economies in transition.
Review of projects’ success and failures
Brazil, China, India and developing nations as a bloc.
“In the world as a whole, but especially in these rapidly growing developing countries, efficiency improvements to generate more
economic output with less energy input is essential for reasons of energy supply security, economic competitiveness, improvement in
“The challenge for governments in this case is to influence the broad technology choice decisions of investors and encourage them to adopt energy efficiency solutions.

44
livelihoods, and environmental sustainability.“ (3) The main tools that governments can use to intervene here are policy“ (4)
“Eighty percent of the world’s economic growth during 2004–30 is expected to occur in the non-
OECD countries. As the developing countries seek to gain at least a modest level of
prosperity, their energy demand is expected to almost double in the IEA Reference Scenario,
adding 4.2 btoe to global demand” (24)
from Brazil, China, India and Beyond. Washington DC: The World Bank Group.
Economy level energy use.
“In addition to the mobilization of resources to meet rising energy demand, a leading concern of
most countries is ensuring their security of energy supply. Most countries are net energy importers, and rely on energy trade to obtain the mix of new energy sources needed, affecting
their trade balances. A related concern is the prospect of sharp price increases and overall
volatility in energy costs, stemming from tightening supply and potential disruptions in delivery.” (26)
Direct rebound effects: “Improved energy efficiency for a particular energy service will
decrease the effective price of that service and should therefore lead to an increase in consumption of that service. This will tend to
offset the reduction in energy consumption provided by the efficiency improvement” (637)
“The policy implication is that non-price regulations to improve energy efficiency may neither reduce energy demand
nor help to mitigate climate change.” (637)
Sorrell, S., & Dimitropoulos, J. (2008). The rebound effect: Microeconomic definitions, limitations and extensions. Ecological Economics , 65, 636-649.
This paper examines the definition and measurement of the direct rebound effect for individual energy services. Indirect and economy-wide effects are not discussed. The focus throughout is on energy efficiency improvements in consumer goods.
Literature review Universal definitions are the focus, with some anecdotal references to
the US Indirect effects: “The lower effective price of the energy service may lead to changes in the demand for other goods, services, and factors of
production that also require energy for their provision. For example, the cost savings obtained
from a more efficient central heating system may be put towards an overseas holiday” (637)

45
Economy wide effects: “A fall in the real price of energy services may reduce the price of
intermediate and final goods throughout the economy, leading to a series of price and quantity adjustments, with energy-intensive goods and
sectors likely to gain at the expense of less energy-intensive ones.”
Global or n/a. macro level focus.
“Since energy-efficiency improvements reduce the marginal cost of energy services such as travel, the consumption of those services may be expected to increase. This increased consumption of energy services may be expected to offset some or all of the predicted reduction in energy consumption. “ (1457)
Sorrell, S. (2009). Jevons' Paradox revisited: The evidence for backfire from improved energy efficiency. Energy Policy , 37, 2310-2317.
“While the evidence remains ambiguous, the central argument is that energy—and by implication improved energy efficiency—plays a significantly more important role in economic growth than is assumed within mainstream economics. “ (1457)
Literature review/critique
(page 1457)

46
(page 1459)
“While many studies demonstrate strong correlations between economic output and energy consumption, the extent to which the
growth in economic output can be considered a cause of the increased energy consumption, or vice versa, remains unclear. “ (1460)
“The conventional wisdom (as represented by both neoclassical and ‘endogenous’ growth
theory) is that increases in energy inputs play a relatively minor role in economic growth, largely because energy accounts for a relatively small share of total costs” (1460)
“This view has been contested by ecological economists, who argue instead that the increased
availability of ‘high quality’ energy inputs has been the primary driver of economic growth
over the last two centuries” (1460)
“This review suggests several possible avenues for research, which may supplement attempts to quantify rebound effects. First, econometric and decomposition techniques could be used to better understand the source of changes in aggregate energy efficiency (e.g. the relative contribution of structural change, technical change, input substitution, changes in fuel
mix and other factors) (Sue Wing, 2008). Second, these techniques could also be used to investigate the extent to

47
“Cleveland et al. (1984) claim that a strong link exists between quality adjusted energy use and
economic output and this link will continue to exist, both temporally and cross-sectionally. This contrasts with the conventional wisdom
that energy consumption has been ‘decoupled’ from economic growth. They also claim that a
large component of increased labour productivity over the past 70 years has resulted from
empowering workers with increased quantities of energy, both directly and indirectly as embodied in capital equipment and technology. This contrasts with the conventional wisdom that productivity improvements have resulted from technical change. Other ecological economists
argue that the productivity of energy inputs is substantially greater than the share of energy in
total costs – again in contradiction to the conventional wisdom.”
which different types of energy efficiency improvement are associated with improvements in the productivity of other inputs and with improvements in total factor productivity.” (1468)
“…if increases in energy inputs contribute disproportionately to total factor productivity improvements and economic growth, then improvements in thermodynamic efficiency may do the same. Conversely, if increases in energy inputs contribute little to productivity improvements and economic growth, then neither should improvements in thermodynamic efficiency.”
Madlener, R., & Alcott, B. (2009). Energy Rebound and Economic Growth: A review of the main issues and research needs. Energy , 34 (4), 370-76.
“This paper summarises some of the discussions around the rebound effect, puts it into perspective to economic growth, and provides some insights at
the end that can guide future empirical research on the rebound topic. “ (1)
Summary of existing debates/ studies
Economy level focus
“A commonly found argument in standard growth theory literature is that technical change and
factor substitution can effectively de-couple economic growth from the demand for resources and environmental services” (7).
“Energy efficiency, as part of the technical progress in neo-classical growth theory, is conventionally seen as a driver of economic growth” (7).
“A further development of endogenous growth
“Increases in energy efficiency are no panacea for either energy conservation or economic growth and welfare; demand saturation and substitutability of input factors matter a great deal, and both of them change over time, as do our needs and wants.” (p. 9)

48
models to also account for rebound effects renders hope that in the future the relationship
between economic growth, technical change and resource use (and eventually the size of various
rebound effects on the macroeconomic level) can be better modeled and understood.” ”These sharp-penciled firms, and dozens like
them, know that energy efficiency improves the bottom line and yields even more valuable side
benefits: higher quality and reliability in energy efficient factories, 6 to 16% higher labour
productivity in efficient offices, and 40 percent higher sales in stores skilfully designed to be
illuminated primarily by daylight.
These savings act like a huge universal tax cut that also reduces the federal deficit. Far from dampening global development, lower energy bills accelerate it.
Lovins, A. (2005, September). More profit with less carbon. Scientific American , 74-82.
Advocating greater efficiency as a key to both econ growth and lower carbon, seeks to clarify some misconceptions.
Non theoretic discussion
USA; data is at sectoral or national level
The greatest opportunities, though, are in developing countries, which are on average
three times less efficient than the U.S.” (7)
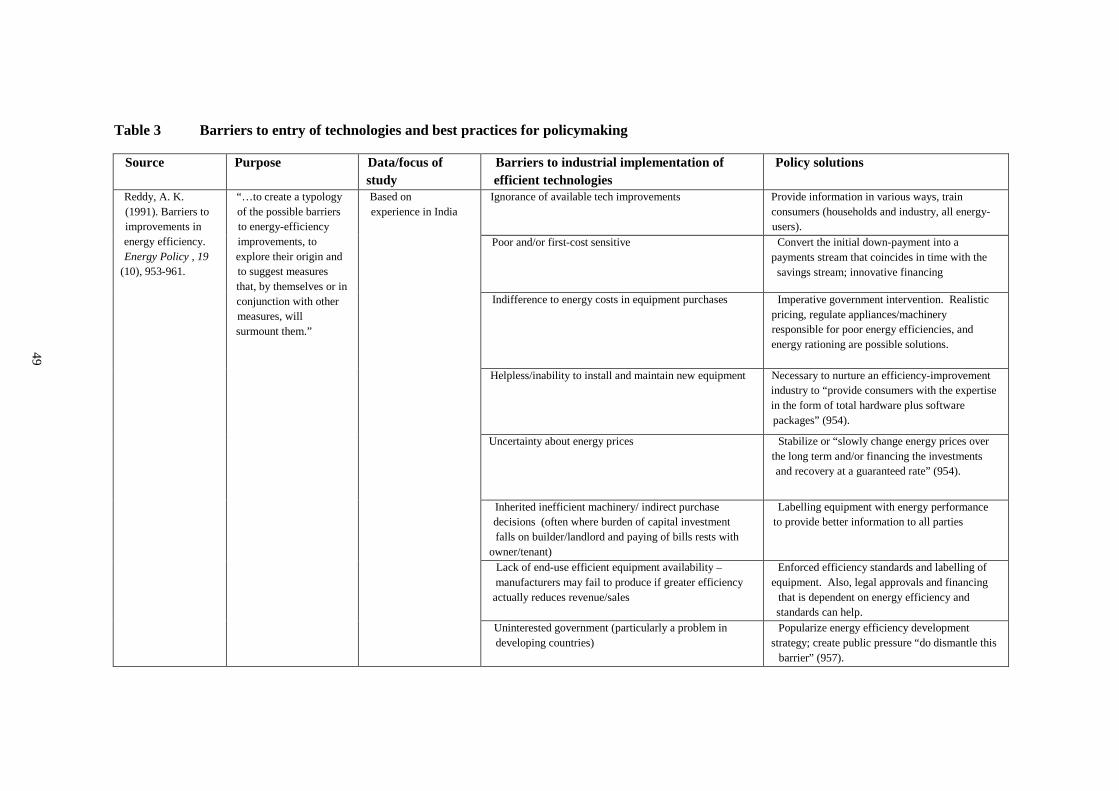
49
Table 3 Barriers to entry of technologies and best practices for policymaking
Source Purpose Data/focus of study
Barriers to industrial implementation of efficient technologies
Policy solutions
Ignorance of available tech improvements Provide information in various ways, train consumers (households and industry, all energy-users).
Poor and/or first-cost sensitive Convert the initial down-payment into a payments stream that coincides in time with the savings stream; innovative financing
Indifference to energy costs in equipment purchases Imperative government intervention. Realistic pricing, regulate appliances/machinery responsible for poor energy efficiencies, and energy rationing are possible solutions.
Helpless/inability to install and maintain new equipment Necessary to nurture an efficiency-improvement industry to “provide consumers with the expertise in the form of total hardware plus software packages” (954).
Uncertainty about energy prices Stabilize or “slowly change energy prices over the long term and/or financing the investments and recovery at a guaranteed rate” (954).
Inherited inefficient machinery/ indirect purchase decisions (often where burden of capital investment falls on builder/landlord and paying of bills rests with
owner/tenant)
Labelling equipment with energy performance to provide better information to all parties
Lack of end-use efficient equipment availability – manufacturers may fail to produce if greater efficiency actually reduces revenue/sales
Enforced efficiency standards and labelling of equipment. Also, legal approvals and financing
that is dependent on energy efficiency and standards can help.
Reddy, A. K. (1991). Barriers to improvements in energy efficiency. Energy Policy , 19
(10), 953-961.
“…to create a typology of the possible barriers to energy-efficiency improvements, to explore their origin and to suggest measures that, by themselves or in conjunction with other measures, will surmount them.”
Based on experience in India
Uninterested government (particularly a problem in developing countries)
Popularize energy efficiency development strategy; create public pressure “do dismantle this
barrier” (957).

50
Skills-short government Implement extensive and intensive training programs
Government without adequate training facilities “…special programmes to develop the required training facilities and to build up a cadre of
trainers.” “…represents an opportunity for collaboration both with other developing and
industrialized countries.” (957). Government without access to hardware and software Provide “access through continuously updated
menus of technologies for a particular energy service as well as menus of policies to
implement an improvement in a particular service” (958).
Capital-short government of an infrastructure-poor country
“this barrier has to be tackled by international aid and funding agencies in the same way as in the
case of poor and first-cost sensitive consumers: the first costs must be converted through loans or aid into operating costs”(958).
Powerless energy-efficiency agency Locate “energy-efficiency agency outside and above the energy system and under a sufficiently high political authority to ensure
that required measures are implemented across all sectors and entities” (958).
Cost-blind price-fixer –“energy prices in developing countries seldom reflect real costs of generating energy and the true costs to society”
Move “towards long-run marginal cost pricing and by ensuring that efficiency improvements are implemented along with price increases”
(958). Fragmented decision-maker Ensure “ that efficiency improvements are made
part of the same investment decision as energy supply expansion and that they are made in the same office by the same decision-maker. Also, efficiency improvements should be included in
the least-cost planning process” (958). Inefficient-technology exporter – developing countries “…assistance with technology assessment, by

51
depend on importing less-efficient technologies from developed countries
favouring energy-efficient technologies in aid programmes and by supporting technological leap-frogging in developing countries” (959).
Supply-biased international assistance Development must be measured by the level of energy services not the magnitude of energy consumption. Also, requires including efficiency improvements in the list of options
for providing services and pursuing least-cost planning.
Four criteria that must be satisfied by a successful large-scale programme that seeks to capture the full economic potential:
• it deals with the high consumer discount rate problem • it is profitable for the companies involved • it can avoid penalizing non-participants • it can ensure that estimated savings are close to actual savings
Promoting innovation rather than efficiency is also an effective way to improve energy efficiency.
UNDP. (2000). World Energy Assessment. New York, NY, USA: United Nations
Development Programme.
P. 206: Obstacles and Market Imperfections for Energy Efficiency and Related Policies: A scheme for Policy Options and Integrated Efficiency Policy (In general, not restricted to Industrial efficiency)

52
“But in practice, many obstacles and market
imperfections prevent profitable energy efficiency from being fully realised (Jochem and Gruber, 1990; Hirst, 1991; IEA, 1997a; Gardner and Stern, 1996; Reddy,
1991)” (200).
“Obstacles to end-use efficiency vary by country for many reasons, including technical education and training, entrepreneurial and household
traditions, the availability of capital, and existing legislation. Market imperfections include the external costs of energy use (Hohmeyer, Ottinger, and Rennings, 1997) as well as subsidies, traditional legislation and
rules, and traditions, motivations, and decision-

53
making in households, companies, and administrations. Finally, an inherent obstacle is
the fact that most energy efficiency investments remain invisible and do not contribute to politicians’ public image. The invisibility of
energy efficiency measures (in contrast to photovoltaic or solar thermal collectors) and the difficulty of demonstrating and quantifying their impacts are also important. Aspects of social
prestige influence the decisions on efficiency of private households—as when buying large cars (Sanstad and Howarth, 1994; Johchem, Sathave,
and Bouille, 2000).” (200). “Energy-intensive industries account for more than half of the industrial sector’s energy consumption in many developing countries (Dasgupta and Roy, 2000; IEA, 2003a; IEA, 2003b)” (9). “The disappointing results from these misapplications can provide a serious disincentive for any subsequent effort to achieve greater energy efficiency” (6). “The key to effective industrial energy efficiency policy is consistency, transparency, engagement of industry in program design and implementation, and, most importantly, allowance for flexibility of industry
response” (2). Some reasons for investment in energy efficiency: Cost reduction; Improved operational reliability and control; Improved product quality; Reduced waste stream; Ability to increase production without requiring additional, and possibly constrained, energy supply; Avoidance of capital expenditures through greater utilization of existing equipment assets; Recognition as a “green company”; and Access to investor capital through demonstration of effective
management practices.
The Industrial Standards Framework proposes a link between ISO 9000/14000 quality and
environmental management systems and industrial energy efficiency. Industrial standards framework includes: target-setting agreements, an energy management standard, system optimization training and tools,
capacity building to create system optimization experts, now and in the future,
a System Optimization Library to document and sustain energy efficiency gains, and
tax incentives and recognition. In addition, the Framework could accommodate: standardized system optimization methodologies certification of energy efficiency projects for trading energy efficiency credits
The purpose of the Framework is to introduce a standardized and transparent methodology into industrial energy efficiency projects and
practices; and builds on existing knowledge of best practices.
McKane, A., Price, L., & de la Rue du Can, S. (2007). Policies for Promoting Industrial Energy Efficiency in Developing Countries and
Transition Economies. Background Paper for the UNIDO Side Event on Sustainable Industrial
Development (pp. 1-87). Vienna: UNIDO. This paper presents a portfolio of policy options
under the organizing structure of the Industrial Standards Framework
“Luken (2007) compares regional levels of energy use intensities in 2004 and calculates that if all developing
Target setting agreements that “provide strong economic incentives as well as technical and

54
countries met the developed country average manufacturing energy use intensity, energy
consumption could potentially be reduced by 70%” (11).
financial support to participating industries” “have been used by a number of governments as a mechanism for promoting energy efficiency within the industrial sector.” (p. 30) Key elements of a target setting program: • target-setting process; • identifying energy-saving technologies and measures, using energy-efficiency tools, guidebooks; • benchmarking current energy efficiency practices, • establishing an energy management plan (see Section 4.3 below); • conducting energy-efficiency audits; • developing an energy-savings action plan; • developing incentives and supporting policies; • measuring and monitoring progress toward
targets, and • program evaluation.
Potential industrial energy efficiency gains are larger in developing countries “where old, inefficient technologies have continued to be used to meet
growing material demands” (3).
Energy Management Standards – provides guidance for industrial facilities to integrate energy efficiency into their management practices by requiring facilities to develop energy management plans.
A focus on individual component energy efficiency means a potential failure to adopt processes, which would improve the whole system efficiency. System energy efficiency requires attention to the entire
system.
System Optimization and Capacity Building – seeks to design an industrial system to achieve “a balance between cost and use that applies energy resources as efficiently as possible” (47). Generally, this kind of optimization is not taught
in universities and requires additional special training to create a “cadre of highly skilled system optimization experts.”
“The presence of energy-efficient components, while important, provides no assurance that an industrial system will be energy-efficient. Misapplication of energy-efficient equipment (such as variable speed drives) in these systems is common.” (5-6).
Documenting for Sustainability – “ISO 9000/14000 Series Standards would require continuously monitoring an organization’s adherence to the new energy system-operating paradigm” (49). Also, a systems optimization

55
library would better enable firms to comply with the energy management standards and energy efficiency projects.
Macroeconomic conditions – Low level of competition among firms resulting from regulation of the domestic market and/or policies that
constrain entry of imported products into the market High tariffs on imported goods Low level of capital market development
High rate of inflation Uncertain status of firms (in transitioning economies) High level of income inequality Weaknesses in the legal framework
Improving information about energy efficiency opportunities Marketing and consumer education Information systems and databases Decisions support tools
Best practices guidelines Common user specifications Demonstrations Product labelling and rating (comparison or
endorsement) Energy audits
Energy pricing prices - may not reflect cost of supply due to lack of marginal cost pricing or time-of-day
pricing, or the presence of price subsidies prices do not incorporate externalities weak feedback between energy consumption and payment for energy
Financing of energy efficiency investments Leasing Performance contracting (transfers some tech and management risk away, minimizes up-front cash requirements)
Vendor financing Special-purpose funds (across specific end-uses, where credit analysis can be reduced by having
similar end-user credits, where capital demand is large enough to justify a fund, and to assist an existing association in marketing its finance
program to its members) Utility financing programs
International flows of capital, technology, and knowledge restrictions on capital flows (unreliable and restrictive policies, and fluctuating exchange rates) restrictions on technology flows (MNC practices and governmental policies, small market size/inability to gain local production technologies) barriers to knowledge and communication flows (lack of resources including publications and reliable internet access)
Minimum efficiency standards Equipment efficiency standards Building energy codes
Meyers, S. (1998). Improving energy efficiency: strategies for supporting sustained market evolution in developing and transitioning countries. Berkeley: Lawrence Berkeley Laboratory.
“This report represents a framework for considering market-oriented strategies for improving energy efficiency that recognize the conditions of developing… countries.” Discusses policies to overcome barriers.
Institutional weaknesses - inadequate education and Market aggregation and technology procurement
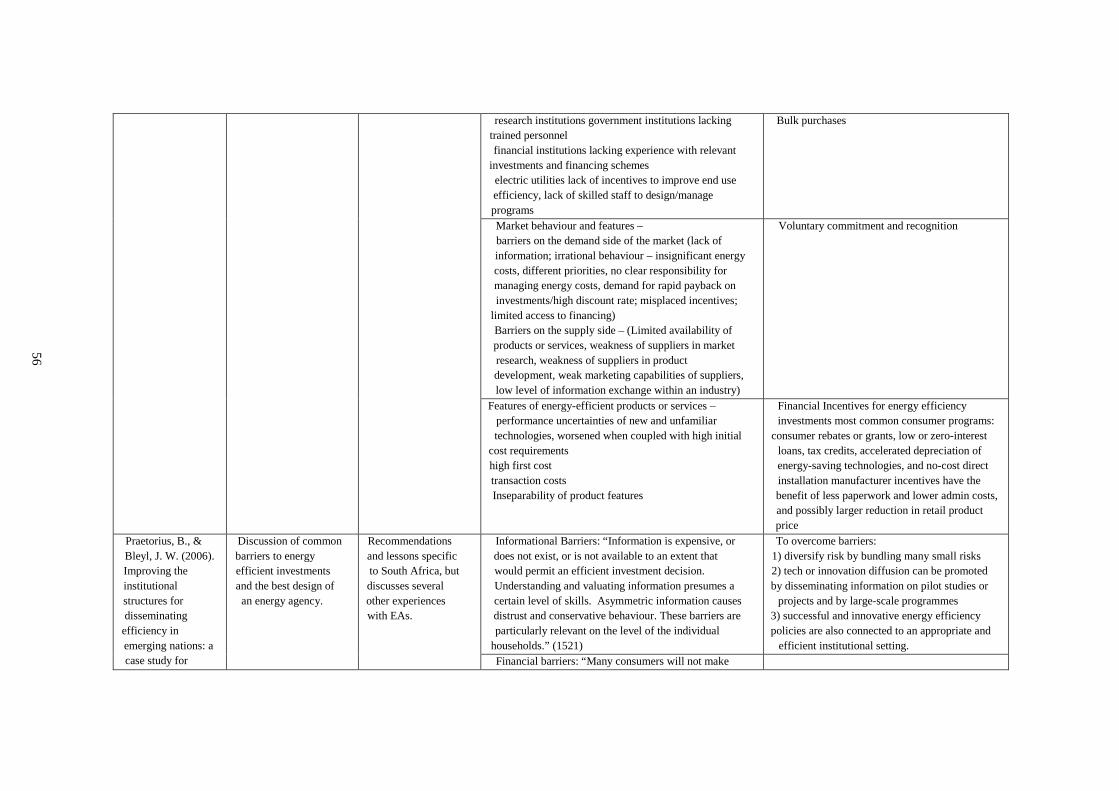
56
research institutions government institutions lacking trained personnel financial institutions lacking experience with relevant
investments and financing schemes electric utilities lack of incentives to improve end use efficiency, lack of skilled staff to design/manage programs
Bulk purchases
Market behaviour and features – barriers on the demand side of the market (lack of information; irrational behaviour – insignificant energy costs, different priorities, no clear responsibility for managing energy costs, demand for rapid payback on investments/high discount rate; misplaced incentives;
limited access to financing) Barriers on the supply side – (Limited availability of products or services, weakness of suppliers in market research, weakness of suppliers in product development, weak marketing capabilities of suppliers, low level of information exchange within an industry)
Voluntary commitment and recognition
Features of energy-efficient products or services – performance uncertainties of new and unfamiliar technologies, worsened when coupled with high initial
cost requirements high first cost transaction costs Inseparability of product features
Financial Incentives for energy efficiency investments most common consumer programs:
consumer rebates or grants, low or zero-interest loans, tax credits, accelerated depreciation of energy-saving technologies, and no-cost direct installation manufacturer incentives have the benefit of less paperwork and lower admin costs, and possibly larger reduction in retail product price
Informational Barriers: “Information is expensive, or does not exist, or is not available to an extent that would permit an efficient investment decision. Understanding and valuating information presumes a certain level of skills. Asymmetric information causes distrust and conservative behaviour. These barriers are particularly relevant on the level of the individual
households.” (1521)
To overcome barriers: 1) diversify risk by bundling many small risks 2) tech or innovation diffusion can be promoted by disseminating information on pilot studies or
projects and by large-scale programmes 3) successful and innovative energy efficiency policies are also connected to an appropriate and
efficient institutional setting.
Praetorius, B., & Bleyl, J. W. (2006). Improving the institutional structures for disseminating efficiency in emerging nations: a case study for
Discussion of common barriers to energy efficient investments and the best design of an energy agency.
Recommendations and lessons specific to South Africa, but discusses several other experiences with EAs.
Financial barriers: “Many consumers will not make

57
investments in energy efficiency because they lack capital to buy new energy-efficient equipment or make
the required retrofit in their installations” (1521) Technological barriers and infrastructure: “Several opportunities to produce and to conserve energy depend on new technologies that may not be available in some countries or regions. Also, many new and efficient technologies incorporate electronic components which
rely on good quality power to operate.” (1521-22)
Bounded rationality: “…linked to the first barrier above, i.e. information cost: Based on his/her experience, it may at least seem (or even be) rational to avoid further information cost and to take a “satisficing” rather than a theoretically optimal
decision” (1522).
Discrepancies in discount rate: “Innovative energy efficiency investments or programmes often involve a number of actors with different perceptions of costs and benefits, risks and uncertainties. Utilities, large consumers and government can more easily afford
investments with longer pay-back periods” (1522)
energy agencies in South Africa. Energy Policy, 34, 1420-1531.
Diversity of investment criteria and limited resources: “Even when a certain investment in energy efficiency is cost effective, it may not be the first investment criterion.” Also, inconveniences may be related to new energy technologies, and the necessary investment may therefore be declined. (1522).
Information barriers “Reduce energy subsidies, as they tend to lower energy productivity” (3).
Capital constraints Provide incentives to utilities to improve energy efficiency and to encourage their customers (including industries) to do the same.
Insulation from true price of energy Implement and enforce energy efficiency standards to boost production of more efficient
appliances and equipment and to reduce their cost.
Farell, D., & Remes, J. (2009). Promoting energy efficiency in the developing world. McKinsey &
Company.
Developing countries
Today’s tighter credit markets are making any Encourage “public-private partnerships, such as

58
investments more difficult, even less risky one such as those in energy efficiency
collaborations between governments, energy service companies, utilities, and mortgage companies, to finance higher energy efficiency
in buildings” (5). Brazil, China and India faced the following key impediments to energy efficiency investment: “current high transaction costs; perceived high risks driving up the implicit discount rates associated with projects; and difficulties in structuring workable contracts for preparing, financing, and implementing energy efficiency investments” (50).
Common impediments: • lack of information
• lack of trained personnel or technical or managerial expertise • below long-run marginal cost pricing and other price distortions (in some cases) • regulatory biases or absence • high transaction costs • high initial capital cost or lack of access to credit • high user discount rates • mismatch of the incidence of investment costs and energy savings • higher perceived risks of the more efficient technology
Taylor, R., Govindarajalu, C., Levin, J., Meyer, A. S., & Ward, W. A. (2008). Financing Energy Efficiency: Lessons from Brazil, China, India and Beyond. Washington DC: The World Bank Group.
Also: missing or incomplete markets, in particular for
financial risk Political and economic uncertainty Weak contracting institutions (legal systems) result in insecure contracts with low certainty of equitable enforcement
Energy Sector Management Assistance Program. (2006). Energy Efficiency
Energy efficiency promotion activities for Industry: Regulation measures Tax incentives
Energy efficiency funds and low interest loans Performance codes, standards, incentives and regulations
Findings of the 3 country study: “Overall, the conclusions show that success requires careful
diagnostic work at the beginning of the project, flexibility in design and arrangements to cover high labor intensities during implementation

59
Investment Forum: Scaling up Financing in the Developing World. Washington DC: The World Bank Group.
Mandatory/compulsory energy efficiency targets Technical assistance and small business programs Energy audits for factories Product labelling, rating, certification and retro-commissioning Energy conservation management Recognition programs, technology adaptation and upgrades; and bulk procurements
and program development. The World Bank found that the development of financially viable
energy savings projects remains blocked by the underdeveloped state of project delivery
mechanisms. Developing appropriate delivery mechanisms is an institutional issue which must
be addressed as delivery mechanisms serve market development, project identification and
financing functions. Well-running project delivery mechanisms must match local institutional environments. The main project delivery options include energy efficiency
lending programs through local banks, partial risk loan guarantee programs, direct financial
investment, revolving loan programs, ESCOs and utility DSM programs” (32).


Printed in AustriaV.11-87135—December 2011—300
UNITED NATIONS INDUSTRIAL DEVELOPMENT ORGANIZATIONVienna International Centre, P.O. Box 300, 1400 Vienna, AustriaTelephone: (+43-1) 26026-0, Fax: (+43-1) 26926-69E-mail: [email protected], Internet: www.unido.org