industrial land in russian cities: finance, investment and...
TRANSCRIPT
Industrial land in Russian cities: finance, investment and re-allocation*
William Pyle Economics Department Middlebury College
* Much of the material presented comes from a working paper co-authored with Alexei Karas and Koen Schoors
CIRANO Montreal, Canada February 22, 2013
(1) greater ability to use land as collateral to secure loans, thereby by
making it more easy to access external financing (“de Soto effect”)
Hypotheses: with more secure land rights,
economic actors (firms) have …
(2) stronger incentive to invest due to diminished expropriation threat
(3) more willingness and ability to dispose of (re-allocate) land to third
parties
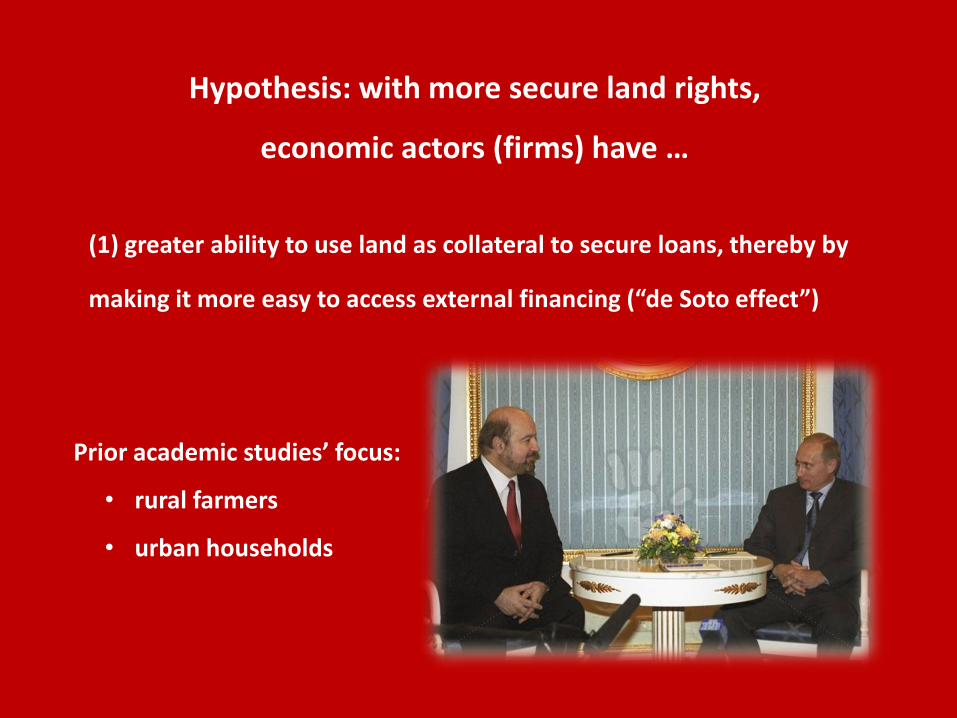
(1) greater ability to use land as collateral to secure loans, thereby by
making it more easy to access external financing (“de Soto effect”)
Hypothesis: with more secure land rights,
economic actors (firms) have …
Prior academic studies’ focus:
• rural farmers
• urban households
Why these are interesting and important issues for Russia
Evolution of land policy at national and regional levels
Survey evidence
Brief outline

Industrial land as share of built-up area
0
5
10
15
20
25
30
35
40
45
50
Russia
CEE
Rest of world
A. Bertaud, 2003. “Spatial structures of Central and East European Cities.”
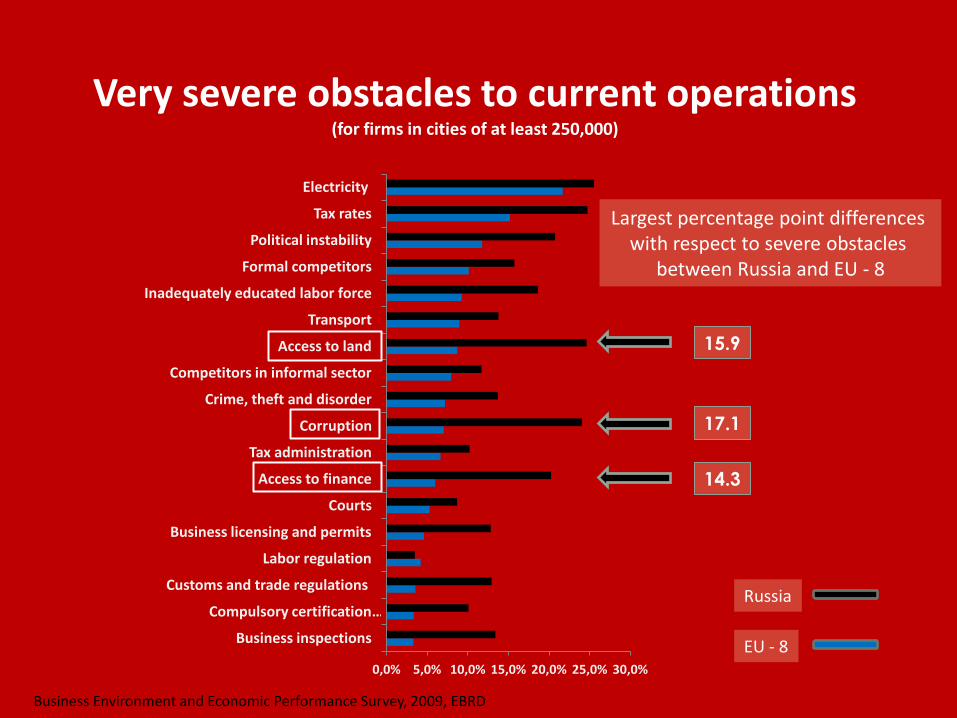
0,0% 5,0% 10,0% 15,0% 20,0% 25,0% 30,0%
Business inspections
Compulsory certification …
Customs and trade regulations
Labor regulation
Business licensing and permits
Courts
Access to finance
Tax administration
Corruption
Crime, theft and disorder
Competitors in informal sector
Access to land
Transport
Inadequately educated labor force
Formal competitors
Political instability
Tax rates
Electricity
Very severe obstacles to current operations (for firms in cities of at least 250,000)
Business Environment and Economic Performance Survey, 2009, EBRD
14.3
17.1
15.9
Russia
EU - 8
Largest percentage point differences with respect to severe obstacles
between Russia and EU - 8
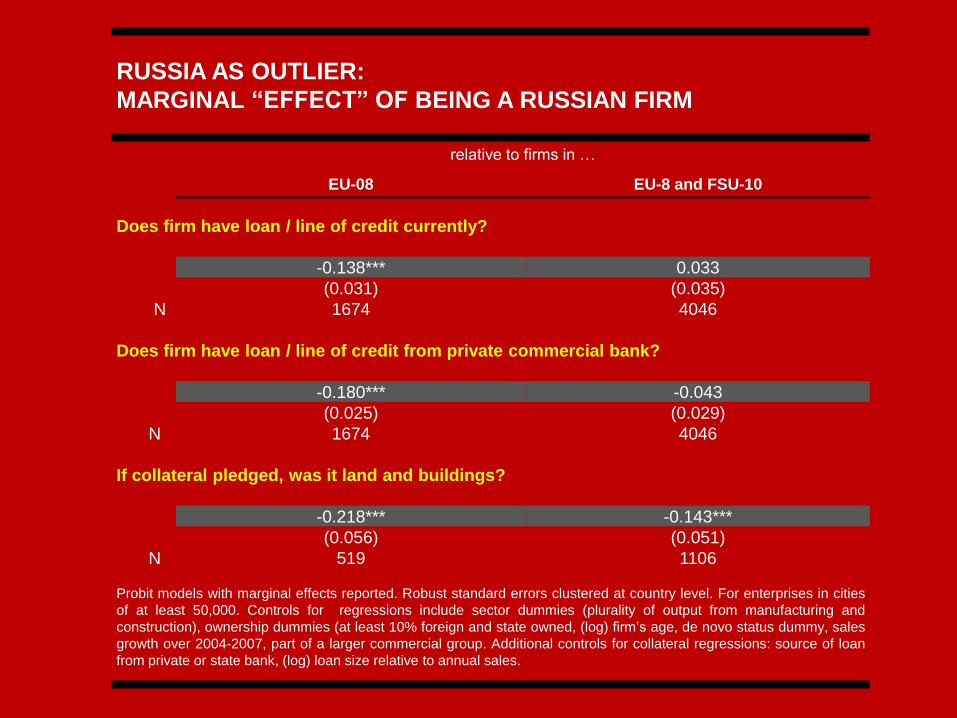
RUSSIA AS OUTLIER:
MARGINAL “EFFECT” OF BEING A RUSSIAN FIRM
relative to firms in …
EU-08 EU-8 and FSU-10
Does firm have loan / line of credit currently?
-0.138*** 0.033
(0.031) (0.035)
N 1674 4046
Does firm have loan / line of credit from private commercial bank?
-0.180*** -0.043
(0.025) (0.029)
N 1674 4046
If collateral pledged, was it land and buildings?
-0.218*** -0.143***
(0.056) (0.051)
N 519 1106
Probit models with marginal effects reported. Robust standard errors clustered at country level. For enterprises in cities
of at least 50,000. Controls for regressions include sector dummies (plurality of output from manufacturing and
construction), ownership dummies (at least 10% foreign and state owned, (log) firm’s age, de novo status dummy, sales
growth over 2004-2007, part of a larger commercial group. Additional controls for collateral regressions: source of loan
from private or state bank, (log) loan size relative to annual sales.

LOAN SIZE AND COLLATERAL TYPE:
CONDITIONAL ON REPORTING A CURRENT LOAN
sample includes firms in Russia and …
EU-08 EU-8 and FSU-10
Pledged land and/or buildings 0.081* 0.049***
(0.039) (0.011)
Country fixed effects Yes Yes
R2 0.10 0.09
N 519 1106
OLS model with loan value relative to sales as dependent variable. Robust standard errors clustered at
country level. For enterprises in cities of at least 50,000. Controls for regressions include sector dummies
(plurality of output from manufacturing and construction), ownership dummies (at least 10% foreign and state
owned, (log) firm’s age, de novo status dummy, sales growth over 2004-2007, part of a larger commercial
group and whether loan from private or state bank.
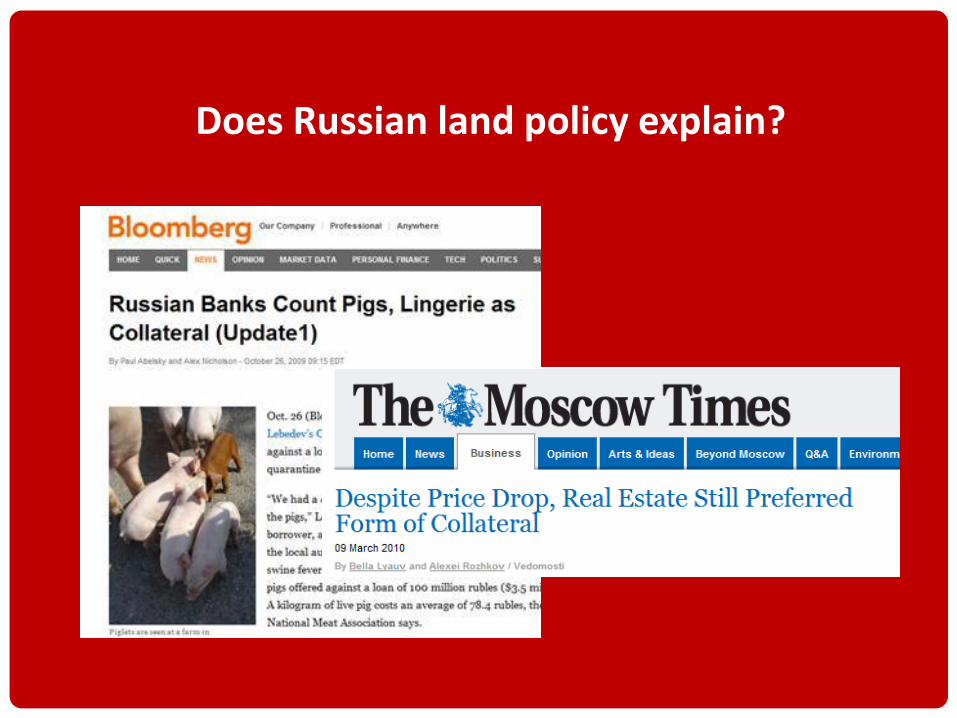
Does Russian land policy explain?
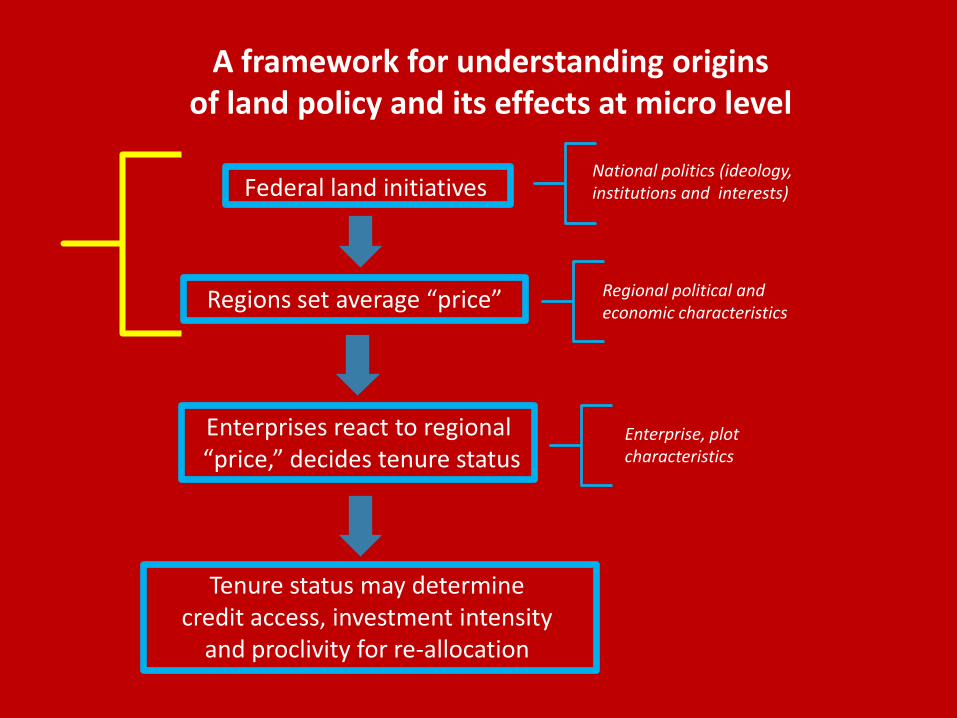
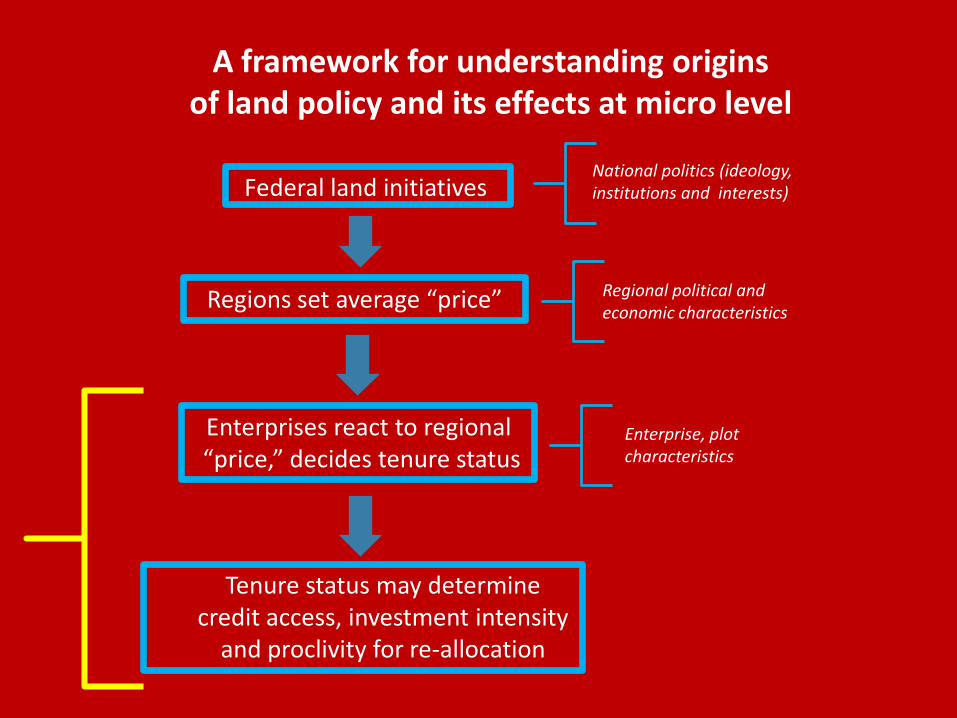
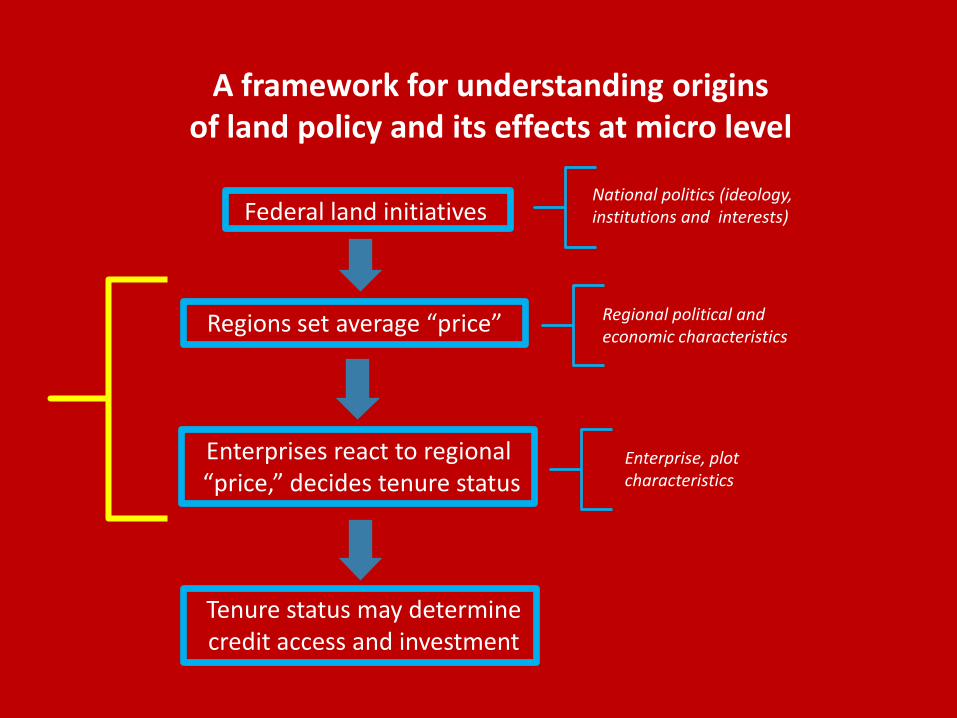
Federal land initiatives
Regions set average “price”
Enterprises react to regional “price,” decides tenure status
Regional political and economic characteristics
National politics (ideology, institutions and interests)
Enterprise, plot characteristics
A framework for understanding origins of land policy and its effects at micro level
Tenure status may determine credit access, investment intensity
and proclivity for re-allocation
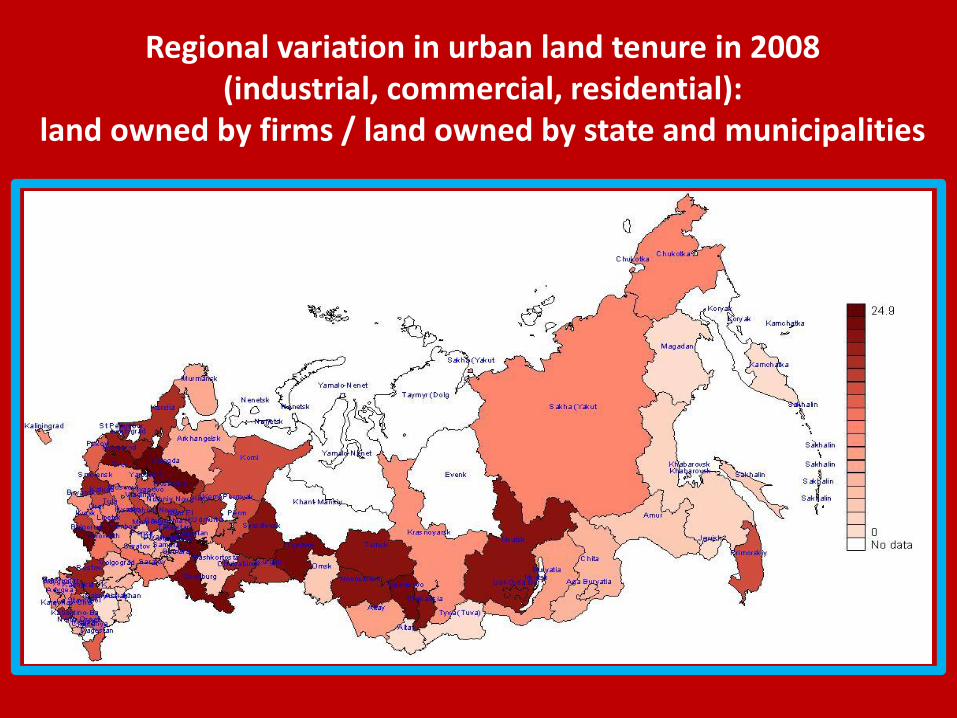
Regional variation in urban land tenure in 2008 (industrial, commercial, residential):
land owned by firms / land owned by state and municipalities
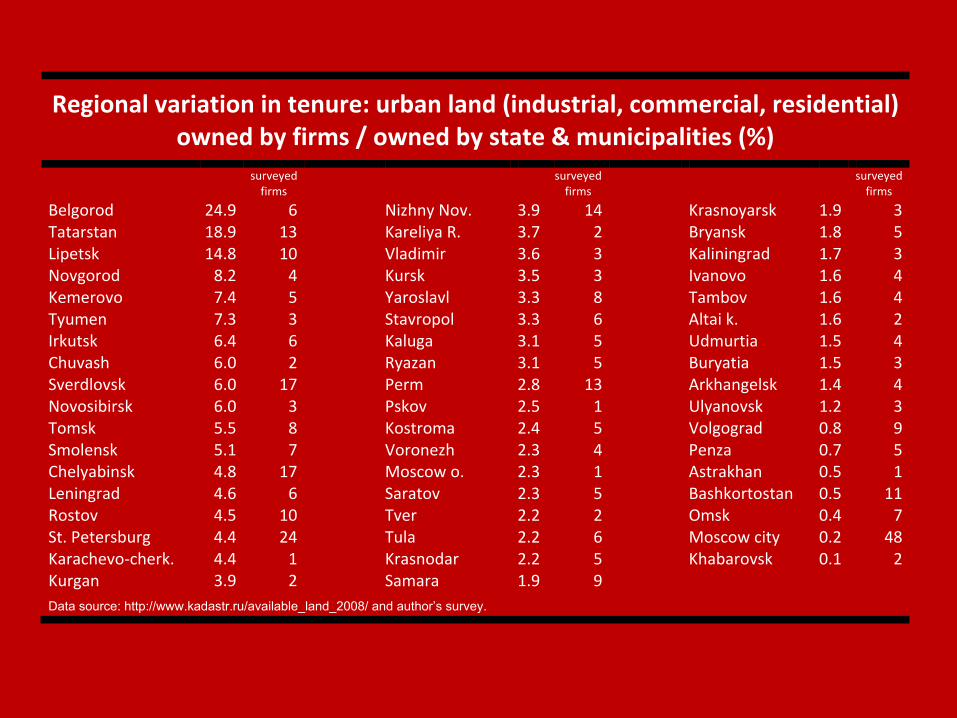
Regional variation in tenure: urban land (industrial, commercial, residential) owned by firms / owned by state & municipalities (%)
surveyed
firms
surveyed firms
surveyed firms
Belgorod 24.9 6 Nizhny Nov. 3.9 14 Krasnoyarsk 1.9 3 Tatarstan 18.9 13 Kareliya R. 3.7 2 Bryansk 1.8 5 Lipetsk 14.8 10 Vladimir 3.6 3 Kaliningrad 1.7 3 Novgorod 8.2 4 Kursk 3.5 3 Ivanovo 1.6 4 Kemerovo 7.4 5 Yaroslavl 3.3 8 Tambov 1.6 4 Tyumen 7.3 3 Stavropol 3.3 6 Altai k. 1.6 2 Irkutsk 6.4 6 Kaluga 3.1 5 Udmurtia 1.5 4 Chuvash 6.0 2 Ryazan 3.1 5 Buryatia 1.5 3 Sverdlovsk 6.0 17 Perm 2.8 13 Arkhangelsk 1.4 4 Novosibirsk 6.0 3 Pskov 2.5 1 Ulyanovsk 1.2 3 Tomsk 5.5 8 Kostroma 2.4 5 Volgograd 0.8 9 Smolensk 5.1 7 Voronezh 2.3 4 Penza 0.7 5 Chelyabinsk 4.8 17 Moscow o. 2.3 1 Astrakhan 0.5 1 Leningrad 4.6 6 Saratov 2.3 5 Bashkortostan 0.5 11 Rostov 4.5 10 Tver 2.2 2 Omsk 0.4 7 St. Petersburg 4.4 24 Tula 2.2 6 Moscow city 0.2 48 Karachevo-cherk. 4.4 1 Krasnodar 2.2 5 Khabarovsk 0.1 2 Kurgan 3.9 2 Samara 1.9 9
Data source: http://www.kadastr.ru/available_land_2008/ and author’s survey.
Federal land initiatives
Regions set average “price”
Enterprises react to regional “price,” decides tenure status
Regional political and economic characteristics
National politics (ideology, institutions and interests)
Enterprise, plot characteristics
A framework for understanding origins of land policy and its effects at micro level
Tenure status may determine credit access, investment intensity
and proclivity for re-allocation
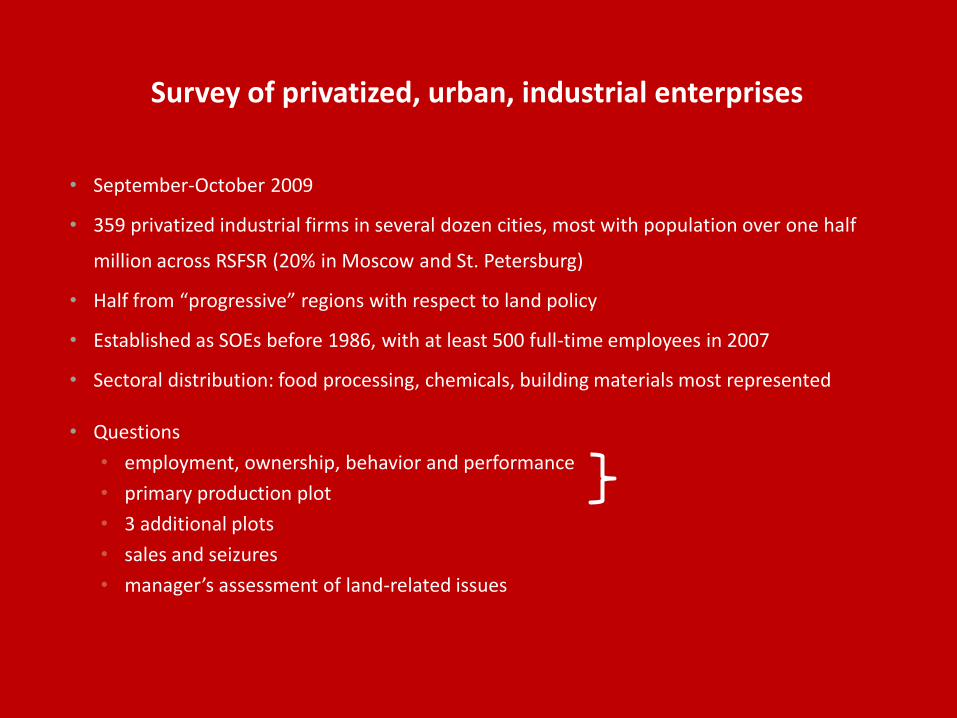
Survey of privatized, urban, industrial enterprises
• September-October 2009
• 359 privatized industrial firms in several dozen cities, most with population over one half
million across RSFSR (20% in Moscow and St. Petersburg)
• Half from “progressive” regions with respect to land policy
• Established as SOEs before 1986, with at least 500 full-time employees in 2007
• Sectoral distribution: food processing, chemicals, building materials most represented
• Questions
• employment, ownership, behavior and performance
• primary production plot
• 3 additional plots
• sales and seizures
• manager’s assessment of land-related issues

Credit access and investment activity
Private Lease Perpetual use
Degree to which difficulties accessing credit pose
problem for firm (1-5 scale) 2.75 * 2.83 3.46 ***
Intensity of investment activity in 2009 (1-5 scale) 2.76 ** 2.51 2.22 **
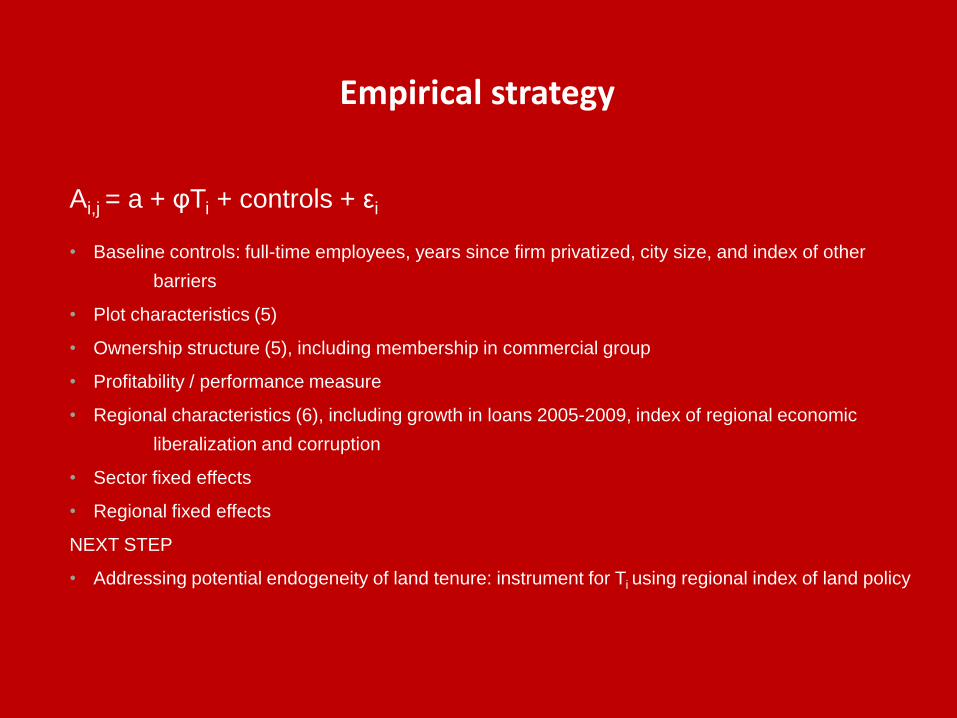
Ai,j = a + φTi + controls + εi
• Baseline controls: full-time employees, years since firm privatized, city size, and index of other
barriers
• Plot characteristics (5)
• Ownership structure (5), including membership in commercial group
• Profitability / performance measure
• Regional characteristics (6), including growth in loans 2005-2009, index of regional economic
liberalization and corruption
• Sector fixed effects
• Regional fixed effects
NEXT STEP
• Addressing potential endogeneity of land tenure: instrument for Ti using regional index of land policy
Empirical strategy
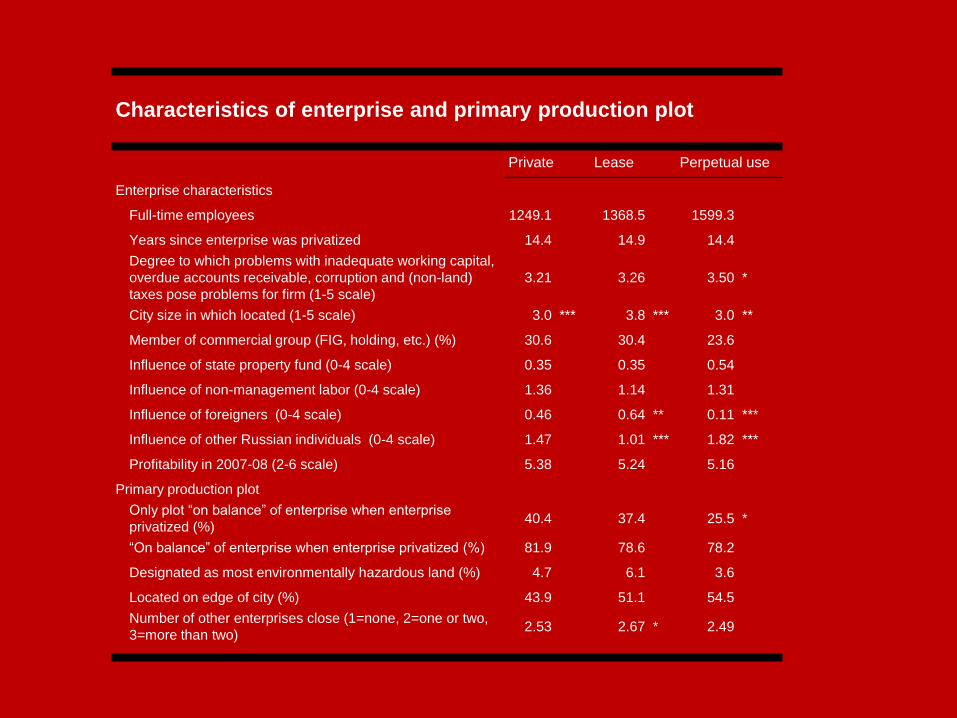
Characteristics of enterprise and primary production plot
Private Lease Perpetual use
Enterprise characteristics
Full-time employees 1249.1 1368.5 1599.3
Years since enterprise was privatized 14.4 14.9 14.4
Degree to which problems with inadequate working capital,
overdue accounts receivable, corruption and (non-land)
taxes pose problems for firm (1-5 scale)
3.21 3.26 3.50 *
City size in which located (1-5 scale) 3.0 *** 3.8 *** 3.0 **
Member of commercial group (FIG, holding, etc.) (%) 30.6 30.4 23.6
Influence of state property fund (0-4 scale) 0.35 0.35 0.54
Influence of non-management labor (0-4 scale) 1.36 1.14 1.31
Influence of foreigners (0-4 scale) 0.46 0.64 ** 0.11 ***
Influence of other Russian individuals (0-4 scale) 1.47 1.01 *** 1.82 ***
Profitability in 2007-08 (2-6 scale) 5.38 5.24 5.16
Primary production plot
Only plot “on balance” of enterprise when enterprise
privatized (%) 40.4 37.4 25.5 *
“On balance” of enterprise when enterprise privatized (%) 81.9 78.6 78.2
Designated as most environmentally hazardous land (%) 4.7 6.1 3.6
Located on edge of city (%) 43.9 51.1 54.5
Number of other enterprises close (1=none, 2=one or two,
3=more than two) 2.53 2.67 * 2.49
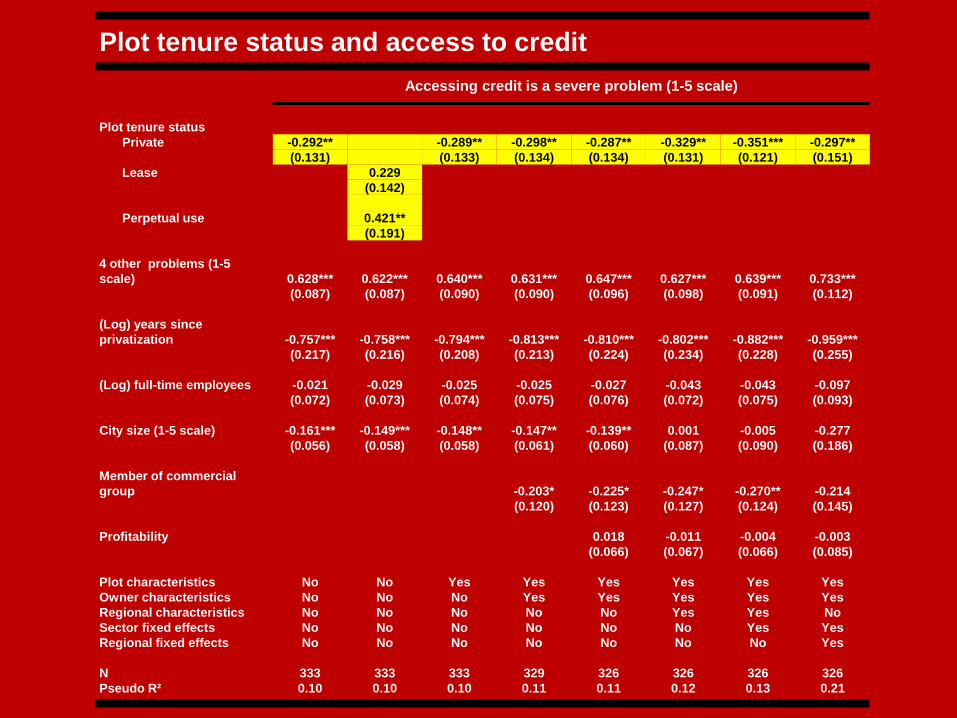
Plot tenure status and access to credit
Accessing credit is a severe problem (1-5 scale)
Plot tenure status
Private -0.292** -0.289** -0.298** -0.287** -0.329** -0.351*** -0.297**
(0.131) (0.133) (0.134) (0.134) (0.131) (0.121) (0.151)
Lease 0.229
(0.142)
Perpetual use 0.421**
(0.191)
4 other problems (1-5
scale) 0.628*** 0.622*** 0.640*** 0.631*** 0.647*** 0.627*** 0.639*** 0.733***
(0.087) (0.087) (0.090) (0.090) (0.096) (0.098) (0.091) (0.112)
(Log) years since
privatization -0.757*** -0.758*** -0.794*** -0.813*** -0.810*** -0.802*** -0.882*** -0.959***
(0.217) (0.216) (0.208) (0.213) (0.224) (0.234) (0.228) (0.255)
(Log) full-time employees -0.021 -0.029 -0.025 -0.025 -0.027 -0.043 -0.043 -0.097
(0.072) (0.073) (0.074) (0.075) (0.076) (0.072) (0.075) (0.093)
City size (1-5 scale) -0.161*** -0.149*** -0.148** -0.147** -0.139** 0.001 -0.005 -0.277
(0.056) (0.058) (0.058) (0.061) (0.060) (0.087) (0.090) (0.186)
Member of commercial
group -0.203* -0.225* -0.247* -0.270** -0.214
(0.120) (0.123) (0.127) (0.124) (0.145)
Profitability 0.018 -0.011 -0.004 -0.003
(0.066) (0.067) (0.066) (0.085)
Plot characteristics No No Yes Yes Yes Yes Yes Yes
Owner characteristics No No No Yes Yes Yes Yes Yes
Regional characteristics No No No No No Yes Yes No
Sector fixed effects No No No No No No Yes Yes
Regional fixed effects No No No No No No No Yes
N 333 333 333 329 326 326 326 326
Pseudo R² 0.10 0.10 0.10 0.11 0.11 0.12 0.13 0.21
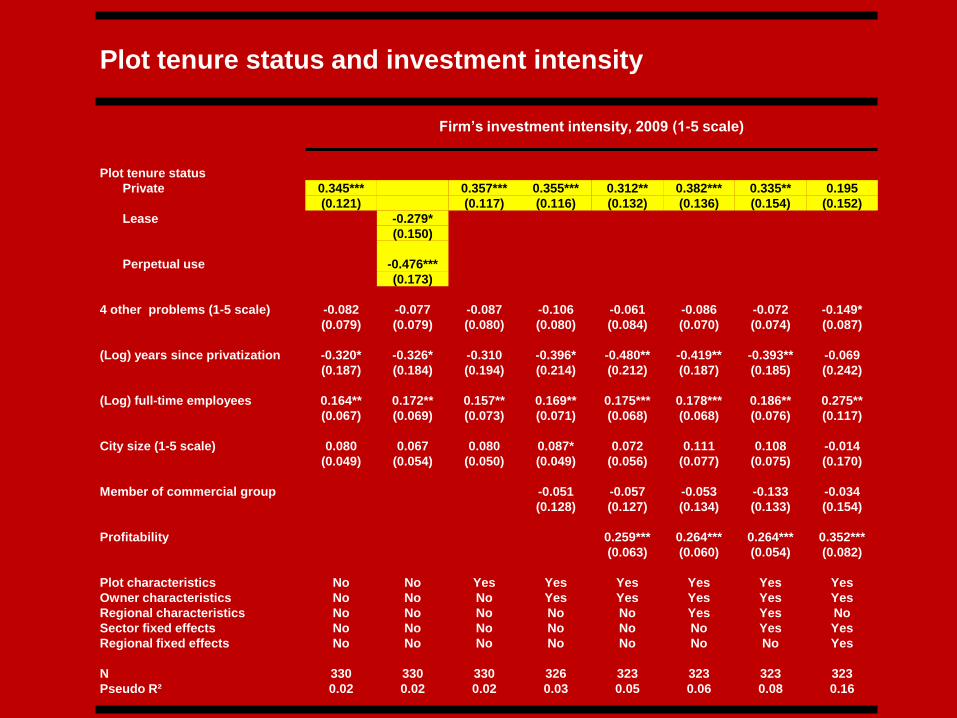
Plot tenure status and investment intensity
Firm’s investment intensity, 2009 (1-5 scale)
Plot tenure status
Private 0.345*** 0.357*** 0.355*** 0.312** 0.382*** 0.335** 0.195
(0.121) (0.117) (0.116) (0.132) (0.136) (0.154) (0.152)
Lease -0.279*
(0.150)
Perpetual use -0.476***
(0.173)
4 other problems (1-5 scale) -0.082 -0.077 -0.087 -0.106 -0.061 -0.086 -0.072 -0.149*
(0.079) (0.079) (0.080) (0.080) (0.084) (0.070) (0.074) (0.087)
(Log) years since privatization -0.320* -0.326* -0.310 -0.396* -0.480** -0.419** -0.393** -0.069
(0.187) (0.184) (0.194) (0.214) (0.212) (0.187) (0.185) (0.242)
(Log) full-time employees 0.164** 0.172** 0.157** 0.169** 0.175*** 0.178*** 0.186** 0.275**
(0.067) (0.069) (0.073) (0.071) (0.068) (0.068) (0.076) (0.117)
City size (1-5 scale) 0.080 0.067 0.080 0.087* 0.072 0.111 0.108 -0.014
(0.049) (0.054) (0.050) (0.049) (0.056) (0.077) (0.075) (0.170)
Member of commercial group -0.051 -0.057 -0.053 -0.133 -0.034
(0.128) (0.127) (0.134) (0.133) (0.154)
Profitability 0.259*** 0.264*** 0.264*** 0.352***
(0.063) (0.060) (0.054) (0.082)
Plot characteristics No No Yes Yes Yes Yes Yes Yes
Owner characteristics No No No Yes Yes Yes Yes Yes
Regional characteristics No No No No No Yes Yes No
Sector fixed effects No No No No No No Yes Yes
Regional fixed effects No No No No No No No Yes
N 330 330 330 326 323 323 323 323
Pseudo R² 0.02 0.02 0.02 0.03 0.05 0.06 0.08 0.16

Federal land initiatives
Regions set average “price”
Enterprises react to regional “price,” decides tenure status
Regional political and economic characteristics
National politics (ideology, institutions and interests)
Enterprise, plot characteristics
A framework for understanding origins of land policy and its effects at micro level
Tenure status may determine credit access and investment
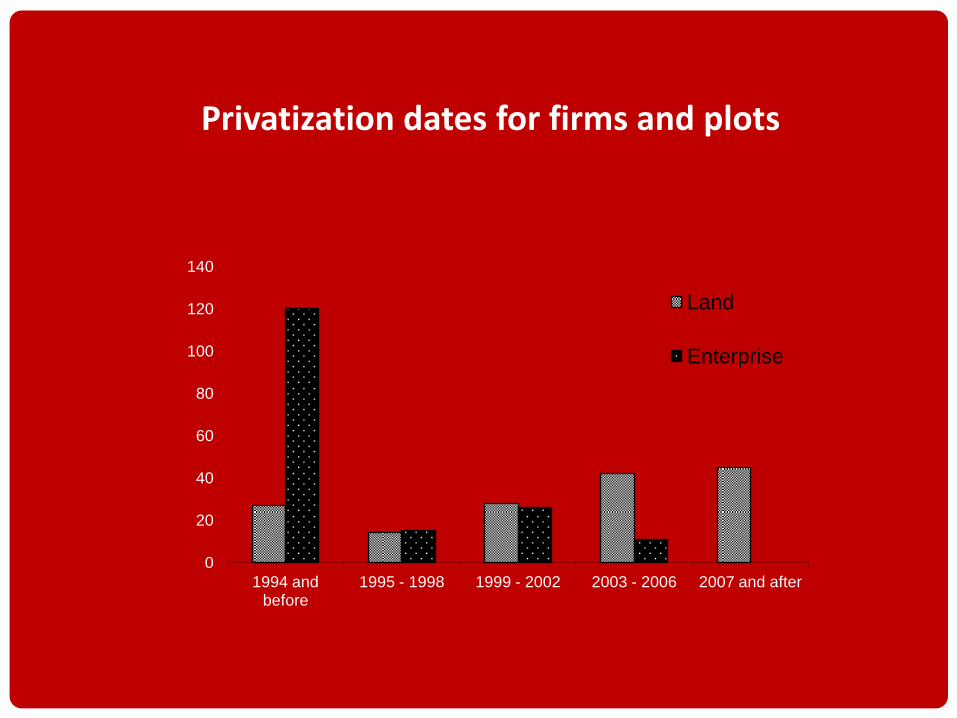
Privatization dates for firms and plots
0
20
40
60
80
100
120
140
1994 and before
1995 - 1998 1999 - 2002 2003 - 2006 2007 and after
Land
Enterprise

Opposition of local officials was barrier to
privatizing plot, 1-5 scale
All
Plot
privatized
before 2005
Plot
privatized
after 2000
(Log) urban commercial-residential-industrial
land owned by firms relative to that owned by
municipalities and government
-0.322** -0.544*** -0.382**
(0.150) (0.174) (0.182)
Other “barriers” control Yes Yes Yes
Sector controls Yes Yes Yes
Plot characteristics controls Yes Yes Yes
Owner controls Yes Yes Yes
N 168 105 108
Pseudo R2 0.19 0.29 0.29
Federal land initiatives
Regions set average “price”
Enterprises react to regional “price,” decides tenure status
Regional political and economic characteristics
National politics (ideology, institutions and interests)
Enterprise, plot characteristics
A framework for understanding origins of land policy and its effects at micro level
Tenure status may determine credit access and investment
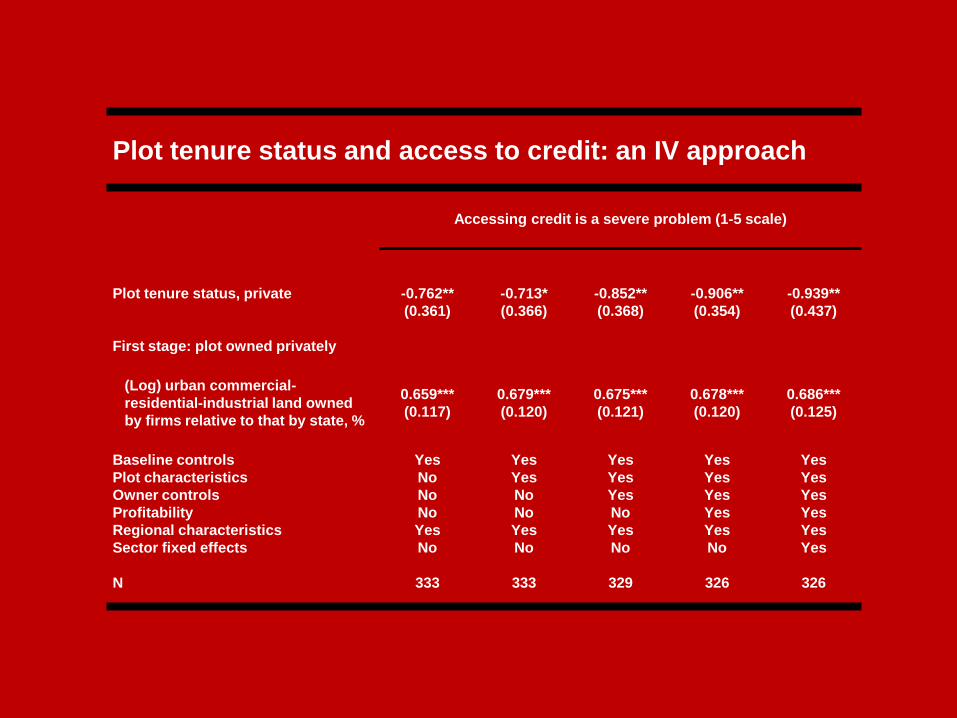
Plot tenure status and access to credit: an IV approach
Accessing credit is a severe problem (1-5 scale)
Plot tenure status, private -0.762** -0.713* -0.852** -0.906** -0.939**
(0.361) (0.366) (0.368) (0.354) (0.437)
First stage: plot owned privately
(Log) urban commercial-
residential-industrial land owned
by firms relative to that by state, %
0.659*** 0.679*** 0.675*** 0.678*** 0.686***
(0.117) (0.120) (0.121) (0.120) (0.125)
Baseline controls Yes Yes Yes Yes Yes
Plot characteristics No Yes Yes Yes Yes
Owner controls No No Yes Yes Yes
Profitability No No No Yes Yes
Regional characteristics Yes Yes Yes Yes Yes
Sector fixed effects No No No No Yes
N 333 333 329 326 326

Plot tenure and investment intensity: an IV approach
Firm’s investment intensity, 2009 (1-5 scale)
Plot tenure status, private 0.790** 0.812** 0.721** 0.732** 0.670**
(0.340) (0.348) (0.360) (0.334) (0.337)
First stage: plot owned privately
(Log) urban commercial-
residential-industrial land owned
by firms relative to that by state, %
0.658*** 0.679*** 0.670*** 0.675*** 0.703***
(0.116) (0.120) (0.123) (0.122) (0.126)
Baseline controls Yes Yes Yes Yes Yes
Plot characteristics No Yes Yes Yes Yes
Owner controls No No Yes Yes Yes
Profitability No No No Yes Yes
Regional characteristics Yes Yes Yes Yes Yes
Sector fixed effects No No No No Yes
N 330 330 326 323 323
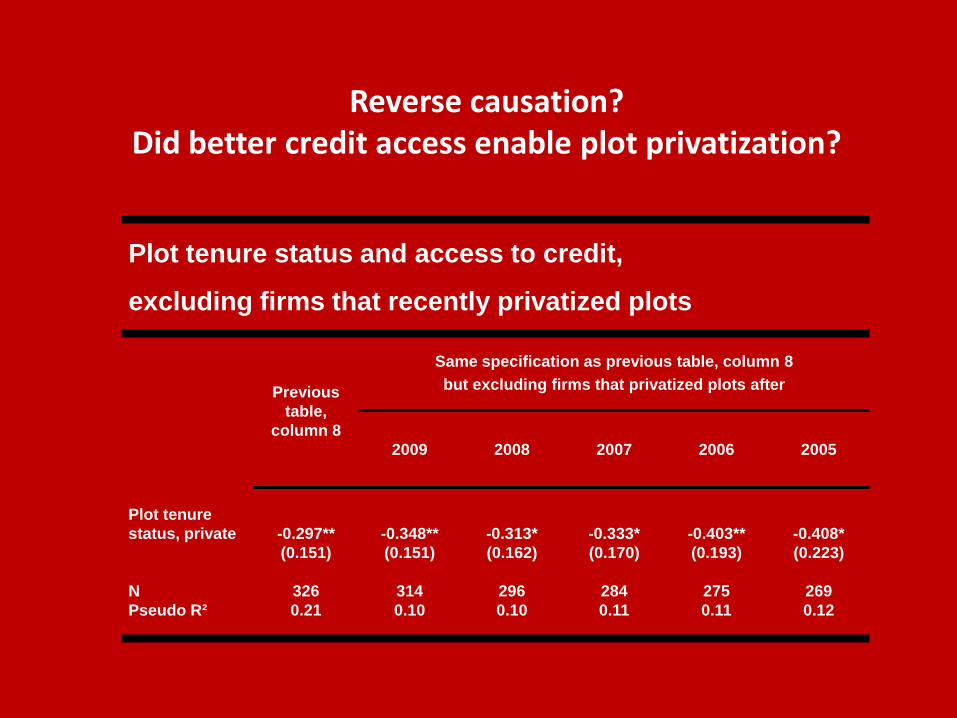
Plot tenure status and access to credit,
excluding firms that recently privatized plots
Previous
table,
column 8
Same specification as previous table, column 8
but excluding firms that privatized plots after
2009 2008 2007 2006 2005
Plot tenure
status, private -0.297** -0.348** -0.313* -0.333* -0.403** -0.408*
(0.151) (0.151) (0.162) (0.170) (0.193) (0.223)
N 326 314 296 284 275 269
Pseudo R² 0.21 0.10 0.10 0.11 0.11 0.12
Reverse causation? Did better credit access enable plot privatization?

Investment intensity in 2009 of firms whose plots privatized before 2009
Ordered probit models similar to previous table
Plot tenure status, private before 2009 0.299** 0.306** 0.303** 0.258* 0.319** 0.274* 0.064
(0.127) (0.123) (0.123) (0.134) (0.139) (0.152) (0.154)
Baseline controls Yes Yes Yes Yes Yes Yes Yes
Plot characteristics No Yes Yes Yes Yes Yes Yes
Owner controls No No Yes Yes Yes Yes Yes
Profitability No No No Yes Yes Yes Yes
Regional characteristics No No No No Yes Yes No
Sector fixed effects No No No No No Yes Yes
Regional fixed effects No No No No No No Yes
N 329 329 325 322 322 322 322
Pseudo R² 0.02 0.02 0.03 0.05 0.06 0.07 0.16
Reverse causation? Was investment intensity in 2009 related to purchasing plot?
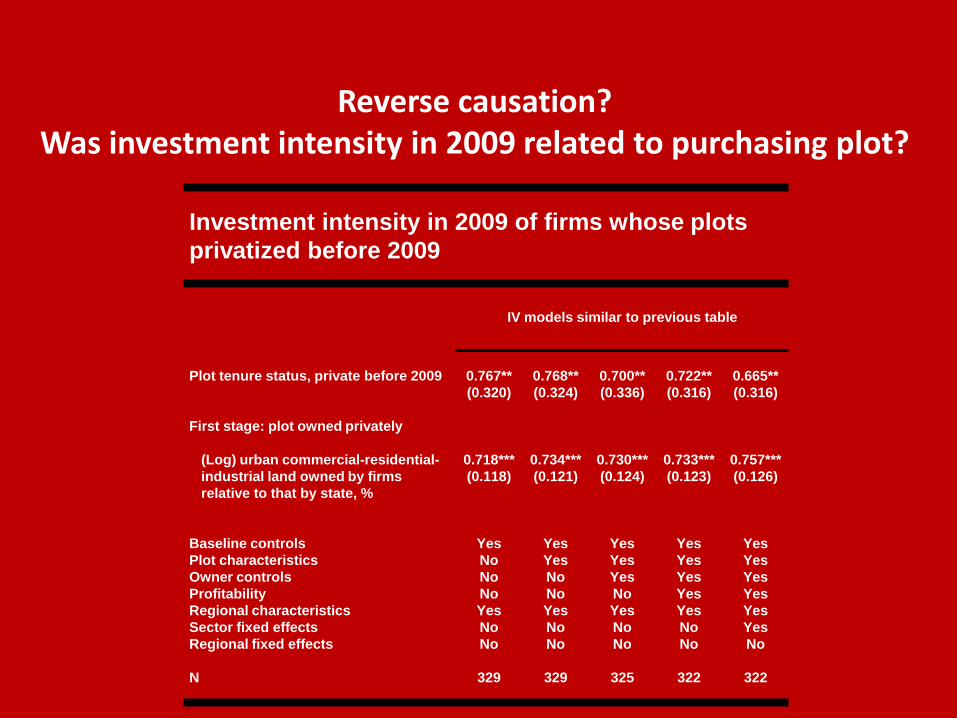
Investment intensity in 2009 of firms whose plots
privatized before 2009
IV models similar to previous table
Plot tenure status, private before 2009 0.767** 0.768** 0.700** 0.722** 0.665**
(0.320) (0.324) (0.336) (0.316) (0.316)
First stage: plot owned privately
(Log) urban commercial-residential-
industrial land owned by firms
relative to that by state, %
0.718*** 0.734*** 0.730*** 0.733*** 0.757***
(0.118) (0.121) (0.124) (0.123) (0.126)
Baseline controls Yes Yes Yes Yes Yes
Plot characteristics No Yes Yes Yes Yes
Owner controls No No Yes Yes Yes
Profitability No No No Yes Yes
Regional characteristics Yes Yes Yes Yes Yes
Sector fixed effects No No No No Yes
Regional fixed effects No No No No No
N 329 329 325 322 322
Reverse causation? Was investment intensity in 2009 related to purchasing plot?

How often do banks require pledge of land as collateral to secure long-term credit?
% of firms responding
5 (very often) 38.3
4 13.4
3 18.6
2 10.0
1 (very seldom) 19.7
N 350
More “direct” evidence for the “de Soto effect”
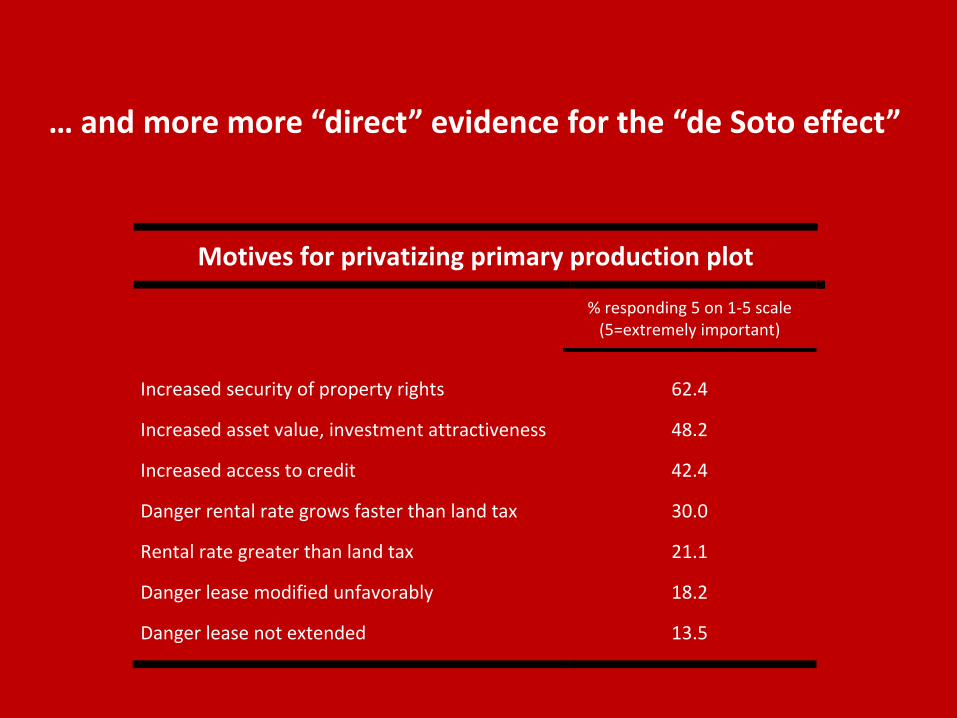
Motives for privatizing primary production plot
% responding 5 on 1-5 scale
(5=extremely important)
Increased security of property rights 62.4
Increased asset value, investment attractiveness 48.2
Increased access to credit 42.4
Danger rental rate grows faster than land tax 30.0
Rental rate greater than land tax 21.1
Danger lease modified unfavorably 18.2
Danger lease not extended 13.5
… and more more “direct” evidence for the “de Soto effect”
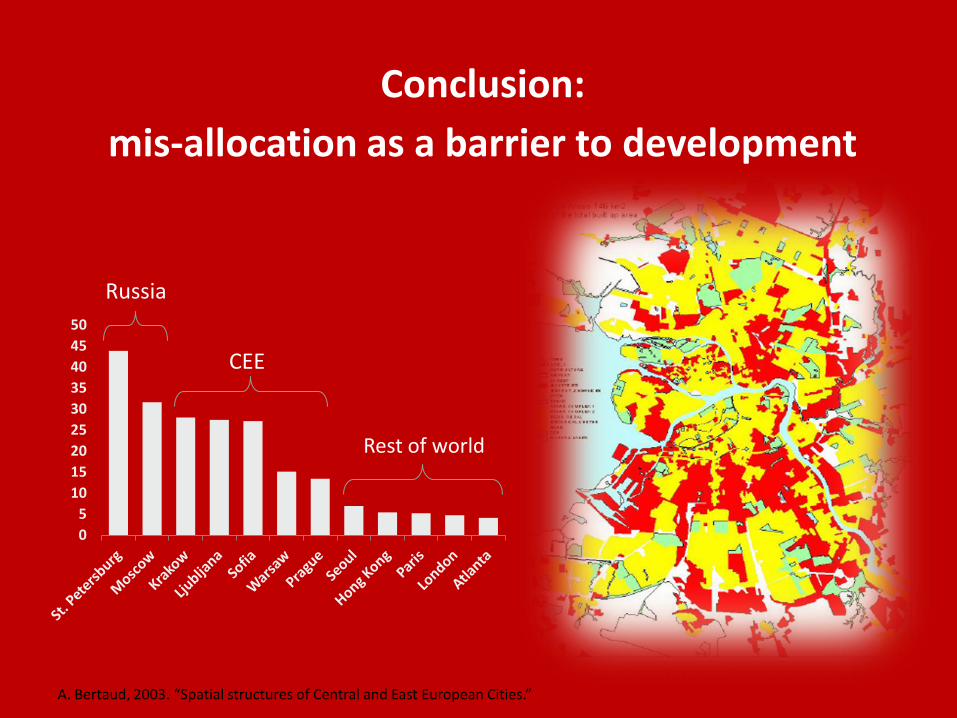
Conclusion:
mis-allocation as a barrier to development
0
5
10
15
20
25
30
35
40
45
50
Russia
CEE
Rest of world
A. Bertaud, 2003. “Spatial structures of Central and East European Cities.”