industrial services media investments - seven group holdings
TRANSCRIPT

INDUSTRIAL SERVICESMEDIA INVESTMENTS
sgh Annual Report 2012

Seven Group Holdings Limited (ABN 46 142 003 469)ii
ContentsSeven Group Holdings Limited
Executive Chairman’s Report 2
2012 Year in Review 4
Industrial Services 12
Media Investments 18
Board of Directors 22
Corporate Governance 24
Directors’ Report 32
Remuneration Report 38
Auditor’s Independence Declaration 51
Financial Statements 52
Consolidated Income Statement 53
Consolidated Statement of Comprehensive Income 54
Consolidated Statement of Financial Postion 55
Consolidated Statement of Changes in Equity 56
Consolidated Cash Flow Statement 58
Notes to the Consolidated Financial Statements 59
Directors’ Declaration 126
Independent Auditor’s Report 127
Company Information 129
Investor Information 130
Shareholder Information 131
Corporate Directory IBC

1
Seven Group Holdings focuses on industrial services, media and investments and is an operating group with diversity, scale and strong prospects for growth with market-leading businesses.

Seven Group Holdings Limited (ABN 46 142 003 469)2
I am pleased to present our annual report for shareholders.
Seven Group Holdings has delivered another strong performance in a challenging economy.
Under the leadership of Chief Executive Officer, Peter Gammell, your company has delivered a record underlying profit result.
It has been a year of growth and consolidation along with undertaking significant investments that will provide for the growth of our business. We have a strong balance sheet and our businesses and investments are well-placed to take advantage of an improving economic outlook.
WesTrac, led by Jim Walker, has delivered an outstanding performance in Australia – a record result underlining this company’s leadership in the strongly performing mining, resources and infrastructure sectors in New South Wales and Western Australia.
WesTrac’s acquisition of Bucyrus from Caterpillar Inc – and the successful integration of this business into WesTrac – will further strengthen the company’s market leadership over the coming twelve months.
Coupled with this major development for WesTrac’s future, is the completion by the landlord of the new facility at Tomago, just north of Newcastle. This is the largest Caterpillar dealer distribution centre in Australia. And the landlord has completed the first
stage of a major development of our presence in Western Australia – with the completion of construction of a major new parts and distribution warehouse in South Guildford in Perth, Western Australia. This is the first stage in a multiple stage extension of our facilities in that state.
The completion of the new facilities allows us to substantially increase our WesTrac Institute apprentice training programme for qualified technicians that we will need for the future growth of your company.
Conditions in our territories in China were very difficult in the latter part of the financial year, and WesTrac China delivered a disappointing result. We are currently working to ensure the cost base of WesTrac China is appropriate for what appears to be challenging conditions over the coming twelve months.
Beyond the acquisition of Bucyrus, your company has been particularly active on a number of fronts, with the completion of the acquisition of National Hire, and as a result full ownership of AllightSykes. The company also now has a 45 per cent shareholding in Coates Hire, recognised as the leading company in equipment hire. We have also strengthened our balance sheet with the sale of vividwireless to Optus Mobile for $230 million.
The development of vividwireless and its sale to Optus was led by Ryan Stokes, an executive director on
the board of Seven Group Holdings. Recently, Ryan was appointed Chief Operating Officer of your company. Ryan’s appointment formalises the key role he has been undertaking for Seven Group Holdings as our industrial services businesses have expanded over the past twelve months.
Our investments in media deliver your company a market-leading presence across broadcast television, newspaper and magazine publishing, online and subscription television.
As we outlined in last year’s annual report, our shareholdings in Seven Media Group and West Australian Newspapers formed a foundation for the merger of those two companies. As a result of that merger we are the largest shareholder in Seven West Media with a 33.2 per cent interest.
It was pleasing to see Seven West Media deliver a positive performance in a challenging economy punctuated by low consumer confidence and declines
Executive Chairman’s reportWe have a strong balance sheet and are well placed to take advantage of an improving economic outlook.

3
in advertising demand. The past twelve months have seen the Seven Network confirm its leadership as the number one television network in ratings and revenue, and West Australian Newspapers’ performance continues to deliver world class returns.
However, these positive operating metrics were not reflected in the share price of Seven West Media, and in marking our investment to market at year end, we incurred a substantial charge to our profit for the year. The $440 million rights issue undertaken by Seven West Media post year end, in which Seven Group Holdings participated for its pro rata share, has significantly strengthened the balance sheet of Seven West Media and positions it strongly during these difficult times.
In June, David Leckie announced his decision to transition from his role as Chief Executive Officer of Seven West Media to a new role as Executive
Director, Media for Seven Group Holdings. David’s track record confirms that he is undoubtedly the best television executive in Australia and has been key to the success of the Seven Network and the development of Seven West Media. We are pleased that he’s taking on this new role at Seven Group Holdings.
Don Voelte is now driving the development of Seven West Media. As Managing Director and Chief Executive Officer of Seven West Media, he is leading a well-credentialled management team and is acknowledged for driving businesses in challenging and competitive markets. We are delighted that Don is leading Seven West Media as that company drives home its leadership over the coming twelve months.
We are particularly fortunate to have great management and people in all of our companies.
Their commitment in such tough and challenging times is laying the foundations for the future of your company. We have strong operating businesses and key investments in media. Your board is focused on driving greater returns for all shareholders, and on behalf of the board I thank you, our shareholders, for your continuing support and commitment to your company.
Kerry Stokes ACExecutive Chairman

Seven Group Holdings Limited (ABN 46 142 003 469)4
2012 YEAR IN REVIEW
Seven Group Holdings delivers a record underlying
result, reflecting the performance of the
company’s industrial services businesses in Australia with
WesTrac Australia, AllightSykes and Coates
Hire delivering significant growth in revenue and
profitability.

5
Seven Group Holdings Limited (ABN 46 142 003 469)6
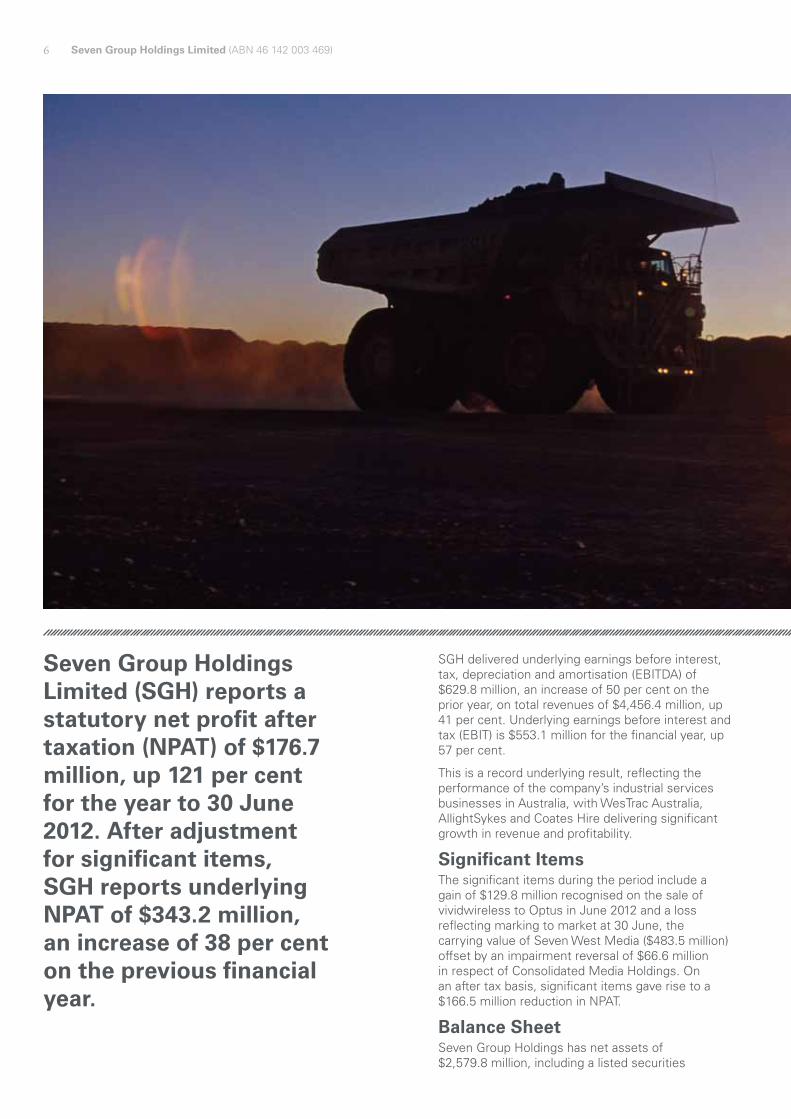
SGH delivered underlying earnings before interest, tax, depreciation and amortisation (EBITDA) of $629.8 million, an increase of 50 per cent on the prior year, on total revenues of $4,456.4 million, up 41 per cent. Underlying earnings before interest and tax (EBIT) is $553.1 million for the financial year, up 57 per cent.
This is a record underlying result, reflecting the performance of the company’s industrial services businesses in Australia, with WesTrac Australia, AllightSykes and Coates Hire delivering significant growth in revenue and profitability.
Significant ItemsThe significant items during the period include a gain of $129.8 million recognised on the sale of vividwireless to Optus in June 2012 and a loss reflecting marking to market at 30 June, the carrying value of Seven West Media ($483.5 million) offset by an impairment reversal of $66.6 million in respect of Consolidated Media Holdings. On an after tax basis, significant items gave rise to a $166.5 million reduction in NPAT.
Balance SheetSeven Group Holdings has net assets of $2,579.8 million, including a listed securities
Seven Group Holdings Limited (SGH) reports a statutory net profit after taxation (NPAT) of $176.7 million, up 121 per cent for the year to 30 June 2012. After adjustment for significant items, SGH reports underlying NPAT of $343.2 million, an increase of 38 per cent on the previous financial year.

7
Results for the year ended 30 June 2012
portfolio of $670.8 million, excluding Seven West Media and Consolidated Media Holdings, and $819.3 million in available undrawn facilities at 30 June 2012.
In media, the company has a 33.2 per cent ordinary shareholding and holds convertible preference shares with a face value of $250 million in Seven West Media, Australia’s largest multiple platform media company, comprising Seven Network, West Australian Newspapers, Pacific Magazines and Yahoo!7. SGH also has a 25.3 per cent investment in Consolidated Media Holdings (which in turn has a 50 per cent interest in Fox Sports and a 25 per cent interest in Foxtel), and an 11.4 per cent investment in Prime Media Group.
DividendA final dividend of 20 cents per share fully franked has been declared, up 2 cents per share, bringing the total dividend on ordinary shares for the 2011-2012 financial year to 38 cents fully franked.
Industrial ServicesSGH’s industrial services businesses delivered total revenue and other income of $4,479.4 million, up 42 per cent on the 2010-2011 financial year. Segment EBITDA of $514.9 million is up
65 per cent. Segment EBIT of $463.1 million is up 75 per cent.
WesTracWesTrac posted a record result for the year, benefitting in particular from the company’s leading position in the strongly performing mining and resource sector in Western Australia and New South Wales.
In Australia, WesTrac delivered total revenue and other income of $3,536.1 million, up 57 per cent on the prior year. Segment EBIT of $387.1 million is up 88 per cent on the prior year. WesTrac Australia’s growth in Australia is being driven primarily by the delivery of new equipment to expanding coal and iron ore mines, with an 82 per cent increase in product sales to $2,240 million. The company also delivered $1,279.1 million in product support revenues, 26 per cent up on the prior year, driven by a significant increase in the installed equipment base.
The very high activity levels also saw a strengthening in WesTrac Australia’s EBIT margins compared to the corresponding prior year with an EBIT margin of 10.9 per cent, up from 9.1 per cent achieved in the prior corresponding period.
$343.2
$629.8
$4.456
MillionUnderlying Net Profit after Tax
MillionUnderlying EBITDA
BillionTotal trading revenue

Seven Group Holdings Limited (ABN 46 142 003 469)8
On 1 June 2012, WesTrac successfully completed the acquisition of the Bucyrus distribution and support business in Western Australia, New South Wales and the Australian Capital Territory from Caterpillar Inc.
The transaction valued at USD 400 million further strengthens WesTrac’s leadership in the supply and service of heavy equipment to the mining sector. This business has been successfully integrated into WesTrac’s management structure and is trading as WesTrac Expanded Mining Products (EMP). Early financial results are in line with expectations with the transaction expected to be EPS accretive in the 2012-2013 financial year.
WesTrac China’s performance was impacted by a slowdown in the construction market, resulting in a significantly lower level of excavator sales compared to the prior year. Sales of mining and power systems equipment performed well and a 17 per cent increase in product support revenue to USD 120.1 million was achieved. Segment EBIT of USD 8.7 million is down 70 per cent from the prior year and was impacted by both the lower revenue and stock provision costs for the year.
AllightSykesSGH moved to a 100 per cent shareholding in National Hire Group through the compulsory
acquisition of remaining minority shareholdings in January 2012. As a result of this transaction, SGH owns 100 per cent of AllightSykes which saw a 56 per cent increase in revenue to $210.3 million, benefitting from the full year impact from the Sykes acquisition made in November 2011 and increased demand for lighting towers, generators and pumps from the resources sector. AllightSykes delivered a 30 per cent increase in segment EBIT versus the 2010-2011 financial year.
Coates HireSGH owns 45 per cent of Coates Hire Group. SGH recognises Coates Hire as an equity accounted investment and its results are not consolidated into SGH’s financial results. SGH’s share of Coates Hire NPAT is up 147 per cent on the previous financial year to $56.3 million. The main drivers of growth were increased equipment hire revenue to the mining and resources sectors and improved operational efficiency. The Coates Hire Group itself delivered a 22 per cent increase in revenue to $1,293.0 million and a 40 per cent increase in EBIT on the prior year to $317.9 million.
Media InvestmentsSGH’s media investments include a 33.2 per cent shareholding (and convertible preference shares) in Seven West Media, a 25.3 per cent shareholding in

9
Consolidated Media Holdings which has significant shareholdings in Foxtel and Fox Sports Australia, and an 11.4 per cent shareholding in Prime Media Group.
These businesses delivered a $116.1 million EBIT contribution to SGH in the 2011-2012 year, an 8 per cent decline on the prior corresponding period reflecting a difficult overall advertising market and operating conditions.
Seven West MediaSeven West Media reported NPAT of $226.9 million and EBIT of $473.4 million on trading and other income revenues of $1,957.4 million.
Despite difficulties in the overall advertising market, Seven West Media delivered an EBIT margin of 24.2 per cent reflecting the strong performances of the company’s key market-leading media businesses.
Earnings comparisons with the prior period are difficult due to the West Australian Newspapers Holdings acquisition of Seven Media Group from Seven Group Holdings and Kohlberg Kravis Roberts & Co to form Seven West Media in April 2011.
On a pro forma basis, with the prior year including twelve months of both West Australian Newspapers and Seven Media Group, Seven West Media EBIT of $473.4 million compares to $550.1 million in the
prior year, on total revenue and other income of $1,957.4 million compared to $1,960.6 million in the prior year.
Over the past twelve months, Seven West Media has successfully completed the re-financing of all existing components of group debt into one facility with an average tenor of four years.
On 16 July 2012, Seven West Media announced an underwritten pro rata accelerated entitlement offer to raise $440 million. The offer received strong support from institutional investors contributing approximately $320 million including a $146 million investment by SGH. The equity raising was successfully completed in August and proceeds have been used to pay down debt, strengthening that company’s balance sheet.
Consolidated Media HoldingsSGH’s current shareholding in Consolidated Media Holdings (CMH) is 25.3 per cent. CMH owns 50 per cent of subscription television programming company, Fox Sports Australia, which owns 25 per cent of pay television company Foxtel and also owns and operates Fox Sports, Fox Sports News, Speed and Fuel TV.
CMH has reported a financial year NPAT of $85.8 million, down 15.6 per cent on the prior period. Underlying NPAT of $97.9 million, excluding

Seven Group Holdings Limited (ABN 46 142 003 469)10
transaction related and contractual costs, is up 2.4 per cent on the prior period. Foxtel’s subscriber base grew by 1.8 per cent during the period to 1.7 million and Foxtel’s average revenue per user (ARPU) increased by 3.1% to $99 per user as at 30 June 2012.
During the year Foxtel completed the acquisition of Austar, creating a national subscription television service and taking total Foxtel subscribers to 2.3 million.
On 7 September 2012, Consolidated Media Holdings Limited (CMH) entered in a Scheme Implementation Deed with News Limited and News Pay TV Financing Pty Limited (News) under which News has offered to acquire CMH for $3.45 cash per share by way of a scheme of arrangement (the Scheme).
The implementation of the Scheme is subject to a number of conditions including, but not limited to, CMH shareholder and court approvals, the independent expert concluding that the Scheme is in the best interests of CMH shareholders, and there being no material adverse change. Further information is contained in CMH’s ASX statement dated 7 September 2012.
At the date of this report, SGH is still evaluating the offer in relation to its investment in CMH.
InvestmentsvividwirelessSGH announced the sale of vividwireless Group Limited (VGL) to Optus Mobile Pty Ltd (Optus) for a total consideration of $230 million on 20 February 2012. Under the terms of the sale, Optus paid $170 million in cash to SGH when the transaction closed on 19 June 2012, with the remaining deferred consideration of $60 million to be paid on the re-issue of spectrum licenses.
Other InvestmentsSGH continues to hold its investment in the Agricultural Bank of China, one of the four biggest national banks in China. The investment has a carrying value at 30 June 2012 of $237.9 million.
SGH’s listed portfolio is an important pool of liquidity available to the group, invested in high yielding listed securities providing income and franking credits. The market value of this portfolio as at 30 June 2012 was $432.9 million.
Note:
1. SGH results are reported under International Financial Reporting Standards (IFRS). The underlying segment performance is presented in Note 3 to the financial statements and excludes significant items, including impairment, fair value movement of derivatives and net gain on sale of investments. This report also includes certain non-IFRS measures including underlying net profit after tax (excluding significant items) and total revenue and other income. These measures are used internally by management to assess the performance of our business, make decisions on the allocation of our resources and assess operational management. Non-IFRS measures have not been subject to audit or review.
Included in this report are data prepared by the management of SGH and other associated entities and investments. Data included for information purposes only and have not been subject to the same level of review by the company as the statutory accounts and so are merely provided for indicative purposes. The company and its employees do not warrant the data and disclaim any liability flowing from the use of data by any party.
11
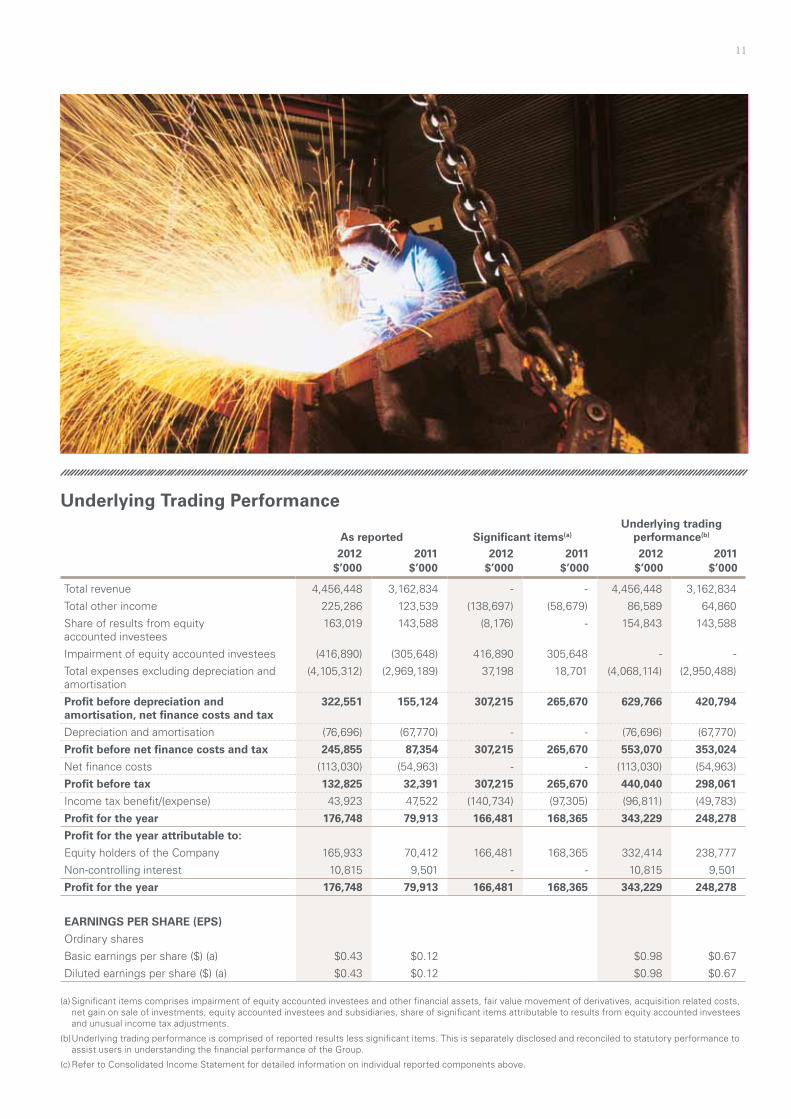
Underlying Trading Performance
As reported Significant items(a)Underlying trading
performance(b)
2012 2011 2012 2011 2012 2011$’000 $’000 $’000 $’000 $’000 $’000
Total revenue 4,456,448 3,162,834 - - 4,456,448 3,162,834
Total other income 225,286 123,539 (138,697) (58,679) 86,589 64,860
Share of results from equity accounted investees
163,019 143,588 (8,176) - 154,843 143,588
Impairment of equity accounted investees (416,890) (305,648) 416,890 305,648 - -
Total expenses excluding depreciation and amortisation
(4,105,312) (2,969,189) 37,198 18,701 (4,068,114) (2,950,488)
Profit before depreciation and amortisation, net finance costs and tax
322,551 155,124 307,215 265,670 629,766 420,794
Depreciation and amortisation (76,696) (67,770) - - (76,696) (67,770)
Profit before net finance costs and tax 245,855 87,354 307,215 265,670 553,070 353,024
Net finance costs (113,030) (54,963) - - (113,030) (54,963)
Profit before tax 132,825 32,391 307,215 265,670 440,040 298,061
Income tax benefit/(expense) 43,923 47,522 (140,734) (97,305) (96,811) (49,783)
Profit for the year 176,748 79,913 166,481 168,365 343,229 248,278
Profit for the year attributable to:
Equity holders of the Company 165,933 70,412 166,481 168,365 332,414 238,777
Non-controlling interest 10,815 9,501 - - 10,815 9,501
Profit for the year 176,748 79,913 166,481 168,365 343,229 248,278
EARNINGS PER SHARE (EPS)
Ordinary shares
Basic earnings per share ($) (a) $0.43 $0.12 $0.98 $0.67
Diluted earnings per share ($) (a) $0.43 $0.12 $0.98 $0.67
(a) Significant items comprises impairment of equity accounted investees and other financial assets, fair value movement of derivatives, acquisition related costs, net gain on sale of investments, equity accounted investees and subsidiaries, share of significant items attributable to results from equity accounted investees and unusual income tax adjustments.
(b) Underlying trading performance is comprised of reported results less significant items. This is separately disclosed and reconciled to statutory performance to assist users in understanding the financial performance of the Group.
(c) Refer to Consolidated Income Statement for detailed information on individual reported components above.

Seven Group Holdings Limited (ABN 46 142 003 469)12
INdustRIAl sERVIcEs
WesTrac Australia delivered record numbers of new
mining machines and also saw continuing growth in
parts and services revenues flowing from the significant
increase in the installed customer base of Caterpillar
equipment.

13

Seven Group Holdings Limited (ABN 46 142 003 469)14
Seven Group Holdings operations in industrial services delivered approximately 80 per cent of the company’s earnings before interest and taxation over the past twelve months and is underpinned by WesTrac, a leading international equipment management company operating sole Caterpillar dealerships in Western Australia, New South Wales, the Australian Capital Territory and North Eastern China. WesTrac’s business is built on a strong long-term partnership with Caterpillar, the world’s leading equipment manufacturing company.
In January 2012, SGH increased its shareholding in National Hire Group to 100 per cent through the compulsory acquisition of remaining minority shareholdings. As a result, SGH now also owns 100 per cent of AllightSykes, a leading manufacturer
of lighting products and dewatering plants, and 45 per cent of Coates Hire Group, Australia’s largest rental company. SGH recognises Coates Hire as an equity accounted investment and its results are not consolidated into SGH’s financial results.
SGH’s industrial services businesses delivered total revenue and other income of $4,479.4 million, up 42 per cent on the 2010-2011 financial year. Segment EBITDA of $ 514.9 million is up 65 per cent. Segment EBIT of $463.1 million is up 75 per cent. SGH’s share of Coates Hire NPAT is up 147 per cent on the previous financial year to $56.3 million. The main drivers of growth were increased equipment hire revenue to the mining and resources sectors and improved operational efficiency. The Coates Hire Group itself delivered a
Results for the year ended 30 June 2012
us$17.4$427.2Million
Segment EBITDA – WesTrac ChinaMillion
Segment EBITDA – WesTrac Australia

15
22 per cent increase in revenue to $1,293.0 million and a 40 per cent increase in EBIT on the prior year to $317.9 million.
WesTracWesTrac has delivered a record result, underpinned by the strongly performing mining and resource and infrastructure sectors in Western Australia and New South Wales.
In Australia, WesTrac delivered total revenue and other income of $3,536.1 million, up 57 per cent on the prior year. Segment EBIT of $387.1 million is up 88 per cent on the prior year. WesTrac’s growth in Australia is being driven primarily by expansion in coal and iron ore mining, with an 82 per cent increase in product sales to $2,240 million.
The company also delivered $1,279.1 million in product support revenues, 26 per cent up on the prior year, driven by a significant increase in the installed equipment base.
The strong result was driven by the significant expansion of activities by WesTrac’s mining customers, particularly in the iron ore sector in Western Australia and the coal sector in New South Wales. WesTrac delivered record numbers of new mining machines during the year, and also saw continuing growth in parts and services revenues flowing from the significant increase in the installed base of Caterpillar equipment over the past two years.
These levels of activity also saw a strengthening in WesTrac Australia’s EBIT margins compared to the
$14.3 $56.3Million
Segment EBITDA – AllightSykesMillion
Share of Coates Hire NPAT (normalised)

Seven Group Holdings Limited (ABN 46 142 003 469)16
corresponding prior year with an EBIT margin of 10.9 per cent, up from the 9.1 per cent achieved in the prior year.
On 1 June 2012, WesTrac successfully completed the acquisition from Caterpillar Inc of the Bucyrus distribution and support business in Western Australia, New South Wales and the Australian Capital Territory.
The transaction valued at USD 400 million further strengthens WesTrac’s leadership in the supply and service of heavy equipment to the mining sector.
The acquisition of the Bucyrus distribution and support business will enhance WesTrac’s leading position in the supply and service of heavy equipment to the mining and construction sectors in Western Australia, Australian Capital Territory and New South Wales. The Bucyrus product line and large installed base are a logical addition to WesTrac’s current range of Caterpillar products, and provides the company with significant opportunities for future growth with mining customers. This business has been successfully integrated
into WesTrac’s management structure as WesTrac Expanded Mining Products.
The company’s Australian business is well-placed for future growth – with major development of its leased facilities in Perth and Newcastle as it leverages the Australian and international demand for resources and Australia’s plans for future infrastructure development. The past twelve months have seen the landlord undertake far-ranging construction projects with new facilities on behalf of WesTrac on 26 hectares in Tomago near Newcastle region and the re-development of WesTrac’s 19 hectare facility in Perth. These developments include the expansion of the WesTrac Institute’s training and development facilities. This large capital investment in new facility developments and an increased intake of apprentices and trainees will secure long term operating capacity to support future growth of our equipment management business. In Australia, the company employs 4,207 people.
In China, the company delivered segment EBITDA of USD 17.4 million on revenues of USD 679.0 million. Segment EBIT was USD 8.7 million. This

17
reduction in revenue was caused by a significantly smaller small hydraulic excavator market which focuses on construction projects. This small hydraulic excavator market was down in unit terms by 39 per cent on 2011. The company delivered positive sales growth in its mining and power systems business and product support revenue is up 17 per cent on the prior year. WesTrac China is focusing on the tight management of inventory and the cost base of its business to match current market demands.
AllightSykesSGH moved to 100 per cent shareholding in National Hire Group through the compulsory acquisition of remaining minority shareholdings in January 2012. As a result of this transaction, SGH owns 100 per cent of AllightSykes, a leading manufacturer and distributor of mobile light towers, de-watering pumps, generators, engines and compressors. AllightSykes has benefitted from both the strong demand for its products in the resources sector and a full year contribution from Sykes Group that was acquired in November 2011, delivering a
56 per cent increase in revenue to $210.3 million, AllightSykes delivered a 30 per cent increase in segment EBIT versus the 2010-2011 financial year.
Coates HireSGH owns 45 per cent of Coates Hire Group. This company is benefitting from significant capital expenditure and continuing strong demand for its products. The main drivers of growth for Coates Hire over the past twelve months were increased equipment hire revenue to the mining and resources sectors and improved operational efficiency. Over the past twelve months, the Coates Hire Group delivered a 22 per cent increase in revenue to $1,293.0 million and a 40 per cent increase in EBIT on the prior year to $317.9 million. Coates Hire has obtained commitments from lenders to extend its current debt facilities until July 2015 and the company is in the process of formally closing this transaction, further confirming in a challenging financial market, the strong performance and positive outlook for the future.

Seven Group Holdings Limited (ABN 46 142 003 469)18

19
MEdIA INVEstMENts
Seven West Media’s businesses are performing well in a
challenging market. The company’s objective is to build on its leadership in broadcast
television, print and online and drive further cost synergies and
enhanced revenue delivery across the business.

Seven Group Holdings Limited (ABN 46 142 003 469)20
Seven Group Holdings’ media presence is underlined by its major shareholding in Australia’s leading multi-platform media business, Seven West Media.
Over the past twelve months, the company has undertaken the successful integration of West Australian Newspapers and Seven Media Group to create ‘one company’ and the company’s focus over the coming twelve months is to build on its leadership in broadcast television, print media and online and drive further cost synergies and enhance revenue delivery across the entire business.
The company’s media businesses are performing well in what has been a challenging past twelve months for all media companies. Seven West Media reports a profit before income tax of $325.2 million on revenues of $1,937.1 million. Net profit after tax is $226.9 million. Basic EPS is 33.3 cents. Diluted EPS is 26.7 cents. Earnings before interest, taxation, depreciation and amortisation (EBITDA) is $535.0 million. Earnings before interest and taxation (EBIT) is $473.4 million.
Seven West Media has net assets of $2.6 billion and $113.6 million in available undrawn facilities at 30 June 2012. Seven West Media has successfully completed re-financing of all existing components of group debt – which is in line with expectations and detailed in the shareholder transaction
documents – into the one facility with overall pricing similar to that under previous facilities.
On 16 July 2012, Seven West media announced an underwritten pro rata accelerated entitlement offer to raise approximately $440 million. This offer was successfully completed on 17 August 2012. The proceeds from the equity raising will be used to pay down debt, strengthening the company’s balance sheet.
The company’s broadcast television business, the Seven Network, continues to lead the market in television advertising revenue share, building share in a tough advertising market. Recent industry figures put Seven’s share of the advertising revenue market at 40 per cent for January-June 2012 and 39 per cent across the 2011-2012 financial year
More Australians watch Seven than any other television network. Seven was the most-watched network for total viewers across the 2011 television year and leads in the 2012 television year, its sixth consecutive year of market leadership in primetime.
The West Australian is regarded as one of the best-performing newspaper publishing businesses, with market-leading margins. The West has increased its total Monday to Saturday audited circulation by 0.2 per cent for the June 2012 quarter, maintaining its position as one of the strongest performing newspapers in the country. The company continues
† †
March 5-6, 2011 thewest.com.au $2.30† † Gascoyne, Shark Bay $2.35; Pilbara $3.30; Kimberley $3.40. GST INC.Metro
WHAT MEN REALLY THINK OF WOMENWEST WEEKENDMAGAZINE
PAGE 18 MOTORINGLIFTOUT
SEVEN DAYSMAGAZINE
POPGODDESSKylie on love, beating cancer and her hottest show ever
WIN 5 HOLDENS IN 5 WEEKS
SV6 COMMODOREBONUSCOUPON
G
WHAT’S INSIDE PartSaturday 21-29Sunday 17-28 Details P81
COLLEEN EGANRETURNING A FAVOUROPINION P28
PAUL MURRAYBARNETT’S LOFTY AIROPINION P29
OUR R
At least 10 Perth State high schoolseach raised more than $1 millionfrom donations, fundraisingdrives, fees and contributions fromparents to supplement governmentfunding, the revamped My Schoolwebsite has revealed.
The figures show parents of Stateschool students are paying thou-sands of dollars from their ownpocket or fundraising to payfor school basics such as class-room materials, computers andexcursions.
The website, which went onlineyesterday, includes information onhow much money each school getsfrom taxpayers, parents, donationsand fundraising, income from can-teens and building hire, and frominvestments and bank interest.
WA Council of State School Orga-nisations president Rob Fry saidthe big amount of money raised bysome public schools showed why amore equitable funding approachwas needed.
“I would like the Government tostop funding rich private and pub-lic schools,” he said. “If they havegot it, why should they get morewhen others are struggling?”
In WA, public schools spend$13,585 per student, Catholicschools $10,722 and independent
schools $12,756 in day-to-day run-ning costs.
The figures, which are based on2009 financial records, show manyprivate schools use surplus incomeraised by fees to pay for capitalworks such as new classrooms andsporting facilities, resulting inresources superior to those in Stateand Catholic schools.
Special needs schools receive thehighest amount of per-studentfunding. The WA Institute for DeafEducation at Cottesloe gets $152,000per student.
The lowest per-student amount is$4200 at Albany’s Australian Chris-tian College, which teaches about70 children but has a bigger dis-tance education program.
Some public schools enjoy ahealthy income stream from par-ents, which can add up to 10 percent of their budget.
One of the State’s biggest schools,Willetton Senior High, receivedalmost $1.7 million in 2009 in paren-tal fees, contributions and fundraising.
Parentspay forschoolbasics
WEBSITE REVEALS FINANCES
■ Andrew Tillett, Vivienne Ryanand Rebecca Trigger INSIDE P6-7
� Your guide to My School website � Parents warned to exercisecaution
.................................................................................� CONTINUED P6
Smiles all round: Lucy Couanis, 3, and Tamzyn Aisbett, 4, arewowed by Chen Wenling’s Red Memory Smile sculpture inCottesloe. Report, P12 Picture: Astrid Volzke

21
to manage its newspaper business in a challenging environment holding cost growth to 1.8 per cent over the past twelve months.
Seven West Media’s magazine publishing business, Pacific Magazines, has secured the largest readership and circulation share increases of any Australian magazine publishing company. It is the only major publishing company to increase advertising share over the past twelve months.
Seven West Media’s online and new media presence is driven by the company’s Yahoo!7 joint venture with Yahoo! Inc.
Yahoo!7 continues its strong momentum, delivering 26.7 per cent growth in revenue, 20.0 per cent growth in EBITDA and 14.7 per cent growth in EBIT for the financial year. Advertising revenue is up 15.7 per cent.
Yahoo!7 has continued its growth in audience with 8.8 million Australians visiting the site each month (as at June 2012). Mobile audiences have grown over 200 per cent in the past year to more than 4.4 million users, and Yahoo!7 is continuing
its development of connected experiences across multiple devices across web, tablet and mobile including the Seven News app, with more than 550,000 downloads and Social TV app FANGO exceeding 540,000 downloads, and growing.
Results for the year ended 30 June 2012
No. 1
$226.9
Seven is the leading television network
MillionSeven West Media – Net Profit after Tax
200%Growth in Yahoo!7 mobile audiences over the past
twelve months
† †
March 5-6, 2011 thewest.com.au $2.30† † Gascoyne, Shark Bay $2.35; Pilbara $3.30; Kimberley $3.40. GST INC.Metro
WHAT MEN REALLY THINK OF WOMENWEST WEEKENDMAGAZINE
PAGE 18 MOTORINGLIFTOUT
SEVEN DAYSMAGAZINE
POPGODDESSKylie on love, beating cancer and her hottest show ever
WIN 5 HOLDENS IN 5 WEEKS
SV6 COMMODOREBONUSCOUPON
G
WHAT’S INSIDE PartSaturday 21-29Sunday 17-28 Details P81
COLLEEN EGANRETURNING A FAVOUROPINION P28
PAUL MURRAYBARNETT’S LOFTY AIROPINION P29
OUR R
At least 10 Perth State high schoolseach raised more than $1 millionfrom donations, fundraisingdrives, fees and contributions fromparents to supplement governmentfunding, the revamped My Schoolwebsite has revealed.
The figures show parents of Stateschool students are paying thou-sands of dollars from their ownpocket or fundraising to payfor school basics such as class-room materials, computers andexcursions.
The website, which went onlineyesterday, includes information onhow much money each school getsfrom taxpayers, parents, donationsand fundraising, income from can-teens and building hire, and frominvestments and bank interest.
WA Council of State School Orga-nisations president Rob Fry saidthe big amount of money raised bysome public schools showed why amore equitable funding approachwas needed.
“I would like the Government tostop funding rich private and pub-lic schools,” he said. “If they havegot it, why should they get morewhen others are struggling?”
In WA, public schools spend$13,585 per student, Catholicschools $10,722 and independent
schools $12,756 in day-to-day run-ning costs.
The figures, which are based on2009 financial records, show manyprivate schools use surplus incomeraised by fees to pay for capitalworks such as new classrooms andsporting facilities, resulting inresources superior to those in Stateand Catholic schools.
Special needs schools receive thehighest amount of per-studentfunding. The WA Institute for DeafEducation at Cottesloe gets $152,000per student.
The lowest per-student amount is$4200 at Albany’s Australian Chris-tian College, which teaches about70 children but has a bigger dis-tance education program.
Some public schools enjoy ahealthy income stream from par-ents, which can add up to 10 percent of their budget.
One of the State’s biggest schools,Willetton Senior High, receivedalmost $1.7 million in 2009 in paren-tal fees, contributions and fundraising.
Parentspay forschoolbasics
WEBSITE REVEALS FINANCES
■ Andrew Tillett, Vivienne Ryanand Rebecca Trigger INSIDE P6-7
� Your guide to My School website � Parents warned to exercisecaution
.................................................................................� CONTINUED P6
Smiles all round: Lucy Couanis, 3, and Tamzyn Aisbett, 4, arewowed by Chen Wenling’s Red Memory Smile sculpture inCottesloe. Report, P12 Picture: Astrid Volzke
Source: Free TV (KPMG) Industry Revenue Share Numbers.Sources: ABC audit, June 2012; Roy Morgan Single Source Australia, July 2011-June 2012; The company and its employees do not warrant the data and disclaim any liability flowing from the use of this data by any party. Other than the amounts that are taken directly from the company’s full year accounts, this information has not been audited or reviewed.

Board of Directors
22 Seven Group Holdings Limited (ABN 46 142 003 469)
Kerry Matthew Stokes ACExecutive Chairman of Seven Group Holdings Limited since April 2010.
Executive Chairman of Seven Network Limited since July 1999. Prior to that Non Executive Chairman since June 1995.
Appointed a Companion in the General Division of the Order of Australia in the Queen’s Birthday honours announced on 9 June 2008.
Chairman of Seven Media Group Pty Limited since December 2006.
Chairman of Australian Capital Equity Pty Limited Group which has significant interests in activities which include media and entertainment and property and industrial activities.
Chairman of Seven West Media Limited (formerly West Australian Newspapers Holdings Limited) since 11 December 2008. Appointed a Director on 25 September 2008.
Peter David Ritchie AODeputy Chairman of Seven Group Holdings Limited since April 2010.
Deputy Chairman of Seven Network Limited since August 1991.
Chairman of the Remuneration & Nomination Committee, Member of the Audit & Risk Committee, Member of the Independent & Related Party Committee.
Former Chairman of McDonald’s Australia Limited and former Director of Westpac Banking Corporation, Solution 6 Holdings Limited and the University of New South Wales Foundation Limited.
Current Chairman of Mortgage Choice Limited and a Director since 5 April 2004.
Current Chairman of Reverse Corporation Limited and a Director since 1 October 2002.
Bachelor of Commerce (University of New South Wales). Fellow of CPA Australia.
Officer in the General Division of the Order of Australia.
Peter Joshua Thomas Gammell Director of Seven Group Holdings Limited since February 2010.
Appointed Managing Director and Group Chief Executive Officer of Seven Group Holdings Limited on 28 April 2010.
Director of Seven West Media Limited (formerly West Australian Newspapers Holdings Limited) since 25 September 2008.
Director of Seven Network Limited since November 1997.
Director of Seven Media Group Pty Limited since December 2006.
Director of WesTrac Pty Limited since 1990. Chairman of Coates Group Holdings Pty Limited.
Director of National Hire Group Limited from 10 December 2004 to 12 May 2008. Alternate Director of National Hire Group Limited from 12 May 2008 to 2 June 2010.
Director of Consolidated Media Holdings Limited since 10 September 2009.
Deputy Chairman of Australian Capital Equity Pty Limited and Group companies.
Member of the Institute of Chartered Accountants of Scotland.
David John Leckie Director of Seven Group Holdings Limited since April 2010. Executive Director, Media for Seven Group Holdings Limited since June 2012.
Group Chief Executive Officer and Managing Director, Seven West Media Limited from 16 May 2011 to 30 June 2012.
Director of Seven Network Limited since April 2003 and the Network’s Chief Executive Officer, Broadcast Television until 9 December 2011.
Chief Executive Officer of the Seven Media Group from December 2006 to 26 June 2012. Director of Seven Media Group Pty Limited since December 2006.
Bachelor of Arts, (Macquarie University), majoring in Economic and Financial Studies.
Former Chairman of Pacific Magazines. Former Chief Executive Officer of the
Nine Network. Former Director of Australian News Channel Pty Limited.
Former Director of Free TV Australia Limited. Former Director of Yahoo!7.
James Allan WalkerDirector of Seven Group Holdings Limited since February 2010.
Chief Executive Officer, WesTrac Group.
Director of WesTrac Pty Limited since February 1999.
Over thirty years experience with the WesTrac Group and over forty years experience in the equipment industry. Prior to joining the WesTrac Group, roles were held with Hastings Deering and Morgan Equipment.
Director of National Hire.
National President of the Australian Institute of Management.
Elizabeth Dulcie Boling Director of Seven Group Holdings Limited since April 2010.
Director of Seven Network Limited since August 1993.
Member of the Remuneration & Nomination Committee, Member of the Independent & Related Party Committee.
Former Chair and Chief Executive of Southdown Press; former Chief Executive Magazines, PMP Limited; former Director of News Limited, ING Australia Limited and Tourism Victoria.
Former Member of the board of the Australian Cancer Research Foundation, the Mental Health Research Institute of Victoria and former Trustee of the National Gallery of Victoria.
Terry James Davis Director of Seven Group Holdings Limited since June 2010.
Group Managing Director, Coca-Cola Amatil Limited since 12 November 2001.
Chairman of the Independent & Related Party Committee, Member of the Remuneration & Nomination Committee.
Director of St. George Bank Limited from December 2004 to December 2008.

Board of Directors
Annual Report 2012 23
Over fifteen years experience in the global wine industry including Managing Director of Beringer Blass (the wine division of Foster’s Group Limited) and Managing Director of Cellarmaster Wines Group between 1987 and 1997.
Council Member of the University of New South Wales Council since 2006.
Christopher John MackayDirector of Seven Group Holdings Limited since June 2010.
Chairman of Magellan Financial Group Limited.
Member of the Audit & Risk Committee, Member of the Independent & Related Party Committee.
Considerable experience in business management, capital allocation, risk management and investment. A former investment banker and corporate and banking lawyer, with broad experience in the financial and corporate sectors over many years.
Formerly Chairman of the investment bank UBS Australasia; having previously been its Chief Executive Officer.
A member of the Federal Treasurer’s Financial Sector Advisory Council and a former member of the Business Council of Australia and director of the International Banks & Securities Association.
A director of Consolidated Media Holdings Limited since 8 March 2006.
A director of Magellan Financial Group Limited since 21 November 2006 and a director of Magellan Flagship Fund Limited since 29 September 2006.
Bruce Ian McWilliam Director of Seven Group Holdings Limited since April 2010.
Director of Seven Network Limited since September 2003.
Appointed Commercial Director for Seven Network Limited in May 2003.
Director of Seven Media Group Pty Limited since December 2006.
Former partner of law firms Gilbert & Tobin, Turnbull McWilliam and Allen Allen & Hemsley specialising in media and commercial law. Former Director BSkyB, Executive Director News
International Television and General Counsel, News International plc.
Director of Australian News Channel Pty Limited.
Alternate Director of Seven West Media Limited since 4 November 2008.
Director of Engin Pty Limited (formerly Engin Limited). Former Director of Vividwireless Group Limited.
Honorary Fellow of the University of Sydney.
Chairman, Sydney University Law School Advisory Committee.
Council Member, St Pauls College, University of Sydney.
Honorary Governor – The Thalidomide Foundation Limited.
Ryan Kerry Stokes Mr Stokes is Chief Operating Officer of Seven Group Holdings Limited (Executive Director since April 2010 and a Director since February 2010).
Director of WesTrac Pty Limited; Director of Seven West Media Limited (since 22 August 2012). Alternate Director of Seven West Media Limited (from 4 November 2008 to 21 August 2012).
Director of Yahoo!7 Pty Limited; Director of Consolidated Media Holdings Limited (since September 2009). Chairman of Engin Pty Limited (formerly Engin Limited).
Mr Stokes is Chief Executive Officer of Australian Capital Equity Pty Limited and a Director of Iron Ore Holdings Pty Limited (since January 2011).
Mr Stokes is the Chairman of the National Library of Australia, Director of the Australian Institute of Management (WA), the Perth International Arts Festival, the Australian Strategic Policy Institute Council and the Victor Chang Cardiac Research Institute.
Richard Anders Uechtritz Director of Seven Group Holdings Limited since June 2010.
Member of the Remuneration & Nomination Committee, Member of the Independent & Related Party Committee.
Director of JB Hi-Fi Limited since 28 April 2011.
Chief Executive Officer and Director of JB Hi-Fi Limited from June 2000 to May 2010.
Over thirty years experience in retailing.
Co-founder of Rabbit Photo and Smith’s Kodak Express.
Director of Kodak (Australasia) Proprietary Limited from 30 July 1998 to 20 July 2000.
Professor Murray Charles Wells Director of Seven Group Holdings Limited since April 2010.
Director of Seven Network Limited since July 1995.
Chairman of the Audit & Risk Committee, Member of the Independent & Related Party Committee. PhD, University of Sydney. M.Com, University of Canterbury. Fellow of CPA Australia, Fellow of the Academy of Social Sciences in Australia. Chairman, Kaplan Higher Education Pty Limited. Deputy Chairman, Australian Scholarships Foundation.
Emeritus Professor of Accounting, former Dean of Economics, and Director of the Graduate School of Business and the Foundation of the Graduate School of Business at the University of Sydney. Former Chairman and Director of Australian National Business School Limited.
Company Secretary Warren Walter Coatsworth Company Secretary of Seven Group Holdings Limited since April 2010.
Company Secretary of Seven Network Limited since July 2005.
Solicitor holding a current practising certificate with degrees in Arts and Law (Hons) from the University of Sydney. Legal Counsel with Seven Network Limited for the past twelve years, advising broadly across the company, and formerly a solicitor at Clayton Utz. He has completed a Graduate Diploma in Applied Corporate Governance and is a qualified Chartered Company Secretary and a Fellow and member of Chartered Secretaries Australia.
24 Seven Group Holdings Limited (ABN 46 142 003 469)
Corporate Governance Year ended 30 June 2012
This statement outlines the Company’s main corporate governance practices and its compliance with the ASX Corporate Governance Council Corporate Governance Principles and Recommendations 2nd Edition (“ASX Recommendations”).
Various of the corporate governance policies referred to in this statement are available on the Company’s website Those policies which are not separately available on the Company’s website are summarised in
this statement. A copy of this statement (including the summaries of the various policies) will be made available on the Company’s website.
PRINCIPLE 1 – LAY SOLID FOUNDATIONS FOR MANAGEMENT AND OVERSIGHTThe Board is empowered to manage the business of the Company subject to the Corporations Act and the Company’s Constitution.
The Board is responsible for the overall corporate governance of the Group and has adopted a Board Charter, posted on the Company’s website, which sets out the role and responsibilities of the Board as well as those functions delegated to management. The Board Charter provides that the Board’s role includes: • representing and serving the interests of shareholders by overseeing, reviewing and appraising the Company’s
strategies, policies and performance in accordance with any duties and obligations imposed on the Board by law and the Company’s Constitution;
• contributing to and approving management’s development of corporate strategy and performance objectives and monitoring management’s performance and implementation of strategy and policies;
• reviewing, ratifying and monitoring systems of risk management and internal control and ethical and legal compliance; and
• monitoring and reviewing management processes aimed at ensuring the integrity of financial and other reporting.
The Board Charter provides that matters which are specifically reserved for the Board or its Committees include: • appointment and removal of the Group Chief Executive Officer; • approval of dividends; • approval of annual budget; • monitoring capital management and approval of major capital expenditure, acquisitions and divestitures in excess of
authority levels delegated to management; and • calling of meetings of shareholders.
Subject to oversight by the Board and the exercise by the Board of functions which it is required by law to carry out, it is the role of management to carry out functions that are delegated to management by the Board as it considers appropriate as well as those functions not specifically reserved to the Board, including those functions and affairs which pertain to the day-to-day management of the operations and administration of the Company. Management is responsible for implementing the policies and strategic objectives approved by the Board. Management must supply the Board with information in a form, timeframe and quality that will enable the Board to discharge its duties effectively.
The Company has adopted a Delegated Authority Policy delegating to management authority to carry out expenditure in relation to specified areas of the Company’s operations, subject to the Company’s policies and procedures in respect of the authorisation and signing of Company contracts which includes a system of legal review. During the year the management of the Company comprised the Group Chief Executive Officer, Executive Director (now also Chief Operating Officer), Chief Financial Officer and a small finance and administration team as well as several Seven West Media Limited executives, for whom a portion of their salary cost was charged to the Company for management services provided.
The functions exercised by the Board and those delegated to management, as disclosed herein and set out in the Board Charter, are subject to ongoing review to ensure that the division of functions remains appropriate.
The performance of the Group Chief Executive Officer is formally reviewed by the Board against the achievement of strategic and budgetary objectives in respect of the Group’s operations and investments whilst also having regard for his personal performance in the leadership of the Group. The Board’s review is carried out annually in regard to certain goals against which he is assessed, and throughout the year in regard to others, and forms the basis of the determination of the Group Chief Executive Officer’s performance-linked remuneration. The Remuneration Report sets out further details of the performance criteria against which the Group Chief Executive Officer’s performance-linked remuneration is assessed. The performance of senior executives of the Company is reviewed on an annual basis in a formal and documented interview process with either the Group Chief Executive Officer or the particular executive’s immediate superior, which evaluates performance against agreed performance goals and assessment criteria in relation to the senior executive’s duties and material areas of responsibility, including management of relevant business units within budget, motivation and development of staff, and achievement of and contribution to the Company’s objectives. A performance evaluation of senior executives has taken place during the year in accordance with this process.

Annual Report 2012 25
Corporate Governance Year ended 30 June 2012
For further information about performance management of Senior Executives and staff, please see the discussion set out under “Principle 8 – Remunerate Fairly and Responsibly”.
For those executives of subsidiaries, performance assessments are undertaken by the Chairman and the respective Board for a Chief Executive Officer and by the Chief Executive Officer for other senior executives.
PRINCIPLE 2 – STRUCTURE THE BOARD TO ADD VALUEBoard composition and independence As at the date of this statement, the Board currently comprises twelve (12) Directors and an alternate Director as follows.
The Non-Independent Directors in office are:• Mr Kerry Stokes AC Executive Chairman• Mr Peter Gammell Director and Group Chief Executive Officer• Mr David Leckie Executive Director, Media• Mr James Walker Director and Chief Executive Officer, WesTrac Group• Mr Bruce McWilliam Commercial Director• Mr Ryan Stokes Chief Operating Officer• Mr Robin Waters Alternate Director to Mr Peter Gammell
The Independent Directors in office are:• Mr Peter Ritchie AO Deputy Chairman and Lead Independent Director• Mrs Dulcie Boling Director• Mr Terry Davis Director• Mr Christopher Mackay Director• Mr Richard Uechtritz Director• Professor Murray Wells Director
Mr Leckie was a Director of the Company throughout the year ended 30 June 2012 and was announced as Executive Director, Media of the Company on 26 June 2012. Mr Ryan Stokes was announced as the Company’s Chief Operating Officer on 28 August 2012 and was Executive Director throughout the year ended 30 June 2012.
The skills, experience, expertise and period in office of each Director of the Company at the date of the Annual Report are disclosed in the Board of Directors section of this Annual Report.
In determining whether a Director is independent, the Board conducts regular assessments and has regard to whether a Director is considered to be one who:• is a substantial shareholder of the Company or an officer of, or otherwise associated directly with, a substantial
shareholder of the Company;• is employed, or has previously been employed in an executive capacity by the Company or another group member, and
there has not been a period of at least three years between ceasing such employment and serving on the Board;• has within the last three years been a principal of a material professional advisor or a material consultant to the
Company or another group member, or an employee materially associated with the service provided;• is a material supplier or customer of the Company or other group member, or an officer of or otherwise associated
directly or indirectly with a material supplier or customer; or• has a material contractual relationship with the Company or another group member other than as a Director.
The Board has determined that a material relationship is to be determined on the basis of fees paid or monies received or paid to either a Director or a Director-related entity, which may impact the Earnings Before Interest, Tax, Depreciation and Amortisation (“EBITDA”) of the Company in the previous financial year by more than 5% (and where that historical actual EBITDA is not available, the EBITDA impact should be assessed against pro forma historical accounts).
In the Board’s view the Independent Directors (identified above) are free from any interest and any business or other relationship which could, or could reasonably be perceived to, materially interfere with the Directors’ ability to act with a view to the best interests of the Company. In terms of longevity of time in office, the Board does not consider that independence can be assessed with reference to an arbitrary and set period of time. The Company has diverse operations that have grown considerably over time and in the Board’s view derives the benefits from having long serving Directors with detailed knowledge of the history and experience of the operations.
As set out above, the Board currently comprises six Non–Independent Directors and six Independent Directors. The Board acknowledges the ASX Recommendation that a majority of the Board should be Independent Directors. However the Directors believe that they are able to objectively analyse the issues before them in the best interests of all shareholders

26 Seven Group Holdings Limited (ABN 46 142 003 469)
Corporate Governance Year ended 30 June 2012
and in accordance with their duties as Directors. The Board considers that the individual Directors make highly-skilled decisions in the best interests of the Company, despite the majority of the Board not comprising a majority of Independent Directors.
The Independent Directors (identified above) are members of the Independent & Related Party Committee which has Mr Terry Davis as its Chairman. The Committee provides a forum for the review of material transactions between the Company and its related parties, including transactions with Australian Capital Equity Pty Limited and interests associated with Mr Kerry Stokes AC. Review of related party transactions by the Committee occurs without management or Non-Independent Directors present. The Committee meets at least twice during the year, and the Committee otherwise holds discussions and receives management reports concerning related party transactions as necessary. As such, the Committee provides an opportunity for the Independent Directors to meet regularly without management or Non-Independent Directors present.
Mr Kerry Stokes AC is Executive Chairman of the Board of the Company. The Board acknowledges the ASX Recommendation that the Chairman be an Independent Director, however the Board views as an advantage the Chairman’s history of leadership across the businesses and investments comprising the Group, including in the areas of heavy equipment management and services, property and television management and related media investments, as well as Mr Stokes’ grasp of new technologies driving television production and transmission, not to mention his clear incentive to maximise the interests of the Company. Mr Stokes has been involved in investing in and managing diverse businesses for more than four decades and currently has broad business interests and investments in a range of major business sectors in Australia and overseas, including construction, mining, oil and gas exploration. His experience and insights are invaluable to the Group.
Mr Peter Gammell is the Group Chief Executive Officer and Managing Director. Mr Gammell has been a Director of Seven Network Limited for sixteen years and was a founding Director of WesTrac Pty Limited on its establishment more than twenty years ago. Mr Gammell’s experience across the Group brings considerable depth of understanding of the Group’s operations, providing strong leadership. The Board considers it appropriate that Mr Gammell be charged with the responsibility for overseeing and supervising the Company’s investments in accordance with the Board’s strategies as well as managing the Company’s small executive team.
The Chief Executive Officer, WesTrac Group, is Mr James Walker who is responsible for the Caterpillar dealership operations in New South Wales, Western Australia, the Australian Capital Territory and regions of North East China. He works closely with the Group Chief Executive Officer and reports to the Board on the performance and operations of the WesTrac Group.
Each Director brings a range of personal and professional experiences and expertise to the Board. The Board seeks to achieve an appropriate mix of skills and diversity, including a deep understanding in the areas of corporate management, operational, safety and financial matters and the media, industrial services and investments industries in which the Group operates.
The Board has established a Remuneration & Nomination Committee, further details of which are set out in this Corporate Governance Statement under the heading “Principle 8 – Remunerate Fairly and Responsibly”. The Remuneration & Nomination Charter is available on the Company’s website.
Board appointmentsThe process and policy for appointing new Directors to the Board is that when the Board considers a vacancy exists for a Board appointment the Board may require the Remuneration & Nomination Committee to assist and advise the Board in relation to any of: • the identification of individuals who are qualified to become Board members; • reviewing potential candidates for Board appointment having regard to the skills, experience, expertise and personal
qualities that will best complement Board effectiveness; • the capability of the candidate to devote the necessary time or commitment to the role; and• diversity of members of the Board.
The most suitable candidate is appointed by the Board which retains the power to nominate and appoint Directors to the Board to fill casual vacancies. Directors appointed as casual vacancies hold office until the next General Meeting and are then eligible for re-election.
Under the Constitution of the Company and subject to the ASX Listing Rules, a Director must retire from office, and will be eligible for re-election, no later than the longer of the third Annual General Meeting of the Company or three years following that Director’s last election or appointment. The Managing Director or an Alternate Director is not taken into account in determining the number of Directors to retire at an Annual General Meeting. The Notice of Meeting for the Annual General Meeting discloses other key current directorships of Director candidates, as well as other appropriate biographical details and qualifications.

Annual Report 2012 27
Corporate Governance Year ended 30 June 2012
Board appointees are inducted through a briefing with the Executive Chairman, discussions of the Company’s corporate governance (including its policies and procedures) with the Company Secretary, visits to key business sites and meetings with Company Executives.
Effective functioning of the BoardThe Board, under the terms of appointment of Directors and by virtue of their position, is entitled to access, and is provided with, information concerning the Company needed to discharge its duties efficiently. Directors are entitled, and encouraged, to request additional information if they believe that is necessary to support informed decision making. Directors are able to obtain independent professional advice to assist them in carrying out their duties, at the Company’s expense.
In addition to an induction process for new Director appointments, Directors variously attend external education seminars and peer group meetings regarding regulatory and compliance developments. The Company arranges presentations to the Board by Executives to update the Directors on the Company’s business activities, industry and regulatory developments.
The Company Secretary is charged by the Board to support the Board’s effectiveness by monitoring that Company policies and procedures are followed, and coordinating the timely distribution of Board and Committee agendas and briefing materials.
The Company Secretary’s appointment and removal is a matter for the Board. The Company Secretary is accountable to the Board through the Chairman on corporate governance matters. Each of the Directors has access to the Company Secretary.
Performance evaluationThe Executive Chairman closely monitors the performance and actions of the Board and its Committees and meets with individual Board members during a financial year to ensure that the Board and its Committees operate effectively and efficiently. The Executive Chairman and each Board member consider the performance of that Board member in relation to the expectations for that Board member and consider any opportunities for enhancing future performance. Matters which may be taken into account include the expertise and responsibilities of the Board member and their contribution to the Board and any relevant Committees and their functions. During a financial year the Chairs of the respective Committees also monitor and evaluate the performance of the Committee – according to the function and objectives of the Committee, its program of work, and the contributions of its members – and discuss the Committee’s performance with the Executive Chairman and its members. During the reporting period, performance evaluations of the Board, its Committees and individual directors were carried out in accordance with this process.
Additionally, during the year, a review and evaluation of the Group’s reporting to the Board and its Committees as well as their performance, was commissioned and commenced, with the assistance of an external consultant, to ensure the Group’s governance and management processes remain appropriate for the Group. The Directors’ Report sets out the number of Committee and Board meetings under the heading “Directors’ Meetings”, including meetings of the Audit & Risk Committee, Remuneration & Nomination Committee and Independent & Related Party Committee, as well as the attendance of Directors at those meetings.
PRINCIPLE 3 – PROMOTE ETHICAL AND RESPONSIBLE DECISION MAKINGEthical standardsThe Board Charter, available on the Company’s website, provides that Directors will act at all times with honesty and integrity, will observe the highest standards of ethical behaviour and will not prioritise their personal interests over the Company’s interests.
The Company and its controlled subsidiaries, as applicable, uphold and maintain the following ethical standards:• General statutory requirements and regulations of the Corporations Act, ASX Listing Rules and Income Tax
Assessment Act;• Equal employment opportunity and affirmative action;• Encouraging high standards of safe work practices and implementing Occupational Health & Safety
compliance procedures;• Policy of community service through charitable organisations; and• Policy of responding to national disasters and tragedies.
The Company assesses the Group as part of its compliance with the National Greenhouse and Energy Reporting Act and will be reporting relevant emissions and energy usage and production for the Group for the financial year.
Formal Employee Conduct Guidelines have been implemented for employees, including Senior Executives, and Directors, and are available on the Company’s website.

28 Seven Group Holdings Limited (ABN 46 142 003 469)
Corporate Governance Year ended 30 June 2012
The Company has adopted Share Trading Policies for Group Directors and Executives and Staff which Policies are available on the Company’s website. The policies essentially provide that a 30 working day “window” is available for trading in the Company securities commencing 24 hours after each of the Company’s half yearly results announcement and full year results announcement, and the Annual General Meeting, provided that trading in Company securities is not prohibited by the Corporations Act. The Share Trading Policies for Group Directors and Executives and Staff also include “blackout periods” between the last day of the financial year and 24 hours after the release of the Company’s annual results announcement as well as between the last day of the half year and 24 hours after the release of the Company’s half yearly results announcement. Directors and staff members may only deal in the Company’s securities during these “blackout periods” in exceptional circumstances.
The Company has adopted a formal Issue Escalation Guideline to encourage the reporting and investigation of unethical and unlawful practices and matters of concern which cannot otherwise be adequately dealt with under Company policies. The Guideline, including employee contacts, is available on the Company’s website.
The Company requires compliance with Company policies by staff under the terms of their employment and carries out training of employees in relation to its policies and procedures.
DiversityDuring the year the Company established a Diversity Policy having regard to the change to the Recommendations concerning gender diversity. The Diversity Policy, which is posted on the Company’s website, recognises the benefits of an inclusive and respectful workplace culture that draws on the experiences and perspectives of all Directors and employees, having regard to diversity factors, including but not limited to their gender, age and cultural background.
As set out in the Diversity Policy, the Board is committed to:• flexible work practices – developing, on a case by case basis, flexible work practices that assist employees to balance
work with family, carer or other responsibilities.• career development and performance – ensuring that decisions regarding employment and remuneration are based on
merit, ability, performance and potential and are made in a transparent and fair manner; and• equal employment opportunities – upholding the Company’s obligations in regard to equal employment opportunity
through training and workplace awareness.
The Board is also committed to regularly establishing, reviewing and assessing achievement of the work practices objectives above in relation to gender diversity. In the Board’s view, the Company has achieved the objective of offering flexible working arrangements and setting out clear expectations of behaviours for employees that foster an inclusive and supportive organisational culture. The Company’s commitment and progress towards achieving the other objectives described above is ongoing. The Company strives to maintain a significant level of female participation throughout the organisation and endeavours to attract female employees at all levels. The Board will continue to review the appropriateness of setting formal diversity objectives.
As at the date of this report, the proportion of women employed within the Group is as follows:
Level Number of Women Proportion of Women
Board 1 of 12 8.33%
Senior Executives* 10 of 80 12.5%
Whole of Organisation 996 of 6,760 14.73%
* Senior Executives include Executive Directors of Seven Group Holdings Limited and its subsidiaries, as well as other members of the Executive leadership team and, where appropriate, direct reports to the Executive leadership team. Executive Directors have been included in both the Board and Senior Executive categories. The Board and Senior Executives are included in the Whole of Organisation category.
PRINCIPLE 4 – SAFEGUARD INTEGRITY IN FINANCIAL REPORTINGThe Board has established an Audit & Risk Committee comprising Professor Murray Wells as its Chairman, Mr Peter Ritchie AO and Mr Christopher Mackay, who are Independent Directors. Professor Wells is an Emeritus Professor of Accounting, University of Sydney. Mr Ritchie is a Fellow of CPA Australia. Mr Mackay, a former investment banker and corporate and banking lawyer, has considerable experience in business management, capital allocation, risk management and investment. The Board believes the ASX Recommendations are satisfied as regards the technical expertise of the Audit & Risk Committee members.
The Audit & Risk Committee has adopted a formal Charter which is available on the Company’s website. The Committee’s key responsibilities in respect of its audit function are to assist the Board in fulfilling its responsibilities in relation to: • the accounting and financial reporting practices of the Company and its subsidiaries; • the consideration of matters relating to the financial controls and systems of the Company and its subsidiaries; • the identification and management of financial risk; and

Annual Report 2012 29
Corporate Governance Year ended 30 June 2012
• the examination of any other matters referred to it by the Board.
The Audit & Risk Committee is also responsible for:• making recommendations to the Board on the appointment (including procedures for selection), and where necessary,
the replacement of the External Auditor; • evaluating the overall effectiveness of external audit function through the assessment of external audit reports and
meetings with the External Auditors; • reviewing the External Auditor’s fees in relation to the quality and scope of the audit with a view to ensuring that an
effective comprehensive and complete audit can be conducted for the fee; and • assessing whether non-audit services provided by the External Auditor are consistent with maintaining the External
Auditor’s independence.
Each reporting period, the External Auditor provides an independence declaration in relation to the audit. Additionally, the Audit & Risk Committee provides advice to the Board in respect of whether the provision of non-audit services by the External Auditor are compatible with the general standard of independence of auditors imposed by the Corporations Act.
The current practice is for the rotation of the appropriate External Audit partner(s) to occur every five years (subject to the requirements of applicable professional standards and regulatory requirements). If a new auditor is to be appointed, the selection process involves a formal tender and evaluation of the tenders by the Audit & Risk Committee. The Chair of the Committee leads the process, in consultation with the CFO.
It is the policy of the Audit & Risk Committee to meet periodically with the External Auditors without management being present.
The Audit & Risk Committee’s key responsibilities in respect of its risk function are set out below under “Principle 7 – Recognise and Manage Risk”.
PRINCIPLE 5 – MAKE TIMELY AND BALANCED DISCLOSUREThe Company complies with the continuous disclosure obligations of the ASX Listing Rules and, in doing so, immediately notifies the market of any material price sensitive information. The Company has adopted and implemented a Continuous Disclosure Policy which sets out the procedure for the identification of material price sensitive information and reporting of such information to the Company Secretary for review. A summary of the Continuous Disclosure Policy is available on the Company’s website.
The Company Secretary has been nominated as the person with primary responsibility for communication and liaison with the ASX in relation to ASX Listing Rules and continuous disclosure issues. The Company Secretary also has responsibility for ensuring internal compliance with those ASX Listing Rules and the oversight of information released to the ASX and shareholders.
PRINCIPLE 6 – RESPECT THE RIGHTS OF SHAREHOLDERSAs disclosed in the Board Charter posted on the Company’s website, the Board aims to ensure that shareholders are informed of all major developments affecting the Company’s state of affairs by promoting effective communication with shareholders principally through ASX announcements, the Company website, the provision of the Annual Report, including the Financial Statements, and the Annual General Meeting (and any extraordinary meetings held by the Company) and notices of General Meetings. Information concerning resolutions for consideration at the Company’s General Meetings is provided in the notice of meeting. Shareholders are encouraged to participate in General Meetings and are invited to put questions to the Chairman of the Board in that forum. The Board ensures that the Company’s External Auditor attends all Annual General Meetings and is available to answer shareholders’ questions about the conduct of the audit and the preparation and content of the Auditor’s report thereon.
The Company’s website provides additional information about the Company. The Board continues to review its channels of communications with shareholders for cost effectiveness and efficiencies, including using electronic delivery systems for shareholder communications where appropriate.
PRINCIPLE 7 – RECOGNISE AND MANAGE RISKThe Company recognises that the management of business and economic risk is an integral part of its operations and has established policies and procedures for the oversight and management of material business risks, including the establishment of the Audit & Risk Committee. As mentioned above under “Principle 4 – Safeguard Integrity in Financial Reporting” the Audit & Risk Committee comprises Professor Murray Wells as its Chairman, Mr Peter Ritchie AO and Mr Christopher Mackay.

30 Seven Group Holdings Limited (ABN 46 142 003 469)
Corporate Governance Year ended 30 June 2012
The Board requires management to design and implement a risk management and internal control system to manage the entity’s material business risks and report to it on the management of those risks. During the reporting period, management reported to the Board as to the effectiveness of the Company’s management of its material business risks.
Commissioned through the Audit & Risk Committee and facilitated by an external consultant, a Strategic Risk Assessment was undertaken during the year by the Company. The Strategic Risk Assessment identifies, assesses, ranks and updates the main strategic risks, including material business risks, facing the Company in respect of which management formulates and records the internal risk controls implemented for those risks. The Strategic Risk Assessment process included separate risk assessments facilitated by an external consultant with key management of each of the Seven Group Holdings, WesTrac Group and National Hire. The risks of the Group’s businesses and investments were then considered on a consolidated basis to produce a Group risk profile of which the key categories of risk are financial and investment risks. During Committee meetings throughout the year, the Audit & Risk Committee received risk briefings from management concerning the Group’s key business operations. WesTrac provides regular reporting on workplace safety practices and management within the WesTrac Group. Additionally, the Company maintains a Business Continuity Management System under which critical business processes are identified across the Company and business continuity plans developed for ongoing review by Head of Internal Audit.
The Audit & Risk Committee also monitors compliance with applicable laws and regulations. As mentioned under “Principle 4 – Safeguard Integrity in Financial Reporting” the Committee has adopted a formal Charter which, in addition to a summary of the Risk Management Policy, is available on the Company’s website.
The Company has also established an Internal Audit function which reports to the Audit & Risk Committee. The Internal Audit function is charged with conducting detailed reviews of relevant controls in the areas of accounting, information and business operations and fulfilling a program of work to test controls implemented by management in these areas.
The risk assessment framework described above, including the Internal Audit function, is an integral part of the process underlying the statement made annually by the Group Chief Executive Officer and the Chief Financial Officer regarding the integrity of the Financial Statements.
The statement is founded on a sound system of risk management, internal compliance and control of material business risks which management has reported to the Board was operating effectively in all material respects, including in relation to financial reporting risks for the financial year ended 30 June 2012 and provides reasonable assurance that the policies prescribed by the Board, either directly or through delegation to Committees or senior executives, have been implemented.
Pursuant to section 295A of the Corporations Act, each person who performs the chief executive function and the chief financial officer function confirm in writing to the Board that the financial records of the Company for the financial year have been properly maintained, the Financial Statements are prepared in accordance with relevant accounting standards, and the Financial Statements and notes present a true and fair view. These statements also confirm that the integrity of the Financial Statements and notes, and of the financial reporting system, is founded on a sound system of risk management and internal compliance and control systems which, in all material respects, implement the policies prescribed by the Board. The Directors’ Declaration set out in this Annual Report confirms that the declarations required by section 295A of the Corporations Act have been given.
PRINCIPLE 8 – REMUNERATE FAIRLY AND RESPONSIBLYThe remuneration of the Non-Executive Directors of the Board is restricted, in aggregate, by the Constitution of the Company and the requirements of the Corporations Act. The Board has determined that Non-Executive Directors remuneration in aggregate will not exceed $2 million per annum. Fees for Directors are set out in the Remuneration Report. As the Directors consider that the attraction, retention and motivation of its Directors and senior executives is of critical importance in securing the future growth of the Company, its profits, share price and shareholder returns, Executive Directors and senior executives may receive performance linked payments. Non-executive Directors may receive additional payments at the discretion of the Board where appropriate in relation to special services that they perform for the Company.

Annual Report 2012 31
Corporate Governance Year ended 30 June 2012
The Board has established a Remuneration & Nomination Committee comprising Mr Peter Ritchie AO as its Chairman, Mrs Dulcie Boling, Mr Terry Davis and Mr Richard Uechtritz. The Remuneration & Nomination Committee Charter posted on the Company’s website sets out the role and responsibilities of the Committee. The terms of the Committee’s charter in respect of its Remuneration function are summarised below and in the Directors’ Report. The primary responsibilities of the Committee are, as required:• to review and advise the Board on Directors’ fees and the remuneration packages, including equity incentive grants, of
the Group Chief Executive Officer, Chief Executives and senior executives of the Group subsidiaries, and• to provide advice and support and serve as a sounding-board for the Group Chief Executive Officer and Board in human
resource and remuneration-related matters; and • to advise on succession planning and employee development policies.
During the year the Remuneration & Nomination Committee met to consider and recommend to the Board the proposed performance-linked remuneration of the Group Chief Executive Officer. The Group Chief Executive Officer’s performance-linked remuneration was then considered and approved by the Board, other than Mr Gammell who left the meeting during the consideration of that item of business. The Remuneration & Nomination Committee also met after the end of the financial year to review and recommend to the Board performance linked remuneration for the Group Chief Executive Officer as well as for senior Company executives. This process is summarised in the Remuneration Report.
The objective of the remuneration process is to ensure that remuneration packages properly reflect the duties and responsibilities of the employees and that the remuneration is at an appropriate but competitive market rate which enables the Company to attract, retain and motivate people of the highest quality and best skills from the industries in which the Company operates. This policy provides for the Group Chief Executive Officer to consider the remuneration packages paid within the industry and the impact these people are expected to have on the operational and financial performance of the Company.
Remuneration packages may include bonus, option or share elements and the Company has established Share and Option Plans for that purpose. The payment of bonuses shall be based on the achievement of specific goals which relate to the performance of the Company or as otherwise specified in the relevant employment contracts. Share Options are issued as a part of remuneration packages where they are considered appropriate, with exercise prices and hurdle rates which reflect the long-term objectives of the Company.
The Company also conducts annual employee performance reviews, involving a written questionnaire, discussion between employee and manager of employee competencies and the agreement of performance goals for the employee.
WesTrac largely determines performance linked incentives for senior employees and executives of the WesTrac Group within a budget approved by the Board. Remuneration matters relating to WesTrac are brought to the Remuneration & Nomination Committee or Board as appropriate.
In light of the ban on hedging remuneration of Key Management Personnel now found in the Corporations Act, and as there are established policies in relation to share trading and trading windows in respect of shares or entitlements owned by executives and senior employees it was not considered necessary to establish a policy in relation to entering into transactions in associated products which limit the economic risk of participating in unvested entitlements under an equity based remuneration scheme. Moreover the ability to deal with unvested rights is restricted in the Employee Share Option Plan under which options are granted. The Company will continue to monitor the appropriateness of this approach, and will implement such a policy if it determines that it is merited in these circumstances.
Further details relating to remuneration and Company’s remuneration policy, framework and structuring are contained within the Remuneration Report.

32 Seven Group Holdings Limited (ABN 46 142 003 469)
Directors’ Report Year ended 30 June 2012
The Directors are pleased to present their report together with the financial statements of the Group comprising Seven Group Holdings Limited (the “Company”), and its subsidiaries, and the Group’s interest in associates and jointly controlled entities for the financial year ended 30 June 2012 and the auditor’s report thereon.
DirectorsThe Directors of the Company at any time during or since the end of the financial year are:
Kerry Matthew Stokes AC (Executive Chairman) Peter David Ritchie AO (Deputy Chairman) Peter Joshua Thomas Gammell (Group Chief Executive Officer) David John Leckie (appointed Executive Director, Media on 26 June 2012)James Allan Walker (Chief Executive Officer, WesTrac Group) Elizabeth Dulcie Boling Terry James Davis Christopher John Mackay Bruce Ian McWilliam Ryan Kerry Stokes (appointed Chief Operating Officer on 28 August 2012)Richard Anders Uechtritz Professor Murray Charles Wells Robin Frederick Waters (Alternate Director for Mr PJT Gammell)
Particulars of their qualifications, experience, special responsibilities and any directorships of other listed companies are set out in the Annual Report under the headings “Board of Directors” and “Corporate Governance” and form part of this report.
Warren Walter Coatsworth is the Company Secretary. Particulars of Mr Coatsworth’s qualifications and experience are set out in the Annual Report under the heading “Company Secretary”.
Principal ActivitiesThe principal activities of the Group during the financial year were those of a diversified operating and investment group; with interests in heavy equipment sales and service and equipment hire and media and broadcasting. There were no significant changes in the nature of the principal activities of the Group during the financial year.
Net Consolidated ProfitThe net amount of the consolidated profit of the Group for the financial year after provision for income tax was $176,748,000 (2011: $79,913,000).
Dividends – Ordinary SharesSince the start of the financial year, a final fully franked dividend for the 2011 financial period of 18.0 cents per share, amounting to $55,154,000, was paid on 14 October 2011.
Since the start of the financial year, an interim fully franked dividend for the 2012 financial year of 18.0 cents per share, amounting to $55,334,000, was paid on 13 April 2012.
A final fully franked dividend for the 2012 financial year of 20.0 cents per share, amounting to $61,482,000 will be paid on 12 October 2012, based on the number of issued shares at the date of this report.
Dividends – TELYS4Since the start of the financial year, a fully franked dividend of $3.4798 per TELYS4 based on 4,963,640 TELYS4 on issue, amounting to $17,272,000 was paid on 30 November 2011.
A further fully franked dividend of $3.2107 per TELYS4 based on 4,963,640 TELYS4 on issue, amounting to $15,937,000 was paid on 31 May 2012.

Annual Report 2012 33
Directors’ Report Year ended 30 June 2012
Review and Results of OperationsA review of the operations during the financial year of the Group, and of the results of those operations, and of the financial position of the Group and its business strategies and prospects for future financial years is set out in the Annual Report under the heading “From the Executive Chairman” and “Year in Review”.
Significant Changes in the State of AffairsSignificant changes in the state of affairs of the Group during the financial year were as follows:
• On 20 September 2011, the Group, through a wholly owned subsidiary, made a cash offer of $3.00 per share (increased to $3.75 per share once the Group acquired at least 91.55% of the total National Hire Group Limited shares on issue) for the remaining shares in National Hire Group Limited that it currently did not own. The acquisition was completed on 25 January 2012 for a consideration of $191,953,000.
• On 20 February 2012, the Company announced that it had reached an agreement for Optus Mobile Pty Limited to acquire vividwireless Group Limited for a consideration of $230 million, including $60 million to be paid on re-issue of spectrum licences. The sale was completed on 19 June 2012.
• On 12 April 2012, WesTrac Pty Limited, a wholly owned subsidiary of the Company, and Caterpillar Inc, announced that the companies had reached an agreement for WesTrac to acquire from Caterpillar the distribution and support business formerly operated by Bucyrus in Western Australia, the Australian Capital Territory and New South Wales. Bucyrus is a world leader in the design and manufacture of high productivity mining equipment for the surface and underground mining industries. The acquisition of Bucyrus was completed on 1 June 2012 for a consideration of $410,461,000.
In the opinion of the Directors there were no other significant changes in the state of affairs of the Group that occurred during the financial year.
Events after end of Financial YearAs noted in Seven West Media Limited’s (“SWM”) ASX release dated 16 July 2012, the Company has committed to take up its full entitlement under SWM’s underwritten 1-for-2 accelerated renounceable entitlement offer. The total cost to the Company of $145,785,000 based on the offer price of $1.32 was paid on 27 July 2012.
Subsequent to 30 June 2012 the market value of the Company’s listed investments has declined from what is presented in the financial report. Details are provided in Note 33 of the Annual Report.
On 7 September 2012, Consolidated Media Holdings Limited (“CMH”) entered into a Scheme Implementation Deed with News Limited and News Pay TV Financing Pty Limited (“News”) under which, News has offered to acquire CMH for $3.45 cash per share by way of a scheme of arrangement (“the Scheme”).
The implementation of the Scheme is subject to a number of conditions including, but not limited to, CMH shareholder and Court approvals, the Independent Expert concluding that the Scheme is in the best interests of CMH shareholders, and there being no material adverse change. Further information is contained in CMH’s ASX release dated 7 September 2012.
At the date of this report, SGH is still evaluating the offer in relation to its investment in CMH.
Other than the above, there has not arisen in the interval between the end of the financial year and the date of this report any item, transaction or event of a material and unusual nature likely, in the opinion of the Directors of the Company, to affect significantly the operations of the Group, the results of those operations, or the state of affairs of the Group, in future financial years.
Likely Developments and Expected Future ResultsExcept for matters otherwise disclosed in this report or the financial report, information as to likely developments in the operations of the Group and the expected results of those operations in future financial years has not been included in this report because, in the opinion of the Directors, to do so would prejudice the interests of the Group.
Directors’ Interests in SecuritiesThe relevant interest of each Director in ordinary shares, TELYS4 or options issued by the companies within the Group, as notified by the Directors to the Australian Securities Exchange in accordance with S205G(1) of the Corporations Act, at the date of this report is as follows:

34 Seven Group Holdings Limited (ABN 46 142 003 469)
Directors’ Report Year ended 30 June 2012
Directors’ holdings of Seven Group Holdings Limited shares as at 21 September 2012
Ordinary Shares
Options over Ordinary
Shares TELYS4
KM Stokes AC 207,304,349 Nil Nil
PD Ritchie AO 46,072 Nil Nil
PJT Gammell 494,345 Nil Nil
DJ Leckie 66,908 3,000,000 Nil
JA Walker 70,000 Nil Nil
ED Boling Nil Nil Nil
TJ Davis Nil Nil 5,500
CJ Mackay Nil Nil Nil
BI McWilliam 1,280,447 1,000,000 Nil
RK Stokes 93,000 Nil Nil
MC Wells 4,000 Nil 710
RA Uechtritz 318,442 Nil Nil
RF Waters 10,000 Nil Nil
Options granted over Ordinary Shares in Seven Group Holdings LimitedOn 28 April 2010, an Employee Share Option Plan was approved by the Board to enable the provision of performance based incentives to the Company’s Senior Executives.
On that date, 6,875,000 options were granted pursuant to the Plan to six option holders, as follows - 2,775,000 options at an exercise price of $7.00, 1,750,000 options at an exercise price of $8.00, 1,850,000 options at an exercise price of $9.00, 250,000 at an exercise price of $10.00 and 250,000 at an exercise price of $11.00.
All options expire on the earlier of their expiry date or 180 days following the termination of the holder’s employment. In addition, the ability to exercise options is conditional on the achievement of Total Shareholder Return hurdles. Further details are included in the Remuneration Report.
During the financial year and up to the date of this report, the following options were exercised:
• 250,000 options with an exercise price of $7.00• 250,000 options with an exercise price of $8.00; and• 500,000 options with an exercise price of $9.00.
25,000 options with an exercise price of $7.00, 250,000 options with an exercise price of $10.00 and 250,000 options with an exercise price of $11.00 lapsed. No options were granted during the year.
Unissued Shares under OptionsAt the date of this report, the following options to acquire an equivalent number of ordinary shares in the Company under the Employee Share Option Plan are outstanding:
Options on Issue Exercise Price Expiry Date
1,500,000 $7.00 30 June 2014
1,500,000 $8.00 30 June 2014
1,250,000 $9.00 30 June 2014
4,250,000
The names of the executives who currently hold options, granted at any time, are entered in the Register of Options kept by the Company pursuant to Section 170 of the Corporations Act. The Register may be inspected free of charge.

Annual Report 2012 35
Directors’ Report Year ended 30 June 2012
None of the options, referred to above issued by the Company or its controlled entities, entitle the holders to participate in any share issue of the Company or any other body corporate.
There are no unissued shares of the Company under option as at the date of this report, other than those referred to above.
Directors’ MeetingsThe number of meetings of the Company’s Directors (including meetings of committees of Directors) held during the financial year, and the number of those meetings attended by each Director, was:
DIRECTOR BOARD AUDIT & RISKREMUNERATION &
NOMINATIONINDEPENDENT & RELATED PARTY
Held Attended Held Attended Held Attended Held Attended
KM Stokes AC 15 13 0 0 1 1 0 0
PD Ritchie AO 15 14 5 3 2 2 2 1
PJT Gammell 15 13 5 5 1 1 0 0
DJ Leckie 15 13 0 0 0 0 0 0
JA Walker 15 15 0 0 0 0 0 0
ED Boling 15 15 0 0 2 2 2 2
TJ Davis 15 15 0 0 2 2 2 2
CJ Mackay 15 15 5 5 0 0 2 2
BI McWilliam 15 14 4 4 0 0 2 2
RK Stokes 15 13 5 5 0 0 0 0
MC Wells 15 15 5 5 0 0 2 2
RA Uechtritz 15 15 0 0 2 2 2 2
ALTERNATE DIRECTOR
RF Waters 0 0 0 0 0 0 0 0
The number of meetings held reflects the number of meetings held while the Director concerned held office during the year. A Director may also have been absent from a meeting, or part thereof, if there was a conflict of interest. A Director may also have attended a Committee meeting as an invitee.
IndemnityThe Constitution of the Company provides an indemnity to any current and former Director and secretary of the Company against any liabilities incurred by that person, or arising out of, the discharge of duties as an officer of the Company or the conduct of the business of the Company, including associated legal costs defending any proceedings relating to that person’s position with the Company in specified circumstances.
As permitted by the Constitution of the Company, the Company has entered into deeds of access, insurance and indemnity with each Director as at the end of the financial year.
Insurance PremiumsThe Company has paid insurance premiums in respect of a directors’ and officers’ liability insurance contract insuring against certain liabilities (subject to exclusions) of all current and former officers of the Company and its subsidiaries, including all Directors named in this report, the Company Secretary and all persons concerned in, or taking part in the management of, the Company and its controlled entities, and former Directors and officers who have retired or relinquished their positions.
The insurance policies prohibit disclosure of the premiums paid in respect of those policies and the nature of the liabilities insured by the policies.

36 Seven Group Holdings Limited (ABN 46 142 003 469)
Directors’ Report Year ended 30 June 2012
Environmental DisclosureIn respect of the environmental regulations under any laws of the States, Territories and Commonwealth of Australia, the significant regulations that apply to the media operations of the entities the Company holds investments in are those guidelines and standards issued by the Australian Communications and Media Authority.
It is the Directors’ understanding that the Company is fully compliant with the provisions of these guidelines and standards. Various State Environmental Protection Authorities have issued licenses to the Company under the laws of the respective States. All requirements and conditions of these licenses have been complied with to the satisfaction of the issuing authority.
The Company assesses the Group as part of its compliance with the National Greenhouse and Energy Reporting Act and will be reporting relevant emissions and energy usage and production for the Group for the financial year.
There are no other particular environmental regulations applying to WesTrac or the Group.
Non Audit ServicesThe appointment of KPMG as the Company’s auditor was confirmed by the approval of the shareholders at the first Annual General Meeting of the Company held on 9 November 2010.
During the year KPMG, the Company’s auditor, has performed certain other services in addition to their statutory duties.
The Board has considered the non audit services provided during the year by the auditor and is satisfied that the provision of those non audit services during the year by the auditor is compatible with, and did not compromise, the auditor independence requirements of the Corporations Act 2001 for the following reasons:
• all non audit services were subject to the corporate governance procedures adopted by the Company and have been reviewed by the Board in terms of the Company’s formal Auditor Independence Policy to ensure that they do not impact the integrity and objectivity of the auditor; and
• the non audit services provided do not undermine the general principles relating to auditor independence as set out in APES 110 Code of Ethics for Professional Accountants, as they did not involve reviewing or auditing the auditor’s own work, acting in a management or decision making capacity for the Company, acting as an advocate for the Company or jointly sharing risks and rewards.
Details of the amounts paid to the auditor of the Group, KPMG, and its related practices for audit and non-audit services provided during the year are set out below. In addition, amounts paid to other auditors have been disclosed.
Amounts received or due and receivable by auditors of the Company for:
2012 ($000)
2011 ($000)
Audit Services
Auditors of the Company
KPMG Australia
– Audit and review of financial reports 581 412
– Other assurance services 5 84
Overseas KPMG firms
– Audit and review of financial report 109 119
Other auditors
– Audit and review of financial reports 169 195
– Other assurance services – 283
Total 864 1,093
Other Services
KPMG Australia:
– Other advisory services 215 –
Overseas KPMG firms:
– Other tax and advisory services 14 41
Other Auditors:
– Other tax and advisory services – 62
Total 229 103

Annual Report 2012 37
Directors’ Report Year ended 30 June 2012
The lead auditor’s independence declaration is set out on page 51 and forms part of the Directors’ Report for the year ended 30 June 2012.
Remuneration & Nomination CommitteeThe Remuneration & Nomination Committee is appointed by the Board and consists of a minimum of three members. The Committee must have a majority of independent Directors, all of whom must be Non-executive Directors. The Board will appoint the Chair of the Committee. The Chair must be an independent Non-executive Director who is not the Chair of the Board. The Board may appoint such additional Directors to the Committee or remove and replace members of the Committee by resolution.
Role of the Committee The Remuneration & Nomination Committee operates under the delegated authority of the Board. As so requested by the Board and / or the Group CEO, the Committee shall fulfil the following responsibilities:
• Provide advice and support and serve as a sounding-board for the Group CEO and Board in human resource matters. • Provide advice to the Group CEO on senior executive remuneration, appointment of new senior staff including proposed
remuneration packages and the corporate remuneration structure. • Make recommendations to the Board on remuneration of the Group CEO and the awarding of any contracted bonuses. • Obtain external advice on which to make recommendations to the Board on remuneration of Non-Executive Directors
and, as necessary, in relation to any aspects of the corporate remuneration structure. • Review and make recommendations to the Board on all proposed offers to participate in, and all grants made pursuant
to, the Company’s equity plans and the overall functioning of the equity plans. • Provide to Senior Management a forum for consideration and advice on employee relations and human resource issues
and remuneration competitiveness in the marketplace and the industry. • Review and advise on Senior Managements’ succession planning and employee development policies.
The Committee will be dependent upon the Group CEO for most of the advice and this will be an on-going process based around an annual review. Approvals may be in retrospect, or ratified by the Committee, as appointments, promotions and some remuneration changes may take place between meetings, on the approval of the Group CEO.
MembershipThe members of the Committee during the year and to the date of this report were:
Name Position Held Status
Peter David Ritchie AO Chairman Independent Director
Elizabeth Dulcie Boling Member Independent Director
Terry James Davis Member Independent Director
Richard Anders Uechtritz Member Independent Director
AdvisorsThe Committee is able to obtain independent professional advice to assist them in carrying out their duties as required and at the Company’s expense.

38 Seven Group Holdings Limited (ABN 46 142 003 469)
Remuneration Report Year ended 30 June 2012
Message from the BoardDear Shareholders
Executive remuneration reviewDuring the 2012 financial year (FY12) the Board undertook a review of the Group’s executive remuneration framework following feedback from shareholders, and to greater align executive remuneration with the strategic objectives of the Group and the long-term interests of shareholders.
As you will be aware, Seven Group Holdings Limited (SGH) increased total revenue significantly during the year (by 41% to a record $4,456.4 million), and reported basic earnings per share growth of 268%, to 43 cents. On an underlying basis (excluding Significant Items), earnings per share increased 46% to 98 cents. However, the reported result was impacted by the after tax cost of Significant Items of $166m, largely due to the mark-to-market of SGH’s investment in Seven West Media. As such, the reported result, which is the basis for measuring executive performance, fell short of the Company’s original target and, accordingly, executive variable remuneration outcomes were modest reflecting the challenging performance targets set by the Board at the beginning of FY12.
Group Chief Executive Officer remunerationFor FY12, the Group Chief Executive Officer (CEO) did not achieve the challenging financial corporate goals set by the Board under the Short-Term Incentive plan. The Group CEO was assessed by the Board to have partially achieved his personal goals which resulted in a cash award equal to 12% of the Group CEO’s fixed remuneration.
In addition, as a result of not meeting the FY12 financial targets, no award under the new Long-Term Incentive (LTI) plan will be made to the Group CEO for FY12. Further detail on the new LTI plan is provided below.
New LTI plan implemented for FY12 and future yearsAs noted above, with effect from the FY12 performance year, the deferred equity component of the Performance Management Plan (which was based on annual Earnings Per Share performance) which was in place last year, has been discontinued and a new LTI plan has been introduced.
The LTI plan will, subject to a pre-determined financial target for the relevant year being achieved, provide grants of performance rights (i.e., the right to receive shares if performance hurdles are met at the end of the performance period) to the Group CEO and other selected executives.
Grants made are then subject to three-year performance conditions which determine the extent to which the awards vest. The performance hurdles that determine the level of vesting of performance rights will be Earnings per Share growth and relative Total Shareholder Return performance against a pre-determined group of peer companies. The LTI plan will not permit re-testing (i.e., if threshold targets are not met at the end of the three-year performance period, the performance rights will lapse).
The new LTI plan encourages sustained long-term performance and enhances the alignment between the interests of executives and those of shareholders. Further details of the LTI plan are outlined in section 5.b. of the Remuneration Report. The LTI plan will be put to shareholders for approval at the forthcoming Annual General Meeting in November 2012.
As noted in the discussion of the Group CEO’s remuneration above, the group financial targets to qualify executives for participation in the proposed LTI were not met in respect of FY12. As such, there were no grants of performance rights in respect of FY12.
New minimum shareholding guidelines for executivesWith effect from 1 July 2012, the Board has implemented new minimum shareholding guidelines for executives, based on the executive’s length of service with SGH. The guidelines encourage executives to hold SGH shares and further align their interests with those of shareholders.
Executive changes during the yearWe welcome the appointment of the new Company and Group Chief Financial Officer, Andrew Harrison, who started on 9 November 2011 as well as the transition of David Leckie to his new role as Executive Director, Media, for Seven Group Holdings Limited on 26 June 2012.
Following the conclusion of the 2012 financial year, Ryan Stokes was appointed as Chief Operating Officer on 28 August 2012. We look forward to continuing to work with Andrew, David and Ryan in their new roles with the Company.

Annual Report 2012 39
Remuneration Report Year ended 30 June 2012
Further details on the executive remuneration arrangements and the remuneration outcomes for FY12 are set out in this Remuneration Report. I look forward to answering any questions you may have at our Annual General Meeting in November.
Yours faithfully
Peter David Ritchie AO Chairman of the Remuneration & Nomination Committee
Remuneration Report – audited ContentsThe Remuneration Report is set out under the following main headings:
1. Introduction 5. Executive remuneration framework
2. Remuneration governance a. Short-term incentive plan
3. Remuneration principles and strategy b. Long-term incentive plan
4. Executive Chairman and Non-Executive Director remuneration framework
6. Legacy share-based remuneration
7. Summary of executive contracts
8. Remuneration in detail
9. Link between remuneration and company performance
1. IntroductionThe Directors of Seven Group Holdings Limited (the Company) present the Remuneration Report for the year ended 30 June 2012 (FY12). The Remuneration Report forms part of the Directors’ Report and has been audited in accordance with the Corporations Act 2001.
The Remuneration Report details the remuneration arrangements for Key Management Personnel (KMP), which include Executive Directors, Non-Executive Directors and executives of Seven Group Holdings Limited.
The introduction of the Corporations Amendment (Improving Accountability on Director and Executive Remuneration) Act 2011 (Cth) has removed the requirement to disclose remuneration for the five highest paid executives and limits disclosure to KMP only.
The Group’s KMP for the year ended 30 June 2012 are listed in the table below.
Executive Directors
Kerry Matthew Stokes AC Executive Chairman
Peter Joshua Thomas Gammell Group Chief Executive Officer (CEO)
David John Leckie^ Executive Director, Media (from 26 June 2012)
James Allan Walker Chief Executive Officer, WesTrac Group
Bruce Ian McWilliam Commercial Director
Ryan Kerry Stokes ^^ Executive Director
Non-Executive Directors
Peter David Ritchie AO Deputy Chairman
Elizabeth Dulcie Boling Director
Terry James Davis Director
Christopher John Mackay Director
Richard Anders Uechtritz Director
Murray Charles Wells Director
Robin Frederick Waters Alternate Director for PJT Gammell

40 Seven Group Holdings Limited (ABN 46 142 003 469)
Remuneration Report Year ended 30 June 2012
Group executives^^^
Andrew Harrison Company and Group Chief Financial Officer (from 9 November 2011)
Peter Lewis Company and Group Chief Financial Officer (from 1 July 2011 to 8 November 2011)
^ Mr Leckie was a Director of Seven Group Holdings for the entire FY12 year, and commenced as Executive Director, Media from 26 June 2012.
^^ Mr R Stokes was appointed as the Company’s Chief Operating Officer on 28 August 2012. All remuneration information contained in this report relates to Mr R Stokes’ role as Executive Director during FY12.
^^^ Due to the Executive Directors being responsible for the operating entities of the Group, the Group has a small additional team of Group executives.
2. Remuneration governanceRole of the Remuneration & Nomination CommitteeThe role and responsibilities of the Remuneration & Nomination Committee are explained in detail in the Directors’ Report. The key responsibilities of the Committee are summarised below and include the following:
• Make recommendations to the Board in relation to the remuneration of the Group CEO and Non-Executive Directors, as necessary.
• Review and make recommendations to the Board on all proposed offers to participate in, and all grants made pursuant to, the Company’s equity plans and the overall functioning of the equity plans.
• Review and advise on senior management succession planning and employee development policies.
Engagement of remuneration advisorsThe Remuneration & Nomination Committee obtains independent advice on the appropriateness of remuneration arrangements for the Company and Group KMP, as required. Advice is sought in relation to remuneration trends for comparative companies both locally and internationally. Any advice received by the Company is considered in light of the Company’s remuneration policy and objectives.
During FY12 no remuneration recommendations, as defined by the Corporations Act, were requested by or provided to the Remuneration & Nomination Committee by any remuneration consultant. Advice was obtained by the Remuneration & Nomination Committee in relation to the overall design of the new LTI plan.
3. Remuneration principles and strategyRemuneration principlesGiven the nature of the Company’s business and the policy of primarily setting operational management remuneration at the operating entity levels, the Company is focused on retaining quality directors and a small team of key personnel with the appropriate skills and expertise.
While the Board determines and applies specific remuneration policies at the Company level, the operating entities have a level of flexibility in determining and setting their own remuneration policies and arrangements within budgets for the operating entity reviewed by management of the Company and approved by the Board. Remuneration matters relating to the Group’s operating entities are brought forward to the Remuneration & Nomination Committee as appropriate.
The key principles underlining the Group’s Remuneration Policy are:
• Ensure that remuneration packages properly reflect the duties and responsibilities of the employees and that the remuneration is at an appropriate but competitive market rate which enables the Group to attract, retain and motivate people of the highest quality and best skills from the industries in which the Company and Group operate;
• Ensure the Group’s remuneration structures are equitable and aligned with the long-term interests of the Group and its shareholders and having regard to relevant Group policies;
• Structure incentives that are linked to the creation of sustainable shareholder returns; and • Ensure any termination benefits are appropriate.
Remuneration strategyThe following diagram illustrates how the Group’s remuneration strategy and approach is linked to the business’ objectives and aligned to the long-term interests of shareholders and the creation of sustainable shareholder returns.

Annual Report 2012 41
Remuneration Report Year ended 30 June 2012
Business objective
Efficiently allocate capital and to work with investee companies where it has a significant stake to increase value in its investments
Remuneration strategy and objectives
Attract, retain and motivate people of the highest quality
We attract, motivate and retain key talent by providing market competitive remuneration, which provides a mix of fixed and variable short-term and long-term incentives.
Align remuneration structures with the long term interests of the Group and shareholders
Short-term and long-term incentive outcomes are dependent on the achievement of financial and non-financial business objectives, and shareholder return measures including Total Shareholder Return and Earnings Per Share.
Fixed remuneration (FR) Short-term incentives (STI) Long-term incentives (LTI)
FR consists of base salary, as well as employer superannuation contributions.
FR is set by having regard to listed companies of a similar size and complexity.
The STI plan delivers an annual cash incentive where executives have achieved stretching performance measures.
Performance is typically measured using a mix of financial corporate goals such as NPAT, and non-financial personal goals including:
• Leadership and staff development;• Strategic direction; and• Investment performance.
The LTI plan will provide grants of performance rights to the Group CEO and other selected executives. Grants are only made if the financial performance targets for the relevant financial year are achieved.
Once made, the grants are subject to further performance hurdles to determine the proportion of performance rights that vest.
Performance hurdles which determine the extent to which performance rights vest are Earnings per Share growth and relative Total Shareholder Return over a three-year period. A WesTrac-specific performance hurdle will apply for a significant portion of any grant to the CEO, WesTrac.
The Company’s TSR is measured against a comparable group of companies (S&P/ASX 100 index excluding Financials).
Total Shareholder Return and Earnings Per Share growth provide alignment of executive remuneration outcomes and shareholder returns.
4. Executive Chairman and Non-Executive Director remuneration frameworkNon-Executive Directors’ remuneration is reviewed by the Board, taking into account the recommendations of the Remuneration & Nomination Committee and, as appropriate, external benchmarking of remuneration for Non-Executive Directors of comparable companies. Non-Executive Director fees remained unchanged during FY12.
The objective of the Committee in making its recommendations is to attract, retain and properly motivate Directors who will, through their contribution to the Board and the Group, work towards creating sustainable value for shareholders and stakeholders.
Executive Chairman feesMr Kerry Stokes AC, Executive Chairman, receives a director’s fee of $350,000. He does not receive any variable remuneration or other performance related incentives such as options or rights to shares. In addition, no retirement benefits are provided to the Executive Chairman other than superannuation contributions.
Non-Executive Director FeesNon-Executive Directors receive a fixed fee which includes a base fee and additional fees for being the Chair or member of a Board Committee (Committee fees). Board and Committee fees are paid in the form of cash and statutory superannuation contributions.

42 Seven Group Holdings Limited (ABN 46 142 003 469)
Remuneration Report Year ended 30 June 2012
The table below sets out the base and Committee fees inclusive of superannuation which applied during FY12.
Non-Executive Director Fees
Base fee $150,000
Committee Chair fees
Audit & Risk Committee $60,000
Remuneration & Nomination $40,000
Independent & Related Party $40,000
Committee member fees
Audit & Risk $20,000
Remuneration & Nomination $20,000
Independent & Related Party $20,000
The Non-Executive Directors do not currently receive any variable remuneration or other performance related incentives such as options or rights to shares, and no retirement benefits (except as outlined below) are provided to Non-Executive Directors other than superannuation contributions. However, Non-Executive Directors may receive performance linked payments and other payments at the discretion of the Board in relation to special services that they perform for the Company.
Approved fee poolIn accordance with the Company’s Constitution and the requirements of the Corporations Act and ASX Listing Rules, the aggregate fees payable to the Non-Executive Directors are set at a maximum level approved by shareholders. The current aggregate pool available for the payment of fees to the Executive Chairman and Non-Executive Directors is $2,000,000 per annum.
Non-Executive Director Retirement BenefitsA Retirement Deed was previously entered into with three qualifying Non-Executive Directors of Seven Network Limited in relation to the benefit payable on retirement to Directors who have served more than five years as Seven Network Limited Directors. These Retirement Deeds have been in place for a number of years. The benefits payable upon retirement under the Deeds were frozen on 1 August 2003 at three times the average of the Director’s emolument over the previous three years and no further increases will apply. From that date, retirement benefits were not offered to any newly appointed Non-Executive Directors. Three Non-Executive Director Retirement Deeds now remain current in respect of Seven Network Limited. No retirement benefits apply in respect of Seven Group Holdings Limited Non-Executive directorships.
5. Executive remuneration frameworkThe Company’s remuneration structures are designed to attract suitably qualified candidates, reward the achievement of strategic objectives and achieve the broader outcome of creation of value for shareholders.
Total remuneration comprises of fixed and variable remuneration which is dependent on the achievement of financial and non-financial performance measures. When determining the nature and amount of remuneration the Remuneration & Nomination Committee considers the appropriate level of total remuneration for each executive by examining the total reward provided to comparable roles in organisations of similar global complexity, size and reach.
Fixed remunerationFixed remuneration consists of base salary (which includes any Fringe Benefit Tax charges related to employee benefits), as well as employer contributions to superannuation funds.
Remuneration levels are reviewed by the Remuneration & Nomination Committee through a process that considers individual, segment and overall performance of the Group. In addition, external consultants may be requested to provide analysis and advice to ensure the Executive Directors and Company executives’ remuneration is competitive in the market place.
The Board considers that the demands of the role of Group CEO require a candidate possessing skills and experience in a diverse range of industries, including media, mining, industrial services and investing. The Group CEO’s remit includes overseeing the strategy of the Group, subject to the input and approval of the Board.
Mr Peter Gammell is uniquely qualified for the position, given his history of close involvement with the core businesses of the Group and its investments, including an association of over 20 years with WesTrac Group as well as his Directorship of Seven Network Limited since 1997. Additionally, Mr Gammell fulfilled a key role in the formation and structure of Seven Group Holdings Limited following the merger in May 2010 of the WesTrac Group and Seven Network Limited, as well as the Company’s investment in Seven West Media Limited following the merger between Seven Media Group and West Australian Newspapers Holdings Limited in April 2011.
Annual Report 2012 43
Remuneration Report Year ended 30 June 2012
During the year ended 30 June 2012 Mr Gammell’s strategic contributions to the Group included managing the Group’s minority buy out of the balance of holdings in National Hire Group Limited such that National Hire is now a 100% owned subsidiary of SGH, and assisting with the refinancing of Coates Hire.
Mr Gammell’s fixed remuneration was announced to the ASX on 22 September 2010. The Board considers Mr Gammell’s fixed remuneration is appropriate having regard to the responsibilities and duties of Mr Gammell, as well as his influence on the investment decisions and strategy of the Group.
Variable remunerationPerformance linked remuneration is designed to reward Company executives and selected Executive Directors (excluding the Executive Chairman who does not receive any variable remuneration) for meeting or exceeding financial and individual objectives. Further details on STI and LTI are discussed in the following sections of the Remuneration Report.
Remuneration mixThe following table outlines the current target remuneration mix for the Group CEO and other executives. The Group CEO has a higher proportion of remuneration “at-risk” (and subject to performance conditions) to reflect the greater responsibility and accountability for the business’ performance relative to other Company executives.
Position Fixed remuneration Target STI LTI grant opportunity
Group CEO 57% 23% 20%
Other executives 57% – 67% 17% – 21% 17% – 21%
Minimum shareholding guidelines for executivesWith effect from 1 July 2012, the Board implemented new minimum shareholding guidelines to encourage executives to hold SGH shares and further align their interests with those of shareholders. The guidelines impose a minimum level of shareholding based on the executive’s length of service with SGH, as follows:
• On reaching five years of service, SGH shares equivalent in value to at least 20% of annual base salary should be held; • On reaching 10 years of service, SGH shares equivalent in value to at least 40% of annual base salary should be held;• On reaching 15 years of service, SGH shares equivalent in value to at least 60% of annual base salary should be held;• On reaching 20 years of service, SGH shares equivalent in value to at least 80% of annual base salary should be held.
a. Short-term incentive (STI) planThe Group CEO, Chief Operating Officer (COO), Group Chief Financial Officer (CFO) and CEO, WesTrac participate in the Company’s Short-Term Incentive (STI) plan (formerly the Performance Management Plan (PMP)) which provides executives with the opportunity to receive an annual cash incentive subject to the achievement of corporate and personal performance measures.
Further detail in relation to the STI is provided in the table below.
Short-Term Incentive plan
What is the purpose of the STI plan?The STI plan is intended to reward executives for the achievement of annual corporate performance measures, including the achievement of SGH Net Profit After Tax (NPAT) and divisional targets and performance against individual personal goals.
Who is eligible to participate? The Group CEO, COO (formerly Executive Director), CFO and CEO WesTrac.
How is the STI delivered?The STI is awarded as a lump sum cash payment after corporate and personal goals have been measured and assessed following the end of the financial year.
What is the target STI opportunity for participants?
Target STI opportunity (as a percentage of fixed remuneration)
Group CEO 40%
COO 25%
CFO 25%
CEO, WesTrac 37.5%

44 Seven Group Holdings Limited (ABN 46 142 003 469)
Remuneration Report Year ended 30 June 2012
Short-Term Incentive plan
What are the performance measures and weightings for the cash component?
The performance measures and weightings for each of the participants are outlined in the table below. Performance measures are intended to reflect the executive’s individual accountabilities.
Executive Weighting Performance measures
Group CEO
Corporate goals (40%) • SGH’s statutory NPAT performance*
Personal goals (60%)
Personal goals are assessed against specified criteria:• Performance against budget;• Leadership and staff development;• Strategic direction;• Investment performance; and • Direction of the Company’s operating
businesses.
COO
Corporate goals (40%) • SGH’s statutory NPAT performance*
Personal goals (60%)
Personal goals are assessed against specified criteria, for example:• Providing support to operating
businesses to achieve target;• Analysis and execution of investment
opportunities;• Monitoring Company investments;
and Representation of the Company to relevant stakeholders.
CFO
Corporate goals (40%) • SGH’s statutory NPAT performance*
Personal goals (60%)
Providing support to operating businesses to achieve target;
• Management of group debt facilities;• Leadership and staff development;• Analysis of investment opportunities; • Monitoring Company investments; and • Representation of the Company to
relevant stakeholders.
CEO, WesTracCorporate & Personal goals (100%)
• WesTrac Group’s NPAT*• Performance against budget;• Leadership and staff development;• Strategic direction; and• Management and executive oversight
of WesTrac operations.
* Subject to Board discretion the statutory NPAT and WesTrac Group NPAT outcomes may be calculated before significant items.
STI awards shall not be provided in circumstances where individual performance is unsatisfactory.
The corporate goals for each of the STI participants (with the exception of the CEO, WesTrac) are determined relative to SGH’s statutory NPAT performance. The NPAT target for FY12 was $278.3m
The FY12 outcomes under the STI are outlined in the table on page 45 of the Remuneration Report.
How are performance and the performance measure weightings determined?
SGH NPAT is based upon NPAT reported in the Group’s audited financial statements and WesTrac NPAT is based upon divisional NPAT of the WesTrac Group, to ensure the assessment of corporate goals is aligned with business performance. Subject to the Board’s discretion SGH NPAT or WesTrac NPAT performance against targets may be calculated before significant items.
Personal goals are measured using a balanced scorecard approach based on measurable and quantifiable targets.
Measurement against audited financial measures provides ensures performance is measured objectively. In relation to the personal goals, using a balanced scorecard approach ensures targets are where applicable measurable and quantifiable.
Who assesses performance against targets?
The level of the STI award is subject to Board approval, based on recommendations provided by the Remuneration & Nomination Committee.
The performance of executives against targets is assessed by the CEO and Executive Chairman.

Annual Report 2012 45
Remuneration Report Year ended 30 June 2012
FY12 STI outcomesThe table below provides the weighting of corporate and personal goals, the level of performance achieved (outstanding achievement, achieved, partially achieved, did not achieve,) and cash incentive (expressed as a percentage of fixed remuneration) awarded in FY12.
The Group CEO’s STI outcome was relatively modest, notwithstanding the strong financial performance of SGH, reflecting the challenging performance targets set by the Board for FY12.
The CFO’s FY12 STI was pro-rated for time served with the Company.
Executive WeightingLevel of achievement
Cash incentive awarded for FY12 (as a percentage of fixed
remuneration)Percentage of STI
AwardedPercentage of STI
not Awarded
Group CEOCorporate goals (40%) Did not achieve
12%30% 70%
Personal goals (60%) Partially achieved
COO (formerly Executive Director)
Corporate goals (40%) Did not achieve8%
30% 70%
Personal goals (60%) Partially achieved
CFOCorporate goals (40%) Did not achieve
8%30% 70%
Personal goals (60%) Partially achieved
CEO, WesTrac Corporate & Personal goals (100%) Did not achieve 0% 0% 100%
b. Long-term incentive planFollowing the executive remuneration review and discussions with shareholders during FY12, the Board decided to introduce a new LTI plan for the Group CEO, COO (formerly Executive Director (R Stokes)), CFO and CEO WesTrac, Other group executives who previously participated in the discontinued deferred equity component of the PMP will not participate in the new LTI plan.
The proposed LTI plan replaces the deferred equity component of the former PMP. LTI awards are only made if financial targets for the relevant year have been achieved and, once granted, awards will only vest if the performance hurdles over the three-year performance period are met. The target LTI opportunity will be equal to the target deferred equity opportunity under the previous PMP.
As noted earlier, SGH’s reported result for FY12 was impacted by Significant Items largely due to the mark-to-market of SGH’s investment in Seven West Media. As a consequence, the group financial targets to qualify executives for participation in the proposed LTI were not met and no LTI grants will be made in respect of FY12.
The Board believes the introduction of the LTI plan will provide a longer-term focus for plan participants through the use of earnings growth (EPS) and relative return measures (TSR) which align the interests of executives with those of shareholders.
LTI plan
What will be granted?Subject to the achievement of financial targets for the relevant financial year, performance rights will be granted for nil consideration. Each right entitles the participant to one ordinary share in the Company, subject to the achievement of the performance hurdles for vesting, as outlined below.
How many performance rights will be granted?
The LTI grant opportunity for on-target performance is set out in the table below and is expressed as a percentage of fixed remuneration.
How is the STI delivered?
The STI is awarded as a lump sum cash payment after corporate and personal goals have been measured and assessed following the end of the financial year.
LTI grant opportunity (as a percentage of fixed remuneration)
Group CEO 35%
COO 25%
CFO 25%
CEO, WesTrac 37.5%
The FY12 NPAT target set by the Board was not achieved and, as such, no LTI awards will be granted in respect of FY12.
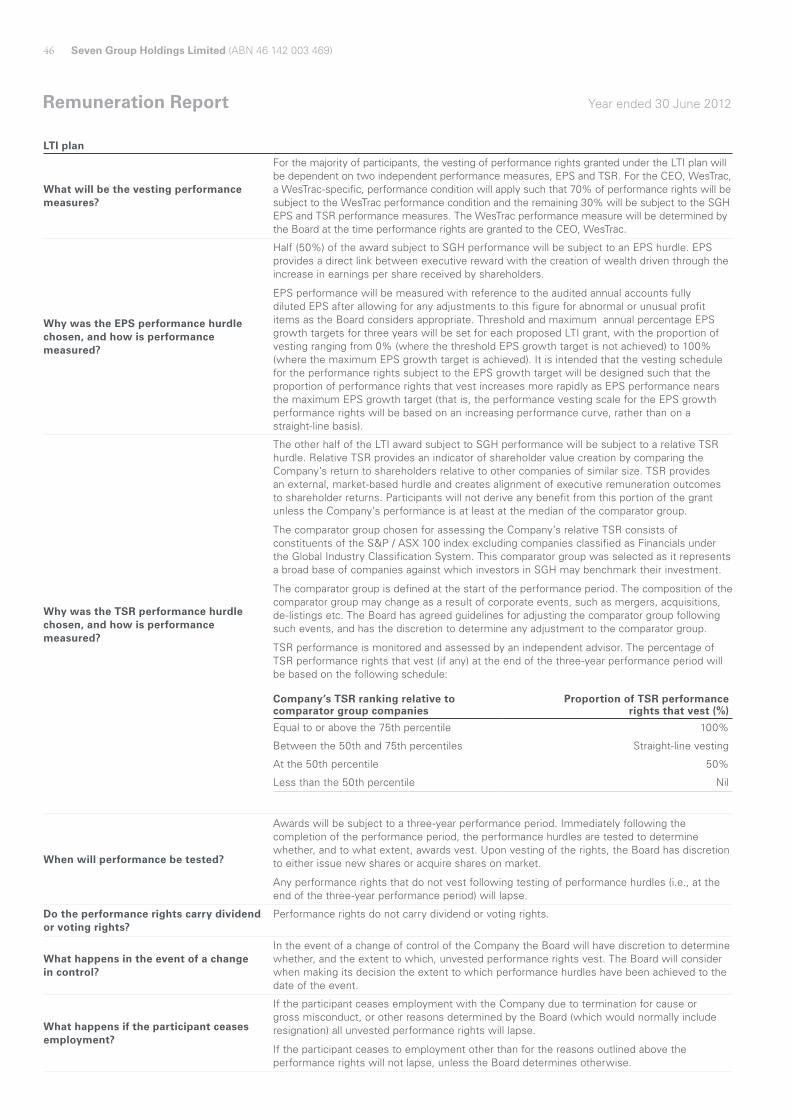
46 Seven Group Holdings Limited (ABN 46 142 003 469)
Remuneration Report Year ended 30 June 2012
LTI plan
What will be the vesting performance measures?
For the majority of participants, the vesting of performance rights granted under the LTI plan will be dependent on two independent performance measures, EPS and TSR. For the CEO, WesTrac, a WesTrac-specific, performance condition will apply such that 70% of performance rights will be subject to the WesTrac performance condition and the remaining 30% will be subject to the SGH EPS and TSR performance measures. The WesTrac performance measure will be determined by the Board at the time performance rights are granted to the CEO, WesTrac.
Why was the EPS performance hurdle chosen, and how is performance measured?
Half (50%) of the award subject to SGH performance will be subject to an EPS hurdle. EPS provides a direct link between executive reward with the creation of wealth driven through the increase in earnings per share received by shareholders.
EPS performance will be measured with reference to the audited annual accounts fully diluted EPS after allowing for any adjustments to this figure for abnormal or unusual profit items as the Board considers appropriate. Threshold and maximum annual percentage EPS growth targets for three years will be set for each proposed LTI grant, with the proportion of vesting ranging from 0% (where the threshold EPS growth target is not achieved) to 100% (where the maximum EPS growth target is achieved). It is intended that the vesting schedule for the performance rights subject to the EPS growth target will be designed such that the proportion of performance rights that vest increases more rapidly as EPS performance nears the maximum EPS growth target (that is, the performance vesting scale for the EPS growth performance rights will be based on an increasing performance curve, rather than on a straight-line basis).
Why was the TSR performance hurdle chosen, and how is performance measured?
The other half of the LTI award subject to SGH performance will be subject to a relative TSR hurdle. Relative TSR provides an indicator of shareholder value creation by comparing the Company’s return to shareholders relative to other companies of similar size. TSR provides an external, market-based hurdle and creates alignment of executive remuneration outcomes to shareholder returns. Participants will not derive any benefit from this portion of the grant unless the Company’s performance is at least at the median of the comparator group.
The comparator group chosen for assessing the Company’s relative TSR consists of constituents of the S&P / ASX 100 index excluding companies classified as Financials under the Global Industry Classification System. This comparator group was selected as it represents a broad base of companies against which investors in SGH may benchmark their investment.
The comparator group is defined at the start of the performance period. The composition of the comparator group may change as a result of corporate events, such as mergers, acquisitions, de-listings etc. The Board has agreed guidelines for adjusting the comparator group following such events, and has the discretion to determine any adjustment to the comparator group.
TSR performance is monitored and assessed by an independent advisor. The percentage of TSR performance rights that vest (if any) at the end of the three-year performance period will be based on the following schedule:
Company’s TSR ranking relative to comparator group companies
Proportion of TSR performance rights that vest (%)
Equal to or above the 75th percentile 100%
Between the 50th and 75th percentiles Straight-line vesting
At the 50th percentile 50%
Less than the 50th percentile Nil
When will performance be tested?
Awards will be subject to a three-year performance period. Immediately following the completion of the performance period, the performance hurdles are tested to determine whether, and to what extent, awards vest. Upon vesting of the rights, the Board has discretion to either issue new shares or acquire shares on market.
Any performance rights that do not vest following testing of performance hurdles (i.e., at the end of the three-year performance period) will lapse.
Do the performance rights carry dividend or voting rights?
Performance rights do not carry dividend or voting rights.
What happens in the event of a change in control?
In the event of a change of control of the Company the Board will have discretion to determine whether, and the extent to which, unvested performance rights vest. The Board will consider when making its decision the extent to which performance hurdles have been achieved to the date of the event.
What happens if the participant ceases employment?
If the participant ceases employment with the Company due to termination for cause or gross misconduct, or other reasons determined by the Board (which would normally include resignation) all unvested performance rights will lapse.
If the participant ceases to employment other than for the reasons outlined above the performance rights will not lapse, unless the Board determines otherwise.

Annual Report 2012 47
Remuneration Report Year ended 30 June 2012
6. Legacy share-based remunerationa. Performance Management PlanPrior to the FY12 performance year, the PMP contained a deferred equity component under which the Group CEO and selected executives received a portion of their total STI opportunity (subject to performance and to the extent that an EPS target was achieved) in the form of ordinary shares in Seven Group Holdings Limited.
Under the PMP, the EPS target was measured over the relevant financial year before significant items (subject to the Board’s discretion). EPS was calculated by dividing the NPAT, after deducting TELYS4 dividends paid by the total weighted average number of shares the company has issued. The measure took into account all the revenues, costs (including interest) and tax payable by the company for the relevant year and does so on a per share basis.
The shares granted vested in three equal tranches over the three years following grant subject to continued service. If an executive ceases employment with the Company due to death, redundancy, retirement, disability or permanent illness, an application can be made to the Board for unvested shares to be transferred to that participant along with shares that have already vested. If an executive ceases employment with the Company for any other reason, all unvested shares will be forfeited, unless the Board determines otherwise.
The details of outstanding shares that are still to vest under the PMP, which relate to the FY11 performance year, are as follows:
ExecutiveNumber of
shares granted Grant date Vesting dateFair value per
share% vested
in FY12% forfeited
in FY12
P Gammell 46,785 9 November 2011 1 October 2012 8.23 nil nil
46,785 9 November 2011 1 October 2013 8.23 nil nil
46,784 9 November 2011 1 October 2014 8.23 nil nil
R Stokes 7,593 9 November 2011 1 October 2012 8.23 nil nil
7,593 9 November 2011 1 October 2013 8.23 nil nil
7,594 9 November 2011 1 October 2014 8.23 nil nil
J Walker 20,721 9 November 2011 1 October 2012 8.23 nil nil
20,721 9 November 2011 1 October 2013 8.23 nil nil
20,720 9 November 2011 1 October 2014 8.23 nil nil
As noted earlier, the deferred equity component of the PMP was discontinued with effect from FY12 and no grant of shares was made in respect of the FY12 performance year.
b. Employee Share Option PlanThe legacy options described below were issued as replacement grants for the Seven Network Limited options that were held by executives at the time of the Seven Network Limited and WesTrac scheme of arrangement under the Employee Share Option Plan (ESOP). No options were granted under the ESOP in FY12.
The options were issued under the ESOP on 28 April 2010, and were issued in consideration for the cancellation of previously-issued Seven Network Limited options on the same terms and were detailed in the Scheme Booklet for the Seven Network Limited and WesTrac transaction. It was not appropriate for the Company to impose new incentive arrangements with different terms on executives when replacing the existing incentive entitlements as part of the implementation of the scheme.
The options were granted subject to a TSR performance condition (tested relative to the performance of the S&P/ASX 200 Accumulation Index), and all legacy options have now vested but remain subject to a holding lock.
The details of outstanding options to KMP under the ESOP are as follows:
Executive Tranche
Number of options
grantedVesting
dateExpiry
dateExercise
priceFair value
per option
% vested in FY12
% forfeited
in FY12
% exercised
in FY12
DJ Leckie 1 1,500,000 30 June 2010 30 June 2014 $ 7.00 $ 1.21 0% 0% 0%
2 1,000,000 30 June 2011 30 June 2014 $ 8.00 $ 0.98 0% 0% 0%
3 500,000 30 June 2012 30 June 2014 $ 9.00 $ 0.79 100% 0% 0%
BI McWilliam 2 500,000 30 June 2011 30 June 2014 $ 8.00 $ 0.98 0% 0% 0%
3 500,000 30 June 2012 30 June 2014 $ 9.00 $ 0.79 100% 0% 0%
P Lewis 1 250,000 30 June 2010 30 June 2014 $7.00 $ 1.21 0% 0% 100%^
2 250,000 30 June 2011 30 June 2014 $8.00 $ 0.98 0% 0% 100%^
3 250,000 30 June 2012 30 June 2014 $ 9.00 $ 0.79 100% 0% 0%
^ Mr Lewis exercised the options under the ESOP after he ceased being KMP of the Group.
All options were valued independently using a Monte Carlo Simulation.
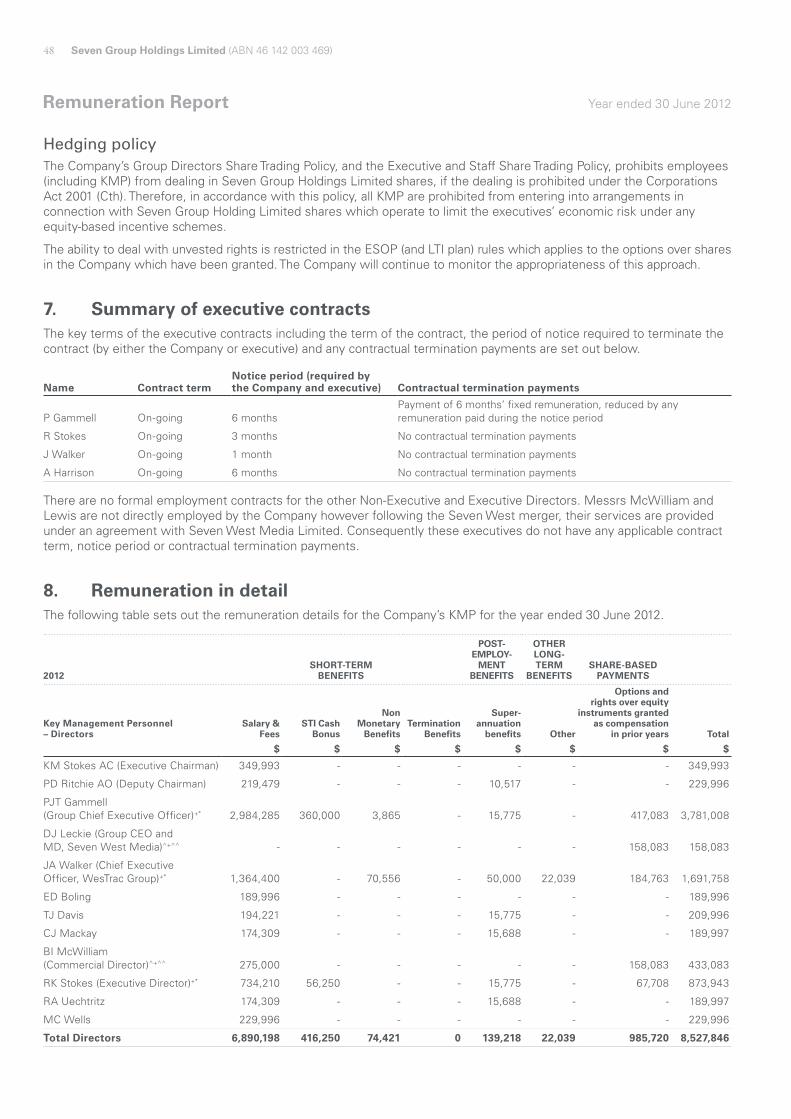
48 Seven Group Holdings Limited (ABN 46 142 003 469)
Remuneration Report Year ended 30 June 2012
Hedging policyThe Company’s Group Directors Share Trading Policy, and the Executive and Staff Share Trading Policy, prohibits employees (including KMP) from dealing in Seven Group Holdings Limited shares, if the dealing is prohibited under the Corporations Act 2001 (Cth). Therefore, in accordance with this policy, all KMP are prohibited from entering into arrangements in connection with Seven Group Holding Limited shares which operate to limit the executives’ economic risk under any equity-based incentive schemes.
The ability to deal with unvested rights is restricted in the ESOP (and LTI plan) rules which applies to the options over shares in the Company which have been granted. The Company will continue to monitor the appropriateness of this approach.
7. Summary of executive contractsThe key terms of the executive contracts including the term of the contract, the period of notice required to terminate the contract (by either the Company or executive) and any contractual termination payments are set out below.
Name Contract termNotice period (required by the Company and executive) Contractual termination payments
P Gammell On-going 6 months Payment of 6 months’ fixed remuneration, reduced by any remuneration paid during the notice period
R Stokes On-going 3 months No contractual termination payments
J Walker On-going 1 month No contractual termination payments
A Harrison On-going 6 months No contractual termination payments
There are no formal employment contracts for the other Non-Executive and Executive Directors. Messrs McWilliam and Lewis are not directly employed by the Company however following the Seven West merger, their services are provided under an agreement with Seven West Media Limited. Consequently these executives do not have any applicable contract term, notice period or contractual termination payments.
8. Remuneration in detailThe following table sets out the remuneration details for the Company’s KMP for the year ended 30 June 2012.
2012SHORT-TERM
BENEFITS
POST- EMPLOY-
MENT BENEFITS
OTHER LONG-TERM
BENEFITSSHARE-BASED
PAYMENTS
Key Management Personnel – Directors
Salary & Fees
STI Cash Bonus
Non Monetary
Benefits Termination
Benefits
Super-annuation
benefits Other
Options and rights over equity
instruments granted as compensation
in prior years Total
$ $ $ $ $ $ $ $
KM Stokes AC (Executive Chairman) 349,993 - - - - - - 349,993
PD Ritchie AO (Deputy Chairman) 219,479 - - - 10,517 - - 229,996
PJT Gammell (Group Chief Executive Officer)+* 2,984,285 360,000 3,865 - 15,775 - 417,083 3,781,008
DJ Leckie (Group CEO and MD, Seven West Media)^+^^ - - - - - - 158,083 158,083
JA Walker (Chief Executive Officer, WesTrac Group)+* 1,364,400 - 70,556 - 50,000 22,039 184,763 1,691,758
ED Boling 189,996 - - - - - - 189,996
TJ Davis 194,221 - - - 15,775 - - 209,996
CJ Mackay 174,309 - - - 15,688 - - 189,997
BI McWilliam (Commercial Director)^+^^ 275,000 - - - - - 158,083 433,083
RK Stokes (Executive Director)+* 734,210 56,250 - - 15,775 - 67,708 873,943
RA Uechtritz 174,309 - - - 15,688 - - 189,997
MC Wells 229,996 - - - - - - 229,996
Total Directors 6,890,198 416,250 74,421 0 139,218 22,039 985,720 8,527,846

Annual Report 2012 49
Remuneration Report Year ended 30 June 2012
2012SHORT-TERM
BENEFITS
POST- EMPLOY-
MENT BENEFITS
OTHER LONG-TERM
BENEFITSSHARE-BASED
PAYMENTS
ExecutivesSalary &
Fees STI Cash
Bonus
Non Monetary
Benefits Termination
Benefits
Super-annuation
benefits Other
Options and rights over equity
instruments granted as compensation
in prior years Total
$ $ $ $ $ $ $ $
AC Harrison (Group Chief Financial Officer)# 456,690 35,041 - - 10,517 - - 502,248
PJ Lewis (Group Chief Financial Officer)^ +^^ 234,405 - - - - - 28,561 262,966
Total executives 691,095 35,041 0 0 10,517 0 28,561 765,214
Total Directors and executives 7,581,293 451,291 74,421 0 149,735 22,039 1,014,281 9,293,060
^ Remuneration, other than equity compensation, for Mr Leckie, Mr McWilliam and Mr Lewis, relates to amounts recharged by SMG/SWM to Seven Group Holdings Limited. In addition, other than equity compensation, from 1 July 2011 to 8 November 2011, Mr Lewis received salary payments from the Company in view of the extra time and responsibilities required of Mr Lewis in fulfilling the role of CFO of the Company. The remuneration for Mr Lewis is for the period from 1 July 2011 to November 2011
^ ̂ 2012 value of options as a proportion of remuneration of D. Leckie 100.0%, B. McWilliam 36.5%, and P. Lewis 10.8%.
* 2012 value of rights over equity instruments granted as compensation as a proportion of remuneration of P. Gammell 11.0%, J. Walker 10.9%, R. Stokes 7.7%.
+ 2012 proportion of remuneration that is performance related as a proportion of remuneration of D. Leckie 100.0%, B. McWilliam 36.5%, P. Lewis 10.8%, P. Gammell 20.5%, R. Stokes 14.1%, J. Walker 10.9%.
# The remuneration for Mr Harrison is for the period from 9 November 2011. Mr Harrison did not receive any payments before taking office as part of consideration for agreeing to hold office.
2011SHORT-TERM
BENEFITS
POST- EMPLOY-
MENT BENEFITS
OTHER LONG-TERM
BENEFITSSHARE-BASED
PAYMENTS
Key Management Personnel – Directors
Salary & Fees
STI Cash Bonus
Non Monetary
Benefits Termination
Benefits
Super-annuation
benefits Other
Options and rights over equity
instruments granted as compensation Total
$ $ $ $ $ $ $ $
KM Stokes AC (Executive Chairman) 348,425 - - - 1,575 - - 350,000
PD Ritchie AO (Deputy Chairman) 204,275 - - - 14,815 - - 219,090
PJT Gammell (Group Chief Executive Officer)+* 2,984,801 1,500,000 7,279 - 15,199 - 417,083 4,924,362
DJ Leckie (Group CEO and MD, Seven West Media)^+^^ 485,046 - 6,129 - 2,967 - 800,910 1,295,052
JA Walker (Chief Executive Officer, WesTrac Group)+* 1,414,400 511,650 70,166 - 50,000 22,039 184,763 2,253,018
ED Boling 184,545 - - - - - - 184,545
TJ Davis 187,003 - - - 14,815 - - 201,818
CJ Mackay 169,730 - - - 14,815 - - 184,545
BI McWilliam (Commercial Director)^+^^ 271,200 - - - 3,800 - 479,281 754,281
RK Stokes (Executive Director)+* 503,430 187,500 - - 12,054 - 67,708 770,692
RA Uechtritz 169,730 - - - 14,815 - - 184,545
MC Wells 230,000 - - - - - - 230,000
Total Directors 7,152,585 2,199,150 83,574 - 144,855 22,039 1,949,745 11,551,948

50 Seven Group Holdings Limited (ABN 46 142 003 469)
Remuneration Report Year ended 30 June 2012
2011SHORT-TERM
BENEFITS
POST- EMPLOY-
MENT BENEFITS
OTHER LONG-TERM
BENEFITSSHARE-BASED
PAYMENTS
ExecutivesSalary &
Fees STI Cash
Bonus
Non Monetary
Benefits Termination
Benefits
Super-annuation
benefits Other
Options and rights over equity
instruments granted as compensation Total
$ $ $ $ $ $ $ $
PJ Lewis (Group Chief Financial Officer)^ +^^ 635,241 - 94,851 - 3,800 - 240,349 974,241
Total executives 635,241 - 94,851 - 3,800 - 240,349 974,241
Total Directors and executives 7,787,826 2,199,150 178,425 - 148,655 22,039 2,190,094 12,526,189
^ Remuneration, other than equity compensation, for Mr Leckie, Mr McWilliam and Mr Lewis, relates to amounts recharged by SMG/SWM to Seven Group Holdings Limited. In addition, other than equity compensation, Mr Lewis receives salary payments from the Company in view of the extra time and responsibilities required of Mr Lewis in fulfilling the role of Chief Financial Officer of the Company.
^ ̂ 2011 value of options as a proportion of remuneration of D. Leckie 61.8%, B. McWilliam 63.5%, and P. Lewis 24.7%.* 2011 value of rights over equity instruments granted as compensation as a proportion of remuneration of P. Gammell 8.5%, J. Walker 8.2% and R. Stokes 8.8%.+ 2011 proportion of remuneration that is performance related as a proportion of remuneration of D. Leckie 61.8%, B. McWilliam 63.5%, P. Lewis 24.7%, P.
Gammell 38.9%, R. Stokes 33.1% and J. Walker 30.9%.
9. Link between remuneration and company performanceDetail below shows the Group performance in key areas for the 2012, 2011 and 2010 financial years.
2012 2011
2010 (2 months trade only)+
Statutory NPAT ($000) $176,748 $79,913 $718,742
NPAT (excluding significant items) ($000) ^ $343,229 $248,278 $28,144
Significant items ($000) ($166,481) ($168,365) $690,598
Dividends per ordinary share 38.0 cents 36.0 cents 0.0 cents
Share price at financial year / period end $7.74 $9.63 $5.74
Statutory basic EPS $0.43 $0.12 $5.87
Basic EPS excluding significant items $0.98 $0.67 $0.09
+ The 2010 result incorporates only 2 months trade, subsequent to the merger of WesTrac Group and Seven Network Limited, as such it is not comparable to the 2011 and 2012 results.
As detailed above, the remuneration framework of the Group is varied and is designed to offer appropriate rewards for those giving superior performance. It is designed to closely align their interests to those of shareholders and other stakeholders.
The remuneration structure is focused on achievement of the Group’s financial and operating objectives. The incentive to achieve these objectives is an important contributing factor in the Group’s financial performance and, ultimately, the value of the Company’s shares and distributions to shareholders.
^ NPAT (excluding significant items) is a non-IFRS measure. This measure is used internally by management to assess the performance of the business and hence is provided to enable as assessment of remuneration compared to company performance. Refer to the executive chairman’s report for a reconciliation to statutory net profit after tax.
End of audited Remuneration Report.
Rounding OffThe Company is of a kind referred to in ASIC Class Order 98/100 dated 10 July 1998 and in accordance with that Class Order, amounts in this report and the accompanying financial report have been rounded off to the nearest thousand dollars unless otherwise stated.
Signed for and on behalf of the Board of Directors and in accordance with a resolution of the Directors.
KM Stokes AC MC Wells Executive Chairman Chairman of the Audit & Risk Committee
Sydney 21 September 2012

Annual Report 2012 51
Auditor’s Independence Declaration Year ended 30 June 2012
ABCD
KPMG, an Australian partnership and a member firm of the KPMG network of independent member firms affiliated with KPMG International Cooperative Liability limited by a scheme approved under(“KPMG International”), a Swiss entity. Professional Standards Legislation
Lead Auditor’s Independence Declaration under Section 307C of the Corporations Act 2001
To: the directors of Seven Group Holdings Limited
I declare that, to the best of my knowledge and belief, in relation to the audit for the financial year ended 30 June 2012 there have been:
(i) no contraventions of the auditor independence requirements as set out in the Corporations Act 2001 in relation to the audit; and
(ii) no contraventions of any applicable code of professional conduct in relation to the audit.
KPMG
Kevin Leighton Partner
Sydney
21 September 2012

52 Seven Group Holdings Limited (ABN 46 142 003 469)
sgh Annual Report 2012
Financial StatementS

Annual Report 2012 53
Consolidated Income Statement Financial Report for the year ended 30 June 2012
2012 2011Note $’000 $’000
RevenueRevenue from product sales 2,999,577 1,969,202
Revenue from product support 1,400,142 1,141,018
Other 56,729 52,614
Total revenue 4,456,448 3,162,834
Other incomeDividend income 45,430 35,536
Gain on sale of property, plant & equipment - 481
Net gain on sale of investments and equity accounted investees 8,911 58,679
Net gain on sale of subsidiary 27 129,786 -
Other investment income 21,545 2,649
Other 19,614 26,194
Total other income 225,286 123,539
Share of results from equity accounted investees 11 163,019 143,588
Impairment of equity accounted investees 11 (416,890) (305,648)
Expenses excluding depreciation and amortisationMaterials cost of inventory sold and used (2,920,004) (2,091,874)
Raw materials and consumables purchased (169,552) (110,003)
Employee benefits expenses (593,991) (448,304)
Operating lease rental expense (52,805) (46,170)
Impairment of non-current assets 13 (300) (18,701)
Fair value movement of derivatives (18,167) (5,374)
Other expenses (350,493) (248,763)
Total expenses excluding depreciation and amortisation (4,105,312) (2,969,189)
Depreciation and amortisation (76,696) (67,770)
Profit before net finance costs and tax 245,855 87,354 Finance income 4 4,465 7,422
Finance costs 4 (117,495) (62,385)
Net finance costs (113,030) (54,963)
Profit before tax 132,825 32,391 Income tax benefit 6 43,923 47,522
Profit for the year 176,748 79,913 Profit for the year attributable to:Equity holders of the Company 165,933 70,412
Non-controlling interest 10,815 9,501
Profit for the year 176,748 79,913
Statutory earnings per share (EPS)
Ordinary sharesBasic earnings per share ($) (a) 7 0.43$ 0.12$
Diluted earnings per share ($) (a) 7 0.43$ 0.12$
The consolidated income statement is to be read in conjunction with the notes to the financial statements.

54 Seven Group Holdings Limited (ABN 46 142 003 469)
Consolidated Statement of Comprehensive Income Financial Report for the year ended 30 June 2012
2012 2011Note $’000 $’000
Profit for the year 176,748 79,913
Other comprehensive income
Net change in fair value of available-for-sale financial assets 21 4,552 27,304
Impairment of available-for-sale financial asset reclassified to profit or loss 21 - 2,910
Cash flow hedges: effective portion of changes in fair value 38,286 (21,114)
Foreign currency differences for foreign operations 38,749 (164,741)
Income tax on items of other comprehensive income 21 (15,803) 12,223
Other comprehensive income/(expense) for the year, net of tax 65,784 (143,418)
Total comprehensive income/(expense) for the year 242,532 (63,505)
Total comprehensive income/(expense) for the year attributable to:
Equity holders of the Company 231,717 (72,347)
Non-controlling interest 10,815 8,842
Total comprehensive income/(expense) for the year 242,532 (63,505)
The consolidated statement of comprehensive income is to be read in conjunction with the notes to the financial statements.

Annual Report 2012 55
Consolidated Statement of Financial Position As at 30 June 2012
2012 2011
Note $’000 $’000
CURRENT ASSETSCash and cash equivalents 32a 127,749 71,145
Trade and other receivables 8 878,795 550,431
Inventories 9 1,384,590 989,626
Current tax assets - 13,123
Other current assets 10 35,214 24,507
Derivative financial instruments 12 10,383 2,587
Total current assets 2,436,731 1,651,419
NON-CURRENT ASSETSInvestments accounted for using the equity method 11 1,279,906 1,482,052
Trade and other receivables 8 41,731 3,840
Derivative financial instruments 12 62,090 -
Other financial assets 13 923,843 884,379
Property, plant and equipment 14 293,258 264,928
Intangible assets 15 749,125 526,233
Deferred tax assets 6 - 10,616
Total non-current assets 3,349,953 3,172,048
Total assets 5,786,684 4,823,467
CURRENT LIABILITIESTrade and other payables 16 615,551 496,093
Derivative financial instruments 12 30,796 18,261
Interest bearing loans and borrowings 17 284,632 347,133
Deferred income 19 108,318 113,370
Current tax liabilities 94,865 -
Provisions 18 105,213 89,143
Total current liabilities 1,239,375 1,064,000
NON-CURRENT LIABILITIESTrade and other payables 16 170 8,477
Interest bearing loans and borrowings 17 1,561,799 561,124
Derivative financial instruments 12 118,710 103,796
Deferred tax liabilities 6 267,386 378,768
Provisions 18 2,044 7,198
Deferred income 19 17,377 18,182
Total non-current liabilities 1,967,486 1,077,545
Total liabilities 3,206,861 2,141,545
Net assets 2,579,823 2,681,922
EQUITYContributed equity 20 2,624,102 2,615,852
Reserves 21 (710,120) (714,807)
Retained earnings 22 654,523 632,287
Total equity attributable to equity holders of the Company 2,568,505 2,533,332
Non-controlling interest 11,318 148,590
Total equity 2,579,823 2,681,922
The consolidated statement of financial position is to be read in conjunction with the notes to the financial statements.

56 Seven Group Holdings Limited (ABN 46 142 003 469)
Consolidated Statement of Changes in Equity Financial Report for the year ended 30 June 2012
Total equity
YEAR ENDED 30 JUNE 2012 Note $'000 $'000 $'000 $'000 $'000 $'000
Balance at 1 July 2011 2,615,852 (714,807) 632,287 2,533,332 148,590 2,681,922
Profit for the year - - 165,933 165,933 10,815 176,748
Net change in fair value of available-for-sale 21 - 4,552 - 4,552 - 4,552
financial assets
Cash flow hedges: effective portion of 21 - 38,286 - 38,286 - 38,286
changes in fair value
Foreign currency differences for foreign 21 - 38,749 - 38,749 - 38,749
operations
Income tax on items of other 21 - (15,803) - (15,803) - (15,803)
comprehensive income
Total comprehensive income for the year - 65,784 165,933 231,717 10,815 242,532
Transactions with owners recognised directly in equityOrdinary dividends paid 5 - - (110,488) (110,488) - (110,488)
TELYS4 dividends paid 5 - - (33,209) (33,209) - (33,209)
Issue of ordinary shares related to exercise 20 8,250 - - 8,250 - 8,250
of options
Acquisition of non-controlling interests 21 - (63,455) (63,455) (148,087) (211,542)
Share based payments expense 21 - 2,358 - 2,358 - 2,358
Total transactions with owners recognised 8,250 (61,097) (143,697) (196,544) (148,087) (344,631) directly in equity
Total movement in equity for the year 8,250 4,687 22,236 35,173 (137,272) (102,099) Balance at 30 June 2012 2,624,102 (710,120) 654,523 2,568,505 11,318 2,579,823
Retained earnings Total
Non-controlling
interestContributed
equity Reserves

Annual Report 2012 57
Consolidated Statement of Changes in Equity Financial Report for the year ended 30 June 2012
Total equity
YEAR ENDED 30 JUNE 2011 Note $'000 $'000 $'000 $'000 $'000 $'000
Balance at 1 July 2010 2,608,852 (574,500) 706,045 2,740,397 139,748 2,880,145
Profit for the year - - 70,412 70,412 9,501 79,913
Net change in fair value of available-for-sale 21 - 27,304 - 27,304 - 27,304
financial assets
Impairment of available-for-sale financial 21 - 2,910 - 2,910 - 2,910
asset reclassified to profit or loss
Cash flow hedges: effective portion of 21 - (22,160) - (22,160) 1,046 (21,114)
changes in fair value
Foreign currency differences for foreign 21 - (163,036) - (163,036) (1,705) (164,741)
operations
Income tax on items of other 21 - 12,223 - 12,223 - 12,223
comprehensive income
Total comprehensive income/(expense) for the year - (142,759) 70,412 (72,347) 8,842 (63,505)
Transactions with owners recognised directly in equityIssue of ordinary shares related to exercise 20 7,000 - - 7,000 - 7,000
of options
TELYS4 dividends paid 5 - - (34,222) (34,222) - (34,222)
Ordinary dividends paid 5 - - (109,948) (109,948) - (109,948)
Share based payments expense 21 - 2,452 - 2,452 - 2,452
Total transactions with owners recognised 7,000 2,452 (144,170) (134,718) - (134,718) directly in equity
Total movement in equity for the year 7,000 (140,307) (73,758) (207,065) 8,842 (198,223) Balance at 30 June 2011 2,615,852 (714,807) 632,287 2,533,332 148,590 2,681,922
The consolidated statement of changes in equity is to be read in conjunction with the notes to the financial statements.
Contributed equity Reserves
Retained earnings Total
Non-controlling
interest
Consolidated Statement of Changes in Equity (Continued) Financial Report for the year ended 30 June 2012

58 Seven Group Holdings Limited (ABN 46 142 003 469)
Consolidated Cash Flow Statement Financial Report for the year ended 30 June 2012
2012 2011Note $’000 $’000
CASH FLOWS RELATED TO OPERATING ACTIVITIESReceipts from customers 4,726,707 3,443,091
Payments to suppliers and employees (4,819,946) (3,447,287)
Dividends received from equity accounted investees 25,626 33,157
Other dividends received 38,798 31,372
Interest and other items of a similar nature received 4,371 7,621
Interest and other costs of finance paid (109,677) (58,487)
Income taxes received/(paid) 19,040 (38,341)
Net operating cash flows 32b (115,081) (28,874)
CASH FLOWS RELATED TO INVESTING ACTIVITIESPayments for purchases of property, plant and equipment (81,854) (60,997)
Proceeds from sale of property, plant and equipment 9,587 1,689
Payments for purchase of intangible assets (3,154) (10,563)
Acquisition of non-controlling interests 26 (197,680) -
Consideration for business combination, net of cash acquired 26 (422,461) (44,093)
Proceeds from sale of subsidiary, net of cash disposed 27 164,028 -
Acquisition of equity accounted investees (83,767) (448,360)
Proceeds from sale of shares in equity accounted investees 1,989 300,586
Payments for other investments (21,119) (297,433)
Proceeds from sale of other financial assets 29,910 4,522
Other 2,010 (285)
Net investing cash flows (602,511) (554,934)
CASH FLOWS RELATED TO FINANCING ACTIVITIESProceeds from issue of shares - Seven Group Holdings Limited 20 8,250 7,000
Proceeds from issue of shares - subsidiaries 2,000 159
Ordinary dividends paid 5 (110,488) (109,948)
TELYS4 dividends paid 5 (33,209) (34,222)
Proceeds from borrowings 1,933,575 1,347,215
Repayment of borrowings (1,018,759) (1,007,698)
Net financing cash flows 781,369 202,506
Net (decrease)/increase in cash and cash equivalents 63,777 (381,302)
Cash and cash equivalents at beginning of period 32a 65,244 449,671
Effect of exchange rate changes on cash and cash equivalents (1,272) (3,125)
Cash and cash equivalents at end of the period 32a 127,749 65,244
The consolidated cash flow statement is to be read in conjunction with the notes to the financial statements.
Annual Report 2012 59
Notes to the Consolidated Financial Statements Financial Report for the year ended 30 June 2012
1. STATEMENT OF SIGNIFICANT ACCOUNTING POLICIESSeven Group Holdings Limited (the “Company”) is a company domiciled in Australia, whose shares are publicly traded on the
Australian Securities Exchange ('ASX'). The company was incorporated on 12 February 2010. These consolidated financial statements cover the year ended 30 June 2012 and comprise the Company and its subsidiaries (together referred to as the "Group"),and the Group's interest in associates and jointly controlled entities. The financial report was authorised for issue in accordance with a resolution of the Directors on 21 September 2012.
(A) BASIS OF PREPARATIONThe financial report is a general purpose report which has been prepared in accordance with the Australian Accounting Standards (including Australian interpretations) adopted by the Australian Accounting Standards Board (AASB) and the Corporations Act2001. The consolidated financial report of the Group complies with International Financial Reporting Standards (IFRSs) and interpretations adopted by the International Accounting Standards Board (IASB).
The financial report is presented in Australian dollars and all values are rounded to the nearest thousand dollars ($’000) unless otherwise stated under the option available to the Company under ASIC Class Order 98/100 dated 10 July 1998.
The financial report is prepared on the historical cost basis except that the following assets and liabilities are stated at their fair value:derivative financial instruments and investments in available-for-sale assets.
The accounting policies set out below have been consistently applied by group entities and associates.
(B) PRINCIPLES OF CONSOLIDATIONi) SubsidiariesSubsidiaries are all those entities (including special purpose entities) over which the Group has the power to govern the financial and operating policies, generally accompanying a shareholding of more than one-half of the voting rights. The existence and effect of potential voting rights that are currently exercisable or convertible are considered when assessing whether the Group controls another entity.
All inter-company balances and transactions, including unrealised profits arising from intra-group transactions, have been eliminated in full. Unrealised losses are eliminated unless costs can not be recovered.
Subsidiaries are consolidated from the date on which control is transferred to the Group, and cease to be consolidated from the date on which control is transferred out of the Group. Where there is loss of control of a subsidiary, the consolidated financial statements include the results for the part of the reporting period during which the Group had control. The accounting policies of subsidiarieshave been changed when necessary to align them with the policies adopted by the Group.
Non-controlling interests in the equity and the results of subsidiaries are shown separately in the income statement, statement of comprehensive income and statement of financial position.
Business combinations are accounted for in accordance with Note 1(G).
ii) Associates and jointly controlled entitiesAssociates are those entities in which the Group has significant influence, but not control, over the financial and operating policies. Significant influence is presumed to exist when the Group holds between 20 and 50 percent of the voting power of another entity, unless it can be clearly demonstrated that this is not the case. Jointly controlled entities are those entities over whose activitiesthe Group has joint control, established by contractual agreement and requiring unanimous consent for strategic financial andoperating decisions.

60 Seven Group Holdings Limited (ABN 46 142 003 469)
Notes to the Consolidated Financial Statements Financial Report for the year ended 30 June 2012
1. STATEMENT OF SIGNIFICANT ACCOUNTING POLICIES (CONTINUED)(B) PRINCIPLES OF CONSOLIDATION (CONTINUED)ii) Associates and jointly controlled entities (continued)
Investments in associates and jointly controlled entities are accounted for using the equity method (equity accounted investees) and are initially recognised at cost, this cost of investment includes transaction costs. The Group's investment includes goodwill identifiedon acquisition, net of any accumulated impairment losses. The consolidated financial statements include the Group's share of the income and expenses and equity movements of equity accounted investees, after adjustments to align the accounting policies with those of the Group, from the date that significant influence or joint control commences until the date that significant or joint control ceases. When the Group's share of losses exceeds its interest in an equity accounted investee, the carrying amount of that interest, including any long-term investments, is reduced to nil, and the recognition of further losses is discontinued except to the extent that the Group has an obligation or has made payments on behalf of the investee.
(C) FOREIGN CURRENCY TRANSLATION
(i) Functional and presentation currency
Items included in the financial statements of each of the Group’s entities are measured using the currency of the primary economic environment in which the entity operates (‘the functional currency’). The financial report is presented in Australian dollars, which isthe Group’s functional and presentation currency.
(ii) TransactionsForeign currency transactions are translated into the respective functional currencies of Group entities using the exchange ratesprevailing at the dates of the transactions. Foreign exchange gains and losses resulting from the settlement of such transactions and from the translation at reporting date exchange rates of monetary assets and liabilities denominated in foreign currencies arerecognised in the income statement, except when they are deferred in equity such as for qualifying cash flow hedges and qualifyingnet investment hedges.
Translation differences on financial assets and liabilities carried at fair value are reported as part of the fair value gain or loss. Translation differences on non-monetary financial assets and liabilities such as equities held at fair value through profit or loss are recognised in profit or loss as part of the fair value gain or loss. Translation differences on non-monetary financial assets such as equities classified as available-for-sale financial assets are included in the fair value reserve in equity.
(iii) Group companiesThe results and financial position of all the Group entities (none of which has the currency of a hyperinflationary economy) that have a functional currency different from Australian Dollars are translated into Australian Dollars as follows:
- assets and liabilities for each balance sheet presented are translated at the closing rate at the date of that balance sheet - income and expenses of foreign operations are translated at average exchange rates (unless this is not a reasonable
approximation of the cumulative effect of the rates prevailing on the transaction dates, in which case income and expenses are translated at the date of the transactions); and
- all resulting exchange differences are recognised in other comprehensive income and presented in the foreign currencytranslation reserve.
On consolidation, exchange differences arising from the translation of any net investment in foreign entities, and of borrowings and other financial instruments designated as hedges of such investments, are recognised in other comprehensive income and presentedin the foreign currency translation reserve. When a foreign operation is sold or any borrowings forming part of the net investmentare repaid, a proportionate share of such exchange differences are transferred to profit or loss, as part of the gain or loss on salewhere applicable.
Goodwill and fair value adjustments arising on the acquisition of a foreign entity are treated as assets and liabilities of the foreign entities and translated at the closing rate.

Annual Report 2012 61
Notes to the Consolidated Financial Statements Financial Report for the year ended 30 June 2012
1. STATEMENT OF SIGNIFICANT ACCOUNTING POLICIES (CONTINUED)(D) REVENUE RECOGNITIONRevenues are recognised at the fair value of the consideration received or receivable, net of goods and services tax (GST). Amounts
disclosed as revenue are net of returns, trade allowances and amounts collected on behalf of third parties.
Sales revenue comprises revenue earned from the provision of goods and services to entities outside of the Group.
The Group recognises revenue when the amount of revenue can be reliably measured, it is probable that the future economic benefits will flow to the entity and specific criteria have been met for each of the Group’s activities as described below. The amount of revenue is not considered to be reliably measurable until all contingencies relating to the sale have been resolved. The Group bases its estimates on historical results, taking into consideration the type of customer, the type of transaction and the specifics of each arrangement.
Revenue is recognised for major business activities as follows:
(i) Revenue from product salesRevenue from product sales is recognised upon the delivery of goods to customers:- when risks and rewards have been transferred which is considered to occur upon the delivery of goods to customers; and - there is no significant unfulfilled obligation that could affect the customer's acceptance of the products;
(ii) Revenue from product supportRevenue from product support is recognised in the accounting period in which the services are rendered. For fixed price contracts,revenue is recognised under the percentage of completion method, based on the actual services provided as a proportion of thetotal services to be provided.
(iii) Other revenueOther revenue relates to sales revenue from the provision of broadband and telecommunication services is recognised net of returns,trade allowances and duties and taxes paid. Fees for monthly access plans which are charged monthly in advance are allocated to the appropriate calendar month. Any income in advance at the end of an accounting period is not recognised as revenue in the income statement, and is held as deferred revenue in the statement of financial position.
(iv) Lease incomeLease income from operating leases is recognised in income on a straight-line basis over the lease term.
(v) DividendsDividend income is recognised net of any franking credits. Dividend income is recognised when the Group's right to receivepayment is established, which in the case of quoted securities is the ex-dividend date.
(vi) Maintenance and repair contracts ("MARC")Contract revenues and expenses are recognised in accordance with the percentage of completion method unless the outcome of the contract cannot be reliably estimated. Where it is probable that a loss will arise from a MARC, the excess of total expected contract costs over total expected contract revenue is recognised as an expense immediately.
Where the outcome of a contract cannot be reliably estimated, contract costs are recognised as an expense as incurred, and where it isprobable that the costs will be recovered, revenue is recognised to the extent of the costs incurred.
(E) TAXATIONIncome tax expense is comprised of current and deferred tax expense. Income tax expense is recognised in profit or loss except to the
extent that it relates to a business combination, or items recognised directly in equity or in other comprehensive income. Currenttax expense or income for the period is the expected tax payable on the current period’s taxable income based on the enacted or substantively enacted income tax rate for each jurisdiction adjusted by changes to tax payable in respect of previous years.

62 Seven Group Holdings Limited (ABN 46 142 003 469)
Notes to the Consolidated Financial Statements Financial Report for the year ended 30 June 2012
1. STATEMENT OF SIGNIFICANT ACCOUNTING POLICIES (CONTINUED)(E) TAXATION (CONTINUED)Deferred income tax is recognised on temporary differences arising between the expected tax bases of assets and liabilities and theircarrying amounts in the financial statements. However, the deferred income tax is not accounted for if it arises from initial recognitionof an asset or liability in a transaction other than a business combination that at the time of the transaction affects neither accountingnor taxable profit or loss. Deferred income tax is determined using tax rates (and laws) that have been enacted or substantively enacted by the reporting date and are expected to apply when the related deferred income tax asset is realised or the deferred income tax liability is settled.
Deferred tax assets have been recognised for deductible temporary differences and unused tax losses only if it is probable that future
taxable amounts will be available to utilise those temporary differences and losses. Deferred tax assets are reviewed at each reporting date and are reduced to the extent that it is no longer probable that the related tax benefit will be realised.
Deferred tax liabilities and assets are not recognised for temporary differences between the carrying amount and tax bases of investments in controlled entities where the parent entity is able to control the timing of the reversal of the temporary differences and it is probable that the differences will not reverse in the foreseeable future.
Deferred tax assets and liabilities are offset if there is a legally enforceable right to offset current tax assets and liabilities and when they relate to income taxes levied by the same taxation authority. Current tax assets and tax liabilities are offset where the entity has a legally enforceable right to offset and intends either to settle on a net basis, or to realise the asset and settle the liability simultaneously.
Tax consolidationThe tax consolidated group comprises Seven Group Holdings Limited and its Australian wholly-owned subsidiaries. Current taxexpense/income, deferred tax liabilities and deferred tax assets arising from temporary differences of the members of thetax-consolidated group are recognised in the separate financial statements of the members of the tax-consolidated group using thegroup allocation approach by reference to the carrying amounts of assets and liabilities in the separate financial statements of eachentity and the tax values applying under tax consolidation.
Any current tax liabilities (or assets) and deferred tax assets arising from unused tax losses of the subsidiaries are assumed by the headentity in the tax-consolidated group and are recognised by the Company as amounts payable/(receivable) to/(from) other entities inthe tax-consolidated group in conjunction with any tax funding arrangement amounts (refer below). Any difference between theseamounts is recognised by the Company as an equity contribution or distribution.
The Company recognises deferred tax assets arising from unused tax losses of the tax-consolidated group to the extent that it isprobable that future taxable profits of the tax-consolidated group will be available against which the temporary difference can beutilised.
Any subsequent period adjustments to deferred tax assets arising from unused tax losses as a result of revised assessments of theprobability of recoverability is recognised by the head entity only.
Nature of tax funding and sharing arrangementsThe head entity, in conjunction with other members of the tax-consolidated group, has entered into a tax funding arrangement which sets out the funding obligations of members of the tax-consolidated group in respect of tax amounts. The tax funding arrangements require payments in certain circumstances to/from the head entity equal to the current tax liability/(asset) assumed by the head entity and any tax-loss deferred tax asset assumed by the head entity, resulting in the head entity recognising an inter-entity receivable/(payable) equal in amount to the tax liability/(asset) assumed. The inter-entity receivable/(payable) is at call.
Contributions to fund the current tax liabilities are payable as per the tax funding arrangement and reflect the timing of the head entity’s obligation to make payments for tax liabilities to the relevant tax authorities.

Annual Report 2012 63
Notes to the Consolidated Financial Statements Financial Report for the year ended 30 June 2012
1. STATEMENT OF SIGNIFICANT ACCOUNTING POLICIES (CONTINUED)(F) LEASES
Leases of property, plant and equipment, where the Group, as lessee has substantially all the risks and rewards of ownership, are
classified as finance leases. Finance leases are capitalised at the lease’s inception at the fair value of the leased property or, if lower, the present value of the minimum lease payments. The corresponding rental obligations, net of finance charges, are included in other short term and long-term payables. Each lease payment is allocated between the liability and finance cost. The finance cost is charged to the income statement over the lease period so as to produce a constant periodic rate of interest on the remaining balance of the liability for each period. The property, plant and equipment acquired under finance leases is depreciated over the shorter of the asset’s useful life and the lease term.
Leases in which a significant portion of the risks and rewards of ownership are not transferred to the Group as lessee are classified as operating leases. Payments made under operating leases (net of any incentives received from the lessor) are charged to the income statement on a straight-line basis over the period of the lease.
(G) BUSINESS COMBINATIONSAcquisition of BucyrusOn 1 June 2012, the Group acquired the core business operations and assets in Western Australia, Australian Capital Territory andNew South Wales from the Australian Bucyrus Group of entities owned by Caterpillar Global Mining LLC. The acquisition was accounted for by applying the acquisition method.
Acquisition of non-controlling interests - transactions with ownersThe following acquisitions of non-controlling interests were accounted for as a transaction with owners and as such the accountingand disclosure requirements of AASB 3 Business Combinations did not apply to these transactions.
- acquisition of EMT Group and Mining Equipment Spares non-controlling interest- acquisition of Engin non-controlling interest- acquisition of National Hire Group non-controlling interest
As a transaction with owners, the acquisitions did not reflect the fair value of assets and liabilities acquired or any recording of additional goodwill at the time of the acquisitions. The difference between the fair value of the consideration given and thecarrying value of the non-controlling interests acquired was recognised as an acquisitions reserve.
The Group has adopted revised AASB 3 Business Combinations (2008) and revised AASB 127 Consolidated and Separate FinancialStatements (2008) for business combinations.
For every business combination, the Group identifies the acquirer, which is the combining entity that obtains control of the othercombining entities or businesses. Control is the power to govern the financial and operating policies of an entity so as to obtainbenefits from its activities. In assessing control, the Group takes into consideration potential voting rights that currently are exercisable.The acquisition date is the date on which control is transferred to the acquirer. Judgement is applied in determining the acquisitiondate and determining whether control is transferred from one party to another.
Measuring goodwillThe Group measures goodwill as the fair value of the consideration transferred including the recognised amount of any non-controllinginterest in the acquiree, less the fair value of the identifiable assets acquired and liabilities assumed, all measured as of the acquisition date. If the cost of the acquisition is less than the Group's share of the fair value of the identifiable net assets of the acquiree, the difference is recognised directly in profit or loss, but only after a reassessment of the identification and measurement of the netassets acquired.
The fair value of the identifiable assets is based on valuations performed by independent experts.

64 Seven Group Holdings Limited (ABN 46 142 003 469)
Notes to the Consolidated Financial Statements Financial Report for the year ended 30 June 2012
1. STATEMENT OF SIGNIFICANT ACCOUNTING POLICIES (CONTINUED)(G) BUSINESS COMBINATIONS (CONTINUED)Consideration transferred includes the fair values of the assets transferred, liabilities incurred by the Group to the previous owners
of the acquiree, and equity interests issued by the Group. Consideration transferred also includes the fair value of any contingentconsideration and share-based payment awards of the acquiree that are replaced mandatorily in the business combination (see below). If a business combination results in the termination of pre-existing relationships between the Group and the acquiree, then the lowerof the termination amount, as contained in the agreement, and the value of the off-market element is deducted from the considerationtransferred and recognised in other expenses.
Share-based payment awardsWhen share-based payment awards exchanged (replacement awards) for awards held by the acquiree's employees (acquiree's awards) relate to past services, then a part of the market-based measure of the awards replaced is included in the consideration transferred.If they require future services, then the difference between the amount included in consideration transferred and the market-based measure of the replacement awards is treated as post-combination compensation cost.
Contingent liabilitiesA contingent liability of the acquiree is assumed in a business combination only if such a liability represents a present obligation andarises from a past event, and its fair value can be measured reliably.
Non-controlling interestThe Group measures any non-controlling interest at its proportionate interest in the identifiable net assets of the acquiree.
Transaction costsTransaction costs that the Group incurs in connection with a business combination, such as finder's fees, legal fees, due diligence fees, stamp duties and other professional and consulting fees, are expensed as incurred.
(H) IMPAIRMENT OF ASSETS
Goodwill and intangible assets that have an indefinite life are not subject to amortisation and are tested annually for impairment or
more frequently if events or changes in circumstances indicate that they might be impaired. Other non-financial assets are reviewed forimpairment whenever events or changes in circumstances indicate that the carrying amount may not be recoverable. An impairment loss is recognised for the amount by which the asset’s carrying amount exceeds its recoverable amount. For the purposes of assessing impairment, assets are grouped at the lowest levels for which there are separately identifiable cash inflows which are largely independent of the cash inflows from other assets or groups of assets (cash-generating units). Non-financial assets other than goodwillthat suffered an impairment are reviewed for possible reversal of the impairment at each reporting date. Impairment losses are recognised in profit or loss unless the asset has previously been revalued, in which case the impairment is recognised as a reversal to the extent of that previous revaluation with any excess recognised in the profit or loss.
(I) CASH AND CASH EQUIVALENTSFor cash flow statement presentation purposes, cash and cash equivalents includes cash on hand, deposits held at call with financial
institutions, other short-term, highly liquid investments with original maturities of three months or less that are readily convertible to known amounts of cash and which are subject to an insignificant risk of changes in value, and bank overdrafts. Bank overdrafts are shown within borrowings in current liabilities in the statement of financial position.
(J) TRADE AND OTHER RECEIVABLESTrade receivables are recognised initially at fair value and subsequently measured at amortised cost, less provision for impairment.
Trade receivables are generally due for settlement no more than 30 days from the date of recognition.

Annual Report 2012 65
Notes to the Consolidated Financial Statements Financial Report for the year ended 30 June 2012
1. STATEMENT OF SIGNIFICANT ACCOUNTING POLICIES (CONTINUED)(J) TRADE AND OTHER RECEIVABLES (CONTINUED)Collectability of trade receivables is reviewed on an ongoing basis. Debts which are known to be uncollectible are written off. An
impairment provision for receivables is established when there is objective evidence that the Group will not be able to collect all amounts due according to the original terms of receivables. The amount of the provision is the difference between the asset’s carrying amount and the present value of estimated future cash flows, discounted at the original effective interest rate. Cash flows relating to short term receivables are not discounted if the effect of discounting is immaterial. The amount of the provision is recognised in the income statement.
Other debtors are reviewed on an ongoing basis and are written down to their recoverable amount when this amount is in excess of their carrying value.
(K) INVENTORIES
Raw materials and stores, work in progress and finished goods are stated at the lower of cost and net realisable value. Cost is based on
the actual costs, with the exception of exchange component inventory and parts inventory for which cost is based on weighted average cost, and includes expenditure incurred in acquiring the inventories and bringing them to their existing condition and location. In the case of work in progress, cost includes an appropriate share of both variable and fixed costs. Fixed costs have been allocated on the basis of normal operating capacity.
Net realisable value is determined on the basis of the Group’s normal selling pattern. Expenses for marketing, selling and distribution to customers are estimated and are deducted to establish net realisable value.
Dependency on key suppliersThe Group is dependent on Caterpillar to maintain its authorisation as an authorised dealer of Caterpillar equipment and parts in its Western Australia, New South Wales/ACT and North Eastern China Service Territories. WesTrac Group has maintained a strong relationship with Caterpillar and although WesTrac Group expects this relationship to continue, as is customary in dealer agreements with Caterpillar, the dealer agreement can be terminated by either party upon 90 days notice at any time.
The Group is also dependent on Caterpillar for timely supply of equipment and parts from their global manufacturing factories and distribution warehouses. During periods of intense demand or in the event of disruption to Caterpillar's business there may be delaysin the supply of equipment and parts to WesTrac Group. This has not in the past proven to be an impediment to the WesTrac Group.
(L) INVESTMENTS AND OTHER FINANCIAL ASSETSThe Group classifies its investments in the following categories: financial assets at fair value through profit or loss, loans and
receivables, held to maturity investments, and available-for-sale financial assets. The classification depends on the purpose for whichthe investments were acquired. Management determines the classification of its investments at initial recognition and, in the case of assets classified as held to maturity, re-evaluates this designation at each reporting date.
(i) Financial assets at fair value through profit or lossFinancial assets at fair value through profit or loss are either financial assets held for trading which are acquired principally for the purpose of selling with the intention of making a profit or financial assets that are managed and have their performance regularly evaluated by management and the directors on a fair value basis. Derivatives are also categorised as held for trading unless they are designated as hedges.
(ii) Loans and receivablesLoans and receivables are non-derivative financial assets with fixed or determinable payments that are not quoted in an active market.They are included in current assets, except for those with maturities greater than 12 months after the balance sheet date which are classified as non current assets. Loans and receivables are included in receivables in the statement of financial position.

66 Seven Group Holdings Limited (ABN 46 142 003 469)
Notes to the Consolidated Financial Statements Financial Report for the year ended 30 June 2012
1. STATEMENT OF SIGNIFICANT ACCOUNTING POLICIES (CONTINUED)(L) INVESTMENTS AND OTHER FINANCIAL ASSETS (CONTINUED)(iii) Available-for-sale financial assets
Available-for-sale financial assets, principally comprising marketable equity securities, are non-derivatives that are either designated in this category or not classified in any of the other categories. They are included in non-current assets unless management intends to dispose of the investment.
Recognition and de-recognitionRegular purchases and sales of investments are recognised on trade date - the date on which the Group commits to purchase or sell the asset. Investments are initially recognised at fair value plus transaction costs for all financial assets not carried at fair value throughprofit or loss. Financial assets carried at fair value through profit or loss are initially recognised at fair value and transaction costs areexpensed in profit or loss. Financial assets are derecognised when the rights to receive cash flows from the financial assets haveexpired or have been transferred and the Group has transferred substantially all the risks and rewards of ownership.
When securities classified as available-for-sale are sold or impaired, the accumulated fair value adjustments recognised in othercomprehensive income and presented in the fair value reserve are recycled to profit or loss as gains and losses from investmentsecurities.
Subsequent measurementLoans and receivables are carried at amortised cost using the effective interest method.
Available-for-sale financial assets and financial assets at fair value through profit or loss are subsequently carried at fair value. Gains or losses arising from changes in the fair value of the financial assets at fair value through profit or loss category, are presentedin the profit or loss within other income or other expenses in the period in which they arise. Dividend income from financial assetsthrough the income statement is recognised in the profit or loss as other income.
Gains or losses arising from changes in the value of available-for-sale financial assets category are taken to the fair value reserve.Amounts are recognised in profit or loss when the associated assets are sold or impaired.
ImpairmentThe Group assesses at each balance date whether there is objective evidence that a financial asset or group of financial assets isimpaired. In the case of equity securities classified as available-for-sale, a significant or prolonged decline in the fair value of a securitybelow its cost is considered in determining whether the security is impaired. If any such evidence exists for available-for-sale financialassets, the cumulative loss measured as the difference between the acquisition cost and the current fair value, less any impairmentloss on that financial asset previously recognised in profit or loss is removed from the fair value reserve in equity and recognised inthe profit or loss. Impairment losses recognised in the profit or loss on equity instruments classified as available-for-sale are notreversed through the profit or loss but are recognised in other comprehensive income and presented in the fair value reserve.
(M) DERIVATIVESDerivatives are initially recognised at fair value on the date a derivative contract is entered into and are subsequently remeasured attheir fair value at each reporting date. The accounting for subsequent changes in fair value depends on whether the derivative is designated as a hedging instrument, and if so, the nature of the item being hedged. The Group designates certain derivatives as either: - hedges of the fair value of recognised assets or liabilities or a firm commitment (fair value hedges); or - hedges of the cash flows of recognised assets and liabilities and highly probable forecast transactions (cash flow hedges).
The Group documents at the inception of the hedging transaction the relationship between hedging instruments and hedged items, as well as its risk management objective and strategy for undertaking various hedge transactions. The Group also documents itsassessment, both at hedge inception and on an ongoing basis, of whether the derivatives that are used in hedging transactionshave been and will continue to be highly effective in offsetting changes in fair values or cash flows of hedged items.
The full fair value of a hedging derivative is classified as a non-current asset or liability when the remaining maturity of the hedged item is more than 12 months; it is classified as a current asset or liability when the remaining maturity of the hedged item is less than 12 months. Trading derivatives are classified as a current asset or liability.

Annual Report 2012 67
Notes to the Consolidated Financial Statements Financial Report for the year ended 30 June 2012
1. STATEMENT OF SIGNIFICANT ACCOUNTING POLICIES (CONTINUED)(M) DERIVATIVES (CONTINUED)(i) Fair value hedges
Changes in the fair value of derivatives that are designated and qualify as fair value hedges are recorded in the profit or loss, together with any changes in the fair value of the hedged asset or liability that are attributable to the hedged risk. The gain or loss relating to the effective portion of interest rate swaps hedging fixed rate borrowings is recognised in the profit or loss within finance costs, together with changes in the fair value of the hedged fixed rate borrowings attributable to interest rate risk. The gain or loss relating to the relating to the ineffective portion is recognised in the profit or loss within other income or other expenses.
If the hedge no longer meets the criteria for hedge accounting, the adjustment to the carrying amount of a hedged item for which the effective interest method is used is amortised to profit or loss over the period to maturity using a recalculated effective interest rate.
(ii) Cash flow hedgesThe effective portion of changes in the fair value of derivatives that are designated and qualify as cash flow hedges is recognised in other comprehensive income in the cash flow hedge reserve. The gain or loss relating to the ineffective portion is recognisedimmediately in the profit or loss within other income or other expenses.
Amounts accumulated in other comprehensive income are recycled in the profit or loss in the periods when the hedged item affectsprofit or loss (for instance when the forecast sale that is hedged takes place). The gain or loss relating to the effective portion of interestrate swaps hedging variable rate borrowings is recognised in the profit or loss within ‘finance costs’. The gain or loss relating to theeffective portion of forward foreign exchange contracts hedging export sales is recognised in profit or loss within ‘sales’. However, when the forecast transaction that is hedged results in the recognition of a non financial asset (for example, inventory or fixed assets), the gains and losses previously deferred in other comprehensive income are transferred from other comprehensive income andincluded in the initial measurement of the cost of the asset. The deferred amounts are ultimately recognised in profit or lossas a cost of goods sold in the case of inventory, or as depreciation in the case of fixed assets.
When a hedging instrument expires or is sold or terminated, or when a hedge no longer meets the criteria for hedge accounting, any cumulative gain or loss existing in other comprehensive income at that time remains in other comprehensive income and isrecognised when the forecast transaction is ultimately recognised in profit or loss. When a forecast transaction is no longer expectedto occur, the cumulative gain or loss that was reported in other comprehensive income is immediately transferred to the profit or loss.
(iii) Derivatives that do not qualify for hedge accountingCertain derivative instruments do not qualify for hedge accounting. Changes in the fair value of any derivative instrument that does not qualify for hedge accounting are recognised immediately in profit or loss.
(N) PROPERTY, PLANT AND EQUIPMENTAll property, plant and equipment is stated at historical cost less accumulated depreciation and accumulated impairment losses.Historical cost includes expenditure that is directly attributable to the acquisition of the items.
Subsequent costs are included in the asset’s carrying amount or recognised as a separate asset, as appropriate, only when it is probable that future economic benefits associated with the item will flow to the Group and the cost of the item can be measured reliably. Allother repairs and maintenance are charged to profit or loss during the reporting period in which they are incurred.
Freehold land is not depreciated. Depreciation on other assets is calculated using the straight line method to allocate their cost or revalued amounts, net of their residual values, over their estimated useful lives, as follows:
Buildings 16 – 40 yearsPlant and equipment 3 – 25 yearsRental fleet – rental store assets 2 – 10 yearsLeasehold improvements 1 – 40 yearsLeased plant and equipment 2 – 12 years
Other rental fleet assets, other than those shown above, are depreciated on a reducing balance method at a rate of 30%.

68 Seven Group Holdings Limited (ABN 46 142 003 469)
Notes to the Consolidated Financial Statements Financial Report for the year ended 30 June 2012
1. STATEMENT OF SIGNIFICANT ACCOUNTING POLICIES (CONTINUED)(N) PROPERTY, PLANT AND EQUIPMENT (CONTINUED)The assets’ residual values and useful lives are reviewed, and adjusted if appropriate, at each reporting date.
An asset’s carrying amount is written down immediately to its recoverable amount if the asset’s carrying amount is greater than its estimated recoverable amount (Note 1(H)).
Gains and losses on disposals are determined by comparing proceeds with carrying amount. These are included in profit or loss.
The cost of improvements to or on leasehold properties is amortised over the unexpired period of the lease or the estimated useful life of the improvement to the consolidated entity, whichever is the shorter.
(O) INTANGIBLE ASSETS(i) Goodwill
Goodwill represents the excess of the cost of an acquisition over the fair value of the Group’s share of the net identifiable assets of the acquired subsidiary/equity accounted investee at the date of acquisition. Goodwill on acquisitions of subsidiaries is included inintangible assets. Goodwill on acquisitions of equity accounted investees is included in investments in equity accounted investees.Goodwill is not amortised. Instead, goodwill is tested for impairment annually or more frequently if events or changes in circumstances indicate that it might be impaired, and is carried at cost less accumulated impairment losses. Gains and losses on the disposal of an entity include the carrying amount of goodwill relating to the entity sold.
Goodwill is allocated to cash generating units for the purpose of impairment testing. Each of those cash generating units representsthe Group’s investment in each country of operation by each primary reporting segment.
(ii) Distribution networksThe distribution networks of the Group are considered by the directors to be identifiable intangible assets.
The directors are of the opinion that the distribution networks have an indefinite useful life, and as such the distribution networks arenot subject to amortisation but rather are tested annually for impairment or more frequently if events or changes in circumstances indicate impairment. The basis for the classification of indefinite life is that the dealership agreements do not require specific renewal over set intervals thus the distribution rights continue uninterrupted unless a cause to terminate is triggered.
(iii) Research and development expenditure (intellectual property)Research expenditure is recognised as an expense as incurred. Costs incurred on development projects are written off as incurredunless it is probable the project will be a success considering its commercial and technical feasibility and its costs can be measuredreliably.
Capitalised development costs are recorded as intangible assets and amortised from the point at which the asset is ready for use on a straight line basis over its useful life, which varies from 1 - 5 years.
(iv) IT development and softwareCosts which are incurred in developing products or systems and costs incurred in acquiring software and licenses that will contribute to future period financial benefits through revenue generation and/or cost reduction are capitalised to software and systems. Costs capitalised include external direct costs of materials and services and the direct payroll and payroll related cost of employees’ time spent on the project. Amortisation is calculated on a straight line basis over the estimated useful life, generally ranging from 3 – 5 years.
IT development costs include only the costs directly attributable to the development phase and are only recognised following completion of technical feasibility and where the Group has an intention and an ability to use the asset.
(v) Customer contractsCustomer contracts acquired as part of a business combination are recognised separately from goodwill. The customer contracts are carried at their fair value at the date of the acquisition less accumulated amortisation and impairment losses. Amortisation is calculated based on the timing of projected cash flows of the contracts over their estimated useful lives, which currently vary from 1 to 10 years.

Annual Report 2012 69
Notes to the Consolidated Financial Statements Financial Report for the year ended 30 June 2012
1. STATEMENT OF SIGNIFICANT ACCOUNTING POLICIES (CONTINUED)(O) INTANGIBLE ASSETS (CONTINUED)(vi) Spectrum licencesSpectrum licence assets acquired as part of a business combination are measured at their fair value at the date of acquisition lessaccumulated amortisation and impairment charges. The amortisation of spectrum licence assets is calculated on a straight-line basisover the expected useful life of the asset based on the current renewal dates of each licence. The renewal date of the 2.3Ghz and 3.5Ghzspectrum licences are July 2015 and December 2015, respectively. The Group's spectrum licence assets were disposed as part of thesale of the vividwireless Group Limited sale to Optus Mobile Pty Ltd on 19 June 2012 as detailed in Note 27.
(P) TRADE AND OTHER PAYABLES
These amounts are carried at amortised cost and represent liabilities for goods and services provided to the Group prior to the end of
the financial year and which are unpaid. The amounts are unsecured and are usually paid within normal trading terms.
(Q) BORROWINGSBorrowings are initially recognised at fair value, net of transaction costs incurred. Borrowings are subsequently measured at amortised
cost. Any difference between the proceeds (net of transaction costs) and the redemption amount is recognised in the income statementover the period of the borrowings using the effective interest method. Fees paid on the establishment of loan facilities, which are not incremental costs relating to the actual draw down of the facility, are recognised on a net basis against borrowings and amortised on astraight line basis over the term of the facility.
Borrowings are derecognised from the statement of financial position when the obligation specified in the contract is discharged,cancelled or expired. The difference between the carrying amount of a financial liability that has been extinguished or transferredto another party and the consideration paid, including any non-cash assets transferred or any liabilities assumed, is recognisedin other income or expenses.
Borrowings are classified as current liabilities unless the Group has an unconditional right to defer settlement for at least 12 months after the reporting date.
Borrowing costs incurred for the construction of any qualifying asset are capitalised during the period of time that is required to complete and prepare the asset for its intended use or sale. Other borrowing costs are expensed.
(R) PROVISIONSProvisions for legal claims, service warranties and make good obligations are recognised when the group has a present legal or
constructive obligation as a result of past events and it is probable that an outflow of resources will be required to settle the obligation and the amount has been reliably estimated. Provisions are not recognised for future operating losses.
Where there are a number of similar obligations, the likelihood that an outflow will be required in settlement is determined by considering the class of obligations as a whole. A provision is recognised even if the likelihood of an outflow with respect to any one item included in the same class of obligations may be small.
Provisions are determined by discounting the expected future cash flows at a pre-tax rate that reflects current market assessments ofthe time value of money and the risks specific to the liability.
(S) EMPLOYEE BENEFITS(i) Wages, salaries and annual leave
Liabilities for wages and salaries, including non-monetary benefits and annual leave due to be settled within 12 months of the reporting date are recognised in provisions in respect of employees services up to the reporting date and are measured at the amounts expected to be paid when the liabilities are settled.

70 Seven Group Holdings Limited (ABN 46 142 003 469)
Notes to the Consolidated Financial Statements Financial Report for the year ended 30 June 2012
1. STATEMENT OF SIGNIFICANT ACCOUNTING POLICIES (CONTINUED)(S) EMPLOYEE BENEFITS (CONTINUED)(ii) Long service leave
The liability for long service leave is recognised in the provision for employee benefits and measured as the present value of expected future payments to be made in respect of services provided by employees up to the reporting date. Consideration is given to expected future wage and salary levels, experience of employee departures and periods of service. Expected future payments are discounted using market yields at the reporting date on national government bonds with terms of maturity and currency that match, as closely as possible, the estimated future cash outflows.
(iii) SuperannuationThe Group contributes to a superannuation fund which provides accumulated contribution plans. Contributions are charged againstthe profit or loss in the period to which they relate.
(iv) Profit-sharing and bonus plansA subsidiary recognises a liability and an expense for bonuses and profit-sharing based on a formula that takes into consideration the profit attributable to the company’s shareholders after certain adjustments. A provision is recognised where the subsidiary is contractually obliged or where there is a past practice that has created a constructive obligation.
(v) Share based payments The fair value of options granted under both the Company's and a subsidiary’s option plan is recognised as an employee benefit expense with a corresponding increase in equity. The fair value is measured at grant date and recognised over the period during which the employees become unconditionally entitled to the options.
The fair value at grant date is independently determined using Black-Scholes, Binomial or Monte Carlo simulation option pricing models that take into account the exercise price, the term of the option, the vesting and performance criteria, the impact of dilution, the non-tradeable nature of the option, the share price at grant date and expected price volatility of the underlying share, the expected dividend yield, total shareholder return (TSR) hurdles and the risk-free interest rate for the term of the option.
The fair value of the options granted excludes the impact of any non-market vesting conditions (for example, profitability and sales growth targets). Non-market vesting conditions are included in assumptions about the number of options that are expected to become exercisable. At each reporting date, the entity revises its estimate of the number of options that are expected to become exercisable. The employee benefit expense recognised each period takes into account the most recent estimate. Other cash-settled share basedpayments are recognised as an employee benefit expense with a corresponding increase in liability for employee entitlements. The expense and the liability incurred are measured at the fair value of the liability. Refer to Note 30 for further information regarding the share based payment schemes.
(T) GOVERNMENT GRANTSGovernment grants relating to costs are deferred and recognised in the consolidated income statement over the period necessary to match them with the costs that they are intended to compensate.
Government grants relating to the purchase of property, plant and equipment are included in non current liabilities as deferred income and are credited to profit or loss on a straight line basis over the expected useful lives of the related assets.
(U) GOODS AND SERVICES TAXRevenues, expenses and assets are recognised net of the amount of associated GST, unless the GST incurred is not recoverable from the
taxation authority. In this case it is recognised as part of the cost of acquisition of the asset or as part of the expense.
Receivables and payables are stated inclusive of the amount of GST receivable or payable. The net amount of GST recoverable from, or payable to, the taxation authority is included with other receivables or payables in the balance sheet.
Cash flows are presented on a gross basis. The GST components of cash flows arising from investing or financing activities which are recoverable from, or payable to the taxation authority, are presented as operating cash flow.

Annual Report 2012 71
Notes to the Consolidated Financial Statements Financial Report for the year ended 30 June 2012
1. STATEMENT OF SIGNIFICANT ACCOUNTING POLICIES (CONTINUED)(V) NEW ACCOUNTING STANDARDS
The following standards, amendments to standards and interpretations have been identified as those which may impact the entity in
the period of initial application. They were available for early adoption at 30 June 2012, but have not been early adopted in preparingthis financial report.
- AASB 9 Financial Instruments- AASB 10 Consolidated Financial Statements- AASB 11 Joint Arrangements- AASB 12 Disclosures of Interests in Other Entities- AASB 13 Fair Value Measurement- AASB 119 Employee Benefits- AASB 127 Separate Financial Statements- AASB 128 Investments in Associates and Joint Ventures- AASB 1053 Application of Tiers of Australian Accounting Standards- AASB 2009-11 Amendments to Australian Accounting Standards arising from AASB 9- AASB 2010-7 Amendments to Australian Accounting Standards arising from AASB 9 (December 2010)- AASB 2010-8 Amendments to Australian Accounting Standards – Deferred Tax Recovery of Underlying Assets- AASB 2011-4 Amendments to Australia Accounting Standards to Remove Individual Key Management
Personnel Disclosure Requirements- AASB 2011-7 Amendments to Australian Accounting Standards arising from the Consolidation and Joint Arrangement Standards- AASB 2011-8 Amendments to Australian Accounting Standards arising from AASB 13- AASB 2011-9 Amendments to Australian Accounting Standards – Presentation of Other Comprehensive Income- AASB 2011-10 Amendments to Australian Accounting Standards arising from AASB 119 (September 2011)- AASB 2012-2 Amendments to Australian Accounting Standards – Disclosures – Offsetting Financial Assets and Financial Liabilities- AASB 2012-3 Amendments to Australian Accounting Standards – Offsetting Financial Assets and Financial Liabilities- AASB 2012-5 Amendments to Australian Accounting Standards arising from Annual Improvements 2009-2011 Cycle
The Group has not yet performed detailed analysis of the financial effect of these new standards.
(W) CONTRIBUTED EQUITYOrdinary shares, redeemable preference shares, non-share equity and other equity securities are classified as equity.
Incremental costs directly attributable to the issue of new shares or options are shown in other comprehensive income and presentedas contributed equity as a deduction, net of tax, from the proceeds. Incremental costs directly attributable to the issue of new sharesor options, for the acquisition of a business, are not included in the cost of the acquisition as part of the purchase consideration.
(X) TELYS4The Transferable Extendable Listed Yield Shares (TELYS4) have been classified as equity and the dividend payable on the TELYS4 is
treated as a distribution of Shareholders Equity. The statement of comprehensive income does not include the dividends on TELYS4.
(Y) OPERATING SEGMENTS
The Group has determined and presented operating segments based on the information that internally is provided to the CEO
and the Board.
An operating segment is a component of the Group that engages in business activities from which it may earn revenues and incurexpenses, including revenues and expenses that relate to transactions with any of the Group's other components. All operating segments’ operating results are regularly reviewed by the Group’s CEO and Board to make decisions about resources to be allocated to the segment and to assess its performance for which discrete financial information is available.
During the current year, segment information previously disclosed as National Hire Group has been disaggregated to separate theAllightSykes and Coates Hire businesses. This is consistent with the information that is internally provided to the CEO and Board.

72 Seven Group Holdings Limited (ABN 46 142 003 469)
Notes to the Consolidated Financial Statements Financial Report for the year ended 30 June 2012
1. STATEMENT OF SIGNIFICANT ACCOUNTING POLICIES (CONTINUED)(Y) OPERATING SEGMENTS (CONTINUED)Segment results that are reported to the CEO and Board include items directly attributable to a segment as well as those that can be allocated on a reasonable basis. Unallocated items comprise mainly corporate assets, head office expenses and income tax assets and liabilities.
Segment capital expenditure is the total cost incurred during the period to acquire property, plant and equipment, and intangible assets other than goodwill.
The segments identified are;• WesTrac Australia• WesTrac China• AllightSykes• Coates Hire• Media investments• Other investments
(Z) EARNINGS PER SHAREThe Group presents basic and diluted earnings per share (EPS) data for its ordinary shares. Basic EPS is calculated by dividing the profit or loss attributable to ordinary shareholders of the Company by the weighted average number of ordinary shares outstanding during the period. Diluted EPS is determined by adjusting the profit or loss attributable to ordinary shareholders and the weighted average number of ordinary shares outstanding for the effects of all dilutive potential ordinary shares.
Profit or loss attributable to ordinary shareholders is stated after allocation of the portion of profit or loss attributable to holdersof TELYS4.
(AA) FINANCE INCOME AND COSTSNet finance expense comprises interest payable on borrowings calculated using the effective interest method and interest receivableon funds invested.
Interest income and interest expense also include components of finance lease payments and is recognised in the income statement as it accrues, using the effective interest method.
Annual Report 2012 73
Notes to the Consolidated Financial Statements Financial Report for the year ended 30 June 2012
2. CRITICAL ACCOUNTING ESTIMATES AND JUDGEMENTSThe preparation of the financial statements requires that management make estimates, judgements and assumptions that affect thereported amounts of assets, liabilities, income and expenses. Actual results may differ from these estimates.
Estimates and underlying assumptions are reviewed on an ongoing basis. Revisions to accounting estimates are recognised in theperiod in which the estimates are incorporated and in any future periods affected.
Significant areas of estimation, uncertainty and critical judgements in applying accounting policies that have the most significant effect on the amounts recognised in the financial statements are;
- income tax: the Group is subject to income taxes in Australia and jurisdictions where it has foreign operations. Judgment is required indetermining the provision for income taxes. There are many transactions and calculations undertaken during the ordinary course ofbusiness for which the ultimate tax determination is uncertain. Assumptions are made about the application of income tax legislation.These assumptions are subject to risk and uncertainty and there is a possibility that changes in circumstances will alter expectationswhich may impact the amount of deferred tax assets recorded in the statement of financial position. In these circumstances the carryingamount of deferred tax assets may change impacting the profit or loss of the Group.
- determining fair values of assets acquired in respect of business combinations: in determining the fair value of assets acquired in abusiness combination, the Group has utilised valuation specialists. As the accounting for the Bucyrus acquisition has not yet been finalised, the disclosure in Note 26 is reported on a provisional basis.
- impairment of intangible assets: the Group tests annually whether goodwill and distribution networks have suffered any impairment, in accordance with the Group's accounting policy. The recoverable amounts of cash-generating units have been determined based ontheir value-in-use or fair value less costs to sell, and using discounted cash-flow model calculations. These calculations require theuse of assumptions.
- impairment of available-for-sale assets and listed equity accounted investees: in determining the amount of impairment for financialassets and equity accounted investees that are listed, the Group has made judgements in identifying financial assets that are impaireddue to industry factors or whose decline in fair value below original cost is considered "significant" or "prolonged". A significant declineis assessed based on the decline from acquisition cost of the share price. The higher the percentage decline, the more likely it is tobe regarded as significant. A prolonged decline is based on the length of the time over which the share price has been depressedbelow cost. A sudden decline followed by immediate recovery is less likely to be considered prolonged compared to a sustained fall of the same magnitude over a longer period.

74 Seven Group Holdings Limited (ABN 46 142 003 469)
Notes to the Consolidated Financial Statements Financial Report for the year ended 30 June 2012
3. OPERATING SEGMENTS
REPORTABLE SEGMENTSIdentification of reportable segmentsThe Group has identified its operating segments based on the internal reports that are reviewed and used by the executive management team (the chief operating decision makers) in assessing performance and in determining the allocation of resources.
The operating segments are identified by management based on the manner in which products are sold, the nature of services provided and country of origin.
• WesTrac Australia - WesTrac Australia is an authorised Caterpillar dealer in Western Australia, New South Wales and the Australian Capital Territory, providing heavy equipment sales and support to customers.
• WesTrac China - operates as one of the four authorised Caterpillar dealers in China, providing heavy equipment sales and support to customers.
• AllightSykes - represents the Group's operations in the manufacture, assembly, sales and support of lighting, power generation and dewatering equipment as well as distribution of Perkins engines, via National Hire's investment in AllightHoldings Pty Ltd and The Sykes Group.
• Coates Hire - represents the Group's equity accounted investment in Coates Hire Pty Limited. Coates Hire is Australia's largestequipment hire company and provides a full range of general and specialist equipment to a wide variety of markets includingengineering and building construction & maintenance, mining & resources, manufacturing, government, and events.
• Media investments - relates to investments in listed and unlisted media organisations, including but not limited to, Seven WestMedia Limited and Consolidated Media Holdings Limited.
• Other investments - incorporates operations in broadband, telephony, other listed investments and property.
The Group is domiciled in Australia and operates predominantly in two countries, Australia and China. Segment revenues are allocatedbased on the country in which the customer is located. The WesTrac China segment represents all revenue derived from China.
Accounting policiesThe accounting policies used by the Group in reporting segments internally are the same as those described in Note 1.
WesTrac (e) WesTrac Allight (e) Coates Media (c) Other
Australia China Sykes Hire investments investments
YEAR ENDED 30 JUNE 2012 $’000 $’000 $’000 $’000 $’000 $’000 $’000
Segment revenueSales to external customers 3,519,078 670,312 210,329 - - 56,729 4,456,448
Segment resultSegment earnings before interest, tax, 427,214 17,056 14,342 56,268 116,083 29,980 660,943
depreciation and amortisation (EBITDA) (a)(d)
Depreciation and amortisation (40,132) (8,644) (3,066) - - (24,854) (76,696)
Segment earnings before interest and 387,082 8,412 11,276 56,268 116,083 5,126 584,247
tax (EBIT) (b)(d)
Other segment informationCapital expenditure (61,647) (9,905) (8,109) - - (5,347) (85,008)
Share of results of equity accounted 5,120 716 - 56,268 92,161 578 154,843
investees included in segment EBIT
(excluding significant items) (d)
Impairment of assets recognised in - - - - (416,890) (300) (417,190)
profit or loss
(a) Segment EBITDA comprises profit before depreciation and amortisation, net finance costs, tax, net gain on sale of investments, equity accounted
investees and subsidiaries, impairment of equity accounted investees and other financial assets, fair value movement of derivatives, share of significant
items relating to results from equity accounted investees, corporate operating costs and transaction related costs.
Total

Annual Report 2012 75
Notes to the Consolidated Financial Statements Financial Report for the year ended 30 June 2012
3. OPERATING SEGMENTS (CONTINUED)
(b) Segment EBIT comprises profit before net finance costs, tax, net gain on sale of investments, equity accounted investees and subsidiaries, impairment
of equity accounted investees and other financial assets, fair value movement of derivatives, share of significant items relating to results from equity
accounted investees, corporate operating costs and transaction related costs.
(c) Media investments comprise investments accounted for using the equity method and available-for-sale financial assets.
(d) Coates Hire segment EBITDA, EBIT and share of results of equity accounted investees excludes share of results from equity accounted
investees attributable to significant items.
(e) WesTrac Australia and AllightSykes results above have been reduced in relation to the elimination of sales to Coates Hire, due to the Group's
45% interest in Coates Hire.
WesTrac WesTrac Allight Coates Media Other
Australia China Sykes Hire investments investments
YEAR ENDED 30 JUNE 2012 $’000 $’000 $’000 $’000 $’000 $’000 $’000
Balance sheetInvestments accounted for using the 21,281 2,041 - 386,347 825,396 44,841 1,279,906
equity method
Other segment assets 2,250,132 823,338 208,620 - 280,050 729,787 4,291,927
Segment assets 2,271,413 825,379 208,620 386,347 1,105,446 774,628 5,571,833
Segment liabilities (553,231) (170,069) (56,242) - - (23,962) (803,504)
WesTrac WesTrac Allight Coates Media Other
Australia China Sykes Hire investments investments
YEAR ENDED 30 JUNE 2011 (RESTATED) $’000 $’000 $’000 $’000 $’000 $’000 $’000
Segment revenueSales to external customers 2,245,209 729,887 135,124 - - 52,614 3,162,834
Intersegment sales 24 - (24) - - - -
2,245,233 729,887 135,100 - - 52,614 3,162,834
Segment resultSegment earnings before interest, tax, 244,085 34,533 10,741 22,838 126,849 14,899 453,945
depreciation and amortisation (EBITDA) (a)(d)
Depreciation and amortisation (38,168) (7,001) (2,007) - - (20,594) (67,770)
Segment earnings before interest and 205,917 27,532 8,734 22,838 126,849 (5,695) 386,175
tax (EBIT) (b)(d)
Other segment informationCapital expenditure (40,865) (12,272) (1,280) - - (17,143) (71,560)
Share of results of equity accounted 930 149 - 22,838 118,401 1,270 143,588
investees included in segment EBIT
(excluding significant items) (d)
Impairment of assets recognised in (4,131) - - - (315,598) (4,620) (324,349)
profit or loss
Balance sheetInvestments accounted for using the 14,119 1,256 - 331,268 1,089,278 46,131 1,482,052
equity method
Other segment assets 1,257,689 760,205 183,839 - 259,965 777,626 3,239,324
Segment assets 1,271,808 761,461 183,839 331,268 1,349,243 823,757 4,721,376
Segment liabilities (440,286) (165,641) (50,210) - (8,543) (32,227) (696,907)
Total
Total

76 Seven Group Holdings Limited (ABN 46 142 003 469)
Notes to the Consolidated Financial Statements Financial Report for the year ended 30 June 2012
3. OPERATING SEGMENTS (CONTINUED)
2012 2011
Reconciliation of segment EBIT to net profit before tax per consolidated income statement $’000 $’000Segment net operating profit before net finance costs and tax (EBIT) 584,247 386,175
Corporate operating costs & transaction related costs (49,908) (33,151)
Net gain on sale of investments and equity accounted investees 8,911 58,679
Net gain on sale of subsidiary 129,786 -
Share of significant items relating to results from equity accounted investees 8,176 -
Fair value movement of derivatives (18,167) -
Impairment of equity accounted investees (416,890) (305,648)
Impairment of non-current assets (300) (18,701)
Net finance costs (113,030) (54,963)
Profit before tax per consolidated income statement 132,825 32,391
2012 2011Reconciliation of segment operating assets to total assets per statement of financial position $’000 $’000Segment operating assets 5,571,833 4,721,376
Corporate cash holdings 127,749 71,145
Current tax assets - 13,123
Deferred tax assets - 10,616
Derivative financial instruments 72,473 2,587
Assets held at corporate level 14,629 4,620
Total assets per statement of financial position 5,786,684 4,823,467
The total of non-current assets other than financial instruments and deferred tax assets (there are no employment benefit assets and rights arising
under insurance contracts) located in Australia is $2,671,674,000 (2011: $2,805,630,000). The total of non-current assets located in China is $616,189,000
(2011: $661,450,000). Segment assets are allocated to countries based on where the assets are located.
2012 2011Reconciliation of segment operating liabilities to total liabilities per statement of financial position $’000 $’000Segment operating liabilities (803,504) (696,907)
Liabilities held at corporate level (45,169) (35,556)
Derivative financial instruments (149,506) (122,057)
Current interest bearing loans and borrowings (284,632) (347,133)
Non current interest bearing loans and borrowings (1,561,799) (561,124)
Current tax liabilities (94,865) -
Deferred tax liabilities (267,386) (378,768)
Total liabilities per statement of financial position (3,206,861) (2,141,545)
4. NET FINANCE EXPENSE
2012 2011$’000 $’000
FINANCE INCOMEInterest income on bank deposits 3,930 6,221
Other 535 1,201
Total finance income 4,465 7,422
FINANCE COSTSInterest expense (107,904) (51,891)
Borrowing costs (9,591) (10,494)
Total finance costs (117,495) (62,385)
Net finance expense (113,030) (54,963)

Annual Report 2012 77
Notes to the Consolidated Financial Statements Financial Report for the year ended 30 June 2012
5. DIVIDENDS
Date of Franked / Amount Total
YEAR ENDED 30 JUNE 2012 payment unfranked per share $’000
DIVIDENDS PAID Ordinary sharesFinal dividend in respect of 2011 year 14-Oct-11 Franked 0.18$ 55,154
Interim dividend 13-Apr-12 Franked 0.18$ 55,334
110,488
Transferable Extendable Listed Yield Shares (“TELYS4”)Dividend 30-Nov-11 Franked 3.48$ 17,272
Dividend 31-May-12 Franked 3.21$ 15,937
33,209
Subsequent eventCurrent period final dividend on ordinary shares
proposed but not provided
Ordinary sharesFinal dividend in respect of 2012 year 12-Oct-12 Franked 0.20$ 61,482
Balance of franking account at 30% 50,148
Date of Franked / Amount Total
YEAR ENDED 30 JUNE 2011 payment unfranked per share $’000
DIVIDENDS PAID Ordinary sharesFinal dividend in respect of 2010 year 22-Oct-10 Franked 0.18$ 54,974
Interim dividend 15-Apr-11 Franked 0.18$ 54,974
109,948
Transferable Extendable Listed Yield Shares (“TELYS4”)Dividend 30-Nov-10 Franked 3.40$ 16,898
Dividend 31-May-11 Franked 3.49$ 17,324
34,222
Ordinary sharesFinal dividend in respect of 2011 year 14-Oct-11 Franked 0.18$ 55,154
Balance of franking account at 30% 37,906
The above amount represents the balance of the dividend franking account as at the reporting date, adjusted for:
(a) franking credits that will arise from the payment of current tax liabilities;
(b) franking debits that will arise from the payment of dividends recognised as a liability at the reporting date;
(c) franking credits that will arise from the receipt of dividends recognised as receivables by the tax consolidated
group at the reporting date; and
(d) franking credits that the entity may be prevented from distributing in subsequent years.
The ability to utilise the franking credits is dependent upon there being sufficient available profits to declare dividends. Theimpact on the dividend franking account of dividends proposed after the balance sheet date but not recognised as a liabilityis to reduce it by $26,349,000 (2011: $23,637,000).

78 Seven Group Holdings Limited (ABN 46 142 003 469)
Notes to the Consolidated Financial Statements Financial Report for the year ended 30 June 2012
6. INCOME TAX
2012 2011$’000 $’000
INCOME TAX BENEFIT/(EXPENSE)Current tax expense:
Current period (85,282) (55,290)
Adjustment for prior periods (3,389) (1,499)
(88,671) (56,789)
Deferred tax benefit due to origination and reversal of temporary differences 132,594 104,311
Total income tax benefit in statement of comprehensive income 43,923 47,522
RECONCILIATION BETWEEN TAX EXPENSE AND
PRE-TAX ACCOUNTING PROFITS:Income tax using the domestic corporation tax rate 30% (39,847) (9,717)
Recognition of deferred tax asset on capital losses, not previously recognised (1) 25,229 -
Remeasurement of deferred tax assets and deferred tax liabilities 22,825 14,465
Franked dividends 35,732 9,411
Share of associates' net profit 11,644 6,994
Taxable capital gain - (17,250)
Non-assessable tax group income 771 18,902
Non-deductible tax group expenses (9,408) (3,150)
Other non-taxable/non-deductible items - 5,957
Income tax benefit under a tax sharing agreement - 22,344
Under provided in prior periods (3,389) (1,499)
Difference in overseas tax rates 367 1,065
Income tax benefit 43,923 47,522
DEFERRED INCOME TAX RECOGNISED DIRECTLY IN EQUITYRelating to available-for-sale financial assets (5,841) 8,721
Relating to cash flow hedge reserve (9,962) 3,502
Relating to acquisition of non-controlling interests (16,609) -
Total deferred income tax recognised directly in equity (32,412) 12,223

Annual Report 2012 79
Notes to the Consolidated Financial Statements Financial Report for the year ended 30 June 2012
6. INCOME TAX (CONTINUED)
DEFERRED TAX ASSETS & LIABILITIES Opening Recognised Recognised Closing
balance in profit in equity Other balance
YEAR ENDED 30 JUNE 2012 $’000 $’000 $’000 $’000 $’000
Investments (394,800) 112,837 (16,054) - (298,017)
Derivative financial instruments (13,234) 11,241 (9,962) - (11,955)
Inventories and receivables (14,403) 15,732 5,963 - 7,292
Intangible assets (4,808) 35 (13,210) - (17,983)
Property, plant & equipment (12,674) 6,030 198 - (6,446)
Trade & other payables 7,715 22,602 - - 30,317
Prepayments 12,498 (12,651) - - (153)
Provisions 37,217 (17,239) - - 19,978
Tax losses - capital (1) - - - - -
Transaction costs deducted over 5 years 13,509 (6,965) - - 6,544
Other 828 972 653 584 3,037
Net tax liability (368,152) 132,594 (32,412) 584 (267,386) Deferred tax asset -
Deferred tax liability (267,386)
Net deferred tax liability (267,386)
(1) prior year capital losses where deferred tax asset not previously recognised, were fully utilised in the current year.
Opening Recognised Recognised Closing
balance in profit in equity Other balance
YEAR ENDED 30 JUNE 2011 $’000 $’000 $’000 $’000 $’000
Investments (500,492) 96,971 8,721 - (394,800)
Derivative financial instruments (13,719) (3,017) 3,502 - (13,234)
Inventories and receivables (8,885) (5,518) - - (14,403)
Intangible assets (4,201) (607) - - (4,808)
Property, plant & equipment (13,865) 1,191 - - (12,674)
Trade & other payables 10,608 (2,893) - - 7,715
Prepayments - 12,498 - - 12,498
Provisions 34,460 2,757 - - 37,217
Tax losses - revenue - SGH tax consolidated group 27,493 (11,356) - (16,137) -
Tax losses - capital 15,976 (1,205) - (14,771) -
Transaction costs deducted over 5 years 10,063 3,446 - - 13,509
Other (14,667) 12,044 - 3,451 828
Net tax liability (457,229) 104,311 12,223 (27,457) (368,152) Deferred tax asset 10,616
Deferred tax liability (378,768)
Net deferred tax liability (368,152)
As at 30 June 2012, the Group had not recognised deferred tax assets of $37,181,000 (2011: $36,482,000) in respect of deductible temporary differences relating to unrealised capital losses as it was not probable that future capital gains will be realisedagainst which it could utilise the benefits.
As at 30 June 2012, the Group had not recognised deferred tax liabilities of $3,155,000 (2011: $2,697,000) in respect of assessable temporary differences in relation to investments in subsidiaries where management controls the timing of reversal of the temporary difference and the temporary difference is not expected to reverse in the foreseeable future.

80 Seven Group Holdings Limited (ABN 46 142 003 469)
Notes to the Consolidated Financial Statements Financial Report for the year ended 30 June 2012
7. EARNINGS PER SHARE
2012 2011$’000 $’000
EARNINGS RECONCILIATIONNet profit attributable to equity holders of the Company 165,933 70,412
Allocated earnings to category of share:- Ordinary shares 133,287 36,126
- TELYS4 32,646 34,286
165,933 70,412
Weighted average number of sharesNumber for basic earnings per share:- Ordinary shares 306,719,024 305,571,925
- TELYS4 4,963,640 4,963,640
Effect of share options on issue:- Ordinary shares 119,148 584,969
Number for diluted earnings per share:- Ordinary shares 306,838,172 306,156,894
- TELYS4 4,963,640 4,963,640
Statutory earnings per shareOrdinary shares - total earnings per share from continuing operations:- Basic ($) 0.43 0.12
- Diluted ($) 0.43 0.12
TELYS4 - total earnings per TELYS4:- Basic ($) 6.58 6.91
- Diluted ($) 6.58 6.91
Of the 4,250,000 (2011: 5,775,000) options exercisable at 30 June 2012, 1,500,000 (2011: 3,525,000) are dilutive. The weighted average number of dilutive shares is 119,148 (2011: 584,969). As at 30 June 2012, 2,750,000 (2011: 2,250,000) options were anti-dilutive and have not been included in the above diluted earnings per share calculation.

Annual Report 2012 81
Notes to the Consolidated Financial Statements Financial Report for the year ended 30 June 2012
7. EARNINGS PER SHARE (CONTINUED)
2012 2011
UNDERLYING EARNINGS PER SHARE FROM CONTINUING OPERATIONS $’000 $’000
Ordinary shares - total underlying earnings per share from continuing operations (a)(b)
- Basic ($) 0.98 0.67
- Diluted ($) 0.98 0.67
(a) Underlying earnings per share from continuing operations is statutory earnings per share less significant items per share. Significantitems is comprised of impairment of equity accounted investees and non-current assets, fair value movement of derivatives,acquisition related costs, net gain on sale of investments, subsidiaries and equity accounted investees, share of significant items attributable to results from equity accounted investees and any income tax benefit of significant items.
(b) The weighted average number of shares used to calculate underlying earnings per share is the same as the weighted averagenumber of shares used to calculate statutory earnings per share.
Underlying earnings from continuing operations is a non-IFRS measure and is calculated as follows:
2012 2011
$’000 $’000Net profit attributable to equity holders of the Company 165,933 70,412
Significant items:
Add: impairment of equity accounted investees 416,890 305,648
Add: impairment of non-current assets 300 18,701
Add: fair value movement of derivatives 18,167 -
Add: transaction costs related to acquisition of Bucyrus and disposal of subsidiary 18,731 -
Less: net gain on sale of investments and equity accounted investees (8,911) (58,679)
Less: net gain on sale of subsidiary (129,786) -
Less: share of results from equity accounted investees attributable to significant items (8,176) -
Less: income tax benefit (140,734) (97,305)
Underlying net profit attributable to equity holders of the Company 332,414 238,777
Allocated underlying earnings to category of share:- Ordinary shares 299,768 204,491
- TELYS4 32,646 34,286
332,414 238,777
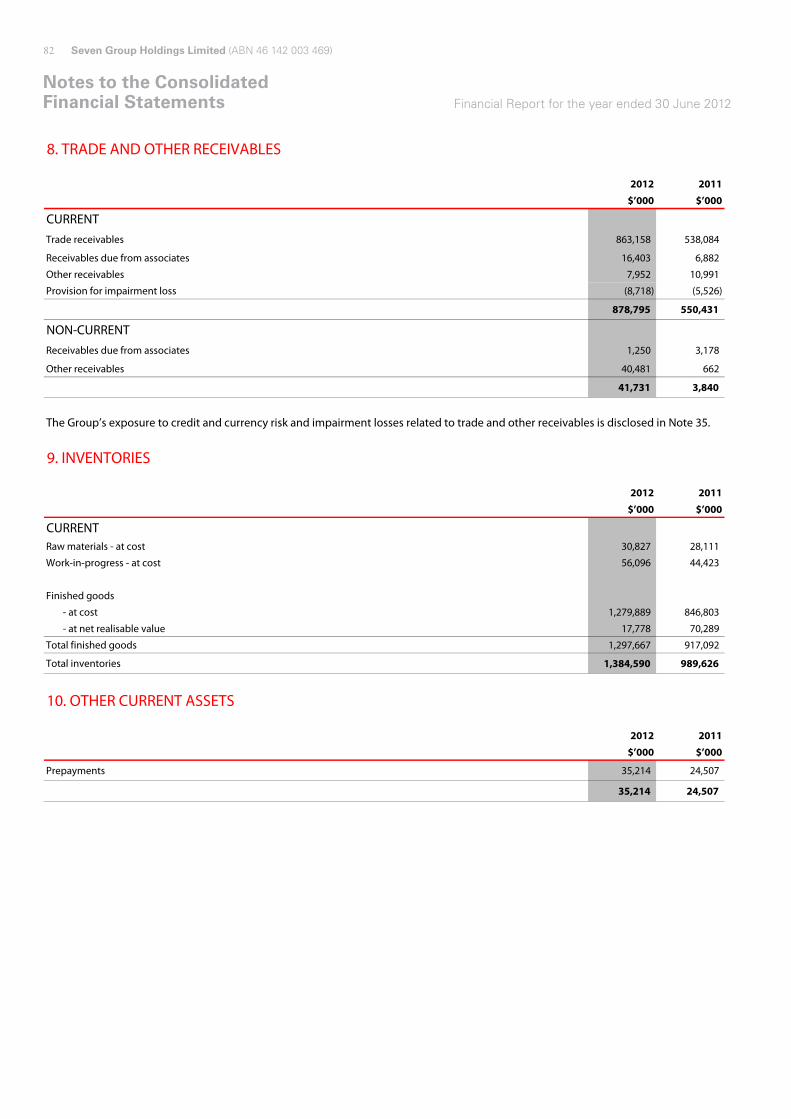
82 Seven Group Holdings Limited (ABN 46 142 003 469)
Notes to the Consolidated Financial Statements Financial Report for the year ended 30 June 2012
8. TRADE AND OTHER RECEIVABLES
2012 2011
$’000 $’000
CURRENTTrade receivables 863,158 538,084
Receivables due from associates 16,403 6,882
Other receivables 7,952 10,991
Provision for impairment loss (8,718) (5,526)
878,795 550,431
NON-CURRENTReceivables due from associates 1,250 3,178
Other receivables 40,481 662
41,731 3,840
The Group’s exposure to credit and currency risk and impairment losses related to trade and other receivables is disclosed in Note 35.
9. INVENTORIES
2012 2011
$’000 $’000
CURRENTRaw materials - at cost 30,827 28,111
Work-in-progress - at cost 56,096 44,423
Finished goods
- at cost 1,279,889 846,803
- at net realisable value 17,778 70,289
Total finished goods 1,297,667 917,092
Total inventories 1,384,590 989,626
10. OTHER CURRENT ASSETS
2012 2011
$’000 $’000
Prepayments 35,214 24,507
35,214 24,507

Annual Report 2012 83
Notes to the Consolidated Financial Statements Financial Report for the year ended 30 June 2012
11. INVESTMENTS ACCOUNTED FOR USING THE EQUITY METHOD
2012 2011
$’000 $’000
Investments in associates and jointly controlled entities 1,279,906 1,482,052
2012 2011Country of Balance Ownership Ownership
Investee Principal activities incorporation date interest interest
EQUITY ACCOUNTED INVESTMENTS AND JOINTLY CONTROLLED ENTITIESAdelaide Broadcast Property Pty Limited* Property management Australia 30-Jun - 40.0%
Adelaide Broadcast Property Trust* Property management Australia 30-Jun - 40.0%
Apac Energy Rental Pte Limited Rental services Singapore 31-Dec 20.0% 20.0%
Consolidated Media Holdings Limited Media Australia 30-Jun 25.3% 24.4%
Energy Power Systems Australia Pty Ltd Distribution and rental of Australia 30-Jun 40.0% 40.0%
CAT engine products
Flagship Property Holdings Pty Limited Property management Australia 31-Dec 46.8% 46.8%
Mo's Mobiles Pty Limited Mobile phone retailer Australia 30-Jun 25.0% 25.0%
Premier Capital Developments Pty Limited Property management Australia 30-Jun 25.0% 25.0%
Revy Investments Pty Limited Property ownership Australia 30-Jun 25.0% 25.0%
Revy Investments Trust Property ownership Australia 30-Jun 25.0% 25.0%
Sydney Broadcast Property Pty Limited* Property management Australia 30-Jun - 40.0%
Vuecast Operations Pty Limited* Programme production Australia 30-Jun - 50.0%
Coates Group Holdings Pty Limited** Rental services Australia 30-Jun 45.0% 46.1%
Seven West Media Limited Media Australia 30-Jun 33.2% 29.6%
* - entities deregistered with ASIC during the year ended 30 June 2012.
** - the Group has determined its interest in Coates Group Holdings Pty Limited to be 45% after considering vesting conditions for options issued
under CG's Management Equity Plan.under Coates Group's Management Equity Plan.
2012 2011
$’000 $’000
SHARE OF INVESTEES' NET PROFITShare of operating profit before tax 211,676 167,278
Share of income tax expense (48,657) (23,690)
Share of net profit of equity accounted investees 163,019 143,588
ASSOCIATED AND JOINTLYCONTROLLED ENTITIES

84 Seven Group Holdings Limited (ABN 46 142 003 469)
Notes to the Consolidated Financial Statements Financial Report for the year ended 30 June 2012
11. INVESTMENTS ACCOUNTED FOR USING THE EQUITY METHOD (CONTINUED)
2012 2011$’000 $’000
SUMMARISED FINANCIAL INFORMATION OF INVESTEES (100% BASIS)Revenues (a) 3,648,332 3,554,539
Expenses (a) (3,044,428) (3,103,181)
Profit before tax 603,904 451,358
Current assets (b) 1,326,882 1,311,050
Non-current assets (b) 7,970,654 7,551,519
Total assets 9,297,536 8,862,569
Current liabilities (b) 972,269 1,209,967
Non-current liabilities (b) 4,272,009 3,855,061
Total liabilities 5,244,278 5,065,028
Net assets as reported by investees 4,053,258 3,797,541
(a) the above revenue and expenses relates to 100% of the investees full year results for the year ended 30 June 2012 for the period of ownership.
(b) the above assets and liabilities relate to investments in equity accounted investees held by the Group at 30 June.
Appropriate adjustments have been made to the reported information in calculating the investor's share of profit.
Book value Market value
YEAR ENDED 30 JUNE 2012 $’000 $’000
MARKET VALUES OF LISTED INVESTMENTS ACCOUNTED FOR USING THE EQUITY METHODConsolidated Media Holdings Limited (b) 439,949 479,879
Seven West Media Limited (a)(b) 385,447 385,447
Book value Market value
YEAR ENDED 30 JUNE 2011 $’000 $’000
MARKET VALUES OF LISTED INVESTMENTS ACCOUNTED FOR USING THE EQUITY METHODConsolidated Media Holdings Limited (b) 358,385 358,385
Seven West Media Limited (a)(b) 730,893 730,893
(a) in addition to the equity accounted investment shown above, the company holds 2,500 convertible preference shares in Seven WestMedia Limited with a carrying value of $252,944,000 included in other financial assets.
(b) impairment (charges)/reversals for the following listed investments accounted for using the equity method were recognised inprofit or loss during the year ended 30 June 2012:
2012 2011
IMPAIRMENT OF INVESTMENTS ACCOUNTED FOR USING THE EQUITY METHOD $’000 $’000Consolidated Media Holdings Limited 66,578 (66,578)
Seven West Media Limited (483,468) (239,070)
Total impairment of investments accounted for using the equity method (416,890) (305,648)
The Group received dividends of $112,384,000 from its investments in equity accounted investees during the year ended 30 June 2012(2011: $46,521,000). $25,626,000 (2011: $33,157,000) was received in cash, with the balance received in the form of additional shares as aresult of participation in a dividend reinvestment plan.

Annual Report 2012 85
Notes to the Consolidated Financial Statements Financial Report for the year ended 30 June 2012
12. DERIVATIVE FINANCIAL INSTRUMENTS
2012 2011
$’000 $’000
CURRENT ASSETSForward foreign exchange contracts - cash flow hedges 10,383 2,587
NON-CURRENT ASSETSCross currency swaps - cash flow hedges 62,090 -
CURRENT LIABILITIESForward foreign exchange contracts - cash flow hedges (12,629) (7,752)
Other derivatives - cash flow hedges - (10,509)
Other derivatives (18,167) -
NON-CURRENT LIABILITIESForward foreign exchange contracts - cash flow hedges (108,700) (101,350)
Interest rate swaps and options - cash flow hedges (10,010) (2,446)
Net derivative financial instruments (77,033) (119,470)
The Group is a party to derivative financial instruments in the normal course of business in order to hedge exposure to fluctuationsin interest rates, foreign exchange rates and equity prices in accordance with the Group’s financial risk management policies (refer to Note 35).
(i) Interest rate swaps and optionsThe Group's policy is to hedge a proportion of its interest bearing liabilities from exposure to changes in interest rates.
The gain or loss from remeasuring the hedging instruments to fair value is deferred in equity in the hedging reserve and reclassified into profit and loss when the hedged interest expense is recognised. To the extent that the hedge is ineffective or undesignated, the fair value movement is recognised in the income statement.
(ii) Foreign exchange contracts and optionsThe Group has obligations to repay the principal amounts of US dollar denominated debt and interest thereon. The Group also enters into purchase and sale transactions denominated in US Dollars, Euros, Great Britain Pounds, New Zealand Dollars and Japanese Yen.In order to protect against exchange rate movements, the Group has entered into forward exchange contracts to purchase foreigncurrency, and foreign exchange option derivatives to impose an upper limit on the cost of purchasing foreign currency.
These contracts are hedging fixed interest and principal repayments on US Private Placement notes, and certain known trading commitments over the next year. The contracts are timed to mature when interest, principal and lease payments are due, and when payments for major purchases of machinery and component parts are scheduled to be made.
(iii) Cross currency swapsThe Group has obligations to repay the principal and interest relating to USD denominated debt. The Group enters into crosscurrency swap contracts to hedge a portion of these obligations.
(iv) Other derivativesOther derivatives comprise equity derivatives. The Group enters into equity derivatives from time to time to hedge the value oflisted investments or to gain exposure to certain market sectors.

86 Seven Group Holdings Limited (ABN 46 142 003 469)
Notes to the Consolidated Financial Statements Financial Report for the year ended 30 June 2012
13. OTHER FINANCIAL ASSETS
2012 2011
$’000 $’000
NON-CURRENTListed equity securities (available-for-sale) 670,899 652,286
Unlisted equity securities 252,944 232,093
923,843 884,379
Listed equity securities are designated as available-for-sale financial assets, in accordance with the Group's accounting policies. Thecarrying amounts are determined based on their market price at 30 June 2012. Any impairment amounts are disclosed separately unless they are not materially significant.
Due to the reduction in market values of some equity securities an aggregate impairment loss of $300,000 (2011: $14,570,000) has been recognised during the year in respect of other financial assets. This impairment loss has been recognised as impairment of non-current assets in the consolidated income statement.
The Group’s exposure to credit, currency, interest rate risk and equity price risk related to other financial assets is disclosed in Note 35.Unlisted equity securities comprise convertible preference shares in Seven West Media Limited (SWM). The shares have no setconversion term but are subject to conversion rights by either the company or SWM. In addition, SWM has the right to redeem thethe shares for cash. In the ordinary course of events, the company cannot exercise its conversion rights prior to the release date of SWM's interim results for the half year ending 31 December 2013 and SWM cannot initiate a conversion or redemption before 21 April 2016. The shares rank ahead of the SWM ordinary shares on liquidation and have no dividend rights. The price at which the shares convert into SWM ordinary shares or are redeemed for cash is dependent on the party exercising its rights. The conversion value of the convertible preference shares is adjusted by 7.143% per annum (compounded on a semi-annual basis) for the first 5 years and thereafter by 9.143% per annum until the shares are either converted or redeemed.
14. PROPERTY, PLANT AND EQUIPMENT
2012 2011
$’000 $’000Freehold land and buildings at cost 59,544 58,452
Accumulated depreciation (5,652) (5,056)
Carrying amount 53,892 53,396 Leasehold improvements at cost 61,965 21,088
Accumulated amortisation (14,790) (12,192)
Carrying amount 47,175 8,896 Plant and equipment at cost 409,742 367,107
Accumulated depreciation (218,677) (164,864)
Carrying amount 191,065 202,243 Leased plant and equipment at cost 1,952 862
Accumulated depreciation (826) (469)
Carrying amount 1,126 393 Total property, plant and equipment at cost 533,203 447,509 Accumulated depreciation and amortisation (239,945) (182,581) Carrying amount at end of the year 293,258 264,928

Annual Report 2012 87
Notes to the Consolidated Financial Statements Financial Report for the year ended 30 June 2012
14. PROPERTY, PLANT AND EQUIPMENT (CONTINUED)
2012 2011
$’000 $’000
RECONCILIATIONSReconciliations of the carrying amounts for each class of property,
plant and equipment:
Freehold land and buildingsFreehold land and buildings at cost 58,452 57,788
Accumulated depreciation (5,056) (4,139)
Carrying amount at beginning of the year 53,396 53,649 Additions through acquisition of controlled entities 800 441
Additions - 2,044
Depreciation (596) (917)
Exchange differences 292 (1,821)
Carrying amount at end of the year 53,892 53,396
Leasehold improvementsFreehold leasehold properties at cost 21,088 16,915
Accumulated depreciation (12,192) (9,502)
Carrying amount at beginning of the year 8,896 7,413 Additions through acquisition of controlled entities 560 361
Additions 40,627 4,300
Depreciation (2,598) (2,690)
Exchange differences (310) (488)
Carrying amount at end of the year 47,175 8,896
Plant and equipmentPlant and equipment at cost 367,107 295,619
Accumulated depreciation (164,864) (116,345)
Carrying amount at beginning of the year 202,243 179,274 Additions through acquisition of controlled entities 1,190 3,168
Additions 40,140 54,604
Disposals (9,587) (1,208)
Disposal of business (35,016) -
Depreciation (53,813) (48,519)
Exchange differences 1,807 (6,082)
Net transfer from inventory 44,101 21,006
Carrying amount at end of the year 191,065 202,243
Leased plant and equipmentLeased plant and equipment at cost 862 813
Accumulated depreciation (469) (55)
Carrying amount at beginning of the year 393 758 Additions 1,087 49
Depreciation (357) (414)
Exchange differences 3 -
Carrying amount at end of the year 1,126 393

88 Seven Group Holdings Limited (ABN 46 142 003 469)
Notes to the Consolidated Financial Statements Financial Report for the year ended 30 June 2012
15. INTANGIBLE ASSETS
2012 2011
$’000 $’000Distribution network - at cost 674,754 367,508
Accumulated amortisation - -
Carrying amount 674,754 367,508
Intellectual property - at cost 8,317 5,202
Accumulated amortisation (5,220) (1,828)
Carrying amount 3,097 3,374
Customer contracts - at cost 10,875 10,696
Accumulated amortisation (5,942) (4,470)
Carrying amount 4,933 6,226
Goodwill - at cost 62,473 63,640
Accumulated amortisation - -
Carrying amount 62,473 63,640
Spectrum licences - at cost - 75,000
Accumulated amortisation - (14,531)
Carrying amount - 60,469
Software - at cost 6,526 27,008
Accumulated amortisation (5,778) (5,112)
Carrying amount 748 21,896
Brand names - at cost 3,120 3,120
Accumulated amortisation - -
Carrying amount 3,120 3,120
Total intangible assets 749,125 526,233

Annual Report 2012 89
Notes to the Consolidated Financial Statements Financial Report for the year ended 30 June 2012
15. INTANGIBLE ASSETS (CONTINUED)
Distribution Intellectual Customer Spectrum
network property contracts Goodwill licences Other (b) Total
YEAR ENDED 30 JUNE 2012 $’000 $’000 $’000 $’000 $’000 $’000 $’000
MOVEMENT IN INTANGIBLE ASSETSCarrying amount at beginning of year 367,508 3,374 6,226 63,640 60,469 25,016 526,233
Acquisitions from business combination 289,951 - - - - - 289,951
Additions - 2,605 - - 100 449 3,154
Other (a) - - - (1,167) - (21,257) (22,424)
Amortisation - (3,392) (1,472) - (13,802) (666) (19,332)
Disposal of business - - - - (46,767) - (46,767)
Exchange differences 17,295 510 179 - - 326 18,310
Carrying amount at end of year 674,754 3,097 4,933 62,473 - 3,868 749,125
Distribution Intellectual Customer Spectrum
network property contracts Goodwill licences Other (b) Total
YEAR ENDED 30 JUNE 2011 $’000 $’000 $’000 $’000 $’000 $’000 $’000
MOVEMENT IN INTANGIBLE ASSETSCarrying amount at beginning of year 450,706 3,688 6,669 30,403 73,207 12,678 577,351
Acquisitions from business combination - - 2,315 33,445 - 3,120 38,880
Additions - 441 - - - 10,122 10,563
Amortisation - (755) (1,620) - (12,738) (117) (15,230)
Exchange differences (83,198) - (1,138) (208) - (787) (85,331)
Carrying amount at end of year 367,508 3,374 6,226 63,640 60,469 25,016 526,233
(a) relates to the expensing of software costs during the year, these are included in other expenses in the Consolidated Income Statement.
(b) relates to software and brand names.

90 Seven Group Holdings Limited (ABN 46 142 003 469)
Notes to the Consolidated Financial Statements Financial Report for the year ended 30 June 2012
15. INTANGIBLE ASSETS (CONTINUED)
(a) Impairment tests for goodwill and distribution networkGoodwill and distribution network costs are allocated to the Group’s cash generating units (CGUs) identified according to the appropriate operating segment. Allocation is made within the individual operating subsidiaries of the Group.
A segment level summary of the goodwill and distribution network allocation is presented below.
WesTrac WesTrac AllightAustralia China Sykes Total
YEAR ENDED 30 JUNE 2012 $’000 $’000 $’000 $’000
Goodwill 16,678 - 45,795 62,473
Distribution network 335,830 338,924 - 674,754
352,508 338,924 45,795 737,227
WesTrac WesTrac AllightAustralia China Sykes Total
YEAR ENDED 30 JUNE 2011 $’000 $’000 $’000 $’000
Goodwill 17,845 - 45,795 63,640
Distribution network 45,714 321,794 - 367,508
63,559 321,794 45,795 431,148
The recoverable amount of a CGU is determined based on the higher of "value-in-use" or "fair value less costs to sell" calculations. These recoverable amount calculations use discounted cash flow projections based on financial budgets and forecasts approved by management. Cash flow projections utilised for value in use calculations are based on financial budgets and cover a five year period. Cash flow projections utilised for fair value less costs to sell calculations are based on financial budgets and projections and cover afifteen year period which is consistent with recent independent valuation methodologies.
Cash flows in the financial budgets and projections are extrapolated using the estimated growth rates stated below. The growth ratedoes not exceed the long term average growth for the business in which the CGU operates.
(b) Key assumptions used for "value-in-use" and "fair value less costs to sell" calculations
2012 2012 2011 2011Growth Discount rate Growth Discount rate
rate* (post-tax)** rate* (post-tax)**
CGU % % % %
Value-in-use
Caterpillar distribution network - Australia 3.0 11.0 4.0 11.0
National Hire - AllightSykes 2.5 11.0 2.5 11.9
Fair value less cost to sellCaterpillar distribution network - China*** 4.0 11.5 4.0 11.5
* - the weighted average growth rate used to extrapolate cash flows beyond the budget or forecast period.** - the discount rates used reflect specific risks relating to the relevant segments and the countries in which they operate.*** - key drivers of the forecast include general growth in WesTrac China's markets, an expansion of product lines and continued
continued investment in new facilities. The growth rate of 4% represents the terminal growth rate after 15 years. The growth rate assumed for the period prior to 15 years is based on budgets and forecasts up to 2017 and then extrapolated based on forecast growth consistent with growth forecasts for the region. This percentage growth forecasts are based on the latest economic forecasts for China and do not exceed the growth forecasts for the region.
The recoverable amount calculations for the goodwill and indefinite life intangible assets are most sensitive to changes in growth rateand EBIT margin on sales. Based on sensitivity analysis performed no reasonable change in these assumptions would give rise to an impairment.

Annual Report 2012 91
Notes to the Consolidated Financial Statements Financial Report for the year ended 30 June 2012
16. TRADE AND OTHER PAYABLES
2012 2011
$’000 $’000
CURRENTTrade payables 458,161 392,132
Other payables 104,298 55,851
Accruals 53,092 48,110
615,551 496,093
NON-CURRENTTrade payables and accruals 170 8,477
170 8,477
The Company has entered into a Deed of Cross Guarantee with certain subsidiaries as described in Note 25. Under the terms of the Deed, the Company has guaranteed the repayment of all current and future creditors in the event that any of the entities party to the Deed are wound up. Details of the consolidated financial position of the Company and subsidiaries party to the Deed are set out in Note 25.
The Group’s exposure to currency and liquidity risk related to trade and other payables is disclosed in Note 35.
17. INTEREST BEARING LOANS AND BORROWINGS
2012 2011
$’000 $’000
CURRENTInterest bearing liabilities 283,985 340,902
Bank overdrafts used for cash management purposes - 5,901
Finance lease liabilities (refer Note 24) 647 330
284,632 347,133
NON-CURRENTInterest bearing liabilities 942,004 155,977
Finance lease liabilities (refer Note 24) 770 1,736
Fixed term US Private Placement notes 627,770 405,066
Less: capitalised borrowing costs net of accumulated amortisation (8,745) (1,655)
1,561,799 561,124
The current interest bearing liabilities of $283,985,000 (2011: $340,902,000) relate to the Group's working capital facilities. Theseliabilities are drawn from rolling short dated facilities within Australia ($90,885,000 (2011: $148,892,000)) and China ($193,100,000(2011: $192,010,000)) and are generally reviewed annually. Of the amount drawn within Australia, $19,300,000 (2011: $35,700,000) issecured against inventory and receivables with the remaining balance being unsecured. The balance drawn from loan facilities locatedin China is unsecured.
Interest bearing loans and liabilities have a weighted average interest rate of 7.40% (2011: 7.68%) and are generally reviewed annually.
At 30 June 2012, the total available borrowing facilities included undrawn loan facilities of $734,336,000 (2011: $466,694,000) and lease and multi-purpose facilities of $85,000,000 (2011: $55,700,000). The Group also had access to unutilised short dated lines of credit totalling $191,900,000 (2011: $176,300,000).

92 Seven Group Holdings Limited (ABN 46 142 003 469)
Notes to the Consolidated Financial Statements Financial Report for the year ended 30 June 2012
17. INTEREST BEARING LOANS AND BORROWINGS (CONTINUED)
Interest bearing liabilitiesDuring the year, the Group renegotiated its corporate syndicated loan facility to $750,000,000 (2011: $498,000,000) with a syndicate ofbanks. This facility is unsecured and supported by guarantees by the Company and various subsidiaries within the Group. This facility isnon-amortising and matures in 2016.
In June 2012, the Group also entered into an unsecured non-amortising five year term loan of $431,000,000 in relation to the Bucyrus acquisition.
Lease liabilities are effectively secured as the rights to the assets revert to the financier in the event of default.
Details of the fair values of each of the borrowings as well as the Group's exposure to interest rate, foreign currency and liquidity riskrelated to interest bearing loans and borrowings is disclosed in Note 35.
Unsecured fixed term US Private Placement NotesThe Group has issued notes denominated in US currency of USD $590,000,000 (2011: USD $435,000,000). These borrowings are hedgedby a combination of forward foreign exchange and cross currency swaps. Series E (2011) USD $50,000,000 was issued and are repayablein AUD. Interest is payable half yearly in arrears and the amount and maturity of the notes, including the effective hedge position, are summarised as follows:
YEAR ENDED 30 JUNE 2012 Amount Spot amount Hedged amount Interest rate
USD AUD AUD (incl. margin) Maturity
Notes Agreement $'000 $'000 $'000 % date
Series D 1999 15,000 14,719 22,628 7.87% 18-Jun-14
Series A 2006 55,000 53,969 72,368 7.40% 23-Aug-13
Series B 2006 75,000 73,594 99,088 7.48% 23-Aug-16
Series C 2006 55,000 53,969 72,598 7.50% 23-Aug-18
Series D 2006 30,000 29,438 39,282 7.53% 23-Aug-20
Series E 2006 85,000 83,407 112,241 7.56% 23-Aug-21
Series A 2011 45,000 44,157 43,838 6.46% 07-Jun-23
Series B 2011 55,000 53,969 53,580 6.40% 07-Jul-23
Series C 2011 75,000 73,594 73,064 6.49% 07-Jun-26
Series D 2011 100,000 98,126 97,418 6.46% 07-Jul-26
Series E 2011 50,000 48,828 48,828 7.96% 07-Jul-41
640,000 627,770 734,933
YEAR ENDED 30 JUNE 2011 Amount Spot amount Hedged amount Interest rate
USD AUD AUD (incl. margin) Maturity
Notes Agreement $'000 $'000 $'000 % date
Series D 1999 15,000 13,968 22,628 7.87% 18-Jun-14
Series A 2006 55,000 51,215 72,368 7.40% 23-Aug-13
Series B 2006 75,000 69,839 99,088 7.48% 23-Aug-16
Series C 2006 55,000 51,215 72,598 7.50% 23-Aug-18
Series D 2006 30,000 27,936 39,282 7.53% 23-Aug-20
Series E 2006 85,000 79,151 112,241 7.56% 23-Aug-21
Series A 2011 45,000 41,903 43,838 7.07% 07-Jun-23
Series C 2011 75,000 69,839 73,064 7.12% 07-Jun-26
435,000 405,066 535,107
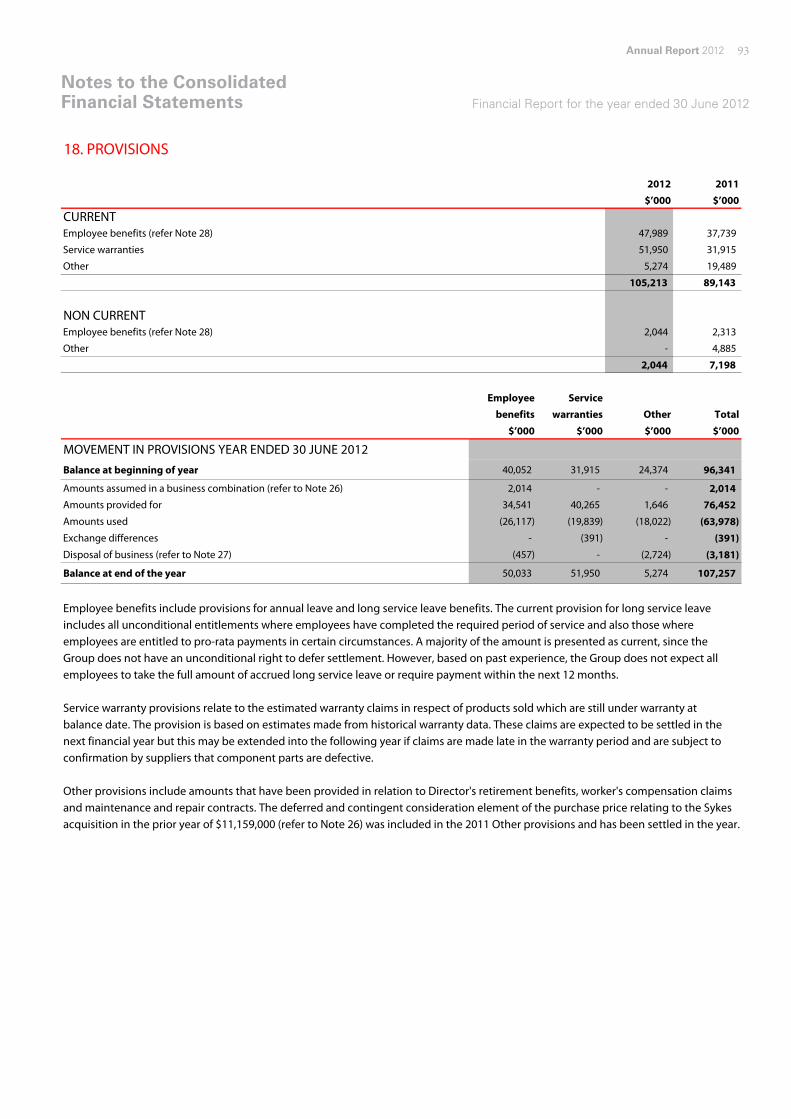
Annual Report 2012 93
Notes to the Consolidated Financial Statements Financial Report for the year ended 30 June 2012
18. PROVISIONS
2012 2011$’000 $’000
CURRENTEmployee benefits (refer Note 28) 47,989 37,739
Service warranties 51,950 31,915
Other 5,274 19,489
105,213 89,143
NON CURRENTEmployee benefits (refer Note 28) 2,044 2,313
Other - 4,885
2,044 7,198
Employee Servicebenefits warranties Other Total
$’000 $’000 $’000 $’000
MOVEMENT IN PROVISIONS YEAR ENDED 30 JUNE 2012Balance at beginning of year 40,052 31,915 24,374 96,341
Amounts assumed in a business combination (refer to Note 26) 2,014 - - 2,014 Amounts provided for 34,541 40,265 1,646 76,452 Amounts used (26,117) (19,839) (18,022) (63,978) Exchange differences - (391) - (391) Disposal of business (refer to Note 27) (457) - (2,724) (3,181)
Balance at end of the year 50,033 51,950 5,274 107,257
Employee benefits include provisions for annual leave and long service leave benefits. The current provision for long service leave includes all unconditional entitlements where employees have completed the required period of service and also those where employees are entitled to pro-rata payments in certain circumstances. A majority of the amount is presented as current, since the Group does not have an unconditional right to defer settlement. However, based on past experience, the Group does not expect all employees to take the full amount of accrued long service leave or require payment within the next 12 months.
Service warranty provisions relate to the estimated warranty claims in respect of products sold which are still under warranty at balance date. The provision is based on estimates made from historical warranty data. These claims are expected to be settled in the next financial year but this may be extended into the following year if claims are made late in the warranty period and are subject to confirmation by suppliers that component parts are defective.
Other provisions include amounts that have been provided in relation to Director's retirement benefits, worker's compensation claims and maintenance and repair contracts. The deferred and contingent consideration element of the purchase price relating to the Sykesacquisition in the prior year of $11,159,000 (refer to Note 26) was included in the 2011 Other provisions and has been settled in the year.

94 Seven Group Holdings Limited (ABN 46 142 003 469)
Notes to the Consolidated Financial Statements Financial Report for the year ended 30 June 2012
19. DEFERRED INCOME
2012 2011
$’000 $’000
CURRENTMaintenance and repair contracts 13,535 34,094
Customer deposits 92,368 75,449
Other deferred income 2,415 3,827
108,318 113,370
NON-CURRENTDeferred government grant 10,056 10,861
Other deferred income 7,321 7,321
17,377 18,182
The deferred government grant balance includes the original grant to build training centres in NSW and WA and accumulated interest as per the terms and conditions of the funding agreement. The terms and conditions of the funding agreement impose an obligation for the training centres in NSW and WA to be used for their intended purpose until 1 January 2020.

Annual Report 2012 95
Notes to the Consolidated Financial Statements Financial Report for the year ended 30 June 2012
20. CONTRIBUTED EQUITY
2012 2011
$’000 $’000
SHARE CAPITAL307,410,281 ordinary shares, fully paid (2011: 306,410,281) 2,196,937 2,188,687
4,963,640 TELYS4 preference shares, fully paid (2011: 4,963,640) 427,165 427,165
Balance at end of the year 2,624,102 2,615,852
MOVEMENTS IN ORDINARY SHARESBalance at 30 June 2011 (306,410,281 shares)/30 June 2010 (305,410,281 shares) 2,188,687 2,181,687
Shares issued on exercise of options - 21 April 2011 (500,000 shares) - 3,500
Shares issued on exercise of options - 13 May 2011 (500,000 shares) - 3,500
Shares issued on exercise of options - 2 March 2012 (500,000 shares) 3,750 -
Shares issued on exercise of options - 16 March 2012 (500,000 shares) 4,500 -
Balance at end of the year 2,196,937 2,188,687
The company does not have authorised share capital or par value in respect of its issued shares. All issued shares are fully paid.
Holders of ordinary shares are entitled to receive dividends as declared from time to time and are entitled to one vote per share at shareholders’ meetings. In the event of winding up of the Company, ordinary shareholders rank after creditors and preference shareholders and are fully entitled to any proceeds on liquidation.
MOVEMENTS IN PREFERENCE SHARES 2012 2011
Transferable Extendable Listed Yield Shares – TELYS4 $’000 $’000
Balance at 1 July 427,165 427,165
Balance at end of the year 427,165 427,165
TELYS4 were issued on 13 May 2010 under the TELYS4 Offer Prospectus on a one for one exchange for all TELYS3 previously issued by Seven Network Limited.
Holders are entitled to a preferential non-cumulative floating rate dividend, which is based on Bank Bill Swap Rate for 180 days plus Margin. The Margin is set at 4.75% subject to the Company’s right of Conversion and Exchange. There are no voting rights attached except in limited circumstances, in which case holders will have one vote per TELYS4 held.
2012 2011
Number Number
OPTIONS ON ORDINARY SHARESAs at reporting date the number of options exercisable into ordinary shares was as follows:
Options to Directors 4,000,000 4,000,000
Options to other Executives 250,000 1,775,000
4,250,000 5,775,000
Details on the above options issued by the Group are detailed in the Directors Report and Note 30.

96 Seven Group Holdings Limited (ABN 46 142 003 469)
Notes to the Consolidated Financial Statements Financial Report for the year ended 30 June 2012
21. RESERVES
Employee Foreign
equity Common Cash flow Fair currency
Acquisitions benefits control hedge value translation
reserve reserve reserve reserve reserve reserve Total
YEAR ENDED 30 JUNE 2012 $’000 $’000 $’000 $’000 $’000 $’000 $’000
As at 1 July 2011 - 7,786 (642,586) (12,088) 55,752 (123,671) (714,807) Fair value movement on available-for-sale - - - - 4,552 - 4,552
financial assets
Tax effect of net gain on available-for-sale - - - - (5,841) - (5,841)
financial assets
Net gain on cash flow hedges - - - 38,286 - - 38,286
Tax effect of net gain on cash flow hedges - - - (9,962) - - (9,962)
Movement in reserves of associates - 1,963 - - - - 1,963
Currency translation differences - - - - - 38,749 38,749
Acquisition of non-controlling interests (46,846) - - - - - (46,846)
Tax effect relating to acquisition (16,609) - - - - - (16,609)
of non-controlling interests
Share based payment expense - 395 - - - - 395
At 30 June 2012 (63,455) 10,144 (642,586) 16,236 54,463 (84,922) (710,120)
Employee Foreign
equity Common Cash flow Fair currency
Acquisitions benefits control hedge value translation
reserve reserve reserve reserve reserve reserve Total
YEAR ENDED 30 JUNE 2011 $’000 $’000 $’000 $’000 $’000 $’000 $’000
As at 1 July 2010 - 5,334 (642,586) 6,570 16,817 39,365 (574,500) Fair value movement on available-for-sale - - - - 27,304 - 27,304
financial assets
Tax effect of net gain on available-for-sale - - - - 8,721 - 8,721
financial assets
Impairment of available-for-sale financial - - - - 2,910 - 2,910
asset reclassified to profit or loss
Net loss on cash flow hedges - - - (20,997) - - (20,997)
Tax effect of net loss on cash flow hedges - - - 3,502 - - 3,502
Movement in reserves of associates - 734 - (1,163) - - (429)
Currency translation differences - - - - - (163,036) (163,036)
Share based payment expense - 1,718 - - - - 1,718
At 30 June 2011 - 7,786 (642,586) (12,088) 55,752 (123,671) (714,807)
NATURE AND PURPOSE OF RESERVESAcquisitions reserveThis reserve is used to record the difference between the fair value of consideration paid for the non-controlling interest of subsidiaries, and the book value of those subsidiaries' share of net assets at date of acquisition.
Employee equity benefits reservesThis reserve is used to record the value of equity benefits provided to employees and Directors as part of their remuneration.
Common control reserveThe acquisition of WesTrac Group by the Company during the period ended 30 June 2010 was accounted for as a common controltransaction. As a consequence, the difference between the fair value of the consideration paid and the existing book values of assetsand liabilities of the WesTrac Group were debited to a common control reserve. Upon disposal of all interests in WesTrac Group bythe Group this reserve would be transferred to retained earnings.

Annual Report 2012 97
Notes to the Consolidated Financial Statements Financial Report for the year ended 30 June 2012
21. RESERVES (CONTINUED)
Cash flow hedge reserveThis reserve records the effective portion of the cumulative net change in fair value of hedging instruments related to cash flowhedged transactions that have not yet occurred.
Fair value reserveThe fair value reserve comprises the cumulative net change in the fair value of available-for-sale financial assets until the investments are derecognised or impaired.
Foreign currency translation reserveThis reserve records the foreign currency differences arising from the translation of the financial statements of foreign operations.
22. RETAINED EARNINGS
2012 2011Note $’000 $’000
Retained earnings at beginning of the year 632,287 706,045
Net profit attributable to members of the Company 165,933 70,412
Dividends paid 5 (143,697) (144,170)
Retained earnings at end of the year 654,523 632,287
23. CONTINGENCIES
2012 2011
$’000 $’000
Contingent liabilities
Performance guarantees (a) 22,146 18,326
Financial guarantees (b) 74,803 85,226
96,949 103,552
(a) Performance guarantees relate to guarantees provided to customers in support of equipment performance.
(b) The Group has issued a number of financial guarantees to third parties for various operational and financing purposes. Any claim against these
guarantees would be reduced by the value of the land, buildings and equipment to which these guarantees relate. To the extent that the Directors
expect these third party guarantees to be called upon, a provision has been recorded in the statement of financial position as at 30 June 2012.
The Group has entered into a number of financial guarantees in relation to subsidiary debt facilities. The drawn amount of these facilities are recorded as interest bearing liabilities in the statement of financial position and Note 17.
The nature of the Group's and equity accounted investees' activities are such that, from time to time, claims are received or made by theGroup. The Directors are of the opinion that no claims are expected to have a material adverse effect on the financial statements of the Group and as such do not require disclosure as a contingent liability.

98 Seven Group Holdings Limited (ABN 46 142 003 469)
Notes to the Consolidated Financial Statements Financial Report for the year ended 30 June 2012
24. COMMITMENTS
2012 2011
$’000 $’000
Capital expenditure commitments
Payable:
Not later than one year 23,131 23,261
Finance lease commitments
Payable:
Not later than one year 647 1,368
Later than one year but not later than five years 810 1,800
Later than five years - 1,685
Minimum lease payments (a) 1,457 4,853
Less future finance charges (40) (2,787)
1,417 2,066
Operating lease commitments (b)
Payable:
Not later than one year 65,655 48,353
Later than one year but not later than five years 208,592 199,673
Later than five years 205,197 237,900
479,444 485,926
Other operating commitments (c)
Payable:
Not later than one year - 6,710
Later than one year but not later than five years - 2,465
- 9,175
(a) Minimum future lease payments include the aggregate of all lease payments and any guaranteed residual value.
(b) The Group leases various offices and sites under non-cancellable operating leases. The leases have varying terms, escalation
clauses and renewal rights. On renewal, the terms of the leases are renegotiated.
(c) Other operating commitments includes commitments for operating expenses and acquisitions of inventory contracted for at the
reporting date but not recognised as liabilities.

Annual Report 2012 99
Notes to the Consolidated Financial Statements Financial Report for the year ended 30 June 2012
25. CONTROLLED ENTITIES
Country of 2012 2011Notes incorporation % %
PARENT ENTITYSeven Group Holdings Limited (a) Australia
SUBSIDIARIESAllight Holdings Pty Limited Australia 100 66Allight Pty Limited Australia 100 66AllightPrimax FZCO UAE 100 -AllightSykes SA (Proprietary) Limited South Africa 100 -Allight USA Inc USA 100 66ATPH Pty Limited Australia 100 100ATP1 Pty Limited Australia 100 100ATP2 Pty Limited Australia 100 100ATP3 Pty Limited Australia 100 100C7 Pty Limited (a) Australia 100 100Direct Target Access Pty Limited (a) Australia 100 100DWB Trust Australia 100 66EMT Group Pty Limited Australia 100 75Engin Pty Limited Australia 100 58FGW Pacific Pty Limited Australia 100 66Kimlin Holdings Pty Limited (a) Australia 100 100Liaoning WesTrac Machinery Equipment Limited China 100 100Manooka Holdings Pty Limited (a) Australia 100 100Mibroadband Pty Limited Australia 100 58Miltonstar Pty Limited (a) Australia 100 100Mining Equipment Spares Pty Limited Australia 100 75National Hire Group Limited Australia 100 66National Hire Facilitation Pty Limited Australia 100 66Network Investment Holdings Pty Limited (a) Australia 100 100Primax Pumps Inc USA 100 66Point Pty Limited (a) Australia 100 100Priority People Solutions Pty Ltd Australia 100 100PT. Sykesindo Indonesia 100 -Pump Rentals Pty Limited Australia 100 66Realtime Reporters Pty Limited (a) Australia 100 100Seven Broadcast Properties Trust Australia 100 100Seven Custodians Pty Limited (a) Australia 100 100Seven Entertainment Pty Limited (a) Australia 100 100Seven Finance Pty Limited Australia 100 100Seven Media Group Pty Limited (a)(b) Australia 100 100Seven (National) Pty Limited Australia 100 -Seven Network Limited (a) Australia 100 100Seven Network Asia Limited (d) Hong Kong - 100Seven Network International Limited (a) Australia 100 100Seven Productions Pty Limited (a) Australia 100 100Seven Resources Pty Limited (a) Australia 100 100Seven Network Nominees Pty Limited (a) Australia 100 100Seven (WAN) Pty Limited Australia 100 100
OWNERSHIPINTEREST

100 Seven Group Holdings Limited (ABN 46 142 003 469)
Notes to the Consolidated Financial Statements Financial Report for the year ended 30 June 2012
25. CONTROLLED ENTITIES (CONTINUED)
Country of 2012 2011Notes incorporation % %
Seven Network Investments Pty Limited (a) Australia 100 100Seven Network (United States) Inc USA 100 100Sitech Solutions Pty Limited Australia 51 51Sitech (WA) Pty Limited Australia 51 51Sitech (Beijing) Engineering Technology Development Company Limited China 51 51SMG FINCO Pty Limited (a)(b) Australia 100 100SMG Executives Pty Limited Australia 100 100SNZ Pty Limited (a) Australia 100 100Sykes Group Pty Limited Australia 100 66Sykes New Zealand Limited New Zealand 100 66Sykes Fleet Services Pty Limited Australia 100 66Tianjin WesTrac Machinery Equipment Limited China 100 100Tallglen Pty Limited (a) Australia 100 100Weishan (Beijing) Machinery Equipment Pty Limited China 100 100WesTrac (Beijing) Machinery Equipment Limited China 100 100WesTrac China Limited Hong Kong 100 100WesTrac (China) Machinery Equipment Limited China 100 100WesTrac Pty Limited Australia 100 100WesTrac Fleet Pty Limited Australia 100 100WesTrac Holdings Pty Limited (a) Australia 100 100WesTrac Hong Kong Limited Hong Kong 100 100WesTrac Inventory Pty Limited Australia 100 100WesTrac Machinery Distribution Pty Limited Australia 100 -Vividwireless Group Limited (c) Australia - 100Vividwireless Pty Limited (c) Australia - 100Ubowireless Pty Limited (c) Australia - 100Unwired Australia Pty Limited (c) Australia - 100AKAL Pty Limited (c) Australia - 100BKAL Pty Limited (c) Australia - 100
(a) These controlled entities entered into the Deed of Cross Guarantee with the Company on 24 June 2010 under ASIC Class Order 98/1418 (as amended)
dated 13 August 1998.
(b) These controlled entities entered into a Deed of Cross Guarantee with the Company on 13 May 2011.
(c) Entity sold to Optus Mobile Pty Ltd as part of vividwireless Group Limited disposal on 19 June 2012.
(d) Entity deregistered on 11 May 2012.
DEED OF CROSS GUARANTEEPursuant to ASIC Class Order 98/1418 the wholly-owned controlled entities listed above (marked (a)) are relieved from the Corporations Act 2001 requirements for preparation, audit and lodgement of financial reports and Directors’ reports.
It is a condition of the Class Order that the Company and each of the wholly owned controlled entities (marked (a)) enter into a Deed of Cross Guarantee. The effect of the Deed is that the Company guarantees to each creditor payment in full of any debt in the event of winding up of any of the parties to the deed under certain provisions of the Corporations Act 2001. If a winding up occurs under other provisions of the Corporations Act 2001, the Company will only be liable in the event that after six months any creditor has not been paid in full. The subsidiaries have also given similar guarantees in the event that the Company is wound up.
OWNERSHIPINTEREST

Annual Report 2012 101
Notes to the Consolidated Financial Statements Financial Report for the year ended 30 June 2012
25. CONTROLLED ENTITIES (CONTINUED)DEED OF CROSS GUARANTEE (CONTINUED)
A consolidated statement of comprehensive income and consolidated statement of financial position, comprising the Company and controlled entities which are a party to the Deed, after eliminating all transactions between parties to the Deed of Cross Guarantee, for the years ended 30 June 2012 and 30 June 2011 are set out below.
2012 2011$’000 $’000
STATEMENT OF COMPREHENSIVE INCOMEOther incomeOther income 991 10,540
Dividend income 44,727 74,372
Total other income 45,718 84,912 Share of results from equity accounted investees 92,739 118,670
Net gain on sale of investments and equity accounted investees 7,785 58,679
Net gain on sale of subsidiary 129,786 -
Impairment of equity accounted investees (416,890) (305,648)
Fair value movement of derivatives & other financial assets (59,893) 5,649
Expenses excluding depreciation and amortisationImpairment of investments in controlled entities not consolidated - (25,493)
Impairment of non-current assets (300) (4,620)
Other expenses (34,772) (37,144)
Total expenses excluding depreciation and amortisation (35,072) (67,257) Depreciation and amortisation (259) (221)
Loss before net finance costs and tax (236,086) (105,216) Net finance costs (33,185) (4,325)
Loss before tax (269,271) (109,541) Income tax benefit 146,047 174,556
(Loss)/profit for the year (123,224) 65,015 Other comprehensive incomeNet change in fair value of available-for-sale financial assets 79,364 (33,877)
Income tax on items of other comprehensive income (23,809) 10,163
Other comprehensive income/(expense) for the year, net of tax 55,555 (23,714) Total comprehensive income/(expense) for the year (67,669) 41,301
MOVEMENT IN RETAINED EARNINGSRetained profits at beginning of the year 600,192 679,347
(Loss)/profit for the year (123,224) 65,015
Dividends paid during the year (143,697) (144,170)
Retained profits at end of the year 333,271 600,192

102 Seven Group Holdings Limited (ABN 46 142 003 469)
Notes to the Consolidated Financial Statements Financial Report for the year ended 30 June 2012
25. CONTROLLED ENTITIES (CONTINUED)DEED OF CROSS GUARANTEE (CONTINUED)
2012 2011$’000 $’000
STATEMENT OF FINANCIAL POSITION
CURRENT ASSETS
Cash and cash equivalents 40,130 15,051
Trade and other receivables 691 7,314
Current tax assets - 13,123
Loans to related parties 3,698 165,655
Total current assets 44,519 201,143
NON-CURRENT ASSETS
Investments in controlled entities 1,434,872 824,929
Trade and other receivables 41,731 -
Investments accounted for using the equity method 870,236 1,135,410
Other financial assets 670,817 652,286
Property, plant and equipment 41,367 41,222
Total non-current assets 3,059,023 2,653,847
Total assets 3,103,542 2,854,990
CURRENT LIABILITIES
Trade and other payables 51,990 51,502
Loans from related parties 73,507 214,684
Current tax liabilities 90,752 -
Derivative financial instruments - 10,509
Total current liabilities 216,249 276,695
NON-CURRENT LIABILITIESInterest bearing loans and liabilities 771,773 145,000
Deferred tax liabilities 172,289 295,950
Derivative financial instruments - 2,446
Provisions 7,265 1,218
Deferred income 7,321 7,321
Total non-current liabilities 958,648 451,935
Total liabilities 1,174,897 728,630
Net assets 1,928,645 2,126,360
EQUITY
Issued capital 2,624,103 2,615,852
Reserves (1,028,729) (1,089,684)
Retained earnings 333,271 600,192
Total equity 1,928,645 2,126,360

Annual Report 2012 103
Notes to the Consolidated Financial Statements Financial Report for the year ended 30 June 2012
26. ACQUISITIONS OF CONTROLLED ENTITIES
ACQUISITIONSAcquisition of BucyrusOn 1 June 2012, the Group acquired the core business operations and assets in Western Australia, Australian Capital Territory andNew South Wales from the Australian Bucyrus Group of entities owned by Caterpillar Global Mining LLC for $410,461,000. No legalentity or share capital was acquired. Bucyrus is a world leader in the design and manufacture of high productivity miningequipment for the surface and underground mining industries. In addition to machine manufacturing, Bucyrus manufacturesparts and provides support services for their machines.
The acquisition has significantly increased the Group's market share in the mining equipment industry and complements the Group'sexisting mining equipment and product support range.
The acquired business contributed revenues of $11,000,000 and a net loss of $1,600,000 to the Group for the period from 1 June2012 to 30 June 2012. Due to the nature of the acquisition, the Group has not been, and will be unable to accurately determinewhat the Bucyrus business would have contributed to revenue and profit for the full year.
Given the timing of the acquisition, the details of the purchase consideration, the net assets acquired and goodwill have not beenfinalised and are provisional as follows:
2012
Consideration $’000Cash paid 410,461
Total consideration 410,461
2012
Identifiable assets acquired and liabilities assumed $’000
Inventories 98,521
Plant and equipment 2,550
Distribution network 289,951
Receivables 21,453
Provision for employee benefits (2,014)
Provisional fair value of net identifiable assets 410,461
2012
Goodwill on acquisition $’000Total consideration transferred for accounting purposes at fair value 410,461
Provisional fair value of identifiable net assets (410,461)
Goodwill on acquisition -
ACQUISITION COSTSAcquisition related costs of $15,600,000 are included in other expenses in the Consolidated Income Statement, thesepredominantly relate to stamp duty.
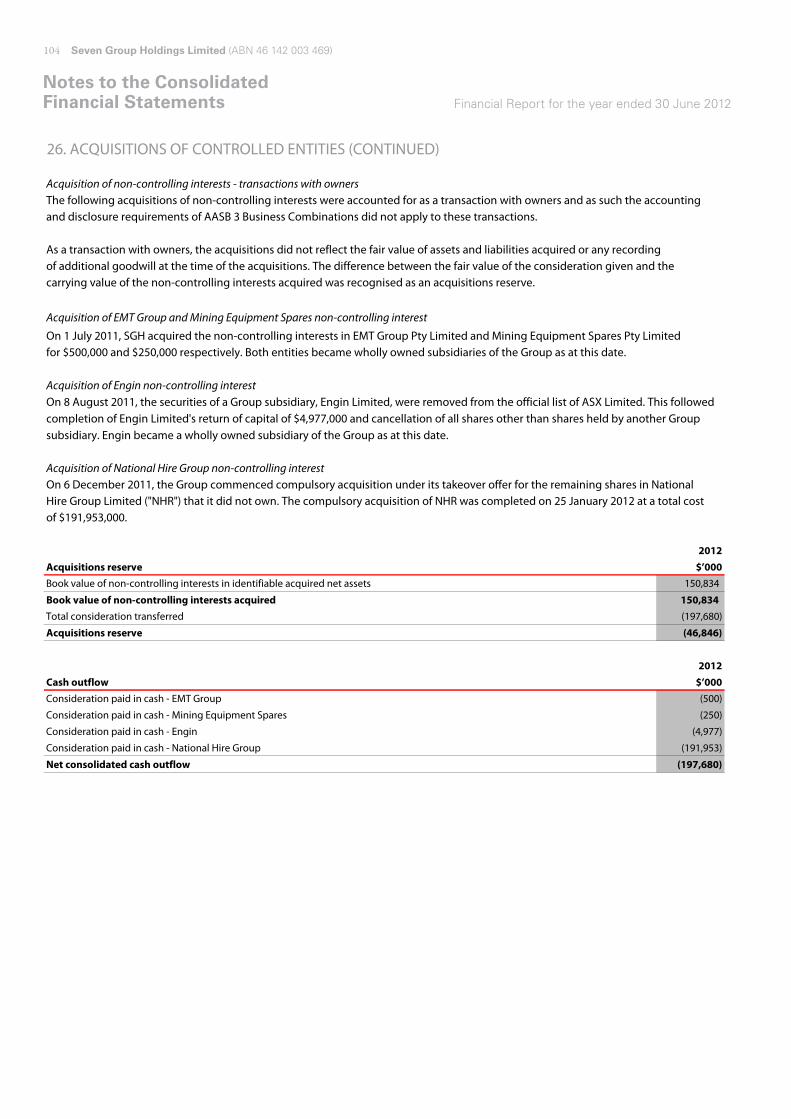
104 Seven Group Holdings Limited (ABN 46 142 003 469)
Notes to the Consolidated Financial Statements Financial Report for the year ended 30 June 2012
26. ACQUISITIONS OF CONTROLLED ENTITIES (CONTINUED)
Acquisition of non-controlling interests - transactions with ownersThe following acquisitions of non-controlling interests were accounted for as a transaction with owners and as such the accountingand disclosure requirements of AASB 3 Business Combinations did not apply to these transactions.
As a transaction with owners, the acquisitions did not reflect the fair value of assets and liabilities acquired or any recording of additional goodwill at the time of the acquisitions. The difference between the fair value of the consideration given and thecarrying value of the non-controlling interests acquired was recognised as an acquisitions reserve.
Acquisition of EMT Group and Mining Equipment Spares non-controlling interest
On 1 July 2011, SGH acquired the non-controlling interests in EMT Group Pty Limited and Mining Equipment Spares Pty Limitedfor $500,000 and $250,000 respectively. Both entities became wholly owned subsidiaries of the Group as at this date.
Acquisition of Engin non-controlling interestOn 8 August 2011, the securities of a Group subsidiary, Engin Limited, were removed from the official list of ASX Limited. This followedcompletion of Engin Limited's return of capital of $4,977,000 and cancellation of all shares other than shares held by another Groupsubsidiary. Engin became a wholly owned subsidiary of the Group as at this date.
Acquisition of National Hire Group non-controlling interestOn 6 December 2011, the Group commenced compulsory acquisition under its takeover offer for the remaining shares in National Hire Group Limited ("NHR") that it did not own. The compulsory acquisition of NHR was completed on 25 January 2012 at a total cost of $191,953,000.
2012Acquisitions reserve $’000Book value of non-controlling interests in identifiable acquired net assets 150,834
Book value of non-controlling interests acquired 150,834 Total consideration transferred (197,680)
Acquisitions reserve (46,846)
2012Cash outflow $’000Consideration paid in cash - EMT Group (500)
Consideration paid in cash - Mining Equipment Spares (250)
Consideration paid in cash - Engin (4,977)
Consideration paid in cash - National Hire Group (191,953)
Net consolidated cash outflow (197,680)

Annual Report 2012 105
Notes to the Consolidated Financial Statements Financial Report for the year ended 30 June 2012
26. ACQUISITIONS OF CONTROLLED ENTITIES (CONTINUED)
PRIOR YEAR ACQUISITIONSAcquisition of Sykes GroupOn 23 November 2010, Allight Holdings Pty Ltd, a wholly owned subsidiary of National Hire Group Limited, acquired 100% of the issued share capital of Pump Rentals Pty Ltd ("Sykes Group"). The Sykes Group is a major player in Australia's pump market and has extended its reach into major manufacturing and construction markets around the world. The Sykes Group specialise in design,manufacture and application of standard and custom built pumping equipment for some of the most challenging mining and construction environments in the world. The acquisition brings together a portfolio of world class light, power, air and water brands,which will underlie Allight's bid to capture an even bigger share of the world mining and construction markets.
The acquired business contributed revenues of $34,658,000 and net profit of $3,603,000 to the Group for the period from 25 November 2010 to 30 June 2011. If the acquisition had occurred on 1 July 2010, consolidated revenue of $55,994,000 and consolidated profit of $4,337,000 for the year ended 30 June 2011 would have been recognised. These amounts have been calculated using the Group's accounting policies and by adjusting the results of the subsidiary to reflect the additional depreciation and amortisation that would have been charged assuming the fair value adjustments to property, plant and equipment and intangible assets hadapplied from 1 July 2010, together with the consequential tax effects.
The following summarises the major classes of consideration transferred, and the recognised amounts of assets acquired and liabilities assumed at the acquisition date:
2011
Consideration $’000Cash paid 43,000
Overdraft acquired 1,093
Contingent consideration 11,159
Total consideration 55,252
2011
Identifiable assets acquired and liabilities assumed $’000
Trade receivables 7,163
Inventories 9,669
Deferred tax assets 628
Intangible assets 5,435
Plant and equipment 3,970
Trade payables (2,577)
Provision for employee benefits (1,668)
Unfavourable contracts (727)
Other current assets 165
Other current liabilities (251)
Fair value of net identifiable assets 21,807
2011Goodwill on acquisition $’000Total consideration transferred for accounting purposes at fair value 55,252
Fair value of identifiable net assets (21,807)
Goodwill on acquisition 33,445
The goodwill is attributable to Pump Rental Pty Ltd's strong position and profitability in trading in the pumps market and synergiesexpected to arise after the acquisition.

106 Seven Group Holdings Limited (ABN 46 142 003 469)
Notes to the Consolidated Financial Statements Financial Report for the year ended 30 June 2012
26. ACQUISITIONS OF CONTROLLED ENTITIES (CONTINUED)
PRIOR YEAR ACQUISITIONS (CONTINUED)Acquisition of Sykes Group (continued)
2011Cash flow $’000Bank overdraft acquired 1,093
Consideration paid in cash 43,000
Net consolidated cash flow 44,093
In the event that certain pre determined sales volumes were achieved by the business and legal releases occurring, an additional consideration of up to $12,000,000, which on a probability and discounted cash flow basis has been determined to be $11,159,000 willbe payable in cash. This $12,000,000 additional consideration was paid by the Group during the year ended 30 June 2012.
ACQUISITION COSTSAcquisition related costs of $1,976,000 are included in other expenses in the prior year's Consolidated Income Statement.
CONTINGENT CONSIDERATIONA total of $12,000,000 was paid by the Group during the year as deferred consideration upon the vendors finalising the transferout of the Sykes Group of certain assets that did not form part of the Sykes Group business, full and final releases ofthe Sykes Group for any liabilities relating to those assets being obtained and the satisfaction of certain EBIT hurdles.
27. DISPOSAL OF BUSINESSES
Sale of vividwireless Group LimitedOn 19 June 2012, the Group sold its interest in vividwireless Group Limited ("vividwireless") to Optus Mobile Pty Ltd ("Optus") for$230,000,0000. Under the terms of the sale, Optus has paid $170,000,000 in cash to the Group, with the remaining $60,000,000 to be paid on the re-issue of spectrum licences. Further information regarding the sale of vividwireless is available in the Company's pressrelease dated 19 June 2012.
The fair value of the $60,000,000 deferred consideration receivable on a probability and discounted cash flow basis has beendetermined to be $39,900,000 and will be received in cash once the Australian Communications and Media Authority (ACMA) re-issuesvividwireless' spectrum licences.
The Group has recognised a net gain on disposal of $129,786,000 and a tax expense of $38,936,000 in respect of the transaction.
2012
Consideration $’000
Cash received 170,000
Fair value of deferred consideration 39,900
Total consideration 209,900

Annual Report 2012 107
Notes to the Consolidated Financial Statements Financial Report for the year ended 30 June 2012
27. DISPOSAL OF BUSINESSES (CONTINUED)
Sale of vividwireless Group Limited (continued)
2012
Effect of disposal on the financial position of the Group $’000
Cash and cash equivalents (5,972)
Trade and other receivables (2,334)
Inventories (737)
Property, plant and equipment (35,016)
Intangible assets (46,767)
Deferred tax assets (1,754)
Trade and other payables 9,285
Provisions 3,181
Net assets disposed (80,114)
2012
Net gain on sale of subsidiary $’000Total consideration received for accounting purposes at fair value 209,900
Net assets disposed (80,114)
Net gain on sale of subsidiary 129,786
28. EMPLOYEE BENEFITS
2012 2011
$’000 $’000
Provisions - Current (refer note 18) 47,989 37,739
Provisions - Non-current (refer note 18) 2,044 2,313
50,033 40,052
Superannuation contributionsThe Group makes contributions on behalf of employees to a defined contribution superannuation fund. The amount recognised as an
expense was $34,174,000 for the year ended 30 June 2012 (2011: $27,161,000).

108 Seven Group Holdings Limited (ABN 46 142 003 469)
Notes to the Consolidated Financial Statements Financial Report for the year ended 30 June 2012
29. AUDITORS’ REMUNERATION
2012 2011
$’000 $’000
Amounts received or due and receivable by auditors of the Company for:
Audit servicesAuditors of the CompanyKPMG Australia
- Audit and review of financial reports 581 412
- Other assurance services 5 84
Overseas KPMG firms- Audit and review of financial report 109 119
Other auditors - Audit and review of financial reports 169 195
- Other assurance services - 283
864 1,093
Other servicesAuditors of the CompanyKPMG Australia
- Other advisory services 215 -
Overseas KPMG firms- Other tax and advisory services 14 41
Other auditors- Other tax and advisory services - 62
229 103
All amounts payable to the Auditors of the Company were paid by Group subsidiaries.
KPMG are only appointed to assignments additional to their statutory audit duties, where they are able to maintain their audit independence.

Annual Report 2012 109
Notes to the Consolidated Financial Statements Financial Report for the year ended 30 June 2012
30. DIRECTOR AND EXECUTIVE DISCLOSURES
Individual Directors' and Executives' compensation disclosuresInformation regarding individual Directors' and Executives' compensation and some equity instruments disclosures is required by Corporations Regulation 2M.3.03 and is provided in the Remuneration Report section of the Directors’ report.
No Director has entered into a material contract with the Group in the current or prior year other than those disclosed in this note.
Key Management Personnel Key management personnel comprise the Directors of the Company and the Chief Financial Officer of the Company. Andrew Harrisonwas appointed Chief Financial Officer on 9 November 2011, replacing Peter Lewis who ceased acting in the role on 8 November 2011.
Key Management Personnel compensation The aggregate compensation made to Directors and other Key Management Personnel of the Company and the Group is set out below:
2012 2011$ $
Short-term employee benefits 8,107,005 10,165,400
Other long-term employee benefits 22,039 22,039
Post-employment benefits 149,735 148,656
Share-based payments 1,014,281 2,190,094
9,293,060 12,526,189
Detailed remuneration disclosures are provided in the remuneration report section of the Directors' report.
Options over equity instruments granted as compensationMovements in the holdings of options by Specified Directors and Key Management Personnel during the period held directly, indirectly,beneficially and including their personally-related entities were as follows:
YEAR ENDED 30 JUNE 2012Vested and
Fair Held at Held at Vested exercisable
Vesting Expiry Exercise value of 30 June 30 June during the at 30 June
Grant date date date price option 2011 Exercised 2012 year 2012
Specified DirectorsExecutiveDJ Leckie 28-Apr-10 30-Jun-10 30-Jun-14 $7.00 $1.21 1,500,000 - 1,500,000 - 1,500,000
28-Apr-10 30-Jun-11 30-Jun-14 $8.00 $0.98 1,000,000 - 1,000,000 - 1,000,000
28-Apr-10 30-Jun-12 30-Jun-14 $9.00 $0.79 500,000 - 500,000 500,000 500,000
3,000,000 - 3,000,000 500,000 3,000,000
BI McWilliam (a)
28-Apr-10 30-Jun-11 30-Jun-14 $8.00 $0.98 500,000 - 500,000 - 500,000
28-Apr-10 30-Jun-12 30-Jun-14 $9.00 $0.79 500,000 - 500,000 500,000 500,000
1,000,000 - 1,000,000 500,000 1,000,000

110 Seven Group Holdings Limited (ABN 46 142 003 469)
Notes to the Consolidated Financial Statements Financial Report for the year ended 30 June 2012
30. DIRECTOR AND EXECUTIVE DISCLOSURES (CONTINUED)
YEAR ENDED 30 JUNE 2011Vested and
Fair Held at Held at Vested exercisable
Vesting Expiry Exercise value of 30 June 30 June during the at 30 June
Grant date date date price option 2010 Exercised 2011 year 2011
Specified DirectorsExecutiveDJ Leckie 28-Apr-10 30-Jun-10 30-Jun-14 $7.00 $1.21 1,500,000 - 1,500,000 1,500,000 1,500,000
28-Apr-10 30-Jun-11 30-Jun-14 $8.00 $0.98 1,000,000 - 1,000,000 1,000,000 1,000,000
28-Apr-10 30-Jun-12 30-Jun-14 $9.00 $0.79 500,000 - 500,000 - -
3,000,000 - 3,000,000 2,500,000 2,500,000
BI McWilliam (a)
28-Apr-10 30-Jun-10 30-Jun-14 $7.00 $1.21 1,000,000 1,000,000 - 1,000,000 -
28-Apr-10 30-Jun-11 30-Jun-14 $8.00 $0.98 500,000 - 500,000 500,000 500,000
28-Apr-10 30-Jun-12 30-Jun-14 $9.00 $0.79 500,000 - 500,000 - -
2,000,000 1,000,000 1,000,000 1,500,000 500,000
Key Management PersonnelP Lewis (b) 28-Apr-10 30-Jun-10 30-Jun-14 $7.00 $1.21 250,000 - 250,000 250,000 250,000
28-Apr-10 30-Jun-11 30-Jun-14 $8.00 $0.98 250,000 - 250,000 250,000 250,000
28-Apr-10 30-Jun-12 30-Jun-14 $9.00 $0.79 250,000 - 250,000 - -
750,000 - 750,000 500,000 500,000
Performance Rights granted as compensation relating to 2012 LTI PlanDuring the year, the Group offered certain specified Directors and KMP the opportunity to participate in the Group’s Long Term Incentive(LTI) Plan. The performance condition was based on the achievement of corporate financial performance targets over the 2012 financial year. The performance rights would vest on 1 October 2015, dependant on meeting certain EPS and TSR targets. However, as corporatefinancial performance targets were not met in the 2012 financial year, no awards were made.
Rights over equity instruments granted as compensation relating to 2011 PMPDuring the prior year, the Group offered certain specified Directors the opportunity to participate in the Group’s PerformanceManagement Plan (PMP). The performance condition was based on the achievement of corporate financial, operational and individualperformance targets over the 2011 financial year. These are disclosed in the Remuneration Report. Shares are acquired on market and held in trust on behalf of the participants. The rights to the shares vest in three annual tranches over the subsequent three yearservice period, and are forfeited if the participant leaves the Company’s employment prior to vesting. Participants have full beneficialownership of all shares granted, including dividend and voting rights.

Annual Report 2012 111
Notes to the Consolidated Financial Statements Financial Report for the year ended 30 June 2012
30. DIRECTOR AND EXECUTIVE DISCLOSURES (CONTINUED)
Rights over equity instruments granted as compensation relating to 2011 PMP (continued)Under the 2011 PMP, the following rights to ordinary shares in the Company were granted to the following Key ManagementPersonnel subsequent to, but in respect of the year ended 30 June 2012.
YEAR ENDED 30 JUNE 2012Held at Granted as Held at
30 June 2011 compensation 30 June 2012
P Gammell - - 140,354
R Stokes - - 22,780
J A Walker - - 62,162
YEAR ENDED 30 JUNE 2011 Value of 2011 PMP deferred Fair value
Held at Granted as Held at equity component (b) per right
30 June 2010 compensation (a) 30 June 2011 (a) $ $
P Gammell - 140,354 - 1,155,000 $8.23
R Stokes - 22,780 - 187,500 $8.23
J A Walker - 62,162 - 511,650 $8.23
(a) the number of rights to ordinary shares granted as compensation and held at 30 June 2012 was the number of ordinary shares inthe company that were acquired on market relating to the 2011 PMP acquired subsequent to the 30 June 2011 balance date.
(b) relates to the granted value of the deferred equity component of the PMP for the year ended 30 June 2011 that was used toacquire ordinary shares in the Company subsequent to year end.
There were no other changes to the number of rights held during the year or at 30 June 2012. No rights vested or were available at 30June 2012.
Options issued to employees over ordinary shares in Seven Group Holdings Limited pursuant to Individual Option DeedsOn 28 April 2010, SGH granted 6,875,000 replacement options to Specified Directors and Key Management Personnel of SGH, whowere previously Specified Directors and Key Management Personnel of Seven Network Limited, in connection with SGH's acquisitionof the Seven Network Limited. 5,750,000 were issued to Specified Directors and Key Management Personnel of SGH and 1,125,000 to Executives of Seven Media Group Pty Limited.
The Seven Network Limited performance conditions were replicated for the options granted by the company pursuant to the Plan. TheSeven Network Limited options service and performance conditions were then cancelled. Performance conditions are disclosed inthe Remuneration Report.
Specified DirectorsThe Non-Executive Directors and the Chairman did not receive or hold any options during the period.

112 Seven Group Holdings Limited (ABN 46 142 003 469)
Notes to the Consolidated Financial Statements Financial Report for the year ended 30 June 2012
30. DIRECTOR AND EXECUTIVE DISCLOSURES (CONTINUED)
Shareholdings and transactionsHoldings of ordinary shares and TELYS4 by Specified Directors and Key Management Personnel as at 30 June 2012 held directly, indirectly, beneficially and including their personally-related entities were as follows:
Held at Held at
YEAR ENDED 30 JUNE 2012 1 July 2011 Purchases Sales 30 June 2012
Key Management Personnel - DirectorsKM Stokes AC 207,304,349 - - 207,304,349
PD Ritchie AO 46,072 - - 46,072
PJT Gammell 465,945 168,724 - 634,669
DJ Leckie 66,908 - - 66,908
JA Walker 70,000 62,162 - 132,162
BI McWilliam 1,280,447 - (1,000,000) 280,447
RK Stokes 93,000 22,780 - 115,780
MC Wells 4,000 - - 4,000
RA Uechtritz 318,442 58,434 - 376,876
RF Waters (alternate director) 10,000 - - 10,000
Key Management Personnel - ExecutivesA Harrison - 5,000 - 5,000
Held at Held at
YEAR ENDED 30 JUNE 2012 1 July 2011 Purchases Sales 30 June 2012
Key Management Personnel - DirectorsTJ Davis 3,500 2,000 - 5,500
MC Wells 710 - - 710
Key Management Personnel - ExecutivesA Harrison - 300 - 300
Held at Held at
YEAR ENDED 30 JUNE 2011 1 July 2010 Purchases Sales 30 June 2011
Key Management Personnel - DirectorsKM Stokes AC 207,304,349 - - 207,304,349
PD Ritchie AO 46,072 - - 46,072
PJT Gammell 465,945 - - 465,945
DJ Leckie 66,908 - - 66,908
JA Walker 70,000 - - 70,000
BI McWilliam 280,447 1,000,000 1,280,447
RK Stokes 93,000 - - 93,000
MC Wells 4,000 - - 4,000
RA Uechtritz 145,641 172,801 - 318,442
RF Waters 10,000 - - 10,000
Key Management Personnel - ExecutivesP Lewis 17,179 - - 17,179
Held at Held at
YEAR ENDED 30 JUNE 2011 1 July 2010 Purchases Sales 30 June 2011
Key Management Personnel - DirectorsTJ Davis 3,500 - - 3,500
MC Wells 710 - - 710
ORDINARY SHARES
TELYS4
ORDINARY SHARES
TELYS4

Annual Report 2012 113
Notes to the Consolidated Financial Statements Financial Report for the year ended 30 June 2012
30. DIRECTOR AND EXECUTIVE DISCLOSURES (CONTINUED)
Specified Director and Key Management Personnel related party transactionsA number of Specified Directors and Key Management Personnel, or their personally-related entities, hold positions in other entities that can result in them having control or significant influence over the financial or operating policies of those entities.
A number of these entities transacted with the Company or its subsidiaries in the reporting period. The terms and conditions of those transactions were no more favourable than those available, or which might reasonably be expected to be available, on similar transactions to unrelated entities on an arm’s length basis.
During the years ended 30 June 2012 and 30 June 2011, the Group transacted with entities of which the Directors of the Company, KM Stokes, P Gammell, RK Stokes and RF Waters are or were Directors or Officers or otherwise had an interest.
These transactions included revenue charged to the related party invoiced at standard WesTrac rates of $420,743 (2011: $873,870), the lease of premises and related outgoings amounting to $21,603,973 (2011: $20,204,204); advisory and transaction expense reimbursement of $nil (2011: $347,000); travel expense amounting to $2,474,813 (2011: $2,865,486) and other expense reimbursements of $73,865 (2011: $373,304).
The WesTrac Group also leases a number of other properties from an entity of which the Directors of the Company, KM Stokes, P Gammell, RK Stokes and RF Waters are or were Directors or Officers or otherwise had an interest. These properties are leased to the WesTrac Group under triple net leases, the material terms of which are set out in page 406 of Part B of the merger scheme documentation and include annual rent increases of the greater of 3% and CPI, responsibility for most costs of maintaining the properties (including capital/structural repairs), and extensive insurance obligations. The rent expense for the use of these properties is included in the disclosure below.
As disclosed in Part B of the merger scheme documentation, during the year the WesTrac Group issued a Works Notice under the existing lease at South Guilford WA as part of the WesTrac Group's redevelopment and expansion of its Parts Distribution Centre (PDC). The lease provides that after receiving the Works Notice, the related party of the mentioned KMPs must construct the works at its own cost as soon as reasonably practicable. Maximum construction costs agreed are $40,289,223 (it is noted the actual works have been let pursuant to a tender to third parties which comprises the bulk of the capital works although some direct expense reimbursement is entailed) and the additional maximum rent agreed will be $3,605,885 per year payable upon practicalcompletion of the works.
During the year a company associated with Director, Mr B McWilliam entered into a consulting agreement with the Group. Total feespaid during the year in relation to this consulting agreement totalled $125,000.
The aggregate value of the related party transactions with directors and director related entities was as follows:
2012 2011$ $
Revenues and expensesRevenues 420,743 873,870
Expenses 24,277,651 23,789,994
Assets and liabilitiesTrade and other receivables - current - 4,774
Trade and other payables - current 263 773,043

114 Seven Group Holdings Limited (ABN 46 142 003 469)
Notes to the Consolidated Financial Statements Financial Report for the year ended 30 June 2012
31. OTHER RELATED PARTY DISCLOSURES
2012 2011$’000 $’000
SubsidiariesInterests in subsidiaries are set out in Note 25.
Key Management PersonnelDisclosures relating to Key Management Personnel are set out in Note 30.
Equity accounted investeesThe aggregate value of transactions between the Group and its
equity accounted investees during the period was as follows:
Sales revenue (a) 125,909 81,184
Other income 2,150 11,889
Interest received 273 600
Rental expense (7,021) (2,297)
Other expenses (2,544) (3,720)
Expense reimbursement (1,669) 15,000
Outstanding balances arising from transactions with equity accounted investees;
Trade and other receivables 19,655 22,403
Trade and other payables (54) (71)
Tax receivable from equity accounted investee who is member of tax consolidated group 10,407 -
Tax payable to equity accounted investee who is member of tax consolidated group - (131)
Contingent liabilities at year end, arising from transactions with equity accounted investees;
Financial guarantees (refer to Note 23) 27,487 27,487
(a) includes sales by the WesTrac Group and AllightSykes to the Coates Hire Group.

Annual Report 2012 115
Notes to the Consolidated Financial Statements Financial Report for the year ended 30 June 2012
32a. CASH AND CASH EQUIVALENTS
2012 2011Note $’000 $’000
Bank balances 92,795 62,145
Call deposits 34,954 9,000
Cash and cash equivalents 127,749 71,145 Bank overdrafts used for cash management purposes 17 - (5,901)
Cash and cash equivalents in the cash flow statement 127,749 65,244
32b. NOTES TO THE CASH FLOW STATEMENT
2012 2011
$’000 $’000
Reconciliation of profit for the period to net cash flows related tooperating activities:
Profit after tax 176,748 79,913 Depreciation and amortisation:
Property, plant and equipment 57,364 52,540
Intangible assets 19,332 15,230
Transaction costs associated with acquisition of Sykes Group - 1,976
Share option expense 395 1,718
Net gain on sale of investments and equity accounted investees (8,911) (58,679)
Net gain on sale of subsidiary (129,786) -
Gain on sale of non-current assets - (481)
Impairment of non-current assets 300 18,701
Impairment of equity accounted investees 416,890 305,648
Fair value movement of derivatives 18,167 5,374
Share of results from equity accounted investees (163,019) (143,588)
Dividends received from associates 25,626 33,157
Foreign exchange loss (638) (349)
Other 7,145 5,122
Movement in:
Trade and other receivables (307,601) (130,806)
Inventories (288,784) (358,445)
Other assets (2,144) (4,366)
Trade and other payables/deferred income 68,614 254,230
Provisions 20,411 8,008
Tax balances (25,190) (113,777)
Net operating cash flows (115,081) (28,874)
NON CASH INVESTING AND FINANCING ACTIVITIES
Acquisition of equity accounted investees - dividend reinvestment plan 86,758 13,364
Total non cash investing and financing activities 86,758 13,364

116 Seven Group Holdings Limited (ABN 46 142 003 469)
Notes to the Consolidated Financial Statements Financial Report for the year ended 30 June 2012
33. EVENTS SUBSEQUENT TO BALANCE DATE
SEVEN WEST MEDIA LIMITED ENTITLEMENT OFFERAs noted in Seven West Media Limited's ("SWM") ASX release dated 16 July 2012, SGH has committed to take up its full entitlementunder SWM's underwritten 1-for-2 accelerated renounceable entitlement offer. The total cost to SGH of $145,785,000 based on theoffer price of $1.32 was paid on 27 July 2012.
CONSOLIDATED MEDIA HOLDINGS LIMITED SCHEMEOn 7 September 2012, Consolidated Media Holdings Limited ("CMH") entered into a Scheme Implementation Deed with News Limitedand News Pay TV Financing Pty Limited ("News") under which, News has offered to acquire CMH for $3.45 cash per share by way of a scheme of arrangement ("the Scheme").
The implementation of the Scheme is subject to a number of conditions including, but not limited to, CMH shareholder and Courtapprovals, the Independent Expert concluding that the Scheme is in the best interests of CMH shareholders, and there being no material adverse change. Further information is contained in CMH's ASX release dated 7 September 2012.
At the date of this report, SGH is still evaluating the offer in relation to its investment in CMH.
MOVEMENT IN SHARE PRICES OF LISTED INVESTMENTSSubsequent to 30 June 2012 the market value of SGH’s listed investments has declined from what is presented in this financial report.The market value of listed investments at 14 September 2012 and 24 August 2012 compared to the market value of the equivalent investment at 30 June 2012, and other related derivatives were as follows:
Market value Market value Market valueat 14 September 2012 at 24 August 2012** at 30 June 2012
Listed investments (available-for-sale) 674,825 676,281 670,817 Listed investments accounted for using 774,616 819,287 865,326
the equity method (refer to Note 11)***Derivative financial instruments (26,907) (23,893) (18,167)
linked to share prices (current liability)1,422,534 1,471,675 1,517,976
* - a number of listed investments have gone ex-dividend since 30 June 2012.** - date of Preliminary Final Report (Appendix 4E).*** - market value calculated at 24 August and 14 September 2012 excludes additional shares acquired as part of SWM entitlement offer. The market value of the additional shares acquired under the entitlement offer was $164,560,000 at 24 August and $145,233,000 at 14 September 2012.

Annual Report 2012 117
Notes to the Consolidated Financial Statements Financial Report for the year ended 30 June 2012
34. PARENT ENTITY INFORMATION
As at and throughout the year ended 30 June 2012 the parent company of the Group was Seven Group Holdings Limited.
2012 2011
$’000 $’000Information relating to Seven Group Holdings Limited:
Financial position of parent entity at end of the yearCurrent assets 117,112 134,177
Total assets 3,479,361 2,792,660
Current liabilities 148,745 77,037
Total liabilities 577,624 77,037
Total equity of the parent entity comprising of:Contributed equity 2,624,102 2,615,852
Reserves 6,440 6,044
Retained earnings 271,195 93,727
Total shareholders equity 2,901,737 2,715,623
Result of the parent entityProfit for the year 321,165 190,879
Total comprehensive income for the year 321,165 190,879
Other informationContingent liabilities of the parent entity (a) 107,842 -
Parent entity guarantees in respect of debts of its subsidiariesThe parent entity has entered into a Deed of Cross Guarantee with the effect that the Company guarantees debts in respect ofcertain of its subsidiaries. Further details of the Deed of Cross Guarantee and the subsidiaries subject to the deed are disclosedin Note 25.
(a) relates to financial guarantees provided to third parties by the parent entity for subsidiary debt facilities. These facilities are held by entities that
are outside of the Deed of Cross Guarantee disclosed in Note 25.
COMPANY

118 Seven Group Holdings Limited (ABN 46 142 003 469)
Notes to the Consolidated Financial Statements Financial Report for the year ended 30 June 2012
35. FINANCIAL RISK MANAGEMENTOverviewThe Group has exposure to the following risks from its use of financial instruments:
(a) Market risk(b) Liquidity risk(c) Credit risk
The following presents information, both qualitative and quantitative, about the Group's exposure to each of the above risks, its objectives, policies and processes for measuring and managing risk, and the management of capital.
The Board of Directors has overall responsibility for the establishment and oversight of the risk management framework.
The Board has established a sound system of risk oversight and management and internal control which includes the establishment of the Audit and Risk Committee. The Committee has been constituted with the function of assisting the Board to ensure that its corporate governance and oversight responsibilities are fulfilled in relation to risk management and compliance with applicable laws and regulations.
Risk management policies are established to identify and demonstrate that the Group understands and manages risk and seeks to ensure that there is consistency to the methods used in assessing, monitoring and communicating risks and that risk management efforts are aligned with the Group's strategic and business objectives.
The Audit and Risk Committee is responsible for reviewing, evaluating and making recommendations to the Board in relation to:• assessing the risk management, compliance and control environment as it relates to the external and internal audit plans;• overseeing financial reporting; and • evaluating internal and external audit.
At the reporting date the Group held the following financial instruments:
2012 2011$'000 $'000
Financial assetsCash and cash equivalents 127,749 71,145
Trade and other receivables 920,526 554,271
Available-for-sale financial assets 670,899 652,286
Unlisted equity investment 252,944 232,093
Derivative financial instruments 72,473 2,587
Total financial assets 2,044,591 1,512,382
Financial liabilitiesTrade and other payables (excluding accruals) 562,459 447,983
Interest bearing liabilities 1,846,431 908,257
Derivative financial instruments 149,506 122,057
Total financial liabilities 2,558,396 1,478,297
(a) Market risk(i) Foreign exchange riskForeign exchange risk arises when future commercial transactions and recognised assets and liabilities are denominated in a currency that is not the entity’s functional currency. The Group's foreign exchange risk arises primarily from:
- The Group's investment in available for sale financial instruments includes an investment in Agricultural Bank of China, which is denominated in Hong Kong Dollars- borrowings denominated in a foreign currency; and- firm commitments of highly probable forecast transactions for receipts and payments settled in foreign currency.

Annual Report 2012 119
Notes to the Consolidated Financial Statements Financial Report for the year ended 30 June 2012
35. FINANCIAL RISK MANAGEMENT (CONTINUED)(i) Foreign exchange risk (continued)The Group is exposed to fluctuations in United States Dollars, Euros, Great Britain Pounds, Hong Kong Dollars, Chinese Yuan Renminbi, New Zealand Dollars, United Arab Emirates Dirhams and Japanese Yen.
The Group will seek to minimise exposure to foreign exchange risk by initially seeking contracts effectively denominated in AustralianDollars where possible. Where this is not possible the Group will manage foreign exchange risk as follows:
- in certain circumstances the Group invoices customers in USD. Where the Group invoices in USD it may seek to match the USD receipt with USD denominated vendor payments. As a result a cash flow designation is created by minimising exposure to changes in the AUD/USD exchange rate. Payments and receipts are made from and to the Group's USD denominated bank account.
- external forward contracts and options are used to manage foreign exchange risk. Contracts are entered into on a transaction by transaction basis to hedge specific purchases, sales and borrowings.
The Group's foreign exchange risk from recognised assets and liabilities arises primarily from WesTrac’s long term USD denominatedborrowings (Note 17). The Group effectively hedges its long term foreign denominated borrowings using a combination of designatedforward exchange contracts and cross currency swaps.
Excluding assets and liabilities for foreign Group entities translated in accordance with Note 1(C)(iii), the Group's exposure to foreign currency risk was as follows, based on notional amounts:
2012 2012 2012 2012 USD GBP EUR JPY
'000 '000 '000 '000Cash at bank 6,732 5 6,942 2,624
Trade and other receivables 127,637 - - -
Trade and other payables (151,757) (1,568) (61) -
Borrowings (590,000) - - -
Derivative financial instruments (49,778) - - -
2011 2011 2011 2011 USD GBP EUR JPY
'000 '000 '000 '000Cash at bank 10,375 - - 2,154
Trade and other receivables 23,114 - - -
Trade and other payables (23,315) (3,091) - -
Borrowings (435,000) - - -
Derivative financial instruments (114,394) - - -
The closing exchange rates at 29 June 2012 as reported by the Reserve Bank of Australia at 4pm (AEST) were as follows: AUD/USD - 1.0191 (2011: 1.0739), AUD/GBP - 0.6529 (2011: 0.6667) and AUD/JPY - 80.89 (2011: 86.33).

120 Seven Group Holdings Limited (ABN 46 142 003 469)
Notes to the Consolidated Financial Statements Financial Report for the year ended 30 June 2012
35. FINANCIAL RISK MANAGEMENT (CONTINUED)(i) Foreign exchange risk (continued)The financial statements for foreign Group companies that have a functional currency different from Australian Dollars are translated into Australian Dollars on consolidation in accordance with Note 1(C)(iii). Exchange differences arising from the translation are taken to reserves and as such the individual account balances of these Group companies are excluded from the above table.
Adverse versus favourable movements are determined relative to the net underlying exposure. An adverse movement in exchange rates implies an increase in the Group’s foreign currency exposure leading to deterioration in the Group’s financial position. A favourable movement in exchange rates implies a decrease in the Group’s foreign currency exposure and an improvement in the Group’s financial position.
As at 29 June 2012 the closing AUD/USD exchange rate, as reported by the Reserve Bank of Australia at 4pm (AEST) was 1.0191 (2011: 1.0739). A foreign currency sensitivity of +/- 10% has been selected and is considered reasonable given the historical AUD/USD exchange rates prevailing in the year ended 30 June 2012. During this period the average AUD/USD exchange rate was 1.0319(2011: 0.9881) and traded within a range of 0.9500 and 1.1055 (2011: 0.8366 and 1.0939).
At 30 June 2012, had the AUD/USD exchange rate moved by 10%, with all other variables held constant, post tax profit/(loss) and equitywould have been affected as illustrated in the table below:
2012 2012 2011 2011Profit/(loss) Equity Profit/(loss) Equity
Judgements of reasonably possible movements: $’000 $’000 $’000 $’000
AUD to USD +10% (955) 18,703 (451) 4,082
AUD to USD -10% 1,167 (22,795) 551 (5,395)
The Group's exposure to other foreign exchange movements is not material.
(ii) Interest rate riskThe Group's exposure to interest rate risk arises from Australian dollar cash deposits and short to medium term borrowings which are at variable interest rates in Australian Dollars, Hong Kong Dollars and Chinese Yuan Renminbi. Generally, long term fixed rate borrowings are obtained in the US and Australia, while shorter term variable borrowings are denominated in local Australian and Chinese currencies and expose the Group to interest rate risk. The Group manages this risk by using financial derivative instruments including interest rate swaps and interest rate caps to fix interest rate exposure.
As at 30 June 2012, 54% (2011: 32%) of the Group's total borrowings were subject to fixed interest rates or were effectively hedged with derivative financial instruments. In addition, the Group had interest rate caps with a notional value of $275,000,000 at 7% (2011: $275,000,000 at 7%). Due to the variance with underlying interest rates, these caps are not considered to be effective hedges.
At balance date, the Group had the following mix of financial assets and liabilities exposed to Australian, Hong Kong, Chinese and New Zealand variable interest rate risk:
2012 2011$'000 $'000
Financial assetsCash and cash equivalents 127,749 71,145
127,749 71,145 Financial liabilitiesBank overdrafts - (5,901)
Interest bearing liabilities (846,967) (595,979)
(846,967) (601,880)

Annual Report 2012 121
Notes to the Consolidated Financial Statements Financial Report for the year ended 30 June 2012
35. FINANCIAL RISK MANAGEMENT (CONTINUED)(ii) Interest rate risk (continued)The following table shows the impact on profit or loss and equity of interest bearing assets and liabilities if floating interest rates at balance date had been 1% (100 basis points) higher or lower, with all other variables held constant.
2012 2012 2011 2011Profit/(loss) Equity Profit/(loss) Equity
If interest rates were 1% (100 basis points) higher with
all other variables held constant - increase/(decrease) (5,035) (5,035) (3,715) (3,715)
If interest rates were 1% (100 basis points) lower with
all other variables held constant - increase/(decrease) 5,035 5,035 3,715 3,715
(iii) Equity price riskEquity price risk refers to the risk that the value of a financial instrument or its associated cash flows will fluctuate due to changes in the underlying share prices.
The Group has exposure to equity price risk arising from its portfolio of listed equity securities and derivatives. In the prior year, theGroup entered into a derivative contract to hedge equity price risk on its commitment to participate in the Seven West Media LimitedDividend Reinvestment Plan.
The Group may also be exposed to equity price risk through its holdings of listed investments accounted for using the equity methodand as part of the Group's impairment assessment process.
The following table shows the impact on net profit and equity of the Group if equity prices at balance date had been 15% higher or lower, with all other variables held constant. A sensitivity of 15% is considered reasonable given the current level of prices and the volatility observed both on a historical basis and market expectations for future movement.
2012 2012 2011 2011Profit/(loss) Equity Profit/(loss) Equity
$'000 $'000 $'000 $'000
If share prices were 15% higher with all other variables constant - increase/(decrease) 3,196 70,444 - 68,490
If share prices were 15% lower with all other variables constant - increase/(decrease) (3,196) (70,444) - (68,490)
The allocation between net profit and equity is subject to impairment testing. The above sensitivity analysis assumes the investments are not impaired.
The fair values of available-for-sale financial assets are determined by reference to their quoted market prices at balance date. Gains or losses arising from changes in the value of available-for-sale financial assets category are taken to the fair value reserve. Amounts are recognised in profit or loss when the associated assets are sold or impaired.
(b) Liquidity riskLiquidity risk refers to the risk that the Group is unable to meet its financial commitments as and when they fall due.
The Group employs a prudent liquidity risk management approach. This involves maintaining sufficient cash on hand and having the availability of funding through an adequate amount of credit facilities.
The Group maintains a large amount of liquid reserves (cash, deposits, listed shares and available credit lines) that can be drawnor sold at short notice to meet the Group's financial commitments. Management monitors the Group's on going cash flow requirements on a daily basis. Due to the dynamic nature of the underlying businesses, the Group aims to maintain flexibility in funding by keeping credit lines available.

122 Seven Group Holdings Limited (ABN 46 142 003 469)
Notes to the Consolidated Financial Statements Financial Report for the year ended 30 June 2012
35. FINANCIAL RISK MANAGEMENT (CONTINUED)(b) Liquidity risk (continued)Financing arrangementsThe Group had access to the following undrawn borrowing facilities at the reporting date:
2012 2011Floating rate $’000 $’000
Expiring within one year 318,566 113,694
Expiring beyond one year 415,769 353,000
Total 734,336 466,694
At 30 June 2012, the Group also has additional liquidity available in the form of cash of $127,749,000 (2011: $71,145,000), available-for-sale listed shares of $670,899,000 (2011: $652,286,000), available lease and multi-purpose facilities of $85,000,000 (2011: $55,700,000) and access to unutilised, short dated lines of other credit totalling $191,900,000 (2011: $176,300,000).
Subject to continued compliance with facility terms, the facilities may be drawn at any time. The average maturity for drawn facilities is 4.9 years (2011: 4.1 years) and 3.8 years (2011: 1.1 years) for undrawn facilities.
Maturities of financial liabilitiesThe table below analyses the Group’s financial liabilities (including derivative financial instruments) into relevant maturity groupings based on the remaining period at the reporting date to the contractual maturity date. Gross cash flows include principal, coupon and premium (on put options) payments at contracted rates.
The amounts disclosed in the table are the contracted undiscounted cash flows.
TotalWithin Between 1 Between 2 Over 5 contractual Carrying1 year & 2 years & 5 years years cash flows amount
YEAR ENDED 30 JUNE 2012 $’000 $’000 $’000 $’000 $’000 $’000Trade and other payables 562,459 - - - 562,459 562,459
Borrowings - variable rate
- principal (including derivative) 248,344 19,282 514,000 67,901 849,527 846,967 - coupon interest & derivative 11,245 11,245 11,245 39,086 72,821 -
Borrowings - fixed rate
- principal (including derivative) 5,777 102,979 540,511 496,986 1,146,253 999,464
- coupon interest & derivative 45,899 43,284 122,263 248,288 459,734 131,339
Total 873,724 176,790 1,188,019 852,261 3,090,794 2,540,229
TotalWithin Between 1 Between 2 Over 5 contractual Carrying1 year & 2 years & 5 years years cash flows amount
YEAR ENDED 30 JUNE 2011 $’000 $’000 $’000 $’000 $’000 $’000Trade and other payables 447,983 - - - 447,983 447,983
Borrowings - variable rate
- principal (including derivative) 340,200 149,938 - 116,902 607,040 601,880 - coupon interest & derivative 8,414 8,823 28,539 83,709 129,485 -
Borrowings - fixed rate
- principal (including derivative) 4,529 40,402 101,071 358,143 504,145 306,377
- coupon interest & derivative 28,768 28,396 69,618 70,321 197,103 109,102
Interest rate derivative contracts 1,368 1,109 295 - 2,772 2,446
Total 831,262 228,668 199,523 629,075 1,888,528 1,467,788

Annual Report 2012 123
Notes to the Consolidated Financial Statements Financial Report for the year ended 30 June 2012
35. FINANCIAL RISK MANAGEMENT (CONTINUED)(c) Credit riskCredit risk is the risk of financial loss to the Group if a customer or counterparty to a financial instrument fails to meet its contractual obligations, and arises principally from the Group's receivables, cash and cash equivalents and investment securities.
The Group has an established credit policy under which new customers are analysed individually for creditworthiness before the Group’s standard payment, delivery terms and conditions are offered. The Group’s review includes external ratings, when available, such as Veda Advantage. Purchase limits are established for each customer and these limits are reviewed annually or upon request. Customers that fail to meet the Group’s benchmark creditworthiness may transact with the Group upon lodging of a Bank Guarantee as a security document or on a strictly pre-paid (cleared funds) only basis.
With respect to credit risk arising from the other financial assets of the Group, which comprise cash and cash equivalents and available for sale investments, the Group's exposure to credit risk arises from default of the counterparty, with a maximum exposure equal to the carrying value of these instruments. The Group mitigates this risk by only dealing with counterparties that meet a defined credit criteria and also by managing specific credit limits on all counterparties.
The Group is not aware of any material credit concerns with respect to the portfolio of investments.
The Group's maximum exposure to credit risk at the reporting date was:
2012 2011Note $’000 $’000
Available-for sale-financial assets 13 670,899 652,286
Unlisted equity investment 13 252,944 232,093
Trade and other receivables 8 920,526 554,271
Cash and cash equivalents 32a 127,749 71,145
Derivative financial instruments 12 72,473 2,587
2,044,591 1,512,382
Past due but not impairedAs at 30 June 2012, trade receivables of $127,826,000 (2011: $60,656,000) were past due but not impaired. These relate to a number ofindependent customers for whom there is no recent history of default. The ageing analysis of these trade receivables is as follows:
2012 2011$'000 $'000
Past due 1-30 days 12,329 15,791
Past due 31-60 days 46,309 27,373
Past due 60 - 90 days 16,449 9,888
> 91 days 52,739 7,604
Balance at end of the period 127,826 60,656
The movement in the allowance for impairment in respect of trade receivables during the year was as follows:
2012 2011$'000 $'000
Balance as beginning of period 5,526 9,768
Impairment loss recognised in profit and loss 8,392 3,800
Impairment loss reversed in profit and loss - (7,700)
Receivables expensed as uncollectable during the year - (342)
Balance at end of the period 13,918 5,526

124 Seven Group Holdings Limited (ABN 46 142 003 469)
Notes to the Consolidated Financial Statements Financial Report for the year ended 30 June 2012
35. FINANCIAL RISK MANAGEMENT (CONTINUED)(c) Credit risk (continued)The Group's and the Company’s exposure to credit risk is predominately in Australia & China.
The creation and release of the provision for impaired receivables has been included in "other expenses" in the income statement.Due to the short term nature of these receivables their carrying value is assumed to approximate their fair value.
In certain circumstances the Group enters into guarantees as part of ordinary trading operations. These are detailed in Note 23.
(d) Fair value measurementsThe fair values of financial assets and liabilities, together with carrying amounts shown in the statement of financial position, are as follows:
2012 2012 2011 2011Carrying Fair Carrying Fair amount value amount value
$'000 $'000 $'000 $'000
Financial assetsCash and cash equivalents 127,749 127,749 71,145 71,145
Trade and other receivables 920,526 920,526 554,271 554,271
Available-for-sale financial assets 670,899 670,899 652,286 652,286
Unlisted equity investment 252,944 252,944 232,093 232,093
Derivative financial instruments 72,473 72,473 2,587 2,587
Total financial assets 2,044,591 2,044,591 1,512,382 1,512,382
Financial liabilitiesTrade and other payables 562,459 562,459 447,983 447,983
Fixed term US Private Placement notes 627,770 732,715 405,066 452,650
Other borrowings 1,218,661 1,218,661 503,191 503,191
Derivative financial instruments 149,506 149,506 122,057 122,057
Total financial liabilities 2,558,396 2,663,341 1,478,297 1,525,881
The fair value of unlisted equity investments was determined using standard bond pricing calculations taking into account the 7.143%accretion in redemption value over five years and 9% market yield for comparable instruments.
Interest rates used for determining fair valueThe interest rates used to discount estimated cash flows relating to the fixed term US dollar notes were 2.1% to 4.5% (2011: 2.0% to 4.9%) and are based on the government yield curve at the reporting date plus an adequate credit spread.
The Group uses various methods in estimating the fair value of a financial instrument. The methods comprise:
Level 1 – fair value is calculated using quoted prices in active markets.Level 2 – fair value is estimated using inputs other than quoted prices included in Level 1 that are observable for the asset or liabilityeither directly (as prices) or indirectly (derived from prices).Level 3 – fair value is estimated using inputs for the asset or liability that are not based on observable market data.

Annual Report 2012 125
Notes to the Consolidated Financial Statements Financial Report for the year ended 30 June 2012
35. FINANCIAL RISK MANAGEMENT (CONTINUED)(d) Fair value measurements (continued)Financial instruments, carried at fair value, as well as the methods used to estimate the fair value are summarised in the table below.
Level 1 Level 2 Level 3 Total
AT 30 JUNE 2012 $'000 $'000 $'000 $'000
AssetsAvailable-for-sale financial assets
Listed equity investments 670,899 - - 670,899
Derivative financial assets - 72,473 - 72,473
670,899 72,473 - 743,372 LiabilitiesDerivative financial liabilities - (149,506) - (149,506)
- (149,506) - (149,506)
Level 1 Level 2 Level 3 Total
AT 30 JUNE 2011 $'000 $'000 $'000 $'000
AssetsAvailable-for-sale financial assets
Listed equity investments 652,286 - - 652,286
Derivative financial assets - 2,587 - 2,587
652,286 2,587 - 654,873 LiabilitiesDerivative financial liabilities - (122,057) - (122,057)
- (122,057) - (122,057)
Quoted market price represents the fair value determined based on quoted prices on active markets as at the reporting date without any deduction for transaction costs. The fair value of the listed equity investments are based on quoted market prices.
For financial instruments not quoted in active markets, the Group uses valuation techniques such as present value techniques, comparison to similar instruments for which market observable prices exist and other relevant models used by market participants. These valuation techniques use both observable and unobservable market inputs. Financial instruments that use valuation techniques with only observable market inputs or unobservable inputs that are not significant to the overall valuation include interest rate swaps and foreign exchange contracts not traded on a recognised exchange.
The fair value of unlisted debt and equity securities, as well as other investments that do not have an active market, are based on valuation techniques using market data that is not observable.
(e) Capital managementThe Group manages its capital to safeguard the Group's ability to continue as a going concern and to maintain an optimal capital structure while maximising shareholder value. As such, the Board regularly reviews the Group's capital structure in order to take advantage of favourable costs of capital and returns on assets.
The Company maintains a diversified capital base with a mixture of equity and debt funding. Equity funding comprises both ordinary shares and preference shares (TELYS4).
The Group's dividend policy is to distribute cash from operating activities after financing costs, subject to the retention of adequate cash reserves to capitalise on investment opportunities. Dividends are franked to the greatest extent possible.
Refer to Note 5 for a listing of dividends paid and proposed but not provided for during the current year.

126 Seven Group Holdings Limited (ABN 46 142 003 469)
Directors’ Declaration Year ended 30 June 2012
1. In the opinion of the Directors of Seven Group Holdings Limited (the “Company”):a) the consolidated financial statements and notes that are set out on pages 53 to 125 and the Remuneration report, set
out on pages 39 to 50 in the Directors’ report, are in accordance with the Corporations Act 2001, including:i) giving a true and fair view of the Group’s financial position as at 30 June 2012 and of its performance for the financial
year ended on that date; andii) complying with Australian Accounting Standards and the Corporations Regulations 2001; and
b) there are reasonable grounds to believe that the Company will be able to pay its debts as and when they become due and payable.
2. There are reasonable grounds to believe that the Company and the group entities identified in Note 25 will be able to meet any obligations or liabilities to which they are or may become subject to by virtue of the Deed of Cross Guarantee between the Company and those group entities pursuant to ASIC Class Order 98 / 1418.
3. The Directors have been given the declarations required by Section 295A of the Corporations Act 2001 from the Chief Executive Officer and the Chief Financial Officer for the financial year ended 30 June 2012.
4. The Directors draw attention to Note 1(a) to the consolidated financial statements, which includes a statement of compliance with International Financial Reporting Standards.
Signed in accordance with a resolution of the Directors:
KM Stokes AC MC Wells Executive Chairman Chairman of the Audit & Risk Committee
Sydney 21 September 2012

Annual Report 2012 127
Independent Auditor’s Report to the members of Seven Group Holdings
ABCD
KPMG, an Australian partnership and a member firm of the KPMG network of independent member firms affiliated with KPMG International Cooperative Liability limited by a scheme approved under(“KPMG International”), a Swiss entity. Professional Standards Legislation
Independent auditor’s report to the members of Seven Group Holdings Limited
Report on the financial report We have audited the accompanying financial report of Seven Group Holdings Limited (the Company), which comprises the consolidated statement of financial position as at 30 June 2012, and consolidated income statement and consolidated statement of comprehensive income, consolidated statement of changes in equity and consolidated statement of cash flows for the year ended on that date, notes 1 to 35 comprising a summary of significant accounting policies and other explanatory information and the directors’ declaration of the Group comprising the Company and the entities it controlled at the year’s end or from time to time during the financial year.
Directors’ responsibility for the financial report
The directors of the Company are responsible for the preparation of the financial report that gives a true and fair view in accordance with Australian Accounting Standards and the Corporations Act 2001 and for such internal control as the directors determine is necessary to enable the preparation of the financial report that is free from material misstatement whether due to fraud or error. In note 1(A), the directors also state, in accordance with Australian Accounting Standard AASB 101 Presentation of Financial Statements, that the financial statements of the Group comply with International Financial Reporting Standards.
Auditor’s responsibility
Our responsibility is to express an opinion on the financial report based on our audit. We conducted our audit in accordance with Australian Auditing Standards. These Auditing Standards require that we comply with relevant ethical requirements relating to audit engagements and plan and perform the audit to obtain reasonable assurance whether the financial report is free from material misstatement.
An audit involves performing procedures to obtain audit evidence about the amounts and disclosures in the financial report. The procedures selected depend on the auditor’s judgement, including the assessment of the risks of material misstatement of the financial report, whether due to fraud or error. In making those risk assessments, the auditor considers internal control relevant to the entity’s preparation of the financial report that gives a true and fair view in order to design audit procedures that are appropriate in the circumstances, but not for the purpose of expressing an opinion on the effectiveness of the entity’s internal control. An audit also includes evaluating the appropriateness of accounting policies used and the reasonableness of accounting estimates made by the directors, as well as evaluating the overall presentation of the financial report.
We performed the procedures to assess whether in all material respects the financial report presents fairly, in accordance with the Corporations Act 2001 and Australian Accounting Standards, a true and fair view which is consistent with our understanding of the Group’s financial position and of its performance.
We believe that the audit evidence we have obtained is sufficient and appropriate to provide a basis for our audit opinion.

128 Seven Group Holdings Limited (ABN 46 142 003 469)
Independent Auditor’s Report to the members of Seven Group Holdings
ABCD
Independence
In conducting our audit, we have complied with the independence requirements of the Corporations Act 2001.
Auditor’s opinion
In our opinion:
(a) the financial report of the Group is in accordance with the Corporations Act 2001, including:
(i) giving a true and fair view of the Group’s financial position as at 30 June 2012 and of its performance for the year ended on that date; and
(ii) complying with Australian Accounting Standards and the Corporations Regulations 2001.
(b) the financial report also complies with International Financial Reporting Standards as disclosed in note 1(A).
Report on the remuneration report We have audited the Remuneration Report included in pages 39 to 50 of the directors’ report for the year ended 30 June 2012. The directors of the Company are responsible for the preparation and presentation of the remuneration report in accordance with Section 300A of the Corporations Act 2001. Our responsibility is to express an opinion on the remuneration report, based on our audit conducted in accordance with auditing standards.
Auditor’s opinion
In our opinion, the remuneration report of Seven Group Holdings Limited for the year ended 30 June 2012, complies with Section 300A of the Corporations Act 2001.
KPMG
Kevin Leighton Partner
Sydney
21 September 2012

Annual Report 2012 129
Company Information
LIST OF DIRECTORSKerry Stokes AC (Executive Chairman)Peter Ritchie AO (Deputy Chairman)Peter Gammell (Group Chief Executive Officer)David Leckie (Executive Director, Media)James Walker (Chief Executive Officer, WesTrac Group)Dulcie BolingTerry DavisChristopher MackayBruce McWilliam (Commercial Director)Ryan Stokes (Chief Operating Officer) Richard UechtritzProf. Murray WellsRobin Waters (Alternate Director)
COMPANY SECRETARYWarren Coatsworth
REGISTERED OFFICECompany SecretariatLevel 238 – 42 Pirrama RoadPyrmont NSW 2009
SHARE REGISTRYBoardroom Pty Limited Level 7, 207 Kent StreetSydney NSW 2000
AUDITORKPMG10 Shelley Street Sydney NSW 2000
LEGAL ADVISORSFreehills MLC CentreMartin PlaceSydney NSW 2000
Clayton UtzLevel 151 Bligh StreetSydney NSW 2000

130 Seven Group Holdings Limited (ABN 46 142 003 469)
Investor Information
SHAREHOLDER INQUIRIESInvestors seeking information regarding their shareholding or dividends or wishing to advise of a change of address should contact the Share Registry at:
Boardroom Pty Limited Level 7, 207 Kent StreetSydney NSW 2000
Telephone: (02) 9290 9600
Facsimile: (02) 9279 0664 or
Visit the online service at
Boardroom Pty Limited has an online service for investors called InvestorServe. This enables investors to make online changes, view balances and transaction history, as well as obtain information about recent dividend payments and download various forms to assist in the management of their holding. To use this service, simply visit the Boardroom Pty Limited website.
Other general inquiries may be directed to Mr W. Coatsworth, Company Secretary on (02) 8777 7777 or visit the website
TAX FILE NUMBER INFORMATIONThe company is obliged to record Tax File Numbers or exemption details provided by shareholders. While it is not compulsory for shareholders to provide a Tax File Number or exemption details, Seven Group Holdings Limited is obliged to deduct tax from unfranked dividends paid to investors resident in Australia who have not supplied such information. Forms are available upon request from the Share Registry or shareholders can submit their Tax File Number via the Boardroom website.
THE CHESS SYSTEMSeven Group Holdings Limited operates under CHESS – Clearing House Electronic Subregister System – an Australian Securities Exchange system which permits the electronic transfer and registration of shares. Under CHESS, the company issues a Statement of Holdings to investors, instead of share certificates, and the statement will quote the Holder Identification Number (HIN). The HIN number should be quoted on any correspondence investors have with the Share Registry.
The company will maintain investors’ holdings in an Issuer Sponsored facility, which enables investors to maintain their holding without the need to be tied to any particular stockbroker.
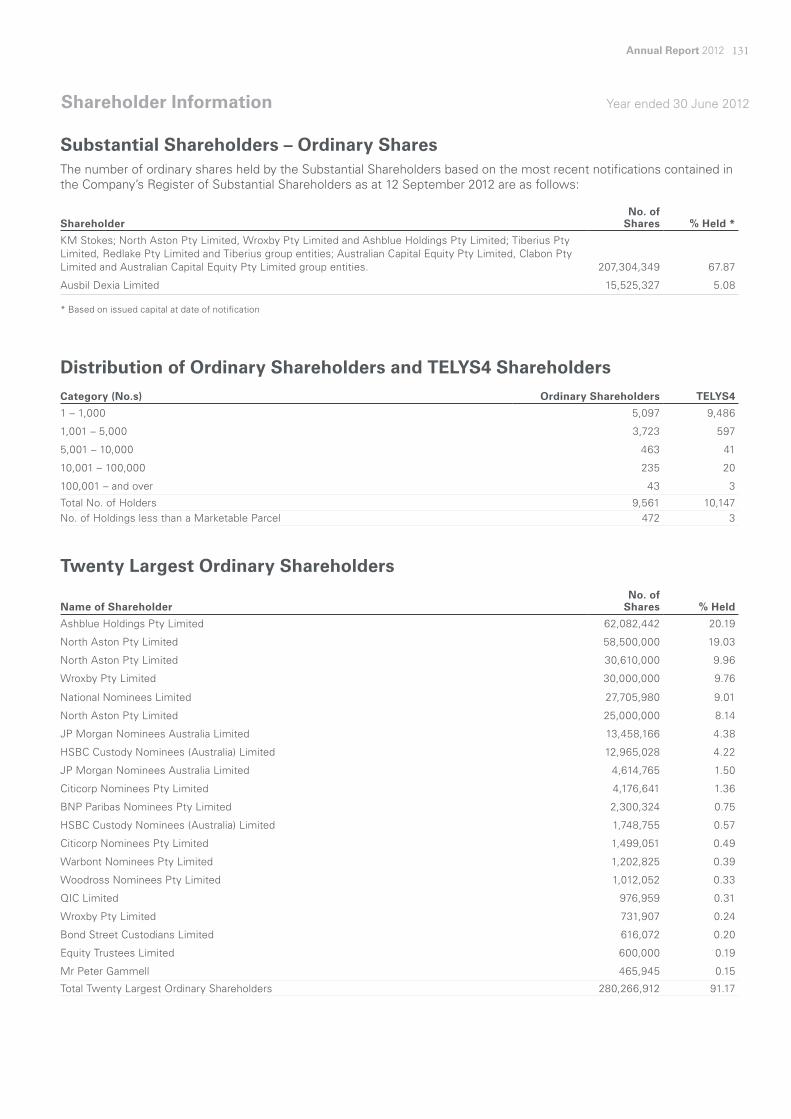
Annual Report 2012 131
Shareholder Information Year ended 30 June 2012
Substantial Shareholders – Ordinary SharesThe number of ordinary shares held by the Substantial Shareholders based on the most recent notifications contained in the Company’s Register of Substantial Shareholders as at 12 September 2012 are as follows:
ShareholderNo. of
Shares % Held *
KM Stokes; North Aston Pty Limited, Wroxby Pty Limited and Ashblue Holdings Pty Limited; Tiberius Pty Limited, Redlake Pty Limited and Tiberius group entities; Australian Capital Equity Pty Limited, Clabon Pty Limited and Australian Capital Equity Pty Limited group entities. 207,304,349 67.87
Ausbil Dexia Limited 15,525,327 5.08
* Based on issued capital at date of notification
Distribution of Ordinary Shareholders and TELYS4 ShareholdersCategory (No.s) Ordinary Shareholders TELYS4
1 – 1,000 5,097 9,486
1,001 – 5,000 3,723 597
5,001 – 10,000 463 41
10,001 – 100,000 235 20
100,001 – and over 43 3
Total No. of Holders 9,561 10,147No. of Holdings less than a Marketable Parcel 472 3
Twenty Largest Ordinary Shareholders
Name of ShareholderNo. of
Shares % Held
Ashblue Holdings Pty Limited 62,082,442 20.19
North Aston Pty Limited 58,500,000 19.03
North Aston Pty Limited 30,610,000 9.96
Wroxby Pty Limited 30,000,000 9.76
National Nominees Limited 27,705,980 9.01
North Aston Pty Limited 25,000,000 8.14
JP Morgan Nominees Australia Limited 13,458,166 4.38
HSBC Custody Nominees (Australia) Limited 12,965,028 4.22
JP Morgan Nominees Australia Limited 4,614,765 1.50
Citicorp Nominees Pty Limited 4,176,641 1.36
BNP Paribas Nominees Pty Limited 2,300,324 0.75
HSBC Custody Nominees (Australia) Limited 1,748,755 0.57
Citicorp Nominees Pty Limited 1,499,051 0.49
Warbont Nominees Pty Limited 1,202,825 0.39
Woodross Nominees Pty Limited 1,012,052 0.33
QIC Limited 976,959 0.31
Wroxby Pty Limited 731,907 0.24
Bond Street Custodians Limited 616,072 0.20
Equity Trustees Limited 600,000 0.19
Mr Peter Gammell 465,945 0.15
Total Twenty Largest Ordinary Shareholders 280,266,912 91.17

132 Seven Group Holdings Limited (ABN 46 142 003 469)
Shareholder Information Year ended 30 June 2012
Twenty Largest TELYS4 Shareholders
Name of ShareholderNo. of
TELYS4 % Held
Navigator Australia Limited 149,620 3.01
JP Morgan Nominees Australia Limited 119,984 2.42
UBS Wealth Management Australia Nominees Pty Limited 103,726 2.09
Nulis Nominees (Australia) Limited 76,073 1.54
Australian Executor Trustees Limited 70,406 1.41
Sandhurst Trustees Limited 64,673 1.30
UCA Cash Management Fund Limited 49,941 1.00
ABN AMRO Clearing Sydney Nominees Pty Limited 46,841 0.95
HSBC Custody Nominees (Australia) Limited 41,071 0.83
National Nominees Limited 34,289 0.69
Netwealth Investments Limited 26,227 0.53
Perpetual Trustee Company Limited 25,029 0.50
RBC Investor Services Australia Nominees Pty Limited 24,447 0.49
RBC Investor Services Australia Nominees Pty Limited 24,159 0.49
SR Consolidated Pty Limited 21,435 0.43
Natpac Financial Services Pty Limited 18,829 0.38
Lenhut Pty Limited 15,619 0.32
Jilliby Pty Limited 14,500 0.29
Netwealth Investments Limited 13,796 0.28
Omineca Pty Limited 13,000 0.26
Total Twenty Largest TELYS4 Shareholders 953,665 19.21
Details of Options Issued by Seven Group Holdings Limited
Number on issue 4,250,000Number of holders 3Name and number of options held by an option holder holding 20% or more of the options in this class
Mr David Leckie holds 3,000,000 options over ordinary shares Mr Bruce McWilliam holds 1,000,000 options over ordinary shares
Voting RightsOrdinary SharesOn a show of hands, every member present in person or by proxy or attorney, or being a corporation, present by its representative, shall have one vote. On a poll, every member present in person or by proxy or attorney, or being a corporation, present by its representative, shall have one vote for every share held.
OptionsThere are no voting rights attached to options. Upon exercise of the option, the issued shares will confer full voting rights.
TELYS4There are limited voting rights attached to TELYS4 as detailed in their terms of issue. In broad terms, a holder has the right to vote if a dividend is in arrears, on a proposal to reduce share capital, affecting rights on the TELYS4, on a winding up of the company, on a disposal of the whole undertaking of the company, on a resolution to approve a buy – back agreement and during the winding up of the company. Upon conversion of the TELYS4, the resulting issued shares will confer full voting rights.
Stock Exchange Listing The Company is listed with the Australian Securities Exchange Limited and the home exchange is Sydney.
On-Market Buy-BackThere is no current on-market buy-back.

Annual Report 2012 III
Corporate Directory
SEVEN GROUP HOLDINGS LIMITEDHEAD OFFICELevel 2, 38 - 42 Pirrama RoadPyrmont NSW 2009Ph: (02) 8777 7777Fax: (02) 8777 7778
WESTRAC WA128-136 Great Eastern HighwaySouth Guildford WA 6055Ph: (08) 9377 9444Fax: (08) 9377 1791
WESTRAC NSW1 Crescent StreetHolroyd NSW 2142Ph: (02) 9840 4600Fax: (02) 9840 4689
WESTRAC ACT78 Sheppard StreetHume ACT 2620Ph: (02) 6290 4500Fax: (02) 6260 2814
WESTRAC CHINASky Centre Tower ANo 22 Wanyuan StreetBeijing China 100176Ph: (86) (10) 5902 1666
NATIONAL HIRE GROUP LIMITEDLevel 1, 1 Puccini CourtStirling WA 6021Ph: (08) 9440 7900Fax: (08) 9440 7999
ALLIGHTSYKES WALevel 1, 1 Puccini CourtStirling WA 6021Ph: (08) 9302 7000Fax: (08) 9440 7999
ALLIGHTSYKES NSW42 Munibung RoadCardiff NSW 2285Ph: (02) 4954 3333Fax: (02) 4954 3303
ENGIN PTY LIMITED22 Rodborough Road Frenchs Forest NSW 2086Ph: (02) 8985 5800Fax: (02) 8985 5847

IV Seven Group Holdings Limited (ABN 46 142 003 469)
Corporate Directory