industry and skill wage premiums in east asia
TRANSCRIPT

Policy Research Working Paper 5379
Industry and Skill Wage Premiums in East AsiaEmanuela di Gropello
Chris Sakellariou
The World BankEast Asia and Pacific RegionEducation Unit, Human Development SectorJuly 2010
WPS5379P
ublic
Dis
clos
ure
Aut
horiz
edP
ublic
Dis
clos
ure
Aut
horiz
edP
ublic
Dis
clos
ure
Aut
horiz
edP
ublic
Dis
clos
ure
Aut
horiz
ed

Produced by the Research Support Team
Abstract
The Policy Research Working Paper Series disseminates the findings of work in progress to encourage the exchange of ideas about development issues. An objective of the series is to get the findings out quickly, even if the presentations are less than fully polished. The papers carry the names of the authors and should be cited accordingly. The findings, interpretations, and conclusions expressed in this paper are entirely those of the authors. They do not necessarily represent the views of the International Bank for Reconstruction and Development/World Bank and its affiliated organizations, or those of the Executive Directors of the World Bank or the governments they represent.
Policy Research Working Paper 5379
This paper focuses on the estimation of skill/industry premiums and labor force composition at the national and sector levels in seven East Asian countries with the objective of providing a comprehensive analysis of trends in demand for skills in the region. The paper addresses the following questions: Are there converging or diverging trends in the region regarding the evolution of skill premiums and labor force composition? Are changes in skill premiums generalized or industry-related? How have industry premiums evolved? The analysis uses labor and household surveys going back at least 10 years. The main trends emerging from the analysis are: (a) increasing proportions of skilled/educated workers over the long run across the region; (b) generally increasing demand for skills in the region; (c) the service sector has become the most important driver of demand for skills for all countries (except Thailand); (d) countries can be broadly
This paper—a product of the Education Unit, Human Development Sector, East Asia and Pacific Region—is part of a larger effort in the department to assess demand for skills in East Asia and its implications for skill development. Policy Research Working Papers are also posted on the Web at http://econ.worldbank.org. The author may be contacted at [email protected].
categorized into three groups in relation to trends and patterns of demand for skills (Indonesia, Philippines, and Thailand; Vietnam and China; and Cambodia and Mongolia); and (e) industry premiums have increased in three countries of the region (Philippines, Thailand, and Cambodia). These trends point to several policy implications, including that governments should focus on policies promoting access to education to address the increasing demand for skills and/or persistent skill shortages; support general rather than specific curricula given broad-based increases in skill premiums in most countries; better tailor curriculum design and content and pedagogical approaches to the needs of the service sector; and target some social protection programs to unskilled workers to protect them from the “unequalizing” impact of education.

Industry and Skill Wage Premiums in East Asia (*)
Emanuela di Gropello
Human Development Unit East Asia Region The World Bank
e-mail: [email protected]
Chris Sakellariou Economics, HSS
Nanyang Technological University Singapore
e-mail: [email protected] (*) This paper is part of the Study on Openness and Labor Demand in East Asia (DECRG Research Grant (RSB-P110368)), which contributes to the broader Regional Study on Skills in East Asia. The paper also counted with the contribution of Hong Tan for the processing and analysis of Philippines data and indicators.
2
1. Context
East Asian countries are undergoing deep structural changes, with resources shifting from
agriculture to manufacturing and services, from resource-based products to labor-
intensive low technology products, and -- in some countries -- from the latter to
medium/high technology products. Some countries like Malaysia and Thailand are ahead
of others in this process, but most of the other countries of the region, including lower
income ones like Vietnam, are following close behind. The nature and the skills content
of jobs are changing in response to these deep structural shifts. Many jobs are being
created in relatively more skilled activities in manufacturing, but also in certain service
activities that require low and medium level skills that are nonetheless different from
those of the jobs being destroyed. In some rapidly-growing economies, such as China,
emerging skill shortages threaten to undermine the competitiveness of export oriented
firms. This evolving context raises key issues regarding the links between skills, labor
reallocation and productivity growth in East Asian economies, but this type of analysis
and research, which is rapidly developing for other regions including the OECD, LAC
and ECA, is still fairly scarce in East Asia.
The regional study on skills attempts to close this gap in two ways. First, it wants to
document in a systematic and comparable manner the evolution of skill/industry
premiums, and of the labor force composition across East Asian economies to identify
trends in the demand for skills and emerging skill gaps. Second, it wants to analyze the
relationship between openness and changes in labor demand. The central question in this
section will be whether openness is accompanied or not by skill upgrading, or, in other
words, is consistent with evidence of skill-biased technological change. A related
question is whether increased openness has benefited only skilled workers, or all workers
in certain sectors. The analysis will be performed by comparing how skill/industry
premiums and labor force composition relate to openness in a systematic and comparable
way across countries.
Understanding the evolution and determinants of the demand for skills is relevant from
both an academic and policy perspective. From an academic perspective, trade theory
indicates that increased trade has an ambiguous effect on skill premiums and demand for
3
skills in general (see, for instance, O'Connor and Lunati, 1999). On the one hand,
traditional trade theory suggests that with increased trade skill premiums should decrease
in labor-intensive countries. Recent studies, however, show that skill premiums can
increase if trade leads to the adoption of better performing skill-biased technologies
(Berman et al., 1998; Keller, 2004), or to increased skill-enhancing investments (Feenstra
and Hanson, 1997; Harrison and Hanson, 1999). Very few studies have documented these
issues in East Asia (see World Bank (2007) on Vietnam; Alatas and Bourguignon (2005)
and Abu-Ghaida and Connolly (2003) on Indonesia; Zeufack and Udomsaph (2006) on
Thailand; and Heckman and Li (2003) and Fajnzylber and Fernandes (2004) on China)
and most of them have not gone beyond the analysis of trends. Additionally,
methodologies differ across existing studies making it difficult to compare them. As little
is known about the evolution and drivers of skill premiums in East Asia, constructing
comparable measures to understand how skill demand evolved in these rapidly growing
countries, and linking these changes to variables such as trade and FDI will help shed
light on consequences of rapid export-led growth. From a policy perspective,
understanding the extent to which skill demand has increased, what has driven the
changes, which sectors have become more skill intensive, and which types of workers
remain vulnerable, can lead to key policy recommendations ranging from the expansion
and improved relevance of education opportunities, to a better targeting of social
protection and pro-poor policies in the region and reforms to improve the functioning of
labor markets.
This paper focuses on the estimation of skill/industry premiums and the labor force
composition (i.e., the proportion of skilled labor by sector) at the national and sectoral
level (one or two digit) with the objective to provide a comprehensive description of
trends in skill premiums and labor force composition over several years. Although no
attempt will be made to explain these trends, a comprehensive description will already
allow answering relevant questions such as: Did income inequalities increase or
decrease? Can we observe converging or diverging trends in the region regarding the
evolution of skill premiums and of the labor force composition? Are changes in skill
premiums generalized or industry-related? Is there evidence of labor market
segmentation?

4
The analysis in this report covers Indonesia, Philippines, Thailand, Vietnam, Cambodia,
Mongolia and urban China. Availability of data going back at least 10 years is a
requirement which was generally met. In the case of Cambodia there were only 3 usable
surveys available in the 1997-2007 period and in the case of China only 2 urban surveys
covering the 1999-2005 period.
2. Methodology
We will be looking at measures of skill and education premiums, and labor force
composition, focusing on both levels and trends. Subsequently, the analysis is extended
to industry premiums and sector/sub-sector analysis to reach a more precise definition
and fuller understanding of the role of skill premiums. In this broader analysis, skill
premiums are estimated following an approach similar to Goldberg and Pavcnik (2005).
Specifically, for each country and year the log of worker i's wage (ln(wijt)) is regressed on
worker i's characteristics (Hijt) such as gender and age; on whether, based on her
education, the worker is skilled or unskilled (Sijt); and on a set of industry j indicators (Iijt)
reflecting worker i's industry affiliation1:
where spjt represents the sectoral return to education (or skill premium) of sector j at time
t, and wpjt represents the industry premium. The estimated wage premiums will be then
presented as deviations from the employment-weighted average wage premium.
3. Data
Choosing among the datasets available for different countries focused on the existence of
an Industry of Employment variable, preferably at the 2-digit level. A 2-digit industry
classification was available for Indonesia and the Philippines; For Vietnam and
Cambodia, taking the smaller sample sizes into consideration, a 1-digit industry
classification was used. For Thailand, a 2-digit industry classification was available only
1 Location factors, such as region, province, city, etc, where also included in the regression for most countries without however significantly changing any of the results.

5
for heads of household, while a 1-digit classification was available for all members. The
surveys and years for different countries are as follows: Indonesia – Sakernas Survey for
years 1994, 1996, 1999, 2001, 2003, 2005 and 2007; Philippines – LFS Survey for years
1988, 1991, 1994, 1997, 2001, 2004, 2006; Thailand - - Socio-economic Survey for years
1990, 1992, 1994, 1996, 1998, 2000, 2002, 2004; Vietnam – VLSS for years 1992, 1998,
2004, 2006; Cambodia – Socio-economic Survey for years 1997, 2003-4 and 2007; China
– China Urban Labor Survey for years 1999 and 2005; and Mongolia – LSMS 1998,
2002 and 2007-8.
In estimating equation (1), the datasets were standardized across countries and years in
terms of variables used. The dependent variable is the logarithm of hourly wage, except
for Thailand where the dependent variable is the monthly wage, as the data did not
contain the necessary information for the calculation of the hourly wage. The estimation
sample contains workers over the age of 15. Data issues did not permit standardization of
the composition of the sample of workers across countries: thus for Indonesia and
Vietnam earnings are reported for those in wage employment; for the rest of the countries
the sample includes a mixture of workers employed for wages.
4. Results
4.1. Educational Attainment and Skilled Labor
Trends in educational attainment by country are reported in Tables A1- A7 in the
Appendix. The comparative percentage change in highest education qualifications over
time is reported in Table 1 below. At the beginning of the 1990s with the exception of
Cambodia, Thailand had the lowest educational attainment of the working population, as
reflected in the average years of schooling as well as the proportion of workers with
secondary or higher qualifications. Between 1990 and 2004 educational attainment in
Thailand increased dramatically at all levels, especially at the upper secondary and
tertiary levels with the proportion of workers with upper secondary and tertiary
qualifications doubling during the same period. A similar evolution of educational
attainment is observed in Indonesia. The proportion of workers with tertiary

6
qualifications (university and diploma) increased by more than 190 percent, with the
proportion of workers with university degrees increasing by almost 4 times. The
Philippines, prior to 1990 was the most educationally advanced among the countries
examined, with about 10 percent of its working population having university degrees by
1988. Subsequently, the proportion of workers with upper secondary or higher
qualifications increased further, albeit at a slower rate compared to Indonesia and
Thailand, having started from a higher base.
Vietnam faced considerable constraints to competitiveness and growth due to insufficient
education and labor skills in its workforce. The proportion of university educated
working population increased from 1.8 percent in 1992 to about 3.6 percent in 2006,
while the corresponding increase for those employed for wages (i.e., excluding the self-
employed) was from 6.7 percent in 1992 to about 13 percent in 2006. Smaller increases
are observed in upper secondary qualifications.
Table 1: Percentage change in highest education qualifications over time (workers with positive reported earnings)
Education % change
Indonesia 1994-07
Philippines1988-06
Thailand 1990-04
Vietnam 1992-06
Cambodia* 1997-07
China** 1999-05
Mongolia 1998-2007
Years of schooling 29.3 23.8 15.6 5.1 4.6 - Less than primary complete Primary Lower secondary Upper secondary general Upper sec. voc./higher voc. Tertiary
-69.8 -32.7 24.6 59.3 -9.6
190.3
-33.7 -30.9 5.3
45.0 -
37.1
-32.9 31.4 45.2 100.0 14.7 98.4
-33.2 -12.1 11.6 20.2 42.2 94.0
4.0 2.3
-12.2 -22.1
- 65.0
-59.3 -45.0 -16.6 19.3
- 15.2
- 31.2 9.8
59.7 180.6 -44.5
* Registered declines in the proportion of workers with secondary qualifications between 2003-4 and 2007 in Cambodia are probably attributable to differences in the composition of the sample of workers by type of employment. ** Urban areas only.
Establishing the evolution of educational attainment in Cambodia and comparing it to
other countries in SE Asia proved problematic: first, the time frame (1997-2007)2 is
shorter and does not extend to the early 1990s; second, comparison between cross
sections is problematic, as the composition of the (smaller) 2007 sample of workers with
2 Pending acquisition of the 1993 CSES.

7
reported wages is different from the 2003-4. The CSES data used suggest that between
1997 and 2007, educational attainment as measured by average years of schooling of
working population increased by about 31 percent (mostly because of large increases in
secondary and tertiary qualifications); however, when we consider the much smaller
sample of workers with reported earnings, the increase in average educational attainment
(years of schooling) is only about 5 percent over the 1997-2007 period, reflecting a small
increase in workers who are primary school educated and a large increase in tertiary
qualifications. Furthermore, the proportion of workers with secondary qualifications
shows a decline (Table 1).
In the case of China, the results are based on only 2 surveys of urban population spanning
the 1999-2005 period. Even during this relatively short period, the composition of
educational qualification of the working population changed substantially; the proportion
of workers with lower secondary or lower qualifications decreased drastically, while
those with upper secondary and tertiary qualifications increased by almost 20 percent and
15 percent respectively.
In Mongolia and the sample of wage employees with reported earnings, the composition
of education qualifications changes substantially over time, with the proportion of those
with upper secondary qualifications (especially vocational qualifications) increasing
substantially over the last decade and (counter-intuitively) the proportion of those with
tertiary (diploma or university) qualifications decreasing by 45 percent. This implies that
the 2007 sample of wage employees used was less skilled compared to the 1998 sample,
especially for those with tertiary qualifications.
Table 2 summarizes the over time changes in labor force composition by 1-digit industry
group (Tables A8 to A14 provide the details by country). One common finding is the
shift away from agriculture. The industries which gained in employment in Indonesia,
Philippines, Thailand, Vietnam and China (Cambodia is discussed separately), are Retail
and Wholesale trade as well as the Finance/Business sector within services. The share of
manufacturing increased somewhat in Thailand, while it decreased somewhat in
Indonesia the Philippines, Vietnam and the urban centers of China.

8
Table 2: Percentage change in Labor Force composition by selected industry group over time
(Workers with positive reported earnings) Industry % change
Indonesia 1994-07
Philippines 1988-06
Thailand1990-04
Vietnam 1992-06
Cambodia 1997-07
China 1999-05
Mongolia 1998-07
Agriculture/Forestry/Fishery Mining Manufacturing Utilities Construction Trade Transportation/Communication Finance/Business Other Services
-19.0 123.1 -11.7 20.0 -16.0 28.4 6.8
34.6 2.5
-27.8 -66.7 -12.1 0.0
22.0 37.2 54.0 117.6 -1.8
-22.1 0.0
10.6 -37.5 16.0 60.8 -12.5
- -9.5
-36.8* -
-10.0 22.2 53.5 97.9 0.0
122.2 8.5
-19.0* -
96.7 n/a
94.1 -47.2 26.2 171.4 -45.8
-81.8* -
-38.6 -60.8 -50.0 74.1 16.9 n/a
36.5
10.7 -
104.1 35.3 168.6 24.0 95.5
- -31.3
* Combined with Mining Using the sample of workers with reported earnings, in Cambodia (as reported in Table
2), besides the decline in the share of agriculture, other sectors which declined are trade
and other services (mostly due to a decline in the share of public administration). The
shares of manufacturing, construction and finance/business exhibited large increases over
the last decade. However, when using the larger sample of employed individuals, the
results are different with respect to the change in the share of trade: now this share shows
a small increase as opposed to a large decline; otherwise, the two sets of results for
Cambodia are generally consistent between the two samples.
With the exception of Cambodia (for upper secondary and above) and Mongolia, the
proportion of skilled workers in Indonesia, Philippines, Thailand, Vietnam and China
increased substantially on average (especially the proportion of workers with tertiary
education) as well as across almost all major industries (Tables 3a and 3b). Increasing
shares of skilled workers in the service sector combined with changing employment
shares in its favor make it as a particularly dynamic market for skilled workers – as will
be further confirmed with the wage skill premium analysis. The largest increase in
Indonesia, Thailand and the Philippines is observed in agriculture where the proportion of
skilled workers (defined as those with upper secondary education or higher), while it still
remains low, nearly tripled in Indonesia and more than doubled in Thailand. In Vietnam
the largest increase is found in transportation/communication, while the proportion of

9
skilled workers in agriculture decreased moderately. In China, substantial increases are
observed in all industries except agriculture, utilities and other services.
Table 3a: Proportion of skilled workers by selected industry group over time (Workers with positive earnings)
Industry % Upper Secondary and above Indonesia
1996 2007 ChangePhilippines
1988 2006 Change Thailand
1990 2004 ChangeVietnam
1992 2006 change Agriculture Mining Manufacturing Utilities Construction Trade Transp/Comm. Finance/Business Public Admin. Other Services
6.2 16.1 9.9 32.4 40.0 7.6 33.5 40.1 6.6 72.4 79.9 7.5 20.3 29.9 9.6 54.3 56.3 2.0 36.2 45.7 9.5 86.4 84.1 -2.3 67.9 80.8 12.9
-
29.6 41.0 11.4 54.6 47.7 -6.9 59.5 77.8 18.3 89.9 98.0 8.1 52.9 66.0 13.1 60.4 77.9 17.5 67.4 77.5 10.1 94.9 96.5 1.6 92.1 91.2 -0.9 92.3 91.8 -0.5
2.4 5.6 3.2 25.0 33.3 8.3 16.4 28.9 12.5 52.8 57.6 4.8 9.9 13.8 3.9 17.5 28.5 11.0 21.0 30.4 9.4
- -
42.8 67.0 24.2
8.6 7.7 -0.9 46.9 47.0 0.1 21.4 22.6 1.2 65.0 88.1 23.1 17.7 20.0 2.3 29.5 43.3 13.8 31.1 61.5 30.4 70.0 81.6 11.6
- 64.3 78.6 14.3
Mean * Mean (1) Mean (2)
- 44.2 55.5 11.3 9.0 19.1 10.1
49.6 65.9 16.3 19.2 27.3 8.1
- 17.7 28.8 11.1 6.1 12.1 6.0
- 29.1 36.7 7.6 6.7 13.0 6.3
Table 3a continued
Industry % Upper Secondary and above Cambodia
1997 2007 ChangeChina
1999 2005 Change Mongolia
1998 2007 change Agriculture Mining Manufacturing Utilities Construction Trade Transp/Comm. Finance/Business Public Admin. Other Services
6.2 2.3 -3.9 -
17.2 16.4 -0.8 -
10.4 14.1 3.7 13.2 23.9 10.7 16.4 16.9 0.5 54.5 52.4 -2.1 49.4 53.4 4.0 51.4 67.7 16.3
64.5 68.0 4.5 n/a
49.0 60.3 11.3 57.5 57.6 0.1 48.4 74.1 25.7 46.2 61.0 14.8 55.4 62.4 7.0
n/a 74.3 86.2 11.9 66.8 69.3 2.5
69.4 63.7 -5.7 -
81.2 81.7 0.5 82.2 77.1 -5.1 80.4 70.0 -10.4 80.6 81.1 0.5 89.6 83.0 -6.6
- 90.8 91.3 0.6 85.4 88.3 2.9
Mean * Mean (1) Mean (2)
26.9 24.5 -2.4 10.5 10.0 -0.5 0.02 0.033 1.3
- 56.4 66.5 10.1 21.0 24.3 3.3
- 84.9 82.2 -2.7 58.2 32.8 -25.4

10
Table 3b: Percentage change in the proportion of skilled workers by selected industry group over time
(Workers with positive reported earnings) Industry % Upper Secondary and above
Indonesia 1996-07
Philippines 1988-06
Thailand 1990-04
Vietnam 1992-06
Cambodia 1997-07
China 1999-05
Mongolia 1998-07
Agriculture Mining Manufacturing Utilities Construction Trade Transportation/Commun. Finance/Business Public Admin. Other Services
159.7 23.5 19.7 10.4 47.3 3.7
26.2 -2.7 19.0
-
38.5 -12.6 30.8 9.0
24.8 29.0 15.0 1.7 -1.0 -0.5
133.3 33.2 76.2 9.1
39.4 62.9 44.8
- -
56.5
-11.4 0.2 5.6 1.1
-10.7 23.7 34.7 13.1
- 12.8
-62.9 -
-4.6 -
35.5 81.1 3.0
-2.0 8.1
22.9
7.1 n/a
23.1 0.0
53.1 32.0 12.6 n/a
16.0 3.7
-8.1 -
0.6 -6.2
-12.9 0.6 -7.4
- 0.6 3.4
Mean % change * Mean % change (1) Mean % change (2)
- 25.6
112.2
- 32.9 42.2
- 62.7 98.4
- 26.1 94.0
-8.9 -4.8 65.0
- 17.9 15.7
- -3.2
-43.6 (1) Secondary education and above; (2) Tertiary education and above. * Lower secondary and above.
In Cambodia, once again the findings with respect to changes in skilled labor need to be
contrasted between sample compositions (all employed workers vs. workers with
reported earnings). In the case of the former, the proportion of skilled workers increased
across the board and much more in agriculture, trade and construction (by 127, 79 and 69
percent respectively) and by only slightly in manufacturing and services. Overall, the
proportion defined as those with lower secondary and higher qualifications increased by
60 percent, while the proportion of workers with upper secondary or tertiary
qualifications increased by 45 percent. Once the sample is restricted to workers with
reported earnings (Table 3), the findings change drastically, especially with respect to
changes in agriculture. Now the proportion of skilled workers in agriculture exhibits a
large decline of about 63 percent over the 1997-2007 period. Overall, the proportion of
skilled workers independently of industry group registers a decline. On the other hand,
the proportion of workers with tertiary qualifications exhibits a large increase.
Finally in Mongolia, small changes in skill composition are observed across industries,
with most industries showing declines in the proportion of skilled workers. As in the case
of Cambodia, here too there are data issues; as reported earlier, in the (lager) 2007 LSMS

11
the proportion of skilled workers (especially those with diplomas and university
qualifications) is significantly smaller compared with the (smaller) 1998 and 2002
samples.
4.2. Estimates of Education/Skill Premiums and Labor Force Composition
The tables below summarize the changes in skill premiums in each country. In
interpreting the estimates in Tables 4-10, the base education level/skill on which other
dummy variables are based are as follows: in Tables 4a-10a the base (reference)
education level is “less than completed primary”; however, the presented return estimates
for education levels higher than primary are given in comparison to primary. Thus, in
Indonesia in 1994, the estimate of 1.125 for tertiary over primary is the difference in
coefficients for tertiary and primary in the estimated earnings equation. Dividing 1.125
by the difference in years of education between tertiary and primary education (10 years)
implies an annualized return of about 11.2%. Similarly, if one wants to derive an estimate
of the return to tertiary over senior secondary (instead of primary), this would be the
difference between 1.125 and 0.596, that is 0.529; annualized this implies an average
return of 13.2% for each year of tertiary education over senior secondary. In Tables 4b-
10b a single dummy for skill is used with two alternative specifications: senior secondary
and above vs. lower secondary and below and tertiary vs. senior secondary and below.
Tables A15 to A21 provide more details on returns by education level by country.
In Indonesia, education premiums declined with the exception of primary education. The
largest decline in education premiums over time occurred in junior and senior secondary
education, with a smaller decline in tertiary education premiums and a small increase in
the premium of primary education. Within senior secondary education, most of the
decline in premiums is associated with vocational-technical education. To a large extent,
the findings are similar for Thailand: Accounting for the effect of industry affiliation in
the regressions, we see declining premiums in junior and senior secondary education and
a smaller decline in tertiary education, along with a small increase in primary education
premiums. As in the case of Indonesia, most of the decline in premiums in secondary
education is associated with vocational-technical education. In fact, with only basic
controls, premiums are on the rise in general senior Ssecondary and tertiary education. In

12
Vietnam, with the exception of tertiary education, education premiums were negative
prior to the Doi Moi reforms. Following the reforms, premiums soared for every
education level and more so for tertiary qualifications. Very large increases in returns
were observed for technical/Vvocational secondary education which was associated with
significantly negative returns (compared to primary) in 1992. Subsequently, the increase
in returns to secondary TVET outpaced that of secondary general education, and by 2006
the return to TVET slightly exceeded that of general education. In Cambodia and the
Philippines, comparison of estimates without and with controlling for industry affiliation
suggests that a large part of the increases in returns to education is industry-specific. In
Cambodia, even after controlling for industry affiliation, education premiums have
roughly doubled for secondary and tertiary education; while premiums decrease in the
Philippines after controlling for industry affiliation. In urban China, between 1999 and
2005, the largest increases in education premiums were observed for secondary
education, followed by tertiary education; no evidence of an increase in primary
education premiums was found. Finally, in Mongolia, skill premiums seem to have been
stagnant between 1998 and 2002 and subsequently increased drastically by 2007. This
suggests that during recent years an excess demand for skilled workers may have
developed. Within education levels, the largest increases were for tertiary diplomas and
university education.

13
Indonesia Table 4a : Returns to levels of education - Employed for wages
1994 2007 Change (%) 2007-1994
Basic controls only - Primary - Junior Sec./primary - Senior Sec./ primary - Tertiary/primary
0.213 0.234 0.596 1.125
0.242 0.128 0.508 1.084
13.6 -45.3 -14.8 -3.6
Basic controls + Industry dummies - Primary - Junior Sec./primary - Senior Sec./ primary - Tertiary/primary
0.195 0.235 0.610 1.137
0.243 0.126 0.498 1.070
25.1 -46.4 -18.4 -5.9
Table 4b:Returns to skill over time – Employed for wages
1994 2007 Change (%) 2007-1994
Basic controls only - High school general/ primary - High school vocational/ primary - Tertiary/primary
0.527 0.663 1.123
0.486 0.547 1.084
-7.8 -17.5 -3.5
Basic controls + Industry dummies - High school general/ primary - High school vocational/ primary - Tertiary/primary
0.545 0.678 1.139
0.479 0.526 1.056
-12.1 -22.4 -7.3
1994 2007 Change (%) 2007-1994
(2007-1996) Basic controls only - Upper Sec. and above/ Low sec. and below - At least some tertiary/Secondary and below
0.696 0.891
0.683 0.849
-1.9 -4.7
Basic controls + Industry dummies - Upper Sec. and above/ Low sec. and below - At least some tertiary/Secondary and below
0.677 0.819
0.622 0.771
-8.1 (-6.2) -5.9 (-2.1)

14
Philippines
Table 5a: Returns to levels of education - Employed for wages 1988 2006 Change (%)
2006-1988 Basic controls only - Secondary/primary - Tertiary/primary
0.415 1.075
0.492 1.184
18.5 10.1
Basic controls + Industry dummies - Secondary/primary - Tertiary/primary
0.254 0.691
0.201 0.593
-20.9 -14.1
Table 5b: Returns to skill over time – Employed for wages
1988 2006 Change (%) 2006-1988
Basic controls only - Some Sec. and above/ Primary. and below - At least some tertiary/Secondary and below
0.415 0.660
0.492 0.693
18.5 5.0
Basic controls + Industry dummies - Some Sec. and above/ Primary and below - At least some tertiary/Secondary and below
0.254 0.437
0.201 0.392
-20.9 -10.3

15
Thailand
Table 6a: Returns to levels of education - Employed for wages 1990 2004 Change (%)
2004-1990 Basic controls only - Primary - Junior Sec./primary - Senior Sec./ primary - Tertiary/primary
0.301 0.374 0.636 1.093
0.394 0.316 0.603 1.289
30.9 -15.5 -5.2 17.9
Basic controls + Industry dummies - Primary - Junior Sec./primary - Senior Sec./ primary - Tertiary/primary
0.221 0.306 0.571 1.089
0.253 0.214 0.430 1.072
14.5 -30.1 -24.6 -1.5
Table 6b: Returns to skill over time – Employed for wages
1990 2004 Change (%) 2004-1990
Basic controls only - High school general/ primary - High school vocational/ primary - Tertiary/primary
0.471 0.730 1.097
0.482 0.719 1.289
2.3 -1.5 17.5
Basic controls + Industry dummies - High school general/ primary - High school vocational/ primary - Tertiary/primary
0.389 0.666 1.094
0.327 0.533 1.078
-15.9 -20.0 -1.5
1990 2004 Change (%) 2004-1990
Basic controls only - Upper Sec. and above/ Low sec. and below -At least some tertiary/Secondary and below
0.857 1.074
0.989 1.259
15.4 17.2
Basic controls + Industry dummies - Upper Sec. and above/ Low sec. and below - At least some tertiary/Secondary and below
0.846 1.056
0.696 0.955
-17.7 -9.6

16
Vietnam Table 7a: Returns to levels of education - Employed for wages
1992 2006 Change * 2006-1992
Basic controls only - Primary - Junior Sec./primary - Senior Sec./ primary - Tertiary/primary
-0.019 -0.172 -0.175 0.00
0.094 0.055 0.210 0.648
0.113 0.227 0.385 0.648
Basic controls + Industry dummies - Primary - Junior Sec./primary - Senior Sec./ primary - Tertiary/primary
-0.018 -0.167 -0.123 0.151
0.080 0.039 0.195 0.638
0.098 0.206 0.318 0.487
* Changes rather than percentage changes are given.
Table 7b: Returns to skill over time – Employed for wages
* Changes rather than percentage changes are given.
1992 2006 Change * 2006-1992
Basic controls only - High school general/ primary - High school vocational/ primary - Tertiary/primary
-0.040 -0.222 0.023
0.147 0.211 0.648
0.187 0.433 0.625
Basic controls + Industry dummies - High school general/ primary - High school vocational/ primary - Tertiary/primary
0.001 -0.167 0.135
0.142 0.187 0.634
0.141 0.354 0.499
1992 2006 Change * 2006-1992
Basic controls only - Lower Sec. and above/ primary and below - Upper Sec. and above/ Low sec. and below - At least some tertiary/Secondary and below
-0.206 -0.100 0.146
0.242 0.414 0.545
0.448 0.514 0.399
Basic controls + Industry dummies - Lower Sec. and above/ primary and below - Upper Sec. and above/ Low sec. and below - At least some tertiary/Secondary and below
-0.082 0.030 0.239
0.170 0.276 0.516
0.252 0.246 0.277

17
Cambodia
Table 8a: Returns to levels of education - Employed for wages 1997 2007 Change (%)
2007-1997 Basic controls only - Primary - Junior Sec./primary - Senior Sec./ primary - Tertiary/primary
0.124 0.087 0.129 0.349
0.330 0.265 0.462 1.097
166.1 204.6 258.1 214.3
Basic controls + Industry dummies - Primary - Junior Sec./primary - Senior Sec./ primary - Tertiary/primary
0.127 0.063 0.119 0.361
0.173 0.128 0.208 0.761
36.2 103.2 74.8 110.8
Table 8b: Returns to skill over time – Employed for wages
1997 2007 Change (%) 2007-1997
Basic controls only - Lower Sec. and above/ primary and below - Upper Sec. and above/ Low sec. and below - At least some tertiary/Secondary and below
0.174 0.154 0.190
0.518 0.595 0.939
197.7 286.4 394.2
Basic controls + Industry dummies - Lower Sec. and above/ primary and below - Upper Sec. and above/ Low sec. and below - At least some tertiary/Secondary and below
0.146 0.155 0.302
0.256 0.301 0.630
75.3 94.2 108.6

18
China
Table 9a: Returns to levels of education - Employed for wages 1999 2005 Change (%)
2005-1999 Basic controls only - Primary - Junior Sec./primary - Senior Sec./ primary - Tertiary/primary
0.095 0.054 0.192 0.607
0.131 0.159 0.466 0.958
37.9 194.4 142.7 57.8
Basic controls + Industry dummies - Primary - Junior Sec./primary - Senior Sec./ primary - Tertiary/primary
0.108 0.052 0.178 0.538
0.089 0.163 0.468 0.930
-17.6 213.5 162.9 72.9
Table 9b: Returns to skill over time – Employed for wages
1999 2005 Change (%) 2005-1999
Basic controls only - Upper Sec. and above/ Low sec. and below - At least some tertiary/Secondary and below
0.271 0.454
0.475 0.609
75.3 34.1
Basic controls + Industry dummies - Upper Sec. and above/ Low sec. and below - At least some tertiary/Secondary and below
0.239 0.397
0.456 0.578
90.8 45.6

19
Mongolia Table 10a : Returns to levels of education - Employed for wages
* Estimates not statistically significant except for university. ** Estimates not statistically significant except for higher diploma and university. *** Estimates are all statistically significant except for primary. **** Changes rather than percentage changes are given.
1998* 2002** 2007-8*** Change**** 1998-2007
Basic controls only Primary Junior Sec./primary Senior Sec./ primary Higher Diploma/primary University/primary
-0.250
0.521
0.603
0.667
0.979
0.059
0.203
0.249
0.500
0.705
0.116
0.290
0.786
1.306
1.387
0.366
-0.231
0.183
0.639
0.408 Basic controls + Industry dummies Primary Junior Sec./primary Senior Sec./ primary Higher Diploma/primary University/primary
-0.243
0.463
0.520
0.592
0.896
0.074
0.195
0.259
0.524
0.725
0.108
0.292
0.776
1.294
1.365
0.351
-0.171
0.252
0.702
0.469
1998 2002 2007-8 Change****1998-2007
Basic controls only High school general/ primary High school vocational/ primary Tertiary/primary
0.650
0.525
0.854
0.215
0.325
0.603
0.743
0.874
1.349
0.093
0.349
0.495

20
****Changes rather than percentage changes are given.
Table 10b: Returns to skill over time – Employed for wages
**** Changes rather than percentage changes are given.
Basic controls + Industry dummiesHigh school general/ primary High school vocational/ primary Tertiary/primary
0.567
0.438
0.773
0.223
0.335
0.624
0.736
0.865
1.332
0.169
0.427
0.559
1998 2002 2007-8 Change**** 1998-2007
Basic controls only Upper secondary and above/ Lower Secondary and below At least some tertiary/ Secondary and below
0.315
0.299
0.264
0.376
0.769
0.701
0.454
0.411
Industry dummies included Upper secondary and above/ Lower Secondary and below At least some tertiary/ Secondary and below
0.280
0.286
0.282
0.392
0.743
0.684
0.463
0.398

21
The charts below (Figures 1 to 7) show the evolution of skill premiums along with the evolution of
the proportion of skilled labor –indicating increasing demand for skilled labor in most countries. In
Indonesia, while the skilled workforce increased and leveled off after 2003, skill premiums slightly
declined after 2000, rebounding moderately by 2007. In the Philippines, against the backdrop of
increasing supply of skilled labor, without controlling for industry affiliation the return to skill is
showing an increasing trend after 1994. However, after controlling for industry affiliation, the
return to skill declined slightly especially after 1997. In Thailand, the significant increases in
supply of skilled workers were mirrored with a leveling off and slight decline of the skill premium
after 1994, but, overall, skill premiums have been increasing over the long run. For Vietnam, there
is evidence of significant excess demand of skilled labor. Premiums have increased sharply
throughout the period, starting with negative premiums prior to the reforms. In Cambodia, while
supply of skills increased only moderately over the last decade, skill premiums increased sharply
between 1997 and 2003 (indicating an excess demand for skilled labor during this period), then
leveled off indicating sluggish demand for skilled labor in recent years. In China skill premiums
increased sharply in urban areas between 1999 and 2005, despite significant increases in the supply
of skilled labor. Finally for Mongolia the charts highlight the sharp rebound of skill premiums in
recent years.

22
Figure 1 (a): Indonesia Skill Premiums – basic controls
Indonesia: Skill Premium and Skilled Workforce - Basic controls only
00.10.20.30.40.50.60.70.80.9
1
1994 1999 2001 2003 2005 2007
Year
Ski
ll p
rem
ium
an
d p
rop
ort
ion
o
f sk
illed
wo
rkfo
rce Skilled-1: At least
Upper Secondary
Skilled-2: Tertiary andabove
Skill premium-1
Skill premium-2
Figure 1 (b): Indonesia Skill Premiums – industry controls
Indonesia: Skill Premium and Skilled Workforce - With Industry controls
0
0.1
0.2
0.3
0.4
0.5
0.6
0.7
0.8
0.9
1994 1999 2001 2003 2005 2007Year
Sk
ill
pre
miu
m a
nd
pro
po
rtio
n
of
sk
ille
d w
ork
forc
e
Skilled-1: At leastUpper Secondary
Skilled-2: Tertiary andabove
Skill premium-1
Skill premium-2

23
Figure 2 (a): Philippines Skill Premiums – basic controls
Figure 2 (b): Philippines Skill Premiums – industry controls
Philippines: Skill Premium and Skilled Workforce - Basic controls only
0
0.1
0.2
0.3
0.4
0.5
0.6
0.7
0.8
1988 1991 1994 1997 2001 2004 2006
Year
Ski
ll p
rem
ium
an
d p
rop
ort
ion
of
skill
ed
wo
rkfo
rce
Skilled-1: At least Secondary
Skilled-2: Tertiary andabove
Skill premium-1
Skill premium-2
Philippines: Skill Premium and Skilled Workforce - With Industry controls
0
0.1
0.2
0.3
0.4
0.5
0.6
0.7
1988 1991 1994 1997 2001 2004 2006
Year
Skilled-1: At leastSecondary
Skilled-2: Tertiary andabove
Skill premium-1
Skill premium-2
Sk
ill p
rem
ium
an
d p
rop
orti
on o
f sk
ille
d
wor
kfo
rce

24
Figure 3 (a): Thailand Skill Premiums – basic controls
Thailand: Skill Premium and Skilled Workforce- Basic controls only
0
0.2
0.4
0.6
0.8
1
1.2
1.4
1990 1994 2000 2004
Year
Ski
ll P
rem
ium
an
d
Pro
po
rtio
n o
f S
kille
d
Wo
rker
sSkilled-1: UpperSecondary and above
Skilled-2: Tertiary andabove
Skill Premium-1
Skill Premium-2
Figure 3 (b): Thailand Skill Premiums – industry controls
Thailand: Skill Premium and Skilled Workforce- With Industry controls
0
0.2
0.4
0.6
0.8
1
1.2
1990 1994 2000 2004
Year
Ski
ll P
rem
ium
an
d
Pro
po
rtio
n o
f S
kill
ed
Wo
rker
s
Skilled-1: UpperSecondary and above
Skilled-2: Tertiary andabove
Skill Premium-1
Skill Premium-2

25
Figure 4 (a): Vietnam Skill Premiums – basic controls
Vietnam: Skill Premium and Skilled Workforce - Basic controls only
-0.2
-0.1
0
0.1
0.2
0.3
0.4
0.5
0.6
1992 1998 2004 2006
Year
Ski
ll p
rem
ium
an
d
pro
po
rtio
n o
f sk
illed
w
ork
ers
Skilled-1: At least UpperSecondary
Skilled-2: Tertiary andabove
Skill Premium-1
Skill Premium-2
Figure 4 (b): Vietnam Skill Premiums – industry controls
Vietnam: Skill Premium and Skilled Workforce - With Industry controls
0
0.1
0.2
0.3
0.4
0.5
0.6
1992 1998 2004 2006Year
Ski
ll p
rem
ium
an
d
pro
po
rtio
n o
f sk
illed
w
ork
ers
Skilled-1:UpperSecondary and above
Skilled-2: Tertiary andabove
Skill Premium-1
Skill Premium-2

26
Figure 5 (a): Cambodia Skill Premiums – basic controls
Cambodia: Skill Premium and Skilled Workforce - Basic controls only
00.10.20.30.40.50.60.70.80.9
1
1997 2003-4 2007
Year
Sk
ill
pre
miu
m a
nd
p
rop
ort
ion
of
sk
ille
d
wo
rke
rsSkilled-1: At leastLower SecondarySkilled-2: At leastUpper SecondarySkilled-3: Tertiary andaboveSkill Premium-1
Skill Premium-2
Skill Premium-3
Figure 5 (b): Cambodia Skill Premiums – industry controls
Cambodia: Skill Premium and Skilled Workforce - With Industry controls
0
0.1
0.2
0.3
0.4
0.5
0.6
0.7
0.8
1997 2003-4 2007
Year
Ski
ll p
rem
ium
an
d p
rop
ort
ion
o
f sk
ille
d w
ork
ers
Skilled-1: At leastLower SecondarySkilled-2: At leastUpper SecondarySkilled-3: Tertiary andaboveSkill Premium-1
Skill Premium-2
Skill Premium-3

27
Figure 6 (a): China Skill Premiums – basic controls
China: Skill Premium and Skilled Workforce - Basic controls only
0
0.1
0.2
0.3
0.4
0.5
0.6
0.7
1999 2005
Year
Ski
ll p
rem
ium
an
d p
rop
ort
ion
o
f sk
ille
d w
ork
ers
Skilled-1: At leastUpper Secondary
Skilled-2: Tertiary andabove
Skill Premium-1
Skill Premium-2
Figure 6 (b): China Skill Premiums – industry controls
China: Skill Premium and Skilled Workforce - With Industry controls
0
0.1
0.2
0.3
0.4
0.5
0.6
0.7
1999 2005
Year
Ski
ll p
rem
ium
an
d p
rop
ort
ion
o
f sk
ille
d w
ork
ers
Skilled-1: At leastUpper Secondary
Skilled-2: Tertiary andabove
Skill Premium-1
Skill Premium-2

28
Figure 7 (a): Mongolia Skill Premiums – basic controls
Mongolia: Skill premium and Skilled Workforce - Basic controls only
0
0.1
0.2
0.3
0.4
0.5
0.6
0.7
0.8
0.9
1998 2002 2007
Year
Ski
ll pre
miu
m a
nd p
roport
ion o
f
skill
ed w
ork
ers Skilled1: At least
Upper Secondary
Skilled-2: Tertiary andabove
Skilled Premium-1
Skilled Premium-2
Figure 7 (b): Mongolia Skill Premiums – industry controls
Mongolia: Skill premium and Skilled Workforce - with industry controls
0
0.1
0.2
0.3
0.4
0.5
0.6
0.7
0.8
0.9
1998 2002 2007
Year
Ski
ll pre
miu
m a
nd p
roport
ion o
f
skill
ed w
ork
ers
Skilled1: At leastUpper Secondary
Skilled-2: Tertiaryand above
Skilled Premium-1
Skilled Premium-2

29
Tables 11a and 11b report changes in wage premiums for selected skill definitions
associated to education qualifications. Together with the change in supply of skills, they
are revealing of the evolution of excess demand or excess supply of skills over time.
There seems to be a divide between three groups of countries: Indonesia, Philippines and
Thailand; Vietnam and China; and Cambodia and Mongolia. For the first group of
countries, the increase in the supply of skills over time has been very strong and seems to
have been accompanied by a slight decrease (Indonesia) or moderate increase in wage
skill premiums with only basic controls and a moderate decline in wage skill premiums
controlling for industry affiliation. Overall, these trends indicate moderate but still
sustained demand for skills, to a large extent driven by industry affiliation in the
Philippines and Thailand – that is skills rewards tend to be increasingly industry specific
in these two countries.
Table 11a: Percentage change in the return to skill over time with basic controls only
Qualification % change Indonesia 1994-07
Philippines1988-06
Thailand 1990-04
Vietnam 1992-06
Cambodia 1997-07
China 1999-05
Mongolia1998-07
Lower Sec. and above/ Primary and below
- - - * 197.7 - -
Upper Sec. and above/ Low sec. and below
-1.9
18.5
15.4
**
286.4
75.3
144.1
Tertiary/ Secondary and below
-4.7 5.0 17.2 273.2 394.2 34.1 134.4
* Premium increased sharply from approximately -21% in 1992 to about 24% in 2006. ** Premium increased from -10% in 1992 to about 41% in 2006.

30
Table 11b: Percentage change in the return to skill over time with industry controls Qualification % change
Indonesia 1994-07 (1996-07)
Philippines1988-06
Thailand 1990-04
Vietnam 1992-06
Cambodia 1997-07
China 1999-05
Mongolia1998-07
Lower Sec. and above/ Primary and below
- - - * 75.3 - -
Upper Sec. and above/ Low sec. and below
-8.1
-20.9
-17.7
**
94.2
90.8
165.3
Tertiary/ Secondary and below
-5.9 (-2.1)
-10.3 -9.6 115.9 108.6 45.6 134.5
* Premium increased sharply from approximately -8% in 1992 to about 17% in 2006. ** Premium increased by 9 times from 3% in 1992 to about 28% in 2006.
On the other hand, in the case of Vietnam, Cambodia, Mongolia and China we see much
higher increase in wage skill premiums, even after controlling for industry affiliation,
combined with increases in the supply of skills over time (Vietnam and China) and a
stagnation or decrease (Cambodia and Mongolia). An excess in the demand for skills is
the most likely explanation for the trends in China and Vietnam; while shortage of skills
is a likely explanation for the trends in Cambodia and Mongolia.
The estimates for Vietnam confirm that Vietnam – a country which has experienced
strong growth – has faced constraints to growth due to insufficient skills. The increase in
wage premiums over the 1992-2006 period has been striking, especially for tertiary
qualifications. The reported increases in wage premiums evolved mostly during the 1998-
2004 period in the case of secondary qualifications and between 1992 and 1998 for
tertiary qualifications
Education reforms, especially at the higher education level were part of the Doi Moi
market oriented reforms of the 1990s in Vietnam. Before the implementation of the
reforms, public sector remuneration policy let to a compression of earnings differentials

31
across education groups. The process of dismantling the old public sector wage system
began in 19903. Salaries of public servants were to be set according to market rates, and
the salary wage structure would reward public sector workers according to education
level, job responsibility and performance4. The implementation of these reforms led to an
increase in the demand for certain types of labor, particularly in trade and services. This
resulted in a shortage of high level technical experts, skilled technical workers,
administrative and managerial experts and researchers, among others (Nguyen et. al
1991; Sakellariou and Patrinos 2000). As a result of the Doi Moi policies, employment
growth was highest in the private sector which absorbed most new labor market entrants
and workers let go from the by government and state enterprises.
What we see with respect to the development of education premiums over time in
Vietnam is that the increase in premiums is higher the higher the education qualification
(Tables A18a-A18d). For example, Senior Secondary and Tertiary premiums quadrupled
over the 1992-2006 period, and most of the increase took place in the middle to late
1990s coinciding with the Doi Moi reforms.
In the case of China, as in the case of Vietnam, premiums increase with higher
qualifications. Large increases in premiums are found for Senior Secondary and tertiary
education, while the premium of primary education remained approximately constant
over the 1999-2005 period.
Despite the similarity in the growth of wage premiums over time between Cambodia and
Vietnam, the source of the developments in wage premiums in Cambodia is probably
different. Wage premiums exhibited an impressive growth at all levels in Cambodia as
was the case in Vietnam. However, in Cambodia, the increases in the return to skill took
place during the 1997-2003 period and stagnated thereafter. Overall, with the exception
of Tertiary education where we observe a large increase in premiums over time (again
3 Remuneration of public sector workers ceased to be based on length of service and jobs were no longer guaranteed for life (Hiebert 1993; Norlund 1993). 4 The full impact of these reforms probably came only years later, since those hired prior to 1994 were largely exempted (World Bank 1996).

32
most of it during the 1997-2003 period) despite the doubling of the proportion of workers
with tertiary qualifications, only a modest increase in premiums is observed for lower
education qualifications, due to the stagnation of premiums after 2003.
The economy of Cambodia did not go into a phase of high growth as was the case in
Vietnam. Ridao-Cano (2003) tried to identify key constraints in the development of new
sources of economic growth in terms of the supply of skills. Some of the questions
addressed are: (i) What is the supply of skills in the labor market; (ii) What is the demand
for skilled and educated workers in the labor market; (iii) How adequate is the current
supply of skills to the current demand for skills in the labor market - do these reflect a
shortage on the supply side or demand side? (iv) Is the current supply of skills a
constraint to the development of new sources of growth (as opposed to current sources of
growth)? He found that although the current supply of skills is low, there does not appear
to be a strong demand for skills in the current labor market, which results in an overall
adequacy of skills supplied and skills demanded. The high and increasing estimated
returns to schooling in the labor market reflect a shortage in the supply of skills rather
than an excess in the demand for skills.
Finally in Mongolia, skill premiums almost tripled over the last decade, mostly due to a
sharp increase in recent years. This increase in skill premiums is mainly due to higher
premiums for tertiary education; however the increase in skill premiums for other levels
of education is also significant. The increase has been accompanied by decreases in the
supply of skilled labor.
4. 3. Evolution of Industry5 and Skill Premiums across Countries, Sectors and Time
Table 12 summarizes the evolution of average industry and skill premiums weighted by
industry shares, across countries and time. Equation (1) was estimated, resulting in 5 The industry disaggregation varies between countries, depending on whether the industry affiliation variable in the dataset is available at the 1-digit, or 2-digit level, as well as at the cell numbers of useable observations per industry group. For Indonesia and the Philippines industry was available at the 2-digit level. However, in the cases of Thailand, Vietnam, Cambodia and China it was only available at the 1-digit level.

33
estimates of industry and skill coefficients by industry group. The sum of the weighted
coefficients of industry and skill for each country are the average premiums for each
year. In estimating industry premiums, the excluded group is Agriculture. In estimating
skill premiums, the excluded group is unskilled workers irrespectively of industry
affiliation.
The interpretation of the industry premium for a particular industry group is the
percentage change in the hourly wage from working in that particular industry in
comparison to working in Agriculture. The sum of the weighted premiums over the n-1
industry premiums for each industry group is a measure of the average industry premium
(vs. Agriculture) for that year. For example, in the case of the Philippines, the average
industry premium in 1991 was approximately 7.3 percent, with Agriculture being the
comparison group.
Similarly, the interpretation of the premium for being a skilled worker (upper secondary
or higher / tertiary or higher) within a particular industry group is the percentage change
in the hourly wage from being a skilled worker in that particular industry in comparison
to being an unskilled worker anywhere. The sum of the n skill premiums is a measure of
the average skill premium for that year. For example, in the case of the Philippines, the
average skill premium (upper secondary and above) for year 1988 was approximately
26.5 percent in comparison to unskilled workers anywhere, and the average skill
premium (tertiary and above) for the same year was just over 40 percent.
Table 12: Industry and Skill Premiums across Countries and Time Mean Wage Premiums Indonesia
1994-07 (1996-07)
Philippines 1988-06
Thailand 1990-04
Vietnam 1992-06
Cambodia 1997-07
China 1999-05
Mongolia 1998-07 Stand. Industry Premium:
Excluded: Agriculture 1988 0.085 1990 0.481 1991 0.073 1992 -0.033 1994 0.045* 0.098 0.584 1996 0.156 1997 0.108 0.122 0.086 1998 -0.15 0.271

34
1999 0.093 -0.030 2000 0.734 2001 0.129 0.226 2002 2003 0.101 0.385 2004 0.207 0.646 -0.007 2005 -0.008 -0.356 2006 0.194 -0.011 2007
-0.01 0.412 0.047
Change in average Industry Premium
-0.055 (-0.166)
0.109 0.165 0.022 0.326 -0.326 -0.224
Stand. Skill Wage Premium (Secondary and above)**
1988 0.265 1990 0.837 1991 0.273 1992 -0.044 1994 0.544* 0.245 0.868 1996 0.604 1997 0.619 0.269 0.091 1998 0.090 0.299 1999 0.611 0.274 2000 0.745 2001 0.647 0.258 2002 2003 0.584 0.324 2004 0.276 0.662 0.289 2005 0.607 0.479 2006 0.296 0.281 2007 0.650 0.270 0.714 Change in average Skill Premium
0.106 (0.046)
0.031 -0.175 0.325 0.179 0.205 0.415
Stand. Skill Wage Premium (Tertiary and above)***
1988 0.414 1990 1.087 1991 0.406 1992 0.229 1994 0.769* 0.381 1.248 1996 0.803 1997 0.865 0.402 0.204 1998 0.266 0.281 1999 0.748 0.412 2000 1.232 2001 0.730 0.378 2002 2003 0.721 0.455 2004 0.390 1.088 0.474 2005 0.694 0.583

35
2006 0.377 0.569 2007 0.810 0.275 0.701 Change in average Skill Premium
0.040 (0.007)
-0.037 0.00 0.34 0.071 0.171 0.420
*The industry variable in the 1994 Sakernas is at the one-digit level;** Lower secondary and above for Cambodia; *** Upper secondary and above for Cambodia.
In Indonesia, the evolution of industry premiums over time suggests that the premium of
belonging to an industry other than Agriculture has declined substantially over time, and
has turned in favor of Agriculture sometime after 2003. In the Philippines, Thailand and
Cambodia the opposite was the case; industry premiums increased over time and the
proportional increase was largest in the case of Cambodia (premiums increased fivefold),
followed by the Philippines. For the Philippines, most of the increase took place
sometime between 1998 and 2001 and for Cambodia sometime between 1998 and 2003.
In the case of Vietnam, small premiums in favor of Agriculture were observed over the
entire period. In China, the reward of being in an industry other than Agriculture has
declined sharply over time.6 In Mongolia, the premium of belonging to an industry other
than Agriculture has declined substantially over time.
The results on skill premiums confirm the previous country grouping, with generally
stable premiums for Indonesia, Philippines and Thailand, and increasing ones for the
other countries. Average skill premiums in Indonesia, for both definitions, remained
fairly stable, exhibiting only a small increase over time during the 1996-2007 period (i.e.,
discarding 1994), especially for those with tertiary education. This was also the case for
the Philippines were practically no change is observed. This finding for the Philippines is
somewhere in-between what was reported in table 10a (no controls for industry
affiliation) and table 10b (with controls for industry affiliation) where declines in skill
premiums of 20 and 10 percent respectively are reported for those with at least some
senior secondary and tertiary qualifications.
6 Note that, the data are for urban populations and, therefore, the agricultural sector is very small in comparison to the other countries examined.

36
In Thailand, using the first definition of skilled workers (senior secondary education and
above), average skill premiums declined over time by about 20 percent (mostly after
1994), while using the second definition skilled premiums remained unchanged. These
results for Thailand are based on regressions which included 1-digit industry affiliations
and the sample of all members of the household. When the alternative sample of heads of
household only was used (a significantly older group of workers) which allowed for 2-
digit industry affiliations, average standardized skill premiums show a decline for both
definitions (more using the first definition of skill).
The results for Vietnam indicate a spectacular increase in skill premiums over time,
consistent with other findings for Vietnam in this report. At the beginning of the period
(1992), and before the Doi Moi reforms impacted the labor market, average skill
premiums were actually negative (secondary and above) or indicated a small skill
premium (tertiary qualifications). Subsequently, skill premiums increased monotonically.
Most of the increase took place between 1998 and 2004 (secondary and above) and
between 2004 and 2006 (tertiary).
In the case of Cambodia the two definitions of skill are Lower Secondary and above and
Senior Secondary and above7. Between 1997 and 2003-4, large increases in average skill
premiums are observed in Cambodia for both skill definitions. Premiums more than
tripled (lower secondary and above) and more than doubled (senior secondary and
above). However, premiums seem to have declined somewhat subsequently, this possibly
reflecting data comparability issues between the 2007 and earlier surveys. Overall, skill
premiums tripled (lower secondary and above definition) / displayed a moderate increase
(senior secondary or higher definition).
In China, average skill premiums have increased substantially over the 1999-2005 period
(second only to Mongolia and Vietnam). Finally in Mongolia, skill premiums for both
7 This is because the proportion of workers with university education is small, making it difficult to estimate coefficients of skill within certain industry groups.

37
definitions of skill increased more than any other country in the group, tripling over the
last decade.
With respect to the question of whether industry premiums or skill premiums changed
more over time, the evidence from Table 12 is mixed: in the Philippines and Cambodia
industry premiums changed more than skill premiums –suggesting that they are the main
driver of wage differentials; in Thailand, Mongolia and China we observe significant
changes in both industry and skill premiums which go in opposite directions – skill
premiums are confirmed to be the main wage driver in China and Mongolia, while
industry premiums are the main driver in Thailand; in Vietnam we see a spectacular
increase in skill premiums and hardly any increase in industry premiums; finally in
Indonesia the answer depends on whether we compare over the 1994-2007 or the 1996-
2007 period and on the skill definition used.
Table 13 reports estimates of the variance of industry and skill premiums over time.
Overall, dispersion of industry premiums for Indonesia, Vietnam, China and Mongolia
remained low with little tendency for change, while it increased sharply over time for
Cambodia and moderately for the Philippines and Thailand. The variance levels as well
as their evolution would seem to indicate that labor markets are more segmented in
Cambodia, Thailand and Philippines than elsewhere (noting the evidence above on
countries with faster rising industry premiums), pointing to the need for focusing on
policies that make labor markets less segmented. An open question for Thailand and the
Philippines – which show both evidence of raising industry premiums and increasingly
industry-specific skill premiums over the long-run – is to what extent industry-specific
skill premiums are associated with higher overall industry premiums in the most skilled
intensive sectors or correspond to “real” variation in skill premiums across sectors. The
variance and sector analysis of skill premiums provided below will help clarify this issue.
With respect to the dispersion of skill premiums, the dispersion for Cambodia, China and
Mongolia remained very low with no significant change over time for both definitions of
skill. The dispersion of skill premiums increased for the first definition of skill in the case

38
of the Philippines (mostly after 2000), but remained broadly stable for the second
definition of skill (tertiary and above); showed an overall increase in Indonesia (once
year 1994 is discarded) for the first definition of skill and a small decrease for the second
definition of skill, after increasing until 2001 and declining thereafter; in Thailand we
observe a significant increase in the dispersion of premiums for tertiary education during
the early 1990s (but remained unchanged during the 1994-2004 period), but a small
decrease in dispersion for senior secondary and above. A notable observation is the sharp
decline in the dispersion of tertiary education premiums in Vietnam, which declined
continuously after 1992 (while the dispersion of premiums for senior secondary and
above remained stable). Overall, the low variance magnitudes and decrease or stability in
time in most countries make it clear that investing in general curriculum makes more
sense than investing in too specific curricula since demand for skills is not very sector
specific. The sector specificity of demand for skills, while a bit higher, has decreased
sharply over time in Vietnam pointing to the need for more general education. Where
demand for skills has become a bit more sector specific in time is in the Philippines
(overall), Thailand (tertiary and above) and Indonesia (secondary and above). These
results are broadly aligned with the above evidence which shows lower overall skill
premiums after industry affiliation is controlled for in the Philippines and Thailand, and
lower premiums for upper secondary education after industry affiliation is controlled for
in Indonesia. They also confirm the differentiation of skill premiums across sectors in the
Philippines and Thailand – beyond possible industry premiums effects. Overall, these
results suggest that there may be more ground for incorporating specific elements in the
general curricula of Indonesia, the Philippines and Thailand. The analysis by sector
presented below will provide more guidance on the direction of these changes.

39
Table 13: Variance of Industry and Skill Premiums across Countries and Time
Variance: Industry Premiums
Indonesia 1994-07
(1996-07)
Philippines 1988-06
Thailand 1990-04
Vietnam1992-06
Cambodia 1997-07
China 1999-05
Mongolia 1998-2007
1988 0.050 1990 0.158 1991 0.051 1992 0.016 1994 0.004* 0.036 0.212 1996 0.011 1997 0.010 0.063 0.008 1998 0.019 0.016 1999 0.009 0.018 2000 0.276 2001 0.012 0.079 2002 2003 0.009 0.076 2004 0.076 0.196 0.016 2005 0.013 0.021 2006 0.082 0.013 2007 0.008 0.121 0.009 Change in Variance 0.004
(-0.003) 0.032 0.038 -0.003 0.113 0.003 -0.007
Variance: Skill Premiums (Secondary and above)**
1988 0.026 1990 0.064 1991 0.025 1992 0.061 1994 0.017* 0.019 0.032 1996 0.047 1997 0.047 0.024 0.008 1998 0.101 0.031 1999 0.053 0.020 2000 0.026 2001 0.101 0.035 2002 2003 0.083 0.034 2004 0.048 0.036 0.023 2005 0.060 0.012 2006 0.047 0.051 2007 0.071 0.016 0.043 Change in Variance 0.054
(0.024) 0.021 -0.028 -0.010 0.008 -0.008 0.012
Variance: Skill Premiums (Tertiary and above)***
1988 0.008

40
1990 0.032 1991 0.008 1992 0.274 1994 0.038 0.007 0.071 1996 0.045 1997 0.062 0.010 0.177 1998 0.133 0.011 1999 0.046 0.009 2000 0.079 2001 0.036 0.011 2002 2003 0.035 0.043 2004 0.011 0.078 0.023 2005 0.023 0.014 2006 0.010 0.011 2007 0.017 0.171 0.019 Change in Variance -0.021
(-0.028) 0.002 0.046 -0.263 -0.006 0.007 0.008
*The industry variable in the 1994 Sakernas is at the one-digit level; ** Lower secondary and above for Cambodia; *** Upper secondary and above for Cambodia. Table 14: Evolution of Skill Premiums by Sector and Country
Indonesia Philippines Thailand Vietnam Cambodia China Mongolia Senior Sec. or higher 1988 - Agriculture/Mining - Manufacturing - Trade/Services
1990 - Agriculture/Mining - Manufacturing - Trade/Services
1991 - Agriculture/Mining - Manufacturing - Trade/Services
1992 - Agriculture/Mining - Manufacturing - Trade/Services
1994 - Agriculture/Mining - Manufacturing - Trade/Services
1997 - Agriculture/Mining - Manufacturing - Trade/Services
0.809 0.419 0.722
0.192 0.343 0.539
0.186 0.322 0.560
0.161 0.301 0.469
0.204 0.255 0.511
1.812 0.642 0.969
1.148 0.665 1.065
-0.586 -0.102 -0.237
-0.263 0.115 0.190

41
1998 - Agriculture/Mining - Manufacturing - Trade/Services
1999 - Agriculture/Mining - Manufacturing - Trade/Services
2000 - Agriculture/Mining - Manufacturing - Trade/Services
2001 - Agriculture/Mining - Manufacturing - Trade/Services 2002 - Agriculture/Mining - Manufacturing - Trade/Services
2003 - Agriculture/Mining - Manufacturing - Trade/Services
2004 - Agriculture/Mining - Manufacturing - Trade/Services
2005 - Agriculture/Mining - Manufacturing - Trade/Services
2006 - Agriculture/Mining - Manufacturing - Trade/Services
2007 - Agriculture/Mining - Manufacturing - Trade/Services
0.634 0.375 0.689
0.551 0.394 0.689
0.605 0.463 0.734
0.140 0.197 0.621
0.145 0.189 0.609
0.122 0.201 0.698
0.898 0.644 0.990
0.571 0.642 0.811
-0.243 0.00 0.00
0.208 0.328 0.463
0.410 0.232 0.249
0.262 0.225 0.516
0.157 0.156 0.541
0.454 0.165 0.348
0.301 0.380 0.541
0.381 0.266 0.280
0.388 0.371 0.296
1.025 0.631 0.833
Tertiary or higher 1988 - Agriculture/Mining - Manufacturing - Trade/Services 1990
0.364 0.497 0.726

42
- Agriculture/Mining - Manufacturing - Trade/Services
1991 - Agriculture/Mining - Manufacturing - Trade/Services 1992 - Agriculture/Mining - Manufacturing - Trade/Services
1994 - Agriculture/Mining - Manufacturing - Trade/Services
1997 - Agriculture/Mining - Manufacturing - Trade/Services
1998 - Agriculture/Mining - Manufacturing - Trade/Services
1999 - Agriculture/Mining - Manufacturing - Trade/Services
2000 - Agriculture/Mining - Manufacturing - Trade/Services
2001 - Agriculture/Mining - Manufacturing - Trade/Services 2002 - Agriculture/Mining - Manufacturing - Trade/Services
2003 - Agriculture/Mining - Manufacturing - Trade/Services
2004 - Agriculture/Mining - Manufacturing - Trade/Services
2005 - Agriculture/Mining
1.432 1.075 0.770
1.128 0.797 0.691
0.976 0.752 0.678
0.355 0.387 0.742
0.336 0.405 0.644
0.405 0.389 0.715
0.350 0.339 0.769
0.354 0.301 0.752
2.010 1.182 1.048
2.436 1.190 1.067
2.051 1.070 1.003
1.487 1.077 0.97
-0.233 0.084 -0.050
0.304 0.382 0.191
0.503 0.517 0.594
-
-0.677 0.325
-
0.423 0.601
0.356 0.318 0.475
0.497 0.477 0.655
0.382 0.259 0.289
0.519 0.400 0.287
43
- Manufacturing - Trade/Services
2006 - Agriculture/Mining - Manufacturing - Trade/Services
2007 - Agriculture/Mining - Manufacturing - Trade/Services
1.213 0.903 0.787
0.303 0.328 0.809
0.384 0.377 0.547
-
1.045* 0.843
0.868 0.560 0.742
* Not statistically significant.
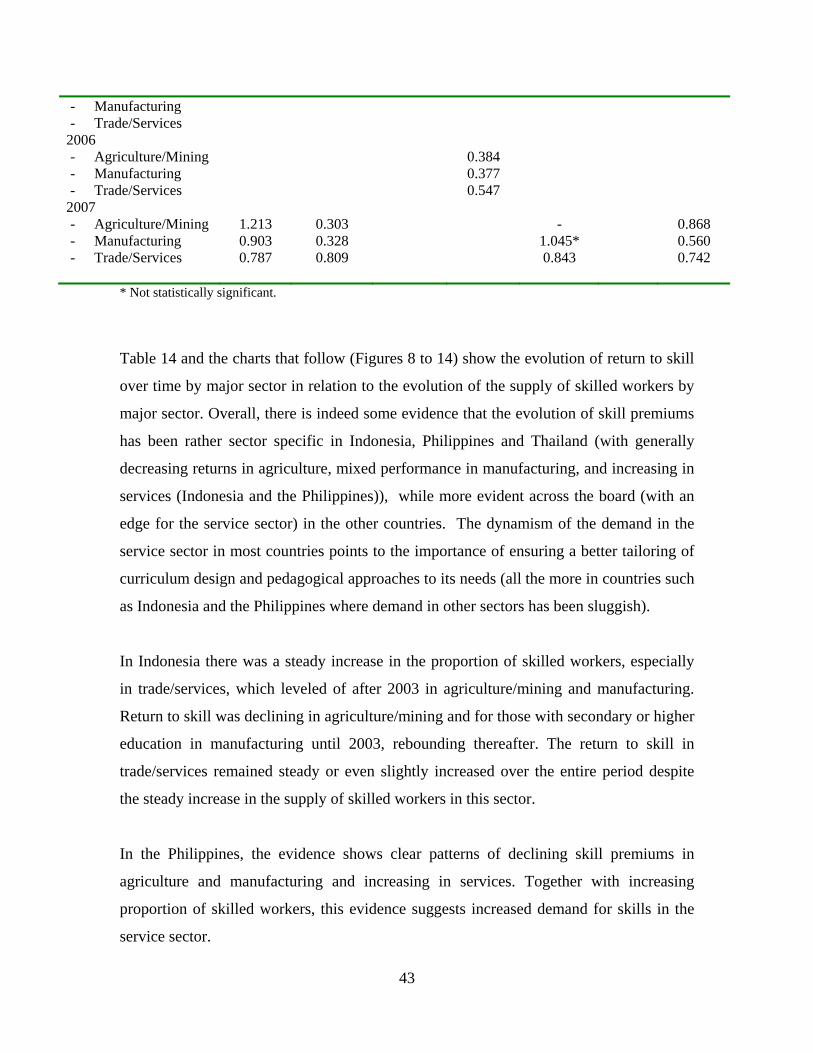
Table 14 and the charts that follow (Figures 8 to 14) show the evolution of return to skill
over time by major sector in relation to the evolution of the supply of skilled workers by
major sector. Overall, there is indeed some evidence that the evolution of skill premiums
has been rather sector specific in Indonesia, Philippines and Thailand (with generally
decreasing returns in agriculture, mixed performance in manufacturing, and increasing in
services (Indonesia and the Philippines)), while more evident across the board (with an
edge for the service sector) in the other countries. The dynamism of the demand in the
service sector in most countries points to the importance of ensuring a better tailoring of
curriculum design and pedagogical approaches to its needs (all the more in countries such
as Indonesia and the Philippines where demand in other sectors has been sluggish).
In Indonesia there was a steady increase in the proportion of skilled workers, especially
in trade/services, which leveled of after 2003 in agriculture/mining and manufacturing.
Return to skill was declining in agriculture/mining and for those with secondary or higher
education in manufacturing until 2003, rebounding thereafter. The return to skill in
trade/services remained steady or even slightly increased over the entire period despite
the steady increase in the supply of skilled workers in this sector.
In the Philippines, the evidence shows clear patterns of declining skill premiums in
agriculture and manufacturing and increasing in services. Together with increasing
proportion of skilled workers, this evidence suggests increased demand for skills in the
service sector.

44
In Thailand, there has been a sharp decline in the return to skill in agriculture/minining
between 1990 and 2004. On the other hand, the return to skill in the other two major
sectors remained roughly unchanged with a slight declining tendency. This is in the
backdrop of significant increases in the proportion of skilled workers in manufacturing
after 1994 and modest increases in the other two major sectors.
In Vietnam, the return to skill in all sectors increases sharply until 2004 (and more so in
agriculture), while the corresponding supply of skills showed a declining trend in
agriculture/mining, increased moderately in manufacturing and more sharply in
trade/services between 2004 and 2006.
In Cambodia, the proportion of workers with senior secondary and above education
declined in agriculture/mining and manufacturing, while it increased in trade/services.
The corresponding returns increased sharply between 1997 and 2003-4 and leveled off
thereafter. On the other hand, the proportion of workers with tertiary education (which is
virtually non-existent in agriculture/mining) increased sharply in trade/services and less
so in manufacturing. The sharp increase in the return to tertiary education in
manufacturing between 2003-4 and 2007 is indicative of an excess demand for tertiary
educated workers in this sector. The return to tertiary skills in trade/services showed a
steady increase over the last decade despite the large increase in the supply of tertiary
educated workers.
In urban China, with the exception of agriculture/mining (which by 2005 accounted for
less that 1% of the workforce in the urban areas), the return to both types of skills
increased significantly, in the backdrop of significant increases in the supply of such
skills.
Finally, in Mongolia, returns to skill increased significantly for all major sectors,
especially for agriculture and services; during the time period the supply of tertiary
education skills decreased for the sample of workers examined.

45
Figure 8(a): Indonesia: Return to skill by sector over time (Senior Secondary and above)
0
0.2
0.4
0.6
0.8
1
1994 1999 2003 2007Year
Re
turn Agriculture/Mining
Manufacturing
Trade/Services
Figure 8(b): Indonesia: Proportion of skilled workers by sector over time (Senior Secondary and above)
01020304050607080
1994 1999 2003 2007Year
% s
kill
ed Agriculture/Mining
Manufacturing
Trade/Services

46
Figure 8(c): Indonesia: Return to skill by sector over time (Tertiary and above)
0
0.2
0.4
0.6
0.8
1
1.2
1.4
1.6
1994 1999 2003 2007Year
Re
turn Agriculture/Minin
gManufacturing
Trade/Services
Figure 8(d): Indonesia: Proportion of skilled workers by sector over time (Tertiary and above)
0
5
10
15
20
25
30
35
1994 1999 2003 2007Year
% s
kill
ed
Agriculture/MiningManufacturing
Trade/Services

47
Figure 9(a): Philippines: Return to skill by sector over time (Secondary and above)
00.10.20.30.40.50.60.70.8
1988 1994 2001 2006
Year
Ret
urn Agriculture/Minin
gManufacturing
T d /S i
Figure 9(b): Philippines: Proportion of skilled workers by sector over time (Secondary and above)
0
0.2
0.4
0.6
0.8
1
1988 1994 2001 2006Year
% s
kill
ed
Agriculture/MiningManufacturing
Trade/Services

48
Figure 9(c): Philippines: Return to skill by sector over time (Tertiary and above)
00.10.20.30.40.50.60.70.80.9
1988 1994 2001 2006
Year
Ret
urn
Agriculture/Mining
Manufacturing
Trade/Services
Figure 9(d): Philippines: Proportion of skilled workers by sector over time (Tertiary and above)
0
0.1
0.2
0.3
0.4
0.5
1988 1994 2001 2006Year
% s
kill
ed Agriculture/MiningManufacturing
Trade/Services
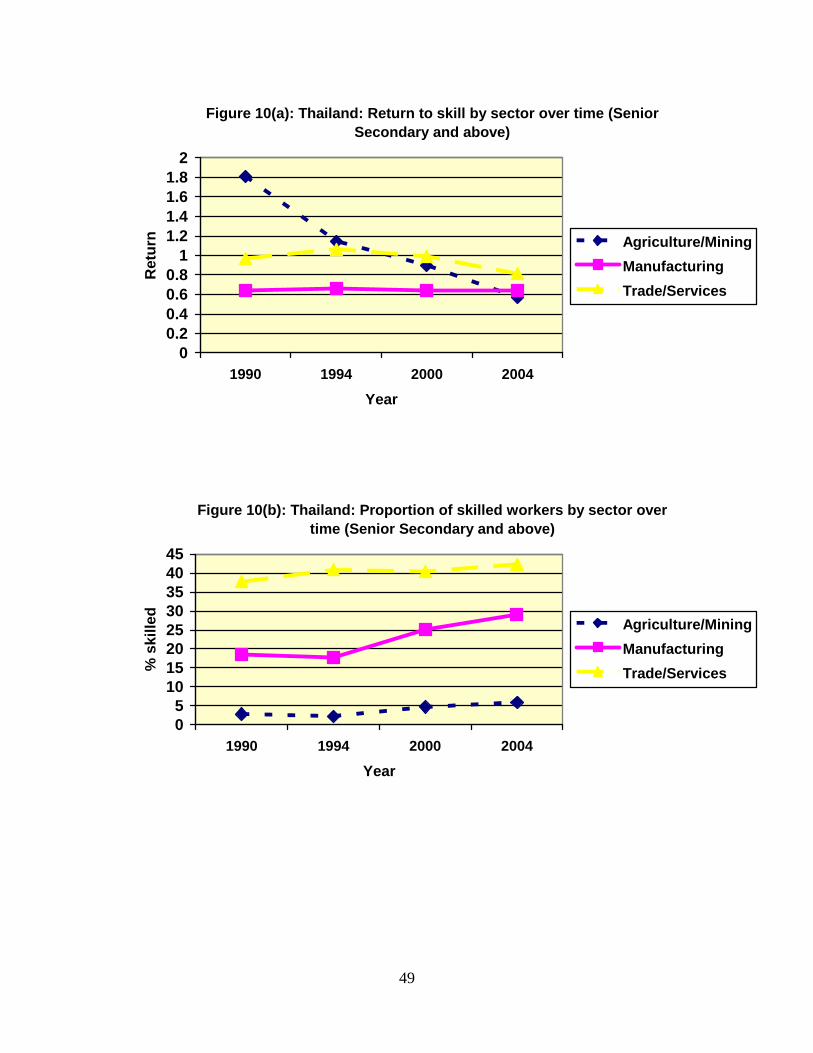
49
Figure 10(a): Thailand: Return to skill by sector over time (Senior Secondary and above)
00.20.40.60.8
11.21.41.61.8
2
1990 1994 2000 2004
Year
Ret
urn Agriculture/Mining
Manufacturing
Trade/Services
Figure 10(b): Thailand: Proportion of skilled workers by sector over time (Senior Secondary and above)
05
1015202530354045
1990 1994 2000 2004
Year
% s
kille
d
Agriculture/Mining
Manufacturing
Trade/Services

50
Figure 10(c):Thailand: Return to skill by sector over time (Tertiary and above)
0
0.5
1
1.5
2
2.5
3
1990 1994 2000 2004
Year
Ret
urn
Agriculture/Mining
Manufacturing
Trade/Services
Figure 10(d): Thailand: Proportion of skilled workers by sector over time (Tertiary and above)
0
5
10
15
20
25
1990 1994 2000 2004
Year
% s
kille
d
Agriculture/Mining
Manufacturing
Trade/Services

51
Figure 11(a): Vietnam: Return to skill by sector over time (Senior Secondary and above)
-0.8
-0.6
-0.4
-0.2
0
0.2
0.4
0.6
1992 1998 2004 2006
Year
Ret
urn Agriculture/Mining
Manufacturing
Trade/Services
Figure 11(b): Vietnam: Proportion of skilled workers by sector over time (Senior Secondary and above)
0
10
20
30
40
50
1990 1998 2004 2006
Year
% s
kill
ed Agriculture/Mining
Manufacturing
Trade/Services

52
Figure 11(c): Vietnam: Return to skill by sector over time (Tertiary and above)
-0.4
-0.2
0
0.2
0.4
0.6
0.8
1
1992 1998 2004 2006
Year
Re
turn
Agriculture/MiningManufacturing
Trade/Services
Figure 11(d): Vietnam: Proportion of skilled workers by sector over time (Tertiary and above)
0
5
10
15
20
25
1990 1998 2004 2006
Year
% s
kille
d
Agriculture/Mining
Manufacturing
Trade/Services

53
Figure 12(a): Cambodia: Return to skill by sector over time (Senior Secondary and above)
-0.4
-0.2
0
0.2
0.4
0.6
1997 2003-4 2007
Year
Ret
urn
Agriculture/Mining
Manufacturing
Trade/Services
Figure 12(b): Cambodia: Proportion of skilled workers by sector over time (Senior Secondary and above)
0
5
10
15
20
25
30
35
1997 2003-4 2007
Year
% s
kille
d
Agriculture/Mining
Manufacturing
Trade/Services

54
Figure 12(c): Cambodia: Return to skill by sector over time Tertiary and above)
-1
-0.5
0
0.5
1
1.5
1997 2003-4 2007
Year
Ret
urn
*
Manufacturing
Trade/Services
* Not enough observations.
Figure 12(d): Cambodia: Proportion of skilled workers by sector over time (Tertiary and above)
02468
10121416
1997 2003-4 2007
Year
% s
kille
d
*
Manufacturing
Trade/Services
* Not enough observations.

55
Figure 13(a): China: Return to skill by sector over time (Senior Secondary and above)
0
0.1
0.2
0.3
0.4
0.5
0.6
1999 2005Year
Ret
urn
Agriculture/Mining
Manufacturing
Trade/Services
Figure 13(b): China: Proportion of skilled labor by sector over time (Senior Secondary and above)
01020304050607080
1999 2005
Year
% s
kille
d Agriculture/Mining
Manufacturing
Trade/Services

56
Figure 13(c): China: Return to skill by sector over time (Tertiary and above)
00.10.20.30.40.50.60.7
1999 2005
Year
Ret
urn Agriculture/Minin
gManufacturing
Trade/Services
Figure 13(d): China: Proportion of skilled labor by sector over time (Tertiary and above)
0
5
10
15
20
25
30
35
40
1999 2005Year
% s
kill
ed
Agriculture/Mining
Manufacturing
Trade/Services

57
Figure 14(a): Mongolia: Return to skill by sector over time (Senior Secondary and above)
0
0.2
0.4
0.6
0.8
1
1.2
1998 2002 2007
Year
Re
turn
Agriculture/Mining
Manufacturing
Trade/Services
Figure 14(b): Mongolia: Proportion of skilled labor by sector over time (Senior Secondary and above)
0
20
40
60
80
100
1998 2002 2007Year
% s
kille
d Agriculture/Mining
Manufacturing
Trade/Services

58
Figure 14(c): Mongolia: Return to skill by sector over time (Tertiary and above)
0
0.2
0.4
0.6
0.8
1
1998 2002 2007
Year
Ret
urn Agriculture/Mining
Manufacturing
Trade/Services
Figure 14(d): Mongolia: Proportion of skilled labor by sector over time (Tertiary and above)
0
10
20
30
40
50
60
1998 2002 2007Year
% s
kill
ed
Agriculture/Mining
Manufacturing
Trade/Services

59
The Charts (Figures 15 to 21) which follow show the changes in the un-standardized
weighted industry and skill (senior secondary and above) premiums by industry
affiliation. The above findings are generally confirmed with clear evidence of increases
in industry premiums compared to Agriculture in the Philippines, Thailand and Cambodia
– suggesting possibility of labor market segmentation; significant increases in skill
premiums in most service sub-sectors in all countries (with the exception of Thailand);
and increases in skill premiums across most sub-sectors in Vietnam, Cambodia, China
and Mongolia.
Changes in industry premiums are interpreted in relation to the excluded industry, which
is agriculture. In Indonesia, generally, industry premiums moved in favor of agriculture,
while premiums for other groups generally declined. Un-standardized skill premiums on
the other hand indicate a mixed pattern, with the skill premium for agriculture and
construction declining over time (in relation to unskilled), while it increased for other
industries, especially Trade and Services. In the Philippines, industry premiums generally
increased compared to agriculture (with the exception of household employment). Skill
premiums show a mixed pattern over time, generally declining in agriculture and
manufacturing, but raising for most services (with the notable exception of financial
services, health and social work and private household employment8). In Thailand,
industry premiums generally increased over time compared to agriculture especially for
trade and services. On the other hand, standardized skill premiums decreased in
agriculture and services and increased in manufacturing and trade. In Vietnam, increasing
industry premiums are found for services and construction and decreasing for food-
beverages-tobacco, textiles, wood-furniture and trade. Skill premiums generally increased
across the board, especially in agriculture and services. In Cambodia, industry premiums
increased compared to agriculture for all industries except trade. Similarly, skill
premiums increased for all industries except in trade. In Mongolia, industry premiums
decreased compared to agriculture, and skill premiums increased across the board (except
for public administration). Finally in China, industry premiums generally decreased
8 When considering a definition of tertiary and more, however, skill premiums are on the rise for insurance and real estate, important parts of the financial services sub-sector.

60
compared to agriculture, while skill premiums increased in trade, services and, to a lower
extent, manufacturing, and slightly decreased in agriculture and utilities.

61
1. Agriculture 2. Forestry 3. Fishery 4. Mining-Minerals 5. Metal ore-Other Mining 6. Food- Drinks- Tobacco 7. Textile 8. Timber and Furniture 9. Paper and Printing 10. Chemicals 11. Non-Metallic production 12. Metal industry 13. Other industry 14. Utilities 15. Construction 16. Wholesale trade 17. Retail trade 18. Transportation/Communication 19. Finance-Real Estate 20. Public Admin-Health-Other Services.
Figure 15: Indonesia-Change in un-standardized weighted industry and skill premium by sector: 1996-2007
-0.06 -0.05 -0.04 -0.03 -0.02 -0.01
0 0.01 0.02 0.03 0.04
1 3 5 7 9 11 13 15 17 19
Industry
Ch
ang
e
Change in Ind Premium
Change in Skill premium

62
1. Growing crops 2. Fishing 3. Non-metal mining 4. Food-Beverages-Tobacco 5. Textiles 6. Wood-Furniture 7. Paper products 8. Chemicals 9. Utilities 10. Construction 11. Wholesale trade 12. Retail trade 13. Hotels-Restaurants 14. Transportation 15. Financial services 16. Business services 17. Public Admin. 18. Education 19. Health and Social Work 20. Private household employment.
Figure 16: Philippines- Change in un-standardized weighted industry and skill premium by sector: 1988-2006
-0.5
-0.4
-0.3
-0.2
-0.1
0
0.1
0.2
0.3
0.4
1 3 5 7 9 11 13 15 17 19 21
Industry
Ch
ang
e
Change in Industrypremium
Change in Skillpremium

63
1. Agriculture 2. Mining 3. Manufacturing 4. Utilities 5. Construction 6. Trade 7. Transportation 8. Other services.
Figure 17: Thailand - Change in un-standardized weighted industry and skill premium by sector: 1990-2004
-0.25
-0.2
-0.15
-0.1
-0.05
0
0.05
0.1
0.15
1 2 3 4 5 6 7 8
Industry
Ch
ang
e Change in IndustryPremium
Change in Skillpremium
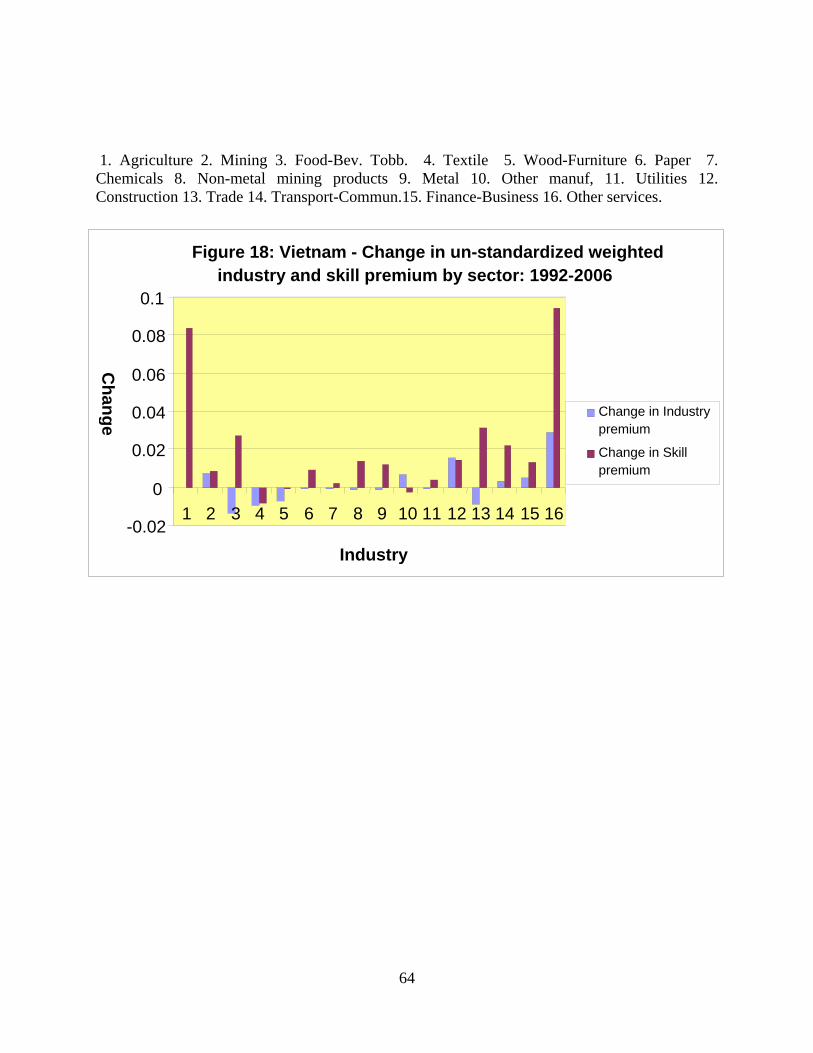
64
1. Agriculture 2. Mining 3. Food-Bev. Tobb. 4. Textile 5. Wood-Furniture 6. Paper 7. Chemicals 8. Non-metal mining products 9. Metal 10. Other manuf, 11. Utilities 12. Construction 13. Trade 14. Transport-Commun.15. Finance-Business 16. Other services.
Figure 18: Vietnam - Change in un-standardized weighted industry and skill premium by sector: 1992-2006
-0.02
0
0.02
0.04
0.06
0.08
0.1
1 2 3 4 5 6 7 8 9 10 11 12 13 14 15 16
Industry
Ch
ang
e
Change in Industrypremium
Change in Skillpremium

65
1. Agriculture-Mining 2. Manufacturing 3. Utilities 4. Construction 5. Trade 6. Transportation- Communication 7. Finance Business 8. Public Admin. 9. Other Services.
Figure 19: Cambodia - Change in un-standardized weighted industry and skill premium by sector: 1997-2007
-0.1
-0.05
0
0.05
0.1
0.15
1 2 3 4 5 6 7 8 9
Industry
Ch
ang
e
Change in Industrypremium
Change in Skillpremium

66
1. Agriculture-Mining 2. Manufacturing 3. Utilities 4. Construction 5. Transportation-
Communication. 6. Trade 7. Public Admin. 8. Other Services (including Finance and Business and others).
Figure 20: China - Change in un-standardized weighted industry and skill premium by sector: 1999-2005
-0.2
-0.15
-0.1
-0.05
0
0.05
0.1
1 2 3 4 5 6 7 8
Industry
C h a n g e
Change in Industrypremium
Change in Skillpremium

67
1. Agriculture-Mining 2. Manufacturing 3. Utilities 4. Construction 5. Transportation-
Communication. 6. Trade 7. Public Admin. 8. Other Services (including Finance and Business and others).
Figure 21: Mongolia - Change in un-standardized weighted industry and skill premium by sector, 1998-2007
-0.1
-0.05
0
0.05
0.1
0.15
1 2 3 4 5 6 7 8
Industry
Ch
ang
e
Change in Ind
Premium
Change in Skill
Premium

68
5. Conclusion
This paper has reviewed levels and trends in education and skill premiums, and skilled
labor force, across eight East Asian countries, and over time, sector and sub-sector,
representing the most comprehensive comparative exercise so far on this topic. Several
main trends have emerged. Main trends include:
-there is evidence of increasing proportions of skilled/educated workers over the long run
across the region
-this evidence combined with stable or increasing education/skill wage premiums (in
regressions with only basic controls) indicates generally increasing demand for skills in
the region (and that education is also leading to increasing inequalities in several
countries)
-sector and sub-sector analysis of skill wage premiums and proportion of skilled labor,
combined with changes in labor force composition in favor of the service sector, confirm
that the service sector has become the most important driver of demand for skills for all
countries (except Thailand)
-beyond these general trends, there is evidence that countries can be broadly categorized
into three groups in relation to trends and patterns of demand for skills:
-Indonesia, Philippines and Thailand – where demand for skills is on the rise but
only moderately so; and increasingly industry-specific (in particular for the
Philippines and Thailand)
-Vietnam and China – where demand for skills is sharply on the rise and
involving most sectors/sub-sectors
-Cambodia and Mongolia – where skill premiums are sharply on the rise across
most sectors/sub-sectors, but accompanied with slow increases or even some
declines in the proportion of skilled labor which point to less clear cut trends in
demand and the importance of shortage of skills
-there is also evidence of rising industry premiums – and related possible labor market
segmentation – in three countries of the region (Philippines, Thailand and Cambodia).
These results point to several policy implications. The main ones are:

69
-Governments should focus on policies promoting access to education (formal education
but also skill development opportunities for the unskilled) to address the increasing
demand for skills and/or the persistent skill shortages.
-The ground is generally stronger for supporting general rather than specific curricula
given broad-based increases in skill premiums, but countries such as the Philippines and
Thailand also require particular attention to specific curricula because of their more
differentiated skill premiums (in favor of services in the Philippines and manufacturing in
Thailand).
-Overall, across practically all countries, there is strong ground for better tailoring
curriculum design and content and pedagogical approaches to the needs of the service
sector given its role in driving the demand for skills.
-At the same time, while these measures take their time to act, governments could also
target some of their social protection programs to unskilled workers to protect them from
the “un-equalizing” impact of education.
-Finally, in the Philippines, Thailand and Cambodia, education and social protection
policies should also be accompanied by policies that make labor markets less segmented

70
References Abu-Ghaida, D and Connolly, M (2003): “Trends in Relative Demand for Workers with Secondary Education: A Look at Nine Countries in East Asia, Africa and MENA”, background paper for “Expanding Opportunities and Building Competencies for Young People: A New Agenda for Secondary Education”, The World Bank, Washington DC. Alatas, V and Bourguignon, F (2005): “Estimation of Rates of Return in Indonesia over 1980-2003”, The World Bank, mimeo Berman, E., J. Bound, and S. Machin (1998): “Implications of Skill-Biased Technological Change: International Evidence” in The Quarterly Journal of Economics, 113(4), 1245-79. Fajnzylber, P and Fernandes, A (2004)” International Economic Activities and the Demand for Skilled Labor: Evidence from Brazil and China” – The World Bank (mimeo) Feenstra, R. C., and G.H. Hanson (1997): “Foreign Direct Investment and Relative Wages: Evidence from Mexico's Maquiladoras” in Journal of International Economics, 42, 371-93. Harrison, A., and G. Hanson (1999): “Who Gains from Trade Reform? Some Remaining Puzzles”, in Journal of Development Economics, 51, 315-24. Heckman, J J and Li, X (2003): “Selection Bias, Comparative Advantage and Heterogeneous Returns to Education: Evidence from China in 2000”. IZA (Institute for Labor Studies) Discussion Paper N.829, Bonn, Germany. Hiebert, M. (1993): “Wage Revolution: Vietnam Makes Salaries Reflect Responsibilities.” The Far Eastern Economic Review (September). Keller, W. (2004): “International Technology Diffusion” in Journal of Economic Literature, 42(3), 752-82. Nguyen, T. L., T. B. Nguyen, Vu Binh Cu, V. T. Nguyen and M. Godfrey (1991): “Human Resources Development.” In: Per Ronnas and Orjan Sjoberj (Eds), Socio-Economic Development in Vietnam. Norlund, I. (1993): “The Creation of a Labor Market in Vietnam: Legal Framework and Practices.” In: C. A. Thayer and D. G. Marr (Eds): Vietnam and the Rule of Law. Political and Social Change Monograph No. 19, Australian National University, Cambera. O'Connor, D., and M.R. Lunati (1999): “Economic Opening and the Demand for Skills in Developing Countries: A Review of Theory and Evidence”, in OECD Development Centre Working Paper, No. 149.

71
Pavcnik, N. (2003): “What Explains Skill Upgrading in Less Developed Countries?” in Journal of Development Economics, 71, 311-28. Ridao-Cano, C. (2003). “Skills and Growth in Cambodia.” ESAHD, World Bank, mimeo. Sakellariou, C. and H. Patrinos (2000): “Labor Market Performance of Tertiary Education Graduates in Vietnam.” Asian Economic Journal, vol. 14 (2). Zeufack and Udomsaph (2006): “Skills Shortages and Mismatch in Malaysia and Thailand: Evidence from Linked Employer-Employee data”, The World Bank, mimeo World Bank (1996): “Vietnam Education Financing Sector Study. Report No. 15925-VN. World Bank, Washington, DC. __________ (2009): “Higher Education and Skills for Growth in Vietnam”, Washington, DC.

72
Appendix
Indonesia
Table A1: Sakernas Survey – Weighted Summary Statistics – (Employed for wages)
1 Industry controls included at the 1-digit level, as opposed to 2-digit for the rest of the years.
19941 1997 1999 2001 2003 2005 (Nov)
2007 (Aug)
Hourly wage (rupia-2006 prices)
4,187 5,027 3,970 5,557 6,079 5,557 6,485
log hourly wage (2006 prices)
8.01 8.21 7.98 8.31 8.44 8.35 8.42
Male 0.694 0.691 0.677 0.686 0.690 0.680 0.685 Age 33.32 33.82 34.48 33.60 33.97 34.13 34.90 Married N/A 0.663 0.666 0.666 0.674 0.666 0.689 Schooling Years of schooling Primary incomplete Primary complete Junior high school High school-general High school- voc. Diploma University
7.99 0.199 0.315 0.138 0.140 0.136 0.040 0.032
8.52 0.168 0.285 0.151 0.168 0.134 0.043 0.050
8.75 0.149 0.280 0.155 0.178 0.128 0.052 0.058
9.64 0.083 0.245 0.177 0.199 0.158 0.064 0.073
10.17 0.053 0.201 0.200 0.259 0.140 0.062 0.084
10.33 0.046 0.202 0.194 0.247 0.142 0.073 0.096
10.33 0.060 0.212 0.172 0.223 0.123 0.088 0.121
Occupation Professional Manager Official/admin Sales Labor (Services) Agriculture Production Transportation Laborers
0.113 0.006 0.134 0.059 0.101 0.182 0.135 0.075 0.194
0.111 0.004 0.144 0.074 0.097 0.155 0.141 0.078 0.196
0.119 0.007 0.144 0.069 0.103 0.178 0.135 0.079 0.165
0.127 0.007 0.155 0.076 0.112 0.102 0.165 0.082 0.173
0.124 0.006 0.175 0.088 0.108 0.083 0.175 0.088 0.154
0.141 0.008 0.153 0.090 0.116 0.075 0.161 0.095 0.161
0.144 0.011 0.144 0.096 0.141 0.075 0.146 0.085 0.158
Skill classification Skilled (Secondary and above) Skilled (Tertiary and above)
0.348
0.072
0.396
0.093
0.416
0.110
0.494
0.137
0.545
0.146
0.557
0.169
0.534
0.209
Sample size 43,450 40,965 27,267 21,037 37,756 27,441 125,654

73
Philippines
Table A2: LFS – Weighted Summary Statistics (Employed Individuals 15-65 years) Variables 1988 1991 1994 1997 2001 2004 2006Hourly pay (2000 pesos) 20.357 21.375 21.502 25.486 25.716 24.029 22.929Log(Hourly pay) 2.707 2.750 2.771 2.915 3.024 2.964 2.908Male 0.633 0.636 0.635 0.623 0.610 0.625 0.616Age in years 35.28 35.94 36.41 36.16 36.98 36.37 36.51Married indicator 0.645 0.652 0.640 0.649 0.633 0.660 0.653Schooling Years of Schooling Less than primary complete 0.261 0.245 0.225 0.205 0.185 0.182 0.173 Primary 0.243 0.242 0.237 0.218 0.192 0.174 0.168 Some secondary 0.131 0.133 0.134 0.135 0.142 0.138 0.138 High school graduate 0.260 0.271 0.297 0.326 0.349 0.368 0.377 Tertiary and above 0.105 0.109 0.107 0.116 0.132 0.138 0.144 Occupation Prof. and technical Admin. and managers Clerical Sales and services Agricultural workers Prod. operators laborers
0.0560.1030.0410.1320.4500.218
0.0580.1050.0410.1370.4410.219
0.0550.1080.0410.1420.4330.221
0.0590.1110.0450.1660.3790.241
0.074 0.100 0.045 0.201 0.359 0.221
0.0730.1100.0440.1980.3580.216
0.0730.1140.0490.2050.3520.207
Skill classification Skilled (Secondary and above) Skilled (Tertiary and above)
0.4960.192
0.5130.199
0.5370.205
0.5760.230
0.623 0.249
0.6440.263
0.6590.273
Sample size 37,335 46,511 47,304 74,768 73,815 76,185 74,090

74
Thailand
Table A3: Socioeconomic Survey – Summary Statistics (Employed individuals) 1990 1994 2000 2004 Monthly earnings (Baht)
3,498 4,941 7,905 8,189
log monthly earnings 7.40 7.76 8.42 8.33 Male 0.581 0.569 0.576 0.512 Age 37.21 38.97 39.64 41.45 Married 0.685 0.717 0.728 0.710 Schooling Years of schooling Less than primary Primary complete Lower Secondary Upper Secondary Higher Vocational University
6.75 0.598 0.140 0.084 0.041 0.075 0.061
6.93 0.569 0.151 0.091 0.047 0.070 0.071
8.27 0.437 0.167 0.115 0.073 0.089 0.120
8.36 0.401 0.184 0.122 0.082 0.086 0.121
Skill classification Skilled (Secondary and above) Skilled (Tertiary and above)
0.177 0.061
0.188 0.071
0.282 0.120
0.289 0.121
Sample size 22,583 41,404 34,981 60,176 * 3-digit occupational classification changed in 2000.

75
Vietnam
Table A4: VLSS Survey – Summary Statistics (excluding Self-Employed) 1992 1998 2004 2006 Monthly earnings (Dong) 1,525 3,451 4,786 6,144 log monthly earnings 6.92 7.88 8.27 8.52 Male 0.603 0.606 0.620 0.563 Age 31.20 32.71 33.58 35.99 Married 0.577 0.565 0.625 0.642 Schooling Years of schooling Primary incomplete Primary Lower Secondary Upper Secondary Higher Vocational Tertiary
7.84 0.220 0.256 0.232 0.089 0.135 0.067
8.04 0.218 0.254 0.219 0.136 0.082 0.090
8.73 0.156 0.218 0.205 0.105 0.190 0.129
9.06 0.147 0.225 0.259 0.107 0.192 0.130
Occupation* Manager/Official Professional Associate Professional Clerical Service/Sales Skilled Agric. Workers Skilled Manual Workers Machine Operators Laborers
0.052 0.119 0.089 0.025 0.078 0.048 0.283 0.038 0.268
0.047 0.071 0.106 0.045 0.037 0.012 0.201 0.053 0.428
0.059 0.078 0.103 0.038 0.038 0.014 0.217 0.052 0.401
Skill classification Skilled (Secondary and above) Skilled (Tertiary and above)
0.291 0.067
0.308 0.090
0.421 0.129
0.425 0.130
Sample size 2,241 3,173 6,707 6,294 * For 1992, Occupational classifications are different from those in the 1998-2006 period.

76
Cambodia
Table A5: Socio-economic survey: Weighted Summary Statistics (workers with positive earnings)
Note: Changes in occupational classification did not permit a consistent comparison of various occupation groups. Between 2003-4 and 2007 the composition of the samples with respect to type of employer are substantially different; as a result changes in educational attainment reported may be misleading (for example the reported decease in the proportion of workers with upper secondary education/skilled workers).
1997 2003-4 2007 Monthly earnings (Riels) 660 1,112 1,495 log monthly earnings 6.00 6.57 6.86 Male 0.687 0.596 0.597 Age 34.48 30.80 31.10 Married 0.683 0.518 0.544 Schooling Years of schooling Primary incomplete Primary Lower Secondary Upper Secondary Tertiary
5.83 0.472 0.259 0.164 0.086 0.020
6.00 0.468 0.260 0.141 0.100 0.030
6.13 0.491 0.265 0.142 0.066 0.034
Skill classification Skilled (Lower secondary and above) Skilled (Upper secondary and above) Skilled (Tertiary)
0.269 0.105 0.020
0.272 0.131 0.030
0.244 0.102 0.034
Sample size 2,560 6,511 2,763

77
China
Table A6: China Urban Labor Survey: Summary Statistics (workers with positive earnings)
1999 2005 Hourly wage (Yuan) 4.49 7.36 log hourly wage 1.26 1.69 Male 0.532 0.566 Age 38.8 40.4 Married 0.870 0.825 Schooling Years of schooling Primary incomplete Primary Lower Secondary Upper Secondary Tertiary
11.42 0.027 0.060 0.349 0.353 0.211
11.94 0.011 0.033 0.291 0.421 0.243
Skill classification Skilled (Upper secondary and above) Skilled (Tertiary)
0.564 0.211
0.665 0.243
Sample size 4,612 3,266

78
Mongolia
Table A7: Summary Statistics (workers with positive earnings) 1998 2002 2007 Hourly wage (Togrog) 420.0 493.6 786.0 log hourly wage 5.52 5.91 6.17 Male 0.495 0.474 0.485 Age 37.31 37.70 36.80 Married 0.746 0.746 0.658 Schooling Years of schooling No education Primary Lower Secondary Upper Secondary Diploma University
13.14 0.004 0.020 0.128 0.267 0.254 0.327
12.69 0.002 0.020 0.151 0.350 0.250 0.228
12.30 0.011 0.026 0.140 0.487 0.150 0.178
Skill classification Skilled (Upper secondary and above) Skilled (Diploma or higher)
0.849 0.582
0.828 0.478
0.822 0.328
Sample size 1,309 2,384 8,780

79
Table A8: Indonesia - Industry share in employment and share of skilled workers by industry
Industry share in employment
1996 2007
Share of skilled workers by industry
1996 2007 Agriculture 0.130 0.090 0.055 0.160 Forestry 0.010 0.008 0.117 0.218 Fishery 0.002 0.017 0.286 0.142 Mining-minerals 0.005 0.010 0.681 0.693 Metal ore and other mining 0.008 0.019 0.129 0.243 Food, Drinks, Tobacco 0.038 0.041 0.234 0.335 Textile 0.057 0.039 0.329 0.341 Timber and furniture 0.040 0.038 0.262 0.342 Paper and Printing 0.007 0.009 0.533 0.616 Chemicals 0.014 0.014 0.465 0.538 Non-Metallic production 0.010 0.010 0.237 0.250 Metal industry 0.014 0.007 0.545 0.471 Other industry 0.016 0.014 0.456 0.709 Electricity-Water 0.005 0.006 0.733 0.799 Construction 0.106 0.089 0.203 0.299 Wholesale 0.028 0.052 0.672 0.587 Retail 0.067 0.070 0.490 0.546 Transportation/Communication 0.059 0.063 0.362 0.457 Finance-Real Estate 0.026 0.035 0.864 0.841 Public Admin-Health-Other Services
0.358 0.367 0.679 0.808
Mean Skilled (Secondary and above)
0.442 0.555
Obs 44,603 125,597 44,603 125,597

80
Table A9: Philippines - Industry share in employment and share of skilled workers by industry Industry share in
employment 1988 2006
Share of skilled workers by industry 1988 2006 (1) (2) (1) (2)
Agriculture 0.455 0.356 0.296 0.052 0.410 0.078Mining 0.006 0.002 0.546 0.153 0.477 0.109Manufacture 0.107 0.094 0.595 0.199 0.778 0.284Electricity/Water 0.004 0.004 0.899 0.578 0.980 0.651Construction 0.041 0.050 0.529 0.132 0.660 0.163Wholesale retail trade 0.137 0.188 0.604 0.238 0.779 0.335 Hotels restaurants 0.015 0.028 0.705 0.307 0.870 0.423Transportation 0.050 0.077 0.674 0.212 0.775 0.284Finance bus. services 0.017 0.037 0.949 0.701 0.965 0.738Public administration 0.041 0.047 0.921 0.694 0.912 0.661Community services 0.054 0.066 0.923 0.793 0.918 0.726Private HH workers 0.071 0.050 0.518 0.102 0.647 0.089Mean Skilled (Secondary and above)
0.496
0.192 0.659 0.273
Obs 37,335 74,090 37,335 74,090 Note: (1) Skilled refers to those with some secondary and above (2) Skilled refers to those with some tertiary and above

81
Table A10: Thailand - Industry share in employment and share of skilled workers by industry Industry share in
employment 1990 2004
Share of skilled workers by industry 1990 2004
(1) (2) (1) (2)
Agriculture/Fishery 0.385 0.300 0.024 0.005 0.056 0.009 Mining 0.001 0.001 0.250 0.100 0.333 0.151 Manufacturing 0.132 0.146 0.164 0.027 0.289 0.062 Utilities 0.008 0.005 0.528
0.118 0.576 0.236
Construction 0.050 0.058 0.099
0.017 0.138 0.027
Trade 0.153 0.246 0.175 0.038 0.285 0.074 Transportation/Commun. 0.040 0.035 0.210
0.036 0.304 0.101
Services 0.231 0.209 0.428
0.209 0.670 0.433
Mean 0.177
0.061 0.288 0.121
Obs 21,524 54,383 21,524 21,524 54,383 54,383 Note: (1) Skilled refers to those with some secondary and above (2) Skilled refers to those with some tertiary and above

82
Table A11: Vietnam - Industry share in employment and share of skilled workers by industry Industry share in employment
1992 2006 Share of skilled workers by industry 1992 2006
Agriculture 0.271 0.162 0.086 0.077 Mining 0.014 0.018 0.469 0.470 Food-Bev-Tobb 0.042 0.048 0.149 0.221 Textiles 0.075 0.076 0.292 0.389 Wood-Furniture 0.057 0.046 0.148 0.188 Paper 0.008 0008 0.176 0.542 Chemicals 0.013 0.012 0.267 0.553 Non-metal 0.037 0.024 0.169 0.253 Metal 0.036 0.021 0.225 0.458 Other manuf. 0.012 0.017 0.333 0.752 Utilities 0.009 0.011 0.650 0.881 Construction 0.101 0.155 0.177 0.200 Trade 0.047 0.093 0.295 0.433 Transport/Commun. 0.046 0.047 0.311 0.615 Finance/Business 0.009 0.020 0.700 0.816 Services 0.224 0.242 0.643 0.786 Mean 0.291 0.425 Obs 2,241 6,294 2,241 6,294

83
Table A12: Cambodia - Industry share in employment and share of skilled workers by industry Industry share in employment
1997 2007 Share of skilled workers
by industry 1997 2007
Agriculture/Mining 0.273 0.221 0.062 0.023 Manufacturing 0.122 0.240 0.172 0.164 Electricity/Water 0.004 0.004 0.644 0.172 Construction 0.085 0.165 0.104 0.141 Trade 0.072 0.039 0.132 0.239 Transport/Communication 0.061 0.077 0.164 0.169 Finance/Business 0.021 0.057 0.545 0.524 Public Admin 0.198 0.085 0.494 0.534 Other Services 0.164 0.111 0.514 0.677 Mean Skilled (Lower secondary and above) Mean Skilled12 (Upper secondary and above)
0.269
0.105
0.245
0.100
Obs 2,516 2,647 2,516 2,647

84
Table A13: China - Industry share in employment and share of skilled workers by industry Industry share in employment
1999 2005 Share of skilled workers
by industry 1999 2005
Agriculture/Mining 0.044 0.008 0.635 0.680 Manufacturing 0.306 0.188 0.490 0.603 Utilities 0.051 0.020 0.575 0.576 Construction 0.068 0.034 0.484 0.741 Transport/Communication 0.089 0.104 0.554 0.624 Trade 0.112 0.195 0.462 0.610 Public Admin 0.056 0.079 0.743 0.862 Services 0.274 0.374 0.668 0.693 Mean Skilled (Upper secondary and above) Mean Skilled (Tertiary)
0.564
0.210
0.665
0.243 Obs 4,620 3,266 4,620 3,266

85
Table A14: Mongolia - Industry share in employment and share of skilled workers by industry Industry share in employment
1998 2007 Share of skilled workers
by industry 1998 2007
Agriculture/Mining 0.075 0.083 0.694 0.637 Manufacturing 0.049 0.100 0.812 0.817 Utilities 0.034 0.046 0.822 0.771 Construction 0.035 0.094 0.804 0.700 Transport/Communication 0.066 0.129 0.896 0.830 Trade 0.075 0.093 0.806 0.811 Public Admin 0.225 0.101 0.908 0.913 Services 0.440 0.355 0.854 0.883 Mean Skilled (Upper secondary and above) Mean Skilled (Tertiary)
0.849
0.582
0.822
0.328 Obs 1,309 8,861 1,309 8,861

86
Table A15a: Indonesia - Returns to levels of education over time - Employed for wages
Table A15b: Indonesia - Returns to levels of education (relative to primary education) - Employed for
wages 1994 2001 2007 Change
2007-94 Basic controls only Primary Junior Sec./primary Senior Sec./ primary Tertiary/primary
0.213
0.234
0.596
1.125
0.242
0.238
0.578
1.123
0.242
0.128
0.508
1.084
0.029
-0.106
-0.088
-0.041
Basic controls + Industry dummies Primary Junior Sec./primary Senior Sec./ primary Tertiary/primary
0.195
0.235
0.610
1.137
0.226
0.227
0.564
1.096
0.243
0.126
0.498
1.070
0.049
-0.109
-0.112
-0.067
1994 1996 1999 2001 2003 2005 2007 Change 2007-1994
Industry dummies included Upper Sec. and above/ Low sec. and below At least some tertiary/ Secondary and below
0.677
0.819
0.663
0.788
0.542
0.691
0.575
0.752
0.549
0.658
0.567
0.667
0.622
0.771
-0.055
-0.048

87
Table A15c: Indonesia - Returns to levels of education (relative to primary education) - Employed for wages
1994 2001 2007 Change 2007-94
Basic controls only Primary Secondary/ primary Tertiary/primary
0.218
0.468
1.109
0.245
0.458
1.105
0.242
0.369
1.069
0.024
-0.099
-0.040
Basic controls + Industry dummies Primary Secondary/ primary Tertiary/primary
0.197
0.466
1.099
0.226
0.431
1.052
0.237
0.351
1.016
0.040
-0.115
-0.083
Table A15d: Indonesia- Returns to levels of education (relative to primary education) - Employed for wages
1994 1997 1999 2001 2003 2005 2007 Change 2007-94
Basic controls only High school general/ primary High school vocational/ primary Tertiary/primary
0.527
0.663
1.123
0.498
0.645
1.046
0.509
0.634
1.044
0.539
0.613
1.117
0.548
0.629
1.064
0.527
0.614
1.034
0.486
0.547
1.084
-0.041
-0.116
-0.039
Basic controls + Industry dummies High school general/ primary High school vocational/ primary Tertiary/primary
0.545
0.678
1.139
0.504
0.638
1.104
0.504
0.615
1.016
0.534
0.603
1.097
0.530
0.599
1.027
0.529
0.612
1.030
0.479
0.526
1.056
-0.066
-0.152
-0.083

88
Table A16a: Philippines - Returns to levels of education over time – Employed individuals
Table A16b: Philippines - Returns to levels of education - Employed for wages 1988 2006 Change (%)
2006-1988 Basic controls only - Secondary/primary - Tertiary/primary
0.415 1.075
0.492 1.184
18.5 10.1
Basic controls + Industry dummies - Secondary/primary - Tertiary/primary
0.254 0.691
0.201 0.593
-20.9 -14.1
1988 1991 1994 1997 2001 2004 2006 Change 2006-1988
With Industry dummies Some Secondary and above/ primary and below At least some tertiary/ Secondary and below
0.254
0.437
0.264
0.425
0.230
0.395
0.239
0.413
0.202
0.402
0.197
0.384
0.201
0.392
-0.063
-0.045

89
Table A17a: Thailand - Returns to levels of education over time – Employed individuals
Table A17b: Thailand - Returns to levels of education over time – Employed individuals
1990 1994 2000 2004 2004-1990 Industry dummies included Senior sec. and above/ low sec. and below Tertiary/ Upper sec. and below
0.846
1.056
0.883
1.045
0.740
0.916
0.696
0.955
-0.150
-0.101
1990 2000 2004 2004-1990 Basic controls only Primary Junior Sec./primary Senior Sec./ primary Tertiary/primary
0.301
0.374
0.636
1.093
0.481
0.314
0.608
1.229
0.394
0.316
0.603
1.289
0.093
-0.058
-0.033
0.196
Basic controls + Industry dummies Primary Junior Sec./primary Senior Sec./ primary Tertiary/primary
0.221
0.306
0.571
1.089
0.285
0.220
0.492
1.039
0.253
0.214
0.430
1.072
0.032
-0.092
-0.141
-0.017

90
Table A17c: Thailand - Returns to levels of education over time – Employed individuals
Table A17d: Thailand - Returns to levels of education over time – Employed individuals
1990 2000 2004 2004-1990 Basic controls only Primary Secondary/ primary Tertiary/primary
0.298
0.525
1.092
0.478
0.483
1.222
0.393
0.482
1.285
0.095
-0.043
0.193
Basic controls + Industry dummies Primary Secondary/ primary Tertiary/primary
0.219
0.455
1.081
0.283
0.371
1.021
0.251
0.336
1.060
0.032
-0.119
-0.021
1990 2000 2004 2004-1990 Basic controls only High school general/ primary High school vocational/ primary Tertiary/primary
0.471
0.730
1.097
0.538
0.668
1.231
0.482
0.719
1.289
0.011
-0.011
0.192
Basic controls + Industry dummies High school general/ primary High school vocational/ primary Tertiary/primary
0.389
0.666
1.094
0.396
0.578
1.045
0.327
0.533
1.078
-0.062
-0.133
-0.016

91
Table A18a: Vietnam - Returns to levels of education over time- Employed for wages
Table A18b: Vietnam - Returns to levels of education over time- Employed for wages
1992 1998 2004 2006 Change 1992-2006
Industry dummies included Lower Secondary and above/ primary and below Upper secondary and above/ Lower Secondary and below At least some tertiary/ Secondary and below
-0.082
0.030
0.239
-0.013
0.193
0.419
0.135
0.294
0.463
0.170
0.276
0.516
0.252
0.246
0.277
1992 1998 2004 2006 Change 1992-2006
Basic controls only Primary Junior Sec./primary Senior Sec./ primary Tertiary/primary
-0.019
-0.172
-0.175
0.00
-0.139
-0.088
0.046
0.390
0.076
-0.034
0.193
0.584
0.094
0.055
0.210
0.648
0.113
0.227
0.385
0.648
Basic controls + Industry dummies Primary Junior Sec./primary Senior Sec./ primary Tertiary/primary
-0.018
-0.167
-0.123
0.151
-0.107
-0.077
0.090
0.450
0.077
-0.040
0.181
0.584
0.080
0.039
0.195
0.638
0.098
0.206
0.318
0.487

92
Table A18c: Vietnam - Returns to levels of education over time- Employed for wages
Table A18d: Vietnam - Returns to levels of education over time- Employed for wages
1992 1998 2004 2006 Change 1992-2006
Basic controls only Primary Secondary/ primary Tertiary/primary
-0.019
-0.174
0.00
-0.143
-0.032
0.366
0.072
0.077
0.533
0.089
0.114
0.612
0.108
0.288
0.612
Basic controls + Industry dummies Primary Secondary/ primary Tertiary/primary
-0.018
-0.151
0.141
-0.112
-0.008
0.418
0.070
0.063
0.526
0.074
0.097
0.596
0.092
0.248
0.455
1992 1998 2004 2006 Change 1992-2006
Basic controls only High school general/ primary High school vocational/ primary Tertiary/primary
-0.040
-0.222
0.023
0.058
0.014
0.385
0.164
0.206
0.576
0.147
0.211
0.648
0.187
0.433
0.625
Basic controls + Industry dummies High school general/ primary High school vocational/ primary Tertiary/primary
0.001
-0.167
0.135
0.098
0.062
0.447
0.161
0.187
0.575
0.142
0.187
0.634
0.141
0.354
0.499

93
Table A19a: Cambodia - Returns to levels of education over time –Employed individuals 1997 2003-4 2007 Change
1997-2007 Industry dummies included Lower Secondary and above/ primary and below At least Upper secondary/ Lower Secondary and below Tertiary/Upper secondary and below
0.146
0.155
0.302
0.363
0.448
0.699
0.256
0.301
0.630
0.110
0.146
0.328
Table A19b: Cambodia - Returns to levels of education over time –Employed individuals 1997 2003-4 2007 Change
1997-2007 Basic controls only Primary Junior Sec./primary Senior Sec./ primary Tertiary/primary
0.122
0.092
0.111
0.313
0.347
0.171
0.395
0.711
0.276
0.227
0.388
1.035
0.154
0.135
0.277
0.722 Basic controls + Industry dummies Primary Junior Sec./primary Senior Sec./ primary Tertiary/primary
0.114
0.061
0.104
0.320
0.210
0.132
0.351
0.699
0.152
0.117
0.165
0.731
0.038
0.056
0.061
0.411

94
Table A19c: Cambodia - Returns to levels of education over time –Employed individuals 1997 2003-4 2007 Change
1997-2007 Basic controls only Primary Secondary/ primary Tertiary/primary
0.088
0.123
0.334
0.267
0.279
0.743
0.224
0.279
1.029
0.136
0.156
0.695
Basic controls + Industry dummies Primary Secondary/ primary Tertiary/primary
0.072
0.080
0.337
0.171
0.217
0.694
0.119
0.127
0.721
0.047
0.047
0.384

95
Table A20a: China - Returns to levels of education over time –Employed individuals 1999 2005 Change
1999-2005 Industry dummies included At least Upper secondary/ Lower Secondary and below Tertiary/Upper secondary and below
0.239
0.397
0.456
0.578
0.217
0.181
Table A20b: China - Returns to levels of education over time –Employed individuals 1999 2005 Change
1999-2005 Basic controls only Primary Junior Sec./primary Senior Sec./ primary Tertiary/primary
0.095
0.054
0.192
0.607
0.131
0.159
0.466
0.958
0.036
0.105
0.274
0.351 Basic controls + Industry dummies Primary Junior Sec./primary Senior Sec./ primary Tertiary/primary
0.108
0.052
0.178
0.538
0.089
0.163
0.468
0.930
-0.019
0.111
0.29
0.392

96
Table A20c: China - Returns to levels of education over time –Employed individuals 1999 2005 Change
1999-2005 Basic controls only Primary Secondary/ primary Tertiary/primary
0.095
0.119
0.602
0.129
0.334
0.943
0.034
0.215
0.341
Basic controls + Industry dummies Primary Secondary/ primary Tertiary/primary
0.107
0.111
0.532
0.087
0.336
0.909
-0.020
0.225
0.377

97
Table A21a: Mongolia - Returns to levels of education over time- Employed for wages
Table A21b: Mongolia - Returns to levels of education over time- Employed for wages
* Estimates not statistically significant except for university. ** Estimates not statistically significant except for higher diploma and university.
1998 2002 2007-8 Change 1998-2007
Basic controls only Upper secondary and above/ Lower Secondary and below At least some tertiary/ Secondary and below
0.315
0.299
0.264
0.376
0.769
0.701
0.454
0.411
Industry dummies included Upper secondary and above/ Lower Secondary and below At least some tertiary/ Secondary and below
0.280
0.286
0.282
0.392
0.743
0.684
0.463
0.398
1998* 2002** 2007-8*** Change 1998-2007
Basic controls only Primary Junior Sec./primary Senior Sec./ primary Higher Diploma/primary University/primary
-0.250
0.521
0.603
0.667
0.979
0.059
0.203
0.249
0.500
0.705
0.116
0.290
0.786
1.306
1.387
0.366
-0.231
0.183
0.639
0.408 Basic controls + Industry dummies Primary Junior Sec./primary Senior Sec./ primary Higher Diploma/primary University/primary
-0.243
0.463
0.520
0.592
0.896
0.074
0.195
0.259
0.524
0.725
0.108
0.292
0.776
1.294
1.365
0.351
-0.171
0.252
0.702
0.469
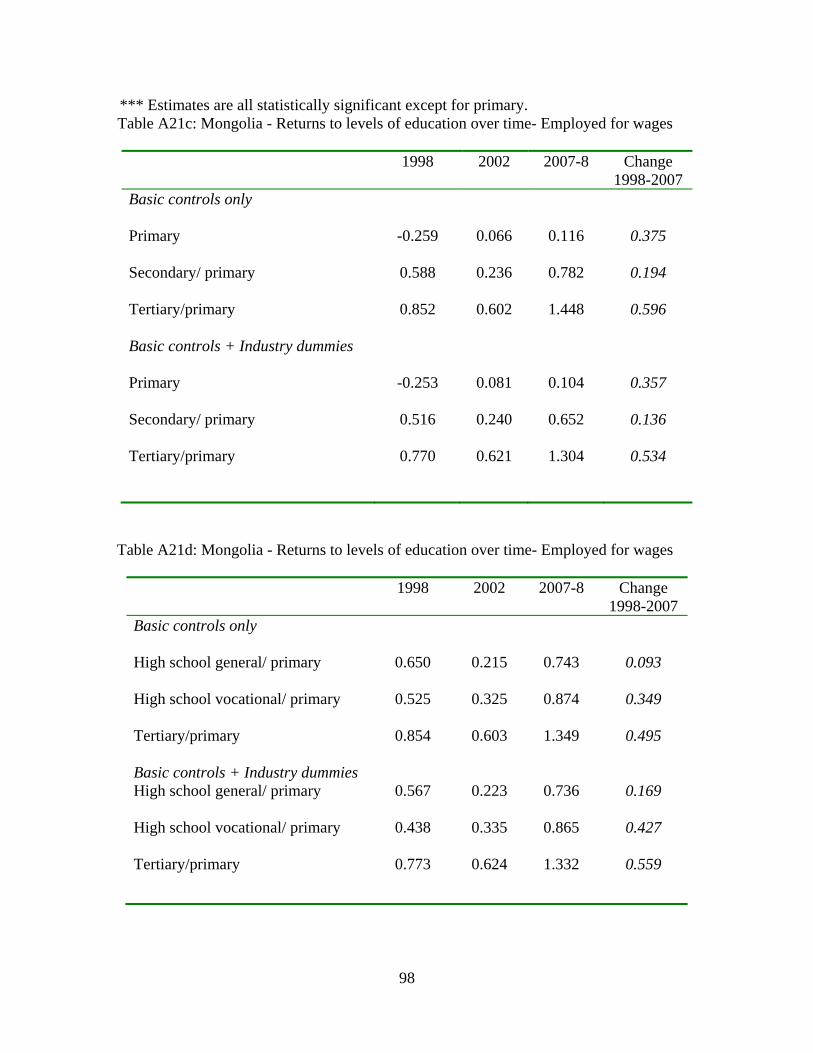
98
*** Estimates are all statistically significant except for primary. Table A21c: Mongolia - Returns to levels of education over time- Employed for wages
Table A21d: Mongolia - Returns to levels of education over time- Employed for wages
1998 2002 2007-8 Change 1998-2007
Basic controls only Primary Secondary/ primary Tertiary/primary
-0.259
0.588
0.852
0.066
0.236
0.602
0.116
0.782
1.448
0.375
0.194
0.596
Basic controls + Industry dummies Primary Secondary/ primary Tertiary/primary
-0.253
0.516
0.770
0.081
0.240
0.621
0.104
0.652
1.304
0.357
0.136
0.534
1998 2002 2007-8 Change 1998-2007
Basic controls only High school general/ primary High school vocational/ primary Tertiary/primary
0.650
0.525
0.854
0.215
0.325
0.603
0.743
0.874
1.349
0.093
0.349
0.495
Basic controls + Industry dummies High school general/ primary High school vocational/ primary Tertiary/primary
0.567
0.438
0.773
0.223
0.335
0.624
0.736
0.865
1.332
0.169
0.427
0.559