industry and trade summary: gemstones - usitc · pdf fileindustry~ trade summary gemstones...
TRANSCRIPT

\)
Industry~ Trade Summary Gemstones
USITC Publication 3018 March 1997
OFFICE OF INDUSTRIES U.S. International Trade Commission Washington, DC 20436

UNITED STATES INTERNATIONAL TRADE COMMISSION
COMMISSIONERS
Marcia E. Miller, Chairman
Lynn M. Bragg, Vice Chairman
Don E. Newquist Carol T. Crawford
Robert A. Rogowsky Director of Operations
Vern Simpson Director of Industries
This report was prepared principally by
Linda A. White
Minerals, Metals, Machinery, and Miscellaneous Manufactures Division Industrial Minerals and Nonferrous Metals Branch
Address all communications to Secretary to the Commission
United States International Trade Commission Washington, DC 20436

PREFACE
In 1991 the United States International Trade Commission initiated its current Industry and Trade Summary series of informational reports on the thousands of products imported into and exported from the United States. Each summary addresses a different commodity/industry area and contains information on product uses, U.S. and foreign producers, and customs treatment. Also included is an analysis of the basic factors affecting trends in consumption, production, and trade of the commodity, as well as those bearing on the competitiveness of U.S. industries in domestic and foreign markets.1
This report on gemstones covers the period 1991through1995 and represents one of approximately 250 to 300 individual reports to be produced in this series. Listed below are the individual summary reports published to date on the minerals, metals, machinery, and miscellaneous manufactures sector.
USITC publication number
2426 2475
2476 2504 2523 2546
2570
2587 2623 2633 2653 2692 2694
2706 2738 2742
Publication date
November 1991 .......... . July 1992 ............... .
January 1992 ............ . November 1992 .......... . June 1992 ............... . August 1992 ............. .
November 1992 .......... .
January 1993 ............ . April 1993 .............. . June 1993 ............... . June 1993 ............... . November 1993 November 1993 .......... .
April 1994 .............. . February 1994 ........... . March 1994 ............. .
Title
Toys and models Fluorspar and certain other mineral substances
Lamps and lighting fittings Ceramic floor and wall tiles Prefabricated buildings Agricultural and horticultural
machinery Electric household appliance
and certain heating equipment Heavy structural steel shapes Copper Textile machinery and parts Glass containers Refractory ceramic products Flat glass and certain flat glass products
Aluminum Structural ceramic products Fiberglass products
1 The information and analysis provided in this report are for the purpose of this report only. Nothing in this report should be construed to indicate how the Commission would find in an investigation conducted under statutory authority covering the same or similar subject matter.
1

PREFACE-Continued
USITC publication number
2748
2756
2757 2758 2765
2872 2857
2858 2880
Publication date
March 1994
March 1994
March 1994 ............. . March 1994 ............. . April 1994 .............. .
May 1995 ............... . May 1995 ............... .
May 1995 ............... . June 1995 ............... .
11
Title
Brooms, brushes, and hairgrooming articles
Air-conditioning equipment and parts
Builders hardware Semifinished steel Metalworking machine tools
and accessories Abrasives Industrial food-processing
machinery and related equipment
Precious metals Stainless steel mill products

CONTENTS
Page
Preface .................................................................... .
Abstract . . . ... . ........................ .. ........... ... . . . .. . . . . . . . . . . . . . . . 1
Introduction.............................................................. 3
Processing . . . . . . . . . . . . . . . . . . . . . . . . . . . . . . . . . . . . . . . . . . . . . . . . . . . . . . . . . . . . . . . . . 4
Diamonds and colored gemstones . . . . . . . . . . . . . . . . . . . . . . . . . . . . . . . . . . . . . . . . . . . . . . 5 Synthetic colored gemstones . . . . . . . . . . . . . . . . . . . . . . . . . . . . . . . . . . . . . . . . . . . . . . . . . . 6
Melt methods . . . . . . . . . . . . . . . . . . . . . . . . . . . . . . . . . . . . . . . . . . . . . . . . . . . . . . . . . . . 6 Solution methods . . . . . . . . . . . . . . . . . . . . . . . . . . . . . . . . . . . . . . . . . . . . . . . . . . . . . . . . 7
Synthetic diamonds . . . . . . . . . . . . . . . . . . . . . . . . . . . . . . . . . . . . . . . . . . . . . . . . . . . . . . . . . 7 Natural and cultured pearls . . . . . . . . . . . . . . . . . . . . . . . . . . . . . . . . . . . . . . . . . . . . . . . . . . . 8 Cutting and polishing . . . . . . . . . . . . . . . . . . . . . . . . . . . . . . . . . . . . . . . . . . . . . . . . . . . . . . . . 9
Colored gemstones . . . . . . . . . . . . . . . . . . . . . . . . . . . . . . . . . . . . . . . . . . . . . . . . . . . . . . 9 Diamonds . . . . . . . . . . . . . . . . . . . . . . . . . . . . . . . . . . . . . . . . . . . . . . . . . . . . . . . . . . . . . . 10 Pearls . . . . . . . . . . . . . . . . . . . . . . . . . . . . . . . . . . . . . . . . . . . . . . . . . . . . . . . . . . . . . . . . . 11
Marketing and Pricing . . . . . . . . . . . . . . . . . . . . . . . . . . . . . . . . . . . . . . . . . . . . . . 12
Market distribution . . . . . . . . . . . . . . . . . . . . . . . . . . . . . . . . . . . . . . . . . . . . . . . . . . . . . . . . . 12 General pricing standards . . . . . . . . . . . . . . . . . . . . . . . . . . . . . . . . . . . . . . . . . . . . . . . . . . . . 18
Cut and polished diamonds . . . . . . . . . . . . . . . . . . . . . . . . . . . . . . . . . . . . . . . . . . . . . . . . 18 Natural pearls . . . . . . . . . . . . . . . . . . . . . . . . . . . . . . . . . . . . . . . . . . . . . . . . . . . . . . . . . . 19 Natural colored gemstones . . . . . . . . . . . . . . . . . . . . . . . . . . . . . . . . . . . . . . . . . . . . . . . . 20 Cultured pearls and synthetic gemstones . . . . . . . . . . . . . . . . . . . . . . . . . . . . . . . . . . . . . 22
U.S. Industry Profile . . . . . . . . . . . . . . . . . . . . . . . . . . . . . . . . . . . . . . . . . . . . . . . . . . 22
Industry structure . . . . . . . . . . . . . . . . . . . . . . . . . . . . . . . . . . . . . . . . . . . . . . . . . . . . . . . . . . . 22 Producers, employment, geographic distribution . . . . . . . . . . . . . . . . . . . . . . . . . . . . . . . . . . 22
111

CONTENTS-Continued
Page
U.S. Industry Profile-Continued Producers, employment, geographic distribution-Continued
Natural pearls and gemstones . . . . . . . . . . . . . . . . . . . . . . . . . . . . . . . . . . . . . . . . . . . . . . . . . 23 Synthetic colored gemstones and diamonds . . . . . . . . . . . . . . . . . . . . . . . . . . . . . . . . . . . . . . 24
Foreign Industry Profile . . . . . . . . . . . . . . . . . . . . . . . . . . . . . . . . . . . . . . . . . . . . . 24
Rough, unworked materials . . . . . . . . . . . . . . . . . . . . . . . . . . . . . . . . . . . . . . . . . . . . . . . . . . . 25 Diamonds . . . . . . . . . . . . . . . . . . . . . . . . . . . . . . . . . . . . . . . . . . . . . . . . . . . . . . . . . . . . . . 26
Russia . . . . . . . . . . . . . . . . . . . . . . . . . . . . . . . . . . . . . . . . . . . . . . . . . . . . . . . . . . . . . 27 Botswana . . . . . . . . . . . . . . . . . . . . . . . . . . . . . . . . . . . . . . . . . . . . . . . . . . . . . . . . . . 28 South Africa . . . . . . . . . . . . . . . . . . . . . . . . . . . . . . . . . . . . . . . . . . . . . . . . . . . . . . . . 28 Zaire . . . . . . . . . . . . . . . . . . . . . . . . . . . . . . . . . . . . . . . . . . . . . . . . . . . . . . . . . . . . . . 29 Australia . . . . . . . . . . . . . . . . . . . . . . . . . . . . . . . . . . . . . . . . . . . . . . . . . . . . . . . . . . . 29 Namibia . . . . . . . . . . . . . . . . . . . . . . . . . . . . . . . . . . . . . . . . . . . . . . . . . . . . . . . . . . . 30 Angola . . . . . . . . . . . . . . . . . . . . . . . . . . . . . . . . . . . . . . . . . . . . . . . . . . . . . . . . . . . . 30
Pearls . . . . . . . . . . . . . . . . . . . . . . . . . . . . . . . . . . . . . . . . . . . . . . . . . . . . . . . . . . . . . . . . . 31 Japan.............................................................. 31 China.............................................................. 32 Australia . . . . . . . . . . . . . . . . . . . . . . . . . . . . . . . . . . . . . . . . . . . . . . . . . . . . . . . . . . . 32
Colored gemstones . . . . . . . . . . . . . . . . . . . . . . . . . . . . . . . . . . . . . . . . . . . . . . . . . . . . . . 33 Synthetic gemstones . . . . . . . . . . . . . . . . . . . . . . . . . . . . . . . . . . . . . . . . . . . . . . . . . . . . . 33
Cutting sector . . . . . . . . . . . . . . . . . . . . . . . . . . . . . . . . . . . . . . . . . . . . . . . . . . . . . . . . . . . . . . 35 Diamonds . . . . . . . . . . . . . . . . . . . . . . . . . . . . . . . . . . . . . . . . . . . . . . . . . . . . . . . . . . . . . . 35
Belgium............................................................ 36 Israel . . . . . . . . . . . . . . . . . . . . . . . . . . . . . . . . . . . . . . . . . . . . . . . . . . . . . . . . . . . . . . 36 India . . . . . . . . . . . . . . . . . . . . . . . . . . . . . . . . . . . . . . . . . . . . . . . . . . . . . . . . . . . . . . 37 China.............................................................. 38 Thailand . . . . . . . . . . . . . . . . . . . . . . . . . . . . . . . . . . . . . . . . . . . . . . . . . . . . . . . . . . . 3 8
Colored gemstones . . . . . . . . . . . . . . . . . . . . . . . . . . . . . . . . . . . . . . . . . . . . . . . . . . . . . . 3 8
U.S. Market . . . . . . . . . . . . . . . . . . . . . . . . . . . . . . . . . . . . . . . . . . . . . . . . . . . . . . . . . . . . . . 39
Consumer characteristics and factors affecting demand . . . . . . . . . . . . . . . . . . . . . . . . . . . . . 39 Consumption . . . . . . . . . . . . . . . . . . . . . . . . . . . . . . . . . . . . . . . . . . . . . . . . . . . . . . . . . . . . . . 3 9 Production . . . . . . . . . . . . . . . . . . . . . . . . . . . . . . . . . . . . . . . . . . . . . . . . . . . . . . . . . . . . . . . . 44
lV

CONTENTS-Continued
Page
U.S. Trade . . . . . . . . . . . . . . . . . . . . . . . . . . . . . . . . . . . . . . . . . . . . . . . . . . . . . . . . . . . . . . . . 45
Overview . . . . . . . . . . . . . . . . . . . . . . . . . . . . . . . . . . . . . . . . . . . . . . . . . . . . . . . . . . . . . . . . . 45 U.S. imports ............................................. , . . . . . . . . . . . . . . . . . 45
Cut gemstones . . . . . . . . . . . . . . . . . . . . . . . . . . . . . . . . . . . . . . . . . . . . . . . . . . . . . . . . . . 4 7 Rough gemstones . . . . . . . . . . . . . . . . . . . . . . . . . . . . . . . . . . . . . . . . . . . . . . . . . . . . . . . 48 U.S. trade measures . . . . . . . . . . . . . . . . . . . . . . . . . . . . . . . . . . . . . . . . . . . . . . . . . . . . . . 48
U.S. exports . . . . . . . . . . . . . . . . . . . . . . . . . . . . . . . . . . . . . . . . . . . . . . . . . . . . . . . . . . . . . . . 51 Principal markets . . . . . . . . . . . . . . . . . . . . . . . . . . . . . . . . . . . . . . . . . . . . . . . . . . . . . . . . 51
Switzerland . . . . . . . . . . . . . . . . . . . . . . . . . . . . . . . . . . . . . . . . . . . . . . . . . . . . . . . . . 51 Hong Kong . . . . . . . . . . . . . . . . . . . . . . . . . . . . . . . . . . . . . . . . . . . . . . . . . . . . . . . . . 51 Canada . . . . . . . . . . . . . . . . . . . . . . . . . . . . . . . . . . . . . . . . . . . . . . . . . . . . . . . . . . . . 52
U.S. export levels . . . . . . . . . . . . . . . . . . . . . . . . . . . . . . . . . . . . . . . . . . . . . . . . . . . . . . . 52 Foreign trade measures . . . . . . . . . . . . . . . . . . . . . . . . . . . . . . . . . . . . . . . . . . . . . . . . . . . 54
Appendixes A. B C. D. E.
Explanation of tariff and trade agreement terms .................................. . hnports .................................................................. . Domestic exports ........................................................... . Re-exports ............................................................... . Total exports ............................................................. .
Figures 1. 2. 3. 4. 5. 6.
7.
8.
9.
10.
11.
12.
General distribution of natural diamonds General distribution of colored gemstones, natural and synthetic ..................... . General distribution of pearls, natural and cultured ................................ . How rough diamondS get from the mine to the store ............................... . Value determinants of gemstones ............................................. . Natural and synthetic gemstones: Change in U.S. apparent consumption relative
to disposable personal income and consumer confidence indexes, 1991-95 ......... . Indexes of rough diamond import values and trade-
weighted average unit price, 1991-95 ....................................... . Indexes of cut diamond import values and trade-weighted
average unit price, 1991-95 .............................................. . Indexes of cut colored gemstone import values and trade-
weighted average unit price, 1991-95 ....................................... . Indexes of rough colored gemstone import values and trade-
weighted average unit price, 1991-95 ....................................... . Natural and synthetic gemstones: U.S. domestic exports, re-exports, total
exports, and imports for consumption, 1991-95 .............................. . Natural and synthetic gemstones: Comparison of U.S. domestic exports,
re-exports, and total exports, 1991-95 ...................................... .
v
A-1 B-1 C-1 D-1 E-1
13 14 15 16 21
40
42
42
43
43
47
52

CONTENTS-Continued
Page
Tables 1. U.S. producers of synthetic gemstones . . . . . . . . . . . . . . . . . . . . . . . . . . . . . . . . . . . . . . . . . . 25 2. Principal sources of gem diamonds, annual production, and relative
quality, 1992 . . . . . . . . . . . . . . . . . . . . . . . . . . . . . . . . . . . . . . . . . . . . . . . . . . . . . . . . . . . 27 3. Natural and synthetic gemstones, all products: U.S. shipments, net imports for consumption,
U.S. exports, and apparent U.S. consumption, 1991-95 . . . . . . . . . . . . . . . . . . . . . . . . . 41 4. Natural and synthetic gemstones: U.S. exports, imports for consumption, and
merchandise trade balance, by selected country and country groups, 1991-95 . . . . . . . . 46 5. Natural and synthetic gemstones: Harmonized Tariff Schedule subheadings;
description; U.S. col. 1 rate of duty as of Jan. 1, 1996; U.S. exports, 1995; and U.S. imports, 1995 . . . . . . . . . . . . . . . . . . . . . . . . . . . . . . . . . . . . . . . . . . . . . . 49
B-1. Natural diamonds: U.S. imports for consumption by principal source, 1991-95 . . . . . . . . . . B-2 B-2. Natural colored gemstones: value of U.S. imports for consumption by principal
source, 1991-95 . . . . . . . . . . . . . . . . . . . . . . . . . . . . . . . . . . . . . . . . . . . . . . . . . . . . . . . . . B-5 B-3. Pearls: value of U.S. imports for consumption by principal source, 1991-95 . . . . . . . . . . . . B-7 B-4. Synthetic and reconstructed gemstones: value of U.S. imports for
consumption by principal source, 1991-95.................................... B-9 C-1. Natural diamonds: U.S. exports of domestic merchandise to major markets,
1991-95 . . . . . . . . . . . . . . . . . . . . . . . . . . . . . . . . . . . . . . . . . . . . . . . . . . . . . . . . . . . . . . . C-2 C-2. Natural colored gemstones: value of U.S. exports of domestic merchandise
tomajormarkets, 1991-95 . . . . . . . . . . . . . . . . . . . . . . . . . . . . . . . . . . . . . . . . . . . . . . . . C-5 C-3. Pearls: value of U.S. exports of domestic merchandise to major markets,
1991-95 . . . . . . . . . . . . . . . . . . . . . . . . . . . . . . . . . . . . . . . . . . . . . . . . . . . . . . . . . . . . . . . C-6 C-4. Synthetic and reconstructed gemstones: value of U.S. exports of domestic
merchandise to major markets, 1991-95 . . . . . . . . . . . . . . . . . . . . . . . . . . . . . . . . . . . . . . C-8 D-1. Natural diamonds: re-exports of foreign merchandise to major markets,
1991-95 .......................................................... ·. . . . . D-2 D-2. Natural colored gemstones: value ofre-exports of foreign merchandise to
major markets, 1991-95 . . . . . . . . . . . . . . . . . . . . . . . . . . . . . . . . . . . . . . . . . . . . . . . . . . D-5 D-3. Pearls: value ofre-exports of foreign merchandise to major markets, 1991-95 . . . . . . . . . . . D-6 D-4. Synthetic and reconstructed gemstones: value ofre-exports of foreign
merchandisetomajormarkets, 1991-95...................................... D-8 E-1. Natural diamonds: U.S. exports of domestic and foreign merchandise to
majormarkets, 1991-95 . . . . . . . . . . . . . . . . . . . . . . . . . . . . . . . . . . . . . . . . . . . . . . . . . . E-2 E-2. Natural colored gemstones: value of U.S. exports of domestic and foreign
merchandise to major markets, 1991-95 . . . . . . . . . . . . . . . . . . . . . . . . . . . . . . . . . . . . . . E-5 E-3. Pearls: value of U.S. exports of domestic and foreign merchandise to major
markets, 1991-95 . . . . . . . . . . . . . . . . . . . . . . . . . . . . . . . . . . . . . . . . . . . . . . . . . . . . . . . E-6 E-4. Synthetic and reconstructed gemstones: value of U.S. exports of
domestic and foreign merchandise to major markets, 1991-95 . . . . . . . . . . . . . . . . . . . . E-8
V1

1


INTRODUCTION
This report provides a global overview of the gemstone industry and examines market trends through a unique compilation of production and trade data that is not otherwise readily available. Industry products covered include: (1) natural and cultured pearls, (2) natural and synthetic diamonds, and (3) natural and synthetic colored gemstones. These products may be in a rough state or they may be cut and/or polished to enhance beauty and commercial value, but they are not yet mounted or set.1 The report generally covers a 5-yearperiod, 1991to1995.
Although the United States accounts for less than 1 percent of total global gemstone production, it is the world's largest consumer of gemstones, particularly diamonds. Imports supply virtually all domestic requirements; in 1995, imports accounted for 92 percent of estimated U.S. gemstone consumption ($4.9 billion). Diamonds are the principal imported product and accounted for nearly 81 percent of estimated consumption in 1995, followed by imports of colored gemstones (8 percent), pearls (2 percent), and synthetic stones (1 percent). The balance of consumption is accounted for by domestically produced products. This trend was consistent throughout the report period.
Most gemstones are mineral compositions; all types have long been held in high esteem for their beauty, rarity, and durability. Although each type of gemstone is homogenous in terms of chemical and physical characteristics, differences in value are a function of qualitative characteristics such as clarity, size, color, and absence of flaws. Like many commodities, colored gemstones and pearls are generally priced on a unit of weight measure and traded on a supply and demand basis that is often cyclical. The diamond industry differs somewhat from other gemstones in that prices are supported by controlling the number and quality of gems in the marketplace relative to demand, a function performed by the international diamond cartel De Beers through its Central Selling Organization (CSO). This practice has resulted in a relatively consistent and stable value for diamonds.
The first stage of production of natural pearls, diamonds, and colored gemstones is determined by geographical deposits; the later stage of cutting and polishing is usually performed in a different country. Recently, there has been a shift in cutting and polishing centers away from the historic industrialized centers (the United States, Belgium, and Israel) to developing countries (India, Thailand, and China). Because gemstone cutting is largely labor-intensive, gemstone cutting and processing skills have gradually migrated to nations with relatively lower labor costs. Moreover, some new centers have adopted advanced cutting technology to mass
1 Gemstones are provided for in chapter 71 of the Harmonized Tariff Schedule of the United States. The Standard Industrial Classification (SIC) coverage of these products generally corresponds with SIC 14 99, Miscellaneous Nonmetallic Minerals, Except Fuels (that part pertaining to gemstone mining and processing); SIC 3299, Nonmetallic Mineral Products, Not Elsewhere Classified (pertaining to synthetic gemstone manufacturing); and SIC 3915, Jewelers' Findings and Materials, and Lapidary Work (pertaining to the cutting and polishing of gemstones).
3
produce low-value gems. In response to the competitive advantage of some developing nations, traditional cutting centers began to specialize in unique types of cuts or sizes of stones. This restructuring and specialization also has led to a reclassification of high-grade industrial diamonds to lower grade gem-quality diamonds that meet an important price-point niche in the market, attracting a broader customer base.
One unanticipated result of these changes in industry structure and specialization has been a rapid increase in production of substantially lower quality diamonds. The volume of low-quality output became so great that De Beers could no longer control wholesale prices. The result was the De Beers relaxation of the rigid and tightly controlled distribution structure as it applied to low-quality diamonds, and a re-focusing of the CSO's management on higher quality diamonds.
An emerging development that may soon impact gemstone markets is the synthetic production of diamonds. Although synthetic gem production is still relatively new and evolving, Russian research is concentrating in this area and several U.S. companies are already contracting for diamonds produced in Russia.
This summary provides an analysis of the gemstone industries. These industries are not selfcontained in any one country. Gemstones are mined or grown in countries with economically viable deposits; they are cut and polished in countries with comparatively low labor costs or market niche specializations; and fmally they are shipped to consuming countries that have populations with disposable discretionary income. The symbiotic structure of the industry and global transportation of gemstones has evolved because of the low-weight-to-value ratio of gemstones.
The summary begins by describing the origin, composition, and processing methods used to derive the various gemstone materials and to improve their intrinsic value and attractiveness. It includes an analysis of the market dynamics and the qualitative discriminators used to establish price benchmarks against standardized characteristics and market demand. Subsequent sections examine the U.S. industry and market in comparison to foreign industries and markets.
PROCESSING
The varied origin and composition of different gemstones determines the type of mining and processing. For example, organic gemstones like pearl and coral, are harvested from water bed environments and may be more fragile materials, while most other organic and inorganic
4

gemstones are mined from various rock formations (deposits). 2 Mining operations range from the most primitive to sophisticated, depending on the kind of deposit and on available financing.
Diamonds and Colored Gemstones
There are two basic kinds of deposits: alluvial/placer and vein. 4 Both alluviaVplacer and vein mining can range from a simple process of digging and sorting with hand tools in shallow deposits, to a complex process using mechanized, heavy-duty excavating, drilling, hauling, and sorting equipment. The most sophisticated technologies in gemstones mining operations are generally reserved for the extraction of diamonds from kimberlite vein deposits. 5
In typical large-scale diamond-mining operations, kimberlite ores are first crushed and screened in stages to a size of about 1.25 inches (a 1.25 inch screen will pass a 350-carat6 diamond) using jaw, gyrator, and roll crushers in sequence. In cases where crushing is deemed too severe, ore may be milled by putting the material in large rotating drums with water and rocks to gradually breakup the ore and release any diamonds.7 The broken up ore is wetted and scrubbed to separate soft conglomerates; heavy minerals, including diamonds, are gravity concentrated on 14-foot diameter rotmy washing pans. The heavy minerals are then passed to greased tables or belts that vibrate at high frequency; the diamonds adhere to the grease and a water wash removes the other minerals. A heated scrapper removes the grease-adherent diamonds from the table/belt and the grease is melted away with a boiling-water wash. Remaining diamond concentrate is screened at 7 mesh. 8 Coarse fractions are sorted by x-ray luminescence and then by hand. Finer fractions are milled to reduce any waste material to slime and washed away;
2 Organically formed gemstones, including pearl, amber, jet, coral, and petrified wood, are formed in one of three ways: (1) as dispersed substance of a living organism (e.g., pearl and coral), (2) as residual material (e.g., amber and jet), or (3) as product of solutions reacting with organic material (e.g. petrified wood).
3 Alluvial or placer deposits are beds of gemstone material that have been eroded from the source of origin, transported along with earth, sand, and gravel by flowing water, and brought to rest on the earth surface and along river beds and shore lines.
4 Vein deposits are fissures, fractures, and fault planes in a rock mass that have been filled with precipitated minerals from solution or with magmatic mineral material injected from the depths of the earth. Diamond-bearing veins are called kimberlites.
5 Kimberlite is an outcropping of the mineral olivine (and other minerals of iron and magnesium) that crystallized deep within the earth, then converted and surfaced as aggregates of hydrous (water containing) magnesium silicate. Kimberlite occurs in vertical pipes, dikes, and sills. U.S. Department of the Interior, A Dictionary of Mining, Mineral, and Related Terms, (Washington: GPO, 1968), p. 611.
6 Carat is a unit of weight used for gemstones, 1 carat equals 200 milligrams (about 3 grains of troy or avoirdupois weight).
7 Eric Bruton F. G.A., Diamonds, 2d ed. (Radnor, Pennsylvania: Chilton Book Co., 1978), p. 144. 8 Mesh is the number of holes or openings per linear inch in a sieve device, used to sort material by
SIZe.
5

remaining diamonds may be concentrated by skin tlotation,9 electrostatic separation, 10 or hand sorting.
Processing alluvial diamonds requires a different approach because they are coated with a film of mineral salts, making them water-avid and preventing adherence to the grease table. This condition is overcome by treating the concentrated minerals with maize oil and caustic soda, which creates a nonwettable surface on the diamonds so that they will adhere to the grease table/belt. Also the final treatment of alluvial diamonds requires a hydrofluoric acid wash to remove any adhering silicates.11
Synthetic Colored Gemstones
Colored gemstones are generally synthesized using variations of either the 'melt' or 'solution' crystal growth techniques, depending on the kind and quality of stone desired. Melt methods are reportedly easier to control than solution techniques and provide a rapid crystal growth rate (hours to days).
Melt Methods
Vemeuil flame fusion and Czochralski pulled-growth (named for the developers) are the more common melt methods; prices range from $5-$50 per rough carat on average, with flame fusion priced lower than pulled-growth.12 With the Verneuil flame fusion method, appropriate chemical compounds in powder form fall through a flame where the powder melts at a temperature of about 2,000 degrees Centigrade; resulting molten droplets fall onto a rotating fire-clay support, which is slowly withdrawn at a rate that allows the droplets to accumulate and solidify into a cylindrical shaped crystal, called a boule. Reportedly, boules weighing 30 carats have been made in about 30 minutes.13 The Czochralski pulled-growth method melts ingredient powders in a crucible. A rotating rod with a seed crystal attached on one end is
9 This process separates diamonds from any remaining waste at the surface of a body of water, which relies on the swface tension of water and the fact that diamonds resist being wetted by water.
10 This is based on the principle that like charges repel and unlike charges attract; finer diamond :fractions and any remaining waste are dropped between positive and negative electrodes that rotate in opposite directions; nonrepelled materials fall in a vertical plane and susceptible materials fall in a position somewhat removed from the vertical plane.
11 Norman L. Weiss, SME Mineral Processing Handbook, vol. 2 (New York: Society of Mining Engineers of the American Institute of Mining, Metallurgical, and Petroleum Engineers, Inc., 1985), p. 28-4.
12 Deborah A Catalano, "Lab-Grown Gems: A Changing and Growing market," National Jeweler, Mar. 16, 1996, p. 30.
13 Michael Weinstein, The World of Jewel Stones (New York: Sheridan House, Inc., 1958), p. 303.
6

lowered into the crucible until the seed touches the melt and is then slowly withdrawn. Both methods produce sapphire, mby, and spinel; pulled growth also produces alexandrite.14
Solution Methods
Information on these techniques is somewhat guarded. Solution methods are generally used for 'luxury' synthetics because they take months to produce high-quality crystals with internal growth marks similar to those found in natural stones; however, a trained gemologist can identify a solution-made stone. Common solution methods are flux and hydrothermal; prices reportedly range from $25-$200 per carat (rough), depending on the producer and on the kind and quality of gemstone.15 The flux method uses a nonwater solution with a relatively low melting point in which the ingredients to be synthesiz.ed are dissolved, creating a molten solvent. The solvent is cooled slowly to bring about crystallization of the desired gem product; commonly used to produce emerald, mby, sapphire, spinel, and alexandrite. Hydrothermal method uses a water-based solvent with relatively high temperatures and high pressure to bring about crystallization; this method is commonly used for emeralds, aquamarine, morganite, and beryl.16
Synthetic Diamonds
Although synthetic diamonds are reportedly produced in the United States for industrial purposes only,17 they are a natural evolution into the gem market. Therefore, the following simplified explanation of the temperature gradient method, developed by General Electric, is provided for informative purposes. Temperature gradient, as with the natural diamond-forming process, requires extreme temperatures (about 2,500-2,900 degrees Fahrenheit) and pressure (about 1.5 million pounds per square inch). The process begins by placing a carbon material (such as synthetic diamond grit) and a metal-alloy flux in a specially designed vessel. Seed crystals (usually small diamond crystals) are placed at the end(s) of the vessel. The temperature and pressure are gradually increased until the flux liquefies and the carbon material dissolves and blends with the flux. The vessel temperature is warmer in the center and cooler at the ends where the seeds are located. This temperature gradient causes carbon to precipitate from the carbon/flux solution and bond to the seed crystals, beginning a growth process. Successful synthesis of large, gem-quality diamonds requires slow growth in a stringently controlled
14 Catalano, "Lab-Grown Gems," p. 28. 15 Ibid., p. 30. 16 Ibid., p. 28. 17 Industrial applications include cutting, grinding, and polishing. In fact, industrial diamonds are
used to cut and polish gem-grade diamonds.
7

environment; a growth rate that is too fast impedes· crystal development. Industry sources report that it takes about 45 to 60 hours to synthesize a I-carat gem-quality diamond.18
Natural and Cultured Pearls
Under natural conditions, a pearl is formed when a minute particle or small parasite gets lodged in the soft tissue (mantle) of a live oyster.19 If the oyster cannot expel the unwanted foreign object, it becomes a source of irritation, causing the oyster to secrete concentric layers of calcium carbonate and organic matter around the object, thereby forming a pearl. Under cultured conditions,20 the same principal applies, but a technician makes an incision in the mantle of an oyster and implants the irritant. 21 This surgical process is usually performed under sanitized laboratory conditions to prevent infection and provide optimal survival rates. Live host oysters are placed in holding tanks of water and then into wire mesh structures suspended in water from floating poles; environmental conditions are monitored and the oysters inspected and cleaned for a specified period of time. It can take from months to 2-5 years to develop a natural or cultured pearl, depending on the desired size and environmental conditions. It normally takes longer to grow a pearl in cold, fresh water than in warmer water temperatures. Harvesting pearls is similar for both natural and cultured varieties; the oyster is pried open and the pearl removed, or in some cases cut free of the shell. Divers remove na~al pearl-bearing oysters from their habitat to harvest pearls, whereas cultured-pearl-bearing oysters are worked from the suspended structures. 22 ·
18 Sharon W ake:field, "Synthetic diamond jewelry: Are you prepared?," Jewelers' CircularKeystone (Mar. 1996), p. 48.
19 Pearl-producing oysters belong to the mussel family, also called mollusca; :freshwater mussels common in the United States belong to the unionidae variety.
2° Cultured half pearls were reportedly produced by Japanese scientist Mikimoto in 1894 and the whole pearl in 1913. In 1921, Japan started marketing the whole cultured pearl in mass quantity. See Weinstein, The World of Jewel Stones, pp. 88-89.
21 For cultured pearls, the irritant is usually a piece of mantle wrapped around a bead ofmother-ofpearl taken from a sacrificed oyster (generally, 20 to 30 irritants can be made from one oyster). Location of the irritant and whether or not it is free floating in the mantle material determines the shape of pearl; irritants that get lodged between the mantle and outer shell have to be cut from the shell and are usually flat and irregular in shape.
22 A live oyster may be used for two or more cultivating periods; more than one implant may be made per live oyster, depending on the size of the oyster and size and shape of the pearls desired.
8

Cutting and Polishing
Once created or removed from their natural environment, gemstones are enhanced to bring out their beauty and affect a desirable display of the material. The cutting segment of the industry generally specializes in cutting either colored gemstones of both natural and synthetic origin (called "lapidary") or diamonds (called "cutting" or sometimes "manufacturing"). The rudiments of cutting diamonds are first learned on inexpensive colored gemstones. Unlike diamond cutters, however, lapidists generally perform the whole job of cutting, shaping, and faceting a colored gem.
Colored Gemstones
Colored gemstones are generally cut and/or polished in one of three basic ways, depending on the shape and structure of the stone.23 (1) Baroque gems, which are of an irregular shape, may be left in their natmal shape, but polished by tumbling in a rubber-lined drum using a polishing medium with or without water.24 (2) Opaque to semi-translucent gems of crystalline structure are generally cut and polished into a convex hemispherical or oval shape with a smooth, rounded surface; this is called a cabochon cut and is commonly used for opals and star sapphires. (3) Transparent, crystalline gems of sufficient hardness are generally cut and polished into many small plane surfaces called "facets" to reflect light.
Colored gemstones can usually be cut in any direction and are soft enough that they can be shaped with an abrasive of silicon carbide or alumina powder. Traditionally, colored gemstones werecutforjewelrypurposes, into one of four basic shapes (round, oval, pear, and step-cut),25
with U.S. and European lapidists focused on perfecting faceted symmetrical planes to maximize the brilliance of a gem. As global competition showed that standardized cuts could be done in lower wage countries (chiefly in Asia) at lower prices and in greater quantities, production has shifted from the U.S. and Europe to new production centers.
23 Most gemstones are inorganic with a transparent, crystalline structure like diamonds. However, some colored stones have a compact amorphous massive structure making them opaque like opals. The structure depends on chemical composition and the basic geological formation process, of which there are three: (1) fusion-cooling and crystallization of magma (e.g., diamond, sapphire, and emerald); (2) metamorphic-chemical and physical change to a rock or mineral deposit deep within the earth as a result of heat, pressure, and moisture (e.g., garnet and emerald); and (3) solution-precipitation from aqueous solutions (e.g., opal and quartz). Some, like the emerald, are formed in more than one way, but all are mined from various rock formations.
24 This method applies to polished pearls as well as other naturally soft gemstones. The choice of polishing medium and use of water depends on the characteristics of the gem material being polished and the desired finish.
25 Step-cut is usually used for emeralds and for other crystalline gems, where the aim is to emphasize the body color of a stone and improve dispersion of light. Facets above and below the girdle line (the edge defining the upper and lower portion of a cut gem) are parallel and horizontal for a step effect; the general shape of the stone is oblong, square, or octagonal. (See Weinstein, The World of Jewel Stones, p. 33).
9

Advances in technology have also played a role in removing standard lapidary work from the hands of U.S. cutters. Computeriz.ed machinery can now calibrate standard cuts faster and more easily than a person can, often working a multiple number of stones at one time. However, most of the U.S. industry has not invested in equipment processing primarily because of cost. The U.S. sector is comprised mostly of individual cutters and small-size operations of 2 to 3 employees; the up-front investment would be substantial, particularly when competing with already established large-scale operations abroad. Moreover, machine cutting is not yet coste:ffective for larger stones because the amount of waste created is greater than waste generated from a good hand-cutter. Larger stones cost more per rough carat than small- or medium-sizes and the additional waste could eliminate any profit for that stone.
During the transition of standard cuts to mechanized off-shore operations, U.S. and European lapidists started moving in the direction of a more individualized and creative form of free-style cutting, called "fantasy cuts." Both traditional and the new contemporary cuts vary optical properties of light to enhance the visual appeal of a gem; the difference is in "the direction of play." Traditional lapidists refract light and play of color out from the stone toward the viewer, giving sparkle and brilliance, but contemporary cuts strive to capture and reflect light in a way that draws the viewer toward and into the stone. This innovative concept in cutting has changed the role lapidists play in jewelry design to collaboration between metalsmith and gem cutter, a role that is reported to have materialized in the last decade as both jewelry designers and customers embraced the change. 26
Diamonds
Gem-quality diamonds are always faceted; clarity and play oflight against the facets creates the ''brilliance" quality associated with these gems. In contrast to colored gemstones, diamonds are the hardest known substance and therefore must be cut and shaped with diamond abrasives. Because diamonds are also brittle, they can only be cut in certain directions. 27 Diamond cutters in the United States and worldwide (except maybe cutters of small, low-quality diamonds) tend to specialize in a particular phase of cut, rather than doing the entire job; one person may subdivide a diamond rough and eliminate flawed areas, another cut it into a basic shape, and yet another shape the facets.
Because of the high cost of labor, most of the low-valued diamonds marketed in the United States (including U.S. production) are cut in developing countries where hand labor is plentiful and relatively inexpensive. Diamond cutters in the United States earned an estimated monthly
26 Richard W. Wise, "A Cut Above: The New American Cutters," National Jeweler, June 1, 1996, pp. 68-76.
27 Unlike free-style cutting that can be applied to colored gemstones, the physical characteristics of diamond tend to limit styles of cut to symmetrical planes, although new shapes and angles are always being developed to improve brilliance and create interest.
10
wage of $1,300 to $2,000 in 1992,28 compared with $80 to $120 a month reported for China in 1994.29 The United States has long been recognized as a master cutting center, in which craftsmen of the trade tend to specialize in the larger (2 carats plus), high-quality diamonds distributed directly to cutters or through gemstone dealers. 30
Pearls
Because of the delicate characteristics of pearls, they are not cut to shape. 31 Instead, enhancement focuses on developing natural sheen or 'orient' identified with highly prized pearls. 32 Accordingly, some pearls may undergo a gentle buffing. One such method tumbles the pearls in a device :filled with table salt; the pearls are then rinsed with fresh water, dried, and tumbled a final time with bamboo chips. 33 Small openings are generally drilled in the pearls for stringing and sometimes dying is employed to enhance their color. When dying, the hue collects in the porous layer called the conchiolin, located between the nucleus and the outermost layer of the pearl. Bleaching may also be performed to remove any unwanted surface blemishes.
28 U.S. Department of Commerce, Bureau of the Census, Industry Series "Jewehy, Silverware, and Plated Ware, SIC 39152," (Lapidary work and diamond cutting and polishing), Census of Manufacturers, census years 1977 (p. 39A-12), 1987 (p. 39A-10), and 1992 (p. 39A-12).
29 Vinod Kuriyan, "China-Upcoming Land of Promise for Gems & Jewehy," Journal of Gem Industry, June 1994, p. 13.
30 Profit margins are higher for larger stones than for smaller ones, justifying higher U.S. labor costs. Also, the U.S. industry, by and large, has elected to not invest in modern (computerized) diamond-cutting equipment that cuts small-to-medium sized diamonds faster and more efficiently than cutting by hand. Clearly the industry has determined that the waste generated by machine cutting is greater than hand cutting, particularly for larger size diamonds that disproportionately reduces the absolute profit margins oflarger stones. Larger diamonds cost more per carat than smaller: ones, justifying U.S. specialization in traditional craftsmanship, as compared to an alternative of increased capitalization in automation.
31 Pearls are among the softer gemstones, ranging from about 3 to 4 on Mohs hardness scale of 1 to 10. In terms of weight, about 90 percent of a pearl is calcium carbonate, the remainder is organic matter and water, with minute undetermined residue. Specific gravity generally ranges between 2.5 to 2.9. (Weinstein, p. 74.)
32 Pearls are composed of thin translucent layers of calcium carbonate and organic matter formed in a concentric arrangement, from which light is diffracted and reflected. Color and quality of the 'orient' depend on the composition, thickness, and arrangement of the layers. (Weinstein, p. 289.)
33 Deborah A Catalano, "Cultivating Pearls Down Under," National Jeweler, vol. 39, No. 19, Oct. 1, 1995, p. 54.
11

MARKETING AND PRICING
Market Distribution
The distribution structure for gemstones is generally organized to move rough gems from producer, to dealers of rough gems, to cutters, to dealers of cut gems, and on to the ultimate customers (primarily jewelry manufacturers).34 There are some distinctions in the flow of goods for each product group. The distribution of diamonds is more involved than for colored gemstones because diamonds include De Beers' role as a dealer in the market. Pearls have the simplest distribution because they enter the market as finished goods. (figures 1-3.)
Dealers generally specialize in natural and synthetic/cultured diamonds, pearls, or colored gemstones, although some dealers may handle all types. In the case of diamonds and colored gemstones, dealers tend to specialize :further in handling either rough or cut goods. To facilitate the distribution of gemstones through the market, the industry has established trading clubs35
in major cities throughout the world, including New York, Los Angeles, Chicago, Houston, and Miami in the United States. Clubs provide central locations for international members to trade on a daily basis. Like the member merchants and traders of gemstones, clubs generally specialize in diamonds, colored gemstones, or pearls; they bring together traders of all types of materials (e.g., rough, cut, natural, and synthetic/cultured) within these groups. These trading organizations are popular because they provide a sense of security and integrity in the industry; membership or sponsorship by a member is required to enter as a visitor. The clubs generally have rules concerning trade practices, and clubs communicate readily with each other worldwide.
In addition to clubs, trade is conducted in offices of mining operations, dealers, and cutters. International gemstone trade shows are another major avenue for trade; shows provide a good one-stop selection for rough, cut, natural, and synthetic/cultured gemstones of all types. Major buyers of U.S. gemstones include gem and mineral merchants, cutting operations, jewelry manufacturers, wholesale and retail outlets, and gem and mineral shops.
The :fundamental difference in distribution of these goods is the amount of control exercised to bring them to market. Pearls and colored gemstones (natural, cultured, and synthetics) enter through numerous dealers and on a competitive price basis. The entry of diamonds, however, is greatly influenced by De Beers, an international diamond cartel. De Beers reportedly controls 80 percent of the world diamond production, with indirect influence over the remaining
34 The actual distribution flow in the market is very flexible in that any of the gem dealers can be bypassed; in the case of diamonds, approximately 20 percent of the value of world production can be sold outside the De Beers distribution network. There are also dealers who conduct all three operations: trading, cutting, and jewehy manufacturing.
35 Trading clubs are also referred to as trading exchanges and, in the case of diamonds, as bourses.
12
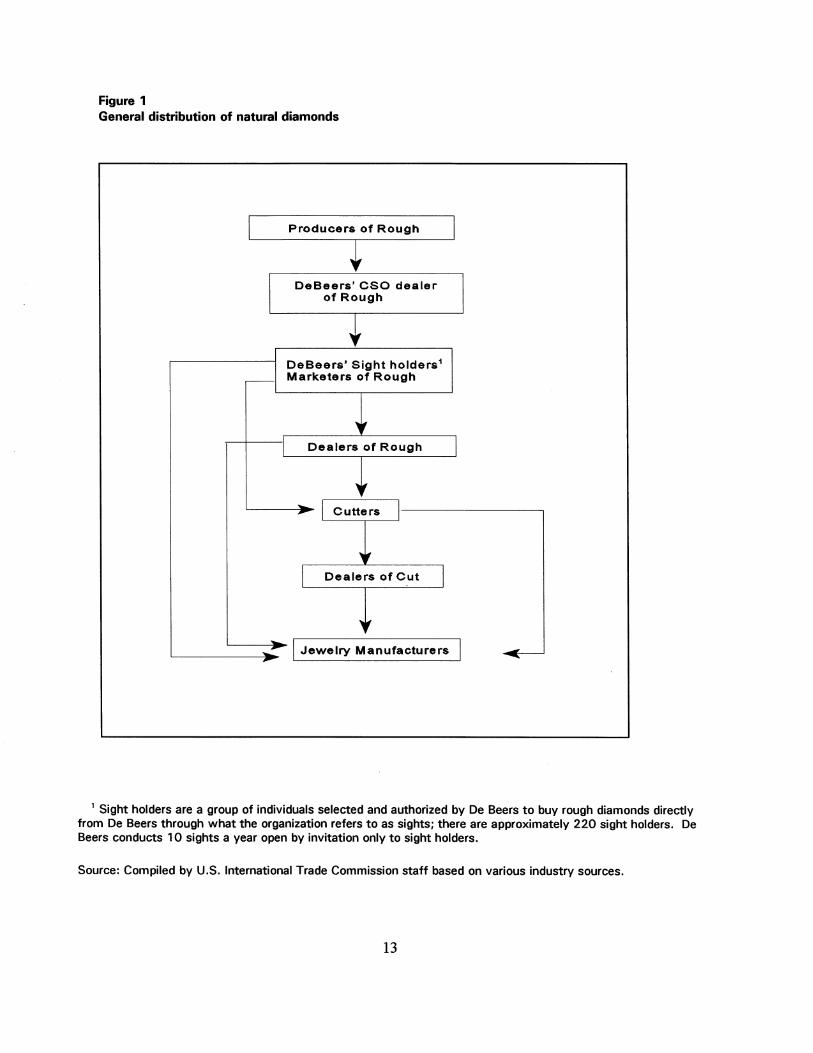
Figure 1 General distribution of natural diamonds
Producers of Rough
DeBeers' CSO dealer of Rough
DeBeers' Sight holders1
Marketers of Rough
Dealers of Rough
Cutters
Dealers of Cut
I Jewelry Manufacturers
1 Sight holders are a group of individuals selected and authorized by De Beers to buy rough diamonds directly from De Beers through what the organization refers to as sights; there are approximately 220 sight holders. De Beers conducts 10 sights a year open by invitation only to sight holders.
Source: Compiled by U.S. International Trade Commission staff based on various industry sources.
13

Figure 2 General distribution of colored gemstones, natural and synthetic
Producers of Rough
Dealers/Merchants of Rough
Cutters
Dealers/Merchants of Cut
Jewelry Manufacturers
Source: Compiled by U.S. International Trade Commission staff based on various industry sources.
14

Figure 3 General distribution of pearls, natural and cultured
I Producers of Pearla J
I Dealers of Pearla I
._______ Jewelry Manufacturers
Source: Compiled by U.S. International Trade Commission staff based on various industry sources.
20 percent (figure 4). Through its Central Selling Organization (CSO), De Beers signs 5-year contracts with most major producers (including Argyle of Australia and the Governments of Botswana and Russia) to buy all, or almost all, of the producers' rough diamond output. The CSO also buys rough stones from the market (including production of Zaire, Brazil, and Venezuela). By achieving marketing control over world production, the cartel establishes the quantity, quality, and price of unworked diamonds supplied to the world market.
The CSO sells rough diamonds to about 220 "sight holders" (about 20 from New York City) 10 times a year.36 Most of the sales are conducted in London through five brokerage firms that
36 Sight holders tend to be owners of diamond cutting businesses or dealers of rough diamonds.
15

Figure 4 HOW ROUGH DIAMONDS GET FROM THE MINE TO THE STORE1
Producers under contract to the Central Selling Organization
smuggled
L ____ L ____ i----t----i----~----~
I I I I I L ___ L __ L _____ 1
---T-----r-----1
I I I I I I
~-••••••~••••••••~•··~··•A•••••••••••••••~
16
Continued on next page

Producers not contracted to the Central Selling Organization
smuggled smuggled
•
r·t.., • • I I
Continued from previous page
• I • I •
----1 • I • I • I • I
Smuggled • • • • • Secondary rough market ---- CSO-contracted -·- Non-CSO pipeline
1 This flow chart covers 1991-1994. Later, several changes took place including: (1) Argyle went independent from the Central Selling Organisation (CSO) in 1996; (2) Russia changed its marketing and exports through Almazi Rossi Sakha in place of the sorting valuing firm, and approximately half of Russia's production is now exported outside the CSO through joint ventures and "leakage;" and (3) Angola's production is all unofficial.
Source: Russell Shor, " Diamonds: From Rough to Cutting Wheel, " Jewelers' Circular - Keystone, July 1992, pp. 100-101.
17

serve as intermediaries between sight holders and the CS0.37 The CSO determines the rough diamond allocation for each sight holder based on an assessment of the world diamond market conditions. The CSO reportedly applies a IO-percent markup to the producer price, and the brokerage firms collect an additional I percent of the sight value from the sight holder. The CSO's conditions of sales are simple-take the rough diamonds offered at the stated price, and pay cash up front.
Once in the market, rough diamonds are sold on a competitive price basis, relative to the same specific, although subjective, value determinants employed by the CSO: size (weight in carats), color, and quality.38 These three value determinants for rough diamonds provide the basis for gauging what the stone will be worth to a cutter, as the rough quality determines how the stone is to be cut and polished. In twn, the amount of cutting and polishing determines the size of the final stone; these final steps reportedly reduce the size of a rough diamond by at least one-half. Market dynamics in the United States favor the processing of large high-quality diamonds, resulting in the U.S. niche in world diamond cutting. For diamonds, the average value added from cutting and polishing is estimated to range between 30-40 percent of the sale price,39
depending on the cost of the original rough, quality of cut, and supply and demand of the cut stone.
General Pricing Standards
Cut and Polished Diamonds
Cut and polished diamonds have their own set of specific, although subjective, price determinants:40 perfection of cut, color,41 clarity, and size (in carats).42 The degree of
37 In 1991, the brokerage firms were reported to be I. Hennig & Company Ltd., W. Nagel, Bonas & Company Ltd., H. Goldie & Company, and J.P. Morgan. (see Peter Harben and Richard Notstaller, "Diamonds-Scintillating Performance in Growth and Prices," Industrial Minerals, Mar. 1991, pp. 43-44).
38 Quality includes the shape of the rough diamond crystal, and the number, size, darkness, and position of any flaws.
39 Estimated by Commission staff based on rough and worked diamond trade data. There are insufficient data to estimate added value for colored gemstones.
40 The sum of these determinants create the rarity factor, which is a measure of supply relative to demand and overall quality. Natural diamonds are an abundant commodity, but the supply of gemquality diamonds is limited. From an annual production of about 12 tons of natural diamonds in the late 1970s, 20 percent was considered gem quality rough with an approximate value of US $3 billion, the remaining 80 percent was valued at approximately US $7 50 million. See Bruton, p. 17.
41 Grading cut diamonds for color means determining the amount of deviation from the preferred truly colorless to gradual increases in tinges of color; yellow is the most common group. Full colored diamonds are marketed as fancies and are valued lower (in terms of color) than the colorless to near colorless category.
42 Commission staff believes other contributing factors are higher diamond prices, increasing number of worked deposits, and a growing interest in the wide variety of colored gemstones.
18

influence exerted by color and clarity on price is about the same, depending on market preference; in some countries color is less important than clarity and the reverse in other countries. Larger diamonds of fme quality are the most rare and bring higher prices-per-carat than smaller sized stones of comparable quality; for stones of the same quality, prices rise as weight increases, but at gradually decreasing rates. A general rule during the 1970s was that cut diamonds of twice the weight of a stone of equal quality cost 4 times as much, with price differential leveling off at about 10 carats. 43 By 1992, the size/price ratio of U.S. cut diamonds dropped to about 1.5 to 2 times as much for comparable diamonds of twice the weight.44 This was thought to be due largely to the sharp contraction in global demand from 1980 to 1986. Prior to this period, the diamond market was strong. Dealers of rough and cut diamonds started accumulating substantial inventories while prices were rising, financing their bank loans for additional inventory purchases with the value of diamonds on hand. 45
Cut and polished diamonds are graded for color and clarity by several internationally recognized standard commercial scales. There are two standard color scales in the United States; one developed by the American Gem Society and the other by the Gemological Institute of America (GIA).46 The GIA color scale ranges from the top-ranked colorless grade to yellow, using the letters of the alphabet from D (top grade) through X. The GIA clarity scale ranges from flawless (FL) when using a 1 OX lens, to imperfect, with inclusions just visible to the naked eye. Both GIA scales were the first to be universally applied. GIA encouraged the use of its scales by offering grading courses and designing and selling grading instruments. The GIA also set up a Gem Trade Laboratory in Los Angeles and one in New York City to grade diamonds and issue certificates for members of the trade and to the public.
Natural Pearls
Natural pearls are appraised by experts for size, shape, absence of surface blemishes, and orient (sheen). Round shapes (favored for strung necklaces) are the most valued, followed by drop and button shapes. Baroque shapes are the least valued. Larger, round pearls are favored because they are the most rare, although necklaces of round pearls of even graduation and all one color
43 Bruton. pp. 21 and 340. 44 U.S. Bureau of Mines, 1992 Annual Report on Gemstones, Table 6, p. 20. 45 Investment buying and speculation were also common place. Dealers and investors became the
only market for these goods, inducing even higher prices. This activity led to higher, albeit artificially inflated, demand and De Beers continued to supply goods to meet the apparent demand. The cycle spun out of control when prices outpaced purchasing/borrowing capacity, and the artificial demand could no longer support increased acquisition. Highly leveraged dealers/investors were caught with large inventories (including larger stones priced disproportionately higher per carat) and no customer at the asking price. Dealers/investors who could not service the cost of inventory were forced to sell stocks at a loss. De Beers, while not lowering its sight prices, reduced the number of stones it put on the market until supply and demand rationalized.
46 Another major grading scale in the international market is the International Confederation of Jewelry, Silverware, Diamonds, Pearls, and Stones (C.I.B.J.O), composed of 13 members in 1976: Austria, Belgium, Britain, Denmark, France, Finland, Germany, Holland, Italy, Norway, Spain, Sweden, and Switzerland.
19

are also very rare and valuable. Pairs of pearls of equal size, shape, and color (used for earrings) are more valuable than single pearls. Also of value in fme pearls is a slight play of color known as 'orient' or sheen, caused by diffraction and reflection of light through thin, translucent layers of carbonate of lime and organic matter that form the pearl. Color and quality of the 'orient' depend on the composition, thickness, and concentric arrangement of these layers; larger, thicker layers do not always translate into fine orient. The relative price-influence of a pearl size versus its orient (sheen or play of color) depends on market preference, with both factors considered important quality characteristics.
Natural Colored Gemstones
Natural colored gemstones are more complex and, some believe, subjective to appraise than diamonds and pearls because of the many different kinds of gemstones and ranges of colors. There are about 100 kinds of gemstones, the bulk of them colored gemstones. The major three-emerald, ruby, and sapphire-and their value determinants are described in figure 5.
There are no internationally recognized grading scales for colored gemstones, but there are general descriptive guidelines used by the trade. Traditionally, colored gemstones have been valued by comparing the color/quality of a gemstone from a particular deposit to an established benchmark gemstone from a different country. This is sometinies referred to as "locality" or "origin nomenclature." For example, use of the phrase "Burmese ruby" could identify a ruby from Burma (the quality standard for rubies), or it could be used as a comparable description of color saturation and purity of rubies from more recent sources including Thailand, Vietnam, and Kenya. Misnomers have sometimes been used to describe the color/quality of different colored gemstones, i.e., "African emerald" for tourmaline, "Brazil diamond" for quartz, and "Manchurian jade" for soapstone. These descriptive devices are a growing controversy within the trade because they imply value/price by association.
Grading systems for colored gemstones have emerged in the past 15 to 20 years, but there are no universally applied systems. Some in the trade do not like the use of grading systems, believing that they eliminate the romance associated with buying gemstones. Others advocate the use of a standard grading system for colored gemstones, arguing that a geQl.Stone from any deposit should be valued for its merits. They believe that grading systems will bring order to the market by providing a basis for determining prices and helping to instill public trust.
The GIA is encouraging the use of its grading guidelines for colored gemstones in the United States and in international markets by opening service and training branches in Taipei, Taiwan, and Venice, Italy. In addition, the International Colored Gemstone Association opened its first branch outside the United States in Jaipur, India, where an estimated 75 percent of the world's cut emeralds are traded, as well as a significant amount of other colored gemstones. The Gemological Association ofldar Oberstein, Germany (the world's oldest, established colored gemstone cutting and trading center) offers gemology service and provides training at its facility to English- and German-speaking students from any country.
20

Figure 5 Value determinants of gemstones
Diamond: Quality of cut, accurately proportioned Clarity, clean of surface and internal flaws for best refractive quality Color, clear or free of color (sometimes referred to as white) favored Weight, price increases with increase in weight.
Influence of color and clarity on price is about the same, depending on market preference; in some cases color is sacrificed over clarity and vice versa.
~: Natural versus cultured; natural favored Clean of surface blemishes Shape, round favored followed by drop and button shapes Size, large and round considered most rare and valuable Orient or sheen, esteemed in the finest pearls
Influence of color on price depends on market preference. Colors include white, off-white/cream, and shades of black, yellow, blue, green, and rosee.
Colored Gemstones, the three major gems: Emerald -
Quality of cut, accurately proportioned Green, strong saturation (amount of color) and strong tone (depth of color) Clean of surface and internal flaws Size
Emerald is a defined green shade of the mineral beryl (beryllium-aluminum silicate); generally in the range of medium to dark green. Beryl is also the basis for other gemstones including light green (green beryl), bluegreen (aquamarine), shades of yellow (golden beryl), and rose pink (morganite).
Quality of cut, accurately proportioned Red, strong saturation (amount of color) and strong tone (depth of color) Clean of surface and internal flaws Size
Ruby is the mineral corundum with sufficient amounts of chromium to create the color red. They can be orangy, purplish, or brownish, but dominant color must be red. Rubies tend to be valued by country of origin, with fine qualities from Myanmar (formerly Burma) setting the benchmark.
Sapphire -Quality of cut, accurately proportioned Color, blue favored Clean of surface flaws, but very specific microscopic needle-point inclusions favored Size
Sapphires represent all colors of the mineral corundum except red (ruby); colorless corundum with traces of titanium and iron make blue. Fine stones from Kashmir, India set the benchmark in quality for their cornflower-blue and velvety appearance, created by microscopic needle-point inclusions (solids, gas, or liquids enclosed within the mineral).
Source: Compiled by U.S. International Trade Commission staff based on various industry sources.
21

Cultured Pearls and Synthetic Gemstones
Cultured pearls and synthetic gemstones can be identified and appraised by the same experienced gemologists that appraise natural gems. They are appraised for the same characteristics as their natural counterparts, but at a lower price for comparable quality.
U.S. INDUSTRY PROFILE
Industry Structure
The gemstones industry has a global structure in which indigenous resources determine the leading countries producing natural goods. Because the United States has never had significant commercial deposits of gemstones, the United States has been primarily a consumer of imported goods, particularly diamonds. However, the United States does have a small but competitive segment of the industry devoted to cutting and polishing larger diamonds (2 carats or more). There is also a growing synthetic gemstone industry.
Producers, Employment, Geographic Distribution
The domestic natural gemstone industry is comprised of many small, independent producers of freshwater pearls (natural and cultured), colored gemstones, and synthetic products. Because of the inherent uncertainty associated with finding and recovering gem-quality deposits, large changes in the number of production operations are not atypical. Between 1991 and 1995, the industry experienced some rationalization when the estimated number of operations dropped from 393 to 346, believed to be due primarily to the inability to develop and sustain economically viable gemstone deposits and lack of long-term fmancing. 47 Colored gemstone mining accounted for the largest drop, from 330 to 282 operations, with an average from 2 to 3 production employees at each site. 48 The number of freshwater pearl operations decreased from 51 (owned by 5 companies) to 50 (3 companies), and the number of synthetic gemstone
47 Other contributing factors include shifts in demand for gemstones typically produced in the United States; the basic diamond, emerald, ruby, sapphire, and round pearl gemestones make up only a small portion of U.S. production. Also, the number of individual miners and dealers that compose the U.S. industry and their movement into and out of business make it difficult to keep accurate data.
48 Mining figures include operations where individuals may pay a fee to search for gemstones, keeping what they find. Crater Diamond State Park of Arkansas is a fee-site deposit operation and is the only known working diamond deposit in the United States. Reportedly, patrons found 135 carats of diamonds in 1993.
22

operations decreased by one to 13 (13 companies). There were no commercially viable domestic deposits of diamonds during 1991-95.49
The cutting sector for this industry is usually in or near populated urban centers with a high concentration of potentialjewehy manufacturers and customers. According to the 1977 U.S. Census, there were an estimated 1,000 diamond and colored gemstone cutters concentrated in New York City. 50 After a sharp contraction in the global diamond market between 1980 and 1986, the nwnber of U.S. cutters decreased to about 300 in 1992. As demand rejuvenated, cut work shifted to off-shore facilities in developing countries with a comparatively large and inexpensive labor force.
Natural Pearls and Gemstones
The location of gemstone operations in the United States, as in any country, is limited to the availability and economic viability of natural resources. Freshwater pearls are primarily harvested along the Mississippi River and tributaries, where the preferred habitat for most oyster species is in the gravel or sand bottom of a swift water current. 51 Colored gemstones are mined from naturally occurring deposits located in remote areas where low land values allow economic extraction. Although all 50 States report the production of natural gemstones, Tennessee, Alabama, Arkansas, North Carolina, Oregon, and Arizona accounted for the bulk of output in 1995 (see tabulation).52
Gemstone types States
Freshwater pearls . . . . . . . . . . . Tennessee1
Colored gemstones ......... .
Alabama
Arkansas Arizona North Carolina Oregon
Products
Natural & cultured Natural
Diamond and quartz crystal Turquoise and peridot Emerald Variety including jasper, agate, thunderegg; petrified wood, and labradorite
1 Freshwater pearl production in Tennessee includes 6 cultured pearl farm operations.
49 The first commercial U.S. diamond mine came into operation in late 1995/early 1996. so There are no data available to delineate between lapidarian (colored gemstone cutters) and
diamond cutters. si Gemological Institute of America, American Freshwater Natural Pearls, prepared by James L.
Sweaney and John R. Latendresse, (Camden, TN, 1982), p. 4. s2 U.S. Department of the Interior, Division of Mineral Commodities, Annual Report on
Gemstones (1995), by Gordon T. Austin (Washington, DC: U.S. Bureau ofMines, 1996), p. 6.
23

Synthetic Colored Gemstones and Diamonds
In contrast to their natural counterparts, synthetic gemstones tend to be produced near urban centers where facilities are more readily available for product research and development, and where markets can be developed. Production for these materials was reported for nine States (table 1).53
U.S.-produced synthetic diamond first appeared in 1954 when General Electric (GE) successfully produced diamond grit (tiny crystalline pieces) at its research laboratory in Schenectady, NY; it was commercially marketed in 1957 for industrial abrasive applications. After another 15 years of research and development, GE announced in 1971 its successful synthesis of gem-quality diamonds, revealing ''jewelry-size" samples of colorless, yellow, and blue crystals. 54 Reportedly these products are also intended for industrial application only. Although commercially available, some U.S. researchers maintain that synthesis of gem-quality diamond on a large scale is not yet economically viable when compared with the mined variety. 55
Even so, the prospect of expansion into the jewelry markets looms large; in 1995, rumors first surfaced that small quantities of yellow synthetic gem-quality diamonds were on the world market 56 This U.S. commercial industry for synthetic gemstones seems to be quite stable with 11 of the 13 producers identified in table 1 in business throughout the 1991-95 period; GE is excluded because it reportedly produces synthetic gem diamonds only for industrial applications.
FOREIGN INDUSTRY PROFILE
The competitive strength of foreign producers is an indigenous supply of natural materials, primarily diamonds. In terms of the cutting sector, lower labor costs in developing countries prove beneficial where the more popular smaller cut diamonds (1 carat and less) are mass produced. In addition to the traditional low-cost cutting centers, a growing number of other countries are combining low cost labor advantages with advanced technology investments in cutting equipment and training as part of their effort toward economic growth, thus widening their margin of competitive strength; some of these countries include India, Thailand, China, and Botswana.
53 Notably excluded from the list is synthetic diamond. 54 K. Nassau, "The Current Decade Synthetic Gemstones in the 1980s," Lapidary Journal, vol. 40
Mar. 1987, p. 37. 55 Sharon Wakefield, "Synthetic diamondjewehy: Are you prepared?," Jewelers' Circular
Keystone, Mar. 1996, p. 49. 56 In 1996, there have been additional reports that small amounts of synthetic diamonds produced in
Russia have been sold (as synthetics) at various gem trade shows in the United States. So far, all of these diamonds are reported to range in color from light yellow to orange.
24
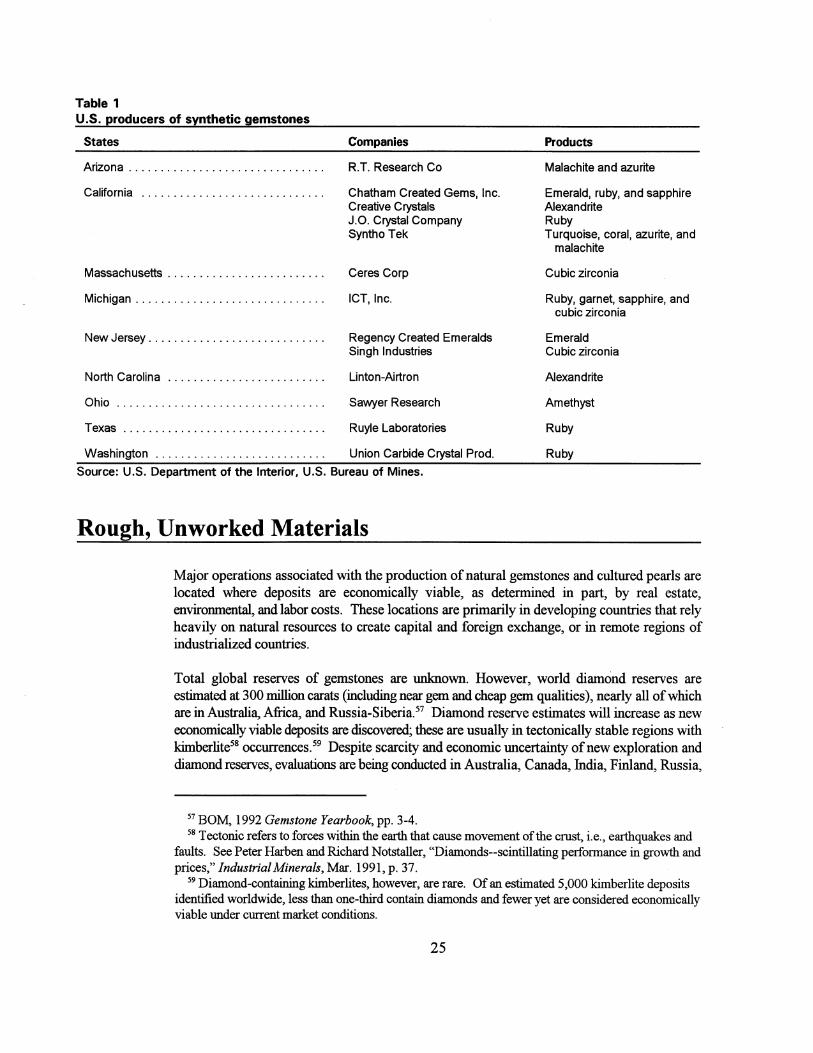
Table 1 U.S. producers of synthetic gemstones
States Companies
Arizona . . . . . . . . . . . . . . . . . . . . . . . . . . . . . . . R.T. Research Co
California . . . . . . . . . . . . . . . . . . . . . . . . . . . . . Chatham Created Gems, Inc. Creative Crystals J.O. Crystal Company Syntho Tek
Massachusetts . . . . . . . . . . . . . . . . . . . . . . . . . Ceres Corp
Michigan . . . . . . . . . . . . . . . . . . . . . . . . . . . . . . ICT, Inc.
New Jersey . . . . . . . . . . . . . . . . . . . . . . . . . . . . Regency Created Emeralds Singh Industries
North Carolina . . . . . . . . . . . . . . . . . . . . . . . . . Linton-Airtran
Ohio . . . . . . . . . . . . . . . . . . . . . . . . . . . . . . . . . Sawyer Research
Texas . . . . . . . . . . . . . . . . . . . . . . . . . . . . . . . . Ruyle Laboratories
Washington . . . . . . . . . . . . . . . . . . . . . . . . . . . Union Carbide Crystal Prod.
Source: U.S. Department of the Interior, U.S. Bureau of Mines.
Rough, Unworked Materials
Products
Malachite and azurite
Emerald, ruby, and sapphire Alexandrite Ruby Turquoise, coral, azurite, and
malachite
Cubic zirconia
Ruby, garnet, sapphire, and cubic zirconia
Emerald Cubic zirconia
Alexandrite
Amethyst
Ruby
Ruby
Major operations associated with the production of natural gemstones and cultured pearls are located where deposits are economically viable, as determined in part, by real estate, environmental, and labor costs. These locations are primarily in developing countries that rely heavily on natural resources to create capital and foreign exchange, or in remote regions of industrialized countries.
Total global reserves of gemstones are unknown. However, world diamond reserves are estimated at 300 million carats (including near gem and cheap gem qualities), nearly all of which are in Australia, Africa, and Russia-Siberia. 57 Diamond reserve estimates will increase as new economically viable deposits are discovered; these are usually in tectonically stable regions with kimberlite58 occurrences. 59 Despite scarcity and economic uncertainty of new exploration and diamond reserves, evaluations are being conducted in Australia, Canada, India, Finland, Russia,
57 BOM, 1992 Gemstone Yearbook, pp. 3-4. 58 Tectonic refers to forces within the earth that cause movement of the crust, i.e., earthquakes and
faults. See Peter Harben and Richard Notstaller, "Diamonds--scintillating performance in growth and prices," Industrial Minerals, Mar. 1991, p. 37.
59 Diamond-containing kimberlites, however, are rare. Of an estimated 5,000 kimberlite deposits identified worldwide, less than one-third contain diamonds and fewer yet are considered economically viable under current market conditions.
25

and Sweden. The 1994 announcement of diamond deposits found in Finland is the most recent and surprising discovery, but, Ashton Mining of Australia had been exploring that area since 1986.6° Factors that encourage exploration include increasing demand for diamondjeweliy, rising prices for rough diamonds, and depletion of developed deposits.
Diamonds
Diamond mining is reported for 32 countries in Africa, Asia, Australia, and South America. Together, seven countries reportedly accounted for approximately 93 percent of the value of annual world diamond production, and approximately 96 percent of the quantity (table 2).61 All seven countries sell production to De Beers for distribution into the world market, with the negotiated option of retaining a percentage of production for their own sales outside the De Beers network. 62
With the exception of Angola and Zaire, which tend to be troubled by civil disorder, diamond mining operations among major producers are highly capitalized and sophisticated. Moreover, the industry is dominated by two organizations with access to capital and the most advanced mining technology: De Beers Consolidated Mines Ltd. of South Africa, and Australia-based Argyle Diamond Mines Pty. Ltd., which is a joint venture between CRA Ltd. (57 percent), Ashton Mining Ltd. (38 percent), and Western Australia Development Corp. (5 percent). The Governments of Botswana and Namibia were able to acquire capital and technology for their diamond mining operations through contract negotiations with De Beers. In Russia, the Government provided capital and technology for diamond mining until the breakup of the Soviet Union; since then Russia has also turned to De Beers and other large foreign organizations for capital and mining development. Advances in mining equipment and methods of operation allow producers to bring into production formerly inaccessible deposits (most recently, off-shore diamond mining in Namibia) and extend the production life of developed deposits.63 A discussion of mining conditions for each of the seven major diamond producers follows:
60 Mining Journal, London, Nov. 25, 1994, p. 385. 61 Table 2 is intended to provide a frame of reference only. Although. these same seven countries
have long been reported as the principal sources of gem diamonds, the value and quantity of production varies from year to year and among different information sources, as noted when comparing quantity of production for these countries in figure 4 of this report. Quantity estimates provided by Bureau of Mines (BOM) tend to be more conservative than production quantity provided by other information sources; in this case, BOM data covers production in 1992. Commission staff was able to identify only the one source for a complete compilation of estimated value production; in this case, the production year was not provided but was reported in a 1994 publication.
62 Russell Shor, "De Beers Closes Rough.Road," Jewelers' Circular-Keystone, Oct. 1991, p. 69. 63 Mine operations face marginally profitable ore grade (carats of diamond per ton of ore mined) as
deposits are worked. The inherent economic advantage of high.er ore concentration is reduced as the cost of mining increases with each new level of depth. Advances in deep-mining technologies have helped to bridge the gap between marginally decreasing ore concentration and rising costs, allowing producers to sustain long-term mining operations that would not otherwise be economically viable.
26

Table 2 Principal sources of gem diamonds, annual production, and relative quality, 1992
Production Relative Countries Dollars Carats value
Average price per
Billion Million carat
Russia . . . . . . . . . . . . . . . . . . . . . . . . . . . . . 1.6 9.0 178 Botswana . . . . . . . . . . . . . . . . . . . . . . . . . . . 1 .4 10.0 140 South Africa . . . . . . . . . . . . . . . . . . . . . . . . . 0.9 4.4 204 Zaire . . . . . . . . . . . . . . . . . . . . . . . . . . . . . . 0.7 3.0 233 Australia . . . . . . . . . . . . . . . . . . . . . . . . . . . . 0.4 21.0 19 Namibia . . . . . . . . . . . . . . . . . . . . . . . . . . . . 0.3 1.5 200 Angola . . . . . . . . . . . . . . . . . . . . . . . . . . . . . 0.3 0.9 333
2.2 N/A Other countries . . . . . . . . . . . . . . . . . . . . . . . ""0.;....4"----------==------__;..;.:.;...'---Total . . . . . . . . . . . . . . . . . . . . . . . . . . . 6.0 52.0 N/A
Source: Production value compiled from International Affairs, FBIS-USR-94-088, Aug. 15, 1994, p. 77; production quantity from U.S. Department of the Interior, Bureau of Mines, Mineral Commodity Summaries 1994, report on gemstones, p. 69.
Russia
Uncut natural diamonds are second only to petroleum as a major contributor to Russia's hard currencyearnings.64 The Republic ofSakha (formerly Yakutiya), in Siberia, accounts for about 98 percent of Russia's natural diamond production. Diamond mining in Russia employed 40,000-50,000 people prior to the collapse of the Soviet Union. Subsequently, the Governments of Russia and of the Republic of Sakha went through a series of organizational reforms in an effort to form a mutually beneficial commercial alliance. The diamond deposits of Sakha are reportedly owned by the Republic, with development responsibilities shared by the Russian and Republic Governments, and by the labor collective through the Diamonds of Russia and Sakha Company, which is a joint-stock company formed in 1992. The industry's organizational structure is further complicated in that De Beers reportedly has separate contractual agreements with both Russia and the Republic of Sakha.
In the 1990 contract with De Beers, the Republic of Sakha agreed to retain up to 10 percent of its diamond rough for cutting and/or sale outside the De Beers network. However, approximately $500 million of diamonds leaked out of Russia into the world market in the first half of 1994.65 In turn, De Beers reduced the amount of diamond purchases from producers under contract, reduced the number of diamonds sold at sight sales, and purchased rough diamonds in the world market in an effort to support diamond prices. 66 Some industry reports
64 FBIS-USR93-048, April 19, 1993, p. 20. 65 "Russia Steps Up Pressure on the CSO," Mining Journal, Sep. 23, 1994, p. 227. 66 This was also a period of decreasing world oil and metal prices and growing requirements for
capital investments in Russia's mineral and metals mining industry. (See "Russia Steps Up Pressure (continued ... )
27

suggest that these extra diamonds were drawn from Russia's inventory and may have been part of an effort to influence negotiations with De Beers for a more favorable contract; possible contract provisions include an increase from 5 to 25 percent for diamonds sold outside the De Beers network; acquisition of De Beers' stock in exchange for part of the Federal diamond reserve; Russian representation on De Beers' Board of Directors; and assistance in the development of Russia's diamond cutting industry. 67 Russia's contract with De Beers expired December 31, 1995; negotiations for a new contract are reportedly ongoing with Russia's delegation including the Republic Government of Sakha (which controls mining and cutting in that region) and Russia's Treasury (which controls the diamond stockpile).68
Russia's industry benefits from low labor costs and an indigenous supply of jewelry-quality diamonds, but the Sakha deposit is in a permafrost zone, making mining operations difficult and costly. New diamond deposits have been discovered in Western Russia, but foreign investment capital is needed to finance exploration and development A number of companies are reportedly involved in exploration efforts including De Beers, VNR Company and Ashton Mining of Australia, Canment Resources of Canada, Fal Marine of South Africa, and Arkhangel Exploration (subsidiary ofTexon Star) of the United States.69
Botswana
Second only to Russia in terms of production value, uncut diamond sales are an important revenue source for Botswana, accounting for an estimated 50 percent of the Government's revenue and 40 percent of the country's gross domestic product.70 The Government of Botswana (GOB) and De Beers share a 50-50 partnership in Debswana, Botswana's diamond mining company, which operates three mines (one each at Jwaneng, Letlhakane, and Orapa). Through contract agreement, the GOB secured 5 percent of De Beers' stock and has two members on De Beers' Board of Directors. Under the 1991 contract, De Beers agreed to build a 500-worker diamond cutting plant that will specialize in preparation work, but not faceting. Botswana sells all of its diamond production through De Beers.71
South Africa
De Beers owns and operates most of South Africa's diamond mines, a.rid accounts for approximately 95 percent of the country's diamond production; the remaining 5 percent of South Africa's production is accounted for by independent miners and sold outside De Beers' network. For a work force of approximately 20,000 employees, wages and working conditions at De
66 ( ••• continued) on the CSO," p. 227.)
67 Telegram from American Embassy Pretoria, South Africa, Pretoria 014042, Section 3 of 8, Sep. 29, 1994.
68 FBIS-USR-94-088, Aug. 15, 1994, p. 78. 69 FBIS-USR-94-086, Aug. 9, 1994, p. 30. 7° Kenneth Gooding, "De Beers Digs Deeper into its Resources," Financial Times, Sep. 6, 1994, p.
26. 71 Shor, "De Beers Closes Rough Road," p. 69.
28
Beers' diamond mines are reportedly better than for most other mined commodities in South Africa. In an effort to establish good labor relations, De Beers started a shareholders plan in 1987 offering employees with over 2 years service a maximum of 10 free shares of stock a year.72
Driven by decreasing ore grade and rising mining costs in its long established operations, De Beers discovered diamondiferous pipes at Venetia in 1980 and brought the facility on line in 1992. Located in the northern Transvaal near Messina, it is designed to employ 870 people from the local communities. As a conventional open pit mine, it is a low-cost, high-grade operation (137 carats per 100 tons of ore).73 Production is reported to be 50-60 percent gem quality stones ( 40-50 percent industrial grade), accounting for 70 percent of the country's total 1991 production. The mine's life expectancy is estimated to be 20 years as an open pit operation, with the economic viability of an underground mine to be assessed at a later time. Environmental controls reportedly incorporated into the mine include construction of buildings to blend with the natural landscape, revegetation to occur during the course of operation, and establishment of an environmental monitoring committee. Other than Venetia, diamond mines in South Africa are mature operations coping with depleting deposits and growing operating costs as mining depths increase.74
Zaire
Zaire has experienced severe economic problems since the late 1970s and bouts of political unrest since 1990. In an environment of economic and political instability, Zaire's diamond trade is reportedly controlled by rebellious military factions and foreign merchants, providing little revenue for the government. 75 Although Zaire is among the top seven diamond producers in terms of quantity, the overall quality of its diamonds is relatively low at an average price of $9. 00 per carat. Zaire does not have a formal diamond-marketing contract with De Beers, although MIBA (which is 80 percent Government-owned and 20 percent Sibeka of Brussels) sells through De Beers.
Australia'"
Capitalizing on high-quality technological and financial resources, Australia's mining industry is a global leader in the exploration of diamonds both at home and abroad, including operations
72 Russell Shor, "Prosperity and Politics: Why Diamond Prices Will Continue to Rise in the 1990s," Jewelers' Circular-Keystone, Jun. 1990, p. 66.
73 The mine was reportedly constructed at a capital cost of approximately $402 million. (See Industrial Minerals, Sep. 1992, p. 19.)
74 Industrial Minerals, Sep. 1992, p. 19. 75 Thomas W. Lippman and Andy Mosher, The Los Angeles Times - Washington Post news service
received byNewsEDGE/LAN: Oct. 10, 1994 at2:02am. 76 Information on Australia was derived principally from the Diamond Registry Bulletin, Mar.
1993, p. l; FBIS-USR-94-088, Aug. 15, 1994, p. 79; andDavidFederman, "Indo-Argyle's U.S. Market Gambit," Modem Jeweler, Oct. 1994, pp. 30-33.
29
in Finland, Canada, and Russia. In Australia, mined diamonds come primarily from Argyle Diamond Mines Pty. Ltd., a joint venture, owned and operated by Australia-based Ashton Mining Ltd., and Australia-based CRA Ltd. Starting production in 1985, Argyle has the advantage of being a relatively modem, low-cost open pit mine. Disadvantages include average temperatures of well over 100 degrees during summer months and relatively high labor costs compared with firms in other major diamond mining countries. With an output of 39 million carats of diamonds in 1992, the Argyle mine is the world's largest volume producer of diamonds, but value is relatively low with an average price of $9 per carat reported in 1994.77
As part of its competitive strategy, Argyle has moved to ensure a market for its output by developing diamond-cutting and jewelry-manufacturing industries in low-cost labor markets through joint projects and fmancial investments, first in India and more recently in China.
Namibia
Diamond mining is reported to account for about 7 percent ($39.7 million) of Namibia's revenue.78 Although total production value is relatively low, gemstone quality is high, with an average 1994 price of $300 per carat. 79 A continuing cooperative relationship was evident in the Deaeers' November 1994 agreement with the Government of Namibia that provided for 50150 control of the newly formed Nam.deb Diamond Corp. Ltd. Other companies operating in Namibia include a U.S. firm, Monarch Minerals and Mining, Inc., that started mining in the southeastern region in 1991,80 and a Canadian company, Namibian Minerals Corp. (NAMCO), that started part of the country's off-shore exploration operations around early 1994.81
Angola
Development of Angola's diamond industly has been slowed by political unrest since 1992 when National Union for the Total Independence of Angola (UNITA) troops refused to accept the results of the country's first multiparty election. Although Endiama (the state diamond company) and De Beers operated under a marketing agreement, it contributed little stability to diamond prices in the world market because most diamonds reportedly are smuggled out through private channels; an estimated $500 million worth of diamonds were .smuggled out of Angola in 1992.82 De Beers reportedly bought most of these at market prices in order to more closely control world market supply and support prices.
77 Although Australia's overall diamond production is of relatively low value compared with other major producers, the country is famous for quality pink and champagne colored diamonds which are growing in popularity in the United States and abroad.
78 As of September 1, 1994, the foreign rate of exchange was approximately 3.6 namdo to 1 U.S. dollar. Actual revenue from diamonds in 1993/94 was 143 million in Namibian currency; 143 divided by 3.6 = US$39.7 million.
79 FBIS-USR-94-088, Aug. 15,1994, p. 79. 80 BOM1991 Annual Gemstones, p. 13. 81 Industrial Minerals, Feb. 1994, p. 13. 82 IndustrialMinerals,Feb. 1993,p. 16.
30
Pearls
Traders dealing in natural pearls report that prices for these goods continue to firm with the depletion of natural stocks. Traditionally, rose-colored pearls (known in the trade as Indian pearls) came almost exclusively from the Persian Gulf. Larger pearls came from the North Australian coasts. Fancied colored pearls-black, yellow, red, and brown-were found in South Pacific waters, including the coasts of Tahiti (famous for black pearls), Pacific Isles, Venezuela, and Panama. The Red Sea area supplied small but good-quality pearls and cool coastal waters of Japan produced lustrous pearls with a light greenish tint. From the European continent, quality freshwater pearls were produced in the river beds of Scotland, Ireland, Germany, and Czechoslovakia. 83 In today's market, however, most natural pearls are obtained almost exclusively from oldjewehy.84
Cultured pearls, however, provide a relatively steady source of new supplies and duplicate their natural counterparts when farmed under the same ecological conditions. Weather, specifically typhoons, is the primary disruptive factor in the production of both natural and cultured pearls; all major cultured pearl-producing countries seem equally affected. Cultured pearls are produced throughout the South Pacific and South Sea waters including white pearls in Burma, Indonesia, Philippines, and Thailand, and black pearls in Tahiti and the French Polynesian Islands. The largest producers of cultured pearls are Japan, and more recently China and Australia.
Japan85
Japan was the first country to produce cultured pearls on a commercial basis, introducing them on the world market in 1921. Japan reportedly produces 14.4 million momme (1 momme equals 18.75 carats) of cultured pearls and controls about 80 percent of the global market. Because of Japan's cool water temperatures, it became famous for the intense luster of its fine-quality pearls; cool water allows layers of cells that make up the nacre to grow slowly and pack tightly, creating the desired lustrous effect.
Japan is reportedly losing its quality edge in the world pearl market, however, due to a number of interrelated contributing factors. First, the industry is reportedly suffering from water pollution that results in smaller, less healthy oysters and thus lower quality pearls. In addition, Japan depleted its wild oyster supply and now propagates oysters for hatchery shells. Even under the best of conditions, propagated oysters produce inferior pearls compared to the stronger, healthier wild oysters found on ocean floors. Second, most culturists have shortened
83 Weinstein, The World of Jewel Stones, pp. 74-86. 84 Journal of Gem Industry, Dec. 1993, p. 63. 85 Information for Japan was derived principally from Deborah A Catalano, "The Cultured Pearl
Shakeout," National Jeweler, Nov. 16, 1995, p. 32; Deborah A Catalano, "Japanese Akoya Pearls: Production Down," National Jeweler, Apr. 16, 1996; Jewelers 'Circular-Keystone, Dec. 1994, p. 14; and Weinstein, The World of Jewel Stones, pp. 88-89.
31

the pearl growth period in response to a larger market for mid-to low-priced product, 86 shifting from the traditional 3-year growing period to about 8 months. Third, there is increasing competitive pressure from China's relatively new cultured pearl industry, which is being developed in part by Japanese investors in response to relatively lower wages and more advantageous growing conditions in China.
China87
China started competing in the world market of cultured pearls around 1984, with inexpensive freshwater rice pearls (so named because of their shape and size), and by 1992 the quality of goods improved to include oval and round shapes. By 1993, China was producing and trading saltwater pearls and by 1994 Japan-based Taski and Taiyo Fisheries were reportedly investing in pearl-farming operations, to take advantage of China's relatively lower wages and more advantageous growing conditions. Although China reportedly produces about 10 tons of pearls compared with 65 tons in Japan, China has the potential to vastly increase its production. Like Japan, China's industry has tried to maximize the quantity of production by utilizing short growing periods, but China has the advantage of warmer waters which helps to generate faster growth. In tenns of quality, China's goods tend to have thin nacre, medium luster, and surface blemishes. However, Chinese pearls serve the larger, lower priced end of the market and are reportedly 10-15 percent less expensive than their Japanese counterparts.
Australia88
Australia has replaced Myamar (Burma) as the leading pearl producer in the South Seas since the Government of Myamar nationalized its Japanese-owned pearl farms in the mid-1960s. Hosting 50 cultured pearl farms with a total output of approximately 240,000 momme, Australia is famous for its limited but dependable production oflarger, 18mm to 20mm pearls; most are between 12mm to 14mmin size.
Environmental conditions and government restrictions tend to promote quality production over quantity. For example, in an effort to conserve natural habitat, the Goveniment of Australia imposes, and reportedly strictly enforces, a quota limit on the removal of wild oysters from the ocean floor. This maintains Australia's competitive advantage in assuring healthier wild oysters from the ocean floor for pearl production; wild oysters account for approximately 60-65 percent of pearl production, with propagated oysters accounting for the remainder. Warmer equatorial
86 A growing period of about 3 years yields better quality pearls with a nacre thickness of about 0. 5mm. By shortening the growing period, particularly in cool waters, the pearl does not have enough time to develop a sufficiently thick nacre for the desired luster and durability of a quality pearl.
'KT Information for China was derived principally from David Federman, "Chinese Akoya Pearls: Sudden Impact," Modem Jeweler, May 1994, p. 64 and from Richard W. Wise, "High-Quality Chinese Freshwater Pearls Are Out There," National Jeweler, Apr. 16, 1996, pp. 46-48.
88 Information for Australia was derived principally from Russell Shor, "Building a New Image for Australian Pearls," Jewelers' Circular-Keystone, Oct. 1995, pp. 72-76 and Deborah A. Catalano, "Cultivating Pearls Down Under," National Jeweler, Oct. 1, 1995, pp. 44-56.
32

waters also provide an advantage in that warm temperatures stimulate the growth of larger oysters and saltwater pearls, as compared to the relatively cooler waters of Japan and China. However, warm water pearls tend to have a grainy/satiny finish, rather than the ceramic luster of cool water pearls. In conjunction with the warmer year-round climate, Australian farmers practice a 2-3 year growing period, allowing pearls to develop thicker nacre, typically 1.5 to 2 millimeters, compared with 0.5 millimeters for pearls from Japan.
Colored Gemstones
Foreign production of colored gemstones, unlike diamond and pearl, are primarily small, lowcost and widely dispersed operations; there are no dominant producers. Production is relatively limited. Most colored gemstones are mined in remote regions of Australia and developing countries. Market supply of colored gemstones is dependent on demand and price for a particular variety of gemstone; availability of accessible, economically viable deposits; and political stability within source countries. World production data for colored gemstones are not available. However, the U.S. Department of the Interior, Bureau of Mines, reported the major deposits by country (see the followingtabulation).89
Country Afghanistan .............. . Australia ................. . Brazil ................... .
Gemstone deposits 1
beryl, quonset, ruby, tourmaline beryl, opal, sapphire agate, amethyst, beryl, quonset, ruby, sapphire,
tourmaline, topaz Myamar (Burma) . . . . . . . . . . . . beryl, jade, ruby, sapphire, topaz Colombia . . . . . . . . . . . . . . . . . beryl, sapphire Kenya . . . . . . . . . . . . . . . . . . . . beryl, garnet, sapphire Madagascar . . . . . . . . . . . . . . . beryl, rose quartz, sapphire, tourmaline Mexico . . . . . . . . . . . . . . . . . . . agate, opal, topaz Sri Lanka . . . . . . . . . . . . . . . . . beryl, ruby, sapphire, topaz Tanzania . . . . . . . . . . . . . . . . . . garnet, ruby, sapphire, tanzanite, tourmaline Zambia . . . . . . . . . . . . . . . . . . . amethyst, beryl
1 Deposits of the mineral beryl is the basis of several colored gemstones including green beryl, aquamarine, morganite, and emerald.
Synthetic Gemstones
Synthesized colored gemstone (ruby) was first announced in Europe in the late 19th century. Today, a variety of colored gemstones are successfully synthesized to produce quality, cutting sizes. Products are primarily located in the industrial countries, including Australia, Austria, China, France, Germany, Italy, Russia, Switzerland, and the United Kingdom. Specific kinds of commercially synthesized gemstones suitable for jewelry applications include alexandrite~
89 U.S. Department of the Interior, Bureau ofMines, Gemstones Annual Report, dated 1992, p. 10.
33

emerald, opal (various colors synthesized primarily in Australia),90 ruby, sapphire (various colors including blue), and spinel. Current production and other industry data are not readily available; this tends to be a competitive sector, sharing very little information. 91
Production of synthetic diamonds (minute crystals) was also first reported in the late 19th century. Synthetic stone sizes of gem quality followed in 1985 when Sumitomo Electric Industries of Japan announced large-scale production of yellow, gem-quality synthetic diamonds,92 marketed for use as heat sinks for high powered semiconductor devices. 93 Then in 1987, it was reported that De Beers had been synthesizing gem-quality diamonds on an experimental basis since the 1970s. By 1993, De Beers was reportedly marketing yellow, single-crystal diamonds for industrial tools under De Beers Monocrystal trademark.94
Although these international producers, along with U.S.-based General Electric, are reportedly maintaining a policy of not selling synthetic diamonds for jewelry applications, crystal growers in Russia are not operating under such constraints.95 Laboratories in Russia, formerly subsidized by the Soviet Union, are pursuing what some believe to be a potentially lucrative business in developing production of gem-quality synthetic diamonds for the jewelry industry. Chatham Created Gems, a U.S.-based producer of synthetic colored gemstones, is reported to have contributed funding to develop research and production capabilities to synthesize gemquality diamonds about 1992, but laboratory recipients have had difficulty meeting product specifications.96 Specifically, Chatham reportedly wanted about 14,000 carats a month of good quality colorless diamonds, with the bulk of production at 1 carat size, and with the crystal structure of each stone to have "a distinctive metallic content" to permit easy synthetic detection by testing for magnetic response. 97 Although not all specifications had been met, a production agreement was reportedly concluded in March 1996 specifying an initial delivery of 100 carats a month increasing to 1,000 carats a month in a few years.98 In July, Chatham reportedly presented ''the first samples ... Russian-produced synthetic white stones" at a U.S. trade show.99
However, availability of large-scale production of gem-quality synthetic colorless diamond is still unpredictable.
90 Australia also accounts for about 90 percent of world natural opal production. See D. A Hiss, "Opal: The Down Under Wonder," Jewelers' Circular-Keystone, Mar. 1989, p. 178.
91 To help put production capability in perspective, one dated source (1939) reported that major producers in Switzerland, France, and Germany together had a daily capacity of 7 50,000 to 1 million carats to produce rubies, sapphires, and spinels.
92 Wakefield, "Synthetic Diamond Jewelry: Are you prepared?," p. 49. 93 This application makes use of diamond's heat conductivity property. See K. Nassau, "The
Current Decade Synthetic Gemstones in the 1980s," Lapidary Journal, Mar. 1987, p. 38. 94 Wakefield, "Synthetic Diamond Jewelry: Are you prepared?," p. 50. 95 Ibid., pp. 47-48. 96 Russell Shor, "Chatham on Synthetic Diamond 'We're Still Working On It,' Jewelers Circular
Keystone, Oct. 1995, p. 82. 97 Ibid., p. 83. 98 Deborah A Catalano, "Synthetic Diamonds Materialize in Tucson," National Jeweler, Mar. 16,
1996,p. 42. 99 Bob Bates, "Synthetic Diamonds Offered for Sale," National Jeweler, Jul. 1, 1996, p. 4.
34
Two other U.S.-based companies reportedly are also working with laboratories in Russia. Morion Company, a distributor in Massachusetts, was reported to have Russian-grown synthetic diamonds at a trade show in 1996; these were all yellow stones ranging in sizes from 1-2 carats, selling for prices ranging from $265 to $1,360 per carat.100 Superings Inc., a ring manufacturer located in Los Angeles, is also reported to be marketing synthetic diamonds grown at the Siberian Branch of the Russian Academy of Sciences. All diamonds for Superings' product line reportedly range in colors from light canary yellow to deep orange.101 The Academy reportedly produces about 50 carats of synthetic diamond rough a month (which equates to about 20 carats cut) and most of these are yellow to light brown.102 In white (or colorless) stones, the Academy produces only about 10 points103 rough (about 3 points cut) a month.104
Cutting Sector
Gemstone cutting is an old craft, dating back to well over 5,000 years ago, that originated in the Middle East. The trade has spread as craftsmen migrated to new regions.
Diamonds
Recently, governments of developing countries have invested in training and advanced cutting technology in an effort to become competitive and create foreign exchange. These are generally joint efforts with De Beers and with other major gemstone mining companies as a means to market their output. Although diamonds are cut in a number of countries (including Belgium, Brazil, China, France, Germany, Holland, Hong Kong, India, Israel, Russia, South Africa, and Thailand), only a few centers dominate the market, as the dynamics of this industry sector shift with rising labor costs and decreasing availability of skilled cutters.105
Belgium and Israel were the major cutting and polishing centers for over 30 years, until the world diamond market sharply contracted between 1980 and 1986. During that period, these traditional cutting centers lost market share to developing countries (particularly India) where hand labor is plentiful and relatively inexpensive. In an effort to regain their competitive edge, Belgian and Israeli processing companies invested in automation; these efforts appear to have had mixed success. More recently, some companies in Belgium and Israel have invested in processing plants in China and Thailand, where they specialize in small-sized, lower quality goods.
100 Catalano, p. 3. 101 "Superings to Market Russian Synthetics," Jewelers' Circular-Keystone May 1996, p. 62. 102 Catalano, p. 42. 103 Points in gemstones are a unit of weight equal to 11100 of a carat. 104 Catalano, p. 42. 105 Eric Bruton, Diamonds, 2 ed. (Chilton), pp. 197-200.
35

Belgium
Today, Belgium's role in the industry is primarily that of a trade center, processing only an estimated 2 percent (.07 million carats) of its 1991 cut and polished diamond exports.106 The number of cutters/polishers in Antwerp, Belgium decreased from an estimated 13,000 in the 1970s to about 3,000 in 1994. Antwerp's manufacturers relinquished the small, round standard cuts to lower-cost processing centers - India, China, and Thailand - and focused on larger stones and fancy cuts; labor typically accounts for only 10 percent of the finished cost of cut goods. In an effort to improve productivity, manufacturers have implemented flexible work schedules and employed automation. This has been a slow process, however, because of strict labor laws and resistance by powerful labor unions.107 There are also several reports that Belgian firms have entered joint ventures in Hong Kong, China, and Russia in an effort to compete for global market share. In Russia, for example, Antwerp-based PHP Diamond, Smolensk Cutting Factory (the Antwerp office of Russalmaz), and Almazjuvelier Export in Moscow formed the Smolensk Gems NV venture to cut Russian rough into fancy cuts for sale in Antwerp.108
Israel
In contrast with Belgium, Israel remains a diamond cutting center. Based on 1991 data (latest available year) Israel processed an estimated 79 percent (2.28 million carats) of its cut/polished diamond exports.109 Israel has 600 diamond cutting factories employing approximately 10,000 cutters. Like Belgium, the Israeli industry is facing higher production costs. As a result, investment in computerized machines and laser cutting equipment has increased and there is a shift to large-sized pieces and fancy cuts. Israel now reportedly produces 70 percent of the world's fancy cuts.11°
In addition, there has been some transfer of Israeli production to off-shore facilities in Thailand and Russia. The Israeli firm Reichbart Arye is reported to have entered an agreement in 1992 with the Russian Republic of Sakha to supply diamond cutting equipment, technology, and training; diamonds are to be cut in Sakha and Israel. m
106 In 1991, Antwerp imported 70.84 million carats; it imported 4.58 million carats of polished but exported 4.65 million carats. (See "Special Report: Ramat Gan Plans to Consolidate its Role as Premier Trading Center," Israel Diamonds, May 1992, p. 30.)
107 Jewelers' Circular-Keystone, Dec. 1994, p. 54. 108 BOM Gemstones Yearbook, 1992, p. 11. 109 Estimated by Commission staff. (See "Special Report: Ramat Gan Plans to Consolidate its Role
as Premier Trading Center," p. 30.) no Jewelers' Circular-Keystone, "Israel Facing the High Tech Future,"Apr. 1994, p. 7. m BOM Gemstones Yearkbook, 1992, p. 11.
36

India
India's cutting industiy is now reported to be the largest in the world in terms of value, quantity of production, and employment. The Indian industry reportedly exported an estimated 40 percent of the world's cut diamonds in terms of value in 1990.112 In terms of quantity, India processes about half the world's production annually (50 million carats), mostly in small diamonds. The work force is largely a hand-labor cottage industry comprised of more than 500,000 artisans concentrated in Surat and Navassari.113
The development of India's cutting industry contrasts somewhat with that of other low-wage countries that have emerged recently as a result of foreign investments. India's industry initially was founded as cottage operations with individual workers seeking near-gem quality rough diamonds (formerly classified as industrial grade material) that the established' cutting centers would not deal with. From these goods, India produced melee-sized stones (0. 06 to 0.14 carats), of a quality suitable for jewelry.
The developed expertise of India's diamond cutters/polishers in small-sized, low quality goods attracted Australia's Argyle Diamond Mining Company as a ready market for its smaller stones that were suitable for labor-intensive working. In 1986, Argyle started sending India its cuttable rough and by 1994, India was processing 90 percent of the company's cuttable production. Today, India hosts some automated cutting factories and is competing with Belgium, Israel, and the United States for larger sized, better quality rough. In one reported project, Bombay-based Shyam Star Gems Ltd. reportedly collaborated with Suraj Gems P.V.B.A. Antwerp in 1993 to install a laser cutting machine.114
India's industry is also credited with expanding the customer base for diamonds and with influencing a change in jewelry designs to include clusters of small diamonds as well as traditional solitaires. In early 1994, Argyle founded Indo-Argyle Diamond Council (IADC) to stimulate a downstream market for its cut diamonds. IADC is made up of 17 Indian jewelry manufacturers, all Argyle diamond customers. These manufacturers have also been involved in India's campaign to modernize and upgrade its jewelry manufacturing industry by building state-of-the-art plants and importing technicians to train workers in the use of refining and casting equipment. Argyle manages the marketing of their products, which are'largely directed to the U.S. market.115
112 Telegram from U.S. Embassy New Delhi, section 6, 18 New Delhi 04330, p. 1. 113 BOM, Gemstones Yearbook, 1992, p. 3. 114 Journal of Gem Industry, Dec. 1993, p. 73. m Some 7 5 percent of Argyle' s material yields sizes of 6/1 OOths of a carat or smaller. (See
Federman, ''Indo-Argyle's U.S. Market Gambit," pp. 30-33.)
37

China
China is emerging as a major diamond-cutting center. In 1988, China reportedly had 30 cutting and polishing facilities, employing about 4,000 cutters/polishers.116 Since then, foreign investment in China has increased, including a 1991 joint project between the Australian International Development Assistance Bureau (financed by Australia's Argyle Mining Company) and the China Pearl, Diamond, Gem and Jewelry Import and Export Corporation.117
This diamond-cutting factcny in Beijing, China, reported to be one of the world's most modem and well equipped at that time, has a planned labor force of about 900.118
Thailand119
Thailand is reported to have opened its first diamond cutting factory in 1980; by 1992 there were 7,000 cutters and three De Beers sight holders. However, diamond cutting production has not developed as rapidly in Thailand as some may have expected;. without the advantages of direct sourcing from producers, early expectations for a cutting industry in Thailand may have been too optimistic for global market conditions.120 However, the emergence of Israeli- owned processing facilities in Thailand is expected to transfer technology to the Thai work force, increasing productivity and influencing the flow of much-needed rough to Thailand through efforts to strengthen their own market position.121
Colored Gemstones
The international cutting/polishlng sector for both natural and synthetic colored gemstones has shifted from Europe to Thailand, India, Hong Kong, Republic of Korea, China, and Brazil.122
Because these countries benefit from a large labor force, low labor costs, and favorable export laws, they are able to mass-produce cut gems by hand. The industry in these countries is thought
116 "China Set to Become Gem Center," Diamond News and SA. Jeweler, Jan. 19S9, p. 13. 117 Developing economically viable cutting and polishing markets for its rough output is
fundamental to Argyle's mining success because of the labor-intensive quality of its mined output. 118 BOM, Gemstones Yearbook, 1991, p. 13. 119 "Development of Thai Cutting Industry Linked to Procurement of Necessary Rough," Israel
Diamonds, May 1992, pp. 78-81. 120 There reportedly was difficulty acquiring the amount of rough goods needed for both learning
and production purposes; contributing factors include the global market condition and pricesupported products with planned supply shortages. Unlike the cutting industry in India, which developed a market niche for near-gem quality diamonds from comparatively inexpensive readily available industrial-grade diamond rough, Thailand has been in the position of competing for limited supplies at relatively high prices. At the same time, De Beers raised its diamond prices and demand for near-gem quality material strengthened.
121 "Development of Thai Cutting Industry Linked to Procurement of Necessary Rough," pp. 78-81.
122 BOM, Gemstones Yearbook, 1992, p. 3.
38

to be mostly small, cottage operations that work both natural and synthetic materials. In contrast, Idar-Oberstein, Germany, one of the largest European centers, is no longer a major cutting center in terms of production. It remains, however, the oldest, well established cutting center for colored gemstones in terms of quality of workmanship. Comparatively high labor costs in Germany have reoriented production to specialized cutting, featuring large, fine quality gemstones, and one-of-a-kind cuts.
U.S. MARKET
Consumer Characteristics and Factors Affecting Demand
Gemstones used for jewelry and artifacts are luxury goods purchased primarily for reasons of fashion, prestige, and personal appeal. Because gemstones are deferable purchase items, the key factor influencing U.S. consumer spending for these goods is disposable personal income. Related economic factors that influence demand for gemstones include consumer confidence in the economy and declining interest rates.
Most U.S. consumers are concentrated in large, urban communities near jewelry manufacturers. In 1990, 40 percent of U.S. jewelry, silverware, and plated ware manufacture establishments were in Rhode Island and New York, while California had 13 percent of such establishments.123
Consumption
Fueled by a growing economy, a 10-percent increase in disposable personal income, 124 relatively low interest rates, and heightened consumer confidence (figure 6), 125 the 40-percent growth in U.S. consumption during 1991-95 (table 3) reflected increased demand for lower-priced
123 Figures include silverware and plated ware manufacturers. Jewelers' Circular-Keystone, 1993-1994 Directory Issue, p. 610.
124 From 1991-95, real GDP (based on billions of chained 1992 dollars) rose by 2.7 percent in 1992 followed by 2.2 percent in 1993, 3.4 percent in 1994, and then 1.5 percent in 1995.
125 During the report period, the average prime interest rate charged by banks dropped from 8.46 percent in 1991 to 6.00 percent in 1993, and then rose to 7.14 percent in 1994 and on to 8.83 percent in 1995. Consumer Confidence Index, as measured by The Conference Board, decreased from 68.5 in 1991to61.6in1992butthenroseto65.9in1993, 90.6in 1994, and an even lOOin 1995.
39

Figure 6 Natural and synthetic gemstones: Change in U.S. apparent consumption relative to disposable personal income and consumer confidence indexes, 1991-95
Consumption
DPI
140 -1-~==~~==:__~C~C~l~~~~~~~~~~--,,,.....-<:::.~=:====:;;;;::z~:..._--
80 ---+~~~~~~-.-~~~~~~-,-~~~~~~---,~~~~~~-----.
1991 1992 1993 1994 1995
Note: (1) Consumption = apparent consumption, based on current year dollars (2) DPI = disposable personal income, based on current year dollars (3) CCI = consumer Confidence Index
Source: Consumption estimated by Commission staff, DPI calculated from official data of the U.S. Department of Co_mmerce, CCI calculated from data of the Consumer Research Center.
gemstone imports, primarily diamonds.126 The exception was imports of rough diamond, which showed a decrease in the quantity demanded for higher-priced goods (figure 7); the large price hike in 1994 reflects a near-doubling of price for rough diamonds from Switzerland. Other product groups for which unit prices can be measured had decreasing prices during the period (see figures 8-10).127 In 1995, a higher annual average prime interest rate levied by banks (almost 9 percent) and a reduction in GDP to 1.5 percent contributed to a slight decline in apparent consumption.
The ratio of net imports to estimated consumption fluctuated between 90 and 97 percent during 1991-95. Diamonds were the most important product group, ranging between 77 to 82 percent
126 In terms of the overall price market, the trade weighted unit price of imported diamonds fluctuated downward from $469 to $437 per carat; unworked goods actually increased in value from $293 to $37 4 per carat but cuts decreased from $517 to $446 per carat, pulling down the trade weighted average.
127 Trade weighted average unit price is based on gross imports, not net imports. The unit price is meaningless for net imports because in some years U.S. re-exports are more for some products than imports of the same products, relying on previous years' inventory. Instead, unit price is calculated on total imports for current and projected market trends. Unit prices cannot be calculated for pearls and synthetics because imports are not quantified.
40

Table 3 Natural and synthetic gemstones, all products: U.S. shipments, net imports for consumption, U.S. exports, and apparent U.S. consumption, 1991-95
Apparent Ratio of net U.S. U.S. U.S. U.S. imports to
Year production 1 net imports2 exports consumption consumption
Million dollars Percent
1991 .......... 618.5 3,206.4 324.4 3,500.4 92 1992 0 0 0 0 0 0 0 0 I 0 582.8 3,621.3 475.5 3,728.6 97 1993 0 0 0 o o o o I I 0 614.1 4,119.4 231.2 4,502.3 92 1994 .......... 796.3 4,507.7 268.4 5,035.7 90 1995 .......... 706.8 4,462.7 268.0 4,901.5 91
Cut natural and synthetic gemstones:
1991 o 0 o o o o o 0 0 I 516.2 2,716.5 271.5 2,961.1 92 1992 .......... 497.7 3, 142.0 414.8 3,224.8 97 1993 .......... 538.3 3,603.8 180.1 3,962.0 91 1994 .......... 723.6 3,797.2 215.7 4,305.2 88 1995 O 0 0 I I I 0 O O 0 606.9 3,856.8 207.2 4,256.6 91
Uncut natural and synthetic gemstones, including worked and unworked pearls:
1991 .......... 102.3 489.9 52.9 539.3 91 1992 .......... 85.1 479.3 60.7 503.7 95 1993 .......... 75.8 515.6 51.1 540.3 95 1994 .......... 72.7 710.5 52.7 730.5 97 1995 I I I 0 o o o 0 0 0 99.9 605.8 60.8 644.9 94
1 U.S. production of cut natural and synthetic gemstones was estimated by the staff of the U.S. International Trade Commission. Production of uncut natural and synthetic gemstones compiled from production data of the U.S. Department of Interior, Bureau of Mines.
2 Net imports, defined as imports minus re-exports. Re-export is the exportation of imported goods with no value added.
Source: Compiled from official statistics of the U.S. Department of Commerce, except as noted.
41

Figure 7 lndexes1 of rough diamond import values and trade-weighted average unit price, 1991-95
200 value
>< ~ 140 -t-~~~~~~~~~~~~~~~~~--,r-~~_,,...~~~---;:--~~--->,.,---
-=
100
80
1991 1992 1993
1 Base: Average import value and average unit price in 1991 .
1994
Source: Compiled from official statistics of the U.S. Department of Commerce.
Figure 8 lndexes1 of cut diamond import values and trade-weighted average unit price, 1991-95
160 Value
140
>< Cl> 120 ~ -=
100
1995
80 -t-~~~~~~~-,-~~~~~~~---.-~~~~~~~---.-~~~~~~~~
1991 1992 1993 1994 1995
1 Base: Average import value and average unit price in 1991 . Source: Compiled from official statistics of the U.S. Department of Commerce.
42

Figure 9 lndexes1 of cut colored gemstone import values and trade-weighted average unit price, 1991-95
Value Price 60 -+~~~~~~~.-~~~~~~---.~~~~~~~--.---~~~~~~--,
1991 1992 1993 1994 1995
1 Base: Average import value and average unit price in 1991. Source: Compiled from official statistics of the U.S. Department of Commerce.
1 Base: Average import value and average unit price in 1991. Source: Compiled from official statistics of the U.S. Department of Commerce.
Figure 10 lndexes1 of rough colored gemstone import values and trade-weighted average unit price, 1991-95
Value Price 0 -+~~~~~~~.---~~~~~~---.~~~~~~~-,--~~~~~~--,
1991 1992 1993 1994 1995
43

of consumption, followed by colored gemstones (8 tol2 percent), natural and cultured pearls (1 to 2 percent), and synthetics (1 to 2 percent). Net imports of cut gemstones fluctuated between 88 and 97 percent of consumption, with cut diamonds alone accounting for 66 to 71 percent of the total.
Production128
Aided by a growing economy from 1991-94 and repeal of a IO-percent luxury tax on certain retail sales (including jewelry),129 total estimated U.S. production of gemstones fluctuated upward by 29-percent to $796 million, but then dropped to $707 million in 1995 (see table 3). The slowing of the economy from a GDP of 3.4 percent in 1994 to 1.5 percent in 1995 contributed to the decline in U.S. production in 1995.
Favorable economic conditions also contributed, in part, to an estimated 40-percent increase in U.S. production of cut gemstones in 1994 to $724 million, which then dropped the following year to $607 million primarily due to the lower rate of growth in GDP. Data for cut gemstone production reflect, in part, the sector's reliance on imported rough (uncut) gemstone for cutting material. In 1995, net imports of rough accounted for almost 93 percent ($513 million) of gemstone material available for cutting, with rough diamonds comprising 89 percent ($492 million) of imported rough gemstones.
In spite of the healthy economy, however, production of mined gemstones and pearls (both natural and c~tured) decreased by nearly 11 percent during 1991 to 1995, to $75.5 million. Offsetting this downward trend, however, was the production of synthetic material which increased by 36 percent to $24.4 million, resulting in only a 2-percent decrease in overall production of rough gemstones to $99.9millionin1995.130
128 Estimated production data combine both rough and cutting sectors in the industry. However, cut gemstones accounted for 83 to 91 percent of estimated production during the report period. Thus, any change in production is primarily a function of demand for quality, large cut (two plus carats) diamonds that U.S. cutters tend to specialize in. Estimates may be overstated because they assume that all rough made available for a given year was cut rather than held in inventory. Information on inventory of gemstones is not readily available, but it is reported to be a major expense item for this industry in terms of the value of goods held, insurance, and handling costs. Inventories are generally held by distributors of rough goods and by distributors of cut goods. Jewelers and cutters generally do not hold large inventories of gemstones.
129 The luxury tax was part of the Omnibus Budget Reconciliation Act of 1990 and was scheduled to terminate December 31, 1999. The tax added a IO-percent surcharge on that portion ofretail jewelry sales prices that exceeded $10,000. The tax was repealed in August 1993, retroactive to January 1, 1993.
130 It is generally recognized within the industry that synthetics bolster overall gemstone sales during a market downturn because they offer a ready supply at lower unit prices than natural gemstones of comparable quality.
44

U.S. TRADE
Overview
Increased imports caused the U.S. trade deficit in natural and synthetic gemstones to expand by $1.3 billion between 1991-1995, from $2.9 billion to $4.2 billion (table 4). Increased imports of smaller diamonds and colored gemstones from Israel, India, and Belgium (major diamond cutting and trading centers) were largely responsible for the expansion. However, the deficit expansion was somewhat tempered by a 42-percent ($730 million) growth in total exports. (See figure 12 for an overall picture on U.S. trade.)
U.S. Imports131
Influenced by a relatively strong economy, imports grew 44 percent during 1991-95 to nearly $6.7 billion (table 4). Both synthetic and natural gemstones are imported primarily by distributors specializing in specific gemstone types (i.e., diamonds, pearls, and colored gemstones); in the case of diamonds, distributors may specialize between cut and uncut materials.132 During 1991-95, diamonds accounted for nearly 90 percent of all gemstone imports ($6 billion in 1995), far outpacing all other categories. Colored gemstones accounted for 8 percent ($553 million) of all imports during the period; pearls accounted for nearly 1 percent ($88 million). The portion of imports entering the country in cut form ranged between 85-88 percent, with uncut goods (including pearls) accounting for the balance. (See import tables in appendix B for a more detailed breakout by types of gemstones and major source countries.)
131 Measurable amount ofU.S. imports are re-exported. During 1991-95, a weighted average of nearly 30 percent ($8.3 billion) of U.S. imports were re-sold abroad with cut diamonds comprising the bulk of this trade. Net imports can be calculated by applying mathematical calculations to appendixB (imports) andD (re-exports).
132 Synthetic and reconstructed gemstones and cultured pearls are generally imported and traded by distributors of the corresponding natural materials.
45

Table 4 Natural and synthetic gemstones: U.S. exports, imports for consumption, and merchandise trade balance, by selected country and country groups, 1991-95
(Million dollars) Item 1991 1992 1993 1994 1995 U.S. exports including re-exports:
Israel 276 287 348 449 544
India 33 40 50 60 84
Belgium 437 373 443 513 559
Switzerland 171 169 195 226 216
U.K 45 56 50 72 71
Hong Kong 296 346 388 471 493
Thailand 111 52 43 41 53 Ghana 0 0 0 0 0
Russia1 NA 0 (2) 7 23
Colombia 2 1 1 (2) (2)
All other 371 312 333 351 428
Total 1 741 1,637 1 851 2189 2,471
Generalized Svstem of Preferences 427 389 456 574 726
Eurooean Union 538 497 530 635 699
ASEAN 143 92 103 89 117 U.S. imports for consumption:
Israel 1,231 1,328 1,646 1,977 2,153
India 902 981 1,282 1 325 1,457
Belgium 1,121 1,132 1,344 1,443 1,416
Switzerland 203 194 184 224 270
U.K 296 232 270 280 202
Hong Kong 107 123 144 128 161
Thailand 199 171 154 174 148
Ghana 57 35 121 143 120
Russia1 NA 20 60 160 106
Colombia 53 99 127 97 98 All other 454 469 408 478 536
Total 4,623 4,783 5739 6429 6,666
Generalized Svstem of Preferences 2 717 2905 3637 4169 4,412
European Union 1493 1469 1676 1,792 1,686
ASEAN 206 178 165 181 158 U.S. merchandise trade balance:
Israel -955 -1 041 -1298 -1,529 -1,609
India -870 -941 -1,231 -1 265 -1 373
Belaium -684 -758 -901 -929 -857 Switzerland -32 -24 11 2 -54
U.K -251 -176 -220 -208 -131
Hona Kona 189 223 244 342 332 Thailand -88 -118 -111 -133 -95
Ghana -57 -35 -121 -143 -120 Russia1 NA -20 -60 -153 -83 Colombia -52 -98 -126 -96 -98 All other -83 -156 -75 -128 -107
Total -2,882 -3,146 -3,888 -4,239 -4,195
Generalized Svstem of Preferences -2290 -2,517 -3,180 -3,595 -3,686 European Union -955 -972 -1,145 -1,157 -988 ASEAN -64 -86 -62 -96 -41
1 Trade data for Russia was not reported separate from the Soviet Union until February 1992. 2 Less than $500,000.
Note.-U.S. exports cover domestic exports and re-exports. Import values are based on customs value; export values are based on f.a.s. value, U.S. port of export. Source: Compiled from official statistics of the U.S. Department of Commerce.
46

Figure 11 Natural and synthetic gemstones: U.S. domestic exports, re-exports, total exports, and imports for consumption, 1991-95
Ul '-
"' 0
~ 4 -1-~~~~~-=ll==-~-D_o_m~es_t_ic_e_xp~o_rt_s~~---=[]==--~~R_e-_e_xp~o_rts~~~~-Ul Im Total exports Imports c 0
1991 1992 1993 1994 1995
Source: Compiled from official statistics of the U.S. Department of Commerce.
Cut Gemstones
The import value of cut gemstones133 increased by 48 percent to $5.9 billion in 1995, supported by increased demand for lower priced gems (see cut gemstone tables in appendix B).134
Diamonds accounted for nearly 91 percent ($5.3 billion) ofthis total, with Israel, India, and Belgium together providing about 90 percent of diamond imports. Thailand, Colombia, and India were major suppliers of cut natural colored gemstones, together providing 55 percent of
133 Pearls are excluded from this category; they are covered under uncut imports. 134 Both the import value and quantity of cut diamonds increased during the report period, from
$3.5 billion (6.7 million carats) in 1991 to $5.3 billion (11.9 million carats) in 1995, resulting in a 14-percent decrease in the trade-weighted unit price of imported cut diamonds to $446. Similarly, the value for all cut rubies, sapphires, and emeralds increased by 27 percent to $404 million while the quantity nearly doubled to 18 million carats, resulting in a 31-percent decrease in the trade-weighted unit price to $22 per carat. In contrast, the value of cut synthetic gemstones suitable for jewelry applications decreased by about 5 percent to $41 million. Unit prices for synthetics and other kinds of cut colored gemstones cannot be calculated because quantity of imports is not reported.
47

such imports.135 In contrast to imports of cut diamonds and natural colored gemstones, the import value of cut synthetic and reconstructed materials decreased by 4 percent to $4 I. 7 million.136 Providing a total of 72 percent of imported synthetic materials ($29. 6 million) were Germany, Thailand, Austria, and Switzerland.
Rough Gemstones
The import value of uncut gemstones fluctuated upward for a 2I-percent increase in value to nearly $799 million in I995, due primarily to higher priced uncut diamonds.137 Diamonds alone made up 8 I percent ($648.9 million) of all uncut gemstone imports in I995 with the United Kingdom, Belgium, and Ghana together supplying 6 I percent. Pearls comprised I I percent of uncut imports ($88.2 million), with Japan, Australia, Hong Kong, and French Polynesia together supplying 9 I percent of pearls. Colored gemstones comprised 6 percent of uncut gemstone imports ($49 .3 million) with Brazil, Russia, and Colombia together supplying nearly 78 percent of colored gemstones; synthetics comprised the remaining 2 percent ($ I2. 6 million) with Japan and Russia together supplying 68 percent of synthetics.138
U.S. Trade Measures
In I995, over 96 percent ($6.4 billion) of total gemstone imports were eligible for duty-free entry under the Harmonized Tariff Schedule (HTS) column-I general rates of duty. Table 5 shows the column-I duty rates as of January I, I996. The aggregate trade-weighted, average rate of duty for imports from column-I countries in I996 was 0.06 ad valorem equivalent, exclusive of imports entering under special duty provisions. Duties were applied to nearly 3 percent ($I 79 million) of imports. Nearly $60 million was eligible for duty free entry under special programs including the Generalized System of Preferences, United States-Israel Free Trade Area, North American Free Trade Agreement, Caribbean Basin Economic Recovery Act, and the Andean Trade Preference Act. See appendix A for explanation of tariff and trade agreement terms. No U.S. nontari:ff measmes were identified as affecting imports of gemstones, nor have there been any U.S. Government trade-related investigations conducted in recent years with respect to imports of gemstones.
135 India displaced Switzerland as the third largest supplier of cut colored gemstones in 1995; the value of imports from the two countries in that year was $66 million and $57 million, respectively (see appendix B for a comparison of prior years). Although it is too early to determine a trend, the shift is thought to be a result of India's push for capital investment and value-added production in the cutting sector along with increased demand for lower priced gems.
136 Cut synthetics and reconstructed gemstones include those materials that may or may not have been worked but were not suitable for jewelry applications. They would have been used for artifacts or industrial applications and account for just 1 percent of the cut synthetics and reconstructed import group.
137 Although the value of uncut diamond imports increased by 20 percent to $648.9 million, the quantity imported decreased by nearly 6 percent to 1. 7 million carats, causing a 28-percent increase in the trade-weighted average unit price to $374.
138 The bulk of imported synthetic rough ($11. 3 million) includes piezo-electric quartz and other material that may be worked but for non-jewelry use. These materials are included in gem trade data because they are often of gem quality.
48

+::\0
Table 5 Natural and synthetic gemstones: Harmonized Tariff Schedule subheading; description; U.S. col. 1 rate of duty as of Jan. 1, 1996; U.S. exports1, 1995; and U.S. imports, 1995
Col. 1 rate of duty as of Jan. 1, 1996 HTS subheading Description General Special2
7101
7101.10.0d3 7101.21.00 7101.22.0ct
7102 7102.10.00 7102.31.00
7102.39.00
7103
7103.10.20 7103.10.40 7103.91.00 7103.99
.10
.50
Pearls (natural or cultured) not strung, mounted or set; ungraded pearls (natural or cultured) temporarily strung for convenience of transport:
Natural pearls . . . . . . . . . . . . . . . . . . . . . . . . . . . . . . . . . . . Cultured pearls, unworked ......................... . Cultured pearls, worked ........................... .
Diamonds, not mounted or set: Unsorted diamonds .............................. . Nonindustrial diamonds, unworked or simply sawn, cleaved
or bruted ..................................... . Nonindustrial diamonds, worked ..................... .
Precious (other than diamonds) and semiprecious stones, not strung, mounted or set; ungraded precious (other than diamond) and semiprecious stones, temporarily strung for convenience of transport:
Unworked ..................................... . Simply sawn or roughly shaped ...................... . Rubies, sapphires and emeralds, worked ............... .
Other precious (other than diamonds) and semiprecious stones, worked but not strung, mounted or set:
Cut but not set, and suitable for use in the manufacture of jewelry ................. · ..................... .
Cut precious and semiprecious stones, n.e.s.i. ........... .
Free 1.3% 1.3%
Free
Free Free
Free 16.8% Free
1.3% 16.8%
Free (A,CA,E,IL,J,MX) Free (A,CA,E,IL,J,MX)
Free (A,CA,E,IL,J,MX)
Free (A' 5,CA,E,IL,J,MX) Free (A,CA,E,IL,J,MX)
U.S. U.S. exports 1, imports 1995 1995
_Million dollars-
2.9 32
3.0
3.9
137.7 2,010.0
42.3 5.7
153.0
27.8 12.2
2.5 6.4
59.3
18.0
630.9 5,321.6
48.6 0.7
404.3
91.5 8.1

Vo 0
Table 5-Continued Natural and synthetic gemstones: Hannonized Tariff Schedule subheading; description; U.S. col. 1 rate of duty as of Jan. 1, 1996; U.S. exports1 ,
1995; and U.S. imports, 1995
Col. 1 rate of duty as of Jan. 1, 1996 HTS subheading Description General Special2
7104
7104.10.00 7104.20.00
7104.90.10
7104.90.50
Synthetic or reconstructed precious or semiprecious stones not strung, mounted or set; ungraded synthetic or reconstructed precious or semiprecious stones, temporarily strung for convenience of transport:
Piezo-electric quartz .............................. . Synthetic or reconstructed precious or semiprecious stones,
except piezo-electric quartz, unworked or simply sawn or roughly shaped ................................ .
Synthetic or reconstructed precious or semiprecious stones, except piezo-electric quartz, cut and suitable for use in the manufacture of jewelry ........................ .
Cut synthetic or reconstructed precious or semiprecious stones n.e.s.i. ................................. .
1 U.S. exports include domestic and re-exports.
4.8% Free (A,CA,E,IL,J,MX)
4.8% Free (CA,E,IL,J,MX)
1.9% Free (A,CA,E,IL,J,MX)
10.2% Free (A,CA,E,IL,J,MX)
U.S. exports1,
1995
U.S. imports 1995
-Million dollars -
11.4 10.8
14.3 1.3
11.5 41.2
3.0 0.5
2 Programs under which special tariff treatment may be provided, and the corresponding symbols for such programs as they are indicated in the "Special" subcolumn, are as follows: Generalized System of Preferences (A or A'); North American Free-Trade Agreement, goods of Canada (CA) and Mexico (MX); Caribbean Basin Economic Recovery Act (E or E'); United States-Israel Free Trade Area (IL); and Andean Trade Preference Act (J or J').
3 HTS subheading broken into 7101.10.30 (natural pearls graded and temporarily strung for convenience of transport) and 7101.10.60 (other natural pearls).
4 HTS subheading broken into 7101.22.30 (worked cultured pearls graded and temporarily strung for convenience of transport) and 7101.22.60 (other worked cultured pearls).
5 Thailand is not eligible for duty free treatment for this product under the Generalized System of Preferences.
Source: U.S. exports and imports compiled from data of the U.S. Department of Commerce.

U.S. Exports
Principal Markets
Foreign markets are relatively important for the U.S. gemstone industry, as between 34 and 82 percent of domestic production was exported during the period (table 3).139 Most exports (77 to 87 percent) were cut products, reflecting the U.S. niche as a cutting center and its lack of indigenous gemstones; remaining U.S. exports were pearls and uncut gemstones. Because gemstones are small and have a very low weight-to-value ratio, they are easily traded and are commonly transported from production to cutting centers and on to consumer markets several times before being used in an application. As in the U.S. market, factors that contribute to foreign demand for gemstones include disposable personal income, confidence in the economy, and declining or relatively low interest rates.
Belgium, India, and Israel are the major global cutting and trading markets for the gemstone industry. However, the United States has limited trade in these markets and they account for the largest trade deficits in gemstones. The United States shipped U.S.-produced and -cut gemstones to 71 countries in 1995 with Switzerland, Hong Kong, and Canada together accounting for about 54 percent ($146 million) of domestic exports.
Switzerland
Switzerland was the leading U.S. export market during 1991-95, accounting for 20 to 37 percent of all gemstone exports during the period as the value of U.S. exports to that country fluctuated. Cut diamonds comprised 85 to 91 percent of shipments on average. Switzerland has a relatively small gemstone-mining and cutting industry, but does have a well-established jewelty and watch manufacturing industry. Although a major U.S. export market, U.S. shipments represented only 3 percent of Swiss imports in 1995. The U.S. gemstone trade balance with Switzerland swung from a deficit of $32 million in 1991 to a surplus of $11 million in 1993 and back to a deficit of $54 million in 1995. This swing reflects a short term increase in demand for large cut, quality diamonds.
Hong Kong
Hong Kong is the second-largest U.S. export market in terms of value, accounting for 17 percent ($45.8 million) of U.S. trade in 1995. As with other export markets, cut diamonds accounted for the majority of shipments (67 percent), totaling $30.8 million. Hong Kong is a major international trading center of cut gemstones of all types and has an internationally-recognized jewelty manufacturing industry. Hong Kong is the only country with which the United States had a trade surplus in natural and synthetic gemstones throughout the report period. This surplus increased by 81 percent to $342 million between 1992 to 1994, and then declined to $332 million in 1995. The decline in 1995 was due primarily to increased U.S. imports of cut diamonds from Hong Kong.
139 During 1991-95, domestic exports fluctuated between $231 million and $4 7 6 million.
51
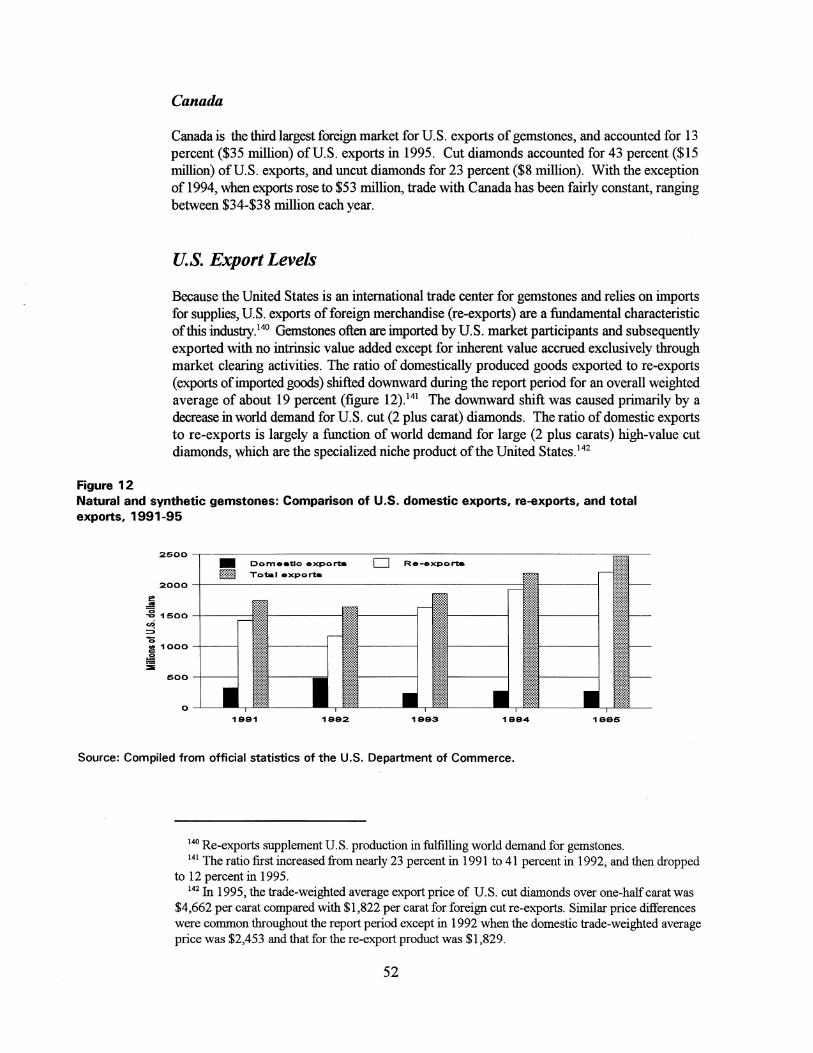
Figure 12
Canada
Canada is the third largest foreign market for U.S. exports of gemstones, and accounted for 13 percent ($35 million) of U.S. exports in 1995. Cut diamonds accounted for 43 percent ($15 million) of U.S. exports, and uncut diamonds for 23 percent ($8 million). With the exception of 1994, when exports rose to $53 million, trade with Canada has been fairly constant, ranging between $34-$3 8 million each year.
U.S. Export Levels
Because the United States is an international trade center for gemstones and relies on imports for supplies, U.S. exports of foreign merchandise (re-exports) are a fundamental characteristic of this industry.140 Gemstones often are imported by U.S. market participants and subsequently exported with no in~ic value added except for inherent value accrued exclusively through market clearing activities. The ratio of domestically produced goods exported to re-exports (exports of imported goods) shifted downward during the report period for an overall weighted average of about 19 percent (figure 12).141 The downward shift was caused primarily by a decrease in world demand for U.S. cut (2 plus carat) diamonds. The ratio of domestic exports to re-exports is largely a function of world demand for large (2 plus carats) high-value cut diamonds, which are the specialized niche product of the United States.142
Natural and synthetic gemstones: Comparison of U.S. domestic exports, re-exports, and total exports, 1991-95
I! ~ .g 1500 -r---«? ::::> b :! 1000 -+---I
~
=-
0
1991 1992 1993 1994 1995
Source: Compiled from official statistics of the U.S. Department of Commerce.
140 Re-exports supplement U.S. production in fulfilling world demand for gemstones. 141 The ratio first increased from nearly 23 percent in 1991 to 41 percent in 1992, and then dropped
to 12percentin1995. 142 In 1995, the trade-weighted average export price of U.S. cut diamonds over one-half carat was
$4,662 per carat compared with $1,822 per carat for foreign cut re-exports. Similar price differences were common throughout the report period except in 1992 when the domestic trade-weighted average price was $2,453 and that for the re-export product was $1,829.
52

Total exports (re-exports and domestic goods exported) increased by 42-percent from $1.7 billion in 1991 to $2.5 billion in 1995, due in large part to increased foreign demand for cut diamonds. (See appendix E for a breakout of exports by types of gemstones and markets.) Reexports alone increased by 55 percent to $2.2 billion, with cut diamonds increasing by 59 percent to $1.9 billion. Re-exports of cut and uncut colored gemstones, pearls, and synthetic and reconstructed materials together also increased in value, by 85 percent to $193 million. This increase reflected a 79 percent increase in exports of cut colored gemstones to $152 million. Primacy markets for re-exports remained relatively constant through the report period with Belgium, Israel, Hong Kong, Switzerland, and Japan together accounting for 84 percent ($1.8billion)in1995 (see appendix D for a breakout ofre-exports by types of gemstones and major markets).
In contrast to re-exports, domestically produced gemstone exports decreased by 17-percent during 1991-95 to $268 million, as a result of a decline in trade in cut materials. Exports of cut diamonds and cut colored gemstones decreased by 17 percent to $157 million and by 4 7 percent to $41 million, respectively. The only category of U.S. cut gemstones to show an improvement in exports was synthetics and reconstructed materials, which increased 73 percent to $9. 6 million. Industry sources state that improved foreign demand for these materials was influenced by increased awareness of the variety of gemstones available and by the quality of workmanship in both growing and cutting synthetics compared with more expensive natural counterparts. Major foreign markets for U.S. cut materials (diamonds, synthetics/reconstructed, and colored gemstones) included Switzerland, Hong Kong, Canada, and Japan, which together accounted for 75 percent ($155 million) in 1995 (see appendix C for a more complete breakout of domestic exports by types of gemstones and major markets).
Domestic export patterns for uncut gemstones and pearls were mixed during the report period. Exports of uncut colored gemstones and synthetic material increased by 100 percent to $21.7 million and by 19 percent to $21.9 million, respectively; exports ofrough (uncut) diamonds decreased by 28 percent to about $15 million.143 Exports of natural pearls also decreased by 65 percent to $715,000 in 1995. At the same time, exports of cultured pearls increased by 31 percent to $2. 0 million; contributing factors are believed to be reduced availability of natural pearls and growing reliability of cultured supplies. India, Canada, Hong Kong, and Switzerland were major foreign markets for U.S. exports of rough gemstones and pearls during the report period, together accounting for about 49 percent ($30 million) of total rough exports in 1995.
Both domestic and re-exports are primarily handled by distributors who tend to specialize in one gemstone category (e.g., diamonds, colored gemstones, or pearls). Generally, distributors handle both the natural and the synthetic materials of their category specialty; pearl distributors handle both natural and cultured. Diamond and colored gemstone distributors tend to specialize in either cut or uncut goods. Certainly exports are important to this industry but because the United States is a trading center and the world's primary gemstone market, the ratio of domestically produced goods exported to net imports ranged from only 6 percent to 13 percent between 1991-95, with each of the last 3 years showing 6 percent (see table 4).
143 Although the United States did not mine diamonds on a commercial basis during the report period, domestic exports of uncut diamonds includes imported unworked diamonds that have been simply sawn, cleaved, or bruted by U.S. cutters.
53

Foreign Trade Measures
Tariff rates in most U.S. gemstone export markets tend to be very low. The exception is India, where tariff rates for unworked and worked gemstone imports are 40 and 60 percent, respectively. However, India also has various drawback and countertrade programs for gemstones to help offset the high import rates and increase the industry's competitiveness vis-avis other world producers. Under the North American Free Trade Agreement (NAFTA), U.S. produced unworked and worked gemstones became eligible for duty-free treatment upon entering Mexico from the United States effective January 1, 1994. In terms of trade with Canada, U.S. produced unworked and worked gemstones were eligible for duty-free treatment upon entering Canada before the United States-Canada Free-Trade Agreement went into effect on January 1, 1989 and continue to receive duty-free treatment under NAFTA. (Canada and Mexico together accounted for nearly 14 percent of U.S. exports of domestic gemstones in 1995 and nearly 3 percent of all U.S. gemstone exports (e.g., domestic and re-exports combined).
Although markets in Thailand and China account for insignificant portions of U.S. exports, these countries have recently emerged as cutting centers for gemstones. In both countries, tariff rates are relatively high. China has the higher rates, ranging from 100 percent for pearls and 70 percent for worked diamonds and colored gemstones, to 30 percent for unworked. Thailand's rates are lower at 15-20 percent for worked gemstones and zero for unworked.
No foreign nontariff measures were identified as affecting U.S. exports of worked and unworked gemstones.
54
APPENDIX A EXPLANATION OF TARIFF AND TRADE
AGREEMENT TERMS

APPENDIX A TARIFF AND TRADE AGREEMENT TERMS
In the Harmonized Tariff Schedule of the United States (HTS), chapters 1through97 cover all goods in trade and incorporate in the tariff nomenclature the internationally adopted Harmonized Commodity Description and Coding System through the 6-digit level of product description. Subordinate 8-digit product subdivisions, either enacted by Congress or proclaimed by the President, allow more narrowly applicable duty rates; 10-digit administrative statistical reporting numbers provide data of national interest. Chapters 98 and 99 contain special U.S. classifications and temporary rate provisions, respectively. The HTS replaced the Tariff Schedules of the United States (TSUS) effective January 1, 1989.
Duty rates in the general subcolumn of HTS column 1 are most-favored-nation (MFN) rates, many of which have been eliminated or are being reduced as concessions resulting from the Uruguay Round of Multilateral Trade Negotiations. Column 1-general duty rates apply to all countries except those enumerated in HTS general note 3(b) (Afghanistan, Cuba, Laos, North Korea, and Vietnam), which are subject to the statutoxy rates set forth in column 2. Specified goods from designated MFN-eligible countries may be eligible for reduced rates of duty or for duty-free entxy under one or more preferential tariff programs. Such tariff treatment is set forth in the special subcolumn of HTS rate of duty column 1 or in the general notes. If eligibility for special tariff rates is not claimed or established, goods are dutiable at column I-general rates. The HTS does not enumerate those countries as to which a total or partial embargo has been declared.
The Generalized System of Preferences (GSP) affords nonreciprocal tariff preferences to developing countries to aid their economic development and to diversify and expand their production and exports. The U.S. GSP, enacted in title V of the Trade Act of 197 4 for 10 years and extended several times thereafter, applied to merchandise imported on or after January 1, 1976 and before the close of May 31, 1997. Indicated by the symbol "A" or "A*" in the special subcolumn, the GSP provided duty-free entxy to eligible articles the product of and imported directly from designated beneficiary developing countries, as set forth in general note 4 to the HTS.
The Caribbean Basin Economic Recovery Act (CBERA) affords nonreciprocal tariff preferences to developing countries in the Caribbean Basin area to aid their economic development and to diversify and expand their production and exports. The CBERA, enacted in title II of Public Law 98-67, implemented by Presidential Proclamation 5133 ofNovember 30, 1983, and amended by the Customs and Trade Act of 1990, applies
A-2

to merchandise entered, or withdrawn from warehouse for consumption, on or after January 1, 1984. Indicated by the symbol "E" or "E*" in the special subcolumn, the CBERA provides duty-free entry to eligible articles, and reduced-duty treatment to certain other articles, which are the product of and imported directly from designated countries, as set forth in general note 7 to the HTS.
Free rates of duty in the special subcolumn followed by the symbol "IL" are applicable to products oflsrael under the United States-Israel Free Trade Area Implementation Act of 1985 (IFTA), as provided in general note 8 to the HTS.
Preferential nonreciprocal duty-free or reduced-duty treatment in the special subcolumn followed by the symbol "J" or "J*" in parentheses is afforded to eligible articles the product of designated beneficiary countries under the Andean Trade Preference Act (ATPA), enacted as title II of Public Law 102-182 and implemented by Presidential Proclamation 6455 of July 2, 1992 (effective July 22, 1992), as set forth in general note 11 to the HTS.
Preferential or free rates of duty in the special subcolumn followed by the symbol "CA" are applicable to eligible goods of Canada, and rates followed by the symbol "MX" are applicable to eligible goods of Mexico, under the North American Free Trade Agreement, as provided in general note 12 to the HTS and implemented effective January 1, 1994 by Presidential Proclamation 6641 of December 15, 1993. Goods must originate in the NAFTA region under rules set forth in general note 12(t) and meet other requirements of the note and applicable regulations.
Other special tariff treatment applies to particular products of insular possessions (general note 3(a)(iv)), products of the West Bank and Gaza Strip (general note 3(a)(v), goods covered by the Automotive Products Trade Act (APTA) (general note 5) and theAgreement on Trade in Civil Aircraft (ATCA) (general note 6), articles imported from freely associated states (general note 10),pharmaceutical products (general note 13), and intermediate chemicals/or dyes (general note 14).
The General Agreement on Tariffs and Trade 1994 (GATT 1994), annexed to the Agreement Establishing the World Trade Organization, replaces an earlier agreement (the GATT 1947 [61 Stat. (pt 5) A58; 8 UST (pt 2) 1786]) as the primary multilateral system of disciplines and principles governing international trade. Signatories' obligations under both the 1994 and 1947 agreements focus upon most-favored-nation treatment, the maintenance of scheduled concession rates of duty, and national (nondiscriminatory) treatment for imported products; the GATT also provides the legal framework for customs valuation standards, "escape clause" (emergency) actions, antidumping and countervailing duties, dispute settlement, and other measures. The results of the Uruguay Round of multilateral tariff negotiations are set forth by way of separate schedules of concessions for each participating contracting party, with the U.S. schedule designated as Schedule XX.
A-3

Pursuant to the Agreement on Textiles and Oothing (ATC) of the GATT 1994, member countries are phasing out restrictions on imports under the prior "Arrangement Regarding International Trade in Textiles" (known as the Multifiber Arrangement (MFA)). Under the MFA, which was a departure from GATT 1947 provisions, importing and exporting countries negotiated bilateral agreements limiting textile and apparel shipments, and importing countries could take unilateral action in the absence or violation of an agreement. Quantitative limits had been established on imported textiles and apparel of cotton, other vegetable fibers, wool, man-made fibers or silk blends in an effort to prevent or limit market disruption in the importing countries. The ATC establishes notification and safeguard procedures, along with other rules concerning the customs treatment of textile and apparel shipments, and calls for the eventual complete integration of this sector into the GATT 1994 over a ten-year period, or by Jan. 1, 2005.
A-4
APPENDIXB IMPORTS

Table B-1 Natural diamonds: U.S. imports for consumption by principal source, 1991-95
Natural diamonds, unworked and cut: Source 1991 1992 1993 1994 1995
Quantity (carats)
Israel •••.•I I I I Io I I I I 1,530,089 1,613,092 1,975,936 2,248,485 2,300,650 Belgium I I I I Io I I I Io I I 1,839,483 1,788,644 1,776,684 1,924,957 1,734,323 India ................ 3,472,088 4,288,257 5,680,795 6,481,320 7,631,338 Switzerland ........... 110, 150 22,962 28,584 24,864 35,147 United Kingdom ........ 641,012 710,455 1, 145,445 506,784 987, 103 Ghana I I I I I I I I I I I I I I 138,014 110,919 204,494 226,435 163,176 Hong Kong I I I I I I I I I I I 152,265 284,292 184,079 174,846 269,555 Russia1 •••••••••••••• N/A 16,617 70,927 122,838 76,017 Zaire I I I 0 0 I I I I I I I I I I 191,536 165,163 117,930 90,604 83,489 Rep. of S. Africa ....... 35,597 26,936 43,783 61,852 49,647 All others I I I I I I I I I I I I 434,650 335, 186 257,011 274,655 340,746
Total ............. 8,544,884 9,362,523 11,485,668 12, 137,640 13,671,191
Value (1,000 dollars)
Israel 0 I I I 0 0 I I 0 0 I I I 0 0 1,204, 142 1,298,402 1,609,247 1,945,108 2,118,407 Belgium I I I I I I 0 I I I I 0 I 1,115,240 1,129,062 1,340,114 1,436,949 1,409,695 India ................ 869,016 954,886 1,243,037 1,270,731 1,388, 166 Switzerland ........... 140,881 109,541 129,426 163,382 206,571 United Kingdom ........ 286,863 225,628 265,915 272,109 195,923 Ghana I I I I I I I I I I I I I I 56,968 35,320 121,297 142,918 119,639 Hong Kong I I I I I I I I 0 I I 63,602 75,081 86,616 74, 116 105,103 Russia1 •••••••••••••• N/A 18,875 58,582 155,981 96,517 Zaire I I I I I I I I I I I I I I I 70,679 83,479 41,674 32,048 82,199 Rep. of S. Africa ....... 29,757 46,263 83,626 103,006 78,980 All others 0 I I I I 0 I I I 0 I I 168,990 171,147 119,066 143,910 169,344
Total ............. 4,006,138 4,147,684 5,098,600 5,740,258 5,970,544
Average unit value (dollars per carat)
Israel I I I I I I I I I I 0 I I I 0 787 805 814 865 921 Belgium I I I I I I I 0 I I I I I 606 631 754 746 813 India ................ 250 223 219 196 182 Switzerland ........... 1,279 4,771 4,528 6,571 5,877 United Kingdom ........ 448 318 232 537 198 Ghana I I I I I I I I I I I I I 0 413 318 593 631 733 Hong Kong 0 I I I I I I I I I I 418 264 471 424 390 Russia1 •••••••••••••• N/A 1,136 826 1,270 1,270 Zaire I 0 I I I I 0 I I 0 I I I I I 369 505 353 354 985 Rep. of S. Africa I I I I I I I 836 1,718 1,910 1,665 1,591 All others I I I I IO O I I I I I 389 511 463 524 497
Total ............. 469 443 444 473 437
Table continues on next page.
B-2

Table B-1-Continued Natural diamonds: U.S. imports for consumption by principal source, 1991-95
Natural diamonds, cut: Source 1991 1992 1993 1994 1995
Quantity (carats)
Israel • • • 0 0 0 0 0 I I I I I I I 1,510,974 1,585,814 1,961,844 2,225,358 2,261,856 India ................ 3,415,221 4,280,477 5,677,396 6,399,578 7,565,709 Belgium I I 0 0 0 I I I I 0 I 0 0 1,381,952 1,384,384 1,628,002 1,617,791 1,550,217 Switzerland ........... 45,003 21,767 20,035 22,124 28, 194 Hong Kong I I I 0 I I 0 I 0 I I 146,931 262, 175 180,043 174,162 259,456 Russia1 •••••••••••••• N/A 11,662 45,437 30,113 41,118 Rep. of S. Africa ....... 21,808 12,969 17,446 23,366 23,705 United Kingdom ........ 10,442 24,840 17, 187 24,330 16,556 Thailand ............. 40,366 20,972 41,482 36,884 79, 120 Botswana ............ 283 3,079 7,806 17,067 21,446 All others I 0 0 I 0 I 0 I 0 0 I 0 125,653 115,737 106,555 115,038 86,594
Total ............. 6,698,633 7,723,876 9,703,233 10,685,811 11,933,971
Value (1,000 dollars)
Israel I IO I I I I 0 O I 0 0 IO I 1, 192,226 1,286,837 1,603,496 1,930,163 2,095,460 India ................ 859, 159 953,138 1,242,135 1,269,175 1,386,264 Belgium ............. 1,074,005 1,046,689 1,227,938 1,262,075 1,290,226 Switzerland ........... 121,393 99,691 116,856 155,569 196,735 Hong Kong I I I I I I 0 I 0 I a 63,436 74,897 85,403 73,165 103,388 Russia1 •••••••••••••• N/A 18,753 53,547 59,857 63,861 Rep. of S. Africa ....... 22, 147 28,621 39,808 56,056 41,232 United Kingdom ........ 35,521 36,493 36,563 47,261 39,607 Thailand ............. 13,363 7,694 13,870 13,975 22,957 Botswana ............ 253 1,552 4,912 9,446 10,990 All others I I 0 I I I 0 I 0 I 0 I 83,096 94,275 61,742 67,186 70,928
Total ............. 3,464,599 3,648,640 4,486,270 4,943,928 5,321,648
Average unit value (dollars e_er carat)
Israel I I I 0 I I I I I I I I Io I 789 811 817 867 926 India ................ 252 223 219 198 183 Belgium I I I I 0 I I 0 I I I I I 777 756 754 96 127 Switzerland ........... 2,697 4,580 5,833 7,032 6,978 Hong Kong I IO O O O O I I I I 432 286 474 420 398 Russia1 •••••••••••••• N/A 1,608 1,178 1,988 1,553 Rep. of S. Africa ....... 1,016 2,207 2,282 2,023 1,671 United Kingdom ........ 3,402 1,469 2,127 1,942 2,392 Thailand ............. 331 367 334 379 290 Botswana ............ 894 504 629 553 512 All others I 0 I I I I I Io I I I 661 815 579 584 819
Total ............. 517 472 462 463 446
Table continues on next page.
B-3

Table B-1-Continued Natural diamonds: U.S. imports for consumption by principal source. 1991-95
Natural diamonds, unworked: Source 1991
United Kingdom ....... . Belgium ............ . Ghana ............. . Zaire .............. . Rep. of S. Africa ...... . Russia1 ••••••••••••••
Israel .............. . Sierra Leone . . . . . . . . . . Congo ............. . Switzerland .......... . All other ............ .
Total ........... .
United Kingdom ....... . Belgium ............ . Ghana ............. . Zaire .............. . Rep. of S. Africa ...... . Russia1 ••••••••••••••
Israel .............. . Sierra Leone . . . . . . . . . . Congo ............. . Switzerland .......... . All other ............ .
Total ........... .
United Kingdom ....... . Belgium ............ . Ghana ............. . Zaire .............. . Rep. of S. Africa ...... . Russia1 ••••••••••••••
Israel .............. . Sierra Leone . . . . . . . . . . Congo . . . . . . . . . . . . . . Switzerland .......... . All other ............ .
Total ........... .
630,570 457,531 137,533 189,768
13,789 N/A
19, 115 9,605 2,057
65,147 321, 136
1,846,251
251,341 41,235 56,001 69,261
7,611 N/A
11,916 12,478
1,889 19,487 70,320
541,539
399 90
407 365 552 N/A 623
1,241 918 299 219 293
1992
685,615 404,260 109,447 163,745
13,967 4,955
27,278 20,471
773 1,195
206,941 1,638,647
189,136 82,373 34,936 82,107 17,641
122 11,565 19,369
666 9,850
51,280 499,045
1993
Quantity (carats)
1,128,258 148,682 202,358 116,884
26,337 25,490 14,092 23,251
986 8,549
87,548 1,782,435
1994
482,454 307,166 225,774 90,390 38,486 92,725 23, 127 26,012 22, 191
2,740 140,764
1,451,829
Value (1,000 dollars)
229,352 112,176 119,583 40,686 43,818
5,035 5,752
17,339 706
12,571 25,312
612,330
224,848 174,874 142,865 31,554 46,950 96, 123 14,945 21, 139 13,492
7,813 21,727
796,330
Average unit value (dollars per carat)
276 204 319 501
1,263 25
424 565 862
8,243 248 305
203 754 591 348
1,664 198 408 247 716
1,470 289 344
466 569 633 349
1,220 1,037
646 575 608
2,851 154 549
1995
970,547 184,106 162,191 82,643 25,942 34,899 38,794 21,471 16,329
6,953 193,345
1,737,220
156,316 119,469 119,136
81,971 37,748 32,656 22,947 18,516 14,913
9,835 35,389
648,896
161 649 735 992
1,455 936 592
1,069 913
1,414 183 374
1 Data for imports from Russia were not reported separate of the Soviet Union in 1991 and covers only Feb. through Dec., 1992; data for 1993-95 are full-year figures.
Source: Compiled from official statistics of the U.S. Department of Commerce.
B-4

Table B-2 Natural colored gemstones: value of U.S. imports for consumption by principal source, 1991-95
(1,000 dollars)
Source 1991 1992 1993 1994 1995
Natural colored gemstones, unworked and cut:
Thailand ........... 169,131 139,437 127,170 150,330 116,513 Colombia .......... 52,938 97,089 125,710 95,992 97,467 India .............. 31,819 25,189 37,595 52,950 57,507 Switzerland ......... 57,546 77,892 48,369 55,415 67,014 Brazil e e •I 0 0 o O 0 O 0 0 I 52, 161 44,225 32,863 41,693 43,657 Hong Kong ......... 37,190 40,829 48,473 44,099 46,889 Israel 0 0 0 o o o o I 0 0 0 I 0 26,846 29,451 36,932 32,107 34,578 Germany ........... 20,690 22,971 19,484 25,220 19,021 Sri Lanka (Ceylon) .... 6,141 5,804 6,285 9,831 13,102 Russia1 •••••••••••• N/A 772 904 3,562 8,601 All other ........... 46, 125 39,676 55,577 56,535 48,776
Total .......... 500,587 523,335 539,362 567,734 553, 125
Natural colored gemstones, unworked:
Brazil 0 0 0 Io o o I 0 0 0 0 I 31,361 26,043 17,963 24,470 29,725 Russia1 •••••••••••• N/A 377 608 190 5,266 Colombia .......... 1,386 4,425 6,085 5,972 3,194 Australia ........... 990 2,059 2,561 3,197 2,518 Tanzania ........... 151 276 324 832 1,135 Zambia ............ 850 986 826 916 808 Thailand ........... 582 687 912 877 765 Pakistan ........... 622 248 437 1,805 648 India .............. 95 215 242 181 644 Germany ........... 921 575 1,188 357 554 Hong Kong ......... 1,895 782 1, 191 865 481 Venezuela .......... 242 0 9 0 456 All other ........... 5,091 4,916 6,387 4,818 3,063
Total .......... 44,186 41,589 38,733 44,480 49,257
Natural colored gemstones, cut:
Thailand ........... 168,549 138,750 126,258 149,453 ' 115,748 Colombia .......... 51,552 92,664 119,626 90,021 94,272 India .............. 31,724 24,974 37,353 52,769 66,370 Switzerland ......... 56,580 77,199 48,138 55,361 57,442 Hong Kong ......... 35,295 40,047 47,282 43,234 43, 175 Israel 0 0 o o o o I 0 0 o o o o 26,680 29,384 36,693 31,759 34,578 Germany ........... 19,768 22,397 18,296 24,862 18,467 Brazil o o a 0 0 0 o o 0 0 I 0 o 20,800 18, 182 14,899 17,223 17,164 Sri Lanka (Ceylon) .... 6,062 5,683 6,267 9,808 13,077 Belgium o 0 0 0 I 0 0 I 0 0 0 5,314 2,536 3,624 5,523 5,747 United Kingdom ...... 7,400 6,327 3,990 8,166 5,486 France ............ 5,352 6,024 2,707 2,619 5,300 All other ........... 21,325 17,579 35,497 32,456 27,041
Total .......... 456,401 481,746 500,630 523,254 503,867
Table continues on next page.
B-5

Table B-2-Continued Natural colored gemstones: value of U.S. imports for consumption by principal source, 1991-95
Average unit value of certain natural colored gemstones, cut: Source 1991 1992 1993 1994 1995
Quantity (carats)
Rubies ........... 2,377,971 2,634,945 3,604,363 4,862,006 4,182,463 Sapphires ......... 3,501,548 4,610,906 5,129,783 7,064,167 6,778,018 Emeralds .......... 3,939,305 2,955,906 5,452,141 5,671,293 7,317,983
Total ........... 9,818,824 10,201,757 14,186,287 17,597,466 18,278,464
Value (1,000 dollars)
Rubies ........... 70,855 77,941 90,617 95,886 84,420 Sapphires ......... 81,620 75,118 79,317 100,902 83,823 Emeralds .......... 165,508 2131497 2441356 227,230 236,038
Total ........... 317,983 366,556 414,290 424,018 404,281
Average unit l!rice (dollars e,er carat)
Rubies ........... 30 30 25 20 20 Sapphires ......... 23 16 15 14 12 Emeralds .......... 42 72 45 40 32
Total ........... 32 36 29 24 22
Average unit value of certain natural colored gemstones, unworked:
Quantity (carats)
Unworked ......... 338,300,443 408,236,447 558,899,682 971,437,017 1,420,946,445 Other ............ 429,475 280,928 174,551 157,059 107,690,955
Total ........... 338,729,918 408,517,375 559,074,233 971,594,076 1,528,637 ,400
Value(7 ,000 dollars)
Unworked ......... 43,825 41,446 38,378 44,102 48,575 Other ............ 361 143 355 377 682
Total ........... 44,186 41,589 38,733 44,479 49,257
Average Unit Price (dollars per carat)
Unworked ......... $0.13 $0.10 $0.07 $0.05 $0.03 Other ............ $0.84 $0.51 $2.03 $2.40 $0.01
Total ........... $0.13 $0.10 $0.07 $0.05 $0.03
1 Data for imports from Russia were not reported separate of the Soviet Union in 1991 and covers only Feb. through Dec., 1992; data for 1993-95 are full-year figures.
Source: Compiled from official statistics of the U.S. Department of Commerce.
B-6

Table B-3 Pearls: value of U.S. imports for consumption by principal source, 1991-95
(1,000 dollars)
Source 1991 1992 1993 1994 1995
Pearls: all products
Japan ............ 55,600 32,917 31,690 42,083 47,627 Australia .......... 3,472 4,760 5,835 8,578 11,708 Hong Kong e e I I I I I I 4,888 4,071 6,515 8,120 10,852 French Polynesia .... 3,345 5,915 5,130 9,020 10,054 China ............ 201 336 770 1,827 3,734 Switzerland ........ 732 823 1,282 574 1,067 Indonesia 0 I I I I I I I I 885 488 70 27 917 India ............. 1,040 803 1,025 657 575 United Kingdom ..... 298 172 58 93 443 Taiwan ........... 131 253 126 36 334 All other .......... 516 716 594 1,061 840
Total .......... 71,108 51,254 53,095 72,076 88, 151
Pearls, natural:
India ............. 1,004 775 951 616 532 French Polynesia .... 233 598 59 8 511 Switzerland ........ 238 63 395 17 454 Hong Kong ........ 538 457 248 381 304 Australia .......... 374 288 198 34 217 Japan ............ 342 122 342 115 205 United Kingdom ..... 151 107 23 39 179 Italy ............. 0 16 10 5 39 Argentina I I I I I I I I I 0 0 0 0 37 China ............ 5 17 31 92 23 All other .......... 955 196 44 78 13
Total I I I 0 I I 0 0 I I 3,840 2,639 2,301 1,385 2,514
Cultured pearls, unworked:
Japan ............ 8, 131 8,729 9,187 9,743 10,043 French Polynesia .... 1,985 4,286 4,015 6,273 7,378 Hong Kong I I I I 0 0 I I 1,958 926 985 2,064 4,009 Australia .......... 539 828 907 1,349 2,328 China ............ 13 33 53 837 2,103 Indonesia I I I 0 I I I I I 0 16 7 0 261 Philippines I I 0 I I I I I 0 2 0 0 71 United Kingdom ..... 64 8 0 0 56 Cooks Islands I I 0 I I I 44 2 0 18 51 Switzerland ........ 269 93 185 266 28 All other .......... 116 29 89 79 53
Total .......... 13, 119 14,952 15,428 20,629 26,381
Table continues on next page.
B-7

Table B-3-Continued Pearls: value of U.S. imports for consumption by principal source, 1991-95
(1,000 dollars)
Source 1991 1992 1993 1994
Cultured pearls, worked:
Japan ............ 47,127 24,066 22, 162 32,224 Australia .......... 2,559 3,643 4,730 7,195 Hong Kong I I I I I I I I 2,393 2,688 5,282 5,675 French Polynesia .... 1, 127 1,032 1,055 2,739 China ............ 183 285 687 898 Indonesia I I I I I I I I I 0 472 63 27 Switzerland ........ 225 667 702 291 Taiwan ........... 108 252 107 18 United Kingdom ..... 83 57 35 54 Cooks Islands I I I I I I 0 9 24 668 All other .......... 344 492 519 273
Total .......... 54,149 33,663 35,366 50,062 Source: Compiled from official statistics of the U.S. Department of Commerce.
B-8
1995
37,379 9,162 6,539 2,165 1,608
656 585 328 208 136 490
59,256

Table B-4 Synthetic and reconstructed gemstones: value of U.S. imports for consumption by principal source, 1991-95
(1,000 dollars)
Source 1991 1992 1993 1994 1995
Synthetic and reconstructed gemstones, all products:
Germany ........... 9,004 10,206 10,777 11,004 11,084 Japan ............. 765 1,781 3,474 5,145 8,177 Thailand ........... 16,206 23,365 12,703 10,061 8,041 Austria ............ 3,414 6,310 3,746 5,050 6,257 Switzerland ......... 3,531 5,309 4,571 4,231 5,033 China ............. 220 517 813 976 3,053 Korea, South ........ 4,880 4,271 2,164 1,498 1,634 Hong Kong ......... 1,647 2,934 2,137 1,985 1,493 Italy .............. 36 3 390 705 1, 121 Australia .....•..... 475 1,906 3,379 2,720 1, 121 All other ........... 5 154 4,108 3,724 5,185 6,840
Total ........... 45,332 60,710 47,878 48,560 53,854
Synthetic and reconstructed gemstones, unworked:
Switzerland ......... 694 639 556 649 542 Canada ............ 7 0 0 5 248 Ireland ............ 460 89 55 157 90 Thailand ........... 2 0 30 4 81 China ............. 2 40 13 8 59 France ............ 111 78 46 74 56 India .............. 45 23 15 58 52 Hong Kong ......... 4 14 20 41 49 Germany ........... 208 52 7 24 47 Brazil ............. 7 1 14 12 24 All other ........... 42 177 136 76 88
Total ........... 1,582 1, 113 892 1,108 1,336
Synthetic and reconstructed gemstones.cut and suitable for jewelry:
Germany ........... 8,725 10,052 10,735 10,944 10,958 Thailand ........... 16,034 23, 161 12,506 9,821 7,911 Austria ............ 3,414 6,310 3,746 5,046 6,251 Switzerland ......... 2,823 4,614 3,837 3,528 4,434 China ............. 142 430 739 908 2,828 Hong Kong ......... 1,607 2,870 1,993 1,887 1,393 Korea, South ........ 4,861 4,231 2,143 1,470 1,360 Australia ........... 455 1,906 3,379 2,720 1, 117 Italy .............. 33 2 380 688 1, 116 France O O O O O 0 0 0 I I 0 0 1,908 1,378 1,027 999 1,008 All other ........... 2,818 2,996 3,622 2,943 2,802
Total ........... 42,820 57,950 44,107 40,954 41,178
Table continues on next page.
B-9
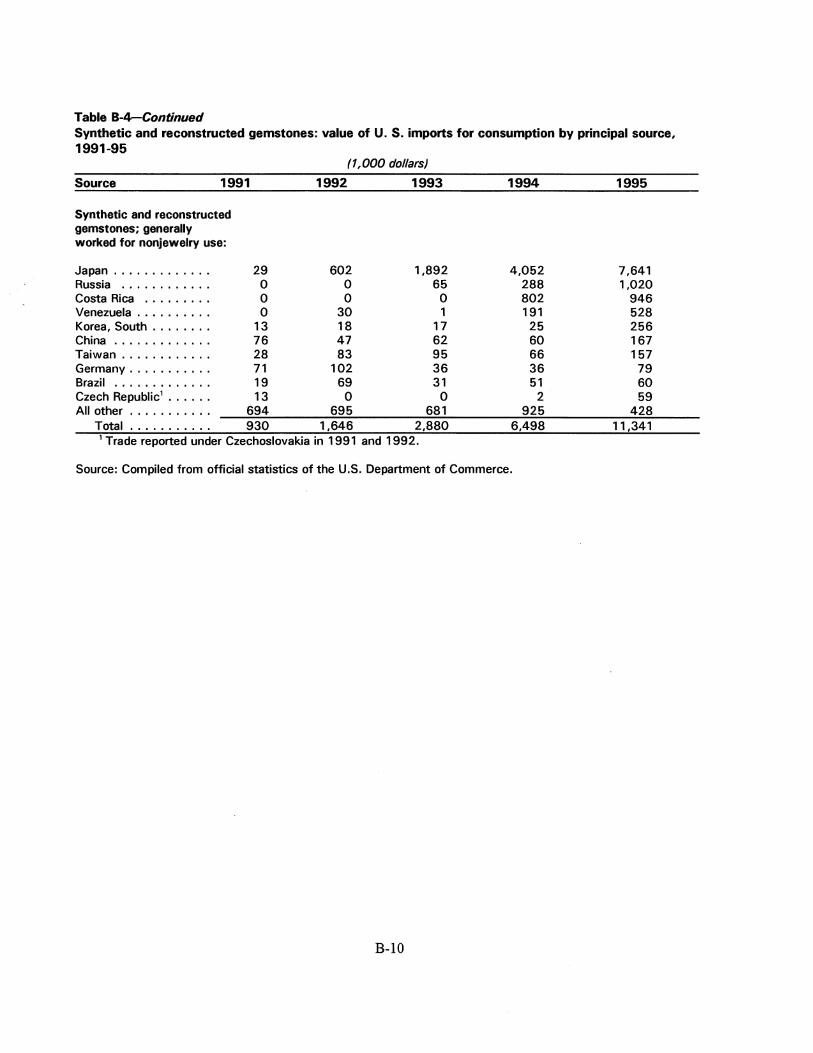
Table B-4-Continued Synthetic and reconstructed gemstones: value of U.S. imports for consumption by principal source, 1991-95
(1,000 dollars)
Source 1991 1992 1993 1994 1995
Synthetic and reconstructed gemstones; generally worked for nonjewelry use:
Japan ............. 29 602 1,892 4,052 7,641 Russia ............ 0 0 65 288 1,020 Costa Rica ......... 0 0 0 802 946 Venezuela .......... 0 30 1 191 528 Korea, South ........ 13 18 17 25 256 China ............. 76 47 62 60 167 Taiwan ............ 28 83 95 66 157 Germany ........... 71 102 36 36 79 Brazil 0 0 0 I I 0 0 0 I 0 0 0 I 19 69 31 51 60 Czech Republic1 •••••• 13 0 0 2 59 All other ........... 694 695 681 925 428
Total ........... 930 1,646 2,880 6,498 11,341 1 Trade reported under Czechoslovakia in 1991 and 1992.
Source: Compiled from official statistics of the U.S. Department of Commerce.
B-10

APPENDIXC DOMESTIC EXPORTS

Table C-1 Natural diamonds: U.S. exports of domestic merchandise to major markets, 1991-95
Natural diamonds, unworked and cut: Markets 1991 1992 1993 1994 1995
Quantity (carats)
Switzerland ........... 9,887 30,075 11,397 15,862 15,985 Hong Kong ........... 13, 119 55,930 16, 141 5,698 43.453 Canada .............. 294,252 398,128 199,310 223,519 78,698 Japan ............... 24,198 22, 123 11,845 5,419 34,390 France .............. 4,656 4,658 4,330 2,110 1,280 United Kingdom ........ 8,301 6,028 3,109 3,545 541 India ................ 21,717 82,023 11,086 16,097 19,962 Singapore ............ 3,566 4,799 3,136 1,012 5,824 Netherlands o 0 I 0 0 0 I 0 0 I 1,270 2,451 1,399 3,985 2.425 Belgium o o 0 Io 0 0 I I 0 0 I• 200,604 234,095 7,059 16,741 4,014 All others ............ 35,941 29,157 113,094 71,566 101,867
Total ............ 630,927 945.462 389,883 378,106 327,860
Value (1,000 dollars)
Switzerland ........... 69,277 84,882 68,876 91,256 57,545 Hong Kong 0 Io 0 o 0 o e 0 o o 23,586 50,824 8,149 8,204 32,851 Canada .............. 29,702 27,855 29,967 41,094 23,612 Japan ............... 6,658 13,707 13,475 9,490 23,006 France .............. 14,348 18,299 4,471 13,294 7,742 United Kingdom ........ 21,586 32.469 3,371 965 7,237 India ................ 1,943 6,329 1,589 1,574 3,163 Singapore ............ 4,730 4,696 2,518 1, 171 2,698 Netherlands .......... 5,501 8,543 3,506 2,462 2,350 Belgium ............. 15,099 64, 157 2,748 2,366 1.468 All others 0 0 e 0 0 I 0 0 0 0 I 0 16,769 55,717 14,202 11,341 9.461
Total ............ 209,199 367,478 152,872 183,217 171, 133
Average unit value (dollars per carat)
Switzerland ........... 7,007 2,822 6,043 5,753 3,600 Hong Kong 0 a 0 0 I 0 0 0 0 0 0 1,798 909 505 1.440 756 Canada .............. 101 70 150 184 300 Japan ............... 275 620 1, 138 1,751 669 France .............. 3,082 3,929 1,033 6,300 6,048 United Kingdom ........ 2,600 5,386 1,084 272 13,377 India ................ 89 77 143 98 158 Singapore ............ 1,326 979 803 1,157 463 Netherlands .......... 4,331 3.486 2,506 618 969 Belgium 0 I I 0 0 0 0 0 0 I 0 0 I 75 274 389 141 366 All others I 0 0 0 0 0 0 a 0 0 I I 467 1,911 126 158 93
Total ............ 332 389 392 485 522
Table continues on next page.
C-2
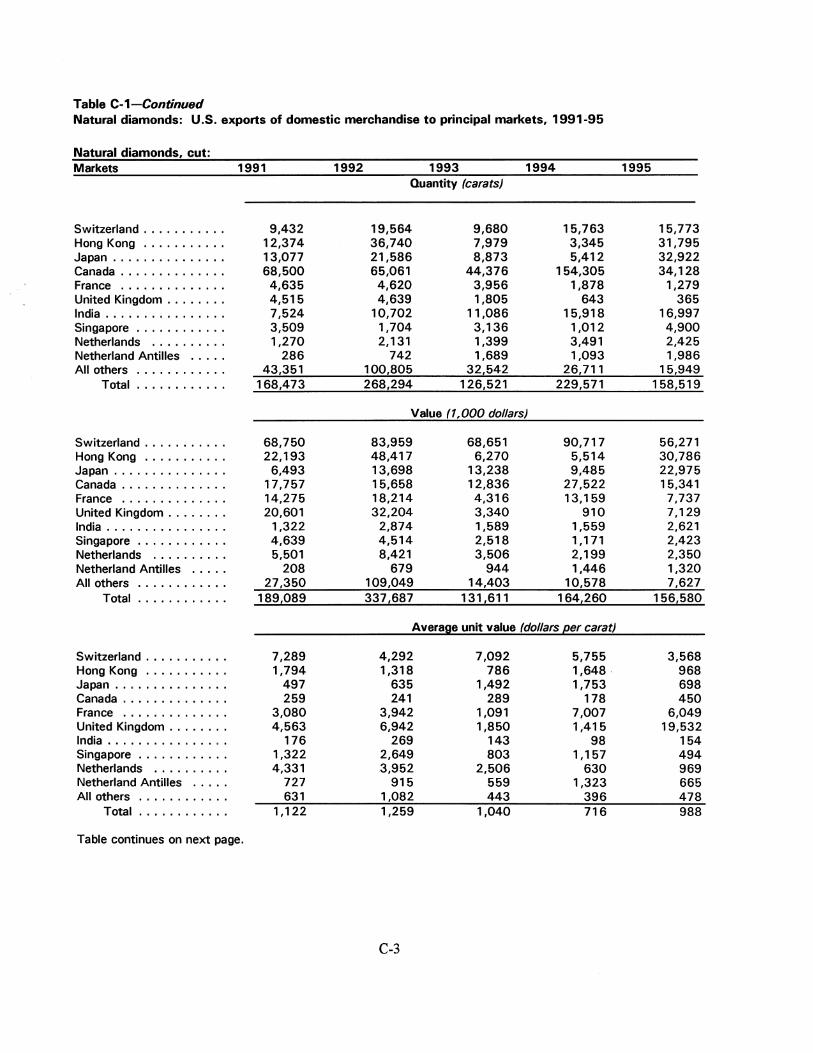
Table C-1-Continued Natural diamonds: U.S. exports of domestic merchandise to principal markets. 1991-95
Natural diamonds, cut: Markets 1991 1992 1993 1994 1995
Quantity (carats)
Switzerland ........... 9,432 19,564 9,680 15,763 15,773 Hong Kong e I I I I I I I I I I 12,374 36,740 7,979 3,345 31,795 Japan ............... 13,077 21,586 8,873 5,412 32,922 Canada .............. 68,500 65,061 44,376 154,305 34,128 France I I I I I I 0 I I I 0 I I I 4,635 4,620 3,956 1,878 1,279 United Kingdom ........ 4,515 4,639 1,805 643 365 India ................ 7,524 10,702 11,086 15,918 16,997 Singapore ............ 3,509 1,704 3,136 1,012 4,900 Netherlands I I I I I I I I I I 1,270 2,131 1,399 3,491 2,425 Netherland Antilles I 0 I I 0 286 742 1,689 1,093 1,986 All others I I 0 I I I 0 0 I I I I 43,351 100,805 32,542 26,711 15,949
Total ............ 168,473 268,294 126,521 229,571 158,519
Value (1,000 dollars)
Switzerland ........... 68,750 83,959 68,651 90,717 56,271 Hong Kong O I I I I I I I 0 I I 22.193 48,417 6,270 5,514 30,786 Japan ............... 6,493 13,698 13,238 9,485 22,975 Canada .............. 17,757 15,658 12,836 27,522 15,341 France I I I I 0 I I I I I I I I I 14,275 18.214 4,316 13, 159 7,737 United Kingdom ........ 20,601 32,204 3,340 910 7,129 India ................ 1,322 2,874 1,589 1,559 2,621 Singapore ............ 4,639 4,514 2,518 1, 171 2,423 Netherlands o I I 0 o I I 0 I I 5,501 8,421 3,506 2,199 2,350 Netherland Antilles I 0 I I I 208 679 944 1,446 1,320 All others I I I I I I I I I I I 0 27,350 109,049 14,403 10,578 7,627
Total ............ 189,089 337,687 131,611 164,260 156,580
Average unit value (dollars e.er carat)
Switzerland ........... 7,289 4,292 7,092 5,755 3,568 Hong Kong I 0 I I 0 I I I I I I 1,794 1,318 786 1,648' 968 Japan ............... 497 635 1,492 1,753 698 Canada .............. 259 241 289 178 450 France I 0 0 I I I I I I I I I I I 3,080 3,942 1,091 7,007 6,049 United Kingdom ........ 4,563 6,942 1,850 1,415 19,532 India ................ 176 269 143 98 154 Singapore ............ 1,322 2,649 803 1, 157 494 Netherlands I I I I I I 0 I I 0 4,331 3,952 2,506 630 969 Netherland Antilles 0 I I I I 727 915 559 1,323 665 All others I I I 0 I 0 I I I 0 0 I 631 1,082 443 396 478
Total ............ 1, 122 1,259 1,040 716 988
Table continues on next page.
C-3

Table C-1-Continusd Natural diamonds: U.S. exports of domestic merchandise to major markets, 1991-95
Natural diamonds, unworked: Markets 1991
Canada ............. . Hong Kong .......... . Switzerland .......... . India ............... . Austria ............. . Mauritius ........... . Singapore ........... . Lebanon ............ . Thailand ............ . Belgium ............ . All others ........... .
Total ........... .
Canada .............. Hong Kong •I I I I I I I I I I
Switzerland ........... India ................ Austria .............. Mauritius I I I I I I I I I I I I
Singapore ............ Lebanon I I I I I I I I I I I I I
Thailand I I I I I I I I I I I I I
Belgium I I I I I I I I I I I I I
All others I I I I I I I I I I I I
Total I I I I I I I I I I I I
Canada .............. Hong Kong I I I I I I I I I I I
Switzerland ........... India ................ Austria .............. Mauritius I I I I I I I I I I I I
Singapore ............ Lebanon I I I I I I I I I I I I I
Thailand I I I I I I I I I I I I I
Belgium I I I I I I I I I I I I I
All others I I I I I I I I I I I I
Total I I I I I I I I I I I I
225,752 745 455
14,193 0 0
57 0
3,282 175,586 42,384
462,454
11,945 1,393
527 621
0 0
91 0
115 3,318 2,100
20, 110
53 1,870 1,158
44 N/A N/A
1,596 N/A 35 19 50 43
1992 1993
Quantity (carats)
333,067 19, 190 10,511 71,321
0 0
3,095 0
358 187,958
51,668 677, 168
154,934 8,162 1,717
0 0
122 0 0
358 1,494
96,575 263,362
1994
Value (1,000 dollars)
12, 197 17,130 2,407 1,879
924 225 3,455 0
0 0 0 74
182 0 0 0 9 6
9,339 195 1,279 1,752
29,792 21,261
69,214 2,353
99 179
0 0 0 0 0
12,705 63,985
148,535
13,572 2,690
539 15 0 0 0 0 0
204 1,936
18,956
Average unit value (dollars e_er carat)
37 111 196 125 230 1,143 88 131 5,444 48 N/A 84
N/A N/A N/A N/A 607 N/A
59 N/A N/A N/A N/A N/A
25 17 N/A 50 131 16 25 18 30 44 81 128
Source: Compiled from official statistics of the U.S. Department of Commerce.
C-4
1995
44,570 11,658
212 2,965
72,770 371 924 358
8,703 2,230
24,580 169,341
8,271 2,064 1,274
542 414 278 275 224 176 158 878
14,554
186 177
6,009 183
6 749 298 626
20 71 36 86

Table C-2 Natural colored gemstones: value of U.S. exports of domestic merchandise to major markets, 1991-95
(1,000 dollars) Markets 1991 1992 1993 1994 1995
Natural colored gemstones, unworked and cut:
India ..................... 6,788 4,283 12,746 12,617 16,383 Hong Kong • e e e I I I I I I I I I I I I 12,520 14,242 9,040 10,510 11,227 Switzerland ................ 9,318 8,852 8,306 7,691 8,279 Canada ................... 4,596 4,837 7,155 10,635 8,185 Germany .................. 1,863 2,253 2,279 1,543 6,494 Japan .................... 8,975 3,373 2, 191 1,497 1,857 Thailand I I I I I I I I I I I I I I I I I I 28,858 26,274 3,754 1,741 1,574 Korea, South ............... 2,043 684 391 362 1,200 Israel I I I I I I I I I I I I I I I 0 IO O O 1,316 1,691 121 87 1,094 France I I I I I I I I I I I I I I I 0 I I I 1,942 2,201 2,920 2,316 937 All others I 0 I I I I I I I I I I I I I I I 9,504 12,890 7,998 7,057 5,411
Total ................. 87,723 81,580 56,901 56,056 62,641
Natural colored gemstones, unworked:
India ..................... 3,036 1,385 6,703 8,443 12,060 Hong Kong DI 0 0 I I I 0 0 I I I I I I I 1,786 2,544 2,365 1,393 2,623 Korea, South ............... 681 114 200 229 968 Israel I I I I I 0 I I I I 0 I I I I 0 0 0 I 0 4 27 50 3 887 Germany .................. 536 396 704 257 664 Canada ................... 531 712 716 1,014 635 Netherlands Antilles .......... 100 204 40 290 478 Thailand I I I 0 0 I I I I I I I I I 0 I I I 1,598 2,265 615 1,042 433 Singapore I IO I I IO I I IO I I I I I 0 29 4 6 74 428 United Kingdom ............. 251 321 111 399 283 All others I I I I 0 I I I I I I 0 I I I I I 2,270 1,908 2,398 1,425 2,202
Total I I I 0 I I I 0 I I I 0 0 0 0 0 I 10,822 9,880 13,908 14,569 21,661
Natural colored gemstones, cut:
Hong Kong I I 0 0 I I I I I I I I I I I I 10,733 11,697 6,675 9,118 8,605 Switzerland ................ 9,097 8,730 8,276 7,662 8,133 Canada ................... 4,065 4,125 6,440 9,621' 7,550 Germany .................. 1,326 1,857 1,575 1,286 5,830 India ..................... 3,752 2,897 6,043 4,174 4,324 Japan .................... 8,076 3,164 2,046 1,223 1,685 Thailand I I I I I I IO O I I I IO O I I I 27,260 24,009 3,138 699 1, 141 France I I I I 0 I I I I I I I 0 I I I I I I 1,899 2,157 2,873 2,307 818 United Kingdom ............. 1,363 1,727 737 321 564 Australia .................. 650 765 843 109 318 All others 0 I I I I I I I 0 I I 0 I I I I I 8,681 10,572 4,347 4,967 2,012
Total I I I 0 I I I 0 I I I I 0 I I 0 I 76,902 71,700 42,993 41,487 40,980 Source: Compiled from official statistics of the U.S. Department of Commerce.
C-5

Table C-3 Pearls: value of U.S. exports of domestic merchandise to major markets, 1991-95
(1,000 dollars) Markets 1991 1992 1993 1994 1995
Pearls, all products:
Canada ................... 640 298 514 371 595 Japan .................... 1,440 935 167 689 493 Hong Kong • •. 0 0 e e. I. I. e e e I 778 1,328 1,841 218 391 United Kingdom ............. 59 62 30 218 177 Paraguay I 0 • 0 • e I Io o •I 0 o I I I 0 5 0 17 138 Germany .................. 9 16 33 196 127 Singapore ................. 13 0 0 7 120 Korea, South ............... 15 238 0 5 112 Taiwan ................... 0 1,594 0 32 105 French Polynesia o o o o o o o o 0 o I I 0 0 0 30 90 All others ................. 634 1,216 460 119 392
Total 0 0 0 0 0 0 I 0 I 0 I 0 I I 0 0 0 3,588 5,692 3,045 1,902 2,740
Pearls, natural:
Canada ................... 76 32 27 35 362 Singapore 0 0 0 0 0 0 I 0 0 I I. 0 0 0 0 0 13 0 0 0 120 Switzerland ................ 54 125 0 0 67 Germany .................. 9 0 13 23 61 Italy 0 0 0 0 0 0 0 0 I e 0 0 e 0 • 0 I I 0 0 I 7 0 44 0 27 United Kingdom ............. 53 12 6 33 22 Brazil 0 0 0 0 0 I I 0 0 0 I 0 0 0 I e 0 I 0 0 5 0 0 0 12 Hong Kong 0 I 0 0 0 0 I 0 I I I I I I I 0 309 1,222 1,487 9 10 Japan .................... 1,280 659 16 0 8 Mexico ................... 41 38 0 0 7 All others 9 •I I 0 e I I 0 o Io o Io I I 201 715 22 14 19
Total O IO I e I I 0 0 I 0 D 0 I IO I 2,048 2,803 1,615 114 715
Cultured pearls, unworked:
Hong Kong 0 0 0 0 0 0 0 I I 0 0 0 0 0 0 0 325 39 91 44 78 Canada ................... 305 123 227 95 63 Spain 0 I 0 0 0 0 0 e I I e 0 I 0 O O I 0 I I 0 0 0 0 57 Japan .................... 0 31 135 76 53 Colombia 0 0 0 0 0 I I 0 0 I e I e e e I I 0 4 11 0 41 United Kingdom ............. 5 0 19 86 34 France a 0 I 0 0 0 I• 0 0 I I I e O I a I I 0 0 40 0 25 Peru 0 0 0 0 0 0 0 I I I 0 I 0 0 O O • 0 0 0 I 0 0 4 3 18 Germany .................. 0 3 0 173 18 Australia .................. 63 8 0 0 11 All others 0 IO 0 0 I 0 0 0 e I I I e I 0 I 60 1,733 294 67 26
Total 0 0 0 0 I 0 0 I 0 e I 0 I 0 e I I 758 1,941 821 544 424
Table continues on next page.
C-6
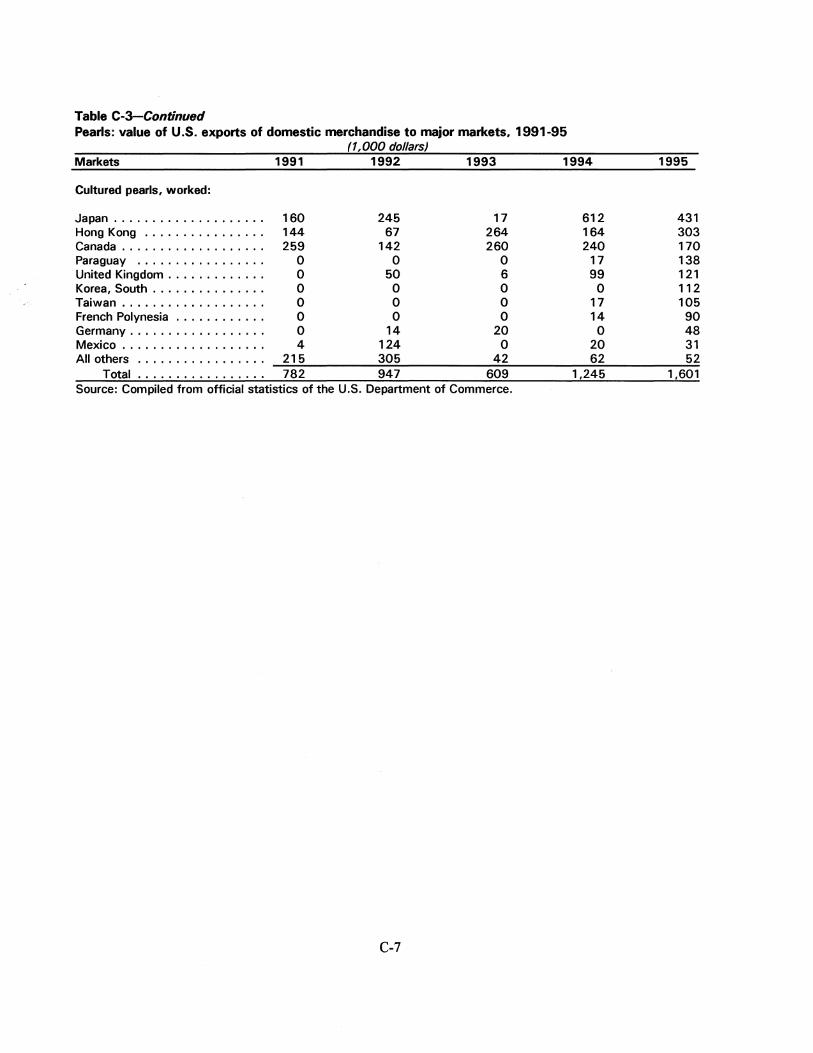
Table C-3-Continued Pearls: value of U.S. exports of domestic merchandise to major markets, 1991-95
(1,000 dollars} Markets 1991 1992 1993 1994
Cultured pearls, worked:
Japan .................... 160 245 17 612 Hong Kong I I I I I I I I I I I I I I I I 144 67 264 164 Canada ................... 259 142 260 240 Paraguay I I I I I I I I I I I I I I I I I 0 0 0 17 United Kingdom ............. 0 50 6 99 Korea, South ............... 0 0 0 0 Taiwan ................... 0 0 0 17 French Polynesia I I I I I I I I I I I I 0 0 0 14 Germany .................. 0 14 20 0 Mexico ................... 4 124 0 20 All others I I I I I I I I I I I I I I I I I 215 305 42 62
Total I I I I I I I I I I I I I I I I I 782 947 609 1,245 Source: Compiled from official statistics of the U.S. Department of Commerce.
C-7
1995
431 303 170 138 121 112 105 90 48 31 52
1,601

Table C-4 Synthetic and reconstructed gemstones: value of U.S. exports of domestic merchandise to major markets, 1991-95
(1,000 dollars) Markets 1991 1992 1993 1994 1995
Synthetic and reconstructed gemstones, all products:
Taiwan ................... 1,950 524 887 3.419 6,750 Germany .................. 487 1,124 979 2,364 3,768 Japan .................... 2,821 1,510 1,719 3,572 3,690 Mexico ................... 1.419 1,580 1,951 3,721 2,530 Canada ................... 1,152 1,035 652 759 2,155 Korea, South ............... 3,805 2,590 2,567 1,384 1,699 Malaysia .................. 2,336 2,545 1,578 1,225 1.496 Hong Kong ................ 693 1,376 1,651 2,095 1,289 United Kingdom ............. 715 533 766 970 1, 145 France ................... 458 307 415 442 1,027 All others 0 0 I I I 0 0 0 o 0 0 o I 0 I I I 8,083 7,652 5,219 7,269 5,932
Total ................. 23,919 20,776 18,384 27,220 31.481
Synthetic and reconstructed gemstones, unworked:
Japan .................... 1,262 1,099 1,212 2.451 2,733 Germany .................. 308 927 303 1,589 1,878 Malaysia .................. 2,336 2,529 1,559 1,216 1.496 Korea, South ............... 3,249 2,002 2,334 975 806 Austria ................... 2,255 3.464 945 1,259 647 Taiwan ................... 989 205 368 370 621 India ..................... 359 135 226 231 477 Hong Kong ................ 378 577 811 450 376 Rep. of S. Africa ............ 0 0 109 61 300 Netherlands ............... 503 11 109 93 297 All others 0 0 o 0 o o o o 0 o o o o o 0 I I 4,114 3,110 2,674 2.492 1,286
Total ................. 15,753 14,059 10,650 11, 187 10,917
Synthetic and reconstructed gemstones, cut and suitable for jewelry:
Mexico ................... 1, 196 1.453 1,725 3,511 2.438 Canada ................... 783 777 481 438 2,005 Korea, South ............... 129 248 84 286 536 Brazil o o o o o o o 0 o 0 0 0 I 0 0 0 0 0 0 0 0 0 0 110 369 Netherlands O 0 0 I 0 0 I I 0 0 0 0 0 0 0 0 0 0 0 331 United Kingdom ............. 127 63 22 145 246 Hong Kong 0 0 I 0 0 0 o o o o o o o o o o 33 65 40 92 193 Peru ..................... 0 0 0 72 114 Thailand 0 0 0 0 0 0 I 0 o o o o o o o o o o 15 55 25 46 83 Israel 0 0 I 0 I 0 0 0 0 0 o o o o o o o o 0 o 23 13 0 21 76 All others ................. 546 325 554 1,705 367
Total ................. 2,852 2,999 2,931 6.426 6,758
Table continues on next page.
C-8

Table C-4-Continued Synthetics and reconstructed gemstones: value of U.S. exports. of domesitc merchandise to major markets, 1991-95
(1,000 dollars) Markets 1991 1992 1993 1994 1995
Synthetic and reconstructed gemstones, suitable for nonjewelry use:
Taiwan ................... 818 165 373 3,024 6,067 Germany .................. 166 187 591 695 1,831 Japan •................... 1,303 411 506 1, 117 938 France e e e I I I I I I I I I I Io I I I I 275 234 375 417 905 United Kingdom ............. 505 215 205 432 762 Hong Kong I I I I 0 I I I 0 0 I I I I I I 281 735 800 1,552 720 Korea, South ............... 427 341 149 123 357 Costa Rica I I I I I I I 0 I I I I I I I I 0 0 10 279 306 China I I I I I I 0 I I I a 0 I I 0 I 0 I I 0 73 0 21 4 248 Ireland I I I I I I I I Io 0 I Io Io o I 0 27 0 123 49 238 All others I I I I I I I 0 I I I 0 I I I 0 0 1.439 1,430 1,649 1,914 1.434
Total ................. 5,314 3,718 4,802 9,606 13,806 Source: Compiled from official statistics of the U.S. Department of Commerce.
C-9


APPENDIXD RE-EXPORTS

Table D-1 Natural diamonds: re-exports of foreign merchandise to major markets, 1991-95
Natural diamonds, unworked and cut: Markets 1991 1992 1993 1994 1995
Quantity (carats)
Belgium 0 0 o 0 o o I I Io I Io 1,976,586 2,170,791 1,573,050 1,237,392 1,143,932 Israel 0 0 0 I 0 0 0 I 0 0 0 0 I I 0 355,746 295,063 501,862 624, 171 694,321 Hong Kong O I I I I I I I I 0 I 278,418 142,488 267,027 220,554 442,367 Japan ............... 101,062 58,830 83,553 49,632 116,868 Switzerland ........... 106,359 22,372 26,537 23,796 39,188 United Kingdom ........ 12,215 10,128 16,018 20,020 12,551 Singapore ............ 17,087 19,414 11,468 13,571 20,683 Thailand ............. 34,539 18,025 60,356 43,792 124,331 India ................ 153,986 217, 158 232,843 237,971 264,051 Russia1 •••••••••••••• N/A 0 0 4,654 9,925 All others I I I I I I I I I I I 0 43,491 50,659 96,146 124,363 179,615
Total 0 I I I 0 0 0 I I I 0 I 3,0791489 310041928 218681860 2,599,916 3,047,832
Value (1,000 dollars)
Belgium 0 0 0 I I I 0 I I I I I I 415,355 304,408 435,073 506,478 552,439 Israel I I I I I I I I I I I I 0 I I 266,372 238,562 327,028 433,424 520,012 Hong Kong I I I 0 I 0 I 0 I I I 246,794 261,692 327,089 396,766 403,623 Japan ............... 189,636 107,803 131,703 124,948 135,942 Switzerland ........... 80,376 61,476 91,565 100,291 126,903 United Kingdom ........ 16,907 19,279 41,698 64,915 57,514 Singapore ............ 22,726 26,214 33, 178 34,383 53,798 Thailand ............. 34,248 14,445 23,306 19, 191 32,014 India ................ 8,235 14,915 21,957 25,656 23,300 Russia1 •••••••••••••• N/A 0 0 6,740 23,054 All others ............ 31,761 33, 193 49,669 43,542 81,874
Total I I I 0 I I 0 I I I 0 I 1,312,410 1,081,987 1,482,266 1,756,334 2,010,473
Average unit value (dollars per carat)
Belgium I I I 0 I 0 I I I I I 0 I 210 140 277 409 483 Israel 0 I I I I I 0 I 0 0 I I 0 I I 749 809 652 694 749 Hong Kong O I I I I I I I I I I 886 1,837 1,225 1,799 912 Japan ............... 1,876 1,832 1,576 2,517 1, 163 Switzerland ........... 756 2,748 3,450 4,215 3,238 United Kingdom ........ 1,384 1,904 2,603 3,243 4,582 Singapore ............ 1,330 1,350 2,893 2,534 2,601 Thailand ............. 992 801 386 438 257-India ................ 53 69 94 108 88 Russia1 •••••••••••••• N/A 0 0 1,448 2,323 All others I I I I I I I I I I 0 0 730 655 517 350 456
Total I 0 0 I I 0 0 0 0 0 I I 426 360 517 676 660
Table continues on next page.
D-2

Table D-1-Continued Natural Diamonds: re-exports of foreign merchandise to major markets, 1991-95
Natural diamonds, cut: Markets 1991 1992 1993 1994 1995
Quantity (carats)
Israel I I I I I I I I I I I I I I I 252,673 198,845 312,718 386,122 493,351 Belgium I I I I I I I I I I I I I 294,436 219,668 297,379 306,620 585,506 Hong Kong ........... 105,847 106,176 208,949 185,398 423, 155 Japan ............... 93,298 53,869 62,313 49,606 116,854 Switzerland ........... 26,782 12,732 18,956 20,384 37,162 United Kingdom ........ 7,564 4,981 9,888 17,945 10,352 Singapore ............ 4,938 5,858 11,468 12,951 20,683 Thailand ............. 33,090 12,337 56,621 41,045 115,572 Russia1
I I I I I I I I I I I I I N/A 0 0 3,529 9,925 France I I I I I I I I I I I I I I 3,205 2,260 4,875· 8,971 22,457 All others I I I I I I I I I I I I 17,848 26,399 41,753 57,471 146,555
Total I I I I I I I I I I I I 839,681 6431125 1,0241920 1,090,042 1,9811572
Value (1,000 dollars)
Israel I I I I I I I I I I I I I I I 232,728 209,733 281,764 388, 183 477,327 Belgium I I I I I I I I I I I I I 320,718 252,796 338,164 400,212 461,488 Hong Kong I I I I I I I I I I I 244,035 261,102 324,955 393,188 401,994 Japan ............... 188,927 107,653 130,071 124,945 135,934 Switzerland ........... 74,464 61,281 91,435 98,854 124,774 United Kingdom ........ 16, 101 18,283 36,825 64,456 57,046 Singapore ............ 22,361 25,579 33,178 34,333 53,798 Thailand ............. 33,931 13,826 22,686 18,614 30,807 Russia1 •••••••••••••• N/A 0 0 6,717 23,054 France I I I I I I I I I I I I I I 8,012 6,240 6,037 13,572' 22,218 All others I I I I I I I I I I I I 20,837 26,810 44,183 30,978 64,982
Total I I I I I I I I I I I I 1, 162, 114 983,303 1,309,298 1,574,052 1,853,422
Average unit value (dollars per carat)
Israel I I I I I I I I I I I I I I I 921 1,055 901 1,005 968 Belgium I I I I I I I I I I I I I 1,089 1, 151 1, 137 1,305 788 Hong Kong I I I I I I I I I I I 2,306 2,459 1,555 2, 121 950 Japan ............... 2,025 1,998 2,087 2,519 1,163 Switzerland ........... 2,780 4,813 4,824 4,850 3,358 United Kingdom ........ 2,129 3,671 3,724 3,592 5,511 Singapore ............ 4,528 4,367 2,893 2,651 2,601 Thailand ............. 1,025 1, 121 401 454 267 Russia1 •••••••••••••• N/A 0 0 1,903 2,323 France I I I I I I I I I I I I I I 2,500 2,761 1,238 1,513 989 All others I I I I I I I I I I I I 1, 167 1,016 1,058 539 443
Total I I I I I I I I I I I I 1,384 1,529 1,277 1,444 935
Table continues on next page.
D-3

Table D-1-Continued Natural Diamonds: re-exports of foreign merchandise to major markets, 1991-95
Natural diamonds, unworked: Markets 1991 1992 1993 1994 1995
Quantit"{. (carats)
Belgium ............. 1,682,150 1,951, 123 1,275,671 930,772 558,426 Israel ............... 103,073 96,218 189,144 238,049 200,970 India ................ 149,897 206,544 217,936 223,080 185,272 Rep. of S. Africa ....... 1,363 2,331 7,084 20,695 12, 131 Mauritius I I I 0 0 0 o I 0 0 I I 2,190 7,611 16,466 19,532 14,713 Switzerland ........... 79,577 9,640 7,581 3,412 2,026 Canada .............. 6;580 5,778 30,535 14,979 12,601 Hong Kong ........... 172,571 36,312 58,078 35,156 19,212 Thailand ............. 1,449 5,688 3,735 2,747 8,759 Netherlands .......... 9,916 4,016 1, 103 23 4,009 All others ............ 31,042 36,542 36,607 21,429 48,141
Total ............ 2,239,808 2,361,803 1,843,940 1,509,874 1,066,260
Value (1,000 dollars)
Belgium 0 0 o Io 0 I 0 o o o 0 0 94,637 51,612 96,909 106,266 90,951 Israel 0 0 0 I 0 0 0 0 0 0 0 0 I 0 0 33,644 28,829 45,264 45,240 42,685 India ................ 4,848 8,597 14, 153 14,075 9,199 Rep. of S. Africa ....... 1,164 2,575 4,157 4,477 2,793 Mauritius 0 0 IO 0 0 0 O O 0 I 0 832 1,449 1,190 3,229 2,421 Switzerland ........... 5,912 195 130 1,437 2,130 Canada .............. 635 309 1, 196 2,057 1,697 Hong Kong o o o o o o I 0 o o o 2,759 590 2,134 3,578 1,629 Thailand ............. 317 619 620 577 1,207 Netherlands .......... 934 964 82 14 781 All others ............ 4,614 2,945 7,133 1,332 1,558
Total ............ 150,296 98,684 172,968 182,282 157,051
Average unit value (dollars eer carat)
Belgium ............. 56 26 76 114 163 Israel 0 0 0 0 0 0 0 0 0 0 I 0 0 0 I 326 300 239 190 212 India ................ 32 42 65 63 50 Rep. of S. Africa ....... 854 1,105 587 216 230 Mauritius ............ 380 190 72 165 165 Switzerland ........... 74 20 17 421 1,051 Canada .............. 97 53 39 137 135 Hong Kong ........... 16 16 37 102 85 Thailand ............. 219 109 166 210 138 Netherlands .......... 94 240 74 609 195 All others 0 I 0 0 0 o 0 o o o o o 149 81 195 62 32
Total ............ 67 42 94 121 147
1 Export data to Russia was not reported separate of the Soviet Union in 1991 and covers only Feb. through Dec. 1992; data for 1993-95 are full-year figures.
Source: Compiled from official statistics of the U.S. Department of Commerce.
D-4

Table D-2 Natural colored gemstones: value of re-exports of foreign merchandise to major markets, 1991-95
(1,000 dollars) Markets 1991 1992 1993 1994 1995
Natural colored gemstones, unworked and cut:
Hong Kong ................ India ..................... Israel .................... Switzerland ................ Thailand .................. Japan .................... France 0 0 Io 0 o o o o o o 0 0 0 0 0 o o 0
Germany .................. Belgium .................. United Kingdom ............. All others o o o o I 0 0 0 I 0 0 0 0 0 0 O O
11,375 15,064
2,321 10,978 40,091
4,544 1,657 1,730 5,376 4,395 41728
Total ................. 102,259
Natural colored gemstones, unworked:
India ..................... 13,883 Hong Kong I I 0 o o o o o o o O o o 0 I 0 910 Israel 0 0 0 0 0 IO o o o o o o o O o o I 0 0 49 Thailand I I I 0 O O O O O O O O O O O 0 0 O 939 Canada ................... 73 Germany .................. 70 Belgium 0 0 I 0 o o o o o o o o o o o 0 0 0 487 Korea, South ............... 49 Bahamas .................. 0 Switzerland ................ 0 All others ................. 639
Total 0 0 0 o o o o o 0 0 0 0 0 o I 0 0 17,099
Natural colored gemstones, cut:
16,650 37,693 14,211 13,661
5,590 16,568 12,755 24,298
7,062 13, 191 3,799 3,835 4,063 4,178 3,441 2,161 1,646 3,966 1,817 2,984 5,825 7,178
76,859 129,713
11,336 10,225 311 1,190
26 145 578 271
81 176 344 182
0 200 61 20
0 0 505 9 718 225
13,960 12,643
Hong Kong . . . . . . . . . . . . . . . . 10,465 16,339 36,502 Israel . . . . . . . . . . . . . . . . . . . . 2,273 5,564 16,424 Switzerland . . . . . . . . . . . . . . . . 10,978 12,250 24,289 India ..................... 1,181 2,875 3,436 Thailand . . . . . . . . . . . . . . . . . . 39, 151 6,484 12,920 Japan.................... 4,171 3,347 3,781 France . . . . . . . . . . . . . . . . . . . 1,657 4,063 4,079 Germany . . . . . . . . . . . . . . . . . . 1,659 3,097 1,980 Belgium . . . . . . . . . . . . . . . . . . 4,889 1,646 3,766 United Kingdom . . . . . . . . . . . . . 4,224 1,817 2,953 All others ................. 4,512 5,417 6,940
Total . . . . . . . . . . . . . . . . . 85, 160 62,899 117 ,070 Source: Compiled from official statistics of the U.S. Department of Commerce.
D-5
50,062 19,910 13,682 25, 108 19,304 4,302 1,972 2,931 4,019 3,857 8,206
153,353
15,676 2,339
43 30
120 185
0 36 57
180 286
18,952
47,723 13,639 24,929 4,234
19,274 4,274 1,955 2,746 4,019 3,852 7,756
134,401
40,885 40,537 21,653 20,763 17,934
6,882 6,618 5,438 4,590 3,596 9,526
178,422
20,765 4,451
387 283 137 120 83 51 42 33 45
26,397
36,434 21,266 20,730 19,772 17,650
6,878 6,618 5,318 4,507 3,596 9,256
152,025

Table D-3 Pearls: value of re-exports of foreign merchandise to major markets, 1991-95
(1,000 dollars) Markets 1991 1992 1993 1994 1995
Pearls, all products:
Hong Kong .............. 122 14 2,544 1,064 2,289 Switzerland .............. 429 455 904 1,076 1,701 Japan .................. 360 101 ,165 1,787 868 Canada ................. 195 111 67 100 215 Spain .................. 36 0 0 309 76 Israel .................. 6 79 88 34 75 France ................. 59 0 56 6 60 United Kingdom ........... 152 69 22 436 37 Italy ................... 0 28 0 0 33 Colombia ............... 0 0 0 0 25 All others ............... 67 205 424 434 61
Total . . . . . . . . . . . . . . . . 1,426 1,062 4,270 5,246 5,440
Natural pearls:
Hong Kong .............. 0 0 661 68 1, 186 Japan .................. 105 0 70 167 500 Switzerland .............. 296 42 379 87 336 United Kingdom ........... 134 69 22 350 34 Spain .................. 0 0 0 0 28 Belgium ................ 0 10 0 12 19 France ................. 59 0 6 0 17 Canada ................. 38 15 7 10 12 Israel .................. 6 79 52 34 5 All others ............... 39 89 105 174 1
Total ............... 677 304 1,302 902 2,138
Cultured pearls, unworked:
Switzerland .............. 109 133 526 820 909 Hong Kong .............. 17 10 1, 133 832 622 Canada ................. 47 37 55 59 88 Spain .................. 0 0 0 309 48 Japan .................. 245 52 0 1,447 46 Israel .................. 0 0 11 0 43 Italy ................... 0 3 0 0 33 France ................. 0 0 51 6 27 Bahamas ................ 0 0 0 0 17 India ................... 0 0 0 0 10 All others ............... 14 11 291 118 18
Total ............... 432 246 2,067 3,591 1,861
Table continues on next page.
D-6
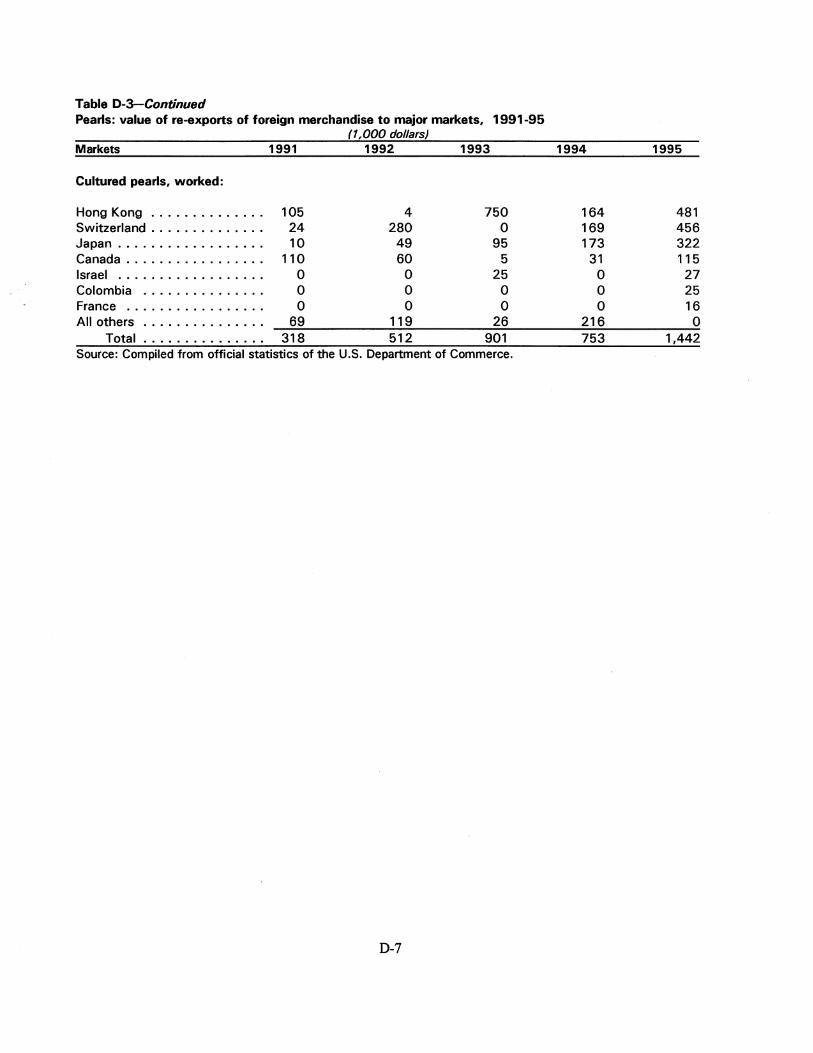
Table D-3-Continued Pearls: value of re-exports of foreign merchandise to major markets, 1991-95
(1,000 dollars) Markets 1991 1992 1993 1994
Cultured pearls, worked:
Hong Kong .............. 105 4 750 164 Switzerland .............. 24 280 0 169 Japan .................. 10 49 95 173 Canada ................. 110 60 5 31 Israel .................. 0 0 25 0 Colombia ............... 0 0 0 0 France ................. 0 0 0 0 All others ............... 69 119 26 216
Total ............... 318 512 901 753 Source: Compiled from official statistics of the U.S. Department of Commerce.
D-7
1995
481 456 322 115
27 25 16
0 1,442
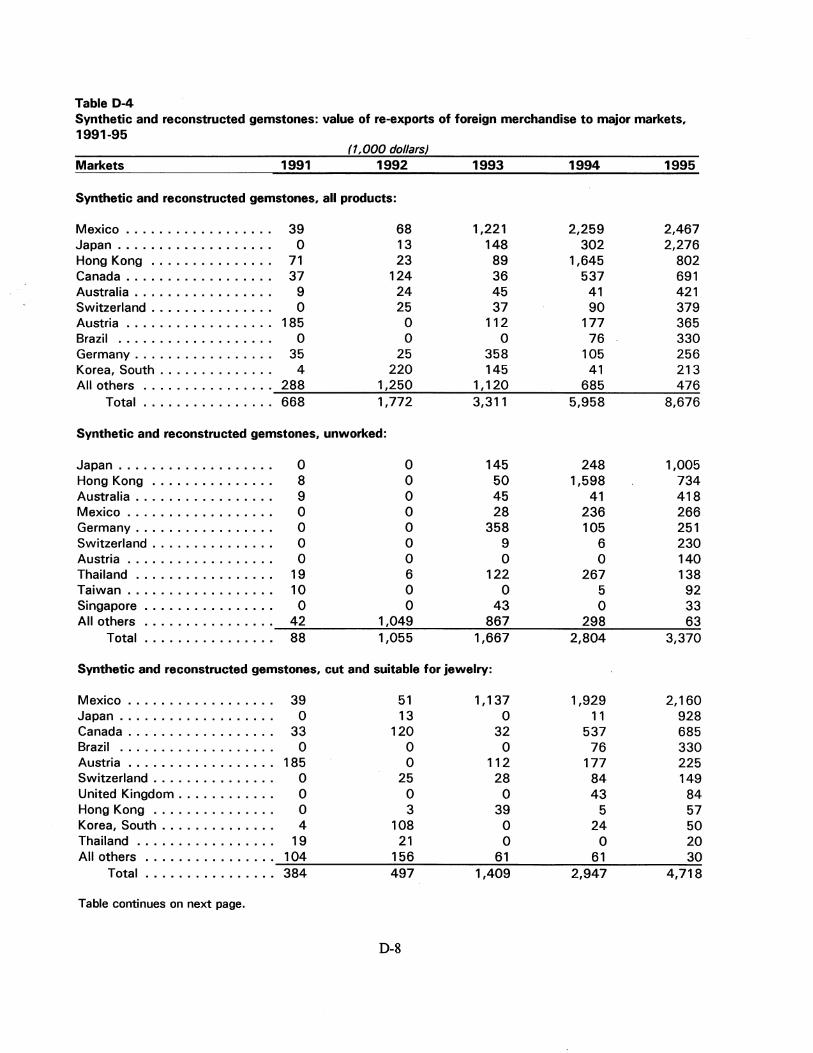
Table D-4 Synthetic and reconstructed gemstones: value of re-exports of foreign merchandise to major markets, 1991-95
(1,000 dollars) Markets 1991 1992 1993 1994 1995
Synthetic and reconstructed gemstones, all products:
Mexico .................. 39 68 1,221 2,259 2,467 Japan ................... 0 13 148 302 2,276 Hong Kong ............... 71 23 89 1,645 802 Canada .................. 37 124 36 537 691 Australia ................. 9 24 45 41 421 Switzerland ............... 0 25 37 90 379 Austria .................. 185 0 112 177 365 Brazil ................... 0 0 0 76 330 Germany ................. 35 25 358 105 256 Korea, South .............. 4 220 145 41 213 All others ................ 288 1,250 1, 120 685 476
Total ................ 668 1,772 3,311 5,958 8,676
Synthetic and reconstructed gemstones, unworked:
Japan ................... 0 0 145 248 1,005 Hong Kong ............... 8 0 50 1,598 734 Australia ................. 9 0 45 41 418 Mexico .................. 0 0 28 236 266 Germany ................. 0 0 358 105 251 Switzerland ............... 0 0 9 6 230 Austria .................. 0 0 0 0 140 Thailand ................. 19 6 122 267 138 Taiwan .................. 10 0 0 5 92 Singapore ................ 0 0 43 0 33 All others ................ 42 1,049 867 298 63
Total ................ 88 1,055 1,667 2,804 3,370
Synthetic and reconstructed gemstones, cut and suitable for jewelry:
Mexico .................. 39 51 1, 137 1,929 2,160 Japan ................... 0 13 0 11 928 Canada .................. 33 120 32 537 685 Brazil ................... 0 0 0 76 330 Austria .................. 185 0 112 177 225 Switzerland ............... 0 25 28 84 149 United Kingdom ............ 0 0 0 43 84 Hong Kong ............... 0 3 39 5 57 Korea, South .............. 4 108 0 24 50 Thailand ................. 19 21 0 0 20 All others ................ 104 156 61 61 30
Total ................ 384 497 1,409 2,947 4,718
Table continues on next page.
D-8

Table D-4-Continued Synthetic and reconstructed gemstones: value of re-exports of foreign merchandise to major markets, 1991-95
(1,000 dollars) Markets 1991 1992 1993 1994 1995
Synthetic and reconstructed gemstones, whether or not worked and suitable for non-jewelry use:
Japan ....................... 0 0 3 43 344 Korea, South .................. 0 101 34 14 157 Mexico ...................... 0 17 56 94 41 France ...................... 0 0 0 0 31 Hong Kong ................... 63 20 0 42 11 Germany ..................... 30 25 0 0 5 All others .................... 103 56 142 13 0
Total .................... 196 219 235 206 588 Source: Complied from official statistics of the U.S. Department of Commerce.
D-9


APPENDIXE TOTAL EXPORTS

Table E-1 Natural diamonds: U.S. exports of domestic and foreign merchandise to major markets, 1991-95
Natural diamonds, unworked and cut: Markets 1991
Belgium ............ . Israel .............. . Hong Kong .......... . Switzerland .......... . Japan .............. . United Kingdom ....... . Singapore ........... . Canada ............. . Thailand ............ . France ............. . All others ........... .
Total ........... .
Belgium ............ . Israel .............. . Hong Kong .......... . Switzerland .......... . Japan .............. . United Kingdom ....... . Singapore ........... . Canada ............. . Thailand ............ . France ............. . All others ........... .
Total ........... .
Belgium ............ . Israel .............. . Hong Kong .......... . Switzerland .......... . Japan .............. . United Kingdom ....... . Singapore ........... . Canada ............. . Thailand ............ . France ............. . All others ........... .
Total ........... .
Table continues on next page.
2,177,190 364,495 291,537 116,246 125,260
20,516 20,653
305,702 39,748
8,746 240,323
3,710,416
430,453 272, 116 270,380 149,653 196,295 38,493 27,455 32,073 39,705 23,708 41,278
1,521,609
198 747 927
1,287 1,567 1,876 1,329
105 999
2,711 172 410
1992 1993 1994 1995
Ouanity (carats)
2,404,886 1,580, 109 1,254,133 1, 147,946 335,521 507,048 629,634 695,964 198,418 283,168 226,252 485,820
52,447 37,934 39,658 55, 173 80,953 95,398 55,051 151,258 16, 156 19, 127 23,565 13,092 24,213 14,604 14,583 26,507
413,285 242,601 263,674 127,210 23,057 62,225 44,016 140,269
7,455 9,214 11,081 23,916 393,999 407,315 416,375 508,537
3,950,390 3,258,743 2,978,022 3,375,692
Value (1,000 dollars)
368,566 437,821 508,843 553,906 278,992 331,045 434,747 521,202 312,516 335,239 404,970 436,473 146,358 160,441 191,547 184,449 121,510 145, 178 134,437 158,947
51,747 45,069 65,880 64,751 30,909 ~5,696 35,554 56,496 30,730 33,582 46, 176 44,370 17, 135 25,034 19,386 32,792 25,207 10,519 26,866 30,457 65,795 75,514 71,145 97,763
1,449,465 1,635, 138 1,939,551 2, 181,606
Average unit value (dollars per carat)
153 277 406 483 832 653 690 749
1,575 1,184 1,790 898 2,791 4,229 4,830 3,343 1,501 1,522 2,442 1,051 3,203 2,356 2,796 4,946 1,277 2,444 2,438 2,131
74 138 175 349 743 ·402 440 234
3,381 1, 142 2,425 1,273 167 185 171 192 367 502 651 646
E-2

Table E-1-Continued Natural diamonds: U.S. exports of domestic and foreign merchandise to major markets, 1991-95
Natural diamonds, cut: Markets 1991 1992 1993 1994 1995
Ouantit~ (carats)
Israel • • 0 I I I I I I I a I I I I 257,704 239,184 317,893 389,200 493,889 Belgium ............. 319,454 265,805 302,944 310,656 587,290 Hong Kong ........... 118,221 142,916 216,928 188,743 454,950 Switzerland ........... 36,214 32,296 28,636 36,147 52,935 Japan ............... 106,375 75,455 71, 186 55,018 149,776 United Kingdom ........ 12,079 9,620 11,693 18,588 10,717 Singapore ............ 8,447 7,562 14,604 13,963 25,583 Canada .............. 73,370 74,440 57,132 179,481 70,039 Thailand ............. 35,017 17,011 58,132 41,269 122,807 France 0 I I I I I I I I I I I I I 7,840 6,880 8,811 10,849 23,736 All others I I I I I I I I I I I I 33,433 40,250 63,482 75,699 148,369
Total ............ 1,008,154 911,419 1, 151,441 1,319,613 2, 140,091
Value (1,000 dollars)
Israel 0 I I I I I I 0 I I I I I I I 238,086 250,145 285,768 389,477 478,478 Belgium I I I I I I I I I I I I 0 332,499 307,615 340,717 402,374 462,797 Hong Kong I I I I I I 8 I I I I 266,228 309,520 331,226 398,702 432,780 Switzerland ........... 143,214 145,240 160,086 189,570 181,045 Japan ............... 195,420 121,351 143,309 134,430 158,909 United Kingdom ........ 36,702 50,487 40,164 65,366 64, 175 Singapore ............ 27 30,093 35,696 35,504 56,221 Canada .............. 19,492 18,223 15,256 30,547 34,402 Thailand ............. 39,273 16,508 24,408 18,809 31,409 France I 0 0 I I I I I I I I I I I 22,287 24,455 10,353 26,732 29,956 All others 0 I I I I I I I I I I I 31,002 47,353 53,926 46,801 79,829
Total ............ 1,351,203 1,320,990 1,440,909 1,738,312 2,010,001
Average unit value (dollars e,er carat)
Israel I I I I I I I I I I 0 I I I 0 924 1,046 899 1,001 969 Belgium I I I I I 0 I I I I I I I 1,041 1, 157 1,125 1,295' 788 Hong Kong I I I I I I I I I 0 I 2,252 2,166 1,527 2,112 951 Switzerland ........... 3,955 4,497 5,590 5,244 3,420 Japan ............... 1,837 1,608 2,013 2,443 1,061 United Kingdom ........ 3,038 5,248 3,435 3,517 5,988 Singapore ............ 3,196 3,980 2,444 2,543 2,198 Canada .............. 266 245 267 170 491 Thailand ............. 1,122 970 420 456 256 France I 0 I I I I I I I I I I I I 2,843 3,555 1, 175 2,464 1,262 All others I I I I I 0 I 0 0 I I 0 927 1,176 849 618 538
Total ............ 1,340 1,449 1,251 1,317 939
Table continues on next page.
E-3

Table E-1-Continued Natural diamonds: U.S. exports of domestic and foreign merchandise to major markets, 1991-95
Natural diamonds, unworked: Markets 1991 1992 1993 1994 1995
Quantity (carats)
Belgium ............. 1,857,736 2, 139,081 1,277, 165 943,477 560,656 Israel 0 0 0 o 0 o o o o 0 0 0 0 0 I 106,791 96,337 189,155 240,434 202,075 Canada .............. 232,332 338,845 185,469 84,193 57,171 India ................ 164,090 277,865 217,936 223,259 188,237 Hong Kong ........... 173,316 55,502 66,240 37,509 30,870 Switzerland ........... 80,032 20, 151 9,298 3,511 2,238 Rep. of S. Africa ....... 1,769 2,500 14,802 21,798 13,234 Mauritius o o I 0 Io o o o o o o 2,190 7,611 16,588 19,532 15,084 Thailand ............. 4,731 6,046 4,093 2,747 17,462 Netherlands o o o o o 0 0 I 0 0 9,916 4,336 1,103 517 4,009 All others ............ 69,359 90,697 125,453 81,432 144,565
Total ............ 2,702,262 3,038,971 2,107,302 1,658,409 1,235,601
Value (1,000 dollars)
Belgium ............. 97,954 60,951 97,104 106,470 91,109 Israel ............... 34,030 28,847 45,276 45,270 42,724 Canada .............. 12,580 12,507 18,326 15,629 9,968 India ................ 5,469 12,052 14, 153 14,090 9,741 Hong Kong ........... 4,152 2,996 4,013 6,268 3,693 Switzerland ........... 6,440 1, 118 355 1,977 3,404 Rep. of S. Africa ....... 1,230 2,776 4,182 4,481 2,900 Mauritius o o o o o o 0 0 0 0 I 0 832 1,449 1,263 3,229 2,699 Thailand ............. 432 627 626 577 1,382 Netherlands o o o o 0 o 0 I 0 0 934 1,087 82 277 781 Alt others ............ 6,352 4,065 8,849 2,971 3,203
Total ............ 170,405 128,475 194,229 201,239 171,604
Average unit value (dollars e_er carat)
Belgium I 0 0 0 o o Io o o o o o 53 28 76 113 163 Israel ............... 319 299 239 188 211 Canada .............. 54 37 99 186 174 India ................ 33 43 65 63 52 Hong Kong I I 0 0 0 o o o o o o 24 54 61 167 120 Switzerland ........... 80 55 38 563 1,521 Rep. of S. Africa ....... 695 1, 110 283 206 219 Mauritius O O 0 0 I 0 0 I 0 0 0 o 380 190 76 165 179 Thailand ............. 91 104 153 210 79 Netherlands I I 0 0 Io o o o o 94 251 74 536 195 All others ............ 92 45 71 36 22
Total ............ 63 42 il2 121 139 Source: Compiled from official statistics of the U.S. Department of Commerce.
E-4

Table E-2 Natural colored gemstones: value of U.S. exports of domestic and foreign merchandise to major markets, 1991-95
(1,000 dollars) Markets 1991 1992 1993 1994 1995
Natural colored gemstones, unworked and cut:
India ..................... 21,852 18,494 26,407 32,527 56,921 Hong Kong •• 0 I I 0 I I I I I I I I I I 23,895 30,892 46,732 60,572 52, 113 Switzerland ................ 20,296 21,606 32,604 32,800 29,041 Israel I I I I I I I I I I I I I I I I I I I I 3,637 7,281 16,689 13,769 22,748 Thailand I I I I I I I I I I I I I I I I I I 68,949 33,336 16,945 21,044 19,507 Germany .................. 3,592 5,694 4,440 4,474 11,932 Canada ................... 5,737 6,459 8,550 12,300 9,793 Japan .................... 13,519 7,172 6,025 5,798 8,739 France I I I I I 0 I I I I I I I I I I I I I 3,599 6,264 7,098 4,288 7,555 Belgium I I I 0 0 I I I 0 I ID 0 0 0 I I I 6,121 3,796 4,862 4,154 4,625 All others I I 0 0 I I I I I I 0 I 0 I I I I 18,786 17,444 16,262 17,683 18,089
Total ................. 189,983 158,438 186,614 209,409 241,063
Natural colored gemstones unworked:
India ..................... 16,919 12,722 16,928 24, 119 32,825 Hong Kong I I I I 0 0 I I I I I I I I I I 2,696 2,855 3,555 3,732 7,074 Israel I I I I I I I I I I I I I I I I I I I I 52 53 195 46 1,274 Korea, South ............... 730 175 220 266 1,019 Germany .................. 606 739 885 442 784 Canada ................... 605 793 892 1, 135 772 Thailand .................. 2,538 2,843 887 1,072 716 Netherland Antilles .......... 100 204 40 292 478 Singapore ................. 29 70 9 85 428 United Kingdom ............. 422 321 141 403 283 All others I I I I I I I 0 I I I I I I I I I 3,224 3,065 2,800 1,929 2,405
Total ................. 27,921 23,840 26,552 33,521 48,058
Natural colored gemstones cut:
Hong Kong I I 0 0 I I I I I I I I I 0 I 0 21, 199 28,037 43,177 56,841 45,039 Switzerland ................ 20,075 20,980 32,565 32,59'1 28,863 India ..................... 4,933 5,772 9,479 8,408 24,096 Israel I I I I I I I I I I I I I I I I I I I I 3,584 7,227 16,494 13,723 21,473 Thailand I I 0 0 I I 0 I I I I I I I I I I I 66,411 30,493 16,058 19,972 18,792 Germany .................. 2,986 4,954 3,555 4,033 11, 148 Canada ................... 5,132 5,666 7,658 11, 165 9,021 Japan .................... 12,247 6,511 5,827 5,497 8,563 France I I I I I I I I I I I I I 0 I I I I I 3,556 6,220 6,952 4,262 7,436 Belgium I I I I I I I I I 0 I I I I I I I I 5,307 3,796 3,853 4,133 4,507 All others I I I I 0 I I I I I 0 0 0 0 I I I 16,632 14,943 14,445 15,263 14,067
Total ................. 162,062 134,599 160,063 175,888 193,005 Source: Compiled from official statistics of the U.S. Department of Commerce.
E-5

Table E-3 Pearls: value of U.S. exports of domestic and foreign merchandise to major markets, 1991-95
(1,000 dollrsJ Markets 1991 1992 1993 1994 1995
Pearls, all products:
Hong Kong o o o o o • o • o e O O o o I I I 900 1,342 4,385 1,281 2,680 Switzerland ................. 492 588 904 1, 111 1,767 Japan ..................... 1,800 1,035 333 2,475 1,361 Canada .................... 836 408 580 470 810 United Kingdom .............. 211 131 52 654 214 Paraguay .................. 0 5 0 17 138 Germany ................... 27 16 146 196 133
' Spain ..................... 46 0 0 309 132 Singapore o o o o o o o o o e o o o o o o I I 13 0 0 7 120 Korea,So~h ................ 15 334 70 5 112 All others 0 0 0 0 0 I 0 0 0 0 0 o 0 o o o o o 674 2,894 845 623 713
Total .................. 5,014 6,753 7,315 7,148 8,180
Pearls, natural:
Hong Kong 0 o o o o o o o 0 0 0 0 Io o o o 309 1,222 2,148 77 1, 196 Japan ..................... 1,385 659 86 167 509 Switzerland ................. 350 166 379 87 402 Canada .................... 115 46 34 46 374 Singapore 0 0 0 I 0 0 0 I 0 0 0 I I IO 0 O O 13 0 0 0 120 Germany ................... 27 0 26 23 61 United Kingdom .............. 188 81 28 382 56 Spain 0 0 I I 0 0 0 I 0 0 0 0 0 0 0 0 0 IO O O 0 0 0 0 28 Italy 0 0 0 0 0 0 0 0 I 0 I I 0 0 0 IO O O O O O 7 0 44 0 27 Belgium 0 0 I I 0 0 0 I 0 0 0 I 0 I 0 O O O O 0 40 0 15 19 All others 0 I 0 0 0 o 0 o 0 o o o 0 0 0 0 0 o 330 893 172 218 61
Total .................. 2,724 3,107 2,917 1,015 2,853
Pearls, unworked cultured:
Switzerland ................. 109 133 526 820 909 Hong Kong o o o 0 0 0 0 0 0 0 I 0 o o o o o 342 49 1,223 876 700 Canada .................... 352 160 282 154 150 Spain o o 0 0 0 I 0 0 o 0 o o o o o o I 0 I I 0 0 0 0 309 105 Japan ..................... 245 82 135 1,523 99 France 0 I I 0 0 0 I 0 0 0 0 0 o I 0 0 0 I 0 O 0 0 90 6 52 Israel ...................... 0 0 11 0 51 Colombia 0 o o o o o o o o o o o o o 0 0 I I 0 4 11 0 41 Italy I 0 0 0 8 0 0 0 0 I 0 o 0 o 0 o 0 0 0 0 I 0 0 10 139 13 37 United Kingdom .............. 5 0 19 162 37 All others 0 0 0 I 0 0 0 o 0 0 0 o I I 0 0 I 0 137 1,749 452 272 103
Total .................. 1,190 2,187 2,888 4,135 2,284
Table continues on next page.
E-6

Table E-3-Continued Pearls: value of US. exports of domestic and foreign merchandise to major markets, 1991-95
(1,000 dollars) Markets 1991 1992 1993 1994 1995
Cultured pearls, worked:
Hong Kong ................. 249 71 1,014 328 784 Japan ..................... 170 294 112 786 753 Switzerland ................. 33 289 0 204 456 Canada .................... 369 202 265 271 285 Paraguay O • e e e I I 0 •I I 0 o 0 0 0 0 0 0 0 0 17 138 United Kingdom .............. 18 50 6 110 121 Korea, South ................ 0 6 0 0 112 Taiwan .................... 0 0 3 39 105 French Polynesia o o o 0 o I 0 0 a o o o o 0 46 0 14 90 Germany ................... 0 14 20 0 48 All others .................. 261 487 90 229 151
Total .................. 1,100 1.459 1,510 1,998 3,043 Source: Compiled from official statistics of the U.S. Department of Commerce.
E-7

Table E-4 Synthetic and reconstructed gemstones: value of U.S. exports of domestic and foreign merchandise to major markets, 1991-95
(1,000 dollars) Markets 1991 1992 1993 1994 1995
Synthetic and reconstructed gemstones, all products:
Taiwan ................... 2,045 534 941 3,449 6,848 Japan .................... 2,821 1,524 1,867 3,875 5,966 Mexico ................... 1,458 1,649 3,172 5,981 4,996 Germany .................. 523 1,149 1,337 2,469 4,024 Canada ................... 1,188 1,159 688 1,297 2,846 Hong Kong ................ 764 1,399 1,740 3,740 2,091 Korea, South ............... 3,809 2,810 2,712 1,425 1,912 Malaysia .................. 2,336 2,548 1,578 1,225 1,496 United Kingdom ............. 726 570 1,251 1,210 1,236 Austria ................... 2,540 3,798 1,400 1,835 1,164 All others ................. 6,377 5,408 51009 6,672 7,578
Total ................. 24,587 22,548 21,695 33, 178 40, 157
Synthetic and reconstructed gemstones, unworked:
Japan .................... 1,262 1,099 1,357 2,699 3,738 Germany .................. 308 927 661 1,694 2,129 Malaysia .................. 2,336 2,529 1,559 1,216 1,496 Hong Kong ................ 387 577 861 2,048 1, 110 Korea, South ............... 3,249 2,013 2,446 978 813 Austria ................... 2,255 3,464 945 1,259 787 Taiwan ................... 999 205 368 375 713 India ..................... 359 135 262 242 477 Australia .................. 75 23 137 136 470 Switzerland ................ 695 778 479 213 385 All others ................. 3,916 3,364 3,242 3, 131 2,169
Total ................. 15,841 15,114 12,317 13,991 14,287
Synthetic and reconstructed gemstones cut and suitable for jewelry:
Mexico ................... 1,235 1,504 2,863 5,440 4,599 Canada ................... 815 898 513 975 2,690 Japan .................... 255 13 0 15 ' 946 Brazil 0 I 0 0 0 0 I I 0 o o o o o o o o o o 0 0 0 0 186 699 Korea, South ............... 133 356 84 310 586 Netherlands OD 0 0 0 0 0 0 I 0 0 I 0 0 0 0 0 0 0 331 United Kingdom ............. 127 63 22 188 329 Hong Kong o o o 0 o o 0 I 0 0 0 0 0 0 o o 33 68 78 98 250 Austria 0 IO O O O O O O O O O 0 I 0 0 I 0 O 194 0 112 355 225 Switzerland ................ 0 76 250 138 224 All others O O 0 I 0 I I 0 o o o o o a o o o 444 518 418 1,669 597
Total 0 O O O O O O 0 I I 0 I 0 0 0 0 0 3,236 3,496 4,340 9,374 11,476
Tabe continues on next page.
E-8

Table E-4-Continued Synthetic and reconstructed gemstones: value of U.S. exports of domestic and foreign merchandise to major markets, 1991-95
(1,000 dollars) Markets 1991 1992 1993 1994 1995
Synthetic and reconstructed gemstones, whether or not worked and suitable for nonjewelry use:
Taiwan ................... 818 645 406 3,034 6,067 Germany .................. 195 211 591 695 1,836 Japan .................... 1,303 411 509 1, 160 1,281 France ................... 275 234 375 417 936 United Kingdom ............. 512 252 288 432 762 Hong Kong ................ 344 755 800 1,594 731 Korea, South ............... 427 441 182 137 514 Costa Rica ................ 0 0 15 279 306 China .................... 73 0 21 4 248 Ireland ................... 76 0 123 49 238 All others ................. 1 487 1,469 1 727 2,012 1,476
Total ................. 5,510 3,938 5~037 9,813 14,395 Source: Compiled from official statistics of the U.S. Department of Commerce.
E-9
