industry aspects of takeovers and divestitures: evidence ... · industry aspects of takeovers and...
TRANSCRIPT
Industry aspects of takeovers and divestitures: Evidence from the UK
Ronan G. Powell *, Alfred Yawson
School of Banking and Finance, the UNSW, Sydney, NSW 2052, Australia
Abstract
This paper examines takeover and divestiture activity at the industry level for the
population of UK firms over the period 1986 to 2000. Consistent with US research, takeovers
and divestitures in the UK cluster both across industries and over time. The paper further
investigates whether broad economic shocks, industry-specific shocks (e.g., deregulation, foreign
competition, technology) and misvaluation explain takeover and divestiture clustering at the
industry level. The results provide strong evidence for broad shocks increasing (decreasing) the
likelihood of takeovers (divestitures). Industry-specific factors are less important, although for
takeovers, growth, free cash flow and the threat of foreign competition some significance.
Deregulation, on the other hand, is only significant for the late 1990s period. Further
investigation reveals that for some UK industries deregulated in the late 1980s (e.g., Electricity
and Water), takeover activity was prevented for up to 5 years after deregulation through the use
of the ‘golden share’ by the UK government.
JEL classification: G14; G34
Keywords: Corporate restructuring; Takeovers; Divestitures; Industry shocks; Deregulation
* Corresponding author: Tel.: +61-2-9385-4925; fax: +61-2-9385-6347. E-mail address: [email protected]
2
1. Introduction
Takeovers and divestitures have played a key role in the restructuring of firms and
industries over the last century. Notable periods include the 1960s, characterized by large
conglomerate mergers, followed in the 1980s by hostile ‘bust-up’ takeovers. The last two
decades, in particular, have witnessed unprecedented takeover activity in both the US and the
UK, with many transactions setting new records in terms of value (see Andrade, Mitchell and
Stafford, 2001). While economists have advanced and tested many firm level theories (e.g.,
synergistic, managerial and diversification) in an attempt to explain takeover activity, no single
theory seems to fully explain why takeovers cluster over particular time periods (i.e., merger
waves) or across industries.
Recent papers have advocated a ‘market driven’ or misvaluation acquisitions theory to
explain the high levels of firm level takeover activity over certain decades (e.g., Shleifer and
Vishny, 2002; Ang and Cheng, 2002). The theory predicts that during periods of high stock
market values, firms are more likely to be misvalued, giving rise to opportunistic takeovers by
overvalued firms. Many of the stock financed transactions of the 1990s merger wave fit nicely
with the theory, with opportunistic managers timing deals to take advantage of highly inflated
stock. The theory also has some support from earlier periods, with contributions by Weston
(1953) and Nelson (1959) documenting a high correlation between security returns and merger
activity. While the theory explains many firm-level transactions during periods of high stock
market values, it has not, however, been applied to industry-level activity. Furthermore, some
observers note that the clustering of activity across industries is evidence of other factors playing
a role in explaining takeover activity (McGowan, 1971). Clearly, if takeover activity was
determined solely by misvaluation arising from periods of high stock prices, we should observe
3
higher activity across all industries. Evidence of significant industry clustering (e.g., Mitchell
and Mulherin, 1996) suggests that factors other than the rapid change in prices may be at play in
explaining clustering at the industry level.
Pioneering research by Coase (1937) on the nature of the firm provides some clues as to
the type of factors that should cause firms to change in size. For example, Coase (1937) argues
that technological advances allow firms to become more efficient in organizing activities in
diverse locations, thereby encouraging an increase in size. Gort (1969) argues that both rapid
changes in prices and technological changes are likely to cause valuation discrepancies between
bidding and target firms helping to induce merger activity. More recent research by Andrade,
Mitchell and Stafford (2001), Mulherin and Boone (2000) and Mitchell and Mulherin (1996)
point to additional factors or ‘shocks’ in explaining takeover activity, such as deregulation,
technological, energy price volatility and foreign competition. Since takeovers and divestitures
are mechanisms that facilitate a change in firm and industry size, industries sensitive to shocks
are likely to have higher frequencies of either or both transactions. Mitchell and Mulherin
(1996) argue that takeovers are probably the least-cost mechanism to alter firm and industry
structure.
This paper examines takeover and divestiture activity at the industry level in the UK over
the last two decades. The main focus of the paper is to test whether proxies for real market
factors (i.e., ‘shocks’) and misvaluation explain the level of takeover and divestiture activity over
time and across industries. Our paper differs from prior research in three important ways. The
first and second distinction relates to modeling. First, by modeling the real factor and
misvaluation theories simultaneously, we attempt to address the question of which theory (if any)
better explains activity. This approach also permits an examination of whether a correlation
4
exists between ‘shocks’ on the one hand, and misvaluation and subsequent activity on the other.
Clearly, factors other than an increase in prices may drive misvaluation, including some of the
factors or ‘shocks’ examined in this paper (e.g., deregulation, technological). Second, we
examine divestiture activity believing that a potential link exists between ‘shocks’, misvaluation
and divestiture activity. Prior empirical research (e.g., Mulherin and Boone, 2001) demonstrates
that divestitures, like takeovers, tend to cluster across industries. We therefore test whether
factors that cause firms to expand or consolidate through takeover, also influence the decision to
streamline operations through divestitures.
The third distinction relates to sample design. We model takeover and divestiture activity
using an industry panel dataset created by aggregating the ‘true’ population of UK firms into
their respective sectors each year, over the sample period 1986 to 2000. This approach allows us
to observe actual takeover and divestiture activity each year as a proportion of the true
population of firms each year. Prior studies (e.g., Mitchell and Mulherin, 1996) have favored the
more static approach, by keeping the population constant at the beginning of the sample period
and following the activity of only those firms observed at the beginning of the period. This
approach is likely to be biased, since it ignores newly listed firms, which arguably, may be more
vulnerable to activity.
Another distinction, although less significant, is that this paper uses a UK dataset. Prior
research is predominantly US based, with only one contribution by Schoenberg and Reeves
(1999) using UK data. The UK market, however, is similar to the US over the period examined.
For example, both countries experienced significant stock market booms in the 1980s and 1990s
and, furthermore, were impacted by similar shocks in the form of deregulation (financial and
utility industries), technological and broader shocks in oil prices, interest and exchange rates.
5
Using UK data allows for useful comparisons to be made with prior US research, e.g., Is
takeover and divestiture activity determined by similar factors?
The rest of the paper is organized as follows. Section 2 sets out the theoretical
underpinning of the paper. Section 3 explains the procedures followed in constructing the
sample. Section 4 presents some preliminary results for the level of corporate restructuring
across each industry over the sample period. Section 5 describes the model development and
discusses the choice of variables to proxy both broad and industry-specific shocks and
misvaluation. Section 6 presents some descriptive statistics and the results of the estimated
regressions. Section 7 concludes with a discussion and summary of the main results.
2. Theoretical background
The starting point for the study is Coase’s (1937) seminal analysis, ‘the nature of the
firm’. Coase provided a framework for defining the firm in terms of setting out the conditions or
forces that cause a firm to change in size. Coase (1937, p.393) asks, ‘Why does the entrepreneur
not organise one less or one more transaction?’ Coase argues that a firm will only expand
internally to the point when the marginal cost of the extra product is equal to the cost of
procuring the same product in the open market, which includes a competitor firm. Expansion
beyond this point would result in diminishing returns to scale since additional costs to facilitate
extra production would increase the marginal cost. However, assuming firms do not produce to
maximum capacity, gains, arising from lower marginal costs, will occur through the merger of
similar operations. Coase argues, however, that expansion beyond core activities will lead to
inefficiencies in terms of organising business activities in different locations. Inventions and
technological advancements that improve the efficiency of managing firms in diverse locations
6
are, therefore, likely to increase the size of the firm. Coase uses examples such as the telephone
and telegraph as inventions or technological advancements that allowed firms in different
locations to operate more efficiently. In today’s environment, clearly the fax, the personal
computer and internet (e.g., video conferencing, email) have allowed firms to operate in different
locations.
The idea that real environmental factors can have an impact on the size of the firm has
been discussed in later research by Gort (1969) and McGowan (1971). Gort (1969) advanced an
‘industry disturbance theory’ of mergers, in which real economic factors, such as rapid
technology changes, cause variations in the valuation of firms. Changes in valuation arise
because technological changes cause past earnings information to contribute less to future
predictions about earnings. That is, new products or processes cause a break from the past,
causing bidding firms to make errors in valuing potential targets. Clearly, this analysis could be
extended to any broad economic or industry-specific shock that causes a variation in the
valuation of firms, and hence, a higher likelihood of errors or discrepancies in valuing potential
targets.
Gort (1969) argues that rapid changes in share prices will also cause a break from the past
and cause increased merger activity. However, while both positive and negative movements in
prices will cause an increase in the dispersion of valuations, they will impact on merger rates in
opposite ways – high prices will lead to more activity, whereas low prices will lead to less
activity. Hence, valuation discrepancies that induce takeovers are more likely to occur in bull
markets.
The correlation between security returns and merger rates has been documented through
time (see, e.g., Nelson, 1959; Weston, 1953; and more recently, Shleifer and Vishny, 2003).
7
McGowan (1971) argues that high prices lead to disequilibria in equity markets; hence market
values fail to reflect true long-term profit opportunities, giving rise to under/over valued firms
and increased merger activity. More recent evidence at the firm level by Rhodes-Kropf and
Viswanathan (2003) and Shleifer and Vishny (2003) suggests that merger activity, particularly in
stock for stock mergers, is linked to misvaluations by bidder and targets firms. Basically,
overvalued acquiring firms use their overvalued stock to purchase assets cheaply. Shleifer and
Vishny (2003) posit that target managers accept overvalued bidder stock because they are self-
interested and ‘cash out’ their shares to generate private gains.
The strong association between merger activity and bull markets fails to explain the
clustering of takeover activity across industries. McGowan (1971) argues that this view only
emphasizes the role of generalized financial market considerations to external expansion rather
than conditions prevailing in the real markets in which firms operate. That is, in bull markets, all
firms could take advantage of merger opportunities, regardless of their industry, but yet, they fail
to do so as evident by significant industry clustering (Gort, 1969, Mitchell and Mulherin, 1996
and Mulherin and Boone, 2000). Clearly, other industry-specific factors are at work in
motivating takeovers, such as technological changes, oil price shocks, government regulation
changes. McGowan (1971) refers to these factors as real market conditions which firms through
merger are better able to adapt to. For example, through merger, firms can acquire new
technologies and highly specialized personnel. Merger also allows an increase in firm size
without adding to total industry capacity. Jensen (1993) further emphasizes the role of changes
in technology, input prices and deregulation in motivating restructuring activity during the
1980s. Andrade, Mitchell and Stafford (2001) show deregulation to be the single biggest factor
8
in explaining takeover activity in the 1990s. Jovanovic and Rousseau (2001, 2002) point to
technological changes inducing merger waves during the 1920s, the 1980s and 1990s.
The discussion so far has concentrated on merger activity. Following Coase’s (1937)
discussion, industry factors could also cause firms to decrease in size through divestitures.
Mulherin and Boone (2000) find that both takeovers and divestitures exhibit significant industry
clustering, indicating that industry-specific changes or shocks have a similar impact in that they
cause an increase in both activities. However, they do not examine the correlation between
specific industry shocks and the rate of divestitures, so it is unclear whether differences arise in
the rates of takeovers and divestitures to particular shocks. They do, however, find an
insignificant negative correlation between the rates of takeovers and divestitures, indicating that
both activities are induced by both common and dissimilar shocks.
3. Sample construction
To construct our industry panel dataset, we begin by identifying the population of UK
firms listed on the London Stock Exchange (hereafter, LSE) during the period 1986 to 2000.1 To
be classified as ‘live’ in a particular year, and be included in the population, all firms must have
financial data available from Datastream.2 Firms are classified according to Datastream’s level 6
classification scheme, which is similar to the US SIC 4 classification scheme. A total of 21,190
firm-years (average of 1,413 per year) are identified as ‘live’, representing a total of 90
industries. Note that the number of industries in any one year may change with the introduction
of new industries. For example, former utilities, such as water, electricity, plus newly
established industries such as internet, only emerged in the 1990s in the UK. We place two
further restrictions on the sample: (1) industries with less than 5 firms per year are excluded; and
9
(2) industries classified as property, investment institutions (e.g., asset managers, insurance
brokers) are removed. The final sample comprises of 71 industries or 880 industry-years.
Note that the sample construction differs from the static approach used by Mitchell and
Mulherin (1996) and Mitchell and Boone (2000). Both papers hold the number of firms in each
industry constant throughout the sample period so that takeover activity for an industry is
calculated the number of transactions over the sample period as a proportion of firms that existed
in the industry at the beginning of their sample period. This approach is likely to suffer from a
new listing bias, since newly listed firms are ignored. Takeover proportions are also likely to be
biased with a static approach if newly listed firms are more likely to be targets for takeover.
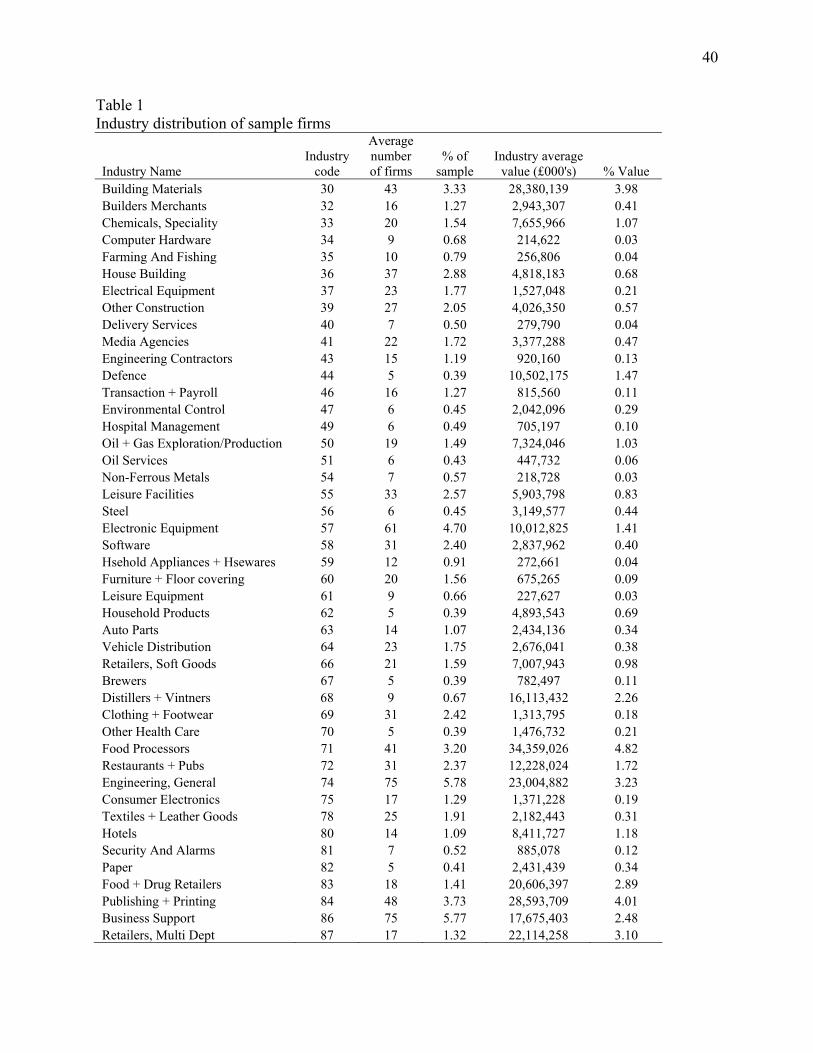
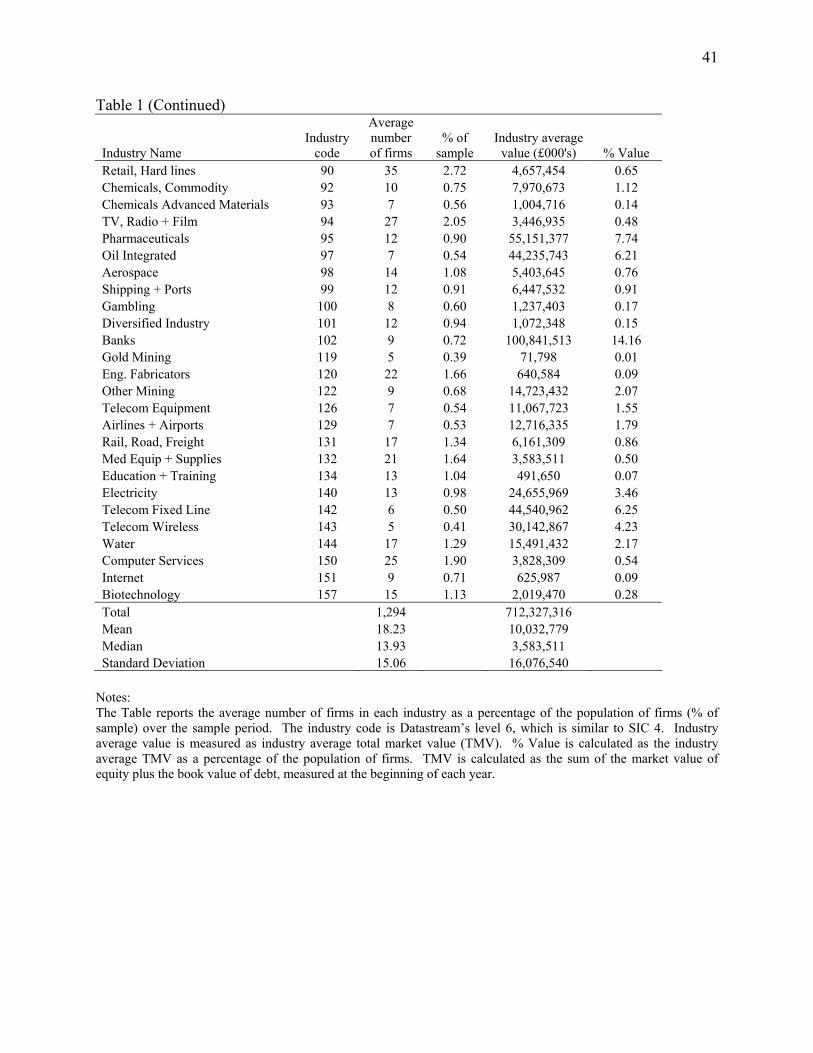
Table 1 shows the distribution of the sample by industry and average total market value
(TMV). The average number of firms each year over the sample period is about 1,294, which
have a TMV of approximately £712 billion, on average, each year. The industries in the sample
have an average TMV of approximately £10 billion over the sample period. The mean (median)
number of firms in each industry is 18 (14) with a standard deviation of 15. Since we use a panel
dataset, comparisons with prior research are difficult. For a static sample constructed in 1981
using US data, Mitchell and Mulherin (1996) report a total sample TMV for 1,064 firms,
representing 51 industries of $1,014 billion, which gives an average industry TMV of
approximately $20 billion. Mulherin and Boone (2000) construct a US sample using data from
59 industries in 1990 and report a total sample market value for 1,305 firms of $2,514 billion,
which gives an average industry market value of about 43 billion. Clearly, even accounting for
currency differences, average industry size in the US is significantly larger than in the UK.3 In
terms of the average number of firms in each industry, General Engineering and Business
Support have the highest representation across all years with an average of 75 firms each (5.78%
10
of the sample). By TMV, Banks is the largest industry across the sample period with an average
of approximately £100 billion (14.16% of the sample). Gold mining has the lowest average
TMV of £72 million (0.01% of the sample). The descriptive statistics reported at the bottom of
Table 1 indicate skewness in the distribution and value of industries across time.
The firms in each industry are followed for the period 1986 to 2000 to identify the major
restructuring choices affecting them. The information on the restructuring choices made by
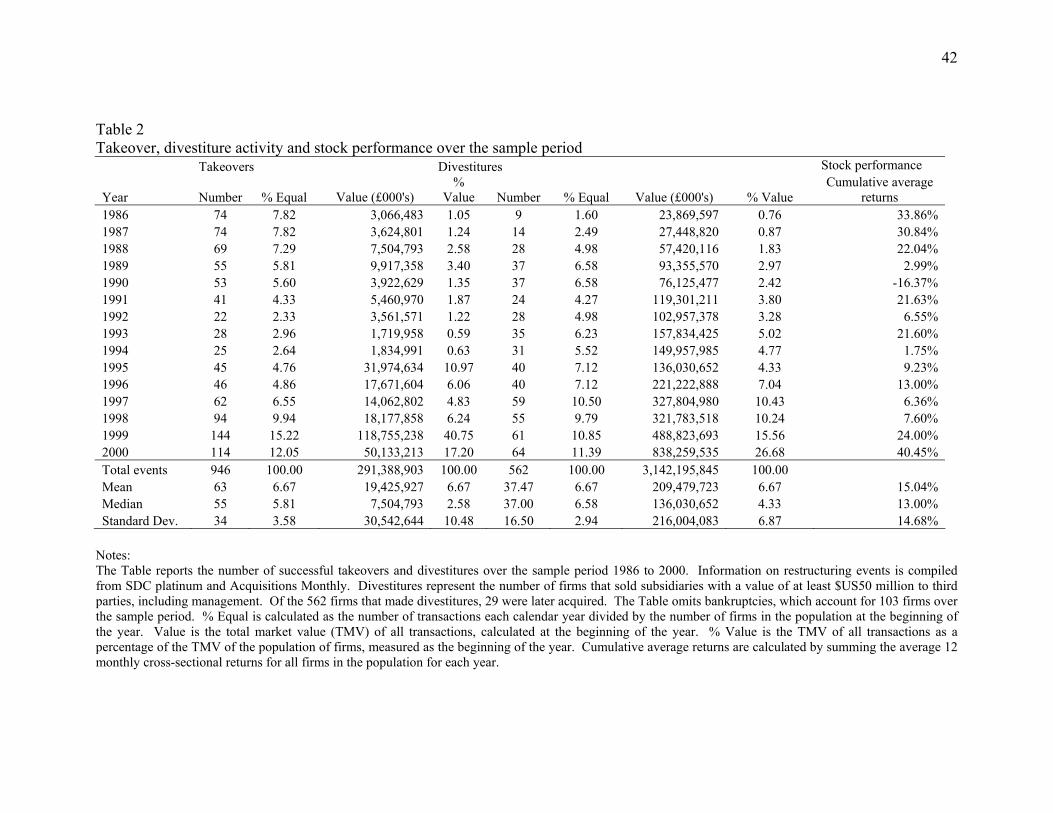
firms is compiled from the SDC Platinum database, compiled by Thomson Financial. Table 2
reports the frequency of restructuring activities pursued by sample firms.4
Insert Table 2 here
Table 2 shows that 562 firms (average of 6.67% of the sample) engaged in divestitures
over the sample period. We define a divestiture as the sale of a subsidiary by the parent to a
third party, which could include an investor group comprising of the management of the divested
subsidiary. To make the results more comparable to Mulherin and Boone (2000) we constrain
our analysis to only the largest transactions by excluding divestitures valued at less than US$50
million.5 We also identify 946 (average of 6.67 of the sample) successful takeovers. As
expected, firms restructuring through divestitures are, on average, larger than firms targeted for
takeover.
The last column in Table 2 reports the stock market performance, measured as the
cumulative monthly average returns of all firms in the population for each year. Consistent with
early research (e.g., Weston, 1953 and Nelson, 1959), the results suggest a positive association
between takeover activity and periods of high stock market values. The correlation coefficient is

11
significant and positive between the number (ρ=0.47) and value (ρ=0.28) of takeovers and stock
market performance. For divestitures, the correlation is positive for the value (ρ=0.36) of
transactions and stock market performance, but negative for the number (ρ=-0.10) of transactions
and stock market performance. The evidence suggest that the both takeovers and
4. Industry patterns in takeovers and divestitures
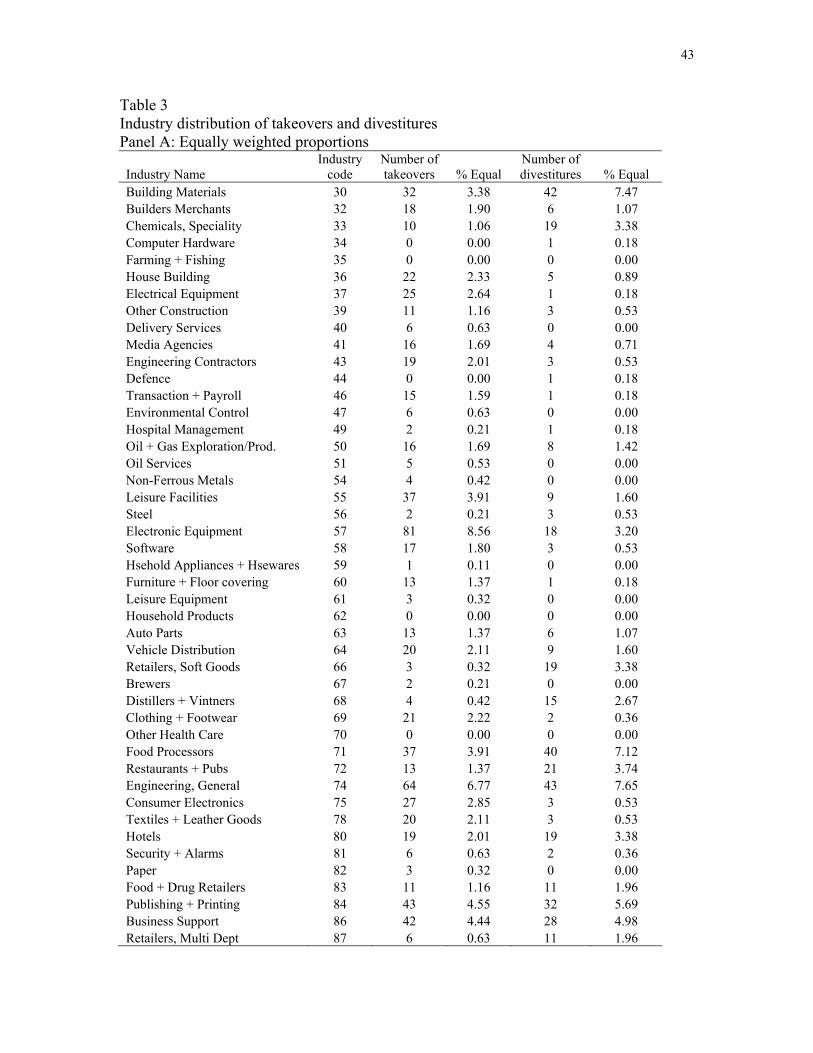
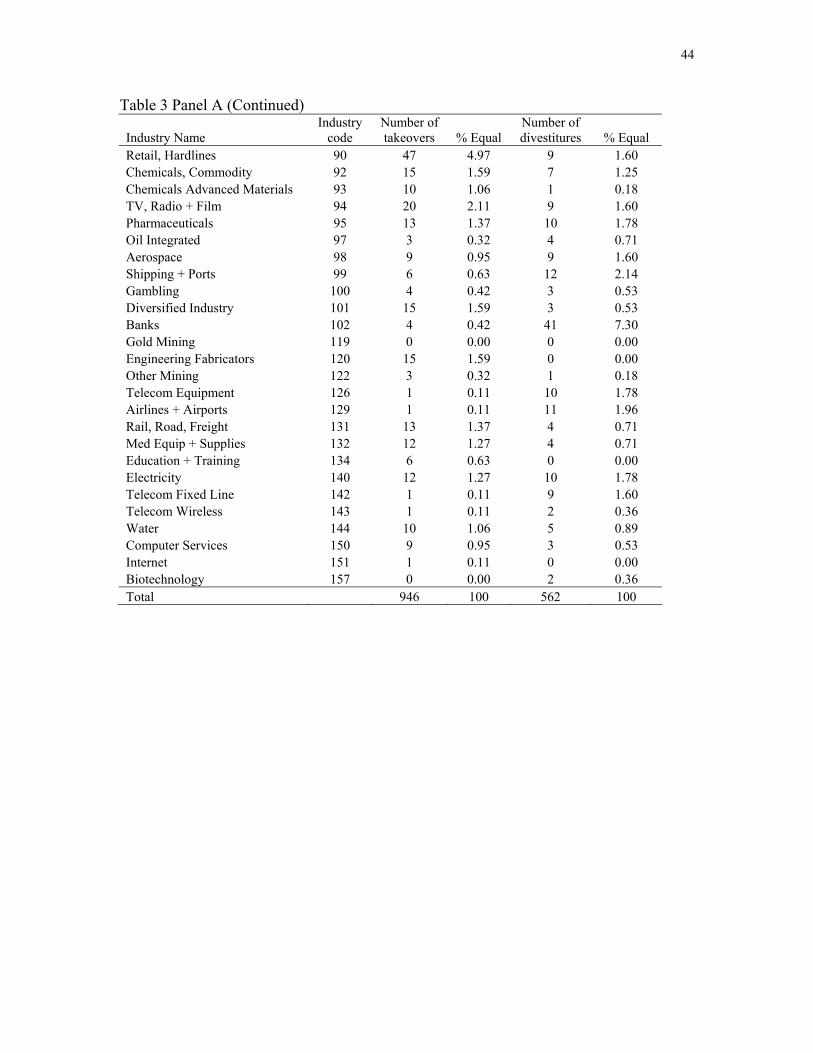
Following from Mitchell and Mulherin (1996) and Mulherin and Boone (2000), we
analyze whether there are any differences in the rate of takeovers and divestitures across
industries over the sample period. Table 3 reports average equally weighted (Panel A) and
average value weighted (Panel B) proportions for takeovers and divestitures over the sample
period.
Insert Table 3 here
While the likelihood of takeovers and divestitures is generally low, some industries show
higher rates of activity indicating clustering. For example, Electronic Equipment and
Engineering General report average takeover rates of 9% and 7% respectively, compared to Steel
(0.21%) and Airlines and Airports (0.11%). Divestitures also appear to cluster around certain
industries with Engineering General and Building Materials reporting rates of 8% and 7%,
respectively. The results using value weighted averages (Panel B) show that the largest
transactions seem to occur in Banks, Pharmaceuticals and Engineering General, reporting
takeover rates of 19%, 18% and 5.4%, respectively. For divestitures, Banks,
Telecommunications (Fixed and Wireless) and Building Materials industries report the highest
rates of 31.65%, 8.95% and 5.72%, respectively. There is some similarity between industries
12
with high takeover and divestiture rates reported here and those reported in the US. For
example, Mulherin and Boone (2000) for the 1990s period, also report high takeover activity
rates for Banking and the Electronics industry. For Divestitures, they also report high activity
for Telecommunications, but not for Banks and Building Materials.
To test whether the variation in the rates of restructuring activity is statistically
significant across all years, we estimate the Pearson χ2, which tests the null hypothesis that the
actual takeover or divestiture rate in each industry equals its expected rate (see Table 4).6 The
value of the statistic for takeovers is 2,119 (df = 875), which is significant at the 1% level,
indicating a rejection of the null hypothesis. The value of the statistic for divestitures is 1,428 (df
= 875), indicating significant clustering of divestitures over the sample period. To test whether
industry clustering is specific to certain years, Table 4 also reports the Pearson χ2 for each year.
The results suggest significant clustering of takeovers and divestitures across significant stock
market growth periods in the late 1980s and mid to late 1990s.7 To check the robustness of this
result, Table 4 reports a variant of the Pearson χ2, the Likelihood Ratio Test, defined as
2Σi(Actuali ln(Actuali / Expectedi). While the results are broadly similar for takeovers, for
divestitures they suggest that clustering was only specific to 1988, 1996 and 1998.
4.1. Do takeovers and divestitures cluster over time?
As a natural extension of the previous section, we examine which industries drive the
clustering of takeovers and divestitures across the sample period.
Insert Table 4 here

13
Table 5 reports the number of takeovers by industry across the sample period. We have
sorted the data in terms of the maximum clustering percentage reported in an adjacent 2-year
period within the 15-year sample period. The evidence suggests that takeovers are clustered in
specific industries across time. For example, over half of all takeovers in the Chemicals
Specialty industry occur within a 2 year period. Similar findings exist for Other Construction,
Electricity and Computer Services. Table 5 also presents the results for divestitures. Again, the
results indicate some clustering across time for certain industries, including Builders Merchants
(67%), Electricity (70%) and Clothing and Footwear (100%).
Insert Table 5 here
5. Modelling shocks and misvaluation
The results from Section 4 provide some evidence that takeovers and divestitures appear
to cluster both across industries and time. This section attempts to identify the causes of this
clustering. We use the discussion of the main theoretical issues discussed in Section 2 as a guide
to building a model of takeover and divestiture activity at the industry level. However, there is a
caveat in that the theories posited in Section 2 relate primarily to takeovers; hence we have no
strong priors that proxies for those theories will be useful in explaining the variation in
divestiture activity across industries and, to a lesser extent, over time.
We suspect, given past research, that ‘real’ factors in the form of broad (i.e., interest and
exchange rate shocks) and industry-specific shocks (i.e., deregulation, foreign competition and
technology) play some role in explaining this clustering. Also, given recent research on
valuation discrepancies as a driving force in explaining takeover activity, we use proxies for
14
misvaluation in our estimated models. This section describes the process followed in developing
a model to explain the clustering of takeovers and divestitures. We describe the variables used to
proxy broad economic shocks, industry-specific shocks and misvaluation.
5.1. Broad economic shocks
Generally, previous studies assume that whatever the source of the broad shock (e.g.,
exchange and interest rate changes) the outcome is a change in industry structure,
operationalized through takeovers and other forms of corporate restructuring. To create a proxy
for broad economic shocks, Mitchell and Mulherin (1996) compute the absolute value of
abnormal industry sales and employment growth for the period of five years prior to their sample
period. They define the absolute value as the difference between an industry’s sales
(employment) growth and the average sales (employment) growth across all industries. Taking
the absolute value recognises that a shock could have either a positive or negative effect on
restructuring. In this paper, we also define broad economic shocks using sales and employment
data. However, we also employ a third measure - operating cash flows. Our motivation for
using operating cash flows is that they are more sensitive to cost side shocks, as well as income
side shocks, unlike sales, which is purely income based. Following Mitchell and Mulherin
(1996), we measure the absolute value of the abnormal industry sales, employment and cash flow
growth over a five year period, starting in 1986. Each of these proxies is used in a pooled
regression to explain the variation in takeover and divestiture activity across all industries over
the sample period. Formally, the model takes the following specification,
tititi SHKR ,,1, εβα ++= (1)
15
where Ri,t represents the restructuring proportions in industry i, during period t. SHKi,t is a proxy
for broad economic shocks for industry i, during period t (i.e., absolute industry-specific growth).
If broad economic shocks are significant determinants of corporate restructuring, we should
expect β1 to be significant and positive. Clearly, given that the dataset is panel in design,
estimation of the model raises some econometric issues. In particular, any inferences placed on
the estimated coefficients could be open to criticism due to understated standard errors arising
from correlated residuals across panel years. Following Fama and McBeth (1973), and more
recently, Fama and French (2002), we use the average coefficients estimated from yearly
regressions and infer statistical significance using time-series standard errors estimated from the
cross-sectional yearly regressions. For the pooled regression model, we report White’s (1980)
standard errors corrected for heteroscedasticity.
4.2. Industry-specific shocks
Since industry-specific shocks are also likely to have some impact on industry
restructuring, we expand the above basic model to include variables that proxy industry-specific
factors. Broadly, the literature has divided industry-specific factors into internal and external
factors. The internal factors include growth opportunities, profitability, availability of cash and
industry concentration (Jensen, 1989, 1993). The external factors include changes in technology,
industry deregulation and foreign competition (Mitchell and Mulherin, 1996; Mulherin and
Boone, 2000). These factors are discussed in more detail below.
16
Internal factors
Two hypotheses related to growth have received attention in the literature. The first
predicts that industries characterized as high growth are more susceptible to restructuring,
especially takeovers. The hypothesis is derived from the ‘empire building’ theory of takeovers,
which suggests that a high growth industry will be more attractive to managers who derive a
higher utility from controlling larger firms. For example, Mulherin and Boone (2000) provide
evidence of greater takeover and divestiture activities in high growth sectors, such as electronics,
telecommunications and electrical equipment. Takeovers in high growth industries by low
growth acquirers with high resources are also more likely to be value enhancing (Myers and
Majluf, 1984).
The second hypothesis argues that industries characterized as low growth, with high free
cash flow, will be subject to hostile takeovers and leverage buyouts. The theory received some
support for the 1980s, a period of high hostile takeovers directed at industries with low growth
options (e.g., oil exploration), but high level of free cash flow (Jensen, 1986 and 1989). The
1990s period, however, has experienced very few hostile transactions, with most transactions
being characterized as ‘consolidated’ deals by firms within the same industry (Holmstrom and
Kaplan, 2001). To capture these effects, we include industry growth (defined using sales,
employment and cash flows) and a proxy for free cash flow (industry-specific operating cash
flow less capital expenditures scaled by total assets) in the estimated models.
The degree of concentration within an industry is likely to be an important determinant of
the level of corporate restructuring. The concentration of firms in an industry has been related to
industry growth, with concentration ratios increasing as firms reach maturity. For example,
Mitchell and Mulherin (1996) document that the excess capacity in Metals and Mining and Food
17
processing industries in the US led to greater restructuring activities, which in turn led to
industry consolidation. The theory suggests that low concentration industries will have a higher
rate of takeovers as firms compete to gain a greater share of the market. Moreover, the desire to
have fewer firms within an industry to enhance market power may lead to takeovers and other
restructuring activities.
In terms of corporate restructuring, industry concentration has only been related to
takeovers. As far as we are aware, there is no evidence of a relationship between industry
concentration on the one hand, and divestitures on the other. This is an empirical issue that will
be addressed in this paper. To the extent that firms selling assets via divestitures are larger in
size, it may be reasonable to expect a higher incidence of these activities in high concentration
industries.
Several measures are used to determine the extent of concentration in an industry. These
measures attempt to capture the prevailing structure and the extent of competitive forces in an
industry (see, e.g., Liebeskind, Opler and Hatfield, 1996 and Ratnayake, 1999). Two of these
measures are commonly used in calculating industry concentration. First, the four firm
concentration ratio, defined as the proportion of total sales accounted for by the four largest firms
in an industry. Second, the Herfindahl index, defined as the sum of the squared market shares of
all incumbent firms. The market share for each firm is defined as the ratio of its sales to the total
value of sales in the industry (Liebeskind, et al., 1996). Hence, larger firms are allocated higher
weights to reflect their relative importance in the industry. We employ the Herfindahl index
since a few of the industries in our sample are relatively small. Using the four firm approach in
such cases is likely to result in an upward bias in the concentration ratios.
18
External Factors
External factors include changes in government policies, such as deregulation,
privatization and the impact of foreign competition. To identify the specific industry shocks
affecting UK industries, we search through the industry background and news contained in Key
Note Market Research Reports and Sequencer for each industry. We identify deregulation,
foreign competition and technological innovations as the key shocks affecting specific UK
industries over the sample period.
Table 6 provides a summary of the sources of specific industry shocks and the industries
affected over the sample period. Although several external factors affect corporate restructuring
in an industry, deregulation seems to be one of the most significant external factors (Andrade,
Mitchell and Stafford, 2001). Deregulation removes the artificial constraints imposed on an
industry and this induces free entry and exit of firms (Rose, 1985). The exposure of these
industries to the pressures of the market and competition requires adaptation, which is facilitated
by takeovers and other restructuring activities. In the UK, for example, the privatization of the
Telecommunications industry initiated in 1981 led to the sale of government shares in Cable and
Wireless and the separation of postal and telecommunication services. This led to the
privatization of British Telecom in 1984. The industry was further deregulated in 1991 when the
duopoly of British Telecom and Mercury was terminated. These changes have dramatically
altered the Telecommunications industry, allowing numerous new entrants into the market.
Similar developments have taken place in the Electricity, Water and Transport industries. We
create a dummy variable equal to one for the deregulated industries (i.e., Electricity, Oil and Gas,
Steel, Telecommunications, Transport and Water) for all post-deregulation years.8
Insert Table 6 about here
19
Foreign competition affects the demand and profitability of the affected industries, which
may lead to various forms of corporate restructuring. For example, new competition from
overseas can impact significantly on an industry’s sales growth. Acquiring other firms within
the industry is one mechanism to quickly increase market power providing a defense against
overseas competition. In the UK, foreign competition has been a major problem affecting some
industries, particularly Automobiles, Aerospace and Defense, Construction and Electronics. In
the 1990s, the UK Motor industry suffered greatly from foreign competition, which led to low
profitability in the industry. Furthermore, the high value of the pound resulted in the industry
losing ground to overseas imports. There is some similarity (albeit small) in industries impacted
by foreign competition in the US (e.g., Electronics and Motor Vehicle Parts) to those reported
here (see, Mitchell and Mulherin, 1996). To create a proxy for foreign competition, we use a
dummy variable equal to one for those industries sensitive to foreign competition (i.e.,
Aerospace and Defense, Automobile, Auto Parts, Construction, Electronics and Food
Processing) and zero otherwise.
The need for continuous improvement in products and processes is widely publicized.
The mechanisms needed to achieve these improvements are often less clearly defined. Changes
in technology and innovations are largely brought about by research and development activities
(R&D). For example, the Pharmaceutical industry in the UK has and is currently undergoing
rapid technological advances with the aim of improving the quality of their products.
Computers, Telecommunications, Electronics and Media are other sectors that are experiencing
fast technological changes. Technological changes are common to almost all sectors of UK
economy, although it is more dramatic in certain industries. It is argued that the rate of
restructuring, in particular takeovers, should be higher in low technology industries. Such
20
industries are likely to spend less on R&D expenditures, and as such, will have relatively low
growth options. While Mitchell and Mulherin (1996) find significant evidence of takeover
activity being concentrated in low R&D industries for the 1980s, Mulherin and Boone (2000) fail
to find any relationship for the 1990s. In other words, takeovers in the 1990s were not restricted
to industries characterized as having low growth options or low technology levels. We use the
ratio of R&D to sales as a proxy for the level of technological and innovation within an industry.
4.3. Misvaluation
The theoretical discussion in Section 2 posits that takeovers are more likely when
valuation discrepancies occur, that is, when a firm’s market value (MV) is different from its true
or fundamental value (FV). Generally, the theory predicts that takeovers are more likely to occur
when firms are overvalued, i.e., MV>FV, consistent with the observation that merger waves
occur during times of high stock prices. Clearly, the determination of misvaluation is dependent
on correctly measuring a firm’s FV. Unfortunately, no perfect measure of FV exists, hence prior
papers typically adopt proxies for FV, common amongst these being the book value of assets or
FV determined by a valuation model (e.g., residual income). While imperfect in that the proxy
for misvaluation may simply be capturing some other phenomenon, e.g., growth opportunities,
past use suggests a strong correlation with between different proxies proxies.9 For example, Ang
and Cheng (2002) report a correlation coefficient of 72% between MTB and residual income
misvaluation proxies.
Following from prior literature (i.e., Ang and Cheng, 2002), we construct two
misvaluation proxies using the MTB ratio. The first is simply the mean MTB ratio of all firms in
the industry (log MTB). The second proxy is the industry-adjusted MTB, where the mean
21
industry MTB is adjusted for the mean MTB across all industries. Subtracting the mean across
all industries is an attempt to remove economy-wide factors, so that the industry MTB reflects
industry-specific misvaluation effects only.
We also include the standard deviation of TMV in the models to capture the dispersion in
industry size. A higher dispersion between the size of firms within an industry is likely to result
in higher takeover activity with smaller firms targeted by larger, both of which increase activity
within the industry.10 Including the above industry-specific variables to our basic model, we
arrive at the full model,
titititititi
tititititi
STDMISVALTECHFCOMDERGCONFCFGROSHKR
,,9,8,7,6,5
,4,3,2,1,
εβββββββββα
++++++
++++= (2)
simplifying to,
tititiR ,,'
, εβα +Χ+= (3)
where SHK is our proxy for broad economic shocks, GRO is industry growth (measured using
sales, employment and cash flows), FCF is a proxy for free cash flow (industry-adjusted), CON
is a proxy for industry concentration (Herfindahl index), DERG is a dummy variable for
deregulation, FCOM is a dummy variable for foreign competition, TECH is a proxy for
technological innovation (R&D/sales), MISVAL is our proxy for industry misvaluation (Industry
and industry-adjusted MTB) and STD is the standard deviation of industry TMV.
22
6. Results
This section first reports some descriptive statistics and correlation coefficients between
the variable proxies and the rates of takeovers and divestitures. The results of the regressions are
then reported in section 6.2.
6.1. Descriptive statistics
Table 7 presents descriptive statistics (Panel A) and correlation coefficients (Panel B) for
the variables employed in the models. The likelihood of takeover (divestiture) across the sample
period is approximately 5% (3.6%) using equally-weighted proportions. While the likelihood
using value-weighed measures is similar for takeovers, the rate for divestitures increases to about
14%, indicating that divestitures are significantly larger transactions. The mean absolute
deviation of an industry’s growth from the average across all industries (SHK) is approximately
40% when measured using sales (SSHK) and employment (ESHK) data, and 67% for cash flow
data (CSHK). Mean industry growth is positive for all measures (SGRO, EGRO, CGRO),
indicating that industries, on average, experienced increases in sales, the number of employees
and cash flows over the sample period. On average, about 12% and 14% of industries,
respectively, were impacted by deregulation (DERG) and foreign competition (FCOM) over the
sample period. The descriptive statistics indicate that many of the variables are positively
skewed (with the exception of free cash flow, FCF).11
The correlation coefficients presented in Panel B of Table 7 provide more interesting
results. We find a positive and significant correlation between our proxies for broad economic
shocks and takeover activity, with value-weighted proportions providing stronger results. On the
other hand, we find a significant negative relationship between the rate of divestitures and
23
shocks, although the result is sensitive to whether equally or value-weighted proportions are
used. The results suggest that industries sensitive to broad economic shocks are more likely to
experience takeovers, but less likely to experience divestitures. The high correlation between the
different proxies for broad economic shocks indicates that they capture similar economic effects.
Insert Table 7 about here
The correlation between the industry-specific shocks and takeovers and divestiture
activity also provide some insights. First, deregulation (DERG) only appears to have a
significant positive impact on divestiture activity. This result clearly contradicts prior research
documenting a strong link between deregulation and subsequent takeover activity (see, e.g.,
Mitchell and Mulherin, 2000). The lack of significance reported here is due to the pooled sample
design. Examining individual years, in particular the mid to late 1990s, deregulation shows a
positive and significant correlation with takeover activity. Second, the results suggest that
takeovers, and to a lesser extent, divestitures, are more likely to occur in low growth industries.
As expected, divestitures are more likely to occur in large highly concentrated industries.
Interestingly, we also find a significant and positive correlation between misvaluation
(MISVAL), industry growth and technology shocks (TECH). While this supports our hypothesis
that some industry shocks may drive misvaluation, it is more likely that our proxies for industry
growth and technology also proxy for growth options. This result is also robust to the industry-
adjusted measure of misvaluation. Overall, the correlations between the variables entering the
models are fairly low, so multicollinearity should not pose a problem. However, correlation
between variables could still lead to spurious results. As a robustness check, Section 6.3 reports
24
the results of several robustness tests, including, testing the impact of correlated variables,
different proxies for variables, the impact of outliers and alternative regression estimation
methods.
6.2. Regression results
Tables 8 and 9 report the results for the estimated OLS regressions for takeovers and
divestitures, respectively. Equation (1) and (2) are estimated using equally-weighted (Panel A)
and value-weighed (Panel B) proportions for takeovers and divestitures. Both pooled OLS and
Fama and MacBeth (1973) type regressions are estimated and reported in Tables 8 and 9.
Insert Tables 8 and 9 about here
The results reported in Table 8 for equation (1) show evidence of broad economic shocks
(SSHK) increasing the likelihood of takeovers. The results are stronger for value-weighted
proportions (Panel B) and are robust to the Fama and MacBeth (1973) regression method.
Controlling for industry-specific factors (equation 2) does not alter our conclusions on the impact
of broad economic shocks on takeover activity. However, while economic shocks impact on
takeover activity, the magnitude of the impact is small. For example, using value-weighted
proportions (Panel B), the results suggest that a 10% deviation in industry sales growth from the
population average leads to only a 0.5% increase in takeover activity in an industry. This is
significantly lower than the 4.6% reported by Mitchell and Mulherin (1996).12
The results for equation 2 suggest that some industry-specific factors impact on the
likelihood of takeover, but are sensitive to whether equally or value-weighted proportions are
25
used. Industry growth (GRO) is the exception, indicating strong evidence of a significant
negative relationship between sales growth and the likelihood of takeover. This result suggests
that takeovers are more likely to occur in low growth industries, indicating maybe, the need for
firms to exit via takeover from low growth or declining industries. There is some evidence that
foreign competition (FCOM) increases the likelihood of smaller transactions, with a significant
positive relationship using equally-weighted proportions, but not for value-weighted proportions.
High industry free cash flows (FCF) also seems to be a characteristic that attracts takeover
activity, providing some support for Jensen’s (1986) free cash flow theory. Furthermore, while
there is some evidence of lower takeover activity in technological intensive (TECH) or high
R&D industries, the results are not robust to the Fama and MacBeth (1973) regression procedure.
Table 9 reports the results for divestitures. The results for equation (1) indicate that
broad economic shocks decrease the likelihood of divestitures (Panel A), although there appears
to be some sensitivity when value-weighted proportions are used in a pooled model (Panel B).
Controlling for industry-specific factors (equation 2) suggests strong evidence of a negative
relationship between broad shocks and the likelihood of divestitures. Also, the results for both
pooled and Fama and MacBeth (1973) regressions suggest that a few industry-specific factors
impact significantly on the likelihood of divestitures. For example, a higher dispersion in
industry size (STD) and higher industry concentration (CON) are characteristics which seem to
increase the likelihood of divestitures. The negative and significant sign on MISVAL (Panel B)
suggests that undervalued industries are more likely to divest.
26
6.3. Robustness tests
To confirm that our inferences above are robust, and not the result of spurious
regressions, we perform the following additional tests. First, we use alternative proxies for broad
and industry-specific shocks. The regressions are re-estimated using employment and cash flow
data to estimate the variables SHK and GRO. Furthermore, FCF and MISVAL are measured as
industry-adjusted variables, as opposed to industry averages. Second, we test the sensitivity of
the results to the exclusion of several variables that are significantly correlated (see Table 7,
Panel B). Third, we test the suitability of OLS as an estimation method in light of the level of
skewness in some of the variables (see Table 7, Panel A) and, furthermore, the censored nature
of takeover and divestiture proportions. OLS may not be appropriate for data where the
dependent variable lies between 0 and 1. To address these issues we address the problem of
outliers in the sample and use censored regressions methods. Fourth, we re-estimate the takeover
models using industry proportions estimated from the acquiring firm’s perspective, as opposed to
the takeover target’s perspective. Theories of misvaluation are more likely to hold for acquiring
firm industries, which are more likely to be overvalued, as opposed to target firm industries,
which could be either over or undervalued (Shleifer and Vishny, 2003).13
Substituting employment and cash flows definitions for SHK and GRO measured using
sales results in no significant change to the results reported in Tables 8 and 9. The high positive
and significant correlations between different shock and growth proxies, as reported in Table 7
(Panel B), suggests that we should not be too surprised by the robustness of the impact of broad
economic shocks, whether measured using sales, employment or cash flow data. Substituting
industry adjusted measures for free cash flow (FCF) and misvaluation (MISVAL) also has no
significant impact on our results. Estimating the regressions using a forward and backward step-
27
wise procedure, by adding one variable at a time or removing one variable at a time from the full
model, indicates that only one variable, STD, has a minor impact on the significance of other
variables. In particular, when STD is removed from the takeover regressions, deregulation
changes from being negative and significant for value-weighed proportions to negative and
insignificant. For divestitures, the only change is an increase in the statistical significance for
concentration (CON) for both equal and value-weighted proportions.14 All other regression
results remain unchanged.
While re-estimating the models using a pooled sample with outliers winsorized results in
a significant decrease in the skewness of the variables, the significance of the variables remains
unchanged, suggesting that OLS is fairly robust to some skewness in variables. Re-estimating
the models using tobit regressions results in minor changes as follows: (1) for takeovers,
concentration (CON) changes from statistically insignificant to negative and significant for
equally and value-weighted proportions; (2) for divestitures, foreign competition (FCOM)
changes from positive and insignificant to positive and significant for both equally and value-
weighted proportions; (3) the constant terms for all regressions become insignificant. Overall,
the OLS results are fairly robust to different estimation methods.
Lastly, we re-examine the robustness of insignificant results for the impact of industry
misvaluation (MISVAL) on the likelihood of takeovers. The theory suggests that overvalued
acquiring firms are likely to use their inflated stock to bid for targets. Since we use takeover
proportions derived from industries targeted by takeover, our results could be biased against
finding industry overvaluation significant, since target industries may be under or overvalued
(Shelifer and Vishny, 2003). We re-estimate the takeover models substituting industry takeover
proportions based on the acquiring firm’s industry for proportions based on the target firm’s
28
industry. While the coefficient for MISVAL is positive, it remains insignificant indicating that
misvaluation at the industry level does not significantly impact on the likelihood of takeover
activity. The result suggests that overvalued acquiring firms do not cluster across certain
industries.
6.4 Discussion of the main results
To summarize, the regression results suggest that broad economic shocks significantly
increase (decrease) the likelihood of takeovers (divestitures). For takeovers, industry-specific
factors, such as growth (GRO), free cash flow (FCF) and the threat of foreign competition
(FCOM) seem to have an impact on takeover likelihood. For divestitures, only concentration
(CON), and the variation in industry size (STD) seem to play a significant role in explaining
divestitures at the industry level. For the 1980s period in the US, Mitchell and Mulherin (1996)
find broad economic shocks plus two industry-specific factors, deregulation and technological
(R&D/sales) to be significant in explaining actual takeovers at the industry level. The results
from this paper support broad economic shocks, but fail to find convincing robust statistical
evidence for deregulation and technology factors. While we do find technology significant using
a pooled OLS regression, the robustness of this result becomes suspect when we use the Fama
and MacBeth (1973) regression method.
As for deregulation, our results suggest that it is important in explaining takeovers, but
only for one or two years in the latter part of the 1990s. This result makes intuitive sense
because the full effects of deregulation for many industries in the UK only became realized when
the UK government’s ‘golden share’ in these industries expired. For example, while the
Electricity industry was deregulated in July of 1989, takeovers only become possible from March
29
1995, when the government’s ‘golden share’ expired, which restricted any single private entity
stake to 15%. As expected, immediately after March 1995, the Electricity industry experienced
several takeover bids. In fact, two thirds of all takeovers in the Electricity industry occurred
within the two year period, 1995-1996 (see Table 5).15 Other deregulated industries in Water,
Telecommunications and Oil and Gas faced similar restrictions to control changes post-
deregulation through the use of the ‘golden share’. Interestingly, deregulated industries in the
US did not face these restrictions, allowing for higher takeover activity immediately after
deregulation.16
7. Summary and conclusions
This paper provides evidence of clustering across industries and time in the rates of
takeover and divestitures. The paper then attempts to explain clustering using proxies for broad
economic shocks, misvaluation and industry-specific shocks. The results provide evidence to
support broad shocks increasing (decreasing) the likelihood of takeovers (divestitures). Industry-
specific factors appear to play less of a significant role in explaining both takeovers and
divestitures, although some factors are important, particularly growth, free cash flow and foreign
competition for takeovers. Little evidence is found for deregulation as a significant factor in
explaining takeover activity over the pooled sample period. Further investigation reveals that
deregulation is important, but only for the latter part of the 1990s when the full effects of
deregulation were felt when the UK government’s ‘golden share’ expired in some deregulated
industries.
The paper has implications for researchers interested in modeling takeovers and
divestitures. Researchers, for example, may be interested in predicting takeovers with a view to

30
developing a successful investment strategy (Palepu, 1986). The results suggest that prediction
models may benefit from the inclusion of variables that capture broad economic and industry-
specific factors, as opposed to the norm of including only firm-level variables.
31
Notes
1. We carefully reconstruct the population of firms each year because Datastream removes
‘dead’ firms from its lists, so the constituents of industries at the time of extracting the
data would not be representative of the ‘true’ constituents at the beginning of the sample
period. So, for example, the list of firms in the Datastream Metals industry for December
1984, extracted in December 2003, would include only firms that survived the period
December 1984 to December 2003. Any firms that died between these dates would be
removed from the industry list by Datastream and placed in a ‘dead’ companies list.
Naturally, this would inflict a serious survivorship bias on any sample constructed solely
from the current Datastream industry lists. In order to avoid this bias, we reconstructed
the ‘true’ population of firms each year using the official stock exchange list, the
alternative investment market list (i.e., small capitalization list) and the dead companies
list.
2. A firm is classified as ‘live’ in a given year if it reported total assets (DS#392). We use
total assets because it is reported by both financial and industrial firms.
3. Using an average conversion rate of $US/£0.61over the period 1986-2000 provides an
industry average TMV for our sample of $US of approximately $16.4 billion. More
specifically, if we examine the 1990 period for the UK, our sample provides an average
industry TMV of approximately £7.8 billion or $US12.5, using the appropriate currency
rate for the beginning of 1990 ($US/£0.62). Hence, even matching by time, the average
size of US industries is significantly larger. This is not surprising since both Mitchell and
32
Mulherin (1996) and Mulherin and Boone (2000) use firms identified from the Value
Line Investment Survey, which represents the largest and most actively traded firms in
the US. Furthermore, the US market is larger than the UK, so even if both US papers
used all firms in their sample construction, the TMV of industries is still likely to be
larger than the UK.
4. A takeover occurs when the acquiring firm accumulates a controlling interest in the target
firm, either through a friendly (with the agreement of the target management) or hostile
bid (rejected by management). A divestiture is defined as the sale of a subsidiary by the
parent company to a third party (otherwise known as a sell-off) or to management
(otherwise known as a management buyout).
5. While Mitchell and Mulherin (2000) use US$100 million as their selection criteria for
‘major’ divestitures, we use the lower value of US$50 million due to the smaller size of
UK transactions. Note, that if we adopted a US$100 million cut-off, the number of
divestitures in our sample would fall to about 342 (or 60% of the current sample).
6. The Pearson χ2 is defined as Σi (Actuali - Expectedi)2 / Expectedi., where i represents the
925 industry-years in the sample and expectedi equals the product of the average takeover
(divestiture) activity for the full sample times the number of firms in the ith industry.
7. The Pearson χ2 and Likelihood Ratio Tests computed using value-weighted averages are
similar to those reported in Table 4.
33
8. There is one important caveat: For several deregulated industries (e.g., Electricity and
Water), corporate control changes were prevented for a period of up to 5 years following
deregulation by the use of the ‘golden share’ by the UK government. The ‘golden share’
simply restricts private equity ownership to 15%, hence preventing control changes
through takeovers. For affected industries, the deregulation dummy only takes a value of
1 for the period after the UK government’s ‘golden share’ expired. For example,
although the Electricity industry was deregulated at the end of 1989, the UK
government’s golden share did not expire until 1995.
9. Note that we control for growth in the estimated models by using growth in sales of the
industry, measured over the previous 5 years.
10. Note that using a measure of dispersion within an industry ignores takeovers that occur
outside the industry (i.e., diversified takeovers). Put differently, while a large dispersion
in industry size facilitates takeovers within an industry between large and small firms, it
says little about large firms acquiring smaller firms from outside the industry. Hence, if
takeovers are more likely to be diversified, it is unclear what sign the dispersion measure
should take. As an alternative measure, we use the natural log of the industry total
market value. Since smaller firms are more likely to be acquired, this result may extend
to smaller industries, indicating a negative relationship. However, given the uncertainty
attached to both measures, we do not specify an exact relationship.
34
11. Section 6.3 discusses some robustness tests conducted, including the winsorizing of
outliers, defined as those observations that lie ± 3 standard deviations from the mean for a
given variable. While winsorizing significantly reduces the skewness of all variables, the
results of the estimated models remain unchanged. For brevity, we report only the results
for the models estimated using unwinsorized data. All unreported results, including
robustness tests reported in Section 6.3, are available from the authors upon request.
12. On examining the yearly regression, the results show that 1996 records the highest
sensitivity to sales shocks, with a 2.2% increase in takeover activity for a 10% deviation
in industry sales growth from the population.
13. Clearly, this view makes the implicit assumption that overvalued acquirers cluster across
specific industries. If overvaluation is firm-specific, we should expect no correlation
between proxies for misvaluation and bidder activity.
14. We substitute the natural log of STD (LNSTD) for the absolute value of STD. For the
value-weighed takeover regression, the coefficient is negative and significant, suggesting
that takeovers are targeted at industries with lower dispersion in size. All other results
remain unchanged. We also test the sensitivity of the results to the natural log of industry
TMV (LNSIZE). The coefficient on LNSIZE is negative and significant for the value-
weighed takeover regression, suggesting that takeovers are directed at smaller industries.
The result is not surprising given the highly significant correlation (0.92) between
LNSTD and LNSIZE (see Table 7, Panel B).
35
15. Schoenberg and Reeves (1999) report evidence of deregulation, industry growth and
concentration as significant factors in determining takeover likelihood at the industry
level in the UK. The authors compile a sample of 200 UK industries over the period
1991 to 1995 and calculate the level of takeover activity as the sum of the number of
takeovers in each industry times the average takeover value. They sort their sample into
two groups based on the value measure, but only select the top and bottom 10%, giving a
total of only 40 industries. We replicate the Schoenberg and Reeves (1999) methodology
by sorting the total value of all takeovers within the 71 industries in our sample over the
sample period, 1986-2000. We select the top 20 and bottom 20 industries and re-estimate
the OLS models. The results provide strong evidence for deregulation, concentration,
foreign competition and industry standard deviation. The explanatory power of the
takeover model is also significantly larger, 36% compared to the 8% reported in Table 8,
Panel B. Clearly, self selecting the estimation sample to include only the largest and
smallest transactions gives rise to significantly better results.
16. The usual explanation for the use of ‘golden shares’, which are used predominantly by
European governments, is to safeguard strategic interests from foreign buyers, such as
defense or energy supply. A political explanation also exists in that retaining control of
valuable utilities, governments can ally the fears of potential voters that state-owned
assets are being taken out of public hands. This explanation is often used to explain the
first use of the ‘golden share’ by the UK Thatcher government in the 1980s.
Interestingly, the European Court of Justice, the EU’s highest court, ruled in favour of the

36
European Commission in 2002 and 2003 in cases against ‘golden shares’ in the UK,
Spain, France and Portugal. Hence, the demise of the ‘golden share’ in Europe is fast
approaching.
37
References
Andrade, G., Mitchell, M., Stafford, E., 2001. New evidence and perspectives on mergers.
Journal of Economic Perspectives 15, 103-120.
Ang, J., Cheng, Y., 2002. Direct evidence on the market driven acquisitions theory. Flordia State
University Working Paper.
Baltagi, B.H., 2001. Econometric analysis of panel data, 2nd Edition. John Wiley and Sons Ltd,
England, UK.
Coase, R.H., 1937. The nature of the firm. Economica 4, 386-405.
Fama, E.F., French, K.R., 2002. Testing trade-off and pecking order predictions about dividends
and debt. Review of Financial Studies 15, 1-33.
Fama, E.F., MacBeth, J.D., 1973. Risk, return, and equilibrium: Empirical tests. Journal of
Political Economy 81, 607-636.
Gort, M., 1969. An economic disturbance theory of mergers. Quarterly Journal of Economics 83,
624-642.
Greene, W., 2000. Econometric Analysis, Fourth Edition. Prentice Hall International, New
Jersey, US.
Gujarati, D.N., 2003. Basic Econometrics, Fourth Edition. McGraw-Hill, New York, US.
Holmstrom, B. Kaplan, S., 2001. Corporate governance and merger activity in the United States:
Making sense of the 1980s and 1990s. Journal of Economic Perspectives 15, 121-145.
Jovanovic, B., Rousseau, P., 2001. Mergers and technological change: 1885-2001. New York
University Working Paper.
Jovanovic, B., Rousseau, P., 2002. The Q-theory of mergers. American Economic Review 92,
198-204.
38
Jensen, M. C., 1986. Agency costs of free cash flow, corporate finance and takeovers. American
Economic Review 76, 323-329.
Jensen, M. C., 1989. Eclipse of the public corporation. Harvard Business Review (September-
October), 60-74.
Jensen, M. C., 1993. The modern industrial revolution and the challenge to the internal control
systems. Journal of Finance 48, 831-880.
Johnston, J., 1984. Econometric methods, 3rd ed. McGraw-Hill, New York, NY.
Liebeskind, J.L., Opler, T.C., Hatfield, D.E., 1996. Corporate restructuring and the
consolidation of US industry. Journal of Industrial Economics 44, 53-68.
McGowan, J., 1971. International comparisons of merger activity. The Journal of Law and
Economics 14, 233-251
Mitchell, M.L., Mulherin, J.H., 1996. The impact of industry shocks on takeover and
restructuring activity. Journal of Financial Economics 41, 193-229.
Mulherin, J.H., Boone, A.L., 2000. Comparing acquisitions and divestitures. Journal of
Corporate Finance 6, 117-139.
Myers, S.C., Majluf, N.S., 1984. Corporate financing and investment decisions when firms have
information that investors do not have. Journal of Financial Economics 35, 99-122.
Nelson, R., 1959. Merger movements in American industry, 1895-1956. Princeton University
Press, Princeton NJ.
Palepu, K.G., 1986. Predicting takeover targets: A methodological and empirical anaysis.
Journal of Accounting and Economics 8, 3-35.
Ratnayake, R., 1999. Industry concentration and competition: New Zealand experience.
International Journal of Industrial Organisation 17, 1041-1057.
39
Rhodes-Kropf, M., Viswanathan, S., 2003. Market valuation and merger waves. Columbia
University Working Paper.
Rose, N.L., 1985. The incidence of regulatory rents in the motor carrier industry. Rand Journal
of Economics 16, 299-318.
Schoenberg, R., Reeves, R., 1999. What determines acquisition activity within an industry?
European Management Journal 17, 93-98.
Shleifer, A., Vishny, R., 2003. Stock market driven acquisitions. Journal of Financial
Economics 70, 295-311.
Weston, J.F., 1953. The role of mergers in the growth of large firms. University of California
Press, Berkeley and Los Angeles.
40
Table 1 Industry distribution of sample firms
Industry Name Industry
code
Average number of firms
% of sample
Industry average value (£000's) % Value
Building Materials 30 43 3.33 28,380,139 3.98 Builders Merchants 32 16 1.27 2,943,307 0.41 Chemicals, Speciality 33 20 1.54 7,655,966 1.07 Computer Hardware 34 9 0.68 214,622 0.03 Farming And Fishing 35 10 0.79 256,806 0.04 House Building 36 37 2.88 4,818,183 0.68 Electrical Equipment 37 23 1.77 1,527,048 0.21 Other Construction 39 27 2.05 4,026,350 0.57 Delivery Services 40 7 0.50 279,790 0.04 Media Agencies 41 22 1.72 3,377,288 0.47 Engineering Contractors 43 15 1.19 920,160 0.13 Defence 44 5 0.39 10,502,175 1.47 Transaction + Payroll 46 16 1.27 815,560 0.11 Environmental Control 47 6 0.45 2,042,096 0.29 Hospital Management 49 6 0.49 705,197 0.10 Oil + Gas Exploration/Production 50 19 1.49 7,324,046 1.03 Oil Services 51 6 0.43 447,732 0.06 Non-Ferrous Metals 54 7 0.57 218,728 0.03 Leisure Facilities 55 33 2.57 5,903,798 0.83 Steel 56 6 0.45 3,149,577 0.44 Electronic Equipment 57 61 4.70 10,012,825 1.41 Software 58 31 2.40 2,837,962 0.40 Hsehold Appliances + Hsewares 59 12 0.91 272,661 0.04 Furniture + Floor covering 60 20 1.56 675,265 0.09 Leisure Equipment 61 9 0.66 227,627 0.03 Household Products 62 5 0.39 4,893,543 0.69 Auto Parts 63 14 1.07 2,434,136 0.34 Vehicle Distribution 64 23 1.75 2,676,041 0.38 Retailers, Soft Goods 66 21 1.59 7,007,943 0.98 Brewers 67 5 0.39 782,497 0.11 Distillers + Vintners 68 9 0.67 16,113,432 2.26 Clothing + Footwear 69 31 2.42 1,313,795 0.18 Other Health Care 70 5 0.39 1,476,732 0.21 Food Processors 71 41 3.20 34,359,026 4.82 Restaurants + Pubs 72 31 2.37 12,228,024 1.72 Engineering, General 74 75 5.78 23,004,882 3.23 Consumer Electronics 75 17 1.29 1,371,228 0.19 Textiles + Leather Goods 78 25 1.91 2,182,443 0.31 Hotels 80 14 1.09 8,411,727 1.18 Security And Alarms 81 7 0.52 885,078 0.12 Paper 82 5 0.41 2,431,439 0.34 Food + Drug Retailers 83 18 1.41 20,606,397 2.89 Publishing + Printing 84 48 3.73 28,593,709 4.01 Business Support 86 75 5.77 17,675,403 2.48 Retailers, Multi Dept 87 17 1.32 22,114,258 3.10
41
Table 1 (Continued)
Industry Name Industry
code
Average number of firms
% of sample
Industry average value (£000's) % Value
Retail, Hard lines 90 35 2.72 4,657,454 0.65 Chemicals, Commodity 92 10 0.75 7,970,673 1.12 Chemicals Advanced Materials 93 7 0.56 1,004,716 0.14 TV, Radio + Film 94 27 2.05 3,446,935 0.48 Pharmaceuticals 95 12 0.90 55,151,377 7.74 Oil Integrated 97 7 0.54 44,235,743 6.21 Aerospace 98 14 1.08 5,403,645 0.76 Shipping + Ports 99 12 0.91 6,447,532 0.91 Gambling 100 8 0.60 1,237,403 0.17 Diversified Industry 101 12 0.94 1,072,348 0.15 Banks 102 9 0.72 100,841,513 14.16 Gold Mining 119 5 0.39 71,798 0.01 Eng. Fabricators 120 22 1.66 640,584 0.09 Other Mining 122 9 0.68 14,723,432 2.07 Telecom Equipment 126 7 0.54 11,067,723 1.55 Airlines + Airports 129 7 0.53 12,716,335 1.79 Rail, Road, Freight 131 17 1.34 6,161,309 0.86 Med Equip + Supplies 132 21 1.64 3,583,511 0.50 Education + Training 134 13 1.04 491,650 0.07 Electricity 140 13 0.98 24,655,969 3.46 Telecom Fixed Line 142 6 0.50 44,540,962 6.25 Telecom Wireless 143 5 0.41 30,142,867 4.23 Water 144 17 1.29 15,491,432 2.17 Computer Services 150 25 1.90 3,828,309 0.54 Internet 151 9 0.71 625,987 0.09 Biotechnology 157 15 1.13 2,019,470 0.28 Total 1,294 712,327,316 Mean 18.23 10,032,779 Median 13.93 3,583,511 Standard Deviation 15.06 16,076,540
Notes: The Table reports the average number of firms in each industry as a percentage of the population of firms (% of sample) over the sample period. The industry code is Datastream’s level 6, which is similar to SIC 4. Industry average value is measured as industry average total market value (TMV). % Value is calculated as the industry average TMV as a percentage of the population of firms. TMV is calculated as the sum of the market value of equity plus the book value of debt, measured at the beginning of each year.
42
Table 2 Takeover, divestiture activity and stock performance over the sample period Takeovers Divestitures Stock performance
Year Number % Equal Value (£000's) %
Value Number % Equal Value (£000's) % Value Cumulative average
returns 1986 74 7.82 3,066,483 1.05 9 1.60 23,869,597 0.76 33.86% 1987 74 7.82 3,624,801 1.24 14 2.49 27,448,820 0.87 30.84% 1988 69 7.29 7,504,793 2.58 28 4.98 57,420,116 1.83 22.04% 1989 55 5.81 9,917,358 3.40 37 6.58 93,355,570 2.97 2.99% 1990 53 5.60 3,922,629 1.35 37 6.58 76,125,477 2.42 -16.37% 1991 41 4.33 5,460,970 1.87 24 4.27 119,301,211 3.80 21.63% 1992 22 2.33 3,561,571 1.22 28 4.98 102,957,378 3.28 6.55% 1993 28 2.96 1,719,958 0.59 35 6.23 157,834,425 5.02 21.60% 1994 25 2.64 1,834,991 0.63 31 5.52 149,957,985 4.77 1.75% 1995 45 4.76 31,974,634 10.97 40 7.12 136,030,652 4.33 9.23% 1996 46 4.86 17,671,604 6.06 40 7.12 221,222,888 7.04 13.00% 1997 62 6.55 14,062,802 4.83 59 10.50 327,804,980 10.43 6.36% 1998 94 9.94 18,177,858 6.24 55 9.79 321,783,518 10.24 7.60% 1999 144 15.22 118,755,238 40.75 61 10.85 488,823,693 15.56 24.00% 2000 114 12.05 50,133,213 17.20 64 11.39 838,259,535 26.68 40.45% Total events 946 100.00 291,388,903 100.00 562 100.00 3,142,195,845 100.00 Mean 63 6.67 19,425,927 6.67 37.47 6.67 209,479,723 6.67 15.04% Median 55 5.81 7,504,793 2.58 37.00 6.58 136,030,652 4.33 13.00% Standard Dev. 34 3.58 30,542,644 10.48 16.50 2.94 216,004,083 6.87 14.68%
Notes: The Table reports the number of successful takeovers and divestitures over the sample period 1986 to 2000. Information on restructuring events is compiled from SDC platinum and Acquisitions Monthly. Divestitures represent the number of firms that sold subsidiaries with a value of at least $US50 million to third parties, including management. Of the 562 firms that made divestitures, 29 were later acquired. The Table omits bankruptcies, which account for 103 firms over the sample period. % Equal is calculated as the number of transactions each calendar year divided by the number of firms in the population at the beginning of the year. Value is the total market value (TMV) of all transactions, calculated at the beginning of the year. % Value is the TMV of all transactions as a percentage of the TMV of the population of firms, measured as the beginning of the year. Cumulative average returns are calculated by summing the average 12 monthly cross-sectional returns for all firms in the population for each year.
43
Table 3 Industry distribution of takeovers and divestitures Panel A: Equally weighted proportions
Industry Name Industry
code Number of takeovers % Equal
Number of divestitures % Equal
Building Materials 30 32 3.38 42 7.47 Builders Merchants 32 18 1.90 6 1.07 Chemicals, Speciality 33 10 1.06 19 3.38 Computer Hardware 34 0 0.00 1 0.18 Farming + Fishing 35 0 0.00 0 0.00 House Building 36 22 2.33 5 0.89 Electrical Equipment 37 25 2.64 1 0.18 Other Construction 39 11 1.16 3 0.53 Delivery Services 40 6 0.63 0 0.00 Media Agencies 41 16 1.69 4 0.71 Engineering Contractors 43 19 2.01 3 0.53 Defence 44 0 0.00 1 0.18 Transaction + Payroll 46 15 1.59 1 0.18 Environmental Control 47 6 0.63 0 0.00 Hospital Management 49 2 0.21 1 0.18 Oil + Gas Exploration/Prod. 50 16 1.69 8 1.42 Oil Services 51 5 0.53 0 0.00 Non-Ferrous Metals 54 4 0.42 0 0.00 Leisure Facilities 55 37 3.91 9 1.60 Steel 56 2 0.21 3 0.53 Electronic Equipment 57 81 8.56 18 3.20 Software 58 17 1.80 3 0.53 Hsehold Appliances + Hsewares 59 1 0.11 0 0.00 Furniture + Floor covering 60 13 1.37 1 0.18 Leisure Equipment 61 3 0.32 0 0.00 Household Products 62 0 0.00 0 0.00 Auto Parts 63 13 1.37 6 1.07 Vehicle Distribution 64 20 2.11 9 1.60 Retailers, Soft Goods 66 3 0.32 19 3.38 Brewers 67 2 0.21 0 0.00 Distillers + Vintners 68 4 0.42 15 2.67 Clothing + Footwear 69 21 2.22 2 0.36 Other Health Care 70 0 0.00 0 0.00 Food Processors 71 37 3.91 40 7.12 Restaurants + Pubs 72 13 1.37 21 3.74 Engineering, General 74 64 6.77 43 7.65 Consumer Electronics 75 27 2.85 3 0.53 Textiles + Leather Goods 78 20 2.11 3 0.53 Hotels 80 19 2.01 19 3.38 Security + Alarms 81 6 0.63 2 0.36 Paper 82 3 0.32 0 0.00 Food + Drug Retailers 83 11 1.16 11 1.96 Publishing + Printing 84 43 4.55 32 5.69 Business Support 86 42 4.44 28 4.98 Retailers, Multi Dept 87 6 0.63 11 1.96
44
Table 3 Panel A (Continued)
Industry Name Industry
code Number of takeovers % Equal
Number of divestitures % Equal
Retail, Hardlines 90 47 4.97 9 1.60 Chemicals, Commodity 92 15 1.59 7 1.25 Chemicals Advanced Materials 93 10 1.06 1 0.18 TV, Radio + Film 94 20 2.11 9 1.60 Pharmaceuticals 95 13 1.37 10 1.78 Oil Integrated 97 3 0.32 4 0.71 Aerospace 98 9 0.95 9 1.60 Shipping + Ports 99 6 0.63 12 2.14 Gambling 100 4 0.42 3 0.53 Diversified Industry 101 15 1.59 3 0.53 Banks 102 4 0.42 41 7.30 Gold Mining 119 0 0.00 0 0.00 Engineering Fabricators 120 15 1.59 0 0.00 Other Mining 122 3 0.32 1 0.18 Telecom Equipment 126 1 0.11 10 1.78 Airlines + Airports 129 1 0.11 11 1.96 Rail, Road, Freight 131 13 1.37 4 0.71 Med Equip + Supplies 132 12 1.27 4 0.71 Education + Training 134 6 0.63 0 0.00 Electricity 140 12 1.27 10 1.78 Telecom Fixed Line 142 1 0.11 9 1.60 Telecom Wireless 143 1 0.11 2 0.36 Water 144 10 1.06 5 0.89 Computer Services 150 9 0.95 3 0.53 Internet 151 1 0.11 0 0.00 Biotechnology 157 0 0.00 2 0.36 Total 946 100 562 100
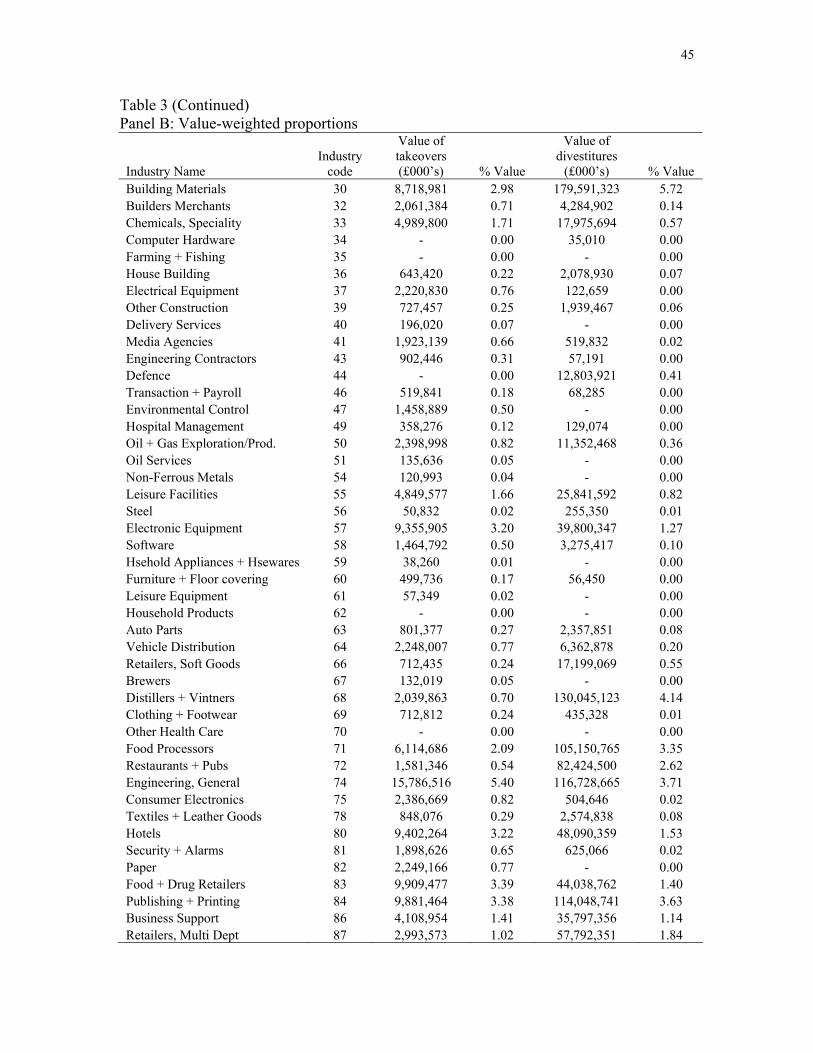
45
Table 3 (Continued) Panel B: Value-weighted proportions
Industry Name Industry
code
Value of takeovers (£000’s) % Value
Value of divestitures
(£000’s) % Value Building Materials 30 8,718,981 2.98 179,591,323 5.72 Builders Merchants 32 2,061,384 0.71 4,284,902 0.14 Chemicals, Speciality 33 4,989,800 1.71 17,975,694 0.57 Computer Hardware 34 - 0.00 35,010 0.00 Farming + Fishing 35 - 0.00 - 0.00 House Building 36 643,420 0.22 2,078,930 0.07 Electrical Equipment 37 2,220,830 0.76 122,659 0.00 Other Construction 39 727,457 0.25 1,939,467 0.06 Delivery Services 40 196,020 0.07 - 0.00 Media Agencies 41 1,923,139 0.66 519,832 0.02 Engineering Contractors 43 902,446 0.31 57,191 0.00 Defence 44 - 0.00 12,803,921 0.41 Transaction + Payroll 46 519,841 0.18 68,285 0.00 Environmental Control 47 1,458,889 0.50 - 0.00 Hospital Management 49 358,276 0.12 129,074 0.00 Oil + Gas Exploration/Prod. 50 2,398,998 0.82 11,352,468 0.36 Oil Services 51 135,636 0.05 - 0.00 Non-Ferrous Metals 54 120,993 0.04 - 0.00 Leisure Facilities 55 4,849,577 1.66 25,841,592 0.82 Steel 56 50,832 0.02 255,350 0.01 Electronic Equipment 57 9,355,905 3.20 39,800,347 1.27 Software 58 1,464,792 0.50 3,275,417 0.10 Hsehold Appliances + Hsewares 59 38,260 0.01 - 0.00 Furniture + Floor covering 60 499,736 0.17 56,450 0.00 Leisure Equipment 61 57,349 0.02 - 0.00 Household Products 62 - 0.00 - 0.00 Auto Parts 63 801,377 0.27 2,357,851 0.08 Vehicle Distribution 64 2,248,007 0.77 6,362,878 0.20 Retailers, Soft Goods 66 712,435 0.24 17,199,069 0.55 Brewers 67 132,019 0.05 - 0.00 Distillers + Vintners 68 2,039,863 0.70 130,045,123 4.14 Clothing + Footwear 69 712,812 0.24 435,328 0.01 Other Health Care 70 - 0.00 - 0.00 Food Processors 71 6,114,686 2.09 105,150,765 3.35 Restaurants + Pubs 72 1,581,346 0.54 82,424,500 2.62 Engineering, General 74 15,786,516 5.40 116,728,665 3.71 Consumer Electronics 75 2,386,669 0.82 504,646 0.02 Textiles + Leather Goods 78 848,076 0.29 2,574,838 0.08 Hotels 80 9,402,264 3.22 48,090,359 1.53 Security + Alarms 81 1,898,626 0.65 625,066 0.02 Paper 82 2,249,166 0.77 - 0.00 Food + Drug Retailers 83 9,909,477 3.39 44,038,762 1.40 Publishing + Printing 84 9,881,464 3.38 114,048,741 3.63 Business Support 86 4,108,954 1.41 35,797,356 1.14 Retailers, Multi Dept 87 2,993,573 1.02 57,792,351 1.84
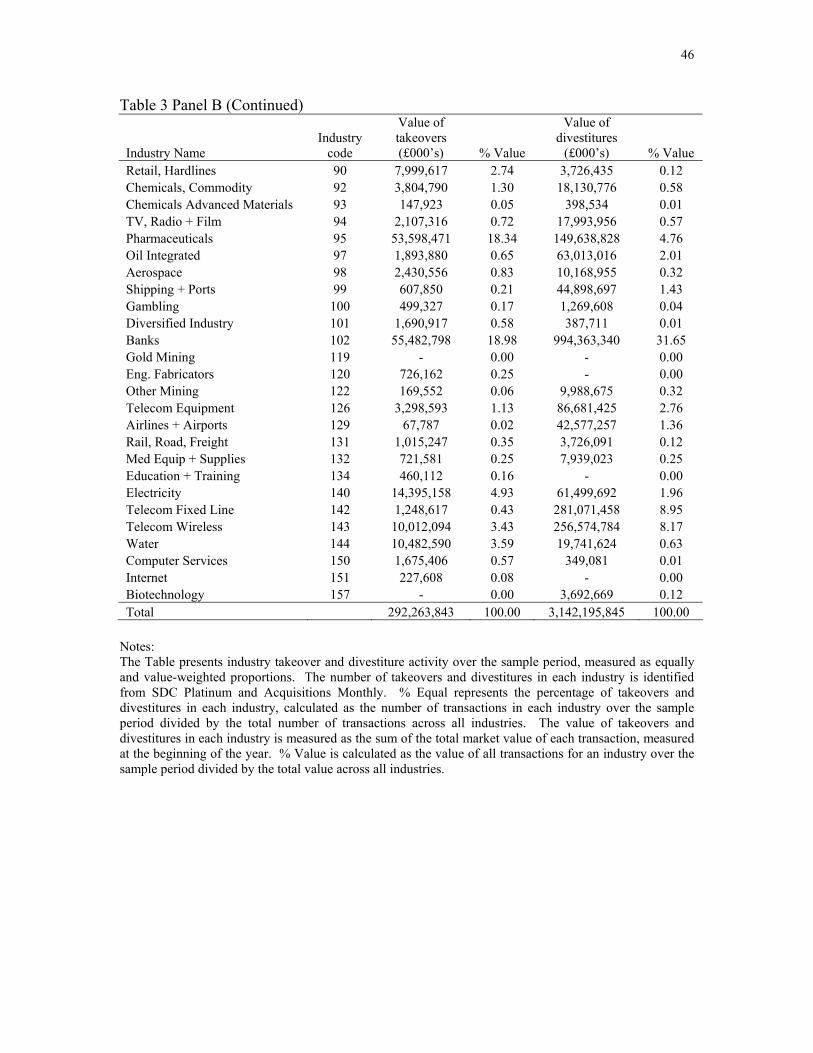
46
Table 3 Panel B (Continued)
Industry Name Industry
code
Value of takeovers (£000’s) % Value
Value of divestitures
(£000’s) % Value Retail, Hardlines 90 7,999,617 2.74 3,726,435 0.12 Chemicals, Commodity 92 3,804,790 1.30 18,130,776 0.58 Chemicals Advanced Materials 93 147,923 0.05 398,534 0.01 TV, Radio + Film 94 2,107,316 0.72 17,993,956 0.57 Pharmaceuticals 95 53,598,471 18.34 149,638,828 4.76 Oil Integrated 97 1,893,880 0.65 63,013,016 2.01 Aerospace 98 2,430,556 0.83 10,168,955 0.32 Shipping + Ports 99 607,850 0.21 44,898,697 1.43 Gambling 100 499,327 0.17 1,269,608 0.04 Diversified Industry 101 1,690,917 0.58 387,711 0.01 Banks 102 55,482,798 18.98 994,363,340 31.65 Gold Mining 119 - 0.00 - 0.00 Eng. Fabricators 120 726,162 0.25 - 0.00 Other Mining 122 169,552 0.06 9,988,675 0.32 Telecom Equipment 126 3,298,593 1.13 86,681,425 2.76 Airlines + Airports 129 67,787 0.02 42,577,257 1.36 Rail, Road, Freight 131 1,015,247 0.35 3,726,091 0.12 Med Equip + Supplies 132 721,581 0.25 7,939,023 0.25 Education + Training 134 460,112 0.16 - 0.00 Electricity 140 14,395,158 4.93 61,499,692 1.96 Telecom Fixed Line 142 1,248,617 0.43 281,071,458 8.95 Telecom Wireless 143 10,012,094 3.43 256,574,784 8.17 Water 144 10,482,590 3.59 19,741,624 0.63 Computer Services 150 1,675,406 0.57 349,081 0.01 Internet 151 227,608 0.08 - 0.00 Biotechnology 157 - 0.00 3,692,669 0.12 Total 292,263,843 100.00 3,142,195,845 100.00
Notes: The Table presents industry takeover and divestiture activity over the sample period, measured as equally and value-weighted proportions. The number of takeovers and divestitures in each industry is identified from SDC Platinum and Acquisitions Monthly. % Equal represents the percentage of takeovers and divestitures in each industry, calculated as the number of transactions in each industry over the sample period divided by the total number of transactions across all industries. The value of takeovers and divestitures in each industry is measured as the sum of the total market value of each transaction, measured at the beginning of the year. % Value is calculated as the value of all transactions for an industry over the sample period divided by the total value across all industries.
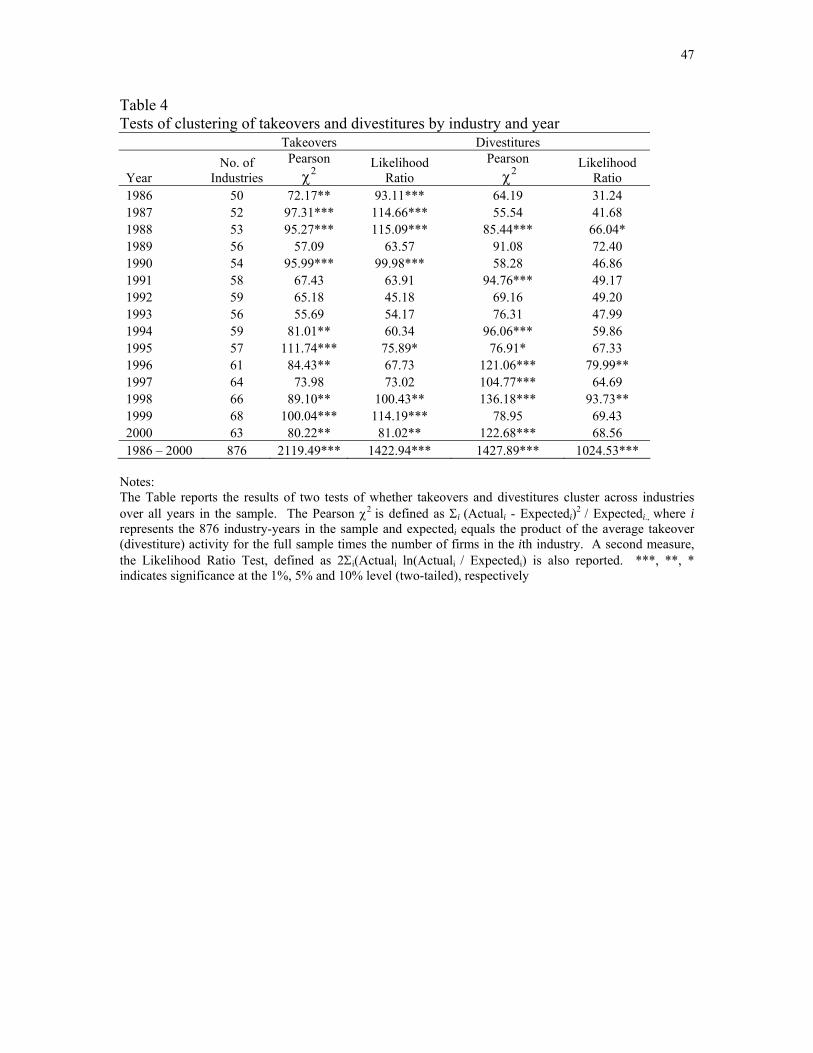
47
Table 4 Tests of clustering of takeovers and divestitures by industry and year Takeovers Divestitures
Year No. of
Industries Pearson χ2
Likelihood Ratio
Pearson χ2
Likelihood Ratio
1986 50 72.17** 93.11*** 64.19 31.24 1987 52 97.31*** 114.66*** 55.54 41.68 1988 53 95.27*** 115.09*** 85.44*** 66.04* 1989 56 57.09 63.57 91.08 72.40 1990 54 95.99*** 99.98*** 58.28 46.86 1991 58 67.43 63.91 94.76*** 49.17 1992 59 65.18 45.18 69.16 49.20 1993 56 55.69 54.17 76.31 47.99 1994 59 81.01** 60.34 96.06*** 59.86 1995 57 111.74*** 75.89* 76.91* 67.33 1996 61 84.43** 67.73 121.06*** 79.99** 1997 64 73.98 73.02 104.77*** 64.69 1998 66 89.10** 100.43** 136.18*** 93.73** 1999 68 100.04*** 114.19*** 78.95 69.43 2000 63 80.22** 81.02** 122.68*** 68.56 1986 – 2000 876 2119.49*** 1422.94*** 1427.89*** 1024.53***
Notes: The Table reports the results of two tests of whether takeovers and divestitures cluster across industries over all years in the sample. The Pearson χ2 is defined as Σi (Actuali - Expectedi)2 / Expectedi., where i represents the 876 industry-years in the sample and expectedi equals the product of the average takeover (divestiture) activity for the full sample times the number of firms in the ith industry. A second measure, the Likelihood Ratio Test, defined as 2Σi(Actuali ln(Actuali / Expectedi) is also reported. ***, **, * indicates significance at the 1%, 5% and 10% level (two-tailed), respectively
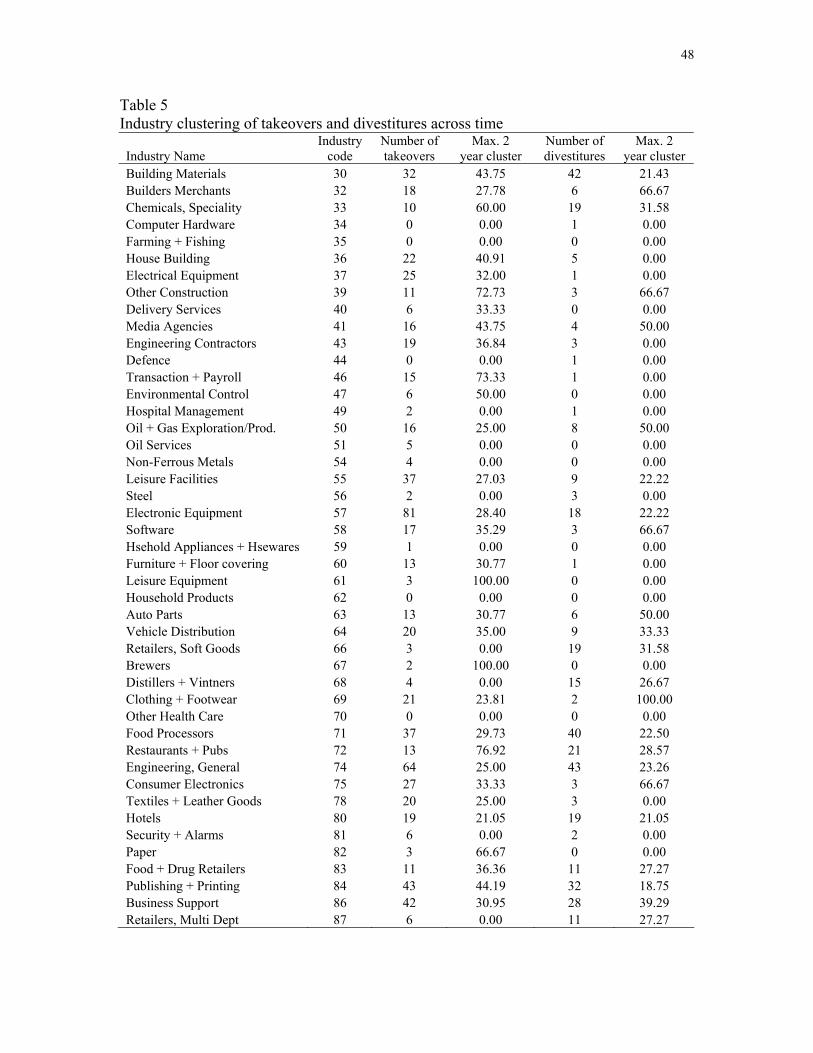
48
Table 5 Industry clustering of takeovers and divestitures across time
Industry Name Industry
code Number of takeovers
Max. 2 year cluster
Number of divestitures
Max. 2 year cluster
Building Materials 30 32 43.75 42 21.43 Builders Merchants 32 18 27.78 6 66.67 Chemicals, Speciality 33 10 60.00 19 31.58 Computer Hardware 34 0 0.00 1 0.00 Farming + Fishing 35 0 0.00 0 0.00 House Building 36 22 40.91 5 0.00 Electrical Equipment 37 25 32.00 1 0.00 Other Construction 39 11 72.73 3 66.67 Delivery Services 40 6 33.33 0 0.00 Media Agencies 41 16 43.75 4 50.00 Engineering Contractors 43 19 36.84 3 0.00 Defence 44 0 0.00 1 0.00 Transaction + Payroll 46 15 73.33 1 0.00 Environmental Control 47 6 50.00 0 0.00 Hospital Management 49 2 0.00 1 0.00 Oil + Gas Exploration/Prod. 50 16 25.00 8 50.00 Oil Services 51 5 0.00 0 0.00 Non-Ferrous Metals 54 4 0.00 0 0.00 Leisure Facilities 55 37 27.03 9 22.22 Steel 56 2 0.00 3 0.00 Electronic Equipment 57 81 28.40 18 22.22 Software 58 17 35.29 3 66.67 Hsehold Appliances + Hsewares 59 1 0.00 0 0.00 Furniture + Floor covering 60 13 30.77 1 0.00 Leisure Equipment 61 3 100.00 0 0.00 Household Products 62 0 0.00 0 0.00 Auto Parts 63 13 30.77 6 50.00 Vehicle Distribution 64 20 35.00 9 33.33 Retailers, Soft Goods 66 3 0.00 19 31.58 Brewers 67 2 100.00 0 0.00 Distillers + Vintners 68 4 0.00 15 26.67 Clothing + Footwear 69 21 23.81 2 100.00 Other Health Care 70 0 0.00 0 0.00 Food Processors 71 37 29.73 40 22.50 Restaurants + Pubs 72 13 76.92 21 28.57 Engineering, General 74 64 25.00 43 23.26 Consumer Electronics 75 27 33.33 3 66.67 Textiles + Leather Goods 78 20 25.00 3 0.00 Hotels 80 19 21.05 19 21.05 Security + Alarms 81 6 0.00 2 0.00 Paper 82 3 66.67 0 0.00 Food + Drug Retailers 83 11 36.36 11 27.27 Publishing + Printing 84 43 44.19 32 18.75 Business Support 86 42 30.95 28 39.29 Retailers, Multi Dept 87 6 0.00 11 27.27
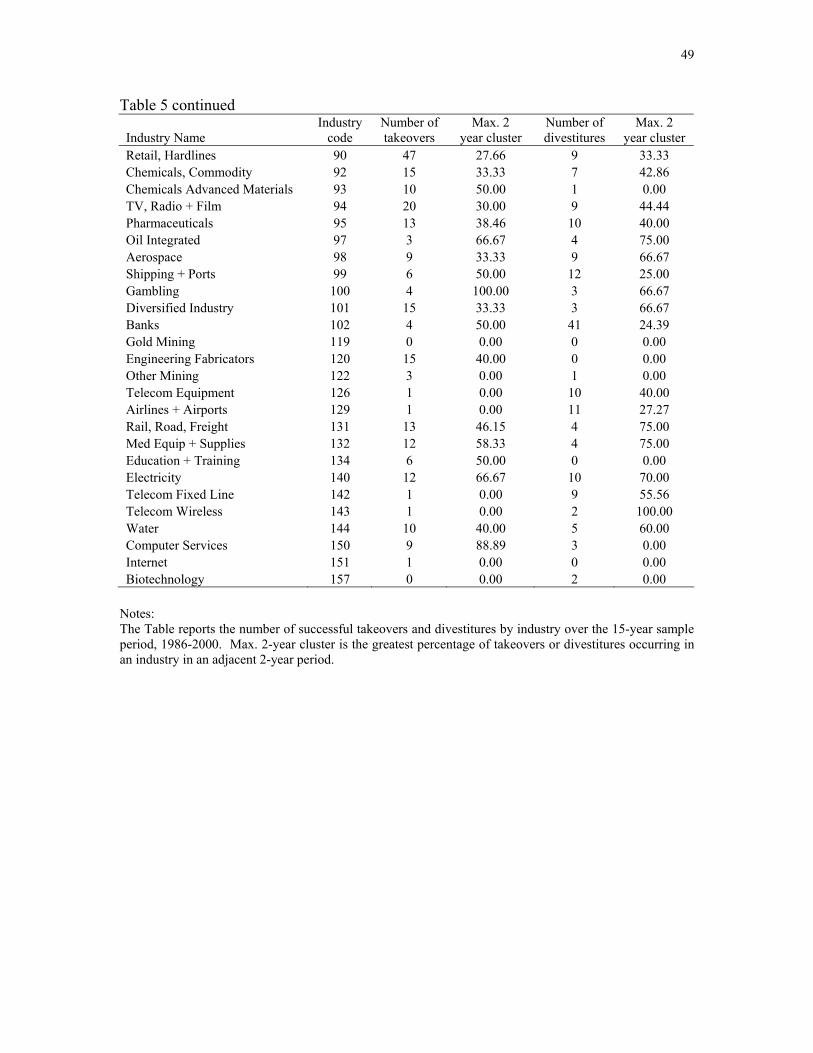
49
Table 5 continued
Industry Name Industry
code Number of takeovers
Max. 2 year cluster
Number of divestitures
Max. 2 year cluster
Retail, Hardlines 90 47 27.66 9 33.33 Chemicals, Commodity 92 15 33.33 7 42.86 Chemicals Advanced Materials 93 10 50.00 1 0.00 TV, Radio + Film 94 20 30.00 9 44.44 Pharmaceuticals 95 13 38.46 10 40.00 Oil Integrated 97 3 66.67 4 75.00 Aerospace 98 9 33.33 9 66.67 Shipping + Ports 99 6 50.00 12 25.00 Gambling 100 4 100.00 3 66.67 Diversified Industry 101 15 33.33 3 66.67 Banks 102 4 50.00 41 24.39 Gold Mining 119 0 0.00 0 0.00 Engineering Fabricators 120 15 40.00 0 0.00 Other Mining 122 3 0.00 1 0.00 Telecom Equipment 126 1 0.00 10 40.00 Airlines + Airports 129 1 0.00 11 27.27 Rail, Road, Freight 131 13 46.15 4 75.00 Med Equip + Supplies 132 12 58.33 4 75.00 Education + Training 134 6 50.00 0 0.00 Electricity 140 12 66.67 10 70.00 Telecom Fixed Line 142 1 0.00 9 55.56 Telecom Wireless 143 1 0.00 2 100.00 Water 144 10 40.00 5 60.00 Computer Services 150 9 88.89 3 0.00 Internet 151 1 0.00 0 0.00 Biotechnology 157 0 0.00 2 0.00
Notes: The Table reports the number of successful takeovers and divestitures by industry over the 15-year sample period, 1986-2000. Max. 2-year cluster is the greatest percentage of takeovers or divestitures occurring in an industry in an adjacent 2-year period.
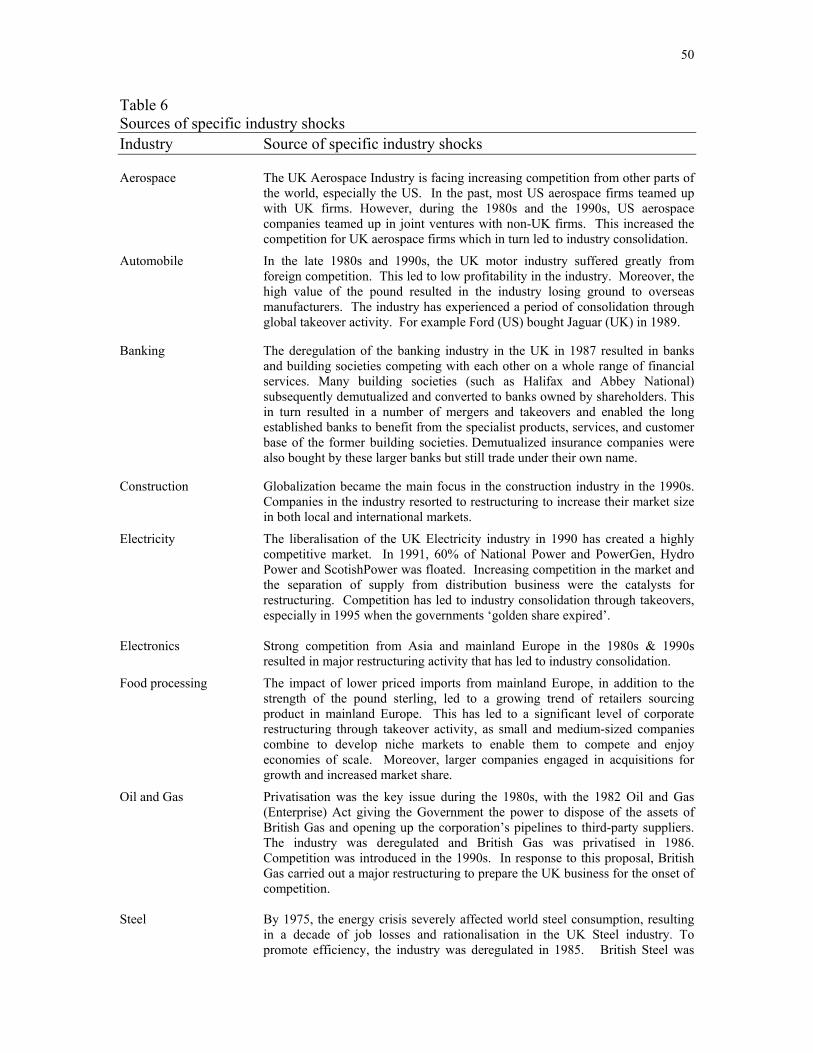
50
Table 6 Sources of specific industry shocks Industry Source of specific industry shocks Aerospace The UK Aerospace Industry is facing increasing competition from other parts of
the world, especially the US. In the past, most US aerospace firms teamed up with UK firms. However, during the 1980s and the 1990s, US aerospace companies teamed up in joint ventures with non-UK firms. This increased the competition for UK aerospace firms which in turn led to industry consolidation.
Automobile In the late 1980s and 1990s, the UK motor industry suffered greatly from foreign competition. This led to low profitability in the industry. Moreover, the high value of the pound resulted in the industry losing ground to overseas manufacturers. The industry has experienced a period of consolidation through global takeover activity. For example Ford (US) bought Jaguar (UK) in 1989.
Banking The deregulation of the banking industry in the UK in 1987 resulted in banks and building societies competing with each other on a whole range of financial services. Many building societies (such as Halifax and Abbey National) subsequently demutualized and converted to banks owned by shareholders. This in turn resulted in a number of mergers and takeovers and enabled the long established banks to benefit from the specialist products, services, and customer base of the former building societies. Demutualized insurance companies were also bought by these larger banks but still trade under their own name.
Construction Globalization became the main focus in the construction industry in the 1990s. Companies in the industry resorted to restructuring to increase their market size in both local and international markets.
Electricity The liberalisation of the UK Electricity industry in 1990 has created a highly competitive market. In 1991, 60% of National Power and PowerGen, Hydro Power and ScotishPower was floated. Increasing competition in the market and the separation of supply from distribution business were the catalysts for restructuring. Competition has led to industry consolidation through takeovers, especially in 1995 when the governments ‘golden share expired’.
Electronics Strong competition from Asia and mainland Europe in the 1980s & 1990s
resulted in major restructuring activity that has led to industry consolidation.
Food processing The impact of lower priced imports from mainland Europe, in addition to the strength of the pound sterling, led to a growing trend of retailers sourcing product in mainland Europe. This has led to a significant level of corporate restructuring through takeover activity, as small and medium-sized companies combine to develop niche markets to enable them to compete and enjoy economies of scale. Moreover, larger companies engaged in acquisitions for growth and increased market share.
Oil and Gas Privatisation was the key issue during the 1980s, with the 1982 Oil and Gas (Enterprise) Act giving the Government the power to dispose of the assets of British Gas and opening up the corporation’s pipelines to third-party suppliers. The industry was deregulated and British Gas was privatised in 1986. Competition was introduced in the 1990s. In response to this proposal, British Gas carried out a major restructuring to prepare the UK business for the onset of competition.
Steel By 1975, the energy crisis severely affected world steel consumption, resulting
in a decade of job losses and rationalisation in the UK Steel industry. To promote efficiency, the industry was deregulated in 1985. British Steel was
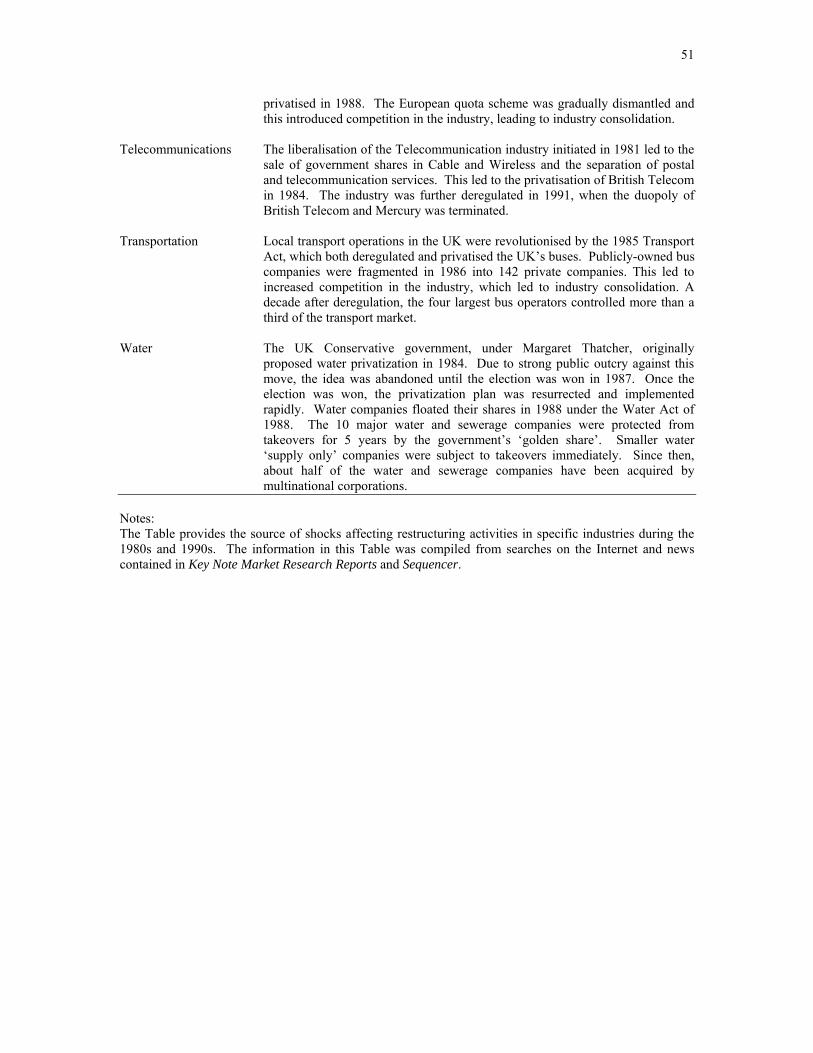
51
privatised in 1988. The European quota scheme was gradually dismantled and this introduced competition in the industry, leading to industry consolidation.
Telecommunications The liberalisation of the Telecommunication industry initiated in 1981 led to the
sale of government shares in Cable and Wireless and the separation of postal and telecommunication services. This led to the privatisation of British Telecom in 1984. The industry was further deregulated in 1991, when the duopoly of British Telecom and Mercury was terminated.
Transportation Local transport operations in the UK were revolutionised by the 1985 Transport
Act, which both deregulated and privatised the UK’s buses. Publicly-owned bus companies were fragmented in 1986 into 142 private companies. This led to increased competition in the industry, which led to industry consolidation. A decade after deregulation, the four largest bus operators controlled more than a third of the transport market.
Water The UK Conservative government, under Margaret Thatcher, originally
proposed water privatization in 1984. Due to strong public outcry against this move, the idea was abandoned until the election was won in 1987. Once the election was won, the privatization plan was resurrected and implemented rapidly. Water companies floated their shares in 1988 under the Water Act of 1988. The 10 major water and sewerage companies were protected from takeovers for 5 years by the government’s ‘golden share’. Smaller water ‘supply only’ companies were subject to takeovers immediately. Since then, about half of the water and sewerage companies have been acquired by multinational corporations.
Notes: The Table provides the source of shocks affecting restructuring activities in specific industries during the 1980s and 1990s. The information in this Table was compiled from searches on the Internet and news contained in Key Note Market Research Reports and Sequencer.
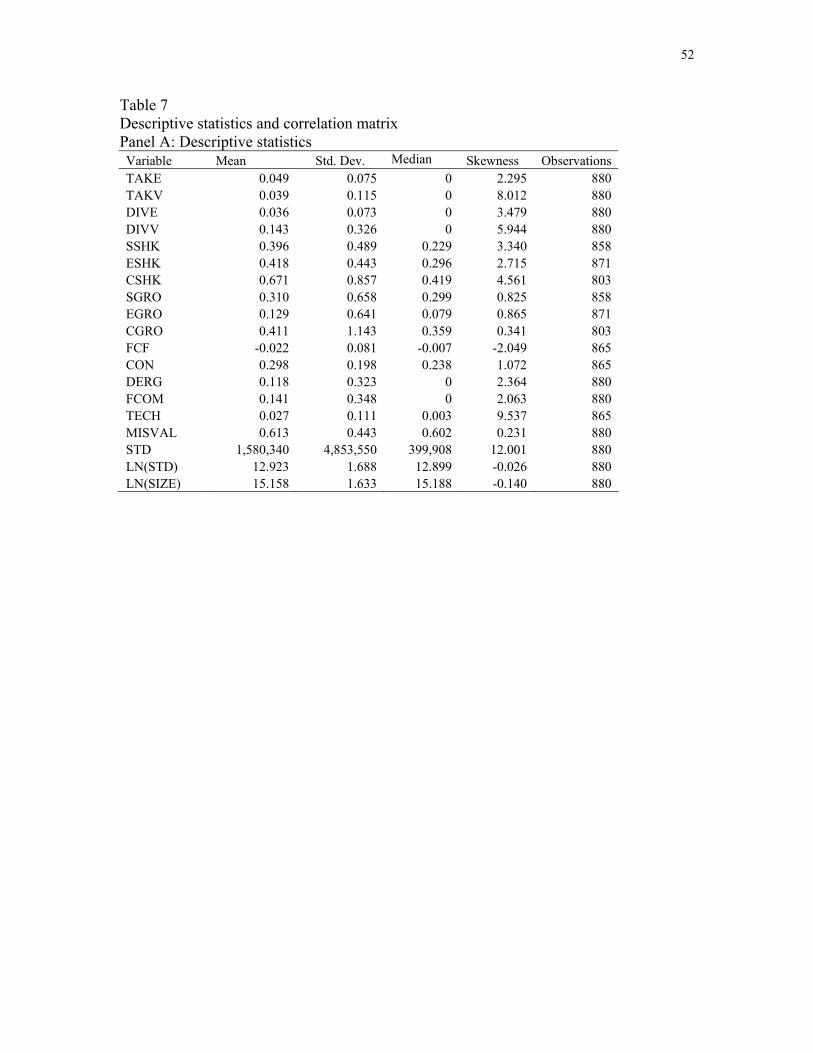
52
Table 7 Descriptive statistics and correlation matrix Panel A: Descriptive statistics Variable Mean Std. Dev. Median Skewness Observations TAKE 0.049 0.075 0 2.295 880 TAKV 0.039 0.115 0 8.012 880 DIVE 0.036 0.073 0 3.479 880 DIVV 0.143 0.326 0 5.944 880 SSHK 0.396 0.489 0.229 3.340 858 ESHK 0.418 0.443 0.296 2.715 871 CSHK 0.671 0.857 0.419 4.561 803 SGRO 0.310 0.658 0.299 0.825 858 EGRO 0.129 0.641 0.079 0.865 871 CGRO 0.411 1.143 0.359 0.341 803 FCF -0.022 0.081 -0.007 -2.049 865 CON 0.298 0.198 0.238 1.072 865 DERG 0.118 0.323 0 2.364 880 FCOM 0.141 0.348 0 2.063 880 TECH 0.027 0.111 0.003 9.537 865 MISVAL 0.613 0.443 0.602 0.231 880 STD 1,580,340 4,853,550 399,908 12.001 880 LN(STD) 12.923 1.688 12.899 -0.026 880 LN(SIZE) 15.158 1.633 15.188 -0.140 880
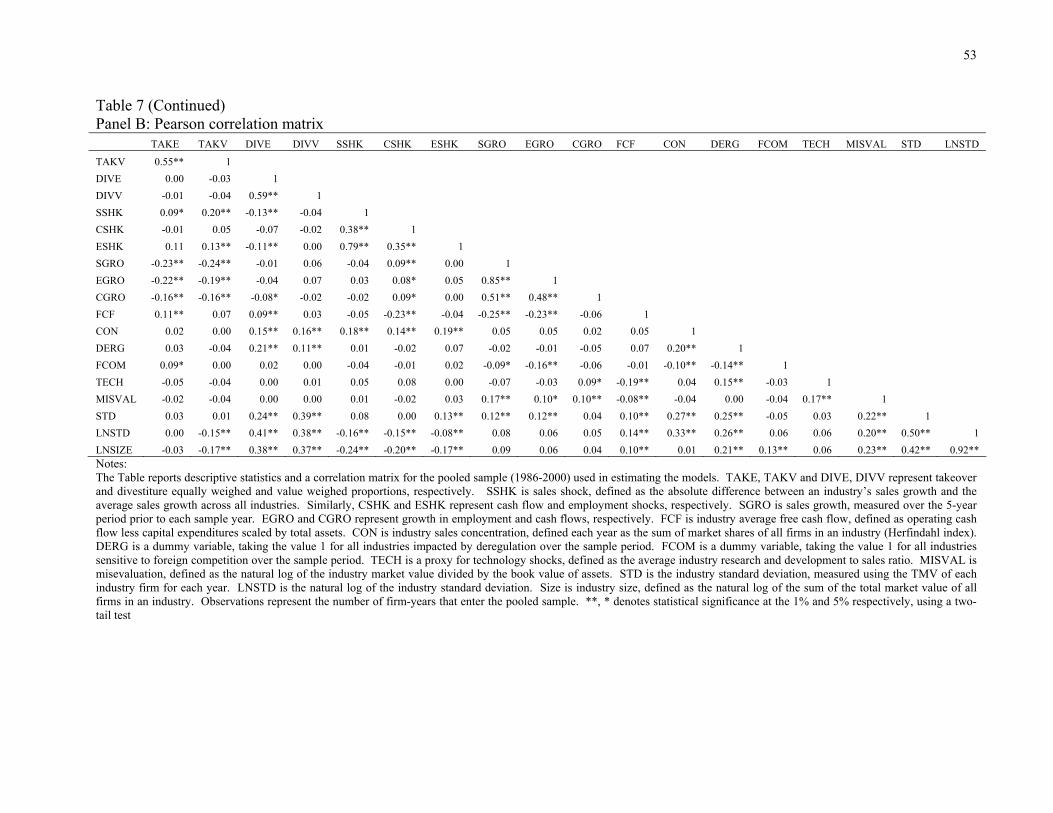
53
Table 7 (Continued) Panel B: Pearson correlation matrix TAKE TAKV DIVE DIVV SSHK CSHK ESHK SGRO EGRO CGRO FCF CON DERG FCOM TECH MISVAL STD LNSTD
TAKV 0.55** 1DIVE
0.00 -0.03 1DIVV -0.01 -0.04 0.59** 1SSHK 0.09* 0.20** -0.13** -0.04 1CSHK -0.01 0.05 -0.07 -0.02 0.38** 1ESHK 0.11 0.13** -0.11** 0.00 0.79** 0.35** 1SGRO -0.23** -0.24** -0.01 0.06 -0.04 0.09** 0.00 1EGRO -0.22** -0.19** -0.04 0.07 0.03 0.08* 0.05 0.85** 1CGRO -0.16** -0.16** -0.08* -0.02 -0.02 0.09* 0.00 0.51** 0.48** 1FCF 0.11** 0.07 0.09** 0.03 -0.05 -0.23** -0.04 -0.25** -0.23** -0.06 1 CON 0.02 0.00 0.15** 0.16** 0.18** 0.14** 0.19** 0.05 0.05 0.02 0.05 1DERG 0.03 -0.04 0.21** 0.11** 0.01 -0.02 0.07 -0.02 -0.01 -0.05 0.07 0.20** 1 FCOM 0.09* 0.00 0.02 0.00 -0.04 -0.01 0.02 -0.09* -0.16** -0.06 -0.01 -0.10** -0.14** 1TECH -0.05 -0.04 0.00 0.01 0.05 0.08 0.00 -0.07 -0.03 0.09* -0.19** 0.04 0.15** -0.03 1 MISVAL -0.02 -0.04 0.00 0.00 0.01 -0.02 0.03 0.17** 0.10* 0.10** -0.08** -0.04 0.00 -0.04 0.17** 1 STD 0.03 0.01 0.24** 0.39** 0.08 0.00 0.13** 0.12** 0.12** 0.04 0.10** 0.27** 0.25** -0.05 0.03 0.22** 1LNSTD 0.00 -0.15** 0.41** 0.38** -0.16** -0.15** -0.08** 0.08 0.06 0.05 0.14** 0.33** 0.26** 0.06 0.06 0.20** 0.50** 1LNSIZE -0.03 -0.17** 0.38** 0.37** -0.24** -0.20** -0.17** 0.09 0.06 0.04 0.10** 0.01 0.21** 0.13** 0.06 0.23** 0.42** 0.92**Notes: The Table reports descriptive statistics and a correlation matrix for the pooled sample (1986-2000) used in estimating the models. TAKE, TAKV and DIVE, DIVV represent takeover and divestiture equally weighed and value weighed proportions, respectively. SSHK is sales shock, defined as the absolute difference between an industry’s sales growth and the average sales growth across all industries. Similarly, CSHK and ESHK represent cash flow and employment shocks, respectively. SGRO is sales growth, measured over the 5-year period prior to each sample year. EGRO and CGRO represent growth in employment and cash flows, respectively. FCF is industry average free cash flow, defined as operating cash flow less capital expenditures scaled by total assets. CON is industry sales concentration, defined each year as the sum of market shares of all firms in an industry (Herfindahl index). DERG is a dummy variable, taking the value 1 for all industries impacted by deregulation over the sample period. FCOM is a dummy variable, taking the value 1 for all industries sensitive to foreign competition over the sample period. TECH is a proxy for technology shocks, defined as the average industry research and development to sales ratio. MISVAL is misevaluation, defined as the natural log of the industry market value divided by the book value of assets. STD is the industry standard deviation, measured using the TMV of each industry firm for each year. LNSTD is the natural log of the industry standard deviation. Size is industry size, defined as the natural log of the sum of the total market value of all firms in an industry. Observations represent the number of firm-years that enter the pooled sample. **, * denotes statistical significance at the 1% and 5% respectively, using a two-tail test
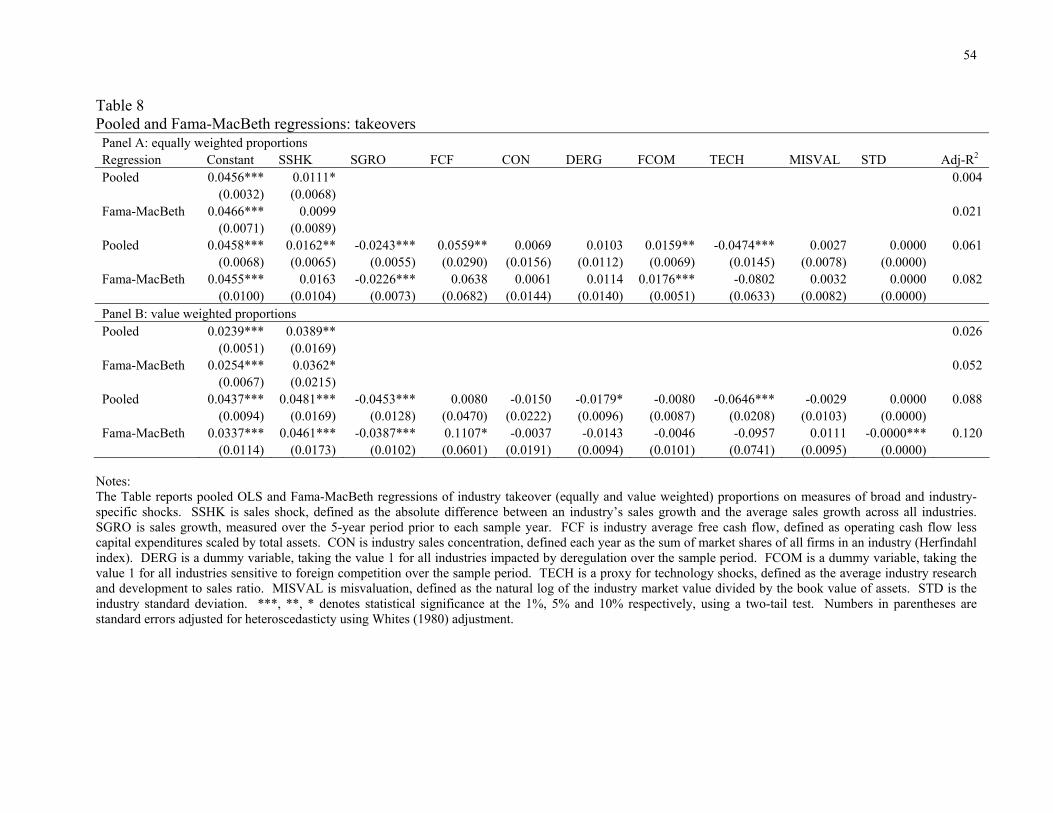
54
Table 8 Pooled and Fama-MacBeth regressions: takeovers
Panel A: equally weighted proportions Regression Constant SSHK
SGRO
FCF CON DERG
FCOM
TECH
MISVAL
STD Adj-R2 Pooled 0.0456*** 0.0111* 0.004 (0.0032) (0.0068)
Fama-MacBeth
0.0466*** 0.0099 0.021 (0.0071) (0.0089)
Pooled
0.0458*** 0.0162** -0.0243*** 0.0559** 0.0069 0.0103 0.0159** -0.0474*** 0.0027 0.0000 0.061 (0.0068) (0.0065) (0.0055) (0.0290) (0.0156)
(0.0112) (0.0069) (0.0145) (0.0078) (0.0000)
Fama-MacBeth
0.0455*** 0.0163 -0.0226*** 0.0638 0.0061 0.0114 0.0176***
-0.0802 0.0032 0.0000 0.082 (0.0100) (0.0104) (0.0073)
(0.0682)
(0.0144)
(0.0140)
(0.0051)
(0.0633)
(0.0082)
(0.0000)
Panel B: value weighted proportions Pooled 0.0239*** 0.0389** 0.026 (0.0051) (0.0169)
Fama-MacBeth
0.0254*** 0.0362* 0.052 (0.0067) (0.0215)
Pooled
0.0437*** 0.0481***
-0.0453*** 0.0080 -0.0150 -0.0179* -0.0080 -0.0646*** -0.0029 0.0000 0.088 (0.0094) (0.0169) (0.0128) (0.0470) (0.0222)
(0.0096) (0.0087) (0.0208) (0.0103) (0.0000)
Fama-MacBeth
0.0337*** 0.0461*** -0.0387*** 0.1107* -0.0037 -0.0143 -0.0046 -0.0957 0.0111 -0.0000*** 0.120(0.0114) (0.0173) (0.0102) (0.0601) (0.0191) (0.0094) (0.0101) (0.0741) (0.0095) (0.0000)
Notes: The Table reports pooled OLS and Fama-MacBeth regressions of industry takeover (equally and value weighted) proportions on measures of broad and industry-specific shocks. SSHK is sales shock, defined as the absolute difference between an industry’s sales growth and the average sales growth across all industries. SGRO is sales growth, measured over the 5-year period prior to each sample year. FCF is industry average free cash flow, defined as operating cash flow less capital expenditures scaled by total assets. CON is industry sales concentration, defined each year as the sum of market shares of all firms in an industry (Herfindahl index). DERG is a dummy variable, taking the value 1 for all industries impacted by deregulation over the sample period. FCOM is a dummy variable, taking the value 1 for all industries sensitive to foreign competition over the sample period. TECH is a proxy for technology shocks, defined as the average industry research and development to sales ratio. MISVAL is misvaluation, defined as the natural log of the industry market value divided by the book value of assets. STD is the industry standard deviation. ***, **, * denotes statistical significance at the 1%, 5% and 10% respectively, using a two-tail test. Numbers in parentheses are standard errors adjusted for heteroscedasticty using Whites (1980) adjustment.
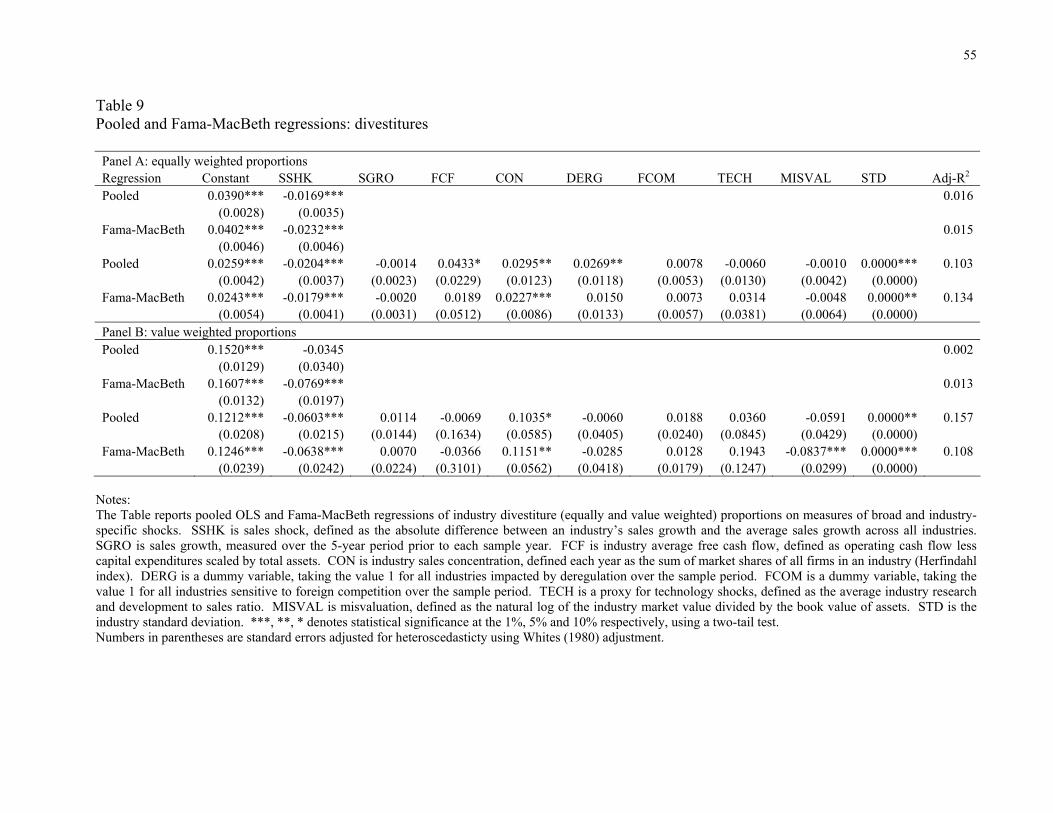
55
Table 9 Pooled and Fama-MacBeth regressions: divestitures Panel A: equally weighted proportions Regression Constant SSHK
SGRO
FCF CON DERG
FCOM
TECH
MISVAL
STD Adj-R2 Pooled 0.0390*** -0.0169*** 0.016 (0.0028) (0.0035)
Fama-MacBeth 0.0402*** -0.0232*** 0.015
(0.0046) (0.0046)Pooled 0.0259*** -0.0204***
-0.0014 0.0433* 0.0295** 0.0269** 0.0078 -0.0060 -0.0010 0.0000***
0.103
(0.0042) (0.0037) (0.0023) (0.0229) (0.0123) (0.0118) (0.0053) (0.0130) (0.0042) (0.0000) Fama-MacBeth 0.0243*** -0.0179*** -0.0020 0.0189 0.0227***
0.0150 0.0073 0.0314 -0.0048 0.0000** 0.134
(0.0054) (0.0041) (0.0031) (0.0512) (0.0086) (0.0133) (0.0057) (0.0381) (0.0064) (0.0000) Panel B: value weighted proportions Pooled 0.1520*** -0.0345 0.002 (0.0129) (0.0340)
Fama-MacBeth 0.1607*** -0.0769*** 0.013
(0.0132) (0.0197)Pooled 0.1212*** -0.0603***
0.0114 -0.0069 0.1035* -0.0060 0.0188 0.0360 -0.0591 0.0000** 0.157
(0.0208) (0.0215) (0.0144) (0.1634) (0.0585) (0.0405) (0.0240) (0.0845) (0.0429) (0.0000) Fama-MacBeth 0.1246*** -0.0638*** 0.0070 -0.0366 0.1151** -0.0285 0.0128 0.1943 -0.0837*** 0.0000***
0.108
(0.0239) (0.0242) (0.0224) (0.3101) (0.0562) (0.0418) (0.0179) (0.1247) (0.0299) (0.0000) Notes: The Table reports pooled OLS and Fama-MacBeth regressions of industry divestiture (equally and value weighted) proportions on measures of broad and industry-specific shocks. SSHK is sales shock, defined as the absolute difference between an industry’s sales growth and the average sales growth across all industries. SGRO is sales growth, measured over the 5-year period prior to each sample year. FCF is industry average free cash flow, defined as operating cash flow less capital expenditures scaled by total assets. CON is industry sales concentration, defined each year as the sum of market shares of all firms in an industry (Herfindahl index). DERG is a dummy variable, taking the value 1 for all industries impacted by deregulation over the sample period. FCOM is a dummy variable, taking the value 1 for all industries sensitive to foreign competition over the sample period. TECH is a proxy for technology shocks, defined as the average industry research and development to sales ratio. MISVAL is misvaluation, defined as the natural log of the industry market value divided by the book value of assets. STD is the industry standard deviation. ***, **, * denotes statistical significance at the 1%, 5% and 10% respectively, using a two-tail test. Numbers in parentheses are standard errors adjusted for heteroscedasticty using Whites (1980) adjustment.