industry insights - westpac · wine forestry and wood products horticulture dairy meat and wool...
TRANSCRIPT
Industry insights
8 November 2016
ContentsSummary 02
Introducing the sector 03
Recent export performance 05
Overcapacity in meat processing 08
Opportunities to grow 10
Challenging domestic and global operating environments 13
Meat and wool farming 15
Meat and wool processing 17
Meat and Wool
INDUSTRY INSIGHTS | November 2016 | 2
The meat and wool sector is the largest primary sector employer in New Zealand, with more than 100,000 full-time equivalent workers (FTEs). It employs double the number of workers in the dairy sector. Meat and wool accounted for $8.1 billion in exports in the year to August.
A challenging domestic and global operating environment
Exports have risen by $1 billion in the last four years, predominantly in beef.
But the sector also faces a number of challenges. We spoke to a large number of farmers, meat and wool processors, farm advisors, and farm support businesses among others to get their views of what the biggest risks and challenges are for the sector. These include:
– falling sheep numbers, and resultant overcapacity have reduced profitability for processing
– overall export weakness for products other than beef, with gains in that product at risk in the United States market
– the growth in competition from an increase in the number of countries trading meat and wool products, the rise in synthetic fibres, and growth in popularity of cheaper protein sources like chicken
– the rise in non-tariff barriers and emerging risks to free trade
– increasing risks to the sector maintaining approval from the public and government to operate as it currently does.
Opportunities for the sector
Opportunities for growth will be driven by higher prices for our products, and by lower costs of production, rather than by volume increases as the number of sheep and beef cattle continues to fall.
One of the biggest weaknesses, and thus opportunities, for the sector, is the lack of a coherent New Zealand “brand” internationally. This does not mean all New Zealand meat and wool products being sold under one label; individual companies were adamant that they want to keep their own brands. However, New Zealand has largely failed to communicate the right ideas about its meat and wool products. Rather than grass-fed animals raised in New Zealand selling at a premium, they are sold because they are cheaper than animals produced elsewhere. Meat and wool products are highly commoditised. A more concerted effort is required to “tell the story” of New Zealand meat and wool, and to create preferences for our products in the way some other sectors have.
A second opportunity to increase prices received for meat and wool products is to ensure each product sells to the highest paying market. China has different preferences for meat cuts compared to Europe, for example, and is willing to pay more for them, so it makes sense to sell those cuts to China. There are also a rising number of alternative uses for certain parts of the animal, including pharmaceuticals. But transporting animal products for pharmaceutical purposes across national boundaries is challenging. Either the regulations will need to change, or New Zealand could seek to capture value by developing pharmaceutical processing here.
Finally, vertical integration, particularly in wool, as well as scale and commercialisation of the family farm are required to adopt technology and other cost-cutting measures to make production cheaper.
The outlook for meat and wool
A number of trends are emerging or expected to continue to in the sector.
– We expect to see a continued reduction in sheep numbers as other productive land uses look more attractive. While dairy is not as attractive as it looked to some a few years ago, horticulture and even forestry offer opportunities that may see sheep farming forced back into hill country.
– There is likely to be a reduction in meat processing capacity. At present, the costs of closing are preventing processors from closing less productive plants, but closure for some is inevitable as the current structure is unsustainable.
– The current strength in beef exports (the stellar performer in the sector) will weaken, and is already beginning to do so. Increased competition from Brazil in particular is making New Zealand beef less attractive to the United States market.
– Ongoing challenges in accessing capital due to poor returns in the sector and the difficulty in getting Overseas Investment Office (OIO) approval for offshore investment in the sector will continue.
– Anti-trade sentiment and protectionism will continue to grow, resulting in the use of non-tariff barriers to restrict trade, and increase uncertainty on market access.
– Compliance costs and regulation on the meat and wool sector with regard to water quality, emissions, health and safety, animal welfare, and worker relations will increase.
– Overseas markets for wool will change. China will be less of a player, and New Zealand will need to access new markets like Vietnam that will increasingly undertake textile manufacturing.
David Norman Industry Economist
Summary

INDUSTRY INSIGHTS | November 2016 | 3
– The meat and wool sector is New Zealand’s largest primary sector, with more than 100,000 workers.
– It contributes 4% of New Zealand’s total GDP, with more than half of that produced on-farm.
– In recent years, dairy conversions have seen the number of meat and wool farms fall 26%, but employment has fallen far less, implying that modern farms are larger.
– Although the dairy sector receives a lot of media coverage given its role in exports, the meat and wool sector employs twice as many workers. Even regions known for their large dairy sectors typically have even more workers in meat and wool, including Southland, the Manawatu, and Canterbury.
The meat and wool sector is the largest by far in terms of employment in New Zealand’s primary sector. More than 100,000 full-time equivalent workers (FTEs) are employed in the sector, compared to around 50,000 in dairy, 40,000 in horticulture, and 35,000 in forestry. Each of these estimates include both the production and processing components of the relevant sector.
Employment (FTEs) in primary industries (000), 2016
8.2
8.7
34.5
39.4
50.4
103.0
Seafood
Wine
Forestry and wood products
Horticulture
Dairy
Meat and wool
0 20 40 60 80 100 120Source: Westpac
Where practical, this study divides the meat and wool sector into three sub-sectors:
– farming, including beef, lamb, pork, poultry and venison
– meat and wool processing, including all processing of farmed animals and their products including rendering, wool scouring and wool wholesaling
– farm support services, including shearing services, farm irrigation services, fertiliser spreading and topdressing, livestock dipping, wool classing, and artificial insemination among others.¹
Meat and wool share of value added, 2014$m
3.9%
96.1%
Meat and Wool
Other industries
Source: Westpac
Meat and wool value added, 2014$m
$4,743
$1,426
$2,787
Farming
Farm support services
Meat and wool processing
$8,955
Source: Westpac
As of 2015, around 4% of New Zealand’s total GDP was generated by the meat and wool sector, or around $9 billion in value added. A little over half the total value added was on-farm, at $4.7 billion. A further $2.8 billion was generated by meat and wool processing, while $1.4 billion came from farm support services.
Recent changes
There has been little change in the absolute number of FTEs employed in meat and wool over the 14 years from 2000 to 2014, but there have been changes within the various sub-sectors.
Total employment fell from 105,800 to 103,000, around a 2.6% decline over this period. But the decline in on-farm employment was greater. Around 13,300 fewer FTEs were employed directly on-farm in 2014 than in 2000. This shift was in part as services formerly carried out by farm staff, such as shearing, were outsourced to specialist businesses. Farm support services employment rose by 9,900, to 27,200. At the same time, a
Introducing the sector
¹ We note that some of these services also support dairy and other primary sector businesses, but we were unable to separate out the share of these workers employed by meat and wool as opposed to other primary sectors. Given the dominance of meat and wool in primary sector employment, it makes sense to include these workers here.
INDUSTRY INSIGHTS | November 2016 | 4
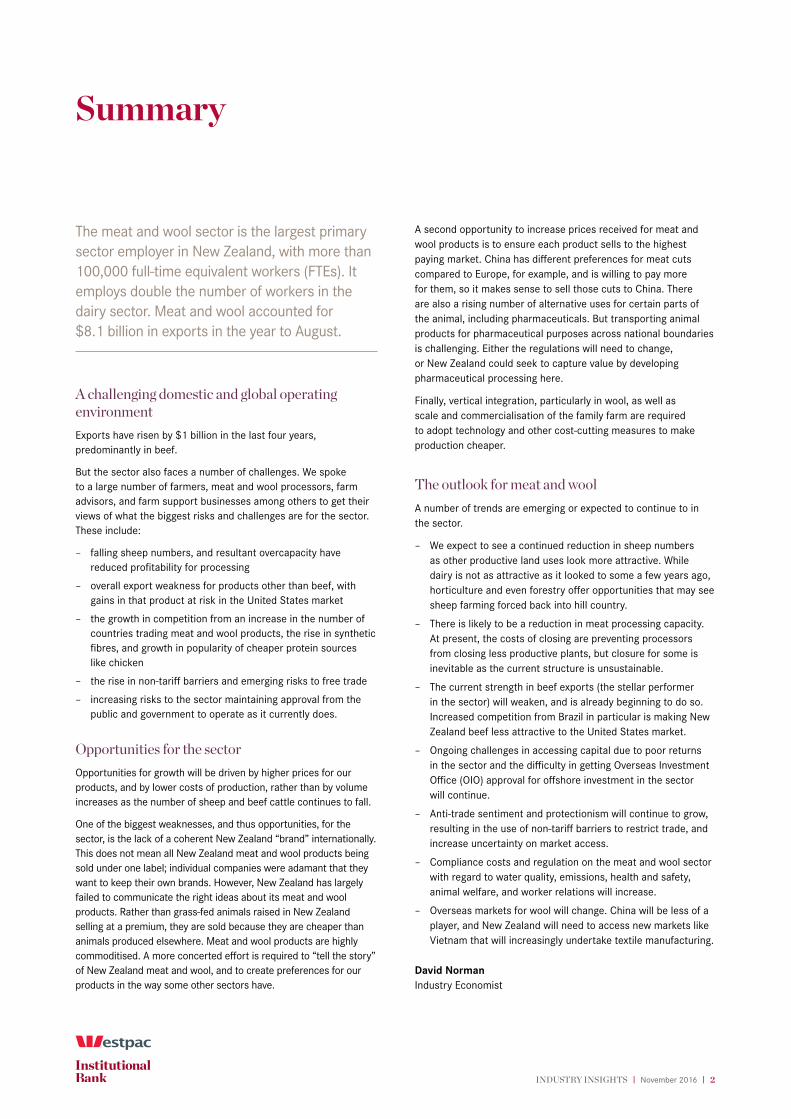
major shift in farming activity away from sheep, to dairy in particular, was underway. Given this change, as well as increased outsourcing, the change in on-farm employment is actually surprisingly small.
Meat and wool employment (FTEs), 2000 to 2014
0
20
40
60
80
100
120
0
20
40
60
80
100
120
2000 2002 2004 2006 2008 2010 2012 2014
Farming Farm support services Meat and wool processing
000 000
Source: Westpac
Employment in processing was also up slightly over the period, reaching 28,100 workers by 2014. This result is also relatively surprising given the switch from sheep to dairy, and given the drive
for more efficient meatworks operation. Although it is not obvious from the chart, meat and wool processing employment in fact peaked at a little over 30,000 in 2008, and has fallen substantially since. Overall employment is still up on the levels in 2000.
Regional distribution of the sector
Gisborne, the Hawke’s Bay, and Southland are New Zealand’s most exposed meat and wool regions. Workers in Southland are four times more likely to work in meat and wool than New Zealand workers overall. The ratio is 2.9 for Gisborne and the Hawke’s Bay, and 2.0 for Taranaki and the Manawatu-Whanganui regions.
Yet in absolute terms, Canterbury is the most important meat and wool region, with around 16,000 meat and wool workers, marginally ahead of Taranaki and the Manawatu-Whanganui region. But the sector is spread across a large number of regions. Only Auckland and Wellington have a lower proportion of employment in the sector than the national average.
As a consequence, this study includes insights from industry players across a wide geographic distribution, as well as a wide sub-sector mix. We spoke to farmers, meat and wool processors, farm advisors, and farm support businesses among others.
Meat and wool employment concentration, 2014
1.4
0.21.5
1.1
2.9
2.0
0.3
1.3
1.1
1.8
4.0
Northland
Auckland
Waikato
Bay of Plenty
Gisborne/Hawke's Bay
Taranaki/Manawatu-…
Wellington
Nelson/Marlborough/West…
Canterbury
Otago
Southland
0.0 1.0 2.0 3.0 4.0Source: Westpac
Meat and wool employment by region (000), 2014
16
15
14
14
10
9
7
19
Canterbury
Taranaki/Manawatu-Whanganui
Gisborne/Hawke's Bay
Waikato
Southland
Otago
Bay of Plenty
Other
Source: Westpac

INDUSTRY INSIGHTS | November 2016 | 5
– The meat and wool sector exported more than $8.1 billion in products in the year to August 2016, or one-sixth of all merchandise exports for the year.
– China and the United States are our biggest export destinations, and have both seen strong growth in predominantly beef exports in the last few years.
– More broadly, beef has been the success story in recent years, with other products treading a more mediocre path. Wool, once a mainstay of meat and wool exports, accounts for only 9% of meat and wool exports today.
– With most recent growth in the sector’s exports being to the United States and China, concentration of exports in just a few markets has risen, but remains relatively low compared to other primary sectors, meaning less exposure to risks in any one export destination.
Meat and wool is New Zealand’s second largest merchandise export group. Exports totalled $8.15 billion in the year to August 2016, which compares to around $11.9 billion in exports of dairy and casein product exports. Meat and wool accounted for one-sixth of all merchandise export values.
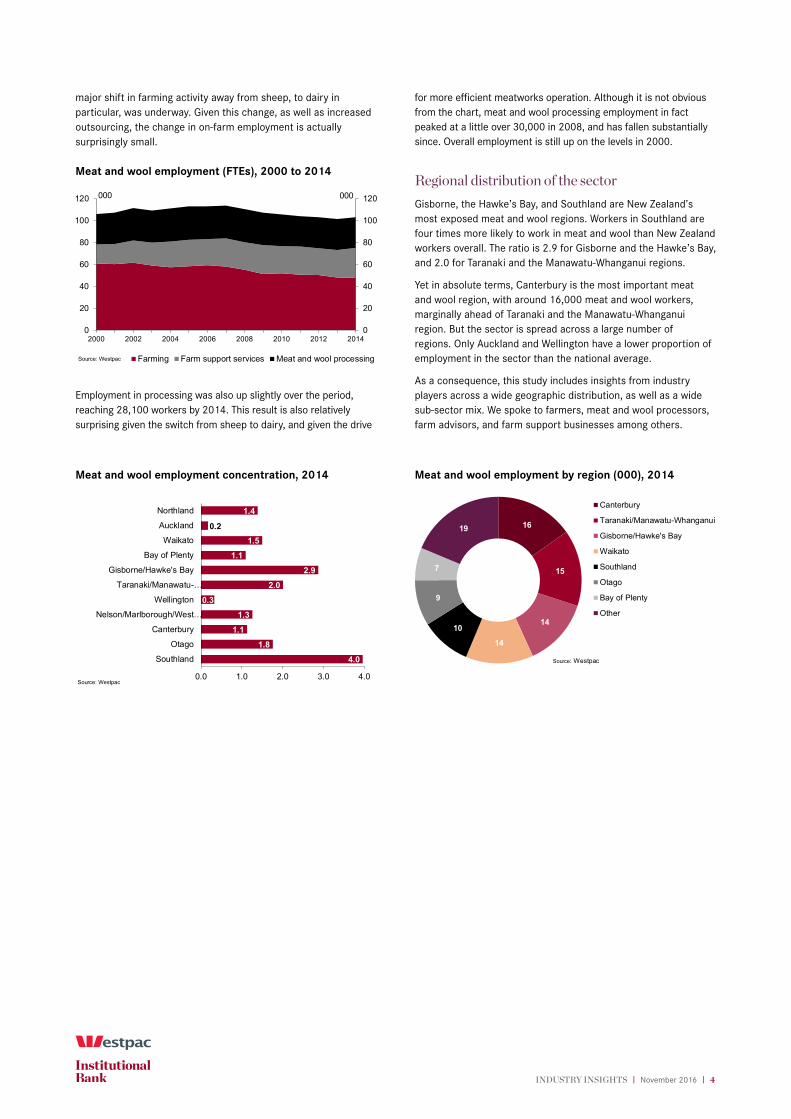
What we export, and where it goes
Beef and lamb each accounted for a little over a third of meat and wool exports in the year to August. Wool was around 9% of the value of exports from the sector, while edible offal from sheep and beef accounted for a further 6%. Other co-products of meat processing accounted for a further 13% of exports.
China has become New Zealand’s largest export destination for meat and wool products, spread fairly equally across beef and lamb, and taking a substantial share of New Zealand’s wool
production. In the year to August 2016, China imported $590 million of New Zealand lamb, $512 million of beef, and $345 million of wool. It also took a further $352 million predominantly of casings and tripe, cowhides and sheepskins.
The United States is our second largest export market for meat and wool products, but its mix of products is quite different to that of China. The United States takes 45% of all New Zealand’s beef exports, at $1.36 billion, and only about 10% of lamb exports. It takes little else.
All other export nations are dramatically less important in terms of total dollar value of exports, but they are important in terms of particular products. The United Kingdom takes only a third of the total export value of meat and wool products we sell to China, but it took $542 million (19%) of lamb exports in the year to August.
Germany, Netherlands, Italy, Taiwan, Japan and Canada each imported between $250 million and $400 million of meat and wool products from New Zealand in the year to August.
In recent years, China has taken what New Zealand considers the “lower value” cuts of lamb, as preferences in China are different, and has been willing to pay a higher price for these cuts than traditional lamb-buying export markets have. In addition, China has its own domestic supply of goat and sheep meat that New Zealand exporters compete against.
Nevertheless, exports to China have helped boost overall lamb prices. But over time, preferences in China, both for lamb as a meat, and for certain cuts, is changing. Beef has become more important in the local diet, and some of the cheaper parts of the animals – casings and offal for example, do not command the same premium they once could.
We explore the changes in exports to China and other nations in the next section.
Recent export performance
Annual meat and wool exports, August 2016
37.3%
35.0%
8.7%
6.1%
3.5%3.1%
2.9%Beef
Lamb
Wool
Edible offal
Cowhides
Casings & tripe
Tallow
Sheepskin
Source: Westpac
Meat and wool export destinations, August 2016 year ($bn)
0.5
1.4
0.2
0.1
0.1
0.6
0.6
0.3
0.5
0.3
0.2
0.7
0.3
0.2 0.2
0.2
0.1
0.0 0.6 1.2 1.8 2.4
China
United States
United Kingdom
Germany
Netherlands
Italy
Taiwan
Japan
Canada
Other countries
BeefLambWoolEdible offalCowhidesCasings and tripeTallowSheepskinsMeat and bonemealOther Meat and Wool products
Source: Statistics New Zealand, Westpac
INDUSTRY INSIGHTS | November 2016 | 6
How exports have changed, 2012 to 2016
New Zealand’s major meat and wool export markets have changed substantially in the last several years. The two largest export markets – China and the United States – have grown in their dominance of exports, while the share of exports going to other countries has fallen in absolute and percentage terms.
Both China and the United States have increased their imports of New Zealand meat and wool products by about 50% in New Zealand dollar terms over the last four years. Each country took around $1.8 billion of New Zealand’s meat and wool products in the year to August 2016.
It is worthwhile noting that much of the growth in meat and wool exports has been driven by improved prices rather than significantly higher volumes. This has particularly been the case for beef exports to the United States.
The next seven largest markets have increased their imports by just $125 million between them, and exports to all other countries have fallen around $230 million over the four years in nominal terms.
This means that increasingly, exports of meat and wool products are becoming concentrated in just a handful of markets, with the top nine countries taking 74% of exports, up from 67% in 2012.
This exposes New Zealand exporters to risks, especially with 52% of exports going to just three countries. For instance, beef exports into the United States rose by $500 million between 2012
and 2016 mostly as a result of drought. But the United States is now also allowing greater access to beef imports from Brazil. Geographic proximity may give Brazil a competitive advantage, which may affect New Zealand beef exports to the country that now takes 45% of our beef exports.
And in terms of which products have seen growth in export values in recent years, the picture is more one-sided. Almost all the growth in export values in the four years to August 2016 can be explained by the $1 billion in additional beef exports. Although lamb exports are also up slightly, most other categories are down, meaning overall growth is around the same as growth in beef exports.
Is this rate of export growth reasonable?
This rate of growth in export values is strong compared to growth in New Zealand export value overall – a rise of 14%, compared with just 3.2% across the economy’s merchandise exports as a whole over the last four years. But excluding beef, the meat and wool rate of growth was just 0.2%. Of the $1 billion in beef exports, $583 million was to the United States, with a further $488 million to China, implying that exports of beef to other countries actually fell overall as well.
But when annual meat and wool exports are plotted against annual average exchange rates, it becomes clear that a significant proportion of the change in export values is due to fluctuations in exchange rates. Exports have clearly risen in real terms over
Meat and wool export destinations, August years ($bn)
1.2
1.8
1.2
1.8
0.7
0.7
0.4
0.4
2.3
2.1
0.0 1.5 3.0 4.5 6.0 7.5 9.0
2012
2016
China United States United Kingdom GermanyNetherlands Italy Taiwan JapanCanada Other
Source: Statistics New Zealand, Westpac
Change in annual Meat and wool exports, 2012 to 2016 ($bn)
1.0
0.2
-0.1
-0.25 0.00 0.25 0.50 0.75 1.00
Beef
Lamb
Wool
Edible offal
Cowhides
Casings & tripe
Tallow
Sheepskin
Meat & bonemeal
Other Meat and Wool products
Source: Statistics New Zealand, Westpac
Exports by product category, annual ($bn)
0.5
1.0
1.5
2.0
2.5
3.0
3.5
0.5
1.0
1.5
2.0
2.5
3.0
3.5
Aug-12 Aug-13 Aug-14 Aug-15 Aug-16
Beef Lamb Wool All other M&W products
Source: Statistics New Zealand, Westpac
$bn $bn
Meat and wool exports and USD exchange rate
0.30
0.40
0.50
0.60
0.70
0.80
0.90
3
4
5
6
7
8
9
Aug-00 Aug-04 Aug-08 Aug-12 Aug-16
Exports (NZD)USD/NZD
Source: Statistics New Zealand, Reserve Bank, Westpac
USD/NZD$bn
INDUSTRY INSIGHTS | November 2016 | 7
the last 16 years, but in times when the New Zealand dollar weakens, exports grow sharply. When the New Zealand dollar strengthens, export values flatten or fall. This highlights the highly commoditised nature of meat and wool exports. It also shows how exchange rates provide a buffer for exports.
It also implies that, putting aside the surge in beef exports, a fair chunk of which was driven by weak supplies in the United States as a result of drought, meat and wool export growth has been quite weak.
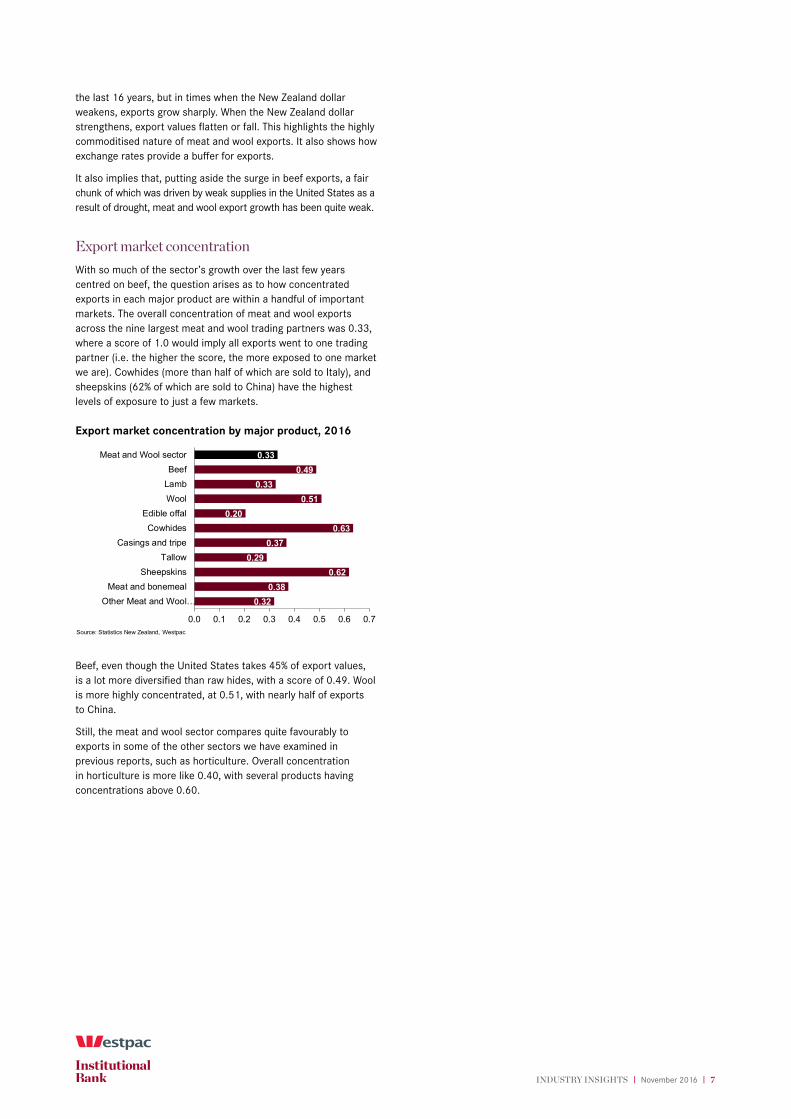
Export market concentration
With so much of the sector’s growth over the last few years centred on beef, the question arises as to how concentrated exports in each major product are within a handful of important markets. The overall concentration of meat and wool exports across the nine largest meat and wool trading partners was 0.33, where a score of 1.0 would imply all exports went to one trading partner (i.e. the higher the score, the more exposed to one market we are). Cowhides (more than half of which are sold to Italy), and sheepskins (62% of which are sold to China) have the highest levels of exposure to just a few markets.
Export market concentration by major product, 2016
0.330.49
0.330.51
0.200.63
0.370.29
0.620.38
0.32
0.0 0.1 0.2 0.3 0.4 0.5 0.6 0.7
Meat and Wool sectorBeef
LambWool
Edible offalCowhides
Casings and tripeTallow
SheepskinsMeat and bonemeal
Other Meat and Wool…
Source: Statistics New Zealand, Westpac
Beef, even though the United States takes 45% of export values, is a lot more diversified than raw hides, with a score of 0.49. Wool is more highly concentrated, at 0.51, with nearly half of exports to China.
Still, the meat and wool sector compares quite favourably to exports in some of the other sectors we have examined in previous reports, such as horticulture. Overall concentration in horticulture is more like 0.40, with several products having concentrations above 0.60.
INDUSTRY INSIGHTS | November 2016 | 8
– New Zealand has an oversupply of meat processing capacity given the current and likely future supply of livestock for processing.
– Yet rationalisation of the number of processing plants is financially unattractive for many processors given the huge redundancy costs associated with closing plants.
– As a result, processors compete for livestock throughput, meaning the farmer captures most of the value although these gains are often ploughed back into farm productivity gains.
– We expect to see the number of processing plants fall, but this will be a slow and expensive process.
– As farms become more corporate and commercially-minded, we may begin to see some longer-term contracting on price rather than just volume or percentage terms, which may create better supply certainty for some processors.
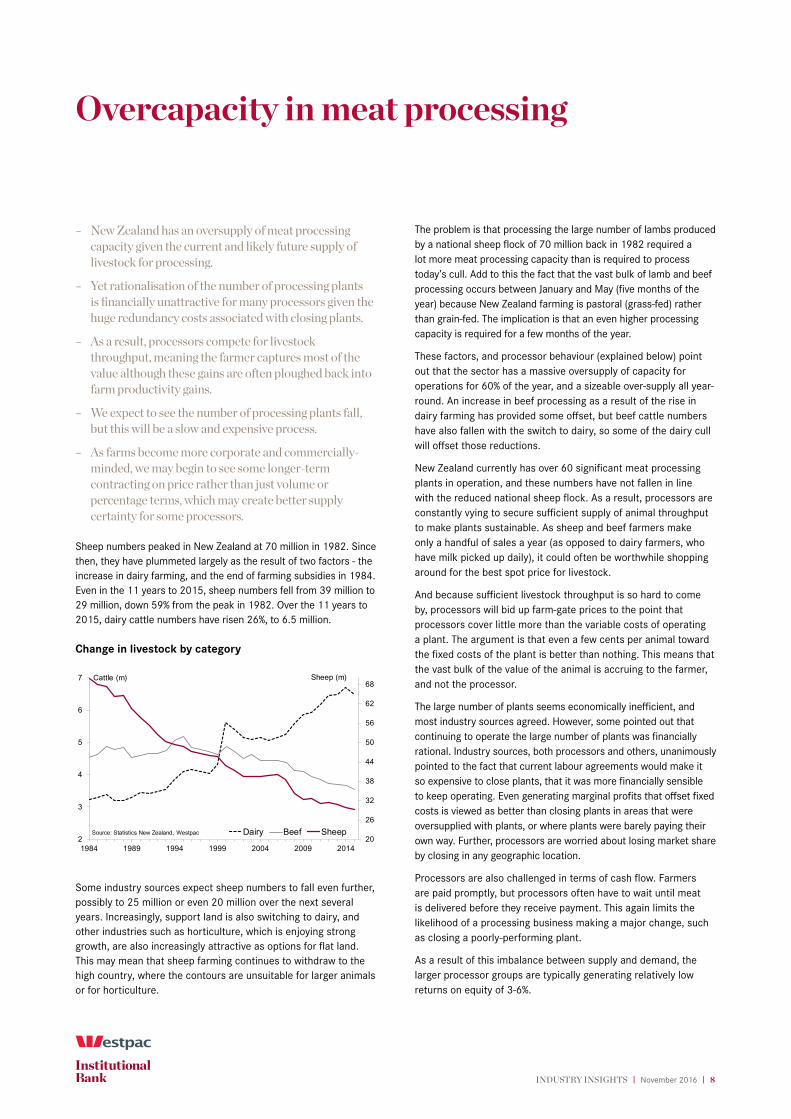
Sheep numbers peaked in New Zealand at 70 million in 1982. Since then, they have plummeted largely as the result of two factors - the increase in dairy farming, and the end of farming subsidies in 1984. Even in the 11 years to 2015, sheep numbers fell from 39 million to 29 million, down 59% from the peak in 1982. Over the 11 years to 2015, dairy cattle numbers have risen 26%, to 6.5 million.
Change in livestock by category
20
26
32
38
44
50
56
62
68
2
3
4
5
6
7
1984 1989 1994 1999 2004 2009 2014
Dairy Beef Sheep
Sheep (m)
Source: Statistics New Zealand, Westpac
Cattle (m)
Some industry sources expect sheep numbers to fall even further, possibly to 25 million or even 20 million over the next several years. Increasingly, support land is also switching to dairy, and other industries such as horticulture, which is enjoying strong growth, are also increasingly attractive as options for flat land. This may mean that sheep farming continues to withdraw to the high country, where the contours are unsuitable for larger animals or for horticulture.
The problem is that processing the large number of lambs produced by a national sheep flock of 70 million back in 1982 required a lot more meat processing capacity than is required to process today’s cull. Add to this the fact that the vast bulk of lamb and beef processing occurs between January and May (five months of the year) because New Zealand farming is pastoral (grass-fed) rather than grain-fed. The implication is that an even higher processing capacity is required for a few months of the year.
These factors, and processor behaviour (explained below) point out that the sector has a massive oversupply of capacity for operations for 60% of the year, and a sizeable over-supply all year-round. An increase in beef processing as a result of the rise in dairy farming has provided some offset, but beef cattle numbers have also fallen with the switch to dairy, so some of the dairy cull will offset those reductions.
New Zealand currently has over 60 significant meat processing plants in operation, and these numbers have not fallen in line with the reduced national sheep flock. As a result, processors are constantly vying to secure sufficient supply of animal throughput to make plants sustainable. As sheep and beef farmers make only a handful of sales a year (as opposed to dairy farmers, who have milk picked up daily), it could often be worthwhile shopping around for the best spot price for livestock.
And because sufficient livestock throughput is so hard to come by, processors will bid up farm-gate prices to the point that processors cover little more than the variable costs of operating a plant. The argument is that even a few cents per animal toward the fixed costs of the plant is better than nothing. This means that the vast bulk of the value of the animal is accruing to the farmer, and not the processor.
The large number of plants seems economically inefficient, and most industry sources agreed. However, some pointed out that continuing to operate the large number of plants was financially rational. Industry sources, both processors and others, unanimously pointed to the fact that current labour agreements would make it so expensive to close plants, that it was more financially sensible to keep operating. Even generating marginal profits that offset fixed costs is viewed as better than closing plants in areas that were oversupplied with plants, or where plants were barely paying their own way. Further, processors are worried about losing market share by closing in any geographic location.
Processors are also challenged in terms of cash flow. Farmers are paid promptly, but processors often have to wait until meat is delivered before they receive payment. This again limits the likelihood of a processing business making a major change, such as closing a poorly-performing plant.
As a result of this imbalance between supply and demand, the larger processor groups are typically generating relatively low returns on equity of 3-6%.
Overcapacity in meat processing
INDUSTRY INSIGHTS | November 2016 | 9
Industry sources were generally of the view that the current structure of the sector could not remain unchanged. Some argued that the sector was not “broken”, as processors were reacting rationally to the situation in which they find themselves. But it is certain that something will have to change. Even in a low interest rate environment, returns on equity at current levels of 3% to 6% would remain unattractive. As a result, we expect to see several plant closures over the next five years.
There have been some positive outcomes from an otherwise dire situation. Most notably, industry sources suggested that there have been significant efficiency gains in processing as processors have been forced by the strong level of competition to find ways to reduce costs. Exporters have also had to be more innovative in marketing to try and garner higher prices so they can pass some of those benefits on to farmers to secure supply.
Some commented that smaller processors, possibly with newer, more flexible or multi-purpose equipment and workforces, were able to switch between species processed, and cuts produced (e.g. there are multiple ways to cut a leg of lamb) depending on which market was paying the highest prices. This allowed them to navigate the challenges of the changing market conditions more easily.
Herding supply in the right direction
Directly linked to over-capacity is the level of uncertainty over supply to individual processors. None of the industry sources indicated that farmers (or in many cases, processors) were willing to contract on price. Some processors do have supply agreements with farmers to supply a certain proportion or volume of stock to their plant, but stock prices were set weekly.
This is despite the fact that some processor contracts on the international market allow prices to be set on a monthly or quarterly basis. Pressed as to whether contracting on price could become the norm, at least two reasons why this was unlikely were voiced. First, farmers were viewed as “eternal optimists” unlikely to agree to a lower, guaranteed price even though it would give them certainty. Second, many processors were unwilling to take the risk of bearing price volatility. The assumption was that the farmer would only lock in a price if it was at a premium over today’s spot price, meaning all the risk of a price fall would be borne by the processor, with little potential for an upside surprise.
This implies that most industry sources who commented on this point held a dim view of the level of sophistication of the average meat farmer, or the processors’ ability to manage risk. One trend that was repeatedly raised is the increased commercialisation and corporatisation of the family farm. With this change in scale and business-orientation, longer-term price-based contracting (monthly or quarterly) based on back-to-back contracts with international customers may become more feasible.
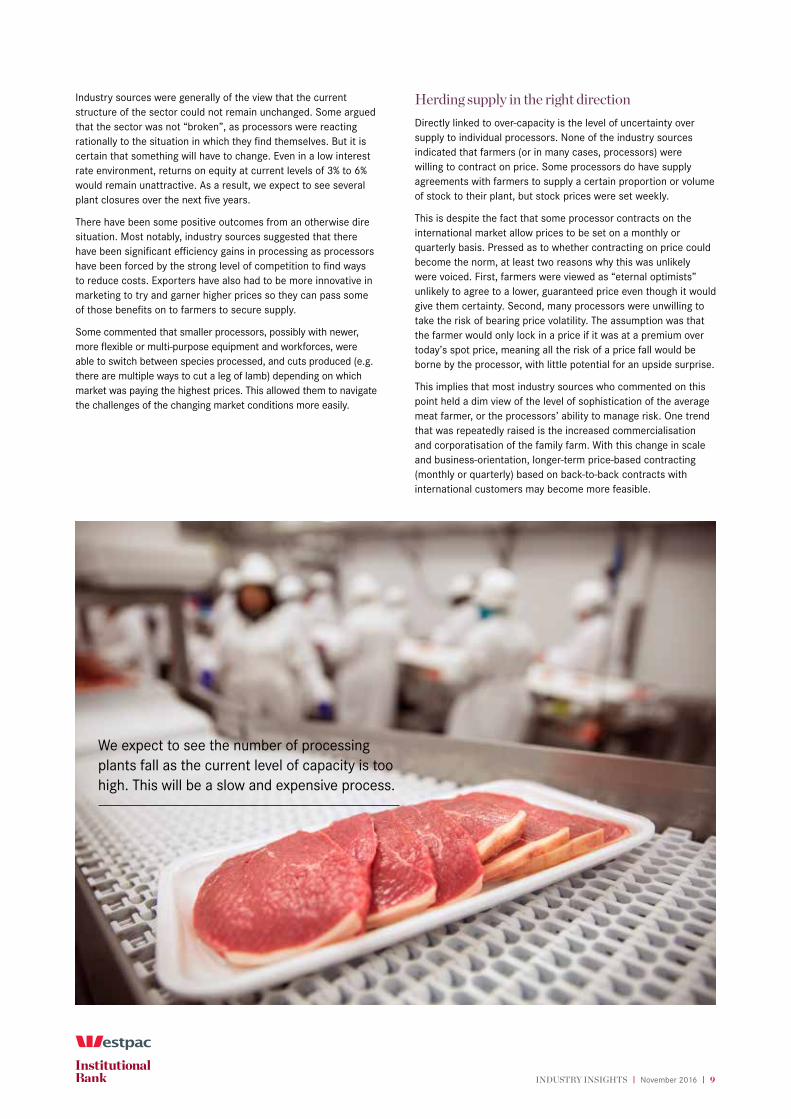
We expect to see the number of processing plants fall as the current level of capacity is too high. This will be a slow and expensive process.

INDUSTRY INSIGHTS | November 2016 | 10
– Industry sources were concerned at the commoditisation of meat and wool products, and the issue of how to raise profitability arose repeatedly.
– Opportunities to boost the volume of meat produced per hectare are limited. Increases in productivity per hectare in lamb have been substantial but are now slowing. Beef is unlikely to see big gains.
– This means the biggest opportunities lie in boosting revenues per animal or per kilogram, and in cutting costs.
– The New Zealand meat “brand” is highly commoditised and does not command a premium. More needs to be done in a coherent, coordinated fashion if revenue is to rise from better perceptions of New Zealand meat.
– The sector also needs to optimise what prices it achieves for the 70% of the animal that is not premium cuts, and look to further spread and reduce costs through scale and technology.
Closely related to the mediocre returns to meat processors given the current overcapacity, is how to increase returns to the sector as a whole, from farmer to exporter. This question is not unique to meat and wool, but given the challenges for lamb and beef processors, it is especially pertinent.
As with any product, there are three ways to boost profitability:
– reduce the cost of production
– increase the revenue per unit
– increase the volume produced.
Discussions with industry sources highlighted a number of opportunities for the sector to improve performance in these three ways. We introduce some of those insights here.
Increase revenue per unit
New Zealand exports an estimated 90% of lamb and 80% of beef production. Several industry sources highlighted the fact that for as long as they can remember, lamb in particular has been exported as a commodity. Comments included examples of New Zealand processors undercutting each other to secure supermarket trade overseas, and the fact that New Zealand lamb was cheaper in British supermarkets than locally produced lamb. In other words, there was no premium on the New Zealand clean, green, pasture-fed image.
Because New Zealand’s meat exports have been highly commoditised, we have been price-takers, with our products substitutable by a range of other producers’ products. A good example of this is the recent inroads made by Brazilian beef producers into the US market.
This suggests that a massive opportunity exists to increase what we get paid per animal or per kilogram of meat. Some of these ideas are not new, which begs the question: why have these ideas not long-since been implemented, or are they doomed to fail?
Action One: Show that our grass is greener
A recurring theme was the lack of a coherent New Zealand brand in meat and wool. No one proposed that there should be a single desk like Zespri. But the idea of New Zealand beef or New Zealand lamb being promoted jointly by processors, exporters and industry bodies, with marketing budgets pooled, has not eventuated, with unsurprisingly hit-and-miss results.
Instead, each processor and/or exporter is doing their own marketing, and the focus appears thus far to have been largely on securing export quantities (probably linked to the need for throughput to keep plant in operation) rather than commanding a premium for New Zealand-produced meat and wool.
Several industry sources suggested that New Zealand’s grass-fed livestock produced better meat than grain-fed overseas competitors, but when pressed as to how that had been ascertained, or whether it was reflected in pricing, it was evident that this was a New Zealand-held belief rather than something translating into premiums internationally. New Zealand faces the challenge of changing international market preferences.
There appears to be huge potential for capitalising on the New Zealand “story”. The New Zealand brand, if we are to attract a premium, needs to appeal. Little is being done to tell the story of how animals are farmed in New Zealand, including sustainability efforts, animal welfare, and where the meat or wool is from. Yet other products around the world are capitalising on the consumer’s desire to be closer to the product.
Then, in addition to better coordination among processors and exporters, individual firms should look to promote their own brands internationally. There have been examples of exporters using their own branding quite successfully overseas and even domestically. A premium, well-presented brand, may generate more revenue per kilogram.
Action Two: Carve up the market for better prices
One industry source put it exceptionally well: “New Zealand produces enough food for 40 million people. We need to sell to the world’s wealthiest 40 million people.”
Part of the answer is better branding of New Zealand meat and wool. But there is also huge potential to take advantage of maximising the price paid for individual cuts or co-products. The question is how we maximise yield per carcass from the 70% of the animal that is not a premium cut.
Some exporters are doing this by developing a wide mix of customers who are in the market for different parts of the animal. For instance, China has been willing to pay more for products
Opportunities to grow
INDUSTRY INSIGHTS | November 2016 | 11
like offal that were traditionally exported to the Pacific Islands. In China, offal is actually valued rather than seen as a cheaper alternative to other cuts. This gives the exporter options as to where products may go, and depending on market prices, similar cuts may head to different places from one month to the next.
One final possibility is an increased role for venison. This industry has certainly had mixed success in recent years, but there are opportunities in emerging venison markets like China that could shift what we farm and what we market into particular export destinations.
Action Three: Chill and pharm new premium products
The most promising opportunity here is the rise in exports of chilled products. As yet, New Zealand is not exporting chilled meat products to China, but if that access is finalised soon as some industry sources believe it will be, another huge opportunity to extract a premium will materialise. Already, the export of chilled rather than frozen products is seeing dollars per kilogram rise in some international markets.
Co-products also offer huge opportunities to increase revenue per animal although results have recently been mixed. Some co-products, such as casings and tripe, have seen prices fall, but other potential uses for co-products, such as pharmaceuticals, may develop. The challenge of transporting animal products internationally means, at this stage, any scale operation using New Zealand-sourced co-products would likely need to be based here. At present, there is not a large New Zealand-based pharmaceutical manufacturing plant taking advantage of New Zealand’s meat production.
Another example of new product development is the increase in sale of premium, retail-ready products, or in the case of poultry, cooked products. These command a premium over bulk, highly-commoditised products.
Action Four: Go the whole (vertical) hog
The development of retail-ready products is one way to try to capture more value by vertical integration, but there are other ways to substantially increase capture.
For instance, exporters need to improve direct access to food and beverage or supermarket chains in export markets, rather than dealing through an importer. Industry sources have had mixed success in achieving this. Some have found that they rely on the importer for access to a distribution and logistics network, making it harder to cut out the middleman. Until exporters are able to develop their own direct relationships with large customers in export markets, the ability to chart their own course rather than relying on an importer will be limited.
A further example exists in the wool sub-sector, where businesses need to integrate across scouring, spinning and cloth making to capture a greater share of the value of the product.
Reduce the cost of production
Industry sources highlighted a number of ways that the sector could reduce the cost of production. Some of these changes are already underfoot. Many of these changes are seeing benefits accrue on-farm rather than to processors, but constitute significant opportunities for the sector.
Action One: Beef up farm size
One commentator estimated that the minimum sustainable sheep farm size has increased to around 600 hectares (1500 acres). This increased scale is allowing greater use of technology such as automated monitoring of moisture content and fertiliser requirements, as well as irrigation. It also meant that the upfront costs of new equipment or technology could be spread over a higher number of stock units.
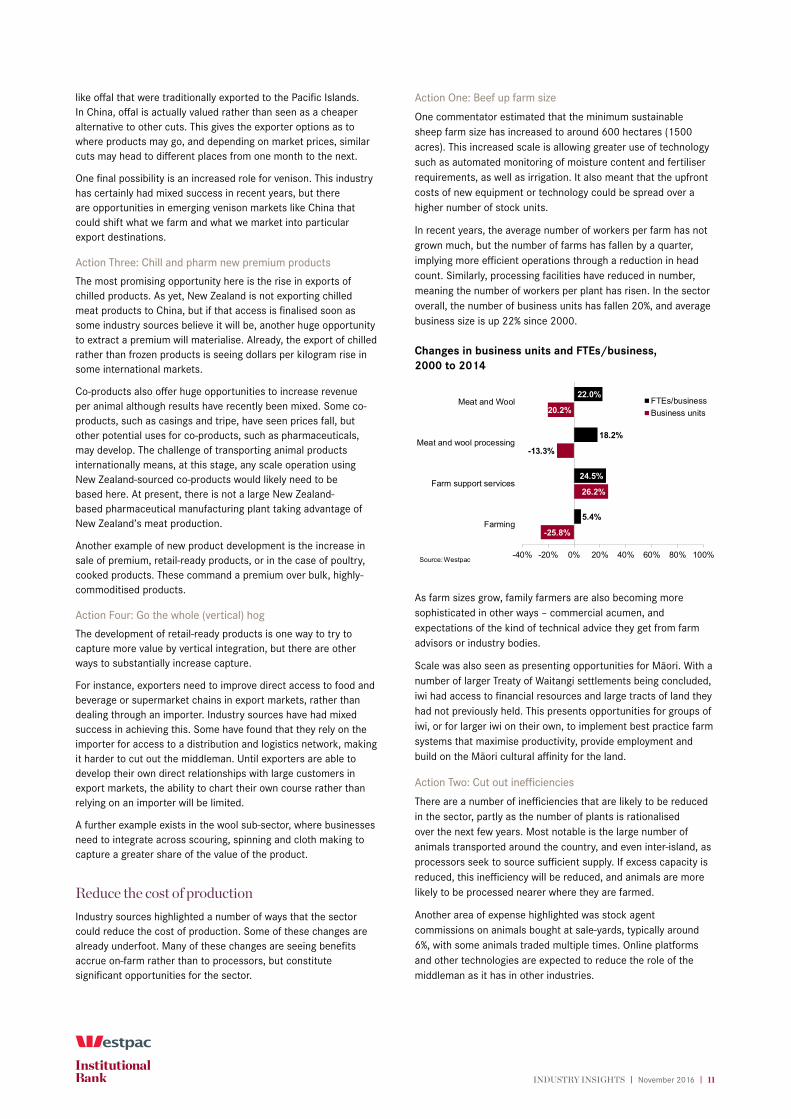
In recent years, the average number of workers per farm has not grown much, but the number of farms has fallen by a quarter, implying more efficient operations through a reduction in head count. Similarly, processing facilities have reduced in number, meaning the number of workers per plant has risen. In the sector overall, the number of business units has fallen 20%, and average business size is up 22% since 2000.
Changes in business units and FTEs/business, 2000 to 2014
-25.8%
26.2%
-13.3%
-20.2%
5.4%
24.5%
18.2%
22.0%
Farming
Farm support services
Meat and wool processing
Meat and Wool
-40% -20% 0% 20% 40% 60% 80% 100%
FTEs/businessBusiness units
Source: Westpac
As farm sizes grow, family farmers are also becoming more sophisticated in other ways – commercial acumen, and expectations of the kind of technical advice they get from farm advisors or industry bodies.
Scale was also seen as presenting opportunities for Māori. With a number of larger Treaty of Waitangi settlements being concluded, iwi had access to financial resources and large tracts of land they had not previously held. This presents opportunities for groups of iwi, or for larger iwi on their own, to implement best practice farm systems that maximise productivity, provide employment and build on the Māori cultural affinity for the land.
Action Two: Cut out inefficiencies
There are a number of inefficiencies that are likely to be reduced in the sector, partly as the number of plants is rationalised over the next few years. Most notable is the large number of animals transported around the country, and even inter-island, as processors seek to source sufficient supply. If excess capacity is reduced, this inefficiency will be reduced, and animals are more likely to be processed nearer where they are farmed.
Another area of expense highlighted was stock agent commissions on animals bought at sale-yards, typically around 6%, with some animals traded multiple times. Online platforms and other technologies are expected to reduce the role of the middleman as it has in other industries.

INDUSTRY INSIGHTS | November 2016 | 12
A third area of significant expense is the cost of animal inspection by Ministry for Primary Industries staff at processing facilities. It is important to ensure the safety of New Zealand's export products to provided confidence to our trading partners. However, the current cost per head of cattle is around $20. There may be ways to reduce these costs.
Increase volumes produced
The volume of meat produced is unlikely to rise sharply given the extent of sheep flock and beef herd reduction, and the pace of productivity gains already recorded in the case of lamb.
Despite the large slump in the number of sheep in the national flock, lamb production volumes have remained remarkably
strong. This is the result of genetics, better lambing percentages, irrigation, management techniques, better forages and faster weight gain, resulting in higher weights per animal.
A further point to consider in acknowledging just how strong the gains in lamb productivity have been is the fact that it is largely the most productive land that has converted to other uses, most notably dairy. In other words, productivity per hectare has risen even as the quality of land available has declined.
Gains in beef cattle productivity have not been nearly as strong, and the opportunities for improvements are generally seen as more limited than they have been in lamb production. With many of the largest gains already achieved in lamb production, the potential for further productivity gains is also not as large as it was 20 years ago.
New Zealand needs to do better at promoting the premium value of our grass-fed meat products.
INDUSTRY INSIGHTS | November 2016 | 13
– Meat and wool faces challenging domestic and global operating environments.
– Globally, price volatility and easy access to substitute proteins and fibres make the strong case for New Zealand to better establish a “brand” for its meat and wool products.
– At the same time, access to capital for expansion and automation is limited even in the current low-interest environment, and rising protectionism is making market access less certain.
– Domestically, the sector’s social licence to operate – the ongoing approval of consumers and government – is at risk.
– Environmental outcomes, animal and worker welfare, and food safety are among the factors the sector needs to deal with to continue to create confidence in the product and to develop the ability to charge a premium for products that fit with the “New Zealand primary sector story”.
World trade conditions
There are a number of factors within the global operating environment that present challenges to the meat and wool sector, as well as some changes afoot that may have further ramifications. Some of these factors are beyond the control of New Zealand’s meat and wool sector, while others may offer new opportunities if the sector seizes upon them.
– Price volatility and exchange rates: As highlighted in the Exports chapter, the commoditised nature of meat and wool export products means that when the New Zealand dollar is weaker, export values surge, but when it is strong, they stumble. A number of industry sources referenced the anecdotal example of New Zealand lamb being “removed from the menu” in Europe if the price of lamb passed a certain threshold, for instance. The sector has little control over either the supply of meat and wool products from other countries (and thus world prices) nor over the exchange rate. Through distinguishing New Zealand meat and wool products as premium products, however, it may be able to create some resilience against changes in world prices.
– Global supply of competing products: A related factor is trends in world supply of meat and wool products. Droughts, disease outbreaks and domestic conditions in competitor nations determine how much meat and wool they demand or supply. Beef exports, for example, have benefitted from drought in the United States, and a lack of approved countries to export into that country. But as beef supplies in the United States are restored,
and as meat from Brazil and other sources re-enters that market, New Zealand’s surge in exports there looks unlikely to be sustained, at least at current levels.
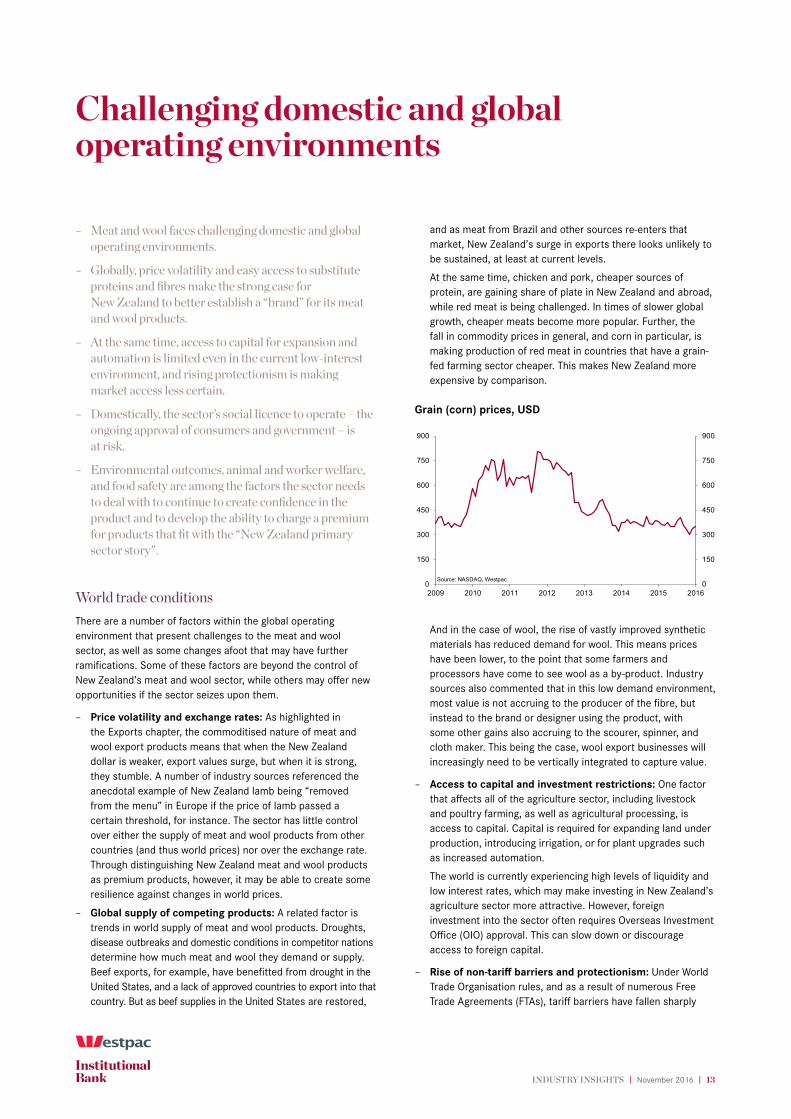
At the same time, chicken and pork, cheaper sources of protein, are gaining share of plate in New Zealand and abroad, while red meat is being challenged. In times of slower global growth, cheaper meats become more popular. Further, the fall in commodity prices in general, and corn in particular, is making production of red meat in countries that have a grain-fed farming sector cheaper. This makes New Zealand more expensive by comparison.
Grain (corn) prices, USD
0
150
300
450
600
750
900
0
150
300
450
600
750
900
2009 2010 2011 2012 2013 2014 2015 2016
Source: NASDAQ, Westpac
And in the case of wool, the rise of vastly improved synthetic materials has reduced demand for wool. This means prices have been lower, to the point that some farmers and processors have come to see wool as a by-product. Industry sources also commented that in this low demand environment, most value is not accruing to the producer of the fibre, but instead to the brand or designer using the product, with some other gains also accruing to the scourer, spinner, and cloth maker. This being the case, wool export businesses will increasingly need to be vertically integrated to capture value.
– Access to capital and investment restrictions: One factor that affects all of the agriculture sector, including livestock and poultry farming, as well as agricultural processing, is access to capital. Capital is required for expanding land under production, introducing irrigation, or for plant upgrades such as increased automation.
The world is currently experiencing high levels of liquidity and low interest rates, which may make investing in New Zealand’s agriculture sector more attractive. However, foreign investment into the sector often requires Overseas Investment Office (OIO) approval. This can slow down or discourage access to foreign capital.
– Rise of non-tariff barriers and protectionism: Under World Trade Organisation rules, and as a result of numerous Free Trade Agreements (FTAs), tariff barriers have fallen sharply
Challenging domestic and global operating environments

INDUSTRY INSIGHTS | November 2016 | 14
around the world. But world events have highlighted a switch toward treating freer trade with some scepticism. Brexit and the views of both major US presidential election candidates toward the recently signed, but as yet unratified, Trans-Pacific Partnership Agreement are the two examples typically cited. But industry sources also suggested that even where FTAs are in place, market access in many countries remained volatile, and could be switched on or off for any one of a number of reasons, including food safety or biosecurity, with or without strong evidence of risk.
– Changing global roles and the emergence of new markets: As China’s wealth grows, its economy is changing to one that is more services-oriented. A lot of the manufacturing that was once done there is now shifting to economies with cheaper labour – Vietnam, Bangladesh, and Indonesia among others. Marketing of New Zealand wool in particular may need to switch toward these countries to find new buyers. Wool export values to China have fallen around $60 million in the last four years although it still accounts for half of all wool exports. But the sector may need to seize opportunities sooner rather than later in emerging textile manufacturing nations.
Social licence to operate
Public and government expectations of how farms and processing plants should operate are changing. The sector’s social licence to operate – the ongoing approval of the community and consumers for the sector to do what it does – is increasingly contingent on a number of factors.
Yet it is precisely these kinds of factors that will determine how the New Zealand meat and wool sector is perceived by local and overseas consumers. If the sector wants to be able to sell products at a premium based on a coordinated marketing approach that tells a New Zealand story of sustainability, animal health, clean waterways, safe work practices and better-tasting grass-fed meat for instance, reality needs to match this image.
– Impact of sector on the environment: Water quality and carbon emissions are probably the two biggest concerns for the public. The public is increasingly concerned about what livestock farming (although dairy often gets most of the blame) is doing to waterways, especially when taken in conjunction with the fact that many farmers have access to water from publicly owned rivers for irrigation purposes. As a result, more stringent requirements from local councils are being put in place, which adds costs to farm operations.
Several industry sources were also confident that agriculture would be added to the Emissions Trading Scheme (ETS) at some point in the future. As Westpac Economics pointed out in a February 2016 report, because agriculture is currently excluded from the ETS, the New Zealand taxpayer is subsidising farmers.² This is unlikely to be politically palatable indefinitely, at which point farmers will be expected to begin paying their share, adding costs to operations.
– Animal welfare: There has been recent media coverage of farmers treating bobby calves and other livestock badly. While
these incidents may be isolated, it is increasingly placing on-farm practices in the limelight. The sector will need to be above reproach, and will need to deal with transgressors in a way that gives consumers confidence that New Zealand’s meat and wool livestock are treated humanely.
– Worker relations: Processors in particular walk the tightrope of managing worker relations, often at plants with dozens or hundreds of workers, and overcapacity that implies they should be closing plants. How this relationship is managed will determine the public’s view of the company and its products.
– Health and safety: The agriculture sector, like other primary and secondary (manufacturing and construction) sectors, is characterised by high rates of injury per worker – a rate comparable to that in forestry, for instance, which is seen by many as having an unsatisfactorily high injury rate. In the year to June 2015, one in every 33 workers in agriculture (which is dominated by meat and wool), claimed compensation from ACC for work time lost, or 29 per 1,000 workers. Only fishing had a higher claim rate per 1,000 workers.³
ACC entitlement claims by industry, rate per 1,000 FTEs, 2015
29
39
27
12
26
23
Agriculture
Fishing
Forestry
Mining
Manufacturing
Construction
0 10 20 30 40
Source: Westpac, Statistics New Zealand
– Food safety: New Zealand has been a world leader in food safety for many years, which is one reason for the success of many primary industries in maintaining or growing exports. However, several industry sources highlighted a concern at the rising costs of complying with constantly tightening food safety standards. The sector, and regulators, face the challenge of ensuring New Zealand stays at the forefront of food safety without imposing unreasonable or unnecessary costs on producers. This could potentially inflate the cost of New Zealand exports relative to our competitors.
Some industry sources also implied that food safety is being used as a non-tariff barrier by some countries to restrict imports, including imports of New Zealand products, and protect their domestic industries, as already described in the previous section.
This challenging mix of health, welfare, environmental and safety factors will need to be successfully dealt with if the sector is to build an image of a farming system and products that are worthy of a premium.
² http://www.westpac.co.nz/assets/Business/Economic-Updates/2016/Bulletins-2016/The-Paris-Agreement-February-2016.pdf
³ Meat processing workers are included in the manufacturing sector, but injury rates specifically for meat processing workers cannot be isolated from the data.

INDUSTRY INSIGHTS | November 2016 | 15
– We expect to see further declines in sheep numbers, and thus employment on farm in meat and wool.
– Average business size in employment terms has not risen particularly sharply, which implies opportunity exists for consolidation and commercialisation of farm businesses.
– Returns on equity tend to be low in the sector given rising land values and the tendency to plough earnings back into farm productivity.
– Farmer debt levels have risen slightly in recent years but remain below levels in many other industries, such as horticulture.
Recent trends: Shearing sheep-farming employment
Overall farm-based employment within meat and wool has shrunk 22% since 2000. In total, employment in specialist sheep and mixed sheep-beef farming has fallen from 34,600 to 25,700 in 14 years.
The trend away from meat and wool production and toward dairy has been reflected in employment numbers in recent years. After remaining flat between 2000 and 2004, employment in specialist sheep farming fell sharply, from around 24,000 to 15,800 although it is evident that much of this initial change was a shift in classification toward mixed sheep-beef farming. Over the years that followed, however, employment in both these categories fell away.
Specialist beef farming employment has also declined, but the change has not been as marked as in sheep farming, falling from 14,500 to 13,400 over the same period. But employment in other livestock and poultry – pigs, deer and chickens mostly – has also fallen.
This has partly been reflected in average business sizes rising
although the biggest change has clearly been businesses converting out of meat and wool into dairy. The number of meat and wool farms has fallen by 10,000 over 14 years. As a result, the sub-sector’s overall business size has grown only marginally, from 1.56 to 1.64. The biggest gains have bene in mixed sheep-beef farming, and other livestock and poultry.
Benchmark indicators
Businesses can monitor their own commercial performance against that of other businesses in their sub-sector by considering averages across key indicators. Where possible, this report provides the most recent available information on a number of key commercial ratios for each sub-sector.
The three indicators are return on equity, current ratio (current assets divided by current liabilities), and liabilities structure (share of total liabilities provided by shareholder or owners’ equity).
As industry sources highlighted, meat and wool farmers tend to benefit from good meat and wool prices only at sale of their property. In other words, profits are ploughed back into the property, with a result that returns on equity tends to be quite low, as property value rises. These low returns are predominantly in sheep and beef farming; returns have been better in poultry, deer and other livestock farming in recent years.
Overall, livestock farming has sound current ratios although these ratios appear to have fallen sharply in recent years, from around 177% in sheep and beef, and 153% in poultry, deer and other livestock farming.
The liabilities structure also suggests that debt levels in the sector have been rising in recent years. Owners’ equity has fallen from 64% to 58% in sheep and beef, and from 51% to 44% in poultry, deer and other livestock farming.
Meat and wool farming
On-farm employment
0
5
10
15
20
25
0
5
10
15
20
25
2000 2002 2004 2006 2008 2010 2012 2014
Specialist sheep farming Mixed sheep-beef farming
Specialist beef farming Other livestock and poultry
Source: Statistics New Zealand, Westpac
000 000
Farm average business size (FTEs/business)
0.0
0.5
1.0
1.5
2.0
2.5
0.0
0.5
1.0
1.5
2.0
2.5
2000 2002 2004 2006 2008 2010 2012 2014
Specialist sheep farmingMixed sheep-beef farmingSpecialist beef farmingOther livestock and poultry
Source: Statistics New Zealand, Westpac

INDUSTRY INSIGHTS | November 2016 | 16
Key commercial indicators
4%
177%
64%
2%
128%
58%
6%
130%
58%
4%
125%
58%
0%
30%
60%
90%
120%
150%
180%
Return on equity Current ratio Liabilities structure0%
30%
60%
90%
120%
150%
180%
2012201320142015
Source: Westpac, Statistics New Zealand
Sheep, beef cattle and grain farming
Key commercial indicators
1%
153%
51%
4%
111%
45%
7%
114%
46%
10%
107%
44%
0%
40%
80%
120%
160%
Return on equity Current ratio Liabilities structure0%
40%
80%
120%
160%
2012201320142015
Source: Westpac, Statistics New Zealand
Poultry, deer and other livestock farming
INDUSTRY INSIGHTS | November 2016 | 17
– Employment in sheep and beef processing has remained strong despite the fall in beef cattle and sheep numbers, unsurprising given the difficulty processors have in reducing headcount or closing plants.
– There has been significant consolidation in the number of poultry, smallgoods and wool processing businesses, with a resultant surge in average business size.
– This change underscores the rise in the share of plate that chicken has captured, as well as improved export opportunities for these smaller components of the meat and wool sector.
Recent trends: Playing chicken
Despite falling sheep and beef cattle numbers, employment in meat processing has remained resilient. As discussed in the chapter on overcapacity, this is in part because of the challenge in reducing headcount at existing plants, or closing plants.
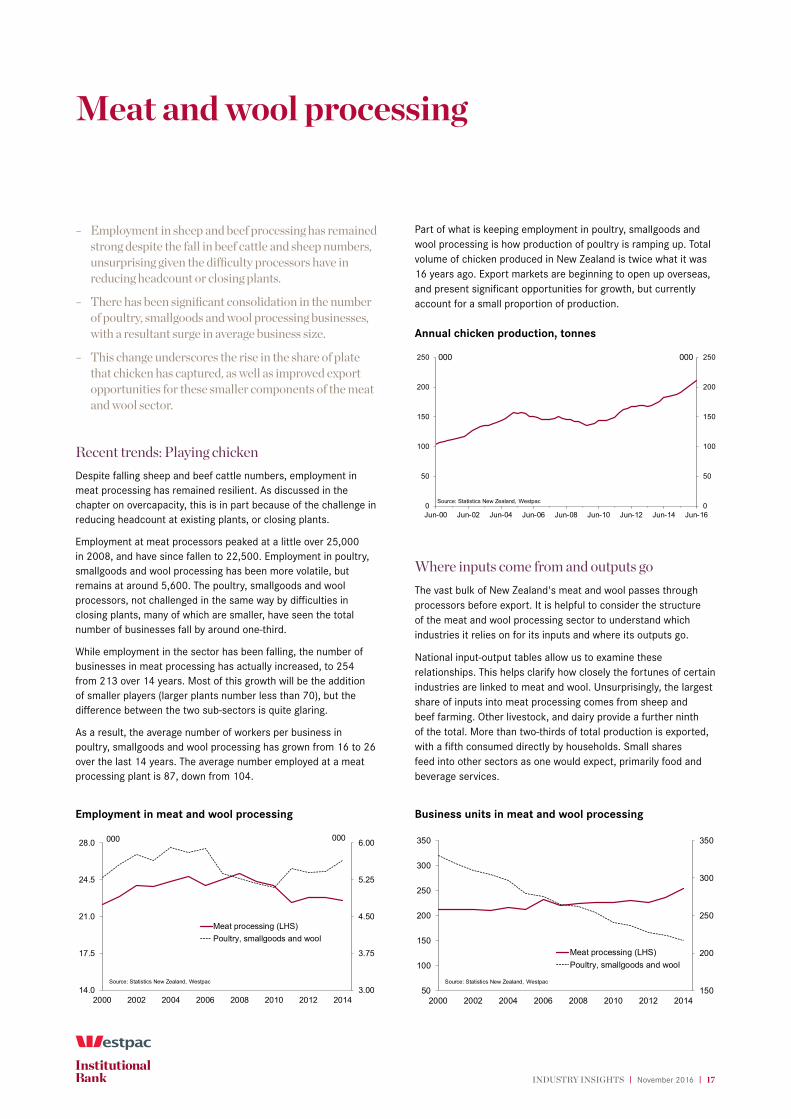
Employment at meat processors peaked at a little over 25,000 in 2008, and have since fallen to 22,500. Employment in poultry, smallgoods and wool processing has been more volatile, but remains at around 5,600. The poultry, smallgoods and wool processors, not challenged in the same way by difficulties in closing plants, many of which are smaller, have seen the total number of businesses fall by around one-third.
While employment in the sector has been falling, the number of businesses in meat processing has actually increased, to 254 from 213 over 14 years. Most of this growth will be the addition of smaller players (larger plants number less than 70), but the difference between the two sub-sectors is quite glaring.
As a result, the average number of workers per business in poultry, smallgoods and wool processing has grown from 16 to 26 over the last 14 years. The average number employed at a meat processing plant is 87, down from 104.
Part of what is keeping employment in poultry, smallgoods and wool processing is how production of poultry is ramping up. Total volume of chicken produced in New Zealand is twice what it was 16 years ago. Export markets are beginning to open up overseas, and present significant opportunities for growth, but currently account for a small proportion of production.
Annual chicken production, tonnes
0
50
100
150
200
250
0
50
100
150
200
250
Jun-00 Jun-02 Jun-04 Jun-06 Jun-08 Jun-10 Jun-12 Jun-14 Jun-16
000 000
Source: Statistics New Zealand, Westpac
Where inputs come from and outputs go
The vast bulk of New Zealand's meat and wool passes through processors before export. It is helpful to consider the structure of the meat and wool processing sector to understand which industries it relies on for its inputs and where its outputs go.
National input-output tables allow us to examine these relationships. This helps clarify how closely the fortunes of certain industries are linked to meat and wool. Unsurprisingly, the largest share of inputs into meat processing comes from sheep and beef farming. Other livestock, and dairy provide a further ninth of the total. More than two-thirds of total production is exported, with a fifth consumed directly by households. Small shares feed into other sectors as one would expect, primarily food and beverage services.
Meat and wool processing
Employment in meat and wool processing
3.00
3.75
4.50
5.25
6.00
14.0
17.5
21.0
24.5
28.0
2000 2002 2004 2006 2008 2010 2012 2014
Meat processing (LHS)Poultry, smallgoods and wool
Source: Statistics New Zealand, Westpac
000 000
Business units in meat and wool processing
150
200
250
300
350
50
100
150
200
250
300
350
2000 2002 2004 2006 2008 2010 2012 2014
Meat processing (LHS)Poultry, smallgoods and wool
Source: Statistics New Zealand, Westpac

INDUSTRY INSIGHTS | November 2016 | 18
Where inputs come from
57.0%
6.2%
5.5%
4.2%3.2%2.2%
20.0%
Sheep & beef farming
Other livestock farming
Dairy farming
Imports
Road transport
Agri, forest & fish support svs
Meat mfg
Other
Meat and meat product manufacturing
Source: Westpac
Where outputs go
67.7%
21.5%
4.4% Exports
Consumption
Food & beverage svs
Grocery, liquor & tobacco wholesale
Meat mfg
Textile & leather mfg
Grocery retail
Other
Meat and meat product manufacturing
Source: Westpac

INDUSTRY INSIGHTS | November 2016 | 19
Contact the Westpac economics team
Michael Gordon, Acting Chief Economist +64 9 336 5670
Satish Ranchhod, Senior Economist +64 9 336 5668
Anne Boniface, Senior Economist +64 9 336 5669
David Norman, Industry Economist +64 9 336 5656
Sarah Drought, Economist +64 9 336 5696
Any questions email: [email protected]
Disclaimer
Things you should know
Westpac Institutional Bank is a division of Westpac Banking Corporation ABN 33 007 457 141 (‘Westpac’).
Disclaimer
This material contains general commentary, and market colour. The material does not constitute investment advice. Certain types of transactions, including those involving futures, options and high yield securities give rise to substantial risk and are not suitable for all investors. We recommend that you seek your own independent legal or financial advice before proceeding with any investment decision. This information has been prepared without taking account of your objectives, financial situation or needs. This material may contain material provided by third parties. While such material is published with the necessary permission none of Westpac or its related entities accepts any responsibility for the accuracy or completeness of any such material. Although we have made every effort to ensure the information is free from error, none of Westpac or its related entities warrants the accuracy, adequacy or completeness of the information, or otherwise endorses it in any way. Except where contrary to law, Westpac and its related entities intend by this notice to exclude liability for the information. The information is subject to change without notice and none of Westpac or its related entities is under any obligation to update the information or correct any inaccuracy which may become apparent at a later date. The information contained in this material does not constitute an offer, a solicitation of an offer, or an inducement to subscribe for, purchase or sell any financial instrument or to enter a legally binding contract. Past performance is not a reliable indicator of future performance. Whilst every effort has been taken to ensure that the assumptions on which the forecasts are based are reasonable, the forecasts may be affected by incorrect assumptions or by known or unknown risks and uncertainties. The ultimate outcomes may differ substantially from these forecasts.
Country disclosures
Australia: Westpac holds an Australian Financial Services Licence (No. 233714). This material is provided to you solely for your own use and in your capacity as a wholesale client of Westpac.
New Zealand: In New Zealand, Westpac Institutional Bank refers to the brand under which products and services are provided by either Westpac or Westpac New Zealand Limited (“WNZL”). Any product or service made available by WNZL does not represent an offer from Westpac or any of its subsidiaries (other than WNZL). Neither Westpac nor its other subsidiaries guarantee or otherwise support the performance of WNZL in respect of any such product. The current disclosure statements for the New Zealand branch of Westpac
and WNZL can be obtained at the internet address www.westpac.co.nz. For further information please refer to the Product Disclosure Statement (available from your Relationship Manager) for any product for which a Product Disclosure Statement is required, or applicable customer agreement. Download the Westpac NZ QFE Group Financial Advisers Act 2008 Disclosure Statement at www.westpac.co.nz.
China, Hong Kong, Singapore and India: This material has been prepared and issued for distribution in Singapore to institutional investors, accredited investors and expert investors (as defined in the applicable Singapore laws and regulations) only. Recipients in Singapore of this material should contact Westpac Singapore Branch in respect of any matters arising from, or in connection with, this material. Westpac Singapore Branch holds a wholesale banking licence and is subject to supervision by the Monetary Authority of Singapore. Westpac Hong Kong Branch holds a banking license and is subject to supervision by the Hong Kong Monetary Authority. Westpac Hong Kong branch also holds a license issued by the Hong Kong Securities and Futures Commission (SFC) for Type 1 and Type 4 regulated activities. This material is intended only to “professional investors” as defined in the Securities and Futures Ordinance and any rules made under that Ordinance. Westpac Shanghai and Beijing Branches hold banking licenses and are subject to supervision by the China Banking Regulatory Commission (CBRC). Westpac Mumbai Branch holds a banking license from Reserve Bank of India (RBI) and subject to regulation and supervision by the RBI.
UK: The contents of this communication, which have been prepared by and are the sole responsibility of Westpac Banking Corporation London and Westpac Europe Limited. Westpac (a) has its principal place of business in the United Kingdom at Camomile Court, 23 Camomile Street, London EC3A 7LL, and is registered at Cardiff in the UK (as Branch No. BR00106), and (b) authorised and regulated by the Australian Prudential Regulation Authority in Australia. Westpac is authorised in the United Kingdom by the Prudential Regulation Authority. Westpac is subject to regulation by the Financial Conduct Authority and limited regulation by the Prudential Regulation Authority. Details about the extent of our regulation by the Prudential Regulation Authority are available from us on request. Westpac Europe Limited is a company registered in England (number 05660023) and is authorised by the Prudential Regulation Authority and regulated by the Financial Conduct Authority and the Prudential Regulation Authority.
This communication is being made only to and is directed at (a) persons who have professional experience in matters relating to investments who fall within Article 19(5) of the Financial Services and Markets Act 2000 (Financial Promotion) Order 2005 (the “Order”)

INDUSTRY INSIGHTS | November 2016 | 20
or (b) high net worth entities, and other persons to whom it may otherwise lawfully be communicated, falling within Article 49(2)(a) to (d) of the Order (all such persons together being referred to as “relevant persons”). Any person who is not a relevant person should not act or rely on this communication or any of its contents. The investments to which this communication relates are only available to and any invitation, offer or agreement to subscribe, purchase or otherwise acquire such investments will be engaged in only with, relevant persons. Any person who is not a relevant person should not act or rely upon this communication or any of its contents. In the same way, the information contained in this communication is intended for “eligible counterparties” and “professional clients” as defined by the rules of the Financial Conduct Authority and is not intended for “retail clients”. With this in mind, Westpac expressly prohibits you from passing on the information in this communication to any third party. In particular this communication and, in each case, any copies thereof may not be taken, transmitted or distributed, directly or indirectly into any restricted jurisdiction. This communication is made in compliance with the Market Abuse Regulation (Regulation(EU) 596/2014).
Investment Recommendations Disclosure
The material may contain investment recommendations, including information recommending an investment strategy. Reasonable steps have been taken to ensure that the material is presented in a clear, accurate and objective manner. Investment Recommendations for Financial Instruments covered by MAR are made in compliance with Article 20 MAR. Westpac does not apply MAR Investment Recommendation requirements to Spot Foreign Exchange which is out of scope for MAR.
Unless otherwise indicated, there are no planned updates to this Investment Recommendation at the time of publication. Westpac has no obligation to update, modify or amend this Investment Recommendation or to notify the recipients of this Investment Recommendation should any information, including opinion, forecast or estimate set out in this Investment Recommendation change or subsequently become inaccurate.
Westpac will from time to time dispose of and acquire financial instruments of companies covered in this Investment Recommendation as principal and act as a market maker or liquidity provider in such financial instruments.
Westpac does not have any proprietary positions in equity shares of issuers that are the subject of an investment recommendation.
Westpac may have provided investment banking services to the issuer in the course of the past 12 months.
Westpac does not permit any issuer to see or comment on any investment recommendation prior to its completion and distribution.
Individuals who produce investment recommendations are not permitted to undertake any transactions in any financial instruments or derivatives in relation to the issuers covered by the investment recommendations they produce.
Westpac has implemented policies and procedures, which are designed to ensure conflicts of interests are managed consistently and appropriately, and to treat clients fairly.
The following arrangements have been adopted for the avoidance and prevention of conflicts in interests associated with the provision of investment recommendations.
(i) Chinese Wall/Cell arrangements;
(ii) physical separation of various Business/Support Units;
(iii) and well defined wall/cell crossing procedures;
(iv) a “need to know” policy;
(v) documented and well defined procedures for dealing with conflicts of interest;
(vi) steps by Compliance to ensure that the Chinese Wall/Cell arrangements remain effective and that such arrangements are adequately monitored.
U.S.: Westpac operates in the United States of America as a federally licensed branch, regulated by the Office of the Comptroller of the Currency. Westpac is also registered with the US Commodity Futures Trading Commission (“CFTC”) as a Swap Dealer, but is neither registered as, or affiliated with, a Futures Commission Merchant registered with the US CFTC. Westpac Capital Markets, LLC (‘WCM’), a wholly-owned subsidiary of Westpac, is a broker-dealer registered under the U.S. Securities Exchange Act of 1934 (‘the Exchange Act’) and member of the Financial Industry Regulatory Authority (‘FINRA’). This communication is provided for distribution to U.S. institutional investors in reliance on the exemption from registration provided by Rule 15a-6 under the Exchange Act and is not subject to all of the independence and disclosure standards applicable to debt research reports prepared for retail investors in the United States. WCM is the U.S. distributor of this communication and accepts responsibility for the contents of this communication. All disclaimers set out with respect to Westpac apply equally to WCM. If you would like to speak to someone regarding any security mentioned herein, please contact WCM on +1 212 389 1269. All disclaimers set out with respect to Westpac apply equally to WCM.
Investing in any non-U.S. securities or related financial instruments mentioned in this communication may present certain risks. The securities of non-U.S. issuers may not be registered with, or be subject to the regulations of, the SEC in the United States. Information on such non-U.S. securities or related financial instruments may be limited. Non-U.S. companies may not subject to audit and reporting standards and regulatory requirements comparable to those in effect in the United States. The value of any investment or income from any securities or related derivative instruments denominated in a currency other than U.S. dollars is subject to exchange rate fluctuations that may have a positive or adverse effect on the value of or income from such securities or related derivative instruments.
The author of this communication is employed by Westpac and is not registered or qualified as a research analyst, representative, or associated person under the rules of FINRA, any other U.S. self-regulatory organisation, or the laws, rules or regulations of any State. Unless otherwise specifically stated, the views expressed herein are solely those of the author and may differ from the information, views or analysis expressed by Westpac and/or its affiliates.
Disclaimer continued