industry report-agri-food-in-the-netherlands-sept14
TRANSCRIPT
2
80
90
100
110
120
130
140
2010 2011 2012 2013 2014
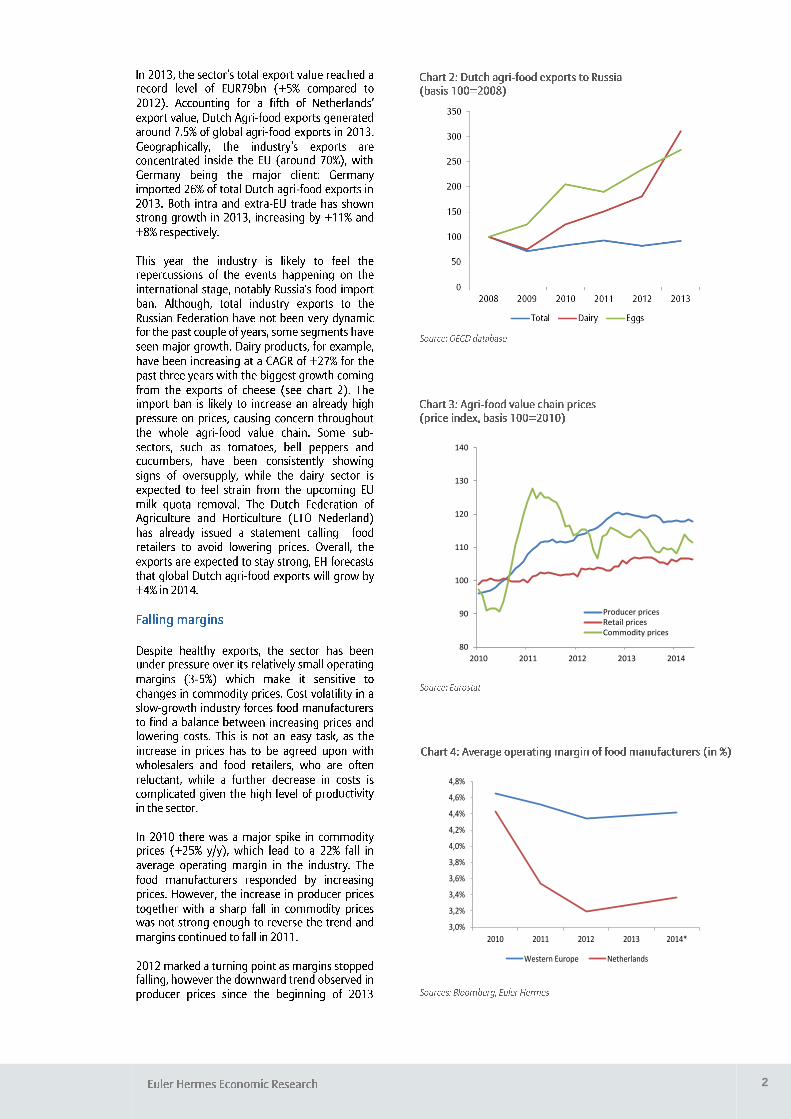
Producer pricesRetail pricesCommodity prices
3,0%
3,2%
3,4%
3,6%
3,8%
4,0%
4,2%
4,4%
4,6%
4,8%
2010 2011 2012 2013 2014*
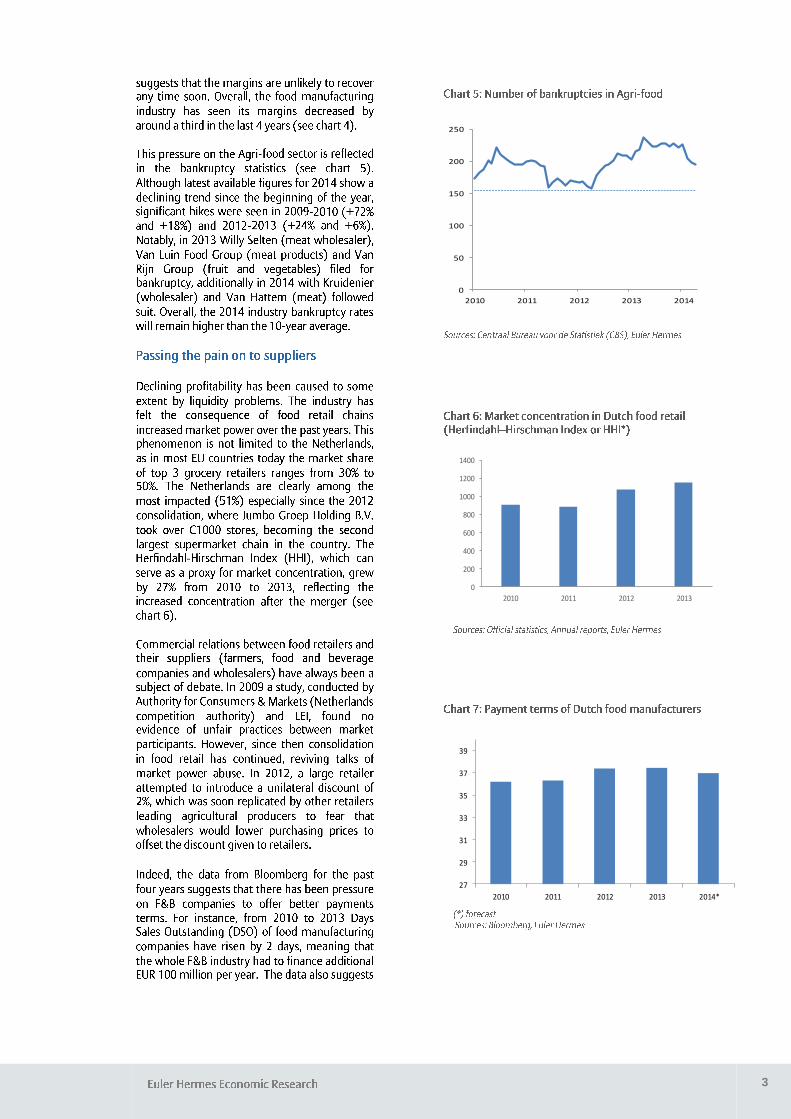
Western Europe Netherlands
3
0
50
100
150
200
250
2010 2011 2012 2013 2014
0
200
400
600
800
1000
1200
1400
2010 2011 2012 2013
27
29
31
33
35
37
39
2010 2011 2012 2013 2014*
4
0%
5%
10%
15%
20%
25%
30%
35%
40%
00 01 02 03 04 05 06 07 08 09 10 11 12
Latin America plus Mexico
Mexico
Colombia
Venezuela
0%
10%
20%
30%
40%
50%
60%
70%
80%
90%
00 01 02 03 04 05 06 07 08 09 10 11 12
-12%
-10%
-8%
-6%
-4%
-2%
0%
2%
4%
6%General gov. gross debt (right
scale)
General gov. net lending (left
scale)
-15%
-10%
-5%
0%
5%
10%
15%
20%
0%
10%
20%
30%
40%
50%
60%
00 01 02 03 04 05 06 07 08 09 10 11
Foreign debt (% GDP, left scale)
Current account (% GDP, right scale)
DISCLAIMER These assessments are, as always, subject to the disclaimer provided below.
This material is published by Euler Hermes SA, a Company of Allianz, for information purposes only and should not be regarded as providing any specific advice. Recipients should make their own independent evaluation of this information and no action should be taken, solely relying on it. This material should not be reproduced or disclosed without our consent. It is not intended for distribution in any jurisdiction in which this would be prohibited. Whilst this information is believed to be reliable, it has not been independently verified by Euler Hermes and Euler Hermes makes no representation or warranty (express or implied) of any kind, as regards the accuracy or completeness of this information, nor does it accept any responsibility or liability for any loss or damage arising in any way from any use made of or reliance placed on, this information. Unless otherwise stated, any views, forecasts, or estimates are solely those of the Euler Hermes Economics Department, as of this date and are subject to change without notice. Euler Hermes SA is authorised and regulated by the Financial Markets Authority of France.
© Copyright 2014 Euler Hermes. All rights reserved.
GDP growth (y/y, 4 qtrs cumulated %)
Sources: IHS Global Insight, Euler Hermes
-20%
-15%
-10%
-5%
0%
5%
10%
15%
20%
25%
00 01 02 03 04 05 06 07 08 09 10 11
Venezuela
World
Latin America