indutrade annual report 2014
DESCRIPTION
ÂTRANSCRIPT

annual report
2014
ContentsBusiness concept ......................................................... 1
Indutrade in brief ........................................................ 2
CEO’s message ........................................................... 4
Share data .................................................................. 6
Goals and strategies .................................................... 8
Driving forces and business environment ................... 10
Business philosophy and acquisition process ...............11
Sustainable business ..................................................12
Quarterly overview .................................................... 14
Several-year overview................................................ 16
Definitions ................................................................ 18
Directors’ report ....................................................... 19
Proposed distribution of earnings .............................. 33
Board of Directors and auditors ................................. 34
Executive Management ............................................. 35
Group accounts ........................................................ 36
Parent company accounts ...........................................41
Notes ........................................................................ 45
Audit report ...............................................................74
Annual General Meeting and reporting dates ............ 75
Contact details .......................................................... 75
Net sales and earnings
SEK m SEK m
0
3,000
6,000
9,000
12,000
201420132012201120100
300
600
900
1,200
Net sale EBITA
Key data 2014 2013
Net sales, SEK m 9,746 8,831
EBITA, SEK m 1,134 990
EBITA margin, % 11.6 11.2
Profit for the year after tax, SEK m 703 587
Earnings per share, SEK 17.60 14.68
Return on operating capital, % 21 20
Average number of employees 4,418 4,151
Year in brief• Order intake rose 11% to SEK 10,000 million
(9,014).• Net sales rose 10% to SEK 9,746 million
(8,831). • Operating profit before amortisation of
intangible non-current assets attributable to
acquisitions (EBITA) rose 15% to SEK 1,134
million (990).• Earnings per share were SEK 17.60 (14.68). • Twelve acquisitions were carried out, with
total annual sales of approximately SEK 770
million, of which eleven were consolidated
by year-end.• The Board of Directors proposes a dividend
of SEK 7.75 (7.05) per share.
This is a non-official translation of the Swedish original wording. In case of differences between the English translation and the Swedish original, the Swedish text shall prevail.
» INDUTRADE 1 «A N N UA L R EP O RT 2014
EBITA margin, %
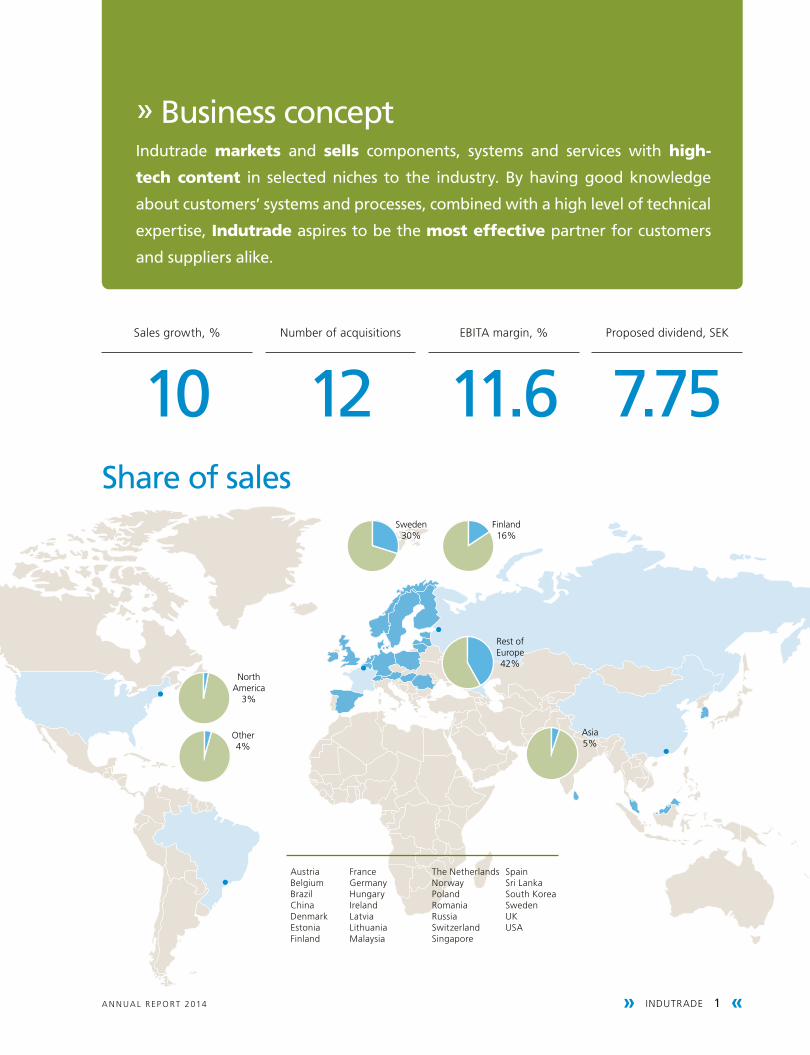
11.6Sales growth, %
10Number of acquisitions
12Proposed dividend, SEK
7.75Share of sales
Sweden30%
Finland16%
Rest ofEurope42%
Asia5%
NorthAmerica
3%
Other4%
Sweden30%
Finland16%
Rest ofEurope42%
Asia5%
NorthAmerica
3%
Other4%
Sweden30%
Finland16%
Rest ofEurope42%
Asia5%
NorthAmerica
3%
Other4%
Sweden30%
Finland16%
Rest ofEurope42%
Asia5%
NorthAmerica
3%
Other4%
Sweden30%
Finland16%
Rest ofEurope42%
Asia5%
NorthAmerica
3%
Other4%
AustriaBelgiumBrazilChinaDenmarkEstoniaFinland
FranceGermanyHungaryIrelandLatviaLithuaniaMalaysia
The NetherlandsNorwayPolandRomaniaRussiaSwitzerlandSingapore
SpainSri LankaSouth KoreaSwedenUKUSA
Indutrade markets and sells components, systems and services with high-
tech content in selected niches to the industry. By having good knowledge
about customers’ systems and processes, combined with a high level of technical
expertise, Indutrade aspires to be the most effective partner for customers
and suppliers alike.
» Business concept
» 2 INDUTRADE « Indutrade in brief A N N UA L R EP O RT 2014
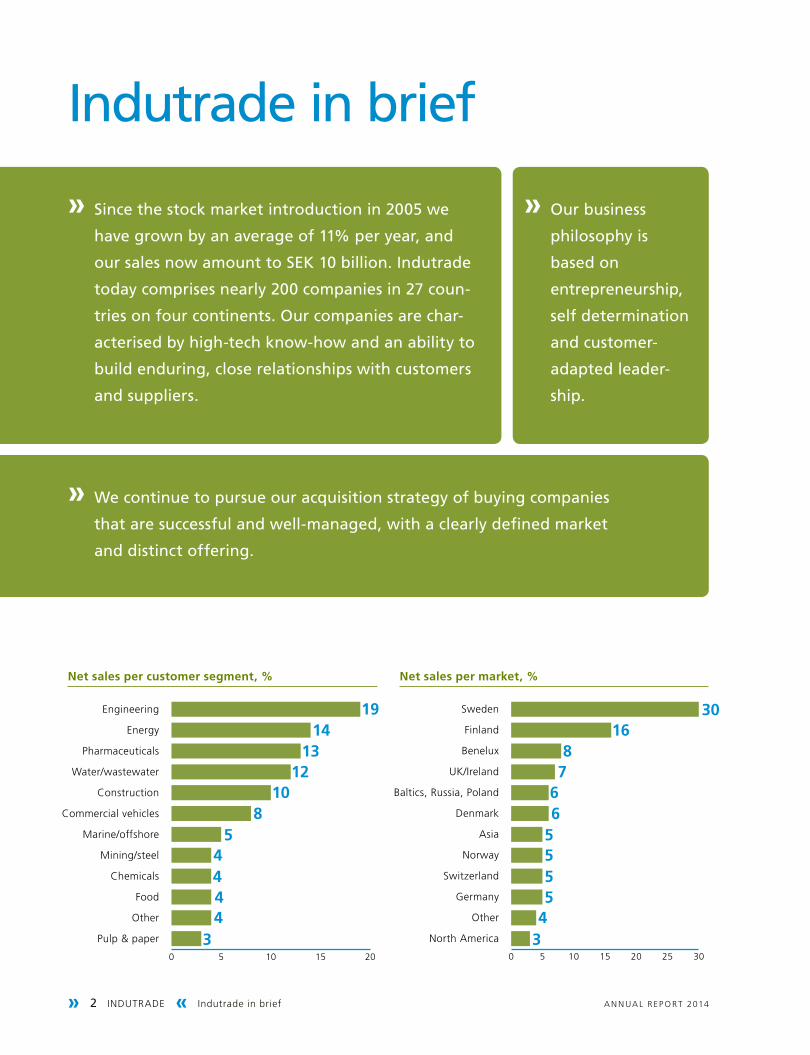
0 5 10 15 20
Pulp & paper
Other
Food
Chemicals
Mining/steel
Marine/offshore
Commercial vehicles
Construction
Water/wastewater
Pharmaceuticals
Energy
Engineering
3444
58
1012
1314
19
0 5 10 15 20 25 30
North America
Other
Germany
Switzerland
Norway
Asia
Denmark
Baltics, Russia, Poland
UK/Ireland
Benelux
Finland
Sweden 3016
87
5
5
3
54
66
54
Net sales per customer segment, % Net sales per market, %
» Since the stock market introduction in 2005 we
have grown by an average of 11% per year, and
our sales now amount to SeK 10 billion. Indutrade
today comprises nearly 200 companies in 27 coun-
tries on four continents. our companies are char-
acterised by high-tech know-how and an ability to
build enduring, close relationships with customers
and suppliers.
» We continue to pursue our acquisition strategy of buying companies
that are successful and well-managed, with a clearly defined market
and distinct offering.
» our business
philosophy is
based on
entrepreneurship,
self determination
and customer-
adapted leader-
ship.
Indutrade in brief
Indutrade in brief » INDUTRADE 3 «A N N UA L R EP O RT 2014
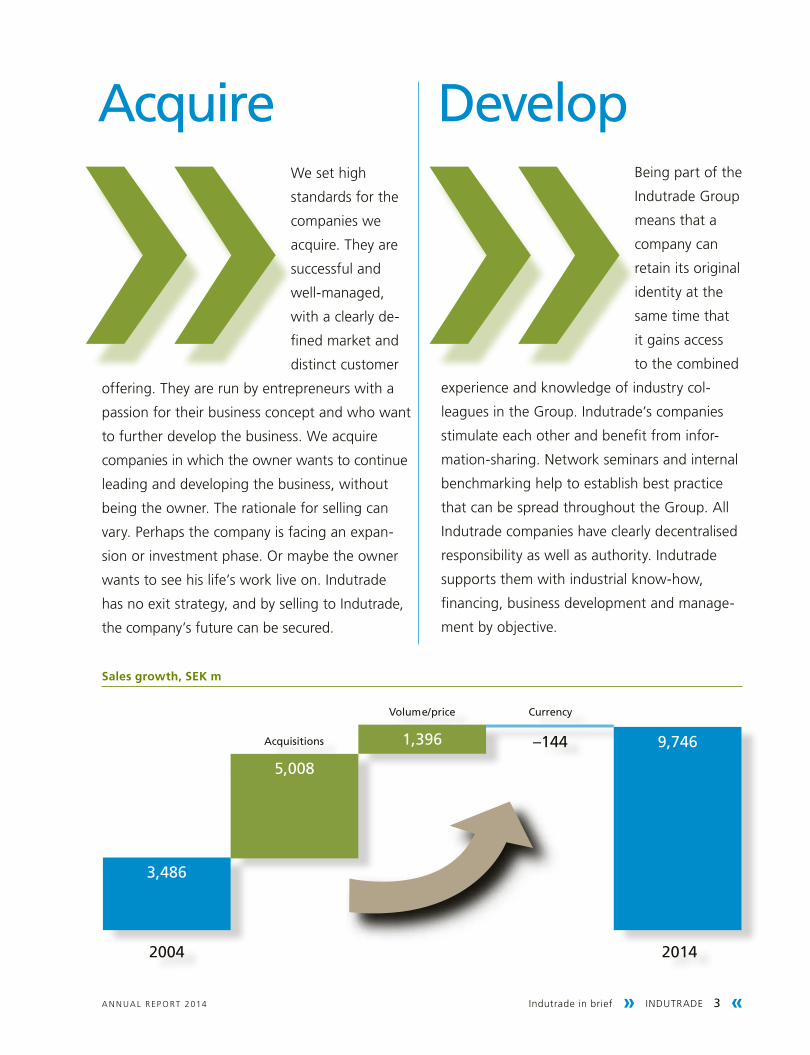
2004 2014
Acquisitions
Volume/price Currency
-2000
0
2000
4000
6000
8000
10000
3,486
5,008
1,396 9,746–144
Sales growth, SEK m
acquireWe set high
standards for the
companies we
acquire. They are
successful and
well-managed,
with a clearly de-
fined market and
distinct customer
offering. They are run by entrepreneurs with a
passion for their business concept and who want
to further develop the business. We acquire
companies in which the owner wants to continue
leading and developing the business, without
being the owner. The rationale for selling can
vary. Perhaps the company is facing an expan-
sion or investment phase. Or maybe the owner
wants to see his life’s work live on. Indutrade
has no exit strategy, and by selling to Indutrade,
the company’s future can be secured.
DevelopBeing part of the
Indutrade Group
means that a
company can
retain its original
identity at the
same time that
it gains access
to the combined
experience and knowledge of industry col-
leagues in the Group. Indutrade’s companies
stimulate each other and benefit from infor-
mation-sharing. Network seminars and internal
benchmarking help to establish best practice
that can be spread throughout the Group. All
Indutrade companies have clearly decentralised
responsibility as well as authority. Indutrade
supports them with industrial know-how,
financing, business development and manage-
ment by objective.
» 4 INDUTRADE « CEO's message A N N UA L R EP O RT 2014
For Indutrade, 2014 was yet another good year for the record. Sales grew 10% and earnings by 20%. Granted, organic growth was only 1%, but given the continued uncertain economic situation in our operating environ-ment, I am satisfied that despite this we have once again managed to achieve growth.
Owing to the extensive breadth of our business in terms of markets as well as sectors, ups and downs in the economy are seldom reflected with the same magnitude in our performance. We have a large spread of risk, and if business is weak in a given market or segment, then this is typically compensated by better performance somewhere else. The same applies for the effects of political decisions that can affect the conditions for doing business in a given market.
Some of our businesses can be affected by problems or disturbances without it having critical consequences for the whole. If anything, an increasingly cumbersome bureaucracy, directives and growing reporting require-ments are taking up a growing share of internal resources which otherwise could be used for business development.
During the year, we also achieved our goal of moving up to the Stockholm Stock Exchange’s Large Cap list. This benefits the company as well as its stock – the company, because it represents yet another quality seal in connec-tion with company acquisitions, and its stock, because more institutional investors with investment restrictions can now invest in Indutrade.
High pace of acquisitionsTwelve new companies with combined annual sales of approximately SEK 770 million came into the Indutrade Group during the year. Entirely in line with our ambition to increase our international presence, most of the acquisi-tions – eight in all – were of companies outside the Nordic region. Five of these were in the UK, which is a market we believe strongly in. In all we now have eleven compa-nies in the UK and Ireland, and both the newly acquired companies and the ones that we have had since previously performed very well during the year. Our success can be
credited to the combination of a favourable market and our acquisition of quality companies. I am counting on a continued high pace of growth in the UK, where there are many interesting companies. As we continue to make more acquisitions, knowledge about Indutrade and what we stand for is growing, which in turn is generating new business opportunities.
In Sweden, too, we expect to continue making acquisitions, but due to our size in certain segments, the number of potential acquisition candidates is fewer. However, it may be of interest for us to move into or grow in market segments that are new for us and that will con-tinue to exist in the country, where we can benefit from our technological niche expertise, such as in infrastructure projects.
New business areaAt year-end 2014 the Indutrade Group comprised nearly 200 companies in 26 countries and five business areas. Starting on 1 January 2015 we have a new, sixth business area. These are companies with relatively advanced meas-urement technology that have been broken away from the Special Products business area to form the new Measure-ment & Sensor Technology business area. We see great growth opportunities in this area, which is interesting in terms of products, markets and profitability. In connection with the formation of this business area we also strength-ened our management team with an externally recruited business area president.
Despite soft demand, all of the business areas per-formed well in 2014, and all of them except Engineering &
Successful acquisitions
CEO's message » INDUTRADE 5 «A N N UA L R EP O RT 2014
Equipment posted earnings improvements compared with 2013. Energy, which is one of our most important seg-ments, got off to a weak start in 2014. However, the sec-ond half of the year was considerably better, with favour-able growth in both invoicing and order intake, and the starting point for 2015 thus appears bright, with a number of big power plant construction projects under way. We have also had success in wind power, which shows that we are well positioned to handle conventional as well as new energy technology.
Good opportunities despite concernsOf course, the unstable global situation – with economic tensions in the EU, terrorist acts and the crisis in Ukraine – is creating uncertainty, which in turn affects the will-ingness to invest among businesses as well as private individuals. Despite of this, the market trend in industry was generally regarded as positive at the start of 2015. However, it is too early to draw any conclusions for the full year. Indutrade has achieved steady growth since its start more than 35 years ago, and the key to our success is our focus on generating positive cash flow. With the money we earn we buy quality companies that generate more money, which enables us to buy more quality companies – it’s that simple. This is how we grow and succeed at gen-erating capital for new acquisitions as well as for a return for our shareholders.
The biggest challenge for Indutrade is to achieve or-ganic growth with profitability. The climate for continued acquisitions is positive, in my view. We have strong cash flow that we can use for new acquisitions. We also have
a good deal flow, and the more well-known we become in the international market, the greater opportunities we have to find good companies.
At our acquisition hubs in the Netherlands, Switzerland and the UK, we are now starting to see the effects of the competence transfer that has taken place with respect to company acquisitions, and the Group’s operations outside the Nordic countries are expected to grow steadily.
New sales channelPreviously, large international trade shows were the primary showcase for companies offering technological products or services. Trade shows are now partly being usurped by the internet. Currently a shift is taking place in our industry, and web portals targeted at customers as well as designers are becoming an increasingly important sales channel. This is opening up opportunities as our companies gain an even broader global reach.
Finally, I cannot stress enough the importance that we hold fast to our values and strong culture, distinguished by entrepreneurship. Our business model is based on a clearly decentralised organisation and management by objective. To preserve and promote creativity and an enterprising spirit, all of our leaders must be able and dare to delegate. This is a central component of our business model, and our success is proof that it works.
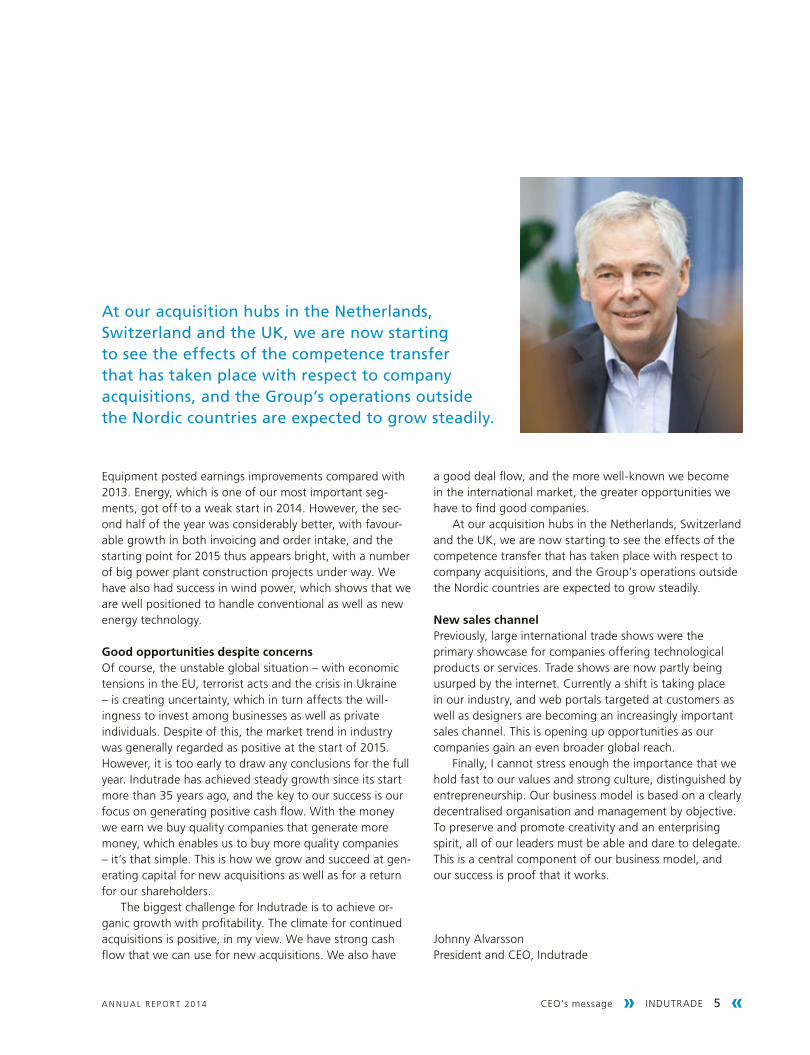
Johnny AlvarssonPresident and CEO, Indutrade
at our acquisition hubs in the netherlands, Switzerland and the uK, we are now starting to see the effects of the competence transfer that has taken place with respect to company acquisitions, and the Group’s operations outside the nordic countries are expected to grow steadily.
» 6 INDUTRADE « Share data A N N UA L R EP O RT 2014
Share data
Indutrade’s shares are listed on Nasdaq Stockholm. From 1 January 2015 the shares are listed on the Large Cap list. Indutrade’s market capitalisation on 31 December 2014 was SEK 12,480 million (10,740).
Indutrade’s share price rose from SEK 268.50 to SEK 312.00 during the year, an increase of 16%. The Stock-holm Stock Exchange gained 13% for the year, and the OMX Industrials PI index rose 12%. Including reinvested dividends, the total return for Indutrade shares was 19%. The highest price paid in 2014 was on 2 April, SEK 319.50, and the lowest price paid was on 16 October, SEK 241.00. Since the stock market introduction on 5 October 2005 until 31 December 2014, Indutrade’s shares have delivered a total return of 466% including reinvested dividends, while the SIX Return Index, which measures the total return of the market as a whole, showed a total return of 137% during the same period.
Trading volumeA total of 17.5 million (21.2) Indutrade shares were traded in 2014, for a combined value of SEK 5.1 billion (4.9). This corresponds to a turnover rate of 44% (53%). Aver-age daily trading volume was 70,328 Indutrade shares (84,890), with 355 transactions (193).
Share capitalIndutrade’s share capital amounted to SEK 40 million on 31 December 2014 (40), divided among 40,000,000 shares (40,000,000) with a share quota value of SEK 1. All shares have equal voting power.
Ownership structureIndutrade had 5,970 shareholders on 31 December 2014 (6,038). At year-end the ten largest owners controlled 69% of the capital and votes (66%). Swedish legal entities, including institutions such as insurance companies and mutual funds, owned 72% of the capital and votes at year-end (72%). Foreign ownership of the Company was 21% (20%).
Incentive programmesIn April 2014 the Annual General Meeting of Indutrade AB resolved to implement an incentive programme, LTI 2014, comprising a combined maximum of 460,000 warrants in two series, directed at senior executives and other key persons in the Indutrade Group.
Within the framework of Series I, which was offered to 135 persons, the participants acquired a total of 257,500 warrants for a combined total of SEK 3,914,000. The price per warrant was SEK 15.20, which corresponded to the market price. The subscription price was set at SEK 356.30 per share. Within the framework of Series II, which was offered to 13 persons, the participants acquired a total of 27,500 warrants for a combined value of SEK 319,000. The price per warrant was SEK 11.60, which corresponded to the market price. The subscription price for this series was set at SEK 350.00 per share.
The shares can be subscribed during specially pre-scribed subscription periods through Friday, 18 May 2018. Upon full exercise, the number of shares outstanding will increase by 285,000, corresponding to 0.7% of the total number of shares and votes.
During the reporting period, the dilutive effect was 0%.
10 largest shareholders at 31 December 2014
no. shares
Share of capital and
votes, %
L E Lundbergföretagen 10,230,000 25.6
Didner & Gerge funds 3,936,899 9.8
AMF Insurance and Funds 3,837,668 9.6
Lannebo funds 2,725,595 6.8
Handelsbanken Funds AB RE JPMEL 1,975,361 4.9
SEB Investment Management 1,596,405 4.0
Nordea Investment Funds 1,219,342 3.1
Odin Norden Verdipapirfond 929,473 2.3
Canadian Treaty Clients Account 637,656 1.6
Odin Sverige Aksjefondet 616,150 1.5
Other 12,295,451 30.8
Shareholders grouped by size
Size classno.
shareholders
Share of capital and
votes, %
1 – 500 4,385 2.0
501 – 1,000 755 1.5
1,001 – 2,000 355 1.4
2,001 – 5,000 239 2.0
5,001 – 10,000 82 1.4
10,001 – 20,000 41 1.5
20,001 – 50,000 46 3.7
50,001 – 100,000 24 4.7
100,001 – 500,000 28 14.9
500,001 – 1,000,000 9 14.8
1,000,001 – 5,000,000 5 26.5
5,000,001 – 10,000,000 0 0
10,000,001 – 1 25.6

Share data » INDUTRADE 7 «A N N UA L R EP O RT 2014
Key data per share
2014 2013
Share price per 31 December, SEK 312.00 268.50
Market cap per 31 December, SEK m 12,480 10,740
Dividend, SEK 7.751) 7.05
Earnings, SEK 17.60 14.68
No. of shares outstanding, thousands 40,000 40,000
No. of shareholders per 31 December 5,970 6,038
Highest prices paid during the financial year, SEK 319.50 272.50
Lowest price paid during the financial year, SEK 241.00 198.00
Dividend yield2), % 2.5 2.6
Shareholders’ equity, SEK 79.00 65.58
Cash flow from operating activities, SEK 22.60 21.48
1) Proposed by the Board of Directors.2) Dividend divided by share price on 31 December.
Dividend and dividend policyThe Board’s goal is to provide the shareholders an attrac-tive dividend yield and high dividend growth. The goal is that over time, the dividend shall range from 30% to 60% of net profit. During the last five-year period, of Indutrade’s aggregate profit after tax, totalling SEK 2,804 million, dividends of SEK 1,348 million have been paid to the shareholders (including the proposed dividend for the year), which corresponds to 48% of net profit.
Contacts with investors and analystsIndutrade maintains regular contact with various actors in the financial market in an effort to provide clear informa-tion about the Company’s performance and events. This is done, among other things, through presentations in con-nection with quarterly reports and through participation in conferences and seminars.
For more information about IR activities and the ana-lysts who monitor Indutrade, visit www.indutrade.se.
Earnings Dividend
Resultat Utdelning
SEK
0
5
10
15
20
20142013201220112010200920082007
SEK
0
5
10
15
20
20142013201220112010200920082007
Earnings and dividend per share
Total return for Indutrades shares October 2005-2014
Share price trend October 2005-2014
Share price trend 2014
■ Indutrade ■ SX20 OMX Stockholm Industrials_PI ■ OMX Stockholm_PI
■ Indutrade (Total return) ■ SIX Return Index
■ Indutrade ■ SX20 OMX Stockholm Industrials_PI ■ OMX Stockholm_PI
SEK
SEK
No. of shares
SEK No. of shares
Trading volume, number of shares ‘000 per mounth
Trading volume, number of shares ‘000 per mounth
0
500
1,000
1,500
2,000
2,500
3,000
3,500
4,000
DecNovOctSepAugJulJunMayAprMarFebJan240
250
260
270
280
290
300
310
320
0
3,000
6,000
9,000
12,000
15,000
20142013201220112010200920082007200620050
50
100
150
200
250
300
350
0
100
200
300
400
500
2014201320122011201020092008200720062005

» 8 INDUTRADE « Goals and strategies A N N UA L R EP O RT 2014
overall goals
the Group strives for continuous growth in selected geographical markets, product areas and niches while maintaining limited business risk. Growth is pursued organically as well as through acquisitions. Indutrade’s overall goals for profitable growth are:
» to be the leading technical sales group in northern europe in terms of net sales and technical expertise,
» to be an international group with proprietary products and brands.
Goals and strategies
Financial targets Target achievement Historical achievement
Average sales growth shall amount to a minimum of 10% per year over a business cycle. Growth is to be achieved organi-cally as well as through acquisitions.
During the last five-year period, average annual sales growth was 9%. Net sales increased by 10% in 2014. For comparable units, the change was marginal, while ac-quired growth was 7%. The currency effect in 2014 was 3%.
The target EBITA margin is a minimum of 10% per year over a business cycle.
The average EBITA margin during the last five years was 11.1%. The EBITA margin in 2014 was 11.6%.
Return on operating capital should be a minimum of 20% per year over a business cycle.
1) The target for return on operating capital was changed in the beginning of 2014 to be 20% instead of previously 25%.
During the last five years, the average return on operating capital was 21%. In 2014 the return was 21%.
Net debt/equity ratio should normally not exceed 100%.
During the last five years, the net debt/equity ratio at year-end ranged from 79% to 102%. The net debt/equity ratio at year-end 2014 was 79%.
The dividend payout ratio should range from 30% to 60% of net profit.
1) The target for dividend payout ratio was a minimum of 50 % of net profit until the proposed dividend for 2012.
2) Proposed dividend for 2014.
During the last five years, the dividend payout ratio was 48% including the proposed dividend. For 2014 a dividend of SEK 7.75 has been proposed, correspond-ing to 44% of net profit.
%
Mål
–10
–5
05
10
15
20
20142013201220112010
%
Mål
0
5
10
15
20
20142013201220112010
%
Mål
0
10
20
30
20142013201220112010
1)
%
Målej överstiga100%
0
20
40
60
80
100
120
20142013201220112010
%
Mål
0
20
40
60
80
100
2014 2)2013201220112010
Target1) 1)
%
Target
–10
–5
05
10
15
20
20142013201220112010
%
Target
0
5
10
15
20
20142013201220112010
%
Target
0
10
20
30
20142013201220112010
1)
%
Targetnot to exceed100%
0
20
40
60
80
100
120
20142013201220112010
%
0
20
40
60
80
100
2014 2)2013201220112010
Goals and strategies » INDUTRADE 9 «A N N UA L R EP O RT 2014
Strategies
Indutrade pursues the following strategies to achieve its goals.
Growth with limited business riskGrowth will be pursued in three dimensions:• In new and existing technology areas• Through a broadened customer offering, such as extended
support, training and other aftermarket services• Geographically in selected marketsGrowth is to be achieved organically as well as through acqui-sitions. As companies in the Indutrade Group grow, the entry barriers for potential competitors are also expected to rise. At the same time, the risk of Indutrade’s suppliers establishing own sales organisations in the Company’s markets decreases.
» Business development and growth are strategic tools for lowering business risk.
AcquisitionsIndutrade acquires well managed, long-term successful, often owner-led industrial companies whose management teams are eager to continue running and growing the business. These companies manufacture or sell products in distinct markets.
» Indutrade normally does not sell companies. nor do we change the companies’ names or combine com-panies, which means that the seller knows that the company will continue as a player in the market.
Strong market positionsIndutrade focuses on sales of products in niches in which it can attain a leading position.
» Strong market positions are often a prerequisite for good profitability. they also make it easier to attract the best suppliers, which further strengthens Indutrade’s position.
Long-term partnerships with leading suppliersIndutrade gives priority to suppliers who, through own product development, provide market-leading, high-quality products with a high-tech content. A partnership with Indu-trade should be the most profitable way for suppliers to sell their products in the geographic markets in which Indutrade operates.
» a range of market-leading products from the best suppliers, coupled with Indutrade’s technical and market know-how, makes Indutrade an attractive business partner for existing and potential customers.
Companies with proprietary products and brandsIndutrade has a number of companies with proprietary products and brands. The products should have a high-tech content, while the companies should have a strong market position and favourable growth potential.
» proprietary products and brands balance the Group’s technology sales companies. Since 2004 the share of sales of proprietary products has grown by 31 percentage points, and in 2014 they accounted for 40% of consolidated net sales.
High share of repetitive sales and focus on selected customer segmentsThe Group gives priority to customers with a recurring need that are active in industries with favourable prospects for maintaining competitive production in Indutrade’s home markets. Many of these industries are characterised by a high degree of automation, high distribution costs and/or large start-up investment.
» this contributes to business stability and predict-ability of revenue flows.
Sales organisation with high level of technical expertiseIndutrade’s product and service offering, which is aimed at both end users and OEM customers (customers that integrate Indutrade’s products in their own products), should have a high-tech content and incorporate a high level of service and qualified technical consulting. Indutrade’s sales repre-sentatives must have a high level of technical expertise in their respective niches and a depth of knowledge about the customers’ production processes.
» this makes Indutrade an attractive business partner that creates value-added for customers and suppliers alike.
Decentralised organisation with strong local tiesIndutrade’s governance model is characterised by decentralisa-tion, as the best business decisions are made close to customers by people who have the best understanding of the customers’ needs and processes.
» the subsidiaries are responsible for their own profitability, which contributes to greater flexibility and a stronger entrepreneurial spirit.

» 10 INDUTRADE « Driving forces A N N UA L R EP O RT 2014
Driving forces and business environment
BUSINESS PRIORITIES COMPANY PORTFOLIO VALUE CREATIONDRIVING FORCES
Macro• Population growth• Growing middle class• Scarcity of resources• Ageing population• Globalisation• Sustainable
development
Sales targets• Acquisitions of well man-
aged, owner-led industrial companies
• Broadened customer offering
• Geographical growth in selected markets
Margin targets• Stronger market positions• Repetitive sales
Sector focus• Engineering• Energy• Water and wastewater• Environment• Transport• Pharmaceuticals• Food
Customers• More energy-efficient
and environment-friendly operations
• Lower costs• Higher productivity• Broader product offering
Society• Better use of resources• Reduced transports• Environmental benefits
Shareholders• Dividend• Growth in value
Employees• Competence development
Global macro-trends often present major challenges for Indutrade’s customers. Indutrade strives to offer compo-nents, systems and services that improve customers’ ability to manage change and thereby overcome these challenges.
The world is developing and changing at a rapid pace. Monitoring and analysing global trends is crucial for Indu-trade’s ability to make well-grounded decisions regarding its business. Global trends entail both challenges and busi-ness opportunities.
Population growth along with a growing middle class is leading to rising demand for capital- as well as consumer goods. As people live longer, their healthcare needs are also growing, with a related rise in demand for new medicines and medical equipment. Finite natural resources are leading to higher demands for more efficient use of resources and the re-use of material and energy in industry. Climate change is leading to demands for greater use of renewable energy sources and a sustainable trans-port sector, with improved fuel economy and lower CO2 emissions. Overall, a growing environmental awareness, coupled with demands for long-term sustainable develop-ment is resulting in greater demand among consumers for locally produced goods.
More environment-friendly production with IndutradeIndutrade’s products and services help customers con-duct their businesses in a more energy-efficient and environment-friendly way. Our growth strategy is focused on sectors with high demands for efficiency and thus a high degree of automation. Priority is given to products that help industries measure, govern, control, automate and streamline their processes, and products that support industries in meeting environmental standards and their energy needs.
Diversification of riskIn an effort to diversify risk and reduce sensitivity to economic fluctuations, Indutrade works with products and services in a wide range of sectors.
In view of the growing demands for generally im-proved environmental performance and more efficient energy production, together with growing international trade, the segments that are considered to be the most important for Indutrade’s continued expansion and devel-opment are energy, water and wastewater, the environ-ment, transport, pharmaceuticals, engineering and food. The segments in which Indutrade currently has the most sales are engineering, energy, pharmaceuticals, and water and wastewater.
Business philosophy » INDUTRADE 11 «A N N UA L R EP O RT 2014
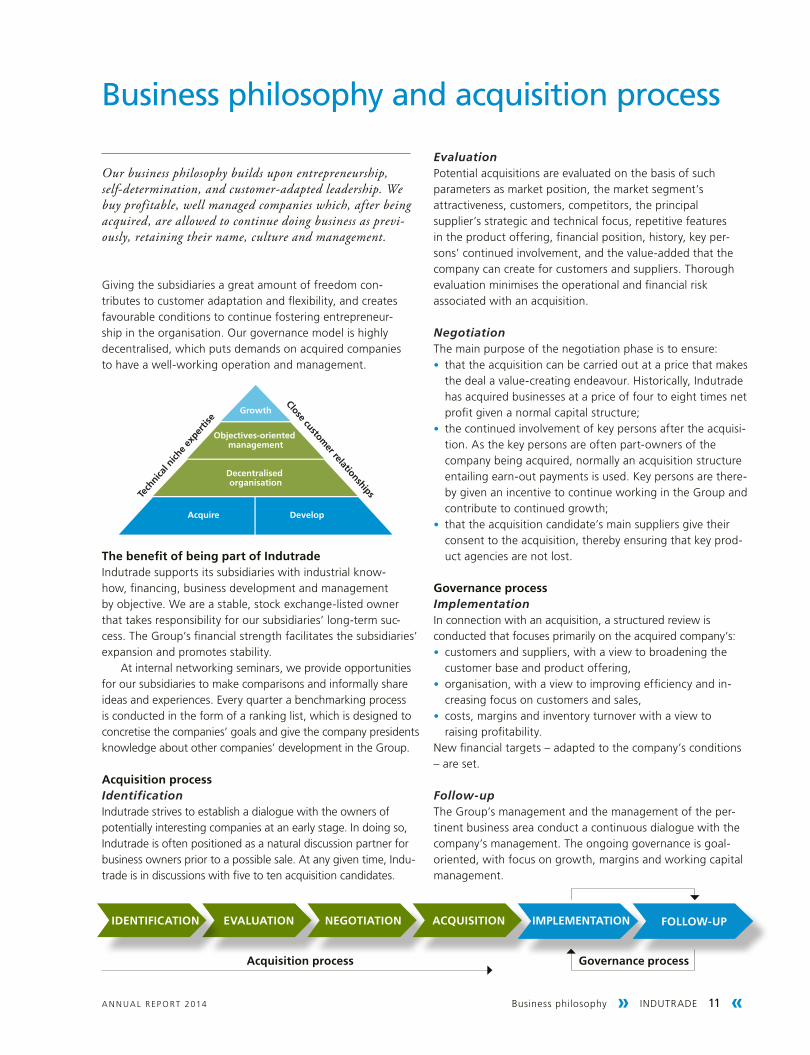
Our business philosophy builds upon entrepreneurship, self-determination, and customer-adapted leadership. We buy profitable, well managed companies which, after being acquired, are allowed to continue doing business as previ-ously, retaining their name, culture and management.
Giving the subsidiaries a great amount of freedom con-tributes to customer adaptation and flexibility, and creates favourable conditions to continue fostering entrepreneur-ship in the organisation. Our governance model is highly decentralised, which puts demands on acquired companies to have a well-working operation and management.
Business philosophy and acquisition process
EvaluationPotential acquisitions are evaluated on the basis of such para meters as market position, the market segment’s attractiveness, customers, competitors, the principal supplier’s strategic and technical focus, repetitive features in the product offering, financial position, history, key per-sons’ continued involvement, and the value-added that the company can create for customers and suppliers. Thorough evaluation minimises the operational and financial risk associated with an acquisition.
NegotiationThe main purpose of the negotiation phase is to ensure:• that the acquisition can be carried out at a price that makes
the deal a value-creating endeavour. Historically, Indutrade has acquired businesses at a price of four to eight times net profit given a normal capital structure;
• the continued involvement of key persons after the acquisi-tion. As the key persons are often part-owners of the company being acquired, normally an acquisition structure entailing earn-out payments is used. Key persons are there-by given an incentive to continue working in the Group and contribute to continued growth;
• that the acquisition candidate’s main suppliers give their consent to the acquisition, thereby ensuring that key prod-uct agencies are not lost.
Governance processImplementationIn connection with an acquisition, a structured review is conducted that focuses primarily on the acquired company’s:• customers and suppliers, with a view to broadening the
customer base and product offering, • organisation, with a view to improving efficiency and in-
creasing focus on customers and sales, • costs, margins and inventory turnover with a view to
raising profitability.New financial targets – adapted to the company’s conditions – are set.
Follow-upThe Group’s management and the management of the per-tinent business area conduct a continuous dialogue with the company’s management. The ongoing governance is goal-oriented, with focus on growth, margins and working capital management.
Evaluation nEGotiation acquisition implEmEntation Follow-up
acquisition process Governance process
idEntiFication
Business philosophy
Growth
Objectives-oriented management
Decentralised organisation
Acquire Develop
Entrepreneurship
Tech
nica
l nich
e ex
perti
se
Close customer relationships
the benefit of being part of indutradeIndutrade supports its subsidiaries with industrial know- how, financing, business development and management by objective. We are a stable, stock exchange-listed owner that takes responsibility for our subsidiaries’ long-term suc-cess. The Group’s financial strength facilitates the subsidiaries’ expansion and promotes stability.
At internal networking seminars, we provide opportunities for our subsidiaries to make comparisons and informally share ideas and experiences. Every quarter a benchmarking process is conducted in the form of a ranking list, which is designed to concretise the companies’ goals and give the company presidents knowledge about other companies’ development in the Group.
acquisition processIdentificationIndutrade strives to establish a dialogue with the owners of potentially interesting companies at an early stage. In doing so, Indutrade is often positioned as a natural discussion partner for business owners prior to a possible sale. At any given time, Indu-trade is in discussions with five to ten acquisition candidates.

» 12 INDUTRADE « Sustainable business A N N UA L R EP O RT 2014
Acquiring companies is one of the cornerstones of Indu-trade’s business model. In our acquisition process it is therefore of utmost importance that we ensure shared values and principles with respect to social responsibility and sustainable business. Naturally, our sustainability work is affected by the laws in the countries in which we have operations, but also by demands made by customers and other stakeholders. Our ambition is to conduct our business in close dialogue with all stakeholders that affect and are affected by our operations.
Everyone’s responsibilityGood business ethics and clear values are crucial for upholding the trust of customers, employees and other stakeholders. Each and every employee makes a contribu-tion to Indutrade’s reputation as a reliable and responsible company that lives up to its obligations.
Indutrade’s policy for social responsibility and environ-mental work provides support for all employees in their daily work. Employees can report deviations from this policy or suspicions of improprieties via our whistleblower function, which can be used anonymously.
Consideration for individuals and societyIndutrade’s operations are based on long-term, strong relationships with customers and suppliers, but also with the communities in which our companies are based. Our companies contribute to local development through a long-term presence and profitable business.
In addition, we support organisations and issues that are aligned with our fundamental values – both at the Group and local levels. A few of the organisations that Indutrade supports are the Children’s Cancer Fund of Sweden, Children’s Rights in Society (BRIS), and the Swedish Society for Nature Conservation.
Diversity Diversity and the repudiation of all forms of discrimina-tion are important for maintaining competitiveness and dynamism in our organisation as well as for continuing to be an attractive employer. We offer our employees equal opportunities regardless of their age, skin colour, gender, nationality, faith, sexual orientation or ethnicity. Workers’ rights to organise in the union of their choice and to col-lectively bargain shall be respected.
Continuous improvements in environmental workIndutrade’s core business is technology sales and distribu-tion, even though the share of the Group’s companies with own manufacturing has increased. As a result, Indutrade’s environmental impact is limited and related mainly to transports of finished products, business travel, and handling of waste.
Nonetheless, the goal is to continuously reduce the environmental impact of operations through systematic improvement work along the entire value chain. Among other things, we strive for more efficient use of energy and natural resources, and we prioritise the use of systems for the re-use or recycling of material and energy and take measures to prevent and limit pollution to the environment. Our goal is to reduce water and energy consumption for our products and to handle waste in a safe and effective manner.
Some of our subsidiaries are certified according to ISO 14001. But even the subsidiaries that are not certified con-duct systematic environmental work aimed at continuous improvement. Environmental targets are to be measure-able, and goals as well as plans are followed up within the frameworks of the respective subsidiaries.
Sustainable customer offeringsLike us, Indutrade’s customers are encountering rising demands and expectations for responsible and sustainable solutions. These entail significant opportunities for our business and operational development. Part of the posi-tioning of the companies’ offerings involves demonstrating the value added they offer from environmental and social perspectives. Indutrade’s companies offer many good examples of such solutions. Tribotec and Pentronic are two such companies.
Sustainable business
Sustainable business » INDUTRADE 13 «A N N UA L R EP O RT 2014
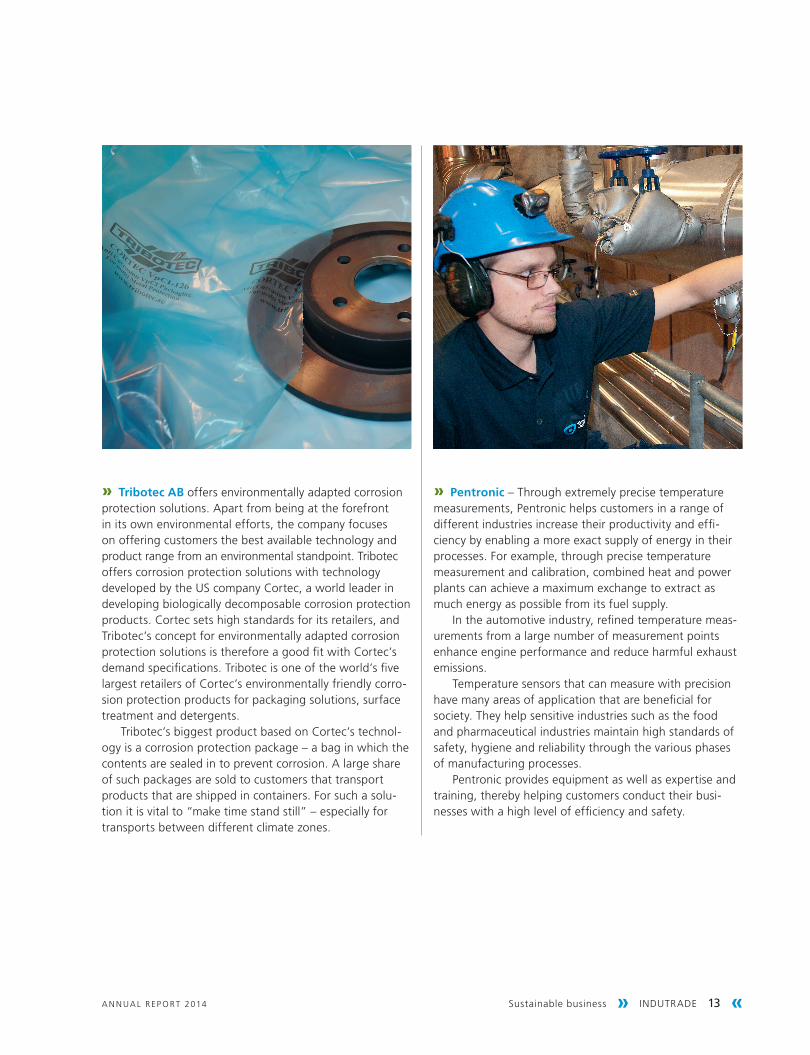
» Tribotec AB offers environmentally adapted corrosion protection solutions. Apart from being at the forefront in its own environmental efforts, the company focuses on offering customers the best available technology and product range from an environmental standpoint. Tribotec offers corrosion protection solutions with technology developed by the US company Cortec, a world leader in developing biologically decomposable corrosion protection products. Cortec sets high standards for its retailers, and Tribotec’s concept for environmentally adapted corrosion protection solutions is therefore a good fit with Cortec’s demand specifications. Tribotec is one of the world’s five largest retailers of Cortec’s environmentally friendly corro-sion protection products for packaging solutions, surface treatment and detergents.
Tribotec’s biggest product based on Cortec’s technol-ogy is a corrosion protection package – a bag in which the contents are sealed in to prevent corrosion. A large share of such packages are sold to customers that transport products that are shipped in containers. For such a solu-tion it is vital to “make time stand still” – especially for transports between different climate zones.
» Pentronic – Through extremely precise temperature measurements, Pentronic helps customers in a range of different industries increase their productivity and effi-ciency by enabling a more exact supply of energy in their processes. For example, through precise temperature measurement and calibration, combined heat and power plants can achieve a maximum exchange to extract as much energy as possible from its fuel supply.
In the automotive industry, refined temperature meas-urements from a large number of measurement points enhance engine performance and reduce harmful exhaust emissions.
Temperature sensors that can measure with precision have many areas of application that are beneficial for society. They help sensitive industries such as the food and pharmaceutical industries maintain high standards of safety, hygiene and reliability through the various phases of manufacturing processes.
Pentronic provides equipment as well as expertise and training, thereby helping customers conduct their busi-nesses with a high level of efficiency and safety.
» 14 INDUTRADE « Quarterly overview A N N UA L R EP O RT 2014
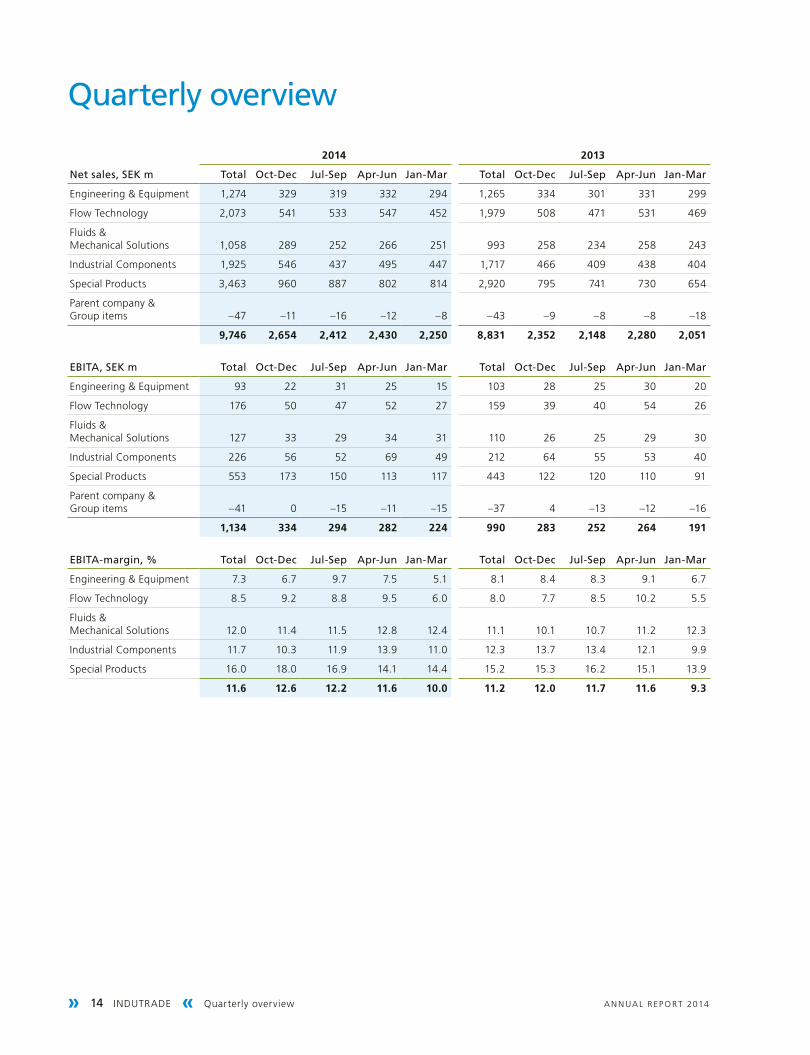
Quarterly overview
2014 2013
net sales, SeK m total oct-Dec Jul-Sep apr-Jun Jan-Mar total oct-Dec Jul-Sep apr-Jun Jan-Mar
Engineering & Equipment 1,274 329 319 332 294 1,265 334 301 331 299
Flow Technology 2,073 541 533 547 452 1,979 508 471 531 469
Fluids & Mechanical Solutions 1,058 289 252 266 251 993 258 234 258 243
Industrial Components 1,925 546 437 495 447 1,717 466 409 438 404
Special Products 3,463 960 887 802 814 2,920 795 741 730 654
Parent company &Group items –47 –11 –16 –12 –8 –43 –9 –8 –8 –18
9,746 2,654 2,412 2,430 2,250 8,831 2,352 2,148 2,280 2,051
eBIta, SeK m total oct-Dec Jul-Sep apr-Jun Jan-Mar total oct-Dec Jul-Sep apr-Jun Jan-Mar
Engineering & Equipment 93 22 31 25 15 103 28 25 30 20
Flow Technology 176 50 47 52 27 159 39 40 54 26
Fluids & Mechanical Solutions 127 33 29 34 31 110 26 25 29 30
Industrial Components 226 56 52 69 49 212 64 55 53 40
Special Products 553 173 150 113 117 443 122 120 110 91
Parent company &Group items –41 0 –15 –11 –15 –37 4 –13 –12 –16
1,134 334 294 282 224 990 283 252 264 191
eBIta-margin, % total oct-Dec Jul-Sep apr-Jun Jan-Mar total oct-Dec Jul-Sep apr-Jun Jan-Mar
Engineering & Equipment 7.3 6.7 9.7 7.5 5.1 8.1 8.4 8.3 9.1 6.7
Flow Technology 8.5 9.2 8.8 9.5 6.0 8.0 7.7 8.5 10.2 5.5
Fluids & Mechanical Solutions 12.0 11.4 11.5 12.8 12.4 11.1 10.1 10.7 11.2 12.3
Industrial Components 11.7 10.3 11.9 13.9 11.0 12.3 13.7 13.4 12.1 9.9
Special Products 16.0 18.0 16.9 14.1 14.4 15.2 15.3 16.2 15.1 13.9
11.6 12.6 12.2 11.6 10.0 11.2 12.0 11.7 11.6 9.3
Quarterly overview » INDUTRADE 15 «A N N UA L R EP O RT 2014
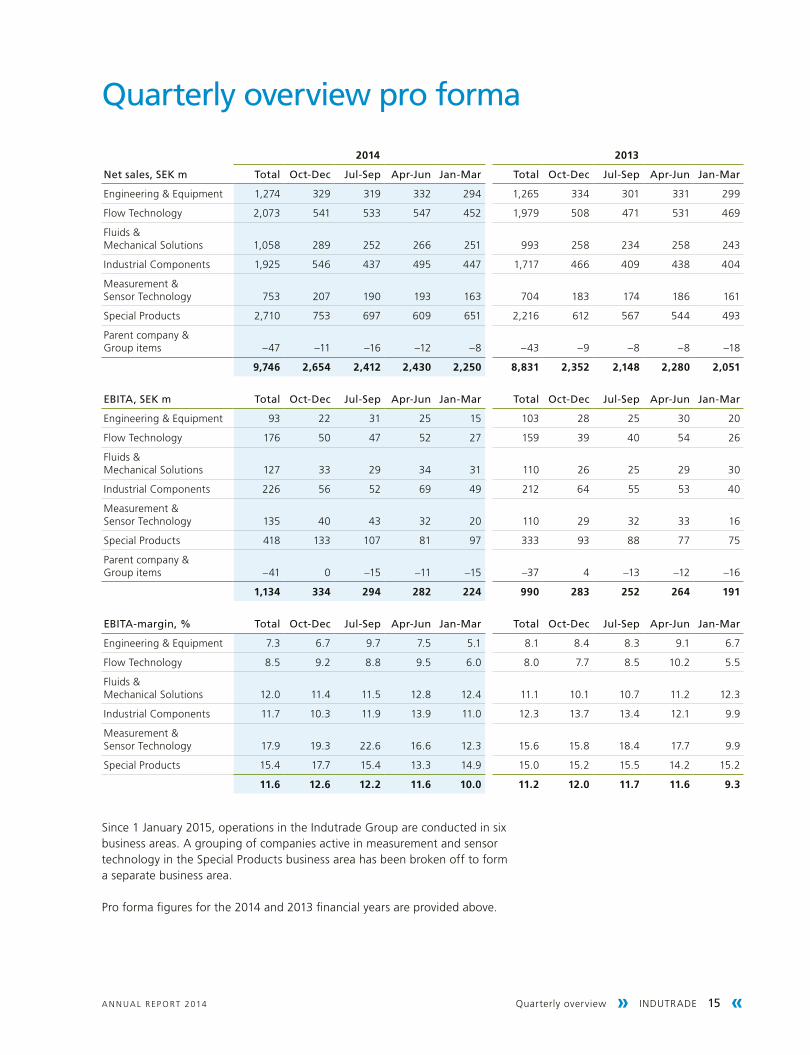
Quarterly overview pro forma
2014 2013
net sales, SeK m total oct-Dec Jul-Sep apr-Jun Jan-Mar total oct-Dec Jul-Sep apr-Jun Jan-Mar
Engineering & Equipment 1,274 329 319 332 294 1,265 334 301 331 299
Flow Technology 2,073 541 533 547 452 1,979 508 471 531 469
Fluids & Mechanical Solutions 1,058 289 252 266 251 993 258 234 258 243
Industrial Components 1,925 546 437 495 447 1,717 466 409 438 404
Measurement & Sensor Technology 753 207 190 193 163 704 183 174 186 161
Special Products 2,710 753 697 609 651 2,216 612 567 544 493
Parent company &Group items –47 –11 –16 –12 –8 –43 –9 –8 –8 –18
9,746 2,654 2,412 2,430 2,250 8,831 2,352 2,148 2,280 2,051
eBIta, SeK m total oct-Dec Jul-Sep apr-Jun Jan-Mar total oct-Dec Jul-Sep apr-Jun Jan-Mar
Engineering & Equipment 93 22 31 25 15 103 28 25 30 20
Flow Technology 176 50 47 52 27 159 39 40 54 26
Fluids & Mechanical Solutions 127 33 29 34 31 110 26 25 29 30
Industrial Components 226 56 52 69 49 212 64 55 53 40
Measurement & Sensor Technology 135 40 43 32 20 110 29 32 33 16
Special Products 418 133 107 81 97 333 93 88 77 75
Parent company &Group items –41 0 –15 –11 –15 –37 4 –13 –12 –16
1,134 334 294 282 224 990 283 252 264 191
eBIta-margin, % total oct-Dec Jul-Sep apr-Jun Jan-Mar total oct-Dec Jul-Sep apr-Jun Jan-Mar
Engineering & Equipment 7.3 6.7 9.7 7.5 5.1 8.1 8.4 8.3 9.1 6.7
Flow Technology 8.5 9.2 8.8 9.5 6.0 8.0 7.7 8.5 10.2 5.5
Fluids & Mechanical Solutions 12.0 11.4 11.5 12.8 12.4 11.1 10.1 10.7 11.2 12.3
Industrial Components 11.7 10.3 11.9 13.9 11.0 12.3 13.7 13.4 12.1 9.9
Measurement & Sensor Technology 17.9 19.3 22.6 16.6 12.3 15.6 15.8 18.4 17.7 9.9
Special Products 15.4 17.7 15.4 13.3 14.9 15.0 15.2 15.5 14.2 15.2
11.6 12.6 12.2 11.6 10.0 11.2 12.0 11.7 11.6 9.3
Since 1 January 2015, operations in the Indutrade Group are conducted in six business areas. A grouping of companies active in measurement and sensor technology in the Special Products business area has been broken off to form a separate business area.
Pro forma figures for the 2014 and 2013 financial years are provided above.
» 16 INDUTRADE « Several-year overview A N N UA L R EP O RT 2014
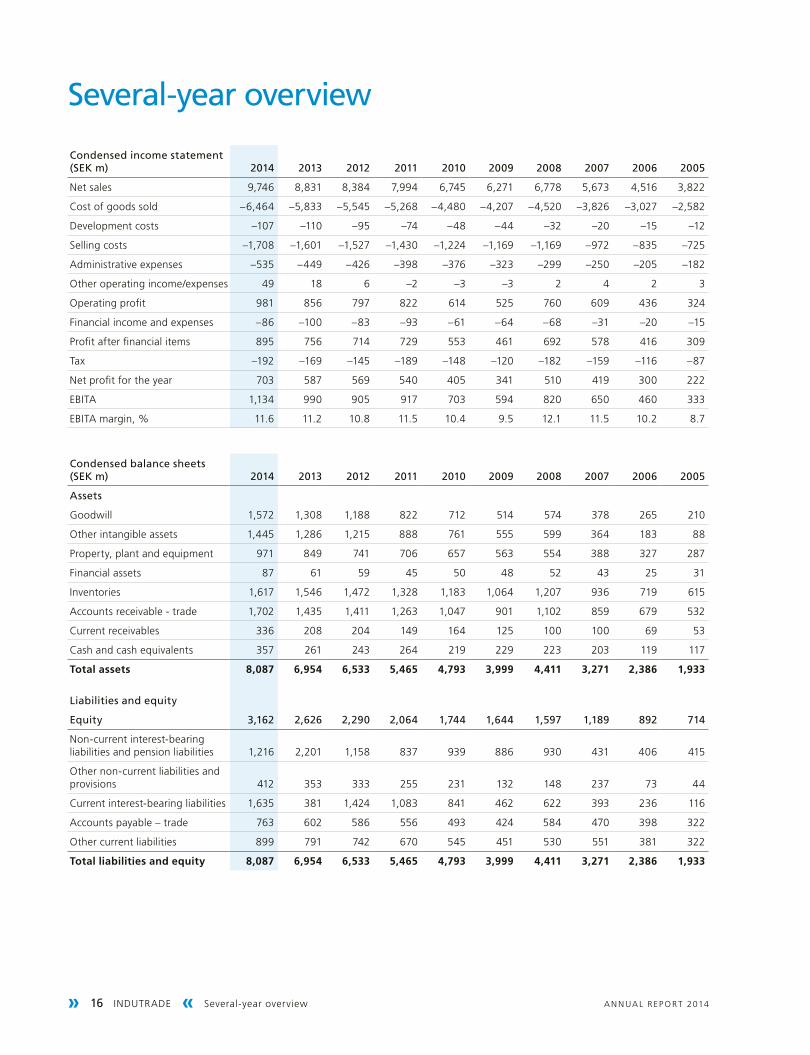
Several-year overview
Condensed income statement (SeK m) 2014 2013 2012 2011 2010 2009 2008 2007 2006 2005
Net sales 9,746 8,831 8,384 7,994 6,745 6,271 6,778 5,673 4,516 3,822
Cost of goods sold –6,464 –5,833 –5,545 –5,268 –4,480 –4,207 –4,520 –3,826 –3,027 –2,582
Development costs –107 –110 –95 –74 –48 –44 –32 –20 –15 –12
Selling costs –1,708 –1,601 –1,527 –1,430 –1,224 –1,169 –1,169 –972 –835 –725
Administrative expenses –535 –449 –426 –398 –376 –323 –299 –250 –205 –182
Other operating income/expenses 49 18 6 –2 –3 –3 2 4 2 3
Operating profit 981 856 797 822 614 525 760 609 436 324
Financial income and expenses –86 –100 –83 –93 –61 –64 –68 –31 –20 –15
Profit after financial items 895 756 714 729 553 461 692 578 416 309
Tax –192 –169 –145 –189 –148 –120 –182 –159 –116 –87
Net profit for the year 703 587 569 540 405 341 510 419 300 222
EBITA 1,134 990 905 917 703 594 820 650 460 333
EBITA margin, % 11.6 11.2 10.8 11.5 10.4 9.5 12.1 11.5 10.2 8.7
Condensed balance sheets (SeK m) 2014 2013 2012 2011 2010 2009 2008 2007 2006 2005
assets
Goodwill 1,572 1,308 1,188 822 712 514 574 378 265 210
Other intangible assets 1,445 1,286 1,215 888 761 555 599 364 183 88
Property, plant and equipment 971 849 741 706 657 563 554 388 327 287
Financial assets 87 61 59 45 50 48 52 43 25 31
Inventories 1,617 1,546 1,472 1,328 1,183 1,064 1,207 936 719 615
Accounts receivable - trade 1,702 1,435 1,411 1,263 1,047 901 1,102 859 679 532
Current receivables 336 208 204 149 164 125 100 100 69 53
Cash and cash equivalents 357 261 243 264 219 229 223 203 119 117
Total assets 8,087 6,954 6,533 5,465 4,793 3,999 4,411 3,271 2,386 1,933
liabilities and equity
equity 3,162 2,626 2,290 2,064 1,744 1,644 1,597 1,189 892 714
Non-current interest-bearing liabilities and pension liabilities 1,216 2,201 1,158 837 939 886 930 431 406 415
Other non-current liabilities and provisions 412 353 333 255 231 132 148 237 73 44
Current interest-bearing liabilities 1,635 381 1,424 1,083 841 462 622 393 236 116
Accounts payable – trade 763 602 586 556 493 424 584 470 398 322
Other current liabilities 899 791 742 670 545 451 530 551 381 322
Total liabilities and equity 8,087 6,954 6,533 5,465 4,793 3,999 4,411 3,271 2,386 1,933
Several-year overview » INDUTRADE 17 «A N N UA L R EP O RT 2014
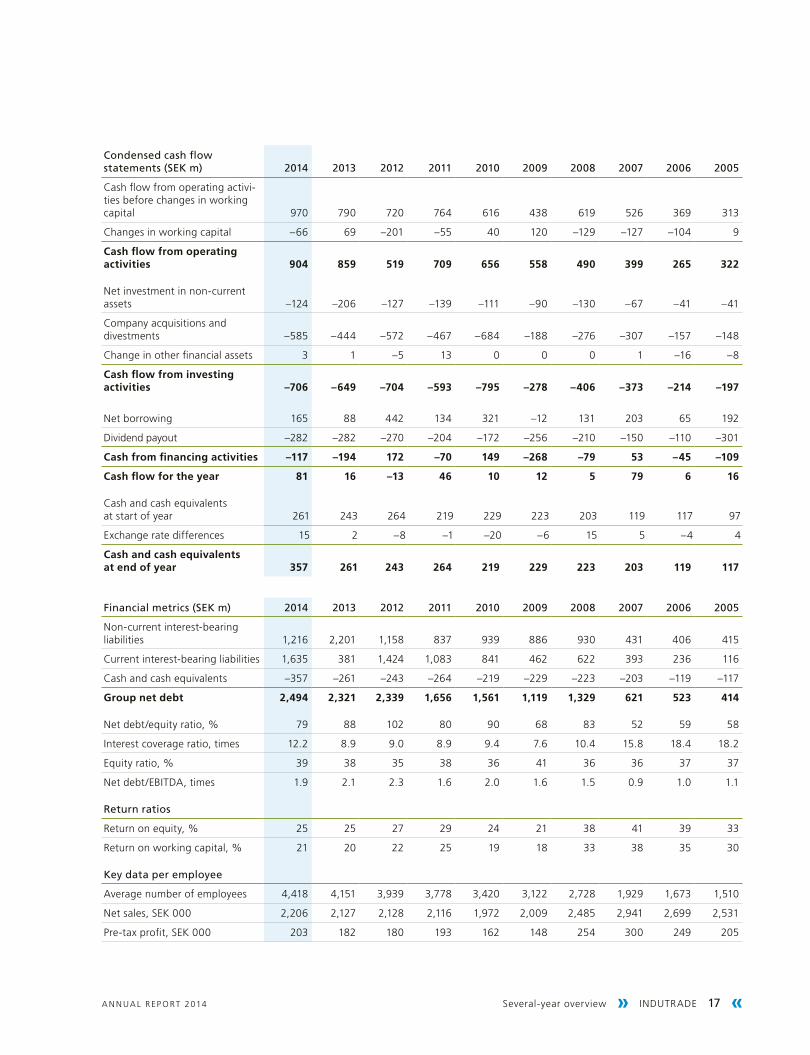
Condensed cash flow statements (SeK m) 2014 2013 2012 2011 2010 2009 2008 2007 2006 2005
Cash flow from operating activi-ties before changes in working capital 970 790 720 764 616 438 619 526 369 313
Changes in working capital –66 69 –201 –55 40 120 –129 –127 –104 9
Cash flow from operating activities 904 859 519 709 656 558 490 399 265 322
Net investment in non-current assets –124 –206 –127 –139 –111 –90 –130 –67 –41 –41
Company acquisitions and divestments –585 –444 –572 –467 –684 –188 –276 –307 –157 –148
Change in other financial assets 3 1 –5 13 0 0 0 1 –16 –8
Cash flow from investing activities –706 –649 –704 –593 –795 –278 –406 –373 –214 –197
Net borrowing 165 88 442 134 321 –12 131 203 65 192
Dividend payout –282 –282 –270 –204 –172 –256 –210 –150 –110 –301
Cash from financing activities –117 –194 172 –70 149 –268 –79 53 –45 –109
Cash flow for the year 81 16 –13 46 10 12 5 79 6 16
Cash and cash equivalents at start of year 261 243 264 219 229 223 203 119 117 97
Exchange rate differences 15 2 –8 –1 –20 –6 15 5 –4 4
Cash and cash equivalents at end of year 357 261 243 264 219 229 223 203 119 117
Financial metrics (SeK m) 2014 2013 2012 2011 2010 2009 2008 2007 2006 2005
Non-current interest-bearing liabilities 1,216 2,201 1,158 837 939 886 930 431 406 415
Current interest-bearing liabilities 1,635 381 1,424 1,083 841 462 622 393 236 116
Cash and cash equivalents –357 –261 –243 –264 –219 –229 –223 –203 –119 –117
Group net debt 2,494 2,321 2,339 1,656 1,561 1,119 1,329 621 523 414
Net debt/equity ratio, % 79 88 102 80 90 68 83 52 59 58
Interest coverage ratio, times 12.2 8.9 9.0 8.9 9.4 7.6 10.4 15.8 18.4 18.2
Equity ratio, % 39 38 35 38 36 41 36 36 37 37
Net debt/EBITDA, times 1.9 2.1 2.3 1.6 2.0 1.6 1.5 0.9 1.0 1.1
return ratios
Return on equity, % 25 25 27 29 24 21 38 41 39 33
Return on working capital, % 21 20 22 25 19 18 33 38 35 30
Key data per employee
Average number of employees 4,418 4,151 3,939 3,778 3,420 3,122 2,728 1,929 1,673 1,510
Net sales, SEK 000 2,206 2,127 2,128 2,116 1,972 2,009 2,485 2,941 2,699 2,531
Pre-tax profit, SEK 000 203 182 180 193 162 148 254 300 249 205
» 18 INDUTRADE « Several-year overview A N N UA L R EP O RT 2014
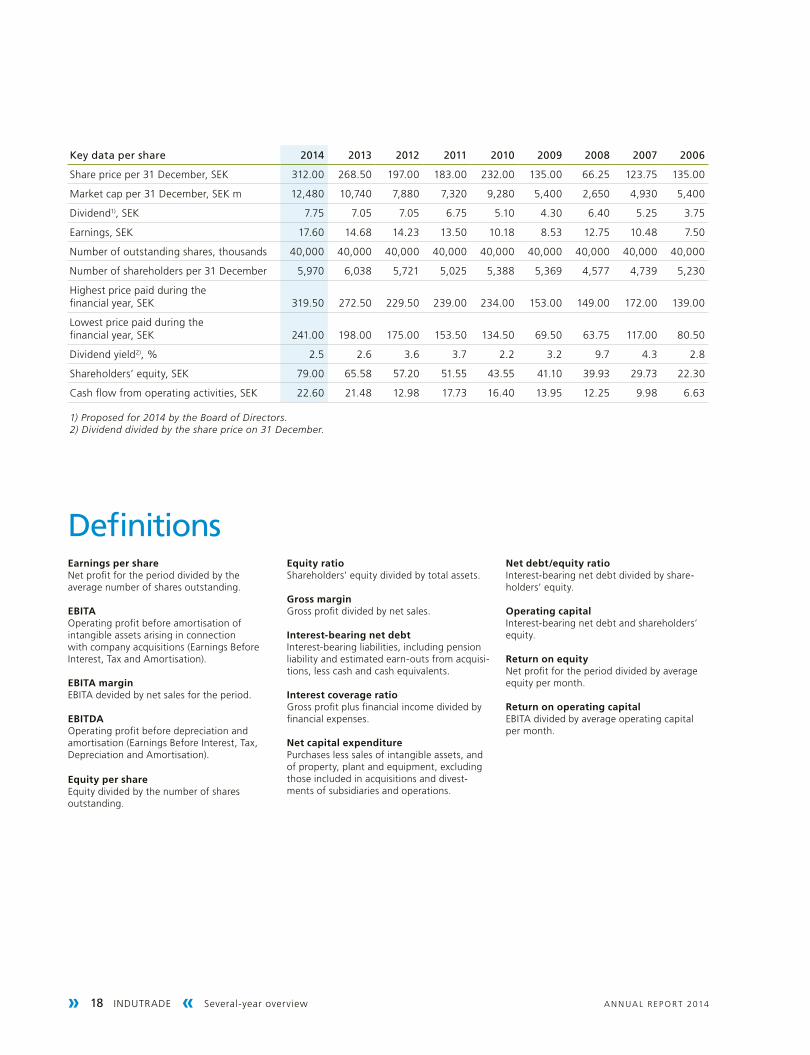
Key data per share 2014 2013 2012 2011 2010 2009 2008 2007 2006
Share price per 31 December, SEK 312.00 268.50 197.00 183.00 232.00 135.00 66.25 123.75 135.00
Market cap per 31 December, SEK m 12,480 10,740 7,880 7,320 9,280 5,400 2,650 4,930 5,400
Dividend1), SEK 7.75 7.05 7.05 6.75 5.10 4.30 6.40 5.25 3.75
Earnings, SEK 17.60 14.68 14.23 13.50 10.18 8.53 12.75 10.48 7.50
Number of outstanding shares, thousands 40,000 40,000 40,000 40,000 40,000 40,000 40,000 40,000 40,000
Number of shareholders per 31 December 5,970 6,038 5,721 5,025 5,388 5,369 4,577 4,739 5,230
Highest price paid during the financial year, SEK 319.50 272.50 229.50 239.00 234.00 153.00 149.00 172.00 139.00
Lowest price paid during the financial year, SEK 241.00 198.00 175.00 153.50 134.50 69.50 63.75 117.00 80.50
Dividend yield2), % 2.5 2.6 3.6 3.7 2.2 3.2 9.7 4.3 2.8
Shareholders’ equity, SEK 79.00 65.58 57.20 51.55 43.55 41.10 39.93 29.73 22.30
Cash flow from operating activities, SEK 22.60 21.48 12.98 17.73 16.40 13.95 12.25 9.98 6.63
1) Proposed for 2014 by the Board of Directors.2) Dividend divided by the share price on 31 December.
DefinitionsEarnings per shareNet profit for the period divided by the average number of shares outstanding.
EBITAOperating profit before amortisation of intangible assets arising in connection with company acquisitions (Earnings Before Interest, Tax and Amortisation).
EBITA marginEBITA devided by net sales for the period.
EBITDAOperating profit before depreciation and amortisation (Earnings Before Interest, Tax, Depreciation and Amortisation).
Equity per shareEquity divided by the number of shares outstanding.
Equity ratioShareholders’ equity divided by total assets.
Gross marginGross profit divided by net sales.
Interest-bearing net debtInterest-bearing liabilities, including pension liability and estimated earn-outs from acquisi-tions, less cash and cash equivalents.
Interest coverage ratioGross profit plus financial income divided by financial expenses.
Net capital expenditurePurchases less sales of intangible assets, and of property, plant and equipment, excluding those included in acquisitions and divest-ments of subsidiaries and operations.
Net debt/equity ratioInterest-bearing net debt divided by share-holders’ equity.
Operating capitalInterest-bearing net debt and shareholders’ equity.
Return on equityNet profit for the period divided by average equity per month.
Return on operating capitalEBITA divided by average operating capital per month.
Directors’ report » INDUTRADE 19 «A N N UA L R EP O RT 2014
Directors’ report
The Board of Directors and President of Indutrade AB (publ), reg. no. 556017-9367, herewith submit the annual report for the 2014 financial year.
Operations Indutrade markets and sells components, systems and services with a high-tech content to industrial companies in selected niches. Through solid knowledge about cus-tomers’ systems and processes combined with a high level of technical expertise, Indutrade aspires to be the most effective partner for customers and suppliers alike.
The Group was organised in five business areas during the year: Engineering & Equipment, Flow Technology, Fluids & Mechanical Solutions, Industrial Components and Special Products. In 2014 business was conducted through nearly 200 subsidiaries in 26 countries on four continents. Indutrade’s shares are listed on Nasdaq Stockholm, and were added to the Large Cap list in January 2015.
Performance 2014Indutrade’s companies encountered a slightly improved demand situation in 2014. This, together with completed acquisitions, led to new record levels for order intake as well as net sales. At the same time, the variation for the Group’s companies was large between markets, segments and countries.
Order intake, net sales and earningsOrder intake for the year totalled SEK 10,000 million (9,014), an increase of 11%. For comparable units, order intake rose 1%, while acquired growth was 7%. Currency movements had a positive effect on order intake, by 3%. Like-for-like order intake increased during the year for the Flow Technology, Fluids & Mechanical Solutions and Industrial Components business areas, while it decreased for the other business areas.
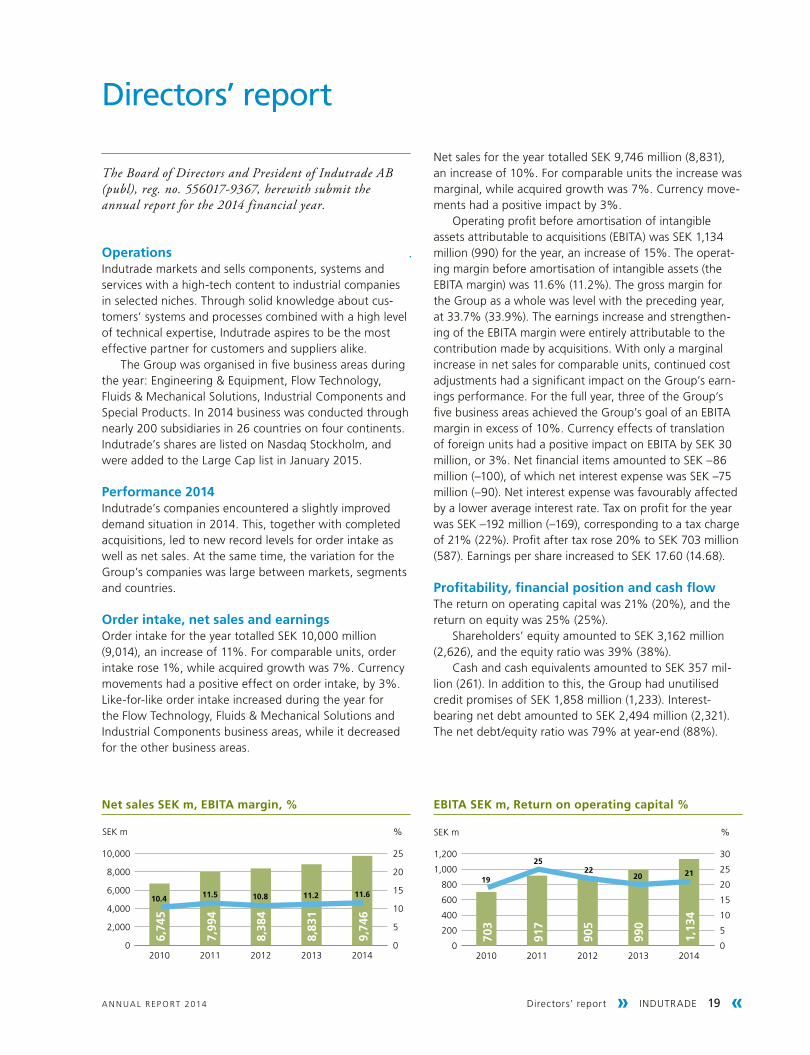
Net sales for the year totalled SEK 9,746 million (8,831), an increase of 10%. For comparable units the increase was marginal, while acquired growth was 7%. Currency move-ments had a positive impact by 3%.
Operating profit before amortisation of intangible assets attributable to acquisitions (EBITA) was SEK 1,134 million (990) for the year, an increase of 15%. The operat-ing margin before amortisation of intangible assets (the EBITA margin) was 11.6% (11.2%). The gross margin for the Group as a whole was level with the preceding year, at 33.7% (33.9%). The earnings increase and strengthen-ing of the EBITA margin were entirely attributable to the contribution made by acquisitions. With only a marginal increase in net sales for comparable units, continued cost adjustments had a significant impact on the Group’s earn-ings performance. For the full year, three of the Group’s five business areas achieved the Group’s goal of an EBITA margin in excess of 10%. Currency effects of translation of foreign units had a positive impact on EBITA by SEK 30 million, or 3%. Net financial items amounted to SEK –86 million (–100), of which net interest expense was SEK –75 million (–90). Net interest expense was favourably affected by a lower average interest rate. Tax on profit for the year was SEK –192 million (–169), corresponding to a tax charge of 21% (22%). Profit after tax rose 20% to SEK 703 million (587). Earnings per share increased to SEK 17.60 (14.68).
Profitability, financial position and cash flowThe return on operating capital was 21% (20%), and the return on equity was 25% (25%).
Shareholders’ equity amounted to SEK 3,162 million (2,626), and the equity ratio was 39% (38%).
Cash and cash equivalents amounted to SEK 357 mil-lion (261). In addition to this, the Group had unutilised credit promises of SEK 1,858 million (1,233). Interest- bearing net debt amounted to SEK 2,494 million (2,321). The net debt/equity ratio was 79% at year-end (88%).
Net sales SEK m, EBITA margin, %
0
2,000
4,000
6,000
8,000
10,000
201420132012201120100
5
10
15
20
25
SEK m %
6,74
5
7,99
4
8,38
4
8,83
1
9,74
6
10.4 11.5 10.8 11.2 11.6
0
200
400
600
800
1,000
1,200
201420132012201120100
5
10
15
20
25
30
SEK m %
703
917
905
990
1,13
4
19
2522
20 21
EBITA SEK m, Return on operating capital %
» 20 INDUTRADE « Directors’ report A N N UA L R EP O RT 2014
Business Areas
» Engineering & Equipment
Share of order intake 2014 ........................................12%Share of net sales 2014 .............................................13%
Net sales rose 1% during the year to SEK 1,274 million (1,265). For comparable units, net sales decreased by 4%, while currency movements had a positive impact on net sales by 5%.
90% of the business area’s sales is in Finland and the demand situation in Finnish industry remained challeng-ing during the year. The business area was affected by low activity mainly in the construction sector and general restraint regarding investments in Finland.
EBITA decreased by 10% to SEK 93 million (103), corre sponding to an EBITA margin of 7.3% (8.1%). Cost adjustments were made in some of the business area’s companies to counter the effects of low demand.
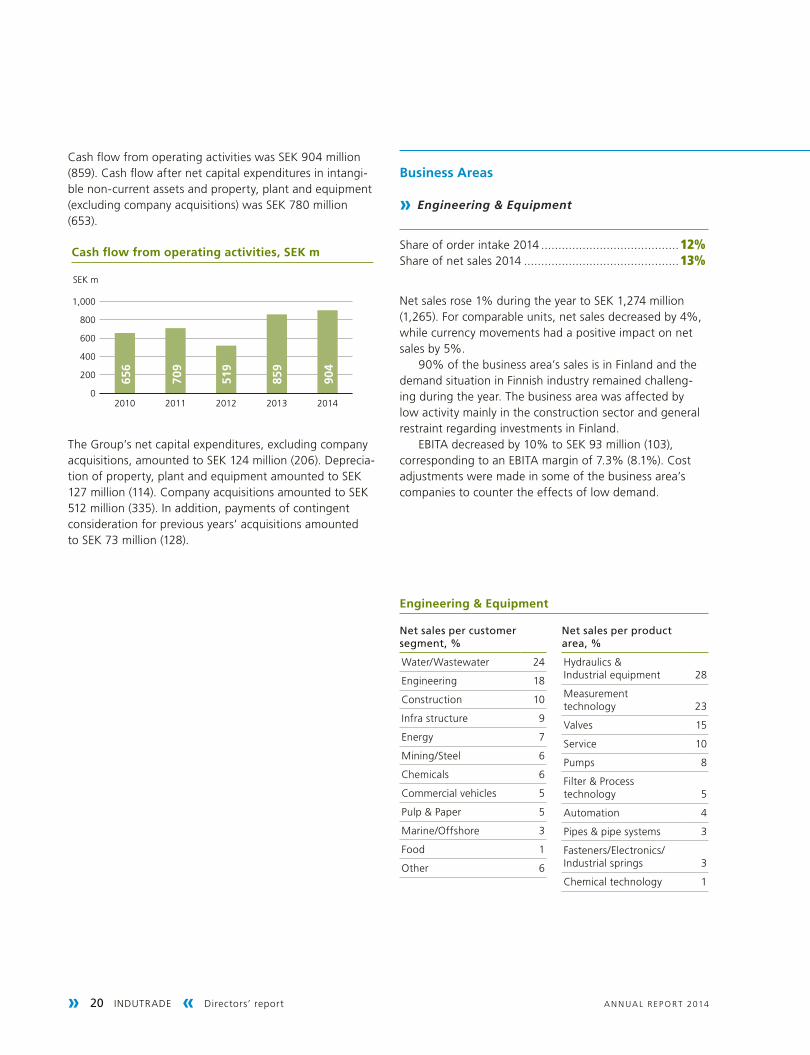
Cash flow from operating activities was SEK 904 million (859). Cash flow after net capital expenditures in intangi-ble non-current assets and property, plant and equipment (excluding company acquisitions) was SEK 780 million (653).
The Group’s net capital expenditures, excluding company acquisitions, amounted to SEK 124 million (206). Deprecia-tion of property, plant and equipment amounted to SEK 127 million (114). Company acquisitions amounted to SEK 512 million (335). In addition, payments of contingent consideration for previous years’ acquisitions amounted to SEK 73 million (128).
0
200
400
600
800
1,000
20142013201220112010
SEK m
656
709
519
859
904
Cash flow from operating activities, SEK m
net sales per productarea, %
Hydraulics & Industrial equipment 28
Measurement technology 23
Valves 15
Service 10
Pumps 8
Filter & Process technology 5
Automation 4
Pipes & pipe systems 3
Fasteners/Electronics/Industrial springs 3
Chemical technology 1
net sales per customersegment, %
Water/Wastewater 24
Engineering 18
Construction 10
Infra structure 9
Energy 7
Mining/Steel 6
Chemicals 6
Commercial vehicles 5
Pulp & Paper 5
Marine/Offshore 3
Food 1
Other 6
Engineering & Equipment
Directors’ report » INDUTRADE 21 «A N N UA L R EP O RT 2014
» Flow Technology
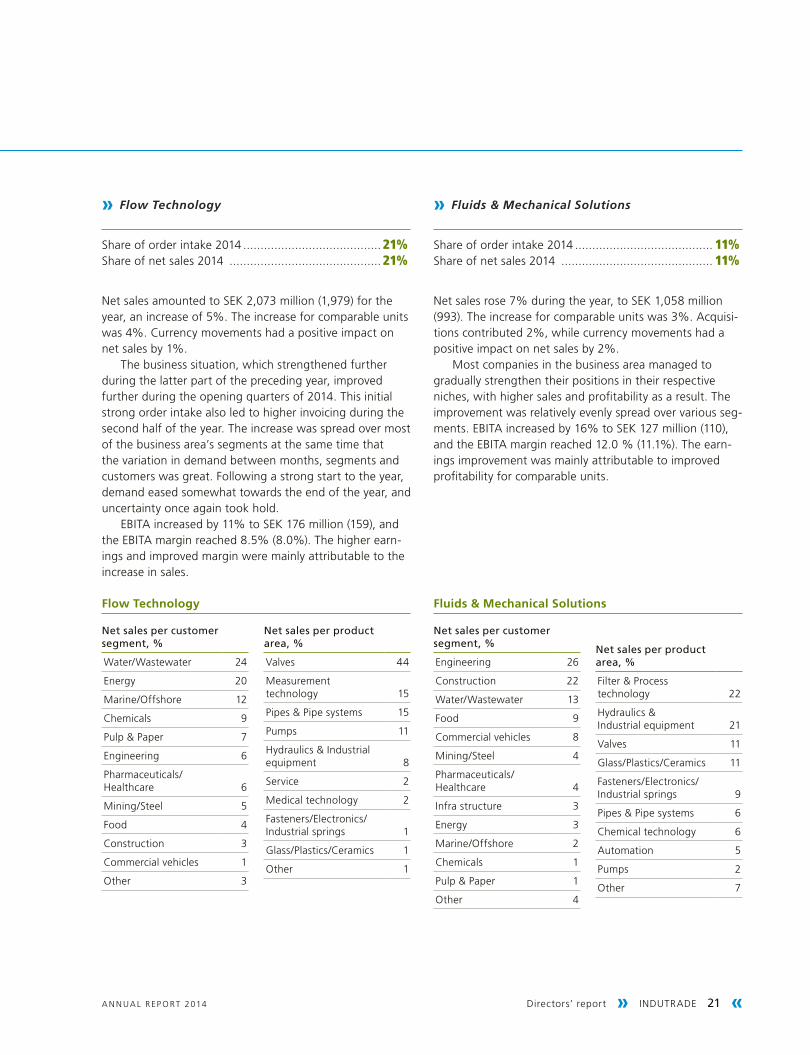
Share of order intake 2014 ........................................21%Share of net sales 2014 ............................................21%
Net sales amounted to SEK 2,073 million (1,979) for the year, an increase of 5%. The increase for comparable units was 4%. Currency movements had a positive impact on net sales by 1%.
The business situation, which strengthened further during the latter part of the preceding year, improved further during the opening quarters of 2014. This initial strong order intake also led to higher invoicing during the second half of the year. The increase was spread over most of the business area’s segments at the same time that the variation in demand between months, segments and customers was great. Following a strong start to the year, demand eased somewhat towards the end of the year, and uncertainty once again took hold.
EBITA increased by 11% to SEK 176 million (159), and the EBITA margin reached 8.5% (8.0%). The higher earn-ings and improved margin were mainly attributable to the increase in sales.
» Fluids & Mechanical Solutions
Share of order intake 2014 ........................................ 11%Share of net sales 2014 ............................................ 11%
Net sales rose 7% during the year, to SEK 1,058 million (993). The increase for comparable units was 3%. Acquisi-tions contributed 2%, while currency movements had a positive impact on net sales by 2%.
Most companies in the business area managed to gradually strengthen their positions in their respective niches, with higher sales and profitability as a result. The improvement was relatively evenly spread over various seg-ments. EBITA increased by 16% to SEK 127 million (110), and the EBITA margin reached 12.0 % (11.1%). The earn-ings improvement was mainly attributable to improved profitability for comparable units.
net sales per customersegment, %
Water/Wastewater 24
Energy 20
Marine/Offshore 12
Chemicals 9
Pulp & Paper 7
Engineering 6
Pharmaceuticals/ Healthcare 6
Mining/Steel 5
Food 4
Construction 3
Commercial vehicles 1
Other 3
net sales per productarea, %
Valves 44
Measurement technology 15
Pipes & Pipe systems 15
Pumps 11
Hydraulics & Industrial equipment 8
Service 2
Medical technology 2
Fasteners/Electronics/Industrial springs 1
Glass/Plastics/Ceramics 1
Other 1
net sales per customersegment, %
Engineering 26
Construction 22
Water/Wastewater 13
Food 9
Commercial vehicles 8
Mining/Steel 4
Pharmaceuticals/ Healthcare 4
Infra structure 3
Energy 3
Marine/Offshore 2
Chemicals 1
Pulp & Paper 1
Other 4
net sales per productarea, %
Filter & Processtechnology 22
Hydraulics & Industrial equipment 21
Valves 11
Glass/Plastics/Ceramics 11
Fasteners/Electronics/Industrial springs 9
Pipes & Pipe systems 6
Chemical technology 6
Automation 5
Pumps 2
Other 7
Fluids & Mechanical SolutionsFlow Technology
» 22 INDUTRADE « Directors’ report A N N UA L R EP O RT 2014
» Industrial Components
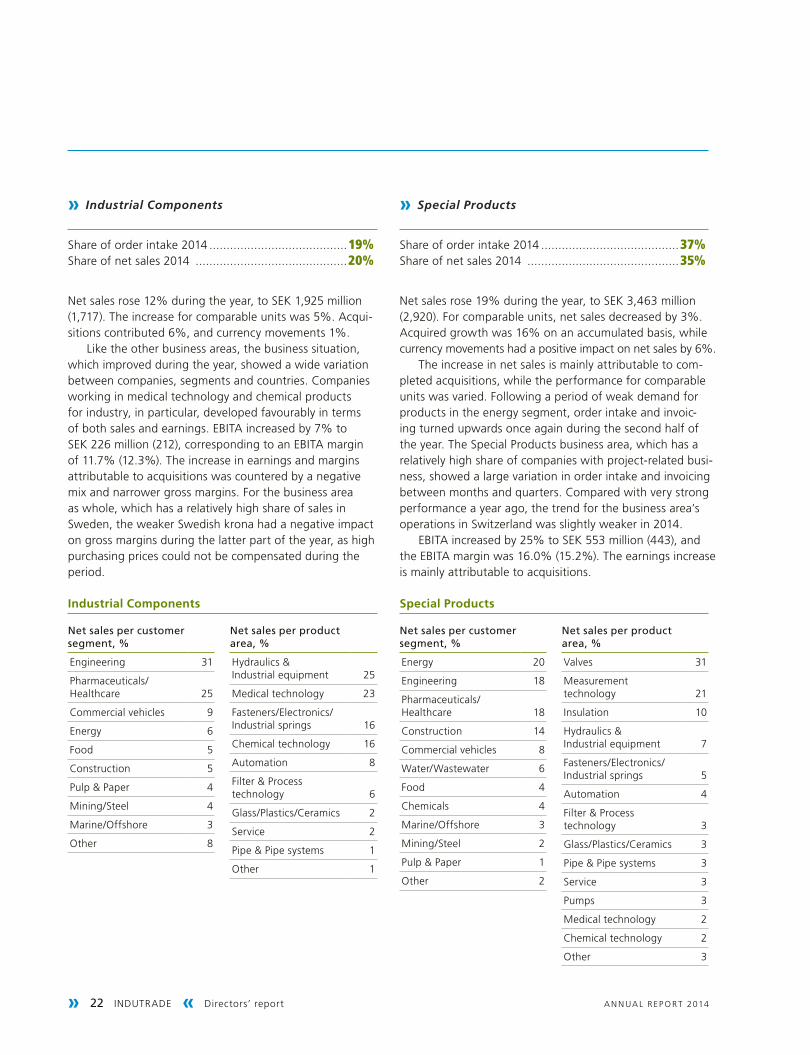
Share of order intake 2014 ........................................19%Share of net sales 2014 ............................................20%
Net sales rose 12% during the year, to SEK 1,925 million (1,717). The increase for comparable units was 5%. Acqui-sitions contributed 6%, and currency movements 1%.
Like the other business areas, the business situation, which improved during the year, showed a wide variation between companies, segments and countries. Companies working in medical technology and chemical products for industry, in particular, developed favourably in terms of both sales and earnings. EBITA increased by 7% to SEK 226 million (212), corresponding to an EBITA margin of 11.7% (12.3%). The increase in earnings and margins attributable to acquisitions was countered by a negative mix and narrower gross margins. For the business area as whole, which has a relatively high share of sales in Sweden, the weaker Swedish krona had a negative impact on gross margins during the latter part of the year, as high purchasing prices could not be compensated during the period.
» Special Products
Share of order intake 2014 ........................................37%Share of net sales 2014 ............................................35%
Net sales rose 19% during the year, to SEK 3,463 million (2,920). For comparable units, net sales decreased by 3%. Acquired growth was 16% on an accumulated basis, while currency movements had a positive impact on net sales by 6%.
The increase in net sales is mainly attributable to com-pleted acquisitions, while the performance for comparable units was varied. Following a period of weak demand for products in the energy segment, order intake and invoic-ing turned upwards once again during the second half of the year. The Special Products business area, which has a relatively high share of companies with project-related busi-ness, showed a large variation in order intake and invoicing between months and quarters. Compared with very strong performance a year ago, the trend for the business area’s operations in Switzerland was slightly weaker in 2014.
EBITA increased by 25% to SEK 553 million (443), and the EBITA margin was 16.0% (15.2%). The earnings increase is mainly attributable to acquisitions.
net sales per customersegment, %
Energy 20
Engineering 18
Pharmaceuticals/ Healthcare 18
Construction 14
Commercial vehicles 8
Water/Wastewater 6
Food 4
Chemicals 4
Marine/Offshore 3
Mining/Steel 2
Pulp & Paper 1
Other 2
net sales per productarea, %
Valves 31
Measurement technology 21
Insulation 10
Hydraulics & Industrial equipment 7
Fasteners/Electronics/Industrial springs 5
Automation 4
Filter & Processtechnology 3
Glass/Plastics/Ceramics 3
Pipe & Pipe systems 3
Service 3
Pumps 3
Medical technology 2
Chemical technology 2
Other 3
net sales per customersegment, %
Engineering 31
Pharmaceuticals/ Healthcare 25
Commercial vehicles 9
Energy 6
Food 5
Construction 5
Pulp & Paper 4
Mining/Steel 4
Marine/Offshore 3
Other 8
net sales per productarea, %
Hydraulics & Industrial equipment 25
Medical technology 23
Fasteners/Electronics/Industrial springs 16
Chemical technology 16
Automation 8
Filter & Processtechnology 6
Glass/Plastics/Ceramics 2
Service 2
Pipe & Pipe systems 1
Other 1
Industrial Components Special Products
Directors’ report » INDUTRADE 23 «A N N UA L R EP O RT 2014
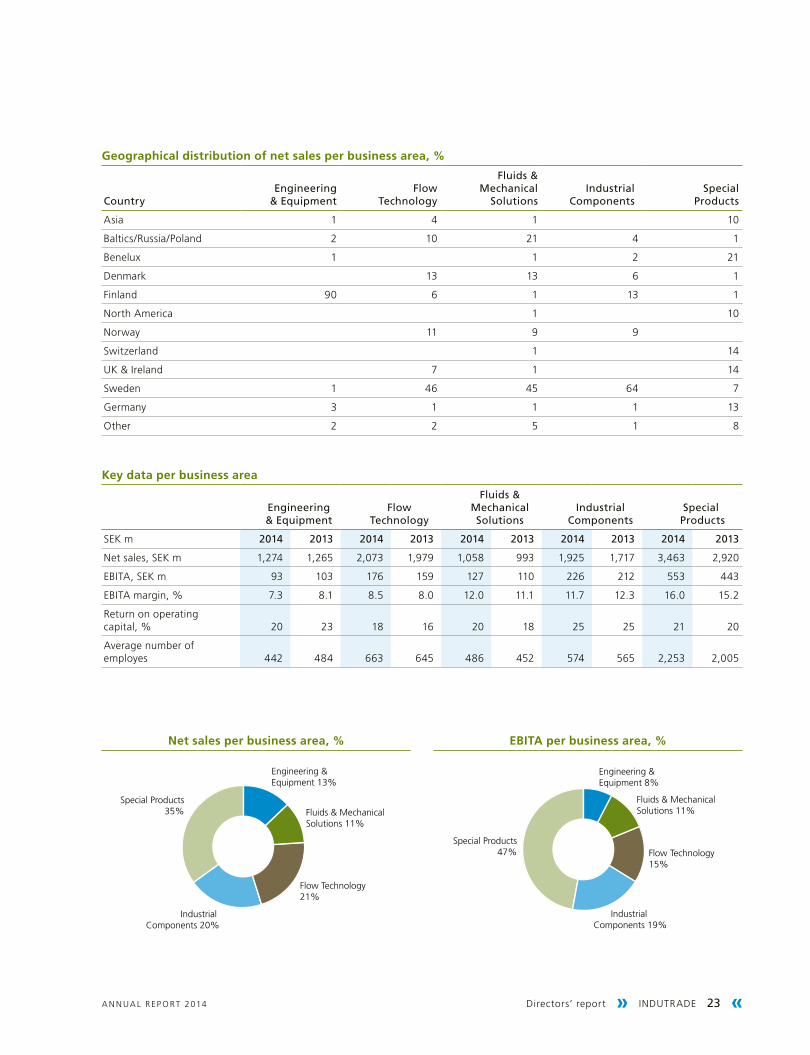
Geographical distribution of net sales per business area, %
Countryengineering
& equipmentFlow
technology
Fluids & Mechanical
SolutionsIndustrial
ComponentsSpecial
products
Asia 1 4 1 10
Baltics/Russia/Poland 2 10 21 4 1
Benelux 1 1 2 21
Denmark 13 13 6 1
Finland 90 6 1 13 1
North America 1 10
Norway 11 9 9
Switzerland 1 14
UK & Ireland 7 1 14
Sweden 1 46 45 64 7
Germany 3 1 1 1 13
Other 2 2 5 1 8
Key data per business area
engineering & equipment
Flowtechnology
Fluids &Mechanical Solutions
Industrial Components
Special products
SEK m 2014 2013 2014 2013 2014 2013 2014 2013 2014 2013
Net sales, SEK m 1,274 1,265 2,073 1,979 1,058 993 1,925 1,717 3,463 2,920
EBITA, SEK m 93 103 176 159 127 110 226 212 553 443
EBITA margin, % 7.3 8.1 8.5 8.0 12.0 11.1 11.7 12.3 16.0 15.2
Return on operatingcapital, % 20 23 18 16 20 18 25 25 21 20
Average number of employes 442 484 663 645 486 452 574 565 2,253 2,005
Engineering & Equipment 13%
Fluids & Mechanical Solutions 11%
Flow Technology21%
Industrial Components 20%
Special Products35%
Net sales per business area, %
Engineering & Equipment 8%
Fluids & Mechanical Solutions 11%
Flow Technology15%
Industrial Components 19%
Special Products47%
EBITA per business area, %
» 24 INDUTRADE « Directors’ report A N N UA L R EP O RT 2014
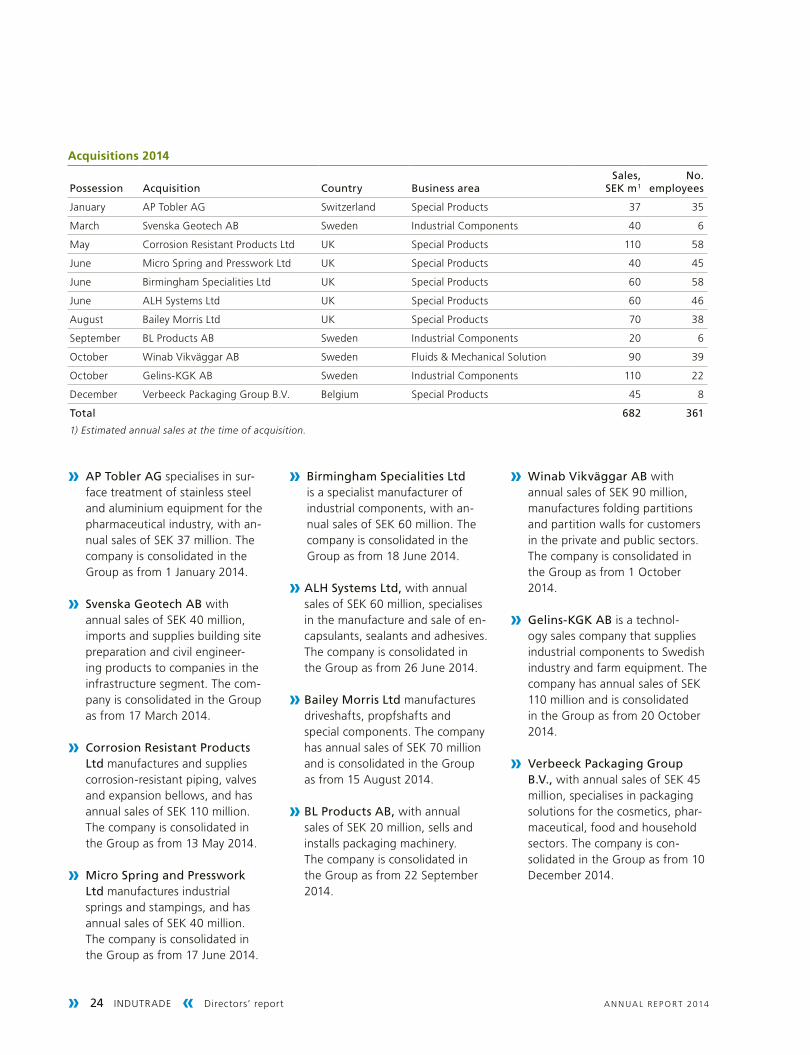
Acquisitions 2014
possession acquisition Country Business areaSales,
SeK m 1no.
employees
January AP Tobler AG Switzerland Special Products 37 35
March Svenska Geotech AB Sweden Industrial Components 40 6
May Corrosion Resistant Products Ltd UK Special Products 110 58
June Micro Spring and Presswork Ltd UK Special Products 40 45
June Birmingham Specialities Ltd UK Special Products 60 58
June ALH Systems Ltd UK Special Products 60 46
August Bailey Morris Ltd UK Special Products 70 38
September BL Products AB Sweden Industrial Components 20 6
October Winab Vikväggar AB Sweden Fluids & Mechanical Solution 90 39
October Gelins-KGK AB Sweden Industrial Components 110 22
December Verbeeck Packaging Group B.V. Belgium Special Products 45 8
total 682 361
1) Estimated annual sales at the time of acquisition.
» ap tobler aG specialises in sur-face treatment of stainless steel and aluminium equipment for the pharmaceutical industry, with an-nual sales of SEK 37 million. The company is consolidated in the Group as from 1 January 2014.
» Svenska Geotech aB with annual sales of SEK 40 million, imports and supplies building site preparation and civil engineer-ing products to companies in the infrastructure segment. The com-pany is consolidated in the Group as from 17 March 2014.
» Corrosion resistant products ltd manufactures and supplies corrosion-resistant piping, valves and expansion bellows, and has annual sales of SEK 110 million. The company is consolidated in the Group as from 13 May 2014.
» Micro Spring and presswork ltd manufactures industrial springs and stampings, and has annual sales of SEK 40 million. The company is consolidated in the Group as from 17 June 2014.
» Birmingham Specialities ltd is a specialist manufacturer of industrial components, with an-nual sales of SEK 60 million. The company is consolidated in the Group as from 18 June 2014.
» alH Systems ltd, with annual sales of SEK 60 million, specialises in the manufacture and sale of en-capsulants, sealants and adhesives. The company is consolidated in the Group as from 26 June 2014.
» Bailey Morris ltd manufactures driveshafts, propfshafts and special components. The company has annual sales of SEK 70 million and is consolidated in the Group as from 15 August 2014.
» Bl products aB, with annual sales of SEK 20 million, sells and installs packaging machinery. The company is consolidated in the Group as from 22 September 2014.
» Winab Vikväggar aB with annual sales of SEK 90 million, manufactures folding partitions and partition walls for customers in the private and public sectors. The company is consolidated in the Group as from 1 October 2014.
» Gelins-KGK aB is a technol-ogy sales company that supplies industrial components to Swedish industry and farm equipment. The company has annual sales of SEK 110 million and is consolidated in the Group as from 20 October 2014.
» Verbeeck packaging Group B.V., with annual sales of SEK 45 million, specialises in packaging solutions for the cosmetics, phar-maceutical, food and household sectors. The company is con-solidated in the Group as from 10 December 2014.
Directors’ report » INDUTRADE 25 «A N N UA L R EP O RT 2014
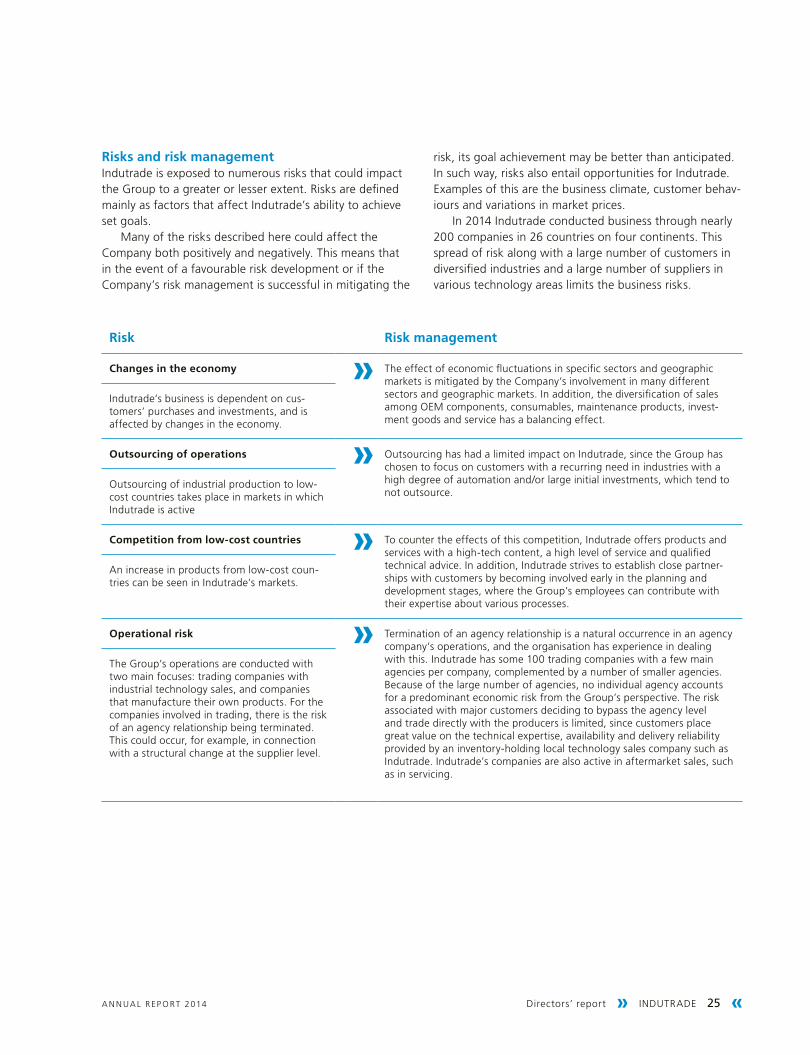
Risks and risk managementIndutrade is exposed to numerous risks that could impact the Group to a greater or lesser extent. Risks are defined mainly as factors that affect Indutrade’s ability to achieve set goals.
Many of the risks described here could affect the Company both positively and negatively. This means that in the event of a favourable risk development or if the Company’s risk management is successful in mitigating the
risk, its goal achievement may be better than anticipated. In such way, risks also entail opportunities for Indutrade. Examples of this are the business climate, customer behav-iours and variations in market prices.
In 2014 Indutrade conducted business through nearly 200 companies in 26 countries on four continents. This spread of risk along with a large number of customers in diversified industries and a large number of suppliers in various technology areas limits the business risks.
Risk Risk management
Changes in the economy The effect of economic fluctuations in specific sectors and geographic markets is mitigated by the Company’s involvement in many different sectors and geographic markets. In addition, the diversification of sales among OEM components, consumables, maintenance products, invest-ment goods and service has a balancing effect.
Indutrade’s business is dependent on cus-tomers’ purchases and investments, and is affected by changes in the economy.
Outsourcing of operations Outsourcing has had a limited impact on Indutrade, since the Group has chosen to focus on customers with a recurring need in industries with a high degree of automation and/or large initial investments, which tend to not outsource.
Outsourcing of industrial production to low-cost countries takes place in markets in which Indutrade is active
Competition from low-cost countries To counter the effects of this competition, Indutrade offers products and services with a high-tech content, a high level of service and qualified technical advice. In addition, Indutrade strives to establish close partner-ships with customers by becoming involved early in the planning and development stages, where the Group’s employees can contribute with their expertise about various processes.
An increase in products from low-cost coun-tries can be seen in Indutrade’s markets.
Operational risk Termination of an agency relationship is a natural occurrence in an agency company’s operations, and the organisation has experience in dealing with this. Indutrade has some 100 trading companies with a few main agencies per company, complemented by a number of smaller agencies. Because of the large number of agencies, no individual agency accounts for a predominant economic risk from the Group’s perspective. The risk associated with major customers deciding to bypass the agency level and trade directly with the producers is limited, since customers place great value on the technical expertise, availability and delivery reliability provided by an inventory-holding local technology sales company such as Indutrade. Indutrade’s companies are also active in aftermarket sales, such as in servicing.
The Group’s operations are conducted with two main focuses: trading companies with industrial technology sales, and companies that manufacture their own products. For the companies involved in trading, there is the risk of an agency relationship being terminated. This could occur, for example, in connection with a structural change at the supplier level.
»
»
»
»
» 26 INDUTRADE « Directors’ report A N N UA L R EP O RT 2014
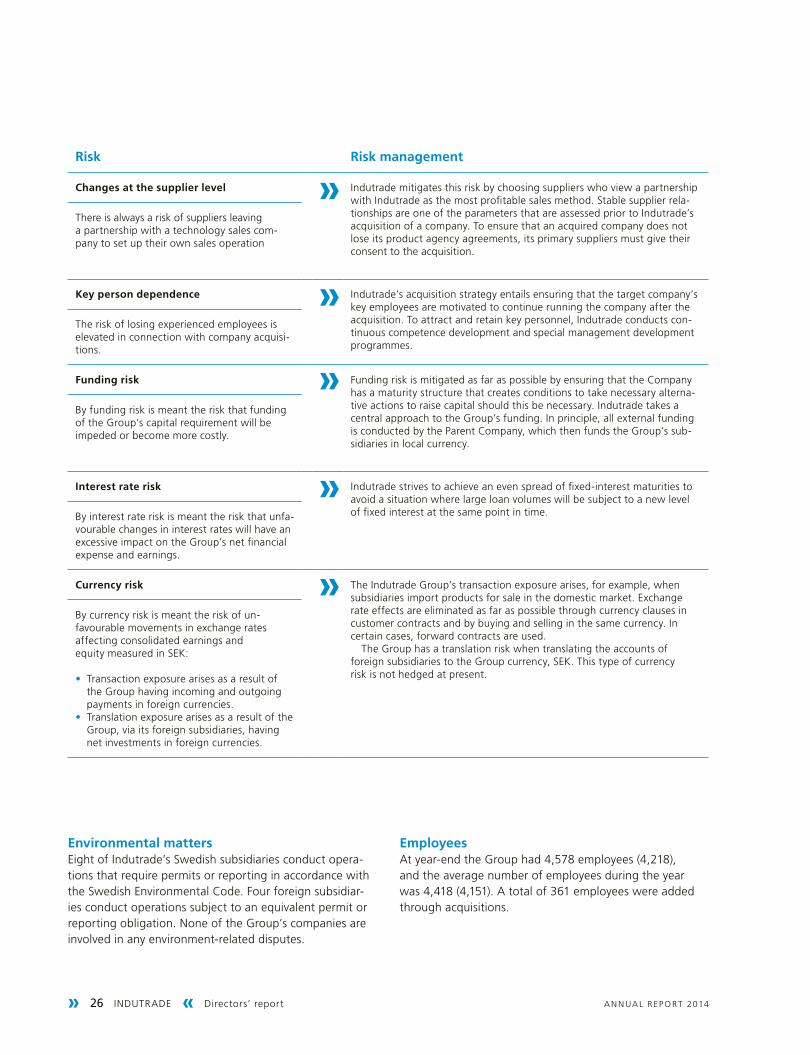
Risk Risk management
Changes at the supplier level Indutrade mitigates this risk by choosing suppliers who view a partnership with Indutrade as the most profitable sales method. Stable supplier rela-tionships are one of the parameters that are assessed prior to Indutrade’s acquisition of a company. To ensure that an acquired company does not lose its product agency agreements, its primary suppliers must give their consent to the acquisition.
There is always a risk of suppliers leaving a partnership with a technology sales com-pany to set up their own sales operation
Key person dependence Indutrade’s acquisition strategy entails ensuring that the target company’s key employees are motivated to continue running the company after the acquisition. To attract and retain key personnel, Indutrade conducts con-tinuous competence development and special management development programmes.
The risk of losing experienced employees is elevated in connection with company acquisi-tions.
Funding risk Funding risk is mitigated as far as possible by ensuring that the Company has a maturity structure that creates conditions to take necessary alterna-tive actions to raise capital should this be necessary. Indutrade takes a central approach to the Group’s funding. In principle, all external funding is conducted by the Parent Company, which then funds the Group’s sub-sidiaries in local currency.
By funding risk is meant the risk that funding of the Group’s capital requirement will be impeded or become more costly.
Interest rate risk Indutrade strives to achieve an even spread of fixed-interest maturities to avoid a situation where large loan volumes will be subject to a new level of fixed interest at the same point in time.By interest rate risk is meant the risk that unfa-
vourable changes in interest rates will have an excessive impact on the Group’s net financial expense and earnings.
Currency risk The Indutrade Group’s transaction exposure arises, for example, when subsidiaries import products for sale in the domestic market. Exchange rate effects are eliminated as far as possible through currency clauses in customer contracts and by buying and selling in the same currency. In certain cases, forward contracts are used. The Group has a translation risk when translating the accounts of foreign subsidiaries to the Group currency, SEK. This type of currency risk is not hedged at present.
By currency risk is meant the risk of un-favourable movements in exchange rates affecting consolidated earnings and equity measured in SEK:
• Transaction exposure arises as a result of the Group having incoming and outgoing payments in foreign currencies.
• Translation exposure arises as a result of the Group, via its foreign subsidiaries, having net investments in foreign currencies.
»
»
»
»
»
Environmental mattersEight of Indutrade’s Swedish subsidiaries conduct opera-tions that require permits or reporting in accordance with the Swedish Environmental Code. Four foreign subsidiar-ies conduct operations subject to an equivalent permit or reporting obligation. None of the Group’s companies are involved in any environment-related disputes.
EmployeesAt year-end the Group had 4,578 employees (4,218), and the average number of employees during the year was 4,418 (4,151). A total of 361 employees were added through acquisitions.
Directors’ report » INDUTRADE 27 «A N N UA L R EP O RT 2014
for members of the executive management shall nor-mally not exceed 7 months’ salary and shall be coupled to the achievement of goals to improve the Company’s and respective business areas’ level of earnings, and the Group’s growth. Variable salaries can amount to a maximum of SEK 12 million in the aggregate. Incen-tive programmes in the Company shall mainly be share price–related and cover persons in senior positions in the Company who have a significant influence over the Company’s earnings and growth, and shall be based on the achievement of set targets. An incentive programme shall ensure long-term commitment to the Company’s development and shall be implemented on market terms. The Company shall be able to pay cash compen-sation coupled to purchases of shares or share-based instruments. Such cash compensation shall normally not exceed 15% of the executive’s fixed salary.
• Non-monetary benefits for members of the execu-tive management shall facilitate the individuals in the execution of their duties and correspond to what can be considered to be reasonable in respect of practice in the market in which the respective executive is active.
• Pension terms for members of the executive manage-ment shall be in line with the going rate in the market in respect of what applies for peer executives in the market in which the executive works and should be based on a defined contribution pension solution or a general pen-sion plan (in Sweden, the ITP plan).
• Severance pay for members of the executive manage-ment shall not exceed a total of 24 months’ salary in the event the Company serves notice, and 6 months in the event a member of the executive management gives notice.
• By executive management is meant in this context the President and CEO, the Chief Financial Officer, the Busi-ness Area presidents, the Head of Group Finance and the Group Controller.
• The Board’s Remuneration Committee deals with and conducts drafting work for decisions on the terms of employment for the CEO, and the Board evaluates the CEO’s performance once a year. The Remuneration Committee also prepares and conducts drafting work concerning guidelines for remuneration of members of the executive management, for decision by the Board. The CEO consults with the Remuneration Committee on terms of employment for other members of the execu-tive management.
• The Board shall have the right to depart from the afore-mentioned guidelines for compensation of the executive management if there are special reasons in a particular case.
Incentive programmesIn April 2014 the Annual General Meeting of Indutrade AB resolved to implement an incentive programme, LTI 2014, comprising a combined maximum of 460,000 warrants in two series, directed at senior executives and other key persons in the Indutrade Group.
Within the framework of Series I, which was offered to 135 persons, the participants acquired a total of 257,500 warrants for a combined total of SEK 3,914,000. The price per warrant was SEK 15.20, and the subscription price was set at SEK 356.30 per share.
Within the framework of Series II, which was offered to 13 persons, the participants acquired a total of 27,500 warrants for a combined value of SEK 319,000. The price per warrant was SEK 11.60, and the subscription price for this series was set at SEK 350.00 per share.
The shares under the programmes can be subscribed during specially prescribed subscription periods starting in the second quarter of 2017 through Friday, 18 May 2018. Upon full exercise, the number of shares outstanding will increase by 285,000, corresponding to 0.7% of the total number of shares and votes.
Guidelines for compensation of senior executivesThe guidelines for compensation of senior executives that applied in 2014 are outlined in Note 7. The Company’s auditors have performed a review to ensure adherence to the guidelines set by the Annual General Meeting. Ahead of the 2015 Annual General Meeting, it is the Board’s intention to propose essentially unchanged guidelines for compensation of senior executives, in accordance with the following recommendation:• Indutrade shall apply the compensation levels and terms
of employment necessary to be able to recruit and retain management with a high level of expertise and the capacity to achieve set objectives. The forms of compen-sation shall motivate members of the executive manage-ment to perform their utmost in order to safeguard the interests of the shareholders. The forms of compensa-tion shall therefore be in line with the going rate in the market and shall be straightforward, long-term and quantifiable. Compensation of members of the execu-tive management shall normally consist of a fixed and a variable portion. The variable portion shall reward clear, goal-related results and improvements in simple, trans-parent structures and shall have a cap. The fixed salary component for members of the executive management shall be in line with the going rate in the market and shall be commensurate with the individual’s expertise, responsibilities and performance. Variable compensation
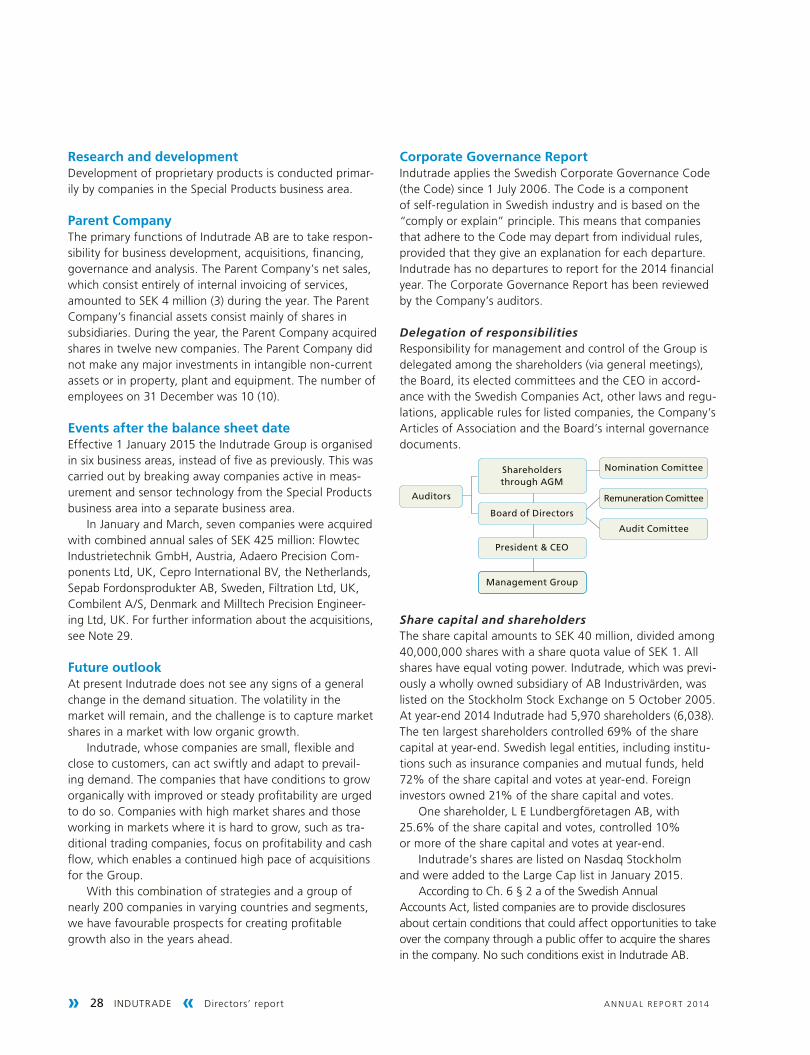
» 28 INDUTRADE « Directors’ report A N N UA L R EP O RT 2014
Research and developmentDevelopment of proprietary products is conducted primar-ily by companies in the Special Products business area.
Parent CompanyThe primary functions of Indutrade AB are to take respon-sibility for business development, acquisitions, financing, governance and analysis. The Parent Company’s net sales, which consist entirely of internal invoicing of services, amounted to SEK 4 million (3) during the year. The Parent Company’s financial assets consist mainly of shares in subsidiaries. During the year, the Parent Company acquired shares in twelve new companies. The Parent Company did not make any major investments in intangible non-current assets or in property, plant and equipment. The number of employees on 31 December was 10 (10).
Events after the balance sheet dateEffective 1 January 2015 the Indutrade Group is organised in six business areas, instead of five as previously. This was carried out by breaking away companies active in meas-urement and sensor technology from the Special Products business area into a separate business area.
In January and March, seven companies were acquired with combined annual sales of SEK 425 million: Flowtec Industrietechnik GmbH, Austria, Adaero Precision Com-ponents Ltd, UK, Cepro International BV, the Netherlands, Sepab Fordonsprodukter AB, Sweden, Filtration Ltd, UK, Combilent A/S, Denmark and Milltech Precision Engineer-ing Ltd, UK. For further information about the acquisitions, see Note 29.
Future outlookAt present Indutrade does not see any signs of a general change in the demand situation. The volatility in the market will remain, and the challenge is to capture market shares in a market with low organic growth.
Indutrade, whose companies are small, flexible and close to customers, can act swiftly and adapt to prevail-ing demand. The companies that have conditions to grow organically with improved or steady profitability are urged to do so. Companies with high market shares and those working in markets where it is hard to grow, such as tra-ditional trading companies, focus on profitability and cash flow, which enables a continued high pace of acquisitions for the Group.
With this combination of strategies and a group of nearly 200 companies in varying countries and segments, we have favourable prospects for creating profitable growth also in the years ahead.
Corporate Governance ReportIndutrade applies the Swedish Corporate Governance Code (the Code) since 1 July 2006. The Code is a component of self-regulation in Swedish industry and is based on the “comply or explain” principle. This means that companies that adhere to the Code may depart from individual rules, provided that they give an explanation for each departure. Indutrade has no departures to report for the 2014 financial year. The Corporate Governance Report has been reviewed by the Company’s auditors.
Delegation of responsibilitiesResponsibility for management and control of the Group is delegated among the shareholders (via general meetings), the Board, its elected committees and the CEO in accord-ance with the Swedish Companies Act, other laws and regu-lations, applicable rules for listed companies, the Company’s Articles of Association and the Board’s internal governance documents.
Share capital and shareholdersThe share capital amounts to SEK 40 million, divided among 40,000,000 shares with a share quota value of SEK 1. All shares have equal voting power. Indutrade, which was previ-ously a wholly owned subsidiary of AB Industri värden, was listed on the Stockholm Stock Exchange on 5 October 2005. At year-end 2014 Indutrade had 5,970 shareholders (6,038). The ten largest shareholders controlled 69% of the share capital at year-end. Swedish legal entities, including institu-tions such as insurance companies and mutual funds, held 72% of the share capital and votes at year-end. Foreign investors owned 21% of the share capital and votes.
One shareholder, L E Lundbergföretagen AB, with 25.6% of the share capital and votes, controlled 10% or more of the share capital and votes at year-end.
Indutrade’s shares are listed on Nasdaq Stockholm and were added to the Large Cap list in January 2015.
According to Ch. 6 § 2 a of the Swedish Annual Accounts Act, listed companies are to provide disclosures about certain conditions that could affect opportunities to take over the company through a public offer to acquire the shares in the company. No such conditions exist in Indutrade AB.
Shareholders through aGM
president & Ceo
Management Group
remuneration Comittee
audit Comittee
auditors
nomination Comittee
Board of Directors
Directors’ report » INDUTRADE 29 «A N N UA L R EP O RT 2014
Articles of AssociationIndutrade is a public company whose business is to “on its own or through subsidiaries, pursue trade in connection with the import and export of machines, raw materials and finished and semi-manufactured products as well as indus-trial necessities, including production, preferably within the plastics, mechanical and chemical industries, and activities compatible therewith.” The Board shall consist of a mini-mum of three and a maximum of eight directors, who are elected each year at the Annual General Meeting. Notices of general meetings of shareholders shall be made through advertisement in the Official Swedish Gazette (Post- och Inrikes Tidningar) and on the Company’s website within the time frame prescribed by the Swedish Companies Act. An advertisement shall be posted in the Swedish daily newspa-per Dagens Nyheter announcing that notice of the Annual General Meeting has been issued. In votes at general meet-ings of shareholders, there is no limitation to the number of votes for represented shares.
General meetings of shareholdersGeneral meetings of shareholders are Indutrade’s highest governing body. At the Annual General Meeting (AGM), which is held within six months after the end of each financial year, the income statement and balance sheet are adopted, the dividend is set, the Board and auditors (where applicable) are elected, their fees are determined, other items of legally ordained business are conducted, and deci-sions are made on proposals submitted by the Board and shareholders.
All shareholders who are registered in the shareholder register on a specified record date and who have notified the Company in due time of their intention to participate at the general meeting are entitled to attend the meeting and vote for the total number of shares they have. Shareholders may be represented by proxy. More information about the 2015 AGM is provided on page 75 of this Annual Report and on the Company’s website.
The notice of the AGM scheduled for 29 April 2015 is expected to be published on 27 March 2015 in the Official Swedish Gazette and on Indutrade’s website. The notice will include a proposed agenda including proposals for the dividend, the election of directors, directors’ fees (broken down by the Chairman and other directors), the election of the auditor, the auditor’s fee, and proposed guidelines on compensation of the Company’s senior executives.
Annual General Meeting 2014At the AGM on 28 April 2014, shareholders representing 60.1% of the shares and votes were in attendance. Fredrik Lundberg was appointed to serve as AGM chairman. At the
AGM, the annual report and audit report were presented. Chairman of the Board Fredrik Lundberg provided informa-tion on the work of the Board and reported on the guide-lines for compensation of the executive management and on the work of the Audit and Remuneration Committees. In addition, CEO Johnny Alvarsson gave an address review-ing Indutrade’s operations in 2013 and the start of 2014.
The auditors reported on their audit of the Group and presented relevant parts of their audit report for 2013.
The 2014 AGM made the following resolutions:• to adopt the financial statements for 2013• to set the dividend at SEK 7.05 per share• to discharge the members of the Board of Directors and
the President from liability for the past financial year• to re-elect directors Fredrik Lundberg, Eva Färnstrand,
Bengt Kjell, Martin Lindqvist, Ulf Lundahl, Krister Mellvé, Lars Pettersson and Johnny Alvarsson
• to re-elect Fredrik Lundberg as Chairman of the Board• to re-elect Bengt Kjell as Vice Chairman of the Board• that the Nomination Committee shall consist of repre-
sentatives of four of the largest shareholders in terms of votes as well as the Chairman of the Board
• that the Nomination Committee’s composition shall be based on ownership data as per 31 August 2014 and be announced not later than six months before the Annual General Meeting
• that Indutrade shall apply compensation levels for senior executives which mainly shall consist normally of a fixed and variable portion, shall be in line with the going rate in the market, and shall be commensurate with the executives’ level of expertise, responsibility and perfor-mance
• to implement a long-term incentive programme involv-ing a directed issue and the transfer of warrants
Members of the Board of DirectorsIndutrade’s board of directors, which is elected by the AGM, consists of eight members including the President and CEO. Indutrade has not set any specific age limit for the board members, nor any term limit for how long a director may sit on the Board.
The Chairman of the Board, Fredrik Lundberg, is President and CEO of L E Lundbergföretagen. The Vice Chairman, Bengt Kjell, is a former Executive Vice President of Industrivärden and is currently CEO of the company AB Handel och Industri. Eva Färnstrand is a former Site Man-ager at Södra Cell Mönsterås and is currently Chairman of Infranord. Martin Lindqvist is President and CEO of SSAB and has previously served in other executive positions in the SSAB Group. Ulf Lundahl is a former Executive Vice
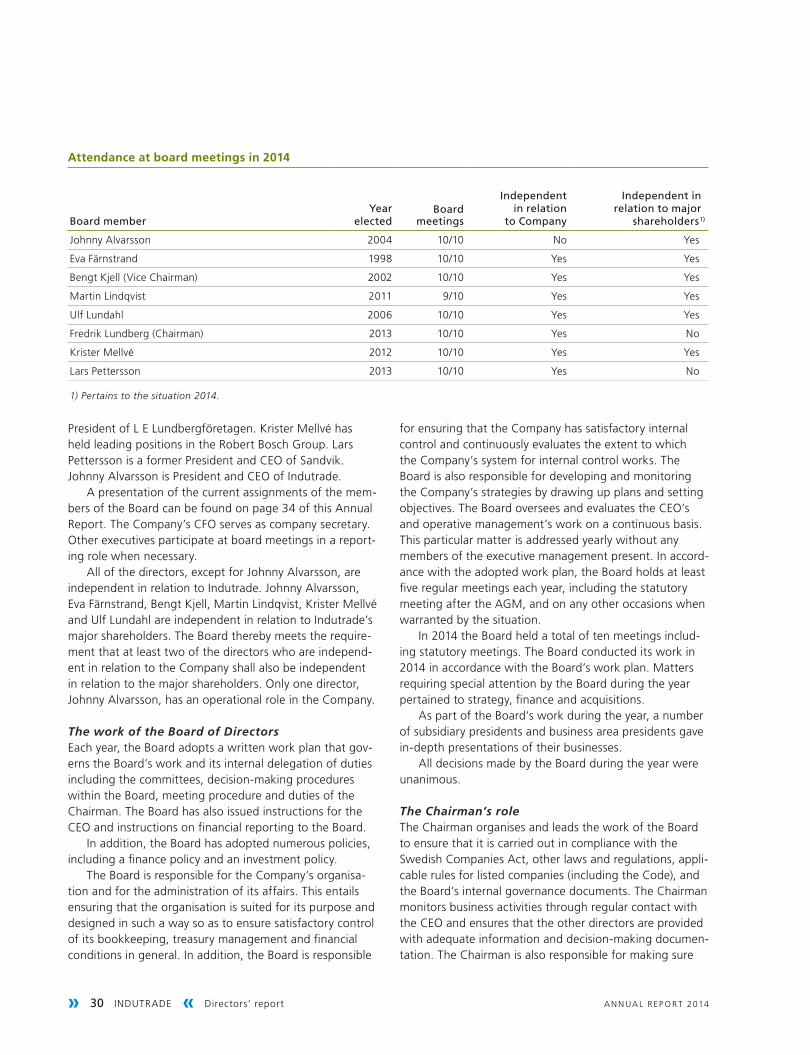
» 30 INDUTRADE « Directors’ report A N N UA L R EP O RT 2014
President of L E Lundbergföretagen. Krister Mellvé has held leading positions in the Robert Bosch Group. Lars Pettersson is a former President and CEO of Sandvik. Johnny Alvarsson is President and CEO of Indutrade.
A presentation of the current assignments of the mem-bers of the Board can be found on page 34 of this Annual Report. The Company’s CFO serves as company secretary. Other executives participate at board meetings in a report-ing role when necessary.
All of the directors, except for Johnny Alvarsson, are independent in relation to Indutrade. Johnny Alvarsson, Eva Färnstrand, Bengt Kjell, Martin Lindqvist, Krister Mellvé and Ulf Lundahl are independent in relation to Indutrade’s major shareholders. The Board thereby meets the require-ment that at least two of the directors who are independ-ent in relation to the Company shall also be independent in relation to the major shareholders. Only one director, Johnny Alvarsson, has an operational role in the Company.
The work of the Board of DirectorsEach year, the Board adopts a written work plan that gov-erns the Board’s work and its internal delegation of duties including the committees, decision-making procedures within the Board, meeting procedure and duties of the Chairman. The Board has also issued instructions for the CEO and instructions on financial reporting to the Board.
In addition, the Board has adopted numerous policies, including a finance policy and an investment policy.
The Board is responsible for the Company’s organisa-tion and for the administration of its affairs. This entails ensuring that the organisation is suited for its purpose and designed in such a way so as to ensure satisfactory control of its bookkeeping, treasury management and financial conditions in general. In addition, the Board is responsible
for ensuring that the Company has satisfactory internal control and continuously evaluates the extent to which the Company’s system for internal control works. The Board is also responsible for developing and monitoring the Company’s strategies by drawing up plans and setting objectives. The Board oversees and evaluates the CEO’s and operative management’s work on a continuous basis. This particular matter is addressed yearly without any members of the executive management present. In accord-ance with the adopted work plan, the Board holds at least five regular meetings each year, including the statutory meeting after the AGM, and on any other occasions when warranted by the situation.
In 2014 the Board held a total of ten meetings includ-ing statutory meetings. The Board conducted its work in 2014 in accordance with the Board’s work plan. Matters requiring special attention by the Board during the year pertained to strategy, finance and acquisitions.
As part of the Board’s work during the year, a number of subsidiary presidents and business area presidents gave in-depth presentations of their businesses.
All decisions made by the Board during the year were unanimous.
The Chairman’s roleThe Chairman organises and leads the work of the Board to ensure that it is carried out in compliance with the Swedish Companies Act, other laws and regulations, appli-cable rules for listed companies (including the Code), and the Board’s internal governance documents. The Chairman monitors business activities through regular contact with the CEO and ensures that the other directors are provided with adequate information and decision-making documen-tation. The Chairman is also responsible for making sure
Attendance at board meetings in 2014
Board member Year
elected Board
meetings
Independent in relation
to Company
Independent in relation to major
shareholders 1)
Johnny Alvarsson 2004 10/10 No Yes
Eva Färnstrand 1998 10/10 Yes Yes
Bengt Kjell (Vice Chairman) 2002 10/10 Yes Yes
Martin Lindqvist 2011 9/10 Yes Yes
Ulf Lundahl 2006 10/10 Yes Yes
Fredrik Lundberg (Chairman) 2013 10/10 Yes No
Krister Mellvé 2012 10/10 Yes Yes
Lars Pettersson 2013 10/10 Yes No
1) Pertains to the situation 2014.
Directors’ report » INDUTRADE 31 «A N N UA L R EP O RT 2014
that an annual evaluation is conducted of the Board’s and the CEO’s work and that the results of this evaluation are presented to the Nomination Committee. The Chairman represents the Company on ownership matters.
Remuneration CommitteeThe Board has appointed a remuneration committee consist-ing of the Chairman of the Board, Fredrik Lundberg, the Vice Chairman, Bengt Kjell, and board member Martin Lindqvist. The Remuneration Committee draws up “the Board’s pro-posed guidelines for compensation and other terms of em-ployment for senior executives”. This proposal is discussed by the Board and is submitted to the AGM for approval.
The CEO consults with the Remuneration Committee on the terms of employment for the other members of the executive management.
The Remuneration Committee held one meeting in 2014, at which all of the committee members were present.
Audit CommitteeThe Board has appointed an audit committee, consisting of the entire board except for the CEO. Ulf Lundahl is Audit Committee chair.
The Audit Committee has an oversight role with respect to the Company’s risk management, govern-ance and control, and financial reporting. The committee maintains regular contact with the Company’s auditor to ensure that the Company’s internal and external reporting satisfies the requirements made on market-listed compa-nies and to discuss the scope and focus of auditing work. The Audit Committee evaluates completed audit activities and informs the Company’s nomination committee about the results of its evaluation and assists the Nomination Committee on drawing up recommendations for auditors and fees for their auditing work. The Audit Committee held three meetings in 2014, at which all of the members were present. On three occasions in 2014 the committee conducted reviews with and received reports from the Company’s external auditors.
Directors’ feesFees are payable to the Chairman of the Board and direc-tors in accordance with an AGM resolution. The Chairmanreceives a fee of SEK 500,000, the Vice Chairman receives a fee of SEK 375,000, and the other directors receive a fee of SEK 250,000 each. However, no fee is payable to directors who are employed by a company within the Indutrade Group. The Audit Committee chair is paid a fee of SEK 50,000, and the members of the Remuneration Committee each receive a fee of SEK 25,000. The total yearly fees thus amount to SEK 2,250,000.
Nomination CommitteeOn 28 April 2014 the AGM resolved that the Nomina-tion Committee shall consist of representatives of four of the largest shareholders in terms of votes as well as the Chairman of the Board, who shall also convene the first meeting of the Nomination Committee. The member representing the largest shareholder shall be appointed as committee chair. The composition of the Nomination Committee ahead of the 2015 Annual General Meeting is to be based on ownership data as per 31 August 2014 and is to be publicly announced not later than six months prior to the AGM. The composition of the Nomination Committee ahead of the 2015 AGM was announced on 28 November 2014.
Ahead of the 2015 AGM, the Nomination Committee was composed of the following members:
Nomination Committee composition
representative ShareholderShare of
votes
Claes Boustedt L E Lundbergföretagen, Nomination Committee chair 25.6%
Gustaf Setterblad Didner & Gerge funds 9.8%
Anders Oscarsson AMF Insurance and funds 9.6%
Göran Espelund Lannebo funds 6.8%
Fredrik Lundberg Chairman of the Board
The Nomination Committee held two meetings, at which – among other items of business – the evaluation of the Board’s work during the past year was presented and the Board’s composition was discussed. The Nomination Committee is tasked with drawing up recommendations to be presented to the AGM for resolutions regarding a person to serve as AGM chairman, the Chairman of the Board and other directors, directors’ fees, the auditor’s fee and, where applicable, election of the auditor, and the principles for the appointment of the new Nomination Committee.
Based on the results of the Board’s evaluation and the current directors’ availability for re-election – among other things – the Nomination Committee makes an assessment of whether the sitting board meets the requirements that will be made for the Board in view of the Company’s situation and future orientation, or if the composition of expertise and experience needs to be changed.
Ahead of the 2015 AGM, the Nomination Commit-tee has proposed the re-election of directors Johnny Alvarsson, Eva Färnstrand, Bengt Kjell, Fredrik Lundberg, Ulf Lundahl, Krister Mellvé and Lars Pettersson. Martin Lindqvist has notified the committee that he is not avail-

» 32 INDUTRADE « Directors’ report A N N UA L R EP O RT 2014
able for re-election. Katarina Martinson has been nomi-nated as a new director.
Katarina Martinson (b. 1981) has an M.Sc. Econ. degree from the Stockholm School of Economics. She has worked since 2009 with asset management for the Lundberg family and is the principal owner and a director on the board of Fidelio Capital AB. She also serves as a director on the boards of L E Lundbergföretagen AB and Husqvarna AB, among other companies.
Fredrik Lundberg has been proposed for re-election as Chairman of the Board. The Nomination Committee’s proposal entails that the number of directors on the Board will be unchanged during the coming mandate period and that the Board will thereby have a total of eight members. A more detailed presentation of the members of the Board is provided on page 34 of this Annual Report.
Operating activitiesThe CEO is responsible for the administration of Indutrade’s day-to-day affairs, which are managed by the Company’s executive management team. The CEO’s decision-making authority regarding investments and financing matters is governed by rules set by the Board.
President and CEOIndutrade’s President and CEO, Johnny Alvarsson, has been employed by Indutrade since 2004. He was CEO of Elektronikgruppen from 2001 to 2004, CEO of Zeteco AB from 1988 to 2000, and held various management positions at Ericsson from 1975 to 1987. Johnny Alvarsson owns 8,050 shares of Indutrade stock.
AuditorsAt the 2014 Annual General Meeting, the chartered accounting firm PricewaterhouseCoopers AB (“PwC”) was appointed as auditor for a term extending through the 2015 Annual General Meeting.
The auditors maintain regular contact with the Audit Committee and the executive management.
The chief auditor since 2013 is Michael Bengtsson, Authorised Public Accountant, who succeeded Lennart Danielsson, who was in charge of Indutrade’s audit from 2006 to 2013. The auditor’s fee is reported in Note 10 of this Annual Report.
Quarterly review by the auditorsDuring the 2014 financial year, Indutrade’s nine-month interim report was reviewed by the external auditors.
Internal control over financial reportingAs prescribed by the Swedish Companies Act, the Board is responsible for internal control. This report has been prepared in accordance with the Annual Accounts Act and describes how the internal control over financial reporting is organised.
Control environmentEffective board work is the foundation for good internal con-trol. The Board’s work plan and the instructions for the CEO and the Board’s committees ensure a clear delegation of roles and responsibilities to the benefit of effective manage-ment of risks in the Company’s operations.
In addition, the Board has adopted a number of funda-mental guidelines and policies designed to create the condi-tions for a good control environment. These include, among other things, a policy for social responsibility and environ-mental work, a policy for economic and financial reporting, a finance policy and an investment policy. These policies are followed up and revised as needed. The executive manage-ment continuously draws up instructions for the Group’s financial reporting which, together with the policies adopted by the Board, are included in the Group’s financial manual.
The Group has a joint reporting system that serves as the base for the Group’s monthly reporting, consolidation work and monitoring of earnings performance.
Risk assessmentThe Company has implemented a structured process for assessing risks that could affect financial reporting. This is an annually recurring process and is evaluated by the Audit Committee and the Board.
Through this risk assessment it has been ascertained that the Group’s structure, consisting of a large number of standalone companies of varying size that are independent from each other in various sectors and geographical mar-kets, entails a considerable diversification of risk. The risk assessment also covered the Group’s income statement and balance sheet items to identify areas in which the aggregate risk for error and the effects of these would be greatest. The areas identified consisted primarily of revenue recognition, trade accounts receivable and inventories.
In addition, continuous risk assessment is conducted in connection with strategic planning, budgeting, forecasts and acquisition activities, aimed at identifying events in the market or operations that could give rise to changes in e.g., revenue streams and valuations of assets or liabilities.
Control activitiesThe Group’s companies were organised in five business areas through 31 December 2014. Effective 1 January 2015,
Directors’ report » INDUTRADE 33 «A N N UA L R EP O RT 2014
there are six business areas. In addition to a business area president, the respective business area management teams include a controller. The controller plays a central role in analysing and monitoring the business area’s financial re-porting and in ensuring compliance by the companies in the business area with Group policies. The Parent Company has additional functions for continuous analysis and monitoring of financial reporting by the Group, the business areas and subsidiaries. The Parent Company’s finance department also initiates work on the annual self assessment routine regard-ing the internal control over financial reporting.
In this evaluation, the Group’s companies have been grouped into three categories, based on the nature and scope of the respective companies’ businesses. For each group of companies, a questionnaire for evaluation of in-ternal control has been prepared based on the performed risk analysis.
All companies owned by Indutrade at the start of 2014 were required to respond to the evaluation question-naire. The responses were compiled and evaluated per group of companies and for the Group as a whole. As a complement to this work, the auditors validated parts of the respective companies’ completed questionnaires. In addition to this, the controllers of the business areas and Parent Company monitor internal control through visits to a number of companies each year. Both the evaluation performed by the Company and the result of the auditors’ validation have been reported to and discussed with the Audit Committee. Feedback is provided to the companies in the Group where a need for improved routines has been identified. The overall evaluation of internal control over the Group’s financial reporting will serve as documenta-tion for the subsequent years’ self assessment and work on further strengthening internal control.
Information and communicationThe Company’s governing documents, consisting of policies, guidelines and manuals – to the extent that these pertain to financial reporting – are updated on a regular basis and communicated to the companies within the Group. Systems and routines have been established to provide management with reports on the results of operations and financial position in relation to set targets, among other things.
MonitoringThe Board conducts a monthly evaluation of business devel-opment, earnings, position and cash flow using a report pack containing comments on outcomes and certain key ratios.
The Audit Committee has an oversight role regarding the Company’s financial reporting, risk management, and
governance and control. In addition, the Audit Committee maintains regular contact with the Company’s auditors to ensure that the Company’s internal and external reporting satisfies requirements made on market-listed companies and to monitor any observations that emerge from the audit.
Internal auditThe Group has a simple operative structure consisting pri-marily of small and medium-sized standalone businessesthat are independent of each other, with varying condi-tions for internal control. Compliance with governance and internal control systems that have been drawn up by the Group is checked by the controllers on a regular basis at the business area and Parent Company levels. In addition, the controllers perform continuing analyses of the companies’ reporting and financial outcomes to verify their perfor-mance. Added to this is the routine for annual self assess-ment of internal control over financial reporting. In view of the above, the Board has opted to not have a dedicated internal audit function.
Proposed distribution of earningsThe Annual General Meeting has the following funds at its disposal (SEK m)
Share premium reserve 4
Reserve for fair value –32
Retained earnings 1,540
Net profit for the year 799
total 2,311
The Board of Directors proposes the following distribution of earnings (SEK m)
Dividend of SEK 7.75 per share 310
To be carried forward 2,001
Total 2,311
The dividend proposed by the Board of Directors corre-sponds to 13% of the Parent Company’s equity and 10% of the Group’s equity. Indutrade’s dividend policy is that the dividend shall, over time, amount to between 30% and 60% of net profit.
Against the backdrop of the anticipated trend in the economy, the Board is of the opinion that the proposed dividend is well balanced with respect to the goals, scope and risks of the operations and with respect to the ability to meet the Company’s future obligations.
If the dividend had been paid out at year-end, the Group’s equity ratio would have been 35%. After payment of the proposed dividend, it is judged that Indutrade will continue to have a favourable financial position.
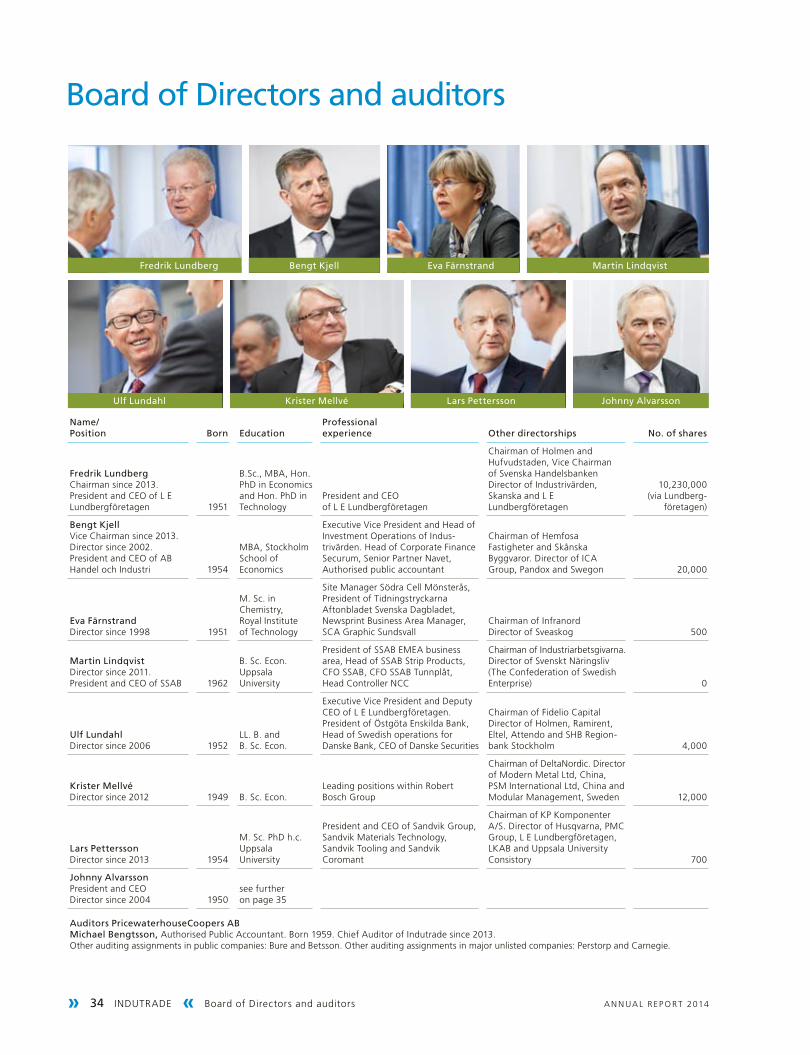
» 34 INDUTRADE « Board of Directors and auditors A N N UA L R EP O RT 2014
Board of Directors and auditors
ulf lundahl Krister Mellvé lars pettersson Johnny alvarsson
Martin lindqvist Bengt Kjell eva FärnstrandFredrik lundberg
name/ position Born education
professionalexperience other directorships no. of shares
Fredrik lundbergChairman since 2013.President and CEO of L E Lundbergföretagen 1951
B.Sc., MBA, Hon. PhD in Economics and Hon. PhD in Technology
President and CEO of L E Lundbergföretagen
Chairman of Holmen and Hufvudstaden, Vice Chairman of Svenska Handelsbanken Director of Industrivärden, Skanska and L E Lundbergföretagen
10,230,000(via Lundberg-
företagen)
Bengt KjellVice Chairman since 2013.Director since 2002.President and CEO of AB Handel och Industri 1954
MBA, Stockholm School of Economics
Executive Vice President and Head of Investment Operations of Indus-trivärden. Head of Corporate Finance Securum, Senior Partner Navet, Authorised public accountant
Chairman of Hemfosa Fastigheter and Skånska Byggvaror. Director of ICA Group, Pandox and Swegon 20,000
eva FärnstrandDirector since 1998 1951
M. Sc. in Chemistry, Royal Institute of Technology
Site Manager Södra Cell Mönsterås, President of Tidningstryckarna Aftonbladet Svenska Dagbladet, Newsprint Business Area Manager, SCA Graphic Sundsvall
Chairman of Infranord Director of Sveaskog 500
Martin lindqvistDirector since 2011.President and CEO of SSAB 1962
B. Sc. Econ. Uppsala University
President of SSAB EMEA business area, Head of SSAB Strip Products, CFO SSAB, CFO SSAB Tunnplåt, Head Controller NCC
Chairman of Industriarbetsgivarna. Director of Svenskt Näringsliv (The Confederation of Swedish Enterprise) 0
ulf lundahlDirector since 2006 1952
LL. B. and B. Sc. Econ.
Executive Vice President and Deputy CEO of L E Lundbergföretagen. President of Östgöta Enskilda Bank, Head of Swedish operations for Danske Bank, CEO of Danske Securities
Chairman of Fidelio Capital Director of Holmen, Ramirent, Eltel, Attendo and SHB Region-bank Stockholm 4,000
Krister MellvéDirector since 2012 1949 B. Sc. Econ.
Leading positions within Robert Bosch Group
Chairman of DeltaNordic. Director of Modern Metal Ltd, China, PSM International Ltd, China and Modular Management, Sweden 12,000
lars petterssonDirector since 2013 1954
M. Sc. PhD h.c. Uppsala University
President and CEO of Sandvik Group, Sandvik Materials Technology, Sandvik Tooling and Sandvik Coromant
Chairman of KP Komponenter A/S. Director of Husqvarna, PMC Group, L E Lundbergföretagen, LKAB and Uppsala University Consistory 700
Johnny alvarssonPresident and CEODirector since 2004 1950
see further on page 35
auditors pricewaterhouseCoopers aBMichael Bengtsson, Authorised Public Accountant. Born 1959. Chief Auditor of Indutrade since 2013. Other auditing assignments in public companies: Bure and Betsson. Other auditing assignments in major unlisted companies: Perstorp and Carnegie.
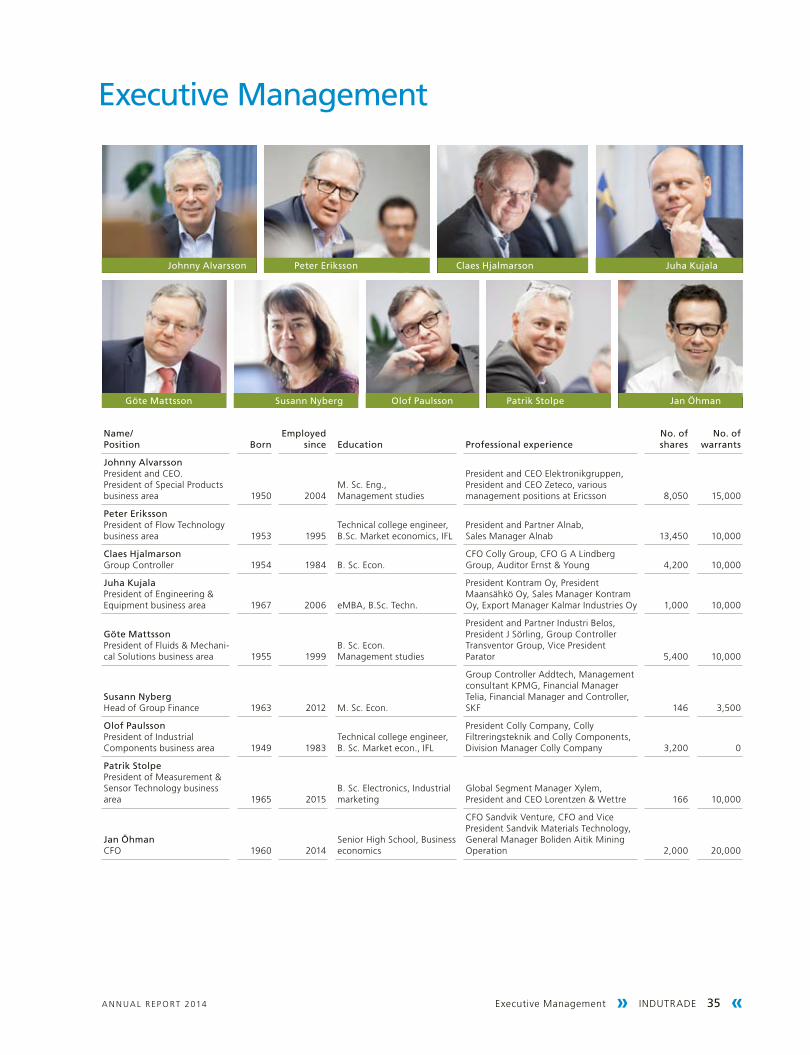
Executive Management » INDUTRADE 35 «A N N UA L R EP O RT 2014
executive Management
Johnny alvarsson peter eriksson Claes Hjalmarson Juha Kujala
Jan ÖhmanGöte Mattsson Susann nyberg patrik Stolpeolof paulsson
name/ position Born
employed since education professional experience
no. of shares
no. of warrants
Johnny alvarssonPresident and CEO.President of Special Products business area 1950 2004
M. Sc. Eng., Management studies
President and CEO Elektronikgruppen,President and CEO Zeteco, various management positions at Ericsson 8,050 15,000
peter erikssonPresident of Flow Technology business area 1953 1995
Technical college engineer,B.Sc. Market economics, IFL
President and Partner Alnab, Sales Manager Alnab 13,450 10,000
Claes HjalmarsonGroup Controller 1954 1984 B. Sc. Econ.
CFO Colly Group, CFO G A Lindberg Group, Auditor Ernst & Young 4,200 10,000
Juha KujalaPresident of Engineering & Equipment business area 1967 2006 eMBA, B.Sc. Techn.
President Kontram Oy, President Maansähkö Oy, Sales Manager Kontram Oy, Export Manager Kalmar Industries Oy 1,000 10,000
Göte MattssonPresident of Fluids & Mechani-cal Solutions business area 1955 1999
B. Sc. Econ. Management studies
President and Partner Industri Belos, President J Sörling, Group Controller Transventor Group, Vice President Parator 5,400 10,000
Susann nybergHead of Group Finance 1963 2012 M. Sc. Econ.
Group Controller Addtech, Management consultant KPMG, Financial Manager Telia, Financial Manager and Controller, SKF 146 3,500
olof paulssonPresident of Industrial Components business area 1949 1983
Technical college engineer,B. Sc. Market econ., IFL
President Colly Company, Colly Filtrerings teknik and Colly Components,Division Manager Colly Company 3,200 0
patrik StolpePresident of Measurement & Sensor Technology business area 1965 2015
B. Sc. Electronics, Industrial marketing
Global Segment Manager Xylem, President and CEO Lorentzen & Wettre 166 10,000
Jan ÖhmanCFO 1960 2014
Senior High School, Business economics
CFO Sandvik Venture, CFO and Vice President Sandvik Materials Technology, General Manager Boliden Aitik Mining Operation 2,000 20,000
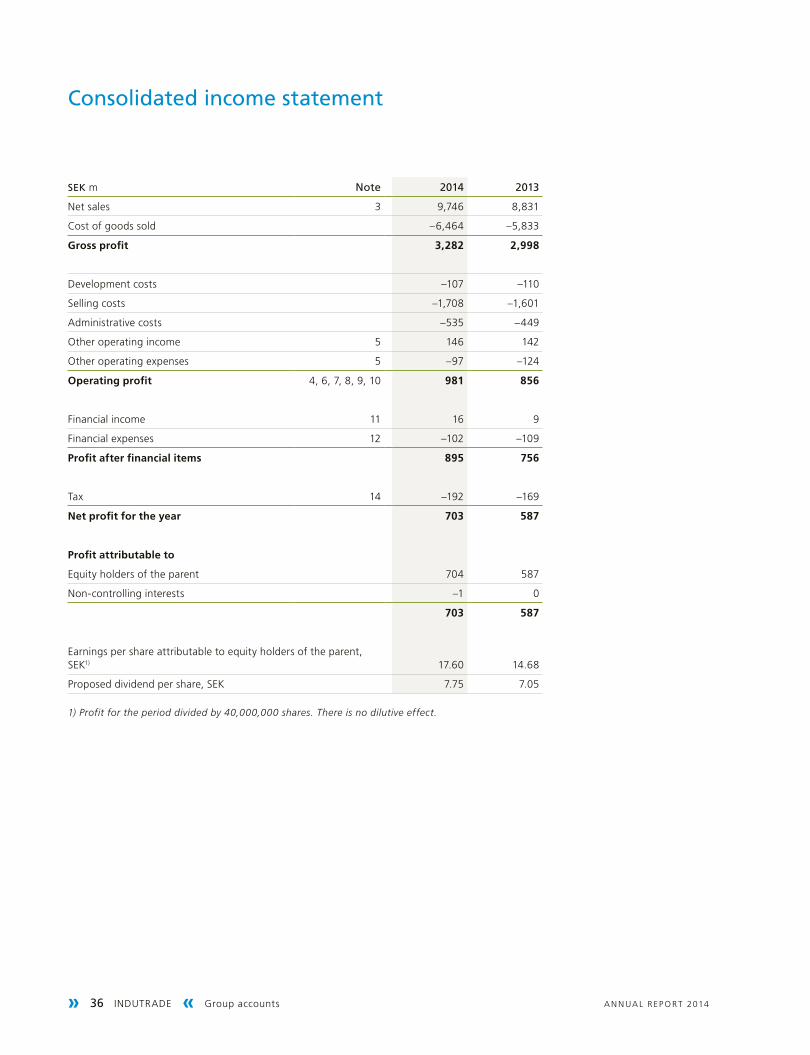
» 36 INDUTRADE « Group accounts A N N UA L R EP O RT 2014
Consolidated income statement
SeK m note 2014 2013
Net sales 3 9,746 8,831
Cost of goods sold –6,464 –5,833
Gross profit 3,282 2,998
Development costs –107 –110
Selling costs –1,708 –1,601
Administrative costs –535 –449
Other operating income 5 146 142
Other operating expenses 5 –97 –124
Operating profit 4, 6, 7, 8, 9, 10 981 856
Financial income 11 16 9
Financial expenses 12 –102 –109
Profit after financial items 895 756
Tax 14 –192 –169
Net profit for the year 703 587
Profit attributable to
Equity holders of the parent 704 587
Non-controlling interests –1 0
703 587
Earnings per share attributable to equity holders of the parent, SEK1) 17.60 14.68
Proposed dividend per share, SEK 7.75 7.05
1) Profit for the period divided by 40,000,000 shares. There is no dilutive effect.
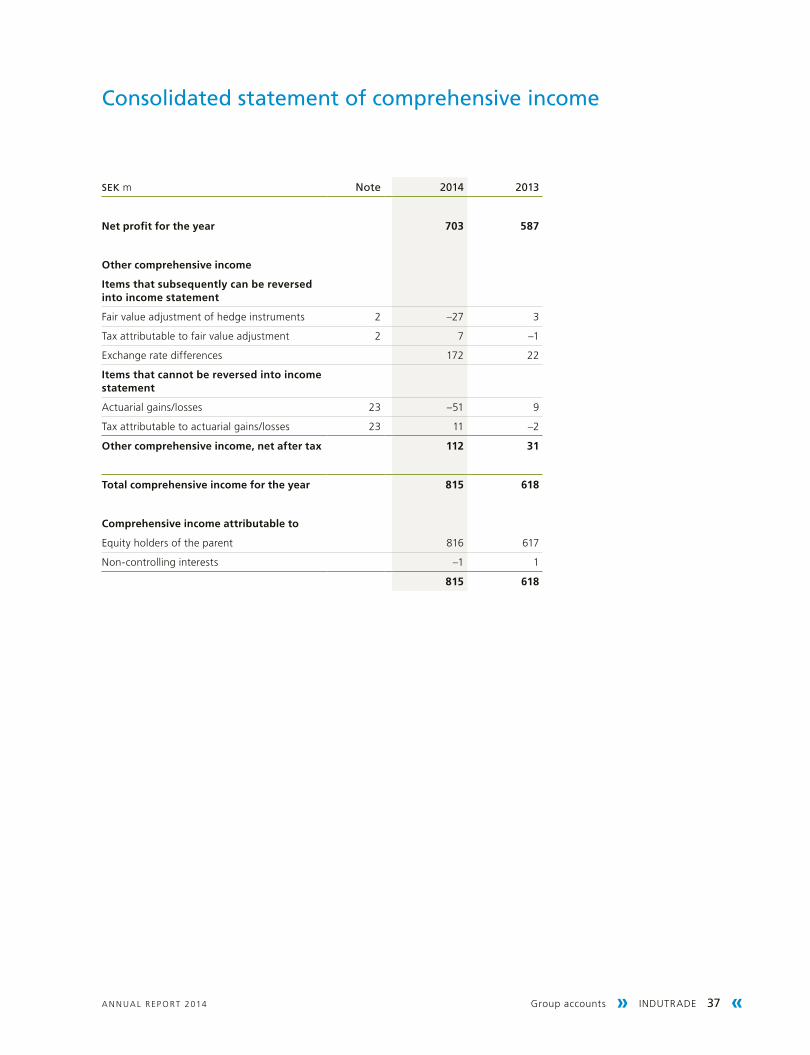
Group accounts » INDUTRADE 37 «A N N UA L R EP O RT 2014
Consolidated statement of comprehensive income
SeK m note 2014 2013
Net profit for the year 703 587
Other comprehensive income
Items that subsequently can be reversed into income statement
Fair value adjustment of hedge instruments 2 –27 3
Tax attributable to fair value adjustment 2 7 –1
Exchange rate differences 172 22
Items that cannot be reversed into income statement
Actuarial gains/losses 23 –51 9
Tax attributable to actuarial gains/losses 23 11 –2
Other comprehensive income, net after tax 112 31
Total comprehensive income for the year 815 618
Comprehensive income attributable to
Equity holders of the parent 816 617
Non-controlling interests –1 1
815 618

» 38 INDUTRADE « Group accounts A N N UA L R EP O RT 2014
Consolidated balance sheet
SeK m note31 Dec
201431 Dec
2013
ASSETS
Non-current assets
Intangible assets 15
Goodwill 1,572 1,308
Other intangible assets 1,445 1,286
Total intangible assets 3,017 2,594
Property, plant and equipment 16
Land and buildings 524 457
Machinery 214 158
Equipment 226 207
Construction in progress and advances for property, plant and equipment 7 27
Total property, plant and equipment 971 849
Financial assets
Financial assets available for sale 17 4 7
Non-current receivables 18 15 12
Deferred tax assets 14 68 42
Total financial assets 87 61
Total non-current assets 4,075 3,504
Current assets
Inventories 19 1,617 1,546
Accounts receivable - trade 20 1,702 1,435
Current tax assets 75 55
Other current receivables 170 68
Prepaid expenses and accrued income 21 91 85
Cash and cash equivalents 28 357 261
Total current assets 4,012 3,450
TOTAL ASSETS 8,087 6,954
SeK m note31 Dec
201431 Dec
2013
EqUITY AND LIABILITIES
Equity
Share capital 40 40
Reserves 57 –95
Profit brought forward incl. net profit for the year 3,063 2,678
Total equity attributable to owners of the parent 3,160 2,623
Non-controlling interests 2 3
Total equity 3,162 2,626
Non-current liabilities
Non-current interest-bearing liabilities 22 983 2,034
Other non-current liabilities 0 0
Pension obligations 23 233 167
Deferred tax liabilities 14 404 344
Other provisions 24 8 9
Total non-current liabilities 1,628 2,554
Current liabilities
Current interest-bearing liabilities 22 1,635 381
Accounts payable – trade 763 602
Current tax liabilities 82 64
Other current liabilities 372 262
Accrued expenses and deferred income 25 445 465
Total current liabilities 3,297 1,774
TOTAL EqUITY AND LIABILITIES 8,087 6,954
Pledged assets 26 253 246
Contingent liabilities 27 2 2

Group accounts » INDUTRADE 39 «A N N UA L R EP O RT 2014
Consolidated statement of changes in equity
attributable to owners of the parent
non-controlling
intereststotal
equitySeK mShare
capital reserves
profit brought forward total
OPENING BALANCE, 1 jANUARY 2013 40 –118 2,366 2,288 2 2,290
Comprehensive income
Net profit for the year – – 587 587 0 587
Other comprehensive income
Fair value adjustment of hedge instruments – 3 – 3 – 3
Tax attributable to fair value adjustment – –1 – –1 – –1
Actuarial gains/losses – – 9 9 – 9
Tax attributable to actuarial gains/losses – – –2 –2 – –2
Exchange rate differences – 21 – 21 1 22
Total comprehensive income – 23 594 617 1 618
Transactions with shareholders
Dividend paid for 2012 – – –2821) –282 – –282
Total transactions with shareholders – – –282 –282 – –282
OPENING BALANCE, 1 jANUARY 2014 40 –95 2,678 2,623 3 2,626
Comprehensive income
Net profit for the year – – 704 704 –1 703
Other comprehensive income
Fair value adjustment of hedge instruments – –27 – –27 – –27
Tax attributable to fair value adjustment – 7 – 7 – 7
Actuarial gains/losses – – –51 –51 – –51
Tax attributable to actuarial gains/losses – – 11 11 – 11
Exchange rate differences – 172 – 172 0 172
Total comprehensive income – 152 664 816 –1 815
Transactions with shareholders
Payment for issued warrants – – 4 4 – 4
Acquisitions of non-controlling interests – – –1 –1 – –1
Dividend paid for 2013 – – –2822) –282 – –282
Total transactions with shareholders – – –279 –279 – –279
CLOSING BALANCE, 31 DECEMBER 2014 40 57 3,063 3,160 2 3,162
1) The dividend per share in 2012 was SEK 7.05.2) The dividend per share in 2013 was SEK 7.05. The proposed dividend per share for 2014 is SEK 7.75.
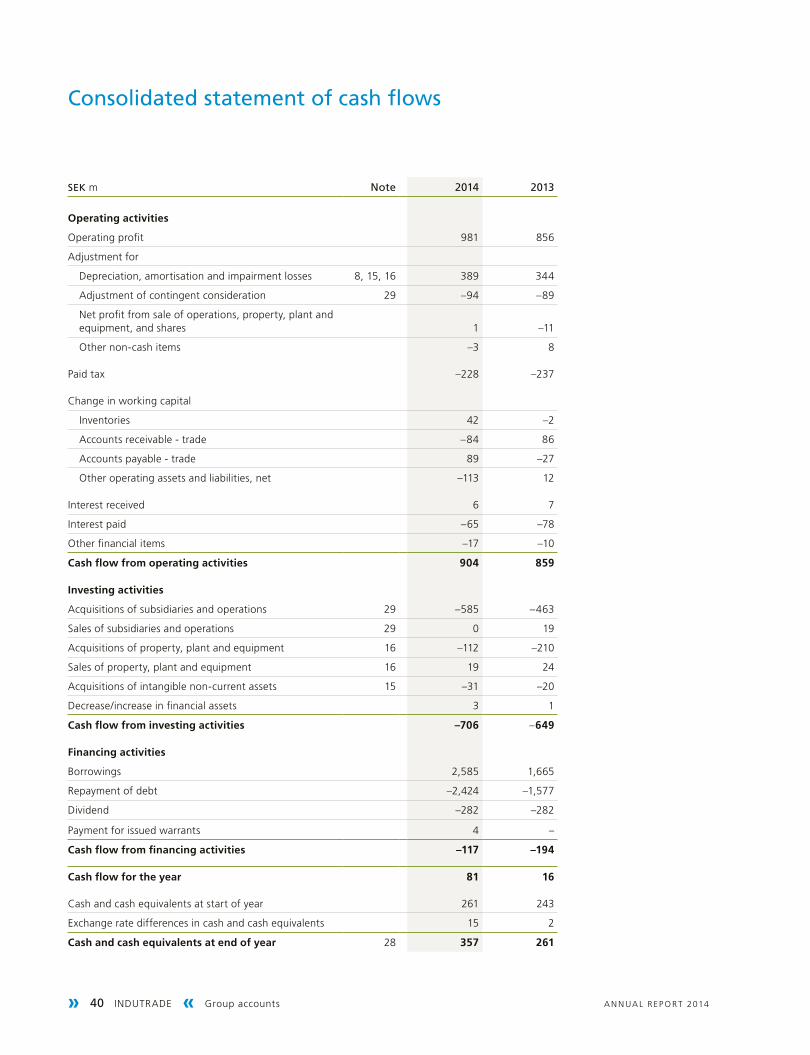
» 40 INDUTRADE « Group accounts A N N UA L R EP O RT 2014
Consolidated statement of cash flows
SeK m note 2014 2013
Operating activities
Operating profit 981 856
Adjustment for
Depreciation, amortisation and impairment losses 8, 15, 16 389 344
Adjustment of contingent consideration 29 –94 –89
Net profit from sale of operations, property, plant and equipment, and shares 1 –11
Other non-cash items –3 8
Paid tax –228 –237
Change in working capital
Inventories 42 –2
Accounts receivable - trade –84 86
Accounts payable - trade 89 –27
Other operating assets and liabilities, net –113 12
Interest received 6 7
Interest paid –65 –78
Other financial items –17 –10
Cash flow from operating activities 904 859
Investing activities
Acquisitions of subsidiaries and operations 29 –585 –463
Sales of subsidiaries and operations 29 0 19
Acquisitions of property, plant and equipment 16 –112 –210
Sales of property, plant and equipment 16 19 24
Acquisitions of intangible non-current assets 15 –31 –20
Decrease/increase in financial assets 3 1
Cash flow from investing activities –706 –649
Financing activities
Borrowings 2,585 1,665
Repayment of debt –2,424 –1,577
Dividend –282 –282
Payment for issued warrants 4 –
Cash flow from financing activities –117 –194
Cash flow for the year 81 16
Cash and cash equivalents at start of year 261 243
Exchange rate differences in cash and cash equivalents 15 2
Cash and cash equivalents at end of year 28 357 261
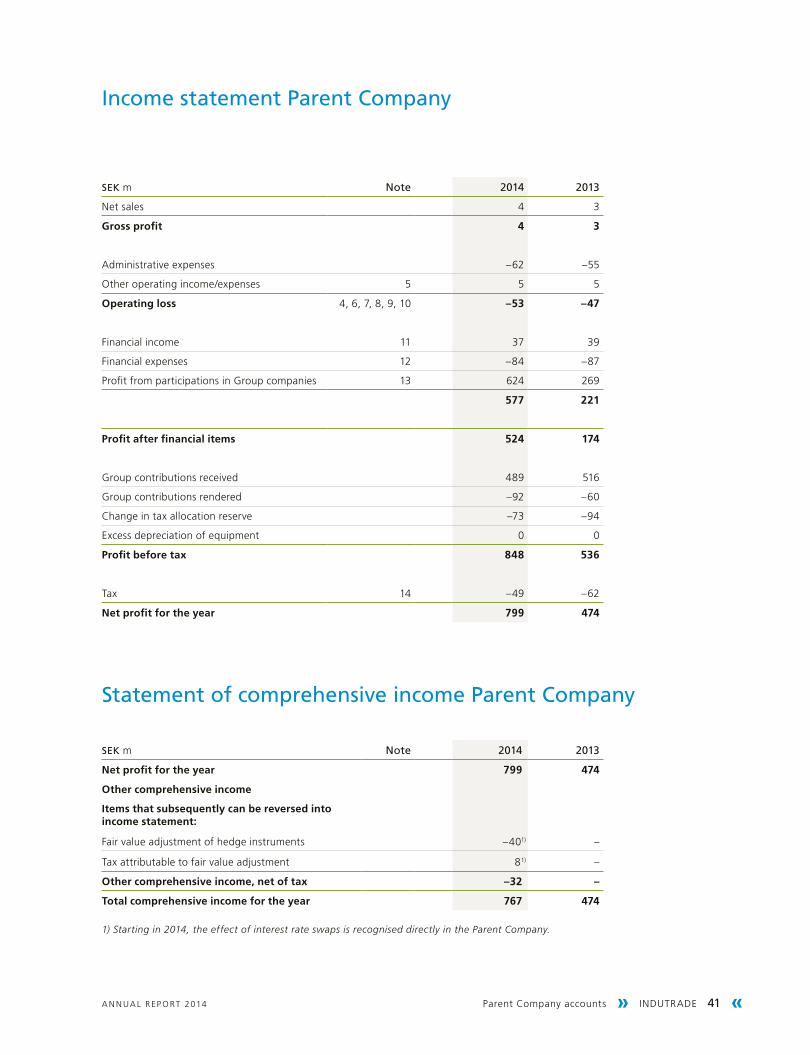
Parent Company accounts » INDUTRADE 41 «A N N UA L R EP O RT 2014
Income statement parent Company
SeK m note 2014 2013
Net sales 4 3
Gross profit 4 3
Administrative expenses –62 –55
Other operating income/expenses 5 5 5
Operating loss 4, 6, 7, 8, 9, 10 –53 –47
Financial income 11 37 39
Financial expenses 12 –84 –87
Profit from participations in Group companies 13 624 269
577 221
Profit after financial items 524 174
Group contributions received 489 516
Group contributions rendered –92 –60
Change in tax allocation reserve –73 –94
Excess depreciation of equipment 0 0
Profit before tax 848 536
Tax 14 –49 –62
Net profit for the year 799 474
Statement of comprehensive income parent Company
SeK m note 2014 2013
Net profit for the year 799 474
Other comprehensive income
Items that subsequently can be reversed into income statement:
Fair value adjustment of hedge instruments –401) –
Tax attributable to fair value adjustment 8 1) –
Other comprehensive income, net of tax –32 –
Total comprehensive income for the year 767 474
1) Starting in 2014, the effect of interest rate swaps is recognised directly in the Parent Company.
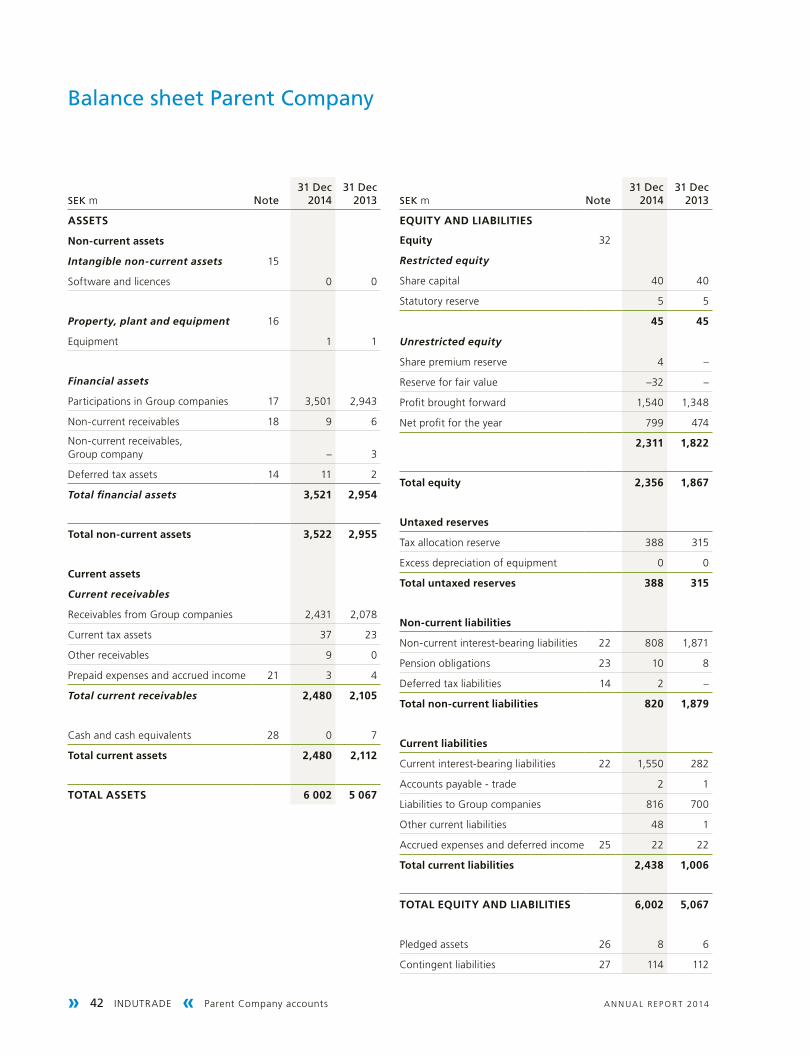
» 42 INDUTRADE « Parent Company accounts A N N UA L R EP O RT 2014
Balance sheet parent Company
SeK m note31 Dec
201431 Dec
2013
ASSETS
Non-current assets
Intangible non-current assets 15
Software and licences 0 0
Property, plant and equipment 16
Equipment 1 1
Financial assets
Participations in Group companies 17 3,501 2,943
Non-current receivables 18 9 6
Non-current receivables, Group company – 3
Deferred tax assets 14 11 2
Total financial assets 3,521 2,954
Total non-current assets 3,522 2,955
Current assets
Current receivables
Receivables from Group companies 2,431 2,078
Current tax assets 37 23
Other receivables 9 0
Prepaid expenses and accrued income 21 3 4
Total current receivables 2,480 2,105
Cash and cash equivalents 28 0 7
Total current assets 2,480 2,112
TOTAL ASSETS 6 002 5 067
SeK m note31 Dec
201431 Dec
2013
EqUITY AND LIABILITIES
Equity 32
Restricted equity
Share capital 40 40
Statutory reserve 5 5
45 45
Unrestricted equity
Share premium reserve 4 –
Reserve for fair value –32 –
Profit brought forward 1,540 1,348
Net profit for the year 799 474
2,311 1,822
Total equity 2,356 1,867
Untaxed reserves
Tax allocation reserve 388 315
Excess depreciation of equipment 0 0
Total untaxed reserves 388 315
Non-current liabilities
Non-current interest-bearing liabilities 22 808 1,871
Pension obligations 23 10 8
Deferred tax liabilities 14 2 –
Total non-current liabilities 820 1,879
Current liabilities
Current interest-bearing liabilities 22 1,550 282
Accounts payable - trade 2 1
Liabilities to Group companies 816 700
Other current liabilities 48 1
Accrued expenses and deferred income 25 22 22
Total current liabilities 2,438 1,006
TOTAL EqUITY AND LIABILITIES 6,002 5,067
Pledged assets 26 8 6
Contingent liabilities 27 114 112
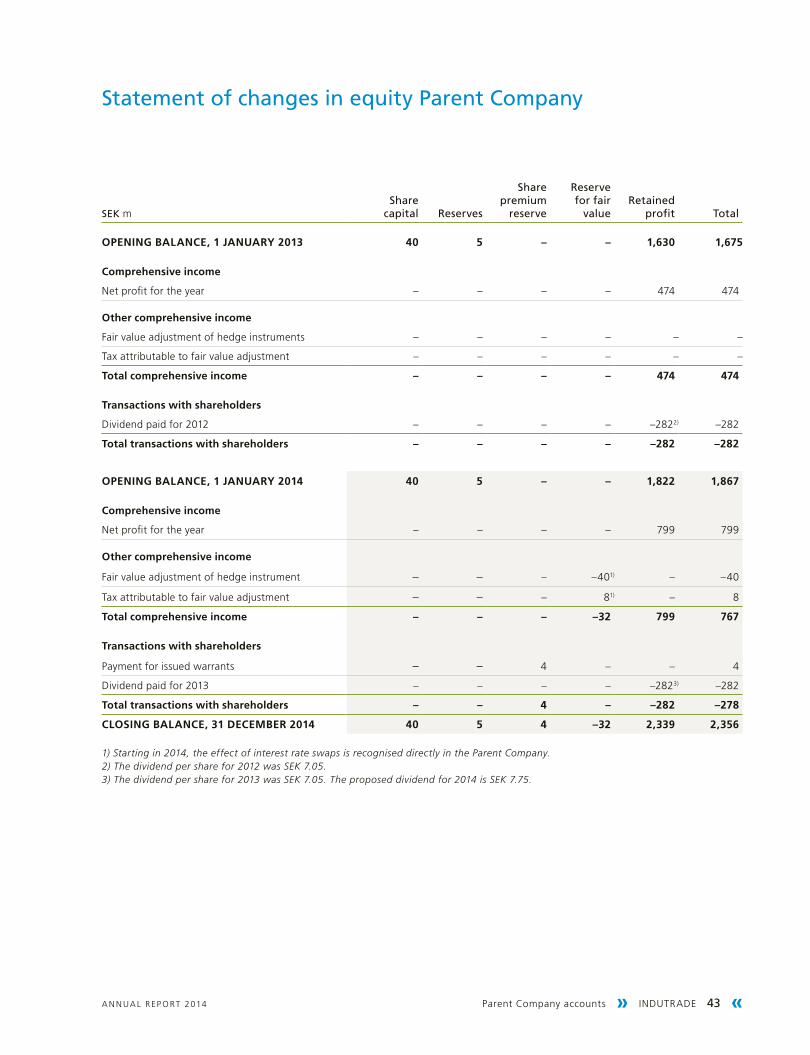
Parent Company accounts » INDUTRADE 43 «A N N UA L R EP O RT 2014
Statement of changes in equity parent Company
SeK mShare
capital reserves
Share premium
reserve
reserve for fair
valueretained
profit total
OPENING BALANCE, 1 jANUARY 2013 40 5 – – 1,630 1,675
Comprehensive income
Net profit for the year – – – – 474 474
Other comprehensive income
Fair value adjustment of hedge instruments – – – – – –
Tax attributable to fair value adjustment – – – – – –
Total comprehensive income – – – – 474 474
Transactions with shareholders
Dividend paid for 2012 – – – – –2822) –282
Total transactions with shareholders – – – – –282 –282
OPENING BALANCE, 1 jANUARY 2014 40 5 – – 1,822 1,867
Comprehensive income
Net profit for the year – – – – 799 799
Other comprehensive income
Fair value adjustment of hedge instrument – – – –401) – –40
Tax attributable to fair value adjustment – – – 81) – 8
Total comprehensive income – – – –32 799 767
Transactions with shareholders
Payment for issued warrants – – 4 – – 4
Dividend paid for 2013 – – – – –2823) –282
Total transactions with shareholders – – 4 – –282 –278
CLOSING BALANCE, 31 DECEMBER 2014 40 5 4 –32 2,339 2,356
1) Starting in 2014, the effect of interest rate swaps is recognised directly in the Parent Company. 2) The dividend per share for 2012 was SEK 7.05.3) The dividend per share for 2013 was SEK 7.05. The proposed dividend for 2014 is SEK 7.75.
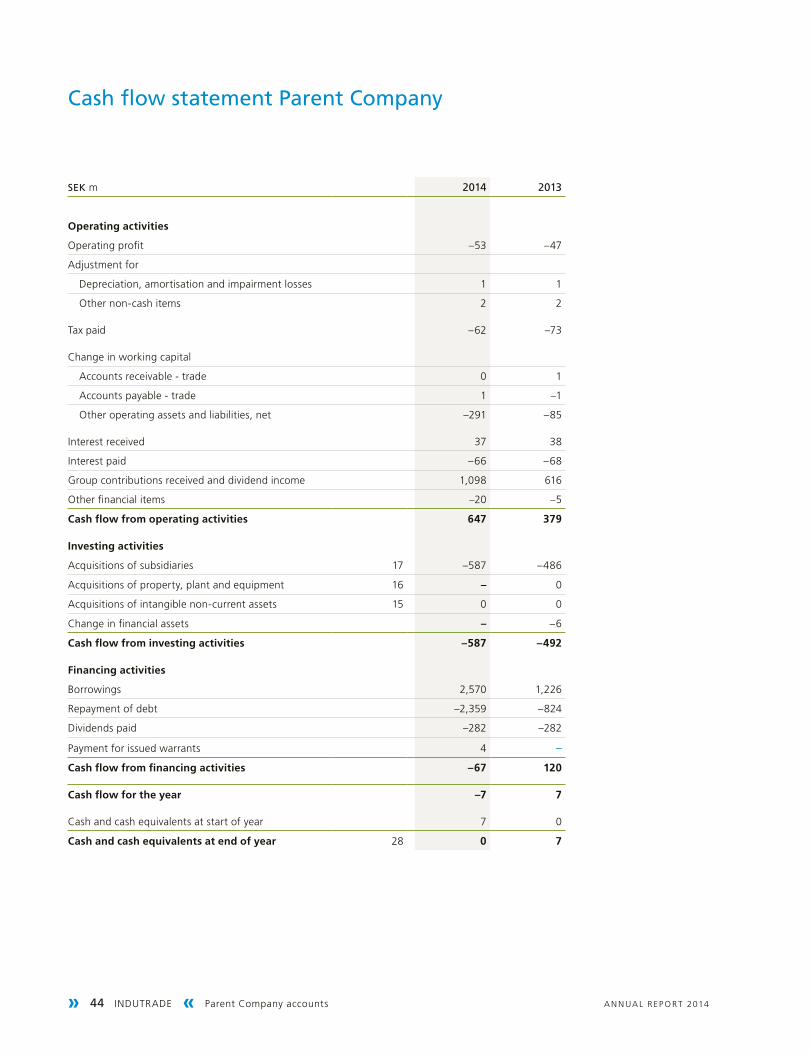
» 44 INDUTRADE « Parent Company accounts A N N UA L R EP O RT 2014
Cash flow statement parent Company
SeK m 2014 2013
Operating activities
Operating profit –53 –47
Adjustment for
Depreciation, amortisation and impairment losses 1 1
Other non-cash items 2 2
Tax paid –62 –73
Change in working capital
Accounts receivable - trade 0 1
Accounts payable - trade 1 –1
Other operating assets and liabilities, net –291 –85
Interest received 37 38
Interest paid –66 –68
Group contributions received and dividend income 1,098 616
Other financial items –20 –5
Cash flow from operating activities 647 379
Investing activities
Acquisitions of subsidiaries 17 –587 –486
Acquisitions of property, plant and equipment 16 – 0
Acquisitions of intangible non-current assets 15 0 0
Change in financial assets – –6
Cash flow from investing activities –587 –492
Financing activities
Borrowings 2,570 1,226
Repayment of debt –2,359 –824
Dividends paid –282 –282
Payment for issued warrants 4 –
Cash flow from financing activities –67 120
Cash flow for the year –7 7
Cash and cash equivalents at start of year 7 0
Cash and cash equivalents at end of year 28 0 7
Notes » INDUTRADE 45 «A N N UA L R EP O RT 2014
notes
Note 1Accounting and valuation principles
General informationThe Indutrade Group markets and sells components, systems and services with a high-tech content to industrial companies in selected niches. Business is conducted through subsidiaries in 26 countries. Indutrade’s shares are listed on Nasdaq Stockholm, and were included on the Mid Cap list through 31 December 2014. Starting on 1 January 2015 the shares are included on the Large Cap list. Through 31 December 2014 the Group was organised in five business areas. On 1 January 2015 the number of business areas was increased to six. Note 3 describes the business area structure through 31 December 2014, with a pro forma presenta-tion for the new business area structure.
The Parent Company is a limited liability company with regis-tered office in Stockholm.
This annual report was approved by the Board of Directors for publication on 20 March 2015. The consolidated and parent com-pany income statements and balance sheets will be presented for adoption by the Annual General Meeting on 29 April 2015.
Basis of preparationThe consolidated accounts of the Indutrade Group have been prepared in accordance with International Financial Report-ing Standards (IFRS) as endorsed by the European Union and in accordance with RFR 1 and the Swedish Annual Accounts Act. Assets and liabilities have been accounted for at historical cost, except for with respect to revaluations of financial assets and liabilities (including derivative instruments) and available-for-sale financial assets, which are measured at fair value through profit or loss.
Preparation of financial statements in accordance with IFRS requires the use of a number of important accounting estima-tions. Further, application of the Company’s accounting principles requires that management makes certain assessments. Areas that involve a high degree of assessment, or areas in which as-sumptions and estimations are of material significance for the consolidated financial statements, are described below in the section “Important estimations and assumptions for accounting purposes”.
Standards, amendments and interpretations that apply as from 1 january 2014There are no new IFRSs or IFRIC pronouncements endorsed by the EU that are applicable for Indutrade or that had a significant impact on the Group’s result of operations and position in 2014.
Standards, amendments and interpretations that apply as from 1 january 2015There are no new IFRSs or IFRIC pronouncements that will have a significant impact on the Group’s result of operations and posi-tion in 2015.
No newly issued IFRSs or interpretations have been applied prospectively.
Amounts stated in the notes are in SEK million unless indicated otherwise.
Other new accounting principles that have been issued, but not taken effectIASB has issued IFRS 9 Financial Instruments, which replaces most of IAS 39 Financial Instruments: Recognition and Measurement (2018) and IFRS 15 Revenue from Contracts with Customers, which is the new standard for revenue recognition (2017). IFRS 15 replaces IAS 18 Revenue and IAS 11 Construction Contracts. No assessment of the effects on the Indutrade Group’s financial statements has been made yet. The standards have not been endorsed yet by the EU.
Basis of consolidationThe consolidated accounts include subsidiaries in which the Group directly or indirectly has control. Subsidiaries are included in the consolidated accounts from the date control is transferred to the Group. They are excluded from the consolidated accounts from the date control ceases.
The purchase method is used for reporting of the Group’s business acquisitions. The purchase price for the acquisition of a subsidiary consists of the fair value of the acquired assets and lia-bilities. The purchase price also includes the fair value of all assets and liabilities that are the result of an agreement on contingent consideration. Transaction costs in connection with acquisitions are recognised directly in profit for the year as other operating expenses. In cases where contingent consideration is remeasured at fair value, this is recognised in operating profit. Identifiable, acquired assets and liabilities taken over in a business acquisition are initially measured at fair value as per the acquisition date.
For each acquisition, the Group determines if all non-control-ling interests in the acquired company are to be stated at fair value or at the non-controlling interest’s proportional share of the acquired company’s net assets.
Goodwill is initially carried at the amount in which the total purchase price and fair value of non-controlling interests exceed the fair value of identifiable, acquired assets and liabilities taken over.
Intra-Group transactions and balance sheet items as well as unrealised gains and losses on transactions between Group companies are eliminated.
The Group treats transactions with non-controlling interests as transactions with the Group’s shareholders. Transactions with non-controlling interests are reported in equity.
ClassificationNon-current assets and non-current liabilities consist essentially of amounts that are expected to be recovered or paid after more than 12 months from the balance sheet date. Current assets and current liabilities consist essentially of amounts that are expected to be recovered or paid within 12 months from the balance sheet date.
Translation of foreign currencyItems that are included in the financial statements for the Group’s various units have been valued in the currency that is used in the economic environment in which the respective company mainly operates (the functional currency). In the consolidated accounts, Swedish kronor (SEK) is used, which is the Parent Company’s functional and reporting currency. The earnings and financial position of all Group companies that have a different functional currency than their reporting currency are translated to the Group’s reporting currency in accordance with the following:
– assets and liabilities on each of the subsidiaries’ balance sheets are translated at the exchange rate in effect on the balance sheet date,
– income and expenses in each of the income statements are translated at the average exchange rate for the year, and
– all exchange rate differences that arise are reported in other comprehensive income.
» 46 INDUTRADE « Notes A N N UA L R EP O RT 2014
Goodwill and fair value adjustments that arise in connection with the acquisition of a foreign business are treated as assets and liabilities in the acquired business and are translated at the exchange rate in effect on the balance sheet date.
Transactions and balance sheet items in foreign currencyTransactions in foreign currencies are translated to the functional currency at the exchange rate in effect on the transaction date. Exchange rate gains and losses that arise upon payment in such transactions and when translating monetary assets and liabilities in foreign currencies at the exchange rate on the balance sheet date are recognised in profit or loss. An exception to this rule is applied for transactions that constitute hedges that meet the conditions for hedge accounting of cash flows or of net invest-ments, for which gains/losses are recognised in other comprehen-sive income.
Exchange rate differences that arise upon translation or recognition of operating assets/liabilities are reported as other income/expenses, while exchange rate differences that arise upon payment of financial assets/liabilities are reported as financial income/expenses.
Intangible non-current assetsGoodwillGoodwill consists of the amount by which the cost exceeds the fair value of the Group’s share of the acquired subsidiary’s iden-tifiable net assets at the time of acquisition. Goodwill is tested at least annually for impairment and is carried at cost less accumu-lated impairment losses. Gains or losses on the disposal of an entity include the remaining carrying amount of goodwill relating to the entity sold. Goodwill is normally allocated at the segment level for impairment testing. For impairment testing during the year, see “Impairment testing of non-financial assets” below.
Agencies, trademarks, customer relationships, etc.The Group’s starting point with respect to acquisitions is that agencies, customer relationships, etc., and the item “Software, licences, etc.” have a limited useful life and are carried at cost less accumulated amortisation. Trademarks are possible to identify in connection with major company acquisitions. Trademarks that have been capitalised to date have been judged to have an in-definite useful life, and no amortisation is calculated. Instead, an impairment test is conducted at least annually, as for goodwill.
In connection with nearly all company acquisitions completed by Indutrade, a value is determined for purchased agencies and the customer relationships that are included as part of the acquisition. Since most of Indutrade’s acquisitions are small, it is not possible to itemise the intangible assets. For small acquisi-tions, the cost of customer lists and agencies is normally valued at between a half year’s and one year’s gross margin. According to IFRS, supplementary disclosures are to be made for each sig-nificant intangible asset. Since the Indutrade Group’s intangible assets consist for the most part of many small sub-items, where none constitutes an item with material impact on the Group’s result or position, no supplementary disclosures are made for these smaller intangible non-current assets.
Amortisation is calculated on a straight-line basis to allocate the cost of these assets over their estimated useful lives. The following amortisation schedules are used:
Agencies, customer relationships, etc. 5–20 yearsTrademarks –Software, licences, etc. 5–10 yearsOther intangible assets 5–20 years
Property, plant and equipmentProperty, plant and equipment are stated at cost less accumu-lated depreciation according to plan. Cost includes charges that are directly attributable to acquisition of the asset. Additional charges are added to the asset’s carrying amount or are reported as a separate asset, depending on which is suitable, only when it is probable that the future economic benefit associated with the asset will accrue to the Group and the asset’s cost can be meas-ured in a reliable manner. All other forms of repairs and mainte-nance are reported as costs in the income statement in the period in which they were incurred.
Property, plant and equipment are depreciated over their esti-mated useful lives. The following depreciation schedules are used:
Buildings 25–40 yearsMachinery 5–10 yearsEquipment 3–10 years
No depreciation is calculated for land.The assets’ residual value and useful lives are tested for impair-
ment at the end of every reporting period and are adjusted as necessary. Gains and losses on disposals of non-current assets are reported in the function in which depreciation was reported prior to their disposal or, alternatively, in other operating income and expenses.
Impairment testing of non-financial assetsGoodwill, land and trademarks are judged to have an indefinite useful life and are not amortised, but are instead tested at least annually for impairment. Impairment is judged on the basis of a decline in value whenever events or changes in conditions indicate that the carrying amount may not be recoverable. Impairment is recognised in the amount in which the asset’s carrying amount exceeds its recoverable value. The recoverable value is the higher of the asset’s fair value less selling costs and its value in use. When calculating value in use, future cash flows are discounted with a discount factor, which takes into account the risk free interest rate and the risk connected to the specific asset. When determin-ing any need to recognise impairment, assets are grouped at the lowest levels in which there are separate, identifiable cash flows (cash-generating units). For Indutrade this entails that such determination is normally done at the segment level, which corresponds to Indutrade’s business areas. For assets other than financial assets and goodwill for which an impairment loss has previously been recognised, a test is performed as per each bal-ance sheet date to determine if any reversals should be made.
InventoriesInventories are stated at the lower of their cost and net realisable value. Cost is calculated using the first-in first-out (FIFO) method. The cost of finished goods and work in progress consists of raw materials, direct wages, other direct costs and related indirect manufacturing costs (based on normal manufacturing capacity).
Net realisable value is the estimated selling price in the normal course of business, less relevant variable selling costs.
Financial instrumentsThe Group mainly has the following financial instruments: trade accounts receivable, cash and cash equivalents, trade accounts payable, borrowings, contingent consideration and derivative instruments.
Note 1Continued
Notes » INDUTRADE 47 «A N N UA L R EP O RT 2014
Trade accounts receivableTrade accounts receivable are stated initially at fair value and thereafter in the amount that is expected to be received after individual assessment. A provision for decreases in the value of trade accounts receivable is made when there is objective evi-dence that the Group will not be able to receive all amounts due according to the original terms of the receivable. Testing is con-ducted locally in the respective subsidiaries. The asset’s carrying amount is reduced by use of a value impairment account, and the loss is recognised in the income statement under the item “Sell-ing costs”. Recoveries of previous impairment losses are credited to selling costs in the income statement. Since the Group consists of more than 180 operating companies, the item trade accounts receivable consists of many smaller amounts. The subsidiaries have close contact with their customers, and thus valuation of trade accounts receivable rarely poses any difficulty. The risk is lower, and the subsidiaries can act quickly if a customer does not pay in accordance with the terms and conditions. See also note 2. Since Indutrade’s trade accounts receivable normally have a remaining term of less than six months, the carrying amount is considered to reflect the fair value.
Cash and cash equivalentsCash and cash equivalents include short-term investments with maturities of less than three months, and cash at bank and in hand.
Drawn bank overdraft facilities are stated on the balance sheet under the item “Current interest-bearing liabilities”.
Trade accounts payableTrade accounts payable are initially stated at fair value and there-after at amortised cost using the effective interest method. Since Indutrade’s trade accounts payable normally have a remaining term of less than six months, the carrying amount is considered to reflect fair value.
BorrowingsLoans are stated initially at fair value, net after deducting transac-tion costs. They are thereafter stated at amortised cost, and any difference between the amount received (net after transaction costs) and the repayment amount is stated in the income state-ment allocated over the duration of the loans using the effective interest method. Borrowings are classified as current liabilities unless the Group has an unconditional right to defer repayment by at least 12 months after the balance sheet date.
Contingent considerationIndutrade normally uses an acquisition structure consisting of a base level of consideration and contingent consideration (earn-out payment). Contingent consideration is normally based on the projected earnings of the acquired company in the years immediately ahead. As per the date of the transaction, the contingent consideration is measured at fair value by estimating the present value of the likely outcome. The interest expense is thereafter allocated over the period up until the date of payment. Contingent consideration is remeasured at every reporting date. Excess or deficit amounts are booked as an expense or revenue in the income statement under other operating income/expense. Contingent consideration is reported as current if it is payable within 12 months from the balance sheet date.
Derivative instrumentsDerivative instruments are stated at fair value on the balance sheet as per the contract date, both initially and for subsequent
revaluations. The method for reporting the gain or loss that arises in connection with revaluation depends on whether the derivative instrument has been identified as a hedge instrument and, if such is the case, the nature of the item that has been hedged. The Group identifies certain derivatives as a hedge of a particular risk that is coupled to a reported asset or liability, or a very probable, prognosticated transaction (cash flow hedge). See further under Cash flow hedging below.
The Group’s other derivatives consist of forward contracts. Realised and unrealised gains and losses arising from changes in fair value are included in the income statement during the period in which they arise. Gains and losses arising from forward cover of payments in foreign currencies are posted as other operating income/expense, and the earnings effect of forward contracts used to hedge loans is reported among financial income and expenses.
Cash flow hedgingThe effective portion of changes in the fair value of a deriva-tive instrument that is identified as a cash flow hedge and that meets the conditions for hedge accounting is reported in other comprehensive income. Changes in the value of the derivative are recognised on the same line and at the same point in time in the income statement as the hedged item.
Indutrade uses interest rate swaps to some extent to hedge borrowings at variable interest rates. The gain or loss that is attributable to the effective portion is recognised in other com-prehensive income, while the ineffective portion is recognised im-mediately in the income statement in the item “Interest expense”. Accumulated amounts in equity are restated in the income statement in the periods in which the hedged item affects earn-ings (e.g., when the prognosticated, hedged interest payment is made). The gain or loss that is attributable to the effective por-tion of interest rate swaps is reported as interest expense in the income statement.
When a prognosticated transaction is no longer expected to take place, the accumulated gain or loss that has been reported in the hedging reserve through other comprehensive income is immediately transferred to the income statement.
Available-for-sale financial assetsAvailable-for-sale financial assets are non-derivative assets that are designated as available for sale or have not been classified in any other category. These are included in non-current assets unless the Group has the intention of selling the asset within 12 months after the balance sheet date. The Group has only negligi-ble holdings of such assets. The difference between the carrying amount and fair value is considered to be immaterial.
Financial income and expensesFinancial income consists of interest income on invested funds, dividends, and gains on hedge instruments recognised in profit for the year.
Financial expenses consist of interest expenses on loans and pension liabilities, effects of the dissolution of discounted con-tingent consideration, losses on hedge instruments recognised in profit for the year, and bank charges.
Interest income and expenses are reported in accordance with the effective interest method. Dividend income is recognised when the right to payment has been determined.
ProvisionsA provision is reported on the balance sheet when the Group has a formal or constructive obligation as a result of an event that has occurred and it is probable that an outflow of resources will
Note 1Continued
» 48 INDUTRADE « Notes A N N UA L R EP O RT 2014
be required to settle the obligation, and the amount has been calculated in a reliable manner. Future obligations for guarantee commitments are based on out-lays for similar costs during the financial year or calculated costs for the respective obligations.
Contingent liabilitiesA contingent liability is recognised when a possible obligation arises from past events and whose existence will be confirmed only by the occurrence of one or more uncertain future events, or when an obligation currently exists that is not reported as a liability or provision because it is not probable that an outflow or resources will be required to settle the obligation.
LeasesIAS 17 defines a lease as an agreement whereby a lessor conveys to the lessee in return for a payment or series of payments the right to use an asset for an agreed period of time.
The Group leases certain non-current assets, mainly premises and cars.
Leases in which the Group in all essential respects accepts the financial risks and benefits associated with ownership are clas-sified as finance leases. Otherwise, the lease is classified as an operating lease.
At the start of the lease period, finance leases are carried on the balance sheet at the lower of the leased asset’s fair value and the present value of the minimum lease payments. Every lease payment is allocated between amortisation of the liability and financial expenses to achieve a fixed rate of interest for the reported liability. Corresponding payment obligations, after deducting financial expenses, are reported on the balance sheet under long-term and short-term borrowings. Non-current assets held under finance leases are depreciated during the shorter of the asset’s useful life or lease period.
Assets leased under operating leases are not carried as assets on the consolidated balance sheet, and operating leases do not give rise to any liability. Lease payments are expensed on a linear basis over the lease period as operating expenses.
Segment reportingThe Group applies IFRS 8. Segment reporting is based on internal reporting to the chief operating decision maker. For Indutrade, this means the Group CEO and the key ratios that are presented for the business areas.
TaxesIncome tax consists of current tax and deferred tax. Income taxes are reported in the income statement, except in cases where the tax is attributable to items that are reported in other comprehen-sive income.
Current tax is tax that is to be paid or received in the current year using the tax rates that apply on at the balance sheet date; this also includes adjustments of current tax attributable to earlier periods. Tax is calculated according to the current tax rate in the respective countries.
Deferred taxes attributable to temporary differences between the book value and the taxable value of assets and liabilities are reported in full in the consolidated accounts, while the Parent Company still reports the difference pertaining to machinery and equipment as an untaxed reserve. However, deferred tax liability is not reported if it arises as a result of initial recognition of good-
will. Valuation of deferred tax is based on how the under lying asset or liability is expected to be realised or settled. Deferred tax is calculated using the tax rates that apply on at the balance sheet date or announced as per the balance sheet date and which are expected to apply when the deferred tax asset in question is realised or the tax liability is settled. Deferred tax assets attribut-able to deductible, temporary differences and unutilised tax-loss carryforwards are reported to the extent that it is probable that they will be utilised in the foreseeable future.
Employee benefitsPension obligationsThe Group has both defined benefit and defined contribution pension plans. A defined benefit pension plan is a pension plan that specifies a level of post-retirement benefits. The Group’s defined benefit plans are both funded and unfunded. For funded plans, the assets have been detached (plan assets). A defined contribution pension plan is a pension plan to which the Group makes set contributions to a separate legal entity.
The liability carried on the balance sheet pertaining to defined benefit pension plans consists of the present value of the defined benefit obligations on the balance sheet date, less the fair value of the plan assets. The defined benefit obligation is calculated annually by independent actuaries using the projected unit credit method. The present value of the defined benefit obligations is calculated by discounting the anticipated future cash flows using the rate of interest for high quality corporate bonds in countries in which such a market exists or, alternatively, mortgage bonds with maturities that correspond to the pension obligations and currency.
Actuarial gains and losses arising from experience-based adjustments and changes in actuarial assumptions are recognised directly in other comprehensive income after taking into account payroll tax and deferred tax.
Pension costs relating to service in current and past periods are recognised directly in profit or loss.
For defined contribution pension plans, the Group pays contributions to publicly or privately administered pension plans on a statutory, contractual or voluntary basis. The Group has no further payment obligations once the contributions have been paid. Earnings are charged in pace with employees’ earnings of the benefits.
Some of the Group’s defined benefit pension obligations have been financed through payment of premiums to the insurance company Alecta. Since relevant information about these cannot be obtained from Alecta, these obligations are reported as a defined contribution plan.
Termination benefitsTermination benefits are payable when employment is terminated before the normal retirement date or when an employee accepts voluntary departure in exchange for such benefits. The Group re-ports severance pay when it is demonstrably committed to either terminating the employment of current employees according to a detailed formal plan without the possibility of withdrawal, or to providing termination benefits as a result of an offer made to encourage voluntary departures.
Profit-sharing and bonus plansThe Parent Company and most of the subsidiaries have bonus or profit-sharing systems based on the earnings performance of each unit. The Group reports a liability and an expense for these programmes when it has a formal or constructive obligation to make such payments in exchange for services performed by employees and the amount of such obligations can be calculated in a reliable manner. Reporting is done in the period the cost pertains to.
Note 1Continued

Notes » INDUTRADE 49 «A N N UA L R EP O RT 2014
Incentive programme, LTI 2014In April 2014 the Annual General Meeting of Indutrade AB resolved to implement an incentive programme, LTI 2014, comprising a combined maximum of 460,000 warrants in two series, directed at senior executives and other key persons in the Indutrade Group.
A total of 285,000 warrants have been acquired in the two series. A market price has been paid for the warrants – SEK 15.20 per warrant for Series I, and SEK 11.60 per warrant for Series II. A total of SEK 4,233,000 has been paid in. Shares can be sub-scribed during specially prescribed subscription periods through Friday, 18 May 2018.
A cash subsidy corresponding to 120% of the price the par-ticipants paid for the warrants will be paid out on two occasions under certain conditions. The cost for the subsidy is recognised in pace with its earning by the participants.
For further details about the incentive programme, see note 7.
Development costsThe Group conducts certain product-specific development activi-ties. Outlays for development are reported as development costs in the income statement as they arise. If the requirements in IAS 38 for internally prepared intangible assets are fulfilled, then the development that has been conducted is capitalised and is included in the item “Other intangible assets”. The requirements of this standard are that the development costs pertain to identi-fiable, unique assets that are controlled by the Group. Capitalisa-tion is done if it is technically possible to complete preparation of the asset and the intention is to use or sell the asset, that it can be shown that future economic benefit is probable, and that the costs can be calculated in a reliable manner.
Revenue recognitionThe Group recognises revenue when its amount can be measured in a reliable manner and it is probable that future economic ben-efit will accrue to the Company. Revenue is recognised excluding value added tax and discounts. The Group’s sales consist in all essential respects of sales of products. Revenue from sales of products is recognised when ownership, i.e., the benefits and risks, has been transferred to the buyer. The date on which owner ship is transferred is regulated in most sales made by the Group in written agreements with the buyer. For the small por-tion of sales that pertain to sales of services, revenue is recog-nised when the services are rendered.
Interest income is recognised taking into account accrued interest on the balance sheet date. Dividend income is recognised when the right to receive payment has been determined.
Important estimations and assumptions for accounting purposesThe Group makes estimations and assumptions about the future. By definition, the estimations for accounting purposes that are a consequence of these rarely match the actual outcome. This ap-plies primarily for the need to recognise impairment of goodwill and defined benefit pension obligations. Assumptions and esti-mations are evaluated continuously and are based on historical experience and anticipations of future events that are considered to be reasonable under prevailing conditions.
Impairment testing of non-financial assetsEach year, non-financial assets are tested for impairment. The re-coverable value for cash-generating units has been determined by
calculating value in use. For these calculations, certain assumptions must be made. These are shown in note 15, Intangible assets.
Valuation of pension obligationsIn calculating the liability on the balance sheet pertaining to de-fined benefit pension plans, various assumptions have been made, as described in note 23.
The discount rate for defined benefit pension plans in the Neth-erlands, the UK and Switzerland has been determined through reference to the market rate of return for high quality corporate bonds. For calculations of defined benefit pension obligations in Sweden, the discount rate has been set in reference to the interest rate for mortgage bonds with a duration that corresponds to the average duration of the obligations. Indutrade has determined that a deep market for high quality corporate bonds exists in Sweden. Indutrade is of the opinion that Swedish mortgage bonds issued by Swedish corporations in the financial sector are covered by the concept of corporate bonds. Based on the outstanding volume, turnover and number of issues in the mortgage bond market, it has been determined that a deep market exists for these bonds. Consequently, mortgage bonds have been used as a basis for the interest rate.
Parent CompanyThe Parent Company accounts have been prepared in accordance with the Swedish Annual Accounts Act and RFR 2, Reporting for Legal Entities. According to RFR 2, in the annual report for a legal entity, the Parent Company shall apply all IFRSs and statements endorsed by the EU as far as possible within the confines of the Annual Accounts Act and taking into account the connection between reporting and taxation. The recommendations indicate which exceptions and amendments are to be applied with respect to IFRS.
Participations in Group companies are reported in the Par-ent Company using the cost method. In the Parent Company, a change in the liability for contingent consideration affects the value of participations in subsidiaries. Contingent consideration is reported in the Parent Company when it is certain or probable that the obligation will arise.
Untaxed reserves are reported in the Parent Company including deferred tax liabilities and not as in the Group (broken down into deferred tax liabilities and equity).
Group contributions are reported gross as appropriations in ac-cordance with the alternative rule in RFR 2.
Note 2Risks and risk management
Market risksAt year-end 2014 the Indutrade Group conducted business in 26 countries. This geographic spread along with a large number of customers and products provides relatively limited risk exposure and sensitivity to economic fluctuations. The Group’s operations are conducted with two main focuses: trading companies with industrial technology sales, and companies that manufacture their own products.
For the companies involved in trading, there is the risk of an agency relationship being terminated. This could occur, for example, in connection with a structural change at the supplier level. This is a natural occurrence in an agency’s operations, and the organisation has experience in dealing with this. Indutrade has more than 100 trading companies with a few main agencies per company, complemented with a number of smaller agencies. Because of the large number of agencies, no individual agency ac-
Note 1Continued

» 50 INDUTRADE « Notes A N N UA L R EP O RT 2014
counts for a decisive economic risk from the Group’s perspective.The risk associated with major customers deciding to bypass
the agency level and trade directly with producers is limited, since customers place great value on the technical expertise, availabil-ity and delivery reliability provided by an inventory-holding local technology sales company. Indutrade’s companies also provide aftermarket services, such as servicing.
Financial risksIn the course of its business, the Indutrade Group is exposed to various types of financial risk:– Funding risk– Interest rate risk– Currency risk– Customer and counterparty risk
Finance policyIndutrade’s board of directors sets the Company’s finance policy on a yearly basis. This policy establishes the Company’s financial strategy and internal delegation of responsibilities. The policy also governs such matters as how financing, liquidity manage-ment and currency risk management are to be handled within the Group as well as any restrictions that should be considered with respect to counterparties.
Funding riskBy funding risk is meant the risk that funding of the Group’s capital requirement will be hampered or become more costly. This is mitigated as far as possible by ensuring that the Company has a maturity structure that creates conditions to take necessary alternative actions to raise capital should this be necessary.
Indutrade takes a central approach to the Group’s funding. In principle, all external funding is conducted by the Parent Company, which then funds the Group’s subsidiaries, both in and outside Sweden, in local currency. Cash pools are established in Sweden, Finland, Norway, Denmark, Germany, the Netherlands and the UK.
During the first quarter of 2014 Indutrade established a com-mercial paper programme with a framework of SEK 1,500 million.
At year-end 2014 the Parent Company had external interest-bearing liabilities worth SEK 2,358 million (2,153). The corre-sponding amount for the Group was SEK 2,618 million (2,415). The Group’s interest-bearing net debt was SEK 2,494 million at year-end, compared with SEK 2,321 million a year earlier.
At year-end 2014 the Group had SEK 357 million (261) in cash and cash equivalents and SEK 1,858 million (1,233) in unutilised overdraft facilities. Of the Group’s interest-bearing loans, 34% of the total amount falls due for payment after 31 December 2015. For a more detailed maturity analysis, see the description of the Group’s borrowings in note 22.
The Group strives to strike a reasonable balance between eq-uity, debt financing and liquidity, to enable the Group to secure funding at a reasonable capital cost. The Group’s goal is that the net debt/equity ratio, defined as interest-bearing liabilities less cash and cash equivalents in relation to equity, normally should not exceed 100%. At year-end the debt/equity ratio was 79% (88%).
Interest rate riskBy interest rate risk is meant the risk that unfavourable changes in interest rates will have an excessive impact on the Group’s net fi-
nancial items and earnings. At year-end 2014, as in the preceding year, most of the Group’s loans carried variable rates of interest. The Parent Company has entered into contracts to hedge SEK 1,200 million of its borrowing at variable interest against fixed interest for five years. Of this amount, SEK 500 million is due in 2015, SEK 300 million is due in 2016, and SEK 400 million is due in 2018. The difference between the fixed and variable interest is expensed in the income statement. During the year, valuation of interest rate swaps resulted in a loss for the group of SEK –16 mil-lion (gain of 2) before tax, which is recognised in other compre-hensive income.
Based on the loan structure at year-end, a 1% rise in the inter-est rate on an annualised basis would result in a higher interest expense of approximately SEK 23 million (21), without taking into account the loans’ fixed interest periods. Taking into account the existing fixed interest periods, the effect would be approximately SEK 11 million (9). Profit after tax would be affected by SEK –9 million (–7).
The table below shows the remaining contractual terms of loans until maturity, including interest on loans, leasing com-mitments and contingent consideration. Trade accounts payable normally have a term of less than six months.
For information on the utilisation of bank overdraft facilities and granted credit limits, see note 22.
Groupparent
Company
Maturity dates for loans, leasing commitments and contingent earn-out pay-ments: 2014 2013 2014 2013
Maturity 2014 – 433 – 329
Maturity 2015 1,663 1,083 1,574 1,038
Maturity 2016 703 668 619 607
Maturity 2017 48 105 4 87
Maturity 2018 219 219 202 203
Maturity 2019 or later 47 43 – –
total borrowings incl. interest, SeK million 2,680 2,551 2,399 2,264
Currency riskBy currency risk is meant the risk of unfavourable changes in exchange rates affecting consolidated earnings and equity measured in SEK:– Transaction exposure arises as a result of the Group having
incoming and outgoing payments in foreign currencies.– Translation exposure arises as a result of the Group, via its for-
eign subsidiaries, having net investments in foreign currencies.
The Indutrade Group’s transaction exposure arises when subsidi-aries import products for sale in the domestic market and/or sell products in foreign currency. Exchange rate effects are eliminated as far as possible by using currency clauses in customer contracts and by buying and selling in the same currency. In certain cases, forward contracts are used. Indutrade therefore considers its transaction exposure to be limited.
The consolidated income statement includes SEK –2 million (–2), net, in exchange rate differences in operating profit and SEK –1 million (–4), net, in financial items.
With respect to transaction exposure, at 31 December 2014 Indutrade had net exposure of SEK 81 million in foreign currency (–47). See the breakdown of currencies in the following table.
Note 2Continued
Notes » INDUTRADE 51 «A N N UA L R EP O RT 2014
Net exposure at year-end
Group
2014 2013
in millionslocal
currency SeKlocal
currency SeK
USD 14.0 109 1.7 11
EUR –2.8 –26 –5.1 –46
DKK 7.0 9 7.2 9
GBP –0.6 –7 –1.5 –16
CHF –0.7 –6 –0.9 –7
Other currencies 2 2
At year-end the Group had outstanding forward contracts worth SEK 626 million (263) to reduce the currency risk associated with future flows, of which SEK 145 million (40) pertains to EUR, and SEK 481 million (223) pertains to USD. The contracts in EUR ex-pire within 12 months from year-end, while the USD contracts ex-pire within 15 months. Market valuation of outstanding forward contracts as per 31 December 2014 resulted in an unrealised loss of SEK –11 million (gain of 1) before tax, which is recognised in other comprehensive income.
In addition, the Parent Company has hedged outstanding receivables from and liabilities to subsidiaries, and anticipated dividends, as shown in the table below.
Forward contracts
parent Company
SeK million 2014 2013
EUR 313 154
GBP 87 24
CHF 19 55
DKK 14 22
NOK 14 17
PLN 11 6
RUB 4 –
SGD – 2
All contracts have a term of less than 15 months.
The Group is exposed to a translation risk associated with transla-tion of the accounts of foreign subsidiaries to the Group currency, SEK. This type of currency risk is not hedged. Net investments in foreign subsidiaries at year-end are shown in the following table. Indutrade also had net investments in other currencies in both 2014 and 2013, but the amounts were insignificant.
Net investments in foreign subsidiaries
Group
2014 2013
net exposure in millions
local currency SeK
local currency SeK
EUR 124 1,179 96 862
GBP 43 516 13 141
CHF 30 237 34 251
NOK 151 159 67 71
DKK 56 72 70 83
Indutrade estimates that the Company’s translation exposure entails that a 1% change in the value of SEK vs. other currencies would result in a yearly positive/negative effect (in the event of a weakening/strengthening of SEK) corresponding to approximately SEK 65 million (54) on net sales and approximately SEK 5 million (5) on net profit. The effect on equity of a 1% change would be SEK 23 million (16).
Customer and counterparty risksIn the treasury management activities, credit risks arise in connec-tion with investments of cash and cash equivalents, and counter-party risks arise in connection with the use of forward contracts. These risks are limited by working with counterparties that have been approved in accordance with the guidelines stipulated in the finance policy.
The risk of the Group’s customers failing to meet their ob-ligations, i.e., of payment not being received from customers, constitutes a customer credit risk. Assessment of credit risk in commercial transactions is handled by the respective subsidiaries. Indutrade’s exposure to individual customers is small, and the risk spread is considered to be favourable. No single customer accounts for more than 3% (3%) of consolidated sales. The Indutrade Group does business in many countries, which entails a spread of credit risk exposure over several geographic areas. For information on sales and profit per geographic area, see note 3.
For information on age analysis, provisions for impaired trade accounts receivable and customer losses, see note 20.
Calculation of fair valueThe table below shows financial instruments at fair value, based on the classification of the fair value hierarchy. The various levels are defined as follows:1. Quoted prices (unadjusted) in active markets for identical
assets and liabilities (level 1)2. Other observable data for assets and liabilities than quoted
prices included in level 1, either directly (i.e., through price list-ings) or indirectly (i.e., stemming from price listings) (level 2)
3. Data for the asset or liability that is not based on observable market data (i.e., non-observable market data) (level 3)
Note 2Continued
» 52 INDUTRADE « Notes A N N UA L R EP O RT 2014
Note 3 Segment reporting
Through 31 December 2014 the Group was organised in five business areas: Engineering & Equipment, Flow Technology, Fluids & Mechanical Solutions, Industrial Components and Special Products, which constituted the Group’s operating segments. The Group’s business areas conduct business primarily in the Nordic countries and in central and northern Europe.
Engineering & Equipment’s operations involve sales of compo-nents as well as customisation, combinations and installations of products from various suppliers. Business is conducted mainly in Finland.
The Flow Technology business area offers components and sys-tems for controlling, measuring, monitoring and regulating flows. The business area includes companies that specialise in various areas of industrial flow technology.
The Fluids & Mechanical Solutions business area offers hydrau-lic and mechanical components to industries in the Nordic and Baltic countries. Important product areas are filters, hydraulics, tools & transmission, industrial springs, valves, compressors, product labelling and construction plastics.
The Industrial Components business area offers a wide range of technically advanced components and systems for produc-tion and maintenance, and medical technology equipment. The products consist mainly of consumables.
The Special Products business area offers specially manufactured niche products, design solutions, aftermarket service and assem-bly, and special processing. The business area includes companies that conduct a considerable amount of own manufacturing. It is also the Indutrade business area with the highest share of propri-etary products.
According to IFRS, the part of operations that does not constitute its own operating segment is to be called “Other”. At Indutrade, only the Parent Company is included in the segment called “Other”. Indutrade AB lacks a major revenue source, which is why the Parent Company does not constitute its own operating segment.
The operating segments are followed up through “Net sales”, which include both external and internal sales. However, the scope of internal sales between the subsidiaries is very limited, which is shown in the eliminations column in the table below.
The earnings metric that is followed up in Indutrade is EBITA. The table below also shows Profit before tax.
The Flow Technology business area incurred nonrecurring expenses of SEK 88 million as a result of the decision on a new long-term strategy for a group of companies within the business area. In the Special Products business area, contingent earn-out payments have been restated, resulting in recognised revenue of
The Group’s assets and liabilities at fair value as per 31 December 2014
level 1 level 2 level 3 total
assets
Available-for-sale financial assets – – 4 4
Derivative instruments held for hedging purposes – 14 – 14
liabilities
Derivative instruments held for hedging purposes – 66 – 66
Contingent earn-out payments – – 241 241
The Group’s assets and liabilities at fair value as per 31 December 2013
level 1 level 2 level 3 total
assets
Available-for-sale financial assets – – 7 7
Derivative instruments held for hedging purposes – 3 – 3
liabilities
Derivative instruments held for hedging purposes – 27 – 27
Contingent earn-out payments – – 268 268
Derivative instruments consist of currency forward contracts and interest rate swaps. No transfers were made between level 2 and level 3 during the year. Assets in level 3 consist essentially of holdings of shares and participations in unlisted companies. Fair value is considered to be equal to cost. For further information, see note 17. Contingent earn-out payments have been discounted to present value using an interest rate that is judged to be in line with the market rate at the time of acquisition. Adjustments for changes in market interest rates are not made on a regular basis, as this effect is considered to be immaterial. Essentially all long- and short-term loans carry variable interest rates, which is why fair value is equal to the carrying amount. For further information about contingent earn-out payments and loans, see note 22. For the Group’s other financial assets and liabilities, such as trade accounts receivable, cash and cash equivalents, and trade ac-counts payable, fair value is estimated to be equal to the carrying amount.
Contingent earn-out payments
2014 2013
Opening book value 268 370
Acquisitions during the year 115 98
Reversed via income statement –94 –89
Earn-out payments –68 –128
Interest expense 4 14
Exchange rate differences 16 3
Closing book value 241 268
Note 2Continued
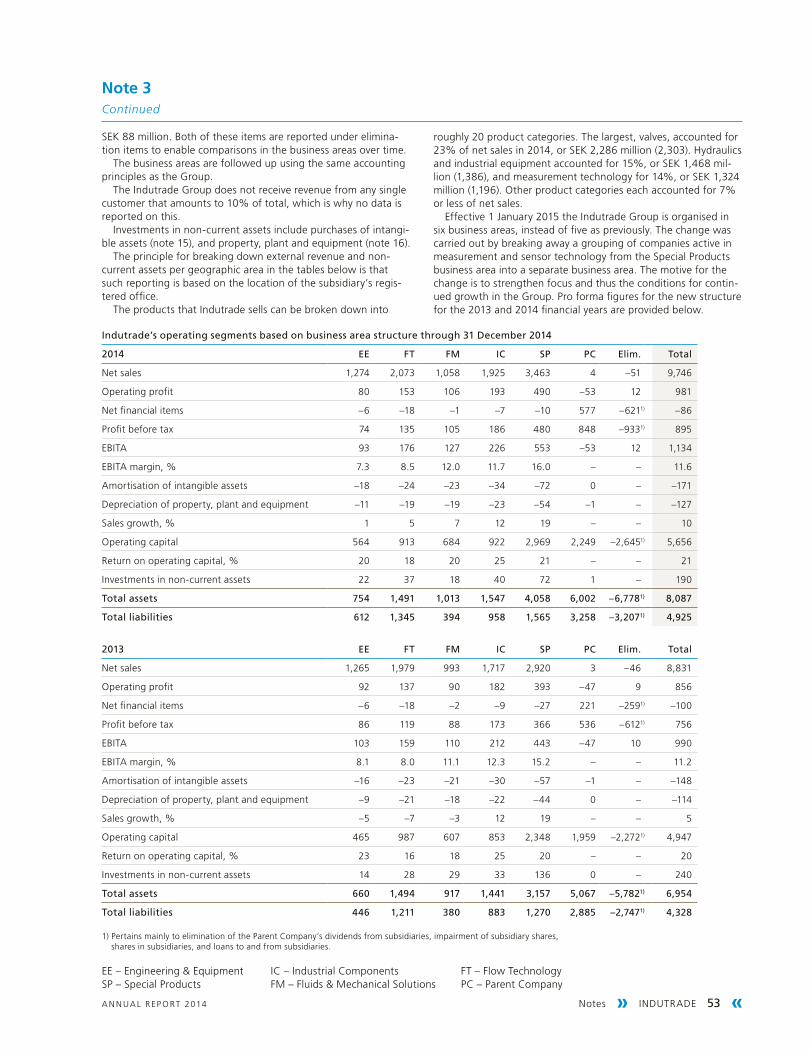
Notes » INDUTRADE 53 «A N N UA L R EP O RT 2014
Indutrade’s operating segments based on business area structure through 31 December 2014
2014 ee Ft FM IC Sp pC elim. total
Net sales 1,274 2,073 1,058 1,925 3,463 4 –51 9,746
Operating profit 80 153 106 193 490 –53 12 981
Net financial items –6 –18 –1 –7 –10 577 –6211) –86
Profit before tax 74 135 105 186 480 848 –9331) 895
EBITA 93 176 127 226 553 –53 12 1,134
EBITA margin, % 7.3 8.5 12.0 11.7 16.0 – – 11.6
Amortisation of intangible assets –18 –24 –23 –34 –72 0 – –171
Depreciation of property, plant and equipment –11 –19 –19 –23 –54 –1 – –127
Sales growth, % 1 5 7 12 19 – – 10
Operating capital 564 913 684 922 2,969 2,249 –2,6451) 5,656
Return on operating capital, % 20 18 20 25 21 – – 21
Investments in non-current assets 22 37 18 40 72 1 – 190
total assets 754 1,491 1,013 1,547 4,058 6,002 –6,7781) 8,087
total liabilities 612 1,345 394 958 1,565 3,258 –3,2071) 4,925
2013 ee Ft FM IC Sp pC elim. total
Net sales 1,265 1,979 993 1,717 2,920 3 –46 8,831
Operating profit 92 137 90 182 393 –47 9 856
Net financial items –6 –18 –2 –9 –27 221 –2591) –100
Profit before tax 86 119 88 173 366 536 –6121) 756
EBITA 103 159 110 212 443 –47 10 990
EBITA margin, % 8.1 8.0 11.1 12.3 15.2 – – 11.2
Amortisation of intangible assets –16 –23 –21 –30 –57 –1 – –148
Depreciation of property, plant and equipment –9 –21 –18 –22 –44 0 – –114
Sales growth, % –5 –7 –3 12 19 – – 5
Operating capital 465 987 607 853 2,348 1,959 –2,2721) 4,947
Return on operating capital, % 23 16 18 25 20 – – 20
Investments in non-current assets 14 28 29 33 136 0 – 240
total assets 660 1,494 917 1,441 3,157 5,067 –5,7821) 6,954
total liabilities 446 1,211 380 883 1,270 2,885 –2,7471) 4,328
1) Pertains mainly to elimination of the Parent Company’s dividends from subsidiaries, impairment of subsidiary shares, shares in subsidiaries, and loans to and from subsidiaries.
EE – Engineering & Equipment IC – Industrial Components FT – Flow TechnologySP – Special Products FM – Fluids & Mechanical Solutions PC – Parent Company
SEK 88 million. Both of these items are reported under elimina-tion items to enable comparisons in the business areas over time.
The business areas are followed up using the same accounting principles as the Group.
The Indutrade Group does not receive revenue from any single customer that amounts to 10% of total, which is why no data is reported on this.
Investments in non-current assets include purchases of intangi-ble assets (note 15), and property, plant and equipment (note 16).
The principle for breaking down external revenue and non-current assets per geographic area in the tables below is that such reporting is based on the location of the subsidiary’s regis-tered office.
The products that Indutrade sells can be broken down into
roughly 20 product categories. The largest, valves, accounted for 23% of net sales in 2014, or SEK 2,286 million (2,303). Hydraulics and industrial equipment accounted for 15%, or SEK 1,468 mil-lion (1,386), and measurement technology for 14%, or SEK 1,324 million (1,196). Other product categories each accounted for 7% or less of net sales.
Effective 1 January 2015 the Indutrade Group is organised in six business areas, instead of five as previously. The change was carried out by breaking away a grouping of companies active in measurement and sensor technology from the Special Products business area into a separate business area. The motive for the change is to strengthen focus and thus the conditions for contin-ued growth in the Group. Pro forma figures for the new structure for the 2013 and 2014 financial years are provided below.
Note 3Continued
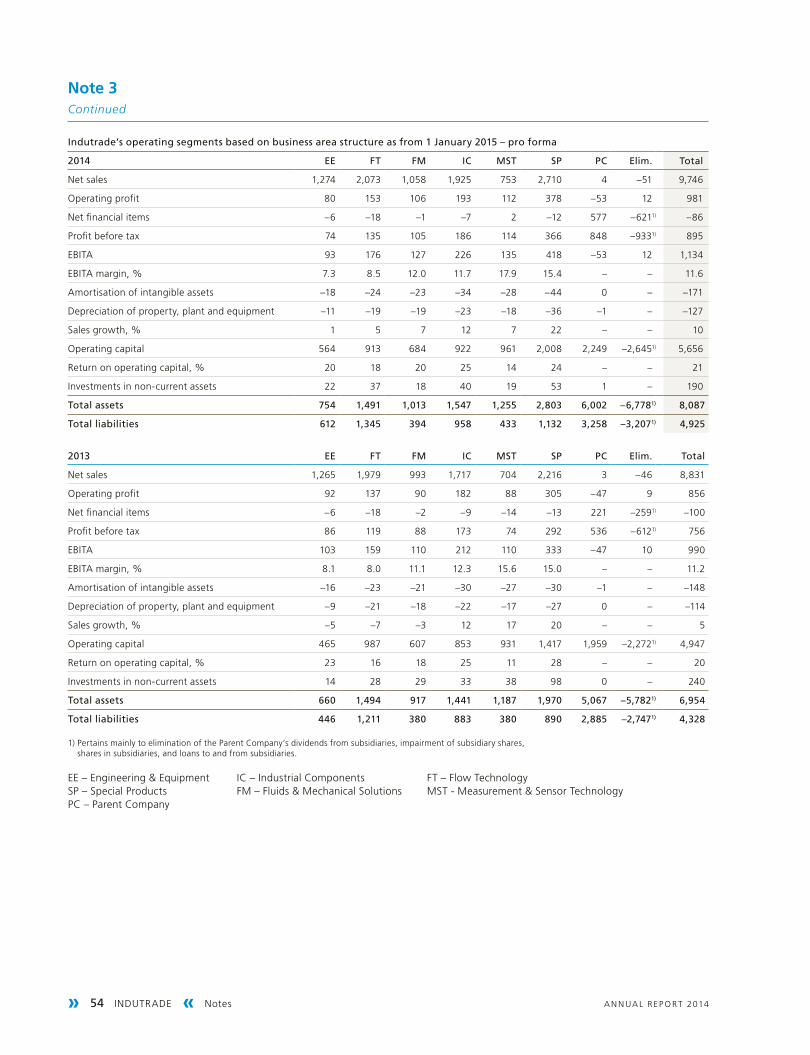
» 54 INDUTRADE « Notes A N N UA L R EP O RT 2014
Indutrade’s operating segments based on business area structure as from 1 January 2015 – pro forma
2014 ee Ft FM IC MSt Sp pC elim. total
Net sales 1,274 2,073 1,058 1,925 753 2,710 4 –51 9,746
Operating profit 80 153 106 193 112 378 –53 12 981
Net financial items –6 –18 –1 –7 2 –12 577 –6211) –86
Profit before tax 74 135 105 186 114 366 848 –9331) 895
EBITA 93 176 127 226 135 418 –53 12 1,134
EBITA margin, % 7.3 8.5 12.0 11.7 17.9 15.4 – – 11.6
Amortisation of intangible assets –18 –24 –23 –34 –28 –44 0 – –171
Depreciation of property, plant and equipment –11 –19 –19 –23 –18 –36 –1 – –127
Sales growth, % 1 5 7 12 7 22 – – 10
Operating capital 564 913 684 922 961 2,008 2,249 –2,6451) 5,656
Return on operating capital, % 20 18 20 25 14 24 – – 21
Investments in non-current assets 22 37 18 40 19 53 1 – 190
total assets 754 1,491 1,013 1,547 1,255 2,803 6,002 –6,7781) 8,087
total liabilities 612 1,345 394 958 433 1,132 3,258 –3,2071) 4,925
2013 ee Ft FM IC MSt Sp pC elim. total
Net sales 1,265 1,979 993 1,717 704 2,216 3 –46 8,831
Operating profit 92 137 90 182 88 305 –47 9 856
Net financial items –6 –18 –2 –9 –14 –13 221 –2591) –100
Profit before tax 86 119 88 173 74 292 536 –6121) 756
EBITA 103 159 110 212 110 333 –47 10 990
EBITA margin, % 8.1 8.0 11.1 12.3 15.6 15.0 – – 11.2
Amortisation of intangible assets –16 –23 –21 –30 –27 –30 –1 – –148
Depreciation of property, plant and equipment –9 –21 –18 –22 –17 –27 0 – –114
Sales growth, % –5 –7 –3 12 17 20 – – 5
Operating capital 465 987 607 853 931 1,417 1,959 –2,2721) 4,947
Return on operating capital, % 23 16 18 25 11 28 – – 20
Investments in non-current assets 14 28 29 33 38 98 0 – 240
total assets 660 1,494 917 1,441 1,187 1,970 5,067 –5,7821) 6,954
total liabilities 446 1,211 380 883 380 890 2,885 –2,7471) 4,328
1) Pertains mainly to elimination of the Parent Company’s dividends from subsidiaries, impairment of subsidiary shares, shares in subsidiaries, and loans to and from subsidiaries.
EE – Engineering & Equipment IC – Industrial Components FT – Flow Technology SP – Special Products FM – Fluids & Mechanical Solutions MST - Measurement & Sensor Technology PC – Parent Company
Note 3Continued
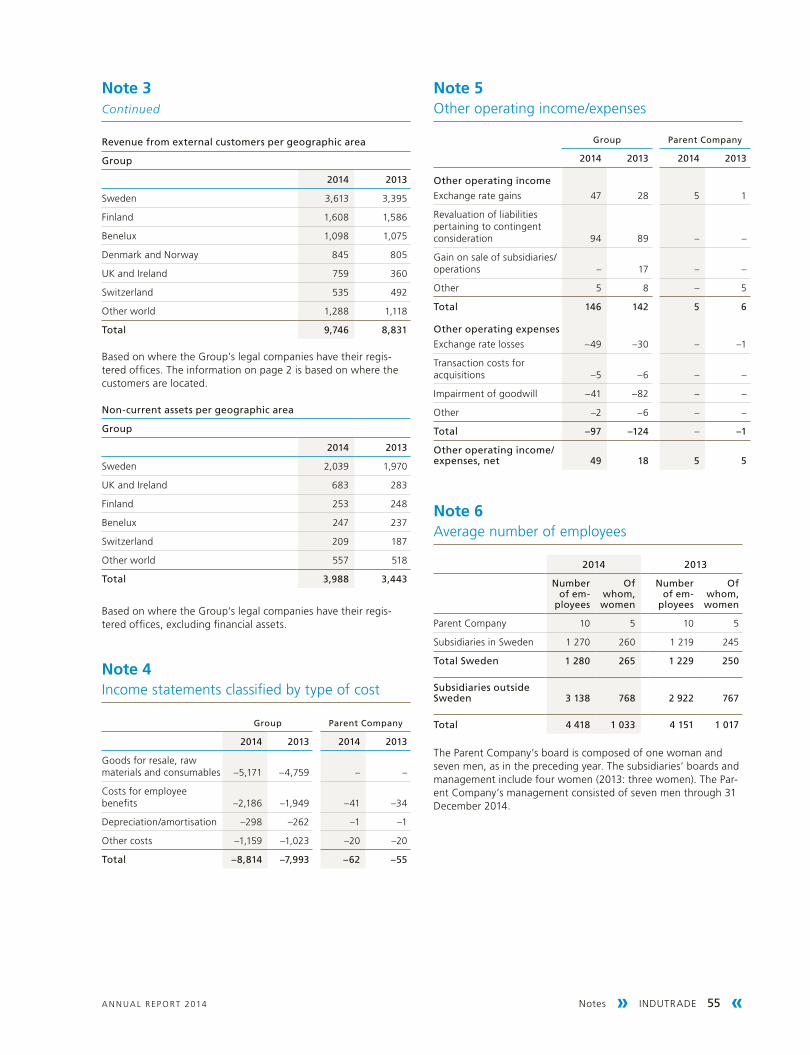
Notes » INDUTRADE 55 «A N N UA L R EP O RT 2014
Note 5Other operating income/expenses
Group parent Company
2014 2013 2014 2013
other operating income
Exchange rate gains 47 28 5 1
Revaluation of liabilities pertaining to contingent consideration 94 89 – –
Gain on sale of subsidiaries/operations – 17 – –
Other 5 8 – 5
total 146 142 5 6
other operating expenses
Exchange rate losses –49 –30 – –1
Transaction costs for acquisitions –5 –6 – –
Impairment of goodwill –41 –82 – –
Other –2 –6 – –
total –97 –124 – –1
other operating income/expenses, net 49 18 5 5
Note 6Average number of employees
2014 2013
number of em-
ployees
of whom, women
number of em-
ployees
of whom, women
Parent Company 10 5 10 5
Subsidiaries in Sweden 1 270 260 1 219 245
total Sweden 1 280 265 1 229 250
Subsidiaries outside Sweden 3 138 768 2 922 767
total 4 418 1 033 4 151 1 017
The Parent Company’s board is composed of one woman and seven men, as in the preceding year. The subsidiaries’ boards and management include four women (2013: three women). The Par-ent Company’s management consisted of seven men through 31 December 2014.
revenue from external customers per geographic area
Group
2014 2013
Sweden 3,613 3,395
Finland 1,608 1,586
Benelux 1,098 1,075
Denmark and Norway 845 805
UK and Ireland 759 360
Switzerland 535 492
Other world 1,288 1,118
total 9,746 8,831
Based on where the Group’s legal companies have their regis-tered offices. The information on page 2 is based on where the customers are located.
non-current assets per geographic area
Group
2014 2013
Sweden 2,039 1,970
UK and Ireland 683 283
Finland 253 248
Benelux 247 237
Switzerland 209 187
Other world 557 518
total 3,988 3,443
Based on where the Group’s legal companies have their regis-tered offices, excluding financial assets.
Note 4Income statements classified by type of cost
Group parent Company
2014 2013 2014 2013
Goods for resale, raw materials and consumables –5,171 –4,759 – –
Costs for employee benefits –2,186 –1,949 –41 –34
Depreciation/amortisation –298 –262 –1 –1
Other costs –1,159 –1,023 –20 –20
total –8,814 –7,993 –62 –55
Note 3Continued
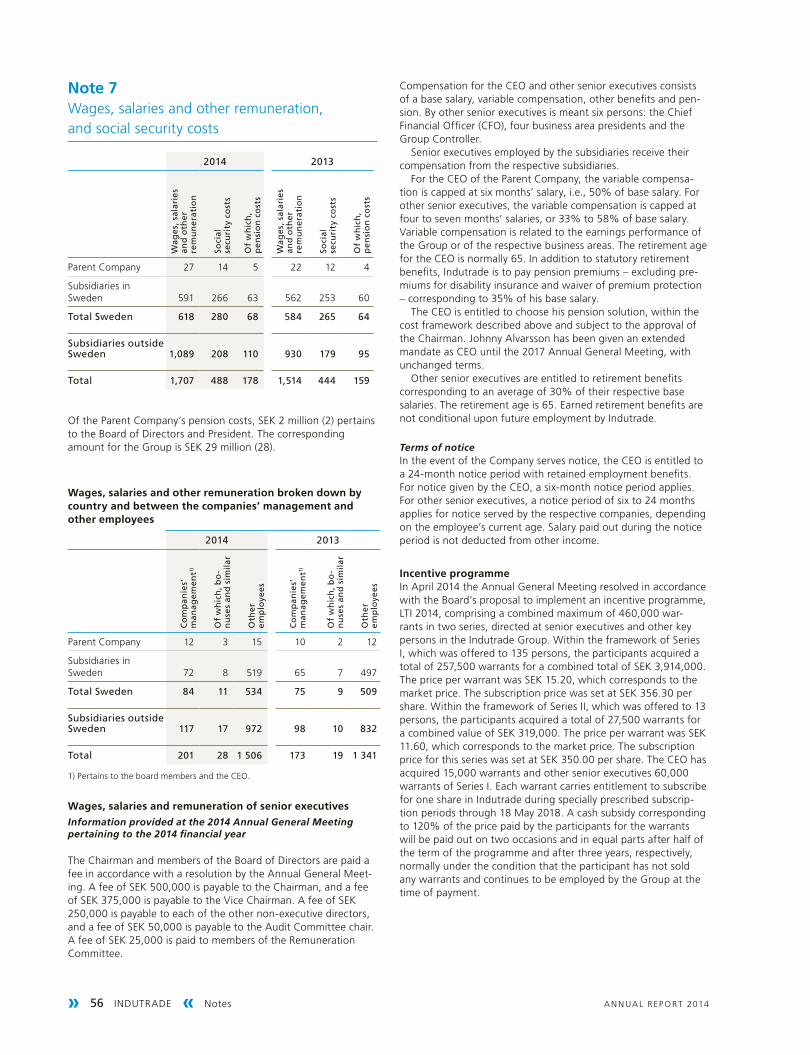
» 56 INDUTRADE « Notes A N N UA L R EP O RT 2014
Note 7Wages, salaries and other remuneration, and social security costs
2014 2013W
age
s, s
alar
ies
and
oth
er
rem
un
erat
ion
Soci
al
secu
rity
co
sts
of
wh
ich
, p
ensi
on
co
sts
Wag
es,
sal
arie
s an
d o
ther
re
mu
ner
atio
n
Soci
al
secu
rity
co
sts
of
wh
ich
, p
ensi
on
co
sts
Parent Company 27 14 5 22 12 4
Subsidiaries in Sweden 591 266 63 562 253 60
total Sweden 618 280 68 584 265 64
Subsidiaries outside Sweden 1,089 208 110 930 179 95
total 1,707 488 178 1,514 444 159
Of the Parent Company’s pension costs, SEK 2 million (2) pertains to the Board of Directors and President. The corresponding amount for the Group is SEK 29 million (28).
wages, salaries and other remuneration broken down by country and between the companies’ management and other employees
2014 2013
Co
mp
anie
s’
man
agem
ent1)
of
wh
ich
, bo
-n
use
s an
d s
imil
ar
oth
er
emp
loye
es
Co
mp
anie
s’
man
agem
ent1)
of
wh
ich
, bo
-n
use
s an
d s
imil
ar
oth
er
emp
loye
es
Parent Company 12 3 15 10 2 12
Subsidiaries in Sweden 72 8 519 65 7 497
total Sweden 84 11 534 75 9 509
Subsidiaries outside Sweden 117 17 972 98 10 832
total 201 28 1 506 173 19 1 341
1) Pertains to the board members and the CEO.
wages, salaries and remuneration of senior executivesInformation provided at the 2014 Annual General Meeting pertaining to the 2014 financial year
The Chairman and members of the Board of Directors are paid a fee in accordance with a resolution by the Annual General Meet-ing. A fee of SEK 500,000 is payable to the Chairman, and a fee of SEK 375,000 is payable to the Vice Chairman. A fee of SEK 250,000 is payable to each of the other non-executive directors, and a fee of SEK 50,000 is payable to the Audit Committee chair. A fee of SEK 25,000 is paid to members of the Remuneration Committee.
Compensation for the CEO and other senior executives consists of a base salary, variable compensation, other benefits and pen-sion. By other senior executives is meant six persons: the Chief Financial Officer (CFO), four business area presidents and the Group Controller.
Senior executives employed by the subsidiaries receive their compensation from the respective subsidiaries.
For the CEO of the Parent Company, the variable compensa-tion is capped at six months’ salary, i.e., 50% of base salary. For other senior executives, the variable compensation is capped at four to seven months’ salaries, or 33% to 58% of base salary. Variable compensation is related to the earnings performance of the Group or of the respective business areas. The retirement age for the CEO is normally 65. In addition to statutory retirement benefits, Indutrade is to pay pension premiums – excluding pre-miums for disability insurance and waiver of premium protection – corresponding to 35% of his base salary.
The CEO is entitled to choose his pension solution, within the cost framework described above and subject to the approval of the Chairman. Johnny Alvarsson has been given an extended mandate as CEO until the 2017 Annual General Meeting, with unchanged terms.
Other senior executives are entitled to retirement benefits corresponding to an average of 30% of their respective base salaries. The retirement age is 65. Earned retirement benefits are not conditional upon future employment by Indutrade.
Terms of noticeIn the event of the Company serves notice, the CEO is entitled to a 24-month notice period with retained employment benefits. For notice given by the CEO, a six-month notice period applies. For other senior executives, a notice period of six to 24 months applies for notice served by the respective companies, depending on the employee’s current age. Salary paid out during the notice period is not deducted from other income.
Incentive programmeIn April 2014 the Annual General Meeting resolved in accordance with the Board’s proposal to implement an incentive programme, LTI 2014, comprising a combined maximum of 460,000 war-rants in two series, directed at senior executives and other key persons in the Indutrade Group. Within the framework of Series I, which was offered to 135 persons, the participants acquired a total of 257,500 warrants for a combined total of SEK 3,914,000. The price per warrant was SEK 15.20, which corresponds to the market price. The subscription price was set at SEK 356.30 per share. Within the framework of Series II, which was offered to 13 persons, the participants acquired a total of 27,500 warrants for a combined value of SEK 319,000. The price per warrant was SEK 11.60, which corresponds to the market price. The subscription price for this series was set at SEK 350.00 per share. The CEO has acquired 15,000 warrants and other senior executives 60,000 warrants of Series I. Each warrant carries entitlement to subscribe for one share in Indutrade during specially prescribed subscrip-tion periods through 18 May 2018. A cash subsidy corresponding to 120% of the price paid by the participants for the warrants will be paid out on two occasions and in equal parts after half of the term of the programme and after three years, respectively, normally under the condition that the participant has not sold any warrants and continues to be employed by the Group at the time of payment.
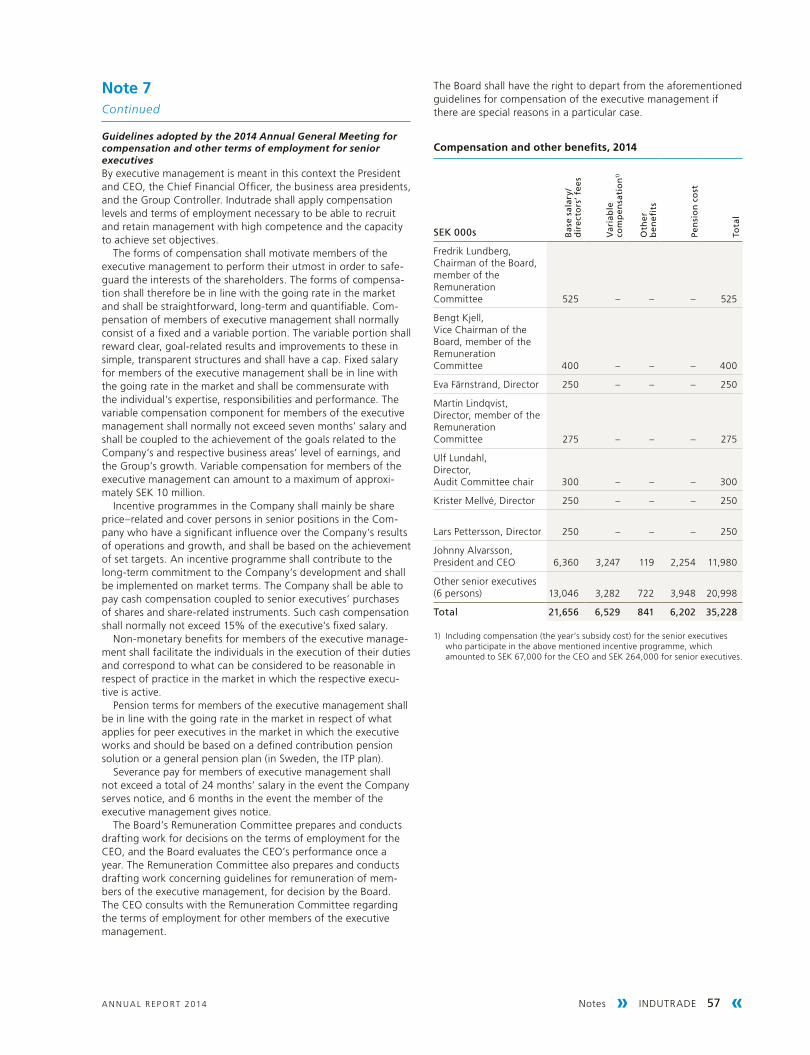
Notes » INDUTRADE 57 «A N N UA L R EP O RT 2014
Guidelines adopted by the 2014 Annual General Meeting for compensation and other terms of employment for senior executivesBy executive management is meant in this context the President and CEO, the Chief Financial Officer, the business area presidents, and the Group Controller. Indutrade shall apply compensation levels and terms of employment necessary to be able to recruit and retain management with high competence and the capacity to achieve set objectives.
The forms of compensation shall motivate members of the executive management to perform their utmost in order to safe-guard the interests of the shareholders. The forms of compensa-tion shall therefore be in line with the going rate in the market and shall be straightforward, long-term and quantifiable. Com-pensation of members of executive management shall normally consist of a fixed and a variable portion. The variable portion shall reward clear, goal-related results and improvements to these in simple, transparent structures and shall have a cap. Fixed salary for members of the executive management shall be in line with the going rate in the market and shall be commensurate with the individual’s expertise, responsibilities and performance. The variable compensation component for members of the executive management shall normally not exceed seven months’ salary and shall be coupled to the achievement of the goals related to the Company’s and respective business areas’ level of earnings, and the Group’s growth. Variable compensation for members of the executive management can amount to a maximum of approxi-mately SEK 10 million.
Incentive programmes in the Company shall mainly be share price–related and cover persons in senior positions in the Com-pany who have a significant influence over the Company’s results of operations and growth, and shall be based on the achievement of set targets. An incentive programme shall contribute to the long-term commitment to the Company’s development and shall be implemented on market terms. The Company shall be able to pay cash compensation coupled to senior executives’ purchases of shares and share-related instruments. Such cash compensation shall normally not exceed 15% of the executive’s fixed salary.
Non-monetary benefits for members of the executive manage-ment shall facilitate the individuals in the execution of their duties and correspond to what can be considered to be reasonable in respect of practice in the market in which the respective execu-tive is active.
Pension terms for members of the executive management shall be in line with the going rate in the market in respect of what applies for peer executives in the market in which the executive works and should be based on a defined contribution pension solution or a general pension plan (in Sweden, the ITP plan).
Severance pay for members of executive management shall not exceed a total of 24 months’ salary in the event the Company serves notice, and 6 months in the event the member of the executive management gives notice.
The Board’s Remuneration Committee prepares and conducts drafting work for decisions on the terms of employment for the CEO, and the Board evaluates the CEO’s performance once a year. The Remuneration Committee also prepares and conducts drafting work concerning guidelines for remuneration of mem-bers of the executive management, for decision by the Board. The CEO consults with the Remuneration Committee regarding the terms of employment for other members of the executive management.
The Board shall have the right to depart from the aforementioned guidelines for compensation of the executive management if there are special reasons in a particular case.
Compensation and other benefits, 2014
SeK 000s Bas
e sa
lary
/ d
ire
cto
rs’ f
ees
Var
iab
le
com
pen
sati
on1)
oth
er
ben
efits
pen
sio
n c
ost
tota
l
Fredrik Lundberg, Chairman of the Board, member of the Remuneration Committee 525 – – – 525
Bengt Kjell, Vice Chairman of the Board, member of the Remuneration Committee 400 – – – 400
Eva Färnstrand, Director 250 – – – 250
Martin Lindqvist, Director, member of the Remuneration Committee 275 – – – 275
Ulf Lundahl, Director, Audit Committee chair 300 – – – 300
Krister Mellvé, Director 250 – – – 250
Lars Pettersson, Director 250 – – – 250
Johnny Alvarsson, President and CEO 6,360 3,247 119 2,254 11,980
Other senior executives (6 persons) 13,046 3,282 722 3,948 20,998
total 21,656 6,529 841 6,202 35,228
1) Including compensation (the year’s subsidy cost) for the senior executives who participate in the above mentioned incentive programme, which amounted to SEK 67,000 for the CEO and SEK 264,000 for senior executives.
Note 7Continued
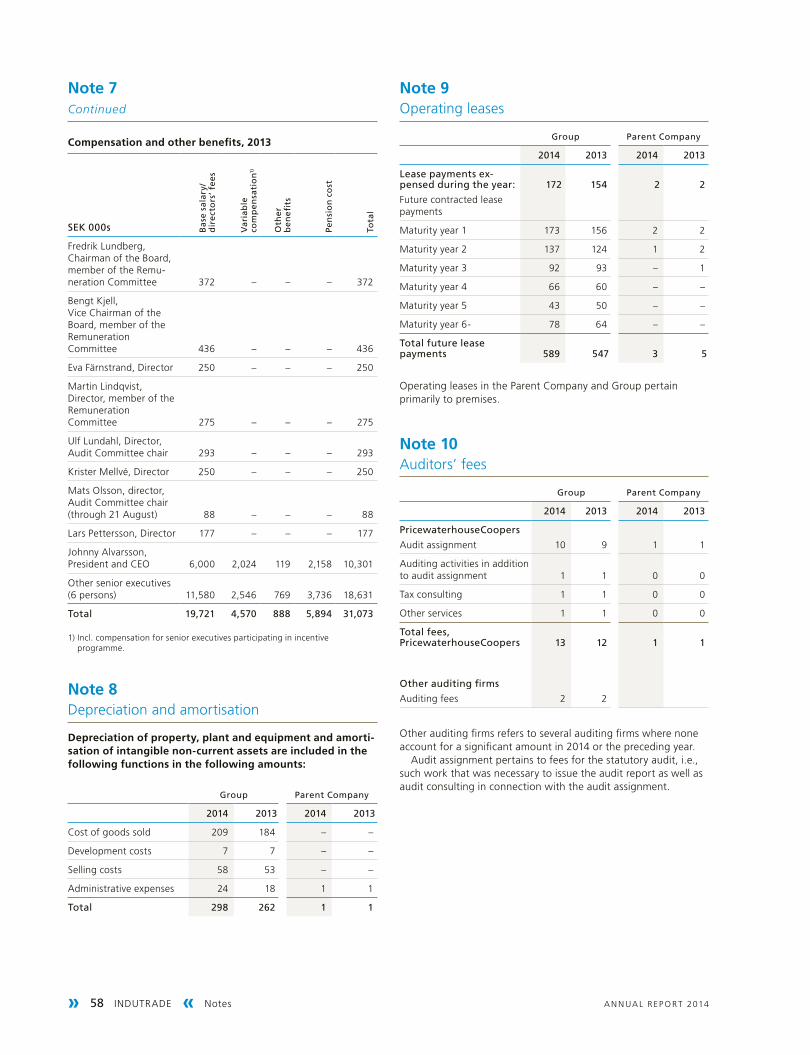
» 58 INDUTRADE « Notes A N N UA L R EP O RT 2014
Compensation and other benefits, 2013
SeK 000s Bas
e sa
lary
/ d
ire
cto
rs’ f
ees
Var
iab
le
com
pen
sati
on1)
oth
er
ben
efits
pen
sio
n c
ost
tota
l
Fredrik Lundberg, Chairman of the Board, member of the Remu-neration Committee 372 – – – 372
Bengt Kjell, Vice Chairman of the Board, member of the Remuneration Committee 436 – – – 436
Eva Färnstrand, Director 250 – – – 250
Martin Lindqvist, Director, member of the Remuneration Committee 275 – – – 275
Ulf Lundahl, Director, Audit Committee chair 293 – – – 293
Krister Mellvé, Director 250 – – – 250
Mats Olsson, director, Audit Committee chair (through 21 August) 88 – – – 88
Lars Pettersson, Director 177 – – – 177
Johnny Alvarsson, President and CEO 6,000 2,024 119 2,158 10,301
Other senior executives (6 persons) 11,580 2,546 769 3,736 18,631
total 19,721 4,570 888 5,894 31,073
1) Incl. compensation for senior executives participating in incentive programme.
Note 8Depreciation and amortisation
Depreciation of property, plant and equipment and amorti-sation of intangible non-current assets are included in the following functions in the following amounts:
Group parent Company
2014 2013 2014 2013
Cost of goods sold 209 184 – –
Development costs 7 7 – –
Selling costs 58 53 – –
Administrative expenses 24 18 1 1
total 298 262 1 1
Note 9Operating leases
Group parent Company
2014 2013 2014 2013
lease payments ex-pensed during the year: 172 154 2 2
Future contracted lease payments
Maturity year 1 173 156 2 2
Maturity year 2 137 124 1 2
Maturity year 3 92 93 – 1
Maturity year 4 66 60 – –
Maturity year 5 43 50 – –
Maturity year 6- 78 64 – –
total future lease payments 589 547 3 5
Operating leases in the Parent Company and Group pertain primarily to premises.
Note 10Auditors’ fees
Group parent Company
2014 2013 2014 2013
pricewaterhouseCoopers
Audit assignment 10 9 1 1
Auditing activities in addition to audit assignment 1 1 0 0
Tax consulting 1 1 0 0
Other services 1 1 0 0
total fees, pricewaterhouseCoopers 13 12 1 1
other auditing firms
Auditing fees 2 2
Other auditing firms refers to several auditing firms where none account for a significant amount in 2014 or the preceding year.
Audit assignment pertains to fees for the statutory audit, i.e., such work that was necessary to issue the audit report as well as audit consulting in connection with the audit assignment.
Note 7Continued
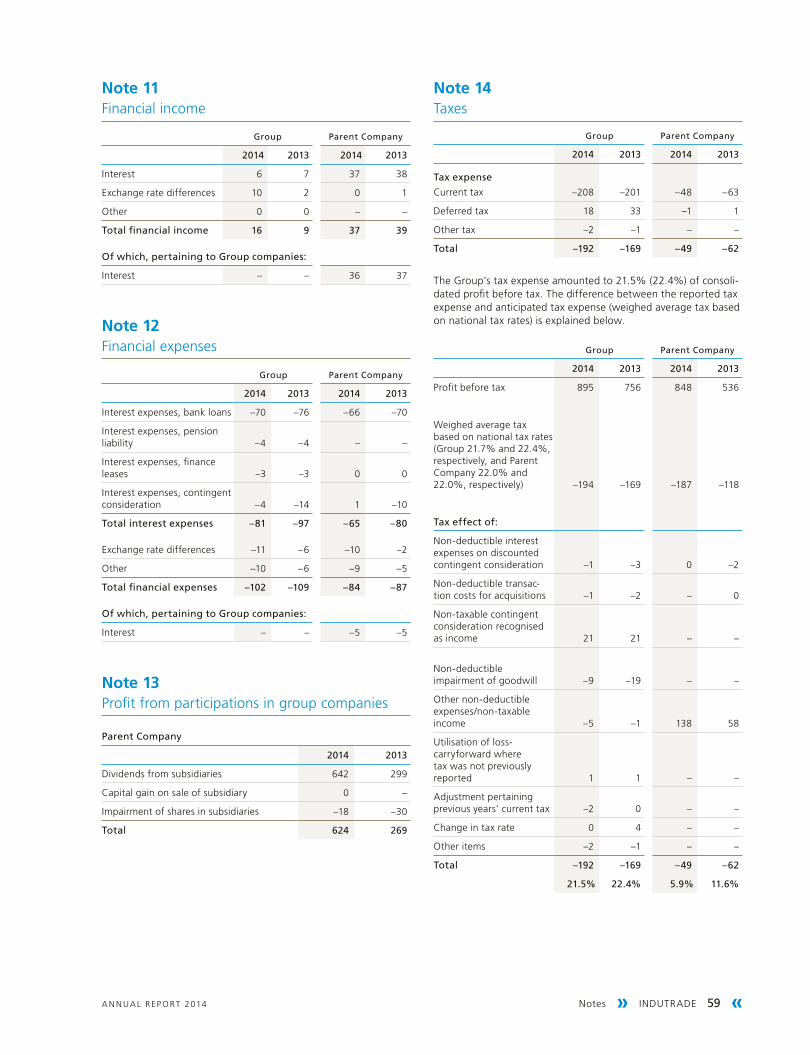
Notes » INDUTRADE 59 «A N N UA L R EP O RT 2014
Note 11Financial income
Group parent Company
2014 2013 2014 2013
Interest 6 7 37 38
Exchange rate differences 10 2 0 1
Other 0 0 – –
total financial income 16 9 37 39
of which, pertaining to Group companies:
Interest – – 36 37
Note 12Financial expenses
Group parent Company
2014 2013 2014 2013
Interest expenses, bank loans –70 –76 –66 –70
Interest expenses, pension liability –4 –4 – –
Interest expenses, finance leases –3 –3 0 0
Interest expenses, contingent consideration –4 –14 1 –10
total interest expenses –81 –97 –65 –80
Exchange rate differences –11 –6 –10 –2
Other –10 –6 –9 –5
total financial expenses –102 –109 –84 –87
of which, pertaining to Group companies:
Interest – – –5 –5
Note 13Profit from participations in group companies
parent Company
2014 2013
Dividends from subsidiaries 642 299
Capital gain on sale of subsidiary 0 –
Impairment of shares in subsidiaries –18 –30
total 624 269
Note 14Taxes
Group parent Company
2014 2013 2014 2013
tax expense
Current tax –208 –201 –48 –63
Deferred tax 18 33 –1 1
Other tax –2 –1 – –
total –192 –169 –49 –62
The Group’s tax expense amounted to 21.5% (22.4%) of consoli-dated profit before tax. The difference between the reported tax expense and anticipated tax expense (weighed average tax based on national tax rates) is explained below.
Group parent Company
2014 2013 2014 2013
Profit before tax 895 756 848 536
Weighed average tax based on national tax rates (Group 21.7% and 22.4%, respectively, and Parent Company 22.0% and 22.0%, respectively) –194 –169 –187 –118
tax effect of:
Non-deductible interest expenses on discounted contingent consideration –1 –3 0 –2
Non-deductible transac-tion costs for acquisitions –1 –2 – 0
Non-taxable contingent consideration recognised as income 21 21 – –
Non-deductible impairment of goodwill –9 –19 – –
Other non-deductible expenses/non-taxable income –5 –1 138 58
Utilisation of loss- carryforward where tax was not previously reported 1 1 – –
Adjustment pertaining previous years’ current tax –2 0 – –
Change in tax rate 0 4 – –
Other items –2 –1 – –
total –192 –169 –49 –62
21.5% 22.4% 5.9% 11.6%
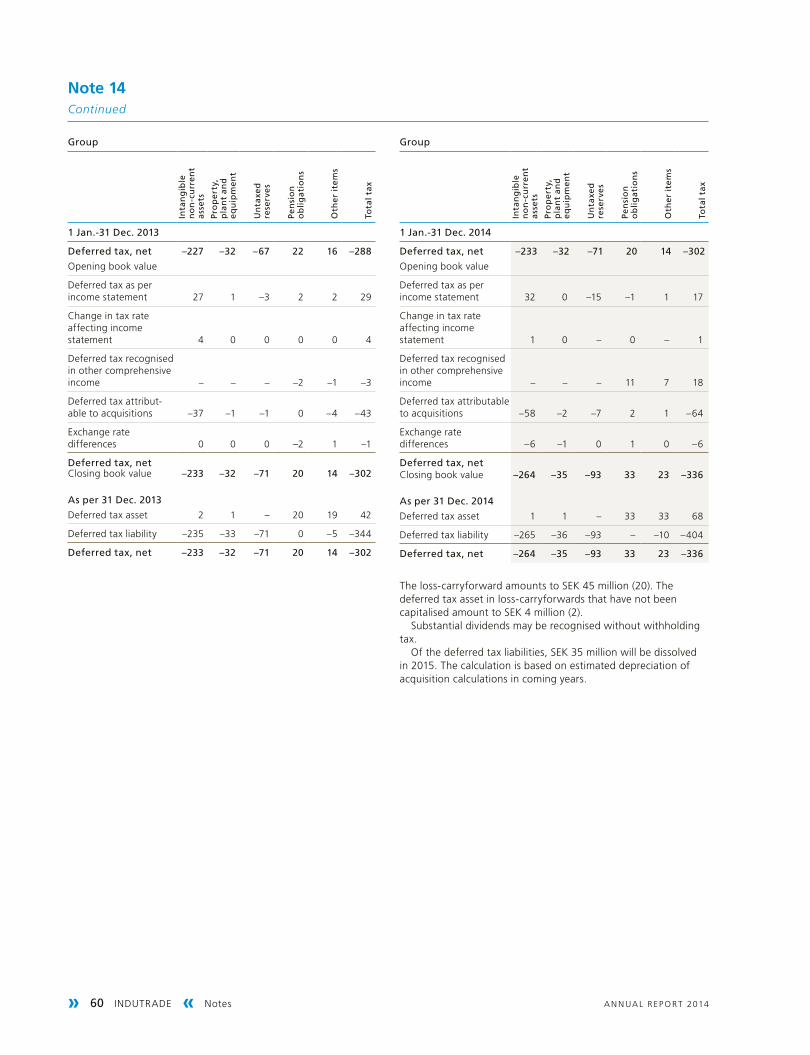
» 60 INDUTRADE « Notes A N N UA L R EP O RT 2014
Group
Inta
ng
ible
n
on
-cu
rren
t as
sets
pro
per
ty,
pla
nt
and
e
qu
ipm
ent
un
taxe
d
rese
rve
s
pen
sio
n
ob
lig
atio
ns
oth
er i
tem
s
tota
l ta
x
1 Jan.-31 Dec. 2013
Deferred tax, net –227 –32 –67 22 16 –288
Opening book value
Deferred tax as per income statement 27 1 –3 2 2 29
Change in tax rate affecting income statement 4 0 0 0 0 4
Deferred tax recognised in other comprehensive income – – – –2 –1 –3
Deferred tax attribut-able to acquisitions –37 –1 –1 0 –4 –43
Exchange rate differences 0 0 0 –2 1 –1
Deferred tax, netClosing book value –233 –32 –71 20 14 –302
as per 31 Dec. 2013
Deferred tax asset 2 1 – 20 19 42
Deferred tax liability –235 –33 –71 0 –5 –344
Deferred tax, net –233 –32 –71 20 14 –302
Group
Inta
ng
ible
n
on
-cu
rren
t as
sets
pro
per
ty,
pla
nt
and
e
qu
ipm
ent
un
taxe
d
rese
rve
s
pen
sio
n
ob
lig
atio
ns
oth
er i
tem
s
tota
l ta
x
1 Jan.-31 Dec. 2014
Deferred tax, net –233 –32 –71 20 14 –302
Opening book value
Deferred tax as per income statement 32 0 –15 –1 1 17
Change in tax rate affecting income statement 1 0 – 0 – 1
Deferred tax recognised in other comprehensive income – – – 11 7 18
Deferred tax attributable to acquisitions –58 –2 –7 2 1 –64
Exchange rate differences –6 –1 0 1 0 –6
Deferred tax, netClosing book value –264 –35 –93 33 23 –336
as per 31 Dec. 2014
Deferred tax asset 1 1 – 33 33 68
Deferred tax liability –265 –36 –93 – –10 –404
Deferred tax, net –264 –35 –93 33 23 –336
The loss-carryforward amounts to SEK 45 million (20). The deferred tax asset in loss-carryforwards that have not been capitalised amount to SEK 4 million (2).
Substantial dividends may be recognised without withholding tax.
Of the deferred tax liabilities, SEK 35 million will be dissolved in 2015. The calculation is based on estimated depreciation of acquisition calculations in coming years.
Note 14Continued
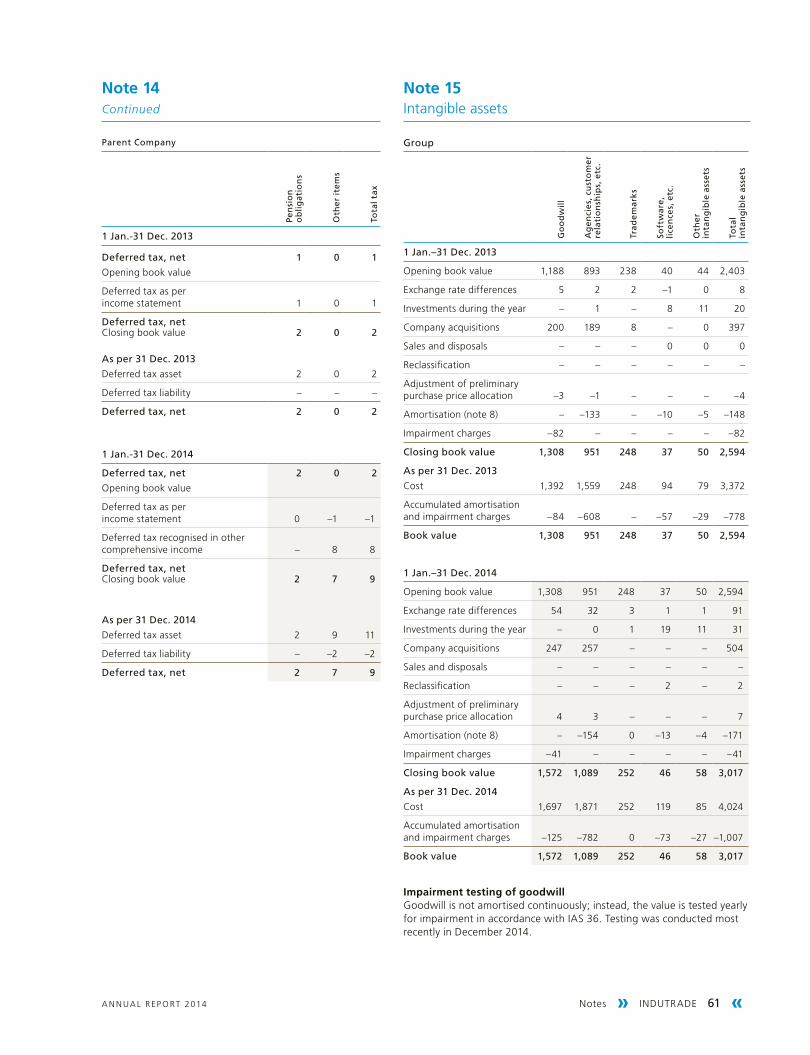
Notes » INDUTRADE 61 «A N N UA L R EP O RT 2014
parent Company
pen
sio
n
ob
lig
atio
ns
oth
er i
tem
s
tota
l ta
x
1 Jan.-31 Dec. 2013
Deferred tax, net 1 0 1
Opening book value
Deferred tax as per income statement 1 0 1
Deferred tax, netClosing book value 2 0 2
as per 31 Dec. 2013
Deferred tax asset 2 0 2
Deferred tax liability – – –
Deferred tax, net 2 0 2
1 Jan.-31 Dec. 2014
Deferred tax, net 2 0 2
Opening book value
Deferred tax as per income statement 0 –1 –1
Deferred tax recognised in other comprehensive income – 8 8
Deferred tax, netClosing book value 2 7 9
as per 31 Dec. 2014
Deferred tax asset 2 9 11
Deferred tax liability – –2 –2
Deferred tax, net 2 7 9
Note 15Intangible assets
Group
Go
od
will
ag
enci
es,
cu
sto
mer
re
lati
on
ship
s, e
tc.
trad
emar
ks
Soft
war
e,
lice
nce
s, e
tc.
oth
er
inta
ng
ible
ass
ets
tota
l in
tan
gib
le a
sset
s
1 Jan.–31 Dec. 2013
Opening book value 1,188 893 238 40 44 2,403
Exchange rate differences 5 2 2 –1 0 8
Investments during the year – 1 – 8 11 20
Company acquisitions 200 189 8 – 0 397
Sales and disposals – – – 0 0 0
Reclassification – – – – – –
Adjustment of preliminary purchase price allocation –3 –1 – – – –4
Amortisation (note 8) – –133 – –10 –5 –148
Impairment charges –82 – – – – –82
Closing book value 1,308 951 248 37 50 2,594
as per 31 Dec. 2013
Cost 1,392 1,559 248 94 79 3,372
Accumulated amortisation and impairment charges –84 –608 – –57 –29 –778
Book value 1,308 951 248 37 50 2,594
1 Jan.–31 Dec. 2014
Opening book value 1,308 951 248 37 50 2,594
Exchange rate differences 54 32 3 1 1 91
Investments during the year – 0 1 19 11 31
Company acquisitions 247 257 – – – 504
Sales and disposals – – – – – –
Reclassification – – – 2 – 2
Adjustment of preliminary purchase price allocation 4 3 – – – 7
Amortisation (note 8) – –154 0 –13 –4 –171
Impairment charges –41 – – – – –41
Closing book value 1,572 1,089 252 46 58 3,017
as per 31 Dec. 2014
Cost 1,697 1,871 252 119 85 4,024
Accumulated amortisation and impairment charges –125 –782 0 –73 –27 –1,007
Book value 1,572 1,089 252 46 58 3,017
Impairment testing of goodwillGoodwill is not amortised continuously; instead, the value is tested yearly for impairment in accordance with IAS 36. Testing was conducted most recently in December 2014.
Note 14Continued

» 62 INDUTRADE « Notes A N N UA L R EP O RT 2014
Group breakdown of trademarks at segmental level
2014 2013
Engineering & Equipment 0 0
Flow Technology 59 59
Fluids & Mechanical Solutions – –
Industrial Components – –
Special Products 193 189
total 252 248
Group breakdown of goodwill at segmental level according to new structure as from 1 january 2015
2014 2013
Engineering & Equipment 134 126
Flow Technology 183 214
Fluids & Mechanical Solutions 248 204
Industrial Components 269 233
Measurement & Sensor Technology 249 244
Special Products 489 287
total 1,572 1,308
Group breakdown of trademarks at segmental level according to new structure as from 1 january 2015
2014 2013
Engineering & Equipment 0 0
Flow Technology 59 59
Fluids & Mechanical Solutions – –
Industrial Components – –
Measurement & Sensor Technology 146 145
Special Products 47 44
total 252 248
parent Company
2014 2013
Opening cost 2 2
Investments during the year 0 0
Closing accumulated cost 2 2
Opening amortisation –2 –1
Amortisation for the year 0 –1
Closing accumulated amortisation –2 –2
planned residual value 0 0
Goodwill is apportioned over cash-generating units, which for Indutrade are equated with operating segments. Operating seg-ments correspond to Indutrade’s business areas.
The recoverable value has been calculated according to value in use and is based on the current estimation of cash flows for the next five years. Assumptions have been made on the gross margin, level of overheads, need for working capital and investment need. The parameters have been set to correspond to budgeted earnings for the 2015 financial year. During the rest of the five-year period, an annual growth rate of 2% (2%) has been assumed. Where greater changes are expected, the assumptions have been adapted to better correspond to these expectations. For cash flows beyond the five-year period, the rate of growth has been assumed to correspond to the growth rate during the fifth year, ordinarily 2%. The cash flows have been discounted with a weighed cost of capital that corresponds to approximately 9% (14%) before tax. The weighed cost of capital has been adapted to the prevailing level of interest rates. The same discount rate has been used for all segments, since they conduct similar operations. The calculation shows that value in use exceeds the carrying amount at the segmental level. A sen-sitivity analysis shows that the remaining goodwill value would continue to be upheld if the discount rate were to be raised by 1 percentage point or long-term growth were to be decreased by 1 percentage point.
In connection with a new assessment of contingent earn-out payments in 2014, in response to a lower level of earnings in relation to the anticipated outcome that formed the basis for the previously booked contingent earn-out payment, impairment testing of goodwill was conducted in the affected companies in accordance with the principles described above. As a result of this impairment testing, an impairment charge of SEK 3 million was recognised in 2014 for the value of goodwill in the Special Products business area. For most of these businesses the trend is positive, but not at the rate required for an earn-out payment.
During the year, a decision was made on a new long-term strategy for a company grouping within the Flow Technol-ogy business area. As a result of this decision, a need arose to conduct impairment testing of goodwill in this grouping, which resulted in recognition of SEK 38 million in impairment.
Other impairment testingEvery year impairment testing is conducted for trademarks at the segmental level in accordance with the same principles and at the same point in time as for goodwill. No events or changed condi-tions have been identified that warrant impairment testing for other intangible non-current assets that are amortised.
Group breakdown of goodwill at segmental level
2014 2013
Engineering & Equipment 134 126
Flow Technology 183 214
Fluids & Mechanical Solutions 248 204
Industrial Components 269 233
Special Products 738 531
total 1,572 1,308
Note 15Continued
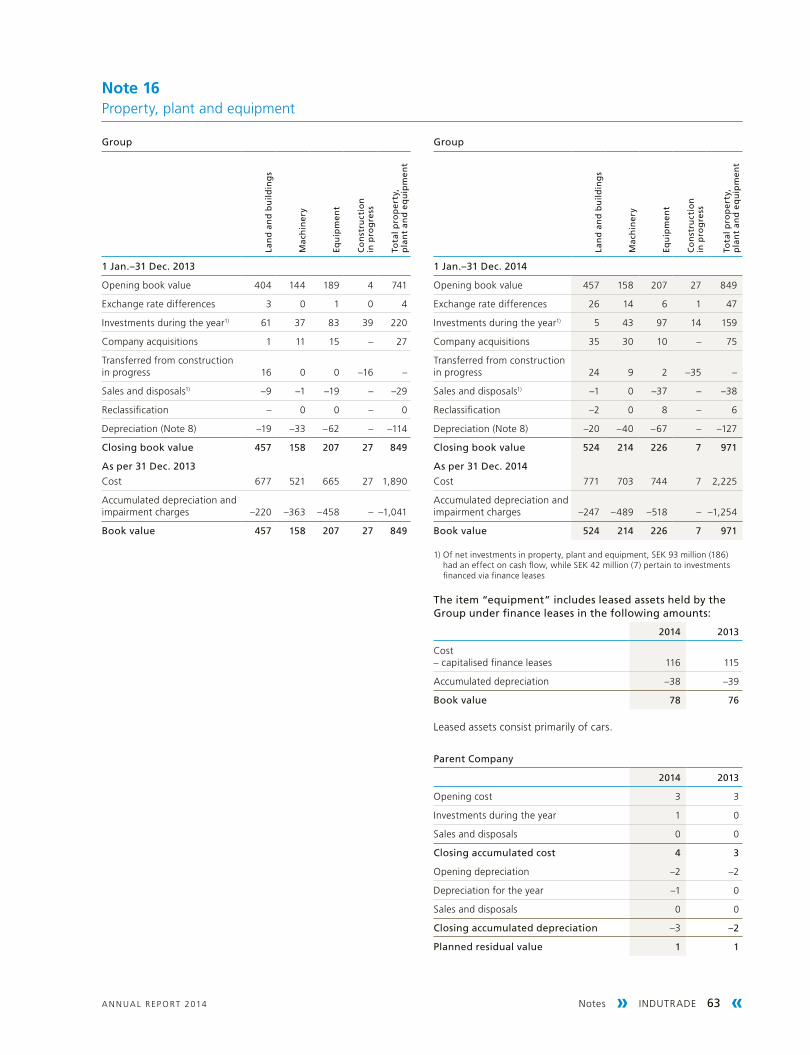
Notes » INDUTRADE 63 «A N N UA L R EP O RT 2014
Group
lan
d a
nd
bu
ild
ing
s
Mac
hin
ery
equ
ipm
ent
Co
nst
ruct
ion
in
pro
gre
ss
tota
l pro
per
ty,
pla
nt
and
eq
uip
men
t
1 Jan.–31 Dec. 2014
Opening book value 457 158 207 27 849
Exchange rate differences 26 14 6 1 47
Investments during the year1) 5 43 97 14 159
Company acquisitions 35 30 10 – 75
Transferred from construction in progress 24 9 2 –35 –
Sales and disposals1) –1 0 –37 – –38
Reclassification –2 0 8 – 6
Depreciation (Note 8) –20 –40 –67 – –127
Closing book value 524 214 226 7 971
as per 31 Dec. 2014
Cost 771 703 744 7 2,225
Accumulated depreciation and impairment charges –247 –489 –518 – –1,254
Book value 524 214 226 7 971
1) Of net investments in property, plant and equipment, SEK 93 million (186) had an effect on cash flow, while SEK 42 million (7) pertain to investments financed via finance leases
the item “equipment” includes leased assets held by the Group under finance leases in the following amounts:
2014 2013
Cost – capitalised finance leases 116 115
Accumulated depreciation –38 –39
Book value 78 76
Leased assets consist primarily of cars.
parent Company
2014 2013
Opening cost 3 3
Investments during the year 1 0
Sales and disposals 0 0
Closing accumulated cost 4 3
Opening depreciation –2 –2
Depreciation for the year –1 0
Sales and disposals 0 0
Closing accumulated depreciation –3 –2
planned residual value 1 1
Group
lan
d a
nd
bu
ild
ing
s
Mac
hin
ery
equ
ipm
ent
Co
nst
ruct
ion
in
pro
gre
ss
tota
l pro
per
ty,
pla
nt
and
eq
uip
men
t
1 Jan.–31 Dec. 2013
Opening book value 404 144 189 4 741
Exchange rate differences 3 0 1 0 4
Investments during the year1) 61 37 83 39 220
Company acquisitions 1 11 15 – 27
Transferred from construction in progress 16 0 0 –16 –
Sales and disposals1) –9 –1 –19 – –29
Reclassification – 0 0 – 0
Depreciation (Note 8) –19 –33 –62 – –114
Closing book value 457 158 207 27 849
as per 31 Dec. 2013
Cost 677 521 665 27 1,890
Accumulated depreciation and impairment charges –220 –363 –458 – –1,041
Book value 457 158 207 27 849
Note 16Property, plant and equipment
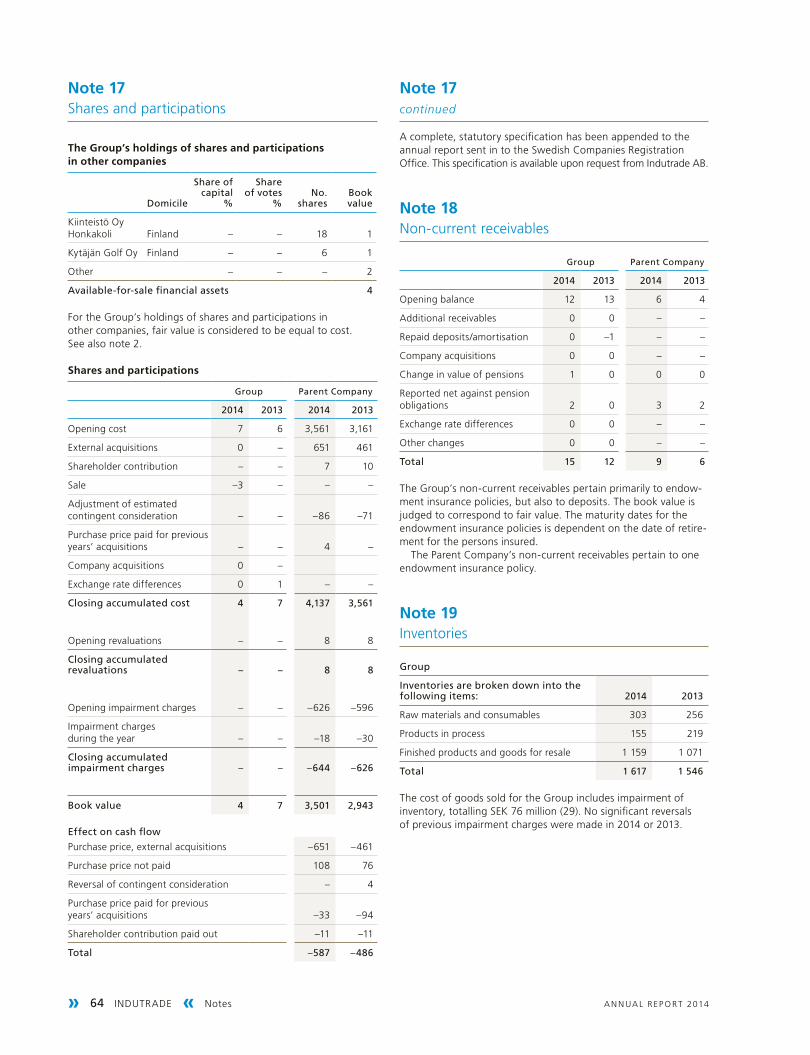
» 64 INDUTRADE « Notes A N N UA L R EP O RT 2014
A complete, statutory specification has been appended to the annual report sent in to the Swedish Companies Registration Office. This specification is available upon request from Indutrade AB.
Note 18Non-current receivables
Group parent Company
2014 2013 2014 2013
Opening balance 12 13 6 4
Additional receivables 0 0 – –
Repaid deposits/amortisation 0 –1 – –
Company acquisitions 0 0 – –
Change in value of pensions 1 0 0 0
Reported net against pension obligations 2 0 3 2
Exchange rate differences 0 0 – –
Other changes 0 0 – –
total 15 12 9 6
The Group’s non-current receivables pertain primarily to endow-ment insurance policies, but also to deposits. The book value is judged to correspond to fair value. The maturity dates for the endowment insurance policies is dependent on the date of retire-ment for the persons insured.
The Parent Company’s non-current receivables pertain to one endowment insurance policy.
Note 19Inventories
Group
Inventories are broken down into the following items: 2014 2013
Raw materials and consumables 303 256
Products in process 155 219
Finished products and goods for resale 1 159 1 071
total 1 617 1 546
The cost of goods sold for the Group includes impairment of inventory, totalling SEK 76 million (29). No significant reversals of previous impairment charges were made in 2014 or 2013.
The Group’s holdings of shares and participations in other companies
Domicile
Share of capital
%
Share of votes
%no.
sharesBook value
Kiinteistö Oy Honkakoli Finland – – 18 1
Kytäjän Golf Oy Finland – – 6 1
Other – – – 2
available-for-sale financial assets 4
For the Group’s holdings of shares and participations in other companies, fair value is considered to be equal to cost. See also note 2.
Shares and participations
Group parent Company
2014 2013 2014 2013
Opening cost 7 6 3,561 3,161
External acquisitions 0 – 651 461
Shareholder contribution – – 7 10
Sale –3 – – –
Adjustment of estimated contingent consideration – – –86 –71
Purchase price paid for previous years’ acquisitions – – 4 –
Company acquisitions 0 –
Exchange rate differences 0 1 – –
Closing accumulated cost 4 7 4,137 3,561
Opening revaluations – – 8 8
Closing accumulated revaluations – – 8 8
Opening impairment charges – – –626 –596
Impairment charges during the year – – –18 –30
Closing accumulated impairment charges – – –644 –626
Book value 4 7 3,501 2,943
effect on cash flow
Purchase price, external acquisitions –651 –461
Purchase price not paid 108 76
Reversal of contingent consideration – 4
Purchase price paid for previous years’ acquisitions –33 –94
Shareholder contribution paid out –11 –11
total –587 –486
Note 17Shares and participations
Note 17continued

Notes » INDUTRADE 65 «A N N UA L R EP O RT 2014
Note 20Trade accounts receivable
Age breakdown of trade accounts receivable and provisions for impaired trade accounts receivable
Group
trade accounts receivable 2014 2013
Trade accounts receivable not due 1,222 985
Trade accounts receivable 0-3 months past due 403 384
Trade accounts receivable 3-6 months past due 30 27
Trade accounts receivable more than 6 months past due 83 72
Provision for impaired trade accounts receivable –36 –33
total 1,702 1,435
provision for impaired trade accounts receivable
Provision for trade accounts receivable, 0-3 months past due –3 –2
Provision for trade accounts receivable, 3-6 months past due –3 –3
Provision for trade accounts receivable, older than 6 months –30 –28
total –36 –33
Change in provision for impaired trade accounts receivable during the year
Opening provision –33 –25
Receivables written off as customer losses 7 2
Reversed, unutilised provisions 2 3
Provision for the year for impaired trade accounts receivable –11 –13
Company acquisitions –2 0
Exchange rate differences 1 0
Closing provision –36 –33
For a description of risks associated with the Company’s trade accounts receivable, see note 2.
Note 21Prepaid expenses and accrued income
Group parent Company
2014 2013 2014 2013
Prepaid rents 14 12 – –
Prepaid insurance premiums 10 8 0 0
Other prepaid expenses 60 51 3 4
Accrued income 7 11 – –
Derivative instruments 1) – 3 – –
total 91 85 3 4
1) Starting in 2014 derivative instruments are reported in Other receivables.
Note 22Non-current and current interest-bearing liabilities
Groupparent
Company
2014 2013 2014 2013
non-current
Future leasing obligations for finance leases 45 44 1 0
SEK-denominated loans with terms longer than 1 year 504 1 304 500 1 300
EUR-denominated loans with terms longer than 1 year 213 433 209 429
Loans in other currencies with terms longer than 1 year 65 53 – –
Contingent earn-out payments in SEK with payment due later than 1 year 35 110 33 110
Contingent earn-out payments in EUR with payment due later than 1 year 20 45 – 22
Contingent earn-out payments in other currencies with payment due later than 1 year 101 45 65 10
983 2,034 808 1,871
Current
Utilised bank overdraft facilities 113 276 86 252
Future leasing obligations for finance leases 32 32 0 0
SEK-denominated loans with terms shorter than 1 year 1,2271) 0 1,2271) –
EUR-denominated loans with terms shorter than 1 year 173 1 162 –
Loans in other currencies with terms shorter than 1 year 5 4 – –
Contingent earn-out payments in SEK with payment due less than 1 year 20 14 20 –
Contingent earn-out payments in EUR with payment due less than 1 year 31 40 24 22
Contingent earn-out payments in other currencies with payment due less than 1 year 34 14 31 8
1,635 381 1,550 282
total 2,618 2,415 2,358 2,153
1) Of which, commercial paper SEK 852 million (–)
Car leases are reported as finance leases in accordance with IFRS, entailing an increase in both assets and liabilities of SEK 78 mil-lion (76). Of the Group’s long-term leasing obligations, SEK 24 million falls due for payment in 2016, SEK 20 million in 2017, and SEK 1 million in 2018 or later.
Externally granted bank overdraft facilities amount to SEK 733 million (742) for the Group and SEK 680 million (702) for the Parent Company.
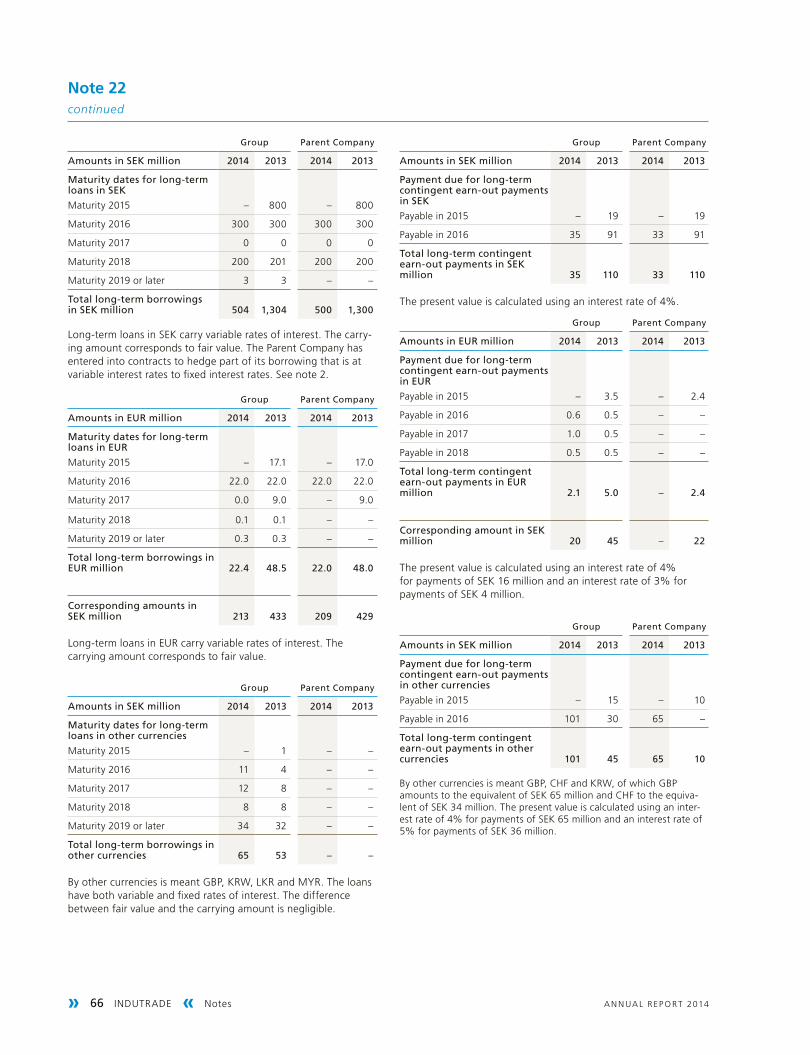
» 66 INDUTRADE « Notes A N N UA L R EP O RT 2014
Group parent Company
amounts in SeK million 2014 2013 2014 2013
payment due for long-term contingent earn-out payments in SeK
Payable in 2015 – 19 – 19
Payable in 2016 35 91 33 91
total long-term contingent earn-out payments in SeK million 35 110 33 110
The present value is calculated using an interest rate of 4%.
Group parent Company
amounts in eur million 2014 2013 2014 2013
payment due for long-term contingent earn-out payments in eur
Payable in 2015 – 3.5 – 2.4
Payable in 2016 0.6 0.5 – –
Payable in 2017 1.0 0.5 – –
Payable in 2018 0.5 0.5 – –
total long-term contingent earn-out payments in eur million 2.1 5.0 – 2.4
Corresponding amount in SeK million 20 45 – 22
The present value is calculated using an interest rate of 4% for payments of SEK 16 million and an interest rate of 3% for payments of SEK 4 million.
Group parent Company
amounts in SeK million 2014 2013 2014 2013
payment due for long-term contingent earn-out payments in other currencies
Payable in 2015 – 15 – 10
Payable in 2016 101 30 65 –
total long-term contingent earn-out payments in other currencies 101 45 65 10
By other currencies is meant GBP, CHF and KRW, of which GBP amounts to the equivalent of SEK 65 million and CHF to the equiva-lent of SEK 34 million. The present value is calculated using an inter-est rate of 4% for payments of SEK 65 million and an interest rate of 5% for payments of SEK 36 million.
Note 22continued
Group parent Company
amounts in SeK million 2014 2013 2014 2013
Maturity dates for long-term loans in SeK
Maturity 2015 – 800 – 800
Maturity 2016 300 300 300 300
Maturity 2017 0 0 0 0
Maturity 2018 200 201 200 200
Maturity 2019 or later 3 3 – –
total long-term borrowings in SeK million 504 1,304 500 1,300
Long-term loans in SEK carry variable rates of interest. The carry-ing amount corresponds to fair value. The Parent Company has entered into contracts to hedge part of its borrowing that is at variable interest rates to fixed interest rates. See note 2.
Group parent Company
amounts in eur million 2014 2013 2014 2013
Maturity dates for long-term loans in eur
Maturity 2015 – 17.1 – 17.0
Maturity 2016 22.0 22.0 22.0 22.0
Maturity 2017 0.0 9.0 – 9.0
Maturity 2018 0.1 0.1 – –
Maturity 2019 or later 0.3 0.3 – –
total long-term borrowings in eur million 22.4 48.5 22.0 48.0
Corresponding amounts in SeK million 213 433 209 429
Long-term loans in EUR carry variable rates of interest. The carrying amount corresponds to fair value.
Group parent Company
amounts in SeK million 2014 2013 2014 2013
Maturity dates for long-term loans in other currencies
Maturity 2015 – 1 – –
Maturity 2016 11 4 – –
Maturity 2017 12 8 – –
Maturity 2018 8 8 – –
Maturity 2019 or later 34 32 – –
total long-term borrowings in other currencies 65 53 – –
By other currencies is meant GBP, KRW, LKR and MYR. The loans have both variable and fixed rates of interest. The difference between fair value and the carrying amount is negligible.
Notes » INDUTRADE 67 «A N N UA L R EP O RT 2014
Note 23Pension obligations
The pension plans in the Indutrade Group are both defined benefit and defined contribution plans.
Defined benefit plans In accordance with IAS 19 Employee Benefits, actuaries commis-sioned by Indutrade have computed the Group’s pension liability and the provisions to be made on a regular basis for pensions for the Group’s employees.
The Group has applied IAS 19 Employee Benefits (revised) since 2013.
The pension plans include retirement pensions, disability pen-sions and family pensions. Calculations are done individually and are based on the employee’s salary, previously earned pension benefits and the anticipated remaining service period. Apart from the PRI plan in Sweden, the Group has defined benefit plans primarily in the Netherlands, Switzerland and the UK. Switzerland has a risk-sharing system for defined benefit plans in which the risk is split between the company and the employees. The plan in the UK was closed for new contributions in 2014.
Breakdown of net liability in SEK million
2014 2013
PRI plan 113 101
Defined benefit plans, the Netherlands, Swit-zerland and the UK 105 53
total defined benefit plans 218 154
Other pension obligations 15 13
total 233 167
The Group’s plan assets, totalling SEK 669 million (425), consist for Switzerland and the Netherlands of investments with insur-ance companies, mainly in government bonds, corporate bonds and interest rate derivatives. Plan assets in the UK consist of equities and equity funds, government and corporate bonds, and liquid assets. The pension liability is irrevocable.
Defined contribution plans The pension plans include retirement pensions, disability pensions and family pensions. Premiums are paid on a regular basis during the year to independent legal entities. The size of the pension premiums is based on the individual employee’s salary, and the cost of the premium is recognised on a continuing basis through profit or loss.
According to a pronouncement from the Swedish Financial Reporting Board, retirement pension and family pension obliga-tions secured through insurance with Alecta for salaried employ-ees in Sweden are classified as multi-employer defined benefit plans. For 2014 Indutrade does not have access to such informa-tion that would make it possible to report this plan as a defined benefit plan, which is why the plan is reported as a defined contribution plan. Premiums paid during the year for pension plans with Alecta amounted to approximately SEK 14 million (16). Premiums for 2015 are expected to be in line with 2014. Alecta’s collective funding ratio was 143% (148%) in December 2014.
Assumptions used in actuarial computationsThe discount rate for defined benefit plans in the Netherlands, Switzerland and the UK is based on the market return of high quality corporate bonds. For calculations of defined benefit pension obligations in Sweden, as from 2011 the discount rate is based on the yield of mortgage bonds with a term that corre-sponds to the average term for the obligations.
The duration of the pension obligation is estimated at 18 years in Sweden, 18 years in the Netherlands, 17 years in Switzerland, and 15 years in the UK.
Sensitivity analysis for changes in significant assumptions:
Impact on the defined benefit obligation, SeK million Sw
ed
en
net
her
-la
nd
s
Swit
zer-
lan
d
uK
Discount rate, increase by 1.00% –16 –62 –35 – 11
Discount rate, decrease by 1.00% 20 90 50 11
Salary increase of 1.00% 10 12 5 0
Actuarial gains and losses, including payroll taxes in Sweden, are recognised in other comprehensive income. At the end of the financial year, accumulated actuarial losses recognised in compre-hensive income amounted to SEK 107 million (52).
Group
2014
assumptions in calculating pension obligations Sw
ed
en
net
her
-la
nd
s
Swit
zer-
lan
d
uK
Discount rate, % 2.30 2.30 1.65 3.60
Future salary increases, % 2.75 2.50 1.00 –
Anticipated inflation, % 1.25 2.00 0.50 3.10
Future pension increases, % 1.25 1.80 0.00 2.40
Employee turnover, % 2.00 1) 1) –
1) Age-related
2013
assumptions in calculating pension obligations Sw
ed
en
net
her
-la
nd
s
Swit
zer-
lan
d
Discount rate, % 3.70 3.50 2.40
Future salary increases, % 3.50 2.50 1.00
Anticipated inflation, % 2.00 2.00 0.50
Future pension increases, % 2.00 1.80 0.00
Employee turnover, % 2.00 1) 1)
» 68 INDUTRADE « Notes A N N UA L R EP O RT 2014
Group 2014 2013
amounts reported in income statement
Defined benefit
plans
Defined contribu-
tion plans total
Defined benefit
plans
Defined contribu-
tion plans total
Current service cost 15 159 174 19 136 155
Interest on obligation 19 – 19 16 – 16
Interest income on plan assets –15 – –15 –12 – –12
net cost in income statement 19 159 178 23 136 159
Of which, included in selling costs 15 121 136 19 106 125
Of which, included in administrative expenses 0 38 38 0 30 30
Of which, included in financial items 4 – 4 4 – 4
Anticipated company contributions to defined benefit pension plans in 2015 amount to SEK 20 million (17).
2014 2013
Present value of pension obligations at start of year 579 534
Pension costs 15 19
Interest expenses 19 16
Employee contributions 7 6
Pension payments –23 –5
Company acquisitions 127 –
Actuarial gains (–)/losses (+) 115 –6
Exchange rate differences 48 15
present value of pension obligations at year-end 887 579
Plan assets at start of year 425 378
Interest income 15 12
Employee contributions 9 7
Company contributions 17 14
Pension payments –20 –2
Company acquisitions 116 –
Return on plan assets, excl. interest income 64 3
Exchange rate differences 43 13
plan assets at year-end 669 425
Net liability at start of year 154 156
Net cost reported in the income statement 19 23
Pension payments –5 –4
Company contributions –17 –14
Company acquisitions 11 –
Actuarial gains (–)/losses (+) 51 –9
Exchange rate differences in foreign plans 5 2
net liability at year-end 218 154
Note 23continued
amounts reported on the balance sheet 2014 2013
Present value of funded obligations 774 478
Fair value of plan assets –669 –425
105 53
Present value of unfunded obligations 113 101
113 101
net liability, defined benefit plans, on balance sheet 218 154
revaluation in other comprehensive income
Experience-based adjustments of defined benefit obligations 5 –1
Return on plan assets, excl. interest income –64 –3
Demographic adjustments of defined benefit obligations 1 0
Financial adjustments of defined benefit obligations 109 –5
total 51 –9
Notes » INDUTRADE 69 «A N N UA L R EP O RT 2014
Note 24Other provisions
Group parent Company
2014 2013 2014 2013
Guarantee commitments 8 9 – –
total long-term provisions 8 9 – –
Guarantee commitments
opening balance, 1 January 2014 9
Guarantee commitments in acquired companies –
Change in guarantee commitments for the year –1
Closing balance, 31 December 2014 8
Note 25Accrued expenses and deferred income
Group parent Company
2014 2013 2014 2013
Accrued personnel-related expenses 318 285 16 10
Derivative instruments 1) – 27 – –
Interest 6 11 5 10
Other 121 142 1 2
total 445 465 22 22
1) Starting in 2014, derivative instruments are reported in Other current liabilities.
Note 26Pledged assets
Group parent Company
2014 2013 2014 2013
For own liabilities:
Real estate mortgages 119 76 – –
Chattel mortgages 46 86 – –
Assets subject to liens 78 76 – –
Endowment insurance policies 10 8 8 6
total 253 246 8 6
Car leases are reported as finance leases in accordance with IFRS, entailing an increase in assets, liabilities and pledged assets of SEK 78 million (76).
Note 27Contingent liabilities
Group parent Company
2014 2013 2014 2013
Contingent liabilities for subsidiaries’ PRI liabilities – – 78 76
Guarantees pledged for the benefit of subsidiaries – – 36 36
Contingent liabilities for own PRI liabilities 2 2 – –
total 2 2 114 112
Note 28Cash and cash equivalents
Cash and cash equivalents on the balance sheet and statement of cash flows consist of:
2014 2013 2014 2013
Cash and bank balances 351 258 – 7
Short-term investments 6 3 – –
total 357 261 – 7
Note 29Acquisitions and divestments of subsidiaries
Acquisitions 2014All of the shares were acquired in AP Tobler AG, Switzerland; Svenska Geotech AB, Sweden; Corrosion Resistant Products Ltd (CRP), Micro Spring and Presswork Ltd, Birmingham Specialities Ltd, ALH Systems Ltd and Bailey Morris Ltd, UK; BL Products AB, Winab Vikväggar AB and Gelins-KGK AB, Sweden; and Verbeeck Packaging Group B.V., the Netherlands.
Industrial ComponentsSvenska Geotech AB, with annual sales of SEK 40 million, imports and supplies building site preparation and civil engineering prod-ucts to companies in the infrastructure segment. The company is consolidated in the Group as from 17 March 2014.
BL Products AB, with annual sales of SEK 20 million, sells and installs packaging machinery. The company is consolidated in the Group as from 22 September 2014.
Gelins-KGK AB, with annual sales of SEK 110 million, is a technology sales company that supplies industrial components to Swedish industry and farm equipment. The company is consoli-dated in the Group as from 20 October 2014.
Fluids & Mechanical SolutionsWinab Vikväggar AB, with annual sales of SEK 90 million, is a leading manufacturer of folding partitions and partition walls for customers in the private and public sectors. The company is consolidated in the Group as from 1 October 2014.

» 70 INDUTRADE « Notes A N N UA L R EP O RT 2014
Special ProductsAP Tobler AG, with annual sales of approximately SEK 37 million, specialises in surface treatment of stainless steel and aluminium equipment for the pharmaceutical industry. The company is con-solidated in the Group as from 1 January 2014.
CRP Ltd, with annual sales of SEK 110 million, manufactures and supplies corrosion-resistant piping, valves and expansion bellows. The company is consolidated in the Group as from 13 May 2014.
Micro Spring and Presswork Ltd, with annual sales of SEK 40 million, manufactures industrial springs and stampings. The com-pany is consolidated in the Group as from 17 June 2014.
Birmingham Specialities Ltd, with annual sales of SEK 60 mil-lion, is a specialist manufacturer of industrial components. The company is consolidated in the Group as from 18 June 2014.
ALH Systems Ltd, with annual sales of SEK 60 million, special-ises in the manufacture and sale of encapsulants, sealants and adhesives. The company is consolidated in the Group as from 26 June 2014.
Bailey Morris Ltd, with annual sales of SEK 70 million, is a manufacturer of driveshafts, propshafts and specialist compo-nents. The company is consolidated in the Group as from 15 August 2014.
Verbeeck Packaging Group B.V., with annual sales of SEK 45 million, specialises in packaging solutions for the cosmetics, pharmaceutical, food and household sectors. The company is consolidated in the Group as from 10 December 2014.
Effects of acquisitions carried out in 2013 and 2014
pertains to the impact on the 2014 income statement Jan–Dec
SeK million net sales eBIta
Business area
Engineering & Equipment – –
Flow Technology – –
Fluids & Mechanical Solutions 21 3
Industrial Components 109 19
Special Products 468 92
effect on Group 598 114
Acquisitions completed in 2013 251 44
Acquisitions completed in 2014 347 70
effect on Group 598 114
If the acquired units had been consolidated as from 1 January 2014, net sales would have increased by SEK 389 million to SEK 10,135 million, and EBITA would have increased by SEK 54 million to SEK 1,188 million.
Acquired assets in AP Tobler AG, Svenska Geotech AB, Corrosion Resistant Products Ltd, Micro Spring and Press-work Ltd, Birmingham Specialities Ltd, ALH Systems Ltd, Bailey Morris Ltd, BL Products AB, winab Vikväggar AB, Gelins KGK AB and Verbeeck Packaging Group B.V.
preliminary purchase price allocation SeK
million
Purchase price, incl. contingent earn-out payments totalling SEK 115 million 735
Book value
Fair value
adjust-ment
Fair value
acquired assets
Goodwill – 247 247
Agencies, customer relationships, licences, etc. 1 257 258
Property, plant and equipment 70 5 75
Financial assets 0 – 0
Inventories 108 – 108
Other current assets 1) 154 – 154
Cash and cash equivalents 108 – 108
Deferred tax liability –10 –54 –64
Borrowings and pension obligations –7 – –7
Other operating liabilities –144 – –144
280 455 735
1) Mainly trade accounts receivable.
Since disclosures about the individual acquisitions are insignifi-cant, they are provided here in aggregate form. The cost of cus-tomer relationships and agencies has been valued at one-half to one year’s gross margin and is reported on the balance sheet as agencies, customer relationships, licences, etc. They will be amor-tised over a period of 10 years. Goodwill is justified by the good profitability and personnel included in the acquired companies.
Indutrade normally uses an acquisition structure entailing a base level of consideration plus a contingent earn-out payment. The contingent earn-out payments are based on the earnings of the acquired companies during the years immediately ahead. Ini-tially, the contingent earn-out payments are valued at the present value of the likely outcome, which for the acquisitions made dur-ing the year amount to SEK 115 million. The contingent earn-out payments fall due for payment within 4 years and can amount to a maximum of SEK 123 million. If the conditions are not met, the outcome can be in the range of SEK 0-123 million.
Transaction costs for the acquisitions carried out during the year totalled SEK 5 million (6) and are included in Other operat-ing expenses in the income statement. Contingent earn-out payments have been restated in the amount of SEK 101 million (89). The income is reported among Other operating income in the income statement in the amount of SEK 94 million and in net financial items in the amount of SEK 7 million. In connection with a new assessment of contingent earn-out payments, goodwill in these companies has also been tested for impairment. As a result of this impairment testing, an impairment loss of SEK 3 million has been recognised for goodwill in the Group. Perfor-mance is positive for most of these operations, but not at the level required for payment of the contingent consideration. This
Note 29continued
Notes » INDUTRADE 71 «A N N UA L R EP O RT 2014
charge is reported under Other operating expenses in the income statement.
The purchase price allocation calculations for Medexa Diag-nostisk Service AB, Kin Pompentechniek B.V. and Verplas Ltd, which were acquired in October and November 2013, have now been finalised. No significant adjustments have been made in the calculations. For other acquisitions, the purchase price allocation calculations are preliminary. Indutrade regards the calculations as preliminary during the time that uncertainty exists with respect to, for example, the outcome of guarantees in the acquisition agreements concerning inventories and trade accounts receivable.
effect on cash flow, SeK million
Purchase price, incl. contingent earn-out payments 735
Purchase price not paid out –115
Cash and cash equivalents in acquired companies –108
Payments pertaining to previous years’ acquisitions 73
total effect on cash flow 585
Acquisitions 2013All of the shares were acquired in Thermotech AS, Norway; ESI Technologies Ltd, Ireland; AMAB (Allen Myrin Aktiebolag), the operations of Micro Joining KB, and Medexa Diagnostisk Service AB, Sweden; Kin Pompentechniek B.V., the Netherlands; and Verplas Ltd, UK.
Industrial ComponentsThermotech AS, with annual sales of SEK 70 million, sells prod-ucts and services in the areas of heat treatment, machine service and bolt tension. The company is consolidated in the Group as from 1 January 2013.
AMAB, with annual sales of SEK 35 million, is one of the Swed-ish market’s leading suppliers of medical alert systems, monitor-ing systems and security systems to the healthcare sector. The company is consolidated in the Group as from 1 July 2013.
The operations of Micro Joining KB were acquired and are con-solidated in the Group as from 1 September 2013. Micro Joining sells adhesives, components and materials, with annual sales of SEK 15 million.
Medexa Diagnostisk Service AB, with annual sales of SEK 25 million, specialises in high-end technology for healthcare with a focus on foetal surveillance and ultrasound applications. The company is consolidated in the Group as from 8 October 2013.
Special ProductsESI Technologies Ltd, with annual sales of SEK 160 million, is a technology sales company specialising in flow technology. Busi-ness is conducted in Ireland and the UK. Customers are mainly in the pharmaceutical, chemical, and oil and gas industries. The company is consolidated in the Group as from 1 April 2013.
Kin Pompentechniek B.V., with annual sales of SEK 76 million, sells pumps from leading suppliers and is consolidated in the Group as from 1 November 2013.
Verplas Ltd, with annual sales of SEK 80 million, manufactures and distributes a range of rigid and flexible ventilation products, and is consolidated in the Group as from 22 November 2013.
Effects of acquisitions made in 2012 and 2013
refers to impact on the income statement for 2013 Jan–Dec
SeK million net sales eBIta
Business area
Engineering & Equipment 18 1
Flow Technology 24 3
Fluids & Mechanical Solutions 26 4
Industrial Components 159 38
Special Products 321 42
effect on Group 548 88
Acquisitions completed in 2012 310 47
Acquisitions completed in 2013 238 41
effect on Group 548 88
If the units acquired in 2013 had been consolidated as from 1 January 2013, net sales would have would have increased by SEK 210 million to SEK 9,041 million, and EBITA would have increased by SEK 32 million to SEK 1,022 million.
Acquired assets in Thermotech AS, ESI Technologies Ltd, AMAB, Micro joining, Medexa Diagnostisk Service AB, Kin Pompentechniek B.V. and Verplas Ltd.
preliminary purchase price allocation SeK
million
Purchase price including contingent earn-out payments of SEK 98 million 550
Book value
Fair value
adjust-ment
Fair value
acquired assets
Goodwill – 200 200
Agencies, trademarks, customer relationships, licences, etc. – 196 196
Property, plant and equipment 27 – 27
Financial assets 0 – 0
Inventories 56 – 56
Other current assets 1) 106 4 110
Cash and cash equivalents 117 – 117
Deferred tax liability –4 –40 –44
Borrowings and pension obligations –7 – –7
Other operating liabilities –105 – –105
190 360 550
1) Mainly trade accounts receivable.
Since disclosures about the individual acquisitions are insignifi-cant, they are provided here in aggregate form. The cost of cus-tomer relationships and agencies has been valued at one-half to one year’s gross margin and is reported on the balance sheet as
Note 29continued
» 72 INDUTRADE « Notes A N N UA L R EP O RT 2014
agencies, trademarks, customer relationships, licences, etc. They will be amortised over a period of 10-20 years, except for trade-marks, which are assumed to have an indefinite life. Trademarks are included in the amount of SEK 8 million. Goodwill is justified by the good profitability and personnel included in the acquired companies.
Indutrade normally uses an acquisition structure entailing a base level of consideration plus a contingent earn-out payment. The contingent earn-out payments are based on the earnings of the acquired companies during the years immediately ahead. Ini-tially, the contingent earn-out payments are valued at the present value of the likely outcome, which for the acquisitions made dur-ing 2013 amount to SEK 98 million. The contingent earn-out pay-ments fall due for payment within 1 to 5 years and can amount to a maximum of SEK 102 million. If the conditions are not met, the outcome may be in the range of SEK 0-102 million.
Transaction costs for the acquisitions carried out during 2013 totalled SEK 6 million (2) and are included in Other operating ex-penses in the income statement. Contingent earn-out payments have been revalued by SEK 89 million (9). The income is reported among Other operating income in the income statement. In con-nection with a new assessment of contingent earn-out payments, goodwill in these companies has also been tested for impairment. As a result of this impairment testing, an impairment loss of SEK 82 million has been recognised for goodwill in the Group. This charge is reported under Other operating expenses in the income statement.
effect on cash flow
Purchase price, including contingent earn-out payments 550
Contingent earn-out payments not yet paid out –98
Cash and cash equivalents in acquired companies –117
Contingent earn-out payments pertaining to previous years’ acquisitions 128
total effect on cash flow 463
Divestment 2013In December, parts of the operations of Gedevelop AB (in the Special Products business area) were divested, with net sales of SEK 10 million. The sale generated a capital gain of SEK 17 mil-lion.
Acquisitions after the end of the reporting periodIn early January 2015 the acquisition of Flowtec Industrietechnik GmbH (Austria) was completed. Flowtec, with annual sales of SEK 80 million, is a technology sales company that sells indus-trial components in Austria and Eastern Europe. The company is included in the Special Products business area as from 1 January 2015.
On 9 January Indutrade acquired Adaero Precision Compo-nents Ltd (UK), with annual sales of SEK 50 million. The company manufactures customised high precision industrial components and is included in the Special Products business area.
On 9 January Indutrade also acquired Cepro International BV (Netherlands), with annual sales of SEK 70 million. Cepro manu-factures products for welding and grinding work stations, and is included in the Special Products business area.
On 22 January Indutrade acquired Sepab Fordonsprodukter AB (Sweden), with annual sales of SEK 50 million. With focus on commercial vehicles, Sepab develops products for safety, national adaptation, efficiency and comfort. Sepab is included in the Measurement & Sensor Technology business area.
On 6 March Indutrade acquired Filtration Ltd (UK), with annual sales of SEK 30 million. Filtration Ltd supplies high quality filters from leading manufacturers. Filtration Ltd is included in the Special Products business area.
On 12 March Indutrade acquired Combilent A/S (Denmark), with annual sales of SEK 100 million. Combilent is a leading provider of combiners and filters for communication systems. Combilent is included in the Measurement & Sensor Technology business area.
On 18 March Indutrade acquired Milltech Precision Engineering Ltd (UK), with annual sales of SEK 45 million. Milltech is a specialist machining and assembly sub-contractor of high precision compo-nents. Milltech is included in the Special Products business area.
Preliminary purchase price allocation calculations will be presented in the first quarter interim report for 2015.
Note 30Related party transactions
Intra-Group purchases and sales have been only negligible. Invest-ments with and borrowings from Group companies have been made on an arm’s length basis.
The Indutrade Group’s related parties consist mainly of senior executives. Disclosures of transactions with these related parties are provided in note 7, Wages, salaries and other remuneration, and social security costs.
Note 31Events after the balance sheet date
Effective 1 January 2015 the Indutrade Group is organised in six business areas, instead of five as previously. The change has been carried out by breaking away companies active in measurement and sensor technology from the Special Products business area into the newly formed Measurement & Sensor Technology business area. The aim of the change is to strengthen focus and thereby the conditions for continued growth in the Group. Pro forma figures for the 2014 and 2013 financial years according to the new struc-ture are provided in note 3 and on page 15 of this report.
Seven company acquisitions were carried out, of which four in January and three in March. For further information on these acquisitions, see note 29.
On 1 January Patrik Stolpe took office as President of the new Measurement & Sensor Technology business area. He joins Indutrade from a position within the Xylem Group. Patrik Stolpe, together with Susann Nyberg, Head of Group Finance, are new members of Indutrade’s executive management as from 1 January 2015.
In other respects, no significant events for the Group have occurred after the end of the reporting period.
Note 29continued
Notes / Assurance » INDUTRADE 73 «A N N UA L R EP O RT 2014
The Board’s assuranceThe Board of Directors and President certify that the consolidated financial statements and annual report have been prepared in ac-cordance with International Financial Reporting Standards (IFRS) and generally accepted accounting principles and give a true and fair presentation of the Group’s and Parent Company’s position and result of operations. The Directors’ Report for the Group and
Parent Company gives a true and fair overview of the Group’s and Parent Company’s operations, position and result of opera-tions and describes material risks and uncertainties facing the Parent Company and companies included in the Group.
The Group’s and Parent Company’s result of operations and position in general are shown in the preceding income state-ments, balance sheets, cash flow statements and notes.
Stockholm, 20 March 2015
Fredrik LundbergChairman of the Board
Bengt KjellVice Chairman of the Board
Eva FärnstrandDirector
Martin LindqvistDirector
Ulf LundahlDirector
Krister MellvéDirector
Lars PetterssonDirector
Johnny Alvarsson President and CEO, Director
Our audit report was submitted on 23 March 2015PricewaterhouseCoopers AB
Michael BengtssonAuthorised Public Accountant
Indutrade AB, reg. no. 556017-9367, is the Parent Company of the Group. The Company is a Swedish limited liability company with registered office in Stockholm, Sweden. Address:
Indutrade ABBox 6044SE-164 06 KistaSwedenTel. +46-8-703 03 00Website: www.indutrade.se
The share capital of Indutrade AB as per 31 December 2013 and 2014 consisted of 40,000,000 shares with a share quota value of SEK 1.
At the Annual General Meeting on 29 April 2015, a dividend of SEK 7.75 per share will be proposed for the 2014 financial year, for a total of SEK 310 million. The proposed dividend has not been reported as a liability in these financial statements.
Note 32Disclosures about Parent Company
» 74 INDUTRADE « Audit Report A N N UA L R EP O RT 2014
audit report
Report on the annual accounts and consolidated accountsWe have audited the annual accounts and consolidated accounts of Indutrade AB (publ) for the year 2014. The annual accounts and consolidated accounts of the company are included in the printed version of this document on pages 19-73 and appendix to note 17 Shares and participations.
Responsibilities of the Board of Directors and the President for the annual accounts and consolidated accounts The Board of Directors and the President are responsible for the preparation and fair presentation of these annual accounts and consolidated accounts in accordance with International Financial Reporting Standards, as adopted by the EU, and the Annual Ac-counts Act, and for such internal control as the Board of Directors and the President determine is necessary to enable the prepara-tion of annual accounts and consolidated accounts that are free from material misstatement, whether due to fraud or error.
Auditor’s responsibility Our responsibility is to express an opinion on these annual accounts and consolidated accounts based on our audit. We con-ducted our audit in accordance with International Standards on Auditing and generally accepted auditing standards in Sweden. Those standards require that we comply with ethical require-ments and plan and perform the audit to obtain reasonable assurance about whether the annual accounts and consolidated accounts are free from material misstatement.
An audit involves performing procedures to obtain audit evi-dence about the amounts and disclosures in the annual accounts and consolidated accounts. The procedures selected depend on the auditor’s judgment, including the assessment of the risks of material misstatement of the annual accounts and consolidated accounts, whether due to fraud or error. In making those risk assessments, the auditor considers internal control relevant to the company’s preparation and fair presentation of the annual accounts and consolidated accounts in order to design audit procedures that are appropriate in the circumstances, but not for the purpose of expressing an opinion on the effectiveness of the company’s internal control. An audit also includes evaluating the appropriateness of accounting policies used and the reasonable-ness of accounting estimates made by the Board of Directors and the President, as well as evaluating the overall presentation of the annual accounts and consolidated accounts.
We believe that the audit evidence we have obtained is suf-ficient and appropriate to provide a basis for our audit opinion.
OpinionsIn our opinion, the annual accounts have been prepared in ac-cordance with the Annual Accounts Act and present fairly, in all material respects, the financial position of the parent company as of 31 December 2014, and of its financial performance and its cash flows for the year then ended in accordance with the Annual Accounts Act, and the consolidated accounts have been prepared
in accordance with the Annual Accounts Act and present fairly, in all material respects, the financial position of the group as of 31 December 2014, and of their financial performance and cash flows in accordance with International Financial Reporting Standards, as adopted by the EU, and the Annual Accounts Act. A corporate governance statement has been prepared. The directors’ report and the corporate governance report are consistent with the other parts of the annual accounts and consolidated accounts.
We therefore recommend that the annual meeting of sharehold-ers adopt the income statement and balance sheet for the parent company and the group.
Report on other legal and regulatory requirements In addition to our audit of the annual accounts and consolidated accounts, we have examined the proposed appropriations of the company’s profit or loss and the administration of the Board of Di-rectors and the President of Indutrade AB (publ) for the year 2014.
Responsibilities of the Board of Directors and the PresidentThe Board of Directors is responsible for the proposal for appro-priations of the company’s profit or loss, and the Board of Directors and the President are responsible for administration under the Companies Act.
Auditor’s responsibility Our responsibility is to express an opinion with reasonable assur-ance on the proposed appropriations of the company’s profit or loss and on the administration based on our audit. We conducted the audit in accordance with generally accepted auditing standards in Sweden.
As a basis for our opinion on the Board of Directors’ proposed appropriations of the company’s profit or loss, we examined the Board of Directors’ reasoned statement and a selection of support-ing evidence in order to be able to assess whether the proposal is in accordance with the Companies Act.
As a basis for our opinion concerning discharge from liability, in addition to our audit of the annual accounts and consolidated accounts, we examined significant decisions, actions taken and circumstances of the company in order to determine whether any member of the Board of Directors or the President is liable to the company. We also examined whether any member of the Board of Directors or the President has, in any other way, acted in contra-vention of the Companies Act, the Annual Accounts Act or the Articles of Association.
We believe that the audit evidence we have obtained is sufficient and appropriate to provide a basis for our opinion.
OpinionsWe recommend to the annual meeting of shareholders that the profit be appropriated in accordance with the proposal in the statutory administration report and that the members of the Board of Directors and the President be discharged from liability for the financial year.
Stockholm, 23 March 2015 PricewaterhouseCoopers AB
Michael BengtssonAuthorised Public Accountant
to tHe annual MeetInG oF tHe SHareHolDerS oF InDutraDe aB (puBl) Corporate IDentItY nuMBer 556017-9367

A N N UA L R EP O RT 2014 Annual General Meeting and reporting dates » INDUTRADE 75 «
annual General Meeting and reporting datesAnnual General MeetingTime and placeThe Annual General Meeting will be held at 4 p.m. on Wednes-day, 29 April 2015, at IVA Konferenscenter, Wallenberg room, Grev Turegatan 16, Stockholm.
Who is entitled to participate?To be entitled to participate in the Annual General Meeting, shareholders must be listed in the shareholder register main-tained by Euroclear Sweden AB on Thursday, 23 April 2015, and have notified the Company of their intention to participate by Thursday, 23 April 2015, at the latest.
How to become registered in the shareholder register?Shareholders who have registered their shares in their own name with Euroclear are automatically entered in the shareholder reg-ister. Shareholders whose shares are registered in the names of a trustee must have their shares re-registered temporarily in their own names well in advance of 23 April to be eligible to partici-pate in the Annual General Meeting.
Notification of attendanceNotification of intention to attend the Meeting can be made using one of the following alternatives:• On the Company’s website: www.indutrade.se• By e-mail to: [email protected]• By post to: Indutrade AB, Box 6044, SE-164 06 Kista• By phone +46 (0)8 703 03 00
Upon notification, shareholders must indicate their:• name• personal identity number or corporate identity number• address and phone number
Notification must be received by the Company no later than Friday 24 April 2015.
ProxiesShareholders may exercise their right to participate in the Annual General Meeting through appointment of a proxy with power of attorney. Such power of attorney must be in writing and should be sent to the Company well in advance of the AGM at the above address. Proxies for legal entities must also submit a certified copy of a certificate of incorporation or corresponding authorisa-tion document.
DividendThe dividend will be paid to shareholders who on the record date, 4 May 2015, are registered in the shareholder register. Provided that the Annual General Meeting resolves in accordance with the Board’s proposal, payment of the dividend is expected to be made via Euroclear Sweden on 7 May 2015.
Reporting datesInterim report 1 January–31 March 2015 29 April 20151 January–30 June 2015 23 July 2015 1 January–30 September 2015 29 October 2015
ContaCt InForMatIon
Indutrade AB, Box 6044, SE-164 06 Kista, Sweden
Visitor’s address: Raseborgsgatan 9
Reg.no. 556017-9367
Tel: +46 (0)8 703 03 00, e-mail: [email protected], www.indutrade.se