inf5180 product and process improvement in software - citeseer
TRANSCRIPT

INF5180 Product and Process Improvement in Software Development
Fall 2006 Page 1 of 23
UNIVERSITY OF OSLO Faculty of Mathematics and Natural Sciences INF5180 – Product and Process Improvement in Software Development Fall 2006 Is software process improvement best seen as science or engineering? A discussion of the Deming perspective by looking at a case of COBOL programmers at the Norwegian Directorate of Taxes Written by: Petter Øgland Submitted: 28.11.06
INF5180 Product and Process Improvement in Software Development
Fall 2006 Page 2 of 23
Abstract We believe there are basically two ways of implementing software process improvement (SPI), either from the perspective of engineering or from the perspective of research. We argue that the path suggested to W. E. Deming can be seen as a research approach, while most of the SPI literature based on Deming, take the engineering approach. We would like to know whether there are any practical differences when applying the scientific philosophy of Deming rather than choosing a typical SPI engineering philosophy. In order to study this, we look at a SPI case of software maintenance at the Norwegian Directorate of Taxes (NTAX), wanting to see whether the Deming lens will give insights that will not be evident otherwise. When analyzing the empirical data against Deming’s “system of profound knowledge” we notice that Deming’s view on the theory of knowledge requires software quality assurance (SQA) to have a working theory on how to achieve process improvements, and that this theory needs to be updated as observations are being made from Statistical Process Control (SPC) and other statistical investigations, hypotheses are being made and tested. Despite this approach focusing first on theory and then on practical results, the philosophy does not seem to add anything to SPI beyond the fact that one needs a documented quality management system, based on standards like ISO 9001, CMMI or CobiT, in order to document the theory in a way that makes it useful for making predictions and possible to revise. What Deming’s “system of profound knowledge” does seem to contribute to SPI theory, however, is a simple checklist, consisting of four points, in order to make sure that any SPI effort is not superficially implemented but implemented with a basis in science.

INF5180 Product and Process Improvement in Software Development
Fall 2006 Page 3 of 23
Table of Contents Abstract ............................................................................................................................... 2 1 Introduction................................................................................................................. 4 2 Theoretical framework................................................................................................ 6
2.1 Appreciation of a system .................................................................................... 6 2.2 Understanding of variation ................................................................................. 7 2.3 Theory of knowledge .......................................................................................... 7 2.4 Psychology.......................................................................................................... 8
3 Methodology............................................................................................................... 9 3.1 Selecting a case ................................................................................................... 9 3.2 Population and sampling procedure.................................................................... 9 3.3 Research instruments .......................................................................................... 9
4 Case description ........................................................................................................ 10 4.1 The COBOL software maintenance system...................................................... 10 4.2 Measurements and feedback ............................................................................. 10 4.3 Improving the SPI system................................................................................. 13
4.3.1 Changes in data collection procedures...................................................... 13 4.3.2 Changes in data analysis and presentation of results ................................ 14 4.3.3 Integration with other systems .................................................................. 14
4.4 Understanding programmer psychology........................................................... 15 5 Discussion................................................................................................................. 16
5.1 Overview of findings ........................................................................................ 16 5.1.1 Appreciation for a system ......................................................................... 16 5.1.2 Knowledge about variation ....................................................................... 16 5.1.3 Theory of knowledge ................................................................................ 17 5.1.4 Psychology................................................................................................ 17
5.2 Implications for the study of the current theory................................................ 17 6 Conclusion ................................................................................................................ 19 References......................................................................................................................... 20 Appendix........................................................................................................................... 23

INF5180 Product and Process Improvement in Software Development
Fall 2006 Page 4 of 23
1 Introduction The Capability Maturity Model (CMM) has been described as an application of the concepts of Total Quality Management (TQM) to software development and maintenance (Paulk, 1995). W. E. Deming (1900-1993) has often been mentioned as one of the leading authorities in the TQM movement, and his name is often quoted in software process improvement (SPI) literature (e.g. Humphrey, 1989; Florac & Carleton, 1999; Chrissis, Konrad & Shrum, 2003; Poppendieck & Poppendieck, 2003; Sommerville, 2004; Ahern, Clouse & Turner, 2004; Boehm & Turner, 2004). Deming’s systematic summary of his thinking on performance improvement, arguably his most important contribution to management theory, was published posthumously (Deming, 1994). In this final work, he puts his ontology, epistemology, ethic into an integrated system of thought (figure 1).
Figure 1 – Deming’s “System of Profound Knowledge” (www.pmi.co.uk/values)
As some researchers have argued (e.g. Tsutsui, 1998: chapter 6), Deming’s main contribution to management theory can be seen as an improvement of the theory of scientific management (Taylor, 1911) through the application of statistical thinking and statistical methods. More specifically, his main contribution may be seen as linking Shewharts’ view on the scientific method from the viewpoint of quality control (Shewhart, 1939) with the early writing on operations research (Churchman, Ackoff & Arnoff, 1957). With a PhD in physics from Yale University, Deming spent most of his life as an academic, teaching at the New York University and publishing more than 150 scientific papers. However, he also worked as industry consultant on statistical methods, teaching how to apply the scientific method of doing empirical-statistical research (Wikipedia, 2006a).

INF5180 Product and Process Improvement in Software Development
Fall 2006 Page 5 of 23
Compared with quality management consultants viewing process improvement as an engineering problem (e.g. Juran, 1964; Shingo, 1987; Ohno, 1988; Womack et al, 1990; 2003), Deming was viewing process improvement as a scientific problem (Deming, 1986; 1994). As we have seen no such distinction in SPI literature, there seems to be a gap in the SPI body of knowledge. SPI literature seems to focus on how to build systems for software process improvement, rather than how to build systems (instruments) for researching software process improvement. In this document we put forward the hypothesis that the engineering approach is equally good or better than the scientific approach. We then look at a SPI experiment through the lens of Deming’s framework, trying to prove the hypothesis wrong, by showing how the scientific approach may be able to identify improvement opportunities that a strictly engineering approach would not do. The document is structured as follows: In chapter 2 we will give a short summary of Deming’s systematic philosophy, as viewed through the perspective of SPI and knowledge management (KM). In chapter 3 we will explain some SPI challenges at the Norwegian Directorate of Taxes (NTAX) and how we design an SPI system as an instrument for doing SPI research. In chapter 4 we present a summary of the results of the experiment. In chapter 5 we analyze the case through the use of Deming’s theory, discussing whether designing the SPI system as a research instrument seems to make it more useful. In chapter 6 we conclude that most SPI frameworks seem to be suitable for both the way of the engineer and the way of the scientist, and suggest that Deming’s “system of profound knowledge” could be used as a checklist when following the way of the scientist.

INF5180 Product and Process Improvement in Software Development
Fall 2006 Page 6 of 23
2 Theoretical framework In order to understand management and process improvement, Deming (1994) suggests looking at four components that are all related to each other:
• Appreciation of a system • Understanding variation • Theory of knowledge • Psychology
If we were to use this framework for the behavioral sciences, such as Tolman’s studies of rats finding food by running through mazes (Wikipedia, 2006b), the mazes would be the systems, the variation could be the variation in time for the rats to find food, theory of knowledge relates to how we relate the challenges of the maze to the performance results, and the psychology would be the psychology of the rats. While Tolman was interested in carrying out such experiments in order to understand aspects of cognition in animals and humans, Deming’s area of research was how to optimize systems of workflow. If we think of a software development company (including suppliers and customers) as rats in a maze, the problem is to coordinate the behavior of the rats, so the total workflow reaches an optimum for the total system.
2.1 Appreciation of a system Focusing on individual events rather than seeing the organization as a total system may cause workflow problems, like unclear expectations, poor predictions, optimal solutions for one area causing havoc in another area, and people getting blamed for events they have little or no control over. Software processes and management systems is a way of introducing systems in a software development organization (Sommerville, 2004). Requirements standards like some of the ISO, IEEE and SEI standards can be used for assessing current practice and provide goals for structural improvements. If we look at the SEI-CMM framework (Humphrey, 1989; Zahran, 1997), in addition to the roles of the software developers and the managers, there are additional roles defined, such as software quality assurance (SQA) and the software engineering process group (SEPG). Both SQA and SEPG fulfil roles that are more or less external to the production system. Why the CMM family of models seem to differentiate between the SQA and the SEPG (i.e. quality assurance and process improvement) does not seem fully clear, as most of the references in the SWEBOK on software engineering process and software quality are the same (Abran & Moore, 2004: Chapter 9 & 11). However, from the perspective of Deming, it seems reasonable to think of the SQA people as organizational scientists, collecting data in order to understand how the system works, while the SEPG people are

INF5180 Product and Process Improvement in Software Development
Fall 2006 Page 7 of 23
organizational engineers, using the analysis from the SQA people in order to redesign processes.
2.2 Understanding of variation Deming writes (1986: pp. 475-6): “There is no such thing as arrival exactly on time. In fact, exactly on time can not be defined. This principle came to my mind one day in Japan as I stepped on to the railway platform and observed the time to be six seconds before the scheduled time of arrival. Of course, I observed, it has to be ahead half the time, and behind half the time, if its performance is on time”. The idea behind statistical process control (SPC) is to help distinguish between variation inherent in the process and signals indicating something unexpected. Not being able to distinguish between process noise and process signals may lead to wrong conclusions and wrong decisions. One may see trends where there are no trends, and miss trends where there are trends. One may not be able to understand past performance, and may not be able to predict future performance.
2.3 Theory of knowledge From the perspective of trying to see quality control as science, the basic argument comes from Shewhart (1939: pp. 44-5): “It may be helpful to think of the three steps in the mass production process as steps in the scientific method. In this sense, specification, production, and inspection correspond respectively to making a hypothesis, carrying out an experiment, and testing the hypothesis. The three steps constitute a dynamic process of acquiring knowledge. From this viewpoint, it might be better to show them as forming a sort of spiral gradually approaching a circular path which would represent the idealized case where no evidence is found (during inspection) to indicate a need for changing the specification (or scientific hypothesis) no matter how many times we repeat the three steps. Mass production viewed this way constitutes a continuing a self-corrective method for making the most efficient use of raw and fabricated materials”. Deming refers to this cycle as the “Shewhart cycle” or the Plan-Do-Check-Act (PDCA) cycle (Deming, 1986: p. 88). This is the learning cycle of the Shewhart/Deming quality management thinking, producing knowledge about the workflow. When going into more philosophical detail on the theory of knowledge (epistemology), he (Deming, 1994: pp. 101-107) talks about prediction. In other words, from the perspective of the problems Shewhart and Deming wanted to understand, a proper understanding corresponds to having the statistical distribution of the parameter in concern. As a consequence of this, both Shewhart and Deming refer to C. I. Lewis (1929). Unlike other American pragmatists, Lewis based his philosophy on Kant and thus believed in Cartesian dualism. This means that he believed in cognitive maps (mental models) or what could perhaps be described as computer ontologies (Wikipedia, 2006c). From the viewpoint of TQM and SPI this may perhaps be interpreted in a simplified manner as knowledge consisting of pairs of ontologies and epistemologies, such as flowcharts and SPC diagrams, or Ishikawa diagrams and Pareto charts. In other words,

INF5180 Product and Process Improvement in Software Development
Fall 2006 Page 8 of 23
the Shewhart/Deming definition of knowledge seems to be quite similar to what has been suggested among people researching artificial intelligence (Russell & Norvig, 2003; Hawkins & Blakeslee, 2004). Given this perspective, learning can be measured along two dimensions. Firstly, a change in understanding may cause a change in the ontology model (i.e. a rewriting of a flowchart or an Ishikawa diagram), and, secondly, a change in understanding may result in a change in behaviour that may produce a new statistical distribution. Not being able to change theory (ontology model) makes behaviour remain the same, and there will be no sustainable improvements. Although the flowchart and Ishikawa diagrams represent “explicit knowledge”, i.e. knowledge that can be formulated in a written theory, Deming (1994: p. 102) also talks about ideas in general as theories: “The barnyard rooster Chanticleer had a theory. He crowed every morning, putting forth all his energy, flapped his wings. The sun came up. The connexion was clear: His crowing caused the sun to come up. There was no question about his importance. There came a snag. He forgot one morning to crow. The sun came up anyhow. Crestfallen, he saw his theory in need of revision”. However, when Nonaka and Tageuchi (1995) discuss organizational learning in Japan, based on the oriental philosophy of the oneness of the body and mind, the concept of “tacit knowledge” (personal knowledge that goes beyond what is easy to explain, such as knowledge of how to ride a bike and how to swim) plays an important part. Some of the Japanese quality experts (e.g. Imai, 1987; Shingo, 1987) seem to have a quality management philosophy that seems more like “intuitive engineering” than working scientifically by separating theory from empirical data. For Deming, however, theory plays a defining role in the theory of knowledge (Deming, 1994: p. 103): “Without theory there is nothing to revise. Without theory, experience has no meaning. Without theory, one has no questions to ask. Hence without theory, there is no learning”. Based on this quote, it does not seem that Deming considers knowledge based on root learning as proper learning, nor would he accept learning by trial and error as proper learning, unless the trial and error consisted of building a theory to match with the empirical experience.
2.4 Psychology Sometimes we may have simplistic and wrong theories about why people behave the way they do. When not understanding psychology, it is difficult to motivate and difficult to predict how people will behave.

INF5180 Product and Process Improvement in Software Development
Fall 2006 Page 9 of 23
3 Methodology
3.1 Selecting a case In 1997, one of the COBOL programmers died at the Norwegian Directorate of Taxes (NTAX), and other programmers had to step in. Due to a lack of a standard way of programming, this caused major problems, and everybody quickly realized that there was a severe need for a way of programming that would make the software maintainable. This case was used as an initial case for introducing SPI at NTAX in 2000. There were several reasons why it was chosen:
• The problem was a real problem with serious implications. • There was already a written management commitment towards standardizing
software (NTAX, 1998) • It seemed like an easy way of implementing measurement based SPI, with focus
on SPC, Pareto charts and internal benchmarking • If the project succeeded it could probably pave way for new SPI projects of
similar kind.
3.2 Population and sampling procedure Ten of the NTAX mainframe information systems are based on COBOL software, and need to be maintained on an annual basis. Seven of the systems (LFP, LEP, PSA, ER@, GLD, FLT, FOS) follow annual life cycles, meaning that maintenance and COBOL standardization are carried out during specific times of the year. The remaining three systems (MVA, DSF, RISK) are systems that are being maintained on an ongoing basis. The maintenance is taken care of by approximately 40 programmers, each of the projects delegated among three groups. The distribution between male and female programmers is about 50/50. The age distribution was from about mid thirties to mid sixties, with most of the people being in the age slot between 40 and 50. Few of the programmers have formal computer education, although the employment policy in recent years has focused on getting people with formal computer background.
3.3 Research instruments The research was designed as a part of a quality improvement strategy in 2000, and the research is carried out by a researcher being a part of the organization. In order to handle problems having to do with doing research in ones own organization, an action research approach for doing research in one’s own organization has been adopted (Coghlan & Brannick, 2001; Øgland, 2006a; 2006b).

INF5180 Product and Process Improvement in Software Development
Fall 2006 Page 10 of 23
4 Case description
4.1 The COBOL software maintenance system The diagram in figure 2 illustrates the general design of the SPI system. As explained in the methodology chapter, the running of the system started in 1997 with the death of a programmer and the decision to define a programming standard. A few years later, the standard was completed by the Software Engineering Process Group (SEPG), the programmers started adjusting new and old software to comply with the standard, and Software Quality Assurance (SQA) documented the results (NTAX, 2001).
Figure 2 – Flowchart for making software maintainable
Each turn of the inner loop lasts one year, and results in a SQA report being put forward to management. It is now the responsibility of the management to act upon this information in terms of (a) letting the process continue by default, (b) asking to have the standard revised or (c) demanding the process to end. So far the process has been running for six years (NTAX, 2001; 2002a; 2004; 2005; 2006). During the third iteration of the inner loop, the programmers were unhappy with the initial version of the standard, and thus got acceptance from management to have it revised. The process of revising the standard was monitoring by the SQA in terms of monitoring the process against NTAX procedures for updating internal standards (NTAX, 2003). Although the system was established with management commitment, and has been running for six years, documenting improvements year in and year out, it is not a very popular system among programmers. If trends tend to point in the wrong direction, as has happened a couple of times, managers also have a tendency for suggesting that the SQA should stop monitoring rather than encouraging the programmers to follow the standards. In 2007, the programmer who is providing SQA with measurement is expected to go into retirement, something that may cause the system to terminate.
4.2 Measurements and feedback The initial version of the internal COBOL standard was made by the SEPG asking for a group of programmers assembling as a standardization committee. The committee was
start Define /improvestandard
Develop code
Evaluate against standard
Act end

INF5180 Product and Process Improvement in Software Development
Fall 2006 Page 11 of 23
headed by the programmer who had to step in for the man who died a few years previously, thus making sure that the head of the committee was someone who understood the problem and was motivated to do something about it. All technical decisions were left for the programmers to decide, although the work was also coordinated with the SQA in order to make sure that the standard was formulated in a manner that would make it possible to define software metrics. The SQA also made sure that the standard was compliant with some of the standard literature on structured programming (e.g. Dijkstra). Once the standard had been completed and accepted by management, the SQA cooperated with the head of the COBOL standardization committee in order to define and implement software metrics. The idea was to produce a small number of metrics that were important to track and simple to implement. After some experimenting, the metrics system ended up with eleven tests, including tests that defined GOTOs and sections longer than 24 lines as errors, as had been defined in the standard. To compare error levels and improvement levels among the various software projects, some metrics consisted of measuring some index and then dividing by 1000 lines of code (KLOC).
y = -16,507x + 174,9R2 = 0,9807
020406080
100120140160180
1998 1999 2000 2001 2002 2003 2004 2005
Error level (LFP)Linear regression
113106
66 66 62 5850
25
13 9
0
20
40
60
80
100
120
LEP
MV
A
GLD
DS
F
ER
@
LFP
RIS
K
FOS
FLT
PS
A
Error level
Figure 3 – Standardization results from one project (LFP) and benchmarking result for this project (LFP) as compared to the other nine projects.
The diagram to the left in figure 3 illustrate how the approximately 75.000 lines of code of the software for the LFP project has been getting more and more compliant with the internal COBOL with every year. Included in the diagram is a regression line with a strong correlation coefficient. Although the standard was introduced on the LFP-2000 system, the diagram shows, somewhat unexpectedly, that the two years of historical data from the first year of data collection also indicate improvements.

INF5180 Product and Process Improvement in Software Development
Fall 2006 Page 12 of 23
The diagram to the right in figure 3 shows the error levels for all the ten projects at the end of 2006. As we can see from this diagram, the error level of the LFP project is close to the median. It is the job of the SQA to update the kind graphs in figure 3 and lots of other tables and graphs, make some objective comments on the trends, and report the results to the programmers and the group manager responsible for the particular project in question.
16,515,3
9,8 9,6
7,1 6,4 5,83,6 3,4
-4,7
-10
-5
0
5
10
15
20
LFP
DS
F
GLD
ER
@
LEP
RIS
K
FOS
FLT
PS
A
MV
A
Improvement rate
R2 = 0,4758
-10
-5
0
5
10
15
20
0 20 40 60 80 100 120
Error level / Improvement rateLeast squares parable
Figure 4 – Benchmarking against improvement rates and performing correlation analysis for understanding the relationship between individual error levels and improvement rates.
The diagram to the left in figure 4 show a comparison of improvement rates for all projects. The project with the best improvement rates is the LFP project. If we compare this result with the fact that LPF error level was close to the median in figure 3, this could suggest us to question whether people working on projects closer to the error level median in figure 3 would get higher improvement rate scores. This would seem consistent with the assumption that those who score “best in class” on error levels would feel no motivation to improve while those scoring “worst in class” would already be unmotivated by default. In the diagram to the right in figure 4 we have plotted the error levels along the x axis and the improvement levels along the y axis. The data seem to comply with the outlined idea. Those ranked close to the median error level are among the best in terms of improvement rates, while those close to the extremes in terms of error levels are among the worst in terms of improvement rates. Although there could be other reasons for why the data follow such a pattern, at least the diagram does not contradict our theory. In figure 5 we have plotted the average error levels for all of the projects on the left side. The first interesting aspect of the graph is the lack of consistent improvement during the first four observations. The reason for this is that the first two measurements are historical data and that it took a couple of years in order to make the programmers understand the standard and how the metrics worked. The next interesting aspect is the significant drop between the years 2003 and 2004. The drop is a reflection of the

INF5180 Product and Process Improvement in Software Development
Fall 2006 Page 13 of 23
standard being changed, more than anything to do with what the programmers were doing with the software. The final interesting aspect are the lines joining the three final years, 2004 to 2006, showing steady reductions on the error levels after the standard was changed.
020406080
100120140160180
1999
2000
2001
2002
2003
2004
2005
2006
Error level
-40
-20
0
20
40
60
80
2000
2001
2002
2003
2004
2005
2006
Impr. rate AVG = 14UCL = 22 LCL = 6
Figure 5 – Error levels and improvement rates for the total amount of COBOL software
The graph on the right hand side of figure 5 show the improvement rates in terms differences between two consecutive years; f(1999)-f(2000), f(2000)-f(2001), …, f(2005)-f(2006). The three observations from the error level graph are reflected in the improvement rate graph by (a) lack of improvement and large variation in the early phase, (b) a spike representing the revision of the standard, and (c) a stable improvement rate for the final years (2003 onwards, excluding the dip in 2004).
4.3 Improving the SPI system As the system in figure 2 was rather simple to begin with, it was not easy to simplify it further. We ended up doing three kinds of improvements. The two first improvements had to do with optimizing the data collection procedures and experimenting with the structure and content of the annual SQA report. The third improvement had to do with utilizing the quality indices from the COBOL project as part of quality indices used in other quality improvement processes.
4.3.1 Changes in data collection procedures During the first year of collection, the time of the year for selecting data from each of the projects was done slightly on speculation. When the results were presented to the programmers, they were asked how data collection fitted with annual life cycles, and adjustments were done as needed. The program used for collecting data also contained errors of various sorts, not having been tested systematically before being put to use. Over time, however, the program was adjusted several times. The biggest change was due to the COBOL standard being revised. Historical data had to be adjusted due to this, in order to be able to use historical data for identifying trends and making predictions.

INF5180 Product and Process Improvement in Software Development
Fall 2006 Page 14 of 23
4.3.2 Changes in data analysis and presentation of results The SQA report has been changing format every year (NTAX, 2001; 2002a; 2004; 2005; 2006). The first report was short and simple, but as we wanted to investigate the SPI process in a more scientific manner, various experiments with different theories, different layouts, different structures, and different types of statistics were tested out. Changing the project report was costly in terms of SQA man-hours, but as the optimal format has not yet been found, it still has to be changed. The individual summary statistics, trends and presentations for programmers is simpler, and has changed less. The aim of these reports are only to give simple indications to programmers and managers whether there are good improvements or not and to identify areas for improvement.
02040
6080
100120
140160180
2003
2004
2005
2006
SPI cost AVG = 99UCL = 165 LCL = 33
020406080
100120140160180200
2004
2005
2006
SPI cycle time AVG = 76UCL = 177 LCL = 0
Figure 6 – Control measurements for improving the SPI process
In 2003 we started measuring the costs of the SQA for running the SPI system. On the left hand side of figure 6 we see the development of costs in terms of man-hours. As the cycle for 2006 is not completed yet, the final value is an estimate. On the right hand side of figure 6 we see SPI cycle times in terms of the average number of days it has taken for completing the analysis of each of the ten software projects. Although there is not sufficient data to demonstrate improvements on the SPC charts, we expect that future measurements of cost and cycle times will remain on par with the 2006 estimates, indicating a shift in process parameters as the process becomes stable on an improved level.
4.3.3 Integration with other systems As mentioned in section 4.3.1 on data collection, it took a year or two until we found the optimal time of year for collecting data from each of the software projects. As most of the software projects were run according to the software development cycle illustrated in figure 7, the best time for doing analysis of the software from the previous cycle was at the beginning of the next cycle. In figure 7 this would correspond to the point N7 at phase IV.

INF5180 Product and Process Improvement in Software Development
Fall 2006 Page 15 of 23
Krav-spesifisering
I Startutvikling (V10.1)
ErfaringDrift/Vedlikehold
Implement-asjon
Spek.designLøsning
II. Godkjennkrav.spek (V10.2)
III. Godkjenndesign spek (V10.3)
IV. Godkjennsystem (V10.4-6; N7)
V. Godkjennendringer (V10.1)
Kravspek Kildekode
Testrapport
System-beskrivelse
Testplan
Løsnings-beskrivelse
Bruker-veiledning
Erfarings-rapport
Drifts-veiledning
Vedtatteendringer
Figure 7 – Generic NTAX software lifecycle model (adapted from NTAX, 1998)
The SPI process for development and maintenance of systems at NTAX, has been done by using the audit procedure V10 and control acceptance procedures N7 indicated on the top of figure 7 (see NTAX, 2005b). Although we had not yet assessed the software against the software standard at the time of V10.4, we could use the predicted error level (e.g. figure 3) as a part of the metric that was supposed to work as a quality index for the implementation phase. Similar to how metrics were produced, data collected, analyzed and presented in the case of COBOL software, similar methods were used for doing process improvement of the total life cycles of each project.
4.4 Understanding programmer psychology Commenting on the results in figure 3 and 4, we had some rough theories on programmer psychology. In order to stimulate to continuous improvement and standardization, we did not use any particular insights beyond trying to emphasis positive results when giving oral and written feedback.

INF5180 Product and Process Improvement in Software Development
Fall 2006 Page 16 of 23
5 Discussion
5.1 Overview of findings
5.1.1 Appreciation for a system As illustrated in figure 3, the process of making current and future software readable and maintainable could be seen as a system consisting of three processes:
(1) The software engineering process of defining and improving methods, such as making sure all relevant procedures and standards exist and are maintained.
(2) The process of writing new software and maintaining old software, in compliance with the standards and procedures.
(3) The software quality assurance process of measuring practice against procedures and products against standards, as in this case consisted of measuring the practice of updating the COBOL standard against the procedure for updating standards and measuring the COBOL software against the current version of the COBOL software standard.
Various groups at NTAX were responsible for each of these processes. The Software Engineering Process Group (SEPG) were responsible for the first task, the Software Quality Assurance Group (SQA) were responsible for the third task, but when it got down to actual work, the programmers themselves were the ones who defined what the standard should be like and what the quality control should be like. During the description of the case, it was also mentioned that writing and maintaining COBOL software was not something done independently of other work, but it was done as an integrated part of the system implementation as a part of the annual life cycles of the NTAX systems.
5.1.2 Knowledge about variation Software process improvement (SPC) was used extensively for monitoring and predicting the behavior of the COBOL software maintenance system, from the simple level of monitoring and predicting the number of code lines in each software project to the complicated level of monitoring and predicting the overall improvement rates. As the maintenance cycle at NTAX is an annual cycle, this means that it takes several years in order to get good estimates for estimating the statistical process parameters for using SPC, and it also means that the improvement process will have to be stable during those years. As was illustrated from the case presentation and the diagrams in figure 5, it is far from certain that the improvement process is stable. However, a pragmatic estimate for the process average in the SPC diagram resulted in an average improvement rate of 14 units per year, with a standard deviation of 3 units per year. If next years improvement is less than 2 units or more than 26 units, then the SPI process may be out of control, otherwise the improvement result is as expected.

INF5180 Product and Process Improvement in Software Development
Fall 2006 Page 17 of 23
5.1.3 Theory of knowledge Once a system has been established, such as the COBOL maintenance system, production costs should be optimized (minimized) in order to move resources into innovation activities. From the perspective of Deming and TQM, process knowledge consists of a procedure (flow chart), explaining how the process is carried out, and it consists of statistical distributions. Such distributions are typically related to time, cost, quality or whatever that might be relevant and important for the process. In the case of the COBOL maintenance system, illustrated in figure 2, we showed in chapter 4 how the system is broken down in to operational procedures, and we have stated that the current implementation of the system appears to result in a normally distributed improvement rate with an average of 14 units per year. As we believe it would be difficult to increase the improvement rates, we believe it should be easier to reduce the costs while maintaining the same improvement rates. As making the COBOL software more compliant with the COBOL standard was fully integrated with the ordinary programming activities, it was not possible to measure the cost of actual updates. Furthermore, as neither the SEPG group nor the programmers keep cost accounts, it would be impossible to figure out the cost of the maintenance anyway. However, cost statistics from the SQA group showing that they spend an annual average of 99 man-hours working on COBOL maintenance activities, an overall reference value for improving the system could be measured against the initial index value of 14 / 99 = 14% improvement per man-hour. The knowledge that produces our current results is explained through the flow charts and statistics in chapter 4. What we need now is knowledge in terms of how to simplify the tasks performed by the SQA group.
5.1.4 Psychology As pointed out in chapter 4, using internal benchmarking seemed to stimulate the competitive instinct among some programmers, giving them a motivational boost in terms of cleaning up old software and making sure that new software was compliant with the standards. Other programmers, however, seemed to ignore the benchmarks, perhaps getting bored or frustrated. There may be some insights on this problem by going to the literature on the sociology and psychology of programmers (e.g. Hohmann, 1997; Weinberg, 1971), but as “what gets measured gets done” seems to work in most cases, it may also be a case of a few “difficult” people doing as they please, not matter how much one might measure and motivate.
5.2 Implications for the study of the current theory Agile Programming is an SPI trend that can be associated with Japanese management philosophy (Poppendieck & Poppendieck, 2003), where some of the main ideas are to improve processes by reducing waste and increasing flexibility. Deming agrees on
INF5180 Product and Process Improvement in Software Development
Fall 2006 Page 18 of 23
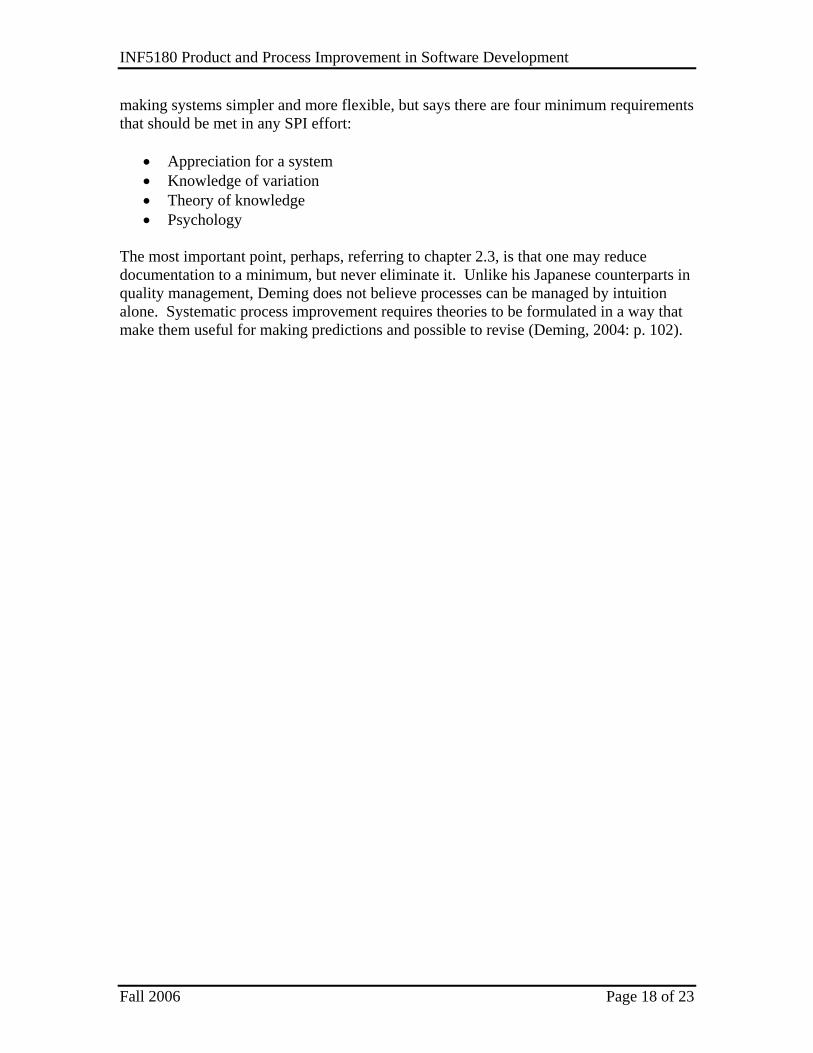
making systems simpler and more flexible, but says there are four minimum requirements that should be met in any SPI effort:
• Appreciation for a system • Knowledge of variation • Theory of knowledge • Psychology
The most important point, perhaps, referring to chapter 2.3, is that one may reduce documentation to a minimum, but never eliminate it. Unlike his Japanese counterparts in quality management, Deming does not believe processes can be managed by intuition alone. Systematic process improvement requires theories to be formulated in a way that make them useful for making predictions and possible to revise (Deming, 2004: p. 102).

INF5180 Product and Process Improvement in Software Development
Fall 2006 Page 19 of 23
6 Conclusion We started by identifying two way of implementing software process improvement (SPI), either from the perspective of engineering or from the perspective of research. We argued that following the path of total quality management (TQM) expert W. E. Deming should imply a research approach, while most of the SPI literature based on Deming, take the engineering approach. The question we wanted to investigate was whether there were any practical differences when applying the scientific philosophy of Deming rather than choosing a typical SPI engineering philosophy. In order to study this, we looked at a SPI case of software maintenance at the Norwegian Directorate of Taxes (NTAX), wanting to see whether the Deming lens would give insights that would not be evident otherwise. When analyzing the empirical data against Deming’s “system of profound knowledge” we noticed that Deming’s view on the theory of knowledge requires software quality assurance (SQA) to have a working theory on how to achieve process improvements, and that this theory needs to be updated as observations are being made from SPC and other statistical investigations, hypotheses are being made and tested. However, despite this approach focusing first on theory and then on practical results, the philosophy does not seem to add anything to SPI beyond the fact that one needs a documented quality management system, perhaps based on ISO 9001, CMMI, CobiT or other standards, in order to document the theory in a way that makes it useful for making predictions and possible to revise. What Deming’s “system of profound knowledge” does seem to contribute to SPI theory, however, is a simple checklist, consisting of four points, in order to make sure that any SPI effort is not superficially implemented but implemented with a basis in science.

INF5180 Product and Process Improvement in Software Development
Fall 2006 Page 20 of 23
References Ahern, D.M., Clouse, A. and Turner, R. (2004). CMMI Distilled. Second Edition. SEI Series in Software Engineering. Addison-Wesley: Reading, Massachusettes. Abran, A. and Moore, J.W. (2004). Swebok: Guide to the Software Engineering Body of Knowledge. IEEE Computer Society: Los Alamitos, California. Chrissis, M.B., Konrad, M. and Shrum, S. (2003). CMMI: Guildelines for Process Integration and Product Improvement. SEI Series in Software Engineering. Addison-Wesley: Boston. Churchman, C.W., Ackoff, R.L. and Arnoff, E.L. (1957). Introduction of Operations Research. John Wiley & Sons: New York. Coghlan, D. & Brannick, T. (2001): “Doing Action Research in Your Own Organization”, SAGE: London. Davenport, Thomas H. & Laurence Prusak (1998): “Working Knowledge: How Organizations Manage What They Know”. Harvard Business School Press. Deming; W. E. (1986): “Out of the Crisis”, The MIT Press: Cambridge; Massachusettes. Deming; W. E. (1994): “The New Economics for Industry, Government, Education”, 2nd edition, The MIT Press: Cambridge; Massachusettes. Florac, W.A. and Carleton, A.D. (1999). Measuring the Software Process: Statistical Process Control for Software Process Improvement. SEI Series in Software Engineering. Addison-Wesley: Reading, Massachusettes. Hawkins, J. and Blakeslee, S. (2004). On Intelligence. Owl Books: New York. Humphrey, W.S. (1989). Managing the Software Process. SEI Series in Software Engineering. Addison-Wesley: Reading, Massachusettes. Imai, M. (1986): “Kaizen: The Key to Japan’s Competitive Success”, McGraw-Hill/Irwin: New York. ISO (2000a): “Quality Management Systems – Terms and Definitions (ISO 9000:2000)”, International Standards Organization: Geneva. ISO (2000b): “Quality Management Systems – Requirements (ISO 9001:2000)”, International Standards Organization: Geneva. ISO (2000c): “Quality Management Systems – Guidelines for Performance Improvement (ISO 9004:2000)”, International Standards Organization: Geneva.

INF5180 Product and Process Improvement in Software Development
Fall 2006 Page 21 of 23
Juran, J. (1964): “Managerial Breakthrough”, McGraw-Hill: New York. Lewis, C. I. (1929): “Mind and the World Order: Outline of a Theory of Knowledge”, Dover Publications: New York. Nonaka, I. and Takeuchi, H. (1995). The Knowledge-Creating Company: How Japanese Companies Create the Dynamics of Innovation. Oxford University Press: Oxford. NTAX (1998): “Strategisk plan for bruk av IT i skatteetaten”, SKD nr 62/96, Oslo. NTAX (2001). Opprydding og standardisering av COBOL-baserte IT-systemer, SKD nr 61/01, Norwegian Directorate of Taxes, Oslo. NTAX (2002a). Opprydding og standardisering av COBOL-baserte IT-systemer, SKD 2002–018, Norwegian Directorate of Taxes, Oslo. NTAX (2002b). Forbedring av IT-prosesser ved bruk av ISO 15504, SKD 2002–032. Skattedirektoratet: Oslo. NTAX (2003). Ajourhold av standarder og retningslinjer, SKD 2003–048, Skattedirektoratet: Oslo. NTAX (2004). Opprydding og standardisering av COBOL-baserte IT-systemer, SKD 2004–001, Norwegian Directorate of Taxes, Oslo. NTAX (2005a). Opprydding og standardisering av COBOL-baserte IT-systemer, SKD 2005–003, Norwegian Directorate of Taxes, Oslo. NTAX (2005b). Stokastisk modell for forvaltningsløp PSA-2004 til støtte for håndtering av klarsignal, SKD 2005–012, Norwegian Directorate of Taxes. Oslo. NTAX (2006). Opprydding og standardisering av COBOL-programvare, Norwegian Directorate of Taxes, Oslo. Paulk, M. (1995). The Rational Planning of (Software) Projects. Proceedings of the First World Congress for Software Quality. San Francisco, CA, 20-22 June 1995, section 4. Poppendieck, M. and Poppendieck, T. (2003). Lean Software Development: An Agile Toolkit. The Agile Software Development Series. Addison-Wesley: Boston. Russell, S. and Norvig, P. (2003). Artificial Intelligence: A Modern Approach. Second Edition. Prentice-Hall: London. Shewhart, W.A. (1939). Statistical Method from the Viewpoint of Quality Control. Dover: New York.

INF5180 Product and Process Improvement in Software Development
Fall 2006 Page 22 of 23
Shingo, S. (1987). The Sayings of Shigeo Shingo: Key Strategies for Plant Improvement. Productivity Press: Portland, Oregon. Sommerville, I. (2004). Software Engineering. 6th Edition. Addison-Wesley: London. Tsutsui, W. M. (1998): “Manufacturing Ideology: Scientific Management in Twentieth-Century Japan”, Princeton University Press: Princeton. Wikipedia (2006a) “W. Edwards Deming” http://en.wikipedia.org/wiki/W._Edwards_Deming, Downloaded 20112006 Wikipedia (2006b) “Edward C. Tolman” online at http://en.wikipedia.org/wiki/Edward_Tolman, Downloaded 19112006 Wikipedia (2006c) “Ontology (Computer Science)” online at http://en.wikipedia.org/wiki/Ontology_%28computer_science%29, Dowloaded 19112006 Womack, J. P., Jones, D. T. and Roos, D. (1990). The Machine that changed the World: The Story of Lean Production. Harper Perennial: New York. Womack, J. P. and Jones, D. T. (2003). Lean Thinking. Second Edition. Harper Perennial: New York. Zahran, S. (1998). Software Process Improvement: Practical Guidelines for Business Success. Addison-Wesley: Harlow, England. Øgland, P. (2006a). Using internal benchmarking as strategy for cultivation: A case of improving COBOL software maintainability. In Proceedings of the 29th Information Systems Research in Scandinavia (IRIS 29): “Paradigms Politics Paradoxes”, 12-15 August, 2006, Helsingør. Øgland, P. (2006b). Improving Research Methodology as Part of Doing Software Process Improvement. Submitted to: 15th European Conference on Information Systems (ECIS 15): "Relevant rigor - Rigorous relevance", June 07-09, 2007, St. Gallen.

INF5180 Product and Process Improvement in Software Development
Fall 2006 Page 23 of 23
Appendix Vurderings-område
Målsetting Egenvurdering
Sammenheng forretningsmessige forhold og forbedringsplan
De relevante forretningsmessige rammebetingelsene og målsetningene er meget godt analysert og beskrevet. De tiltakene som settes i verk er direkte knyttet til opplevde problemer og målsetninger og de er prioritert.
Premisser og rammebetingelser for valg av case er beskrevet i kapittel 3.1. Tiltak og forløp er beskrevet i kapittel 4. Som det fremgår av beskrivelsen, så har opplegget fungert bra i seks år, og det gjøres stadig forbedringer, ved utprøving av forskjellige former for SPI-teori, for å få det til å fungere bedre.
Bruk av pensum-kunnskap og referanser
Pensum brukes i stor grad i besvarelsen med sentrale og relevante referanser. Der annen litteratur legges til grunn er også referansene gode og relevante.
I kapittel 1 forsøker jeg å identifisere hull i pensumlitteraturen. Mitt inntrykk er at man viser til Deming som utgangspunkt for SPI, men muligens ikke har forstått Deming fullt ut. I kapittel 2 forsøker jeg meg på min egen redegjørelse for Deming i forhold til SPI, og i kapittel 5 tolker jeg SPI-caset mitt i lys av Deming for å se på om jeg kan vise til naturlige måter å tolke Deming på som ikke har vært benyttet i SPI-klassikerene (e.g. Humphrey, 1989; Florac & Carleton, 1999; Poppendieck & Poppendieck, 2003). Oppsummering og konklusjon i kapittel 6.
Argumentasjon Det argumenteres særdeles godt for de tiltak som settes i verk. Realismen i tiltakene vurderes på en overbevisende måte.
Opplegget er basert på anerkjente teorier og standarder, og har vært testet ut i seks år i Skattedirektoratet, sml referanselisten.
Struktur Besvarelsen har et godt språk og en logisk oppbygging som leder leseren gjennom forbedringsplan og argumentasjon uten unødvendige gjentagelser.
Dokumentet er strukturert i henhold til standard for skriving av akademiske dokumenter, sml INF5550.