infant environmental exposure to thimerosal and … · 2018-12-27 · infant environmental exposure...
TRANSCRIPT

Infant EnvironmentalExposure to Thimerosaland NeuropsychologicalOutcomes at Ages 7 to10 Years
Technical ReportVolume I
Date 9-6-07
Prepared forImmunization Safety OfficeCenters for Disease Control andPrevention1600 Clifton Rd, NEAtlanta, GA 30333
Prepared byCristofer PriceBarbara GoodsonGerrie Stewart
Cambridge, MALexington, MAHadley, MABethesda, MDChicago, IL
Abt Associates Inc.Suite 800 North4550 Montgomery AvenueBethesda, MD 20814-3343

Abt Associates Inc. Technical Report – Volume I i
The interpretations of results presented in this report represent theviews of the authors and do not necessarily represent the views ofthe Centers for Disease Control and Prevention (CDC).

Abt Associates Inc. Technical Report – Volume I ii
Acknowlegements
We have many people to thank for their contributions to this study. We thank the ClinicManagers, Child Assessors, and Consulting Psychologists for their efforts and dedicationto obtaining high quality data. Clinic Managers: Jean Caiani, Ramon Campana,Katherine Eng, Ph.D., Elle Garcia, Julie Gronouski, Joanne Melton, Victoria Mendez,Judith Meyer, Valerie S. Miran, MA, Elizabeth Munoz, MSW, Diane G. Preciado, P. AnaSilfer, MA, Child Assessors: Aimee L. Adray, Kathy Angell, Ph.D., Candace WollardBivona, Ph.D., Karrie Campbell, Maureen O’Kane Grissom, Ph.D., Debbie Groff, AnneE. Hay, Kerri Johnson, Psy.D., Darcey A. Reeves, Angela J. Stewart, Ph.D., MeryMacaluso, Tracie Takeshita, Psy.D., Jolie C.von Suhr, Ph.D., Jennifer A. Wittert, M.A.,Kevin Wittenberg, Ph.D., Christine Zalecki, Consulting Psychologists: Christine H.Duong-Perez, Ph.D., Maury Eldridge, Ph.D., Susan Yuh Harrison, Ed.M., Kelly A.Johnson, Ph.D., Robert Kretz, Psy.D., Stephanie Marcy, Ph.D., Denise Noonan, Ph.D.,Mina D. Nguyen, Psy.D., Susan Toth Patiejunas, Ph.D., David Scott, Ph.D., T. Kristianvon Almen, PhD, Michael White, Ph.D.
Many thanks are given to the study’s External Expert Consultants who volunteered theirtime to make substantive contributions to the study design, to review and comment on thestudy’s analysis plan, to review progress reports, and to review and advise on next stepsafter they were presented the results of preliminary results from the first round of fittingthe models specified in the analysis plan. External Expert Consultants: Ann Abramowitz,Sallie Bernard, Lorne Garretson, Stanley Lemeshow, Roberta White, Robert Wright.
We wish to thank the Michael Shannon, Jane Bernstein, and Tom Campbell whosubcontracted to Abt Associates Inc. to provide the study with expertise in the areas oftoxicolology, neuropsychology, in speech and language development, respectively.
We wish to express special gratitude to our colleagues at the CDC and, the four HMOsthat participated in the study. These staff included Principal Investigators, StudyManagers and Data Managers who participated in countless phone conferences to discussstudy design, analysis plans, data quality, and interpretation of medical codes. Theybrought a wealth of knowledge regarding vaccination and health care practices, childdevelopment, data management, and research methodology. The shared dedication andcommitment among this group to obtaining high quality data, and producing the mostscientifically rigorous and useful study possible was inspiring. The group included:
GHC - Health Center for Health Studies, Seattle, WAPatti Benson, M.P.H.Lisa A. Jackson, M.D.John Dunn, MD, M.P.H.
HPHC - Department of Ambulatory Care and Prevention, Harvard Pilgrim Health Careand Harvard Medical School, Boston, MAVirginia Hinrichsen, M.S., M.P.H.Tracy Lieu, M.D.

Abt Associates Inc. Technical Report – Volume I iii
Xian-Jie Yu
NCK - Kaiser Permanente Kaiser Permanente Division of Research and Vaccine StudyCenter, Northern California, Oakland, CAEdwin Lewis, M.P.H.Paula Ray, M.P.H.Patricia Ross, S.Steve Black, M.D.
SCK - UCLA - Southern California Kaiser Permanente, Torrance, CAEileen Eriksen, M.P.H.Michael Marcy, M.D., M.P.H.
CDC - Immunization Safety Office, US Centers for Disease Control and Prevention,Atlanta, GAWilliam W. Thompson, Ph.D.Frank Destefano, M.D., M.P.H.Robert L. Davis, M.D., M.P.H.David Shay, M.D., M.P.H.Eric S. Weintraub, M.P.H.
Thanks also to Bob Chen from the CDC for his support of the project.
And finally, we wish to thank our colleagues at Abt Associates Inc. who worked on theproject for their effort and dedication to the study. The list below summarizes the keyAbt staff that had substantive roles on the project:
Abt Associates - Abt Associates Inc., Bethesda, MD and Cambrige, MAPatty Connor – Field DirectorCarter Smith – Design phaseAmanda Parsad – Data analysisLaura Simpson – Data analysisAttina White – Data managementJulia Foodman – Data managementKate Benson – Data managementStephen Kennedy – Project Quality AdvisorGerrie Stewart– Project DirectorBarbara Goodson – Principal InvestigatorCristofer Price – Director of Analysis

Abt Associates Inc. Table of Contents iv
Volume I Table of Contents
1. Executive Summary ................................................................................................... 1
2. Document Overview ................................................................................................... 4
3. Background and Research Questions ....................................................................... 5
3.1. Statement of the Problem............................................................................................ 5
3.2. Background on Mercury ............................................................................................. 5
3.3. Research on Neurotoxicity of Methylmercury .......................................................... 63.3.1. Neurological Effects of Children’s Dietary Exposure to Methylmercury .............................. 73.3.2. Mercury Exposure May Present Greater Risk for Infants....................................................... 9
3.4. Uses of Thimerosal in Vaccines.................................................................................. 9
3.5. Recommendation to Remove Thimerosal from Infant Vaccines ........................... 10
3.6. Research on Neurotoxicity of Ethylmercury/Thimerosal....................................... 123.6.1.1. The CDC Research Program....................................................................................... 14
3.7. Research Questions for the Current Study.............................................................. 15
4. Study Design............................................................................................................. 16
5. Sample ...................................................................................................................... 17
5.1. Eligibility Criteria ...................................................................................................... 19
5.2. Sampling Frame ......................................................................................................... 25
5.3. Sample Selection......................................................................................................... 26
5.4. Physician, Sibling, and Out-of-Area Exclusions...................................................... 27
5.5. Recruitment in Batches ............................................................................................. 28
5.6. Recruitment and Eligibility Outcomes..................................................................... 29
5.7. Size of Analysis Sample ............................................................................................. 30
6. Data Sources ............................................................................................................ 32
6.1. The Clinic Visit........................................................................................................... 326.1.1. Clinic Staff............................................................................................................................ 33
6.1.1.1. Training and Quality Control ...................................................................................... 346.1.2. Child Assessments ................................................................................................................ 346.1.3. Parent Interview.................................................................................................................... 39
6.2. Teacher Mail Survey.................................................................................................. 39
6.3. Medical Record Abstractions.................................................................................... 39
6.4. VSD Computer-Automated Data.............................................................................. 40
7. Measures................................................................................................................... 41
7.1. Outcome Measures..................................................................................................... 417.1.1. Outcomes Measured on Continuous Scales.......................................................................... 417.1.2. Dichotomous Outcomes: Tics and Stuttering ....................................................................... 41

Abt Associates Inc. Table of Contents v
7.1.2.1. Tics.............................................................................................................................. 427.1.2.2. Stuttering..................................................................................................................... 43
7.2. Measures of Postnatal Exposure to Ethylmercury ................................................. 447.2.1. Introduction to the Vaccination Histories File...................................................................... 447.2.2. Overview of Steps from Raw Data to Creation of Analysis Variables ................................. 457.2.3. Data Cleaning for Child Vaccination Histories .................................................................... 48
7.2.3.1. Step 1: Preliminary Vaccine History........................................................................... 497.2.3.2. Step 2: Application of 30-day and 15-day Algorithms................................................ 497.2.3.3. Step 3: Check, Verify or Fix ....................................................................................... 51
7.2.4. Mercury Amount Assigned to Each Childhood Vaccine or Immune Globulin Receipt ....... 58
7.3. Measures of Prenatal Exposure to Ethylmercury................................................... 607.3.1. Introduction to the Prenatal Ethylmercury Exposures File ................................................... 607.3.2. Overview of Steps from Raw Data to Creation of Analysis Variables ................................. 617.3.3. Cleaning of Prenatal Ethylmercury Exposures Data............................................................. 627.3.4. Mercury Amount Assigned to Each Prenatal Vaccine or Immune Globulin Receipt ........... 68
7.4. Covariates ................................................................................................................... 71
7.5. Imputation of Missing Values ................................................................................... 78
8. Analysis Approach ................................................................................................... 82
8.1. Overview of Analytical Models ................................................................................. 84
8.2. Inclusion of Covariates .............................................................................................. 85
8.3. Testing for Effect Modifiers ...................................................................................... 97
8.4. Multiple Testing ......................................................................................................... 97
8.5. Reporting Effect Sizes................................................................................................ 98
9. Results..................................................................................................................... 100
9.1. Descriptive Statistics ................................................................................................ 1009.1.1. Characteristics of the Analysis Sample .............................................................................. 100
9.1.1.1. Demographics ........................................................................................................... 1009.1.1.2. Outcomes .................................................................................................................. 1029.1.1.3. Exposures .................................................................................................................. 104
9.1.2. Descriptive Statistics on Variables Used in Analysis Models ............................................ 109
9.2. Model Results ........................................................................................................... 1179.2.1. Overview ............................................................................................................................ 1179.2.2. Main Effect Models ............................................................................................................ 118
9.2.2.1. Introduction............................................................................................................... 1189.2.2.2. Model Specifications................................................................................................. 1189.2.2.3. Explanation of Model Results Summary Table......................................................... 1199.2.2.4. Results....................................................................................................................... 120
9.2.2.4.1. Main Effect Models with Single Imputation for Covariates with Missing Values120
9.2.2.4.2. Main Effect Models With Multiple Imputation for Covariates with Missing Values123
9.2.2.4.3. Main Effect Models with Alternative Prenatal Mercury Amount Assignments .. 1259.2.2.4.4. Additional Main Effect Models for ADHD Outcomes ........................................ 127
9.2.3. Sex-by-Exposure Interaction Models ................................................................................. 1299.2.3.1. Introduction............................................................................................................... 1299.2.3.2. Model Specifications................................................................................................. 1299.2.3.3. Results....................................................................................................................... 132
9.2.3.3.1. Prenatal Exposure ................................................................................................ 132

Abt Associates Inc. Table of Contents vi
9.2.3.3.2. Cumulative Exposure Birth to Seven Months...................................................... 1329.2.3.3.3. Neonatal Exposure (Birth to 28 Days)................................................................. 133
9.2.4. Cumulative Effects of Exposures Spanning the Prenatal Period Though Age 7 Months ... 1369.2.4.1. Introduction............................................................................................................... 1369.2.4.2. Model Specifications for Two Additional Hypothesis Tests..................................... 1369.2.4.3. Results....................................................................................................................... 137
9.2.4.3.1. Joint Test for Additive Effect .............................................................................. 1379.2.4.3.2. Test of Prental-by-Postnatal Exposure Interaction Effect.................................... 142
9.2.5. Models for Multiple Sources of Prenatal Exposure Interacted with Postnatal Exposure fromThimerosal ........................................................................................................................................ 152
9.2.5.1. Introduction............................................................................................................... 1529.2.5.2. Model Specifications................................................................................................. 1549.2.5.3. Results....................................................................................................................... 155
9.2.6. Concurrent Antibiotics-by-Exposure Interaction Models................................................... 1579.2.6.1. Introduction............................................................................................................... 1579.2.6.2. Model Specifications................................................................................................. 1579.2.6.3. Results....................................................................................................................... 160
10. References .......................................................................................................... 163

Abt Associates Inc. Table of Contents vii
Volume II Table of Contents

Abt Associates Inc. Chapter 1 1
1. Executive SummaryThe current study was conducted to investigate whether there are relationships betweenprenatal and/or early childhood exposure to thimerosal-containing vaccines and immuneglobulins and neurodevelopmental functioning at ages seven to ten years. The studyutilized a retrospective cohort design wherein computerized medical records were used toselect a sample of children who had been exposed to varying amounts of thimerosal-containing vaccines and immune globulins during infancy. The children were assessed atages 7 to 10 years using a battery of neurodevelopmental assessments administered in aclinical setting. Results are based on data obtained from 1,047 study participants.
There are three major strengths of the study. The first is that we were are able to computeaccurate measures of each child’s prenatal and early childhood exposures to ethylmercuryfrom thimerosal-containing vaccines and immune globulins. We used three sources ofdata on vaccination and immune globulin receipt to develop measures of exposure levels.The first source was computer-automated records maintained by the HMOs as part of theVaccine Safety Datalink system and as part of their administrative record keepingsystems. The second source was from detailed abstractions of medical charts of childrenand their mothers. These data were collected by a team of experienced chart abstractors.The third source was from personal records and responses to survey items provided byparents during a detailed interview with each child’s biological mother.
The second major strength of the study was that outcomes were measured in a clinicalsetting using a battery of standardized assessment tools. Outcome measures spanneddomains of speech and language, verbal memory, reading achievement, fine motorcoordination, visual spatial ability, attention/executive functioning, behavior regulation,tics, and general intellectual functioning.
The third major strength of the study is that we were able to obtain detailed informationfor each child on potential confounding factors. These included data on other prenataland early childhood exposures, on other diagnoses and medical conditions of childrenand their mothers, and on whole range of child and family characteristics. These includedincome, maternal education, birth order, plurality, family size/structure, language spokenin the home, maternal age, duration of breastfeeding, and maternal diagnoses ofneuropsychological disorders. These data were obtained from parent interview, frommedical record abstraction, and from the computer-automated records.
The primary weakness of the current study is that exposure levels were not determined ina randomized, controlled trial (RCT) design. Although the study measured and controlledfor a wide range of potential confounders, it is impossible to know with certainty whetherthe threat of selection bias has been eliminated. Selection bias will have affected theresults if one or more unmeasured factors have causal effects on both the amount ofexposure that children receive, and on outcome measures. Given this important limitationof the design of the study, results can only be judged as informative, not conclusive. Thestudy was intended to be an important contribution to a growing literature regarding the

Abt Associates Inc. Chapter 1 2
possible effects of ethylmercury, and was not intended to be a definitive concludingstatement of whether the ethylmercury in thimerosal-containing vaccines and immuneglobulins does or does not cause harm.
Associations between each of 42 outcome measures and exposure to thimerosal-containing vaccines and immune globulins were estimated from linear and logisticregression models that controlled for potential confounding effects of familydemographics and other factors. Models were fit to each of the 42 outcome measures toestimate the effects of:
Prenatal exposure; Neonatal exposure (cumulative exposure birth to one month); Birth to 7 months exposure (cumulative exposure birth to seven months); For males - Prenatal exposure; For males – Neontal exposure; For males – Birth to 7 months exposure; For females - Prenatal exposure; For females – Neontal exposure; For females – Birth to 7 months exposure; Interaction effects of prenatal exposure and cumulative exposure birth to seven
months; Interaction effects of antibiotic treatment concurrent with receipt of thimerosal-
containing vaccines or immune globulins birth to one month; Interaction effects of antibiotic treatment concurrent with receipt of thimerosal-
containing vaccines or immune globulins birth to seven months.
Across the models for the 42 outcome measures we found small numbers of statisticallysignificant effects that were roughly balanced between findings where increased exposurewas associated with better outcomes, and findings where increased exposure wasassociated with worse outcomes. For example, in the model used to estimate main effectson the combined group of males and females, higher prenatal exposure was associatedwith better scores on one outcome measure, and worse scores on another. Cumulativeexposure birth to one month was associated with a better outcome on one measure, and aworse outcome for another. Cumulative exposure birth to seven months was associatedwith better outcomes for two measures. This pattern of results is consistent with whatwould be expected to occur by chance if exposure had no relationship to outcomes. Usinga p<0.05 criterion, the expected number of false rejections of the null hypothesis for 42tests for a single exposure measure (e.g., birth to seven months) is obtained as the productof 0.05 and 42, which is equal to three. The three false rejections of the null hypothesisare expected to be roughly equally distributed between positive and negative associations.
The pattern of finding small numbers of beneficial effects, approximately equallybalanced with findings of harmful effects was replicated over all sets of analyses. Thistype of pattern was found for prenatal, neonatal (birth to 1 month) and birth to 7 monthsexposure effects for the full sample, for boys, for girls, for interaction effects of prenatalwith birth to 7 months exposures, and for interaction effects of antibiotic treatmentconcurrent with neonatal and birth to 7 months receipt of thimerosal-containing vaccines

Abt Associates Inc. Chapter 1 3
or immune globulins. For example, the evaluation of three exposure measures (prenatal,neonatal, birth to 7 months) across the 42 outcome measures, for each of the two sexesrequired 152 hypothesis tests. Among those tests, 13 were significant at the p<0.05 level.The associations were in the direction of increased exposure being associated with betteroutcomes for seven of the significant tests. The remaining five were in the directionworse outcomes. Under a null hypothesis of no association between exposure andoutcomes, the expected number of false rejections of the null hypothesis for 152 tests atthe p<0.05 level is 13.
Results of two large studies conducted in Great Britain indicated mixes of beneficial andharmful associations between exposure to ethylmercury from vaccines and outcomessimilar to those measured in the current study (Heron et al., 2004; Andrews et. al, 2004).Results from the current study showing significant associations between exposures inbirth to 7 months and assessor rated motor and phonic tics in boys appear to support twosets of findings from previous studies. The study by Verstraeten et al (2003) found asignificant association between exposure and tics at one of three HMOs. And Andrews etal. (2004) found a significant harmful association between exposure and tics in a specialsub-analysis. However, Heron et al. (2003) reported a beneficial association betweenexposure and tics. And among the findings of the current study was a beneficialassociation between parent reported motor tics and neonatal exposure for girls.
The beneficial associations between exposures and outcomes in the fine motor domainfound in the current study coincide with a finding reported by Heron et al. (2003) of abeneficial association between exposure and fine motor skills. However, these findingsdo not align with the estimated harmful effects of methylmercury exposure from fishconsumption on performance on the finger tapping test, as reported by Grandjean et. al.(1997).
The results of models used to test interaction effects between prenatal and postnatalexposure did not support the hypothesis that prenatal exposure would exacerbate theeffects of postnatal exposure. Nor did the results of this study support the hypothesis thatantibiotic treatment would worsen the effects of postnatal exposure.
We conclude that we did not find clear and convincing evidence of harm. While studiesof the sort conducted here cannot disprove the null hypothesis, we consider the pattern ofpositive and negative associations to be consistent with what we would expect to occurby chance if exposure had no relationship to outcomes. We note, however, that thepreviously stated caution regarding the threat of selection bias should not be ignored. Weurge the reader to consider the results of this study as one piece of evidence in the contextof a growing literature on the effects of exposure to ethylmercury.

Abt Associates Inc. Chapter 2 4
2. Document OverviewThe current document is intended to present both study results and the technical details ofstudy design, sampling, data sources, variable construction, and methods of analysis. Thisdocument allows for a more complete presentation of details than was possible within thespace constraints on the presentation of the same study published by Thompson et. al. (inpress, 2007).
Section 3 presents the historical factors that motivated the study, some background onmercury exposure and its effects on neurological development, the history and use ofthimerosal in vaccines, a brief review of the literature on thimerosal andneurodevelopmental outcomes, an introduction to the Centers for Disease Control’sresearch program on thimerosal and vaccines, and the study’s motivating researchquestions. Sections 4, 5, and 6 describe the study’s design, sample, and data sources.
Section 7 presents detail on the construction of outcome measures, exposure measures,and covariates. This section also includes an explanation of imputations of missing valueson covariates. Section 8 describes the analysis approach. Section 9 presents results.Included in Section 9 are descriptive statistics that describe the characteristics of thestudy participants and their amounts of exposure to ethylmercury from thimerosal-containing vaccines and immune globulins. The latter part of Section 9 presentssummaries of the results of models used to estimate the size and statistical significanceof associations between neurodevelopmental outcomes and exposure to ethylmercuryfrom thimerosal-containing vaccines and immune globulins.

Abt Associates Inc. Chapter 3 5
3. Background and Research Questions
3.1. Statement of the ProblemDuring the 1990s the nation's childhood immunization rates increased dramatically.While the overall immunization rate for preschool children was approximately 55 percentin 1992, it rose to 79 percent in 2000. Over approximately the same time period, therecommended number of vaccines to be received by a child during the age range frombirth through seven months more than doubled. In 1988, a child immunized according tothe recommended schedule1 would have received three DTP vaccines and two polio shotsduring his/her first seven months of life. By 1999, a child immunized according to therecommended schedule would have received as many as three hepatitis-b vaccines, threeDTaP vaccines, three Hib vaccines, and three polio shots during his/her first sevenmonths. Over the same approximate time frame the rates of diagnoses of a range ofneurodevelopmental diseases such as autism and attention hyperactivity deficit disorder(ADHD) increased dramatically (Mandell et. al., 2005; Newschaffer et. al, 2006).
Until the phase-out of thimerosal-containing childhood vaccines that began in 1999,many of the regularly administered infant vaccines contained mercury. Thimerosal,which had been used as a preservative in vaccines since the 1930s, is 49.6% mercury byweight and is metablolized into ethylmercury and thiosalicylate.
In 1999, the U.S. Food and Drug Administration (FDA) estimated that adherence to theschedule of immunizations recommended by the Advisory Committee on ImmunizationPractices (ACIP) could result in ethylmercury exposure that exceeded the EnvironmentalProtection Agency’s (EPA) limits for methylmercury exposure. At the time, there waslittle known about similarities or difference in the metabolism and excretion of these twoforms of mercury, but the chemical similarities of the two, combined with the knowntoxic effects of exposure to methylmercury, was cause for alarm.
Consequently, the U.S. Public Health Service and the American Academy of Pediatricsurged vaccine manufacturers to removed thimerosal from all infant vaccines as soon aspossible, and recommended that studies be carried out to assess the risks associated withexposure to mercury from thimerosal-containing vaccines.
3.2. Background on MercuryMercury is an element that cycles through three different chemical forms in theenvironment: methylmercury, ethylmercury, and phenylmercury. Research hasconfirmed that determination of the toxicity of mercury is complicated and dependent onthe form of mercury, route of entry, dose, and age at exposure (AAP, 1999). Humans areexposed to mercury in its different forms from various sources. Modern industrial
1 The vaccine schedule recommended and approved by the Advisory Committee on Immunization Practices(ACIP), the American Academy of Pediatrics (AAP), and the American Academy of Family Physicians(AAFP).

Abt Associates Inc. Chapter 3 6
processes, especially fossil fuel combustion and waste incineration, are responsible for arecent dramatic increase in environmental levels of methylmercury. The major source ofnon-occupational methylmercury exposure is dietary intake, with fish and seafood as themain sources because of their propensity to bioaccumulate mercury up the food chain.Vaccinations are the major source of exposure to ethylmercury, because the Thimerosalused as a preservative contains 49.6 percent mercury by weight and is metabolized toethylmercury and thiosalicylate (AAP, 1999; Pless and Risher, 2000).
The major impact of organic mercury compounds is on the central nervous system,although the kidneys and the immune system also may be affected. Furthermore, organicmercury easily crosses placenta and blood-brain barriers (AAP, 1999). Although theCDC and others have recently made strides in understanding the effects of theethylmercury in Thimerosal-containing vaccines, the exact nature of toxicity andneurodevelopmental effects from exposure are essentially unknown. At dosesconsiderably higher than what the children would be exposed to from a normal scheduleof vaccines, ethylmercury has been reported to cause neurotoxicity, but the effects ofexposure to low concentrations have not been established (Ball et al., 2001).
Much of the concern about the potential hazards of ethylmercury comes from research onthe effects of mercury in the form of methylmercury. Below we summarize the researchon methylmercury neurotoxicity and present the argument for its relevance to concernsabout possible ethylmercury toxicity from Thimerosal exposure.
3.3. Research on Neurotoxicity of MethylmercuryResearch on the adverse effects of human mercury exposure dates to the 1950s, when theconsumption of fish contaminated by industrial waste in the Minamata Bay region ofJapan was linked to an epidemic of severe neurological disease (Harada, 1995). Asimilar epidemic occurred in Iraq in the 1970s from consumption of mercury-containingfungicide in seed grain (Bakir et al., 1973; Marsh et al., 1980). In both these outbreaksmercury poisoning was documented in all age groups, but infants seemed particularlyvulnerable, and maternal methylmercury exposure was associated with nervous systemabnormalities, such as mental retardation and impaired motor function among childrenexposed in utero. In the Minamata epidemic, some infants with severe brain damagewere born to exposed mothers who were themselves barely affected. Similar effects oninfants were seen in the Iraqi outbreak, which also raised questions about more subtle,delayed effects of prenatal exposure. These epidemics provided strong evidence linkingexposure to high levels of methylmercury with severe neurological damage, and also ledto the confirmation of mercury as a neurotoxicant and to the establishment of earlyexposure guidelines.
Concern about the potential health threat from methylmercury grew in the early 1970swhen elevated concentrations were found in fish from the Great Lakes. Inorganicmercury released into large bodies of water is converted to methylmercury bymicroorganisms and bioaccumulated up the aquatic food chain (Davidson et al., 1998;Mahaffey, 1999). Accumulation of mercury in fish can result in increased human

Abt Associates Inc. Chapter 3 7
exposures to this metal, particularly in populations whose diets include a high intake ofmarine food (Turner et al., 1980).
Recently, increased attention has focused on what levels of exposure to methylmercurycan be considered safe. Agencies such as the World Health Organization (WHO), theU.S. Environmental Protection Agency (EPA), the U.S. Agency for Toxic Substances andDisease Registry, and the U.S. Food and Drug Administration (FDA) providerecommendations for safe exposure to methylmercury in the diet; suggested “safe” levelsrange from 0.7 μg/kg bodyweight/week (EPA) to 3.3 μg/kg bodyweight/week (WHO)(Clements et al., 2000). Most recommendations for methylmercury exposure limits arebased on data from the Iraqi epidemic (Bakir et al., 1973; Marsh et al., 1980), but becausethe exposures in Iraq were about six months in duration and at high concentrations,questions remain about generalizing the effects of this exposure period and concentrationlevel (Mahaffey, 1999). Recently, however, epidemiological studies of lower levels ofmethylmercury exposure have begun to emerge, heightening concern over potentialeffects of chronic, low level exposure to methylmercury, particularly for childrenexposed prenatally from maternal fish consumption.
3.3.1. Neurological Effects of Children’s Dietary Exposure toMethylmercury
In 1998, conflicting findings from two seminal studies on the effects of children’s dietaryexposure to methylmercury prompted the White House Office on Science andTechnology Policy (OSTP) to convene a multi-agency scientific review of risksassociated with chronic, low levels of methylmercury exposure (National Institute ofEnvironmental Health Sciences, 1998). Both of these studies, located in vastly differentgeographic areas, one in the Seychelle Islands in the Indian Ocean (Davidson et al., 1998)and the other in the Faroe Islands in the North Atlantic (Grandjean et al., 1997), arelongitudinal examinations of children’s neuropsychological functioning after prenatalexposure to methylmercury, in which mothers were enrolled in the studies duringpregnancy and their child’s development was followed into elementary school.
Both the Faroese and Seychellois consume a steady fish diet; the Faroese also consumeintermittent meals of pilot whale muscle. Despite comparable mercury levels frommaternal hair samples in the two populations—a geometric mean of 4.3 ppm in the FaroeIslands (Grandjean, et al., 1997) and an arithmetic mean of 6.8 ppm in the Seychelles(Davidson, et al., 1998)—investigators came to opposite conclusions about the effects ofmercury exposure on children’s intellectual functioning. In the Seychelle Islands, apreliminary pilot study revealed effects of prenatal methylmercury exposure on severalneurobehavioral assessments, but the researchers discounted these results when theexclusion of four “outlier” cases from the analysis dropped the effects below statisticalsignificance and because the pilot failed to include potential socioenvironenmentalconfounding variables (Myers et al., 1995). In the subsequent main study, researchersfound no association between 5.5-year-olds’ performance on global assessments ofintellectual functioning and mercury exposure measured in maternal hair samples(Davidson et al., 1998). In contrast, Faroe Islands investigators reported that each

Abt Associates Inc. Chapter 3 8
doubling in prenatal mercury exposure corresponded to a delay of one to two months inmental development at age seven (Grandjean et al., 1997).
In an attempt to account for these divergent findings, the OSTP panel identified fivemajor differences between the studies (Jacobson, 2001). First, the determination ofmercury exposure in the Faroe Islands study included measurement of the concentrationof methylmercury in umbilical cord blood, which primarily indicates exposure occurringduring the last trimester, a time of relatively rapid neuronal development. In theSeychelles Islands study, the measure of mercury exposure was limited to maternal hairsamples, which reflect exposure over the entire pregnancy. Second, children in theSeychelles Islands study were assessed at 5.5 years, an age during which rapiddevelopmental change and substantial individual differences in maturation may maskneurodevelopmental delays, whereas children in the Faroe Islands study were assessed atage 7, a time of relative developmental stability (Jacobson and Jacobson, 1991). Third,the assessments used in the Faroe Islands study were targeted at specific domains ofneuropsychological functioning, including measures sensitive to particular aspects offunction in language, memory, and attention, in contrast to more global measures ofcognitive functioning used in the Seychelles study. Thus, the measures and timing ofassessments in the Faroes study may have been better suited to detect an associationbetween exposure and neurodevelopmental delays. In addition to these methodologicaldifferences, panelists identified two potentially important environmental differences.First, the Seychellois’ steady diet of fish the Faroese diet includes intermittentconsumption of pilot whale meat, a source of methylmercury concentrations 10-20 timesstronger than those in fish (Grandjean, et al., 1992). Second, because environmentalcontaminants tend to be transported northward along prevailing currents, the NorthAtlantic region in which the Faroe Islands are located is subjected to much strongerconcentrations of polychlorinated biphenyls (PCBs) than the Seychelles Islands in theIndian Ocean. Some panelists suggested that prenatal methylmercury exposure mayaffect neurodevelopment only in the presence of significant PCB exposure (Jacobson,2001).
The OSTP panel concluded that uncertainty remained over low levels of methylmercuryexposure from fish (NIEHS, 1998). Subsequently, however, a National Academy ofSciences panel conducted further examination of these same two studies in conjunctionwith other data not considered by the OSTP panel. The NAS panel’s findings cast doubton the explanations offered to account for differences in the Faroese and Seychelloisfindings.
Specifically, the NAS panel evaluated the findings in light of a New Zealand studyconducted in the 1980s but published without formal peer review (Kjellstrom et al.,1989). Though similar in methodology to the Seychelles Island study, the New Zealandinvestigators did find effects of methylmercury. As in the Seychelles study, the NewZealand study: used maternal hair samples to measure methylmercury exposure; includeda global assessment of intelligence; and focused on a population likely exposed to verylow levels of PCBs. Moreover, the New Zealand study tested children close in age (i.e.,six-year-olds) to the 5.5-year-olds in the Seychelles. Finally, the diet of the New

Abt Associates Inc. Chapter 3 9
Zealanders was similar to that of the Seychellois, in that neither population consumedwhale meat; thus, the episodic peak doses of high levels of methylmercury among theFaroese could not account for the differences in the conclusions of the two islandsstudies. In light of these findings, arguments that research design differences between theFaroese and Seychellois studies could account for their conflicting conclusions weredeemed no longer persuasive (National Research Council, 2000). Further analysis by theNAS panel suggested that the Seychelles study may have lacked sufficient power todetect the relatively small effect sizes computed for the Faroe Islands data (NRC, 2000;Jacobson, 2001).
Because the data from all three studies more likely represent the typical exposurescenario of North American populations than did the Iraqi experience, the NAS panelrecommended that the EPA compute a new reference dose for methylmercury. In light oftheir evaluation of the Faroese, Seychellois and New Zealand studies and the burden ofpreventing potential risks to public health, the NAS panel argued that the positivefindings from the Faroe Islands data be accorded more weight than the lack of findingsamong the Seychellois cohort. Nevertheless, the NAS panel could not fully account forthe lack of findings in the Seychellois studies.
3.3.2. Mercury Exposure May Present Greater Risk for InfantsDespite unresolved differences in the findings of the Faroese and Seychellois studies,scientific review indicates general concern over the health effects of human exposure toeven low levels of mercury, particularly for infants. The developing fetus and youngchildren may be disproportionately affected by mercury exposure because many aspectsof development, particularly brain maturation, can be disturbed by the presence ofmercury (Mahaffey, 1999). Because newborns may have decreased ability to bothoxidize and eliminate mercury (Goldman et al., 2001), the resulting higher concentrationsof unoxidized mercury for longer durations than would typically be found in adults couldlead to toxic levels of accumulation. In addition, the primary way that the body gets ridof mercury is through bile, which infants do not produce (AAP, 1999). Also, the longhalf-life of methylmercury (average 50 days) results in accumulation that could beharmful to the developing fetal brain, which is much more susceptible to organomercurialcompounds than is the adult brain (Choi, 1989).
3.4. Uses of Thimerosal in Vaccines
Thimerosal is necessary for use as a preservative only when the vaccine is packaged in amulti-dose vial. In this circumstance, the thimerosal acts as a preservative to protect theremaining doses of the vaccine from bacterial and fungal contamination after a singledose is administered. Although in the United States multi-dose vials are currently notbeing used for vaccines administered as part of the recommended childhoodimmunization schedule, they remain the only option in many parts of the developingworld, as they are less expensive and require less storage space (Ball et al., 2001).

Abt Associates Inc. Chapter 3 10
In the late 1990s, childhood vaccines that contained thimerosal included hepatititis-b(HepB) vaccines , diphtheria-pertussis-tetanus (DPT) vaccines, some Haemophilusinfluenzae type b (HiB) vaccines, and the influenza vaccine. An additional potentialsource of mercury exposure was from receipt of hepatitis B immune globulins. Polio andmeasles-mumps-rubella vaccines did not contain thimerosal.
In addition to the postnatal sources of thimerosal, in utero exposure was possible viaadministration of thimerosal-containing preparations administered to mothers duringpregnancy. These included the influenza, tetanus, hepatitis B, and diphtheria-tetatnusvaccines, and anti-Rh immunoglobulins, which is used to suppress Rh-sensitization inRh-negative mothers who give birth to Rh-positive babies.
In addition to its use as a preservative, thimerosal is used as an inactivating agent in themanufacture of certain vaccines, and as a bacteriostatic agent during the productionprocess of other vaccines (Ball et al., 2001). Its use in manufacturing and productionprocesses, however, contributes little to the final concentration of ethylmercury in asingle vaccine. In the 1990s, receipt of a hepatitis B vaccine would result in exposure to12.5 micrograms of ethylmercury from the thimerosal used as a preservative. Most DTPand Hib vaccines in use at that time would have resulted in exposure to 25 micrograms ofethylmercury from the thimerosal used as a preservative, for each receipt. In contrast,thimerosal’s use in manufacturing and production results in, at most, exposure to 0.25 to0.75 micrograms of ethylmercury per vaccine receipt (Ball et al., 2001)2.
3.5. Recommendation to Remove Thimerosal from InfantVaccines
In July of 1999 the U.S. Public Health Service and the American Academy of Pediatricsissued a joint statement which established the goal of removing thimerosal as soon aspossible from vaccines customarily recommended for infants (AAP, 1999). Untilsufficient supplies of thimerosal-free vaccines were available, recommendations weremade to postpone the first hepatitis B (HepB) vaccine dose until two to six months of agefor infants born to hepatitis B-negative women, to avoid exposing newborn children toethylmercury at a time when they were especially vulnerable to neurotoxicity because oftheir small body mass and their inability to excrete the ethylmercury effectively.Pediatricians were further advised that the use of thimerosal-containing vaccines waspreferred to withholding vaccinations if no alternative was available
At the time of the recommendation, little was known about the toxicity of ethylmercuryand a review by Ball et al., (2001) revealed no evidence of harm caused by the doses ofthimerosal found in vaccines, except for local hypersensitivity reactions. That is, whenvaccines containing thimerosal had been administered in recommended doses,hypersensitivity had been noted, but no other harmful effects had been reported (CDC,2000). The case against ethylmercury was made primarily on the basis of the data on the
2 Ball et. al (2001) report that these processes result in a maximum of 2-3 micrograms of thimerosal / mL.Thimerosal is 49.6% mercury by weight. Multiplication of of relevant terms yields an estimate of 0.5 – 0.75micrograms of mercury per 0.5 mL dose.

Abt Associates Inc. Chapter 3 11
toxicity of methylmercury and clinical similarities between cases of ethyl- andmethylmercury poisoning.
Two ethylmercury epidemics in Iraq in the 1960s were remarkably similar to themethylmercury epidemics that occurred there in the 1970s: victims had consumed grain,or animals fed grain, that had been improperly treated with an ethylmercury-containingfungicide (Damluji, 1962; Jalili and Abbasi, 1961). The range of symptoms reportedincluded difficulty walking, ataxia, other motor function impairment, speech disorders,and visual field constriction. In addition to such dietary exposure, there are also reportsof neurologic symptoms in patients who received large overdoses of ethylmercury frommedicinal preparations (e.g., Axton, 1972; Fagan et al., 1977; Lowell et al., 1996). Forexample, a liver transplant patient given high doses of hepatitis-B immunoglobulins inpreparations containing thimerosal developed speech articulation difficulties, generalslowing of motor movements, and an inability to walk; chelation therapy eliminated thesesymptoms within four to five weeks (Lowell et al., 1996). Interestingly, hair samplesindicated that he had had prior environmental exposure to mercury, though from anundetermined source.
Although ethylmercury, in sufficiently high doses, has neurotoxic properties similar tothose of methylmercury, the relative toxicities of ethylmercury and methylmercury hadnot been well established (Ball et al., 2001). At the time of the recommendation forremoval of thimerosal, the effect of intermittent intramuscular doses of thimerosal-containing vaccines on neurodevelopmental outcomes had not been studied. One studydid measure the effect of a single dose of a thimerosal-containing HepB vaccination,administered within three days of birth, on infants’ blood-mercury levels. With one 0.5mL dose of the vaccine (approximately 12.5 μg of mercury), the mean mercury bloodlevel increased from . 54 to 7.36 μg/L in 15 preterm infants and .04 to 2.24 μg/L in fiveterm infants. These were statistically significant increases (Stajich et al., 2000).Therefore, a birth dose of the hepatitis B vaccine may measurably increase infant bloodmercury levels.
Calculations of the maximum potential exposure to ethylmercury from recommendedchildhood immunization schedules in effect in the 1990s suggest that infants couldreceive total doses of ethylmercury in excess of various agencies’ exposure limits formethylmercury during the first six months of life (Ball et al., 2001). The exact dosage ofthimerosal received depended on the vaccine schedule followed by the child and themanufacturer of the vaccine, but a worst-case scenario would be an infant who received aseries of vaccinations resulting in a maximum exposure to ethylmercury by age sixmonths that could reach approximately 187.5 μg. With limits for safe methylmercuryexposure between 34 and 159 μg, this suggested that some infants may have receiveddoses of mercury from vaccines that may have been of concern (WHO, 2000). Anadditional issue was that infants may not eliminate mercury as efficiently as olderchildren or adults (Goldman et al., 2001).

Abt Associates Inc. Chapter 3 12
3.6. Research on Neurotoxicity of Ethylmercury/ThimerosalSubsequent to the recommendation to remove thimerosal from childhood vaccinesseveral studies have been published that focus on the relationships between exposure toethylmercury from thimerosal-containing vaccines and neurodevelopmental outcomes ofchildren. These include studies by Verstraeten et al. (2003), Hviid et. al. (2003), Geierand Geier (2003a, 2003c, 2003c, 2004, 2005, 2006a, 2006b), Heron et. al. (2004),Andrews et. al. (2004), and Fombonne et al. (2006).
The study by Verstraeten et al. (2003) calculated measures of exposure and outcomesusing computerized records of three large HMOs. These records were developed andmaintained as part of the Vaccine Safety Datalink (VSD) system, and as part ofadministrative record keeping systems. Three measures of exposure were calculated fromthe computerized records of vaccine receipts. These were cumulative mercury exposurefrom birth to 1 month, cumulative mercury exposure from birth to 3 months, andcumulative mercury exposure from birth to 7 months. Outcome measures were obtainedfrom ICD-9 codes3 and were coded as the presence/absence of diagnoses ofneurodevelopmental disorders. Outcomes included autism, “other child psychosis”,stammering, tics, sleep disorders, eating disorders, emotional disturbances, ADD,developmental language delay, developmental speech delay, speech or language delay,and coordination disorder. Results were reported separately for each of the three HMOs.
The study reported no significant associations between outcomes and 1-monthcumulative exposure for any of the three HMOs. Significant findings were reported forassociations between 3-month cumulative exposure and tics at one HMO, and 3-monthexposure and language delay at a second HMO, and between 7-month cumulativeexposure and language delay at the same HMO.
The study had several important design weaknesses. First, it relied on physiciandiagnosis of childhood neurodevelopmental delays and other developmental outcomes,rather than a standardized assessment of children’s developmental status. Physiciandiagnosis is likely to introduce unreliability in the outcome measures, since differentphysicians may be using different criteria for classifying children as developmentallydelayed or as demonstrating behavioral problems such as ADHD. Second, usingphysician diagnosis introduces the possibility of bias in the measurement of childoutcomes, since children from families that are more attentive to seeking health care maybe both more likely to receive a diagnosis and more likely to have received all of his/hervaccinations on time, thus potentially having higher ethylmercury exposure. Third, thestudy did not have family demographic information and therefore the analyses could notcontrol for factors known to be associated with the outcomes.
The study by Hviid et al. (2003) used computerized records corresponding to all childrenborn in Denmark over the period January 1, 1990 to December 31, 1996, to estimate therelative risk of autism corresponding to cumulative ethylmercury exposure amounts of 0,25, 75, and 125 micrograms. No significant associations were reported.
3 ICD-9 = International Classification of Diseases, Nineth Revision, Clinical Modification.

Abt Associates Inc. Chapter 3 13
Each of the Geier and Geier (2003a, 2003c, 2003c, 2004, 2005, 2006a, 2006b) studiesreported finding associations between thimerosal-containing vaccines andneurodevelopmental disorders. However, the Institute of Medicine (IOM) (2004),characterized the first four of those studies (2003a, 2003c, 2003c, 2004) as having seriousmethodological limitations that render the results uninterpretable. Parker et. al, (2004)also identifies multiple methodological concerns with the same studies. Like the earlierstudies, the latter three papers (2005, 2006a, 2006b) report results of analyses of theVaccine Adverse Events Reporting System (VAERS) database. Detailed descriptions ofpotential biases and pitfalls that could arise from attempting to use the VAERS data tomake causal inferences are provided in IOM (2004) and Parker et. al (2004).
In addition to the results from analysis of VAERS data, the Geier and Geier (2005) paperreports results from analyses of VSD data. Although the authors of the Geier and Geier(2005) paper claim to have analyzed the VSD data as independent researchers, majorsections the text and several tables match almost identically to text and tables included ina preliminary draft of the Verstraeten et. al. paper, described above4.
The results reported by Heron et al (2004) were based on a study of over 13,000 childrenin the United Kingdom. Exposure data came from the Bristol-based Child HealthSurveillance Database. Outcome measures were created from maternal responses to theStrengths and Difficulties Questionnaire and the Child Behavior Checklist (behaviorratings), the Revised Denver Scale (fine motor development) and from other items in thematernal questionnaire (speech problems, tics, and special needs). Results of 69hypothesis tests (23 outcomes times 3 exposure measures) from models that controlledfor birth weight, gestation, maternal education, and other demographic characteristics ofthe child and family indicated nine significant associations between exposures andoutcomes. One was in the direction of increased exposure being related to harm, theremaining 8 were in the direction of benefit. Poor prosocial behavior at 47 months of agewas associated with higher 3-month exposure. Outcomes with associations in thedirection of benefit were conduct problems, fine motor skills at 30 months of age, tics at91 months of age, and two measures that are each indicators that the child has specialneeds. Several of these 5 beneficial outcomes had significant associations with twoexposure measures, totaling 8 significant hypothesis tests.
The results reported by Andrews et al. (2004) were based on data obtained from over 103thousand children. Exposure and outcome data were extracted from computerizedmedical records. Outcome measures were created from ICD-9 codes. Confoundervariables used in their statistical models included gender, year of birth, and whensignificant, month of birth. They reported beneficial associations between increasedexposure and general developmental disorders, ADD, speech or language delay, and
4 Early pre-publication write-ups of the Verstraeten et. al. analyses obtained via the Freedom of Informationact were posted on a web site and, at the time of this writing, are currently available on the web. SeeVerstraeten et. al. (2000) for details. For criticism regarding the differences in findings between preliminaryand final analyses conducted by Verstraeten et. al. see Redwood (2004). For a response to criticism, seeVerstraeten (2004).

Abt Associates Inc. Chapter 3 14
unspecified developmental delay. In a special sub-analysis that excluded children whohad not received all three recommended DTP vaccinations by one year of age, asignificant harmful association between increased exposure and tics was found. In the fulldata set, the estimates for tics were in the harmful direction, but not statisticallysignificant.
Fombonne et al. (2006) estimated the prevalence of pervasive developmental disorder(PDD) in cohorts of children in Montreal Canada over a span of time that included theremoval of thimerosal from childhood vaccines. They reported a statistically significantlinear trend in the prevalence of PDD during the study period. They also reported that theprevalence of PDD in thimerosal-free birth cohorts was significantly higher than that inthimerosal-exposed cohorts. They concluded that thimerosal exposure was unrelated tothe increasing trend in PDD prevalence in Montreal Canada.
3.6.1.1. The CDC Research ProgramTo study the potential health risks of thimerosal in vaccines, the CDC has utilized datafrom a vaccine safety monitoring project (the VSD) and has mounted a program ofresearch that includes a series of studies.
The CDC established the VSD Project in 1990 to improve the capability to study sideeffects of vaccines through large-linked databases of computerized vaccination andmedical records. This project involves partnerships with several large HMOs tocontinually monitor vaccine safety. The database includes information on more than sixmillion people. All vaccines administered within the study population are recorded, aswell as data on vaccine type, date of vaccination, concurrent vaccinations, manufacturer,lot number, and injection site. Records are monitored for potential adverse eventsresulting from immunization.
The first in the CDC’s series of studies on health effects of exposure to thimerosal wasthe screening study by Verstraeten et al. (2003), described previously. The intent of thisstudy was to determine if there were any adverse associations that could be subsequentlyinvestigated using more rigorous study designs.
The next three studies in the CDC’s series of investigations were:The Infant Environmental Exposures and Neurodevelopmental Outcomes at Ages 7-10
Years – This study is the focus of this report. This study was designed tofollow-up on the conflicting results from the screening study, as well as theresults Sechelles and Faroe Islands studies. To overcome some of themethodological limitations of the screening study, the current study conductedin-person assessments of children using a standardized battery ofneuropsychological assessments, sampled children based on vaccine exposurewithout regard health care utilization or neurodevelopmental diagnosis, andincluded extensive additional data on potential confounding factors.

Abt Associates Inc. Chapter 3 15
The Italian Trial on Acellular Pertussis Vaccines – This study comparesneuropsychological outcomes of children at ages 10-12 years that wererandomly assigned to receive either of two forms of diphtheria-tetanus-acellular pertusis vaccine (DTaP) in the first year of life. One of the two formsof DTaP included thimerosal as a preservative, the other included 2-phenoxyethanol as a preservative. Children that received the thimerosal-containing DTaPs had cumulative exposure to 137.5 micrograms ofethylmercury during the age range spanning birth to twelve months, from allvaccines including hepatitis-b receipts, while children receiving the other formof DTaP had total cumulative exposure of 62.5 micrograms during the sameage range. The study is currently in progress.
The Autism Case-Control Study – This study is using a case-control design toinvestigate whether there are associations between exposure to mercury fromthimerosal-containing vaccines and immune globulins, and autistic disorderand autism spectrum disorder. At the time of this writing, data collection wasunderway for this study.
3.7. Research Questions for the Current Study
The primary research questions that motivated the design and guided the analyses were asfollows:
1) Is there an association between neuropsychological outcomes and cumulativeexposure to mercury from thimerosal-containing vaccines and immune globulinsreceived during the age range spanning birth to seven months?
2) Is there an association between neuropsychological outcomes and cumulativeexposure to mercury from thimerosal-containing vaccines and immune globulinsreceived during the age range spanning birth to one month?
3) Is there an association between neuropsychological outcomes and prenatalexposure to mercury from thimerosal-containing vaccines and immune globulinsreceived by the mother during her pregnancy with the focus child?
Secondary research questions motivated additional analyses. These were:Do exposure effects vary by the sex of the child?Does prenatal exposure to mercury modify the effects of postnatal exposure to
mercury from thimerosal-containing vaccines and immune globulins?Does receipt of antibiotics, concurrent with receipt of thimerosal-containing vaccines
or immune globulins, modify the exposure effects?

Abt Associates Inc. Chapter 4 16
4. Study DesignThe current study utilized a retrospective cohort design5 (Kleinbaum, Kupper, &Morgenstern, 1982) wherein historical (administrative) data were used to select a cohortof children with a wide range of cumulative exposure to ethylmercury from thimerosalduring the age range spanning birth to seven months. This cohort of children was“followed” into the present, when the children were in the age range of 7-10 years, atwhich time outcomes were measured using a battery of neurodevelopmental assessments
Inferences regarding the relationships of prental and early childhood exposure toethylmercury from thimerosal-containing vaccines and immune globulins toneurodevelopmental outcomes were made from results of linear and logistic regressionmodels where outcomes were modeled as functions of the exposure variables, covariates,and residual error.
The choice of which tests to include in the battery of assessments was guided by theresults of the Faroe Islands study (Grandjean et al., 1997), the Sechelles Islands study(Davidson et al., 1998), and the CDC screening study (Verstraeten et al., 2003)), and bythe recommendations from the External Expert Consultants. Outcomes that were found tohave associations with mercury exposure in any of those studies were considered to beimportant outcomes for the current study. The battery of outcome assessments includedmeasures of speech and language, verbal memory, literacy achievement, fine motorcoordination, visual spatial ability, attention / executive functioning, behavior regulation,tics, and general intellectual functioning.
Data on prenatal and early childhood exposure to ethylmercury from thimerosal-containing vaccines and immune globulins were obtained from several sources: Medicalrecord abstractions, computer-automated medical records that are maintained as part theVaccine Safety Datalink system or as part of HMO administrative records, parent-provided immunization records, and parent interview.
Measures of child and family demographic characteristics, child birth conditions, prentaland childhood exposure to neurotoxins, child medical conditions, and measures ofmaternal diagnoses of speech delay, language delay, stuttering and attention deficithyperactivity disorder were used as covariates. The data required to construct thesemeasures were obtained from parent interview and from child and maternal medicalrecord abstraction.
5 Also known as a historical prospective design (Mausner & Bahn, 1985)

Abt Associates Inc. Chapter 5 17
5. Sample
The sample of study participants was drawn from a sampling frame created from VSDrecords from four participating health maintenance organizations (HMOs). Eligibilitycriteria are described in Section 5.1. The steps from creation of the sampling frame, tosample selection, to recruitment and data collection, to creation of the final analysissample are depicted in the flow chart in Exhibit 5.1 and are described in subsequentsections. The numbers appear smaller in each successive step as samples and sub-sampleswere drawn, as new information on eligibility was acquired in several steps thatnecessitated the omission of ineligible children, and for other reasons such as inability tolocate families or families’ refusal to participate.

Abt Associates Inc. Chapter 5 18
Exhibit 5.1. Data Collection Flow Chart
Sample Framen = 27,240
Selected Samplen = 7,982
Retained in Sample Physician, Geographic, Sibling,Membership Exclusions
n = 7,088 n = 894
Attempted to Recruit No Attempt to Recruitn = 3,648 (reserve sample that was not utilized)
n = 3,440
Child Assessed Child Not Assessed (n=2,541)
n = 1,107
51244
1,9852,541
IneligibleClinic endedRefused / unable to locate
Analysis Data Set Excluded (n=60)
n = 1,047
12475
2360
Year 1 care not in HMOLow birth weightNo weight dataNo prenatal exposure dataExclusionary medical condition

Abt Associates Inc. Chapter 5 19
5.1. Eligibility CriteriaEligibility criteria are listed in Exhibit 5.2. Children with particular medical conditionswere excluded from the study. The list of exclusionary medical conditions was developedby a team of five pediatricians from the CDC and from the HMOs. These conditions hadto be present at birth or diagnosed and recorded before the first birthday, and wereconditions that were deemed likely to have adverse effects on neurodevelopmentaloutcomes. Most exclusions due to medical conditions were applied during the creation ofthe sampling frame, using ICD-9 codes from the VSD database. Other exclusions wereapplied at the time of the telephone eligibility interview, and a small number ofexclusions were applied only after the sample child’s medical records had beenabstracted. Exclusionary medical conditions are shown Exhibit 5.3. Additionally,children who had ever been diagnosed with lead poisoning, or who had ever had bloodlead levels greater than 10 were excluded, as were children with uncorrected hearing loss.
Prior to recruitment, the children’s primary care physicians were informed of the namesof their patients that were selected to participate in the study, and the physicians had theopportunity to exclude any or all their patients if they so desired.
Exhibit 5.2. Eligibility CriteriaEligibility Criterion CommentsChild’s birth date between Jan 1, 1993 and Dec31, 1997
Children born during this period would be 7 to10 years of age at the time of assessment.
Child is currently a member of HMO. This criterion increased the likelihood thatcurrent contact information would be availablefor sample members.
Child must be born into HMO system This criterion increased the likelihood of havingcomplete prenatal and birth records
Child must be a member of HMO for entire firstyear of life.
This criterion increased the likelihood of havinga complete vaccination history and medicalrecords for entire first year of life.
Child must have received all year 1vaccinations at HMO
This criterion increased the likelihood of havingcomplete vaccination for entire first year of life.
Child must not have received any experimentalvaccines that had unknown thimerosalamounts.
If thimerosal amount was unknown, accurateethylmercury exposure could not beascertained.
Child must not have any siblings in the sample. If two or more eligible children from a singlefamily were randomly selected for inclusion inthe sample, only one of the children, chose atrandom, was retained in the sample.
Child and mother must speak English wellenough to participate in English languageinterviews and/or assessments.
Assessment of English language ability wasassessed during eligibility and recruitmentcalls.
Child must be singleton. Twins, triplets, multiple births were excluded.Child must live with biological mother at least 4days per week on average.
Child must live with biological mother to ensurethat questions on parent interview aboutprenatal and early experiences could beanswered, and must live with mother at least 4days per week to ensure that mother is veryknowledgeable about child’s development.

Abt Associates Inc. Chapter 5 20
Exhibit 5.2. Eligibility CriteriaEligibility Criterion CommentsChild must not have been takingantidepressant or anticonvulsant medication orhave been taking Clonopin (a type ofantihypertension medication).Child must live within 50 miles of the clinic sitewhere assessments were administered.Child must not have had any of theexclusionary medical conditions listed in Exhibit5.3.
The exclusionary conditions were medicalconditions diagnosed within the first year of lifethat are known or expected to be associatedwith poor scores on the outcome measures.
Children who had ever been diagnosed withlead poisoning, or who had ever had blood leadlevels greater than 10 were excluded.Children with uncorrected hearing loss wereexcluded.
Exhibit 5.3. Exclusionary Medical Conditions
ICD-9 Code Condition
Low birth weight (<2500 grams)
0478 VIRAL MENINGITIS NEC
0479 VIRAL MENINGITIS NOS0490 LYMPHOCYTIC CHORIOMENING
0498 VIRAL ENCEPHALITIS NEC
0499 VIRAL ENCEPHALITIS NOS
24200 TOX DIF GOITER NO CRISIS
243 CONGENITAL HYPOTHYROIDSM
244 ACQUIRED HYPOTHYROIDISM*2440 POSTSURGICAL HYPOTHYROID
2443 IATROGEN HYPOTHYROID NEC
2449 HYPOTHYROIDISM NOS
245 THYROIDITIS*
2452 CHR LYMPHOCYT THYROIDIT
2459 THYROIDITIS NOS2461 DYSHORMONOGENIC GOITER
2462 CYST OF THYROID
2468 DISORDERS OF THYROID NEC
2469 DISORDER OF THYROID NOS
3200 HEMOPHILUS MENINGITIS
3201 PNEUMOCOCCAL MENINGITIS3202 STREPTOCOCCAL MENINGITIS
3203 STAPHYLOCOCC MENINGITIS
32081 ANAEROBIC MENINGITIS

Abt Associates Inc. Chapter 5 21
Exhibit 5.3. Exclusionary Medical Conditions
ICD-9 Code Condition
32082 MNINGTS GRAM-NEG BCT NEC
3209 BACTERIAL MENINGITIS NOS3222 CHRONIC MENINGITIS
3229 MENINGITIS NOS
3231 RICKETTSIAL ENCEPHALITIS
3234 OTH ENCEPHALIT D/T INFEC
3236 POSTINFECT ENCEPHALITIS
3239 ENCEPHALITIS NOS3240 INTRACRANIAL ABSCESS
325 PHLEBITIS INTRCRAN SINUS
326 LATE EFF CNS ABSCESS
330 CEREBRAL DEGEN IN CHILD*
3300 LEUKODYSTROPHY
3301 CEREBRAL LIPIDOSES3308 CEREB DEGEN IN CHILD NEC
3309 CEREB DEGEN IN CHILD NOS
36900 BOTH EYES BLIND-WHO DEF
36923 ONE EYE-MODERATE/OTH-NOS
36960 BLINDNESS, ONE EYE
3699 VISUAL LOSS NOS3897 DEAF MUTISM NEC
7400 ANENCEPHALUS
7401 CRANIORACHISCHISIS
7410 SPINA BIF W HYDROCEPHAL*
74100 SPIN BIF W HYDROCEPH NOS
74103 SPIN BIF W HYDRCEPH-LUMB7420 ENCEPHALOCELE
7421 MICROCEPHALUS
7422 REDUCTION DEFORM, BRAIN
7423 CONGENITAL HYDROCEPHALUS
7424 BRAIN ANOMALY NEC
74300 CLINIC ANOPHTHALMOS NOS74310 MICROPHTHALMOS NOS
74312 MICROPHTH W OTH EYE ANOM
7433 CONG CATARACT/LENS ANOM*
74330 CONGENITAL CATARACT NOS
74335 CONGENITAL APHAKIA
74339 CONG CATAR/LENS ANOM NEC74343 CONG CORNEAL OPACIT NEC
7467 HYPOPLAS LEFT HEART SYND

Abt Associates Inc. Chapter 5 22
Exhibit 5.3. Exclusionary Medical Conditions
ICD-9 Code Condition
74682 COR TRIATRIATUM
747 OTH CONG CIRC SYST ANOM*74869 LUNG ANOMALY NEC
749 CLEFT PALATE & CLEFT LIP*
7490 CLEFT PALATE*
74900 CLEFT PALATE NOS
74901 UNILAT CLEFT PALATE-COMP
74902 UNILAT CLEFT PALATE-INC74903 BILAT CLEFT PALATE-COMPL
74904 BILAT CLEFT PALATE-INC
7491 CLEFT LIP*
74910 CLEFT LIP NOS
74911 UNILAT CLEFT LIP-COMPL
74912 UNILAT CLEFT LIP-IMCOMPL74914 BILAT CLEFT LIP-INCOMPL
7492 CLEFT PALATE W CLEFT LIP*
74920 CLEFT PALATE & LIP NOS
74921 UNIL CLEFT PALAT/LIP-COM
74922 UNIL CLEFT PALAT/LIP-INC
74923 BILAT CLFT PALAT/LIP-COM74924 BILAT CLFT PALAT/LIP-INC
74925 CLEFT PALATE & LIP NEC
75010 TONGUE ANOMALY NOS
75012 CONG ADHESIONS OF TONGUE
75015 CONG MACROGLOSSIA
75019 TONGUE ANOMALY NEC75026 MOUTH ANOMALY NEC
75029 PHARYNGEAL ANOMALY NEC
7507 GASTRIC ANOMALY NEC
7560 ANOMAL SKULL/FACE BONES
75616 KLIPPEL-FEIL SYNDROME
758 CHROMOSOMAL ANOMALIES*7580 DOWN'S SYNDROME
7581 PATAU'S SYNDROME
7582 EDWARDS' SYNDROME
7583 AUTOSOMAL DELETION SYND
7584 BALANCE AUTOSOM TRANSLOC
7585 AUTOSOMAL ANOMALIES NEC7586 GONADAL DYSGENESIS
7587 KLINEFELTER'S SYNDROME

Abt Associates Inc. Chapter 5 23
Exhibit 5.3. Exclusionary Medical Conditions
ICD-9 Code Condition
7588 SEX CHROMOSOME ANOM NEC*
75889 OTH CON D/T CHRM ANM NEC7589 CHROMOSOME ANOMALY NOS
7594 CONJOINED TWINS
7595 TUBEROUS SCLEROSIS
7596 HAMARTOSES NEC
7597 MULT CONGEN ANOMAL NEC
75981 PRADER-WILLI SYNDROME75983 FRAGILE X SYNDROME
7600 MATERN HYPERTEN AFF NB
7601 MATERN URINE DIS AFF NB
7602 MATERNAL INFEC AFF NB
7603 MATERN CARDIORESP AFF NB
76070 NOXIOUS SUBST NOS AFF NB76071 MATERNAL ALCOHOL AFF NB
76072 MATERNAL NARCOTIC AFF NB
76073 MATERNAL HALLUCIN AFF NB
76075 COCAINE - NXS INFL FETUS
76079 NOXIOUS SUBST NEC AFF NB
7608 MATERNAL COND NEC AFF NB7611 PREMAT RUPT MEMB AFF NB
7612 OLIGOHYDRAMNIOS AFF NB
7613 POLYHYDRAMNIOS AFF NB
7615 MULT PREGNANCY AFF NB
7617 ANTEPART MALPRES AFF NB
7618 MATERN COMPL NEC AFF NB7640 LT-FOR-DATES W/O FET MAL*
76400 LIGHT-FOR-DATES WTNOS
76401 LIGHT-FOR-DATES <500G
76402 LT-FOR-DATES 500-749G
76403 LT-FOR-DATES 750-999G
76404 LT-FOR-DATES 1000-1249G76405 LT-FOR-DATES 1250-1499G
76406 LT-FOR-DATES 1500-1749G
76407 LT-FOR-DATES 1750-1999G
76408 LT-FOR-DATES 2000-2499G
7641 LT-FOR-DATES W FETAL MAL*
76410 LT-FOR-DATE W/MAL WTNOS76413 LT-DATE W/MAL 750-999G
76418 LT-DATE W/MAL 2000-2499G

Abt Associates Inc. Chapter 5 24
Exhibit 5.3. Exclusionary Medical Conditions
ICD-9 Code Condition
7649 FETAL GROWTH RETARD NOS*
76490 FET GROWTH RETARD WTNOS76492 FET GROWTH RET 500-749G
76493 FET GROWTH RET 750-999G
76494 FET GRWTH RET 1000-1249G
76495 FET GRWTH RET 1250-1499G
76496 FET GRWTH RET 1500-1749G
76497 FET GRWTH RET 1750-1999G76498 FET GRWTH RET 2000-2499G
765 EXTREME IMMATURITY
7650 EXTREME IMMATURITY*
76500 EXTREME IMMATUR WTNOS
76501 EXTREME IMMATUR <500G
76502 EXTREME IMMATUR 500-749G76503 EXTREME IMMATUR 750-999G
76504 EXTREME IMMAT 1000-1249G
76505 EXTREME IMMAT 1250-1499G
76506 EXTREME IMMAT 1500-1749G
76507 EXTREME IMMAT 1750-1999G
76508 EXTREME IMMAT 2000-2499G7651 OTHER PRETERM INFANTS*
76510 PRETERM INFANT NEC WTNOS
76511 PRETERM NEC <500G
76512 PRETERM NEC 500-749G
76513 PRETERM NEC 750-999G
76514 PRETERM NEC 1000-1249G76515 PRETERM NEC 1250-1499G
76516 PRETERM NEC 1500-1749G
76517 PRETERM NEC 1750-1999G
76518 PRETERM NEC 2000-2499G
767 BIRTH TRAUMA*
7670 CEREBRAL HEM AT BIRTH768 INTRAUTERINE ASPHYXIA*
7681 FET DEATH-ANOXIA DUR LAB
7685 SEVERE BIRTH ASPHYXIA
769 RESPIRATORY DISTRESS SYN
7702 NB INTERSTIT EMPHYSEMA
7703 NB PULMONARY HEMORRHAGE7707 PERINATAL CHR RESP DIS
7721 NB INTRAVENTRICULAR HEM

Abt Associates Inc. Chapter 5 25
Exhibit 5.3. Exclusionary Medical Conditions
ICD-9 Code Condition
7722 NB SUBARACHNOID HEMORR
7725 NB ADRENAL HEMORRHAGE7757 LATE METAB ACIDOSIS NB
7762 DISSEM INTRAVASC COAG NB
7790 CONVULSIONS IN NEWBORN
7792 CNS DYSFUNCTION SYN NB
7794 NB DRUG REACTION/INTOXIC
7795 NB DRUG WITHDRAWAL SYNDRV310 TWIN, MATE LB-IN HOSP*
V3100 TWIN-MATE LB-HOSP W/O CS
V3101 TWIN-MATE LB-IN HOS W CS
V311 TWIN, MATE LB-BEFORE ADM
V3200 TWIN-MATE SB-HOSP W/O CS
V3201 TWIN-MATE SB-HOSP W CSV3300 TWIN-NOS-IN HOSP W/O CS
V3301 TWIN-NOS-IN HOSP W CS
V331 TWIN NOS-BEFORE ADMISSN
V3400 OTH MULT LB-HOSP W/O CS
V3401 OTH MULT LB-IN HOSP W CS
V370 MULT BIRTH NOS-IN HOSP*V3700 MULT BRTH NOS-HOS W/O CS
V3701 MULT BIRTH NOS-HOSP W CS
V3710 MULT BIRTH NOS-HOSP
5.2. Sampling FrameThe sampling frame for the current study, (i.e., the list from which the sample wasdrawn,) was created in collaboration with the data managers from each of the four HMOsparticipating in the study. HMO data managers first selected records from their VSDdatabase that satisfied birth year and HMO enrollment criteria. Abt Associates thencreated the final sampling frame by applying additional exclusionary criteria based onchild age, medical conditions, and primary care facilities. The numbers of children in thesampling frame by HMO and exposure categories are displayed in Exhibit 5.4. Theexposure categories represent levels of exposure to ethylmercury from thimerosal invaccines during the age range of one to seven months, crossed with exposure tothimerosal from receipt of hepatitis B vaccine during the first month of life.

Abt Associates Inc. Chapter 5 26
Exhibit 5.4Size of Sampling Frame by Exposure Category for Each HMO
HMO-A HMO-B HMO-C HMO-D Total
VSD Exposures HepB atBirth
HepB atBirth
HepB atBirth
HepB atBirth
HepB atBirth
Cumulative 1-7Months No Yes No Yes No Yes No Yes No Yes
(0 to 62.5 g ) 226 489 224 342 53 40 5 6 508 877(75.0 to 87.5 g ) 1122 1060 230 1272 2 3 1 10 1355 2345(100.0 to 112.5 g ) 4376 1328 463 4762 39 321 4 17 4882 6428(125.0 to 137.5 g ) 229 108 397 4703 20 34 1 157 647 5002(150.0 to 162.5 g ) 104 32 26 536 202 2424 18 120 350 3112(175.0 to 187.5 g ) 145 11 1 47 79 154 13 769 238 981(200.0 g & up ) 0 0 0 6 3 9 21 476 24 491
Total 6202 3028 1341 11668 398 2985 63 1555 8004 19236HMO / Grand Total 9230 13009 3383 1618 27240
Note: g = micrograms.
5.3. Sample SelectionThe primary objectives of the sample selection were to obtain a) a sample with a widedistribution of exposures, and b) an analysis sample of approximately 1,200 assessedchildren. Due to budget constraints the target sample size was subsequently reduced to1,100 assessed children. Power calculations had indicated that an analysis sample of thissize would have more than 90 percent power to detect hepatitis B at birth and cumulativeexposures in the one to seven month age range effects as small as r2 = 0.01 (i.e., the effectexplains one percent of total variance in the outcome measure). To obtain an analysissample of size n=1,100, we had to select a much larger sample in order to account forsample loss due to factors such as physician refusals, geographic criteria, inability to findsampled families, additional eligibility criteria ascertained during eligibility call, andunwillingness to participate in the study.
We had originally hoped to select a sample that was balanced across the four HMOs, andacross exposure categories within HMOs, and across age groups and primary carefacilities within exposure categories. Perfect balance across all of those factors wouldeliminate the possibility of confounding on those factors. Such balance was not feasible,however, due to the sizes of the sampling frame and the distribution of exposures withineach of the four HMOs. Based on the sizes and exposures across HMOs, the decision wasmade to allocate the sample unequally across the four HMOs. Stratified random sampleswere drawn from each HMO, where the strata were defined by exposure levels, withimplicit stratification by age cohort and primary care facility via the use of a systematicrandom sampling paradigm.
The sizes of the selected samples at each HMO are displayed in Exhibit 5.5.

Abt Associates Inc. Chapter 5 27
Exhibit 5.5Size of Samples Selected from Each HMO by Exposure Category
HMO-A HMO-B HMO-C HMO-D Total
VSD Exposures HepB atBirth
HepB atBirth
HepB atBirth
HepB atBirth
HepB atBirth
Cumulative 1-7Months No Yes No Yes No Yes No Yes No Yes
(0 to 62.5 g ) 226 489 224 342 53 40 5 6 508 877(75.0 to 87.5 g ) 534 534 230 483 2 3 1 10 767 1030(100.0 to 112.5 g ) 534 534 463 483 39 71 4 17 1040 1105(125.0 to 137.5 g ) 229 108 397 483 20 34 1 45 647 670(150.0 to 162.5 g ) 104 32 26 483 71 71 18 45 219 631(175.0 to 187.5 g ) 145 11 1 47 71 71 13 45 230 174(200.0 g & up ) 0 0 0 6 3 9 21 45 24 60
Total 1772 1708 1341 2327 259 299 63 213 3435 45473480 3668 558 276 7982
Note: g = micrograms.
5.4. Physician, Sibling, and Out-of-Area ExclusionsAfter sample selection, Abt Associates sent the IDs of the sampled children to the fourHMOs. Those IDs were used to generate letters to physicians informing them of whichof their patients had been selected for the study and allowing the physician to ask that anychild or family be removed from the sample. The HMOs tracked any families thatneeded to be removed from the sample based on physician requests. At HMO-B, if thechild’s primary care provider was unknown, the child was excluded from the sample atthis point.
The HMOs also identified sibling pairs within the sample (in a few cases, three siblingswere selected in the sample). The HMOs sent the IDs of the sibling groupings back toAbt Associates, where a random sample from each sibling group was selected to remainin the sample. The other member of the sibling pair (or members of the sibling group)was excluded from the sample.
At this phase, the HMOs also applied geographical exclusions whenever it wasdiscovered that some of the sampled children lived outside of the geographic boundariesof the defined study populations. Additionally, a small number of exclusions occurred atHMO-D during this phase due to membership criteria. Exhibit 5.6 summarizesexclusions made during this phase and the sizes of the remaining samples.

Abt Associates Inc. Chapter 5 28
Exhibit 5.6Sample Loss Due to Physician, Sibling, and Out-of-Area Exclusions
by HMOHMO
HMO-A HMO-B HMO-C HMO-D TotalN in Selected Sample 3480 3668 558 276 7982Exclusions: n % n % n % n % n % Physician exclusions 31 0.9 3 0.1 0 0.0 5 1.8 39 0.5 Physician Unknown 0 0.0 114 3.1 0 0.0 0 0.0 114 1.4 Sibling exclusions 138 4.0 177 4.8 10 1.8 9 3.3 334 4.2 Geographic exclusions 0 0.0 392 10.7 0 0.0 7 2.5 399 5.0 Membership exclusions 0 0.0 0 0.0 0 0.0 8 2.9 8 0.1Total Excluded 169 4.9 686 18.7 10 1.8 29 10.5 894 11.2Remaining Sample 3311 95.1 2982 81.3 548 98.2 247 89.5 7088 88.8
5.5. Recruitment in BatchesSamples were released for recruitment in randomly selected batches. We monitored theparticipation rates across all four HMOs as recruitment and testing was underway. Thebatch release of sample allowed us to keep assessment clinics full to the maximum extentpossible as the various assessment sites got up and running at various rates. The batchrelease also made possible the inclusion of children in later batches that were too youngto satisfy eligibility criteria in earlier batches. Batches were selected as stratified randomsamples of the full samples, where strata were defined by exposure levels, with implicitstratification by age cohort and facility via the use of a systematic random samplingparadigm.
The batch histories are shown in Exhibit 5.7. All IDs from the two smaller HMOs(HMO-C and HMO-D) were released for recruitment in batches. At the two largeHMOs, the full samples were not needed in order to achieve the overall targeted size forthe analysis sample of tested children. Therefore, only a subset of the samples wasreleased for recruitment. At each of the two large HMOs, there were small numbers ofchildren for whom no attempt at recruitment was made because the study ended andclinics closed before the recruitment calls were made.
Exhibit 5.7Batch History by HMO
HMOHMO-A HMO-B HMO-C HMO-D Total
N in Sample 3311 2982 548 247 7088Batches: Month n Month n Month n Month n 1st Batch June 839 June 600 May 548 May 110 2097 2nd Batch Jan. 250 June 220 Aug. 137 607 3rd Batch Sept. 800 800 4th Batch March 250 250Total Batches 1089 1870 548 247 3754Recruitment endeda -61 -45 -106Total Attemptsb 1028 1825 548 247 3648a “Recruitment ended” means clinics closed prior to recruitment call. No attempt was ever made to contact these families.b “Total Attempts” are the numbers of children for whom eligibility and/or recruitment calls were made.

Abt Associates Inc. Chapter 5 29
5.6. Recruitment and Eligibility OutcomesFamilies whose physicians allowed them to be contacted by the study were sent a letterand informational brochure. A postcard was enclosed that the family could return to theHMO indicating their willingness (or refusal) to participate in the study. If no returnpostcard was received from a family, this mailing was followed by a telephone call froman HMO study team member, who followed a recruitment script to ascertain (a) if themother had any questions about the materials received, and (b) if the mother was willingto be contacted by a representative of Abt Associates Inc.
Families who did not agree to be contacted by Abt Associates were asked if they werewilling to provide reasons for their refusal, so that the study could track non-responsedata. For the families who agreed to be contacted, locating information was given to AbtAssociates for follow-up to confirm the child’s eligibility and the family’s willingness toparticipate. Subsequently, a Screening Interview was conducted with each family bytelephone by a trained Abt Associates interviewer. In addition to confirming that thefamily and child met the eligibility criteria previously discussed, additional criteria wereapplied: the child could not be one of a multiple birth (e.g., twin, triplet), and thebiological mother had to have been at least 16 years old at the time of the target child’sbirth. The Screening Interview also collected information on additional criteria forparticipation: the biological mother had to be available to participate in the assessment,had to be mentally competent to understand the consent form and the researchinstruments, could be interviewed in English, and lived with the target child at least fourdays a week.
Exhibit 5.8 summarizes the results of the recruitment effort. The row labeled “complete”indicates children who were recruited, were determined to be eligible, and whoparticipated in testing. Summed across the four HMOs, the total number of children thatparticipated in the assessments was n=1,107. The row labeled “ineligible” shows thenumbers of children that were determined to be ineligible during the eligibility call. Therow labeled “clinic ended” shows the numbers of families that had had been contactedand who indicated a willingness to participate, but who were never assessed because datacollection ended before they were scheduled to come to the clinic for an assessment. Therow labeled “Refused (active)” indicates families that were contacted but who declined toparticipate in the study. The row labeled “Refused (passive)” shows the numbers offamilies that either could not be located, or had been contacted but were never assessedfor any of a number of reasons, e.g. scheduling issues and failure to return phone calls.
There is little information available on the families that refused to participate. Some ofthe study’s internal review boards (IRBs) specified that after a family had activelyrefused participation, no further analyses of any of the electronic data that had beenavailable during construction of the sampling frame were allowed. At two of the sites, a

Abt Associates Inc. Chapter 5 30
small sub-sample of families that actively refused was administered a refusal interview.Eighty-four refusal interviews were obtained from refusers from HMO-B, and 118 refusalinterviews were obtained from HMO-C. Of the families that provided reasons for non-participation, 68 percent said it was due to lack of time or a busy schedule, and 13percent gave reasons that indicated they distrusted or were ambivalent towards research.
Exhibit 5.8Recruitment & Eligibility Outcomes by HMO
HMOHMO-A HMO-B HMO-C HMO-D Total
Total Attemptsa1028 1825 548 247 3648
Outcomes n % n % n % n % n %Ineligible 182 17.7 235 12.9 78 14.2 17 6.9 512 14.0Refused (active) 297 28.9 408 22.4 174 31.8 80 32.4 959 26.3Refused (passive) 167 16.3 723 39.6 75 13.7 61 24.7 1026 28.1Clinic ended 30 2.9 13 0.7 0 0.0 1 0.4 44 1.2Complete 352 34.2 446 24.4 221 40.3 88 35.6 1107 30.3Total 1028 100.0 1825 100.0 548 100.0 247 100.0 3648 100.0“Total Attempts” = the numbers of children for whom eligibility and/or recruitment calls were made.“Ineligible” = child was determined to be ineligible during eligibility call.
“Refuse (active)” = Contact was made with child’s mother and she indicated that she could not or would not participate.“Refuse (passive)” = Includes unable to locate, non-working phone number, maximum number of telephone attemptsexceeded, calls not returned, willing to participate by repeated postponements to scheduled assessment, no-show at clinic.“Clinic ended” = Clinic ended after recruitment call. These families had expressed a willingness to participate, but clinicsclosed prior to testing.“Complete” = child was assessed.
5.7. Size of Analysis Sample
A total of 1,107 children were assessed for the study. After each child participated intesting, his/her medical records were abstracted and his/her mother’s medical records forthe period covering her pregnancy with the focus child were abstracted. Review of thesedata abstracted from medical charts resulted in the identification of a set of children thatwere ineligible for the study. In this section we describe 60 children that were excludedfrom the analysis data set. After applying exclusions, the analysis data set included IDsfrom 1,107 – 60 = 1,047 children. The 60 excluded children included:
1 that was excluded because the child did not receive care from the participatingHMO during his/her first year of life.
24 that were excluded because they were low birth weight. 8 that were excluded because they have no weight data at any age (no birth
weight, no weights at subsequent ages). 6 that were excluded because they had no information on prenatal exposures. 23 that were excluded due to exclusionary medical conditions.

Abt Associates Inc. Chapter 5 31
One child was excluded because she/he did not receive care from the participating HMO,and we therefore did not have the necessary data on exposures. During creation of thesampling frame, low birth weight children (less than 2,500 grams) were identified viaVSD diagnosis codes and were excluded. The 24 low birth weight children excludedfrom the analysis data set did not have the relevant VSD diagnosis codes so were notexcluded during sample frame creation, but were identified as low birth weight from thedata abstracted from their medical charts. Birth weights and body weights measured atsubsequent ages were used in the calculation of exposure levels6. For the eight childrenwith no recorded weight measurements, the postnatal measures of exposure toethylmercury from thimerosal could not be calculated. Therefore, those children wereexcluded from the analysis data set. Six children were excluded because no informationon prenatal exposures to mercury from thimerosal were available from either maternalmedical records or from the parent interview.
During the creation of the sampling frame, records were excluded from the sample basedon exclusionary medical conditions that were identified via codes in the VSD database.After chart abstractions were completed, we created a document summarizing all medicalconditions identified in the abstracted chart data for any of the 1107 children. A team offive pediatricians reviewed the data and identified a set of conditions that were consistentwith the exclusions applied during the creation of the sampling frame. In addition to the24 low birth weight children, described previously, 23 additional children were excludeddue to exclusionary medical conditions identified from the chart-abstracted data.
6 The measures of postnatal exposure to ethylmercury from thimerosal were calculated as a function of theamount of mercury received and the child’s weight at the time of vaccine receipt.

Abt Associates Inc. Chapter 6 32
6. Data Sources
Data were obtained for the current study from a variety of sources, as shown in Exhibit6.1.1. These include: (a) parent interviews; (b) records of children vaccine histories frompediatrician/clinic visits; (c) direct child assessments, (d) scoring of a language samplefrom each child, conducted by professionals at a specialized speech and languagelaboratory; (e) behavior ratings of the child by the mother and the child’s primary schoolteacher (the latter administered by mail survey); (f) ratings of the presence of tics andstuttering, collected from the child’s mother, teacher, and the child assessor at the clinic;(g) medical record abstraction, and (h) computer-automated medical data on children’shealth conditions and vaccinations, collected in accordance with the Vaccine SafetyDatalink (VSD) system. Each data source is described below.
6.1. The Clinic Visit
Testing clinics were established at each of the participating HMOs. The clinics wereorganized to provide a standardized testing situation for children and a site wheremothers could be interviewed without distractions. At the clinic visit, a trainedinterviewer conducted the Parent Interview, conducted the parent IQ test, obtained parentratings of the child’s behavior and neurological functioning, and collected any records theparent kept on the child’s schedule of vaccinations. A trained child tester, who wasblinded to the child’s vaccine history, conducted a battery of neuropsychologicalassessments with the child.
As shown in Exhibit 6.1.1, the clinic visit produced data on outcomes, exposures, andcovariates. Clinic visits took between 3 and 4 hours to complete, with breaks and snacksfor the mother and child. For the clinic visit, children who were taking medication(s) forattention deficit hyperactivity disorder (ADHD) were asked to refrain from taking themedication 12 hours prior to the clinic visit.

Abt Associates Inc. Chapter 6 33
Exhibit 6.1.1Sources for each Type of DataData Source MethodChild outcomes Neuropsychologicaloutcomes
Direct assessment Clinic visit: assessments administered at clinic bytrained child tester
Speech anomalies Direct evaluation oftaped speech sample
Clinic visit/outside evaluation: taped speechsample from child evaluated at speech/languagelaboratory (University of Pittsburgh)
Attention, executivefunctioning, and behaviorregulation at home
Parent rating Clinic visit: parent ratings as part of ParentInterview
Attention, executivefunctioning, and behaviorregulation at school
Teacher ratings Mail questionnaire: Sent out to child’s teacher
Tics and stuttering Parent rating Clinic visit: parent ratings as part of ParentInterview
Teacher rating Mail questionnaire: Sent out to child’s teacherAssessor rating Clinic visit: assessor rating as end of assessments
Exposures Child Medical report Data abstraction: data from VSD computerized
databaseClinic visit: vaccination record brought by parentinto clinic visit
Parent report Clinic visit: Parent Interview questions on child’sreceipt of vaccinations
Child medical records Data abstraction: Medical record data Mother Mother medical records Data abstraction: Medical record data
Parent report Parent interviewCovariates Maternal IQ KBIT (Kaufman Brief
Intelligence Test)Clinic visit: administered at clinic by trainedinterviewer
Characteristics of child,family, home
Parent report Clinic visit: Parent Interview
Exposure to other toxins Parent report Clinic visit: Parent Interview Medical history Child medical record Data abstraction: Medical record data
6.1.1. Clinic StaffTwo kinds of staff operated the clinic sessions: the Clinic Managers (parent interviewer)Child Assessors. Clinic Managers were college graduates who had extensive experienceeither in office management or in coordinating research studies. These staff people wereresponsible for administering the informed consent, conducting the Mother Interview(described in a subsequent section), providing guidance to the mother for completing theself-administered rating scales, conducting the mother IQ measure, and performing all ofthe administrative tasks that were necessary for the coordination of the data collection.The Clinic Manager scheduled all clinic visits, sent data to Abt Associates, orderedsupplies, and acted as coordinator on site.
Child Assessors had at least a Master’s degree, some had PhDs, and all had training andexperience in testing children. These staff were critical to the study and were extensivelytrained to be proficient in the administration and scoring of the child tests. In addition,they were responsible for making sure that the data that they collected were sent to theappropriate people for subsequent review and processing.

Abt Associates Inc. Chapter 6 34
In addition to the two types of clinic staff, a third type of professional provided overallsupervision of the child assessors. At each HMO, the study hired licensed ClinicalPsychologists who were trained to review the administration and scoring of the tests. TheClinical Psychologists double-scored the data provided by the Child Assessors. ChildPsychologists reviewed all child assessment data (previously scored and entered by theChild Assessors) for completeness and accuracy and were responsible for interpretationof the tests and for writing the letters to the parents informing them of their children’sresults. Clinical Psychologists also were available to parents to discuss their children’sscores. Furthermore, a Clinical Psychologists was on call each time the clinic was insession, to provide backup support for the Child Assessors and to be available forconsultation on the phone or in-person in case of emergencies
6.1.1.1. Training and Quality ControlOne of the most important activities of this project was the training and testing of ClinicManagers and Child Assessors for inter-rater reliability. This training was conducted byexperienced neuropsychologists. Clinic Managers and Child Assessors had to pass twokinds of reliability testing. First, they were tested for administrative fidelity duringtraining, based on mock scripts and were tested for scoring accuracy using writtenscoring tests. At training, Clinic Managers and Child Assessors had to pass tests ofadministration and scoring for all of the instruments for which he/she was responsible.Any Clinic Manager or Child Assessor who did not pass these tests was not hired for thestudy.
Training and reliability checks continued for Clinic Managers and Child Assessors in thefield. Prior to the actual data collection, pilot testing with non-study families wasconducted to test the data collection protocol, check timing of clinic assessments and totalclinic visit, and to further establish reliability of the Clinic Managers and ChildAssessors. Clinic managers audiotaped these pilot interviews and tests and sent thesetapes along with their scored tests and edited interviews to Abt staff for review.
Each Child Assessors was observed conducting a test session by a ConsultingPsychologists with pilot test children. Consulting Psychologists were given specificcriteria to use for monitoring the Child Assessors during each subtest. They were askedto make judgments about each Child Assessor’s fidelity to the test administration basedon the project training and the assessor’s ability to establish rapport with the child duringtesting.
6.1.2. Child AssessmentsAt the clinic, each child was administered a battery of 14 tests comprising 26 subtests andcovering nine developmental domains. Additional measures of child outcomes wereobtained from parent interview and teacher surveys (described subsequently) and fromchild assessor ratings of the presence of tics and stuttering. The battery of assessments issummarized in Exhibit 6.1.2. Note that one of the measures, the Goldman-Firstoe, was

Abt Associates Inc. Chapter 6 35
scored outside of the clinic in a language laboratory under the supervision of Dr. TomCampbell of the University of Pittsburgh.

Abt Associates Inc. Chapter 6 36
Exhibit 6.1.2Child Assessment Battery
Measurement Instrument Subtest(s)/Constructs Tested Outcome(s) Data Collection MethodSpeech and LanguageBoston Naming Test Naming vocabulary Total number of correctly-named
picturesDirect assessment at clinic
NEPSY(2 subtests)
Language subtests:Speeded Naming (rapid accessto/production of names of recurring colors,sizes, shapes)
Comprehension of Instructions(process/respond quickly to verbalinstructions of increasing syntacticcomplexity)
Total score(based on Time to Completion andTotal Number Correct)
Total correct responses
Direct assessment at clinic
Clinical Evaluation of LanguageFundamentals–Third Edition (CELF-3)(2 subtests)
Expressive language subtests:Formulated Sentences (formulation ofsimple, compound, complex sentences)
Recalling Sentences (recall/ reproduction ofsentence surface structure as a function ofsyntactic complexity)
Total score based oncompleteness of sentence
Total score based onaccuracy of sentence recall
Direct assessment at clinic
Goldman-Fristoe 2 Test of Articulation(GFTA-2)
Sounds-in-Words (spontaneous speechproduction of single words)
Total number of articulation errors Audio recording of child sentto speech laboratory forscoring on articulation.
Iowa Scale for Rating Severity ofStuttering
Speech/language dysfluencies Parent rating (1-7)Clinical assessor rating (1-7)Teacher rating (1-7)
Rating by parent and clinicalassessor at the clinic visitRating by teacher via mailsurvey
Verbal MemoryCalifornia Verbal Learning Test—Children’s Version (CVLT-C)(5 subtests)
Immediate Free RecallShort Delay Free RecallShort Delay Cued RecallLong Delay Free RecallLong Delay Cued Recall
Total number correctly recalledTotal number correctly recalledTotal number correctly recalledTotal number correctly recalledTotal number correctly recalled
Direct assessment at clinic
Children’s Memory Scale Stories 1 andStories 2 (2 subtests)
Immediate Recall of connected, meaningfultextDelayed Recall of connected, meaningful text
Number correctly recalled story unitsNumber correctly recalled story units
Direct assessment at clinic
AchievementWoodcock-Johnson Psycho-EducationalBattery-Revised: Tests of Achievement
Letter-Word Identification (phonemicawareness--ability to match a rebus withactual picture; ability to identify isolated lettersand words)
Total number correct converted to“W” [Rasch logit score]
Direct assessment at clinic

Abt Associates Inc. Chapter 6 37
Exhibit 6.1.2Child Assessment Battery
Measurement Instrument Subtest(s)/Constructs Tested Outcome(s) Data Collection MethodFine Motor CoordinationGrooved Pegboard(2 subtests)
Manipulative dexterity- Dominant hand
Manipulative dexterity- Non-dominant hand
Total time to completion: dominanthandTotal time to completion: non-dominant hand
Direct assessment at clinic
Finger Tapping Test(2 subtests)
Manipulative dexterity- Dominant hand
Manipulative dexterity- Non-dominant hand
Maximum number of taps: dominanthandMaximum number of taps: non-dominant hand
Direct assessment at clinic
Visual Spatial AbilityStanford-Binet Intelligence Test Copyingsubtest
Visuomotor coordination (reproduce designswith blocks/ copy simple and complexgeometric patterns from pictures on cards)
Total number correct Direct assessment at clinic
Attention /Executive FunctioningGordon Diagnostic System (GDS)(2 subscores)
Vigilance Task: ability to respond accuratelyand quickly to presentation of paired numberson screen
Number correct responsesNumber commissions
Direct assessment at clinic
WISC III Digit Span subtest(3 subscores)
Memory for digit strings Score for digits forwardsScore for digits backwardsCombined score
Direct assessment at clinic
Behavior Rating Inventory of ExecutiveFunction (BRIEF)
Metacognition Index (child’s ability to plan,organize, sustain future-oriented problemsolving in working memory)
Parent rating: Total scoreTeacher rating: Total score
Separate ratings by child’steacher (mail survey) andparent (parent interview)
Behavior RegulationConners’ Rating Scales—Revised(2 subscores)
Inattentive (cluster of symptoms on DSM-IVdiagnosis of ADHD--predominantlyinattention)Hyperactive-Impulsive (cluster of symptomson DSM-IV diagnosis of ADHD--predominantly hyperactivity-impulsivity)
Parent rating: Total scoreTeacher rating: Total score
Separate ratings by child’steacher (mail survey) andparent (parent interview)
Behavior Rating Inventory of ExecutiveFunction (BRIEF)
Behavioral Regulation Index (shifting ofcognitive set and modulating emotions andbehavior to achieve goal)
Parent rating: Total scoreTeacher rating: Total score
Separate ratings by child’steacher (mail survey) andparent (parent interview)
TicsYale Global Tic Severity Scale(scores for 2 types of tics)
Motor ticsPhonic tics
Clinical assessor report of motortics/phonic tics during assessment
Parent report on motor tics/phonictics shown by child in prior 7 days
Ratings by parent as part ofparent interview at clinic andby child assessor at end ofclinic visit

Abt Associates Inc. Chapter 6 38
Exhibit 6.1.2Child Assessment Battery
Measurement Instrument Subtest(s)/Constructs Tested Outcome(s) Data Collection MethodGeneral Intellectual FunctioningWASI(4 subtests resulting in Verbal andPerformance scores)
Verbal subtests:Vocabulary (oral definition of orally-presented words)Similarities (state rule for how two objectsor concepts are similar)]Performance subtests:Block Design (2-dimensional geometricpatterns to be replicated with two-color cubes)Matrix Reasoning (choosing piece of matrixthat best completes the designs—untimed;taps analogic reasoning, spatial visualization,visuospatial reasoning)
Verbal IQ standard score(M=100, SD=15)
Performance IQ standard score(M=100, SD=15)
Full scale IQ standard score(M=100, SD=15)
Direct assessment at clinic

Abt Associates Inc. Chapter 6 39
6.1.3. Parent InterviewThe parent interview was administered to the child’s biological mother during the clinicvisit. The interview produced detailed data on:
Family structure and demographics Family educational history Home characteristics Prenatal medical care Events and exposures during pregnancy with focus child Events and exposures during infancy Child’s use of medications Child’s developmental diagnoses Maternal developmental diagnoses
To obtain a measure of the mother’s IQ, the Kaufman Brief Intelligence Test (KBIT) wasadministered to each mother by the clinic coordinator.
Mothers were also asked to bring their child’s immunization records from their personalfiles to the clinic visit.
As part of the parent interview, the mother rated the child’s behavior at home, using theConners Rating Scales and the Behavior Rating Inventory of Executive Function(BRIEF).
Mothers were also asked whether the child had exhibited any stuttering or tics in theseven-day period leading up to the clinic visit.
6.2. Teacher Mail SurveyThe child’s primary school teacher also was asked to (a) rate the child’s behavior usingConners’ Rating Scales and the BRIEF , which produced measures of children’sattention/executive functioning, and behavior regulation, and (b) indicate whether thechild exhibited stuttering at school in the seven-day period leading up to date that theteacher completed the child ratings. This information was obtained from teachers viamail-return questionnaire.
6.3. Medical Record AbstractionsData from both the mother’s and the child’s medical records was abstracted by trainedrecord abstractors at each HMO (typically, HMO medical staff). The abstraction weredeveloped to collect the following information from the maternal medical record: 1)pregnancy history; 2) complications, illness, procedures and treatments during thepregnancy with the target child; 3) procedures or complications of labor and delivery,including method of delivery and any drugs administered during labor; 4) maternalhepatitis B antigen status, receipt of Rhogam (or other Rh(D) immunoglobulin), and

Abt Associates Inc. Chapter 6 40
receipt of any vaccines during pregnancy with target child; and 5) maternal medicalhistory for developmental outcomes.
Data abstracted from the child’s medical records included: 1) perinatal data, such asgestational age, birth weight, birth length, head circumference at birth, Apgar scores andbirth plurality; 2) abnormal conditions and clinical procedures relating to newborn; 3)infant medications; 4) all receipts of any vaccines or immune globulins; 6) all receipts ofantibiotics; 7) developmental delays or conditions and psychiatric conditions, includingdate of the first mention of the condition in the medical chart, date of first prescribedmedications, date of first referral, and type of service provider; and 8) medical conditions,such as lead poisoning and anemia/iron deficiency, including date of first mention in themedical chart.
Each medical record abstractor attended a half-day training session that covered thebackground and purpose of the study; medical abstraction forms for the mother and child;working with the clinician to obtain copies of medical release forms of the clinicallyassessed children in order to obtain medical records; maintaining subject confidentiality;transmittal of data to Abt’s central office; and quality assurance.
All medical abstraction data were double entered by a professional data-entry house.
6.4. VSD Computer-Automated DataThe computer-automated data, collected and maintained in accordance with the VaccineSafety Datalink (VSD) system (Chen et. al, 2000), were provided to the study from eachof the four participating HMOs. These data were used in the creation of the sample frame(see Chapter 5) and used in the analysis phase to create measures of exposure andcovariate measures. These data sets included information on child’s sex and date of birth;vaccination information including date and type of vaccine received, vaccinemanufacturer and lot number and indicators of whether vaccines were received inside oroutside of the HMO; inpatient and outpatient medical care information including ICD-9codes and dates; and information about child’s birth including gestational age, birthweight, apgar score, and mother’s date of birth.

Abt Associates Inc. Chapter 7 41
7. Measures
7.1. Outcome Measures
7.1.1. Outcomes Measured on Continuous ScalesThirty-five of the 42 outcomes in this study were measured on a continuous scale. Eachof these 35 outcome measures was obtained from administration of commerciallyavailable assessment instruments and in each case we followed the test publisher’sinstructions for administering the assessments and assigning scores. After the outcomemeasures were entered into a computerized database, each measure was subjected to aseries of checks prior to its inclusion in the analysis data set. A record identified in any ofthe following checks triggered a process of looking up the original hand-recordedassessment form, recalculating summary scores (if applicable), and checking against thevalue shown in the computerized database:
1. Either raw or scale score outside the range of values indicated in the test’stechnical manual.
2. Child had either a raw score but a missing scale score, or a scale score but amissing raw score.
3. Standardized (studentized) residuals from model with scale score regressed onraw score exceeds cut-off level7.
4. Standardized (studentized) residuals from model with scale score regressed on ageand sex exceeds cut-off level.
5. Standardized (studentized) residuals from model with raw score regressed on ageand sex exceeds cut-off level.
6. Very unusual value identified in scatter-plot of raw score versus age.7. Very unusual value identified in scatter-plot of scale score versus age.
7.1.2. Dichotomous Outcomes: Tics and Stuttering
Unlike the previously described continuous outcome measures, the tics and stutteringoutcomes were not obtained from commercially available assessment batteries. As will bedescribed below, assessments of the presence of tics and stuttering among studyparticipants were obtained from multiple sources. As part of determining the most validway to construct the child outcomes for tics and stuttering, we consulted with a speechand language expert, Dr. Thomas Campbell of the University of Pittsburgh. We reviewedour tics and stuttering data with Dr. Campbell and made final decisions about how toconstruct the outcomes. The decisions regarding the creation of the tics and stutteringmeasures were made prior to any linking of exposure and outcome data.
7 We used a cut-off suggested by Bollen and Jackman (1990) to identify distance outliers (i.e., highlyunusual observations). Their suggested cutoff is the quantile of a t-distribution corresponding to probabilityequal to n2/ and degrees of freedom equal to the number of observations minus 1. With alpha set to0.05 and n equal to 1,047, the value of the cut-off level is +/- 4.08.

Abt Associates Inc. Chapter 7 42
7.1.2.1. TicsThe study collected information on children’s tics from two sources: the parent reportedon any tics shown by their child currently (in the seven days prior to and including theday of assessment) or ever, and the clinical assessor reported on any tics manifested bythe child during the testing session. Parents were given instructions on how to recognizephonic and motor tics, and were asked to indicate whether the child exhibited each typeof tic. The clinical assessors were provided with standardized training on how tics mightbe manifested in children.
Four binary outcome variables were created to indicate the presence of tics:
Any motor tic observed by the clinical assessor at the time of the testing; Any phonics tic observed by the clinical assessor at the time of the testing; Any current motor tic reported by the child’s mother; Any current phonics tic reported by the child’s mother.
1. Separate tic variables were constructed for the assessor and the parent for threereasons:
The two reporters did not agree on which children had tics. Although boththe parents and the assessors identified 95 children as having motor tics,only 22 of the 95 children were identified by both having motor tics. Theassessors identified 73 children as having motor tics that were notidentified by the parents, and the parents identified a different 73 childrenas having motor tics that were not identified by the assessors. Similarly,assessors identified 76 children as having phonic tics, the parentsidentified 107 children as having phonic tics, and only 17 children wereidentified as having phonic tics by both assessors and parents.
There are logical reasons to believe that the two reporters might identifydifferent children as having tics, based on the fact that parents have a morethorough knowledge of their child in various types of situations but theassessor, unlike the parent, was observing the child in a potentiallystressful situation where any tics might be likely to appear.
In previous studies using tics as a child outcome, physician reports are thecommonly used basis for identifying tics. Since physician reports of ticsare likely to reflect parent report rather than direct physician observationof tics, we wanted to maintain a tic variable that comes closest toapproximating the reporting basis in the literature.
2. Our rationale for constructing separate variables for motor and phonics tics ratherthan combining them into a single binary variable (any type of tic or none) is as follows.When clinicians discuss tics, they typically are referring to motor tics. In order tomaintain a variable that links most directly to the way the field thinks about tics, wedecided to create separate variables for motor and phonics tics.

Abt Associates Inc. Chapter 7 43
3. Although both the parent and the assessor could report multiple types of motor orphonics tics, we constructed a binary variable (any tic) rather than a count of tics, sincewe believed that the actual number of tics identified may not have been reliable.
4. Parents reported both any current motor or phonics tics and any tics that the child evermanifested. We decided to construct the tic variables for parents based only on theirreports of current tics. This is based on the recommendation of our technical expert thattransient tics are less likely to be severe or notable and therefore should not beconsidered.
7.1.2.2. Stuttering
The study collected information on children’s stuttering from three sources: parent reporton whether the child currently stuttered; the clinical assessor report on any stutteringexhibited by the child during the testing session; and reports from the children’s teacherson any stuttering by the child while in school. Each reporter was asked to indicate theseverity of the child’s stuttering on a 7-point scale, where 1 = very mild and 7 = verysevere.
Three binary outcome variables were created to indicate the presence of stuttering:
Any stuttering observed by the clinical assessor during thetesting;
Any stuttering reported by the parent; Any stuttering at school reported by the teacher.
1. Reports on stuttering from parents, clinical assessors, and teachers were kept separate,to maintain parallelism with the tic variables.
2. A child was identified as having a stutter only if the reporter indicated the severity ofthe stuttering was at least 2 on the 7-point scale, where 2 = mild. This means that nostuttering and very mild stuttering form the “0” value on the binary stuttering variableand mild to very severe (2 and above) form the “1” value. This criterion was based on arecommendation by the technical expert, who felt that a child rated as having very mildstuttering probably does not have a stuttering disorder.

Abt Associates Inc. Chapter 7 44
7.2. Measures of Postnatal Exposure to Ethylmercury
7.2.1. Introduction to the Vaccination Histories FileThree sources of postnatal vaccination data (computer-automated, chart abstraction, andparent provided immunization records) were combined to create a Vaccination HistoriesFile. This file contains the vaccination histories of the n=1,047 children in the analysisdata set. Each row of the Vaccination Histories File represents a record of a vaccinereceived on a particular day. Thus, the file has many records per child. The file includeseach child’s “resolved vaccine history”, and also includes the raw, original, un-cleanedvaccine data from each of three data sources. The resolved vaccine histories wereobtained from cleaning the raw, original data and resolving any discrepancies among thethree data sources and any discrepancies between the records and recommendedchildhood vaccination schedules. Cumulative exposure amounts were calculated fromeach child’s resolved vaccine history. Data cleaning procedures are describedsubsequently.
Exhibit 7.2.1.1 shows an example resolved vaccine history for one child. The column“Res_Vacdays1” shows the child’s age in days at the time of each vaccine receipt. Theexhibit shows that the child received vaccines on the day she/he was born (day 1), and atages 63, 126, and 183 days. The next three columns to the right show the type of vaccinereceived (Res_VacType), the manufacturer (Res_Mfr), and the ethylmercury amountcontained in each vaccine (MercAmt). Additional detail is provided subsequently in thisdocument regarding vaccine types and the assignments of mercury amounts associatedwith each receipt. The column labeled “RecptWtKG1” shows the child’s weight (inkilograms) at the time of vaccine receipt. And the final column (Amt_wt1) shows themercury amount for each receipt divided by the child’s weight at the time of the vaccinereceipt. To create the exposure variables used in the analyses, the values of “Amt_wt1”were summed over particular age ranges.

Abt Associates Inc. Chapter 7 45
Exhibit 7.2.1.1 Example of a Resolved Vaccine HistoryChildID Res_Vacdays1 Res_VacType Res_MFR MercAmt RecptWtKG1 Amt_wt1
0001 1 HepB SKB 12.50 3.65 3.42
0001 63 DTP CON 25.00 5.90 4.240001 63 HIB MSD 12.50 5.90 2.120001 63 HepB SKB 12.50 5.90 2.120001 63 Polio LED 0.00 5.90 0.00
0001 126 DTP CON 25.00 7.17 3.490001 126 HIB MSD 12.50 7.17 1.740001 126 Polio LED 0.00 7.17 0.00
0001 183 DTP CON 25.00 8.51 2.940001 183 HepB SKB 12.50 8.51 1.470001 183 Polio LED 0.00 8.51 0.00
7.2.2. Overview of Steps from Raw Data to Creation ofAnalysis Variables
Data on early childhood exposure to ethylmercury from thimerosal containing vaccinesand immune globulins were obtained from three sources: From computer-automated datafiles, from abstractions of each child’s medical records, and from records provided byparents at the time of the parent interview. An overview of the data processing steps fromthe receipt of raw data files to the creation of the exposure variables used in analyses is asfollows:
1. The master list of study IDs was merged to each of the three vaccine files(computer-automated, chart abstraction, and parent provided immunizationrecords). Any problems with ID discrepancies were resolved at this stage. Each ofthe three files contained many records per child ID, where each recordrepresented a single vaccine receipt. Each file contained fields for child’s ID, typeof vaccine received, and either the date the vaccine was received or the child’sage in days at the time of vaccine receipt. The computer-automated and chartabstracted data sets also contained fields for vaccine manufacturer and lotnumber. The master list of study IDs contained each child’s ID and date of birth.
2. For each of the three files (chart, computer automated, parent providedimmunization records) a new VacType (vaccine type) variable was created, wherethe possible values taken by the variable, and the spelling of each vaccine typewere standardized across all three files. For example, in the computer-automateddata set, the codes 08, 43, and 45 took the value “HepB” on the VacType variable.In the chart data set, entries originally recorded as “HEP B”, “HEP-B”, “HEP BRECOMB”, and several others were assigned the value “HepB” on the VacTypevariable. In the parent report data set, entries originally coded as “hepb”, “HepB”,and several others were assigned the value “HepB” on the VacType variable. Thecommon coding of the VacType variable made possible the merging andalignment of the three data sources on receipts of particular types of vaccines. All

Abt Associates Inc. Chapter 7 46
recodes were discussed and confirmed during weekly conference calls with thewhole study team (the team included CDC staff, principal investigators from eachof the HMOs, many of whom are pediatricians, data managers from each of theHMOs, and Abt staff).
3. For the chart abstraction and parent provided immunization records files, eachchild’s age in days corresponding to each vaccine receipt was calculated. Thecomputer-automated data set was delivered to Abt Associates with a field forchild’s age in days at time of vaccine receipt.
4. The three files were merged by child’s ID, child’s age in days at time of vaccinereceipt, and vaccine type.
5. The next step was to resolve discrepancies in vaccine histories. Discrepanciesincluded differences between the three data sources regarding the receipt of avaccine on a particular day, or between the vaccine history indicated in the dataset and the recommended vaccine schedule. An example of the former is a casewhere the medical chart abstraction data set indicated receipt of hepatitis-Bvaccine for a child on day 1 (i.e. on day child was born), but where the computer-automated data showed no receipt on that day, and where the parent did notprovide a vaccine record. An example of the latter is when a particular datasource (e.g. chart or computer automated) indicated receipt of two full series ofDTaP, HIB, and HepB only two days apart. Receipt of two full series separatedby only two days represents a major discrepancy from recommended vaccineschedules. It is exceedingly unlikely that a child would have received these seriestwo days apart. It is much more likely that the duplicate records are due to clericalerrors. Resolution of discrepancies was a major task and is considered in greaterdetail in Section 7.2.3. This data cleaning phase focused exclusively on vaccinesand immune globulins received during the age range from birth to one year.Resolution of discrepancies resulted in a “resolved vaccine history” for eachchild.
6. In the next step we assigned a mercury exposure amount corresponding to eachvaccine receipt shown in each child’s resolved vaccine history. For example,polio vaccine receipts were assigned an exposure amount equal to zeromicrograms of ethylmercury, hepatitis-b vaccines were assigned an exposureamount equal to 12.5 micrograms of ethylmercury, and HIB vaccines wereassigned values of 0, 12.5, or 25 micrograms depending on the type of HIBvaccine received. Additional details on the exposure amounts corresponding toeach vaccine type are provided in Section 7.2.4.
7. Next, we needed to obtain the child’s weight (in kilograms) corresponding to eachage (in days) that the child received a vaccine. For most records the process wasstraightforward because children’s weights are often recorded in medical recordsat the same time that vaccines are administered. In some cases, however, the dataon children’s weights were incomplete or did not align perfectly to the dates ofvaccine receipt. When a vaccine receipt did not have a corresponding weight, oneof two methods was used to impute a weight. If there were recorded weightsbefore and after the vaccine receipt, then linear interpolation was used to predictthe child’s weight on the day of vaccine receipt. If there were no recorded weightsafter the vaccine receipt, then all of the child’s recorded weights were used in a

Abt Associates Inc. Chapter 7 47
growth curve model to predict the child’s weight at the time of the vaccinereceipt. The predictions from the growth curve models aligned very closely withthe growth curves published in the 2000 CDC Growth Charts for the UnitedStates: Methods and Developments. Children with no recorded weights wereexcluded from the analysis data set.
8. For each vaccine receipt, the mercury exposure amount (expressed as microgramsof ethylmercury contained in the vaccine) was divided by the child’s weight (inkilograms) at the time of vaccine receipt, resulting in a measure of exposure perkilogram per vaccine receipt. For example, if a child weighed 8 kilograms at thetime of receipt of a vaccine containing 12.5 micrograms of ethylmercury, then thevalue on this variable corresponding to this vaccine receipt would be equal to 12.5/ 8 = 1.56 micrograms per kilogram.
9. Finally, for each child, the variables representing exposure per kilogram pervaccine receipt were summed over all vaccines and immune globulins receivedwithin each of three age ranges (0 to 7 months; 0 to 1 month; 1 to 7 months) toproduce the following three variables that were used in the analytical models: Exp07mos = “Exposure zero to 7 months” = Exposure per kilogram per
vaccine receipt summed over all vaccines and immune globulins receivedduring the age range from birth to seven months of age (1 to 214 days).
HepB = “Exposure zero to 1 month” = Exposure per kilogram per vaccinereceipt summed over all vaccines and immune globulins received during theage range from birth to one month of age (1 to 28 days). This variable wasnamed “HepB” because all vaccine received during this age range were eitherhepatitis-b vaccines or hepatitis-b immune globulins.
Exp17mos = “Exposure one to 7 months” = Exposure per kilogram pervaccine receipt summed over all vaccines received during the age range fromone to seven months of age (29 to 214 days).
Several additional exposure variables were created and used in models to estimateexposure effects when the receipt of thimerosal-containing vaccines coincided withantibiotic treatment. Those variables are described in the section titled “ConcurrentAntibiotics-by-Exposure Interaction Models” (Section 9.2.6).
Three additional variables were created that were not used in the analytical models, butwere used for descriptive purposes. These three variables were similar to those definedabove, except that there was no division by the child’s weight at the time of vaccinereceipt. They are:
Amt07mos = “Amount zero to 7 months” = Amount of ethylmercury pervaccine receipt summed over all vaccines and immune globulins receivedduring the age range from birth to seven months of age (1 to 214 days).
Amt01mos = “Amount zero to 1 month” = Amount of ethylmercury pervaccine receipt summed over all vaccines and immune globulins receivedduring the age range from birth to one month of age (1 to 28 days).
Amt17mos = “Amount one to 7 months” = Amount of ethylmercury pervaccine receipt summed over all vaccines received during the age range fromone to seven months of age (29 to 214 days).

Abt Associates Inc. Chapter 7 48
7.2.3. Data Cleaning for Child Vaccination Histories
Data on early childhood exposure to Thimerosal from vaccines and Hepatitis-B immuneglobulins were obtained from three sources: From computer automated data files8, fromabstractions of each child’s medical records, and from records provided by parents at thetime of the parent interview. Section 7.2.2 provided an overview of the data processingsteps from the receipt of raw data files to the creation of the exposure variables. Thepurpose of the current section is to provide detail on the data cleaning procedures used toderive a “resolved vaccine history” for each child. We use the term “resolved vaccinehistory” to mean the final vaccine history for a child after having resolved anydiscrepancies among the three data sources regarding the receipt of a vaccine on aparticular day, or between the vaccine history indicated in the raw data set and therecommended vaccine schedule.
In the sections that follow we describe each of several data cleaning procedures that wereapplied to the combined data set. Explanations of these procedures are accompanied byexamples. The data cleaning procedures were developed in close consultation with datamanagers and investigators at each of the four participating HMOs, and withinvestigators at the CDC. This team included several pediatricians with firsthandexperience in administering childhood vaccinations and in-depth knowledge ofvaccination policies and practices used during the time period covered by the study. Theteam also included data managers and analysts from the HMOs who had a great deal ofexperience in the use of vaccination data for research purposes.
In a process spanning several months, the entire team scrutinized countless records tohelp develop and validate the data cleaning procedures. As computer automated cleaningalgorithms were developed, samples of resulting vaccine histories, shown along with theraw data from each of the three data sources, were sent out to all team members and werediscussed during weekly telephone conferences. Near the end of the process, in order tovalidate that the computerized algorithms did not generate any unexpected results, Abtstaff scrutinized printouts showing the resolved histories and the raw data for every childin the data set.
8 Each HMO that participated in the study maintains computer-automated vaccine records foradministrative use and for research purposes. These computer-automated files are part of the VaccineSafety Datalink system.

Abt Associates Inc. Chapter 7 49
7.2.3.1. Step 1: Preliminary Vaccine History
After combining vaccination data from all three sources (chart, computer-automated,parent provided immunization records) we preliminarily assumed, when a vaccine receiptappears in one or more, but not all three data sources, that the vaccine was received bythe child. In other words, a vaccine did not need to appear in all three data sources inorder to be counted. As will be shown later, the assumption is preliminary becausesubsequent cleaning rules may remove one or more of the vaccines from the resolvedhistory. An example of the application of this assumption is shown in Exhibit 7.2.3.1,where the resolved vaccine history includes a hepatitis-B vaccine receipt at age 2-days.The right-hand panel of the exhibit shows the vaccine records from the chart, computer-automated and parent provided immunization records data sets. The relevance of thecolumns for manufacturer and lot number will become apparent in subsequent examples.As shown in the exhibit, this receipt was indicated in the chart data, but was not presentin the computer-automated data. There were no parent provided immunization data forthis child. The left-hand panel of the exhibit shows the resolved vaccine history for ID #258. This child received hepatitis-B vaccines at ages 2, 54, and 282 days, and severalother vaccines on ages 60, 178, and 233 days. The resolved vaccine history includes onlyvaccines received during the age range spanning from birth to 365 days, i.e. from age (indays) = 1 to 365. The columns of the middle panel of the exhibit are for indicators fordecision rules. None of those rules were applied in this example, but will be discussed ina subsequent section.
7.2.3.2. Step 2: Application of 30-day and 15-day AlgorithmsA set of algorithms was developed to detect duplicate records of receipts of HepB, Hib,DTP, DTaP, combined DTP-Hib, combined DTaP-Hib, and polio vaccines within thefirst year of life. Since polio vaccines did not contain thimerosal, it was not strictlynecessary to include them in the cleaning processes, but they were included nonetheless.However, for the other vaccines listed above, failure to identify and remove duplicaterecords from the resolved vaccine history would result in an overestimate of a child’smercury exposure. Checks for other, less commonly administered childhood vaccines aredescribed in a subsequent section of this document.
For all of the vaccine types listed above, except HepB, the algorithms were based on anassumption that two receipts of a single type of vaccine separated by a period of 30 daysor less, represents a major discrepancy from the recommended vaccination schedule.When such cases were detected, the algorithms marked one of the assumed duplicates forremoval, and retained the other in the resolved vaccine history. The process for decidingwhich to keep and which to remove is described subsequently. These algorithms werecreated with the full awareness that, in the rare instance that a child was mistakenlyadministered one or more of these vaccines twice in a period of less than 30 days, theapplication of the algorithm would result in an underestimate of the child’s actualexposure. However, there was consensus among the study team that those instances were

Abt Associates Inc. Chapter 7 50
expected to be exceedingly rare, whereas duplicate entries of the same vaccine wereknown to be common. Therefore, the algorithms focused on solving the commonproblem, hence preventing overestimates of exposure, while simultaneously, in rareinstances, potentially causing underestimates.
The assumptions underlying the algorithms for HepB were similar to those describedabove, except that, when one of the receipts is a HepB that was received in the firstmonth of life, it is plausible for two doses to be separated by a period of less than 30days. This occurs, for example, in cases when a child receives a late birth dose of HepB,or an early month-1 dose of HepB. Examples include records of children who receivedHepB vaccinations on days 1 and 29, on days 15 and 43, and on days 2 and 31. The teamconsidered it to be implausible to receive two doses within a period of 15 days or lesswhen one of the receipts occurs in the first month of life, so the algorithm wasprogrammed accordingly. When neither receipt fell within the first 30 days of life, the 30-day algorithm as previously described was applied for HepB vaccinations.
Detecting duplicate records for DTPs and Hibs was complicated by the fact that somediscrepancies were caused by situations such as a record of a combined DTP-Hib vaccinein one data source, but separate DTP and Hib vaccines in another source, or entry of aDTP in one source, but entry of a DTaP in another source. The algorithms were designedto detect duplicates in all permutations of individual DTP, DTaP, DT TD, TT,experimental DTaP, and HIB vaccines, and combined DTP, DTaP, and HIB vaccines.
When duplicate records were detected, a set of decision rules was applied to determinewhich of the two records should be omitted and which should be retained in the resolvedvaccine history. The first decision rule was dependent on which of the two records hadnon-missing information on manufacturer and/or lot number. The record containinginformation on manufacturer and lot number was deemed to be more reliable and wastherefore retained. In order to facilitate the comparisons, a manufacturer and lot numberinformation score was computed for each record as follows. The combined data setincluded two variables from the chart data set that listed vaccine manufacture and lotnumber, and two additional variables listing vaccine manufacture and lot number fromthe computer-automated data set. For each of those four variables, we created acorresponding dummy variable that took the value “1” if the manufacturer or lot numberwas non-missing, and took the value “0” otherwise. We then calculated the sum of thefour dummy variables to obtain the manufacturer and lot number information score foreach vaccine record. Possible values on this score were 0, 1, 2, 3, or 4. If one of the twoduplicates had a higher score, it was retained, and the other was omitted.
Exhibit 7.2.3.2 shows an example where combined DTP-HIB vaccines were retained ondays 121, and 185, while separate DTP and HIBs were omitted from the same daysbecause the former had non-missing manufacturer and lot number, while the latter didnot. This example also shows same-day-duplicate HIBs that were omitted on day 63. Inthe “decision rules” columns of the exhibit, “1”s indicate omitted duplicates.
Abt Associates Inc. Chapter 7 51
In cases of a tie on the manufacturer and lot information score, a second decision rulewas implemented. Many duplicates were caused by slight discrepancies between thecomputer-automated and Chart data sources on the child’s age in days at the time ofvaccine receipt. If either of the two duplicates matched the parent provided data regardingthe age in days at time of vaccine receipt, and the other did not, the record with the matchin the parent data set was retained and the other was omitted.
An example of the application of the second decision rule is presented in Exhibit.7.2.3.3where HIB and polio vaccines recorded on day 117 were omitted from the resolvedhistory because the same vaccine types were recorded on day 120, and the latter hadmatching parent provided data. This exhibit also has an example of an application of thefirst decision rule. The exhibit shows DTaPs on days 62, 120, and 174 that were omittedbecause the records of DTPs on the same days had non-missing manufacturer and lotnumbers.
Finally, if neither of the two previous rules produced a decision of which to retain andwhich to omit, then one was chosen at random to retain, and the other was omitted. Anexample is presented in Exhibit 7.2.3.4, where records of HIB and polio receipts on day130 were omitted, but records of the same vaccines received on day 131 were retained inthe resolved vaccine history. The choice of which to omit and which to retain wasrandom.
7.2.3.3. Step 3: Check, Verify or Fix
This section summarizes a set of checks that were carried out on the children’s vaccinehistories to identify potential errors. Vaccine histories identified by this set of checkswere scrutinized by the study team during weekly phone conferences and decisions weremade either verifying that the history was already correct, or that fixes were needed.Often a decision was made that a child’s medical records should be pulled and studied forclues on how to resolve potential discrepancies. The process of checking and fixing wasiterative, such that after programming code was written and executed resulting in achange in a set of resolved vaccine histories, the set of checks was run again. Theprogramming code used to make changes was applied only to the resolved vaccinehistory. The original data from the chart, computer-automated, and parent immunizationrecords sources were never changed. A summary of the set of checks is as follows:
1) Verify that there are no two receipts of vaccines of a single type separated by less than30 days, unless one is a HepB that was received during the first month of life.
2) Check for any receipts shown as having occurred before the child was born.
This type of error was caused by incorrect date entries. These errors were rectified byexamination of the child’s full vaccine history, followed by a decision regarding the mostlikely correct date of receipt. For example, in one case a DTP-HIB vaccine was shown ashaving been received 180 days prior to the birth of the child. By changing the date of

Abt Associates Inc. Chapter 7 52
receipt by one year, the vaccine lined up with other vaccine receipts that occurred whenthe child was 185 days old.
3) Check for receipts of anything other than HepB during first 30 days of life.
Receipts of anything other than HepB or HepB immune globulin were treated as dataentry errors. Examples include a record of a receipt of HIB at age 2-days, and for adifferent child, a receipt of DTP at age 1-day. In both cases the children received HepBvaccinations on those days. In both cases it was believed that the entries of the HIB andDTP vaccines were inadvertent.
4) Identify and check any histories indicating more than 3 HepB receipts in the first yearof life.
The vaccine histories of children with more than three HepB receipts during the first yearof life were examined by the study team. In instances where the receipts occurred aroundbirth, 2 months, 4 months, and 6 to 12 months, the histories were deemed to be plausibleand no further action was taken. When the four receipts deviated considerably from thatpattern, staff from the relevant HMO went back to the child’s medical charts to look forclues as to what might have happened. In one example, receipts were listed at birth,around 1 month, around 6 months, and around 7 months. Review of the charts indicatedthat the record of receipt near 7 months was an error. That receipt was omitted from thechild’s resolved vaccine history.
5) Identify and check any histories indicating more than 3 DT receipts (including DTPs,DTaPs, TT, experimental DTaP vaccines, DTaP-HIB or DTP-HIB combinations, etc) inthe first year of life.
The vaccine histories of children with more than three DT receipts during the first yearof life were examined by the study team. In instances where the receipts occurred around2, 4, 6, and 12 months, the histories were deemed to be plausible and no further actionwas taken. When the four receipts deviated considerably from that pattern, staff from therelevant HMO went back to the child’s medical charts to look for clues as to what mighthave happened. In one example, receipts were listed at days 66, 121, 154, and 188.Review of the charts indicated that the record of receipt at 154 days was an error. Thatreceipt was omitted from the child’s resolved vaccine history.
6) Identify and check any histories indicating more than 4 HIB receipts (includingcombination vaccines with DTP or DTaP) in the first year of life.
A finding that a child’s vaccine history indicated more than 4 HIB receipts triggered achart review by staff at the relevant HMO. In one case, the receipt of 5 HIBs by a singlechild within the first year of life was deemed to be accurate.
7) Identify and check any histories indicating a receipt of an influenza vaccine in the first120 days of life.

Abt Associates Inc. Chapter 7 53
It would be unusual to receive a flu shot in this age range. None were found.
8) Checks for Hepatitis-A, MMR, varicella and polio vaccines.
These vaccines never contained thimerosal, so obtaining clean histories was not criticalfor these vaccines. However, checks were run to help identify anomalies in the children’shistories. Checks included identification of histories where either varicella or MMRvaccine was received in the first 180 days of life, histories where any hepatitis-A vaccinewas received before age 1 year, and histories indicating more than three polio receipts inthe first year
A list of all vaccine types remaining in the resolved vaccine histories of all children, andthe amount and the mercury amount assigned to each receipt is shown in Section 7.2.4.

Abt Associates Inc. Chapter 7 54
Exhibit 7.2.3.1Example Vaccine History: Record of HepB Vaccine Receipt at Age 2-Days Shown in Chart Data, but no Corresponding Recordin Computer-Automated Data.
Resolved Vaccine Decision Rule Indicators Chart, Computer-automated, and Parent ProvidedImmunization Data
History HepB HepB DTP DTP Same Bad LookID Age Res. Res. Polio Polio HIB HIB Day Date up Age Chart Cmptr Parent Chart Cmptr Chart Cmptr
Days Vac. Mfr. R1 R2 R1 R2 Dup. Days Vac. Vac. Vac. Mfr. Mfr. Lot Lot258 2 HepB MIS 2 HepB MIS MIS258 54 HepB SKB 54 HepB HepB ENG SKB ENG 110258 60 DTP CON 60 DTP DTP CON CON 2B4 2B4258 60 HIB PRX 60 HIB HIB PRA PRX M13 M13258 60 Polio LED 60 Polio Polio LED LED 67 67258 178 DTP LED 178 DTP DTP LED LED 350 350258 178 HIB PRX 178 HIB HIB PRA PRX M13 M13258 178 Polio LED 178 Polio Polio LED LED 352 352258 233 DTP CON 233 DTP DTP CON CON 3J4 3J4258 233 HIB PRX 233 HIB HIB PRA PRX M13 M13258 233 Polio LED 233 Polio Polio LED LED 352 352258 282 HepB SKB 282 HepB HepB ENG SKB 128 128258 465 DTP DTP CON CON 3F5 3F5258 465 HIB HIB PRA PRX M71 M71258 465 MMR MMR MSD MSD 116 116
Notes: For brevity, manufacturer and lot numbers are truncated to three characters. Actual values span more characters and may include blank spaces.Resolved vaccine history includes only vaccines received in the age range of 1 to 365 days.

Abt Associates Inc. Chapter 7 55
Exhibit 7.2.3.2Example Vaccine History: Combined DTP-HIB Vaccines Retained on Days 121, and 185 While Separate DTP and HIBs Omittedfrom Same Days Because Former Had Manufacturer and Lot Number. Same-Day-Duplicate HIBs Omitted on Day 63.
Resolved Vaccine Decision Rule Indicators Chart, VSD, and Parent Provided ImmumizationRecords Data
History HepB HepB DTP DTP Same Bad LookID Age Res. Res. Polio Polio HIB HIB Day Date up Age Chart Cmptr Parent Chart Cmptr Chart Cmptr
Days Vac. Mfr. R1 R2 R1 R2 Dup. Days Vac. Vac. Vac. Mfr. Mfr. Lot Lot26 1 HepB MIS 1 HepB HepB MIS UNK MIS26 1 63 HIB MSD 13626 1 63 HIB UNK26 63 DTP CON 63 DTP DTP MIS CON MIS 3D526 63 HIB MSD 63 HIB HIB MIS MSD MIS 13626 63 HepB SKB 63 HepB HepB MIS SKB MIS ENG26 63 Polio LED 63 Polio Polio MIS LED MIS 7126 121 DTP-HIB LED 121 DTP-HIB LED 39026 1 121 DTP DTP MIS UNK MIS26 1 121 HIB HIB MIS UNK MIS26 121 Polio LED 121 Polio Polio MIS LED MIS 7126 185 DTP-HIB LED 185 DTP-HIB LED 39026 1 185 DTP DTP MIS UNK MIS26 1 185 HIB HIB MIS UNK MIS26 185 HepB SKB 185 HepB HepB MIS SKB MIS ENG26 185 Polio LED 185 Polio Polio MIS LED MIS 7126 371 DTP-HIB UNK26 371 MMR UNK26 371 DTP DTP MIS UNK MIS26 371 HIB HIB MIS UNK MIS
Notes: For brevity, manufacturer and lot numbers are truncated to three characters. Actual values span more characters and may include blank spaces.Resolved vaccine history includes only vaccines received in the age range of 1 to 365 days.

Abt Associates Inc. Chapter 7 56
Exhibit 7.2.3.3Example Vaccine History: Day 117 HIB and Polio Vaccines Omitted from Resolved History Because Same Vaccines on Day120 Have Matching Parent Provided Data. DTaPs on Days 62, 120, and 174 Omitted Because DTPs on Same Days HaveManufacturer and Lot Numbers.
Resolved Vaccine Decision Rule Indicators Chart, VSD, and Parent Provided ImmunizationRecords Data
History HepB HepB DTP DTP Same Bad LookID Age Res. Res. Polio Polio HIB HIB Day Date up Age Chart Cmptr Parent Chart Cmptr Chart Cmptr
Days Vac. Mfr. R1 R2 R1 R2 Dup. Days Vac. Vac. Vac. Mfr. Mfr. Lot Lot373 1 HepB MIS 1 HepB HepB HepB MIS MIS373 1 62 DTaP373 62 DTP CON 62 DTP DTP CON CON 400 400373 62 HIB PRX 62 HIB HIB HIB PRA PRX M00 M00373 62 HepB SKB 62 HepB HepB HepB SKE SKB ENG 173373 62 Polio LED 62 Polio Polio Polio LED LED 428 428373 1 117 HIB PRX M00373 1 117 Polio LED 432373 1 120 DTaP373 120 DTP LED 120 DTP LED 431373 120 HIB PRA 120 HIB HIB PRA M00373 120 Polio LED 120 Polio Polio LED 432373 1 174 DTaP373 174 DTP CON 174 DTP DTP CON CON M56 5M6373 174 HIB PRX 174 HIB HIB HIB PRA PRX M23 M23373 174 Polio LED 174 Polio Polio Polio LED LED 430 430373 306 HepB SKB 306 HepB HepB HepB SKB SKB ENG ENG
Notes: For brevity, manufacturer and lot numbers are truncated to three characters. Actual values span more characters and may include blank spaces.Resolved vaccine history includes only vaccines received in the age range of 1 to 365 days.

Abt Associates Inc. Chapter 7 57
Exhibit 7.2.3.4Example Vaccine History: HIB and Polio Receipts from Day 130 Omitted, Same Vaccines Received on Day 131 Retained.Choice of Which to Omit and Which to Retain was Random.
Resolved Vaccine Decision Rule Indicators Chart, VSD, and Parent Provided ImmunizationRecords Data
History HepB HepB DTP DTP Same Bad LookID Age Res. Res. Polio Polio HIB HIB Day Date up Age Chart Cmptr Parent Chart Cmptr Chart Cmptr
Days Vac. Mfr. R1 R2 R1 R2 Dup. Days Vac. Vac. Vac. Mfr. Mfr. Lot Lot300 11 HepB SKB 11 HepB SKB 139300 60 HIB PRX 60 HIB HIB PRA PRX M17 M17300 60 HepB SKB 60 HepB HepB SKB SKB ENG ENG300 60 Polio PMC 60 Polio Polio PAS PMC J06 JO6300 1 130 HIB PRA M28300 1 130 Polio PAS J11300 131 HIB PRX 131 HIB PRX M28300 131 Polio PMC 131 Polio PMC J11300 183 HIB PRX 183 HIB HIB PRA PRX M28 M28300 183 Polio PMC 183 Polio Polio CON PMC J11 J11
Notes: For brevity, manufacturer and lot numbers are truncated to three characters. Actual values span more characters and include may blank spaces.Resolved vaccine history includes only vaccines received in the age range of 1 to 365 days.

Abt Associates Inc. Chapter 7 58
7.2.4. Mercury Amount Assigned to Each Childhood Vaccineor Immune Globulin Receipt
Each vaccine or immune globulin listed in each child’s resolved vaccine history wasassigned a mercury amount. Our reference sources for determining the amount ofmercury contained in each receipt included the 1995 and 2000 Physician’s DeskReferences (PDRs), Pediatrics (1999), Plotkin & Orenstein (1999), Plotkin & Mortimer(1994), the Food and Drug Administration (FDA) website (accessed on 2/28/2003), andpersonal communication with vaccine experts at the FDA. The mercury amountscontained in experimental vaccines were provided by the participating HMOs, using datafrom their own records.
Exhibit 7.2.4.1 shows all of the vaccine types listed in the children’s resolved vaccinationhistories, their frequency of occurrence, and the mercury amount assigned to each. Forthe time frame in which these vaccines were administered (all were received between01/03/1993 and 01/08/1998), most of the vaccines had a single, constant mercury amountthat did not vary by manufacturer. For example, all hepatitis-b vaccines available duringthat time contained 12.5 micrograms of ethylmercury per dose. Exceptions were DTaP,TD, pneumococcal, HIB vaccines, and experimental vaccines. Smithkline Beechamlicensed a thimerosal-free DTaP vaccine under the name Infanrix on 1/29/1997. Prior tothat all available DTaP vaccines contained 25 micrograms of ethylmercury per dose. Thedatabase of resolved vaccine histories include two receipts of Smithkline BeechamDTaPs after 1/29/1997, but both were so soon after the license date that we made theassumption that these two instances were not receipts thimerosal-free vaccine. Wetherefore assumed these two doses contained 25 micrograms of ethylmercury each. Thereceipt dates were 2/19/97, and 3/21/97.
Almost all of the tetanus/diphtheria (TD) in use during that time frame contained 25micrograms of ethylmercury per dose. An exception was a TD vaccine manufactured byMassachusetts Biologic Laboratories, which contained only 8.3 micrograms per dose.However, the database contained no TD receipts where the manufacturer wasMassachusetts Biologic Laboratories.
Lederle made two pneumococcal vaccines in that time frame, one of which contained 25micrograms of ethylmercury (product name = Pnu-Imune 23), while the other containedzero micrograms of mercury (product name = Prevnar). The resolved vaccine histories doinclude pneumococcal receipts where the manufacturer was Lederle. We know, however,that at the one HMO where these pneumococcal receipts occurred, that the only productin use at the time was the Prevnar product. Therefore, all pneumococcal receipts fromthat HMO were assigned a mercury amount equal to zero micrograms. Children fromother HMOs with pneumococcal receipts in their resolved vaccine histories were knownor assumed9 to have received the Merck product, which contained zero micrograms ofethylmercury.
9 Of the 92 pneumococcal receipts in the resolved vaccine histories, only 1 receipt did not have anyinformation on manufacturer. We assumed this receipt contained zero micrograms of ethylmercury.

Abt Associates Inc. Chapter 7 59
HIB vaccines in use at that time contained zero, 12.5, or 25 micrograms of ethylmercury,depending on the type and manufacturer. The HIB PRP-T vaccines made by Connaught,Aventis Pasteur, Pasteur Merieux Connaught, and Smithkline Beecham with productnames ActHIB and OmniHIB contained zero micrograms of ethylmercury per dose. TheHIB PRP-OMP manufactured by Merck & Company with product name PedvaxHIBcontained 12.5 micrograms of ethylmercury per dose. And HIB HbOC vaccine made byLederle / Praxis with product name HibTITER contained 25 micrograms of ethylmercuryper dose.
Exhibit 7.2.4.1Vaccine Types in Resolved Vaccine Histories and Amount of Ethylmercury in Each Receipt
Vaccine TypeMercuryAmount
(Micrograms)Frequency Comment
DT TD 25 23 Diphtheria and tetanusDTP 25 1477 Diphtheria, tetanus, pertussisDTP-HIB 25 1328 Combined DTP-HIBDTaP 25 135 Diphtheria, tetanus andacellular pertussisDTaP-HIB 25 4 Combined DTaP-HIBDTaPHepB 12.5 6 Experimental combined DTaP-HepBFlu 12.5 4 InfluenzaHBIG 25 7 Hepatitis B immune globulin
HIB 0 47H. influenzae type bMercAmt=0 if Connaught/Merieux/Pasteur PRP-TActHIB, or SKB/GSK PRP-T OmniHIB
HIB 12.5 472 H. influenzae type bMercAmt=12.5 if MSD PedVax-HIB
HIB 25 983 H. influenzae type bMercAmt=25 if Lederle/Praxis/WAL HbOC Hibtiter.
HepA 0 5 Hepatitis AHepB 12.5 2828 Hepatitis BMMR 0 17 Measles, Mumps, RubellaPneumo 0 92 PneumococcalPolio 0 2740 PolioTT 25 3 Tetanus toxoidVaricel 0 3 VaricellaX01DTaP 0 9 X01 Experimental DTaPX02(DTaP 25 9 X02 Experimental (Acelimune)X03 25 3 X03 Experimental (Tetracel)X03(D-H) 25 3 X03 Experimental (Tetracel)X10 0 6 X10 Experimental Meningicoccal
10204

Abt Associates Inc. Chapter 7 60
7.3. Measures of Prenatal Exposure to Ethylmercury
7.3.1. Introduction to the Prenatal Ethylmercury ExposuresFile
Two sources of prenatal vaccination data (maternal medical chart abstraction, andmaternal interview) were combined to create a Prenatal Ethylmercury Exposures File.This file contains data on maternal exposure to ethylmercury from thimerosal-containingvaccines and immune globulins received by the mothers of study participants during theirpregnancies with the focus children. The file contains one record per mother (n=1,047).Each record lists the types of vaccines and immune globulins received, the amounts ofethylmercury corresponding to each receipt, and the timing of each receipt. The timing ofreceipt is expressed as the number of months from the receipt to the birth of the focuschild.
Examples of several prenatal records are shown in Exhibit 7.3.1.1. The first record (ID =“x1”) corresponds to a mother who received a Gamulin injection (an immune globulin)3.0 months prior to the birth of the focus child. The mercury amount corresponding to aGamulin receipt was assigned as 50 micrograms of ethylmercury. The example in thesecond row (ID= “x2”) is a mother who received a rhogam injection (an immuneglobulin) 2.8 months prior to the birth of the focus child. Rhogam is assumed to havecontained 12.75 micrograms of ethylmercury per receipt10. ID “x3” received two immuneglobulin injections during her pregnancy, each containing 50 micrograms ofethylmercury, resulting in a total prenatal exposure amount equal to 100 micrograms.
ID “x4” received an immune globulin 2.6 months before the focus child was born, andreceived another on the day the child was born. Receipts on the day of the birth of thefocus child were assumed to have occurred after delivery, and are therefore not countedin the total prenatal exposure amount. ID “x5” received adult dose influenza and tetatnusvaccines during her pregnancy, resulting a total exposure amount equal to 50micrograms. ID “x6” received a hepatitis-B vaccination resulting in 12.5 micrograms ofethylmercury exposure. And, ID “x7” did not receive any vaccinations or immuneglobulins during her pregnancy with the focus child.
10 Additional detail is provided in Section 7.3.3

Abt Associates Inc. Chapter 7 61
Exhibit 7.3.1.1Example Records of Prenatal Ethylmercury Exposures from Thimerosal-containing Vaccines and Immune Globulins
Prenat- Immune Globulin 1 Immune Globulin 2 Flu HepB Tetanus DTID thimer Type Amt Mos Dose Type Amt Mos Dose Amt Mos Amt Mos Amt Mos Amt Mosx1 50 GAMULIN 50 3.0 1CCx2 12.75 RHOGAM 12.75 2.8 SINGLE DOSx3 100 GAMULIN 50 5.3 UNK (FULL) GAMULIN 50 2.5 UNK (FULL)x4 50 GAMULIN 50 2.6 J23003 GAMULIN 0 0 J24110x5 50 25 7.0 25 0.8x6 12.5 12.5 6.6x7 0
PrenatThimer = total ethylmercury exposure from vaccines and immune globulins during pregnancy with focus child.Columns labled “Amt” show the ethylmercury amount corresponding to a vaccine or immune globulin receipt.Columns labeled “Mos” show the number of months between receipt and birth of the focus child.“Flu” = influenza vaccine, “HepB” = hepatitis-B vaccine, “Tetanus” = tetanus, and ”DT” = diphtheria-tetanus. Recordsindicated that these were the only types of thimerosal-containing vaccines received by the mothers of study participantsduring their pregnancies with the focus children.
7.3.2. Overview of Steps from Raw Data to Creation ofAnalysis Variables
Data on prenatal exposure to ethylmercury from thimerosal containing vaccines andimmune globulins were obtained from two sources: From abstractions of maternalmedical charts covering the period that the mother was pregnant with the focus child, andfrom questionnaire items from the parent interview. An overview of the data processingsteps from the receipt of raw data files to the creation of the exposure variables used inanalyses is as follows:
1. The master list of study IDs was merged to the maternal medical chart and parentinterview files. Any problems with ID discrepancies were resolved at this stage.The master list of IDs, the maternal medical chart, and the parent interview datafiles each contained one record per child ID. The master list of study IDscontained each child’s ID and date of birth. The maternal chart file contained afield for Rh-blood group status of the mother. It also contained fields for the date,dosage, manufacturer, and product names of immune globulins received, and fordates and types of vaccines received by the mother. The parent interview filecontained data from questionnaire items that explained that women with Rh-negative blood types often receive rhogam or other immune globulins duringpregnancy to prevent problems with blood incompatibility, and asked the motherif she had received any rhogam or other immune globulins during her pregnancywith the focus child.
2. For chart records, all entries indicating the type of immune globulin received wererecoded to correct spelling errors and variations in abbreviations. For example, anincorrectly spelled entry indicating receipt of “rhogan” would have been recodedto take the value “RHOGAM”.

Abt Associates Inc. Chapter 7 62
3. Next, we calculated the number of months between vaccine or immune globulinreceipt and the date of delivery. Only those receipts that occurred within theperiod spanning ten months (256 days) prior to the delivery date were countedtowards the total amount of prenatal exposure to ethylmercury from thimerosal.Immune globulins received on the day of delivery were assumed to have occurredafter delivery, and were therefore not counted in the calculation of prenatalexposure.
4. In the next step, discrepancies between the maternal medical chart-abstracted dataand the parent interview data on receipt of immune globulins during pregnancywere resolved. During the weekly conference calls, the entire study teamreviewed all available data for discrepant cases. If the mother was rh-negative,and either of the two data sources indicated receipt of an immune globulin duringpregnancy, then it was assumed that a receipt had occurred. Additional details onthis step are provided in Section 7.3.4 of this document.
5. A mercury exposure amount was assigned to each vaccine or immune globulinreceipt. See Section 7.3.5 for details.
6. Finally, a measure of total ethylmercury exposure from vaccine and immuneglobulins received during pregnancy was created. For example, a child whosemother received two vaccines during her pregnancy that each contained 25micrograms of ethylmercury, e.g., a flu shot and a tetanus shot, would have areceived a value of 50 micrograms on this measure. This measure was used in theanalytical models and was defined as follows: PrenatThimer = “Prenatal exposure to ethylmercury from thimerosal” = The
sum total of mercury amounts from all thimerosal containing vaccines andimmune globulins received by the mother during her pregnancy with the focuschild.
7.3.3. Cleaning of Prenatal Ethylmercury Exposures DataThe chart-abstracted data on vaccine receipts during pregnancy were straightforward.The records listed the types of and dates of vaccine receipts. Using the date of vaccinereceipt and the child’s date of birth, we calculated the number of months from receipt tobirth and assigned an exposure amount to the vaccine receipt only if the receipt occurredbefore the child was born, and less than 10 months prior to the birth of the child.Although the rule we applied would have counted receipts 10 months prior to birth (toaccount for the possibility of late births) there were no receipts listed in the data set thatwere near 10 months. In these data we found one occurrence of a diphtheria-tetanus (DT)receipt that was 9.2 months prior to the birth of the child. All other vaccine receipts thatwere counted toward the total exposure amounts were less than 9 months prior to birth.
The chart-abstracted data included records of receipts of the following thimerosal-containing vaccines: Influenza, tetanaus, diphtheria-tetanus, and hepatitis-B. There werealso records of rubella vaccine receipts, but the rubella vaccines did not containthimerosal and were therefore of no consequence to the analyses.
The data on immune globulin receipts were less straightforward for several reasons. Thefirst was that the information on the product name and manufacturer sometimes

Abt Associates Inc. Chapter 7 63
conflicted with one another, or was sometimes missing entirely. This was a problembecause the amount of mercury included in a dose varied according to the productreceived. A second potential conflict was between the mother’s recorded rh-status andimmune globulin receipt. The expectation is that rh-positive mothers would not receiveimmune globulins and rh-negative mothers would usually receive immune globulins,although this was not always the case. Finally, there was the potential for discrepancybetween the mother’s recollection of immune globulin receipt, as reported in the parentinterview, and the data recorded in the medical charts. The resolutions for each of thesetypes of discrepancies are described below.
An example of a discrepancy between a product name (type) and the productmanufacturer is a record that indicates that the product received was Rhogam and themanufacturer was Armour. The product made by Armour was called Gamulin, andthimerosal content in Gamulin was different than that of Rhogam. This discrepancyprobably occurred because, even though Rhogam is a specific product, the name“rhogam” is often used as a generic term similar to the way “kleenex” is often used ageneric term to refer to facial tissues, even though Kleenex is a specific product.Therefore, whenever a manufacturer or lot number was listed in the record that pointedtoward the receipt of a specific product, that information took precedence over theinformation listed in the product type field. The Prenatal Ethylmercury Exposures Fileincludes the original text for product type and manufacturer, as well as the resolvedproduct type. The resolved product type represents our best estimate of what was actuallyreceived, and was used for the purpose of assigning a mercury exposure amount.
Rhogam was the most commonly listed type of immune globulin at all four HMOs. Incases where the evidence pointed to the receipt of an immune globulin, but where therewas no information on product type, manufacturer, or lot number, we assumed the receiptwas Rhogam. Section 7.3.4 describes variables that were created and analyses that wereconducted to evaluate the sensitivity of the model results to this assumption.
For each record we had to make a judgment, based on the available evidence, as towhether the mother received an immune globulin during her pregnancy with the focuschild, and if so, what type of immune globulin was received. A set of codes wasdeveloped to document the decisions that were made. The codes are shown in the columnlabeled “Decision code” of Exhibit 7.3.3.1 and are defined as follows:
Decision code 1 = prenatal immune globulin received: The chart indicated that themother was rh-negative, the mother reported having received an immune globulinduring her pregnancy with the focus child, and the chart abstraction listed animmune globulin receipt within the period spanning ten months prior to the birthof the child.
Decision code 2 = prenatal immune globulin received: Although the mother didnot know whether she had received an immune globulin during her pregnancywith the focus child, the chart clearly indicated that the mother was rh-negative,

Abt Associates Inc. Chapter 7 64
and the chart abstraction listed an immune globulin receipt within the periodspanning ten months prior to the birth of the child.
Decision code 3 = prenatal immune globulin received: For these records there wasa discrepancy between the mother report and the chart-abstracted data. Althoughthe mother reported that she did not receive an immune globulin during herpregnancy with the focus child, the chart clearly indicated that the mother was rh-negative, and the chart abstraction listed an immune globulin receipt within theperiod spanning ten months prior to the birth of the child. We assumed themothers’ memories were in error and the chart data were correct.
Decision code 4 = prenatal immune globulin received: The mother and the chartagreed that there had been an immune globulin receipt, but the type of immuneglobulin was not recorded in the records. Receipt of Rhogam was assumed.
Decision code 5 = prenatal immune globulin received: The mother indicated thatshe had received a prenatal immune globulin. According to the chart abstracteddata, these mothers were either rh-negative or their rh-status was not recorded.The types and dates of receipts were not recorded. For these records we assumedthe mother report was correct and assumed Rhogam receipts were prior to thebirth of the child.
Decision code 6 = prenatal immune globulin received: For this record, weassumed that the chart data indicating that the mother was rh-positive was anerror, and assumed the remaining data from both the mother report and the chartwere correct. The mother and the chart agreed that there had been an immuneglobulin receipt, and the chart indicated the type and date of receipt.
Decision code 7 = no prenatal immune globulin received: For each of theserecords, the mother indicated that she had received a prenatal immune globulin,but the chart indicated that she was rh-positive and that no receipts had occurred.We assumed the mother’s recollection was in error and that the chart wasaccurate.
Decision code 8 = no prenatal immune globulin received: The charts indicatedthat the mother was rh-positive and contained no indication of immune globulinreceipt. The mothers in this group either said ‘no’ or they did not know whetherthey had received and immune globulin during their pregnancies with the focuschildren.
Decision code 9 = no prenatal immune globulin received: For each of theserecords, both the mother and the chart indicated receipts of immune globulins, butthe chart showed that the receipts occurred after the birth of the child. Note thatreceipts that occurred on the day of the child’s birth (indicated as Months Prior toBirth =0 in Exhibit 7.3.3.1) were assumed to have occurred after delivery andwere not counted as prenatal exposures.

Abt Associates Inc. Chapter 7 65
Decision code 10 = no prenatal immune globulin received: Although the chartindicated that the mother was rh-negative, a check-box on the chart abstractionform indicated that no immune globulins had been received. The mother alsoreported that she had not received an immune globulin during her pregnancy withthe focus child.
Decision code 11 = no prenatal immune globulin received: The mothers in thisgroup indicated that they had not received an immune globulin during theirpregnancies with the focus children. The chart data fields were mostly missing orincomplete. The assumption of no prenatal immune globulin receipts was basedprimarily on the maternal report.
Decision code 12 = no prenatal immune globulin received: Notes written on thechart indicated that no immune globulins were needed. In one case the mother’shusband was rh-negative, in the other case there was no note about the father rh-status but the child was rh-negative so there was no issue of incompatibility.
Exhibit 7.3.3.1Data Cleaning Decision Codes for Prenatal Immune Globulin Receipts
Chart Mother Original Chart Cleaned Assigned Months Chart
Decision Rh Reported IG Text for Text for Mercury Prior to Check Box
Code Status Receipt IG Receipt IG Receipt Amount Birth IG Received Freq.
1 RhNeg Yes GAMULIN GAMULIN 50 2.83 Yes 1
1 RhNeg Yes GAMULIN GAMULIN 50 3.03 Yes 1
1 RhNeg Yes HYP RHO-D HYPRHO-D 50 1.61 Yes 1
1 RhNeg Yes HYPRHO-D HYPRHO-D 50 2.47 Yes 1
1 RhNeg Yes J24211 GAMULIN 50 2.66 Yes 1
1 RhNeg Yes MISSING RHOGAM 12.75 2.14 Yes 1
1 RhNeg Yes MISSING RHOGAM 12.75 2.57 Yes 1
1 RhNeg Yes MISSING RHOGAM 12.75 2.93 Yes 1
1 RhNeg Yes MISSING RHOGAM 12.75 2.96 Yes 1
1 RhNeg Yes MISSING RHOGAM 12.75 3.09 Yes 1
1 RhNeg Yes MISSING RHOGAM 12.75 5.56 Yes 1
1 RhNeg Yes RHL174 RHOGAM 12.75 2.89 Yes 1
1 RhNeg Yes RHL228 RHOGAM 12.75 5.72 Yes 1
1 RhNeg Yes RHO GAM RHOGAM 12.75 2.3 Yes 1
1 RhNeg Yes RHOD HYPRHO-D 50 2.57 Yes 1
1 RhNeg Yes RHOGAM GAMULIN 50 2.11 Yes 1
1 RhNeg Yes RHOGAM GAMULIN 50 2.6 Yes 1
1 RhNeg Yes RHOGAM GAMULIN 50 5.33 Yes 1
1 RhNeg Yes RHOGAM RHOGAM 12.75 1.71 Yes 1
1 RhNeg Yes RHOGAM RHOGAM 12.75 1.74 Yes 1
1 RhNeg Yes RHOGAM RHOGAM 12.75 1.84 Yes 1
1 RhNeg Yes RHOGAM RHOGAM 12.75 1.97 Yes 1
1 RhNeg Yes RHOGAM RHOGAM 12.75 2.04 Yes 1
1 RhNeg Yes RHOGAM RHOGAM 12.75 2.14 Yes 1

Abt Associates Inc. Chapter 7 66
Exhibit 7.3.3.1Data Cleaning Decision Codes for Prenatal Immune Globulin Receipts
Chart Mother Original Chart Cleaned Assigned Months Chart
Decision Rh Reported IG Text for Text for Mercury Prior to Check Box
Code Status Receipt IG Receipt IG Receipt Amount Birth IG Received Freq.
1 RhNeg Yes RHOGAM RHOGAM 12.75 2.17 Yes 2
1 RhNeg Yes RHOGAM RHOGAM 12.75 2.24 Yes 2
1 RhNeg Yes RHOGAM RHOGAM 12.75 2.34 Yes 1
1 RhNeg Yes RHOGAM RHOGAM 12.75 2.4 Yes 1
1 RhNeg Yes RHOGAM RHOGAM 12.75 2.57 Yes 1
1 RhNeg Yes RHOGAM RHOGAM 12.75 2.76 Yes 4
1 RhNeg Yes RHOGAM RHOGAM 12.75 2.8 Yes 3
1 RhNeg Yes RHOGAM RHOGAM 12.75 2.89 Yes 4
1 RhNeg Yes RHOGAM RHOGAM 12.75 3.03 Yes 1
1 RhNeg Yes RHOGAM RHOGAM 12.75 3.06 Yes 1
1 RhNeg Yes RHOGAM RHOGAM 12.75 3.09 Yes 2
1 RhNeg Yes RHOGAM RHOGAM 12.75 3.26 Yes 1
1 RhNeg Yes RHOGAM RHOGAM 12.75 3.29 Yes 1
1 RhNeg Yes RHOGAM RHOGAM 12.75 3.42 Yes 1
1 RhNeg Yes RHOGAM RHOGAM 12.75 3.45 Yes 1
1 RhNeg Yes RHOGAM RHOGAM 12.75 3.55 Yes 2
1 RhNeg Yes RHOGAM RHOGAM 12.75 4.87 Yes 1
1 RhNeg Yes RHOGAM RHOGAM 12.75 5.3 Yes 1
1 RhNeg Yes RHOGAM RHOGAM 12.75 5.69 Yes 1
1 RhNeg Yes RHOGAM RHOGAM 12.75 5.72 Yes 1
1 RhNeg Yes RHOGAM RHOGAM 12.75 6.74 Yes 1
1 RhNeg Yes RHOGAN RHOGAM 12.75 4.47 Yes 1
1 RhNeg Yes Rhogam RHOGAM 12.75 2.5 Yes 1
1 RhNeg Yes Rhogam RHOGAM 12.75 2.83 Yes 1
1 RhNeg Yes Rhogam RHOGAM 12.75 3.03 Yes 1
1 RhNeg Yes UNK RHOGAM 12.75 2.8 Yes 1
2 RhNeg DK MISSING RHOGAM 12.75 2.04 Yes 1
2 RhNeg DK RHOGAM RHOGAM 12.75 1.22 Yes 1
2 RhNeg DK RHOGAM RHOGAM 12.75 2.93 Yes 1
2 RhNeg DK UNK RHOGAM 12.75 2.76 Yes 1
3 RhNeg No MICROHOGAMMICRHOGAM 11.25 5.66 Yes 1
3 RhNeg No MISSING RHOGAM 12.75 3.16 Yes 1
3 RhNeg No MISSING RHOGAM 12.75 5.39 Yes 1
3 RhNeg No MISSING RHOGAM 12.75 6.61 Yes 1
3 RhNeg No RHOGAM GAMULIN 50 5 Yes 1
3 RhNeg No RHOGAM RHOGAM 12.75 2.01 Yes 1
3 RhNeg No RHOGAM RHOGAM 12.75 2.53 Yes 1
3 RhNeg No RHOGAM RHOGAM 12.75 2.73 Yes 1
3 RhNeg No RHOGAM RHOGAM 12.75 3.22 Yes 1
4 RhNeg Yes RHOGAM 12.75 2.34 Yes 1
4 RhNeg Yes RHOGAM 12.75 3.03 Yes 1
4 RhNeg Yes RHOGAM 12.75 5.26 Yes 1

Abt Associates Inc. Chapter 7 67
Exhibit 7.3.3.1Data Cleaning Decision Codes for Prenatal Immune Globulin Receipts
Chart Mother Original Chart Cleaned Assigned Months Chart
Decision Rh Reported IG Text for Text for Mercury Prior to Check Box
Code Status Receipt IG Receipt IG Receipt Amount Birth IG Received Freq.
4 RhNeg Yes RHOGAM 12.75 7.3 Yes 1
4 RhNeg Yes RHOGAM 12.75 7.83 1
5 RhNeg Yes RHOGAM 12.75 3 1
5 Unk Yes RHOGAM 12.75 3 6
6 RhPos Yes RHOGAM GAMULIN 50 2.66 Yes 1
7 RhPos Yes . . No 2
8 RhPos DK . . 1
8 RhPos DK . . No 13
8 RhPos No . . 113
8 RhPos No . . No 748
9 RhNeg Yes . -21.18 Yes 1
9 RhNeg Yes MISSING . -0.03 Yes 1
9 RhNeg Yes RHIMGLOB . 0 Yes 1
9 RhNeg Yes RHL241A . -0.03 Yes 1
9 RhNeg Yes RHOGAM . 0 Yes 1
9 RhNeg Yes Rhogam . -0.03 No 1
9 RhNeg Yes UNKNOWN . 0 Yes 1
10 RhNeg No . . No 7
11 Unk No . . 64
11 Unk No . . No 2
12 RhNeg Yes . . No 2Total: 1047

Abt Associates Inc. Chapter 7 68
7.3.4. Mercury Amount Assigned to Each Prenatal Vaccine orImmune Globulin Receipt
Similar to the process described for childhood vaccine receipts, each vaccine or immuneglobulin received by the mother during the prenatal period was assigned a mercuryamount. Our reference sources for determining the amount of mercury contained in eachvaccine receipt included the 1995 and 2000 Physician’s Desk References (PDRs),Pediatrics (1999), Plotkin & Orenstein (1999), Plotkin & Mortimer (1994), the Food andDrug Administration (FDA) website (accessed on 2/28/2003).
Final determination of the amounts of ethylmercury in prenatal immune globulins weremade in consultation with experts at the FDA and with the manufacturers of immuneglobulin products. The amounts assigned were as follows:
Rhogam: Between 1993 and 1997 the fill volumes ranged from 0.5 to 1.2milliliters (ml), with an assumed average fill volume of 0.85 ml. Thimerosal waspresent in Rhogam at 0.003% w/v, which is equivalent to 30 micrograms ( g )per ml. Thimerosal was 50 percent ethylmercury by weight. Multiplying the three
quantities gives gmlml
g
75.1250.085.030 of ethylmercury per receipt.
MicRhogam: Between 1993 and 1997 the fill volumes ranged from 0.3 to 1.2milliliters (ml), with an assumed average fill volume of 0.75 ml. Thimerosal waspresent in MicRhogam at 0.003% w/v, which is equivalent to 30 g per ml.Thimerosal was 50 percent ethylmercury by weight. Multiplying the three
quantities gives gmlml
g
25.1150.075.030 of ethylmercury per receipt.
Gamulin and Hyprho-d: The average fill volumes for Gamulin and Hyprho-d usedbetween 1993 and 1997 are assumed to be 1.0 ml. Thimerosal was present in eachtype at 0.01% w/v, which is equivalent to 100 micrograms g per ml. Thimerosalwas 50 percent ethylmercury by weight. Multiplying the three quantities gives
gmlml
g
5050.00.1100 of ethylmercury per receipt.
Exhibit 7.3.4.1 lists all of the thimerosal-containing vaccines and immune globulinsreceived by the mothers during their pregnancies with the focus children. The exhibit alsoshows the amount of ethylmercury assigned to each receipt.
As described previously, the word “rhogam” is often used as a generic term even thoughit is a specific product. Since lot numbers and manufacturers were infrequently listed inthe medical charts, there are many instances where the product type was listed as“rhogam”, but where we are uncertain whether the term was being used generically or

Abt Associates Inc. Chapter 7 69
was referring to the specific product “Rhogam”. If the term was being used generically,then we may have assigned the wrong mercury amount to the receipt. For example, if aGamulin was administered, but the administering physician wrote in the chart that“rhogam” was given, then we would have mistakenly assigned the receipt a mercuryamount equal to 12.75, instead of 50. The data set includes two variables, correspondingto IG receipts 1 and 2, that each reflect the level of uncertainty regarding the type ofimmune globulin received. Recall that up to two immune globulins were listed in thechart abstracted data.
For receipt number 1, we defined a variable named PN_ProductInfo1 that could take thevalues “1” or “0”. A value of “1” reflects a high level of confidence that we have correctinformation on the type of product that was administered. The variable took the value “1”if the lot number or the manufacturer, or a product other than “rhogam” was recorded inthe chart. These pieces of information provided specifics about the product that wasreceived. Immune globulin receipts where PN_ProductInfo1 takes the value “0” arethose where we lack the specific information on the product received. In several cases weassumed that rhogam was received because we had no information on product type, andin the remaining cases the chart listed the type as “rhogam”, but we are unsure of whetherthe term “rhogam” was being used generically or was a reference to the specific product.For receipt number 2, the same type of variable was created and namedPN_ProductInfo2.
We used the variables PN_ProductInfo1 and PN_ProductInfo2 in the following way. Ourprimary set of analyses utilized the prenatal mercury amounts listed in Exhibit 7.3.4.1.This is equivalent to an assumption that all receipts with low levels of certainty about theproduct types were Rhogam receipts, and hence contained 12.75 micrograms ofethylmercury. To evaluate the sensitivity of the model results to the potentialmisspecification of the type of immune globulin received (and hence the total prenatalmercury exposure amount) we fit an alternate set of models where we made an alternativeassumption that all receipts with low levels of certainty about the product types, wereGamulin or Hyprho-d receipts, with 50 micrograms of ethylmercury. In these alternativemodels, if PN_ProductInfo1 or PN_ProductInfo2 was equal to zero, than mercuryamount for the corresponding immune globulin receipt was set to 50 micrograms.
Exhibit 7.3.4.2 shows a three-way cross-tabulation of the variable PN_ProductInfo1 withthe variable containing the primary mercury amount assignments for immune globulinreceipt number one (PN_IG1_Amt), and with the variable containing the alternatemercury amount assignments for immune globulin receipt number one(PN_IG1_Amt_Alt). The exhibit shows that there were 75 immune globulin receiptswhere the value of PN_ProductInfo1 was 0 and the primary mercury amount wasassigned as 12.75 micrograms. The alternate value for these 75 receipts was set to 50micrograms. The same type of cross-tabulation for variables corresponding to immuneglobulin receipt number two are shown in Exhibit 7.3.4.3. Finally, Exhibit 7.3.4.4 showsa cross-tabulation of the primary variable measuring total prenatal mercury exposurefrom thimerosal (PreNatThimer), with the variable measuring total exposure calculatedusing the alternate amounts (PreNatThimer_Alt).

Abt Associates Inc. Chapter 7 70
Exhibit 7.3.4.1Thimerosal-containing Prenatal Vaccines and Immune Globulins and Amount ofEthylmercury in Each Receipt
Vaccine orImmune
Globulin Type
MercuryAmount
(Micrograms) Freq. CommentRhogam 12.75 88 Immune globulinMicrhogam 11.25 1 Immune globulinGamulin 50 11 Immune globulinHyprho-d 50 3 Immune globulin
Influenza 25 9 Influenza (Adult Dose)Tetanus 25 3 TetanusDT 25 8 Diphtheria-tetanusHepB 12.5 1 Hepatitis – B
Exhibit 7.3.4.2Cross-tabulation of PN_ProductInfo1, PN_IG1_Amt, and PN_IG1_Amt_Alt Variables
CumulativePN_ProductInfo1 PN_IG1_Amt PN_IG1_Amt_Alt Frequency Frequency
. . . 959 9590 12.75 50 74 10331 11.25 11.25 1 10341 12.75 12.75 2 10361 50 50 11 1047
Exhibit 7.3.4.3Cross-tabulation of PN_ProductInfo2, PN_IG2_Amt, and PN_IG_Amt_Alt Variables
CumulativePN_ProductInfo2 PN_IG2_Amt PN_IG2_Amt_Alt Frequency Frequency
. . . 1032 10320 12.75 50 11 10421 12.75 12.75 2 10441 50 50 3 1047

Abt Associates Inc. Chapter 7 71
Exhibit 7.3.4.4Cross-tabulation of PreNatThimer and PreNatThimer_Alt Variables
CumulativePreNatThimer PreNatThimer_Alt Frequency Frequency
0 0 936 93611.25 11.25 1 93712.5 12.5 1 93812.75 12.75 4 94212.75 50 65 1007
25 25 18 102525.5 100 9 103450 50 10 1044
62.75 100 1 1045100 100 2 1047
7.4. CovariatesExhibit 7.4.1 summarizes the data sources and construction of all variable that were usedas covariates in the analytic models.

Abt Associates Inc. Chapter 7 72
Exhibit 7.4.1 Data Sources and Construction of Variables Used as Covariates in Analytical ModelsData Sources
Variable Description ParentInterview
MedicalAbstract
ComputerAutomated Additional Details
Variables Included in Every ModelChildAge Child Age (Yrs) at assessment X Xsexmale Sex of child 0=female, 1=male X XBirth weight 1 = if birth weight 2500-2999 grams
2 = Birth weight 3000-3999 grams3 = Birth weight 4000+ grams
X X
Maternal IQ 1= Score in lower third of distribution2= Score in middle third of distribution3= Score in upper third of distribution
The Kaufman Brief Intelligence test
HOME_TotalIndex “HOME” Total Index X
Home Observation for Measurement of theEnvironment was administered as part of theparent interview. It is a measure of a child’s homeenvironment based on maternal self-report andinterviewer observations. The total score is a sumof two subscores, a cognitive stimulation and anemotional support score. The total score has awide variety of inputs that measure the quality ofthe home environment including family interactionpatterns, physical attributes of the home, andintellectual attributes.
PctPoverty1 (Percent of poverty line)/100
X
Percent of poverty line calculated from householdsize, household income, and the 2004 povertyguidelines for the48 contiguous states and theDistrict of Columbia shown in Department ofHealth and Human Services Annual Update ofthe HHS Poverty Guidelines; Federal Register,Vol. 69, No. 30, February 13, 2004 / Noticesaccording to the following algorithm:if HH size=2 then Pov=HH Income/12490;if HH size=3 then Pov=HH Income/15670;if HH size=4 then Pov=HH Income/18850;

Abt Associates Inc. Chapter 7 73
Exhibit 7.4.1 Data Sources and Construction of Variables Used as Covariates in Analytical ModelsData Sources
Variable Description ParentInterview
MedicalAbstract
ComputerAutomated Additional Details
if HH size=5 then Pov=HH Income/22030;if HH size=6 then Pov=HH Income/25210;if HH size=7 then Pov=HH Income/28390;if HH size=8 then Pov=HH Income/31570;if HH size=9 then Pov=HHIncome/(31570+3180);if HH size=10 then Pov=HHIncome/(31570+6360);
Maternal Education 0= No HS degree1=High school diploma or GED2=attended some college, but nodegree3=Associate’s degree or higher
X
SingleParent Child lives in a single parenthousehold(0/1) X
Site HMO-AHMO-BHMO-CHMO-D
Variable defines four categories of HMO siteswhere assessments took place.
Child and Family CharacteristicsComputerExperience
Child’s experience with usingcomputers X 0=No experience, 1=some experience, 2=much
experience.Maternal Age 1= Maternal Age at Ch Birth: <=16
years2=Maternal Age at Ch Birth: 17-39years3=Maternal Age at Ch Birth: >=40years
X X X
OlderSibs Child has an older sibling (0/1) X =1 if child has older sibling living in homeYoungerSibs Child has a younger sibling (0/1) X =1 if child has younger sibling living in homeDayCareCentr # of center-based day care settings
prior to KG X Number of center-based daycare settingsattended by child prior to kindergarten.

Abt Associates Inc. Chapter 7 74
Exhibit 7.4.1 Data Sources and Construction of Variables Used as Covariates in Analytical ModelsData Sources
Variable Description ParentInterview
MedicalAbstract
ComputerAutomated Additional Details
DayCareHome # of home-based day care settingsprior to KG X Number of home-based daycare settings
attended by child prior to kindergarten.EngOnly English only at home X Binary indicator of whether English was the only
language spoken in the child’s homeBreast Feeding(Duration)
0 = Breast Fed: <1mo1 =Breast Fed: 1-6mos2 = Breast Fed: 6+ mos
X
Child Birth ConditionscMedicalHist_1 =1 if IUGR or birth headCM +/- 2SD
from Mean
X
A binary indicator of whether intrauterine growthretardation was diagnosed at birth or headcircumference was +/- 2 standard deviations fromnational mean at birth. National means andstandard deviations for head circumferencemeasurements of U.S. boys and girls at birthobtained from Kuczmarski RJ, Ogden CL, GuoSS, et al. 2000 CDC growth charts for the UnitedStates: Methods and development. NationalCenter for Health Statistics. Vital Health Stat11(246). 2002
C5APGARImpVal1 5-minute apgar
X
Child’s score on the 5 minute APGAR, which is atest given to newborns five minutes after birth tomeasure activity, pulse, grimace, appearance,and respiration.
Prenatal Exposures (non-vaccine related)PreNatNicotine_1 Used tobacco during pregnancy X X = 1 if mother used any tobacco products during
pregnancy.PreNatAlcohol_1 Alcohol use during pregnancy:
X X
0= none1= occasional (1-4 drinks per month)2= light (20-24 drinks/month or 5-6 per week)3=moderat e(10-15 drinks per week)4=heavy (more than 15 drinks per week)
Tuna Consumption Maternal tuna consumption during X 0= no consumption of tuna during pregnancy.

Abt Associates Inc. Chapter 7 75
Exhibit 7.4.1 Data Sources and Construction of Variables Used as Covariates in Analytical ModelsData Sources
Variable Description ParentInterview
MedicalAbstract
ComputerAutomated Additional Details
pregnancy 1 = moderate consumption (less than one servingper week)2 = high consumption (more than one serving perweek)
PreNatFish_1 High consumption of fish duringpregnancy. X
1= if mother reported eating tuna, and ocean fish,and home-caught fish during pregnancy.0 = else.
PreNatOrgMerc_1 Use of mercury-containing contactlens solutions or nasal sprays duringpregnancy.
X
PreNatOrgMerc calculated as sum of PreNatContactsand PreNatNasal, defined below:
PreNatContactsUse of thimerosal-containing contact lens solutionduring pregancy2=high (regular use of this agent)1=moderate (any non- regular use of this agent)0=no use of this agent
PreNatNasalUse of thimerosal-containing nasal sprays duringpregancy2=high (regular use of this agent)1=moderate (any non- regular use of this agent )0=no use of this agent
PreNatHomePro_1 Prenatal exposure to mercury fromhome products X
=1 if any exposure to mercury during pregnancyfrom thermometers, florescent light bulbs, shoes,or switches; =0 else.
Tooth Amalgams Mercury-containing dental amalgams
X
Amalgam fillings during pregnancy:0 = mother had no amalgam fillings1 = had amalgam filling, but no dental work anddid not chew gum during pregnancy2= had amalgam fillings and had dental work orchewed gum during pregnancy.
PreNatlead_1 Prenatal exposure to lead fromoccupational or residential sources X =1 if during pregnancy
mother worked in:

Abt Associates Inc. Chapter 7 76
Exhibit 7.4.1 Data Sources and Construction of Variables Used as Covariates in Analytical ModelsData Sources
Variable Description ParentInterview
MedicalAbstract
ComputerAutomated Additional Details
Worked in smelting, soldering, construction, ordemolitionor if during pregnancy mother lived in :a pre-1950 home, ora pre-1978 home that underwent painting orrenovation during her pregnancy.
PreNatIllDrug 1=Cocaine or Narcotic
X X
1= if mother reported any use of cocaine, crack,heroin, methamphetamines, or speed duringpregnancy, or maternal medical chart indicatedsuspected use or suspected use of cocaine ornarcotics during pregnancy.0 = else.
Child Medical ConditionsIronDef_1 Anemia or iron deficiency X =1 if any records of anemia and iron deficiency in
child’s chart. =0 else.ADHDstimulant Use of ADHD stimulant in 12 hours
prior to assessment
X X X
=1 if child used any of the following stimulantmedications in the 12 hours prior to the clinicalassessment: Focalin; Ritalin; Methylin; RitalinSR; Methylin ER; Metadate ER; Ritalin LA;Metadate CD; Concerta; Desoxyn;Dextroamphetamine tablets (generic); DextroStattablets; Dexedrine tablets; Adderall tablets;Dexedrine Spansules; Adderall XR capsules.
ChdPICA_1 Child Pica
X X
= 1 if child has pica, which is characterized bypersistent and compulsive cravings (lasting onemonth or longer) to eat nonfood items.=0 else.
Maternal DiagnosesMatLangDel Maternal Language Delay X X =1 if mother ever diagnosed as having language
delay; =0 else.MatSpeechDel Maternal speech delay X X =1 if mother ever diagnosed as having speech
delay; =0 else.

Abt Associates Inc. Chapter 7 77
Exhibit 7.4.1 Data Sources and Construction of Variables Used as Covariates in Analytical ModelsData Sources
Variable Description ParentInterview
MedicalAbstract
ComputerAutomated Additional Details
MatSTUTTER Maternal stuttering X X =1 if mother ever diagnosed as having stuttering;=0 else.
MatADHD Maternal ADHD X X =1 if mother ever diagnosed as having ADHD; =0else.
MatTIC Maternal tics(No mothers in this sample had thisdiagnosis. This variable not used inmodels.)
X X
=1 if mother ever diagnosed as tics; =0 else.
Quadratic and Cubic FormsChildAge2 ChildAge2 (squared) X XChildAge3 ChildAge3 (cubed) X XPctPoverty1_2 (PctPoverty1/100) 2 (squared) XPctPoverty1_3 (PctPoverty1/100) 3 (cubed) XHOME_TotalIndex2 HOME_TotalIndex2 (squared) XHOME_TotalIndex3 HOME_TotalIndex3 (cubed) XVariables Used Only in Models for Finger Tapping Outcomesa
Spline9 =1 if ChildAge > 9.0; =0 Else X XChildAge_Spline9 Childage * Spline9 X XChildAge2_Spline9 Childage2 * Spline9 X Xa Finger tapping tests for children aged 9 and above were slightly different than tests for younger children. Spline term allows for separate intercepts for children above and below9 years. Spline*ChildAge and Spline*ChildAge2 terms allow for different age slopes for children above and below 9 years.

Abt Associates Inc. Chapter 7 78
7.5. Imputation of Missing ValuesThe analysis data set contained no missing values on measures of ethylmercury exposurefrom thimerosal-containing vaccines and immune globulins. Having non-missing valueson exposure measures was a requirement for inclusion in the study. The postnatalexposure measures were calculated as the amount of mercury contained in a receivedvaccine or immune globulin, divided by the child’s weight at time of vaccine receipt, andsummed over the appropriate age range. Thus, there was a requirement for data on eachchild’s weight at the time of vaccine receipt. An explanation of imputation of missingweight data was provided in Section 7.2.2. To re-cap, linear interpolation was used if themissing weight value was between two known weight values, and predicted values from agrowth-curve model were used as imputed values when missing weight values were notfollowed by recorded weight values. Children with no recorded weights were excludedfrom the analysis data set.
We did not conduct imputations for missing values on outcome measures. The consensusamong the Principal Investigators at the CDC, the four participating HMOs, and AbtAssociates, and the view shared by the study’s External Expert Consultants, was that theanalyses should be limited to records with non-missing values on outcome measures.Most of missing values on outcome measures were due to children not completingassessments when they became fatigued or emotional. In a few cases, the tests wereadministered incorrectly. For example, in some cases an incorrect basal or ceiling wasused. On the finger tapping and grooved pegboard outcomes, some of the missing valueswere caused by equipment failures. Missing values on tics and stuttering outcomesoccurred when parents or assessors failed to fill-out the relevant forms. On parent ratingsof attention/executive functioning, and behavior regulation, some of the missing valueswere due to language barriers, i.e., when parents did not understand the instruments. Arelatively large proportion of teachers failed to return rating forms for stuttering and forattention/executive functioning, and behavior regulation. The numbers of missing andnon-missing values for each outcome measure are shown in Section 9.1.2., Exhibit9.1.2.1.
In cases where there were missing values on covariate measures, we compared resultsfrom a single-imputation analysis methodology to a multiple-imputation methodology.Details follow.
There are two separate issues to consider in the imputation process. One is the method forobtaining an imputed value. Examples of methods include stochastic regressionimputation, hot deck, cold deck, and mean value imputation. We used a stochasticregression imputation method, as described below. The second issue is whether theanalysis is based on a single-imputation or on multiple-imputations.
Abt Associates Inc. Chapter 7 79
In the single-imputation methodology, each missing value is replaced with a singleimputed value, and the analysis proceeds as if the imputed data were comprised of actual,observed values. In multiple imputation, there are several (usually 5 or 10) imputedvalues calculated for each missing value. In our analyses we calculated 10 imputed valuesfor each missing value. None of these several values are exactly equal to one anotherbecause there is a “random draw” component included in each of the imputed values. Themultiple-imputation analysis uses the data from all 10 random draws. The advantage ofmultiple imputation is that it more fully accounts for the uncertainty arising from the useof imputed values in place of observed data. Its disadvantage is that it is morecumbersome to implement.
Our stochastic regression imputation method proceeded in the following manner.Suppose a variable, x2, had several missing values. We fit a regression model to all of thenon-missing values of x2, where x2 was the outcome variable and all other covariates inthe data set were used on the right-hand side of the regression equation as independent(predictor) variables. We saved the residuals from this model in a data set. Next, usingthe parameter estimates from the fitted model, and the values on all of the othercovariates in the data set, we calculated the predicted value of x2, for each non-missingrecord in the data set. Let us call the predicted value x2 of for child i, ix2ˆ ,
Suppose child j had a missing value on the variable x2. Let us denote the imputed valuefor child j as .~
2 jx To obtain the imputed value, we randomly selected a residual from thepreviously described data set of residuals. Let us denote the randomly selected residualvalue as rrandom. We then calculated the imputed value as the sum of the predicted valueobtained from the regression model, jx2ˆ , and the randomly selected residual, rrandom. That
is, randomjj rxx 22 ˆ~ . This is called stochastic regression imputation because the imputedvalue is obtained from the predicted value from a regression model and a random(stochastic) component. The reason for adding the randomly selected residual to thepredicted value was to retain the same amount of variability in imputed values as exists inthe observed values.
After completing the stochastic regression imputation process on all variables that hadmissing values, we obtained a data set with no missing values on covariates. The single-imputation analyses were based on that data set.
In the multiple imputation method, we created 10 data sets in the same manner asdescribed above. Each data set was slightly different from one another because of therandom component in each imputed value. In this method, our analysis models, (i.e., themodels used to estimate the effects of ethylmercury exposure on outcomes), were fit toeach of the 10 data sets. This resulted in 10 estimates for each model parameter, and 10standard error estimates for each model parameter. The final estimate for a particularmodel parameter was calculated as the mean of the 10 separate estimates from the 10 datasets. And the final standard error for that parameter was calculated as a function of themean of the standard errors estimated from the 10 regression models, a component

Abt Associates Inc. Chapter 7 80
measuring the variation between the estimates obtained from the 10 regression models,and an adjustment factor for the 10 repetitions. A more formal explanation of thecalculations used in the multiple imputation procedure follows.
We fit a model of the general form below to each of the D data sets, (D = 1, 2, … 10)ddkdkdddddD xxxY ,,,2,2,1,1,0 ... ,
producing 10 estimates for each parameter
,...ˆ,...ˆ,ˆ...,
,ˆ,...ˆ,ˆ
,ˆ,...ˆ,ˆ
10,2,1,
10,12,11,1
10,02,01,0
kkk
The final estimate for a parameter was calculated a the mean of the estimates from the 10repetitions, e.g.,
10
ˆ10
1,1
1
d
d
The standard error of the combined estimate, ).(. es , was calculated from a within-imputation variance component, and a between-imputation variance component, and anadjustment factor for the number of repetitions (D).
Let dW be the estimated variance of the parameter from repetition d,
i.e., 2,1 )]ˆ.(.[ dd esW .
The within-imputation variance was calculated as the average of the D=10 estimatedvariances
10
10
1 d
d
D
WW .
The between-imputation variance component was calculated as
2
11,1 )ˆ(
11
D
ddD D
B .

Abt Associates Inc. Chapter 7 81
And the total was calculated as
DDD BD
DWT
1 ,
where (D+1)/D is the correction factor for D repetitions.
The standard error of 1 was calculated as DTes ).(. .
We applied both single-imputation and multiple-imputation methods to the main effectsmodels corresponding to the study’s primary research questions, and found that bothmethods produced very similar results. In two sets of results the parameter estimates werevery similar, and the associations between exposure and outcome measures werestatistically significant or non-significant for the same outcomes and exposure measuresin both sets. These results are reported in Section 9.2.2.4.2. Since the analyses with thesingle-imputation were far less cumbersome, all subsequent analyses used the single-imputation methodology.

Abt Associates Inc. Chapter 8 82
8. Analysis ApproachDuring the design phase of this study an analysis plan was developed that detailed whatoutcomes were to be measured, what the data sources would be, how exposure measuresand covariates were to be coded, the forms of the statistical models that were to be fit tothe data, and the method for deciding which covariates were to be retained or dropped forinclusion in the models for any particular outcome variable. The analysis plan wentthrough several iterations of review and comment by the Principal Investigators at theCDC, at each of the four participating HMOs, and at Abt Associates, and by the study’sExternal Expert Consultants11. Variable construction and the modeling approachfollowed very closely to that analysis plan. In the first phase of analysis, only models thatwere specified in the analysis plan were fit to the data. Following an agreed uponprotocol, none of the preliminary results were shown to or discussed with anyone outsideof the analysis team at Abt Associates prior to a meeting meeting that took place on April8, 2005. At that meeting the preliminary results from those models were presented to thegroup of Principal Investigators and the study’s External Expert Consultants. Thoseresults generated new ideas and motivated new lines of inquiry. Subsequent to themeeting, requests to fit additional models came from the group of principal investigatorsand the External Expert Consultants. Consequently, many of the results presented inSection 9 are from models that were not specified in the original analysis plan. Theanalyses that were specified in the original analysis plan, and the analyses that wererequested subsequent to the April 8, 2005 meeting are indicated in Exhibit 8.1.1.
The data sources and construction of measures were described previously in Sections 6and 7. The remainder of Section 8 focuses on the analytical models used and on modelselection (i.e., which covariates are included in each model). The design and analysisplans of the current study were strongly influenced by the Faroe Islands (Grandjean et al.,1997) and Seychelles Islands (Davidson et al., 1998) studies of the effects of dietaryexposure to methylmercury during pregnancy on subsequent child outcomes.Consequently, the designs and methods implemented in those studies are frequentlyreferenced in the discussion that follows.
Section 8.1 presents an example model specification and introduces notation that is usedthroughout the remainder of the report. The full set of models is documented in Section 9.The model specifications are presented in that section in order to clarify the interpretationof the results that are presented there.
Section 8.2 documents the methods used for model selection. Discussions of how wetested for effect modifiers, and how we approach the issue of multiple comparisonsfollow in Sections 8.3 and 8.4.
11 See Acknowledgements section for listing of the Panel of External Consultants

Abt Associates Inc. Chapter 8 83
Exhibit 8.1.1.Explanation of Analyses That Were Specified in Original Analysis Plan, and Analyses ThatWere Requested Subsequent to Review of Preliminary Analysis Results.
Analyses Specified in Original AnalysisPlan
Analyses Requested Subsequent to April 8,2005 Meeting
Exhibit 9.2.2.1 Main Effect Models (1) and (2)Exhibit 9.2.2.2 Main Effect Models (1) and (2)with Multiple Imputation for Missing Values ofCovariates
Exhibit 9.2.2.3 Main Effect Models (1) and (2)with Alternative Coding of Prenatal ExposureVariableExhibit 9.2.2.4 Additional Main Effect Modelsfor ADHD Outcomes
Exhibit 9.2.3.1. Summary of Thimerosal Effectsfor FemalesExhibit 9.2.3.2. Summary of Thimerosal Effectsfor Males
Exhibit 9.2.4.1. Summary of Models TestingEffects of Cumulative Exposure PrenatalThrough Seven Months – Full Data SetExhibit 9.2.4.2. Summary of Models TestingEffects of Cumulative Exposure PrenatalThrough Seven Months – FemalesExhibit 9.2.4.3. Summary of Models TestingEffects of Cumulative Exposure PrenatalThrough Seven Months – MalesExhibit 9.2.5.2. Summary of Multiple Sourcesof Prenatal Mercury Models
Exhibit 9.2.6.1. Summary of Models forConcurrent Antibiotics Effect –Birth to SevenMonthsExhibit 9.2.6.2. Summary of Models forConcurrent Antibiotics Effect –Birth to 28 Days,and 29 Days to Seven MonthsRead Table: The results summarized in Exhibit 9.2.2.1 were from models that were specified in the original analysisplan. The results summarized in Exhibit 9.2.2.3 were from models that were requested subsequent to the presentation ofpreliminary analysis results that took place on April 8, 2005.

Abt Associates Inc. Chapter 8 84
8.1. Overview of Analytical Models
In this section, we present an example model specification. This will allow us tointroduce some notation and some terminology and conventions that will be usedthroughout the remainder of the document. The example model shown below is specifiedto produce estimates of the effects of prenatal exposure, neonatal (birth to 28 days)exposure, and cumulative exposure for the age range spanning 29 days to 217 daysmonths (1 to 7 months), on an outcome measure, Y:
l
llkjk
kkjj
jj StcfoemosExpHepBerpreNatThimY 173210
The model is specified as an ordinary least squares regression model. The outcomevariable, Y, is assumed to be measured on a continuous scale. The error term, , isassumed to be conditionally independent and identically distributed normal with meanzero and variance 2 .
There are three classes of right-hand-side variables in the model. The first class consistsof the ethylmercury exposure variables. In this model, the preNatThimer variable is ameasure of prenatal exposure to ethylmercury from thimerosal-containing vaccines andimmune globulins, the variable HepB is a measure of exposure to Hepatitis B vaccinesand immune globlins received in the first 28 days of life, and Exp17mos is a measure ofexposure from vaccines received in the age range of one to seven months (29-214 days)(for details see Section 7.2).
The second class of right-hand-side variables represents other exposures. These areprenatal or postnatal exposures to neurotoxins that may be related to the outcomemeasures. We included this class of variables in the model in order to account forrelationships between exposures to neurotoxins and the outcome measures, when makinginferences about the effects of ethylmercury exposure on the outcome variable. Examplesinclude maternal alcohol use and maternal smoking during pregnancy. These terms arerepresented in the model specification by joe , where “oe” stands for “other exposures”,
and the j represent fixed effect parameters. The summation symbol means that we willhave 0, 1, 2, 3… up to “J” such terms in the model specification.
We have labeled the third class of right-hand-side variables as “child and familystatistical control variables”. This class of variables includes child and familydemographic factors, birth conditions, child medical conditions, and maternal diagnoses.These are factors that we want to control for when making inferences about therelationship of ethylmercury exposure to the outcome variable. Examples include ageand sex of the child, maternal age, and family socio-economic status. This class ofvariables is represented in the model specification by kcf , where the subscript “k”

Abt Associates Inc. Chapter 8 85
indicates that we will have 1, 2, 3, … up to “K” such terms in the model. Thecorresponding parameters are numbered “J + k”, to indicate that the numbering followssequentially, after the “other exposures” variables. For example, if there were two “otherexposures” variables, then the first child and family statistical control variable in themodel would be subscripted with a 3 (J + k = 2 + 1 = 3). The second cf variable wouldbe numbered 4, (J + k = 2+2=4), etc.
The fourth class of variables in the model consists of site dummy variables. These arevariables that indicate each of HMOs where data were collected. The site dummies arerepresented in the model specification by the terms lSt .
There are three hypotheses to be tested using the model shown in the example above.The first is the test of the null hypothesis that there is no linear relationship of prenatalethylmercury exposure to the outcome variable. The second is a test of whether there is arelationship between receipt of Hepatitis B vaccines or immune globulins in the first 28days of life, and the outcome measure. And the third is a test for a linear relationshipbetween exposure to ethylmercury from vaccines received in the age range of one monthto seven months, and the outcome variable. These are two-sided hypothesis tests, and weused a p<0.05 criterion for statistical significance. We use the following notation forthese three tests.
0:0: 110 aHvsH ,0:0: 220 aHvsH ,0:0: 330 aHvsH .
Thirty five of the 42 outcomes analyzed in this study were measured on a continuousscale. The example model shown above was specified as a linear regression model,suitable for continuous outcome variables. Logistic regression models, that areanalogous to the linear regression models shown here, were fit to the data for the 7outcomes that were coded as binary measures.
8.2. Inclusion of Covariates
Consulting pediatricians, neurotoxicolgists, and other experts identified a long list offactors that were expected to have relationships with the neuropsychological measuresthat are the outcome variables in this study. It is not feasible to implement anexperimental design that would strictly eliminate the potential influence of all of thesefactors on the outcome measures. However, by specifying some or all of them ascovariates in our statistical models, we attempt to control for the influences of thesefactors on the outcome variables, when making inferences about the relationship betweenexposure to ethylmercury and the outcome measures.
In observational studies, selection of covariates can have a large impact on the inferencesabout exposure variables. Statisticians consulting on the design of the current study

Abt Associates Inc. Chapter 8 86
(from External Expert Consultants, the CDC, the HMOs, and Abt Associates Inc.)suggested and discussed three different approaches to covariate selection. The threemethods are not necessarily mutually exclusive. We will refer to the first method as the apriori selection method. In this approach, model covariates are selected during thedesign phase, well before data are collected. This method is based on the assumption thatthere is strong prior knowledge of the relationships between outcomes and the variablesthat are being considered as covariates and/or the relationships between ethylmercuryexposure and the variables that are being considered as covariates. In many cases, strongprior knowledge exists. For example, for most of the outcome measures, we knew, apriori, that the age of the child at the time of testing would be related to the outcome.
We will refer to the second method as backward elimination. This is a very commonlyused method of covariate selection in which one begins a step-wise process by fitting amodel with a full set of covariates, and identifying the covariate with the largest p-value.That variable is dropped in the second iteration and a new model is fit, and the process isrepeated. This procedure continues until all covariates that do not reach a pre-setsignificance criterion are dropped from the model.
Several consulting statisticians advocated the use of a change-in-estimate methodology.In this approach, the decision of whether or not to include a variable as a covariate isdecided by fitting models with and without the covariate and comparing the estimates ofthe target parameter(s) (i.e., the exposure variables) in the two models. If the differencebetween the estimates from the two models of the target parameter(s) changes by morethan some pre-determined cut-off level (e.g., 10%), then the covariate is retained insubsequent models, otherwise it is dropped.
Before considering the pros and cons of each approach, and describing the approach weused, we review the typical reasons that covariates are included in models. Then wereview the covariate selection strategies used by Grandjean et. al (1997) for the FaroeIslands study, and by Davidson, et. al. (1998) for the Seychelles study. And we review astudy by Budtz-Jorgensen et. al. (2007) that used the Faroe Islands data to compare theresulting inferences on exposure variables when several different covariate selectionstrategies were used.
Typically, covariates are included in regression models for any or all of the followingthree reasons:
To Reduce Residual Error and Increase Power. To the extent that a covariatereduces the variance of the residual error, the power to detect a relationshipbetween the exposure variables and the outcome measure will be increased. Onthe other hand, addition of covariates that are not related to the outcome measurecan have the effect of decreasing the precision of the exposure estimates and,hence, decreasing power.
To Control for Confounding. As an example of a confounder, suppose that for aparticular outcome measure, lower maternal IQ was related to lower scores on theoutcome measure. Furthermore, suppose there was a relationship betweenmaternal IQ and exposure such that lower maternal IQ tended to be associated

Abt Associates Inc. Chapter 8 87
with lower exposure. Then, in this scenario, maternal IQ is a confounder, andomission of the variable could lead to a spurious finding that lower exposure isrelated to lower scores on the outcome measure.
To Test for Effect Modification. For example, suppose that biological differencesbetween boys and girls were such that the neurocognitive development of boyswas adversely affected by exposure to ethylmercury from vaccines or immuneglobulins, whereas girls were not sensitive to exposure. Then sex would be aneffect modifier. If sex were an effect modifier, we would like to produce separateestimates of exposure effects for boys and girls. This is accomplished by addingsex-by-exposure interaction terms to the model. Without the interaction terms, theoverall estimated exposure effect on both boys and girls combined would fallsomewhere in between the two separate estimates. The sex variable could also bea confounder, if, for example, boys scored lower than girls regardless of theirexposure and if the distribution of exposure levels was not the same for boys andgirls.
The method for selecting covariates in the Faroe Island study is described by Budtz-Jorgensen et. al. (2007):
“In the original analysis of the Faroese data Grandjean et al. (1997) developed an ad hoc criterionfor confounder selection combining information across different outcome variables. According tothis method the child's sex and age in addition to the maternal Raven score were consideredobligatory confounders for all outcome variables. Additional confounders were selectedapproximately as follows. For each neuropsychological test important predictors were identifiedusing backward elimination (adjusted for the obligatory covariates) with p=0.10. Predictors thatwere important for more than 3 outcomes (out of 17) were then included in the final regressionmodel for all outcomes.”
In the Seychelles study (Davidson, et. al., 1998), covariates were specified as part of thestudy design and were “selected because of their potential to bias the assessment of theassociation beween Hg and outcome”. A full model and a reduced model were fit to thedata for each outcome variable. The full model included all of the a priori selectedcovariates and the reduced model “included only those covariates that did not duplicateothers or were felt to be the most relevant to child development in the Seychelles” (Marshet. al, 1995).
Thus, the covariate selection strategy used in the Faroe Islands study was a mix of the apriori and backwards elimination methods. In the Seychelles study, the a priori methodwas used. None of the covariates used in the Faroe Islands study were tested as effectmodifiers. In the Seychelles study, only one covariate, sex, was tested as an effectmodifier. “Each full and reduced model was run both with and without mercuryexposure by sex interaction terms to test the hypothesis that males and females havedifferent mercury exposure slopes” (Davidson, et. al., 1998).
An attractive aspect of the a priori method of covariate selection is that it reduces thepotential for criticism that the analysis will become some kind of data snooping exercise.That is, it completely precludes the possibility of an analyst choosing covariates in such a

Abt Associates Inc. Chapter 8 88
way that the estimated exposure effects come as close as possible to some pre-conceivednotion held by the analyst. A negative aspect of this approach is that you might end upspecifying a model that does not fit the data well. And, if some of the covariates are notcorrelated with the outcome, the standard errors on the key exposure variables can belarger than they would have been had the non-significant covariate been eliminated.Furthermore, there may be potential confounders for which there is not enough priorknowledge for the decision of whether or not they should be included.
Backwards elimination methods are attractive from the point of view that they are oftenused and familiar. But use of this method using the conventional p<0.05 criterion hasbeen criticized from the point of view that the selection criteria tends to favor covariateswith strong relationships to the outcome, but may omit important confounders (i.e.,variables that have a weaker relationship to the outcome, but have a strong relationship toexposure). Maldonado and Greenland (1993) evaluated a backwards elimination strategyand a change-in-estimate strategy using simulated data from a poisson regression model.They found that the p-value based method performed adequately when the alpha levelswere higher than conventional levels (0.20 or more), and found that the change-in-estimate strategy performed adequately when the cut point was set to 10 percent.However, their data, generated from a poisson model, and their analysis model, with onlya single covariate in addition to the key exposure variable, are very different than themodels anticipated for the current study.
Using the Faroe Islands data, Budtz-Jorgensen et. al. (2007) compared several covariateselection strategies including backwards elimination, change-in-estimate, and the originalcovariate selection strategy used by Grandjean et. al. 1997. They looked at the backwardselimination strategy with three p-value cut-off levels, 0.05, 0.10, and 0.20, and, followingthe recommendation of Maldonado and Greenland (1993) used a 10% criterion for thechange-in-estimate method. The measures that formed the basis of the comparisons werethe standard errors and the biases on the exposure variables. To assess bias, theyassumed that the full model with all 20 covariates produced an unbiased estimate of theexposure effect. Bias was defined to be the difference between the exposure coefficientestimated from the full model, and the coefficient estimated from the model withcovariates selected with a competing selection approach. They compared results of thevarious selection strategies on models for two outcome variables. Both of these were alsoused as outcome measures in the current study (the California Verbal Learning Test, andthe Boston Naming Test).
They found that, although the change-in-estimate strategy did an adequate job ofidentifying confounders and keeping them in the model, it sometimes threw out variablesthat were correlated with the outcome, but were not confounders. Therefore, this methodthrew out variables that, if retained, would have reduced the residual error and reducedthe standard error of the exposure coefficient (thus increasing the power to detectexposure effects). Although they found that backwards elimination with a p<0.05criterion was un-suited for confounder identification, they found that when the p-valuecriterion was set to p<0.20, backwards elimination strategy resulted in a reduction ofresidual error variance and did not throw out important confounders. They recommended

Abt Associates Inc. Chapter 8 89
the backwards elimination strategy with a p<0.20 criterion over the change-in-estimatestrategy. The original strategy used by Grandjean et. al. was comparable to thebackwards selection strategy using the p<0.20 criterion in terms of reduction in bias andstandard error of the exposure effect.
For the current study, we used a covariate selection method that was a mix of all three ofthe previously described methods, the a priori method, backwards elimination, and thechange-in-estimate method. Our philosophical starting point was that if there wereenough prior knowledge about all of the potential covariates then the ideal method for thecurrent study would have been an a priori only method for the selection of covariates.We saw this as the ideal for the current study because a priori selection of covariateswould allay fears on the part of stakeholders about potential post-hoc manipulation of thedata to fit some prior notion. An a priori only method, however, was not practical for thecurrent study because there were too many variables for which we did not have priorknowledge about their relationships to the outcome variables. This was especially truefor the “other exposures” variables. Including a large number of covariates that are notrelated to the outcome, in the model, would have undesirable effects on the precision ofthe exposure estimates.
Our strategy for selecting covariates was as follows. We identified a set of a prioriselected covariates that were included in all models for all outcomes. There was a secondset of variables that were tested for inclusion. There were two ways that the testing couldresult in the determination that a particular variable would be retained in the final modelfor a particular outcome. The first way utilized the backwards elimination strategy usinga p<0.20 cutoff. If the p-value for a particular variable was less that 0.20, then it wasretained in the final model. Each variable was simultaneously evaluated using a change-in-estimate method with a 10 percent change criterion. When either method indicatedthat a particular variable should be retained as a covariate, then that variable was retainedin the final model. This ensured that we did not drop variables that, if retained, wouldsubstantially reduce residual error variance, and ensured that we did not drop variablesthat are confounders.
We included dummy variables for HMO in all models. All but three of the remaining apriori selected covariates that were used in our study were used as covariates in the finalmodels in both the Faroe Islands study and the Seychelles study. The three exceptionswere age, child’s computer experience, and the HOME score. Age was not used as acovariate in the Seychelles study, presumably because all of children tested were in avery narrow age range. The design of the current study was such that we tested subjectsin the age range of 7 to 10 years. Age was expected to have a strong relationship to theoutcome measures for the current study. Age was significant for both outcomes reportedby Budtz-Jorgensen et. al. (2007). Computer experience was not used as a covariate inthe Seychelles study because none of the outcome measures were based on a computerinteractive assessment. In the Faroe Islands study, computer experience was an importantpredictor for the assessments that used a computer interactive testing regime. In thecurrent study, computer experience was an a priori covariate only for those particularoutcome measures that used a computerized assessment (the finger tapping and GDS

Abt Associates Inc. Chapter 8 90
vigilance tasks). It was tested for inclusion in models for all other outcomes. Finally, theHOME scale score was not used in the Faroe Islands study. However, in the Seychellesstudy, it was a significant predictor at the p<0.01 level for five of the six outcomes, andsignificant at the p<0.05 level for the sixth.
In deciding which variables to treat as a priori selected, we looked at the statisticalsignificance associated with each covariate as reported in Budtz-Jorgensen et. al. (2007),for the Faroe Islands study, and Davidson et. al. (1998), for the Seychelles Islands study.Budtz-Jorgensen et. al. (2007) showed significance levels for covariates for twooutcomes and Davidson et. al. (1998) showed results associated with six outcomes.Exhibit 8.2.1 shows that, with the exceptions of age, child’s computer experience, and theHOME score, our a priori selected covariates were statistically significant at a p<0.20criterion for at least four of the six total outcomes shown in the two papers.
For each outcome variable, the remaining covariates shown in Exhibit 8.2.1 were testedfor inclusion in the final model. These include variables that were used in the Faroe andthe Seychelles studies, but that were not consistently found to be confounders or reducersof residual in those studies. These also include variables that were not examined in theFaroe or Seychelles studies, but that had been suggested by consulting neurologists,toxicologists or pediatricians because of their hypothesized relationship to the outcomemeasures. We also tested higher order functional forms of age, percent poverty, and theHOME score for inclusion. We included tests for these forms because, for example, wedid not know, a priori, whether a linear coding of the age variable would be the mostappropriate functional form to assume for each outcome measure. For some outcomemeasures, quadratic or cubic forms of these variables significantly improved the fit.
The variable selection routine was implemented for each outcome measure using themain effect model for prenatal exposure and cumulative exposure during the age rangefrom birth to 7 months (See Model 1, of Section 9.2.2.2 for specifications of this model).For each outcome measure, variables that were selected for inclusion in that model wereretained as covariates in all other models for that outcome measure. All models for anyone particular outcome measure used the same covariate set. However, the selectionprocess was such that different outcome measures had different covariate sets. The list ofcovariates that were used in models for each outcome measure is shown in Exhibit 8.2.2.

Abt Associates Inc. Chapter 8 91
Exhibit 8.2.1. A Priori Variables and Variables Tested for Inclusion as Model CovariatesResearch Evidence
Variable Description / Levels FaroeIslandsa
SeychellesIslandsb
Variables Included in Every Model (a priori selected)
ChildAge Child Age (Yrs) at assessment 2/2c: p=.202/2: p=.05
Not entered
sexmale Sex of child 0=female, 1=male 2/2: p=.200/2: p=.05
4/6: p=.203/6: p=.05
Birth weight1 = if birth weight 2500-2999 grams2 = Birth weight 3000-3999 grams3 = Birth weight 4000+ grams
2/2: p=.201/2: p=.05
4/6: p=.203/6: p=.05
Maternal IQ1= Score in lower third of distribution2= Score in middle third of distribution3= Score in upper third of distribution
2/2: p=.202/2: p=.05
4/6: p=.203/6: p=.05
HOME_TotalIndex “HOME” Total Index Not entered 6/6: p<.05
PctPoverty1 (Percent of poverty line)/100SESd:
2/2: p=.202/2: p=.05
SESd:5/6: p=.205/6: p=.05
Maternal Education 0= No HS degree1=High school diploma or GED2=attended some college, but no degree3=Associate’s degree or higher
SESd:2/2: p=.202/2: p=.05
SESd:5/6: p=.205/6: p=.05
SingleParent Child lives in a single parent household (0/1)SESd:
2/2: p=.202/2: p=.05
SESd:5/6: p=.205/6: p=.05
Site HMO-AHMO-BHMO-CHMO-D
Variables Tested for Inclusion: Child and Family Characteristics
Computer Experience0=No experience1=some experience2=much experience.
Computerizedtests:p=.05
Maternal Age1= Maternal Age at Ch Birth: <=16 years2=Maternal Age at Ch Birth: 17-39 years3=Maternal Age at Ch Birth: >=40 years
1/2: p=.200/2: p=.05
1/6: p=.201/6: p=.05
OlderSibs Child has an older sibling (0/1) 1/2: p=.200/2: p=.05 Not entered
YoungerSibs Child has a younger sibling (0/1) 1/2: p=.200/2: p=.05 Not entered
DayCareCentr # of center-based day care settings prior to KG 1/2: p=.201/2: p=.05 Not entered
DayCareHome # of home-based day care settings prior to KG 1/2: p=.201/2: p=.05 Not entered
EngOnly English only at home Not entered full modelonly/ ? signif.e
Breast Feeding(Duration)
0 = Breast Fed: <1mo1 =Breast Fed: 1-6mos2 = Breast Fed: 6+ mos
0/2: p=.200/2: p=.05
full modelonly/ ? signif.e
Variables Tested for Inclusion: Child Birth Conditions
cMedicalHist_1 =1 if birth headCM +/- 2SD from Mean Not entered 2/6e: p=.200/6: p=.05

Abt Associates Inc. Chapter 8 92
Exhibit 8.2.1. A Priori Variables and Variables Tested for Inclusion as Model CovariatesResearch Evidence
Variable Description / Levels FaroeIslandsa
SeychellesIslandsb
C5APGARImpVal1 5-minute apgarVariables Tested for Inclusion: Prenatal Exposures (non-vaccine related)
PreNatNicotine_1 Used tobacco during pregnancy 0/2: p=.200/2: p=.05
full modelonly/ ? signif.f
PreNatAlcohol_1 0=never - 4 heavy Not entered full modelonly/ ? signif.f
Tuna Consumption0= no consumption of tuna during pregnancy.1 = moderate consumption (less than one serving/week)2 = high consumption (more than one serving per week)
PreNatFish_11= if mother reported eating tuna, and ocean fish, and home-caught fish duringpregnancy.0 = else.
PreNatOrgMerc_1 Use of mercury-containing contact lens solutions or nasal sprays during pregnancy.PreNatHomePro_1 Prenatal exposure to mercury from home products
Tooth Amalgams0 = mother had no amalgam fillings during pregnancy1 = had amalgam fillings, but no dental work and did not chew gum during pregnancy2= had amalgam fillings and had dental work or chewed gum during pregnancy.
PreNatlead_1 Prenatal exposure to lead from occupational or residential sourcesPreNatIllDrug 1=Cocaine or NarcoticVariables Tested for Inclusion: Child Medical ConditionsIronDef_1 Anemia or iron deficiencyADHDstimulant Use of ADHD stimulant in 12 hours prior to assessmentChdPICA_1 Child PicaVariables Tested for Inclusion: Maternal DiagnosesMatLangDel Maternal Language DelayMatSpeechDel Maternal speech delayMatSTUTTER Maternal stutteringMatADHD Maternal ADHDMatTIC Maternal ticsVariables Tested for Inclusion: Quadratic and Cubic FormsChildAge2 ChildAge**2 (squared)ChildAge3 ChildAge**3 (cubed)PctPoverty1_2 (PctPoverty1/100)**2 (squared)PctPoverty1_3 (PctPoverty1/100)**3 (cubed)HOME_TotalIndex2 HOME_TotalIndex**2 (squared)HOME_TotalIndex3 HOME_TotalIndex**3 (cubed)a Budtz-Jorgenson et al. (2007) Confounder Identification in Environmental Epidemiology. Assessment of Health effects of PrenatalMercury Exposure.b Davidson et al. (1998). Effects of prenatal and postnatal methylmercury exposure from fish consumption on neurodevelopment.Outcomes at 66 months of age in the Seychelles Child Development Study. JAMA 280(8): 701-707.c Notation represents number of outcomes for which covariate was significant. For example, "½" should be interpreted to mean thatthe covariate was significant for 1 of the 2 outcomes that were tested.d In Faroe Island study, a single measure of socio-economic status (the Hollingsead) was used. In Seychelles study SES variableswere paternal employment, paternal education, and maternal education.e In Davidson et. al, this variable took the value “1” if child had intrauterine growth retardation (IUGR) or if head size was > 2standard deviations from mean at birth. In the current study, IUGR was an exclusionary condition.e These covariates were included in the full model only. Their level of significance was not reported.
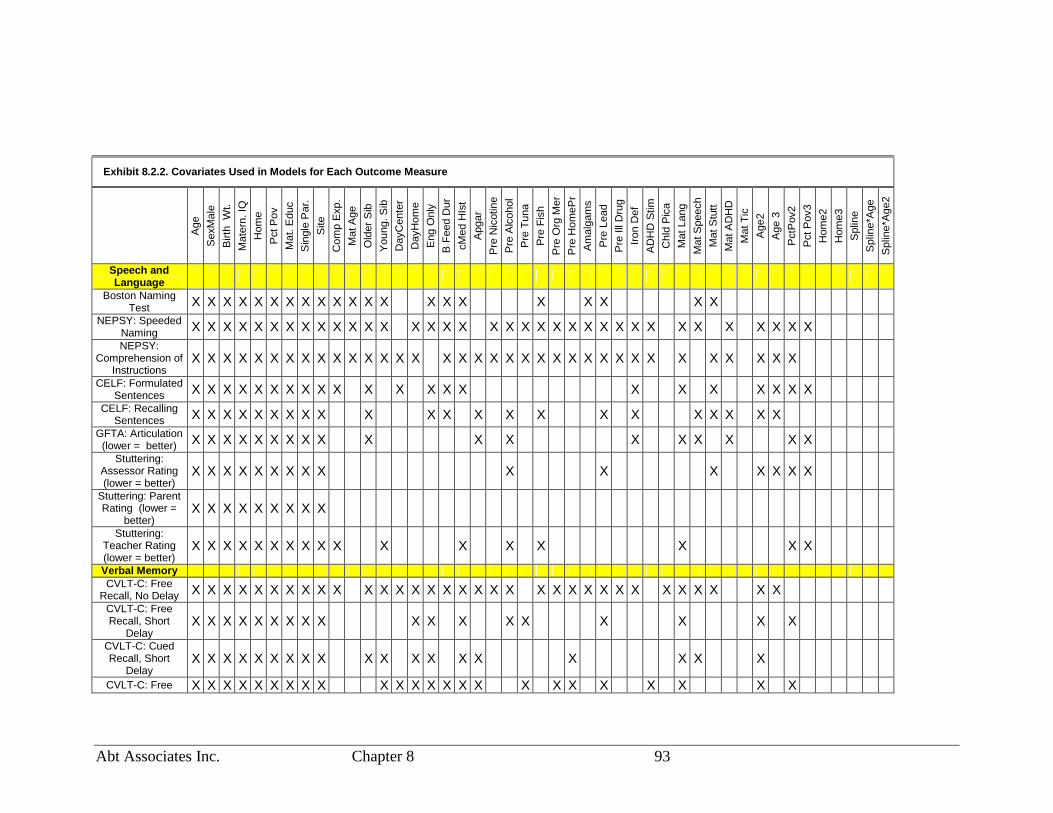
Abt Associates Inc. Chapter 8 93
Exhibit 8.2.2. Covariates Used in Models for Each Outcome Measure
Age
Sex
Mal
eB
irth
Wt.
Mat
ern.
IQH
ome
Pct
Pov
Mat
.Edu
cS
ingl
eP
ar.
Site
Com
pE
xp.
Mat
Age
Old
erS
ibY
oung
.Sib
Day
Cen
ter
Day
Hom
eE
ngO
nly
BF
eed
Dur
cMed
HIs
tA
pgar
Pre
Nic
otin
eP
reA
lcoh
olP
reT
una
Pre
Fis
hP
reO
rgM
erP
reH
omeP
rA
mal
gam
sP
reLe
adP
reIll
Dru
gIr
onD
efA
DH
DS
timC
hld
Pic
aM
atLa
ngM
atS
peec
hM
atS
tutt
Mat
AD
HD
Mat
Tic
Age
2A
ge3
Pct
Pov
2P
ctP
ov3
Hom
e2H
ome3
Spl
ine
Spl
ine*
Age
Spl
ine*
Age
2
Speech andLanguage
Boston NamingTest X X X X X X X X X X X X X X X X X X X X X
NEPSY: SpeededNaming X X X X X X X X X X X X X X X X X X X X X X X X X X X X X X X X X X XNEPSY:
Comprehension ofInstructions
X X X X X X X X X X X X X X X X X X X X X X X X X X X X X X X X X X X
CELF: FormulatedSentences X X X X X X X X X X X X X X X X X X X X X X
CELF: RecallingSentences X X X X X X X X X X X X X X X X X X X X X X
GFTA: Articulation(lower = better) X X X X X X X X X X X X X X X X X X
Stuttering:Assessor Rating(lower = better)
X X X X X X X X X X X X X X X X
Stuttering: ParentRating (lower =
better)X X X X X X X X X
Stuttering:Teacher Rating(lower = better)
X X X X X X X X X X X X X X X X X
Verbal MemoryCVLT-C: Free
Recall, No Delay X X X X X X X X X X X X X X X X X X X X X X X X X X X X X X X X XCVLT-C: FreeRecall, Short
DelayX X X X X X X X X X X X X X X X X X
CVLT-C: CuedRecall, Short
DelayX X X X X X X X X X X X X X X X X X X
CVLT-C: Free X X X X X X X X X X X X X X X X X X X X X X X X

Abt Associates Inc. Chapter 8 94
Exhibit 8.2.2. Covariates Used in Models for Each Outcome Measure
Age
Sex
Mal
eB
irth
Wt.
Mat
ern.
IQH
ome
Pct
Pov
Mat
.Edu
cS
ingl
eP
ar.
Site
Com
pE
xp.
Mat
Age
Old
erS
ibY
oung
.Sib
Day
Cen
ter
Day
Hom
eE
ngO
nly
BF
eed
Dur
cMed
HIs
tA
pgar
Pre
Nic
otin
eP
reA
lcoh
olP
reT
una
Pre
Fis
hP
reO
rgM
erP
reH
omeP
rA
mal
gam
sP
reLe
adP
reIll
Dru
gIr
onD
efA
DH
DS
timC
hld
Pic
aM
atLa
ngM
atS
peec
hM
atS
tutt
Mat
AD
HD
Mat
Tic
Age
2A
ge3
Pct
Pov
2P
ctP
ov3
Hom
e2H
ome3
Spl
ine
Spl
ine*
Age
Spl
ine*
Age
2
Recall, LongDelay
CVLT-C: CuedRecall, Long
DelayX X X X X X X X X X X X X X X X X X X X X X X X X X X X X X X X X X X X X X
CMS Stories 1:Immediate Recall X X X X X X X X X X X X X X X X XCMS Stories 2:Delayed Recall X X X X X X X X X X X X X X X X X X X X X X X X XAchievementWJIII: Letter-
WordIdentification
X X X X X X X X X X X X X X X X X X X X X X X
Fine MotorCoordination
GroovedPegboard:
Dominant Hand(lower = better)
X X X X X X X X X X X X X X X X X X X
GroovedPegboard: Non-dom Hand (lower
= better)
X X X X X X X X X X X X X X X X X X X X X X X X X X X X X X X X
Finger Tapping:Dominant Hand X X X X X X X X X X X X X X X X X X X XFinger Tapping:Non-dominant
HandX X X X X X X X X X X X X X X X X X X X X X X X X X
Visual SpatialAbility
Stanford Binet:Copying X X X X X X X X X X X X X X X X X X X X X X X X X X X
Attention/Executive
FunctioningGDS VigilanceTask: Correct X X X X X X X X X X X X X X X X X X X X X X X X X X X X X X X X X X

Abt Associates Inc. Chapter 8 95
Exhibit 8.2.2. Covariates Used in Models for Each Outcome Measure
Age
Sex
Mal
eB
irth
Wt.
Mat
ern.
IQH
ome
Pct
Pov
Mat
.Edu
cS
ingl
eP
ar.
Site
Com
pE
xp.
Mat
Age
Old
erS
ibY
oung
.Sib
Day
Cen
ter
Day
Hom
eE
ngO
nly
BF
eed
Dur
cMed
HIs
tA
pgar
Pre
Nic
otin
eP
reA
lcoh
olP
reT
una
Pre
Fis
hP
reO
rgM
erP
reH
omeP
rA
mal
gam
sP
reLe
adP
reIll
Dru
gIr
onD
efA
DH
DS
timC
hld
Pic
aM
atLa
ngM
atS
peec
hM
atS
tutt
Mat
AD
HD
Mat
Tic
Age
2A
ge3
Pct
Pov
2P
ctP
ov3
Hom
e2H
ome3
Spl
ine
Spl
ine*
Age
Spl
ine*
Age
2
ResponsesGDS VigilanceTask: Errors
(lower = better)X X X X X X X X X X X X X X X X X X X X X X X X X X X X X X X X
WISC III: DigitSpan, Forward
RecallX X X X X X X X X X X X X X X X X X X X X X X X X X
WISC III: DigitSpan, Backward
RecallX X X X X X X X X X X X X X
WISC III: DigitSpan, Combined X X X X X X X X X X X X X X X X X X X X X
BRIEF ParentRating:
Metacognition(lower = better)
X X X X X X X X X X X X X X X X X X X X X X X X X X X
BRIEF TeacherRating:
Metacognition(lower = better)
X X X X X X X X X X X X X X X X X X X X X X X X X X X X
BehaviorRegulation
(lower = better)CRS-R: Parent
Rating:Hyperactive/Impul
sive
X X X X X X X X X X X X X X X X X X X X X
CRS-R: TeacherRating:
Hyperactive/Impulsive
X X X X X X X X X X X X X X X X X X X
CRS-R: ParentRating: Inattentive X X X X X X X X X X X X X X X X X X X X X X X XCRS-R: Teacher
Rating: Inattentive X X X X X X X X X X X X X X X X X X X X XBRIEF Parent
Rating: Behavior X X X X X X X X X X X X X X X X X X X X X

Abt Associates Inc. Chapter 8 96
Exhibit 8.2.2. Covariates Used in Models for Each Outcome Measure
Age
Sex
Mal
eB
irth
Wt.
Mat
ern.
IQH
ome
Pct
Pov
Mat
.Edu
cS
ingl
eP
ar.
Site
Com
pE
xp.
Mat
Age
Old
erS
ibY
oung
.Sib
Day
Cen
ter
Day
Hom
eE
ngO
nly
BF
eed
Dur
cMed
HIs
tA
pgar
Pre
Nic
otin
eP
reA
lcoh
olP
reT
una
Pre
Fis
hP
reO
rgM
erP
reH
omeP
rA
mal
gam
sP
reLe
adP
reIll
Dru
gIr
onD
efA
DH
DS
timC
hld
Pic
aM
atLa
ngM
atS
peec
hM
atS
tutt
Mat
AD
HD
Mat
Tic
Age
2A
ge3
Pct
Pov
2P
ctP
ov3
Hom
e2H
ome3
Spl
ine
Spl
ine*
Age
Spl
ine*
Age
2
RegulationBRIEF TeacherRating: Behavior
RegulationX X X X X X X X X X X X X X X X X X X X X X X X X X X
Tics (lower =better)
Motor tics(current):
Assessor RatingX X X X X X X X X X X X X X X X X X X X X X X X X
Phonics tics(current):
Assessor RatingX X X X X X X X X X X X X X X X
Motor tics(current): Parent
RatingX X X X X X X X X X X X X X X X X X X X X X X X X X X
Phonics tics(current): Parent
RatingX X X X X X X X X X X X X X X X X X X X X X X X
GeneralIntellectualFunctioning
WASI Verbal IQ X X X X X X X X X X X X X X X X X X X X XWASI
Performance IQ X X X X X X X X X X X X X X X X XWASI Full Scale
IQ X X X X X X X X X X X X X X X X X X X X X X X X X X X“X” indicates that the variable shown in the column was used as a covariate in all models for the outcome variable shown on the row.

Abt Associates Inc. Chapter 8 97
8.3. Testing for Effect Modifiers
The test for whether a covariate is an effect modifier involves creating an interaction termbetween the covariate and the exposure variables, and conducting tests of the null hypothesesthat the coefficients for the interactions term are zero. Grandjean et. al. (1997), did not testfor effect modifiers. Davidson et. al. (1998) tested for interactions between sex and exposureand found a significant sex-by-prenatal exposure interaction for one of their six outcomemeasures. Following the lead of Davidson et. al., (1998), our analysis plan specified modelsto test for sex-by-exposure interactions.
Additionally, several studies of the rates of excretion of methylmercuric chloride in rodentshave indicated that oral antibiotics taken concurrently with oral ingestion of methylmercuricchloride is associated with slower excretion (Rowland et. al., 1977, 1980,1984). It hastherefore been suggested that if children are on antibiotics at the time of exposure toethylmercury from thimerosal-containing vaccines or immuned globulins, that the antibioticuse could act as a modifier of an exposure effect. Therefore, we included specifications formodels to test for these interaction effects in the analysis plan.
The current report also includes results from two models with tests for effect modificationthat were not included in the original analysis plan. The requests for these analyses weregenerated after the April 8th, 2005 presentation of preliminary results to group of PrincipalInvestigators and the study’s External Expert Consultants. One is a test for an interactioneffect between prenatal and postnatal exposure to ethylmercury from thimerosal-containingvaccines and immune globulins. This test was motivated by a theory that prenatal exposurecould exacerbate the effects of postnatal exposure. Details are provided in Section 9.2.4.
A second model is similar to the first except that the measure of prenatal exposure includesexposures to mercury from sources other than vaccines and immune globulins. The othersources include prenatal mercury exposures from consumption of fish, from mercury-containing contact lens and nasal spray solutions, from home products, and from dentalamalgams. Details are provided in Section 9.2.5.
8.4. Multiple TestingWe fit models to data for 42 outcome variables. The example model specified in Section 8.1produces three hypothesis tests. Multiplying the three hypothesis tests by the 42 outcomesresults in 126 hypothesis tests. A similar model to the one presented in the example, butwhere a test for the effect of cumulative exposure in the age range of birth to 7 monthsreplaces the two separate terms for birth to one month, and 1 to 7 months in the examplemodel, was fit to all 42 outcomes. Multiplying the two hypothesis from this model by the 42outcomes results in 84 additional tests. Furthermore, separate estimates were calculated forboys and girls, resulting in yet more tests. During the design phase, we tried to limit theproliferation of statistical tests by focusing on a few key research questions, and a few modelspecifications to answer those questions. However, the number of tests inevitably multiplied

Abt Associates Inc. Chapter 8 98
after the presentation of preliminary results motivated interest in additional analyses. Acrossall of the models that were fit to the 42 outcome variables, Section 9 reports results of morethan 2,500 hypothesis tests.
With such a large number of tests, we expect to see a large number of statistically significantresults that are due to chance alone. During the design phase we considered the use ofmethods, such as a Bonferonni adjustment to control for the overall type I error rate.However, the group of Principal Investigators and the study’s External Expert Consultantswere not in favor of such an adjustment. Their recommendations were to report theconventional levels of statistical significance with appropriate caveats in the written textregarding the number of tests that were performed.
8.5. Reporting Effect Sizes
In addition to reporting the parameter estimated and standard errors corresponding to theexposure variables from the linear and logistic regression models, we sought to presentmeasures that could be interpreted and compared as measures of effect size. In order tofacilitate comparisons of effect sizes from the current study to the methylmercury effectsreported from the Faroe Islands study, we followed the lead of Jacobson (2001) who hadconverted the raw regression coefficients reported by Grandjean et. al. (1997) intostandardized regression coefficients. The standardized regression coefficient is calculated bymultiplying the estimated regression coefficient from the model (the unstandardizedcoefficient) by the ratio of the standard deviation of X (the exposure variable) to the standarddeviation of Y (the outcome variable). This calculation is equivalent to standardizing allindependent and dependent variables in the model and fitting a model to the standardizedvariables12. The raw and standardized regression coefficients reported by Jacobson (2001) forthe Faroe Islands results are shown in Exhibit 8.5.1.
An odds ratio is a standardized measure of effect size. The parameter estimates for thelogistic regression models are easily converted to odds ratios by taking their exponent.However, this simple procedure produces the odds ratio of the outcome associated with aone-point increase in the exposure measure. Since a one-point increase in exposure does nothave any intuitive meaning, we converted the standardized result to be the odds ratioassociated with a two standard deviation increase in the exposure measure. We chose twostandard deviations of the exposure measure to roughly correspond to the difference betweenlow and high exposure.
12 A proof is provided by R. William at: http://www.nd.edu/~rwilliam/xsoc592/lectures/x92.pdf.

Abt Associates Inc. Chapter 8 99
Exhibit 8.5.1. Results Reported by Jacobson (2001) for Faroe Islands Data
Exposure SD Endpoint Endpoint S.D.Raw RegressionCoefficient
StandardizedRegressionCoefficient
Finger Tapping 6.15 -1.10 -0.07CPT Errors 0.54 0.12 0.08CPT ReactionTime
80.00 40.30 0.18
Digit Span 1.50 -0.27 -0.06Boston NamingTest: no cues
5.30 -1.77 -0.12
Boston NamingTest: cues
5.30 -1.91 -0.13
CVLT short-termrecall
3.10 -0.57 -0.06
0.375
CVLT long-termrecall
3.80 -0.55 -0.05

Abt Associates Inc. Chapter 9 100
9. Results
9.1. Descriptive StatisticsWe present two sets of descriptive statistics. The first set is provided in order to describe thecharacteristics of the study participants, the variation across the four HMOs from which thesample was drawn, and for some variables, comparisons to national population means. Thesecond set specifically describes the variables used in the analysis models. The former drawson information that illuminates information on who the study participants were, but includesvariables or forms of variables that were not part of the analytic models. For example, thefirst section presents the proportions of participants that were 7, 8, 9, and 10 years old at thetime of assessment. However, the analytic models did not utilize a categorical age variable.For the models, age was a continuous variable with values that ranged from 7.07 to 10.99.The continuous age variable is described in the second section.
9.1.1. Characteristics of the Analysis Sample
9.1.1.1. DemographicsThe sampling method was designed to obtain a sample with a wide distribution of exposuresfor the neonatal period (1-28 days), and early infancy (29-214 days). The method did notinclude explicit stratification on age of child, but included implicit stratification on age via asystematic sampling routine (see Section 5.5 for details). This method increases theprobability that children in all age ranges will be included in the sample. Exhibit 9.1.1.1shows the proportions of assessed children at each of the four HMOs that were 7, 8, 9, and 10year-old children. In the total sample, and at each of the four HMOs, roughly half of thestudy participants were boys, and roughly half were girls. The birth weights of almost threequarters of study participants were between 3 and 4 kilograms. Children with birth weightsthat were below 2.5 kilograms were excluded from the study.
The maternal IQ score was a population-normalized measure with a mean of 100 and astandard deviation of 15. Approximately 16 percent of the national population has IQ scoresbelow 85 (one standard deviation below the mean), and approximately 16 percent has IQscores above 115 (one standard deviation above the mean). Exhibit 9.1.1.1 shows that thedistribution of IQ scores in the total sample was slightly skewed towards higher scores thanthe national population. Cumulative exposures from birth to seven months varied acrossmaternal IQ levels (p<0.001). Higher maternal IQ was associated with higher exposurelevels.
The mothers of participants also appeared to have higher educational attainment, on average,than the national population. Nationally, in 2003, around 87 percent of women between theages of 25 and 40 had a high school degree or above, 57 percent had some college or more,and roughly 30 percent had bachelor’s degrees (Stoops, 2004). In the total sample, about 96percent had a high school degree or above, 79 percent had some college or more, andalthough not directly comparable to the national numbers, about one half of the mothers ofparticipants reported having associate’s degrees or above. Higher maternal education levelwas associated with higher cumulative exposures from birth to seven months (p<0.001).

Abt Associates Inc. Chapter 9 101
An eligibility criterion for the study was that children must live with their biological mothersat least four days per week. In the total sample, 19 percent of focus children lived in singleparent households, i.e., lived with their mother but not with their father. Living in singleparent household was associated with lower exposure levels (p<0.01). Seven percent of thefocus children were born to mothers who were 40 years or older at the time of birth of thechild, and 63 percent lived in household where English was the only language spoken. Oldermaternal age and English language households were associated with higher exposure levels(p=0.05, and p<0.001, respectively).
Exhibit 9.1.1.1 Descriptive Statistics for Demographic MeasuresBy Cumulative Exposures Birth to 7 Months
FullSample
0 -62.5 g
75 –137.5 g
150.0 –187.5 g
n=1047 n=93 n=691 n=263
Demographics Percent Percent Percent Percent P-valueb
Child Age(Years): 7 17 18 16 17 0.33
8 23 26 23 229 28 35 28 28
10 32 20 33 33Sex: Male 49 54 48 48 0.57Birth weight: 2500-2999 grams 11 11 10 15 0.34
3000-3999 grams 73 75 75 694000+ grams 15 14 15 16
Maternal IQ: <85 10 12 12 5 <0.00185 – 115 73 73 75 66>115 17 15 13 29
Maternal No High School degree 4 3 5 2 <0.001Education: High School /GEDa 16 16 18 10
Some College 28 38 29 24College degree 51 43 48 65
Child lives in a single parent household 19 29 21 13 0.008Maternal Age 16-39 years 93 91 94 89 0.050(at Child’s Birth): >=40 years 7 9 6 10Only English spoken at home 63 63 58 75 <0.001
Sample size = 1,047 assessed children.a GED is a certificate given for the completion of the Tests of General Educational Development, a series of five tests.It is the equivalent of a high school diploma.b P-value is from chi-square test of independence between the demographic characteristic and the three levels of cumulativeexposure.
Read Table: Seventeen percent of children were 7 years-old at the time of assessment. Eighteen percentof low exposure children (0 - 62.5 g ) were 7 years-old at the time of assessment.

Abt Associates Inc. Chapter 9 102
9.1.1.2. OutcomesExhibit 9.1.1.2 provides a basis for comparison between the study sample and the nationalpopulation of children of the same age on assessment results. The results indicate that formost of the measures that have national norms, the sample of study participants scoredhigher, on average, than the national population. For example, the WASI measures of generalintellectual functioning are standardized such that the national population mean and standarddeviation are 100 and 15, respectively. The last columns in the exhibit show the means forthe full sample, i.e. children from all four HMOs. The means for the three measures rangefrom around 105 to 107. Thus this sample of children scored 5 to 7 points, or roughly a thirdof a standard deviation unit, higher than the national average on these measures. Thevariation among the scores of children in the sample was similar to the variation in test scoresthat would be obtained from a national sample. That is, the standard deviations of themeasures are close to the standard deviations expected from a national sample.
For most of the speech and language measures the sample means were roughly a tenth to ahalf a standard deviation unit higher than the national population means. On three of the fourparent ratings of behavior regulation and attention/executive functioning, the sample childrenhad slightly higher scores than the national population. On these measures higher scoresindicate the presence of a greater number of undesirable behaviors or symptoms. On onemeasure their average scores were slightly lower.
The exhibit also shows the variation of means among HMOs. Children from HMOs C and Dtended to have higher average scores on general intellectual functioning, achievement,language, and memory measures than children assessed at HMOs A and B.

Abt Associates Inc. Chapter 9 103
Exhibit 9.1.1.2Means and Standard Deviations on Normed Tests for Sample
By HMOHMO
HMO-A HMO-B HMO-C HMO-D Total(n = 1047)
Tests with Standardized Score for National Norming Sample: Mean = 100; Standard Deviation = 15Measurea x s.d. x s.d. x s.d. x s.d. x s.d.General Intellectual FunctioningWASI Full Scale IQ 106.3 14.3 104.4 13.3 111.7 15.0 116.1 15.3 107.4 14.6WASI Performance IQ 105.7 15.1 101.7 14.3 108.2 15.2 110.9 17.1 105.1 15.3WASI Verbal IQ 106.7 14.3 103.6 13.3 111.5 14.5 114.9 16.2 107.1 14.6
AchievementWJR Letter-Word 108.1 11.2 105.8 11.1 106.4 13.0 110.4 11.5 107.0 11.7Measures with Standardized T-Scores: Mean = 50 and Standard Deviation = 10Memory for Words x s.d. x s.d. x s.d. x s.d. x s.d.CVLT: Free Recall, No Del. 53.9 9.7 53.5 10.2 54.4 9.9 56.5 9.3 54.0 9.9
Parent Ratings of Behavior RegulationConnors Inattention 51.7 10.4 52.4 10.6 52.3 10.0 51.7 11.6 52.1 10.5Connors Hyperactivity 53.7 10.6 54.9 11.4 53.7 10.0 52.9 11.5 54.1 10.9
Parent Ratings of Attention/Executive FunctioningBRIEF Meta-cognition 51.0 10.7 51.6 11.6 51.4 10.8 49.0 12.6 51.2 11.2BRIEF Behavioral Control 48.7 10.2 49.7 10.7 49.4 10.3 47.2 11.2 49.1 10.5Tests with Standardized Score for National Norming Sample: Mean = 10; Standard Deviation = 3Language Use x s.d. x s.d. x s.d. x s.d. x s.d.NEPSY Speeded Naming 10.2 2.7 10.0 2.7 10.9 2.7 11.2 2.7 10.4 2.7NEPSY Compren of Instr 10.9 2.7 10.2 2.9 11.6 2.6 11.9 2.5 10.9 2.8CELF-3 Formulated Sent 11.0 2.6 10.6 2.6 11.6 2.9 11.6 2.7 11.0 2.7Memory for Connected TextCMS Short-term Memory 10.7 3.0 10.6 3.0 11.5 2.9 12.3 2.8 10.9 3.0CMS Long term Memory 11.0 3.0 10.7 3.0 11.5 3.0 12.4 2.9 11.1 3.0Tests with Standardized Score for National Norming Sample: Mean = 0; Standard Deviation = 1Verbal Memory x s.d. x s.d. x s.d. x s.d. x s.d.CVLT Free ST 0.4 1.0 0.5 1.0 0.4 0.9 0.5 1.0 0.4 0.9CVLT Cued Free ST 0.5 1.0 0.5 1.0 0.6 1.0 0.7 1.0 0.5 1.0CVLT Free LT 0.5 0.9 0.5 0.9 0.6 0.9 0.6 0.9 0.5 0.9CVLT Cued Free LT 0.4 0.9 0.5 0.9 0.6 0.9 0.7 0.9 0.5 0.9

Abt Associates Inc. Chapter 9 104
9.1.1.3. Exposures
The postnatal exposure measures used in the analytical models were calculated asmicrograms of ethylmercury divided by weight of the child (in kilograms) at the time ofreceipt of the vaccine or immune globulin, and summed over the relevant time period (i.e., 0-28days, 29-214 days, or 0-214 days). Those measures are described in the Section 9.2. In thecurrent section we describe postnatal exposures without the division by child’s weight. Theselatter measures are useful for descriptive purposes because they are easier to relate to themercury amounts contained in individual vaccines. A single dose of most childhood vaccinesin use during the mid to late 1990s contained 0, 12.5, or 25 micrograms of ethylmercury.Thus, an exposure amount equal to, for example, 37.5 micrograms, implies receipt of eitherthree vaccines that each contained 12.5 micrograms of mercury, or receipt of two vaccines,one containing 12.5 micrograms, the other containing 25 microgram of ethylmercury.
The leftmost panel of Exhibit 9.1.1.3 shows the frequency distribution of cumulativeexposure during the age range from birth to 7 months. It shows, for example, that 16 of thestudy children had zero micrograms of exposure during this age range. The middle panel ofthe exhibit shows neonatal exposures (1-28 days) crossed with cumulative exposure duringthe age range from one to seven months (29-214 days). It shows, for example, that threechildren had a birth dose of HepB (12.5 g during the age range 0-28 days), but had zeroexposure during the age range spanning 29-214 days. The column totals of the middle panelshow that 312 of the study participants did not receive a hepatitis-b vaccination (HepB) atbirth (or within the first 28 days of life). The 718 study participants that had 12.5 microgramsof mercury exposure within the first 28 days had received a single HepB at birth or soonafter. The 10 subjects that had 25 micrograms of neonatal exposure had received a HepB atbirth, or within one day of birth, and had received a second dose around age 27 or 28 days.The second dose was an early administration of HepB that typically would have beenreceived after turning one or two months of age. The seven children that had 37.5micrograms of neonatal exposure had received a hepatitis-b immune globulin and a hepatitis-B vaccine at birth, or within a day or two of birth.
Exhibit 9.1.1.4 is a graphical depiction of the postnatal exposure distributions that shows thatthere was considerable variation in cumulative exposures for the age ranges spanning 29-214days, both for children who received a birth dose of hepatitis-b vaccine and for those who didnot. Exhibit 9.1.1.5 shows the variation in frequency distributions across the four HMOs.
In 1999, children that were vaccinated on time and according to the recommended childhoodimmunization schedule13 may have been exposed to 187.5 micrograms of ethylmercury fromthimerosal during the age range spanning birth and seven months. This amount could havebeen achieved if the child received HepB vaccinations (12.5 g ) at birth, between the agesof 1 and 4 months, and at age 6 months, and received DTaP and Hib vaccinations (each withas much 25 g of ethylmercury per dose) at ages 2, 4, and 6 months.
13 The vaccine schedule recommended and approved by the Advisory Committee on Immunization Practices(ACIP), the American Academy of Pediatrics (AAP), and the American Academy of Family Physicians(AAFP).

Abt Associates Inc. Chapter 9 105
There are several possible sources of variation among children in exposure amounts. The firstis variation in vaccination policies among health care providers. For example, at somehospitals, HepB vaccinations were given to new-borns as a matter of policy, others did nothave that policy. And some health care providers typically did not administer a Hib vaccineat age 6 months. Another source of variation is the mercury amounts contained within onedose of a vaccine. For example, depending on the manufacturer, Hib vaccines in use at thattime contained 0, 12.5, or 25 g of ethylmercury per dose. Another source of variation wasthe use of combined DTaP-Hib vaccines. The combined vaccine contained 25 g ofethylmercury per dose. Receipt of separate DTaP and Hib vaccines at one visit could resultexposure to 50 g of ethylmercury. And finally, there was variation in exposure due todelayed or skipped vaccinations. Recommended vaccines were skipped or delayed due topersonal circumstances, beliefs, and preferences. A total of 16 study participants were notvaccinated at all during the age range spanning birth to 7 months.
Exhibit 9.1.1.6 shows a schematic of the pattern of receipts that would result in 187.5micrograms of cumulative exposure to ethylmercury. The exhibit also shows the modal (mostfrequently occurring) pattern of receipts of thimerosal-containing vaccines during the agerange from birth to 7 months at each HMO. See Section 7.2 for additional information onvaccine types and exposure amounts.
One hundred eleven (11 percent) of the 1,047 study participants had prenatal exposure toethylmercury from thimerosal-containing vaccines or immune globulins administered to theirmothers during pregnancy. See Section 7.2 for additional details.
Exhibit 9.1.1.7 shows the intercorrelation among the variables measuring amounts ofcumulative exposure in each age range. It shows that there are weak positive correlationsbetween prenatal exposure and postnatal receipts of thimerosal-containing vaccines andimmune globulins. Children that were exposed at birth (within the first 28 days) were slightlymore likely to have higher exposure during the age range from 29 days to 7 months, asindicated by the weak positive correlation among the Amt01mos and Amt17mos variables.Since the Amt07mos variable is equal to the sum of the Amt01mos and Amt17mos variables, itis positively correlated to both.

Abt Associates Inc. Chapter 9 106
Exhibit 9.1.1.3Descriptive Statistics for Exposure Amounts
Cumulative ExposureBirth to 7 Months
Cumulative Exposure Birth to 1 Month Crossed withCumulative Exposure 1 to 7 Months
Birth to 1 Month (0-28 Days)
Birth to 7Months
(1-214 Days)Total 1 to 7 Months
(29-214 Days)0 g 12.5 g 25 g 37.5 g Total
0 g 16 0 g 16 3 0 0 1912.5 g 3 12.5 g 0 0 0 0 025 g 2 25 g 2 2 1 0 537.5 g 12 37.5 g 10 24 0 0 3450 g 37 50 g 12 14 1 0 27
62.5 g 23 62.5 g 9 89 0 0 9875 g 146 75 g 56 20 1 0 77
87.5 g 27 87.5 g 7 69 1 0 77100 g 116 100 g 46 121 1 2 170
112.5 g 164 112.5 g 42 70 0 2 114125 g 115 125 g 44 105 0 3 152
137.5 g 123 137.5 g 16 35 0 0 51150 g 52 150 g 15 7 5 0 27
162.5 g 19 162.5 g 9 103 0 0 112175 g 130 175 g 22 56 0 0 78
187.5 g 62 187.5 g 6 0 0 0 6Total 1047 Total 312 718 10 7 1047
g = micrograms of ethylmercury from thimerosal in vaccines or immune globulinsRead table: Sixteen of the 1,047 study participants were exposed to 0 g in the age range from birth to one month, and
0 g in the age range spanning one to seven months.

Abt Associates Inc. Chapter 9 107
Exhibit 9.1.1.4.Frequency Distribution of Neonatal Exposure by Exposures 1-7 Months
Frequency Counts of Cumulative Exposure for Age Range of 1 to 7 Months Crossed withExposure from Birth Dose of Hepatitis-B Vaccine
050
100
150
200
Fre
quen
cy
28 31
21
105
63
92 89
196
60
144
25
116
28
56
No HepB at BirthReceived HepB at Birth
0- 37.550.0- 62.5
75.0- 87.5
100.0-112.5
125.0-137.5
150.0-162.5
175.0-187.5
Cumulative Exposure Ages 1 to 7 Months
Read: “The study included 28 children who did not received a hepatitis-B vaccination in first month of life, and whosecumulative exposure to ethylmercury from vaccines during the age range from one to seven months was in the range of 0 to37.5 micrograms.”
Exhibit 9.1.1.5Size of Analysis Sample from Each HMO by Exposure Category
HMO-A HMO-B HMO-C HMO-D Total
VSD Exposures HepB at Birth HepB atBirth
HepB atBirth
HepB atBirth
HepB atBirth
Cumulative 1-7Months No Yes No Yes No Yes No Yes No Yes
(0 to 62.5 g ) 26 49 11 69 10 10 2 6 49 134(75.0 to 87.5 g ) 47 51 15 38 0 2 1 0 63 91(100.0 to 112.5 g ) 44 55 40 94 3 36 1 11 88 196(125.0 to 137.5 g ) 25 20 28 113 6 7 1 3 60 143(150.0 to 162.5 g ) 7 7 2 3 8 74 7 31 24 115(175.0 to 187.5 g ) 9 0 0 0 16 40 3 16 28 56
Total 158 182 96 317 43 169 15 67 312 735340 413 212 82 1047
Note: g = micrograms.

Abt Associates Inc. Chapter 9 108
Exhibit 9.1.1.6.Pattern of Receipts of Thimerosal-containing Vaccines Resulting in
Maximum Cumulative Exposure Birth to 7 Monthsand
Modal Patterns of Receipts at Each HMOPattern Resulting in
MaximumCumulative Modal Patterns at each HMO
Age Vaccine Exposure HMO-A HMO-B HMO-C HMO-DBirth HepB 12.5 12.5 12.5 12.5 12.51-4 months HepB 12.5 12.5 12.5 12.5 12.56-7 months HepB 12.5 12.5 12.5 . .2 months DTaP 25 . 25 25 252 months Hib 25 . 12.5 25 252months DtaP-Hib . 25 . . .4 months DtaP 25 . 25 25 254 months Hib 25 . 12.5 25 254 months DtaP-Hib . 25 . . .6 months DtaP 25 . 25 25 256 months Hib 25 . . 25 256 months DtaP-Hib . 25 . . .Cumulative Exposure Birth to 7 months: 187.5 112.5 137.5 175 175
Note: Ball et al (2001) estimated that a thimerosal-containing influenza vaccine that would have been recommended forchildren in selected populations could have been added to the maximum pattern shown above, resulting in 200 microgramsof cumulative exposure. In the current study, while there were four children that received the influenza vaccine before ageseven months, none of these children had received all of the vaccinations in the pattern resulting in maximum exposure,depicted above. It is also conceptually possible for a child to have received more than 187.5 micrograms of cumulativeexposure in the first seven months if the child had received a hepatitis-b immune globulin, in addition to all the vaccinesdepicted in the maximum pattern. That scenario, however, did not occur in the sample of children analyzed in the currentstudy.
Exhibit 9.1.1.7. Correlation Among Exposure Amount VariablesPreNatThimer Amt01mos Amt17mos
PreNatThimerCumulative g : Prenatal
1
Amount 0-1 mosCumulative g : birth-28 days
0.05(0.137)
1
Amt17mosCumulative g : 29-214 days
0.09(0.003)
0.09(0.003)
1
Amt07mosCumulative g : birth-214 days
0.10(0.002)
0.24(<0.001)
0.99(<0.001)
Pearson Correlation Coefficients, N = 1047

Abt Associates Inc. Chapter 9 109
9.1.2. Descriptive Statistics on Variables Used in AnalysisModels
The means, standard deviations, minimums and maximums of the variables used in theanalytical models are displayed in Exhibits 9.1.2.1 - 9.1.2.3. The correlations among theexposure variables that were used in the analytical models are shown in Exhibit 9.1.2.4, andthe correlation among outcome variables is shown in Exhibit 9.1.2.5.
Exhibit 9.1.2.1. Descriptive Statistics on Outcome MeasuresTest Form of Score N Miss. Mean Std Min MaxSpeech and LanguageBoston Naming Test Raw score 1045 2 39.55 7.97 14 58NEPSY: Speeded Naming Raw score 1040 7 27.39 8.12 1 42NEPSY: Comprehension of Instructions Raw score 1034 13 23.58 2.82 12 28CELF: Formulated Sentences Raw score 1038 9 32.76 6.7 0 44CELF: Recalling Sentences Raw score 1044 3 44.59 14.32 5 78GFTA: Articulation (lower = better) Raw score 1025 22 1.57 1.88 0 18Stuttering: Assessor Rating (lower = better) 0=None/very mild; 1=mild/severe 1043 4 0.03 0.18 0 1Stuttering: Parent Rating (lower = better) 0=None/very mild; 1=mild/severe 1035 12 0.02 0.15 0 1Stuttering: Teacher Rating (lower = better) 0=None/very mild; 1=mild/severe 728 319 0.09 0.29 0 1Verbal MemoryCVLT-C: Free Recall, No Delay Raw score 1046 1 46.51 9.69 0 71CVLT-C: Free Recall, Short Delay Raw score 1047 0 9.73 2.72 0 15CVLT-C: Cued Recall, Short Delay Raw score 1045 2 10.3 2.4 1 15CVLT-C: Free Recall, Long Delay Raw score 1044 3 10.38 2.53 0 15CVLT-C: Cued Recall, Long Delay Raw score 1043 4 10.65 2.46 1 15CMS Stories 1: Immediate Recall Raw score 1038 9 47.36 15.5 0 77CMS Stories 2: Delayed Recall Raw score 1037 10 44.49 15.09 0 76AchievementWJIII: Letter- Word Identification Raw score 1043 4 50.9 9.38 16 73Fine Motor CoordinatioinGrooved Pegboard: Dominant Hand (lower = Time to completion (minutes) 1045 2 65.88 27.54 21 300Grooved Pegboard: Non-dom Hand (lower = better) Time to completion (minutes) 1039 8 73.69 31.72 20 300Finger Tapping: Dominant Hand Number of taps 1037 10 38.81 6.8 15.6 107Finger Tapping: Non-dominant Hand Number of taps 1034 13 34.47 6.25 15 86Visual Spatial AbilityStanford Binet: Copying Raw score 1038 9 18.2 3 3 28Attention/Executive FunctioningGDS Vigilance Task: Correct Responses Raw score (# correct) 1042 5 40.47 5.13 0 45GDS Vigilance Task: Errors (lower = better) Raw score (# errors) 1042 5 7.55 13.31 0 162WISC III: Digit Span, Forward Recall Raw score 1045 2 8.06 1.88 3 15WISC III: Digit Span, Backward Recall Raw score 1046 1 4.53 1.64 0 13WISC III: Digit Span, Combined Raw score 1045 2 12.58 2.94 4 26BRIEF Parent Rating: Metacognition (lower = Raw score 1042 5 74.28 18.1 44 128BRIEF Teacher Rating: Metacognition (lower = Raw score 782 265 67.31 22.5 44 129Behavior Regulation (lower = better)CRS-R: Parent Rating: Hyperactive/Impulsive Raw score (# reported problems) 1041 6 5.42 5.1 0 25CRS-R: Teacher Rating: Hyperactive/Impulsive Raw score (# reported problems) 777 270 3.94 5.75 0 27CRS-R: Parent Rating: Inattentive Raw score (# reported problems) 1041 6 6.3 5.94 0 26CRS-R: Teacher Rating: Inattentive Raw score (# reported problems) 777 270 6.68 7.33 0 28BRIEF Parent Rating: Behavior Regulation Raw score (# reported problems) 1042 5 42.28 10.79 26 82BRIEF Teacher Rating: Behavior Regulation Raw score (# reported problems) 782 265 38.79 12 29 87Tics (lower = better)Motor tics (current): Assessor Rating 0=None; 1=Any 1044 3 0.09 0.28 0 1Phonics tics (current): Assessor Rating 0=None; 1=Any 1044 3 0.07 0.26 0 1Motor tics (current): Parent Rating 0=None; 1=Any 1035 12 0.09 0.29 0 1Phonics tics (current): Parent Rating 0=None; 1=Any 1037 10 0.1 0.3 0 1

Abt Associates Inc. Chapter 9 110
Exhibit 9.1.2.1. Descriptive Statistics on Outcome MeasuresTest Form of Score N Miss. Mean Std Min MaxGeneral Intellectual FunctioningWASI Verbal IQ Standardized score 1032 15 107.39 14.6 62 153WASI Performance IQ Standardized score 1038 9 105.06 15.27 67 147WASI Full Scale IQ Standardized score 1025 22 107.1 14.56 71 153
Exhibit 9.1.2.2 Descriptive Statistics on Exposure VariablesVariable Description N Miss. Mean Std. Min. Max.Variables Used in Primary ModelsPreNatThimer Total prenatal mercury from thimerosal 1047 0 2.2 8.3 0 100Exp07mos Amt/Wt(KGs) birth-214 days 1047 0 19.8 7.1 0 38.3HepB Amt/Wt(KGs) birth-28 days 1047 0 2.6 1.8 0 12.7Exp17mos Amt/Wt(KGs) 29-214 days 1047 0 17.2 6.6 0 33.8Variables Used in Models to Assess Influence of High Leverage Observations on ResultsPreNatThimer_Alt Alternative Tot prenat (for sensitivity analysis) 1047 0 5.2 16.7 0 100PN_Trunc if PreNatThimer>25 then PN_Trunc=25 1047 0 1.8 5.6 0 25HepBYN 1 if any HepB, 0 else 1047 0 0.7 0.5 0 1Variable Used in Model for Multiple Sources of Prenatal Mercury ExposurePreNatAllMerc Prenatal mercury from any source 1047 0 1.8 0.9 0 5Variables Used in Concurrent Antibiotics-by-Exposure Interaction ModelsAbDays # days child on antibiotics in period 1-214 days 1047 0 8.7 17.7 0 214AbDays1_28 # days child on antibiotics in period 1-28 days 1047 0 0.4 2.1 0 28AbDays29_214 # days child on antibiotics in period 29-214 days 1047 0 8.2 17 0 186AbExp07mos Exposure concurrent w/ antibiotics (ages 1-214 days) 1047 0 2.3 4.3 0 32.9AbHepB Exposure concurrent w/ antibiotics (ages 1-28 days) 1047 0 0.1 0.6 0 4.3AbExp17mos Exposure concurrent w/ antibiotics (ages 29-214 days) 1047 0 2.2 4.2 0 32.9

Abt Associates Inc. Chapter 9 111
Exhibit 9.1.2.3. Descriptive Statistics on CovariatesVariable Label N Impa Mean Std Min MaxVariables Included in Every ModelChildAge Child Age (Yrs) at assessment 1047 0 9.28 1.08 7.07 11sexmale Sex of child 0=female, 1=male 1047 0 0.49 0.50 0 1Birth weight Birth weight 2500-2999 grams 1047 0 0.11 0.32 0 1
Birth weight 3000-3999 grams 1047 0 0.73 0.44 0 1Birth weight 4000+ grams 1047 0 0.15 0.36 0 1
Maternal IQ Maternal IQ: Lower third of Distbn 1047 0 0.34 0.48 0 1Maternal IQ: Midd. third of Distbn 1047 0 0.30 0.46 0 1Maternal IQ: Upper third of Distbn 1047 23 0.35 0.48 0 1
HOME_TotalIndex “HOME” Total Index 1047 0 11.98 1.95 3 16PctPoverty1 (Percent of poverty line)/100 1047 15 4.12 2.60 0.2 22.7Maternal Education Mother EduH: No HS degree 1047 0 0.04 0.21 0 1
Mother EduH: HS /GED 1047 0 0.16 0.36 0 1Mother EduH: Some College 1047 0 0.28 0.45 0 1Mother EduH: College degree 1047 0 0.51 0.50 0 1
SingleParent Child lives in a single parent household(0/1) 1047 0 0.19 0.40 0 1Site =1 if HMO-A 1047 0 0.32 0.47 0 1
=1 if HMO-B 1047 0 0.39 0.49 0 1=1 if HMO-C 1047 0 0.20 0.40 0 1=1 if HMO-D 1047 0 0.08 0.27 0 1
Child and Family CharacteristicsComputer Experience Computer Experience = None 1047 1 0.01 0.10 0 1
Computer Experience = Some 1047 1 0.41 0.49 0 1Computer Experience = Much 1047 1 0.58 0.49 0 1
Maternal Age Maternal Age at Ch Birth: <=16 years 1047 0 0.00 0.05 0 1Maternal Age at Ch Birth: 17-39 years 1047 0 0.93 0.26 0 1Maternal Age at Ch Birth: >=40 years 1047 0 0.07 0.26 0 1
OlderSibs Child has an older sibling (0/1) 1047 0 0.64 0.48 0 1YoungerSibs Child has a younger sibling (0/1) 1047 0 0.41 0.49 0 1DayCareCentr # of center-based day care settings prior to KG 1047 4 0.81 1.02 0 9DayCareHome # of home-based day care settings prior to KG 1047 4 1.48 1.44 0 14EngOnly English only at home 1047 0 0.63 0.48 0 1Breast Feeding Breast Fed: <1mo 1047 0 0.22 0.41 0 1(Duration) Breast Fed: 1-6mos 1047 0 0.37 0.48 0 1
Breast Fed: 6+ mos 1047 0 0.42 0.49 0 1Child Birth ConditionscMedicalHist_1 =1 if birth headCM +/- 2SD from Mean 1047 0 0.02 0.15 0 1C5APGARImpVal1 5-minute apgar 1047 75 8.93 0.49 4 10Prenatal Exposures (non-vaccine related)PreNatNicotine_1 Used tobacco during pregnancy 1047 2 0.08 0.26 0 1PreNatAlcohol_1 0=never - 4 heavy 1047 4 0.09 0.37 0 4Tuna Consumption Prenatal Tuna: None 1047 55 0.31 0.46 0 1
Prenatal Tuna: Moderate 1047 55 0.65 0.48 0 1Prenatal Tuna: High 1047 55 0.04 0.20 0 1
PreNatFish_1 1=Tuna, Ocean and Home Caught 1047 47 0.07 0.25 0 1

Abt Associates Inc. Chapter 9 112
Exhibit 9.1.2.3. Descriptive Statistics on CovariatesVariable Label N Impa Mean Std Min MaxPreNatOrgMerc_1 # Merc containing contact lens, ear, eye, nasal 1047 34 0.11 0.46 0 4PreNatHomePro_1 # Merc exp from therm, bulbs, switches etc. 1047 40 0.04 0.19 0 1Tooth Amalgams Amalgams: None 1047 39 0.19 0.39 0 1PreNatFillings_1_L1 Amalgams: yes 1047 39 0.11 0.31 0 1PreNatFillings_1_L2 Amalgams: yes & work, grind, or gum 1047 39 0.71 0.46 0 1PreNatlead_1 Prenat lead from occup or residential 1047 8 0.15 0.36 0 1PreNatIllDrug 1=Cocaine or Narcotic 1047 0 0.01 0.10 0 1Child Medical ConditionsIronDef_1 Anemia or iron deficiency 1047 0 0.02 0.15 0 1ADHDstimulant ADHD stim in 12 hrs prior to assessment 1047 0 0.00 0.04 0 1ChdPICA_1 Child Pica 1047 10 0.04 0.20 0 1Maternal DiagnosesMatLangDel Maternal Language Delay 1047 0 0.00 0.07 0 1MatSpeechDel Maternal speech delay 1047 0 0.01 0.10 0 1MatSTUTTER Maternal stuttering 1047 0 0.01 0.11 0 1MatADHD Maternal ADHD 1047 0 0.01 0.11 0 1MatTIC Maternal tics 1047 0 0.00 0.00 0 0Quadratic and Cubic FormsChildAge2 ChildAge2 (squared) 1047 0 87.31 19.87 50.01 120.95ChildAge3 ChildAge3 (cubed) 1047 0 831.84 276.88 353.67 1330.25PctPoverty1_2 (PctPoverty1/100)**2 (squared) 1047 15 23.75 42.27 0.04 515.12PctPoverty1_3 (PctPoverty1/100)**3 (cubed) 1047 15 198.26 768.15 0.01 11691.4HOME_TotalIndex2 HOME_TotalIndex**2 (squared) 1047 0 147.35 44.69 9 256HOME_TotalIndex3 HOME_TotalIndex**3 (cubed) 1047 0 1851.88 800.69 27 4096Variables Used Only in Models for Finger Tapping Outcomesb
Spline9 =1 if ChildAge > 9.0; =0 Else 1047 0 0.60 0.49 0 1ChildAge_Spline9 Childage * Spline9 1047 0 6.04 4.93 0 11ChildAge2_Spline9 Childage2 * Spline9 1047 0 60.82 50.25 0 120.95
a Numbers listed in “Imp” column show the number of missing values that were replaced with imputed values.b Finger tapping tests for children aged 9 and above were slightly different than tests for younger children. Spline term allows forseparate intercepts for children above and below 9 years. Spline*ChildAge and Spline*ChildAge2 terms allow for differentage slopes for children above and below 9 years.

Abt Associates Inc. Chapter 9 113
Exhibit 9.1.2.4. Correlation Among Exposure VariablesPreNatThimer HepB Exp17mos
PreNatThimerTotal prenat merc from thimerosal
1
HepBAmt/Wt(KGs) birth-28 days
0.04(0.204)
1
Exp17mosAmt/Wt(KGs) 29-214 days
0.08(0.012)
0.13(<0.001) 1
Exp07mosAmt/Wt(KGs) birth-214 days
0.08(0.007)
0.38(<0.001)
0.97(<0.001)
Pearson Correlation Coefficients, N = 1047

Abt Associates Inc. Chapter 9 114
Exhibit 9.1.2.5. Correlation Among Outcome Measures
Bos
ton
Nam
NE
PS
Y:S
P
NE
PS
Y:C
.I.
CE
LF:F
.S.
CE
LF:R
.S.
GF
TA
Stu
tter
-A
Stu
tter
-P
Stu
tter
-T
CV
LT:F
ND
CV
LT:F
SD
CV
:T”
CS
D
CV
LT:F
LD
CV
LT:C
LD
CM
S-1
C<S
-2
WJ
-LW
ID
Peg
-Dom
Peg
-ND
Tap
-D
om
Tap
-N
D
SB
Cop
y
GD
S-C
orr
GD
S-E
rr
Dig
it-F
Dig
it-B
Dig
it-
C
Met
a-P
Met
a-T
Hyp
er-
P
Hyp
er-T
Inat
t-P
Inat
t-T
Beh
avio
r-P
Beh
avio
r-T
Mot
orTi
cs-A
Mot
orTi
csP
Pho
nT
ics-
A
Pho
nT
ics-
P
Ver
balI
Q
Per
fIQ
Ful
lIQ
Speech and LanguageBoston Naming Test 1 .52 .58 .61 .65 -.31 -.04 -.09 -.02 .42 .34 .39 .35 .37 .6 .62 .64 .14 .15 .29 .28 .29 .32 -.22 .35 .34 .41 -.08 -.14 -.11 -.08 -.09 -.14 -.08 -.11 -.02 -.08 .00 -.1 .66 .48 .65NEPSY: Speeded
Naming .52 1 .51 .48 .51 -.24 -.06 -.06 -.07 .49 .45 .47 .46 .46 .45 .46 .6 .11 .13 .3 .26 .31 .35 -.32 .31 .39 .42 -.28 -.34 -.22 -.19 -.29 -.31 -.2 -.24 -.04 -.06 .00 -.06 .41 .37 .44
NEPSY:Comprehension of
Instructions.58 .51 1 .52 .63 -.18 -.08 -.08 -.05 .41 .31 .35 .35 .37 .49 .48 .5 .07 .08 .18 .17 .22 .32 -.26 .39 .4 .47 -.15 -.25 -.15 -.08 -.18 -.24 -.14 -.14 -.06 -.03 -.06 -.1 .52 .48 .57
CELF: FormulatedSentences .61 .48 .52 1 .63 -.26 -.11 -.06 -.04 .4 .31 .33 .31 .32 .53 .54 .6 .17 .18 .3 .28 .26 .34 -.28 .31 .34 .39 -.12 -.18 -.13 -.09 -.14 -.16 -.15 -.14 -.07 -.11 .01 -.11 .52 .35 .5
CELF: RecallingSentences .65 .51 .63 .63 1 -.21 -.03 -.04 -.05 .44 .3 .33 .32 .32 .56 .56 .57 .17 .18 .22 .24 .28 .3 -.25 .57 .42 .6 -.14 -.21 -.14 -.11 -.14 -.19 -.12 -.16 -.08 -.05 -.05 -.13 .6 .4 .57
GFTA: Articulation(lower = better) -.31 -.24 -.18 -.26 -.21 1 -.03 .02 .12 -.18 -.14 -.19 -.16 -.16 -.24 -.23 -.24 -.1 -.08 -.1 -.12 -.14 -.16 .14 -.11 -.09 -.12 -.04 .03 -.01 .07 -.03 .04 .01 .05 .03 -.02 -.05 .04 -.19 -.13 -.18
Stuttering: AssessorRating (lower = better) -.04 -.06 -.08 -.11 -.03 -.03 1 .09 .14 -.03 -.02 -.03 -.07 -.04 -.04 -.05 -.09 .03 .03 .02 .03 -.01 -.08 .15 -.01 .01 .00 .04 .09 .02 .02 .00 .09 .06 .1 .24 .24 .00 .04 -.08 -.04 -.07
Stuttering: ParentRating (lower = better) -.09 -.06 -.08 -.06 -.04 .02 .09 1 .17 -.04 -.02 -.02 -.02 -.05 -.05 -.04 -.06 .11 .11 -.04 .00 -.14 -.07 .17 -.01 -.07 -.05 .08 .1 .03 .02 .06 .12 .03 .05 .04 .05 .13 .11 -.13 -.1 -.13
Stuttering: TeacherRating (lower = better) -.02 -.07 -.05 -.04 -.05 .12 .14 .17 1 -.06 -.05 -.04 -.08 -.05 -.04 -.02 -.01 .05 .13 -.01 -.04 -.1 -.05 .07 -.04 -.02 -.04 .07 .14 .00 .1 .07 .14 .06 .18 .09 .07 .02 .08 -.02 -.05 -.04
Verbal MemoryCVLT-C: Free Recall,
No Delay .42 .49 .41 .4 .44 -.18 -.03 -.04 -.06 1 .67 .7 .69 .68 .46 .46 .46 .14 .17 .18 .18 .23 .31 -.25 .23 .29 .31 -.17 -.21 -.16 -.14 -.16 -.2 -.16 -.19 -.03 .01 -.01 -.07 .3 .25 .32
CVLT-C: Free Recall,Short Delay .34 .45 .31 .31 .3 -.14 -.02 -.02 -.05 .67 1 .74 .8 .74 .41 .42 .41 .14 .16 .16 .16 .23 .25 -.27 .14 .28 .24 -.18 -.22 -.16 -.16 -.18 -.21 -.15 -.18 -.03 -.04 .00 -.02 .24 .21 .25
CVLT-C: Cued Recall,Short Delay .39 .47 .35 .33 .33 -.19 -.03 -.02 -.04 .7 .74 1 .79 .87 .43 .44 .42 .13 .15 .15 .17 .29 .25 -.25 .13 .26 .23 -.15 -.21 -.13 -.12 -.17 -.2 -.12 -.16 -.01 .00 -.01 -.04 .28 .25 .3
CVLT-C: Free Recall,Long Delay .35 .46 .35 .31 .32 -.16 -.07 -.02 -.08 .69 .8 .79 1 .82 .38 .4 .42 .13 .14 .17 .18 .27 .22 -.27 .16 .28 .26 -.17 -.25 -.13 -.16 -.16 -.25 -.14 -.2 -.05 -.02 .01 -.03 .26 .25 .29
CVLT-C: Cued Recall,Long Delay .37 .46 .37 .32 .32 -.16 -.04 -.05 -.05 .68 .74 .87 .82 1 .43 .44 .41 .15 .16 .13 .15 .31 .24 -.28 .17 .27 .26 -.14 -.21 -.12 -.12 -.15 -.21 -.11 -.16 -.02 -.04 -.01 -.03 .27 .27 .31
CMS Stories 1:Immediate Recall .6 .45 .49 .53 .56 -.24 -.04 -.05 -.04 .46 .41 .43 .38 .43 1 .96 .55 .52 .52 .32 .32 .22 .28 -.16 .24 .3 .32 .01 -.09 -.05 -.05 -.02 -.07 -.03 -.07 -.07 -.03 .00 -.06 .36 .26 .36
CMS Stories 2:Delayed Recall .62 .46 .48 .54 .56 -.23 -.05 -.04 -.02 .46 .42 .44 .4 .44 .96 1 .56 .5 .5 .3 .31 .22 .29 -.19 .24 .31 .33 .00 -.09 -.06 -.05 -.04 -.08 -.05 -.07 -.07 -.04 .01 -.05 .38 .27 .37
AchievementWJIII: Letter- Word
Identification .64 .6 .5 .6 .57 -.24 -.09 -.06 -.01 .46 .41 .42 .42 .41 .55 .56 1 .29 .31 .38 .39 .34 .39 -.24 .35 .44 .47 -.2 -.26 -.19 -.16 -.17 -.25 -.19 -.19 -.02 -.05 .03 -.09 .47 .37 .48
Fine MotorCoordination
Grooved Pegboard: .14 .11 .07 .17 .17 -.1 .03 .11 .05 .14 .14 .13 .13 .15 .52 .5 .29 1 .9 .21 .25 .05 .09 .02 .04 .07 .06 .16 .08 .04 -.01 .15 .1 .07 -.01 -.04 .05 .00 .01 -.13 -.18 -.18

Abt Associates Inc. Chapter 9 115
Exhibit 9.1.2.5. Correlation Among Outcome Measures
Bos
ton
Nam
NE
PS
Y:S
P
NE
PS
Y:C
.I.
CE
LF:F
.S.
CE
LF:R
.S.
GF
TA
Stu
tter
-A
Stu
tter
-P
Stu
tter
-T
CV
LT:F
ND
CV
LT:F
SD
CV
:T”
CS
D
CV
LT:F
LD
CV
LT:C
LD
CM
S-1
C<S
-2
WJ
-LW
ID
Peg
-Dom
Peg
-ND
Tap
-D
om
Tap
-N
D
SB
Cop
y
GD
S-C
orr
GD
S-E
rr
Dig
it-F
Dig
it-B
Dig
it-
C
Met
a-P
Met
a-T
Hyp
er-
P
Hyp
er-T
Inat
t-P
Inat
t-T
Beh
avio
r-P
Beh
avio
r-T
Mot
orTi
cs-A
Mot
orTi
csP
Pho
nT
ics-
A
Pho
nT
ics-
P
Ver
balI
Q
Per
fIQ
Ful
lIQ
Dominant Hand (lower= better)
Grooved Pegboard:Non-dom Hand (lower
= better).15 .13 .08 .18 .18 -.08 .03 .11 .13 .17 .16 .15 .14 .16 .52 .5 .31 .9 1 .2 .21 .03 .08 .03 .05 .05 .06 .14 .07 .03 -.02 .15 .1 .06 .01 -.03 .05 .02 .01 -.1 -.18 -.16
Finger Tapping:Dominant Hand .29 .3 .18 .3 .22 -.1 .02 -.04 -.01 .18 .16 .15 .17 .13 .32 .3 .38 .21 .2 1 .81 .22 .23 -.08 .14 .23 .22 -.02 -.01 -.01 .07 -.02 .00 -.05 .03 -.05 -.03 .07 .04 .07 .15 .13
Finger Tapping: Non-dominant Hand .28 .26 .17 .28 .24 -.12 .03 .00 -.04 .18 .16 .17 .18 .15 .32 .31 .39 .25 .21 .81 1 .24 .2 -.06 .15 .2 .21 .00 .05 .00 .11 .00 .06 -.02 .06 -.03 .00 .07 .03 .07 .14 .13
Visual Spatial AbilityStanford Binet:
Copying .29 .31 .22 .26 .28 -.14 -.01 -.14 -.1 .23 .23 .29 .27 .31 .22 .22 .34 .05 .03 .22 .24 1 .23 -.22 .19 .24 .26 -.2 -.24 -.17 -.17 -.17 -.22 -.15 -.2 -.03 -.01 .02 -.02 .21 .34 .31
Attention/ ExecutiveFunctioning
GDS Vigilance Task:Correct Responses .32 .35 .32 .34 .3 -.16 -.08 -.07 -.05 .31 .25 .25 .22 .24 .28 .29 .39 .09 .08 .23 .2 .23 1 -.41 .18 .25 .26 -.17 -.17 -.15 -.09 -.14 -.16 -.17 -.11 -.06 -.03 .02 -.02 .22 .2 .24
GDS Vigilance Task:Errors (lower = better) -.22 -.32 -.26 -.28 -.25 .14 .15 .17 .07 -.25 -.27 -.25 -.27 -.28 -.16 -.19 -.24 .02 .03 -.08 -.06 -.22 -.41 1 -.15 -.22 -.22 .24 .23 .19 .14 .26 .24 .18 .2 .05 .04 .07 .07 -.24 -.22 -.26
WISC III: Digit Span,Forward Recall .35 .31 .39 .31 .57 -.11 -.01 -.01 -.04 .23 .14 .13 .16 .17 .24 .24 .35 .04 .05 .14 .15 .19 .18 -.15 1 .38 .86 -.1 -.15 -.1 -.06 -.12 -.15 -.08 -.1 -.08 -.07 -.08 -.1 .34 .31 .38
WISC III: Digit Span,Backward Recall .34 .39 .4 .34 .42 -.09 .01 -.07 -.02 .29 .28 .26 .28 .27 .3 .31 .44 .07 .05 .23 .2 .24 .25 -.22 .38 1 .8 -.19 -.25 -.16 -.12 -.2 -.25 -.11 -.18 -.06 -.02 -.08 -.05 .29 .34 .36
WISC III: Digit Span,Combined .41 .42 .47 .39 .6 -.12 .00 -.05 -.04 .31 .24 .23 .26 .26 .32 .33 .47 .06 .06 .22 .21 .26 .26 -.22 .86 .8 1 -.17 -.24 -.15 -.11 -.18 -.24 -.11 -.17 -.09 -.06 -.1 -.09 .38 .39 .44
BRIEF Parent Rating:Metacognition (lower =
better)-.08 -.28 -.15 -.12 -.14 -.04 .04 .08 .07 -.17 -.18 -.15 -.17 -.14 .01 .00 -.2 .16 .14 -.02 .00 -.2 -.17 .24 -.1 -.19 -.17 1 .57 .63 .35 .88 .54 .7 .39 .04 .01 .17 .18 -.18 -.17 -.2
BRIEF Teacher Rating:Metacognition (lower =
better)-.14 -.34 -.25 -.18 -.21 .03 .09 .1 .14 -.21 -.22 -.21 -.25 -.21 -.09 -.09 -.26 .08 .07 -.01 .05 -.24 -.17 .23 -.15 -.25 -.24 .57 1 .44 .67 .6 .93 .38 .74 .06 .07 .11 .13 -.23 -.18 -.23
Behavior Regulation(lower = better)
CRS-R: Parent Rating:Hyperactive/Impulsive -.11 -.22 -.15 -.13 -.14 -.01 .02 .03 .00 -.16 -.16 -.13 -.13 -.12 -.05 -.06 -.19 .04 .03 -.01 .00 -.17 -.15 .19 -.1 -.16 -.15 .63 .44 1 .45 .67 .41 .75 .45 .07 .06 .15 .17 -.15 -.14 -.17
CRS-R: TeacherRating:
Hyperactive/Impulsive-.08 -.19 -.08 -.09 -.11 .07 .02 .02 .1 -.14 -.16 -.12 -.16 -.12 -.05 -.05 -.16 -.01 -.02 .07 .11 -.17 -.09 .14 -.06 -.12 -.11 .35 .67 .45 1 .37 .63 .34 .8 .01 .08 .03 .09 -.12 -.04 -.09
CRS-R: Parent Rating:Inattentive -.09 -.29 -.18 -.14 -.14 -.03 .00 .06 .07 -.16 -.18 -.17 -.16 -.15 -.02 -.04 -.17 .15 .15 -.02 .00 -.17 -.14 .26 -.12 -.2 -.18 .88 .6 .67 .37 1 .57 .61 .44 .05 .02 .19 .18 -.19 -.15 -.19
CRS-R: Teacher -.14 -.31 -.24 -.16 -.19 .04 .09 .12 .14 -.2 -.21 -.2 -.25 -.21 -.07 -.08 -.25 .1 .1 .00 .06 -.22 -.16 .24 -.15 -.25 -.24 .54 .93 .41 .63 .57 1 .35 .65 .05 .05 .11 .11 -.24 -.18 -.24

Abt Associates Inc. Chapter 9 116
Exhibit 9.1.2.5. Correlation Among Outcome Measures
Bos
ton
Nam
NE
PS
Y:S
P
NE
PS
Y:C
.I.
CE
LF:F
.S.
CE
LF:R
.S.
GF
TA
Stu
tter
-A
Stu
tter
-P
Stu
tter
-T
CV
LT:F
ND
CV
LT:F
SD
CV
:T”
CS
D
CV
LT:F
LD
CV
LT:C
LD
CM
S-1
C<S
-2
WJ
-LW
ID
Peg
-Dom
Peg
-ND
Tap
-D
om
Tap
-N
D
SB
Cop
y
GD
S-C
orr
GD
S-E
rr
Dig
it-F
Dig
it-B
Dig
it-
C
Met
a-P
Met
a-T
Hyp
er-
P
Hyp
er-T
Inat
t-P
Inat
t-T
Beh
avio
r-P
Beh
avio
r-T
Mot
orTi
cs-A
Mot
orTi
csP
Pho
nT
ics-
A
Pho
nT
ics-
P
Ver
balI
Q
Per
fIQ
Ful
lIQ
Rating: InattentiveBRIEF Parent Rating:Behavior Regulation -.08 -.2 -.14 -.15 -.12 .01 .06 .03 .06 -.16 -.15 -.12 -.14 -.11 -.03 -.05 -.19 .07 .06 -.05 -.02 -.15 -.17 .18 -.08 -.11 -.11 .7 .38 .75 .34 .61 .35 1 .41 .08 .04 .14 .23 -.13 -.15 -.16
BRIEF Teacher Rating:Behavior Regulation -.11 -.24 -.14 -.14 -.16 .05 .1 .05 .18 -.19 -.18 -.16 -.2 -.16 -.07 -.07 -.19 -.01 .01 .03 .06 -.2 -.11 .2 -.1 -.18 -.17 .39 .74 .45 .8 .44 .65 .41 1 .1 .07 .05 .12 -.13 -.09 -.13
Tics (lower = better)Motor tics (current):
Assessor Rating -.02 -.04 -.06 -.07 -.08 .03 .24 .04 .09 -.03 -.03 -.01 -.05 -.02 -.07 -.07 -.02 -.04 -.03 -.05 -.03 -.03 -.06 .05 -.08 -.06 -.09 .04 .06 .07 .01 .05 .05 .08 .1 1 .31 .18 .1 -.03 -.03 -.03
Phonics tics (current):Assessor Rating -.08 -.06 -.03 -.11 -.05 -.02 .24 .05 .07 .01 -.04 .00 -.02 -.04 -.03 -.04 -.05 .05 .05 -.03 .00 -.01 -.03 .04 -.07 -.02 -.06 .01 .07 .06 .08 .02 .05 .04 .07 .31 1 .03 .13 -.08 -.03 -.07
Motor tics (current):Parent Rating .00 .00 -.06 .01 -.05 -.05 .00 .13 .02 -.01 .00 -.01 .01 -.01 .00 .01 .03 .00 .02 .07 .07 .02 .02 .07 -.08 -.08 -.1 .17 .11 .15 .03 .19 .11 .14 .05 .18 .03 1 .43 -.06 -.02 -.05
Phonics tics (current):Parent Rating -.1 -.06 -.1 -.11 -.13 .04 .04 .11 .08 -.07 -.02 -.04 -.03 -.03 -.06 -.05 -.09 .01 .01 .04 .03 -.02 -.02 .07 -.1 -.05 -.09 .18 .13 .17 .09 .18 .11 .23 .12 .1 .13 .43 1 -.13 -.08 -.12
General IntellectualFunctioning
WASI Verbal IQ .66 .41 .52 .52 .6 -.19 -.08 -.13 -.02 .3 .24 .28 .26 .27 .36 .38 .47 -.13 -.1 .07 .07 .21 .22 -.24 .34 .29 .38 -.18 -.23 -.15 -.12 -.19 -.24 -.13 -.13 -.03 -.08 -.06 -.13 1 .53 .87WASI Performance IQ .48 .37 .48 .35 .4 -.13 -.04 -.1 -.05 .25 .21 .25 .25 .27 .26 .27 .37 -.18 -.18 .15 .14 .34 .2 -.22 .31 .34 .39 -.17 -.18 -.14 -.04 -.15 -.18 -.15 -.09 -.03 -.03 -.02 -.08 .53 1 .88
WASI Full Scale IQ .65 .44 .57 .5 .57 -.18 -.07 -.13 -.04 .32 .25 .3 .29 .31 .36 .37 .48 -.18 -.16 .13 .13 .31 .24 -.26 .38 .36 .44 -.2 -.23 -.17 -.09 -.19 -.24 -.16 -.13 -.03 -.07 -.05 -.12 .87 .88 1Pearson Correlation Coefficients

Abt Associates Inc. Chapter 9 117
9.2. Model Results
9.2.1. OverviewThe model results section introduces the factors that motivated fitting each model, providesspecifications of the models and interpretation of parameter estimates, and providessummaries of results fit to the data from the n=1,047 assessed children. Section 9.2.2 isdevoted to main effect models that estimate exposure effects on the combined population ofmales and females. This section includes results of several variants of data subsets or codingof particular variables. These variants are used to assess the sensitivity of results to particularassumptions, analysis methods, or inclusion or omission of particular observations. Theresults in this section are approximately equally balanced between findings where increasedexposure is associated with better outcome measures and findings where increased exposureis associated with worse outcomes.
Section 9.2.3 focuses on sex-by-exposure interaction models. Estimates of exposure effectson females and males are presented, as well as results of tests of sex-by-exposure interactioneffects.
Sections 9.2.4 and 9.2.5 are devoted to the question of whether prenatal exposure exacerbatesthe effects of postnatal exposure. The results do not provide evidence to support thehypothesis.
Section 9.2.6 concentrates on analyses to determine whether concurrent antibiotic receiptexacerbates the effects of postnatal exposure. The pattern of results suggests random scatterof small numbers of positive and negative effects.

Abt Associates Inc. Chapter 9 118
9.2.2. Main Effect Models
9.2.2.1. IntroductionThis section summarizes the results of two main effects models that were fit to each of the 42outcome variables. These models are considered to be of primary importance as they directlyaddress the study’s primary research questions. The first of the two models produces twohypothesis tests. One is a test of the null hypothesis that prenatal exposure to ethylmercuryfrom thimerosal in vaccines and immune globulins is unrelated to the outcome measure. Thesecond is a test of the null hypothesis that cumulative exposure, over the age range spanningbirth to seven months, to ethylmercury from thimerosal used in vaccines and immuneglobulins is unrelated to the outcome measure.
The second of the two models produces three hypothesis tests. One is a test of the nullhypothesis that ethylmercury exposures from thimerosal used in vaccines and immuneglobulins received during the age range spanning birth to 28 days is unrelated to the outcomemeasure. The second test is of the null hypothesis that cumulative exposures spanning theage range from 29 days to seven months is unrelated to the outcome. And the third is a test ofthe null hypothesis that prenatal exposure is unrelated to the outcome. The hypothesis testsconcerning prenatal exposures in models 1 and 2 produce almost identical results.
These two models were fit to a full data set with single imputation for missing values oncovariates, to a full data set with multiple imputation for missing values on covariates, to adata set with an alternative coding for prenatal exposure, to several variants used to assess thesensitivity of results regarding ADHD outcomes to coding of outcomes or inclusion/omissionof children who have taken medication for ADHD, and to a data set with a single outlieromitted. Details on each are provided subsequently.
9.2.2.2. Model SpecificationsThe notation and variables shown in the model specifications below are defined in Chapter 8.For tics and stuttering outcomes, logistic regression models that are analogous to the linearregression models specified below, were fit to the data.
Model (1) Specification: Main Effects of Prenatal, and Cumulative Exposures from Birth to 7Months
l
llkjk
kkjj
jj StcfoemosExperpreNatThimY 07210
0:0:
0:0:
220
110
a
a
HvsH
HvsH
Model (2) Specification: Main Effects of Prenatal, Hepatitis B at Birth, 1-7 Month Exposures

Abt Associates Inc. Chapter 9 119
l
llkjk
kkjj
jj Stcfoe
mosExpHepBerpreNatThimY 173210
0:0: 110 aHvsH0:0: 220 aHvsH0:0: 330 aHvsH
9.2.2.3. Explanation of Model Results Summary TableResults from Models (1) and (2) are summarized in Exhibit 9.2.1. Model (1) is summarizedin the left side of the exhibit, and the summary for Model (2) appears on the right-hand side.For each model and each outcome variable, the exhibit shows the parameter estimate,standard error, p-value from the hypothesis test, and a standardized regression coefficient foreach of the ethylmercury exposure variables. As indicated in the exhibit, for some values, ahigher score (positive value for parameter estimate) indicates a better outcome, and for othersa lower score (negative value for parameter estimate) indicates a more desirable outcome.
Statistically significant relationships (i.e., p<0.05) are highlighted with a box around the p-value, shading inside the box, and either a “+” or a “*” next to the p-value, depending on thedirection of the relationship. When the relationship was such that higher mercury exposurewas related to worse values on the outcome measure, the significant p-value was highlightedwith a blue box and a “*” appears next to the value. When the relationship was such thathigher mercury exposure was related to better values on the outcome measure, the significantp-value was highlighted with a red box and a “+” appears next to the value. P-values thatwere above the p<0.05 criterion, but below p<0.10 are also highlighted in the exhibit withred or blue boxes. While these relationships do not satisfy the study’s criterion for statisticalsignificance, we felt that highlighting these weaker effects would help illuminate any patternof relationships in the results.
For outcomes analyzed using linear regression models (i.e., outcomes other than tics andstuttering), the values in the standardized regression coefficient column (labeled “StCf” inthe exhibit) indicate the model predicted difference of the outcome measure, expressed instandard deviation units, associated with an increase of one standard deviation unit of theexposure measure. For example, in Exhibit 9.2.1, the standardized coefficient for thesignificant relationship of prenatal exposure to the NEPSY speeded naming outcomemeasure is 0.058. Therefore, the model predicts that an increase of one standard deviationunit of prenatal exposure is associated with improved scores on this outcome measure wherethe amount of improvement is equal to 0.058 standard deviation units of the outcomemeasure. Within the prenatal exposure column, it is reasonable to compare values of thestandardized coefficients among all of the outcomes (except the tics and stuttering outcomes,which will be discussed subsequently). Therefore we may conclude that the size of theestimated beneficial effect of prenatal exposure on the NEPSY Speeded Naming outcome(0.058 standard deviation units), is similar to the size of the estimated harmful effect ofprenatal exposure on the WISC III Digit Span Backward Recall outcome measure (-0.066standard deviation units).

Abt Associates Inc. Chapter 9 120
For each of the exposure measures, one can think of a difference of two standard deviationunits as approximately corresponding to the difference between high and low exposure.Therefore, for the outcomes analyzed using linear regression models, doubling thestandardized regression coefficient gives an effect size that roughly corresponds to thedifference between high and low exposure. Returning to the NEPSY Speeded Namingexample, one can think of the model predicted results as indicating that the differencebetween high and low prenatal exposure roughly corresponds to an effect size of 0.116.
For the tics and stuttering outcomes, which were analyzed in logistic regression models, thevalue in the standardized regression coefficient column corresponds to the odds ratioassociated with an increase of two standard deviation units of the exposure measure. Forexample, in Exhibit 9.2.1, the value in the “SdCF” column of the “Exp07Mos” exposurevariable for “Motor tics (current): Assessor Rating” is 1.357. That means that the estimatedeffect of a two standard deviation increase in cumulative exposures in the age range frombirth to seven months, is a 36 percent increase in the likelihood of assessor reported motortics. When increased exposure is related to a decrease in the probability of the outcome, theodds ratio takes a value less than one. An example from Model (2), corresponding to HepBexposure for parent reported motor tics, is a value in the “SdCF” column equal to 0.665. Inorder to get a sense of the relative magnitude of values that are less than one, as compared tovalues that are greater than one, the reader can invert the values. Inverting the value in thisexample gives 1/0.665 = 1.50. Thus the model predicted effect of a two standard deviationincrease in HepB exposure, is a 50 percent increase in the likelihood of not having parentreported motor tics. This effect was not significantly different than zero.
For details on the calculation of the values in the StCF columns of the exhibit, see Chapter 8.
9.2.2.4. Results
9.2.2.4.1. Main Effect Models with Single Imputation forCovariates with Missing Values
Across the collection of outcome measures that were assessed in this study, the model resultssummarized in Exhibit 9.2.2.1 do not suggest clear evidence of either harm or benefit ofincreased exposure to ethylmercury from vaccines or immune globulins. The results indicatethat increased mercury exposure was about as likely to be associated with better outcomes asit was to be associated with worse outcomes. Higher levels of prenatal exposure was relatedto worse scores on the WISC III Digit Span Backward Recall assessment, but was associatedwith better scores on the NEPSY Speeded Naming test. Cumulative exposures spanning theage range from birth to seven months was associated with better scores on the GroovedPegboard test with the non-dominant hand, and with better scores on WISC III Digit SpanBackward Recall assessment. Higher exposure in the first month of life (HepB exposure)was associated with more errors on the GFTA Test of Articulation, but with higher scores onthe Finger Tapping test with the dominant hand. And finally, cumulative exposures duringthe age range spanning 1 to 7 months had no significant associations that were in thedirection of worse outcomes, but was associated with better scores on the WJIII Letter WordIdentification test, and better scores on the Grooved Pegboard test with the non-dominanthand.

Abt Associates Inc. Chapter 9 121
Among the results that were highlighted because the p-values were above 0.05, but below0.10, there was a similar pattern of approximate balance between findings where theassociation was in the direction of higher exposure being related to worse outcomes andassociations that were in direction of higher exposure being related to better outcomes.

Abt Associates Inc. Chapter 9 122
Exhibit 9.2.2.1 Main Effect Models (1) and (2) (n=1,047)
Est S.E. P StCf
0.061 0.032 0.058 0.0510.019 0.041 0.650 0.015
-0.012 0.015 0.412 -0.028-0.031 0.032 0.337 -0.0300.008 0.066 0.908 0.0040.004 0.010 0.718 0.0130.022 0.035 0.521 1.3460.034 0.045 0.451 1.5710.008 0.026 0.753 1.117
-0.003 0.049 0.950 -0.002-0.025 0.014 0.076 -0.060-0.009 0.012 0.464 -0.025-0.019 0.013 0.139 -0.0500.000 0.013 0.981 0.001
-0.024 0.063 0.701 -0.0100.013 0.063 0.834 0.006
0.079 0.039 0.045 + 0.056
-0.058 0.094 0.542 -0.014-0.279 0.116 0.017+ -0.0590.013 0.033 0.705 0.0120.016 0.030 0.605 0.017
0.010 0.016 0.542 0.022
0.037 0.027 0.176 0.048-0.025 0.071 0.730 -0.0120.000 0.010 0.964 -0.0020.016 0.009 0.069 0.0640.017 0.015 0.262 0.039
-0.059 0.098 0.549 -0.022-0.165 0.140 0.241 -0.049
0.013 0.028 0.641 0.017-0.051 0.036 0.150 -0.059-0.028 0.032 0.374 -0.032-0.039 0.046 0.390 -0.0360.093 0.059 0.115 0.057
-0.071 0.076 0.353 -0.039
0.039 0.023 0.094 1.6800.037 0.024 0.120 1.6340.012 0.022 0.599 1.1670.005 0.020 0.803 1.068
-0.003 0.070 0.961 -0.0020.110 0.079 0.162 0.0480.075 0.072 0.295 0.034
Exp17mosEst S.E. P StCf Est S.E. P StCf Est S.E. P StCf Est S.E. P StCf
Speech and LanguageBoston Naming Test 0.032 0.022 0.143 0.033 0.050 0.030 0.096 0.045 0.032 0.022 0.133 0.034 -0.044 0.101 0.664 -0.011NEPSY: Speeded Naming 0.057 0.027 0.034 + 0.058 0.010 0.038 0.784 0.009 0.058 0.027 0.033 + 0.059 -0.058 0.126 0.646 -0.014NEPSY: Comprehension of Instructions -0.002 0.010 0.860 -0.005 -0.014 0.014 0.310 -0.035 -0.002 0.010 0.873 -0.005 -0.030 0.045 0.504 -0.020CELF: Formulated Sentences 0.021 0.021 0.327 0.026 -0.035 0.030 0.237 -0.038 0.021 0.021 0.319 0.026 -0.077 0.099 0.435 -0.022CELF: Recalling Sentences 0.058 0.044 0.187 0.034 -0.001 0.062 0.984 -0.001 0.059 0.044 0.182 0.034 -0.079 0.206 0.703 -0.011GFTA: Articulation (lower = better) -0.002 0.007 0.804 -0.007 0.011 0.010 0.249 0.042 -0.002 0.007 0.735 -0.010 0.075 0.032 0.017 * 0.077Stuttering: Assessor Rating (lower = better) -0.002 0.021 0.907 0.959 0.026 0.033 0.434 1.443 -0.003 0.021 0.898 0.956 0.054 0.103 0.599 1.229Stuttering: Parent Rating (lower = better) -0.024 0.048 0.616 0.668 0.020 0.043 0.644 1.327 -0.024 0.049 0.620 0.667 -0.118 0.125 0.346 0.638Stuttering: Teacher Rating (lower = better) -0.042 0.030 0.160 0.500 0.011 0.025 0.674 1.163 -0.041 0.030 0.162 0.503 0.029 0.074 0.696 1.118Verbal MemoryCVLT-C: Free Recall, No Delay 0.029 0.033 0.385 0.024 -0.001 0.046 0.975 -0.001 0.028 0.033 0.389 0.024 0.013 0.153 0.935 0.002CVLT-C: Free Recall, Short Delay -0.001 0.009 0.887 -0.004 -0.024 0.013 0.066 -0.063 -0.001 0.009 0.884 -0.004 -0.019 0.043 0.664 -0.013CVLT-C: Cued Recall, Short Delay -0.001 0.008 0.910 -0.003 -0.005 0.011 0.639 -0.016 -0.001 0.008 0.889 -0.004 0.026 0.038 0.497 0.020CVLT-C: Free Recall, Long Delay 0.001 0.009 0.917 0.003 -0.019 0.012 0.108 -0.054 0.001 0.009 0.914 0.003 -0.023 0.040 0.562 -0.018CVLT-C: Cued Recall, Long Delay 0.005 0.008 0.568 0.016 0.001 0.012 0.928 0.003 0.005 0.008 0.574 0.016 0.008 0.039 0.845 0.006CMS Stories 1: Immediate Recall 0.024 0.042 0.570 0.013 -0.030 0.060 0.610 -0.014 0.024 0.042 0.563 0.013 -0.084 0.197 0.671 -0.010CMS Stories 2: Delayed Recall -0.010 0.041 0.817 -0.005 0.005 0.059 0.936 0.002 -0.009 0.041 0.828 -0.005 -0.066 0.193 0.732 -0.008AchievementW JIII: Letter- W ord Identification 0.011 0.026 0.675 0.010 0.062 0.037 0.094 0.047 0.012 0.026 0.639 0.011 -0.089 0.122 0.469 -0.018Fine Motor CoordinationGrooved Pegboard: Dominant Hand (lower = better) -0.109 0.064 0.089 -0.033 -0.080 0.089 0.371 -0.021 -0.107 0.064 0.095 -0.032 -0.282 0.299 0.347 -0.020Grooved Pegboard: Non-dom Hand (lower = better) -0.083 0.077 0.284 -0.022 -0.274 0.109 0.012 + -0.062 -0.083 0.077 0.282 -0.022 -0.226 0.362 0.532 -0.014Finger Tapping: Dominant Hand -0.015 0.022 0.502 -0.018 0.034 0.031 0.271 0.036 -0.016 0.022 0.459 -0.020 0.222 0.103 0.032 + 0.062Finger Tapping: Non-dominant Hand -0.015 0.020 0.455 -0.020 0.018 0.028 0.524 0.020 -0.015 0.020 0.451 -0.020 0.039 0.093 0.676 0.012Visual Spatial AbilityStanford Binet: Copying 0.005 0.011 0.628 0.014 0.007 0.015 0.667 0.016 0.005 0.011 0.611 0.015 -0.022 0.050 0.662 -0.014Attention/Executive FunctioningGDS Vigilance Task: Correct Responses -0.013 0.018 0.470 -0.021 0.032 0.026 0.209 0.045 -0.013 0.018 0.485 -0.021 -0.009 0.085 0.914 -0.003GDS Vigilance Task: Errors (lower = better) 0.033 0.047 0.489 0.020 -0.022 0.067 0.742 -0.012 0.032 0.047 0.493 0.020 0.000 0.220 0.999 0.000W ISC III: Digit Span, Forward Recall 0.000 0.007 0.983 0.001 -0.002 0.010 0.820 -0.008 0.000 0.007 0.965 0.001 -0.017 0.032 0.594 -0.017W ISC III: Digit Span, Backward Recall -0.013 0.006 0.027 * -0.066 0.018 0.008 0.028 + 0.078 -0.013 0.006 0.025 * -0.067 0.038 0.028 0.170 0.044W ISC III: Digit Span, Combined -0.012 0.010 0.244 -0.034 0.017 0.015 0.242 0.041 -0.012 0.010 0.245 -0.034 0.014 0.048 0.773 0.009BRIEF Parent Rating: Metacognition (lower = better) 0.021 0.066 0.744 0.010 -0.052 0.092 0.573 -0.020 0.021 0.066 0.750 0.010 0.009 0.307 0.976 0.001BRIEF Teacher Rating: Metacognition (lower = better) 0.026 0.088 0.764 0.010 -0.147 0.133 0.268 -0.046 0.024 0.088 0.784 0.009 0.011 0.431 0.980 0.001Behavior Regulation (lower = better)CRS-R: Parent Rating: Hyperactive/Impulsive 0.007 0.019 0.725 0.011 0.019 0.026 0.469 0.026 0.006 0.019 0.745 0.010 0.071 0.087 0.414 0.027CRS-R: Teacher Rating: Hyperactive/Impulsive 0.023 0.022 0.301 0.033 -0.048 0.034 0.157 -0.059 0.023 0.022 0.310 0.032 -0.016 0.110 0.883 -0.005CRS-R: Parent Rating: Inattentive 0.011 0.022 0.606 0.016 -0.024 0.030 0.433 -0.028 0.011 0.022 0.619 0.015 0.019 0.100 0.848 0.006CRS-R: Teacher Rating: Inattentive 0.002 0.029 0.939 0.002 -0.034 0.043 0.432 -0.033 0.002 0.029 0.957 0.002 0.014 0.141 0.919 0.004BRIEF Parent Rating: Behavior Regulation -0.021 0.040 0.594 -0.016 0.077 0.055 0.167 0.050 -0.020 0.040 0.616 -0.015 -0.069 0.185 0.711 -0.012BRIEF Teacher Rating: Behavior Regulation 0.035 0.048 0.455 0.024 -0.045 0.072 0.535 -0.026 0.032 0.048 0.498 0.022 0.182 0.231 0.432 0.029Tics (lower = better)Motor tics (current): Assessor Rating 0.017 0.011 0.104 1.336 0.032 0.022 0.142 1.586 0.018 0.011 0.089 1.357 -0.026 0.068 0.696 0.904Phonics tics (current): Assessor Rating -0.011 0.018 0.560 0.839 0.037 0.023 0.102 1.702 -0.011 0.018 0.560 0.839 0.041 0.073 0.574 1.169Motor tics (current): Parent Rating 0.003 0.012 0.832 1.043 -0.001 0.021 0.963 0.986 0.004 0.012 0.768 1.062 -0.107 0.069 0.122 0.665Phonics tics (current): Parent Rating -0.014 0.016 0.409 0.798 0.007 0.019 0.699 1.109 -0.014 0.016 0.401 0.795 0.028 0.064 0.666 1.112General Intellectual FunctioningW ASI Verbal IQ 0.054 0.047 0.252 0.030 -0.044 0.066 0.506 -0.021 0.057 0.047 0.224 0.032 -0.408 0.219 0.063 -0.053W ASI Performance IQ -0.008 0.054 0.881 -0.004 0.130 0.074 0.080 0.061 -0.010 0.054 0.856 -0.005 0.323 0.252 0.200 0.040W ASI Full Scale IQ 0.026 0.048 0.594 0.015 0.059 0.068 0.383 0.029 0.027 0.048 0.575 0.015 -0.084 0.225 0.707 -0.011
< .05 >.05, <.10 < .05 >.05, <.10Key: Mercury effect = Better Outcome p-value+ p-value Mercury effect =W orse Outcome p-value* p-value
P-values shown are rounded to 3 decimal places. Therefore, a value shown as 0.050 may satisify p<0.05 criterion if the original value was rounded up, or may not satisify the criterion if the value was rounded down.
PreNatThimer HepBMain Effects Model (2)
Exp07mosTest
Main Effects Model (1)PreNatThimer

Abt Associates Inc. Chapter 9 123
9.2.2.4.2. Main Effect Models With Multiple Imputationfor Covariates with Missing Values
When covariates had missing values, the missing values were replaced with imputedvalues. The imputed values were the predicted values from regression models withrandom noise added. The amount of missing data on covariates is shown in Section 9.1.
For the models summarized in the previous section, and all other models except thosesummarized in the current section, a single imputed value replaced each missing value.In order to assess whether the model results were sensitive to the imputation, we theapplied method of multiple imputation described in Little and Rubin (2002) to the twomain effects models previously discussed. Briefly, the method of multiple imputationinvolves imputing ten separate values for each missing value. Each is a little differentbecause of the random noise added to the predicted value from the regression. Tenseparate data sets are created to accommodate the ten sets of imputations. Next, tenseparate regression models are fit to the ten data sets. A parameter estimate from themultiple imputation method is the mean of the parameter estimates from the 10 separatemodels fit to the 10 separate data sets. The standard error of the coefficient is calculatedas a function of the average of the standard errors from the 10 models, and the amount ofbetween-imputation variation in parameter estimates.
We fit multiple imputation models for the two main effects models to the data from the42 outcome variables. The results are summarized in Exhibit 9.2.2.2. There were nosubstantive difference between results from the multiple- and single-imputation methods.
It is not surprising that the multiple imputation results are very close to the singleimputation results. The imputations were for covariates only, and most covariates hadonly small amounts of missing data.

Abt Associates Inc. Chapter 9 124
Exhibit 9.2.2.2 Main Effect Models (1) and (2) with Multiple Imputation for Missing Values of Covariates (n=1,047)
Est S.E. P StCf Est S.E. P StCf Est S.E. P StCf Est S.E. P StCfSpeech and LanguageBoston Naming Test 0.031 0.022 0.145 0.033 0.052 0.030 0.087 0.046 0.032 0.022 0.135 0.034 -0.040 0.101 0.695 -0.009NEPSY: Speeded Naming 0.057 0.027 0.033+ 0.059 0.011 0.038 0.771 0.010 0.058 0.027 0.032+ 0.059 -0.053 0.126 0.674 -0.012NEPSY: Comprehension of Instructions -0.002 0.010 0.868 -0.005 -0.014 0.014 0.316 -0.035 -0.001 0.010 0.880 -0.004 -0.029 0.045 0.528 -0.019CELF: Formulated Sentences 0.020 0.021 0.343 0.025 -0.035 0.030 0.244 -0.037 0.020 0.021 0.335 0.025 -0.076 0.099 0.440 -0.022CELF: Recalling Sentences 0.057 0.044 0.194 0.033 0.002 0.062 0.979 0.001 0.058 0.044 0.189 0.034 -0.073 0.206 0.724 -0.010GFTA: Articulation (lower = better) -0.002 0.007 0.811 -0.007 0.011 0.010 0.255 0.041 -0.002 0.007 0.741 -0.010 0.075 0.032 0.018* 0.076Stuttering: Assessor Rating (lower = better) -0.002 0.021 0.907 0.959 0.026 0.033 0.434 1.443 -0.003 0.021 0.899 0.956 0.054 0.103 0.599 1.229Stuttering: Parent Rating (lower = better) -0.024 0.048 0.616 0.668 0.020 0.043 0.644 1.327 -0.024 0.049 0.620 0.667 -0.118 0.125 0.346 0.638Stuttering: Teacher Rating (lower = better) -0.042 0.030 0.160 0.500 0.011 0.025 0.674 1.163 -0.041 0.030 0.162 0.503 0.029 0.074 0.696 1.118Verbal MemoryCVLT-C: Free Recall, No Delay 0.028 0.033 0.393 0.024 -0.001 0.046 0.982 -0.001 0.028 0.033 0.397 0.024 0.015 0.154 0.924 0.003CVLT-C: Free Recall, Short Delay -0.001 0.009 0.903 -0.003 -0.024 0.013 0.065 -0.063 -0.001 0.009 0.899 -0.004 -0.019 0.043 0.666 -0.013CVLT-C: Cued Recall, Short Delay -0.001 0.008 0.912 -0.003 -0.005 0.011 0.649 -0.015 -0.001 0.008 0.891 -0.004 0.026 0.038 0.491 0.021CVLT-C: Free Recall, Long Delay 0.001 0.009 0.907 0.003 -0.019 0.012 0.109 -0.054 0.001 0.009 0.904 0.003 -0.023 0.040 0.570 -0.017CVLT-C: Cued Recall, Long Delay 0.005 0.008 0.560 0.017 0.001 0.012 0.942 0.003 0.005 0.008 0.567 0.016 0.008 0.039 0.838 0.006CMS Stories 1: Immediate Recall 0.024 0.042 0.573 0.013 -0.030 0.060 0.613 -0.014 0.024 0.042 0.566 0.013 -0.084 0.197 0.671 -0.010CMS Stories 2: Delayed Recall -0.010 0.041 0.805 -0.006 0.003 0.059 0.953 0.002 -0.010 0.041 0.816 -0.005 -0.066 0.194 0.734 -0.008AchievementWJIII: Letter- Word Identification 0.011 0.026 0.676 0.010 0.063 0.037 0.091 0.048 0.012 0.026 0.639 0.011 -0.089 0.123 0.470 -0.018Fine Motor CoordinationGrooved Pegboard: Dominant Hand (lower = better) -0.109 0.064 0.089 -0.033 -0.081 0.089 0.362 -0.021 -0.107 0.064 0.095 -0.032 -0.298 0.299 0.319 -0.021Grooved Pegboard: Non-dom Hand (lower = better) -0.086 0.077 0.267 -0.023 -0.276 0.109 0.012+ -0.062 -0.086 0.077 0.266 -0.023 -0.241 0.362 0.507 -0.015Finger Tapping: Dominant Hand -0.015 0.022 0.502 -0.018 0.035 0.031 0.255 0.037 -0.016 0.022 0.459 -0.020 0.224 0.103 0.030+ 0.063Finger Tapping: Non-dominant Hand -0.014 0.020 0.490 -0.018 0.020 0.028 0.477 0.023 -0.014 0.020 0.484 -0.019 0.043 0.094 0.650 0.013Visual Spatial AbilityStanford Binet: Copying 0.005 0.011 0.610 0.015 0.006 0.015 0.686 0.015 0.006 0.011 0.593 0.016 -0.022 0.050 0.661 -0.014Attention/Executive FunctioningGDS Vigilance Task: Correct Responses -0.013 0.018 0.484 -0.021 0.034 0.026 0.188 0.047 -0.012 0.018 0.499 -0.020 -0.007 0.085 0.932 -0.003GDS Vigilance Task: Errors (lower = better) 0.031 0.047 0.506 0.020 -0.024 0.067 0.717 -0.013 0.031 0.047 0.509 0.020 -0.005 0.220 0.981 -0.001WISC III: Digit Span, Forward Recall 0.000 0.007 0.999 0.000 -0.002 0.010 0.852 -0.007 0.000 0.007 0.982 0.001 -0.016 0.032 0.607 -0.017WISC III: Digit Span, Backward Recall -0.013 0.006 0.028* -0.065 0.018 0.008 0.027+ 0.079 -0.013 0.006 0.027* -0.066 0.038 0.028 0.169 0.044WISC III: Digit Span, Combined -0.012 0.010 0.243 -0.034 0.018 0.015 0.226 0.043 -0.012 0.010 0.244 -0.034 0.015 0.048 0.753 0.010BRIEF Parent Rating: Metacognition (lower = better) 0.018 0.066 0.785 0.008 -0.050 0.092 0.584 -0.020 0.017 0.066 0.791 0.008 0.006 0.307 0.984 0.001BRIEF Teacher Rating: Metacognition (lower = better) 0.026 0.088 0.766 0.010 -0.144 0.133 0.278 -0.045 0.024 0.088 0.787 0.009 0.018 0.431 0.966 0.002Behavior Regulation (lower = better)CRS-R: Parent Rating: Hyperactive/Impulsive 0.007 0.019 0.709 0.011 0.019 0.026 0.461 0.027 0.006 0.019 0.729 0.010 0.072 0.087 0.409 0.027CRS-R: Teacher Rating: Hyperactive/Impulsive 0.023 0.022 0.307 0.033 -0.047 0.034 0.163 -0.058 0.022 0.022 0.317 0.032 -0.012 0.110 0.911 -0.004CRS-R: Parent Rating: Inattentive 0.011 0.022 0.625 0.015 -0.023 0.030 0.443 -0.028 0.010 0.022 0.637 0.014 0.019 0.100 0.846 0.006CRS-R: Teacher Rating: Inattentive 0.001 0.029 0.971 0.001 -0.034 0.043 0.432 -0.033 0.000 0.029 0.989 0.000 0.015 0.141 0.915 0.004BRIEF Parent Rating: Behavior Regulation -0.022 0.040 0.577 -0.017 0.077 0.055 0.166 0.050 -0.021 0.040 0.599 -0.016 -0.069 0.185 0.711 -0.012BRIEF Teacher Rating: Behavior Regulation 0.038 0.047 0.421 0.026 -0.041 0.072 0.566 -0.024 0.035 0.048 0.463 0.024 0.189 0.231 0.414 0.030Tics (lower = better)Motor tics (current): Assessor Rating 0.017 0.011 0.104 1.336 0.032 0.022 0.142 1.586 0.018 0.011 0.089 1.357 -0.026 0.068 0.696 0.904Phonics tics (current): Assessor Rating -0.011 0.018 0.560 0.839 0.037 0.023 0.102 1.702 -0.011 0.018 0.560 0.839 0.041 0.073 0.575 1.169Motor tics (current): Parent Rating 0.003 0.012 0.832 1.043 -0.001 0.021 0.963 0.986 0.004 0.012 0.768 1.062 -0.107 0.069 0.122 0.665Phonics tics (current): Parent Rating -0.014 0.016 0.409 0.798 0.007 0.019 0.699 1.109 -0.014 0.016 0.401 0.795 0.028 0.064 0.666 1.112General Intellectual FunctioningWASI Verbal IQ 0.053 0.047 0.253 0.030 -0.039 0.066 0.557 -0.019 0.057 0.047 0.225 0.032 -0.402 0.219 0.067 -0.053WASI Performance IQ -0.007 0.054 0.902 -0.004 0.132 0.074 0.077 0.062 -0.008 0.054 0.877 -0.005 0.332 0.252 0.188 0.041WASI Full Scale IQ 0.026 0.048 0.585 0.015 0.062 0.068 0.361 0.030 0.028 0.048 0.567 0.016 -0.074 0.225 0.741 -0.010
< .05 >.05, <.10 < .05 >.05, <.10Key: Mercury effect = Better Outcome p-value+ p-value Mercury effect =Worse Outcome p-value* p-value
P-values shown are rounded to 3 decimal places. Therefore, a value shown as 0.050 may satisify p<0.05 criterion if the original value was rounded up, or may not satisify the criterion if the value was rounded down.
PreNatThimer HepBMain Effects Model (2)
Exp07mosTest
Main Effects Model (1)PreNatThimer
Est S.E. P StCf
0.062 0.032 0.054 0.0520.019 0.041 0.647 0.015
-0.012 0.015 0.412 -0.028-0.030 0.032 0.344 -0.0300.010 0.066 0.877 0.0050.004 0.010 0.724 0.0130.022 0.035 0.521 1.3460.034 0.045 0.451 1.5710.008 0.026 0.754 1.117
-0.003 0.049 0.954 -0.002-0.025 0.014 0.075 -0.060-0.009 0.012 0.471 -0.024-0.019 0.013 0.139 -0.0500.000 0.013 0.999 0.000
-0.024 0.063 0.705 -0.0100.012 0.063 0.853 0.005
0.080 0.039 0.042+ 0.057
-0.057 0.094 0.544 -0.014-0.281 0.117 0.016+ -0.0590.014 0.033 0.681 0.0130.018 0.030 0.560 0.019
0.009 0.016 0.561 0.021
0.039 0.027 0.158 0.050-0.026 0.071 0.711 -0.0130.000 0.010 0.993 0.0000.016 0.009 0.066 0.0650.018 0.015 0.248 0.040
-0.057 0.098 0.562 -0.021-0.162 0.140 0.249 -0.048
0.013 0.028 0.632 0.017-0.051 0.036 0.154 -0.059-0.028 0.032 0.383 -0.031-0.040 0.046 0.389 -0.0360.093 0.059 0.114 0.057
-0.068 0.076 0.372 -0.038
0.039 0.023 0.094 1.6800.037 0.024 0.120 1.6340.012 0.022 0.599 1.1670.005 0.020 0.803 1.068
0.002 0.070 0.982 0.0010.111 0.079 0.158 0.0480.077 0.072 0.283 0.035
>.05, <.10
Exp17mos

Abt Associates Inc. Chapter 9 125
9.2.2.4.3. Main Effect Models with AlternativePrenatal Mercury Amount Assignments
The measure of prenatal exposure to ethylmercury was calculated as the sum ofethylmercury amounts from maternal receipt of vaccines and immune globulins receivedduring pregnancy with the focus child. As explained in Section 7.2, different immuneglobulin products contained different amounts of ethylmercury, and for many receiptsthere was uncertainty regarding the specific product that was received. The medicalcharts often indicated that the immune globulin product received was “rhogam”. Theuncertainty arises from the fact that while Rhogam is a specific product, the name“rhogam” is also often used as a generic term, similar to the way “kleenex” if often usedas a generic term to refer to facial tissues, even though Kleenex is a specific productname. For assigning mercury content amounts to each receipt, if the chart indicatedreceipt of “rhogam”, we assigned a mercury amount equal to 12.75 micrograms.However, if the term “rhogam” was being used generically, then some other product mayhave been administered which may have contained up to 50 micrograms per dose.
Out of 88 prenatal rhogam receipts in the database, only four had a lot number ormanufacturer written on the record that clearly confirmed that the receipt was the product“Rhogam”. In order to assess the sensitivity of the model results to our assumption thatthe remaining 84 rhogam receipts were, in fact, receipts of the product “Rhogam” andhence resulted in 12.75 micrograms of ethylmercury exposure, we created an alternativeversion of the prenatal exposure variable where we made an alternative assumption thateach of these 84 receipts contained 50 micrograms of ethylmercury. Under the alternativeassumptions, these “rhogam” receipts were higher exposure events than prenatal receiptsof vaccines (influenza, tetatnus, diphtheria-tetanus, hepatitis-b). Under the originalassumptions, the prenatal vaccine receipts where higher exposure events, relative to the“rhogam” receipts.
Exhibit 9.2.2.3 shows a summary of model results when the alternatively coded prenatalexposure variable (PreNatThimer_Alt) was substituted for the original prenatal exposurevariable (PreNatThimer). Comparison of Exhibits 9.2.2.3 to 9.2.2.1 shows that alternativecoding does not produce dramatic differences from original results. The alternativecoding results in a slightly larger estimated beneficial effect of prenatal exposure on theNEPSY Speeded Naming outcome, and a slightly smaller estimate of a harmful effect onWISC III Digit Span, Backward Recall.

Abt Associates Inc. Chapter 9 126
Est S.E. P StCf
0.062 0.032 0.053 0.0520.021 0.041 0.599 0.018
-0.012 0.015 0.411 -0.028-0.030 0.032 0.350 -0.0300.010 0.066 0.883 0.0050.003 0.010 0.730 0.0120.022 0.035 0.524 1.3440.034 0.045 0.449 1.5750.006 0.026 0.808 1.090
-0.002 0.049 0.973 -0.001-0.024 0.014 0.077 -0.060-0.009 0.012 0.461 -0.025-0.019 0.013 0.141 -0.0490.001 0.013 0.967 0.001
-0.023 0.063 0.717 -0.0100.013 0.063 0.836 0.006
0.079 0.039 0.044+ 0.056
-0.062 0.094 0.511 -0.015-0.283 0.116 0.015+ -0.0600.012 0.033 0.727 0.0110.015 0.030 0.625 0.016
0.010 0.016 0.530 0.023
0.037 0.027 0.182 0.047-0.023 0.071 0.742 -0.0120.000 0.010 0.965 -0.0020.015 0.009 0.078 0.0620.017 0.015 0.273 0.038
-0.058 0.098 0.550 -0.021-0.164 0.140 0.243 -0.048
0.013 0.028 0.640 0.017-0.050 0.036 0.157 -0.058-0.028 0.032 0.379 -0.031-0.039 0.046 0.391 -0.0360.092 0.059 0.119 0.056
-0.070 0.076 0.360 -0.039
0.040 0.023 0.085 1.7030.037 0.024 0.119 1.6370.012 0.022 0.591 1.1710.004 0.020 0.827 1.060
-0.001 0.070 0.988 -0.0010.110 0.079 0.162 0.0480.077 0.072 0.286 0.035
Exp17mosEst S.E. P StCf Est S.E. P StCf Est S.E. P StCf Est S.E. P StCf
Speech and LanguageBoston Naming Test 0.013 0.011 0.242 0.026 0.052 0.030 0.086 0.046 0.013 0.011 0.232 0.027 -0.039 0.101 0.698 -0.009NEPSY: Speeded Naming 0.033 0.013 0.014+ 0.068 0.014 0.038 0.719 0.012 0.033 0.013 0.014+ 0.068 -0.051 0.126 0.683 -0.012NEPSY: Comprehension of Instructions 0.001 0.005 0.791 0.008 -0.014 0.014 0.307 -0.035 0.001 0.005 0.783 0.008 -0.031 0.045 0.494 -0.021CELF: Formulated Sentences 0.008 0.010 0.444 0.020 -0.034 0.030 0.251 -0.036 0.008 0.010 0.439 0.020 -0.074 0.099 0.455 -0.021CELF: Recalling Sentences 0.018 0.022 0.415 0.021 0.002 0.062 0.980 0.001 0.018 0.022 0.410 0.021 -0.069 0.206 0.739 -0.009GFTA: Articulation (lower = better) -0.003 0.003 0.316 -0.030 0.011 0.010 0.253 0.041 -0.004 0.003 0.290 -0.032 0.076 0.031 0.016* 0.077Stuttering: Assessor Rating (lower = better) -0.004 0.012 0.752 0.879 0.026 0.033 0.435 1.441 -0.004 0.012 0.748 0.877 0.054 0.102 0.599 1.228Stuttering: Parent Rating (lower = better) -0.002 0.015 0.876 0.926 0.020 0.043 0.639 1.333 -0.002 0.015 0.878 0.927 -0.118 0.125 0.345 0.636Stuttering: Teacher Rating (lower = better) -0.011 0.010 0.307 0.701 0.009 0.025 0.731 1.131 -0.010 0.010 0.311 0.703 0.027 0.074 0.717 1.109Verbal MemoryCVLT-C: Free Recall, No Delay 0.021 0.016 0.202 0.036 0.000 0.046 0.999 0.000 0.021 0.016 0.203 0.036 0.015 0.153 0.922 0.003CVLT-C: Free Recall, Short Delay 0.003 0.005 0.510 0.019 -0.024 0.013 0.065 -0.063 0.003 0.005 0.512 0.019 -0.020 0.043 0.652 -0.014CVLT-C: Cued Recall, Short Delay 0.000 0.004 0.924 -0.003 -0.005 0.011 0.636 -0.016 0.000 0.004 0.912 -0.003 0.026 0.038 0.499 0.020CVLT-C: Free Recall, Long Delay 0.003 0.004 0.508 0.019 -0.019 0.012 0.110 -0.054 0.003 0.004 0.507 0.019 -0.024 0.040 0.556 -0.018CVLT-C: Cued Recall, Long Delay 0.003 0.004 0.547 0.017 0.001 0.012 0.910 0.004 0.002 0.004 0.551 0.017 0.008 0.039 0.833 0.006CMS Stories 1: Immediate Recall 0.022 0.021 0.292 0.024 -0.029 0.059 0.625 -0.013 0.022 0.021 0.289 0.024 -0.083 0.197 0.674 -0.010CMS Stories 2: Delayed Recall 0.004 0.020 0.827 0.005 0.004 0.059 0.942 0.002 0.005 0.020 0.820 0.005 -0.069 0.193 0.720 -0.009AchievementWJIII: Letter- Word Identification -0.006 0.013 0.669 -0.010 0.062 0.037 0.092 0.047 -0.005 0.013 0.691 -0.009 -0.085 0.122 0.488 -0.017Fine Motor CoordinationGrooved Pegboard: Dominant Hand (lower = better) -0.048 0.032 0.130 -0.030 -0.085 0.089 0.338 -0.022 -0.048 0.032 0.135 -0.029 -0.296 0.299 0.323 -0.021Grooved Pegboard: Non-dom Hand (lower = better) -0.039 0.038 0.313 -0.021 -0.278 0.109 0.011+ -0.063 -0.039 0.038 0.312 -0.021 -0.237 0.362 0.513 -0.014Finger Tapping: Dominant Hand -0.014 0.011 0.207 -0.034 0.033 0.031 0.282 0.035 -0.014 0.011 0.191 -0.035 0.221 0.103 0.032+ 0.062Finger Tapping: Non-dominant Hand -0.015 0.010 0.119 -0.042 0.017 0.028 0.543 0.020 -0.015 0.010 0.118 -0.042 0.038 0.093 0.681 0.012Visual Spatial AbilityStanford Binet: Copying 0.004 0.005 0.436 0.023 0.007 0.015 0.653 0.016 0.004 0.005 0.427 0.024 -0.022 0.050 0.667 -0.014Attention/Executive FunctioningGDS Vigilance Task: Correct Responses -0.005 0.009 0.560 -0.017 0.032 0.026 0.220 0.044 -0.005 0.009 0.570 -0.017 -0.011 0.085 0.896 -0.004GDS Vigilance Task: Errors (lower = better) 0.006 0.023 0.801 0.007 -0.020 0.067 0.762 -0.011 0.006 0.023 0.805 0.007 0.007 0.219 0.974 0.001WISC III: Digit Span, Forward Recall 0.000 0.003 0.970 0.001 -0.002 0.010 0.820 -0.008 0.000 0.003 0.959 0.002 -0.017 0.032 0.594 -0.017WISC III: Digit Span, Backward Recall -0.005 0.003 0.078 -0.053 0.017 0.008 0.034+ 0.076 -0.005 0.003 0.075 -0.054 0.036 0.028 0.190 0.042WISC III: Digit Span, Combined -0.005 0.005 0.367 -0.026 0.017 0.015 0.257 0.040 -0.005 0.005 0.369 -0.026 0.012 0.048 0.798 0.008BRIEF Parent Rating: Metacognition (lower = better) -0.016 0.032 0.613 -0.015 -0.051 0.092 0.581 -0.020 -0.017 0.032 0.610 -0.015 0.017 0.306 0.956 0.002BRIEF Teacher Rating: Metacognition (lower = better) -0.004 0.045 0.927 -0.003 -0.145 0.132 0.274 -0.046 -0.005 0.045 0.917 -0.003 0.022 0.430 0.960 0.002Behavior Regulation (lower = better)CRS-R: Parent Rating: Hyperactive/Impulsive -0.004 0.009 0.625 -0.015 0.019 0.026 0.462 0.027 -0.005 0.009 0.612 -0.015 0.074 0.087 0.397 0.028CRS-R: Teacher Rating: Hyperactive/Impulsive 0.004 0.011 0.745 0.011 -0.046 0.034 0.170 -0.057 0.004 0.011 0.751 0.011 -0.009 0.110 0.933 -0.003CRS-R: Parent Rating: Inattentive -0.001 0.011 0.911 -0.003 -0.023 0.030 0.443 -0.028 -0.001 0.011 0.903 -0.004 0.022 0.100 0.828 0.007CRS-R: Teacher Rating: Inattentive -0.001 0.015 0.971 -0.001 -0.034 0.043 0.434 -0.033 -0.001 0.015 0.964 -0.002 0.015 0.140 0.915 0.004BRIEF Parent Rating: Behavior Regulation -0.020 0.020 0.317 -0.030 0.075 0.055 0.173 0.049 -0.019 0.020 0.326 -0.030 -0.069 0.185 0.708 -0.012BRIEF Teacher Rating: Behavior Regulation 0.006 0.024 0.805 0.008 -0.042 0.072 0.556 -0.025 0.005 0.024 0.825 0.007 0.193 0.231 0.405 0.030Tics (lower = better)Motor tics (current): Assessor Rating 0.010 0.006 0.086 1.400 0.034 0.022 0.125 1.619 0.010 0.006 0.081 1.409 -0.021 0.068 0.754 0.922Phonics tics (current): Assessor Rating 0.002 0.007 0.777 1.070 0.037 0.023 0.102 1.702 0.002 0.007 0.778 1.070 0.039 0.073 0.587 1.163Motor tics (current): Parent Rating 0.000 0.007 0.944 0.984 -0.001 0.021 0.972 0.990 0.000 0.007 0.983 0.995 -0.106 0.069 0.126 0.668Phonics tics (current): Parent Rating -0.004 0.007 0.558 0.870 0.006 0.019 0.728 1.097 -0.004 0.007 0.548 0.867 0.026 0.064 0.686 1.104General Intellectual FunctioningWASI Verbal IQ 0.019 0.023 0.414 0.022 -0.041 0.066 0.534 -0.020 0.020 0.023 0.392 0.023 -0.398 0.219 0.069 -0.052WASI Performance IQ 0.016 0.026 0.539 0.018 0.130 0.074 0.081 0.061 0.016 0.026 0.551 0.017 0.317 0.251 0.207 0.040WASI Full Scale IQ 0.018 0.024 0.447 0.021 0.060 0.068 0.372 0.030 0.018 0.024 0.436 0.021 -0.083 0.224 0.713 -0.011
< .05 >.05, <.10 < .05 >.05, <.10Key: Mercury effect = Better Outcome p-value+ p-value Mercury effect =Worse Outcome p-value* p-value
P-values shown are rounded to 3 decimal places. Therefore, a value shown as 0.050 may satisify p<0.05 criterion if the original value was rounded up, or may not satisify the criterion if the value was rounded down.
PreNatThimer_Alt HepBMain Effects Model (2)
Exp07mosTest
Main Effects Model (1)PreNatThimer_Alt
Exhibit 9.2.2.3 Main Effect Models (1) and (2) with Alternative Coding of Prenatal Exposure Variable (n=1,047)

Abt Associates Inc. Chapter 9 127
9.2.2.4.4. Additional Main Effect Models for ADHDOutcomes
Measures of attention deficit hyperactivity disorder (ADHD) symptomatology wereobtained from administration of Conners and BRIEF assessments14 to parents of teachersof focus children. There was concern among the study’s external advisors that childrenthat were on ADHD medications in the time frame that parents and teachers completedthe Conners and BRIEF assessments might have lower scores than they would have hadif they had not been taking the medications. In order to address the concern, the study’sexternal advisors recommended several additional analyses, described below.
The parent interview data indicate that 38 children took ADHD medications, includingtwo that had taken an ADHD stimulant within twelve hours of the clinical assessment.We did three sets of follow-up analyses to better understand the results for these 38children and to assess whether the findings from the full sample (including those 38)were sensitive to the inclusion/exclusion of these 38 children from the analyses.
In the first set of analyses, we asked, how do the Conners and BRIEF scores of 38children who took ADHD medications compare to the scores of children who did not takemedications? Those analyses indicate that the children who took ADHD medications hadsignificantly higher symptomotolgy scores on all 8 of the Conners and BRIEF assessmentscales.
In the second set of analyses, we re-fit the main effects models for the 8 Conners andBRIEF outcomes, where the data from the 38 children who had taken ADHD medicationswere excluded.
In the third set of analyses we made binary outcome measures for each of the 8assessments. These binary measures took the value 1 if the child was above a clinicallyrelevant cut point15 on the assessment scale or if the child had taken ADHD medications;and took the value zero of neither of those conditions occurred. We fit logistic regressionmodels to tests the main effects hypotheses to these binary outcome data.
The results of the second and third analyses described above, as well as the results fromthe analyses on the full data set (these are the same results that are shown in Exhibit9.2.2.1) are summarized in the Exhibit 9.2.2.4. Similar to the results from the full dataset, there were no significant effects from the models where the 38 children who tookADHD medications were omitted. There were also no significant effects found in thelogistic models for the binary outcomes.
14 Conners’ Rating Scales – Revised, and Brief Behavior Rating Inventory of Executive Function. SeeSection 7.1 for details.15 Children scoring above this cut-point were at the 90th percentile or above on the symptoms rated in thescale.

Abt Associates Inc. Chapter 9 128
Exhibit 9.2.2.4 Additional Main Effect Models for ADHD Outcomes (n=1,047)
Est S.E. P StCf Est S.E. P StCf Est S.E. P StCf Est S.E. P StCfLinear Model (Theseare thesameresultsasshowninmainsummarytable.)Attention/ExecutiveFunctioning(lower =better)BRIEFParent Rating: Metacognition 0.021 0.066 0.744 0.010 -0.052 0.092 0.573 -0.020 0.021 0.066 0.750 0.010 0.009 0.307 0.976 0.001BRIEFTeacher Rating: Metacognition 0.026 0.088 0.764 0.010 -0.147 0.133 0.268 -0.046 0.024 0.088 0.784 0.009 0.011 0.431 0.980 0.001Behavior Regulation(lower =better)CRS-R: Parent Rating: Hyperactive/Impulsive 0.007 0.019 0.725 0.011 0.019 0.026 0.469 0.026 0.006 0.019 0.745 0.010 0.071 0.087 0.414 0.027CRS-R: Teacher Rating: Hyperactive/Impulsive 0.023 0.022 0.301 0.033 -0.048 0.034 0.157 -0.059 0.023 0.022 0.310 0.032 -0.016 0.110 0.883 -0.005CRS-R: Parent Rating: Inattentive 0.011 0.022 0.606 0.016 -0.024 0.030 0.433 -0.028 0.011 0.022 0.619 0.015 0.019 0.100 0.848 0.006CRS-R: Teacher Rating: Inattentive 0.002 0.029 0.939 0.002 -0.034 0.043 0.432 -0.033 0.002 0.029 0.957 0.002 0.014 0.141 0.919 0.004BRIEFParent Rating: Behavior Regulation -0.021 0.040 0.594 -0.016 0.077 0.055 0.167 0.050 -0.020 0.040 0.616 -0.015 -0.069 0.185 0.711 -0.012BRIEFTeacher Rating: Behavior Regulation 0.035 0.048 0.455 0.024 -0.045 0.072 0.535 -0.026 0.032 0.048 0.498 0.022 0.182 0.231 0.432 0.029
Linear Model (excludingn=39childrenwhosemothers indicatedthat childtakesdrugsfor ADHD)Attention/ExecutiveFunctioning(lower =better)BRIEFParent Rating: Metacognition -0.008 0.066 0.902 -0.004 -0.033 0.091 0.719 -0.013 -0.009 0.066 0.892 -0.004 0.051 0.304 0.867 0.005BRIEFTeacher Rating: Metacognition -0.008 0.090 0.927 -0.003 -0.147 0.133 0.270 -0.046 -0.012 0.090 0.890 -0.005 0.117 0.433 0.787 0.010Behavior Regulation(lower =better)CRS-R: Parent Rating: Hyperactive/Impulsive -0.003 0.018 0.882 -0.004 0.020 0.025 0.426 0.028 -0.003 0.018 0.855 -0.005 0.082 0.085 0.338 0.031CRS-R: Teacher Rating: Hyperactive/Impulsive 0.012 0.022 0.582 0.018 -0.059 0.034 0.081 -0.072 0.011 0.022 0.616 0.016 0.019 0.109 0.862 0.006CRS-R: Parent Rating: Inattentive 0.001 0.021 0.957 0.002 -0.011 0.029 0.719 -0.013 0.001 0.021 0.967 0.001 0.018 0.098 0.855 0.006CRS-R: Teacher Rating: Inattentive -0.010 0.029 0.722 -0.012 -0.032 0.043 0.466 -0.031 -0.011 0.029 0.693 -0.013 0.052 0.140 0.710 0.014BRIEFParent Rating: Behavior Regulation -0.038 0.040 0.336 -0.029 0.083 0.055 0.133 0.054 -0.037 0.040 0.351 -0.029 -0.045 0.184 0.805 -0.008BRIEFTeacher Rating: Behavior Regulation 0.000 0.048 0.996 0.000 -0.050 0.071 0.484 -0.029 -0.005 0.048 0.924 -0.003 0.230 0.229 0.316 0.036
Logistic Model (Outcome=1 if child takesdrugsfor ADHDor if childscoredabovecriteriononConners/Brief assessments)Attention/ExecutiveFunctioning(lower =better)BRIEFParent Rating: Metacognition -0.002 0.011 0.872 -0.005 0.016 0.745 -0.002 0.011 0.861 0.027 0.053 0.613BRIEFTeacher Rating: Metacognition -0.005 0.010 0.634 -0.003 0.016 0.844 -0.005 0.010 0.636 -0.007 0.049 0.888Behavior Regulation(lower =better)CRS-R: Parent Rating: Hyperactive/Impulsive -0.010 0.013 0.405 0.006 0.015 0.693 -0.011 0.013 0.402 0.016 0.050 0.756CRS-R: Teacher Rating: Hyperactive/Impulsive 0.010 0.011 0.366 -0.005 0.020 0.790 0.010 0.011 0.361 -0.015 0.062 0.815CRS-R: Parent Rating: Inattentive 0.006 0.011 0.582 -0.025 0.016 0.113 0.006 0.011 0.582 -0.026 0.055 0.636CRS-R: Teacher Rating: Inattentive -0.003 0.012 0.808 0.010 0.019 0.589 -0.003 0.012 0.815 -0.009 0.057 0.880BRIEFParent Rating: Behavior Regulation -0.003 0.013 0.841 0.021 0.018 0.238 -0.003 0.013 0.844 0.007 0.059 0.903BRIEFTeacher Rating: Behavior Regulation 0.002 0.011 0.825 0.001 0.018 0.940 0.002 0.011 0.836 0.017 0.055 0.756
<.05 >.05, <.10 <.05 >.05, <.10Key: Mercuryeffect =Better Outcome p-value+ p-value Mercuryeffect =WorseOutcome p-value* p-value
P-valuesshownare roundedto3decimal places. Therefore, avalueshownas 0.050maysatisifyp<0.05criterion if theoriginal valuewas roundedup, or maynot satisify thecriterion if thevaluewas roundeddown.
PreNatThimer HepBMainEffectsModel (2)
Exp07mosTest
MainEffectsModel (1)PreNatThimer
Est S.E. P StCf
-0.059 0.098 0.549 -0.022-0.165 0.140 0.241 -0.049
0.013 0.028 0.641 0.017-0.051 0.036 0.150 -0.059-0.028 0.032 0.374 -0.032-0.039 0.046 0.390 -0.0360.093 0.059 0.115 0.057-0.071 0.076 0.353 -0.039
-0.042 0.097 0.663 -0.016-0.177 0.141 0.210 -0.052
0.013 0.027 0.624 0.017-0.067 0.035 0.059 -0.077-0.014 0.031 0.659 -0.015-0.041 0.046 0.373 -0.0370.097 0.058 0.097 0.059-0.082 0.075 0.275 -0.045
-0.009 0.017 0.605-0.003 0.017 0.875
0.005 0.016 0.759-0.004 0.021 0.840-0.025 0.017 0.1360.012 0.020 0.5330.023 0.019 0.230-0.001 0.019 0.976
>.05, <.10
Exp17mos

Abt Associates Inc. Chapter 9 129
9.2.3. Sex-by-Exposure Interaction Models
9.2.3.1. IntroductionThe decision to test for differential exposure effects for boys and girls was motivated bytwo considerations. The first was that the design of the current study was stronglyinfluenced by precedents set in the Faroe and Seychelles Island studies (Grandjean et. al,1997; Davidson et. al 1998), and the Davidson study had tested for sex-by-exposureinteraction effects. The second consideration was that among the types ofneurodevelopmental outcomes measured in the current study, the frequency and severityof delays or problems in the general population are often unequal for boys and girls, thusgenerating the question of whether differential sensitivity to exposure might be related todifferential performance on the outcome measures.
The analysis summaries shown in this section present results of tests for interactions ofsex with prenatal exposure, cumulative exposure from birth to seven months, neonatalexposure, and cumulative exposure from 1 to seven months. A commonly used reportingconvention is to report separate estimates of exposure effects for boys and girls only ifthe interaction meets a pre-specified criterion for statistical significance. In thisconvention, whenever the interaction is non-significant, only the combined effect for bothboys and girls is reported. For this report we have chosen not to adopt that reportingconvention. Instead, we report separate estimates of exposure effects, for boys and girls,regardless of the result of the interaction test. We felt that the readers of this report wouldbe better served by having the more detailed set of results, even if the additional detailpresents them with greater challenges in terms of interpretation of results.
9.2.3.2. Model Specifications
The notation and variables shown in the model specifications below are defined inChapters 8. For tics and stuttering outcomes, logistic regression models that areanalogous to the linear regression models specified below, were fit to the data.
Interaction Model (1): Sex by Prenatal, and Birth-7 Month Exposures
The model shown below was used to estimate separate exposure effects for males andfemales, and to test whether sex is an effect modifier for thimerosal exposure receivedeither by the mother during pregnancy (prenatal exposure) or received by the child duringperiod spanning birth to seven months of age. Sex is expressed as a dummy variable,which takes the value 1 if the child is male, and takes the value zero if the child is female.
l
llkjk
kkjj
jj Stcfoe
SexmalemosExpSexmaleerpreNatThim
SexmalemosExperpreNatThimY
*07*
07
5
4
3210

Abt Associates Inc. Chapter 9 130
1̂ = The estimated effect of prenatal exposure to ethylmercury from vaccinesand immune globulins received by the mother during pregnancy, forfemales.
2̂ = The estimated effect of cumulative exposure to ethylmercury fromvaccines and immune globulins received by the child during the agerange from birth to seven months, for females.
3̂ = The average difference between males and females on the outcomemeasure, after controlling for other terms in the model.
4̂ = The average difference between males and females in the effect ofprenatal exposure.
41ˆˆ = The estimated effect of prenatal exposure to ethylmercury from vaccines
and immune globulins received by the mother, for males.
5̂ = The average difference between males and females in the effect ofpostnatal exposure.
52ˆˆ = The estimated effect of exposure to ethylmercury from vaccines and
immune globulins received by the child during the age range from birthto seven months, for males.
lkjj ˆ...ˆ = Parameter estimates corresponding to model covariates. See Chapter 8for details.
The model resulted in two tests of the null hypotheses that exposure effects are equal tozero for females:
0:0:
0:0:
220
110
a
a
HvsH
HvsH
The model also resulted in two tests of the null hypotheses that exposure effects are equalto zero for males:
0:0:
0:0:
52520
41410
a
a
HvsH
HvsH
And, the model resulted in two tests of the null hypotheses that the interactioncoefficients are equal to zero.
0:0:
0:0:
550
440
a
a
HvsH
HvsH
All tests were conducted using the p<0.05 criterion16.
Interaction Model (2): Sex by Prenatal, HepB at Birth, and 1-7 Month Exposures
The model shown below is similar to the previous model except that postnatal exposuresare separated into two time periods – birth to 28 days (represented by the HepB variable),
16 Since there is generally less power to detect interaction effects than main effects, it is not uncommon tospecify higher alpha levels for interaction tests. However, for the sake of consistency and simplicity, wehave elected to use a single alpha level criterion (p<0.05) for all tests of exposure effects.

Abt Associates Inc. Chapter 9 131
and cumulative exposures during the periods spanning 29 days to 7 months of age(represented by the Exp17mos variable). As before, the model was used to estimateseparate exposure effects for males and females, and to test whether sex is an effectmodifier for prenatal or postnatal exposures.
l
llkjk
kkjj
jj Stcfoe
sexmalemosExpsexmaleHepBsexmaleerpreNatThimsexmale
mosExpHepBerpreNatThimY
*17**
17
765
4
3210
1̂ = The estimated effect of prenatal exposure to ethylmercury from vaccinesand immune globulins received by the mother, for females.
2̂ = The estimated effect of exposure to ethylmercury from vaccines andimmune globulins received by the child during the age range from birthto one month (28 days), for females.
3̂ = The estimated effect of exposure to ethylmercury from vaccines receivedby the child during the age range from one month (29 days) to sevenmonths, for females.
4̂ = The average difference between males and females on the outcomemeasure, after controlling for other terms in the model.
5̂ = The average difference between males and females in the effect ofprenatal exposure.
51ˆˆ = The estimated effect of prenatal exposure to ethylmercury from vaccines
and immune globulins received by the mother, for males.
6̂ = The average difference between males and females in the effects ofexposures received during the age range spanning birth to 1 month (28days).
62ˆˆ = The estimated effect of exposure to ethylmercury from vaccines and
immune globulins received by the child during the age range from birthto one month, for males.
7̂ = The average difference between males and females in the effects ofexposures received during the age range spanning one to seven months.
73ˆˆ = The estimated effect of exposure to ethylmercury from vaccines and
immune globulins received by the child during the age range from one toseven months, for males.
lkjj ˆ...ˆ = Parameter estimates corresponding to model covariates. See Chapter 8for details.
The model resulted in three tests of the null hypotheses that exposure effects are equal tozero for females:
0:0:
0:0:
0:0:
330
220
110
a
a
a
HvsH
HvsH
HvsH

Abt Associates Inc. Chapter 9 132
The model also resulted in three tests of the null hypotheses that exposure effects areequal to zero for males:
0:0:
0:0:
0:0:
73730
62620
51510
a
a
a
HvsH
HvsH
HvsH
And, the model resulted in three tests of the null hypotheses that the interactioncoefficients are equal to zero.
0:0: 550 aHvsH0:0: 660 aHvsH0:0: 770 aHvsH
9.2.3.3. Results
The results summarized in Exhibits 9.2.3.1 and 9.2.3.2 correspond to models fit to the fulldata set and show the estimated exposure effects on females and males, respectively. Foreach of the two sexes, there is an approximate balance between the number of significanteffects that are in the direction of harm and benefit.
9.2.3.3.1. Prenatal ExposureThere are four significant sex-by-prenatal-exposure interaction effects shown in thesummary tables. They are indicated by and “S*” next to the parameter estimate. For theStanford Binet Copying outcome measure, the interaction effect was such that theestimated exposure effect for males was significant and beneficial, whereas the estimatedexposure effect was non-significant and in the direction of harm for females. For theremaining three outcome measures with significant sex-by-prenatal-exposureinteractions, the estimated effects were in the direction of harm for one sex, but in thedirection of benefit for the other. In none of these was the estimated exposure effectsignificantly different than zero for either sex.
For males, the estimated effect of prenatal exposure on performance of the WISC III DigitSpan Backwards Recall tests was significant and in the direction of harm. Although theinteraction test was not significant, indicating that we cannot reject the null hypothesis ofa common effect for males and females, the estimate for females was non-significant, butalso in the direction of harm.
9.2.3.3.2. Cumulative Exposure Birth to Seven MonthsThere is one significant sex-by-birth-to-seven-months-exposure interaction effect shownin the summary tables. It corresponds to the Parent Rated Phonic Tics outcome measure,and it is such that estimated effect is in the direction of harm for males, but is similar in

Abt Associates Inc. Chapter 9 133
magnitude but in the direction of benefit for females, and is non-significant for bothsexes.
There were three outcome measures where the estimated effects of cumulative exposurein the age range spanning birth to seven months was associated with significant harmfuleffects for males. However, there were also three outcome measures where the estimatedexposure effects were significant and beneficial. One was for males and two were forfemales.
The estimated effects of exposures in the age range of one to seven months are verysimilar to the estimated birth to seven month exposure effects, and are not discussedfurther.
9.2.3.3.3. Neonatal Exposure (Birth to 28 Days)
There are six significant sex-by-neonatal-exposure interaction effects shown in thesummary tables. All are such that the estimated effects are in the direction of harm forone sex, but in the direction of benefit for the other. In only one was the estimatedexposure effect significantly different than zero for either sex. That is the estimatedbeneficial effect of increased exposure on the Finger Tapping Non-dominant Handoutcome measure for males.
For females, increased neonatal exposure was associated with poorer scores on the WASIVerbal IQ measure, whereas increased neonatal exposure was associated with betterscores on the WASI Performance IQ measure for males. Increased neonatal exposure wasassociated with beneficial effects on Parent Rated Motor Tics for females, and for FingerTapping Dominant and Non-dominant Hands for males.

Abt Associates Inc. Chapter 9 134
Exhibit 9.2.3.1. Summary of Thimerosal Effects for Females (n=1,047; Data set included 538 females and 509 males)
Est S.E. P StCf
0.080 0.042 0.056 0.0670.033 0.053 0.530 0.0270.003 0.019 0.875 0.007
-0.034 0.041 0.409 -0.0340.028 0.086 0.745 0.0130.001 0.013 0.937 0.0040.028 0.047 0.556 1.4490.051 0.064 0.419 1.9820.011 0.039 0.772 1.163
0.012 0.064 0.853 0.008-0.023 0.018 0.195 -0.057-0.006 0.016 0.691 -0.017-0.011 0.017 0.522 -0.0280.004 0.016 0.813 0.0110.037 0.082 0.648 0.0160.061 0.081 0.453 0.027
0.030 0.051 0.552 0.022
-0.042 0.123 0.732 -0.010-0.347 0.151 0.022 + -0.0730.003 0.043 0.950 0.0030.013 0.039 0.745 0.014
S 0.033 0.021 0.113 0.074
0.050 0.036 0.159 0.065-0.121 0.092 0.189 -0.061-0.004 0.013 0.775 -0.0130.025 0.011 0.027 + 0.1020.022 0.020 0.276 0.050
-0.058 0.127 0.649 -0.021-0.126 0.182 0.489 -0.037
-0.001 0.036 0.978 -0.001-0.044 0.046 0.339 -0.051-0.017 0.042 0.690 -0.019-0.051 0.059 0.393 -0.0460.019 0.077 0.805 0.012
-0.088 0.099 0.373 -0.049
0.020 0.031 0.531 1.3000.004 0.034 0.899 1.0590.016 0.032 0.624 1.234
S* -0.044 0.028 0.115 0.559
-0.035 0.091 0.696 -0.0160.140 0.103 0.173 0.0610.097 0.093 0.299 0.044
>.05, <.10
Exp17mosEst S.E. P StCf Est S.E. P StCf Est S.E. P StCf Est S.E. P StCf
Speech and LanguageBoston Naming Test 0.027 0.035 0.441 0.028 0.060 0.040 0.131 0.054 0.031 0.035 0.385 0.032 -0.147 0.141 0.300 -0.035NEPSY: Speeded Naming 0.046 0.044 0.297 0.047 0.027 0.050 0.588 0.024 0.047 0.044 0.288 0.048 -0.026 0.177 0.882 -0.006NEPSY: Comprehension of Instructions 0.003 0.016 0.831 0.010 -0.007 0.018 0.676 -0.019 0.005 0.016 0.746 0.015 S -0.113 0.063 0.075 -0.076CELF: Formulated Sentences 0.026 0.035 0.456 0.032 -0.044 0.039 0.262 -0.047 0.027 0.035 0.429 0.034 -0.146 0.139 0.295 -0.041CELF: Recalling Sentences 0.058 0.072 0.418 0.034 0.011 0.081 0.888 0.006 0.061 0.072 0.396 0.036 -0.157 0.289 0.585 -0.021GFTA: Articulation (lower = better) -0.005 0.011 0.683 -0.020 0.008 0.013 0.533 0.030 -0.006 0.011 0.601 -0.026 0.073 0.044 0.098 0.075Stuttering: Assessor Rating (lower = better) 0.037 0.024 0.120 1.847 0.025 0.045 0.571 1.439 0.037 0.024 0.119 1.855 -0.001 0.155 0.997 0.998Stuttering: Parent Rating (lower = better) -0.717 8.949 0.936 0.000 0.038 0.062 0.536 1.726 -0.715 8.701 0.935 0.000 -0.141 0.195 0.468 0.583Stuttering: Teacher Rating (lower = better) -0.046 0.049 0.348 0.467 0.005 0.038 0.901 1.071 -0.046 0.049 0.352 0.467 -0.095 0.123 0.441 0.695Verbal MemoryCVLT-C: Free Recall, No Delay 0.033 0.054 0.543 0.028 -0.006 0.060 0.918 -0.005 0.036 0.054 0.502 0.031 -0.203 0.215 0.345 -0.040CVLT-C: Free Recall, Short Delay -0.001 0.015 0.922 -0.005 -0.028 0.017 0.106 -0.072 -0.001 0.015 0.959 -0.002 -0.072 0.061 0.243 -0.050CVLT-C: Cued Recall, Short Delay -0.007 0.013 0.577 -0.026 -0.009 0.015 0.529 -0.028 -0.007 0.013 0.599 -0.024 S -0.044 0.053 0.412 -0.035CVLT-C: Free Recall, Long Delay -0.008 0.014 0.566 -0.026 -0.016 0.016 0.314 -0.045 -0.007 0.014 0.615 -0.023 -0.072 0.057 0.204 -0.054CVLT-C: Cued Recall, Long Delay -0.008 0.014 0.541 -0.028 -0.002 0.016 0.898 -0.006 -0.007 0.014 0.600 -0.024 S* -0.069 0.055 0.212 -0.053CMS Stories 1: Immediate Recall -0.021 0.069 0.765 -0.011 0.025 0.078 0.751 0.011 -0.018 0.069 0.792 -0.010 -0.110 0.276 0.690 -0.014CMS Stories 2: Delayed Recall -0.060 0.068 0.372 -0.033 0.039 0.077 0.616 0.018 -0.056 0.068 0.410 -0.031 -0.199 0.272 0.463 -0.025AchievementWJIII: Letter- Word Identification -0.025 0.043 0.557 -0.022 S 0.009 0.048 0.856 0.007 -0.021 0.043 0.620 -0.019 -0.205 0.171 0.232 -0.042Fine Motor CoordinationGrooved Pegboard: Dominant Hand (lower = better) -0.046 0.105 0.658 -0.014 -0.054 0.117 0.645 -0.014 -0.044 0.105 0.678 -0.013 -0.155 0.419 0.712 -0.011Grooved Pegboard: Non-dom Hand (lower = better) -0.035 0.126 0.783 -0.009 -0.344 0.143 0.016 + -0.078 -0.035 0.127 0.781 -0.009 -0.316 0.509 0.535 -0.019Finger Tapping: Dominant Hand 0.001 0.036 0.969 0.002 0.007 0.041 0.856 0.008 0.000 0.036 0.994 0.000 S 0.026 0.144 0.859 0.007Finger Tapping: Non-dominant Hand 0.024 0.033 0.470 0.031 -0.006 0.037 0.871 -0.007 0.027 0.033 0.412 0.036 S* -0.204 0.131 0.118 -0.062Visual Spatial AbilityStanford Binet: Copying S* -0.033 0.017 0.057 -0.093 S 0.028 0.020 0.163 0.066 S* -0.032 0.018 0.065 -0.090 -0.029 0.071 0.685 -0.018Attention/Executive FunctioningGDS Vigilance Task: Correct Responses -0.014 0.030 0.647 -0.022 0.036 0.034 0.282 0.050 -0.011 0.030 0.710 -0.018 -0.105 0.119 0.378 -0.039GDS Vigilance Task: Errors (lower = better) 0.040 0.077 0.600 0.025 -0.111 0.087 0.201 -0.060 0.038 0.077 0.617 0.024 -0.007 0.308 0.981 -0.001WISC III: Digit Span, Forward Recall S* -0.017 0.011 0.119 -0.076 -0.003 0.012 0.787 -0.013 S* -0.017 0.011 0.118 -0.076 0.004 0.044 0.928 0.004WISC III: Digit Span, Backward Recall -0.004 0.010 0.656 -0.022 0.025 0.011 0.021 + 0.109 -0.004 0.010 0.654 -0.022 0.020 0.039 0.610 0.023WISC III: Digit Span, Combined -0.021 0.017 0.208 -0.060 0.022 0.019 0.258 0.052 -0.021 0.017 0.211 -0.060 0.018 0.068 0.788 0.012BRIEF Parent Rating: Metacognition (lower = better) S* -0.159 0.107 0.138 -0.073 -0.082 0.120 0.494 -0.032 S* -0.155 0.107 0.150 -0.071 -0.345 0.431 0.423 -0.036BRIEF Teacher Rating: Metacognition (lower = better) -0.042 0.143 0.769 -0.016 -0.177 0.174 0.308 -0.056 -0.031 0.144 0.829 -0.011 S* -0.826 0.596 0.166 -0.070Behavior Regulation (lower = better)CRS-R: Parent Rating: Hyperactive/Impulsive -0.019 0.030 0.529 -0.031 -0.001 0.034 0.972 -0.002 -0.019 0.030 0.529 -0.031 -0.011 0.122 0.929 -0.004CRS-R: Teacher Rating: Hyperactive/Impulsive 0.011 0.037 0.755 0.016 -0.055 0.045 0.219 -0.068 0.013 0.037 0.716 0.019 -0.186 0.153 0.225 -0.061CRS-R: Parent Rating: Inattentive S* -0.048 0.035 0.175 -0.067 -0.020 0.039 0.609 -0.024 S* -0.047 0.035 0.180 -0.066 -0.061 0.141 0.664 -0.020CRS-R: Teacher Rating: Inattentive 0.001 0.047 0.986 0.001 -0.070 0.057 0.222 -0.068 0.004 0.047 0.931 0.005 S* -0.312 0.195 0.109 -0.081BRIEF Parent Rating: Behavior Regulation -0.060 0.065 0.353 -0.046 S -0.008 0.073 0.912 -0.005 -0.055 0.065 0.396 -0.042 -0.280 0.260 0.282 -0.049BRIEF Teacher Rating: Behavior Regulation 0.013 0.077 0.871 0.009 -0.084 0.095 0.376 -0.049 0.013 0.078 0.872 0.009 -0.104 0.322 0.746 -0.016Tics (lower = better)Motor tics (current): Assessor Rating 0.033 0.020 0.104 1.733 0.003 0.030 0.928 1.039 0.036 0.020 0.083 1.806 S -0.174 0.108 0.109 0.515Phonics tics (current): Assessor Rating -0.029 0.046 0.529 0.620 S -0.002 0.033 0.945 0.969 -0.029 0.046 0.532 0.621 -0.078 0.115 0.498 0.743Motor tics (current): Parent Rating -0.052 0.054 0.335 0.424 -0.008 0.030 0.788 0.891 -0.051 0.054 0.344 0.425 -0.234 0.108 0.030 + 0.409Phonics tics (current): Parent Rating -0.069 0.051 0.182 0.320 S* -0.038 0.026 0.149 0.584 -0.070 0.052 0.173 0.310 0.030 0.101 0.768 1.121General Intellectual FunctioningWASI Verbal IQ 0.039 0.076 0.607 0.022 -0.097 0.086 0.263 -0.047 0.051 0.076 0.508 0.029 -0.738 0.307 0.017 * -0.097WASI Performance IQ -0.032 0.092 0.726 -0.018 0.113 0.098 0.246 0.053 -0.029 0.092 0.756 -0.016 S* -0.211 0.349 0.546 -0.026WASI Full Scale IQ -0.005 0.082 0.948 -0.003 0.044 0.089 0.622 0.021 0.004 0.082 0.957 0.002 S* -0.519 0.313 0.098 -0.068
< .05 >.05, <.10 < .05 >.05, <.10Key: Mercury effect = Better Outcome p-value+ p-value Mercury effect =Worse Outcome p-value* p-value
P-values shown are rounded to 3 decimal places. Therefore, a value shown as 0.050 may satisify p<0.05 criterion if the original value was rounded up, or may not satisify the criterion if the value was rounded down.S* (S) = Coefficient for females is significantly different than coefficient for males at the 0.05 (0.10) level
PreNatThimer HepBModel (2)
Exp07mosTest
Model (1)PreNatThimer

Abt Associates Inc. Chapter 9 135
Exhibit 9.2.3.2. Summary of Thimerosal Effects for Males (n=1,047; Data set included 538 females and 509 males)
Est S.E. P StCf Est S.E. P StCf Est S.E. P StCf Est S.E. P StCfSpeech and LanguageBoston Naming Test 0.034 0.027 0.207 0.036 0.041 0.040 0.304 0.036 0.035 0.027 0.195 0.037 0.062 0.141 0.658 0.015NEPSY: Speeded Naming 0.064 0.034 0.059 0.066 -0.006 0.050 0.899 -0.006 0.064 0.034 0.058 0.066 -0.085 0.177 0.631 -0.020NEPSY: Comprehension of Instructions -0.004 0.012 0.714 -0.013 -0.020 0.018 0.258 -0.051 -0.004 0.012 0.737 -0.012 S 0.053 0.063 0.401 0.036CELF: Formulated Sentences 0.017 0.027 0.515 0.021 -0.027 0.039 0.488 -0.029 0.018 0.027 0.507 0.022 -0.012 0.137 0.930 -0.003CELF: Recalling Sentences 0.059 0.056 0.294 0.034 -0.014 0.081 0.864 -0.007 0.059 0.056 0.289 0.034 0.003 0.288 0.991 0.000GFTA: Articulation (lower = better) 0.000 0.009 0.990 0.000 0.014 0.012 0.259 0.053 0.000 0.009 0.970 -0.001 0.077 0.044 0.076 0.079Stuttering: Assessor Rating (lower = better) -0.466 1.145 0.684 0.000 0.025 0.040 0.537 1.422 -0.465 1.136 0.682 0.000 0.077 0.129 0.552 1.340Stuttering: Parent Rating (lower = better) -0.005 0.043 0.912 0.925 0.008 0.052 0.870 1.129 -0.005 0.044 0.918 0.928 -0.100 0.161 0.534 0.683Stuttering: Teacher Rating (lower = better) -0.039 0.036 0.283 0.521 0.014 0.030 0.645 1.214 -0.036 0.035 0.300 0.545 0.095 0.089 0.288 1.436Verbal MemoryCVLT-C: Free Recall, No Delay 0.026 0.042 0.533 0.022 0.003 0.061 0.954 0.003 0.027 0.042 0.523 0.023 0.225 0.213 0.291 0.044CVLT-C: Free Recall, Short Delay -0.001 0.012 0.909 -0.004 -0.020 0.017 0.233 -0.053 -0.001 0.012 0.925 -0.003 0.032 0.060 0.594 0.022CVLT-C: Cued Recall, Short Delay 0.003 0.010 0.784 0.010 -0.002 0.015 0.917 -0.005 0.003 0.010 0.762 0.011 S 0.094 0.052 0.072 0.075CVLT-C: Free Recall, Long Delay 0.006 0.011 0.562 0.021 -0.023 0.016 0.144 -0.065 0.006 0.011 0.550 0.021 0.028 0.056 0.618 0.021CVLT-C: Cued Recall, Long Delay 0.013 0.011 0.236 0.043 0.004 0.016 0.800 0.011 0.013 0.011 0.231 0.043 S* 0.087 0.055 0.115 0.067CMS Stories 1: Immediate Recall 0.051 0.053 0.329 0.028 -0.086 0.078 0.267 -0.040 0.052 0.053 0.325 0.028 -0.037 0.274 0.893 -0.005CMS Stories 2: Delayed Recall 0.022 0.052 0.678 0.012 -0.029 0.076 0.705 -0.014 0.022 0.052 0.670 0.012 0.086 0.270 0.749 0.011AchievementWJIII: Letter- Word Identification 0.030 0.033 0.358 0.027 S 0.113 0.048 0.019 + 0.086 0.031 0.033 0.347 0.027 0.022 0.170 0.897 0.004Fine Motor CoordinationGrooved Pegboard: Dominant Hand (lower = better) -0.145 0.081 0.073 -0.044 -0.103 0.117 0.378 -0.027 -0.145 0.081 0.073 -0.044 -0.419 0.417 0.315 -0.029Grooved Pegboard: Non-dom Hand (lower = better) -0.115 0.098 0.242 -0.030 -0.203 0.143 0.155 -0.046 -0.115 0.098 0.242 -0.030 -0.161 0.504 0.750 -0.010Finger Tapping: Dominant Hand -0.025 0.028 0.364 -0.031 0.062 0.041 0.130 0.065 -0.024 0.027 0.375 -0.030 S 0.411 0.144 0.004 + 0.115Finger Tapping: Non-dominant Hand -0.038 0.025 0.126 -0.051 0.043 0.037 0.244 0.049 -0.037 0.025 0.138 -0.049 S* 0.268 0.129 0.038 + 0.082Visual Spatial AbilityStanford Binet: Copying S* 0.029 0.014 0.033 + 0.080 S -0.015 0.020 0.444 -0.036 S* 0.029 0.014 0.032 + 0.081 -0.004 0.070 0.960 -0.002Attention/Executive FunctioningGDS Vigilance Task: Correct Responses -0.013 0.023 0.580 -0.021 0.028 0.034 0.398 0.039 -0.012 0.023 0.596 -0.020 0.088 0.119 0.457 0.033GDS Vigilance Task: Errors (lower = better) 0.025 0.060 0.674 0.016 0.066 0.087 0.444 0.036 0.025 0.060 0.677 0.016 -0.013 0.305 0.966 -0.002WISC III: Digit Span, Forward Recall S* 0.010 0.009 0.220 0.046 -0.001 0.012 0.924 -0.004 S* 0.011 0.009 0.219 0.046 -0.036 0.044 0.419 -0.036WISC III: Digit Span, Backward Recall -0.018 0.007 0.015 * -0.091 0.011 0.011 0.288 0.050 -0.018 0.007 0.016 * -0.090 0.055 0.038 0.148 0.065WISC III: Digit Span, Combined -0.006 0.013 0.619 -0.018 0.012 0.019 0.512 0.030 -0.006 0.013 0.620 -0.018 0.013 0.068 0.851 0.008BRIEF Parent Rating: Metacognition (lower = better) S* 0.128 0.083 0.123 0.058 -0.030 0.120 0.803 -0.012 S* 0.129 0.083 0.119 0.059 0.388 0.423 0.360 0.041BRIEF Teacher Rating: Metacognition (lower = better) 0.068 0.112 0.546 0.025 -0.121 0.172 0.483 -0.038 0.063 0.112 0.570 0.023 S* 0.904 0.606 0.137 0.076Behavior Regulation (lower = better)CRS-R: Parent Rating: Hyperactive/Impulsive 0.021 0.023 0.369 0.034 0.038 0.034 0.266 0.053 0.021 0.023 0.368 0.034 0.156 0.121 0.200 0.058CRS-R: Teacher Rating: Hyperactive/Impulsive 0.029 0.028 0.291 0.042 -0.042 0.044 0.341 -0.052 0.029 0.028 0.294 0.042 0.159 0.153 0.299 0.053CRS-R: Parent Rating: Inattentive S* 0.046 0.027 0.090 0.064 -0.030 0.039 0.448 -0.036 S* 0.046 0.027 0.087 0.065 0.112 0.138 0.417 0.036CRS-R: Teacher Rating: Inattentive 0.002 0.036 0.946 0.003 0.001 0.057 0.991 0.001 0.001 0.036 0.976 0.001 S* 0.342 0.196 0.081 0.089BRIEF Parent Rating: Behavior Regulation 0.000 0.050 0.994 0.000 S 0.157 0.072 0.030 * 0.103 0.000 0.050 0.995 0.000 0.128 0.255 0.615 0.023BRIEF Teacher Rating: Behavior Regulation 0.049 0.060 0.421 0.033 -0.008 0.093 0.931 -0.005 0.045 0.060 0.453 0.031 0.474 0.325 0.145 0.075Tics (lower = better)Motor tics (current): Assessor Rating 0.012 0.013 0.361 1.213 0.055 0.027 0.043 * 2.186 0.012 0.013 0.355 1.217 S 0.062 0.083 0.453 1.267Phonics tics (current): Assessor Rating -0.007 0.019 0.705 0.888 S 0.063 0.028 0.026 * 2.443 -0.007 0.019 0.698 0.886 0.108 0.088 0.218 1.513Motor tics (current): Parent Rating 0.008 0.012 0.519 1.141 0.003 0.024 0.897 1.046 0.009 0.012 0.460 1.164 -0.032 0.085 0.710 0.886Phonics tics (current): Parent Rating -0.002 0.016 0.919 0.973 S* 0.040 0.024 0.088 1.780 -0.002 0.016 0.914 0.971 0.027 0.082 0.743 1.109General Intellectual FunctioningWASI Verbal IQ 0.060 0.059 0.308 0.034 0.008 0.086 0.924 0.004 0.062 0.059 0.291 0.035 -0.090 0.303 0.766 -0.012WASI Performance IQ 0.004 0.067 0.955 0.002 0.145 0.098 0.137 0.068 0.005 0.067 0.938 0.003 S* 0.876 0.352 0.013 + 0.110WASI Full Scale IQ 0.042 0.060 0.487 0.024 0.073 0.088 0.407 0.036 0.043 0.060 0.476 0.024 S* 0.362 0.314 0.249 0.048
< .05 >.05, <.10 < .05 >.05, <.10Key: Mercury effect = Better Outcome p-value+ p-value Mercury effect =Worse Outcome p-value* p-value
P-values shown are rounded to 3 decimal places. Therefore, a value shown as 0.050 may satisify p<0.05 criterion if the original value was rounded up, or may not satisify the criterion if the value was rounded down.S* (S) = Coefficient for males is significantly different than coefficient for females at the 0.05 (0.10) level
PreNatThimer HepBModel (2)
Exp07mosTest
Model (1)PreNatThimer
Est S.E. P StCf
0.037 0.043 0.386 0.0310.004 0.054 0.948 0.003
-0.029 0.019 0.131 -0.069-0.029 0.042 0.491 -0.029-0.016 0.088 0.854 -0.0080.006 0.014 0.650 0.0220.017 0.044 0.693 1.2570.020 0.055 0.715 1.3100.002 0.032 0.962 1.021
-0.025 0.066 0.709 -0.017-0.027 0.018 0.147 -0.065-0.013 0.016 0.405 -0.037-0.029 0.017 0.085 -0.077-0.007 0.017 0.696 -0.018-0.093 0.084 0.272 -0.040-0.043 0.083 0.600 -0.019
0.124 0.052 0.018 + 0.088
-0.065 0.127 0.609 -0.016-0.208 0.155 0.180 -0.0440.018 0.044 0.681 0.0180.015 0.040 0.714 0.016
S -0.017 0.021 0.441 -0.037
0.021 0.037 0.569 0.0270.076 0.094 0.418 0.0380.003 0.014 0.815 0.0110.006 0.012 0.616 0.0240.012 0.021 0.550 0.028
-0.082 0.130 0.528 -0.030-0.251 0.187 0.179 -0.074
0.023 0.037 0.533 0.030-0.069 0.048 0.150 -0.079-0.048 0.043 0.265 -0.053-0.045 0.061 0.466 -0.0410.159 0.078 0.042 * 0.097
-0.070 0.101 0.492 -0.038
0.053 0.029 0.065 2.0300.057 0.029 0.053 2.1370.006 0.027 0.813 1.087
S* 0.042 0.026 0.099 1.754
0.017 0.093 0.858 0.0080.056 0.105 0.597 0.0240.038 0.095 0.691 0.017
Exp17mos

Abt Associates Inc. Chapter 9 136
9.2.4. Cumulative Effects of Exposures Spanning thePrenatal Period Though Age 7 Months
9.2.4.1. IntroductionThe analyses summarized in this section present the results of two additional hypothesistests conducted to evaluate the combined effects of prenatal and postnatal exposures. Thefirst is a joint test for additive effects of prenatal and postnatal exposure, and the secondis an interaction test. The first simply tests the joint hypothesis that both effects are zero.This is done to guard against the possibility that prenatal or postnatal exposure effects areobscured by correlated errors of estimate. Because we are concerned with the cumulativeeffect, we only use this test when the two estimated effects are in the same direction (i.e.,both prenatal and postnatal estimates are in the direction of harm, or both are in thedirection of benefit). The second is a test for an interaction effect of prenatal andpostnatal exposure. This test was motivated by a theory that prenatal exposure couldexacerbate the effects of postnatal exposure.
The models producing the two additional hypothesis tests were fit to three sets of data.The first set was comprised of the entire sample of 1,047 assessed children. The secondwas a subset comprised only of data from females (n=538), and the third was the subsetcomprised only of males (n=509).
9.2.4.2. Model Specifications for Two Additional HypothesisTests
Joint TestThe first of the two tests is a test of the joint hypothesis that the effects of prenatalexposure and cumulative exposures from birth through seven months are both zero. Themodel is the same as model (1), presented in Section 9.2.2.2., but with an additionalhypothesis as specified below. Because we are concerned with cumulative effects, thistest is conducted only when coefficients for PreNatThimer and Exp07mos have the samesign (i.e., both are positive or both are negative). We used an F-test for linearregressions, and a likelihood ratio test for outcomes where logistic regression modelswere used to obtain estimates of the effects on binary outcomes.
l
llkjk
kkjj
jj StcfoemosExperpreNatThimY 07210
00
:00
:2
1
2
10
aHvsH
Interaction Model

Abt Associates Inc. Chapter 9 137
This model produces a test of whether there is an interaction effect of PreNatThimer andExp07mos that goes above and beyond the additive effects of the two terms.
l
llkjk
kkjj
jj Stcfoe
mosExperpreNatThimmosExperpreNatThimY 07*07 3210
0:0: 330 aHvsH
9.2.4.3. ResultsA summary of models fit to the full data set is shown in Exhibit 9.2.4.1. Summaries ofmodels fit to the subsets of data from females, and males are shown in Exhibits 9.2.4.2and 9.4.2.3, respectively.
9.2.4.3.1. Joint Test for Additive EffectThe test for a cumulative effect makes sense only when the direction of the effect forPreNatThimer is consistent with the direction of the Exp07mos effect (i.e., coefficientsfor both are negative or coefficients for both are positive). When both are in a consistentdirection, it is possible to find that a small, statistically non-significant effect ofPreNatThimer can combine with a small, statistically non-significant effect of Exp07mosto result in a statistically significant combined effect of both. When the directions of thetwo effects are not consistent (e.g., PreNatThimer weakly associated with better outcomescores, and Exp07mos weakly associated with worse outcome scores) it makes no senseto conduct a joint test of a combined additive effect for both.
Full Data SetOf the 42 outcome measures, there were 13 for which the effects of PreNatThimer andExp07mos were in a consistent direction. For five outcomes the effects were in thedirection of worse outcomes and for eight the effects were in the direction of betteroutcomes.
For the following five outcome measures, both the coefficients for of PreNatThimer andExp07mos were in the direction of increased exposure being related to worse outcomes:
NEPSY: Comprehension of instructions CVLT-C Free Recall, Short Delay CVLT-C Cued Recall, Short Delay CRS-R: Parent Rating: Hyperactive / impulsive Motor tics (current): Assessor rating
For the following eight outcome measures, both the coefficients for of PreNatThimer andExp07mos were in the direction of increased exposure being related to better outcomes:
Boston Naming Test NEPSY: Speeded Naming CVLT-C Cued Recall, Long Delay WJIII: Letter- Word Identification Grooved Pegboard: Dominant hand (lower=better)

Abt Associates Inc. Chapter 9 138
Grooved Pegboard: Non-Dominant hand (lower=better) Stanford Binet: Copying WASI Full Scale IQ
The joint hypothesis test was conducted for the 13 outcome measures listed above. Onlyone test was significant at the p<0.05 level. For the outcome measure, GroovedPegboard: Non-dominant Hand, the weak prenatal effect combined with the strongerpostnatal effect to result in a significant combined effect (p=0.02 for the hypothesis thatboth effects are zero). This effect was in the direction of higher exposure to ethylmercuryfrom thimerosal being associated with lower response times (better scores) on the test.
Models Fit to Data from Females Only
For females, 21 of the 42 outcome measures had PreNatThimer and Exp07mos effectsthat were both in the same direction. For 14 of the outcome measures both estimates werein the direction of benefit, and for the remaining 7 outcome measures both estimates werein the direction of harm. None of the joint tests were statistically significant.
Models Fit to Data from Males Only
For males, 16 of the 42 outcome measures had PreNatThimer and Exp07mos effects thatwere both in the same direction. For 10 of the outcome measures both estimates were inthe direction of benefit, and for the remaining 6 outcome measures both estimates were inthe direction of harm. Two of the joint tests were significant at the p<0.05 level. For theoutcome measure, WJIII Letter Word Identification, the weak prenatal effect combinedwith the stronger postnatal effect to result in a significant combined effect (p=0.03 forthe hypothesis that both effects are zero). This effect was in the direction of higherexposure to ethylmercury from thimerosal being associated with better scores on the test.For the outcome measure, Grooved Pegboard Dominant Hand, the weak postnatal effectcombined with the stronger prenatal effect to result in a significant combined effect(p=0.045 for the hypothesis that both effects are zero). This effect was in the direction ofhigher exposure to ethylmercury from thimerosal being associated with better scores onthe test.

Abt Associates Inc. Chapter 9 139
Exhibit 9.2.4.1. Summary of Models Testing Effects of Cumulative Exposure Prenatal Through Seven Months–Full Data Set (n=1,047)
Est S.E. P StCf Est S.E. P StCf Est S.E. PSpeech and LanguageBoston Naming Test 0.032 0.022 0.143 0.033 0.050 0.030 0.096 0.045 0.078 0.092 0.087 0.294NEPSY: Speeded Naming 0.057 0.027 0.034+ 0.058 0.010 0.038 0.784 0.009 0.100 0.281 0.109 0.010+NEPSY: Comprehension of Instructions -0.002 0.010 0.860 -0.005 -0.014 0.014 0.310 -0.035 0.583 -0.012 0.039 0.758CELF: Formulated Sentences 0.021 0.021 0.327 0.026 -0.035 0.030 0.237 -0.038 . 0.042 0.085 0.621CELF: Recalling Sentences 0.058 0.044 0.187 0.034 -0.001 0.062 0.984 -0.001 . 0.169 0.178 0.341GFTA: Articulation (lower = better) -0.002 0.007 0.804 -0.007 0.011 0.010 0.249 0.042 . -0.033 0.027 0.229Stuttering: Assessor Rating (lower = better) -0.002 0.021 0.907 0.959 0.026 0.033 0.434 1.443 . 0.068 0.097 0.482Stuttering: Parent Rating (lower = better) -0.024 0.048 0.616 0.668 0.020 0.043 0.644 1.327 . -0.033 0.158 0.836Stuttering: Teacher Rating (lower = better) -0.042 0.030 0.160 0.500 0.011 0.025 0.674 1.163 . -0.011 0.094 0.905Verbal MemoryCVLT-C: Free Recall, No Delay 0.029 0.033 0.385 0.024 -0.001 0.046 0.975 -0.001 . 0.094 0.134 0.484CVLT-C: Free Recall, Short Delay -0.001 0.009 0.887 -0.004 -0.024 0.013 0.066 -0.063 0.181 0.016 0.038 0.663CVLT-C: Cued Recall, Short Delay -0.001 0.008 0.910 -0.003 -0.005 0.011 0.639 -0.016 0.888 -0.001 0.033 0.975CVLT-C: Free Recall, Long Delay 0.001 0.009 0.917 0.003 -0.019 0.012 0.108 -0.054 . 0.040 0.035 0.248CVLT-C: Cued Recall, Long Delay 0.005 0.008 0.568 0.016 0.001 0.012 0.928 0.003 0.844 0.023 0.034 0.507CMS Stories 1: Immediate Recall 0.024 0.042 0.570 0.013 -0.030 0.060 0.610 -0.014 . 0.254 0.169 0.134CMS Stories 2: Delayed Recall -0.010 0.041 0.817 -0.005 0.005 0.059 0.936 0.002 . 0.258 0.167 0.123AchievementW JIII: Letter- Word Identification 0.011 0.026 0.675 0.010 0.062 0.037 0.094 0.047 0.220 0.071 0.106 0.503Fine Motor CoordinationGrooved Pegboard: Dominant Hand (lower = better) -0.109 0.064 0.089 -0.033 -0.080 0.089 0.371 -0.021 0.149 -0.141 0.259 0.587Grooved Pegboard: Non-dom Hand (lower = better) -0.083 0.077 0.284 -0.022 -0.274 0.109 0.012+ -0.062 0.022+ -0.336 0.315 0.286Finger Tapping: Dominant Hand -0.015 0.022 0.502 -0.018 0.034 0.031 0.271 0.036 . -0.063 0.089 0.477Finger Tapping: Non-dominant Hand -0.015 0.020 0.455 -0.020 0.018 0.028 0.524 0.020 . -0.056 0.080 0.482Visual Spatial AbilityStanford Binet: Copying 0.005 0.011 0.628 0.014 0.007 0.015 0.667 0.016 0.804 0.094 0.043 0.030+Attention/Executive FunctioningGDS Vigilance Task: Correct Responses -0.013 0.018 0.470 -0.021 0.032 0.026 0.209 0.045 . -0.032 0.074 0.663GDS Vigilance Task: Errors (lower = better) 0.033 0.047 0.489 0.020 -0.022 0.067 0.742 -0.012 . -0.036 0.191 0.852W ISC III: Digit Span, Forward Recall 0.000 0.007 0.983 0.001 -0.002 0.010 0.820 -0.008 . -0.018 0.027 0.511W ISC III: Digit Span, Backward Recall -0.013 0.006 0.027* -0.066 0.018 0.008 0.028 + 0.078 . -0.057 0.024 0.016*W ISC III: Digit Span, Combined -0.012 0.010 0.244 -0.034 0.017 0.015 0.242 0.041 . -0.069 0.042 0.097BRIEF Parent Rating: Metacognition (lower = better) 0.021 0.066 0.744 0.010 -0.052 0.092 0.573 -0.020 . -0.068 0.266 0.800BRIEF Teacher Rating: Metacognition (lower = better) 0.026 0.088 0.764 0.010 -0.147 0.133 0.268 -0.046 . -0.571 0.357 0.110Behavior Regulation (lower = better)CRS-R: Parent Rating: Hyperactive/Impulsive 0.007 0.019 0.725 0.011 0.019 0.026 0.469 0.026 0.717 -0.103 0.074 0.168CRS-R: Teacher Rating: Hyperactive/Impulsive 0.023 0.022 0.301 0.033 -0.048 0.034 0.157 -0.059 . -0.219 0.090 0.015+CRS-R: Parent Rating: Inattentive 0.011 0.022 0.606 0.016 -0.024 0.030 0.433 -0.028 . 0.068 0.087 0.438CRS-R: Teacher Rating: Inattentive 0.002 0.029 0.939 0.002 -0.034 0.043 0.432 -0.033 . -0.200 0.116 0.086BRIEF Parent Rating: Behavior Regulation -0.021 0.040 0.594 -0.016 0.077 0.055 0.167 0.050 . -0.249 0.160 0.119BRIEF Teacher Rating: Behavior Regulation 0.035 0.048 0.455 0.024 -0.045 0.072 0.535 -0.026 . -0.249 0.192 0.195Tics (lower = better)Motor tics (current): Assessor Rating 0.017 0.011 0.104 1.336 0.032 0.022 0.142 1.586 0.326 0.121 0.051 0.017 *Phonics tics (current): Assessor Rating -0.011 0.018 0.560 0.839 0.037 0.023 0.102 1.702 . 0.066 0.073 0.362Motor tics (current): Parent Rating 0.003 0.012 0.832 1.043 -0.001 0.021 0.963 0.986 . 0.021 0.054 0.700Phonics tics (current): Parent Rating -0.014 0.016 0.409 0.798 0.007 0.019 0.699 1.109 . 0.048 0.061 0.428General Intellectual FunctioningW ASI Verbal IQ 0.054 0.047 0.252 0.030 -0.044 0.066 0.506 -0.021 . 0.136 0.189 0.472W ASI Performance IQ -0.008 0.054 0.881 -0.004 0.130 0.074 0.080 0.061 . 0.303 0.224 0.177W ASI Full Scale IQ 0.026 0.048 0.594 0.015 0.059 0.068 0.383 0.029 0.584 0.244 0.201 0.226
< .05 >.05, <.10Key: Mercury effect = Better Outcome p-value+ p-value Mercury effect =Worse Outcome
P-values shown are rounded to 3 decimal places. Therefore, a value shown as 0.050 may satisify p<0.05 criterion if the original value was rounded up, or may not satisify the criterion if the value was rounded down.
Test
Model w/ Joint TestPreNatThimer Exp07mos Joint
TestPreNatThimer
Est S.E. P Est S.E. P
0.054 0.031 0.077 -0.003 0.004 0.4770.026 0.039 0.504 -0.010 0.005 0.034*
-0.015 0.014 0.295 0.000 0.002 0.785-0.034 0.030 0.267 -0.001 0.004 0.7950.006 0.063 0.922 -0.005 0.007 0.5200.009 0.010 0.365 0.001 0.001 0.2380.030 0.033 0.361 -0.003 0.005 0.4770.019 0.044 0.659 0.000 0.007 0.9550.012 0.026 0.629 -0.001 0.004 0.741
0.003 0.047 0.950 -0.003 0.006 0.616-0.023 0.013 0.087 -0.001 0.002 0.626-0.005 0.012 0.644 0.000 0.001 0.997-0.017 0.012 0.175 -0.002 0.001 0.2440.002 0.012 0.849 -0.001 0.001 0.589
-0.014 0.061 0.816 -0.010 0.007 0.1610.023 0.060 0.702 -0.012 0.007 0.099
0.066 0.038 0.080 -0.003 0.004 0.559
-0.082 0.091 0.367 0.001 0.011 0.899-0.291 0.111 0.009 + 0.011 0.013 0.4070.031 0.032 0.330 0.002 0.004 0.5740.015 0.029 0.604 0.002 0.003 0.593
0.013 0.015 0.406 -0.004 0.002 0.035*
0.031 0.026 0.237 0.001 0.003 0.791-0.027 0.068 0.694 0.003 0.008 0.713-0.003 0.010 0.722 0.001 0.001 0.4940.015 0.008 0.070 0.002 0.001 0.0550.013 0.015 0.372 0.002 0.002 0.157
-0.058 0.094 0.535 0.004 0.011 0.730-0.193 0.135 0.154 0.025 0.015 0.085
0.012 0.026 0.659 0.005 0.003 0.130-0.066 0.034 0.054 0.010 0.004 0.006*-0.020 0.031 0.524 -0.002 0.004 0.504-0.050 0.044 0.260 0.009 0.005 0.0740.061 0.056 0.278 0.010 0.007 0.141
-0.066 0.073 0.367 0.012 0.008 0.127
0.040 0.022 0.070 -0.004 0.002 0.046+0.042 0.023 0.070 -0.004 0.004 0.3050.000 0.021 0.990 -0.001 0.002 0.7320.011 0.019 0.556 -0.003 0.003 0.317
-0.038 0.067 0.571 -0.004 0.008 0.6520.151 0.076 0.046+ -0.014 0.010 0.1530.074 0.069 0.284 -0.010 0.009 0.265
< .05 >.05, <.10p-value* p-value
P-values shown are rounded to 3 decimal places. Therefore, a value shown as 0.050 may satisify p<0.05 criterion if the original value was rounded up, or may not satisify the criterion if the value was rounded down.
Exp07mos PreNatThimer X Exp07mos
Interaction Model: Prenatal byPostnatal

Abt Associates Inc. Chapter 9 140
.Exhibit 9.2.4.2. Summary of Models Testing Effects of Cumulative Exposure Prenatal Through Seven Months – Females (n=538)
Est S.E . P
-0.004 0.006 0.441-0.010 0.006 0.1390.000 0.002 0.840
-0.003 0.005 0.598-0.006 0.011 0.5600.002 0.002 0.289
-0.011 0.007 0.124-0.001 0.571 0.9980.005 0.007 0.509
-0.006 0.008 0.428-0.003 0.002 0.255-0.001 0.002 0.557-0.005 0.002 0.023*-0.002 0.002 0.283-0.007 0.010 0.513-0.007 0.010 0.506
-0.004 0.006 0.551
0.001 0.017 0.9430.014 0.019 0.4640.000 0.005 0.9950.002 0.005 0.676
-0.004 0.003 0.163
0.001 0.004 0.7730.005 0.009 0.5380.000 0.002 0.8900.001 0.001 0.4200.001 0.003 0.5830.020 0.016 0.2020.025 0.021 0.222
0.003 0.004 0.4890.001 0.004 0.7420.004 0.005 0.4690.007 0.006 0.2810.014 0.009 0.1410.005 0.011 0.639
-0.010 0.006 0.089-0.004 0.009 0.675-0.014 0.010 0.182-0.017 0.010 0.097
0.005 0.012 0.691-0.003 0.015 0.8520.003 0.013 0.844
PreNatThim er X Exp07mosEst S.E. P StCf Est S.E. P StCf Est S.E. P Est S .E . P
Speech and LanguageBoston Nam ing Test 0.037 0.036 0.303 0.039 0.053 0.045 0.240 0.048 0.294 0.139 0.137 0.310 0.060 0.046 0.192NEPSY: Speeded Nam ing 0.041 0.042 0.337 0.042 0.018 0.054 0.738 0.016 0.595 0.269 0.160 0.093 0.035 0.055 0.523NEPSY: Com prehension of Instructions 0.007 0.016 0.658 0.021 -0.005 0.020 0.815 -0.012 . -0.005 0.060 0.938 -0.006 0.021 0.786CELF: Form ulated Sentences 0.035 0.032 0.273 0.043 -0.022 0.040 0.593 -0.023 . 0.097 0.121 0.424 -0.017 0.041 0.681CELF: Recalling Sentences 0.060 0.072 0.403 0.035 0.025 0.090 0.780 0.013 0.677 0.212 0.271 0.433 0.036 0.092 0.693GFTA: Articula tion (lower = better) -0.006 0.011 0.547 -0.029 0.007 0.014 0.600 0.027 . -0.048 0.040 0.237 0.004 0.014 0.778Stuttering: Assessor Rating (lower = better) 0.043 0.025 0.086 2.033 0.043 0.059 0.467 1.839 0.760 0.293 0.151 0.052 0.066 0.061 0.285Stuttering: Parent Rating (lower = better) -0.712 8.358 0.932 0.000 0.096 0.080 0.230 3.927 . -0.529 13.692 0.969 0.096 0.080 0.230Stuttering: Teacher Rating (lower = better) -0.041 0.050 0.410 0.503 -0.001 0.045 0.987 0.990 1.000 -0.172 0.216 0.426 -0.005 0.045 0.904Verbal M emoryCVLT-C: Free Recall, No Delay 0.017 0.053 0.752 0.014 -0.008 0.066 0.907 -0.006 . 0.170 0.200 0.397 0.004 0.068 0.955CVLT-C: Free Recall, Short Delay -0.004 0.015 0.793 -0.012 -0.031 0.018 0.091 -0.082 0.232 0.058 0.056 0.304 -0.026 0.019 0.165CVLT-C: Cued Recall, Short Delay -0.012 0.012 0.336 -0.041 -0.013 0.015 0.387 -0.040 0.432 0.014 0.046 0.756 -0.011 0.016 0.475CVLT-C: Free Recall, Long Delay -0.010 0.013 0.446 -0.033 -0.022 0.017 0.190 -0.061 0.320 0.099 0.050 0.047+ -0.013 0.017 0.435CVLT-C: Cued Recall, Long Delay -0.010 0.012 0.412 -0.034 0.003 0.016 0.841 0.009 . 0.039 0.047 0.413 0.007 0.016 0.675CMS Stories 1: Im m ediate Recall 0.003 0.067 0.964 0.002 0.071 0.084 0.400 0.032 0.701 0.162 0.252 0.520 0.083 0.086 0.337CMS Stories 2: Delayed Recall -0.049 0.065 0.451 -0.027 0.092 0.083 0.268 0.043 . 0.108 0.245 0.659 0.103 0.085 0.221Achievem entW JIII: Letter- W ord Identification -0.031 0.042 0.452 -0.028 -0.015 0.053 0.776 -0.012 0.724 0.060 0.158 0.706 -0.008 0.054 0.879Fine M otor CoordinationGrooved Pegboard: Dom inant Hand (lower = better) -0.070 0.108 0.515 -0.021 -0.064 0.134 0.631 -0.017 0.722 -0.099 0.407 0.809 -0.066 0.137 0.628Grooved Pegboard: Non-dom Hand (lower = better) -0.037 0.127 0.771 -0.010 -0.308 0.161 0.056 -0.070 0.155 -0.375 0.478 0.433 -0.334 0.165 0.043+Finger Tapping: Dom inant Hand 0.004 0.034 0.899 0.005 -0.005 0.043 0.903 -0.006 . 0.004 0.129 0.978 -0.005 0.044 0.904Finger Tapping: Non-dom inant Hand 0.022 0.030 0.468 0.029 -0.024 0.039 0.532 -0.028 . -0.024 0.115 0.833 -0.028 0.040 0.484Visual Spatial AbilityStanford Binet: Copying -0.039 0.018 0.026* -0.110 0.016 0.022 0.480 0.038 . 0.050 0.066 0.452 0.023 0.023 0.324Attention/Executive FunctioningGDS Vigilance Task: Correct Responses -0.018 0.028 0.515 -0.030 0.046 0.036 0.195 0.064 . -0.048 0.106 0.652 0.044 0.037 0.230GDS Vigilance Task: Errors (lower = better) 0.023 0.057 0.685 0.014 -0.123 0.072 0.090 -0.066 . -0.104 0.214 0.627 -0.132 0.074 0.074W ISC III: Digit Span, Forward Recall -0.015 0.011 0.195 -0.065 -0.008 0.014 0.578 -0.030 0.368 -0.009 0.043 0.835 -0.008 0.015 0.606W ISC III: Digit Span, Backward Recall -0.004 0.009 0.684 -0.020 0.026 0.012 0.025+ 0.115 . -0.032 0.036 0.376 0.024 0.012 0.044+W ISC III: D ig it Span, Com bined -0.019 0.017 0.254 -0.054 0.023 0.021 0.265 0.057 . -0.053 0.064 0.407 0.021 0.022 0.329BRIEF Parent Rating: Metacognition (lower = better) -0.159 0.102 0.120 -0.073 -0.084 0.126 0.506 -0.033 0.241 -0.633 0.385 0.101 -0.121 0.129 0.352BRIEF Teacher Rating: Metacognition (lower = better) -0.043 0.133 0.745 -0.016 -0.011 0.181 0.952 -0.003 0.947 -0.663 0.524 0.206 -0.073 0.188 0.699Behavior Regulation (low er = better)CRS-R: Parent Rating: Hyperactive/Im pulsive -0.020 0.029 0.475 -0.033 -0.030 0.036 0.402 -0.042 0.547 -0.092 0.107 0.391 -0.036 0.037 0.336CRS-R: Teacher Rating: Hyperactive/Im pulsive 0.008 0.029 0.779 0.012 -0.051 0.039 0.193 -0.063 . -0.028 0.114 0.805 -0.055 0.041 0.180CRS-R: Parent Rating: Inattentive -0.048 0.032 0.139 -0.067 -0.020 0.040 0.627 -0.023 0.300 -0.132 0.121 0.276 -0.026 0.041 0.525CRS-R: Teacher Rating: Inattentive -0.001 0.041 0.989 -0.001 -0.048 0.056 0.391 -0.046 0.692 -0.169 0.162 0.296 -0.064 0.058 0.266BRIEF Parent Rating: Behavior Regulation -0.058 0.062 0.349 -0.044 -0.044 0.077 0.566 -0.029 0.549 -0.386 0.231 0.095 -0.070 0.079 0.379BRIEF Teacher Rating: Behavior Regulation 0.037 0.070 0.596 0.026 -0.019 0.096 0.839 -0.012 . -0.087 0.274 0.750 -0.031 0.099 0.752Tics (low er = better)Motor tics (current): Assessor Rating 0.041 0.022 0.065 1.972 0.019 0.038 0.619 1.306 0.882 0.244 0.112 0.029* 0.036 0.039 0.350Phonics tics (current): Assessor Rating -0.018 0.044 0.688 0.747 0.039 0.039 0.316 1.757 . 0.065 0.192 0.734 0.042 0.040 0.291Motor tics (current): Parent Rating -0.064 0.059 0.277 0.344 0.010 0.041 0.800 1.159 . 0.211 0.191 0.270 0.022 0.042 0.595Phonics tics (current): Parent Rating -0.102 0.063 0.107 0.184 -0.035 0.035 0.321 0.609 0.614 0.198 0.170 0.244 -0.022 0.036 0.544General Intellectual FunctioningW ASI Verbal IQ 0.021 0.076 0.788 0.012 -0.087 0.096 0.363 -0.043 . -0.089 0.287 0.756 -0.095 0.098 0.332W ASI Perform ance IQ -0.034 0.086 0.696 -0.018 0.129 0.102 0.206 0.060 . 0.028 0.342 0.935 0.134 0.105 0.203W ASI Full Scale IQ -0.022 0.079 0.785 -0.012 0.079 0.097 0.415 0.039 . -0.081 0.313 0.795 0.075 0.100 0.454
< .05 >.05, <.10 < .05 >.05, <.10Key: Mercury effect = Better Outcom e p-value+ p-value Mercury effect =W orse Outcom e p-value* p-va lue
P-values shown are rounded to 3 decim al places. Therefore, a value shown as 0.050 m ay satisify p<0.05 criterion if the orig ina l va lue was rounded up, or m ay not satisify the criterion if the value was rounded down.
Test
M odel w / Joint TestPreNatThimer Exp07mos Joint
TestPreNatThim er Exp07m os
Interaction M odel: Prenatal byPostnatal

Abt Associates Inc. Chapter 9 141
.Exhibit 9.2.4.3. Summary of Models Testing Effects of Cumulative Exposure Prenatal Through Seven Months – Males (n=509)
E st S .E . P
-0 .001 0.005 0.910-0 .007 0.007 0.2940.002 0.002 0.4140.003 0.005 0.588
-0 .002 0.011 0.8540.001 0.002 0.5300.007 0.224 0.9740.000 0.006 0.969
-0 .008 0.007 0.242
-0 .003 0.008 0.7610.001 0.002 0.7360.002 0.002 0.4600.001 0.002 0.7340.001 0.002 0.705
-0 .011 0.010 0.300-0 .014 0.010 0.172
0.001 0.006 0.834
-0 .009 0.015 0.552-0 .006 0.019 0.7370.004 0.005 0.4750.000 0.005 0.934
-0 .003 0.003 0.273
0.003 0.005 0.458-0 .008 0.013 0.5300.002 0.002 0.2300.002 0.001 0.1160.003 0.003 0.200
-0 .008 0.017 0.6280.032 0.023 0.161
0.006 0.005 0.2020.020 0.006 0.002*
-0 .009 0.006 0.1290.012 0.008 0.1280.005 0.010 0.6280.021 0.013 0.105
-0 .004 0.003 0.129-0 .006 0.005 0.1710.000 0.003 0.913
-0 .002 0.003 0.553
-0 .009 0.011 0.417-0 .019 0.013 0.146-0 .016 0.012 0.177
P reN atT him er X E xp 07m osE st S .E . P S tC f E st S .E . P S tC f E st S .E . P E st S .E . P
S p eec h an d Lan g uag eB o ston N a m ing Te st 0 .0 40 0.028 0.152 0.041 0.0 52 0 .04 2 0 .21 6 0.047 0.149 0.053 0.119 0.659 0.053 0.043 0.217N E P S Y: S p eeded N a m ing 0.0 56 0.036 0.123 0.057 0.0 02 0 .05 6 0 .97 1 0.002 0.300 0.217 0.158 0.169 0.011 0.057 0.840N E P S Y: C om prehen sion of Ins truc tions -0 .0 11 0.013 0.412 -0 .031 -0 .0 27 0 .02 0 0 .16 9 -0 .069 0.253 -0 .056 0.057 0.326 -0 .030 0.020 0.137C E LF : Fo rm u la te d S e nte nces 0.0 17 0.029 0.554 0.021 -0 .0 45 0 .04 5 0 .31 4 -0 .048 . -0 .049 0.125 0.698 -0 .050 0.046 0.279C E LF : R eca lling S entences 0.0 65 0.059 0.272 0.038 -0 .0 39 0 .08 9 0 .66 6 -0 .019 . 0 .110 0.254 0.664 -0 .036 0.091 0.692G F TA : A rticu la tion (low er = b ette r) 0 .0 02 0.009 0.802 0.010 0.0 18 0 .01 4 0 .18 2 0.070 0.390 -0 .021 0.038 0.581 0.017 0.014 0.228S tu tte ring : A ssessor R ating (low er = bette r) -0 .4 70 1.061 0.658 0.000 0.0 15 0 .04 1 0 .71 0 1.246 . -0 .636 4.816 0.895 0.015 0.041 0.710S tu tte ring : P a rent R a tin g (low er = bette r) -0 .0 04 0.042 0.917 0.930 -0 .0 19 0 .05 4 0 .72 9 0.767 0.943 -0 .010 0.150 0.947 -0 .019 0.055 0.729S tu tte ring : Te ach er R ating (low er = b ette r) -0 .0 33 0.037 0.381 0.579 0.0 19 0 .03 2 0 .55 4 1.311 . 0 .116 0.122 0.344 0.029 0.033 0.389V e rb al M em o ryC V LT-C : Free R e ca ll, N o D elay 0.0 26 0.044 0.554 0.022 -0 .0 19 0 .06 8 0 .78 2 -0 .014 . 0 .084 0.194 0.666 -0 .015 0.069 0.822C V LT-C : Free R e ca ll, S ho rt D e lay -0 .0 05 0.013 0.688 -0 .015 -0 .0 16 0 .01 9 0 .40 6 -0 .041 0.637 -0 .023 0.054 0.674 -0 .017 0.019 0.384C V LT-C : C ued R e ca ll, S ho rt D e lay 0.0 02 0.011 0.881 0.006 0.0 00 0 .01 7 0 .97 9 -0 .001 . -0 .033 0.048 0.494 -0 .002 0.017 0.888C V LT-C : Free R e ca ll, Lo ng D ela y 0.0 03 0.012 0.769 0.011 -0 .0 19 0 .01 8 0 .30 5 -0 .052 . -0 .014 0.052 0.792 -0 .020 0.018 0.288C V LT-C : C ued R e ca ll, Lo ng D ela y 0.0 13 0.012 0.291 0.044 0.0 00 0 .01 9 0 .99 5 0.000 0.570 -0 .007 0.054 0.899 -0 .001 0.019 0.955C M S S tories 1 : Im m edia te R eca ll 0 .0 44 0.056 0.433 0.023 -0 .1 18 0 .08 7 0 .17 7 -0 .054 . 0 .285 0.239 0.234 -0 .103 0.089 0.247C M S S tories 2 : D e layed R e ca ll 0 .0 18 0.056 0.753 0.010 -0 .0 54 0 .08 7 0 .53 3 -0 .025 . 0 .343 0.244 0.161 -0 .037 0.087 0.674A ch ieve m en tW JIII: Le tte r- W o rd Iden tifica tion 0.0 39 0.035 0.261 0.035 0.1 26 0 .05 4 0.020+ 0.096 0 .03 0+ 0.009 0.150 0.953 0.124 0.055 0.0 24+F ine M oto r C o ordin atio nG roo ved P egboa rd : D o m inant H and (low er = bette r) -0 .1 83 0.080 0.0 22+ -0 .055 -0 .0 97 0 .12 1 0 .42 3 -0 .025 0 .04 5+ 0.016 0.344 0.962 -0 .086 0.122 0.481G roo ved P egboa rd : N o n-dom H and (lo we r = bette r) -0 .1 31 0.102 0.199 -0 .034 -0 .1 86 0 .15 5 0 .23 0 -0 .042 0.191 0.015 0.446 0.973 -0 .179 0.157 0.255F ing er Ta pp ing : D om ina nt H a nd -0 .0 20 0.029 0.493 -0 .025 0.0 62 0 .04 6 0 .18 0 0.065 . -0 .108 0.127 0.393 0.056 0.047 0.229F ing er Ta pp ing : N on-d om inant H and -0 .0 28 0.027 0.296 -0 .038 0.0 36 0 .04 2 0 .39 1 0.041 . -0 .038 0.117 0.746 0.036 0.043 0.406V isu al S p atia l A bilityS tanford B ine t: C opyin g 0.0 34 0.014 0.0 15+ 0.095 -0 .0 13 0 .02 1 0 .55 8 -0 .030 . 0 .099 0.061 0.103 -0 .008 0.022 0.702A tten tion /E x ecutive F u nctio ningG D S V ig ilance Task : C orre ct R espon se s -0 .0 24 0.025 0.337 -0 .039 0.0 22 0 .03 9 0 .57 3 0.030 . -0 .104 0.110 0.346 0.017 0.039 0.665G D S V ig ilance Task : E rrors (low er = b ette r) 0 .0 34 0.073 0.643 0.021 -0 .0 19 0 .11 0 0 .86 5 -0 .010 . 0 .228 0.317 0.472 -0 .006 0.112 0.954W IS C III: D ig it S pan , Fo rwa rd R eca ll 0 .0 11 0.009 0.198 0.050 0.0 01 0 .01 3 0 .94 9 0.003 0.433 -0 .032 0.037 0.385 -0 .002 0.013 0.881W IS C III: D ig it S pan , B ackwa rd R eca ll -0 .0 20 0.008 0.0 09* -0 .102 0.0 08 0 .01 2 0 .47 8 0.036 . -0 .071 0.033 0.0 33* 0 .006 0.012 0.643W IS C III: D ig it S pan, C om bine d -0 .0 10 0.014 0.452 -0 .029 0.0 10 0 .02 1 0 .61 7 0.025 . -0 .083 0.058 0.155 0.006 0.021 0.763B R IE F P arent R ating : M etacogn ition (lo we r = bette r) 0 .1 31 0.091 0.153 0.060 -0 .0 20 0 .14 0 0 .88 5 -0 .008 . 0 .318 0.397 0.423 -0 .008 0.142 0.954B R IE F Teacher R ating : M etacogn ition (low er = b ette r) 0 .1 17 0.125 0.352 0.043 -0 .2 72 0 .20 0 0 .17 4 -0 .086 . -0 .632 0.547 0.249 -0 .311 0.201 0.124B eh avio r R eg ulation (lo w er = be tter)C R S -R : P arent R ating : H ypera ctive /Im pu ls ive 0.0 26 0.025 0.308 0.042 0.0 52 0 .03 8 0 .17 4 0.073 0.213 -0 .109 0.109 0.316 0.045 0.039 0.247C R S -R : Teacher R ating : H yp erac tive /Im pu lsive 0.0 36 0.034 0.291 0.052 -0 .0 58 0 .05 6 0 .30 3 -0 .072 . -0 .417 0.147 0.0 05+ -0 .082 0.056 0.144C R S -R : P arent R ating : Ina tten tive 0 .0 43 0.031 0.158 0.061 -0 .0 32 0 .04 7 0 .49 7 -0 .038 . 0 .240 0.133 0.071 -0 .019 0.047 0.685C R S -R : Teacher R ating : In a tten tive 0 .0 06 0.042 0.888 0.007 -0 .0 24 0 .06 9 0 .72 9 -0 .023 . -0 .266 0.183 0.147 -0 .040 0.070 0.571B R IE F P arent R ating : B eh avior R e gu la tion 0.0 24 0.054 0.659 0.018 0.1 66 0 .08 1 0.040* 0 .109 0.103 -0 .086 0.232 0.712 0.160 0.082 0.051B R IE F Teacher R ating : B ehavior R egu la tion 0.0 79 0.070 0.261 0.055 -0 .0 90 0 .11 2 0 .42 2 -0 .053 . -0 .397 0.301 0.188 -0 .111 0.112 0.322T ics (lo w er = be tter)M otor tics (cu rren t): A ssessor R ating 0.0 17 0.013 0.218 1.317 0.0 53 0 .03 0 0 .07 6 2.143 0.187 0.118 0.066 0.074 0.059 0.030 0.0 49*P h on ics tics (curren t): A ssessor R ating -0 .0 09 0.020 0.665 0.865 0.0 51 0 .02 9 0 .08 5 2.060 . 0 .123 0.091 0.177 0.060 0.030 0.0 47*M otor tics (cu rren t): P arent R ating 0.0 07 0.013 0.605 1.116 -0 .0 11 0 .02 5 0 .65 7 0.851 . 0 .013 0.062 0.831 -0 .011 0.026 0.676P h on ics tics (curren t): P a rent R ating -0 .0 02 0.017 0.929 0.975 0.0 30 0 .02 5 0 .21 7 1.541 . 0 .043 0.075 0.567 0.033 0.025 0.185G en eral Inte llectua l Fu n ctio n in gW A S I V erba l IQ 0.0 68 0.062 0.270 0.039 -0 .0 19 0 .09 4 0 .84 1 -0 .009 . 0 .279 0.267 0.297 -0 .006 0.095 0.953W A S I P erfo rm an ce IQ 0.0 24 0.071 0.733 0.013 0.1 11 0 .11 0 0 .31 1 0.052 0.548 0.460 0.308 0.136 0.139 0.111 0.213W A S I Fu ll S ca le IQ 0.0 52 0.064 0.417 0.030 0.0 20 0 .09 9 0 .84 2 0.010 0.695 0.422 0.281 0.134 0.042 0.100 0.673
< .0 5 >.05, < .10 < .0 5 > .0 5, < .10K ey: M ercury e ffect = B ette r O utcom e p-va lue+ p -va lue M ercury e ffec t = W orse O utcom e p-va lue* p-va lue
P -va lues show n a re ro unded to 3 d ec im al p laces . There fore , a va lue show n as 0 .05 0 m ay satis ify p <0.05 crite rion if the orig in a l va lue w as ro unded up , or m ay no t sa tis ify the crite rion if the va lue w as ro unded do wn .
P re N atT him er E xp0 7m o s
Interaction M o de l: P rena ta l byP o stn ata l
T est
M od el w / J oint Te stP re N atT him er E x p07 m os Jo in t
Te st

Abt Associates Inc. Chapter 9 142
9.2.4.3.2. Test of Prental-by-Postnatal ExposureInteraction Effect
Full Data SetAmong the hypothesis tests for an interaction effect conducted for the 42 outcomemeasures, four were significant at the p<0.05 level, and three additional tests fell below0.10. If the direction of the main effects of PreNatThimer and Exp07mos had beenconsistent with the direction of the interaction effect (PreNatThimer*Exp07mos), theinterpretation of a significant interaction would be straightforward. For example, if ahigher score were considered a better outcome, and the coefficients for all three effectswere negative, one could conclude that higher exposure was associated with a worseoutcome, and that the effect of having both high prenatal and high postnatal exposureresults in a negative effect above and beyond the individual additive effects of exposureduring the two periods. But that kind of consistency did not occur in any of the modelswhere the p-value for the interaction was less than 0.10. In each model there was a mix ofpositive and negative coefficients for the three terms.
In order to understand the complex results produced from these models, we producedplots of the values on the outcome variables that would be predicted from the models forvarious exposure levels. The plots show the predicted values of the outcome variable(Y), for increasing values of the exposure variables (PreNatThimer, and Exp07mos).Based on the distributions of exposures for the entire sample of girls and boys combined,we made cut-points to classify prenatal and postnatal exposures as Very Low, Low, High,and Very High. Our goal was to show the predicted value of Y for all sixteen possiblecombinations of the four prenatal groups (very low to very high) crossed with the fourpostnatal groups (very low to very high). However, for cells with no observations (e.g.,there were zero children in the “high PreNatThimer” and “very low Exp07mos” group),no predicted value is shown. We picked the most extreme values of PreNatThimer andExp07mos observed within each crossed group and plotted a set of predicted values fordifferent postnatal exposures within each prenatal exposure category. The exposurecategories used for the plots of predicted values are shown below.
Exposure CategoriesVery Low Low High Very High
PreNatThimer(Prenatal)
0 11.25 – 12.75 25 to 25.5 50 to 100
Exp07mos(postnatal)
0 to 11.59 11.6 to 19.99 20 to 30 30.01 to 38.3
PreNatThimer is a measure of cumulative exposure to ethylmercury from vaccines andimmune globulins during the prenatal period and is expressed in micrograms.Exp07mos is a cumulative measure of exposure to ethylmercury from vaccines and immuneglobulins for the period from birth through seven months of age and is expressed asmicrograms of mercury divided by child’s body weight at the time of receipt, summed overall receipts in the age range.
The plot shown in Exhibit 9.2.4.4b is a hypothetical example wherein the coefficients forall three terms are negative (i.e., the terms for PreNatThimer, Exp07mos, and

Abt Associates Inc. Chapter 9 143
PreNatThimer*Exp07mos are all in a consistent direction). This hypothetical examplecan be contrasted to the results from the observed data, shown later, where thecoefficients for the three terms are not in a consistent direction.
The plot of the hypothetical data shows that as PreNatThimer increases in value, thepredicted value of the outcome variable Y decreases. And as Exp07mos increases invalue, the predicted value of the outcome variable Y decreases. It also shows that theslope of the Exp07mos effect is steeper for higher values of PreNatThimer. The plot hasfour panels indicated by the vertical dotted lines. The leftmost panel is for Very Lowprenatal exposures. The Very Low prenatal exposure category corresponds to zeroprenatal exposure, so the plots in this group use predictions with PreNatThimer = 0, asindicated in the first row of numbers at the bottom of the plot. The Exp07mos values usedare shown in the second row of numbers at the bottom of the plot. We used the low pointof the range for the two lower postnatal exposure categories (0 for Very Low and 11.6 forLow) and the high point of the range for the higher exposure categories (30 for High and42 for Very High). The plotting symbols (open circles) in this panel show the predictedvalues of Y when PreNatThimer is equal to zero, and Exp07mos is at values 0, 11.6, 30,and 42. In this example there is a slight downward slope associated with increasingvalues of Exp07mos when the value of PreNatThimer is held constant at zero. The thirdrow of numbers shown along the bottom of the plot is labeled “n in group”. Thishypothetical example used the observed numbers in each exposure group. For example,there were 106 children that had zero prenatal exposure and were in the very low groupfor Exp07mos.
Exhibits 9.2.4.5 through 9.2.4.8 show the estimates and plots for four outcome measuresthat had significant interaction effect at the 0.05 level in the models fit to the full data set.Exhibits 9.2.4.9 and 9.2.4.10 correspond to the one significant interaction effect forfemales and the one significant interaction effect for males.
Exhibit 9.2.4.5a is a summary of results from the interaction model for the NEPSYSpeeded Naming outcome measure. The summary shows the estimates (regressioncoefficients) and their standard errors and p-values for the thimerosal exposure variables.For the sake of brevity, the estimates for the intercept term and all of the covariates areomitted from the summary. For this particular outcome measure, a higher score is better.The coefficients for the PreNatThimer and Exp07mos terms are positive, and thecoefficient for the interaction term (PreNatThimer * Exp07mos) is negative. The p-valuefor the interaction is below 0.05, indicating a statistically significant interaction effect.The coefficient for the PreNatThimer term is large, relative to its standard error, andpositive, suggesting that, holding postnatal exposure constant at zero, one would expectthat higher prenatal exposures would be related to more desirable scores on the outcomemeasure.
The estimated main effects from the model without the (PreNatThimer*Exp07mos)interaction are shown in Exhibit 9.2.4.5b . Comparing Exhibits 9.2.4.5a and 9.2.4.5b, itis evident that the addition of the interaction term substantially increased the size of the

Abt Associates Inc. Chapter 9 144
estimated positive coefficients for both main effects, with an offsetting negativeinteraction.
Plots of predicted values from the interaction model are shown in Exhibit 9.2.4.5c. Theleft-most panel of the plot shows that when PreNatThimer is held constant at zero,increases in the value of Exp07mos have a very weak positive association with theoutcome measure. In this portion of the plot, as the values of Exp07mos increase, thepredicted values of Y increase a small amount. Note that, by far, most children had zeroprenatal thimerosal exposure, so the left-most panel of the plot represents the data forroughly 90 percent of the children in the sample. The next panel to the right shows thepredicted values of Y when PreNatThimer is equal to 11.25, for several increasing valuesof Exp07mos. The plot shows that when Exp07mos is at very low or low values, themodel predicts that 11.25 micrograms of prenatal exposure is associated with betteroutcome scores than are predicted when prenatal exposure is zero, and postnatal exposureis at any value, low or high. When postnatal cumulative exposure is at high or very highlevels, the predicted benefit of 11.25 micrograms of prenatal exposure diminishes to nearzero. The predicted values of Y when PreNatThimer is 11.25, and Exp07mos is high orvery high are very close to the predicted values of Y when PreNatThimer is zero. Thetwo right-most panels of the exhibit tell a very similar story. The predicted benefits ofhigher prenatal exposure diminish to near zero as postnatal exposure increases.
For Stanford Binet Copying and CRS-R Teacher Rated Hyperactive/Impulsive outcomemeasures (Exhibits 9.2.4.6 and 9.2.4.7), the models predict beneficial effects of postnatalexposure when prenatal exposure is zero, and harmful effects when both prenatal andpostnatal exposures are high, but at the lower levels postnatal exposure, the predictedbenefits of high or very high prenatal exposure are large.
When there is zero prental exposure, the model for Assessor Rated Motor Tics (Exhibit9.2.4.8) predicts that the risk of tics with increases with increasing postnatal exposure,but when there is prenatal exposure, increasing postnatal exposure is associated withdecreased risk of tics.
For females, the predicted beneficial effects of high prenatal exposure on the CVLT-CFree Recall Long Delay outcome measure are similar in magnitude to the predictedharmful effects of having both high prenatal and high postnatal exposure (Exhibit9.2.4.9). The results for males on CRS-R Teacher Rated Hyperactive/Impulsive outcome(Exhibit 9.2.4.10) are very similar to the previously displayed results on the sameoutcome measure for the full data set (Exhibit 9.2.4.7).
None of the significant interaction effects suggest clear evidence of either harm or benefitassociated with the interaction between prenatal and postnatal exposure.

Abt Associates Inc. Chapter 9 145
Exhibit 9.2.4.4a. Hypothetical Example Where Coefficients for PreNatThimer, Exp07mos,and the Interaction of PreNatThimer by Exp07mos are all NegativeSummary of Regression Coefficients from Interaction ModelVariable Name Estimate Standard Error P-ValuePreNatThimer -0.014Exp07mos -.005PreNatThimer*Exp07mos -0.002
Exhibit 9.2.4.4b. Hypothetical Example Where Coefficients for PreNatThimer, Exp07mos,and the Interaction of PreNatThimer by Exp07mos are all NegativePlot of Predicted Values of Y
Exposure Levels
Pre
dict
edV
alue
ofY
46
810
1214
1618
Predicted Values from Interaction Model: PreNatThimer X Exp07mosOutcome = Hypothetical
00
106
011.6392
030365
03873
11.2506
11.2511.627
11.253035
11.25383
2500
2511.612
253011
25384
100193
100309
50341
PreNatThimer=ZeroIncreasing Exp07mos -->
PreNatThimer=LowIncreasing Exp07mos -->
PreNatThimer=HighIncreasing Exp07mos -->
PreNatThimer=HighestObserved Exp07mos
PreNatThimer:Exp07mos:n in group
Notes: Plot symbol indicates predicted value of Y when the values if PreNatThimer and Exp07mos are equal to thevalues shown below the x-axis. For example, the left-most plotting symbol shows the predicted value of Y whenPreNatThimer = 0 and Exp07mos = 0. The next symbol to the right shows the predicted value when PreNatThimer = 0and Exp07mos = 11.6, and so on.

Abt Associates Inc. Chapter 9 146
Exhibit 9.2.4.5a. NEPSY Speeded NamingSummary of Regression Coefficients from Interaction ModelVariable Name Estimate Standard Error P-ValuePreNatThimer 0.281 0.109 0.010Exp07mos 0.026 0.039 0.504PreNatThimer*Exp07mos -0.010 0.005 0.034
Exhibit 9.2.4.5b. NEPSY Speeded NamingSummary of Regression Coefficients from Model Without The InteractionVariable Name Estimate Standard Error P-ValuePreNatThimer 0.057 0.027 0.034Exp07mos 0.010 0.038 0.784
Exhibit 9.2.4.5c. NEPSY Speeded NamingPlot of Predicted Values of Y
Exposure Levels
Pre
dict
edV
alue
ofY
1015
2025
3035
40
Predicted Values from Interaction Model: PreNatThimer X Exp07mosOutcome = NEPSY Speeded Naming
00
106
011.6392
030365
03873
11.2506
11.2511.627
11.253035
11.25383
2500
2511.612
253011
25384
100193
100309
50341
PreNatThimer=ZeroIncreasing Exp07mos -->
PreNatThimer=LowIncreasing Exp07mos -->
PreNatThimer=HighIncreasing Exp07mos -->
PreNatThimer=HighestObserved Exp07mos
PreNatThimer:Exp07mos:n in group
Notes: Plot symbol indicates predicted value of Y when the values if PreNatThimer and Exp07mos are equal to thevalues shown below the x-axis. For example, the left-most plotting symbol shows the predicted value of Y whenPreNatThimer = 0 and Exp07mos = 0. The next symbol to the right shows the predicted value when PreNatThimer = 0and Exp07mos = 11.6, and so on.

Abt Associates Inc. Chapter 9 147
Exhibit 9.2.4.6a. Stanford Binet: CopyingSummary of Regression Coefficients from Interaction ModelVariable Name Estimate Standard Error P-ValuePreNatThimer 0.094 0.043 0.030Exp07mos 0.013 0.015 0.406PreNatThimer*Exp07mos -0.004 0.002 0.035
Exhibit 9.2.4.6b. Stanford Binet: CopyingSummary of Regression Coefficients from Model Without InteractionVariable Name Estimate Standard Error P-ValuePreNatThimer 0.005 0.011 0.628Exp07mos 0.007 0.015 0.667
Exhibit 9.2.4.6c. Stanford Binet: CopyingPlot of Predicted Values of Y
Exposure Levels
Pre
dict
edV
alue
ofY
1214
1618
2022
24
Predicted Values from Interaction Model: PreNatThimer X Exp07mosOutcome = Stanford Binet Copying
00
106
011.6392
030365
03873
11.2506
11.2511.627
11.253035
11.25383
2500
2511.612
253011
25384
100193
100309
50341
PreNatThimer=ZeroIncreasing Exp07mos -->
PreNatThimer=LowIncreasing Exp07mos -->
PreNatThimer=HighIncreasing Exp07mos -->
PreNatThimer=HighestObserved Exp07mos
PreNatThimer:Exp07mos:n in group
Notes: Plot symbol indicates predicted value of Y when the values if PreNatThimer and Exp07mos are equal to thevalues shown below the x-axis. For example, the left-most plotting symbol shows the predicted value of Y whenPreNatThimer = 0 and Exp07mos = 0. The next symbol to the right shows the predicted value when PreNatThimer = 0and Exp07mos = 11.6, and so on.

Abt Associates Inc. Chapter 9 148
Exhibit 9.2.4.7a. CRS-R: Teacher--Hyperactive/Impulsive ClusterSummary of Regression Coefficients from Interaction ModelVariable Name Estimate Standard Error P-ValuePreNatThimer -0.219 0.090 0.015Exp07mos -0.066 0.034 0.054PreNatThimer*Exp07mos 0.010 0.004 0.006
Exhibit 9.2.4.7b. CRS-R: Teacher--Hyperactive/Impulsive ClusterSummary of Regression Coefficients from Model Without The InteractionVariable Name Estimate Standard Error P-ValuePreNatThimer 0.023 0.022 0.301Exp07mos -0.048 0.034 0.157
Exhibit 9.2.4.7c. CRS-R: Teacher--Hyperactive/Impulsive ClusterPlot of Predicted Values of Y
Exposure Levels
Pre
dict
edV
alue
ofY
-50
510
15
Predicted Values from Interaction Model: PreNatThimer X Exp07mosOutcome = CRS-R: Teacher Rating Hyperactive/Impulsive
00
106
011.6392
030365
03873
11.2506
11.2511.627
11.253035
11.25383
2500
2511.612
253011
25384
100193
100309
50341
PreNatThimer=ZeroIncreasing Exp07mos -->
PreNatThimer=LowIncreasing Exp07mos -->
PreNatThimer=HighIncreasing Exp07mos -->
PreNatThimer=HighestObserved Exp07mos
PreNatThimer:Exp07mos:n in group
Notes: Plot symbol indicates predicted value of Y when the values if PreNatThimer and Exp07mos are equal to thevalues shown below the x-axis. For example, the left-most plotting symbol shows the predicted value of Y whenPreNatThimer = 0 and Exp07mos = 0. The next symbol to the right shows the predicted value when PreNatThimer = 0and Exp07mos = 11.6, and so on.

Abt Associates Inc. Chapter 9 149
Exhibit 9.2.4.9a. Assessor Rated Motor TicsSummary of Regression Coefficients from Interaction ModelVariable Name Estimate Standard Error P-ValuePreNatThimer 0.121 0.051 0.017Exp07mos 0.040 0.022 0.070PreNatThimer*Exp07mos -0.004 0.002 0.046
Exhibit 9.2.4.9b. Assessor Rated Motor TicsSummary of Regression Coefficients from Model Without The InteractionVariable Name Estimate Standard Error P-ValuePreNatThimer 0.017 0.011 0.104Exp07mos 0.032 0.022 0.142
Exhibit 9.2.4.9c. Assessor Rated Motor TicsPlot of Predicted Values of Y
Predicted Values from Interaction Model: PreNatThimer X Exp07mosOutcome = (Motor Tics Current): Assessor Rating
Exposure Levels
Mod
elP
redi
cted
Pro
port
ion
with
Tic
s
-0.5
0.0
0.5
00
106
011.6392
030365
03873
11.2506
11.2511.627
11.253035
11.25383
2500
2511.612
253011
25384
100193
100309
50341
PreNatThimer=ZeroIncreasing Exp07mos -->
PreNatThimer=LowIncreasing Exp07mos -->
PreNatThimer=HighIncreasing Exp07mos -->
PreNatThimer=HighestObserved Exp07mos
PreNatThimer:Exp07mos:n in group
Notes: Plot symbol indicates predicted value of Y when the values if PreNatThimer and Exp07mos are equal to thevalues shown below the x-axis. For example, the left-most plotting symbol shows the predicted value of Y whenPreNatThimer = 0 and Exp07mos = 0. The next symbol to the right shows the predicted value when PreNatThimer = 0and Exp07mos = 11.6, and so on.

Abt Associates Inc. Chapter 9 150
Exhibit 9.2.4.9a. Females – CVLT-C: Free Recall Long DelaySummary of Regression Coefficients from Interaction ModelVariable Name Estimate Standard Error P-ValuePreNatThimer 0.099 0.050 0.047Exp07mos -0.013 0.017 0.435PreNatThimer*Exp07mos -0.005 0.002 0.023
Exhibit 9.2.4.9b. Females – CVLT-C: Free Recall Long DelaySummary of Regression Coefficients from Model Without The InteractionVariable Name Estimate Standard Error P-ValuePreNatThimer -0.010 0.013 0.446Exp07mos -0.022 0.017 0.190
Exhibit 9.2.4.9c. Females – CVLT-C: Free Recall Long DelayPlot of Predicted Values of Y
Exposure Levels
Pre
dict
edV
alue
ofY
68
1012
14
Predicted Values from Interaction Model: PreNatThimer X Exp07mosOutcome = CVLT-C: Free Recall, Long Delay
0043
011.6196
030191
03850
11.2501
11.2511.616
11.253020
11.25383
25.500
25.511.6
3
25.5305
25.5384
50192
50303
50341
PreNatThimer=ZeroIncreasing Exp07mos -->
PreNatThimer=LowIncreasing Exp07mos -->
PreNatThimer=HighIncreasing Exp07mos -->
PreNatThimer=HighestObserved Exp07mos
PreNatThimer:Exp07mos:n in group
Notes: Plot symbol indicates predicted value of Y when the values if PreNatThimer and Exp07mos are equal to thevalues shown below the x-axis. For example, the left-most plotting symbol shows the predicted value of Y whenPreNatThimer = 0 and Exp07mos = 0. The next symbol to the right shows the predicted value when PreNatThimer = 0and Exp07mos = 11.6, and so on.

Abt Associates Inc. Chapter 9 151
Exhibit 9.2.4.10a. Males – CRS-R: Teacher--Hyperactive/Impulsive ClusterSummary of Regression Coefficients from Interaction ModelVariable Name Estimate Standard Error P-ValuePreNatThimer -0.417 0.147 0.005Exp07mos -0.082 0.056 0.144PreNatThimer*Exp07mos 0.020 0.006 0.002
Exhibit 9.2.4.10b. Males – CRS-R: Teacher--Hyperactive/Impulsive ClusterSummary of Regression Coefficients from Model Without The InteractionVariable Name Estimate Standard Error P-ValuePreNatThimer 0.036 0.034 0.291Exp07mos -0.058 0.056 0.303
Exhibit 9.2.4.10c. Males – CRS-R: Teacher--Hyperactive/Impulsive ClusterPlot of Predicted Values of Y
Exposure Levels
Pre
dict
edV
alue
ofY
-20
-10
010
20
Predicted Values from Interaction Model: PreNatThimer X Exp07mosOutcome = CRS-R: Teacher Rating Hyperactive/Impulsive
0063
011.6196
030174
03823
11.2505
11.2511.611
11.253015
11.25380
25.500
25.511.6
9
25.5306
25.5380
100191
100281
50295
PreNatThimer=ZeroIncreasing Exp07mos -->
PreNatThimer=LowIncreasing Exp07mos -->
PreNatThimer=HighIncreasing Exp07mos -->
PreNatThimer=HighestObserved Exp07mos
PreNatThimer:Exp07mos:n in group
Notes: Plot symbol indicates predicted value of Y when the values if PreNatThimer and Exp07mos are equal to thevalues shown below the x-axis. For example, the left-most plotting symbol shows the predicted value of Y whenPreNatThimer = 0 and Exp07mos = 0. The next symbol to the right shows the predicted value when PreNatThimer = 0and Exp07mos = 11.6, and so on.

Abt Associates Inc. Chapter 9 152
9.2.5. Models for Multiple Sources of Prenatal ExposureInteracted with Postnatal Exposure from Thimerosal
9.2.5.1. IntroductionThe models summarized in this section were motivated by the same hypothesis asdescribed in the previous section – that is, children who had prenatal exposure to mercurycould be more susceptible to additional doses of postnatal exposure than children whowere not exposed in utero. In the current section, however, a broader measure of prenatalexposure is introduced and modeled. The broader measures of prenatal exposure includesmercury exposures from thimerosal in vaccines and immune globulins, maternal fishconsumption, maternal use of mercury containing health care produces (contact lens,nasal, ear, eye drops), maternal exposure from home products, and from amalgamfillings. This new measure was modeled as an interaction effect with cumulativeexposure from birth through seven months.
The broader measure of prenatal exposure was created by dichotomizing the componentvariables17 into categories “1 = any exposure”, and “0 = no exposure”, and summing tocreate a composite score. The following variables were summed to create the composite(named PrenatAllMerc):
Variable Defintion= 0 if PreNatThimer = 0Pre_VacIG { = 1 if PreNatThimer > 0 }= 1 if PreNatTuna > 0Pre_Tuna { = 0 if PrenatTuna = 0 }= 0 PreNatOrgMerc = 0PreOrg { = 1 if PreNatOrgMerc > 0 }= 0 if PreNatFillings = 0PreAmalgam { = 1 if PreNatFillings > 0 }
PreNatFish = PreNatFish variable as currently defined (0/1).PreNatHomePro = PreNatHomePro as currently defined (0/1).
PreNatAllMerc = Pre_VacIG + Pre_Tuna + PreOrg + PreAmalgam +PreNatFish + PreNatHomePro
A frequency crosstab of the PreNatAllMerc variable crossed with the components used inits creation is shown in Exhibit 9.2.5.1.
17 For definitions of component variables, see Section 7.3.

Abt Associates Inc. Chapter 9 153
Exhibit 9.2.5.1. PreNatAllMerc_1 Crossed with Six Component Variables Used to Construct ItPreNatAllMerc
_1
PreNatThimer
PreNatTuna
_1
PreNatFish
_1
PreNatOrgMerc
_1
PreNatHomePro_1
PreNatFillings
_1Freq. Percent Cum.
Freq.Cum.
Percent
0 0 0 0 0 0 0 71 6.78 71 6.781 0 0 0 0 0 1 36 3.44 107 10.221 0 0 0 0 0 2 170 16.24 277 26.461 0 0 0 0 1 0 1 0.1 278 26.551 0 0 0 2 0 0 1 0.1 279 26.651 0 1 0 0 0 0 87 8.31 366 34.961 0 2 0 0 0 0 6 0.57 372 35.531 12.75 0 0 0 0 0 3 0.29 375 35.821 25 0 0 0 0 0 1 0.1 376 35.912 0 0 0 0 1 1 1 0.1 377 36.012 0 0 0 0 1 2 3 0.29 380 36.292 0 0 0 1 0 1 1 0.1 381 36.392 0 0 0 1 0 2 1 0.1 382 36.492 0 0 0 2 0 1 2 0.19 384 36.682 0 0 0 2 0 2 10 0.96 394 37.632 0 1 0 0 0 1 53 5.06 447 42.692 0 1 0 0 0 2 354 33.81 801 76.52 0 1 0 0 1 0 1 0.1 802 76.62 0 1 0 1 0 0 1 0.1 803 76.72 0 1 0 2 0 0 4 0.38 807 77.082 0 1 0 3 0 0 1 0.1 808 77.172 0 1 1 0 0 0 8 0.76 816 77.942 0 2 0 0 0 1 3 0.29 819 78.222 0 2 0 0 0 2 19 1.81 838 80.042 11.25 0 0 0 0 1 1 0.1 839 80.132 12.75 0 0 0 0 1 2 0.19 841 80.322 12.75 0 0 0 0 2 12 1.15 853 81.472 12.75 1 0 0 0 0 3 0.29 856 81.762 12.75 2 0 0 0 0 1 0.1 857 81.852 25 0 0 0 0 2 2 0.19 859 82.042 25 1 0 0 0 0 2 0.19 861 82.232 25.5 0 0 0 0 2 1 0.1 862 82.332 50 0 0 0 0 2 3 0.29 865 82.622 50 1 0 0 0 0 1 0.1 866 82.712 100 0 0 0 0 2 1 0.1 867 82.813 0 0 0 2 1 2 1 0.1 868 82.93 0 1 0 0 1 1 2 0.19 870 83.093 0 1 0 0 1 2 19 1.81 889 84.913 0 1 0 1 0 2 8 0.76 897 85.673 0 1 0 2 0 1 3 0.29 900 85.963 0 1 0 2 0 2 15 1.43 915 87.393 0 1 1 0 0 1 2 0.19 917 87.583 0 1 1 0 0 2 34 3.25 951 90.833 0 2 0 0 1 1 1 0.1 952 90.933 0 2 0 0 1 2 1 0.1 953 91.023 0 2 0 2 0 2 2 0.19 955 91.213 0 2 1 0 0 2 4 0.38 959 91.63 12.5 1 0 0 0 2 1 0.1 960 91.693 12.75 0 0 0 1 2 1 0.1 961 91.793 12.75 0 0 2 0 2 1 0.1 962 91.883 12.75 1 0 0 0 1 3 0.29 965 92.17

Abt Associates Inc. Chapter 9 154
Exhibit 9.2.5.1. PreNatAllMerc_1 Crossed with Six Component Variables Used to Construct ItPreNatAllMerc
_1
PreNatThimer
PreNatTuna
_1
PreNatFish
_1
PreNatOrgMerc
_1
PreNatHomePro_1
PreNatFillings
_1Freq. Percent Cum.
Freq.Cum.
Percent
3 12.75 1 0 0 0 2 29 2.77 994 94.943 12.75 1 1 0 0 0 2 0.19 996 95.133 12.75 2 0 0 0 2 1 0.1 997 95.223 25 1 0 0 0 1 1 0.1 998 95.323 25 1 0 0 0 2 7 0.67 1005 95.993 25 1 1 0 0 0 1 0.1 1006 96.083 25 2 0 0 0 2 2 0.19 1008 96.283 25.5 1 0 0 0 1 1 0.1 1009 96.373 25.5 1 0 0 0 2 5 0.48 1014 96.853 25.5 2 0 0 0 2 1 0.1 1015 96.943 50 0 0 0 1 2 1 0.1 1016 97.043 50 0 0 2 0 2 1 0.1 1017 97.133 50 1 0 0 0 2 2 0.19 1019 97.333 62.75 2 0 0 0 2 1 0.1 1020 97.423 100 1 0 0 0 2 1 0.1 1021 97.524 0 1 0 1 1 2 1 0.1 1022 97.614 0 1 1 0 1 2 4 0.38 1026 97.994 0 1 1 1 0 1 1 0.1 1027 98.094 0 1 1 2 0 2 2 0.19 1029 98.284 0 1 1 4 0 2 1 0.1 1030 98.384 12.75 1 0 2 0 2 5 0.48 1035 98.854 12.75 1 1 0 0 2 6 0.57 1041 99.434 25 1 1 0 0 2 2 0.19 1043 99.624 25.5 2 1 0 0 2 1 0.1 1044 99.714 50 1 0 0 1 2 1 0.1 1045 99.814 50 1 0 2 0 2 1 0.1 1046 99.95 0 1 1 2 1 2 1 0.1 1047 100
9.2.5.2. Model SpecificationsInteraction ModelThis model tests for an interaction effect of PreNatAllMerc and Exp07mos.
l
llkjk
kkjj
jj Stcfoe
mosExpercpreNatAllMmosExpercpreNatAllMY 07*07 3210
0:0: 330 aHvsH
Main Effect ModelThe summary table also shows results from models where the non-significant interactioneffects were dropped. These models are of the form:

Abt Associates Inc. Chapter 9 155
l
llkjk
kkjj
jj StcfoemosExpercpreNatAllMY 07210
0:0: 110 aHvsH
9.2.5.3. Results
Results are summarized in Exhibit 9.2.5.2. There were two significant PreNatAllMerc byExp07mos interaction effects. Similar to the results in the previous section, both sets ofsignificant results were cases where the signs of the coefficients for prenatal, postnatal,and interaction effects were not consistent. For these two results, the coefficients forprenatal and postnatal effects were positive, while the coefficient for the interaction effectwas negative. And, comparing the coefficient from the interaction model in the right-hand panel of the summary, to the main effect model in the left-hand panel of thesummary, it is evident that the addition of the interaction term substantially increased thesize of the estimated positive coefficients for both main effects, with offsetting negativeinteraction effects.
The exhibit also highlights three interaction effects that fell below a p<0.10 criterion. Innone of these three cases were the coefficients for the prenatal, postnatal, and interactioneffects in a consistent direction of either benefit or harm.
Similar to the results from the previous section, none of the interaction effects shown inExhibit 9.2.5.2 suggest clear evidence of either harm or benefit associated with theinteraction between prenatal and postnatal exposure.

Abt Associates Inc. Chapter 9 156
Exhibit 9.2.5.2. Summary of Multiple Sources of Prenatal Mercury Models (n=1,047)
E st S .E . P
-0 .034 0 .030 0 .2580 .014 0 .038 0 .711
-0 .007 0 .014 0 .625-0 .038 0 .029 0 .193-0 .039 0 .061 0 .5240 .007 0 .009 0 .455
-0 .026 0 .030 0 .3870 .058 0 .045 0 .199
-0 .036 0 .027 0 .177
-0 .011 0 .046 0 .807-0 .002 0 .013 0 .8870 .001 0 .011 0 .929
-0 .010 0 .012 0 .4160 .000 0 .012 0 .997
-0 .123 0 .059 0 .036*-0 .125 0 .058 0 .031*
-0 .060 0 .036 0 .097
-0 .057 0 .089 0 .523-0 .051 0 .109 0 .639-0 .007 0 .031 0 .815-0 .017 0 .028 0 .552
-0 .009 0 .015 0 .529
0 .025 0 .026 0 .338-0 .033 0 .066 0 .615-0 .017 0 .009 0 .069-0 .007 0 .008 0 .384-0 .024 0 .014 0 .0900 .054 0 .092 0 .5560 .009 0 .131 0 .943
0 .014 0 .026 0 .5920 .041 0 .033 0 .2210 .015 0 .030 0 .6290 .004 0 .043 0 .9240 .035 0 .055 0 .5180 .009 0 .070 0 .897
-0 .014 0 .021 0 .5160 .000 0 .025 0 .999
-0 .008 0 .020 0 .703-0 .011 0 .018 0 .537
-0 .068 0 .065 0 .2990 .014 0 .074 0 .852
-0 .046 0 .067 0 .491> .05 , < .10
P reN atAllM erc X Exp07 m osE st S .E . P E st S .E . P Est S.E . P Est S .E . P
Speech and LanguageBoston N am ing Test 0 .430 0.276 0 .119 0 .051 0 .030 0 .090 1 .103 0 .655 0 .093 0 .113 0 .063 0 .071N EP SY: S peeded N am ing 1 .675 0.588 0 .004+ 0 .012 0 .038 0 .753 1 .392 0 .963 0 .149 -0 .014 0 .079 0 .863N EP SY: C om prehension of Ins truc tions 0 .211 0.210 0 .315 -0 .014 0 .014 0 .301 0 .344 0 .343 0 .317 -0 .002 0 .028 0 .947C ELF: Form u la ted S en tences -0 .060 0.207 0 .772 -0 .034 0 .030 0 .248 0 .691 0 .612 0 .259 0 .036 0 .062 0 .560C ELF: R ecalling Sentences 0 .244 0.482 0 .612 0 .001 0 .062 0 .982 1 .008 1 .290 0 .435 0 .073 0 .128 0 .569G FTA: A rticu la tion (lower = be tte r) -0 .034 0.067 0 .611 0 .011 0 .010 0 .254 -0.173 0 .197 0 .381 -0 .002 0 .020 0 .919Stu tte ring : Assesso r R ating (lower = bette r) -0 .116 0.208 0 .579 0 .025 0 .033 0 .438 0 .402 0 .633 0 .525 0 .071 0 .062 0 .254Stu tte ring : Paren t R a ting (low er = be tte r) -0 .188 0.265 0 .478 0 .020 0 .043 0 .631 -1.263 0 .887 0 .154 -0 .069 0 .082 0 .397Stu tte ring : Teacher R a ting (low er = be tte r) -0 .132 0.180 0 .465 0 .008 0 .025 0 .754 0 .575 0 .552 0 .297 0 .068 0 .051 0 .183Verbal M em oryC VLT-C : Free R ecall, N o D e lay 0 .364 0.476 0 .444 -0 .001 0 .046 0 .991 0 .584 1 .019 0 .567 0 .020 0 .097 0 .835C VLT-C : Free R ecall, Short D elay 0 .183 0.115 0 .113 -0 .024 0 .013 0 .070 0 .219 0 .282 0 .438 -0 .020 0 .027 0 .455C VLT-C : C ued R eca ll, S hort D e lay 0 .029 0.084 0 .734 -0 .005 0 .011 0 .637 0 .009 0 .237 0 .970 -0 .007 0 .024 0 .760C VLT-C : Free R ecall, Long D e lay 0 .102 0.122 0 .401 -0 .019 0 .012 0 .111 0 .294 0 .265 0 .268 -0 .001 0 .025 0 .957C VLT-C : C ued R eca ll, Long D elay 0 .211 0.183 0 .249 0 .001 0 .012 0 .924 0 .210 0 .300 0 .484 0 .001 0 .025 0 .966C M S S tories 1: Im m ediate R ecall 0 .353 0.416 0 .396 -0 .029 0 .059 0 .630 2 .766 1 .224 0 .024+ 0 .198 0 .123 0 .109C M S S tories 2: D e layed R ecall 0 .401 0.476 0 .400 0 .004 0 .059 0 .948 2 .823 1 .216 0 .020+ 0 .234 0 .121 0 .054Achievem entW JIII: Lette r- W ord Iden tification -0 .350 0.300 0 .243 0 .063 0 .037 0 .090 0 .819 0 .764 0 .284 0 .173 0 .076 0 .023+Fine M otor C oord inationG rooved Pegboard: D om inan t H and (low er = be tte r) -0 .688 0.737 0 .351 -0 .085 0 .089 0 .339 0 .418 1 .880 0 .824 0 .019 0 .185 0 .920G rooved Pegboard: N on-dom H and (lower = be tte r) -1 .191 1.393 0 .393 -0 .278 0 .109 0 .011+ -0.165 2 .594 0 .949 -0 .185 0 .227 0 .415F inger Tapp ing : D om inan t H and -0 .186 0.216 0 .389 0 .033 0 .031 0 .288 -0.046 0 .639 0 .942 0 .046 0 .064 0 .473F inger Tapp ing : N on-dom inan t H and -0 .136 0.269 0 .612 0 .017 0 .028 0 .539 0 .191 0 .613 0 .755 0 .048 0 .058 0 .414Visua l S patial AbilityStanfo rd B ine t: C opying 0 .093 0.185 0 .613 0 .007 0 .015 0 .655 0 .287 0 .358 0 .424 0 .024 0 .032 0 .443Attention /Executive Function ingG D S V ig ilance Task : C orrect R esponses 0 .049 0.328 0 .881 0 .032 0 .026 0 .220 -0.443 0 .610 0 .467 -0 .014 0 .054 0 .799G D S V ig ilance Task : E rro rs (lower = be tter) 0 .275 0.624 0 .660 -0 .020 0 .067 0 .766 0 .927 1 .440 0 .520 0 .041 0 .139 0 .766W IS C III: D ig it S pan , Fo rw ard R eca ll -0 .057 0.077 0 .462 -0 .002 0 .010 0 .819 0 .277 0 .199 0 .164 0 .029 0 .020 0 .138W IS C III: D ig it S pan , B ackward R ecall -0 .027 0.058 0 .647 0 .017 0 .008 0 .035+ 0 .113 0 .171 0 .508 0 .030 0 .017 0 .075W IS C III: D ig it Span, C om b ined -0 .083 0.113 0 .463 0 .016 0 .015 0 .259 0 .394 0 .303 0 .193 0 .061 0 .030 0 .042+BR IE F Parent R a ting: M e tacogn ition (lower = be tter) -0 .890 0.927 0 .338 -0 .052 0 .092 0 .573 -1.950 2 .024 0 .336 -0 .151 0 .191 0 .431BR IE F Teacher R a ting: M e tacogn ition (lower = be tter) -1 .105 1.631 0 .498 -0 .145 0 .132 0 .275 -1.300 3 .158 0 .681 -0 .162 0 .274 0 .554B ehavior R egu la tion (low er = bette r)C R S-R : P aren t R ating : H yperac tive/Im pu ls ive -0 .078 0.191 0 .684 0 .019 0 .026 0 .464 -0.348 0 .539 0 .519 -0 .006 0 .053 0 .909C R S-R : Teacher R ating : H yperac tive/Im pu ls ive 0 .241 0.313 0 .442 -0 .046 0 .034 0 .171 -0.580 0 .740 0 .433 -0 .121 0 .069 0 .083C R S-R : P aren t R ating : Ina tten tive -0 .122 0.295 0 .678 -0 .023 0 .030 0 .439 -0.411 0 .665 0 .537 -0 .050 0 .063 0 .427C R S-R : Teacher R ating : Ina tten tive -0 .127 0.481 0 .791 -0 .034 0 .043 0 .433 -0.212 1 .012 0 .834 -0 .041 0 .089 0 .642BR IE F Parent R a ting: B ehavior R egulation -0 .974 0.518 0 .060 0 .073 0 .055 0 .184 -1.679 1 .208 0 .165 0 .009 0 .114 0 .939BR IE F Teacher R a ting: B ehavior R egulation -0 .014 0.526 0 .978 -0 .042 0 .072 0 .557 -0.196 1 .491 0 .896 -0 .059 0 .148 0 .689Tics (low er = bette r)M oto r tics (cu rren t): Assessor R a ting 0 .086 0.197 0 .662 0 .033 0 .022 0 .133 0 .376 0 .489 0 .441 0 .058 0 .045 0 .194Phonics tics (cu rrent): A ssesso r R a ting 0 .189 0.213 0 .375 0 .038 0 .023 0 .095 0 .188 0 .540 0 .727 0 .038 0 .049 0 .431M oto r tics (cu rren t): Pa rent R a ting 0 .087 0.219 0 .693 -0 .001 0 .021 0 .971 0 .235 0 .447 0 .600 0 .013 0 .042 0 .753Phonics tics (cu rrent): P aren t R ating 0 .140 0.163 0 .391 0 .007 0 .019 0 .693 0 .359 0 .390 0 .357 0 .028 0 .038 0 .465G enera l In te llec tua l Fun ction in gW A S I V erba l IQ 0 .366 0.513 0 .475 -0 .040 0 .066 0 .538 1 .696 1 .378 0 .219 0 .084 0 .136 0 .539W A S I P erform ance IQ 0 .903 0.583 0 .122 0 .130 0 .074 0 .080 0 .634 1 .558 0 .684 0 .105 0 .154 0 .496W A S I Fu ll Sca le IQ 0 .721 0.523 0 .168 0 .061 0 .068 0 .370 1 .616 1 .401 0 .249 0 .145 0 .140 0 .300
< .05 > .05, < .10 < .05 > .05 , < .10K ey: M ercu ry effect = B e tte r O utcom e p-va lue+ p-va lue M ercu ry effect =W orse O utcom e p-va lue* p -va lue
P-va lues show n are rounded to 3 decim a l places . There fo re , a va lue show n as 0.050 m ay sa tis ify p<0 .05 criterion if the o rig ina l value was rounded up , o r m ay no t sa tis ify the crite rion if the value was rounded dow n.
PreN atA llM erc Exp07m osInteractio n M odel
Exp07m osTest
M ain Effec ts M od elPreN atAllM erc

Abt Associates Inc. Chapter 9 157
9.2.6. Concurrent Antibiotics-by-Exposure InteractionModels
9.2.6.1. IntroductionSeveral studies of the rates of excretion of methylmercuric chloride in rodents haveindicated that oral antibiotics taken concurrently with oral ingestion of methylmercuricchloride is associated with slower excretion (Rowland et. al., 1977, 1980,1984). Theresults of these studies suggest that antibiotics may interact with mercury in a way thatmay alter the effects of mercury. These finding motivate the hypothesis that, in children,antibiotics may interact with exposure to ethylmercury from thimerosal in vaccines, tohave an effect that is different from exposure to ethylmercury from vaccines absentantibiotics use.
The models summarized in this section were fit to the data in order to explore theconcurrent antibiotics hypothesis. Exposure to ethylmercury from thimerosal wasdefined as “concurrent with antibiotic receipt” if the thimerosal-containing vaccine wasreceived during the course of antibiotic treatment, or was received up to 14 days prior toinitiation of antibiotic treatment, or was received up to 14 days after the last day ofantibiotic treatment. This definition of “concurrent with antibiotics” was the subject ofmuch discussion and debate among the study’s external consultants and principalinvestigators, and after consultation with the literature and several experts in toxicology,the current definition was considered to be the best available option. The rationale forthis definition is as follows.
If we operate on the theory that the loss of normal flora by antibiotic treatment causes thethimerosal to be excreted more slowly from the body, we must include a period of timeafter antibiotic usage stops during which the normal flora returns to normal. Pediatricexperts advised that E. coli (the most common gut bacteria) typically returns to normallevels within two weeks of antibiotic use.
The rational for the window prior to antibiotic use is based on the notion that it takes timefor the mercury to be excreted, and if antibiotic treatment starts after receipt of athimerosal containing vaccine, the antibiotic could slow the excretion rate of thepreviously received, but unexcreted mercury. A consulting toxicologist advised that bothanimal and human data indicate demethylation and fecal excretion of the inorganicspecies is the predominant route of elimination of ethylmercury from the body.Unfortunately there are no precise numbers for the rate or biological half time of thisprocess. Data from human infants (Pichichero et al, 2002), and infant monkeys(Burbacher et al., 2005) suggested that 14 days would be a reasonable guess at the lengthof one half-life for excretion.
9.2.6.2. Model Specifications

Abt Associates Inc. Chapter 9 158
The following two models were fit to each outcome variable18:
Model (1): Concurrent Antibiotics from Birth to 7 Months
l
llkjk
kkjj
jj Stcfoe
mosAbExpmosAbDaysmosExperpreNatThimY 070707 43210
0:0:
0:0:
42420
440
a
a
HvsH
HvsH
where
AbDays07mos = a count of the number of days that child received antibiotics, during theage range of 1 to 214 days,
and
AbExp07mos = a cumulative measure of ethylmercury exposure from thimerosal invaccines received concurrent with antibiotics during the age range from birth throughseven months (1 – 214 days), expressed in microgram units per kilograms of body weightat the time of vaccine receipt.
The parameter estimates have the following interpretations:
2̂ is an estimate of the effect of exposure without concurrent antibiotic use.
3̂ is an estimate of the effect of antibiotic use (note: not concurrent antibiotics, butantibiotics in and of themselves).
4̂ is an estimate of the difference between exposure effects with concurrent antibioticuse and exposure effects without antibiotic use.
42ˆˆ is an estimate of the effect of exposure with concurrent antibiotic use (assuming
the number of days on antibiotics is held constant).
Model (2): Concurrent Antibiotics from Birth to 1 Month, and 1 to 7 Months
l
llkjk
kkjj
jj Stcfoe
mosAbExpmosAbExp
mosAbDaysmosAbDaysmosExpHepBerpreNatThimY
1701
170117
76
543210
18 The models shown here are OLS regression models for continuous outcome variables. For dichotomousoutcome measures (tics and stuttering) logistic regression models of a similar form were fit to the data.

Abt Associates Inc. Chapter 9 159
0:0:
0:0:
0:0:0:0:
73730
62620
770
660
a
a
a
a
HvsH
HvsH
HvsHHvsH
whereAbDays01mos = a count of the number of days that child received antibiotics, during thefirst month of life (age range of 1 to 28 days),
AbDays17mos = a count of the number of days that child received antibiotics, during theduring the age range of 1 to 7 months (age range of 29 to 214 days),and
AbExp01mos = a cumulative measure of ethylmercury exposure from thimerosal invaccines received concurrent with antibiotics during the age ranges from birth throughone month1 (1 – 28 days), expressed in microgram units per kilograms of body weight atthe time of vaccine receipt,
AbExp17mos = a cumulative measure of ethylmercury exposure from thimerosal invaccines received concurrent with antibiotics during the age ranges from one throughseven months (29 – 214 days), expressed in microgram units per kilograms of bodyweight at the time of vaccine receipt, and all other terms are as defined in the analysisplan.
The parameter estimates have the following interpretations:
2̂ is an estimate of the effect of exposure without concurrent antibiotic use (during theage range spanning birth to 28 days).
3̂ is an estimate of the effect of exposure without concurrent antibiotic use (during theage range spanning 29 days to seven months).
4̂ is an estimate of the effect of antibiotic use during the age range spanning birth to 28days. (note: not concurrent antibiotics, but antibiotics in and of themselves).
5̂ is an estimate of the effect of antibiotic use during the age range spanning 29 days toseven months. (note: not concurrent antibiotics, but antibiotics in and of themselves).
6̂ is an estimate of the difference between exposure effects with concurrent antibioticuse and exposure effects without antibiotic use, for the age range spanning birth to 28days.
6̂ is an estimate of the difference between exposure effects with concurrent antibioticuse and exposure effects without antibiotic use, for the age range spanning 29 days toseven months.
62ˆˆ is an estimate of the effect of exposure with concurrent antibiotic use, for the age
range spanning birth to 28 days (assuming the number of days on antibiotics is heldconstant).

Abt Associates Inc. Chapter 9 160
73ˆˆ is an estimate of the effect of exposure with concurrent antibiotic use, for the age
range spanning 29 days to seven months.
9.2.6.3. ResultsThe results offer little support for the hypothesis that mercury from vaccines is moreharmful if received concurrent with antibiotics. Of the 42 outcomes analyzed in the birthto seven months exposure model (Model 1), one, CRS-R Teacher Rating Hyperactive /Impulsive, had a significant exposure by antibiotics interaction effect19. For this outcomethe model estimated a statistically non-significant beneficial effect of cumulativeexposure during the age range from birth to seven months, when the exposures were notconcurrent with antibiotics20. For exposures that were concurrent with antibiotics, themodel estimates a harmful effect that was not statistically significant, but wasapproximately similar in magnitude to the beneficial effect of non-concurrent exposure21.Furthermore, the estimated effects of the antibiotics themselves, were significant in thedirection of benefit.
For the Assessor Rated Motor Tics outcome measure, the results indicate a significanteffect of concurrent exposure during the age range from birth to seven months. Holdingthe number of days on antibiotics constant, the model predicts increasing risk of tics withincreasing concurrent exposure. However, the coefficient for the effect of the number ofdays on antibiotics (AbDays07mos) is negative. This means that the model predicts thatan increase in the number of days on antibiotics results in lower risk for this outcome.The predictions from this model are such that a combination of high levels concurrentexposure with a high number of days on antibiotics, produces a lower estimated risk thanis estimated for a combination of low concurrent exposure and few days on antibiotics.
The Model 2 estimates regarding exposure during the age range from 1 to 7 months onthe same outcome, CRS-R Teacher Rating Hyperactive / Impulsive, mirror the previouslydescribed results from Model 1 regarding exposure from birth to 7 months. (See columnslabeled “Exp17mos”, “AbExp17mos”, and “Concur Exp17mos effect” in Exhibit9.2.6.2). There was also a significant interaction effect (exposure 1 to 7 months byantibiotics) for the Finger Tapping Non-Dominant Hand outcome measures. For thisoutcome, estimates for non-concurrent exposure are in the direction of benefit, whileestimates for concurrent exposure are in the direction of harm. However, for this sameoutcome, concurrent exposure in the earlier age range (birth to 28 days) is in the directionof benefit. For Finger Tapping: Dominant Hand, the interaction effect for birth to 28days is significant, and the beneficial effect of concurrent exposure during the age rangespanning birth to 28 days is statistically significant.
19 See the column labeled “AbExp07mos” in Exhibit 9.2.6.1.20 See the column labeled “Exp07mos” in Exhibit 9.2.6.1.21 See the column labeled “ Concur Exp07mos Effect” in Exhibit 9.2.6.1.

Abt Associates Inc. Chapter 9 161
.Exhibit 9.2.6.1. Summary of Models for Concurrent Antibiotics Effect –Birth to Seven Months (n=1,047)
Est S.E. P StCf Est S.E. P StCf Est S.E. P StCf Est S.E. P StCfSpeech and LanguageBoston Naming Test 0.032 0.022 0.143 0.033 0.049 0.031 0.111 0.044 -0.008 0.014 0.544 0.006 0.058 0.911NEPSY: Speeded Naming 0.058 0.027 0.031 + 0.060 0.017 0.039 0.670 0.015 -0.001 0.017 0.969 -0.066 0.073 0.368NEPSY: Comprehension of Instructions -0.002 0.010 0.867 -0.005 -0.013 0.014 0.356 -0.032 0.004 0.006 0.517 -0.008 0.026 0.759CELF: Formulated Sentences 0.020 0.021 0.341 0.025 -0.035 0.030 0.247 -0.037 0.016 0.013 0.231 0.008 0.056 0.893CELF: Recalling Sentences 0.057 0.044 0.201 0.033 -0.012 0.063 0.846 -0.006 -0.014 0.028 0.616 0.102 0.118 0.389GFTA: Articulation (lower = better) -0.002 0.007 0.800 -0.008 0.010 0.010 0.284 0.040 -0.004 0.004 0.313 0.003 0.018 0.859Stuttering: Assessor Rating (lower = better) -0.002 0.021 0.941 0.974 0.031 0.033 0.355 1.556 0.015 0.011 0.170 -0.048 0.062 0.437Stuttering: Parent Rating (lower = better) -0.022 0.049 0.651 0.694 0.034 0.045 0.452 1.620 0.001 0.026 0.974 -0.188 0.114 0.100Stuttering: Teacher Rating (lower = better) -0.039 0.029 0.176 0.519 0.009 0.026 0.721 1.140 0.010 0.008 0.187 -0.002 0.041 0.959Verbal M em oryCVLT-C: Free Recall, No Delay 0.030 0.033 0.356 0.026 0.010 0.047 0.826 0.008 0.022 0.021 0.299 -0.112 0.088 0.205CVLT-C: Free Recall, Short Delay -0.001 0.009 0.895 -0.004 -0.023 0.013 0.085 -0.060 0.006 0.006 0.350 -0.007 0.025 0.795CVLT-C: Cued Recall, Short Delay -0.001 0.008 0.916 -0.003 -0.005 0.012 0.672 -0.015 0.001 0.005 0.919 -0.004 0.022 0.864CVLT-C: Free Recall, Long Delay 0.001 0.009 0.926 0.003 -0.020 0.012 0.111 -0.055 0.001 0.006 0.837 0.003 0.023 0.880CVLT-C: Cued Recall, Long Delay 0.005 0.008 0.563 0.016 0.002 0.012 0.900 0.004 0.001 0.005 0.904 -0.004 0.023 0.844CMS Stories 1: Im mediate Recall 0.025 0.042 0.555 0.013 -0.028 0.061 0.650 -0.013 -0.014 0.027 0.600 -0.032 0.113 0.781CMS Stories 2: Delayed Recall -0.009 0.041 0.826 -0.005 0.006 0.060 0.925 0.003 -0.010 0.027 0.711 -0.014 0.111 0.903Achievem entW JIII: Letter- W ord Identification 0.013 0.026 0.633 0.011 0.072 0.038 0.055 0.055 0.026 0.017 0.122 -0.094 0.070 0.182Fine Motor CoordinationGrooved Pegboard: Dominant Hand (lower = better) -0.111 0.064 0.084 -0.033 -0.081 0.091 0.370 -0.021 0.069 0.041 0.095 0.058 0.171 0.736Grooved Pegboard: Non-dom Hand (lower = better) -0.086 0.077 0.263 -0.023 -0.281 0.111 0.012 + -0.063 0.078 0.050 0.118 0.118 0.207 0.569Finger Tapping: Dominant Hand -0.013 0.022 0.561 -0.016 0.044 0.032 0.167 0.046 0.004 0.014 0.764 -0.096 0.059 0.105Finger Tapping: Non-dominant Hand -0.013 0.020 0.511 -0.017 0.029 0.029 0.315 0.033 0.011 0.013 0.393 -0.103 0.054 0.055Visual Spatial AbilityStanford Binet: Copying 0.006 0.011 0.595 0.016 0.009 0.016 0.545 0.022 -0.001 0.007 0.874 -0.029 0.029 0.307Attention/Executive FunctioningGDS Vigilance Task: Correct Responses -0.012 0.018 0.505 -0.020 0.039 0.026 0.138 0.054 0.010 0.012 0.392 -0.063 0.049 0.198GDS Vigilance Task: Errors (lower = better) 0.035 0.047 0.461 0.022 -0.005 0.068 0.947 -0.002 0.070 0.030 0.020* -0.152 0.126 0.227W ISC III: D ig it Span, Forward Recall 0.000 0.007 0.968 0.001 -0.002 0.010 0.859 -0.007 -0.002 0.004 0.687 -0.006 0.018 0.755W ISC III: D ig it Span, Backward Recall -0.013 0.006 0.030 * -0.065 0.019 0.008 0.022 + 0.084 0.001 0.004 0.710 -0.012 0.016 0.447W ISC III: D igit Span, Com bined -0.012 0.010 0.258 -0.033 0.019 0.015 0.205 0.046 0.000 0.007 0.951 -0.019 0.028 0.498BRIEF Parent Rating: Metacognition (lower = better) 0.019 0.066 0.770 0.009 -0.066 0.094 0.479 -0.026 -0.028 0.042 0.506 0.134 0.176 0.449BRIEF Teacher Rating: Metacognition (lower = better) 0.022 0.088 0.800 0.008 -0.174 0.135 0.198 -0.055 -0.033 0.057 0.564 0.275 0.244 0.260Behavior Regulation (low er = better)CRS-R: Parent Rating: Hyperactive/Impulsive 0.005 0.019 0.776 0.009 0.009 0.026 0.727 0.013 -0.026 0.012 0.028+ 0.082 0.050 0.098CRS-R: Teacher Rating: Hyperactive/Im pulsive 0.021 0.022 0.349 0.030 -0.065 0.034 0.057 -0.080 -0.029 0.015 0.049+ 0.177 0.062 0.005*CRS-R: Parent Rating: Inattentive 0.011 0.022 0.609 0.015 -0.024 0.031 0.440 -0.029 0.001 0.014 0.934 0.002 0.058 0.967CRS-R: Teacher Rating: Inattentive 0.001 0.029 0.967 0.001 -0.039 0.044 0.372 -0.038 -0.002 0.019 0.927 0.060 0.080 0.458BRIEF Parent Rating: Behavior Regulation -0.023 0.040 0.556 -0.018 0.060 0.057 0.287 0.040 -0.037 0.026 0.151 0.144 0.106 0.176BRIEF Teacher Rating: Behavior Regulation 0.033 0.048 0.488 0.023 -0.061 0.073 0.402 -0.036 -0.019 0.031 0.529 0.174 0.132 0.187Tics (low er = better)Motor tics (current): Assessor Rating 0.017 0.011 0.119 1.320 0.025 0.022 0.265 1.429 -0.027 0.015 0.078 0.059 0.039 0.130Phonics tics (current): Assessor Rating -0.011 0.018 0.538 0.829 0.034 0.023 0.151 1.618 -0.002 0.009 0.839 0.024 0.038 0.522Motor tics (current): Parent Rating 0.003 0.012 0.834 1.043 -0.003 0.021 0.876 0.955 -0.013 0.010 0.185 -0.005 0.041 0.893Phonics tics (current): Parent Rating -0.013 0.017 0.443 0.810 0.012 0.019 0.538 1.183 0.007 0.007 0.344 -0.041 0.036 0.260General Intellectual FunctioningW ASI Verbal IQ 0.052 0.047 0.270 0.029 -0.055 0.067 0.414 -0.027 -0.014 0.030 0.651 0.104 0.126 0.409W ASI Perform ance IQ -0.008 0.054 0.887 -0.004 0.130 0.076 0.086 0.061 -0.023 0.034 0.496 -0.016 0.144 0.910W ASI Full Scale IQ 0.026 0.048 0.595 0.015 0.057 0.069 0.412 0.028 -0.016 0.031 0.600 0.019 0.129 0.884
< .05 >.05, <.10 < .05 >.05, <.10Key: Mercury effect = Better Outcome p-value+ p-value Mercury effect =W orse Outcome p-value* p-value
P-values shown are rounded to 3 decimal places. Therefore, a value shown as 0.050 m ay satisify p<0.05 criterion if the original value was rounded up, or m ay not satisify the criterion if the value was rounded down.
AbDays07m os AbExp07mosExp07m osTest
PreNatThim erEst S.E. P StCf
0.056 0.060 0.352 0.050-0.049 0.076 0.518 -0.043-0.021 0.027 0.440 -0.053-0.028 0.059 0.637 -0.0290.090 0.122 0.464 0.0450.014 0.019 0.469 0.052
-0.017 0.065 0.788 0.779-0.154 0.114 0.174 0.1100.007 0.044 0.874 1.106
-0.101 0.091 0.268 -0.074-0.029 0.026 0.256 -0.077-0.009 0.023 0.701 -0.026-0.016 0.024 0.502 -0.045-0.003 0.024 0.901 -0.008-0.059 0.117 0.614 -0.027-0.008 0.116 0.946 -0.004
-0.022 0.073 0.766 -0.017
-0.024 0.177 0.894 -0.006-0.163 0.215 0.449 -0.037-0.052 0.061 0.397 -0.054-0.074 0.055 0.181 -0.085
-0.020 0.030 0.502 -0.048
-0.024 0.051 0.638 -0.033-0.157 0.131 0.232 -0.084-0.007 0.019 0.695 -0.0280.007 0.016 0.658 0.0320.000 0.029 1.000 0.0000.067 0.182 0.713 0.0260.102 0.257 0.692 0.032
0.091 0.051 0.075 0.1280.112 0.065 0.088 0.138
-0.021 0.060 0.720 -0.0260.020 0.085 0.812 0.0200.204 0.110 0.063 0.1340.113 0.139 0.417 0.067
0.084 0.040 0.037* 3.3100.058 0.040 0.142 2.291
-0.009 0.042 0.834 0.883-0.029 0.037 0.439 0.661
0.049 0.130 0.705 0.0240.114 0.149 0.445 0.0530.076 0.134 0.573 0.037
>.05, <.10
Concur Exp07m os Effect

Abt Associates Inc. Chapter 9 162
.Exhibit 9.2.6.2. Summary of Models for Concurrent Antibiotics Effect –Birth to 28 Days, and 29 Days to Seven Months (n=1,047)
Est S.E. P StCf Est S.E. P StCf Est S.E. P StCf Est S.E. P StCfSpeechandLanguageBostonNamingTest 0.033 0.022 0.129 0.034 -0.047 0.102 0.643 -0.011 0.063 0.033 0.056 0.052 -0.173 0.109 0.112NEPSY:SpeededNaming 0.057 0.027 0.033+ 0.059 -0.034 0.127 0.788 -0.008 0.024 0.042 0.573 0.019 -0.019 0.135 0.889NEPSY:Comprehensionof Instructions -0.002 0.010 0.842 -0.006 -0.023 0.045 0.610 -0.016 -0.012 0.015 0.421 -0.028 0.028 0.049 0.566CELF:FormulatedSentences 0.020 0.021 0.340 0.025 -0.064 0.099 0.518 -0.018 -0.030 0.032 0.356 -0.030 -0.089 0.106 0.399CELF:RecallingSentences 0.054 0.044 0.224 0.031 -0.035 0.207 0.866 -0.005 -0.007 0.067 0.914 -0.003 -0.082 0.222 0.711GFTA: Articulation(lower= better) -0.002 0.007 0.715 -0.011 0.076 0.032 0.017* 0.077 0.003 0.010 0.794 0.010 0.008 0.034 0.821Stuttering:AssessorRating(lower=better) -0.002 0.021 0.925 0.967 0.067 0.104 0.523 1.290 0.024 0.036 0.495 1.381 0.066 0.081 0.416Stuttering:ParentRating (lower=better) -0.021 0.048 0.663 0.705 -0.095 0.125 0.447 0.696 0.046 0.046 0.324 1.840 -6.373 50.547 0.900Stuttering:TeacherRating (lower=better) -0.038 0.029 0.183 0.529 0.030 0.075 0.689 1.122 0.010 0.028 0.726 1.137 -0.044 0.074 0.554VerbalMemoryCVLT-C:FreeRecall,NoDelay 0.031 0.033 0.356 0.026 0.020 0.154 0.897 0.004 0.011 0.050 0.833 0.007 -0.065 0.166 0.694CVLT-C:FreeRecall,ShortDelay -0.001 0.009 0.896 -0.004 -0.017 0.044 0.695 -0.012 -0.023 0.014 0.103 -0.056 -0.024 0.047 0.617CVLT-C:CuedRecall,ShortDelay -0.001 0.008 0.870 -0.005 0.030 0.038 0.432 0.024 -0.009 0.012 0.488 -0.024 -0.021 0.041 0.602CVLT-C:FreeRecall, LongDelay 0.001 0.009 0.943 0.002 -0.020 0.041 0.618 -0.015 -0.019 0.013 0.144 -0.050 -0.020 0.043 0.645CVLT-C:CuedRecall, LongDelay 0.005 0.008 0.565 0.016 0.008 0.040 0.835 0.006 0.001 0.013 0.918 0.004 -0.036 0.042 0.396CMSStories1: ImmediateRecall 0.024 0.042 0.572 0.013 -0.068 0.198 0.731 -0.008 -0.023 0.065 0.721 -0.010 0.029 0.212 0.891CMSStories2:DelayedRecall -0.011 0.041 0.791 -0.006 -0.037 0.195 0.847 -0.005 0.011 0.064 0.859 0.005 -0.002 0.209 0.994AchievementWJIII: Letter-WordIdentification 0.013 0.026 0.609 0.012 -0.072 0.123 0.559 -0.015 0.090 0.040 0.024+ 0.064 -0.059 0.132 0.656FineMotorCoordinationGroovedPegboard:DominantHand(lower=better) -0.108 0.064 0.092 -0.033 -0.278 0.301 0.355 -0.019 -0.061 0.096 0.527 -0.015 0.133 0.323 0.680GroovedPegboard:Non-domHand(lower=better) -0.090 0.077 0.244 -0.024 -0.165 0.364 0.651 -0.010 -0.296 0.119 0.013+ -0.062 0.252 0.388 0.517FingerTapping:DominantHand -0.012 0.022 0.573 -0.015 0.197 0.104 0.057 0.055 0.028 0.034 0.404 0.028 -0.152 0.110 0.168FingerTapping:Non-dominantHand -0.012 0.020 0.560 -0.015 0.025 0.094 0.791 0.008 0.032 0.031 0.303 0.034 -0.127 0.100 0.207VisualSpatialAbilityStanfordBinet:Copying 0.006 0.011 0.560 0.017 -0.025 0.051 0.621 -0.016 0.014 0.017 0.408 0.031 -0.021 0.054 0.693Attention/ExecutiveFunctioningGDSVigilanceTask:CorrectResponses -0.011 0.018 0.540 -0.018 -0.014 0.086 0.875 -0.005 0.045 0.028 0.110 0.058 0.018 0.092 0.846GDSVigilanceTask:Errors(lower=better) 0.033 0.047 0.489 0.020 0.051 0.221 0.817 0.007 -0.009 0.072 0.905 -0.004 -0.040 0.236 0.866WISCIII:DigitSpan,ForwardRecall 0.000 0.007 0.953 0.002 -0.014 0.032 0.649 -0.015 0.001 0.010 0.934 0.003 -0.063 0.034 0.065WISCIII:DigitSpan,BackwardRecall -0.013 0.006 0.028* -0.066 0.038 0.028 0.168 0.045 0.018 0.009 0.049+ 0.071 -0.021 0.030 0.478WISCIII: DigitSpan,Combined -0.012 0.010 0.255 -0.033 0.017 0.049 0.732 0.011 0.021 0.016 0.195 0.046 -0.086 0.052 0.099BRIEFParentRating: Metacognition(lower=better) 0.019 0.066 0.778 0.008 0.004 0.309 0.990 0.000 -0.072 0.100 0.474 -0.026 -0.167 0.332 0.616BRIEFTeacherRating:Metacognition(lower=better) 0.019 0.089 0.832 0.007 0.014 0.436 0.974 0.001 -0.198 0.144 0.169 -0.058 0.070 0.441 0.873BehaviorRegulation(lower=better)CRS-R:ParentRating:Hyperactive/Impulsive 0.003 0.019 0.853 0.006 0.079 0.087 0.364 0.030 0.000 0.028 0.998 0.000 0.065 0.093 0.488CRS-R:TeacherRating:Hyperactive/Impulsive 0.020 0.022 0.367 0.029 -0.019 0.111 0.867 -0.006 -0.069 0.036 0.058 -0.079 -0.070 0.112 0.535CRS-R:ParentRating: Inattentive 0.010 0.022 0.638 0.014 0.025 0.101 0.807 0.008 -0.030 0.033 0.365 -0.033 0.040 0.109 0.713CRS-R:TeacherRating: Inattentive 0.001 0.029 0.984 0.001 0.009 0.142 0.950 0.002 -0.046 0.047 0.326 -0.042 0.026 0.144 0.858BRIEFParentRating: BehaviorRegulation -0.023 0.040 0.559 -0.018 -0.061 0.186 0.745 -0.011 0.075 0.060 0.214 0.046 -0.066 0.200 0.742BRIEFTeacherRating:BehaviorRegulation 0.029 0.048 0.540 0.020 0.186 0.234 0.426 0.029 -0.089 0.078 0.252 -0.049 -0.050 0.237 0.832Tics(lower=better)Motortics(current):AssessorRating 0.018 0.011 0.099 1.345 -0.038 0.069 0.580 0.864 0.031 0.024 0.190 1.510 0.047 0.066 0.478Phonicstics(current):AssessorRating -0.012 0.019 0.533 0.825 0.032 0.074 0.661 1.132 0.032 0.024 0.187 1.534 0.026 0.062 0.673Motortics(current):ParentRating 0.003 0.012 0.795 1.055 -0.106 0.070 0.129 0.666 0.009 0.022 0.681 1.130 -0.040 0.103 0.700Phonicstics(current):ParentRating -0.013 0.017 0.437 0.807 0.030 0.065 0.638 1.123 0.011 0.020 0.605 1.150 -0.101 0.102 0.323General IntellectualFunctioningWASIVerbal IQ 0.054 0.047 0.247 0.031 -0.399 0.220 0.071 -0.052 -0.014 0.071 0.840 -0.007 -0.128 0.236 0.587WASIPerformanceIQ -0.009 0.054 0.875 -0.005 0.304 0.254 0.231 0.038 0.114 0.080 0.158 0.050 -0.167 0.269 0.534WASIFullScaleIQ 0.027 0.049 0.580 0.015 -0.082 0.227 0.717 -0.011 0.075 0.074 0.310 0.034 -0.137 0.240 0.570
<.05 >.05,<.10 <.05 >.05,<.10Key: Mercuryeffect=BetterOutcome p-value+ p-value Mercuryeffect=WorseOutcome p-value* p-value
P-valuesshownareroundedto3decimal places.Therefore,avalueshownas0.050maysatisifyp<0.05criterionif theoriginal valuewasroundedup,ormaynotsatisifythecriterionif thevaluewasroundeddown.
Exp17mos AbDays01mosHepBTest
PreNatThimerEst S.E. P StCf Est S.E. P StCf Est S.E. P StCf Est S.E. P StCf Est S.E. P StCf
0.001 0.015 0.942 0.101 0.342 0.767 -0.003 0.059 0.958 0.054 0.346 0.876 0.013 0.060 0.061 0.327 0.0500.003 0.019 0.862 -0.801 0.424 0.059 -0.052 0.074 0.483 -0.835 0.429 0.052 -0.196 -0.028 0.077 0.713 -0.0230.003 0.007 0.681 -0.189 0.155 0.225 -0.003 0.027 0.918 -0.212 0.157 0.179 -0.143 -0.015 0.028 0.594 -0.0350.023 0.015 0.116 -0.143 0.332 0.667 0.007 0.057 0.905 -0.207 0.336 0.538 -0.059 -0.023 0.060 0.698 -0.023-0.005 0.031 0.877 -1.282 0.701 0.068 0.126 0.120 0.293 -1.317 0.708 0.063 -0.176 0.119 0.124 0.341 0.055-0.005 0.005 0.288 -0.040 0.108 0.715 0.006 0.019 0.755 0.036 0.109 0.740 0.037 0.008 0.019 0.659 0.0300.011 0.013 0.404 -0.068 0.295 0.818 -0.048 0.064 0.455 -0.001 0.299 0.997 0.996 -0.024 0.067 0.724 0.7290.002 0.027 0.950 -0.839 69.395 0.990 -0.173 0.115 0.131 -0.934 69.395 0.989 0.028 -0.127 0.115 0.267 0.1840.015 0.010 0.118 0.013 0.234 0.957 -0.006 0.041 0.878 0.043 0.237 0.857 1.178 0.003 0.045 0.940 1.046
0.027 0.023 0.238 -0.080 0.522 0.879 -0.115 0.089 0.198 -0.060 0.529 0.910 -0.012 -0.105 0.093 0.263 -0.0720.007 0.007 0.260 -0.004 0.148 0.980 -0.008 0.025 0.768 -0.021 0.150 0.889 -0.015 -0.031 0.026 0.247 -0.0750.002 0.006 0.691 -0.107 0.131 0.415 -0.002 0.022 0.926 -0.077 0.132 0.561 -0.061 -0.011 0.023 0.643 -0.0300.003 0.006 0.655 -0.067 0.137 0.627 0.004 0.024 0.863 -0.087 0.139 0.532 -0.065 -0.015 0.024 0.538 -0.0400.003 0.006 0.622 -0.003 0.135 0.984 -0.006 0.023 0.802 0.006 0.137 0.968 0.004 -0.004 0.024 0.854 -0.012-0.015 0.029 0.619 -0.642 0.667 0.336 -0.018 0.115 0.877 -0.711 0.675 0.293 -0.087 -0.041 0.120 0.733 -0.018-0.007 0.029 0.814 -0.980 0.654 0.134 0.006 0.113 0.956 -1.018 0.662 0.125 -0.128 0.018 0.118 0.881 0.008
0.032 0.018 0.078 -0.356 0.415 0.392 -0.096 0.071 0.179 -0.428 0.420 0.309 -0.087 -0.006 0.074 0.940 -0.004
0.063 0.045 0.159 0.518 1.011 0.608 0.047 0.174 0.787 0.240 1.023 0.815 0.017 -0.014 0.181 0.938 -0.0030.072 0.054 0.185 -1.117 1.224 0.362 0.152 0.211 0.471 -1.281 1.237 0.301 -0.077 -0.144 0.220 0.511 -0.0300.011 0.015 0.493 0.719 0.351 0.041+ -0.115 0.060 0.055 0.916 0.355 0.010+ 0.257 -0.086 0.062 0.164 -0.0840.017 0.014 0.221 0.490 0.318 0.124 -0.120 0.054 0.027* 0.515 0.322 0.110 0.157 -0.089 0.056 0.116 -0.095
0.000 0.008 0.980 0.063 0.171 0.713 -0.033 0.029 0.264 0.038 0.172 0.828 0.024 -0.019 0.030 0.534 -0.042
0.009 0.013 0.493 0.146 0.289 0.614 -0.068 0.050 0.172 0.132 0.292 0.651 0.049 -0.023 0.052 0.658 -0.0300.080 0.033 0.015* -0.992 0.744 0.183 -0.138 0.127 0.278 -0.941 0.752 0.211 -0.135 -0.147 0.134 0.271 -0.0740.002 0.005 0.646 -0.066 0.107 0.539 -0.007 0.018 0.705 -0.080 0.108 0.459 -0.081 -0.006 0.019 0.750 -0.0220.003 0.004 0.509 -0.002 0.093 0.979 -0.013 0.016 0.431 0.036 0.095 0.704 0.042 0.005 0.017 0.769 0.0200.005 0.007 0.493 -0.060 0.165 0.715 -0.021 0.028 0.449 -0.044 0.167 0.794 -0.028 -0.001 0.029 0.978 -0.002-0.019 0.046 0.675 0.033 1.047 0.975 0.131 0.179 0.464 0.037 1.058 0.972 0.004 0.060 0.186 0.749 0.022-0.040 0.064 0.527 0.173 1.390 0.901 0.289 0.248 0.245 0.187 1.405 0.894 0.016 0.090 0.261 0.729 0.027
-0.030 0.013 0.020+ -0.402 0.292 0.169 0.097 0.050 0.054 -0.323 0.296 0.275 -0.121 0.097 0.052 0.063 0.127-0.025 0.016 0.113 0.124 0.355 0.726 0.177 0.063 0.005* 0.106 0.358 0.768 0.035 0.108 0.066 0.106 0.124-0.001 0.015 0.964 -0.165 0.341 0.628 0.008 0.059 0.888 -0.140 0.345 0.684 -0.045 -0.021 0.061 0.725 -0.024-0.005 0.021 0.824 0.227 0.451 0.615 0.060 0.081 0.462 0.236 0.456 0.606 0.061 0.014 0.086 0.872 0.013-0.033 0.028 0.237 -0.422 0.627 0.501 0.153 0.108 0.158 -0.483 0.634 0.446 -0.085 0.227 0.112 0.042* 0.139-0.017 0.034 0.621 0.063 0.749 0.933 0.180 0.133 0.178 0.249 0.756 0.742 0.039 0.091 0.141 0.521 0.050
-0.031 0.015 0.042+ 0.047 0.195 0.810 0.064 0.040 0.110 0.009 0.199 0.966 1.033 0.095 0.042 0.025* 3.529-0.005 0.011 0.651 0.131 0.188 0.486 0.023 0.040 0.566 0.163 0.194 0.400 1.867 0.055 0.041 0.184 2.078-0.013 0.010 0.213 -0.086 0.289 0.765 -0.004 0.041 0.931 -0.192 0.290 0.508 0.479 0.006 0.043 0.895 1.0780.010 0.008 0.209 0.104 0.219 0.633 -0.045 0.037 0.220 0.135 0.223 0.545 1.674 -0.035 0.039 0.370 0.630
-0.006 0.033 0.859 -0.242 0.755 0.749 0.102 0.128 0.426 -0.641 0.763 0.401 -0.084 0.087 0.132 0.510 0.040-0.016 0.037 0.668 0.328 0.844 0.697 -0.024 0.147 0.870 0.632 0.855 0.460 0.079 0.090 0.152 0.554 0.039-0.008 0.033 0.804 -0.135 0.766 0.861 0.015 0.131 0.908 -0.217 0.774 0.779 -0.028 0.090 0.137 0.510 0.041
>.05,<.10
ConcurExp17mosEffectAbDays17mos AbExp01mos AbExp17mos ConcurHepBEffect

Abt Associates Inc. Chapter 10 163
10. References
Ambrose, N. G.; Cox, N. J.; Yairi, E. (1997, June). The genetic basis of the persistenceand recovery in stuttering. Journal of Speech, Language, and Hearing Research, 40(3),567-580.
Andrews N, Miller E, Grant A, Stowe J, Osborne V, Taylor B (2004). Thimerosalexposure in infants and developmental disorders: a retrospective cohort study in theUnited kingdom does not support a causal association. Pediatrics; 114(3):584-591.
American Academy of Pediatrics (AAP) (1999). Thimerosal in Vaccines – An InterimReport to Clinicians (RE9935). Pediatrics, 104, 570-574.
Axton, J.H.M. (1972). Six cases of poisoning after a perenteral organic mercurialcompound (Merthiolate). Postgraduate Medical Journal, 48, 417-421.
Bakir, F., Damluji, S.F., Amin-Zaki, L., Murtadha, M., Khalidi, A., Al-Rawi, N.Y.,Tikriti, S., Dhahir, H.I., Clarkson, T.W., Smith, J.C., and Doherty, R.A., (1973).Methylmercury poisoning in Iraq. Science, 181, 230-241.
Ball, L.K., Ball, R., and Pratt, R.D. (2001). An assessment of Thimerosal use inchildhood vaccines. Pediatrics, 107, 1147-1154.
Baskin DS, Ngo H, Didenko VV (2003). Thimerosal induces DNA breaks, caspase-3activation, membrane damage, and cell death in cultured human neurons and fibroblasts.Toxicol Sci; 74(2):361-368.
Bellinger, D., Dietrich, K.N. (1994). Low-level lead exposure and cognitive function inchildren. Pediat Ann, 23, 600-605.
Bollen, K.A., Jackman, R. W., (1990). Regression Diagnostics: An Expository Treatmentof Outliers and Influential Cases, in Fox J., and Long J.S., eds (1990) Modern Methods ofData Analysis Newbury Park CA: Sage
Bradley B.J., Caldwell B.M., (1984). The HOME Inventory and family demographics.Developmental Psychology; 20:315-320.
Budtz-Jorgensen E, Keiding N, Grandjean EM, Weihe P (2007). Confounder selection inenvironmental epidemiology. Assessment of health effects of prenatal mercury exposure.Annals of Epidemiology; 17:27-35.
Burbacher, T.M., Shen, D.D., Liberato, N., Grant, K.S., Cernichiar, E., Clarkson, T.,(2005). Comparison of Blood and Brain Mercury Levels in Infant Monkeys Exposed to

Abt Associates Inc. Chapter 10 164
Methylmercury or Vaccines Containing Thimerosal. Environmental Health Perspectives,ehponline.org
Chen RT, Glasser JW, Rhodes PH et al. Vaccine Safety Datalink project: a new tool forimproving vaccine safety monitoring in the United States. The Vaccine Safety DatalinkTeam. Pediatrics 1997; 99(6):765-773.
Chen R.T., DeStefano F., Davis R.L., Jackson, L.A., Thompson, R. S., Mullooly, J.P.,Black, S.B., Shinefield, H.R., Vadheim, C.M., Ward, J.I., Marcy, S.M. (2000) TheVaccine Safety Datalink: immunization research in health maintenance organizations inthe USA. Bull World Health Organ; 78(2):186-194.
Choi, B.H. (1989). The effects of methylmercury on the developing brain. Progress inNeurobiology, 32, 447-770.
Cohen, J., (1988). Statistical Power Analysis for the Behavioral Sciences, 2nd edtion.Lawrence Erlbaum Associates, Inc., Hillsdale NJ.
Cox, N.H., and Forsyth, A. (1988). Thimerosal allergy and vaccination reactions.Contact dermatitis, 18, 229-233.
Crump, K.S., Kjellstrom, T., Shipp, A.M., Silvers, A., Stewart, A. (1998). Influence ofprenatal mercury exposure upon scholastic and psychological test performance:Benchmark analysis of a New Zealand cohort. Risk Analysis, 18, 701-713.
Dale, P.S., Simonoff, E., Bishop, D.V.M., Eley, T.C., Oliver, B., Price, T.S., Purcell, S.,Stevenson, J., and Plomin, R. (1998). Genetic influence on language delay in two-year-old children. Nature Neuroscience, 1(4): 324-328.
Damluji, S. (1962) Mercurial poisoning with the fungicide Granosan M. J. Fac. Med.Baghdad 4 (no3) 83-103.
Davidson PW, Kost J, Myers GJ, Cox C, Clarkson TW, Shamlaye CF (2001).Methylmercury and neurodevelopment: reanalysis of the Seychelles Child DevelopmentStudy outcomes at 66 months of age. JAMA; 285(10):1291-1293.
Davidson, P.W., Myers, G. J., Cox, C., Axtell, C., Shamlaye, C., Slaone-Reeves, J.,Cernichari, E., Needaham, L., Choi, A., Wang, Y., Berlin, M., Clarkson, T.W. (1998).Effects of prenatal and postnatal methylmercury exposure from fish consumption onneurodevelopment: Outcomes at 66 months of age in the Seychelles child developmentstudy. JAMA, 280, 701-707
Davidson, PW, Palumbo, D, Myers, GJ, Cox, C, Shamlaye, CF, Sloane-Reeves, J,Cernichiari, E, Wilding, GE, and Clarkson, TW (2000). Neurodevelopmental outcomesof Seychellois children from the pilot cohort at 108 months following prenatal exposure

Abt Associates Inc. Chapter 10 165
to methylmercury from a maternal fish diet. Environmental Research Section A, 84, 1-11.
Dietrich, K.N. (1996). Prenatal lead exposure and its consequences for fetal and childdevelopment. In S.M . Pueschel, et al. (eds.) Lead Poisoning in Childhood. Baltimore:Brookes Publishing.
Fagan DG, Pritchard JS, Clarkson TW, Greenwood MR. (1977). Organ mercury levels ininfants with omphaloceles treated with organic mercurial antiseptic. Archives of Diseasein Childhood, 52: 962-964.
Faraone, S.V. and Biederman, J. (1994). Genetics of attention-deficit hyperactivitydisorder. Disruptive Disorders, 3: 285-301.
Geier D.A., Geier M.R. (2003a). An assessment of the impact of thimerosal on childhoodneurodevelopmental disorders. Pediatr Rehabil; 6(2):97-102.
Geier M.R., Geier D.A. (2003b). Neurodevelopmental disorders after thimerosal-containing vaccines: a brief communication. Exp Biol Med (Maywood ); 228(6):660-664.
Geier D.A., Geier M.R. (2003c). Thimerosal in childhood vaccines, neurodevelopmentaldisorders, and heart disease in the United States. PJ Am Phys Surg; 8:6-11.
Geier D.A., Geier M.R. (2004). Neurodevelopmental disorders following thimerosal-containing childhood immunizations: a follow-up analysis. Int J Toxicol; 23(6):369-376.
Geier D.A., Geier M.R. (2005). A two-phased population epidemiological study of thesafety of thimerosal-containing vaccines: a follow-up analysis. Med Sci Monit ;11(4):CR160-CR170.
Geier D.A., Geier M.R. (2006a). An assessment of downward trends inneurodevelopmental disorders in the United States following removal of thimerosal fromchildhood vaccines. Med Sci Monit ; 12(6):CR231-239.
Geier D.A., Geier M.R. (2006b). An evaluation of the effects of thimerosal onneurodevelopmental disorders reported following DTP and Hib vaccines in comparisonto DTPH vaccine in the United States. J Toxicol Environ Health, Part A 2006;69(15):1481-1495.
Goldman, L.R. & Shannon, M.W., and the Committee on Environmental Health,American Academy of Pediatrics. (2001). Technical Report: Mercury in theenvironment: Implications for Pediatricians. Pediatrics, 108: 197-205.
Goldfrank, Flonenbaum, Lewin, Howland, Hoffman, Nelson (2002). Goldfrank'sToxicologic Emergencies. 7th ed..

Abt Associates Inc. Chapter 10 166
Goldman, L.R., Shannon, M.W., Balk, S., Gitterman, B.A., Miller, M.D., Shannon,M.W., Shea, K.M., Weil, W.B. (2001). Technical report: Mercury in the environment:Implications for pediatricians. Pediatrics, 108 (1).
Goth S.R., Chu R.A., Gregg J.P., Cherednichenko G, Pessah I.N. (2006). Uncoupling ofATP-mediated calcium signaling and dysregulated interleukin-6 secretion in dendriticcells by nanomolar thimerosal. Environ Health Perspect; 114(7):1083-1091.
Grandjean, P, Weihe, P., White, R.F., Debes, F., Araki, S., Yokoyama, K., Murata, K.,Sorensen, N., Dahl, R., and Jorgensen, P.J. (1997). Cognitive deficit in 7-year childrenwith prenatal exposure to methylmercury. Neurotoxicology and Teratology, 19 (6), 417-428.
Grandjean, P., Budtz-Jorgensen, E., White, R. Jorgensen, P.J., Weihe, P., Debes, F.,Keilding, N. (1999). Methylmercury exposure biomarkers of neurotoxicity in childrenaged 7 years. American Journal of Epidemiology 150(3); 301-305.
Grandjean, P., Weihe, P., Jorgensen, P.J., Clarkson, T., Cernichiari, E., Videro, T. (1992).Impact of maternal seafood diet on fetal exposure to mercury, selenium, and lead.Archives of Environmental Health, 47, 185-195.
Harada, M. (1995). Minamata disease: methylmercury poisoning in Japan caused byenvironmental pollution. Critical Review of Toxicology, 25, 1-24.
Havarinasab S., Lambertsson,L., Qvarnstrom, J., Hultman P. (2004) Dose-response studyof thimerosal induced murine systemic immunity. Toxicol Appl Pharmacol; 194:169-179.
Havarinasab S, Haggqvist B, Bjorn E, Pollard KM, Hultman P. (2005)Immunosuppressive and autoimmune effects of thimerosal in mice. Toxicol ApplPharmacol; 204(2):109-121.
Havarinasab S, Hultman P. (2006) Alteration of the spontaneous systemic autoimmunedisease in (NZB x NZW)F1 mice by treatment with thimerosal (ethylmercury). ToxicolAppl Pharmacol; 214(1):43-54.
Heron J, Golding J. (2004.) Thimerosal exposure in infants and developmental disorders:a prospective cohort study in the United kingdom does not support a causal association.Pediatrics; 114(3):577-583.
Hornig M., Chian D., Lipkin W.I. (2004) Neurotoxic effects of postnatal thimerosal aremouse strain dependent. Mol Psychiatry; 9(9):833-845.
Hunter J.E., Hamilton M.A. (2002). The advantages of using standardized scores incausal analysis. Human Communication Research; 28:552-561.

Abt Associates Inc. Chapter 10 167
Immunization safety review (2004). Vaccines and Autism. Immunization Safety ReviewCommittee. Board of Health Promotion and Disease Prevention, Institute of Medicine.Washington DC: National Academy Press.
Jacobsen, J.L., (2001). Contending with contradictory data in a risk assessment context:the case of methlylmercury. Neurotoxicology 22 ; 667-675.
Jacobson, J. L. (2001). Contending with contradictory data in a risk assessment context:The case of methylmercury. Neurotoxicology, 22, 667-675.
Jacobson, J.L. and Jacobson, S.W. (1991). Assessment of teratogenic effects oncognitive and behavioral development in infancy and childhood. In: Kilbey, M.M.,Asghar, K., editors. Methodological issues in controlled studies on effects of prenatalexposure to drugs of abuse, Research Monograph 114. Rockville (MD): NationalInstitute on Drug Abuse. Pp. 248-61.
James SJ, Slikker W, III, Melnyk S, New E, Pogribna M, Jernigan S. (2005). Thimerosalneurotoxicity is associated with glutathione depletion: protection with glutathioneprecursors. Neurotoxicology; 26(1):1-8.
Jalili, MA, Abbasi, AH (1961). Poisoning by ethylmercury toluene sulphonanilide.British Journal of Industrial Medicine, 18, 303-308.
Joint statement of the American Academy of Pediatrics (AAP) and the United StatesPublic Health Service (USPHS). Pediatrics 1999; 104(3 Pt 1):568-569.
Kim J, Feree G. (1981) Standardization in causal analysis. Sociological Methods andResearch; 10:187-210.
Kjellstrom, T., Kennedy, P., Wallis, S., Stewart, A., Friberg, L., Lind, B., Wutherspoon,T., Mantell, C. (1989). Physical and mental development of children with prenatalexposure to mercury from fish. Stage II: Interviews and psychological tests at age 6.National Swedish Environmental Protection Board Report 3642, Solna, Sweden.
Kleinbaum, D.G., Kupper, L.L, Morgenstern, H. (1982) Epidemiologic Research. VanNostrand Reinhold, New York.
Lanphear, BP, Dietrich, K, Auinger, P, Cox, C (2000). Cognitive deficits associated withblood lead concentrations < 10 ug/dL in children and adolescents. Public Health Reports,115: 521-529.
Lewis, Barbara (1992, Fall). Genetics in Speech Disorders. In Philips, B. J. andSchaefer, G. B. (Eds.), Genetics of Communication Disorders (issue), Clinics inCommunication Disorders, 2(4), 48-58. (5), 385-401.

Abt Associates Inc. Chapter 10 168
Lindberg, S.E., et al. 2001. Methylated mercury species in municipal waste landfill gassampled in Florida, USA. Atmospheric Environment 35(August):4011.
Little, R.J.A., Rubin, D.B., (2002). Statistical Analysis with Missing Data. Wiley,Hoboken New Jersey.
Lowell JA, Burgess S, Shenoy S, Curci JA, Peters M, Howard TK (1996). Mercurypoisoning associated with high-dose hepatitis-B immune globulin administration afterliver transplantation for chronic hepatitis B. Liver Transplantation and Surgery., 2, 475-478.
Lozoff, B., Jimenez, E., Hagen, J., Mollen, E. and Wolf, A.W. (2000). Poorer behavioraland developmental outcome more than 10 years after treatment for iron deficiency ininfancy. Pediatrics, 105: E51.
Magos, L. (2001a). Review on the toxicity of ethylmercury, including its presence as apresrvative in biological and pharmaceutical products. Journal of Applied Toxicology,21, 1-5.
Magos, L. (2001b) Answers to questions on the toxicity of ethylmercury. Prepared forthe Institute of Medicine Immunization Safety Review Committee. Washington, DC:National Academies Press.
Magos, L., Brown, A.W., Sparrow, S., Bailey, E., Snowden, R.T., Skipp, W.R. (1985).Comparative toxicology of ethyl- and methylmercury. Archives of Toxicology, 57, 260-267.
Mahaffey, K.R. (1999). Methylmercury: A new look at the risks. Public Health Reports,114, 397-413.
Maldonado, G., Greenland, S., (1993). Simulation study of confounder-selectionstrategies. American Journal of Epidemiology 138(11); 923-936.
David S. Mandell, D.S., Thompson, W.W.,Weintraub, E.S., DeStefano, F., Blank, M.B.(2005). Trends in Diagnosis Rates for Autism and ADHD at Hospital Discharge in theContext of Other Psychiatric Diagnoses. Psychiatric Services;http://ps.psychiatryonline.org . January Vol. 56 No. 1
Marsh, D.O., Clarkson, T.W., Myers, G.J., Davidson, P.W., Cox, C., Cernichiari, E.,Tanner, M.A., Lednar, W., Shalaye,C., Choisy, O., Hoareau, Cl, Berlin, M., (1995). TheSeychelles study of fetal methylmercury exposure and child development: Introduction.Aneurotoxicology. 16(4), 583-596.

Abt Associates Inc. Chapter 10 169
Marsh, D.O., Myers, G.J., Clarkson, T.W., Amin-Zaki, L., Tikriti, S., and Majeed, M.(1980). Fetal methylmercury poisoning: clinical and toxicological data on 29 cases.Annuals of Neurology, 7, 348-353.
Mausner, J. S., Kramer, S., (1985). Mausner & Bahn Epidemiology – An IntroductoryText. W. B. Saunders Company, Philidelphia.
Mendelsohn AL, Dreyer, BP, Fierman, AH, Rosen CM, Legano LA, Kruger, HA, Lim ,SW , Courtlandt, CD (1998). Low-level lead exposure and behavior in early childhood.Pediatrics, 101:
Mutkus L., Aschner J.L., Syversen T., Shanker G., Sonnewald U., Aschner M. (2005) Invitro uptake of glutamate in G. Biol Trace Elem Res; 105(1-3):71-86.
Myers, G.J., Davidson, P.W., Cox, C., Shamlaye, C.F., Tanner, M.A., Choisy, O.,Sloane-Reeves, J., Marsh, D.O., Cernichiari, E., Choi, A., Berlin, M., Clarkson, T.W.(1995). Neurodevelopmental outcomes of Seychellois children 66 months after in uteroexposure to methylmercury from a maternal fish diet: Pilot study. Neurotoxicology, 16(4): 639-652.
National Institute of Environmental Health Sciences (NIEHS) (1998). Scientific issuesrelevant to assessment of health effects from exposure to methylmercury. Workshoporganized by the Committee on Environmental and Natural Resources, White HouseOffice of Science and Technology Policy, The White House, Raleigh, NC. November18-20.
National Research Council (2000). Toxicological effects of methylmercury. WashingtonDC: National Academies Press.
Newschaffer, C.J., Falb, M.D., Gurney, J.G., (2005). National autism prevalence trendsfrom the United States special education data. Pediatrics; 115;277-282.
Newschaffer, C.J., (2006). Investigating diagnostic substitution and autism prevalence.Pediatrics; 117; 1436-1437.
Oski, F.A. (1993). Iron deficiency in infancy and childhood. New England Journal ofMedicine, 329, 190-193.
Parker, S.K., Schwartz, B., Todd, J., Pickering, L.K., (2004). Thimerosal-containingvaccines and autism spectrum disorder: A Critical review of published original data.Pediatrics; 114: 793-804.
Parran D.K., Barker A, Ehrich M. (2005). Effects of thimerosal on NGF signaltransduction and cell death in neuroblastoma cells. Toxicol Sci; 86(1):132-140.

Abt Associates Inc. Chapter 10 170
Physicians' Desk Reference. 49 ed. Montvale, NJ: Medical Economics Data ProductionCompany, 1995.
Physicians' Desk Reference. 53 ed. Montvale, NJ: Medical Economics Data ProductionCompany, 1999.
Pichichero, M.E., Cernichiari, E., Lopreiato, J., Treanor J., (2002). Mercuryconcentrations and metabolism in infants receiving vaccines containing thiomersal: adescriptive study. The Lancet, Vol 360, November 30: 1737-41.
Pless, R. and Risher, J.F. (2000). Mercury, infant neurodevelopment, and vaccination.Journal of Pedatrics, 136, 571-3.
Redwood, L. (2004). Testimony before the subcommittee on human rights and wellnessCommittee on Government Reform, U.S. House of Representatives: Hearing “Truthrevealed: New scientific discoveries regarding mercury in medicine and autism”.September 8. Downloaded from www.safeminds.org.
Richardson, G.A. Prenatal cocaine exposure: A longitudinal study of development.Annals of the New York Academy of Sciences 846:144-152, 1998.
Rowland I, Davies M, Grasso P. Biosynthesis of methylmercury compounds by theintestinal flora of the rat. Arch Environ Health. 1977 Jan-Feb;32(1):24-8
Rowland IR, Davies MJ, Evans JG. Tissue content of mercury in rats givenmethylmercuric chloride orally: influence of intestinal flora. Arch Environ Health. 1980May-Jun;35(3):155-60
Rowland IR, Robinson RD, Doherty RA. Effects of diet on mercury metabolism andexcretion in mice given methylmercury: role of gut flora. Arch Environ Health. 1984Nov-Dec;39(6):401-8
Shannon M., Graef J. 1996. Lead intoxication in children with pervasive developmentaldelays. Jnl of Tox-Clin Tox, 34: 177-182.
Shattuck, P.T., (2006). The contribution of diagnostic substitution to the growingadministrative prevalence of autism in US special education. Pediatrics; 117; 1028-1037.
Smeriglio, V.L., and Wilcox, H.C. Prenatal drug exposure and child outcome. Clinics inPerinatology 26(1):1-16, 1999.
Stajich, G.V., Lopez, G.P., Harry, S.P., et al. (2000). Clinical and laboratoryobservations: Iatrogenic exposure to mercury after hepatitis B vaccination in preterminfants. Journal of Pediatrics, 136, 679-681.

Abt Associates Inc. Chapter 10 171
Stern A.H., Jacobson J.L., Ryan L., Burke T.A. (2004). Do recent data from theSeychelles Islands alter the conclusions of the NRC Report on the toxicological effects ofmethylmercury? Environ Health; 3(1):2.
Stoops, N., (2004). Educational Attainment in the United States. Current PopulationReports, Annual Social and Economic Supplement. Issued June, 2004.http://www.census.gov/prod/2004pubs/p20-550.pdf
Thimerosal in vaccines--An interim report to clinicians (1999). American Academy ofPediatrics. Committee on Infectious Diseases and Committee on Environmental Health.Pediatrics ; 104(3 Pt 1):570-574.
Thompson, W.W., Price, C., Goodson,B.,Shay,D.K.,Benson,P.,HinrichsenV.L.,Lewis,E.,Eriksen,E.,Ray,P.,Marcy,M., Dunn J.,Jackson, L.A., Lieu, T.,Black S.,Stewart G.,Weintraub, E.S.,Davis, R.L.,DeStefano, F. (2007) Early Thimerosal Exposureand Neuropsychological Outcomes at 7 to 10 Years. (In Press New England Journal ofMedicine, September 27, 2007)
Totsika T, Sylva K. (2004.) The Home observation for measurement of the environmentrevisited. Child and Adolescent Mental Health; 9:25-35.
Turner, M.D., Marsh, D.O., Smith, J.C., Inglis, J.B., Clarkson, T.W., Rubio, C.E.,Chiriboga, J., and Chiriboga, C.C. (1980). Methylmercury in populations eating largequantities of marine fish. Archives of Environmental Health, 35, 367-78.
Verstraeten T, Davis RL, DeStefano F (2000). Risk of neurologic and renal impairmentassociated with thimerosal-containing vaccines. [Unpublished draft document obtainedfrom Safe Minds from the CDC in the summer of 1001 through the freedom ofinformation act. Each page of the document is stamped with “DRAFT – MAYCONTAIN ERROR OF FACT OR OMISSION. Downloaded from:http://safeminds.org/legislation/foia/VSD_VerstraetenJune2000.pdf ]
Verstraeten T, Davis RL, DeStefano F et al. (2003) Safety of thimerosal-containingvaccines: a two-phased study of computerized health maintenance organizationdatabases. Pediatrics; 112(5):1039-1048.
Verstraeten T. (2004) Thimerosal, the Centers for Disease Control and Prevention, andGlaxoSmithKline. Pediatrics; 113(4): 932.
World Health Organization (WHO) (2000). Thimerosal as a vaccine preservative.Weekly Epidemiological Record, 2 (14), 12-16.
Yairi, E.; Ambrose, N.; Cox, N. (1996, August). Genetics of stuttering: a criticalreview. Journal of Speech and Hearing Research, 39(4), 771-784.