infant mortality - cradlecincinnati.org · all infants > 7 d nicu stay in high risk care mgmt ....
TRANSCRIPT

Ohio Department of Medicaid
Infant Mortality: State Perspective Cincinnati
Mary Applegate, MD, FAAP, FACP, Medical Director, Ohio Department of Medicaid July 2015

M a k i n g O h i o B e t t e r O H I O D E PA R T M E N T O F M E D I C A I D
Perspective
M a k i n g O h i o B e t t e r O H I O D E PA R T M E N T O F M E D I C A I D
Prescription for Population Health: Working Together to Make A Difference
• We • Align
• Design • Develop
• Implement a PLAN • Focused on a population
• With specific measurement targets • Based on sound evidence of best clinical practice
• In the context of public health and sociopolitical systems
M a k i n g O h i o B e t t e r O H I O D E PA R T M E N T O F M E D I C A I D
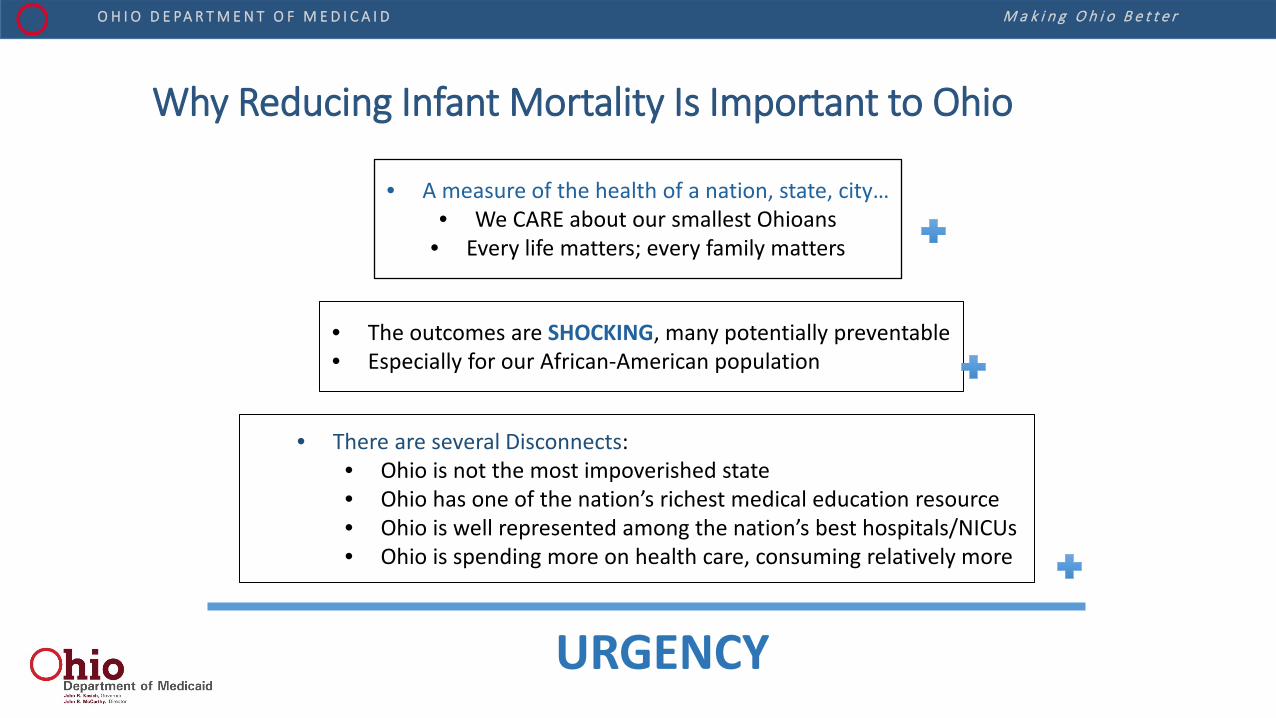
Why Reducing Infant Mortality Is Important to Ohio
• A measure of the health of a nation, state, city… • We CARE about our smallest Ohioans
• Every life matters; every family matters
• The outcomes are SHOCKING, many potentially preventable • Especially for our African-American population
• There are several Disconnects: • Ohio is not the most impoverished state • Ohio has one of the nation’s richest medical education resource • Ohio is well represented among the nation’s best hospitals/NICUs • Ohio is spending more on health care, consuming relatively more
URGENCY
M a k i n g O h i o B e t t e r O H I O D E PA R T M E N T O F M E D I C A I D
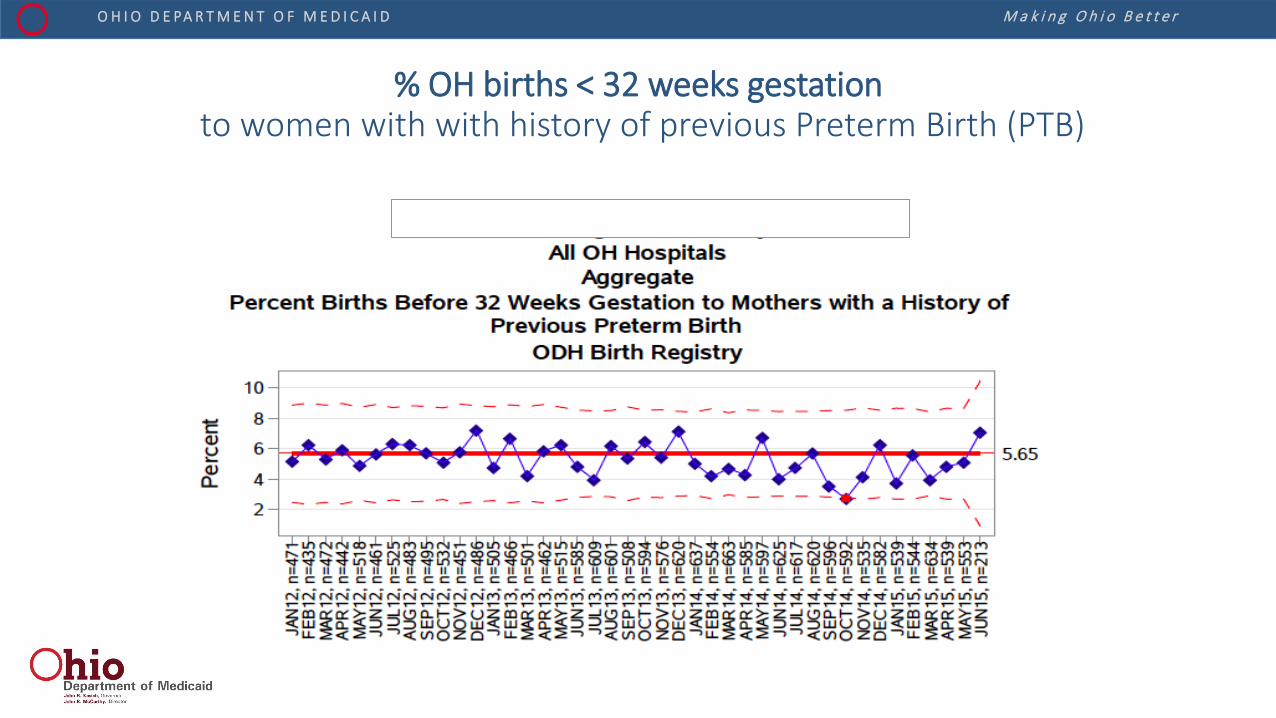
% OH births < 32 weeks gestation to women with with history of previous Preterm Birth (PTB)
M a k i n g O h i o B e t t e r O H I O D E PA R T M E N T O F M E D I C A I D
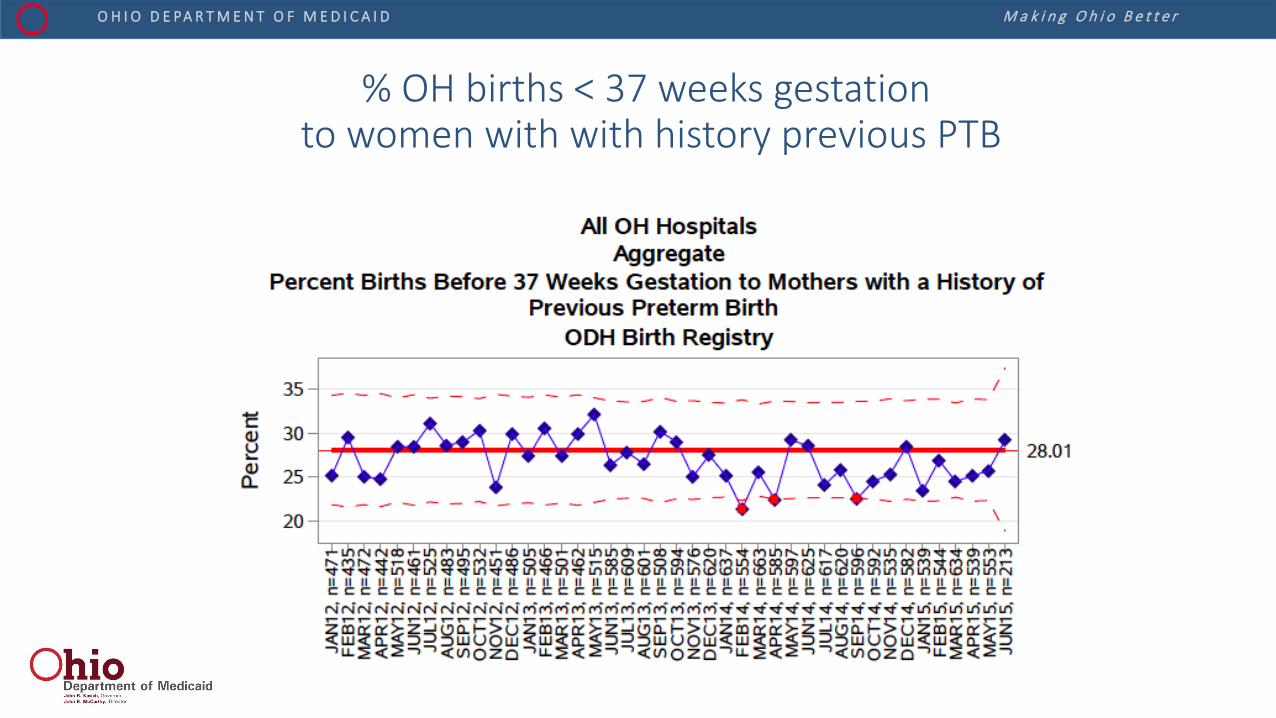
% OH births < 37 weeks gestation to women with with history previous PTB
M a k i n g O h i o B e t t e r O H I O D E PA R T M E N T O F M E D I C A I D
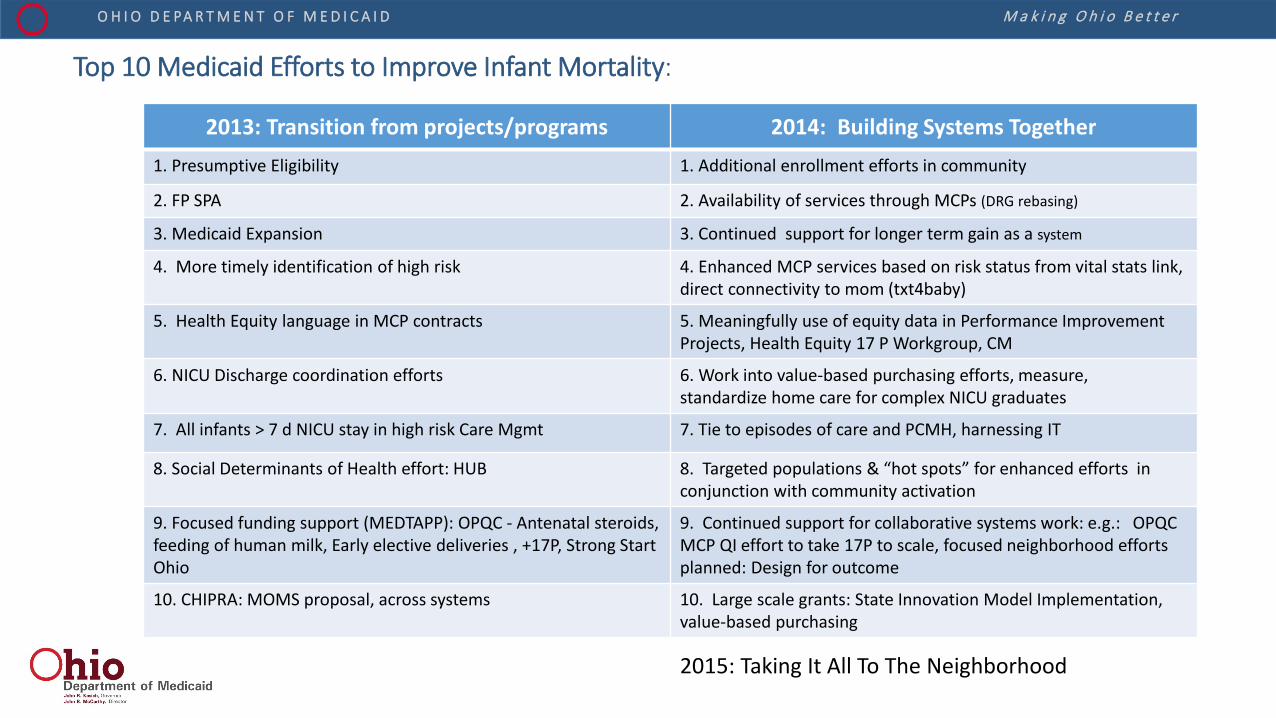
Top 10 Medicaid Efforts to Improve Infant Mortality:
2013: Transition from projects/programs 2014: Building Systems Together 1. Presumptive Eligibility 1. Additional enrollment efforts in community
2. FP SPA 2. Availability of services through MCPs (DRG rebasing)
3. Medicaid Expansion 3. Continued support for longer term gain as a system
4. More timely identification of high risk 4. Enhanced MCP services based on risk status from vital stats link, direct connectivity to mom (txt4baby)
5. Health Equity language in MCP contracts 5. Meaningfully use of equity data in Performance Improvement Projects, Health Equity 17 P Workgroup, CM
6. NICU Discharge coordination efforts 6. Work into value-based purchasing efforts, measure, standardize home care for complex NICU graduates
7. All infants > 7 d NICU stay in high risk Care Mgmt 7. Tie to episodes of care and PCMH, harnessing IT
8. Social Determinants of Health effort: HUB 8. Targeted populations & “hot spots” for enhanced efforts in conjunction with community activation
9. Focused funding support (MEDTAPP): OPQC - Antenatal steroids, feeding of human milk, Early elective deliveries , +17P, Strong Start Ohio
9. Continued support for collaborative systems work: e.g.: OPQC MCP QI effort to take 17P to scale, focused neighborhood efforts planned: Design for outcome
10. CHIPRA: MOMS proposal, across systems 10. Large scale grants: State Innovation Model Implementation, value-based purchasing
2015: Taking It All To The Neighborhood
M a k i n g O h i o B e t t e r O H I O D E PA R T M E N T O F M E D I C A I D
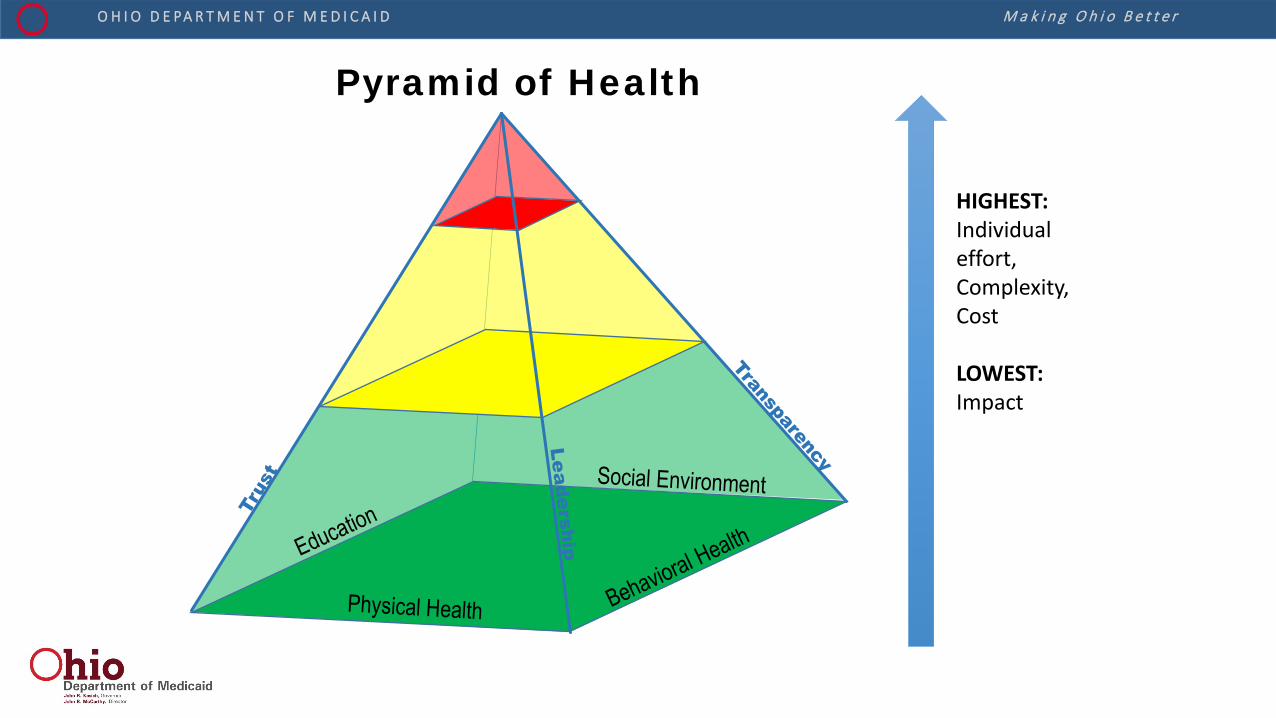
Pyramid of Health
HIGHEST: Individual effort, Complexity, Cost LOWEST: Impact
M a k i n g O h i o B e t t e r O H I O D E PA R T M E N T O F M E D I C A I D
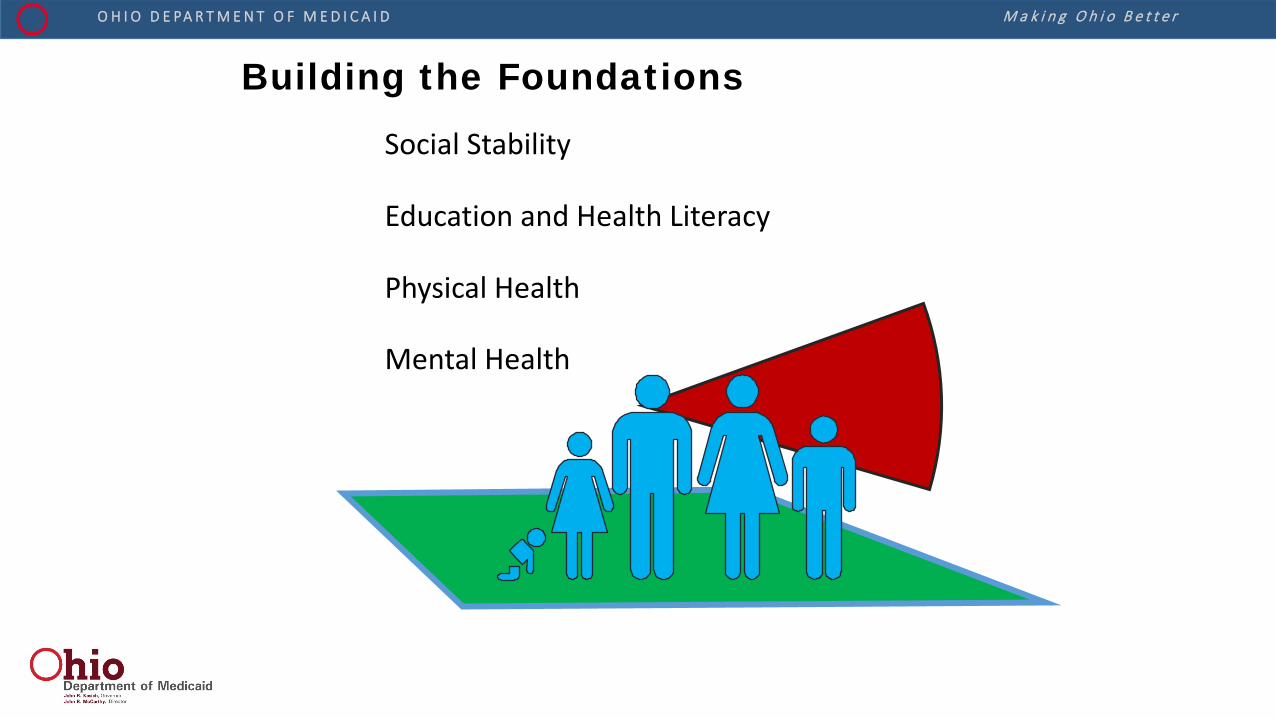
Social Stability
Education and Health Literacy
Physical Health
Mental Health
Building the Foundations
M a k i n g O h i o B e t t e r O H I O D E PA R T M E N T O F M E D I C A I D
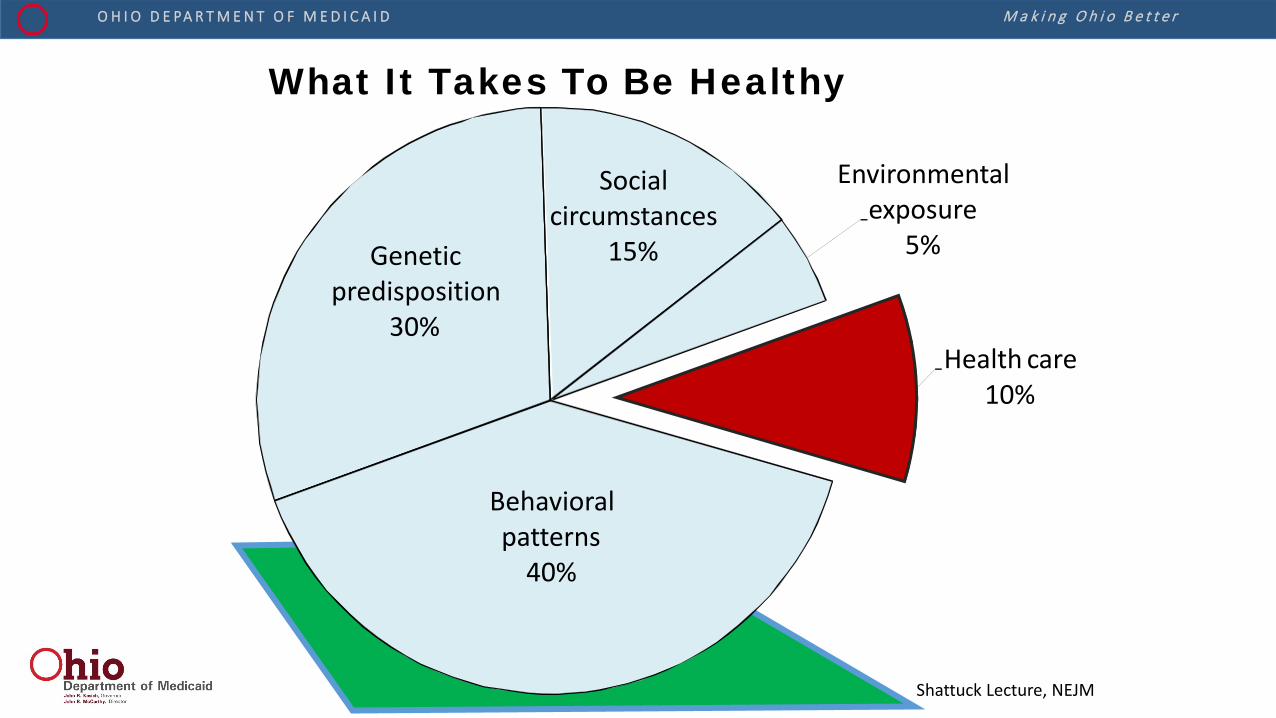
Genetic predisposition
30%
Social circumstances
15%
Environmental exposure
5%
Health care 10%
Behavioral patterns
40%
What It Takes To Be Healthy
Shattuck Lecture, NEJM

M a k i n g O h i o B e t t e r O H I O D E PA R T M E N T O F M E D I C A I D
Social Environment
Physical Health
Driving Change: Improved Well-being
CHAN
GE
Change begins with
Broader, Stronger Foundations
M a k i n g O h i o B e t t e r O H I O D E PA R T M E N T O F M E D I C A I D
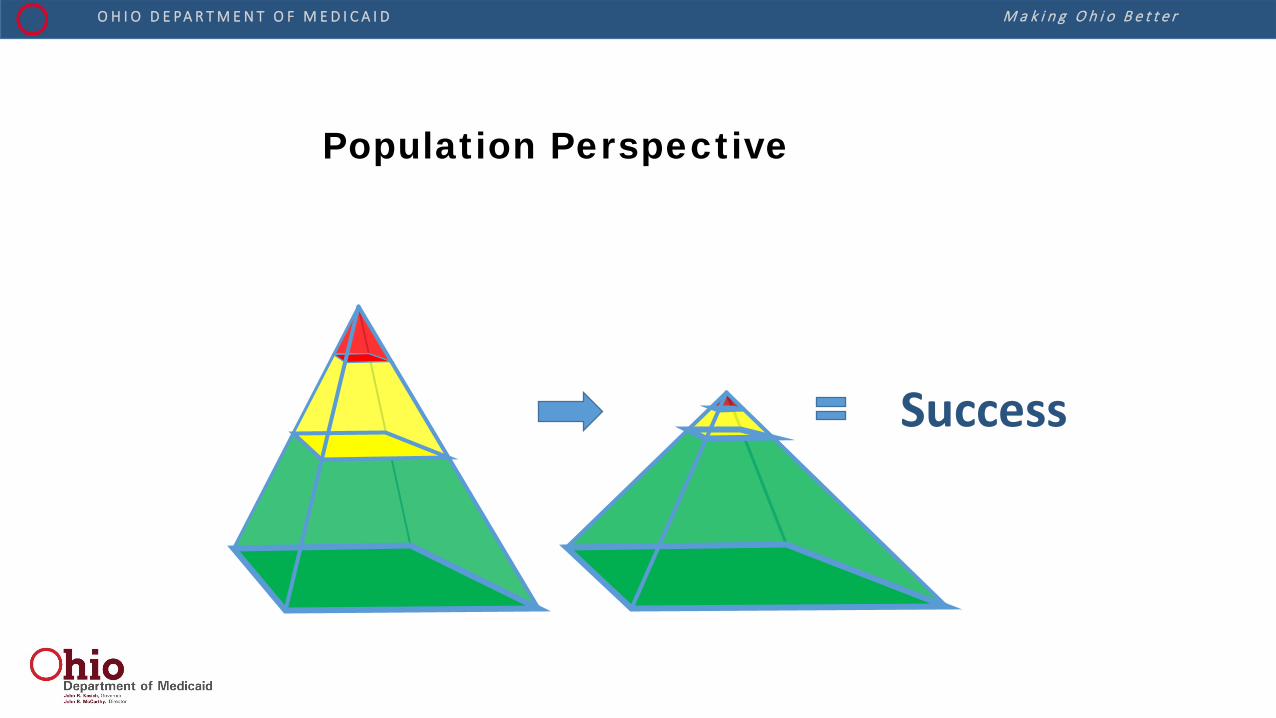
Population Perspective
Success
M a k i n g O h i o B e t t e r O H I O D E PA R T M E N T O F M E D I C A I D
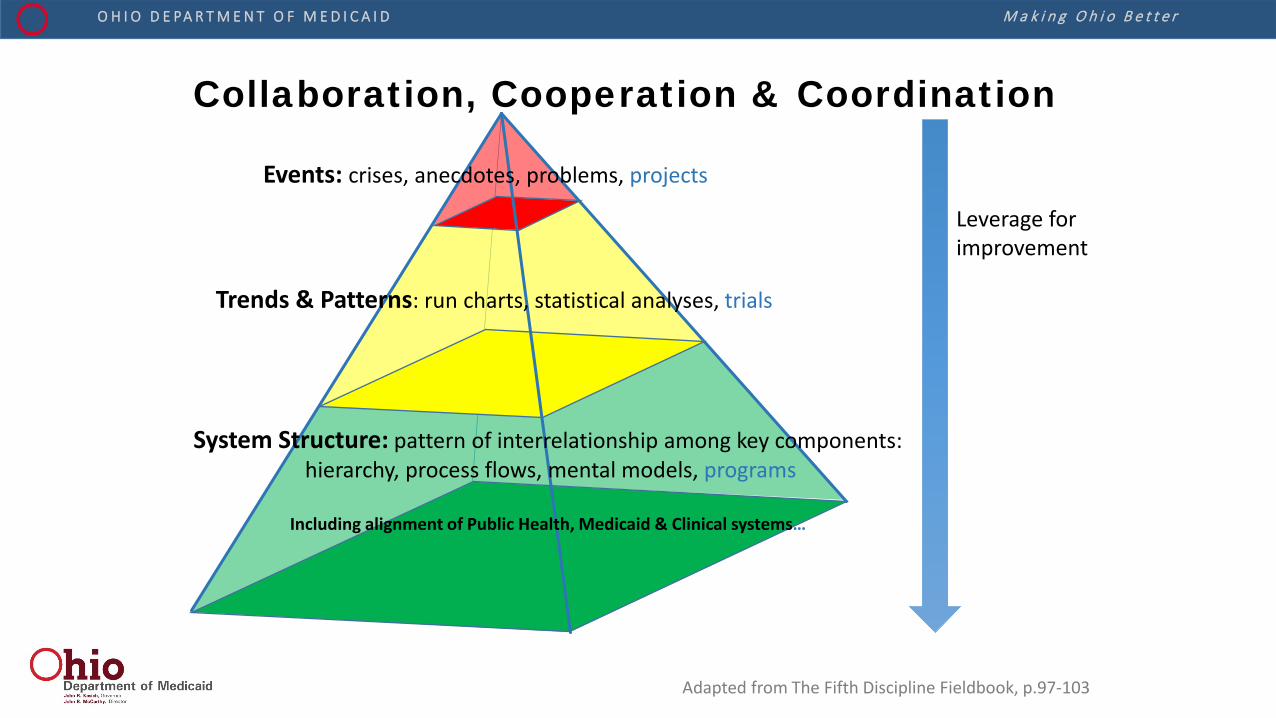
Collaboration, Cooperation & Coordination
Leverage for improvement
Events: crises, anecdotes, problems, projects
Trends & Patterns: run charts, statistical analyses, trials
System Structure: pattern of interrelationship among key components: hierarchy, process flows, mental models, programs
Including alignment of Public Health, Medicaid & Clinical systems…
Adapted from The Fifth Discipline Fieldbook, p.97-103
M a k i n g O h i o B e t t e r O H I O D E PA R T M E N T O F M E D I C A I D
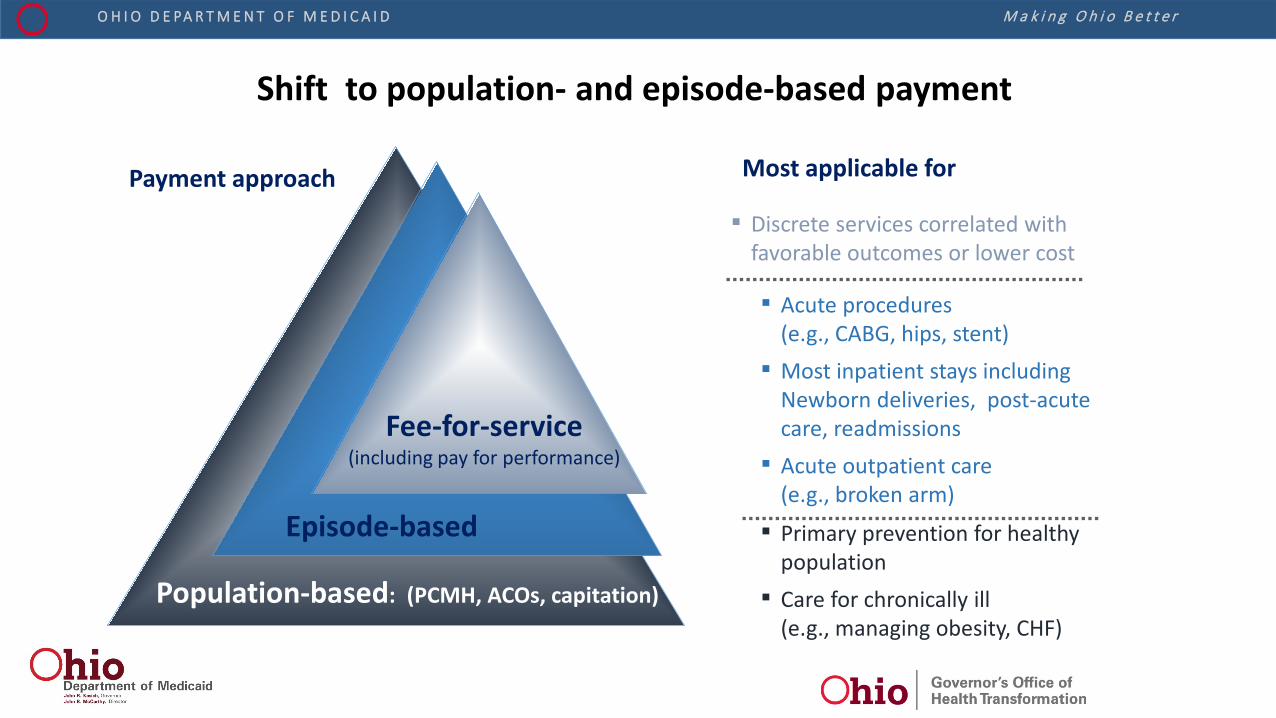
Shift to population- and episode-based payment
Most applicable for
▪ Primary prevention for healthy population
▪ Care for chronically ill (e.g., managing obesity, CHF)
▪ Acute procedures (e.g., CABG, hips, stent)
▪ Most inpatient stays including Newborn deliveries, post-acute care, readmissions
▪ Acute outpatient care (e.g., broken arm)
▪ Discrete services correlated with favorable outcomes or lower cost
Payment approach
Population-based: (PCMH, ACOs, capitation)
Episode-based
Fee-for-service (including pay for performance)
M a k i n g O h i o B e t t e r O H I O D E PA R T M E N T O F M E D I C A I D
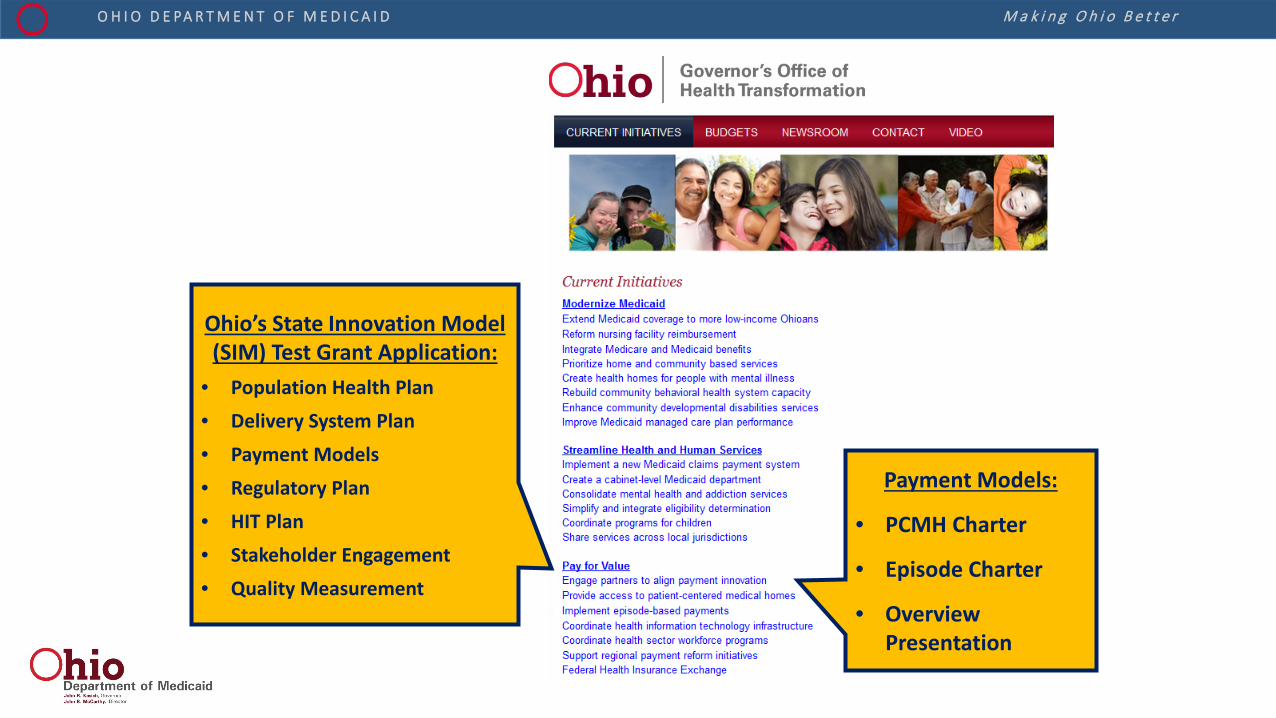
Payment Models:
• PCMH Charter
• Episode Charter
• Overview Presentation
Ohio’s State Innovation Model (SIM) Test Grant Application:
• Population Health Plan • Delivery System Plan • Payment Models • Regulatory Plan • HIT Plan • Stakeholder Engagement • Quality Measurement
M a k i n g O h i o B e t t e r O H I O D E PA R T M E N T O F M E D I C A I D
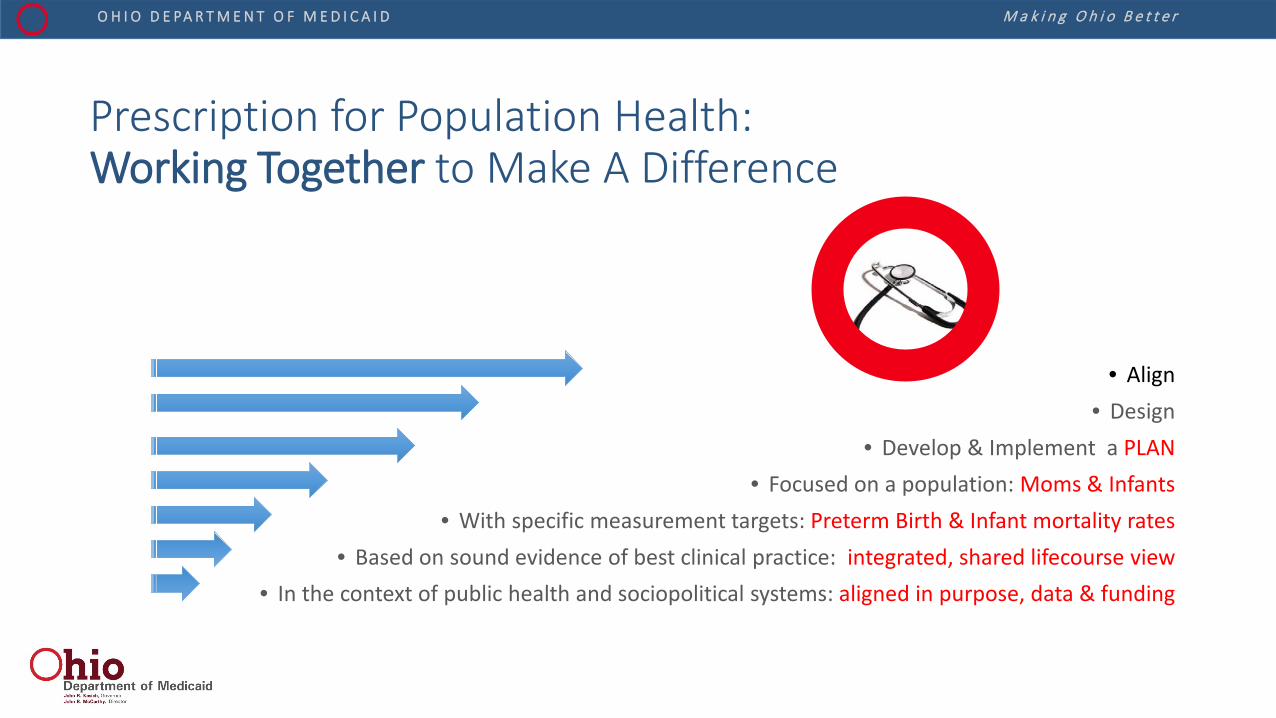
Prescription for Population Health: Working Together to Make A Difference
• Align • Design
• Develop & Implement a PLAN • Focused on a population: Moms & Infants
• With specific measurement targets: Preterm Birth & Infant mortality rates • Based on sound evidence of best clinical practice: integrated, shared lifecourse view
• In the context of public health and sociopolitical systems: aligned in purpose, data & funding
M a k i n g O h i o B e t t e r O H I O D E PA R T M E N T O F M E D I C A I D
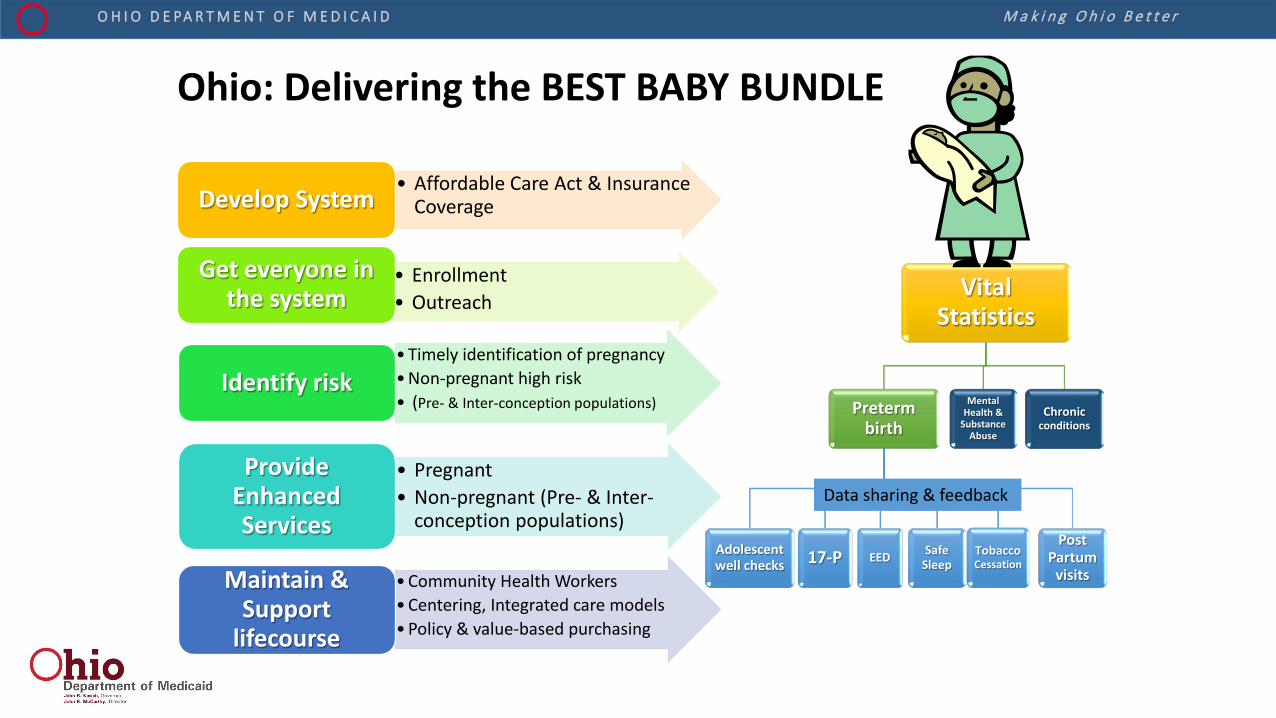
• Affordable Care Act & Insurance Coverage Develop System
• Enrollment • Outreach
Get everyone in the system
•Timely identification of pregnancy •Non-pregnant high risk • (Pre- & Inter-conception populations)
Identify risk
• Pregnant • Non-pregnant (Pre- & Inter-
conception populations)
Provide Enhanced Services
•Community Health Workers •Centering, Integrated care models •Policy & value-based purchasing
Maintain & Support
lifecourse
Vital Statistics
Preterm birth
17-P Adolescent well checks
Safe Sleep
Tobacco Cessation EED
Post Partum
visits
Mental Health &
Substance Abuse
Chronic conditions
Ohio: Delivering the BEST BABY BUNDLE
Data sharing & feedback

M a k i n g O h i o B e t t e r O H I O D E PA R T M E N T O F M E D I C A I D Creating Systems to Improve Health Outcomes
Safety net services
Neighborhood
SIM
High risk maternity
Smart Data to Target Special Populations
Disparate Population
Neighborhood Filter
Health Care Coverage
Community Workforce
Community Coordination
PCMH
+ + + = Success
Innovation Data Support State and Agency Strategic Vision
M a k i n g O h i o B e t t e r O H I O D E PA R T M E N T O F M E D I C A I D
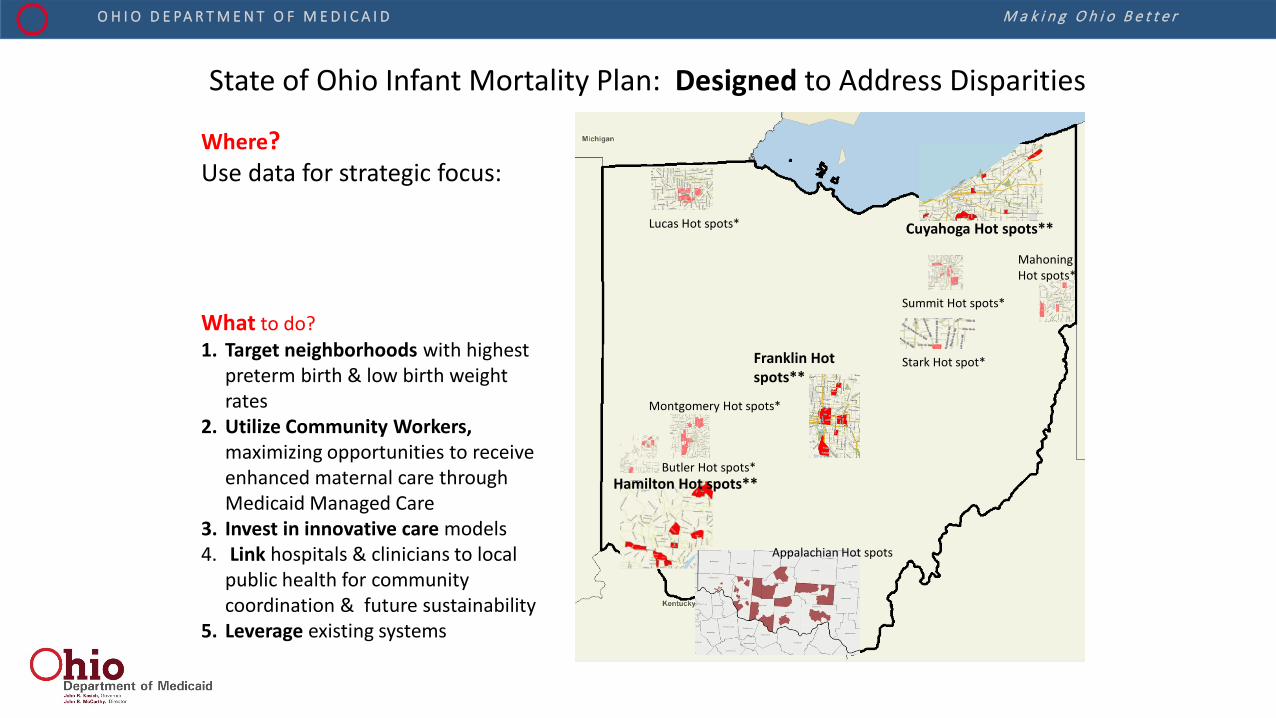
State of Ohio Infant Mortality Plan: Designed to Address Disparities
Where? Use data for strategic focus:
Hamilton Hot spots**
Franklin Hot spots**
Cuyahoga Hot spots**
Butler Hot spots*
Montgomery Hot spots*
Lucas Hot spots*
Summit Hot spots*
Stark Hot spot*
Mahoning Hot spots*
Appalachian Hot spots
What to do? 1. Target neighborhoods with highest
preterm birth & low birth weight rates
2. Utilize Community Workers, maximizing opportunities to receive enhanced maternal care through Medicaid Managed Care
3. Invest in innovative care models 4. Link hospitals & clinicians to local
public health for community coordination & future sustainability
5. Leverage existing systems

M a k i n g O h i o B e t t e r O H I O D E PA R T M E N T O F M E D I C A I D
Infant Mortality Density Map in Counties with >6/1000: Number Needed To Save for a 50% Improvement
M a k i n g O h i o B e t t e r O H I O D E PA R T M E N T O F M E D I C A I D
What Can We Do To Improve Infant Outcomes?
• Work. • Together. • Differently. • With data. • And sharing.
• The Collaborative serves all the purposes
M a k i n g O h i o B e t t e r O H I O D E PA R T M E N T O F M E D I C A I D
[email protected] And Medicaid family team
Creating Systems to Improve Infant Mortality Reliably. What else?
What can we do better together?
Thank you THANK YOU Thank you It’s hard work Thank you THANK YOU Thank you It’s not the way we normally work Thank you THANK YOU Thank you It’s frustrating work Thank you THANK YOU Thank you It’s slow work Thank you THANK YOU Thank you But It-will-save-a-life work Thank you THANK YOU Thank you