inflation , causes and effetcs
TRANSCRIPT

Your Logo www.company.com
Inflation
BBA 5th Semester
Group II
Causes, Effects on Economy & Solutions

Your Logo www.company.com
Group MembersPresenters
Muhammad Shahroze
Group Leader
Nida Khalil Usama Jahangir Zeeshan Ahmed
72 52 73 102
2
Your Logo www.company.com
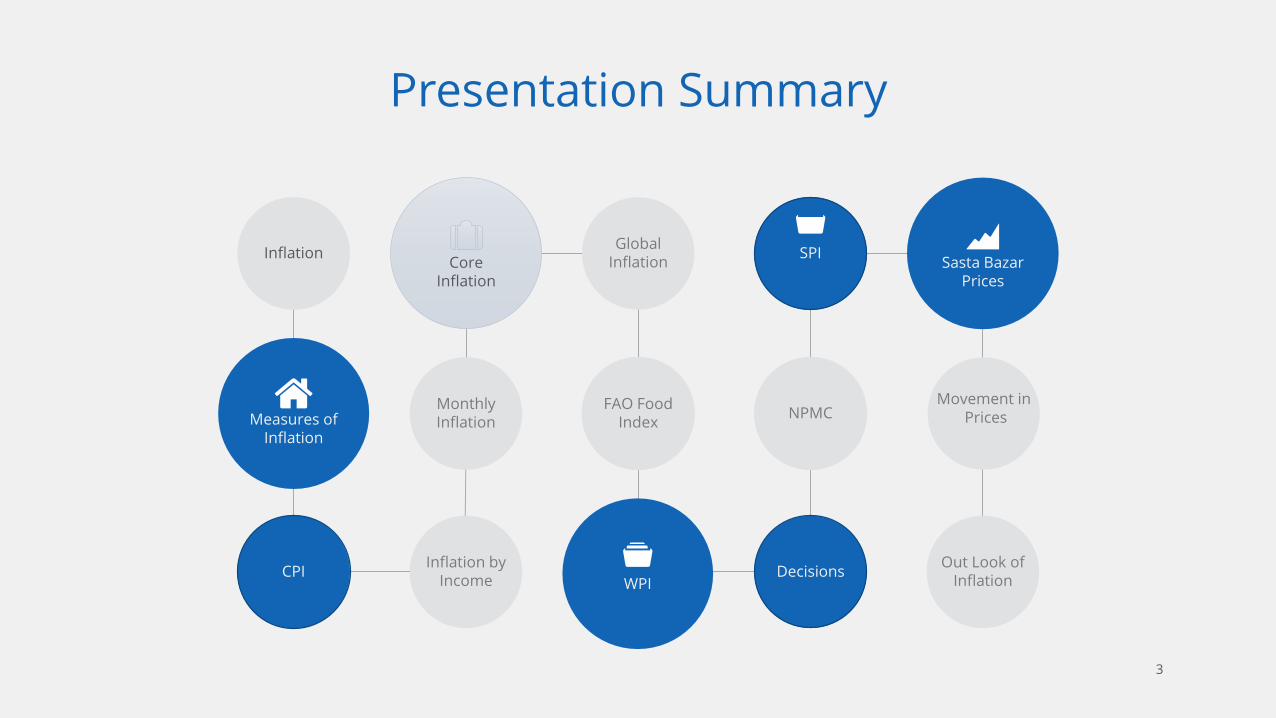
Presentation Summary
InflationGlobal
InflationCore Inflation
SPI
NPMCMovement in
PricesFAO Food
IndexMonthly Inflation
CPIInflation by
IncomeDecisions
Out Look of Inflation
Sasta Bazar Prices
Measures of Inflation
WPI
3

Your Logo www.company.com
now… let’s talk about …Consumer Price Index
Sensitive Price
Indicators
Whole Sale Price Index
Decisions
NPMC
Inflation
4

Your Logo www.company.com
What is Inflation?

Your Logo www.company.com
1
2
3
4
1
2
3
4
Pakistan Economy Survey FY 2014-15Overview of Inflation During Fiscal Year 2014-15.
The inflation is on downward Trajectory during FY 2015-15.
Causes of Low Inflation
Better Supply of Commodities and Role of NPMC.
Budget Deficit, Appropriate Fiscal and Monetary Policies and Decline in Prices of Imported Goods, and Decrease in Petroleum Prices.
Stability in Exchange Rates, Better Production of Minor Crops and Vigilant Monitoring of Prices
Development of Sasta Bazars and Revival of Magistracy System and Prudent Expenditures
6

Your Logo www.company.com
Measures of InflationOverview of Measurements of inflation during FY 2014-15
Summary
Various parameters are used to measures inflation like Consumer Price Index (CPI), Wholesale Price Index (WPI) and Sensitive Price Indicator (SPI). These important parameters of prices indicate a substantial deceleration in inflation.
CPI 2013-14 and 14-15
WPI 2013-14 and 14-15
SPI 2013-14 and 14-15
4.8%
PR
Comparison
8.3%
7
8.7%
0.03%
1.19% 9.8%

Your Logo www.company.com
Divergent Trend in PricesThe divergent trend in the price indices is due to their composition, coverage and nature of items.
Wholesale PriceWholesale price covers the items which are
offered for sale in bulk by the producers
and manufacturers in primary market. Its
prices are influenced immediately by trend
in imports prices and local productivity.
WPI inflation stayed in negative zone for the
last five months in a row which is the
reflection that inflationary pressure will
further ease out in coming months.
8

Your Logo www.company.com9

Your Logo www.company.com
Low Petrol Price
Price of PetrolIn Pakistan oil prices has been on downward trajectory since September 2014 and its pass on effect has been
realized in domestic prices.
Decline in Consumer
goods price
Success
Low Inflation Rate
Benefits for
Common Man
10

Your Logo www.company.com
1 Dec 14
112.76 112.76 110.3 84.53 70.29 74.29
115.71 115.71 110.3 101.18 96.64 95.84
123.67 123.67 123.67 114.51 89.32 89.32
129.71 129.71 139.69 122.73 108.76 108.76
1 Jan 14 1Feb 14 1Mar 14 1Mar15 1Apr 15
INDIA
SRI LANKA
NEPAL
Comparison of Petrol PricesComparison of Petrol Prices in Pakistan and other regional countries.
In PKR
FY 2014-15
PAKISTAN
11

Your Logo www.company.com
Historical Trend in InflationHistorically viewed, Pakistan’s experience in inflation rate over the last 25 years can be expressed in four
distinctive phases
CPI : 12.70
Food : 12.90
Non Food : 12.40
CPI : 10.58
Food : 10.64
Non Food : 10.52
CPI : 9.83
Food : 11.74
Non Food : 7.81
1990-91 1992-931991-92
12

Your Logo www.company.com
CPI : 4.41
Food : 3.56
Non Food : 5.09
CPI : 12.00
Food : 17.65
Non Food : 7.90
CPI : 4.81
Food : 3.59
Non Food : 5.69
2000-01 2014-152007-08
13

Your Logo www.company.com
Inflation was at double digit in the first seven years during 1990s. In the next 10 years from 1997 - 2007, inflation was
contained to single digit in the range of 3 percent to 9 percent. However, it remained very volatile during 2008 to 2012
and remained almost at double digit with varying magnitudes. Since 2013 till now April 2015, inflation moved at slow
pace despite some policy adjustments.14

Your Logo www.company.com
now… let’s talk about …
Inflation
Sensitive Price
Indicators
Whole Sale Price Index
Decisions
NPMC
Consumer Price Index
CPI
15

Your Logo www.company.com
An index of the variation in prices for retail goods and other items.
Changes in CPI are used to assess price changes associated with the Cost of Living.
CPI
What is CPI???
16

Your Logo www.company.com
Consumer Price Index (CPI) capture prices of 487 items prevailing in 76
markets in 40 big cities.
Sub Indices of CPI
Monthly Inflation By Income Group Global InflationCore Inflation FOA Food Index
17

Your Logo www.company.com
Food 3.6%
Non-Food 5.7%
Potatos-67%
Ghee 10.3%
Chicken -9.4%
Cooking Oil -9.3
Wheat -9.2%
Rice -8.2%
Egg -2.4%
Fish -2.4%
Fruits -0.9%
Overall CPI -
1.31%
Consumer Price Index (CPI)Consumer price index, the most frequently used indicator of inflation averaged at 4.8 percent
during (July-April) 2014-15.
Inflation of diff
commodities
Inflation in 11 main Food
items
& overall Food inflation
18

Your Logo www.company.com
Consumer Price Index (CPI)The prices of perishable food items has declined significantly as is evident from its current year index reduction to 2.2 percent
against 17 percent last year.
1. Education
Increased by 15 percent in current year which is much more against the
increase of 8.8 percent witnessed in the same period last year
1
2
4
Inflation Rate
Increased by 7 percent as
compared to 8 percent.
2. Housing
Operational
Groups
The sharp reduction
in transport group -
3.1%
4. Transportation
Increased by 8.4 %
3. Clothes & Footwear
3
Inflation Rate
19

Your Logo www.company.com
Consumer Price Index (CPI)
03/12/201520

Your Logo www.company.com
now… let’s talk about …
Inflation
Sensitive Price
Indicators
Whole Sale Price Index
Decisions
NPMC
Core Inflation
21

Your Logo www.company.com
It is measured through the indices of 43 commodities and represents the rate of increase in cost of goods and services excluding food and energy prices.
Decrease in Prices of 43
commodities pushed down the
Core inflation.
Other reason for slow pace of core inflation
is that with reduction in food and fuel prices
it remained quite subdued since November 2014
onward owing to the lag impact of tight monetary
policy which continued to prevail till November
2014.
It is effected by
monetary
policy and is
mostly relevant
to SBP.
Core Inflation
22

Your Logo www.company.com
Core Inflation
03/12/201523

Your Logo www.company.com
Monthly Inflation TrendInflation trend in Food and Non Food items of Month to Month Basis.
Year to Year Trend
On year-on-year basis the overall
inflation stood at 7.9 percent in July
2014 and declined to 2.1 percent in
April 2015.
Food Inflation
Food inflation decelerated
from 7.0 percent to -0.03
percent in April 2015.
Non Food Inflation
The non-Food inflation decelerated
from 8.5 percent in July 2014 to 3.7
percent in April 2015
Month to Month Trend
The overall inflation continued to
exhibit Decline trend since July 2014.
04 01
0203
24

Your Logo www.company.com
Monthly Inflation Trend
03/12/2015
25

Your Logo www.company.com
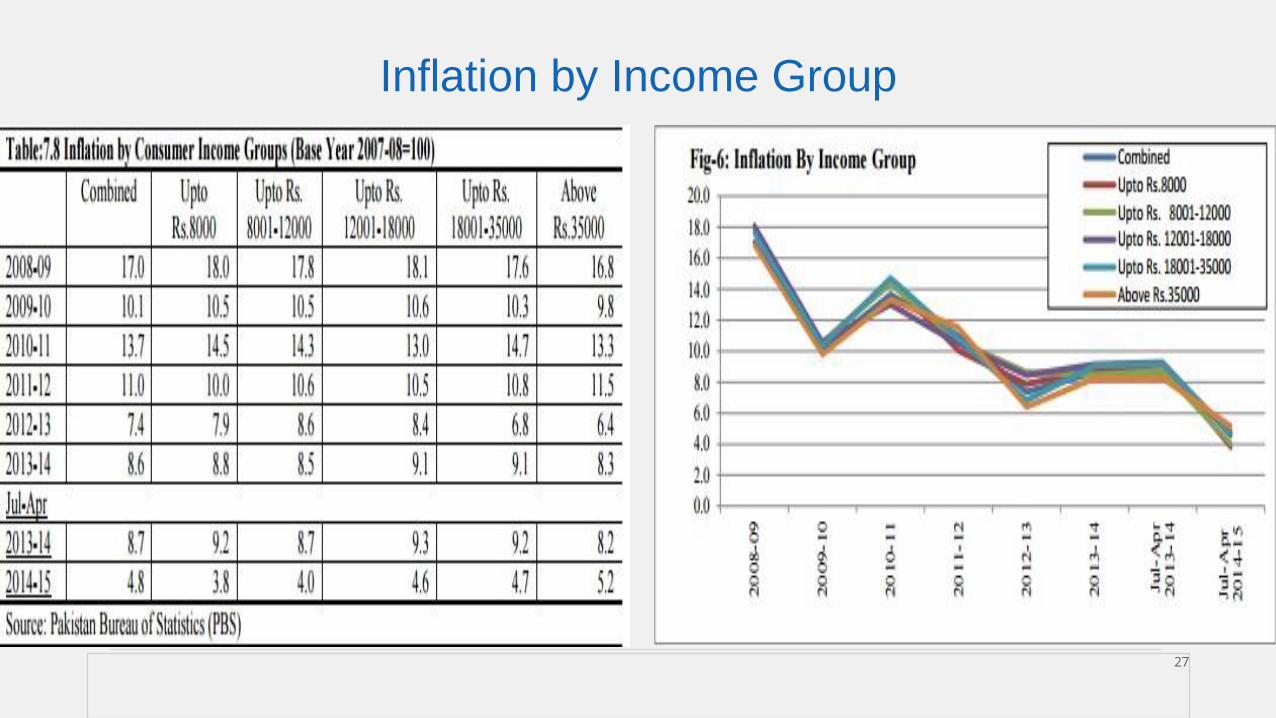
Inflation by Income GroupInflation effects all segment of society but the degree of impact varies in scale and intensity, depending upon the
economic status of individual
Analysis of ten months (July-Apr)
The Food Take Greater Share in Expenditure for Poor than the other income groups.
Inflation rate 5.2%
The highest inflation at 5.2 percent for the highest income groups
In Pakistan, majority of the population spend about half of their income on food
It is Divided into 5 income Groups
26
Your Logo www.company.com
Inflation by Income Group
03/12/201527

Your Logo www.company.com
Global InflationGlobal inflation has received a substantial attention in recent years.
Consumer price inflation differs considerably across the regions.
The chart below shows the six regions inflation for the
period 2001-2015.
It provides an insight in making trade and financial
decisions
28

Your Logo www.company.com
Global Inflation
03/12/2015
29

Your Logo www.company.com
FAO Food IndexAccording to FAO, global food prices fell across all commodities with dairy and sugar prices
experiencing the most drastic decline
The drop in dairy products prices reflect the impact of abolition of the
milk quota system which raised expectation of abundant supply. Dairy
prices were also influenced by imports prohibition imposed by the
Russian Federation.
The decrease in sugar prices was mainly due to the report of higher than
expected sugar cane production in Brazil, International palm oil prices
continued to ease as higher than expected output in Indonesia and
Malaysia with weak global demand. While decline in Wheat prices was due
to large supply and slow trade activity
Sugar , Palm Oil and Wheat Prices
Dairy Products
Other Products
30

Your Logo www.company.com
FOA Food Index
03/12/2015
31

Your Logo www.company.com
now… let’s talk about …
Inflation
Sensitive Price
Indicators
Core InflationDecisions
NPMC
Whole Sale Price Index
32

Your Logo www.company.com
Wholesale Price IndexIt measure the directional movement of prices.
Non Food Items
The highest decrease in Non Food items is -
1.26% while last year it was 9%.
Overall Result
Their deflationary impact to the
overall WPI movement is
estimated as -4.8%
Fuel Prices
A pronounced decline has been noted in
fuel and fuel related items-- furnace oil -
1.4%, diesel - 1.75 % and kerosene -0.1%
Index increase
The index recorded an increase of
0.03 percent during July-Apr 2014-15
against a rise of 8.3 percent during
the same period last year
04 01
0203
33

Your Logo www.company.com
Wholesale Price Index
03/12/201534

Your Logo www.company.com
Wholesale Price Index
03/12/201535

Your Logo www.company.com
now… let’s talk about …
Inflation
Wholesale Price Index
Core InflationDecisions
NPMC
Sensitive Price
Indicator
36

Your Logo www.company.com
Sensitive Price Indicator (SPI)SPI covering 53 essential items of daily use increased by 1.9 percent during July-April 2014- 15
compared to 9.8 percent in the same period last year
Food Items
10 food items with decrease in their
prices has been estimated (-) 3.2
percent while that of four items of
utility contributed as (-)1.8 percent.
Food Items
A significant decrease in Prices of
Ghee, Potatoes, chicken and
Wheat etc
Overall Results
SPI recorded a substantial slow growth
rate for 6 months with a decrease of -
2.00%
Division of Items
These 53 items are further divided
into Food and Non Food and items
of utility.
04 01
0203
37

Your Logo www.company.com
Sensitive Price Indicator (SPI)
03/12/201538

Your Logo www.company.com
now… let’s talk about …
Inflation
Wholesale Price Index
Core InflationDecisions
Sasta Bazars
National Price Monitoring Committee
(NPMC )
39
Your Logo www.company.com
1
2
3
4
1
2
3
4
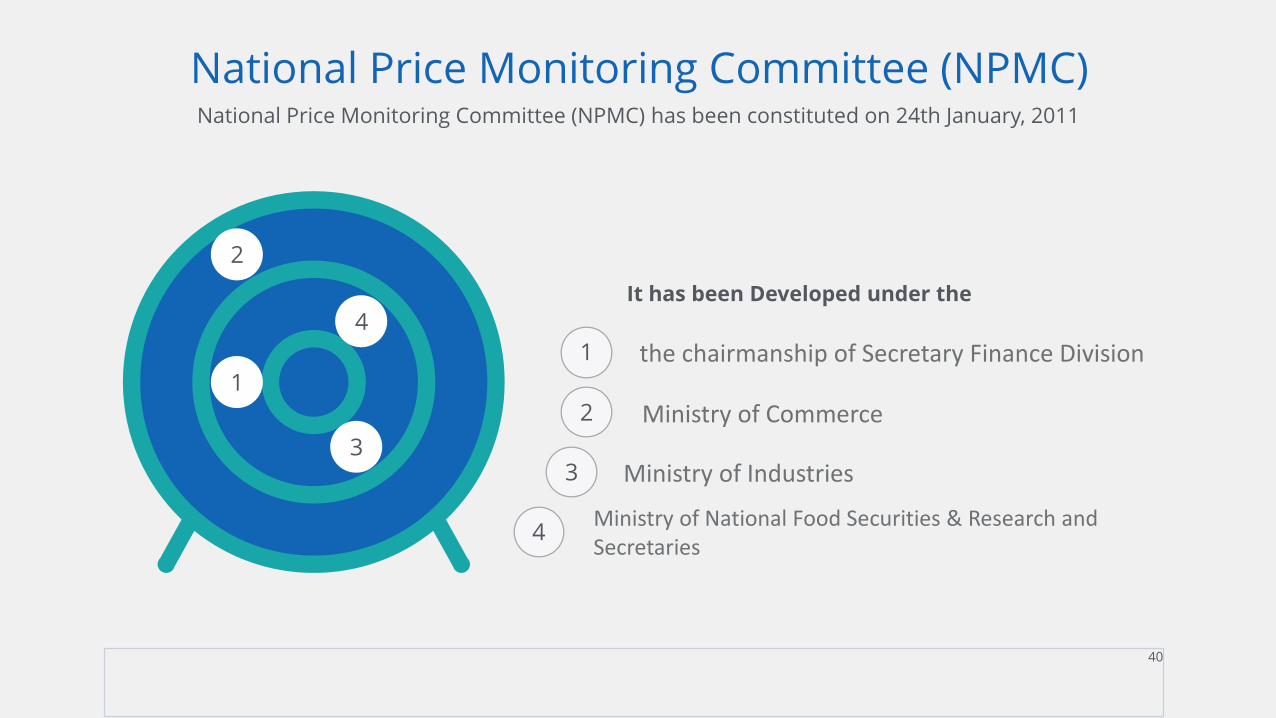
National Price Monitoring Committee (NPMC)National Price Monitoring Committee (NPMC) has been constituted on 24th January, 2011
It has been Developed under the
Ministry of Commerce
Ministry of National Food Securities & Research and Secretaries
the chairmanship of Secretary Finance Division
Ministry of Industries
40

Your Logo www.company.com
Purposes of NPMCNPMC has mandated to
To Assess the Demand and Supply of
key Commodities.
to take/ propose corrective measures
as necessary.
1 2
41

Your Logo www.company.com
Deliberations of NPMCThe committee has made following deliberations:
A sub Committee was constituted to develop
actionable measure for removing hike in the prices of Pulses, Tomato and Milk
Powder etc
CCP to Control hording, Profiting and breaking cartelization in order
to pass benefits to general consumersa
Ministry of IPC to Expenditure the process of Revival of
Executive Magistracy System
The Committee Played an Active Role to control prices and ensures smooth supply of essential goods.
01
02
03
04
Low Inflation
42

Your Logo www.company.com
now… let’s talk about …
Inflation
Wholesale Price Index
Core InflationDecisions
NPMC
Sasta Bazaar Prices
43

Your Logo www.company.com
Sasta Bazaars are developed to
provide essential goods to
consumers on cheap/Low Prices.
In the first week of May 2015 in Sasta Bazaar of
the country including Islamabad reveals a wide
variation in their prices to be compared with
Open Market Prices
Sasta Bazaar PricesAn overview of Goods prices in Sasta Bazaar
Sasta Bazaar
Items with significant decline in their prices at Sasta
Bazar include potatoes, onion, tomatoes, red chilies,
garlic, pulses and chicken farm etcGoods
Price Comparison
44

Your Logo www.company.com
Sasta Bazaar PricesRole of Government in Success of Sasta Bazaar
1. Provincial governments
It also monitor the prices and supply of essential items and taking various proactive measures to ease the prices for the benefit of common man in the country
1
2
4
Sasta Bazaar
The provincial governments have also
activated their District Price Control
Committees to check and maintain the
prices.
2. District Price Control
Committees
In NPMC meeting it was argued to investigate and
take necessary steps to control undue price hike so
that the benefits may reach to the consumers
4. NPMC
The Provincial Govt. also established Sasta Bazaars
for the consumers where they can get Food items at
reasonable prices.
3. Establishment of Sasta Bazaars
3
Sasta Bazaar
45

Your Logo www.company.com
Sasta Bazaar Prices
03/12/2015
46

Your Logo www.company.com
Movement in Prices of Essential GoodsThe movement of 28 essential items from Jun 2013 to April 2015 is presented
graphically
Overall Effect
On the whole, it is observed that
prices of essential items are
easing out over time.
47

Your Logo www.company.com
Movement in Prices of Essential Goods
03/12/2015
48

Your Logo www.company.com
Movement in Prices of Essential Goods
03/12/2015
49

Your Logo www.company.com
Regional Situation of PricesComparison of Prices of Essential Goods with Neighbor Countries
In comparison with the regional countries Pakistan is the lowest in the prices of Wheat, Wheat Flour, Chicken farm, Gram Pulse, Petrol, Eggs and
Red Chilies than those of other regional countries. The large variation in prices of some S specific items like meat and poultry products is due to
different consumption pattern and socio cultural variation.
Analysis
22-04-2015India
30-04-2015Pakistan
27-04-2015Bangladesh
50

Your Logo www.company.com
Regional Situation of Prices
03/12/2015
51

Your Logo www.company.com
Estimated
8.00%
Outlook of InflationAn overview of inflation during FY2015-15
FY2014-15
Actual increase
4.8%
Success
Low Inflation Rate
Future Expectations of inflation
52

Your Logo www.company.com
OverviewVideo
53