inflation report 1st quarter 2 0 1 6 · cesar v. purisima alfredo c. antonio ... v 2016 schedule of...
TRANSCRIPT

i
The primary objective of monetary policy is to promote a low and stable rate of inflation conducive to a
balanced and sustainable economic growth. The adoption in January 2002 of the inflation targeting
framework for monetary policy was aimed at helping to fulfill this objective.
One of the key features of inflation targeting is greater transparency, which means greater disclosure and
communication by the BSP of its policy actions and decisions. This Inflation Report is published by the BSP
as part of its transparency mechanisms under inflation targeting. The objectives of this Inflation Report
are: (i) to identify the risks to price stability and discuss their implications for monetary policy; and (ii) to
document the economic analysis behind the formulation of monetary policy and convey to the public the
overall thinking behind the BSP’s decisions on monetary policy. The broad aim is to make monetary policy
easier for the public to understand and enable them to better monitor the BSP’s commitment to the
inflation target, thereby helping both in anchoring inflation expectations and encouraging informed
debate on monetary policy issues.
The government’s target for annual headline inflation under the inflation targeting framework has been
set at 3.0 percent ± 1.0 percentage point (ppt) for 2015-2018 by the Development Budget Coordination
Committee (DBCC). This is consistent with the desired disinflation path over the medium term, favorable
trends in inflation dynamics, and expected higher capacity of the economy for growth under a low
inflation environment.
The report is published on a quarterly basis, presenting an analysis of the various factors affecting
inflation. These include recent price and cost developments, inflation expectations, prospects for
aggregate demand and output, labor market conditions, monetary and financial market conditions, fiscal
developments, and the international environment. An entire section is devoted to a discussion of
monetary policy developments in the most recent quarter, while a separate section provides a
comprehensive analysis of the BSP’s view of the inflation outlook for the policy horizon.
The Monetary Board approved this Inflation Report at its meeting on 14 April 2016.
Foreword
AMANDO M. TETANGCO, JR.
Governor

ii
The BSP Mandate
The BSP’s main responsibility is to formulate and implement policy in the areas of money, banking and
credit, with the primary objective of maintaining stable prices conducive to a balanced and sustainable
economic growth in the Philippines. The BSP also aims to promote and preserve monetary stability and
the convertibility of the national currency.
Monetary Policy Instruments
The BSP’s primary monetary policy instrument is its overnight reverse repurchase (RRP) or borrowing
rate. Other instruments to implement the desired monetary policy stance to achieve the inflation target
include (a) increasing/decreasing the reserve requirement; (b) accepting deposits in the special deposit
account (SDA) facility by banks and trust entities of BSP-supervised financial institutions; (c) adjusting
the rediscount rate on loans extended to banking institutions on a short-term basis against eligible
collateral of banks’ borrowers; and (d) outright sales/purchases of the BSP’s holdings of government
securities.
Policy Target
The BSP’s target for monetary policy uses the Consumer Price Index (CPI) or headline inflation rate,
which is compiled and released to the public by the National Statistics Office (NSO). The policy target is
set by the Development Budget Coordination Committee (DBCC)1 in consultation with the BSP. The
inflation target for 2015-2018 is 3.0 percent ± 1.0 ppt.2
BSP’s Explanation Clauses
These are the predefined set of acceptable circumstances under which an inflation-targeting central
bank may fail to achieve its inflation target. These clauses reflect the fact that there are limits to the
effectiveness of monetary policy and that deviations from the inflation target may sometimes occur
because of factors beyond the control of the central bank. Under the inflation targeting framework of
the BSP, these exemptions include inflation pressures arising from: (a) volatility in the prices of
agricultural products; (b) natural calamities or events that affect a major part of the economy;
(c) volatility in the prices of oil products; and (d) significant government policy changes that directly
affect prices such as changes in the tax structure, incentives, and subsidies.
1 The DBCC, created under Executive Order (E.O.) No. 232 dated 14 May 1970, is an inter-agency committee tasked primarily to
formulate the National Government's fiscal program. It is composed of the Office of the President (OP), Department of Budget
and Management (DBM), National Economic and Development Authority (NEDA), and the Department of Finance (DOF).
The BSP attends the Committee meetings as a resource agency. 2 The inflation range target for 2015-2018 was announced thru DBCC Resolution No.2015-1 dated 27 January 2015. The decision
to maintain the inflation range target for 2016-2018 was announced thru DBCC Resolution No.2015-7 dated 29 December 2015.
The Monetary Policy of the Bangko Sentral ng Pilipinas

iii
The Monetary Board
The powers and functions of the BSP, such as the conduct of monetary policy and the supervision over
the banking system, are exercised by its Monetary Board, which has seven members appointed by the
President of the Philippines. The Monetary Board holds eight (8) monetary policy meetings in a year to
review and decide on the stance of monetary policy.
Chairman & Governor
Amando M. Tetangco, Jr.
Members
Cesar V. Purisima
Alfredo C. Antonio
Felipe M. Medalla
Armando L. Suratos
Juan D. De Zuñiga, Jr.
Valentin A. Araneta
The Advisory Committee
The Advisory Committee was established as an integral part of the institutional setting for inflation
targeting. It is tasked to deliberate, discuss, and make recommendations on monetary policy to the
Monetary Board. Like the Monetary Board, the Committee meets eight times a year but may also
meet between regular meetings, whenever deemed necessary.
Chairman & Governor
Amando M. Tetangco, Jr.
Members
Diwa C. Guinigundo
Deputy Governor
Monetary Stability Sector
Nestor A. Espenilla, Jr.
Deputy Governor
Supervision and Examination Sector
Ma. Ramona GDT Santiago
Assistant Governor
Treasury Department
Francisco G. Dakila, Jr.
Managing Director
Monetary Policy Sub-sector

iv
Technical Staff
Head
Zeno Ronald R. Abenoja
Director, Department of Economic Research
Members
Edna C. Villa
Managing Director, Office of the Governor
Veronica B. Bayangos
Director, Center for Monetary and Financial Policy
Lorelei S. Fernandez
Chief Dealer, Treasury Department
Rosabel B. Guerrero
Director, Department of Economic Statistics
Dennis D. Lapid
Deputy Director, Department of Economic Research
Dennis M. Bautista
Deputy Director, Department of Economic Research
Ma. Mediatriz M. Boelsch
Assistant Chief Dealer, Treasury Department
Thea Josefina Natalia W. Santos
Deputy Director, Capital Markets Specialist Group
Jose Recon S. Tano
Deputy Director, Financial Supervision Research and Consumer Protection Sub-sector
Lara Romina E. Ganapin
Bank Officer V, Department of Economic Research
Cherrie F. Ramos
Bank Officer V, Department of Economic Research
Jasmin E. Dacio
Bank Officer V, Department of Economic Research
Eduard Joseph DP Robleza
Bank Officer V, Department of Economic Research
Vanessa T. Españo
Bank Officer V, Department of Economic Research
Marites B. Oliva
Bank Officer V, Center for Monetary and Financial Policy

v
2016 Schedule of Monetary Policy Meetings, Inflation
Report Press Conferences and Publication of MB Highlights
2016
Advisory
Committee
Meeting
Monetary
Board Meeting
Publication of
MB Highlights
Inflation Report
Press
Conference
Jan 14 (Thu)
(17 Dec 2015 MB)
22 (Fri)
(Q4 2015 IR)
Feb 5 (Fri) 11 (Thu)
Mar 18 (Fri) 23 (Wed) 10 (Thu)
(11 Feb 2016 MB)
Apr 21 (Thu)
(23 Mar 2016 MB)
22 (Fri) (Q1 2016 IR)
May 6 (Fri) 12 (Thu)
Jun 17 (Fri) 23 (Thu) 9 (Thu)
(12 May 2016 MB)
Jul 21 (Thu)
(23 Jun 2016 MB)
22 (Fri) (Q2 2016 IR)
Aug 5 (Fri) 11 (Thu)
Sep 16 (Fri) 22 (Thu) 8 (Thu)
(11 Aug 2016 MB)
Oct 20 (Thu)
(22 Sep 2016 MB)
21 (Fri) (Q3 2016 IR)
Nov 4 (Fri) 10 (Thu)
Dec 16 (Fri) 22 (Thu) 8 (Thu)
(10 Nov 2016 MB)

vi
List of Acronyms, Abbreviations, and Symbols
AL Auto Loans NBQBs Non-Bank Financial Institutions with
Quasi-Banking Functions
BES Business Expectations Survey NEDA National Economic and Development
Authority
BTr Bureau of the Treasury NEER Nominal Effective Exchange Rate
CAMPI Chamber of Automotive Manufacturers of
the Philippines, Inc.
NNPL Net Non-Performing Loan
CAR Capital Adequacy Ratio NFA Net Foreign Assets;
National Food Authority
CBD Central Business District NG National Government
CES Consumer Expectations Survey NGCP National Grid Corporation of the Philippines
CDS Credit Default Swaps NPC National Power Corporation
CI Confidence Index NPI Net Primary Income
COV Coefficient of Variation NPL Non-Performing Loan
CPI Consumer Price Index OECD Organization for Economic Cooperation and
Development
DBCC Development Budget Coordination
Committee
OPEC Organization of the Petroleum Exporting
Countries
DOE Department of Energy OF Overseas Filipinos
DI Diffusion Index PMI Purchasing Managers’ Index
DOF Department of Finance PSA Philippine Statistical Authority;
Power Supply Agreement
EIA US Energy Information Administration PSALM Power Sector Assets and Liabilities
Management Corporation
EM Emerging Market PSEi Philippine Stock Exchange Composite Index
EMBI JP Morgan Emerging Market Bond Index RBs Rural Banks
ERC Energy Regulatory Commission REER Real Effective Exchange Rate
FCDA Foreign Currency Differential Adjustment ROP Republic of the Philippines
GDP Gross Domestic Product RP Repurchase
GNI Gross National Income RR Reserve Requirement
GOUR Generation Over/Under Recovery RRP Reverse Repurchase
GNPL Gross Non-Performing Loan RWA Risk-Weighted Asset
GS Government Securities SDA Special Deposit Account
IEA International Energy Agency SEM Single-Equation Model
IMF International Monetary Fund SLOUR System Loss Over/Under Recovery
IPP Independent Power Producer SME Small and Medium Enterprise
IRI International Research Institute for Climate
and Society
SOFSM Society of Fellows in Supply Management, Inc.
LFS Labor Force Survey TBs Thrift Banks
LPG Liquefied Petroleum Gas TLP Total Loan Portfolio
LSOUR Lifeline Subsidy Over/Under Recovery TOUR Transmission Over/Under Recovery
LTFRB Land Transportation Franchising and
Regulatory Board
U/KBs Universal and Commercial Banks
MB Monetary Board VAPI Value of Production Index
MEM Multi-Equation Model VOPI Volume of Production Index
MERALCO Manila Electric Company WESM Wholesale Electricity Spot Market
MISSI Monthly Integrated Survey of Selected
Industries
WTI West Texas Intermediate
MTP Major Trading Partner
vii
Contents
Overview ................................................................................................... viii
I. Inflation and Real Sector Developments .................................................... 1
Prices ................................................................................................................................. 1
Private Sector Economists’ Inflation Forecasts. ......................................................... 2
Energy prices. ............................................................................................................ 3
Aggregate Demand and Supply ........................................................................................ 5
Aggregate Demand. ................................................................................................... 6
Other Demand Indicators. ......................................................................................... 7
Aggregate Supply. .................................................................................................... 13
Labor Market Conditions ............................................................................................... 14
II. Monetary and Financial Market Conditions .............................................. 16
Domestic Liquidity and Credit Conditions....................................................................... 16
Interest Rates .................................................................................................................. 19
Financial Market Conditions ........................................................................................... 21
Banking System ............................................................................................................... 23
Exchange Rate ................................................................................................................. 26
III. Fiscal developments ............................................................................... 28
IV. External Developments .......................................................................... 29
V. Monetary Policy Developments ............................................................... 32
VI. Inflation Outlook .................................................................................... 33
BSP Inflation Forecasts.................................................................................................... 33
Risks to the Inflation Outlook ......................................................................................... 35
VII. Implications for the Monetary Policy Stance .......................................... 37
Summary of Monetary Policy Decisions ....................................................... 39

viii
Overview
Headline inflation edged up but remains
subdued. Headline inflation inched higher to
1.1 percent in Q1 2016 but remained below the
low end of the government’s announced annual
target of 3.0 percent ± 1.0 percentage point for
2016-2018. This was slightly higher than the
previous quarter’s 1.0 percent but lower than the
year-ago level of 2.5 percent. Modest upticks in
selected food items contributed to the slightly
higher inflation reading. Meanwhile, non-food
inflation remained steady as easing utility rates
were counterbalanced by price increases in other
items such as transport fares. In contrast, core
inflation eased to 1.6 percent from 1.8 percent in
the previous quarter. Two out of the three
alternative measures of core inflation, i.e.,
measures using trimmed mean and net of volatile
items, were lower. There were 22 CPI items with
inflation rates greater than the upper end of the
2016 inflation target, comprising 11.3 percent of
the CPI basket.
Inflation expectations are generally lower.
Results of the BSP’s survey of private sector
economists for March 2016 showed lower mean
inflation forecasts for 2016 of 1.9 percent from
2.5 percent in December 2015. Analysts attributed
their lower inflation expectations to continued low
global oil prices, slower global economic growth,
and lower domestic electricity rates which are
seen to outweigh upside risks brought by the
El Niño phenomenon, increased government
expenditures from the upcoming election, pending
power rate adjustments, rebound in oil prices,
base effects in the CPI data, the possible
occurrence of La Niña in the latter part of 2016,
and expectations of higher US interest rates.
Similarly, results of the March 2016 Consensus
Economics survey also showed a lower mean
inflation forecast for 2016 at 2.2 percent from
2.5 percent in December 2015. Meanwhile, mean
inflation forecast for 2017 was at 3.1 percent.
Domestic demand remains intact. The domestic
economy expanded in Q4 2015 by 6.3 percent
from the previous quarter’s 6.1 percent although
this was slightly lower than the previous year’s
increase of 6.6 percent. This brought the
full-year 2015 growth to 5.8 percent. Growth for
the quarter in review was fueled by accelerated
consumer spending and increased fixed capital
investments, particularly in durable equipment
and public construction. Meanwhile, the services
and industry sectors continued to be the main
drivers of growth on the production side. Likewise,
trends in higher-frequency demand indicators
point to optimistic prospects in the near term.
Vehicle sales sustained its double-digit growth,
supported by rising household incomes coupled
with attractive car financing terms offered by
industry players while the composite Purchasing
Managers’ Index remained firmly above the
50-point expansion threshold.
Inflation edges higher amid
firm domestic prospects but
remains benign
At the same time, business and consumer
confidence continue to improve, consistent with
the assessment that underlying domestic demand
continues to be firm against a backdrop of
sustained credit growth and notable
improvements in employment conditions.
Global economic activity softens in early 2016.
Economic activity in advanced economies remains
subdued as growth in the US, euro area and Japan
continued to regain momentum. In contrast,
downturns were noted in major emerging markets
such as India and China. The subdued economic
outlook for emerging markets dampened global
growth prospects to which several central banks
responded by easing monetary policy settings in
order to stave off deflationary pressures.
In addition, in order to achieve their price stability
targets, the Bank of Japan introduced quantitative
and qualitative monetary easing with negative
interest rate while the European Central Bank
expanded its asset purchase program.
Domestic financial market remains solid despite
external headwinds. The domestic financial
system remained stable, supported by strong
macroeconomic fundamentals. However,
uncertainty on the external front stemming from
continuing worries over global growth, China’s
bumpy transition and deepening monetary policy
divergence buffeted emerging market assets.
On the domestic front, the Philippine equities
market saw dampened activity as cautious
investor sentiment reined in gains. Increased risk
perception was likewise reflected in the country’s
bond spreads and risk premiums. Nevertheless,
sovereign CDS remained lower compared to the
Philippines’ Asian neighbors. Moreover, investor

ix
appetite for local currency government securities
remained healthy, affirmed by the continued
oversubscription in the scheduled GS auctions.
Amid all these external developments, the
Philippine banking system remained sound and
resilient, marked by a continued increase in assets,
lending, and deposits, and with capital adequacy
ratios comfortably above the BSP’s and Bank for
International Settlements’ prescribed levels. In
addition, bank lending standards for both loans to
enterprises and households were also broadly
unchanged during the quarter, indicating that
banks continue to be prudent in managing their
risks.
The BSP maintains monetary policy settings
during the quarter. The BSP decided to maintain
its key policy interest rates at 4.0 percent for the
overnight borrowing or RRP facility and
6.0 percent for the overnight lending or RP facility.
The interest rates on term RRPs, RPs, and SDAs
were also kept steady. The reserve requirement
ratios were left unchanged as well. The BSP’s
assessment of a manageable inflation outlook and
robust growth conditions continue to support
keeping monetary policy settings steady,
particularly with inflation expectations firmly
anchored within the inflation target band over the
policy horizon.
Current monetary policy settings remain
appropriate. Latest baseline inflation forecasts
extending to 2017 show that annual average
inflation is likely to settle within the target range
while inflation expectations remain
well-anchored. The continued buoyancy of
domestic demand, including fiscal policy which is
already starting to provide additional boost to
demand, suggests that prospects for growth
remain firm despite indications that the global
economy is growing at a slightly slower pace than
previously expected. Thus, although inflation
pressures remain largely subdued, the relatively
strong and positive indicators of domestic activity
serve to allay concerns on potential deflationary
pressures. In addition, liquidity and credit continue
to grow at a reasonable pace, suggesting that the
economy may not require further monetary
stimulus at the moment.
The BSP is of the view that
current monetary policy
settings are appropriate
Equally important, there continues to be ample
room for fiscal policy to provide an additional
boost to domestic demand by raising
infrastructure and social spending through
improved budget execution. Over the period
ahead, the BSP has scope to further assess
whether weaker external conditions and
heightened financial market volatility would
require an appropriate policy response.
On balance, the BSP is of the view that current
monetary policy settings remain appropriately
calibrated. Going forward, the BSP will continue
to monitor domestic and external developments
to ensure that the monetary policy stance
remains consistent with its price and financial
stability objectives.

Q1 2016 Inflation Report | | | | 1111
I. Inflation and Real Sector Developments
Prices
Headline Inflation. Headline inflation inched up
in the first quarter of 2016 on the back of higher
prices of selected food items.
Inflation dynamics remain
driven by supply-side factors
Inflation increased to 1.1 percent from 1.0 percent
in the previous quarter but remained below the
low end of the government’s announced target of
3.0 percent ± 1.0 percentage point for 2016-2018.
Chart 1. Quarterly Headline Inflation (2006=100)
in percent
0
1
2
3
4
5
6
Q1
2012
Q2 Q3 Q4 Q1
2013
Q2 Q3 Q4 Q1
2014
Q2 Q3 Q4 Q1
2015
Q2 Q3 Q4 Q1
2016
Food
Non-Food
Non-Alcoholic Beverages
Alcoholic Beverages and Tobacco
Headline Inflation
Source: Philipine Statistical Authority (PSA), BSP
Core Inflation. On the other hand, core inflation
(which excludes certain volatile food and energy
items) eased to 1.6 percent from 1.8 percent in the
previous quarter. Similarly, two out of the three
alternative measures of core inflation computed by
the BSP were lower in Q1 2016. Both trimmed
mean and net of volatile items edged down to
1.2 percent (from 1.3 percent) and 1.3 percent
(from 1.5 percent), respectively. Meanwhile, the
weighted median measure was steady at
1.3 percent.
The number of items with inflation rates greater
than the threshold of 4.0 percent (which is the
upper end of the 2016 inflation target) was slightly
lower at 22 items in Q1 2016 from 23 items in the
previous quarter. These items accounted for
11.3 percent of the CPI basket, lower than the
quarter-ago share of 12.4 percent.
Table 1. Alternative Core Inflation Measures
quarterly averages of year-on-year change
Quarter
Official
Headline
Inflation
Official Core
Inflation
Trimmed
Mean 1
Weighted
Median 2
Net of
Volatile
Items 3
2014 4.1 3.0 3.5 2.9 2.6
Q1 4.1 3.0 3.3 2.6 2.8
Q2 4.4 3.0 3.6 3.2 2.6
Q3 4.7 3.3 3.8 3.1 2.8
Q4 3.6 2.7 3.3 2.7 2.4
2015 1.4 2.0 1.9 1.9 1.8
Q1 2.5 2.5 3.0 3.0 2.3
Q2 1.7 2.2 2.1 2.2 1.9
Q3 0.6 1.6 1.3 1.2 1.5
Q4 1.0 1.8 1.3 1.3 1.5
2016 0.8 1.1 1.2 1.3 1.3
Q1 1.1 1.6 1.2 1.3 1.31
The trimmed mean represents the a verage inflati on ra te of the (weighted) middl e 70 percent
in a lowes t-to-highest ra nking of year-on-year infla tion rates for a l l CPI components .2
The weighted median represents the middle infla tion rate (correspondi ng to a cumul ative CPI
weight of 50 percent) in a lowest-to-highest ra nking of year-on-year i nfla tion rates .3
The net of vola ti le i tems method excludes the fol lowi ng i tems: brea d and cereal s , meat, fi sh,
fruit, vegetables , ga s , sol id fuels , fue ls and lubrica nts for personal trans port equi pment, a nd
pa ssenger transport by road, whi ch repres ents 39.0 percent of a l l i tems. The s eries ha s been
recomputed us ing a new methodology tha t i s a l igned with PSA's method of computing the
officia l core inflation, which re-weights remaining i tems to comprise 100 percent of the core
ba sket after excludi ng non-core i tems . The previous methodology retained the weights of
volati l e i tems i n the CPI basket whi le keeping thei r indices cons tant at 100.0 from month to month.
Source: PSA, BSP estimates
Chart 2. CPI Items with Inflation Rates Above
Threshold
0
10
20
30
40
50
60
70
0
5
10
15
20
25
30
35
Q1
2012
Q2 Q3 Q4 Q1
2013
Q2 Q3 Q4 Q1
2014
Q2 Q3 Q4 Q1
2015
Q2 Q3 Q4 Q1
2016
Cumulative weight in % (LHS) No. of Items Above Threshold (RHS)
Source: PSA, BSP staff estimates
Food Inflation. Food inflation increased to
1.6 percent in Q1 2016 from 1.3 percent in the
previous quarter. The slightly higher food inflation
can be traced mainly to price increases in certain
key food items namely, meat, vegetables, sugar as
well as oils and fats.
Meanwhile, rice prices continued to decline
compared to year-ago levels as the arrival of
additional rice importation and onset of the main
harvest season in the previous quarter ensured
sufficient supply during the start of the year.
Rice accounts for 8.9 percent of total CPI basket.

Q1 2016 Inflation Report | | | | 2222
Table 2. Inflation Rates for Selected Food Items
quarterly averages in percent (2006=100)
Q1 Q2 Q3 Q4 Q1
Food and Non-Alcoholic Beverages 4.8 3.0 1.1 1.3 1.6
Food 5.0 3.1 1.1 1.3 1.6
Bread and Cereals 5.7 2.6 -0.5 -1.6 -1.2
Rice 7.2 3.3 -0.9 -2.5 -2.0
Corn 2.4 0.2 -0.6 -0.4 1.7
Meat 4.2 1.3 0.4 0.8 1.0
Fish 5.1 5.3 3.2 3.7 2.8
Milk, Cheese and Eggs 4.4 3.3 1.9 1.3 1.2
Oils and Fats 2.7 0.9 -0.3 -0.2 0.3
Fruit 11.4 9.6 4.9 3.5 3.3
Vegetables 1.1 0.3 0.2 9.0 10.3
Sugar, Jam, Honey 3.8 4.2 2.9 3.9 6.4
Food Products, N.E.C. 4.8 4.6 3.8 2.7 3.1
Non-Alcoholic Beverages 2.1 2.2 1.8 1.4 1.2
Alcoholic Beverages and Tobacco 4.0 3.8 3.7 3.9 4.9
2015Commodity
2016
Source of Ba s ic Da ta: PSA, BSP
Non-Food Inflation. On the other hand, non-food
inflation remained steady in Q1 2016 at
0.5 percent. Inflation for housing, water,
electricity, gas, and other fuels remained in the
negative territory as utility rates declined.
Electricity rates decreased during the quarter on
lower generation charge. Water rates also
declined in Q1 2016.
Nonetheless, these developments were
counterbalanced by higher price increases of
certain non-food items like health, recreation and
culture as well as restaurants and miscellaneous
goods and services. Similarly, transport fares for
air and ships increased due to higher demand for
provincial trips during the Lenten season. By
contrast, transport services eased during the
quarter as previous rollbacks of domestic
petroleum products (i.e., gasoline, kerosene,
diesel, and LPG) led to transport fare reductions in
Q1 2016.
Table 3. Inflation Rates for Selected Non-Food
Items
quarterly averages in percent (2006=100)
Q1 Q2 Q3 Q4 Q1
Non-Food 0.6 0.5 0.1 0.5 0.5
Clothing and Footwear 3.1 2.6 2.3 2.3 1.9
Housing, Water, Electricity,
Gas and Other Fuels -1.1 -1.1 -1.7 -1.2 -1.0
Electricty, Gas, and Other Fuels -8.7 -8.2 -9.8 -8.8 -6.9
Furnishings, Household Equipment
& Routine Maintenance of the House 2.2 2.1 1.7 1.6 1.5
Health 2.7 2.3 1.7 1.8 1.9
Transport -0.7 0.0 -0.5 0.9 0.3
Transport Services 2.6 2.9 2.5 3.3 1.2
Communication -0.1 -0.1 0.0 0.0 0.1
Recreation and Culture 1.1 1.1 1.0 1.0 1.1
Education 5.1 4.7 3.6 3.6 3.6
Restaurant and Miscellaneous
Goods and Services 1.6 1.2 1.2 1.3 1.6
2015 2016
Source of Ba s ic Da ta: PSA, BSP
Commodity
Private Sector Economists’ Inflation
Forecasts. Results of the BSP’s survey of private
sector economists for March 2016 yielded lower
mean inflation forecast for 2016 relative to the
results in December 2015.3
Mean inflation forecasts for
2016 are lower
In particular, the mean inflation forecast for 2016
declined to 1.9 percent from 2.5 percent in
December 2015. By contrast, the average annual
inflation forecast for 2017 was unchanged at
2.7 percent from the December 2015 survey
results. Meanwhile, mean inflation forecast for
2018 was at 3.0 percent.
Chart 3. BSP Private Sector Economists’ Survey
mean forecast for full year; in percent
1
2
3
4
5
Jan
20
14
Fe
b
Ma
r
Ap
r
Ma
y
Jun
Jul
Au
g
Se
p
Oct
No
v
De
c
Jan
20
15
Fe
b
Ma
r
Ap
r
Ma
y
Jun
Jul
Au
g
Se
p
Oct
No
v
De
c
Jan
20
16
Fe
b
Ma
r
2016 2017 2018 target range 2016: 1.9
2017: 2.7
2018: 3.0
Source: BSP
Analysts attributed their lower inflation
expectations to continued low global oil prices,
slower global economic growth, and lower
domestic electricity rates. These are likely to
outweigh the upside risks brought by the El Niño
phenomenon, increased government expenditures
from the upcoming election, pending power rate
adjustments, rebound in oil prices, base effects in
the CPI data, possible occurrence of La Niña in the
latter part of 2016, and prospects of rising US
interest rates.
Based on the probability distribution on the
forecasts provided by 23 out of 28 respondents,
there is a 46.3-percent chance that average
inflation for 2016 will settle between the
1.0-1.99 percent range. Meanwhile, there is a
46.4-percent chance that 2016 inflation rate will
fall within the 2-4 percent target range.
3 There were 28 respondents in the BSP’s survey of private
sector economists in March 2016. The survey was conducted
between 8-28 March 2016.
Q1 2016 Inflation Report | | | | 3333
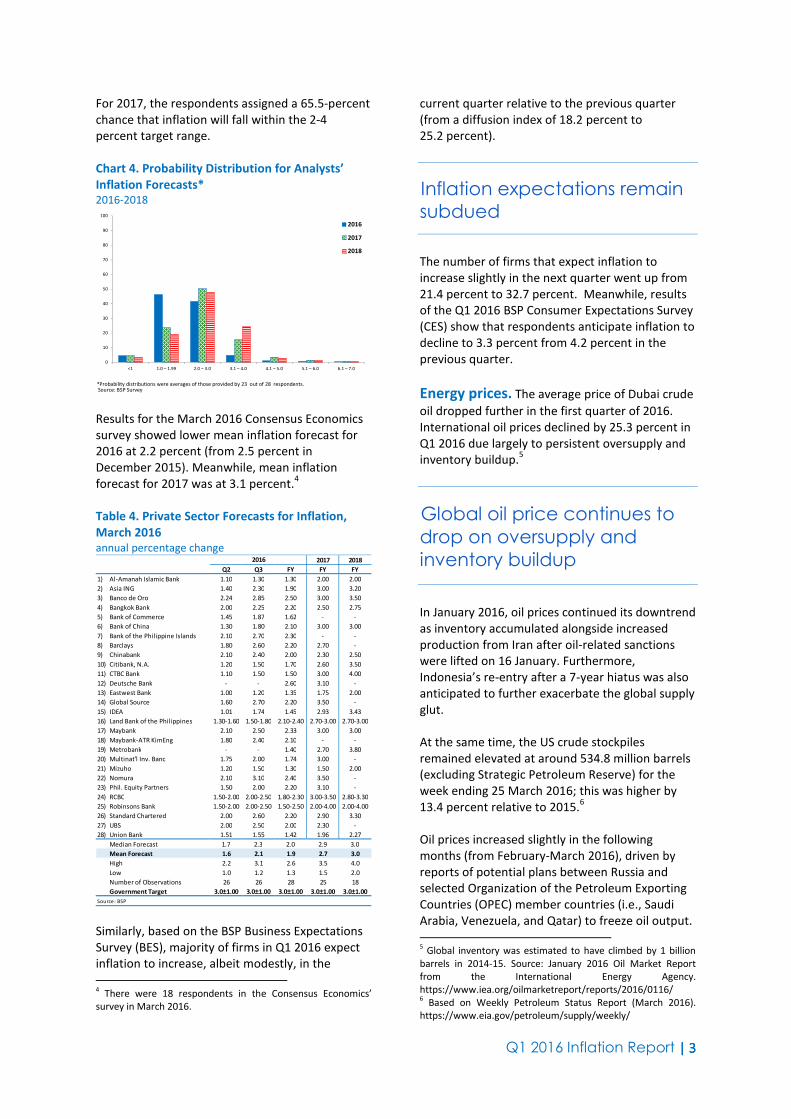
For 2017, the respondents assigned a 65.5-percent
chance that inflation will fall within the 2-4
percent target range.
Chart 4. Probability Distribution for Analysts’
Inflation Forecasts*
2016-2018
0
10
20
30
40
50
60
70
80
90
100
<1 1.0 – 1.99 2.0 – 3.0 3.1 – 4.0 4.1 – 5.0 5.1 – 6.0 6.1 – 7.0
2016
2017
2018
*Probability distributions were averages of those provided by 23 out of 28 respondents. Source: BSP Survey
Results for the March 2016 Consensus Economics
survey showed lower mean inflation forecast for
2016 at 2.2 percent (from 2.5 percent in
December 2015). Meanwhile, mean inflation
forecast for 2017 was at 3.1 percent.4
Table 4. Private Sector Forecasts for Inflation,
March 2016
annual percentage change 2017 2018
Q2 Q3 FY FY FY
1) Al-Amanah Islamic Bank 1.10 1.30 1.30 2.00 2.00
2) Asia ING 1.40 2.30 1.90 3.00 3.20
3) Banco de Oro 2.24 2.85 2.50 3.00 3.50
4) Bangkok Bank 2.00 2.25 2.20 2.50 2.75
5) Bank of Commerce 1.45 1.87 1.62 - -
6) Bank of China 1.30 1.80 2.10 3.00 3.00
7) Bank of the Philippine Islands 2.10 2.70 2.30 - -
8) Barclays 1.80 2.60 2.20 2.70 -
9) Chinabank 2.10 2.40 2.00 2.30 2.50
10) Citibank, N.A. 1.20 1.50 1.70 2.60 3.50
11) CTBC Bank 1.10 1.50 1.50 3.00 4.00
12) Deutsche Bank - - 2.60 3.10 -
13) Eastwest Bank 1.00 1.20 1.35 1.75 2.00
14) Global Source 1.60 2.70 2.20 3.50 -
15) IDEA 1.01 1.74 1.45 2.93 3.43
16) Land Bank of the Philippines 1.30-1.60 1.50-1.80 2.10-2.40 2.70-3.00 2.70-3.00
17) Maybank 2.10 2.50 2.33 3.00 3.00
18) Maybank-ATR KimEng 1.80 2.40 2.10 - -
19) Metrobank - - 1.40 2.70 3.80
20) Multinat'l Inv. Banc 1.75 2.00 1.74 3.00 -
21) Mizuho 1.20 1.50 1.30 1.50 2.00
22) Nomura 2.10 3.10 2.40 3.50 -
23) Phil. Equity Partners 1.50 2.00 2.20 3.10 -
24) RCBC 1.50-2.00 2.00-2.50 1.80-2.30 3.00-3.50 2.80-3.30
25) Robinsons Bank 1.50-2.00 2.00-2.50 1.50-2.50 2.00-4.00 2.00-4.00
26) Standard Chartered 2.00 2.60 2.20 2.90 3.30
27) UBS 2.00 2.50 2.00 2.30 -
28) Union Bank 1.51 1.55 1.42 1.96 2.27
Median Forecast 1.7 2.3 2.0 2.9 3.0
Mean Forecast 1.6 2.1 1.9 2.7 3.0
High 2.2 3.1 2.6 3.5 4.0
Low 1.0 1.2 1.3 1.5 2.0
Number of Observations 26 26 28 25 18
Government Target 3.0±1.00 3.0±1.00 3.0±1.00 3.0±1.00 3.0±1.00
2016
Source: BSP
Similarly, based on the BSP Business Expectations
Survey (BES), majority of firms in Q1 2016 expect
inflation to increase, albeit modestly, in the
4 There were 18 respondents in the Consensus Economics’
survey in March 2016.
current quarter relative to the previous quarter
(from a diffusion index of 18.2 percent to
25.2 percent).
Inflation expectations remain
subdued
The number of firms that expect inflation to
increase slightly in the next quarter went up from
21.4 percent to 32.7 percent. Meanwhile, results
of the Q1 2016 BSP Consumer Expectations Survey
(CES) show that respondents anticipate inflation to
decline to 3.3 percent from 4.2 percent in the
previous quarter.
Energy prices. The average price of Dubai crude
oil dropped further in the first quarter of 2016.
International oil prices declined by 25.3 percent in
Q1 2016 due largely to persistent oversupply and
inventory buildup.5
Global oil price continues to
drop on oversupply and
inventory buildup
In January 2016, oil prices continued its downtrend
as inventory accumulated alongside increased
production from Iran after oil-related sanctions
were lifted on 16 January. Furthermore,
Indonesia’s re-entry after a 7-year hiatus was also
anticipated to further exacerbate the global supply
glut.
At the same time, the US crude stockpiles
remained elevated at around 534.8 million barrels
(excluding Strategic Petroleum Reserve) for the
week ending 25 March 2016; this was higher by
13.4 percent relative to 2015.6
Oil prices increased slightly in the following
months (from February-March 2016), driven by
reports of potential plans between Russia and
selected Organization of the Petroleum Exporting
Countries (OPEC) member countries (i.e., Saudi
Arabia, Venezuela, and Qatar) to freeze oil output.
5 Global inventory was estimated to have climbed by 1 billion
barrels in 2014-15. Source: January 2016 Oil Market Report
from the International Energy Agency.
https://www.iea.org/oilmarketreport/reports/2016/0116/ 6 Based on Weekly Petroleum Status Report (March 2016).
https://www.eia.gov/petroleum/supply/weekly/

Q1 2016 Inflation Report | | | | 4444
However, this was not enough to offset the
consecutive decreases since 2015.
Meanwhile, the estimated futures prices of Dubai
crude oil in Q1 2016 showed a lower path for 2016
to 2018 compared to the estimates in the previous
quarter.7
Chart 5. Spot and Estimated Prices of Dubai Crude
Oil
20
40
60
80
100
120
140
Q1
20
12
Q2
Q3
Q4
Q1
20
13
Q2
Q3
Q4
Q1
20
14
Q2
Q3
Q4
Q1
20
15
Q2
Q3
Q4
Q1
20
16
Q2
Q3
Q4
Q1
20
17
Q2
Q3
Q4
Q1
20
18
Q2
Q3
Q4
*Futures prices derived using Brent crude futures
Source: Bloomberg, BSP
31 December 2015
31 March 2016
Global oil supply is projected to outstrip demand
for the next two years but could narrow in
2H 2017. In its latest report, the US Energy
Information Administration (EIA) revised both
supply and demand forecasts downward though
production will continue to exceed consumption
for 2016-2017. Production is expected to decline in
the coming months due largely to lower non-OPEC
output particularly, the US tight oil production,
which is regarded to be one of the most
price-sensitive.
Similarly, projections on oil consumption were
lower as downside risks to global demand
increased with the possible slowdown in economic
growth of major consumers namely, China, Japan,
and OECD Europe. In March 2016, the US EIA
adjusted December 2015 supply estimates for
2016 downward to 1.1 million barrels per day
(mb/d) from 1.4 mb/d. Meanwhile, supply
forecasts for 2016 from both the IEA and OPEC
remained steady at 1.2 mb/d and 1.25 mb/d,
respectively.
Meanwhile, prices of domestic petroleum
products showed mixed trends compared to the
previous quarter. Gasoline, kerosene and diesel
posted an increase relative to end-Q4 2015.
By contrast, LPG decreased by P4.45 per liter.
Nonetheless, domestic retail pump prices
remained lower than year-ago levels.
7 Future prices derived using Brent crude futures data.
Table 5. Domestic Retail Pump Prices
peso/liter; end-quarter prices
QUARTER GASOLINE KEROSENE DIESEL LPG
2014 Q1 53.75 50.87 44.25 41.73
Q2 54.95 51.51 43.70 40.27
Q3 52.15 47.99 40.70 38.74
Q4 41.20 37.39 30.05 33.87
2015 Q1 42.60 35.59 28.85 31.19
Q2 45.90 37.49 29.65 30.18
Q3 42.25 33.44 26.80 28.00
Q4 38.10 29.07 22.60 32.14
2016 Q1 39.00 30.32 22.80 27.69
2016 Q1 0.90 1.25 0.20 (4.45)
2016 Q1 (3.60) (5.27) (6.05) (3.50)
QUARTER-ON-QUARTER CHANGE
YEAR-ON-YEAR CHANGE
*Average Metro Mani la reta i l pump pri ces for the big three oi l
compani es: Ca ltex, Petron and Shel l
Source: Department of Energy (DOE) Power. Overall electricity rates went down slightly
in Q1 2016 due to lower generation costs.
Lower generation charges
lead to decreased retail
electricity prices
For Q1 2016, the average generation charge
dropped by P0.04 per kilowatt hour (kWh) to
P4.03 per kWh from P4.07 per kWh in Q4 2015.
The marginal decline in the average electricity
rates during the quarter was driven mainly by the
lower generation cost from the Power Supply
Agreements (PSAs) in January and March 2016,
which offset the increase recorded in February
2016. The lower generation charge in the quarter
were attributed to the higher dispatch of the
power plants, reduction of capacity fees, and to
some extent, the reduction in fuel cost.
Chart 6. Meralco’s Generation Charge
PhP/kWh; year-on-year growth rates in percent
-40
-30
-20
-10
0
10
20
30
40
50
0
1
2
3
4
5
6
7
8
9
Q1
2012
Q2 Q3 Q4 Q1
2013
Q2 Q3 Q4 Q1
2014
Q2 Q3 Q4 Q1
2015
Q2 Q3 Q4 Q1
2016
Generation Charge (PhP/kWh) (LHS)
Generation Charge (year-on-year growth rates in percent) (RHS)
Source: Meralco

Q1 2016 Inflation Report | | | | 5555
Meanwhile, there are potential sources of upside
pressures on electricity charges. Meralco has
existing petitions for rate increases with ERC which
include the petition to implement the Maximum
Average Price for 2012, 2013, 2014, and 2015;
amended application for a rate increase in the
January 2014 billing (consisting of incremental fuel costs and deferred generation cost to be collected
monthly for six months); and petitions for the
refund of generation over/under recovery (GOUR),
transmission over/under recovery (TOUR), system
loss over/under recovery (SLOUR), and lifeline
subsidy over/under recovery (LSOUR) for the
period January-December 2011. In addition, the
Power Sector Assets and Liabilities Management’s
(PSALM) has several pending petitions with ERC for
the recovery of True-Up Adjustments of Fuel and
Purchased Power Costs (TAFPPC), Foreign
Exchange Related Costs (TAFxA) and Purchased
Power Costs and Foreign Exchange Related Costs
by the National Power Corporation (NPC), and
NPC’s Stranded Debt portion of the universal
charge. Likewise, the National Grid Corporation of
the Philippines (NGCP) also filed several petitions
to recover connection charges and residual sub-
transmission charges for 2011-2013 and the costs
of repair on damages caused by force majeure
events such as earthquake, flooding, landslides,
and lightning incidents in 2011-2012.
Water. Effective 1 January 2016, the all-in-water
rates of Manila Water Company, Inc. (MWCI) and
Maynilad Water Services, Inc (MWSI) went down
by P0.34/cu.m. (from P34.00/cu.m to
P33.66/cu.m.) and P0.26 /cu.m. (from
P45.87/cu.m. to P45.61/cu.m.), respectively.
MWSS adjusts rates for
concessionaires due to FCDA
The decrease in the all-in-tariff rate of MWCI was
attributed mainly to the downward adjustment of
basic water charges as the MWSS Board of
Trustees (MWSS-BOT) approved and confirmed
MWSS-RO Resolution No. 2015-14-CA, ordering a
P0.36/cu.m. reduction in MWCI basic water charge
while reflecting an increase of P0.20/cu.m., taking
expected inflation into account. The lower foreign
currency differential adjustment (FCDA) for
Q1 2016 brought down further MWCI’s
all-in-water tariff rate by P0.05/cu.m.
Meanwhile, the reduction in all-in-tariff rate of
MWSI was due to the decrease in FCDA by
P0.46/cu.m. for Q1 2016 which offset the
inflation-adjusted increase in the basic water
charge of P0.27/cu.m.
Aggregate Demand and Supply
The Philippines’ real gross domestic product (GDP)
grew by 6.3 percent in Q4 2015, higher than the
6.1 percent growth in the previous quarter but
lower than the 6.6 percent growth in the same
period last year. This brought the full-year 2015
growth to 5.8 percent.
The Philippine economy
sustains momentum in Q4
The fourth quarter growth was fueled by
accelerated consumer spending and increasing
fixed capital investments, particularly in durable
equipment and public construction. Meanwhile,
the services and industry sectors continued to be
the main drivers of growth on the production side.
On a seasonally-adjusted basis, quarter-on-quarter
GDP growth accelerated to 2 percent in Q4 2015
from 1.4 percent in Q3 2015.
Gross national income (GNI) growth increased to
6.2 percent in Q4 2015 from the previous quarter’s
growth of 5.8 percent. Likewise, net primary
income accelerated to 5.4 percent in Q4 2015
(from 4.7 percent in Q3 2015) which was driven
mainly by the positive growth in compensation
inflow and the decline in property expense.
Chart 7. Gross Domestic Product (GDP) and Gross
National Income (GNI)
at constant prices
2
4
6
8
10
Q1
2012
Q2 Q3 Q4 Q1
2013
Q2 Q3 Q4 Q1
2014
Q2 Q3 Q4 Q1
2015
Q2 Q3 Q4
GDP GNI
Source: PSA

Q1 2016 Inflation Report | | | | 6666
Aggregate Demand. On the expenditure side,
household and government spending as well as
fixed capital investments led to the accelerated
growth of the economy (with contribution to GDP
growth of 4.7 percentage points, 1.4 percentage
points, and 4.9 percentage points, respectively),
offsetting the negative contribution of net exports
(-3.1 percentage points), which was due mainly to
the slowdown of growth in exports of goods and
the higher expansion in imports of services.
Household consumption find
boost in benign inflation
Household consumption, which accounted for
nearly three-fourths of the country’s output at
72.5 percent, rose by 6.4 percent in Q4 2015,
higher compared to the 6.1-percent growth in the
previous quarter. The slower pace of increase in
prices of consumer goods and services available to
households boosted household spending during
the quarter. The top contributors to growth of
household final consumption expenditure were
food and non-alcoholic beverages (2.8 percentage
points) and miscellaneous goods and services
(1.3 percentage points).
Chart 8. Gross Domestic Product by Expenditure
Shares
at constant prices
-30
-20
-10
0
10
20
30
40
50
Q1
2012
Q2 Q3 Q4 Q1
2013
Q2 Q3 Q4 Q1
2014
Q2 Q3 Q4 Q1
2015
Q2 Q3 Q4
HH Consumption Govt Spending Capital Formation
6.4 pct 17.4 pct 13.5 pct
Source: PSA
Growth in investments in capital formation
accelerated to 13.5 percent in Q4 2015 from
12.4 percent in Q3 2015, as growth in fixed capital
investments increased to 22.5 percent in Q4 2015
from 13.3 percent in Q3 2015. The expansion in
fixed capital investments can be attributed mainly
to the following:
(a) surge in growth of private investments in
durable equipment (40.2 percent in Q4 2015
from 19.1 percent a quarter ago) as
investments in road vehicles increased by
57.2 percent from 42.4 percent in the
previous quarter, coinciding with the higher
growth in car sales8 reported in Q4 2015 at
38.9 percent (compared to the previous
quarter’s 33.0 percent); and
(b) higher growth in public construction
(51.0 percent from 41.5 percent in the
previous quarter).
Government expenditures growth remained
steady at 17.4 percent in Q4 2015 owing to the
continued increase in disbursements under
maintenance and other operating expenses
(MOOE) for the implementation of projects and
social protection programs.
Overall exports growth picked up in Q4 2015,
registering an expansion of 7.1 percent from the
quarter-ago growth rate of 6.5 percent. The
slowdown in exports of goods growth compared to
a quarter ago (from 5.4 percent to 1.7 percent)
was offset by the appreciable growth in exports of
services (from 12.5 percent to 30.2 percent). The
growth in exports of services was due mainly to
the increase in miscellaneous services, such as
maintenance and repair services, charges for the
use of intellectual property, and
telecommunications, computer, and information
services (which contributed 17.8 percentage
points) and travel services (which contributed
10 percentage points). Meanwhile, the growth in
exports of goods decelerated, driven by the higher
contraction in exports of articles of apparel and
clothing accessories and others (e.g., transport
equipment/parts), which contributed
-1.8 percentage points and -5.3 percentage points,
respectively.
Table 6. Economic Performance
at constant 2000 prices; growth rate in percent
Q4 Q1 Q2 Q3 Q4
Household Consumption 5.0 6.0 6.2 6.1 6.4
Government Consumption 9.4 1.7 3.9 17.4 17.4
Capital Formation 3.0 11.6 17.2 12.4 13.5
Fixed Capital Formation 8.0 10.0 8.9 13.3 22.5
Exports 12.8 6.4 2.1 6.5 7.1
Imports 9.9 8.7 10.4 14.9 13.3
BY EXPENDITURE ITEM
Source: PSA
20152014
Overall imports posted 13.3 percent growth for
the quarter, lower than the quarter-ago increase
of 14.9 percent, owing to the slowdown in the
growth of imports of goods compared to a quarter
8 Data based on the Chamber of Automotive Manufacturers of
the Philippines (CAMPI) and Association of Vehicle Importers
and Distributors (AVID).

Q1 2016 Inflation Report | | | | 7777
ago (13.1 percent from 15.9 percent). The
contraction in imports of mineral fuels and
artificial resins contributed negatively to the
fourth quarter’s growth of imports of goods
(-0.9 percentage point and -0.6 percentage point,
respectively). Meanwhile, imports of services
increased by 13.6 percent (from 10.3 percent a
quarter ago) due largely to the 24.3 percent
growth in imports of transportation (which
contributed 3.6 percentage points) and the
30.5 percent growth in imports of miscellaneous
services, such as construction services and
personal, cultural and recreational services (which
contributed 7.3 percentage points).
Other Demand Indicators. High-frequency
demand indicators continued to report positive
signals in the first quarter of the year.
The property sector continues to grow at a
manageable pace, vehicle sales sustains its
double-digit growth while the composite
Purchasing Managers’ Index remains firmly above
the 50-point expansion threshold in January,
indicating continued firm domestic demand.
Moreover, business and consumer confidence for
the current quarter continue to improve and turn
bullish for the next quarter.
Property Prices
Land Values, Metro Manila. Data from Colliers
International indicated that implied land values9 in
the Makati CBD and Ortigas Center appreciated in
Q4 2015 from quarter- and year-ago levels.
Implied land values trend
higher but still below 1997
levels in real terms
Implied land values in the Makati CBD reached
P500,000/sq.m. in Q4 2015, higher by 8.7 percent
and 13.6 percent relative to the levels recorded in
Q3 2015 and Q4 2014, respectively. Similarly,
implied land values in the Ortigas Center rose by
4.1 percent quarter-on-quarter and 13.2 percent
year-on-year to P179,500/sq.m.
9
In the absence of reported closed transactions, implied land
values based on trends are used by Colliers International to
monitor prices.
Land values in the Makati CBD were above their
1997 levels in nominal terms, but just about half of
their 1997 levels in real terms.
Continued demand for office
space keeps vacancy rates
low
Meanwhile, land values in the Ortigas Center were
about 92.1 percent of their 1997 level in nominal
terms and 40.1 percent in real terms.
Chart 9. Land Values
average price per square meter
100,000
200,000
300,000
400,000
500,000
600,000
Q1
2013
Q2 Q3 Q4 Q1
2014
Q2 Q3 Q4 Q1
2015
Q2 Q3 Q4
Makati Bonifacio Global City Ortigas
Source: Colliers International Philippines
Vacancy Rates, Metro Manila. The office vacancy
rate in the Makati CBD remained steady at
2.1 percent in Q4 2015 relative to quarter-ago
level but slightly lower than the year-ago level of
2.2 percent. The continued strong office demand
in the Makati CBD has kept office vacancy rates at
low single-digit levels. However, Colliers
anticipates office vacancy to rise to 2.3 percent in
Q4 2016 with the scheduled completion of office
buildings that would surpass projected demand.
Similarly, the residential vacancy rate in the
Makati CBD increased to 8.9 percent in Q4 2015
from 8.3 percent in the previous quarter.
Higher residential vacancy
rates due to completion of
new residential buildings
The residential vacancy rate in Q4 2015 was also
higher than the year-ago level of 8.1 percent due
to recent residential building completions. The
delivery of new residential condominium units

Q1 2016 Inflation Report | | | | 8888
within the next 12 months is expected to increase
vacancy rates by 9.0 percent by Q4 2016.
Chart 10. Vacancy Rates (Makati Central Business
District)
in percent
0
1
2
3
4
5
6
Q1
2013
Q2 Q3 Q4 Q1
2014
Q2 Q3 Q4 Q1
2015
Q2 Q3 Q4
Office Residential
Source: Colliers International Philippines
Rental Values, Metro Manila.10
Monthly Grade A
office11
rents in the Makati CBD reached
P910/sq.m. in Q4 2015, representing an increase
of 0.6 percent from the previous quarter. Similarly,
monthly Grade A office rents in the Makati CBD
were higher by 7.1 percent relative to Q4 2014.
Office rental values show slight
increase
Office rental values for Grade A offices were above
their 1997 levels in nominal terms. In real terms,
office rental values were about half of the
comparable levels in 1997.
Monthly rents for luxury three-bedroom
condominium units in the Makati CBD rose to
P883/sq.m. in Q4 2015 or a 0.9 percent growth
from the previous quarter. Likewise, monthly rents
for the 3-bedroom segment were higher by
5.4 percent compared to the year-ago levels.
10
Actual rentals for housing account for 13.8 percent of the
2006-based CPI basket. The NSO presently surveys rentals only
ranging from around P300-P10,000/month to compute rent
inflation. However, the rental values discussed in this section
pertain to high-end rented properties, which may be
considered as indicators of wealth and demand. 11
In terms of location, Grade A office are located within the
CBD and have good access from the main and secondary
avenues. In terms of general finish, Grade A office units have
high quality presentation and maintenance.
Residential rental values rise
slightly
Residential rental values for luxury three-bedroom
high-rise units were above their 1997 levels in
nominal terms but were only about 81.0 percent
of their 1997 levels in real terms.
Chart 11. Rental Values (Makati Central Business
District)
price per square meter
0
100
200
300
400
500
600
700
800
900
1,000
Q1
2013
Q2 Q3 Q4 Q1
2014
Q2 Q3 Q4 Q1
2015
Q2 Q3 Q4
Office (Grade A) Residential (Luxury)
Source: Colliers International Philippines
Capital Values, Metro Manila. Capital values12
for
office buildings in the Makati CBD in Q4 2015 were
higher in nominal terms than their quarter- and
year-ago levels. Grade A office capital values in the
Makati CBD rose to P108,850/sq.m., higher by
4.2 percent and by 11.1 percent compared to the
quarter- and year-ago levels, respectively.
Capital values for office and
residential buildings are higher
Grade A office capital values were also higher than
the 1997 levels in nominal terms. Nevertheless, in
real terms, office capital values were about
59.7 percent of the comparable levels in 1997.
Capital values for luxury residential buildings13
in
Makati CBD in Q4 2015 rose to P151,350/sq.m.
from their quarter- and year-ago levels. Average
12
Capital value is defined as the probable price that the
property would have fetched if sold on the date of the
valuation. The valuation includes imputed land and building
value. 13
In terms of location, luxury residential units are located
within the CBD core and have quality access to/from and have
superior visibility from the main avenue. Meanwhile, in terms
of general finish, luxury residential units have premium
presentation and maintenance.

Q1 2016 Inflation Report | | | | 9999
prices for three-bedroom luxury residential
condominium units increased by 0.2 percent
quarter-on-quarter and 4.7 percent year-on-year.
Capital values for luxury residential buildings were
above their 1997 levels in nominal terms. In real
terms, residential capital values were about
67.7 percent of the comparable levels in 1997.
Chart 12. Capital Values (Makati Central Business
District)
price per square meter
0
20,000
40,000
60,000
80,000
100,000
120,000
140,000
160,000
Q1
2013
Q2 Q3 Q4 Q1
2014
Q2 Q3 Q4 Q1
2015
Q2 Q3 Q4
Office (Grade A) Residential (luxury)
Source: Colliers International Philippines
Vehicle Sales. Sales of new vehicles14
grew by
24.5 percent y-o-y in the first two months of Q1
2016 from a 21.1-percent growth recorded in the
same period a year ago. The Chamber of
Automotive Manufacturers of the Philippines, Inc.
(CAMPI) attributed the continued growth in car
sales to rising household incomes coupled with
attractive car financing terms of industry players.
Sales of new vehicles
continue to be robust
Passenger car sales from CAMPI members grew by
20.2 percent y-o-y in January-February 2016,
accruing to a total of 18,451 units from 15,349
units sold in the same period in 2015. Similarly,
commercial vehicles, which account for about
61.0 percent of total vehicle sales, expanded by
27.2 percent in the first two months of Q1 2016.
14
Vehicle sales data is gathered on a monthly basis by the
Chamber of Automotive Manufacturers of the Philippines
(CAMPI). CAMPI represents the local assemblers and
manufacturers of vehicle units in the Philippine automotive
industry. The following are the active members of CAMPI:
(1) Asian Carmakers Corp., (2) CATS Motors, Inc., (3) Columbian
Autocar Corp., (4) Honda Cars Philippines, Inc., (5) Isuzu
Philippines Corp., (6) Mitsubishi Motors Philippines Corp.,
(7) Nissan Motor Philippines Corp., (8) Suzuki Philippines Inc.,
(9) Toyota Motor Philippines Corp. and (10) Universal Motors
Corp.
Commercial vehicles sold during the quarter
reached 30,507 units from 23,976 units in the
same period in 2015.
Chart 13. Vehicle Sales
number of units
-15
-10
-5
0
5
10
15
20
25
30
35
Q1
2012
Q2 Q3 Q4 Q1
2013
Q2 Q3 Q4 Q1
2014
Q2 Q3 Q4 Q1
2015
Q2 Q3 Q4 Q1
2016*
* January-February 2016
Source: Chamber of Automotive Manufacturers of the Philippines, Inc. (CAMPI)
Energy Sales. Total energy sales of Meralco
increased by 12.4 percent year-on-year in January
2016, a turnaround after a 0.6-percent decline a
year-ago.
Energy sales increase in
January
Residential Energy Sales (RSALES), Commercial
Energy Sales (CSALES), and Industrial Sales (ISALES)
rose by 17.7 percent, 13.9 percent and 4.9 percent
to 903.6 kWh, 1,162.5 kWh and 790.7 kWh
year-on-year, respectively, in January 2016.
Chart 14. Energy Sales
year-on-year growth in percent
-20
-15
-10
-5
0
5
10
15
20
25
Jan
20
12
Feb
Ma
rA
pr
Ma
yJu
nJu
lA
ug
Sep
Oct
No
vD
ec
Jan
20
13
Feb
Ma
rA
pr
Ma
yJu
nJu
lA
ug
Sep
Oct
No
vD
ec
Jan
20
14
Feb
Ma
rA
pr
Ma
yJu
nJu
lA
ug
Sep
Oct
No
vD
ec
Jan
20
15
Feb
Ma
rA
pr
Ma
yJu
nJu
lA
ug
Sep
Oct
No
vD
ec
Jan
20
16
Total Energy Sales
Residential
Commercial
Industrial
Others
Source: Meralco, BSP calculations
12.4 pct
17.7 pct
13.9 pct
4.9 pct
1.8 pct
Capacity Utilization. The average capacity
utilization rate of the manufacturing sector was
unchanged at 83.5 percent in January 2016 from
the month-ago level based on the Philippine
Statistics Authority’s Monthly Integrated Survey of
Selected Industries (MISSI).

Q1 2016 Inflation Report | | | | 10101010
Capacity utilization in
manufacturing remains above
80 percent
Of the 581 respondent-establishments,
60.5 percent operated at least at 80.0 percent
capacity in January 2016. Data show that
manufacturing companies have been operating
above the 80.0-percent capacity since 2010.
Chart 15. Monthly Average of Capacity Utilization
for Manufacturing
in percent
81.8
82.0
82.2
82.4
82.6
82.8
83.0
83.2
83.4
83.6
83.8
Jan
20
12
Fe
bM
ar
Ap
rM
ay
Jun
Jul
Au
gS
ep
Oct
No
vD
ec
Jan
20
13
Fe
bM
ar
Ap
rM
ay
Jun
Jul
Au
gS
ep
Oct
No
vD
ec
Jan
20
14
Fe
bM
ar
Ap
rM
ay
Jun
Jul
Au
gS
ep
Oct
No
vD
ec
Jan
20
15
Fe
bM
ar
Ap
rM
ay
Jun
Jul
Au
gS
ep
Oct
No
vD
ec
Jan
20
16
Source: PSA
Volume and Value of Production. Preliminary
results of the MISSI showed that the volume of
production index (VoPI) grew at a significantly
faster pace in January 2016 by 34.3 percent
year-on-year from 5.0 percent (revised) in
December 2015. This is the highest since
January 2010 when the VoPI rose by 36.2 percent.
Manufacturing output rises
The January growth was led by the triple-digit
increment in the production of chemical products,
followed by tobacco products (49.4 percent),
machinery except electrical (23.6 percent), food
(20.2 percent), electrical machinery (19.2 percent),
and beverages (10.1 percent).
Factory output—as measured by the VoPI—
increased in January 2016 following a moderate
growth in 2015, which was a result of weak global
demand and adverse weather conditions, the National Economic and Development Authority
(NEDA) said in a press statement dated 10 March
2016. The expansion of the manufacturing sector
will likely be sustained for the year ahead given
the anticipated increase in spending for
election-related activities and infrastructure
projects. Also, stronger domestic demand during
the summer will provide support to the sector’s
growth.
Similarly, the value of production index (VaPI)
grew in January 2016 by 26.5 percent, from a
contraction of 2.5 percent (revised) in the previous
month. The uptick in VaPI was led by the
expansions in the following sub-sectors: chemical
products (309.6 percent), tobacco products
(49.6 percent), food (19.1 percent), and beverages
(11.7 percent). The rise in the VaPI of chemical
products was driven mainly by the drugs and
medicines sub-sector, which grew ten times
year-on-year.
Chart 16. Volume and Value Indices of
Manufacturing Production
year-on-year in percent
-15
-10
-5
0
5
10
15
20
25
30
35
40Ja
n 2
01
2Fe
bM
ar
Ap
rM
ay
Jun
Jul
Au
gSe
pO
ctN
ov
De
cJa
n 2
01
3Fe
bM
ar
Ap
rM
ay
Jun
Jul
Au
gSe
pO
ctN
ov
De
cJa
n 2
01
4Fe
bM
ar
Ap
rM
ay
Jun
Jul
Au
gSe
pO
ctN
ov
De
cJa
n 2
01
5Fe
bM
ar
Ap
rM
ay
Jun
Jul
Au
gSe
pO
ctN
ov
De
cJa
n 2
01
6
VAPI VOPI
Source: PSA
Business Expectations. Business optimism on the
economy remained positive albeit lower for
Q1 2016,15
with the overall confidence index (CI)16
declining to 41.9 percent from 51.3 percent for
Q4 2015. This indicates that the number of
optimists declined but continued to be greater
than the number of pessimists during the quarter.
15
The Q1 2016 BES was conducted during the period
5 January-17 February 2016 among 1,539 firms surveyed
nationwide. Respondents were drawn from the combined list
of the Securities and Exchange Commission’s Top 7,000
Corporations in 2010 and Business World’s Top 1000
Corporations in 2014, consisting of 588 companies in NCR and
951 firms in AONCR, covering all 18 regions nationwide. The
survey response rate for this quarter was lower at 82.6 percent
(from 83.6 percent in the previous quarter). The response rates
were lower both for NCR at 80.3 percent (from 81.5 percent in
the previous quarter) and for AONCR at 84 percent (from
85 percent in Q4 2015). 16
The CI is computed as the percentage of firms that answered
in the affirmative less the percentage of firms that answered in
the negative with respect to their views on a given indicator.
A positive CI indicates a favorable view, except for the inflation
rate and the peso-borrowing rate, where a positive CI indicates
the opposite.

Q1 2016 Inflation Report | | | | 11111111
Business sentiment optimistic in
Q1 and more bullish in the
next quarter
According to respondents, their less upbeat
quarter-on-quarter outlook was due to the
following factors: (a) usual slowdown in business
activity and moderation of consumer demand
after the holiday season; (b) decline in global oil
prices and other commodities; (c) growing
concerns about the outlook for global growth amid
continued weakness in China; (d) wait-and-see
attitude of businesses with regard to the outcome
of the 2016 national and local elections;
(e) adverse effects of El Niño on crop production
and businesses; (f) strong market competition;
and, (g) bearish trend of the Philippine stock
market. The sentiment of businesses in the
Philippines mirrored the less sanguine business
outlook in the United Kingdom, Germany, China,
and Korea, but was in contrast to the more
buoyant views of those in the United States,
Canada, France, Netherlands, and Russia.
Meanwhile, a more pessimistic outlook was
registered by businesses in Hong Kong SAR and
Singapore.
Table 7. Business Expectations Survey
Q4 Q1 Q2 Q3 Q4 Q1
Current Quarter 48.3 45.2 49.2 41.4 51.3 41.9
Next Quarter 43.1 58.2 47.3 53.1 43.9 49.6
BUSINESS
OUTLOOK INDEX
Source: BSP
2015 20162014
For the next quarter (Q2 2016), business outlook
turned more optimistic, with the CI rising to
49.6 percent from 43.9 percent in the last
quarter’s survey. The next quarter CI suggests that
economic growth could be higher for the next
quarter. Respondents cited the following factors as
reasons behind their more bullish outlook:
(a) election-related spending in the run-up to the
elections in May 2016; (b) sustained increase in
orders and projects leading to higher volume of
production; (c) anticipated increase in demand
during summer with the expected influx of both
local and foreign tourists and enrollment periods;
(d) introduction of new and enhanced business
strategies and processes; and, (e) expansion of
businesses and new product lines.
Consumer Expectations. Consumers’ outlook
continued to improve for Q1 201617
, with the
overall CI18
rising to -5.7 percent from -8.1 percent
for Q4 2015. The current quarter CI matched the
all-time high recorded for Q2 2013 since the
nationwide survey started in Q1 2007. The higher
(but still negative) CI for Q1 2016 means that the
number of households with optimistic views
increased but continued to be less than those who
think otherwise.
Consumer confidence
improves in Q1 and turns
optimistic in the next quarter
According to respondents, their more favorable
outlook during the current quarter was due to the
following reasons: (a) availability of more jobs;
(b) stable prices of commodities; and (c) more
investors in the country. The other factors cited by
respondents that helped boost their confidence
for the current quarter were oil price rollback,
assistance from government such as the Pantawid
Pamilyang Pilipino Program (4Ps), perception of
less corruption in the government, and anticipated
election of new government officials. The outlook
of consumers in the Philippines for Q1 2016
mirrored the improved sentiment of consumers in
Canada, China, and Taiwan, but was in contrast to
the less optimistic views of those in the Euro Area,
Indonesia, Japan, South Korea, Thailand, United
Kingdom, and the United States.
17
The Q1 2016 CES was conducted during the period
21-30 January 2016 among 5,805 households nationwide.
Respondents were drawn from the Philippine Statistics
Authority (PSA) 2003 Master Sample List of Households. Of the
sample size, 5,673 households responded to the survey,
equivalent to a response rate of 97.7 percent (from
97.1 percent in the last quarter’s survey). The respondents
consist of 2,850 households in NCR (with 98.7 percent response
rate) and 2,823 households in AONCR (with 96.7 percent
response rate). Nearly half of the respondents (47.7 percent)
were from the low-income group, 38.2 percent from the
middle-income group, and 14 percent from the high-income
group. 18
The CI is computed as the percentage of households that
answered in the affirmative less the percentage of households
that answered in the negative with respect to their views on a
given indicator. A positive CI indicates a favorable view, except
for the inflation rate, the peso-borrowing rate, unemployment
and change in prices, where a positive CI indicates the
opposite. The overall consumer CI measures the average
direction of change in three indicators - overall condition of the
economy, household finances, and household income.

Q1 2016 Inflation Report | | | | 12121212
Table 8. Consumer Expectations Survey
Q4 Q1 Q2 Q3 Q4 Q1
Current Quarter -21.8 -10.0 -16.2 -11.6 -8.1 -5.7
Next 3 Months 0.7 4.4 -0.4 5.8 5.7 9.1
Next 12 Months 9.6 17.3 16.4 15.8 18.0 25.4
Source: BSP
CONSUMER
OUTLOOK INDEX
2014 2015 2016
For the next quarter (Q2 2016), consumer
sentiment continued to be more favorable as the
next quarter CI increased and remained in the
positive territory at 9.1 percent (from 5.7 percent
in the previous quarter’s survey), while the year
ahead CI rose to 25.4 percent (from 18 percent for
Q4 2015). This indicates that the number of
consumers with favorable views increased and
exceeded those with unfavorable views.
Consumers were of the view that good governance
and improvements in infrastructure and peace and
order would continue over the next 12 months.
They also anticipated lesser household expenses
as well as an increase in household income and
savings which could translate to growth in real
income and higher purchasing power of the
household.
Purchasing Managers’ Index.19
The composite PMI
remained firmly above the 50-point expansion
threshold20
at 52.8 in January 2016. However, this
was lower than the composite PMI at 54.6 in the
previous month.
PMI remains firmly above the
50-point expansion threshold
The decline was due mainly to the slower rate of
expansion of the services and retail/wholesale
sectors.
19
Data based on the monthly purchasing managers’ index
report of the Philippine Institute for Supply Management. 20
The actual formula used to calculate the PMI assigns weights
to each common element and then multiplies them by 1.0 for
improvement, 0.5 for no change, and 0 for deterioration. As a
result, an index above 50 indicates economic expansion, and an
index below 50 implies a contraction. PMI surveys are
conducted on the last week of the month.
Chart 17. Purchasing Managers’ Index
40
45
50
55
60
65
70
Jan
20
12
Feb
Ma
rA
pr
Ma
yJu
nJu
lA
ug
Sep
Oct
No
vD
ec
Jan
20
13
Feb
Ma
rA
pr
Ma
yJu
nJu
lA
ug
Sep
Oct
No
vD
ec
Jan
20
14
Feb
Ma
rA
pr
Ma
yJu
nJu
lA
ug
Sep
Oct
No
vD
ec
Jan
20
15
Feb
Ma
rA
pr
Ma
yJu
nJu
lA
ug
Sep
Oct
No
vD
ec
Jan
20
16
Composite Manufacturing Retail & Wholesale Trade Services
52.8 53.5 50.0 53.2
Source: Philippine Institute of Supply Management (PISM)
The manufacturing PMI in January 2016
accelerated by 8.3 index points to 53.5 from
45.2 in December 2015. In December,
manufacturers adjusted their capacity build-up
due to the severe lead time and delivery
conditions during the month that brought the
index to its record low. Also, shutdown and
maintenance work in manufacturing plants also
contributed to the deceleration of the sector in
December. In January 2016, the manufacturing
PMI showed a significant reversal as three of the
five sub-indices expanded at a faster rate.
Manufacturing companies reported that stronger
demand, higher overall production, and increased
level of stockpiles contributed to the expansion of
the sector. All the manufacturing subsectors
accelerated in January 2016, except for food and
beverages and publishing and printing.
The services PMI declined by 4.0 index points to
53.2 in January 2016 from 57.2 in the previous
month. This was attributed to the easing of
demand in January. Slower expansions were noted
in four out of the six indices during the month due
to lower number of new services contracted,
fewer task orders in progress, lower price charges
on services rendered, and lower amount paid for
materials and services. All the sub-indices
remained well above the 50-point expansion
threshold, except for business activity sub-index
which showed a faster contraction.
Likewise, the retail and wholesale PMI decreased
by 8.7 percentage points to 50.0 in January 2016
from 58.7 a month ago due to the anticipated
post-holiday slackening in retail/wholesale
business. Three of the five sub-indices showed
contraction that include the Sales Revenue Index,
Employment Index, and Inventories Index. The
retail subsector PMI decreased by 8.3 index points
to 51.0 in January 2016 from 59.3 in December
2015. Similarly, the wholesale subsector PMI
declined to 47.6 from 57.1 in the same review
period.

Q1 2016 Inflation Report | | | | 13131313
External Demand
Exports. Exports of goods remained in negative
growth territory in Q4 2015. Exports dropped by
5.0 percent from a decline of 8.1 percent in the
previous quarter as foreign shipments across all
export commodities decreased.
Export performance remains
negative
The decline in exports can be attributed to lower
demand from the country’s Asian trading
partners21
, which account for the bulk of the
country’s exports.
Table 9. Exports of Goods
growth rate in percent
Q4 Q3 Q4
Coconut Products 9.0 -29.7 -13.9
Sugar and Products -95.0 -87.8 -75.0
Fruits and Vegetables -2.1 -27.3 -28.3
Other Agro-Based Products 14.3 -22.3 -34.2
Forest Products 9.9 -57.2 -77.8
Mineral Products -1.5 -43.7 -33.3
Petroleum Products -25.5 1.0 -42.6
Manufactures 6.5 -3.8 -1.1
Special Transactions 173.0 130.7 -35.1
Total Exports 5.7 -8.1 -5.0
COMMODITY GROUP
Source: BSP s taff computations ba sed on data from the
PSA
2014 2015
Imports. Imports of goods increased marginally by
0.5 percent in Q4 2015, from a 12.1-percent
growth a quarter ago.
Imports of goods slow down
The growth in imports was due to the double-digit
expansion in inward shipments of capital goods,
offsetting the contraction in the import bill of raw
materials and intermediate goods, mineral fuels
and lubricants, and consumer goods.
21
East Asia (includes China, Hong Kong, Japan, Macau,
Mongolia, North Korea, South Korea and Taiwan) and ASEAN
(includes Brunei, Cambodia, Indonesia, Laos, Malaysia,
Myanmar, Singapore, Thailand and Vietnam)
Table 10. Imports of Goods
growth rate in percent
Q4 Q3 Q4
Capital Goods -9.8 28.5 30.7
Raw Materials and
Intermediate Goods 21.4 29.7 -4.9
Lubricants -17.6 -49.9 -32.2
Consumer Goods 26.1 33.6 -2.2
Special Transactions -25.8 8.9 -9.3
Total Imports 4.5 12.1 0.5
Mineral Fuels and Lubricants
Source: BSP s taff computations ba sed on data from the
PSA
COMMODITY GROUP2014 2015
Aggregate Supply. On the production side, the
fourth quarter growth was mainly driven by the
services sector (contributing 4.1 percentage
points) and the industry sector (contributing
2.3 percentage points). Meanwhile, agriculture
contributed -0.03 percentage point.
Services sector remains the
main driver of output growth
on the production side
The services sector expanded by 7.4 percent in
Q4 2015, slightly higher than the 7.2-percent
growth in Q3 2015. Major contributors to the
sector’s growth were trade and repair of motor
vehicles, motorcycles, personal and household
goods (2.2 percentage points), real estate, renting
and business activities (1.5 percentage points) and
other services (1.4 percentage points). The
increase in output of trade and repair of motor
vehicles, motorcycles, personal and household
goods sector can be attributed mainly to output of
retail trade (4.9 percentage points). Meanwhile,
growth of real estate, renting and business
activities improved slightly to 7.9 percent from
7.8 percent in the previous quarter, on account of
the higher growth of renting and other business
activities at 11.8 percent from 11.5 percent a
quarter ago. Also, the growth in other services was
due primarily to the accelerated increase from a
quarter ago of services in recreational, cultural and
sporting activities (13.5 percent from 7 percent)
and hotels and restaurants services (10.9 percent
from 10.7 percent).

Q1 2016 Inflation Report | | | | 14141414
Chart 18. Gross Domestic Product by Industrial
Origin (at constant prices)
year-on-year growth in percent
-4
-2
0
2
4
6
8
10
12
14
Q1
2012
Q2 Q3 Q4 Q1
2013
Q2 Q3 Q4 Q1
2014
Q2 Q3 Q4 Q1
2015
Q2 Q3 Q4
Agriculture Industry Services
-0.3 pct 6.8 pct 7.4 pct
Source: PSA
The industry sector grew by 6.8 percent in
Q4 2015, higher compared to 5.5 percent in
Q3 2015. This was due mainly to the acceleration
in manufacturing (which posted a growth of
6.6 percent from 5.5 percent a quarter ago) and
construction activities (which grew by 8.4 percent
from 5.4 percent in the previous quarter). Growth
in manufacturing came mainly from chemical and
chemical products (2.5 percentage points), food
manufactures (1.9 percentage points), and radio,
television and communication equipment and
apparatus (1.5 percentage points). Moreover,
appreciable growths in manufacturing of wood,
bamboo, cane and rattan articles (35.7 percent
from 12.7 percent) and basic metal industries
(35.6 percent from -24 percent) were noted
compared to that a quarter ago. However,
negative growths were recorded primarily in
beverage industries, petroleum and other fuel
products, and furniture and fixtures. Meanwhile,
growth in construction was due to the robust
growth of public construction. Growth in all
sub-sectors of the industry sector accelerated
compared to a quarter ago, except for electricity,
gas and water supply (4.8 percent from
6.6 percent).
Agriculture, hunting, forestry and fishery (AHFF)
sector’s growth reverted to negative territory at
-0.3 percent in Q4 2015 from 0.3 percent a quarter
ago. The contraction mainly came from the
negative growth of palay and corn production and
fishing (particularly in the production of milkfish,
tiger prawn, skipjack, and yellowfin tuna).
The sector’s performance was negatively affected
by the long dry spell and damages caused by
Typhoon “Lando”.
Table 11. Economic Performance
at constant 2000 prices; growth rate in percent
Q4 Q1 Q2 Q3 Q4
Agri., Hunting, Forestry and Fishing 4.2 1.1 -0.2 0.3 -0.3
Agriculture and Forestry 4.3 1.9 -0.3 0.2 0.7
Fishing 4.2 -2.9 -0.1 1.1 -4.5
Industry Sector 9.1 5.5 5.9 5.5 6.8
Mining and Quarrying 5.9 -3.1 -7.1 3.6 7.8
Manufacturing 7.7 6.0 4.7 5.5 6.6
Construction 17.9 5.4 15.3 5.4 8.4
Electricity, Gas and Water Supply 5.1 5.1 2.7 6.6 4.8
Service Sector 5.6 5.4 6.6 7.2 7.4
Transport, Storage and
Communication 4.5 8.3 6.4 8.1 8.9
Trade and Repair of Motor Vehicles,
Motorcycles, Personal and
Household Goods 3.4 5.5 6.6 8.3 7.0
Financial Intermediation 8.9 4.3 5.8 5.4 7.4
Real Estate, Renting and
Business Activities 9.7 6.3 7.0 7.8 7.9
Public Administration and Defense;
Compulsory Social Security 11.4 -3.5 -0.3 3.1 3.2
Other Services 1.8 6.6 10.0 7.2 8.1
Source: PSA
BY INDUSTRIAL ORIGIN2014 2015
Labor Market Conditions
In January 2016, the Philippine labor market22
posted the second lowest unemployment rate in
the past 10 years,23
although its underemployment
rate deteriorated compared to the same period in
2015.
Unemployment rate improves
notably
The country’s unemployment rate settled at
5.8 percent, still below 6 percent and much lower
than the 6.6 percent unemployment rate in
January 2015.24
This is equivalent to a 279,000
decline in unemployment level to 2.4 million,
resulting from a 2.0-percent growth in
employment that outpaced the 1.1-percent
growth in the labor force. The unemployment rate
22
The data used in the analysis are estimates based on January
2016 data that excludes the province of Leyte, to be
comparable with the January 2015 Labor Force Survey (LFS),
which did not cover the province of Leyte. The Philippine
Statistics Authority also released preliminary estimates with
Leyte. 23
Since 2005, the country posted the lowest unemployment
rate in October 2015 at 5.7 percent. Starting April 2005, the
new unemployment definition based on international standard
was adopted per NSCB Resolution No. 15 series of 2004. 24
Including Leyte, the resulting unemployment rate is the same
at 5.8 percent.

Q1 2016 Inflation Report | | | | 15151515
among the youth (15-24 years old) also improved
to 14.4 percent from 14.9 percent in the same
period last year, although this is still more than
double the rate at the national level.25
Chart 19. Unemployment and Underemployment
in percent
0
5
10
15
20
25
Q1
2012
Q2 Q3 Q4 Q1
2013
Q2 Q3 Q4 Q1
2014
Q2 Q3 Q4 Q1
2015
Q2 Q3 Q4 Q1
2016
Unemployment Underemployment
Source: PSA
The 752,000 increase in total employment to
39.2 million came mainly from the 5.6-percent and
8.4-percent growth in employment in services and
industry sectors, respectively, which offset the
8.1-percent decline in employment in agriculture
sector. The 1.2 million employment generated in
services sector (the country’s primary employment
contributor) was driven primarily by other services
activities (12.9 percent), public administration and
defense (10.6 percent), and transportation and
storage (4.9 percent) sub-sectors. The 508,000
additional employment in industry sector was
contributed mainly by a double-digit employment
growth in construction (18.0 percent)26
and a
continued increase in employment in
manufacturing (2.1 percent) sub-sector.
Meanwhile, the 935,000 employment loss in
agriculture sector was due to adverse effects of
El Niño on agriculture production.
25
The youth comprises 48.3 percent of the unemployed in
January 2016. There was a slight decline in labor force
participation rate among the youth (from 43.9 percent to 41.3
percent) partly due to their decision to attend school and
become full-time students (Source: NEDA (2016),
“Unemployment Down, More Jobs created in January 2016,”
NEDA Media Release, 11 March). 26
This gained primarily from increased public infrastructure
spending.
However, the underemployment rate worsened to
19.7 percent from 17.9 percent in January 201527
due to increase in invisible28
(43.1 percent)
underemployment. Nevertheless, the higher share
of full-time employment to total employment
(67.4 percent from 61.6 percent a year ago)
resulted in an increase in the country’s overall
mean hours of work (hours per week) to 42.5 from
40.3, which could indicate a higher level of
economic activities in the first quarter of 2016.
27
Majority of the underemployed were wage and salary
workers in private establishments. 28
This refers to underemployed full-time workers or those who
work 40 hours or more per week but still wanted more work.
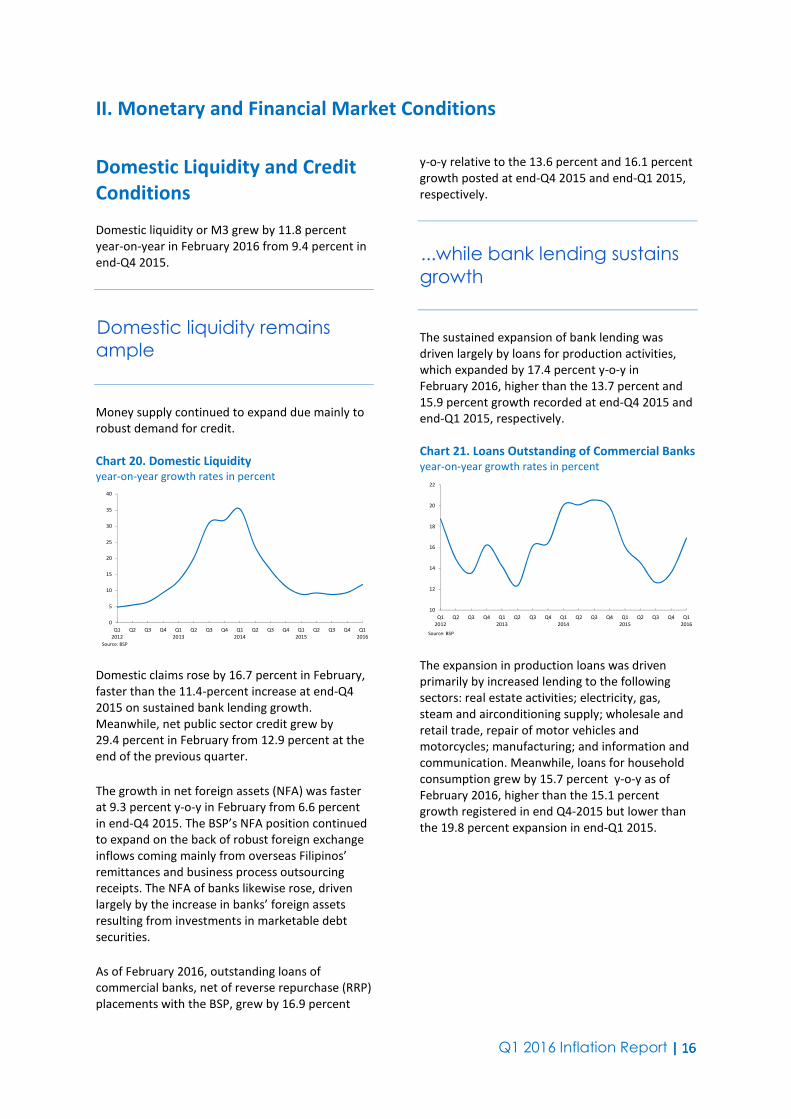
Q1 2016 Inflation Report | | | | 16161616
II. Monetary and Financial Market Conditions
Domestic Liquidity and Credit
Conditions
Domestic liquidity or M3 grew by 11.8 percent
year-on-year in February 2016 from 9.4 percent in
end-Q4 2015.
Domestic liquidity remains
ample
Money supply continued to expand due mainly to
robust demand for credit.
Chart 20. Domestic Liquidity
year-on-year growth rates in percent
0
5
10
15
20
25
30
35
40
Q1
2012
Q2 Q3 Q4 Q1
2013
Q2 Q3 Q4 Q1
2014
Q2 Q3 Q4 Q1
2015
Q2 Q3 Q4 Q1
2016
Source: BSP
Domestic claims rose by 16.7 percent in February,
faster than the 11.4-percent increase at end-Q4
2015 on sustained bank lending growth.
Meanwhile, net public sector credit grew by
29.4 percent in February from 12.9 percent at the
end of the previous quarter.
The growth in net foreign assets (NFA) was faster
at 9.3 percent y-o-y in February from 6.6 percent
in end-Q4 2015. The BSP’s NFA position continued
to expand on the back of robust foreign exchange
inflows coming mainly from overseas Filipinos’
remittances and business process outsourcing
receipts. The NFA of banks likewise rose, driven
largely by the increase in banks’ foreign assets
resulting from investments in marketable debt
securities.
As of February 2016, outstanding loans of
commercial banks, net of reverse repurchase (RRP)
placements with the BSP, grew by 16.9 percent
y-o-y relative to the 13.6 percent and 16.1 percent
growth posted at end-Q4 2015 and end-Q1 2015,
respectively.
...while bank lending sustains
growth
The sustained expansion of bank lending was
driven largely by loans for production activities,
which expanded by 17.4 percent y-o-y in
February 2016, higher than the 13.7 percent and
15.9 percent growth recorded at end-Q4 2015 and
end-Q1 2015, respectively.
Chart 21. Loans Outstanding of Commercial Banks
year-on-year growth rates in percent
10
12
14
16
18
20
22
Q1
2012
Q2 Q3 Q4 Q1
2013
Q2 Q3 Q4 Q1
2014
Q2 Q3 Q4 Q1
2015
Q2 Q3 Q4 Q1
2016
Source: BSP
The expansion in production loans was driven
primarily by increased lending to the following
sectors: real estate activities; electricity, gas,
steam and airconditioning supply; wholesale and
retail trade, repair of motor vehicles and
motorcycles; manufacturing; and information and
communication. Meanwhile, loans for household
consumption grew by 15.7 percent y-o-y as of
February 2016, higher than the 15.1 percent
growth registered in end Q4-2015 but lower than
the 19.8 percent expansion in end-Q1 2015.

Q1 2016 Inflation Report | | | | 17171717
Credit Standards. Results of the Q1 2016 Senior
Bank Loan Officers’ Survey (SLOS)29
showed that
most of the respondent banks maintained their
credit standards for loans to both enterprises and
households during the quarter based on the modal
approach.30
This is the 28th
consecutive quarter
since Q2 2009 that the majority of banks reported
broadly unchanged credit standards.
Meanwhile, the diffusion index (DI) approach31,32
pointed to a net tightening of overall credit
standards for loans extended to businesses while
overall credit standards for loans extended to
households were unchanged. In the previous
quarter, credit standards for both corporate
lending and household loans eased slightly based
on the DI approach.
Lending to Enterprises. Most banks (86.7 percent
of banks that responded to the question) indicated
that credit standards for loans to enterprises
remained unchanged during the quarter using the
modal approach. Meanwhile, a net tightening was
observed using the DI approach as the number of
respondents indicating tighter overall credit
standards outnumbered those that indicated the
opposite.
Most respondent banks
maintain credit standards for
loans to enterprises
The net tightening of overall credit standards was
attributed by respondent banks to their reduced
29
The survey consists of questions on loan officers’ perceptions
relating to the overall credit standards of universal/commercial
banks (U/KBs) in the Philippines, as well as to factors affecting
the supply of and demand for loans by both enterprises and
households. Survey questionnaires were sent to 35 U/KBs, of
which, 32 banks responded to the current survey representing
a response rate of 91.4 percent. As of end-December 2015,
U/KB loans accounted for about 84.2 percent of the banking
system’s total outstanding loans. 30
In the modal approach, the results of the survey are analyzed
by looking at the option with the highest share of responses. 31
In the diffusion index approach, a positive diffusion index (DI)
for credit standards indicates that the proportion of banks that
have tightened their credit standards are greater compared to
those that eased (“net tightening”), whereas a negative DI for
credit standards indicates that more banks have eased their
credit standards compared to those that tightened (“net
easing”). 32
From Q1 2010 to Q4 2012 survey rounds, the BSP used
largely the DI approach in the analysis of survey results.
Beginning in Q1 2013, the BSP used both the modal and DI
approaches in assessing the results of the survey.
tolerance for risk, perception of stricter financial
system regulations, and more uncertain outlook
on certain industries and firms. In terms of specific
credit standards, the net tightening of overall
credit standards for business loans reflected
stricter collateral requirements and loan
covenants.33
Table 12. General Credit Standards for Loans to
Enterprises (Overall)
Q4 Q1 Q2 Q3 Q4 Q1
Tightened Considerably 0.0 3.4 0.0 0.0 3.2 3.3
Tightened Somewhat 3.2 13.8 3.2 6.3 0.0 6.7
Remained Basically Unchanged 93.5 79.3 93.5 87.5 90.3 86.7
Eased Somewhat 3.2 3.4 3.2 6.3 6.5 3.3
Eased Considerably 0.0 0.0 0.0 0.0 0.0 0.0
Total 100.0 100.0 100.0 100.0 100.0 100.0
Diffusion Index for Credit Standards 0.0 13.8 0.0 0.0 -3.2 6.7
Weighted Diffusion Index for Credit Standards 0.0 8.6 0.0 0.0 0.0 5.0
Mean 3.0 2.8 3.0 3.0 3.0 2.9
Number of Banks Responding 31 29 31 32 31 30
Note: A pos itive diffus i on index for credi t s tanda rds indica tes that more ba nks have ti ghtened their credit s ta nda rds
compared to thos e tha t ea sed ("net ti ghteni ng"), wherea s a negative di ffus ion index for credit standards indi cates tha t
more banks have ea sed thei r credi t s ta nda rds compa red to thos e that tightened ("net eas ing").
Source: BSP
2014 2015 2016
In terms of borrower firm size, overall credit
standards tightened across all firm sizes, except for
small and medium enterprises (SMEs) for which
overall credit standards were unchanged based on
the DI approach.
Most of the respondent banks foresee maintaining
their overall credit standards for loans to
businesses over the next quarter. However, the
percentage of banks expecting a slight easing of
overall credit standards for enterprises was higher
compared to those expecting the opposite.
Respondent banks cited expectations of
improvement in the profitability of banks’
portfolio and more aggressive competition from
banks and non-bank lenders as among the reasons
for the expected net easing of credit standards.
Lending to Households. The survey results
likewise showed that most of the respondent
banks (81.0 percent) continued to report
unchanged overall credit standards for loans
extended to households. At the same time, the
DI approach showed basically unchanged overall
33
The survey questionnaire asks banks to describe changes in
six specific credit standards: (1) loan margins (price-based);
(2) collateral requirements; (3) loan covenants; (4) size of
credit lines; (5) length of loan maturities; and (6) interest rate
floors. A loan covenant is an agreement or stipulation laid
down in loan contracts, particularly contracts with enterprises,
under which the borrower pledges either to take certain action
(an affirmative covenant), or to refrain from taking certain
action (a negative covenant); this is consequently part of the
terms and conditions of the loan. Meanwhile, an interest rate
floor refers to a minimum interest rate for loans. Greater use of
interest rate floor implies tightening while less use indicates
otherwise.

Q1 2016 Inflation Report | | | | 18181818
credit standards for household loans in Q1 2016
with equal percentages of banks reporting tighter
and easier credit standards for the quarter.
Most respondent banks report
unchanged credit standards
for loans to households
Respondent banks attributed the steady credit
standards to banks’ unchanged tolerance for risk
and profile of borrowers, among others. In
particular, banks’ responses indicated overall
unchanged loan margins and maturities.
Respondent banks likewise maintained collateral
requirements and loan covenants, particularly for
auto loans and personal/salary loans during the
quarter.
Table 13. General Credit Standards for Loans to
Households (Overall)
Q4 Q1 Q2 Q3 Q4 Q1
Tightened Considerably 0.0 0.0 0.0 0.0 0.0 0.0
Tightened Somewhat 14.3 10.5 9.5 4.2 4.5 9.5
Remained Basically Unchanged 85.7 84.2 81.0 87.5 81.8 81.0
Eased Somewhat 0.0 5.3 9.5 8.3 13.6 9.5
Eased Considerably 0.0 0.0 0.0 0.0 0.0 0.0
Total 100.0 100.0 100.0 100.0 100.0 100.0
Diffusion Index for Credit Standards 14.3 5.3 0.0 -4.2 -9.1 0.0
Weighted Diffusion Index for Credit Standards 7.1 2.6 0.0 -2.1 -4.5 0.0
Mean 2.9 2.9 3.0 3.0 3.1 3.0
Number of Banks Responding 21 19 21 24 22 21
Note: A pos itive diffus i on index for credi t s tanda rds indica tes that more ba nks have ti ghtened their credit s ta nda rds
compared to thos e tha t ea sed ("net ti ghteni ng"), wherea s a negative di ffus ion index for credit standards indi cates tha t
more banks have ea sed thei r credi t s ta nda rds compa red to thos e that tightened ("net eas ing").
Source: BSP
2014 2015 2016
Looking ahead, most of the respondent banks
expect their overall credit standards for household
loans to remain unchanged. However, some banks
anticipate overall credit standards to ease slightly
on expectations of higher risk tolerance,
improvement in borrowers’ profile, and more
aggressive competition from banks and non-bank
lenders, along with banks’ more favorable outlook
on the economy.
Loan demand. Responses to the survey question
on loan demand indicated that the majority of the
respondent banks continued to see stable overall
demand for loans from both enterprises and
households.
Loan demand from both
enterprises and households is
unchanged
Using the DI approach, however, results showed a
net increase in loan demand34
across all firm sizes,
except micro enterprises, and all household loans,
except credit cards and auto loans. The net
increase in loan demand of firms35
was attributed
by banks largely to higher working capital and
accounts receivable financing needs of borrower
firms. Meanwhile, the net increase in demand for
household loans reflected higher household
consumption and banks’ more attractive financing
terms, among others.
Over the next quarter, most of the respondent
banks expect unchanged loan demand from both
firms and households. However, a larger
proportion of respondents expect overall demand
for corporate loans to increase further in the next
quarter relative to those who indicated the
opposite. Respondent banks cited improved
economic outlook of clients along with
expectations of higher working capital and
accounts receivable financing needs of borrower
firms as key factors behind the expected increase
in demand for business loans. Meanwhile, the
anticipated net increase in household loan
demand was attributed by respondent banks
largely to higher household consumption and
investment as well as more attractive financing
terms offered by banks.
Real Estate Loans. Most of the respondent banks
(95.2) also indicated unchanged credit standards
for commercial real estate loans in Q1 2016. The
DI approach, however, indicated a net tightening
of overall credit standards for the said type of loan
after being unchanged in the previous quarter.
34
The “DI for loan demand” refers to the percentage difference
between banks reporting an increase in loan demand and
banks reporting a decrease. A positive DI for loan demand
indicates that more banks reported an increase in loan demand
compared to those stating the opposite, whereas a negative DI
for loan demand implies that more banks reported a decrease
in loan demand compared to those reporting an increase. 35
In particular, top corporations, large middle-market
enterprises, and SMEs.

Q1 2016 Inflation Report | | | | 19191919
Credit standards for real
estate loans remain steady
The tighter overall credit standards for commercial
real estate loans reflected respondent banks’
reduced tolerance for risk, deterioration in the
profile of borrowers, and perception of stricter
financial system regulations. In terms of specific
credit standards for commercial real estate loans,
banks’ responses showed wider loan margins,
reduced credit line sizes, stricter collateral
requirements, and increased use of interest rate
floors.
Demand for commercial real estate loans was also
unchanged in Q1 2016 based on the modal
approach. A number of banks, however, indicated
increased demand for the said type of loan on the
back of clients’ improved economic outlook and
increased working capital and inventory financing
needs of customers, among others. Over the next
quarter, although most of the respondent banks
anticipate generally steady loan demand, a
number of banks expect demand for commercial
real estate loans to increase further.
Similarly, in the case of housing loans extended to
households, most of the respondent banks
(82.4 percent) reported unchanged credit
standards. Using the DI approach, however, a
slight easing of credit standards for housing loans
was noted in Q1 2016. The net easing of credit
standards for housing loans was attributed by
respondent banks largely to improvement in
borrower’s profile and higher risk tolerance of
banks for the said type of loan. Over the next
quarter, although most respondent banks foresee
maintaining their credit standards for housing
loans, a number of banks expect credit standards
to tighten slightly on expectations of lower
tolerance for risk. At the same time, results
continued to show increased demand for housing
loans in Q1 2016 as well as expectations of a
continued increase in demand for the said type of
loan in the next quarter.
Interest Rates
Primary Interest Rates. In Q1 2016, the average
91-day, 182-day, and 364-day T-bill rates in the
primary market decreased to 1.555 percent,
1.580 percent, and 1.723 percent from
1.710 percent, 1.697 percent, and 1.897 percent,
respectively, in Q4 2015.
T-bill rates in the primary
market decline
The decline in T-bill rates reflected strong investor
preference for short-dated tenors amid concerns
over slowing economic growth in Asia.
Chart 22. Treasury Bill Rates
in percent
0
1
2
3
Q1
2012
Q2 Q3 Q4 Q1
2013
Q1 Q2 Q3 Q1
2014
Q4 Q1 Q2 Q1
2015
Q3 Q4 Q1 Q1
2016
91-day T-bill Rate
182-day T-bill Rate
364-day T-bill Rate
Source: Bureau of the Treasury (BTr)
Yield Curve. The secondary market yield for
government securities (GS) fell generally, except
for the 3-year and 10-year GS, as of end-March
2016 relative to the end-December 2015 levels,
amid strong buying interest as market players
invested their excess liquidity and serviced their
clients’ requirements as well as supply concerns
due to lack of long-dated securities in the Q2 2016
schedule of the NG’s Treasury bond offering.
The yield curve declines
Debt paper yields were lower by a range of
29.0 bps (20-year GS) to 102.3 bps (6-month GS)
compared to end-December 2015 levels. By
contrast, the interest rates for the 3-year and
10-year GS rose by 2.8 bps and 59.0 bps,
respectively.

Q1 2016 Inflation Report | | | | 20202020
Chart 23. Yields of Government Securities in the
Secondary Market
in percent
0
1
2
3
4
5
6
3Mo 6Mo 1Yr 2Yr 3yr 4Yr 5Yr 7Yr 10Yr 20Yr 25Yr
Mar 2015
Dec 2015
Mar 2016
Source: Bloomberg
Relative to year-ago levels, the secondary market
yields of GS increased generally by a range of
12.6 bps for the 4-year GS to 71.5 bps for the
3-year GS except for the shorter-dated maturities
which declined by -53.9 bps (3-month), 71.1 bps
(6-month) and 59.5 bps (1-year).
Interest Rate Differentials. The average
differentials between domestic and US interest
rates, gross and net of tax, narrowed further in
Q1 2016 relative to the previous quarter.
Interest rate differentials
narrow further
The average 91-day RP T-bill rate declined q-o-q by
14.5 bps to 1.555 percent in Q1 2016 from
1.700 percent in Q4 2015. Meanwhile, the average
US 90-day LIBOR and US 90-day T-bill rate
increased by 21.6 bps and 7.9 bps, respectively,
to 0.625 percent and 0.341 percent in Q1 2016.
Foreign interest rates rose on investor optimism
following the release of better-than-expected US
economic data on manufacturing activity,
non-farm payrolls, and consumer and construction
spending during the quarter.
Chart 24. Interest rate Differentials
quarterly averages; in basis points
-50
0
50
100
150
200
250
300
350
400
450
Q1 2012 Q2 Q1 2013 Q1 Q1 2014 Q4 Q1 2015 Q3 Q1 2016
RP 91-day T-bill vs. US 90-day LIBOR (before tax) RP 91-day T-bill vs. US 90-day T-bill (before tax)
RP 91-day T-bill vs. US 90-day LIBOR (after tax) RP 91-day T-bill vs. US 90-day T-bill (after tax)
Source: Bloomberg, BTr and BSP
The positive differential between the BSP's
overnight borrowing or RRP rate and the US Fed
funds target rate remained unchanged at
350-375 bps in Q1 2016, as the policy settings for
both central banks were kept steady.
Chart 25. BSP RRP Rate and US Federal Funds
Target Rate
in percent
-1
0
1
2
3
4
5
Q1
2012
Q1 Q2 Q3 Q1
2013
Q4 Q1 Q2 Q1
2014
Q3 Q4 Q1 Q1
2015
Q2 Q3 Q4 Q1
2016
BSP RRP Rate US Federal Funds Target Rate
Source: Bloomberg and BSP
Meanwhile, the interest rate differential between
the BSP’s overnight RRP rate and the US Fed funds
target rate adjusted for risk36
widened further to
266 bps as of end-March 2016 from 249 bps in
end-December 2015 due to lower risk premium.
Chart 26. Risk-Adjusted Differentials
in basis points
150
175
200
225
250
275
300
Q1
2012
Q1 Q2 Q3 Q1
2013
Q4 Q1 Q2 Q1
2014
Q3 Q4 Q1 Q1
2015
Q2 Q3 Q4 Q1
2016
Source: Bloomberg and BSP
36
The difference between the 10-year ROP note and the 10-
year US Treasury note is used as proxy for the risk premium.
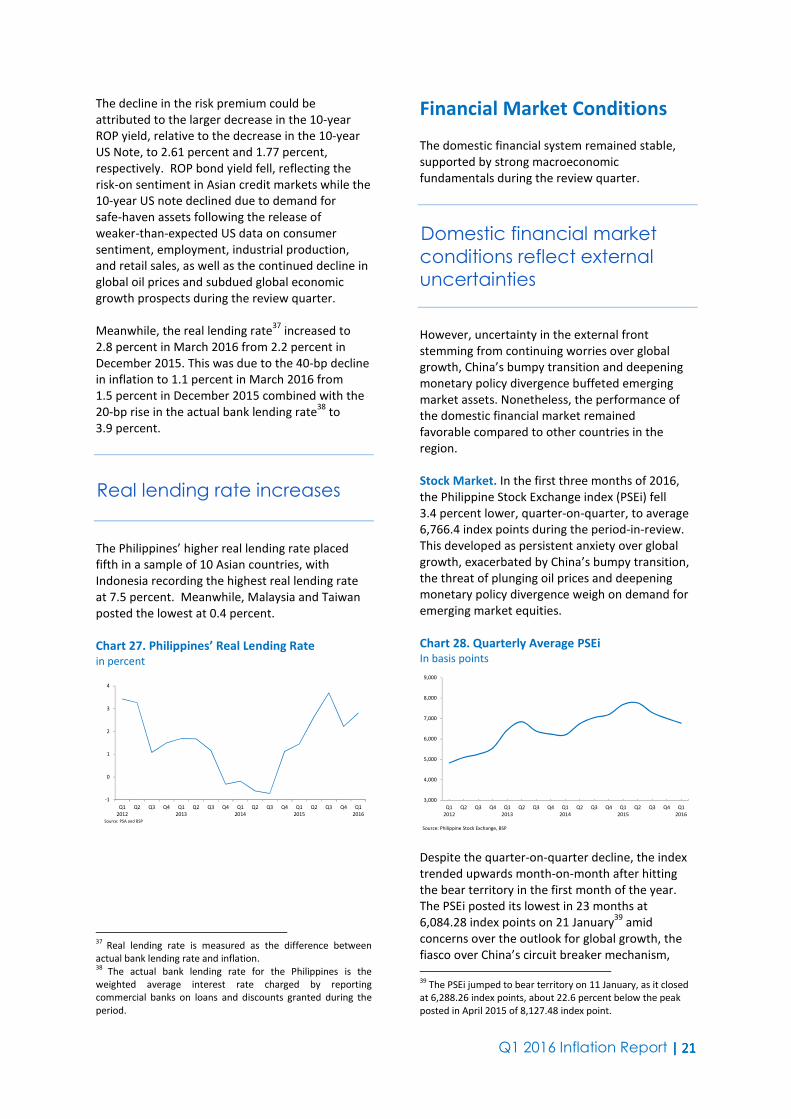
Q1 2016 Inflation Report | | | | 21212121
The decline in the risk premium could be
attributed to the larger decrease in the 10-year
ROP yield, relative to the decrease in the 10-year
US Note, to 2.61 percent and 1.77 percent,
respectively. ROP bond yield fell, reflecting the
risk-on sentiment in Asian credit markets while the
10-year US note declined due to demand for
safe-haven assets following the release of
weaker-than-expected US data on consumer
sentiment, employment, industrial production,
and retail sales, as well as the continued decline in
global oil prices and subdued global economic
growth prospects during the review quarter.
Meanwhile, the real lending rate37
increased to
2.8 percent in March 2016 from 2.2 percent in
December 2015. This was due to the 40-bp decline
in inflation to 1.1 percent in March 2016 from
1.5 percent in December 2015 combined with the
20-bp rise in the actual bank lending rate38
to
3.9 percent.
Real lending rate increases
The Philippines’ higher real lending rate placed
fifth in a sample of 10 Asian countries, with
Indonesia recording the highest real lending rate
at 7.5 percent. Meanwhile, Malaysia and Taiwan
posted the lowest at 0.4 percent.
Chart 27. Philippines’ Real Lending Rate
in percent
-1
0
1
2
3
4
Q1
2012
Q2 Q3 Q4 Q1
2013
Q2 Q3 Q4 Q1
2014
Q2 Q3 Q4 Q1
2015
Q2 Q3 Q4 Q1
2016Source: PSA and BSP
37
Real lending rate is measured as the difference between
actual bank lending rate and inflation. 38
The actual bank lending rate for the Philippines is the
weighted average interest rate charged by reporting
commercial banks on loans and discounts granted during the
period.
Financial Market Conditions
The domestic financial system remained stable,
supported by strong macroeconomic
fundamentals during the review quarter.
Domestic financial market
conditions reflect external
uncertainties
However, uncertainty in the external front
stemming from continuing worries over global
growth, China’s bumpy transition and deepening
monetary policy divergence buffeted emerging
market assets. Nonetheless, the performance of
the domestic financial market remained
favorable compared to other countries in the
region.
Stock Market. In the first three months of 2016,
the Philippine Stock Exchange index (PSEi) fell
3.4 percent lower, quarter-on-quarter, to average
6,766.4 index points during the period-in-review.
This developed as persistent anxiety over global
growth, exacerbated by China’s bumpy transition,
the threat of plunging oil prices and deepening
monetary policy divergence weigh on demand for
emerging market equities.
Chart 28. Quarterly Average PSEi
In basis points
3,000
4,000
5,000
6,000
7,000
8,000
9,000
Q1
2012
Q2 Q3 Q4 Q1
2013
Q2 Q3 Q4 Q1
2014
Q2 Q3 Q4 Q1
2015
Q2 Q3 Q4 Q1
2016
Source: Philippine Stock Exchange, BSP
Despite the quarter-on-quarter decline, the index
trended upwards month-on-month after hitting
the bear territory in the first month of the year.
The PSEi posted its lowest in 23 months at
6,084.28 index points on 21 January39
amid
concerns over the outlook for global growth, the
fiasco over China’s circuit breaker mechanism,
39
The PSEi jumped to bear territory on 11 January, as it closed
at 6,288.26 index points, about 22.6 percent below the peak
posted in April 2015 of 8,127.48 index point.

Q1 2016 Inflation Report | | | | 22222222
rising geopolitical tensions between Saudi Arabia
and Iran, as well as the nuclear testing by North
Korea helped trigger a global sell-off. However, the
US Fed’s decision to hold-off an interest rate hike
during its two-day meeting in January and the
release of a robust Philippine GDP growth in
Q4 2015 tempered partly the decline and helped
move the index past bear territory by 27 January.
The PSEi averaged 6,469.8 index points in January,
lower by 6.2 percent than the previous month’s
level.
The PSEi continued to show some recovery in
February on optimism that the US Fed will
continue to defer further interest rates hikes and
on hopes of more stimulus across major central
banks. The Saudi Arabia–Russia agreement
reached on 16 February to freeze oil production
output to levels registered in January 2016 in
efforts to stem the global supply glut also helped
improve investors’ risk appetite.
External headwinds dampen
stock trading in Q1 2016
Nevertheless, these were offset by lingering
concerns about global growth amid disappointing
GDP outturn from Japan and trade data from
China. The PSEi averaged 3.7 percent higher at
6,771.8 index points in February.
In March, the PSEi breached the 7,000 mark,
boosted by the PBoC’s decision to cut reserve
requirements by 50 bps, the ECB’s aggressive
stimulus program and the US Fed’s dovish
guidance on interest rates. Reports of positive
earnings by domestic firms also helped encourage
the return of foreign investors in the local bourse.
The main index averaged 6.0 percent higher at
7,117.7 index points in March.
Other stock indicators registered positive turnouts
during the review period. Total market
capitalization reached P13.9 trillion in end-March,
higher by 3.2 percent than the P13.5 trillion
posted in end-December 2015. Foreign investors’
return in the local bourse in March resulted in net
purchases of P3.4 billion in Q1 as opposed to the
net sales of P15.2 billion registered in the previous
quarter. Meanwhile, data from Bloomberg
indicated that the price-earnings ratio of local
issues was virtually unchanged at 20.8x in end-
March 2016. Philippine shares remained the
second most expensive in the ASEAN5 region, next
to Indonesia’s 24.9x.
Government Securities. The Bureau of the
Treasury (BTr) decided to award in full bids for all
tenors in auctions held during Q1 2016
(January – March 2016). With total subscription
amounting to P135.5 billion, about 2.3 times
higher than the P60.0 billion total offered amount,
results of the T-bill auctions conducted during the
review quarter continued to show firm demand for
government securities amid concerns over slowing
economic growth in Asia. The oversubscription for
the quarter at P75.5 billion was lower than the
P30.7 billion oversubscription in the previous
quarter.
Chart 29. Total Oversubscription of T-bill Auctions
0
20
40
60
80
100
120
140
160
180
Q1
2012
Q2 Q3 Q4 Q1
2013
Q2 Q3 Q4 Q1
2014
Q2 Q3 Q4 Q1
2015
Q2 Q3 Q4 Q1
2016
Source: Bureau of the Treasury
Sovereign Bond and CDS Spreads. The cost of
insuring Philippine sovereign debt increased in the
first quarter of 2016. The country’s 5-year
sovereign credit default swap (CDS) spreads
averaged 118.6 basis points (bps) in Q1 2016, up
from Q4 2015 average of 107.4 bps.
Debt spreads widen due to
uncertainties on the external
front
Against those of neighboring economies, the
Philippine CDS traded lower than Indonesia’s
average of 229.8 bps, Malaysia’s 181.7 bps and
Thailand’s 150.3 bps.

Q1 2016 Inflation Report | | | | 23232323
Chart 30. Quarterly Philippine Sovereign 5-Year
CDS Spreads
in basis points
0
50
100
150
200
250
Q1
2012
Q2 Q3 Q4 Q1
2013
Q2 Q3 Q4 Q1
2014
Q2 Q3 Q4 Q1
2015
Q2 Q3 Q4 Q1
2016
Philippines Indonesia Thailand Malaysia
118.6 bps 229.8 bps 150.3 bps 181.7 bps
Source: Bloomberg
Meanwhile, the risk premium from holding a
Philippine sovereign bond over a similarly tenured
US Treasury bond climbed to an average of
123.3 bps, marginally higher than the previous
quarter’s 123.1 bps as indicated by the wider
EMBIG Philippine spreads.
Chart 31. Quarterly JPMorgan EMBI+ Sovereign
Bond Spreads
in basis points
0
50
100
150
200
250
300
350
400
450
500
Q1
2012
Q2 Q3 Q4 Q1
2013
Q2 Q3 Q4 Q1
2014
Q2 Q3 Q4 Q1
2015
Q2 Q3 Q4 Q1
2016
EMBI+Philippines
123.3 bps
EMBI+Global
432.0 bps
Source: Bloomberg
In January 2016, debt spreads took a negative
turnaround, widening to levels last seen during the
taper tantrum in 2013. Investors traded on a
safe-haven mode which pushed yields of US
Treasury bonds lower while raising yields of the
relatively risky emerging market bonds higher
(including the Philippines) thereby resulting in a
wider debt spreads. The rout in China’s financial
market sapped investors’ risk appetite away from
higher-yielding emerging market assets, which
wiped out gains from most of Asia’s equities
market and weakened their currencies against the
US dollar. Investors were also surprised as the
Bank of Japan adopted a negative interest rate
strategy.
In February 2016, debt spreads further widened as
concerns over China and the continued drop in oil
prices spurred market jitters. China’s foreign
exchange reserves shrank by US$99.5 billion in
January to US$3.23 trillion, the lowest level since
2012. Meanwhile, talks between Venezuela and
Saudi Arabia failed to mitigate oil supply issues.
In March, debt spreads narrowed as the global
economic and financial environment remained
calm. Yields continued to decrease as investors
stay cautious and away from high risk assets.
By 31 March, the Philippines’ 5-year sovereign CDS
stood at 104 bps, lower than the 109 bps in end-
Q4 and has remained lower than Indonesia’s
197 bps, Malaysia’s 153 bps and Thailand’s
130 bps. The EMBIG Philippines also ended the
quarter narrower at 107 bps compared to the
previous quarter’s closing of 124 bps.
Banking System
The Philippine banking system maintains its strong
position as it continues to support long-term
economic growth. Banks’ balance sheets were marked by a sustained growth in assets and
deposits.
The Philippine banking system
remains robust
Asset quality indicators also continued to improve,
while capital adequacy ratios remained above
international standards, even with the
implementation of the tighter Basel III framework.
Savings Mobilization. Savings and demand
deposits were the primary sources of funds for the
banking system. Banks’ total deposits40
as of
end-January 2016 amounted to P7.3 trillion,
11.3 percent or P0.7 trillion higher than the
year-ago level. The growth in deposits outpaced
the 8.9-percent growth posted in the previous
quarter. Demand, savings, and time deposits
expanded by 17.4 percent, 13.7 percent, and
1.5 percent respectively.41
Also, foreign currency
deposits owned by residents (FCD-Residents) grew
by 12.5 percent, y-o-y, to P1.5 trillion.42
40
This refers to the total peso-denominated deposits of the
banking system. 41
Along with the savings, time and demand deposits, M3
includes currency in circulation and deposit substitutes. 42
M4 is the sum of M3 and FCD-Residents. Along with savings,
time and demand deposits, M3 includes currency in circulation
and deposit substitutes.

Q1 2016 Inflation Report | | | | 24242424
Chart 32. Deposit Liabilities of Banks
in billion pesos
0
1,000
2,000
3,000
4,000
5,000
6,000
7,000
8,000
Mar
2012
Jun Sep Dec Mar
2013
Jun Sep Dec Mar
2014
Jun Sep Dec Mar
2015
Jun Sep Dec Jan
2016
Demand Savings Time
Source: BSP
Institutional Developments. The total resources of
the banking system grew by 7.6 percent to
P12.4 trillion as of end-December 2015 from the
year-ago level of P11.5 trillion.
Total resources of the banking
system continue to rise
As a percent of GDP, total resources stood at 93.4
percent.
Chart 33. Total Resources of the Banking System
levels in trillion pesos; share in percent
50
60
70
80
90
100
4
5
6
7
8
9
10
11
12
13
14
Mar
2013
Jun Sep Dec Mar
2014
Jun Sep Dec Mar
2015
Jun Sep Dec
Total Resources (LHS) as % of GDP (RHS)
Source: BSP
The number of banking institutions (head offices)
fell to 632 as of end-December 2015 from the
year- and quarter-ago levels of 648 and 635,
respectively, indicating continued consolidation of
banks as well as the exit of weaker players in the
banking system. By banking classification, banks
(head offices) consisted of 40 universal and
commercial banks (U/KBs), 68 thrift banks (TBs),
and 524 rural banks (RBs). Meanwhile, the
operating network (head offices and
branches/agencies) of the banking system
expanded to 10,756 offices in Q4 2015 from
10,361 offices during the same period in the
previous year and 10,615 offices in Q3 2015, due
mainly to the increase in the branches/agencies of
U/KBs, TBs and RBs.
The Philippine banking system’s gross
non-performing loan (GNPL) ratio at 2.1 percent,
as of end-December 2015, was an improvement
relative to the 2.3 percent posted a year- and a
quarter-ago.
Asset quality of Philippine
banks continues to improve
Banks’ initiatives to improve their asset quality
along with prudent lending regulations helped
maintain the GNPL ratio below its pre-Asian crisis
level of 3.5 percent43
. The improvement reflected
the combined effect of the GNPL decrease of
P2.8 billion, from P139.7 billion in Q3 2015 down
to P136.9 billion in Q4 2015, and the banking
system’s TLP expansion of P495.6 billion, from
P6.0 trillion in Q3 2015 to P6.5 trillion. Similarly,
the net non-performing loan (NNPL) ratio
increased, though mildly, to 0.7 percent relative to
the 0.6 percent posted a year- and a quarter-ago.
In computing for the NNPLs, specific allowances
for credit losses44
on TLP are deducted from the
GNPLs. The said allowances decreased to
P94.2 billion in end-December 2015 from the
P101.4 billion posted a quarter ago.
Chart 34. Ratios of Gross Non-Performing Loans
and Net Non-Performing Loans to To Total Loans
of the Banking System
in percent
0.2
0.3
0.4
0.5
0.6
0.7
0.8
0.9
1.0
1.1
1.9
2.1
2.3
2.5
2.7
2.9
3.1
3.3
3.5
3.7
3.9
4.1
Mar
2012
Jun Sep Dec Mar
2013
Jun Sep Dec Mar
2014
Jun Sep Dec Mar
2015
Jun Sep Dec
Gross NPLs/Total Loans (LHS)
Net NPLs/Total Loans (RHS)
Source: BSP
43
The 3.5 percent NPL ratio was based on the pre-2013
definition. 44
This type of provisioning applies to loan accounts classified
under loans especially mentioned (LEM), substandard-secured
loans, substandard-unsecured loans, doubtful accounts and
loans considered as loss accounts.

Q1 2016 Inflation Report | | | | 25252525
The Philippine banking system’s GNPL ratio of
2.1 percent was higher relative to South Korea
(1.7 percent) and Malaysia (1.2 percent), but lower when compared with Thailand (2.6 percent) and
Indonesia (2.3 percent).45
The loan exposures of banks remained adequately
covered as the banking system registered an NPL
coverage ratio of 117.8 percent. The Q4 2015
coverage ratio was lower than the 119.8 percent
registered a year-ago but slightly higher than the
117.6 percent posted in end-September 2015.
The ratio is indicative of banks’ continued
compliance with the loan-loss provisioning
requirements of the BSP to ensure adequate
buffers against potential credit losses.
Compliance with the BSP capital framework for
U/KBs under the Basel III framework46
took effect
on 1 January 2014. The new Basel III regime
incorporates adjustments to the treatment of bank
capital in ways that enhance the use of the CAR as
a prudential measure. The capital adequacy ratio
(CAR) of universal and commercial banks (U/KBs)
stood at 15.55 percent on solo basis and
16.40 percent on consolidated basis at the end of
the third quarter in 2015. These figures are
well-above the BSP regulatory threshold of
10.0 percent and international minimum of
8.0 percent. The banks’ latest CAR on solo basis
rose quarter-on-quarter from the 15.48 percent
posted at end-June last year. On the other hand,
U/KBs’ CAR on consolidated basis at end-
September last year slightly declined from the
16.42 posted a quarter earlier.
Banks remain well-capitalized
amid tighter capital
requirements
45
Sources: Various central bank websites, IMF and financial
stability reports, Indonesia (Banks’ Nonperforming Loans,
Q1 2015); Malaysia (Banking System’s Net Impaired Loans,
Q4 2015); Thailand (Total Financial Institutions’ Gross NPLs,
Q4 2015); and South Korea (Domestic Banks’ Substandard or
Below Loans [SBLs], Q4 2015). 46
Basel III no longer counts towards “bank capital” those Basel
II-compliant capital instruments that do not have the feature of
loss absorbency. Loss absorbency refers to the ability of bank-
eligible capital instruments other than common equity to
behave and act in the same way as common equity shares at
the point where the bank takes losses and becomes non-viable.
In addition, Basel III now deducts from capital the investments
of banks in non-allied undertakings, defined benefit pension
fund assets, goodwill and other intangible assets.
The industry’s capitalization remains
predominantly composed of Common Equity Tier 1
(CET 1), the highest quality among instruments
eligible as bank capital. The CET 1 of U/KBs
increased quarter-on-quarter to 12.99 percent and
13.92 percent of risk weighted assets (RWA) from
12.87 percent and 13.89 percent last quarter on
both solo and consolidated bases, respectively.
Their Tier 1 ratio also grew to 13.18 percent and
14.08 percent from 13.06 percent and
14.05 percent last quarter on both solo and
consolidated bases, respectively. Tier 1 is
composed of common equity and qualified capital
instruments. Both CET 1 and Tier 1 ratios of U/KBs
were also above the BSP thresholds of 6.0 percent
and 7.5 percent, respectively. Said capital ratios
increased amid the U/KBs’ profitable operations
and issuance of new shares as well as the infusion
of foreign bank capital.
The CAR of U/KBs on a consolidated basis at
16.4 percent was higher than those of Malaysia
(16.1 percent) and South Korea (13.9 percent), but
lower compared to those of Indonesia
(20.6 percent) and Thailand (17.4 percent).47
47
Sources: Various central bank websites, IMF and financial
stability reports, Indonesia (Commercial Banks, Q3 2015);
Thailand (Commercial Banks’ Capital Funds Percentage of Risk
Assets, Jan. 2016); Malaysia (Banking System’s Total Capital
Ratio, Q4 2015); and South Korea (Domestic Banks’ Capital
Ratio, Q4 2015).

Q1 2016 Inflation Report | | | | 26262626
Exchange Rate The peso depreciated against the US dollar in the
first quarter of 2016. On a quarter-on-quarter
basis, the peso weakened by 0.9 percent to
average P47.30/US$1 from the previous quarter’s
average of P46.87/US$1.
Peso weakens on
uncertainties related to the US
interest rate hike
On a year-on-year basis, the peso depreciated by
6.1 percent relative to the P44.42/US$1 average in
the first quarter of 2015.48 The weakness of the
peso during the review quarter was due to the risk
aversion towards emerging market assets arising
from concerns on the Chinese economy and
declining oil prices.
Chart 35. Quarterly Peso-Dollar Rate
PHp/US$
39
40
41
42
43
44
45
46
47
48
Q1
2012
Q2 Q3 Q4 Q1
2013
Q2 Q3 Q4 Q1
2014
Q2 Q3 Q4 Q1
2015
Q2 Q3 Q4 Q1
2016
Source: Reference Exchange Rate Bulletin, Treasury Department, BSP.
In January 2016, the peso weakened to average
P47.51/US$1 relative to the P47.23/US$1 average
in December 2015 on continued risk aversion
towards emerging market assets over concerns on
global growth, declining oil prices, and worries on
the Chinese economy. In February, the peso
depreciated further to an average of P47.64/US$1
on safe-haven buying following the contraction in
China’s manufacturing sector.49
Meanwhile, the
Bank of Japan’s move to introduce a negative
interest rate policy rendered support for Asian
currencies, tempering the depreciation of the
48
Dollar rates or the reciprocal of the peso-dollar rates were
used to compute for the percentage change. 49
Official manufacturing purchasing managers’ index fell to
49.4 in January from 49.7 in December, marking the lowest
level since August 2012 and the sixth straight month of
contraction. A reading below 50 indicates a contraction.
(Source: National Bureau of Statistics of China)
peso. In March, the trend reversed as the peso
appreciated to average P46.76/US$1 on improved
risk appetite towards emerging market assets,
following aggressive stimulus measures from the
European Central Bank and dovish statement on
the outlook for interest rates by the US Federal
Reserve. Overall, the sustained inflows of foreign
exchange from overseas Filipino remittances,
foreign direct investments, BPO and tourism
receipts, as well as the healthy level of gross
international reserves and the country’s robust
economic growth provided stability to the peso.50
On a year-to-date basis, the peso appreciated
against the US dollar by 2.1 percent on
31 March 2016 as it closed at P46.07/US$1,
moving in tandem with most Asian currencies
except the Indian rupee which depreciated against
the US dollar.51
Table 14. Year-to-Date Changes in Selected Dollar
Rates
appreciation/(-depreciation); in percent 2012 2013 2014 2015 2016*
Singaporean Dollar 6.1 -2.7 -4.5 -6.0 5.2
Chinese Yuan 1.0 2.6 -2.7 -4.3 0.4
Thai Baht (Onshore) 3.0 -4.6 -0.7 -8.9 2.3
Philippine Peso 6.8 -7.0 -0.7 -5.0 2.1
Japanese Yen -10.9 -16.3 -12.5 -0.5 6.9
New Taiwan Dollar 4.3 -1.9 -6.2 -3.6 2.0
Malaysian Ringgit 3.5 -5.5 -6.3 -18.6 9.6
Korean Won 7.7 1.1 -4.3 -6.6 3.0
Indonesian Rupiah -5.9 -19.1 -2.1 -9.8 3.9
Indian Rupee -3.1 -11.4 -2.9 -4.9 -0.1Notes:
- Negative va lue represents depreciation of the currency aga ins t the US dol lar.
- Cum means cumulative s um of year-to-date changes of selected Asian currencies.
- YTD changes are computed as the percent change between the clos ing pri ces for the year
indicated vers us the clos ing prices for the precedi ng year (i .e., clos ing pri ces are based on
Bloomberg data as of 31 December except for the Phi l ippine pes o which us ed clos ing pri ce
for the last trading day of the year).
*Bas ed on Bloomberg data as of 4:00 p.m., 31 March 2016
Meanwhile, volatility as measured by the
coefficient of variation (COV) of the peso’s daily
closing rates stood at 1.15 percent during the first
quarter of 2016, slightly higher compared with the
0.93 percent in the previous quarter.52
On a real trade-weighted basis, the peso lost
external price competitiveness, for the period
January to February 2016, against the basket of
currencies of all trading partners (TPI), trading
partners in advanced (TPI-A) and developing
countries (TPI-D) as the real effective exchange
rate (REER) index of the peso increased by
2.6 percent, 2.7 percent, and 2.5 percent,
respectively, relative to the fourth quarter of 2015.
These developed mainly on account of widening
50
GIR stood at US$81.9 billion as of end-February 2016
(revised).
51 Based on the last done deal transaction in the afternoon.
52 The coefficient of variation is computed as the standard
deviation of the daily closing exchange rate divided by the
average exchange rates for the period.

Q1 2016 Inflation Report | | | | 27272727
inflation differential which more than offset the
nominal depreciation of the peso against these
currency baskets.53,54
Relative to the first quarter of 2015, the peso
gained external price competitiveness against the
TPI, TPI-A, and TPI-D baskets for the period
January to February 2016. These developed as the
nominal depreciation of the peso which offset the
impact of widening inflation differential led to the
decrease in the REER index of the peso by
2.7 percent, 5.1 percent, and 0.9 percent against
the TPI, TPI-A, and TPI-D baskets, respectively.
53
The Trading Partners Index (TPI) measures the nominal and
real effective exchange rates of the peso across the currencies
of 14 major trading partners of the Philippines, which includes
US, Euro Area, Japan, Australia, China, Singapore, South Korea,
Hong Kong, Malaysia, Taiwan, Indonesia, Saudi Arabia, United
Arab Emirates, and Thailand. The TPI-Advanced measures the
effective exchange rates of the peso across currencies of
trading partners in advanced countries comprising of the US,
Japan, Euro Area, and Australia. The TPI-Developing measures
the effective exchange rates of the peso across 10 currencies of
partner developing countries which includes China, Singapore,
South Korea, Hong Kong, Malaysia, Taiwan, Indonesia, Saudi
Arabia, United Arab Emirates, and Thailand. 54
The REER index represents the Nominal Effective Exchange
Rate (NEER) index of the peso, adjusted for inflation rate
differentials with the countries whose currencies comprise the
NEER index basket. A decrease in the REER index indicates
some gain in the external price competitiveness of the peso,
while a significant increase indicates the opposite. The NEER
index, meanwhile, represents the weighted average exchange
rate of the peso vis-à-vis a basket of foreign currencies.

Q1 2016 Inflation Report | | | | 28282828
III. Fiscal developments
The National Government (NG) recorded a deficit
of P121.7 billion in 2015, 66.0 percent higher than
what was incurred in 2014. Nevertheless, the NG’s
2015 shortfall was 57.0 percent lower than the
programmed deficit of P283.7 billion for the year.
NG posts higher deficit in 2015
Consequently, the lower expenditure propped up
the primary surplus, which is net of interest
payments, to reach P187.7 billion or 140.0 percent
higher than the target.
Table 15. National Government Fiscal
Performance
in billion pesos
Growth Rate
Jan-Dec Jan-Dec (in percent)
Surplus/(Deficit) -73.1 -121.7 66
Revenues 1,908.5 2,109.0 11
Expenditures 1,981.6 2,230.6 13
* Tota ls may not add up due to rounding
Source: BTr
2014 2015
Revenues increased by 11.0 percent to
P2,109.0 billion in 2015 compared to
P1,908.5 billion in 2014, due largely to higher
revenues from other offices. This was however
7.0 percent below the 2015 target. The Bureau of
Internal Revenue continued to be the primary
revenue collecting agency of the NG, contributing
P1,433.3 billion, which was 7 percent higher than a
year ago, but fell short of its target by
14.0 percent. Income from other offices, which
include the Coco Levy Fund and the Cavite-Laguna
Expressway Project, grew by 78.0 percent to reach
P198.1 billion which is 90.0 percent higher than
target. Similarly, the Bureau of the Treasury
contributed P110.0 billion representing an
18.0 percent increase compared to its level a year
ago, and surpassed the target by 81.0 percent.
Meanwhile, income from the Bureau of Customs
fell slightly by 0.5 percent to P367.5 billion, falling
short of the program by 14.0 percent.
Expenditures for 2015 amounted to
P2,230.6 billion, 13.0 percent higher than the total
spending recorded in 2014. However, this was
13.0 percent lower than the disbursement
program for the year. Excluding interest payments,
expenditures went up by 16.0 percent from the
year-ago level to P1,921.3 billion, which is
13.0 percent lower than programmed. Meanwhile,
interest payments reached P309.4 billion in 2015,
P11.8 billion lower compared to its year-ago level.
This was 14.0 percent lower than the target.
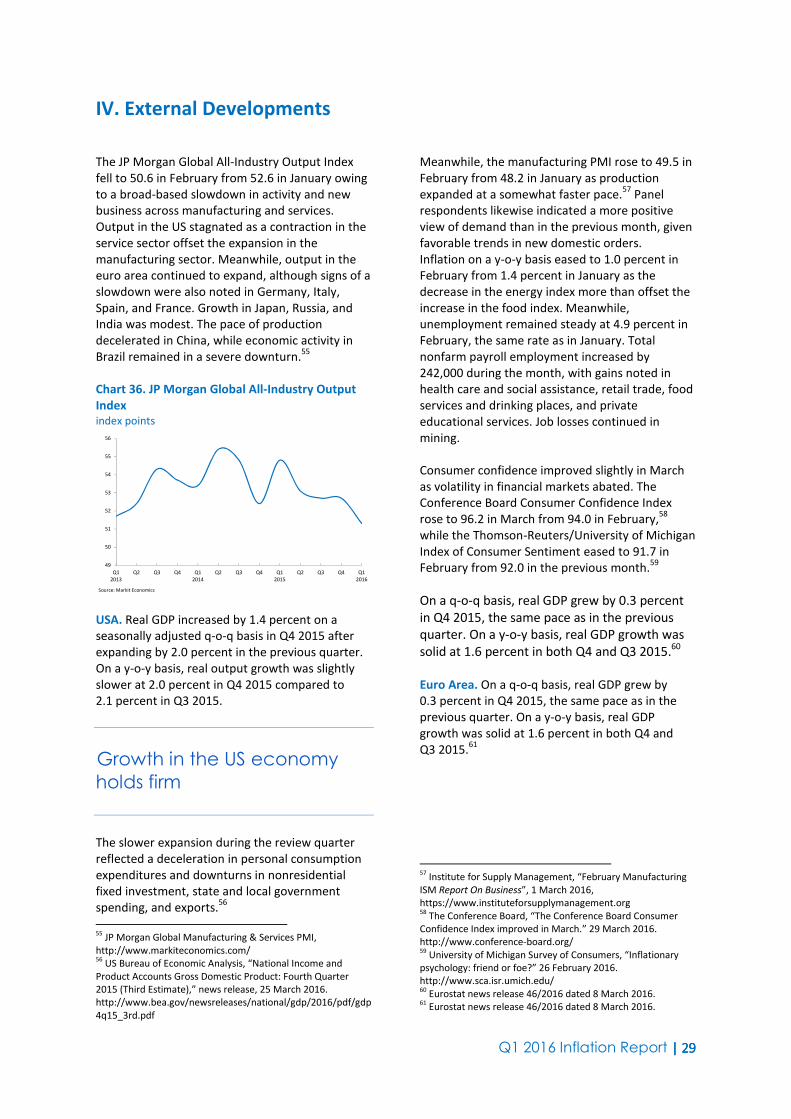
Q1 2016 Inflation Report | | | | 29292929
IV. External Developments
The JP Morgan Global All-Industry Output Index
fell to 50.6 in February from 52.6 in January owing
to a broad-based slowdown in activity and new
business across manufacturing and services.
Output in the US stagnated as a contraction in the
service sector offset the expansion in the
manufacturing sector. Meanwhile, output in the
euro area continued to expand, although signs of a
slowdown were also noted in Germany, Italy,
Spain, and France. Growth in Japan, Russia, and
India was modest. The pace of production
decelerated in China, while economic activity in
Brazil remained in a severe downturn.55
Chart 36. JP Morgan Global All-Industry Output
Index
index points
49
50
51
52
53
54
55
56
Q1
2013
Q2 Q3 Q4 Q1
2014
Q2 Q3 Q4 Q1
2015
Q2 Q3 Q4 Q1
2016
Source: Markit Economics
USA. Real GDP increased by 1.4 percent on a
seasonally adjusted q-o-q basis in Q4 2015 after
expanding by 2.0 percent in the previous quarter.
On a y-o-y basis, real output growth was slightly
slower at 2.0 percent in Q4 2015 compared to
2.1 percent in Q3 2015.
Growth in the US economy
holds firm
The slower expansion during the review quarter
reflected a deceleration in personal consumption
expenditures and downturns in nonresidential
fixed investment, state and local government
spending, and exports.56
55
JP Morgan Global Manufacturing & Services PMI,
http://www.markiteconomics.com/ 56
US Bureau of Economic Analysis, “National Income and
Product Accounts Gross Domestic Product: Fourth Quarter
2015 (Third Estimate),” news release, 25 March 2016.
http://www.bea.gov/newsreleases/national/gdp/2016/pdf/gdp
4q15_3rd.pdf
Meanwhile, the manufacturing PMI rose to 49.5 in
February from 48.2 in January as production
expanded at a somewhat faster pace.57
Panel
respondents likewise indicated a more positive
view of demand than in the previous month, given
favorable trends in new domestic orders.
Inflation on a y-o-y basis eased to 1.0 percent in
February from 1.4 percent in January as the
decrease in the energy index more than offset the
increase in the food index. Meanwhile,
unemployment remained steady at 4.9 percent in
February, the same rate as in January. Total
nonfarm payroll employment increased by
242,000 during the month, with gains noted in
health care and social assistance, retail trade, food
services and drinking places, and private
educational services. Job losses continued in
mining.
Consumer confidence improved slightly in March
as volatility in financial markets abated. The
Conference Board Consumer Confidence Index
rose to 96.2 in March from 94.0 in February,58
while the Thomson-Reuters/University of Michigan
Index of Consumer Sentiment eased to 91.7 in
February from 92.0 in the previous month.59
On a q-o-q basis, real GDP grew by 0.3 percent
in Q4 2015, the same pace as in the previous
quarter. On a y-o-y basis, real GDP growth was
solid at 1.6 percent in both Q4 and Q3 2015.60
Euro Area. On a q-o-q basis, real GDP grew by
0.3 percent in Q4 2015, the same pace as in the
previous quarter. On a y-o-y basis, real GDP
growth was solid at 1.6 percent in both Q4 and
Q3 2015.61
57
Institute for Supply Management, “February Manufacturing
ISM Report On Business”, 1 March 2016,
https://www.instituteforsupplymanagement.org 58
The Conference Board, “The Conference Board Consumer
Confidence Index improved in March.” 29 March 2016.
http://www.conference-board.org/ 59
University of Michigan Survey of Consumers, “Inflationary
psychology: friend or foe?” 26 February 2016.
http://www.sca.isr.umich.edu/ 60
Eurostat news release 46/2016 dated 8 March 2016. 61
Eurostat news release 46/2016 dated 8 March 2016.

Q1 2016 Inflation Report | | | | 30303030
Economic activity in the euro
area regains some
momentum
Meanwhile, the composite PMI for the euro area
rose to 53.7 in March from 53.0 in February as
new orders in both the manufacturing and service
sectors increased marginally.62
The seasonally adjusted unemployment rate
declined from 10.4 percent in December 2015 to
10.3 percent in January 2016, the lowest since
August 2011.63
Meanwhile, inflation declined to
-0.2 percent in February from 0.3 percent in
January, as the energy index decreased further
during the month.64
The European Commission’s Economic Sentiment
Indicator for the euro area declined to 103.0 in
March from 103.9 in the previous month owing to
weaker confidence among managers in the
services and construction sectors. Consumer
confidence likewise dipped on households’ less
favorable assessment of general economic
conditions.65
Japan. On a q-o-q basis, real GDP decreased by
0.3 percent in Q4 2015 after increasing by
0.3 percent in the previous quarter.
Manufacturing activity in
Japan slows down
Meanwhile, real GDP expanded by 0.7 percent
y-o-y in Q4 2015 following the 1.7-percent
increase in Q3 2015.66
The y-o-y expansion reflects
the modest recovery of the Japanese economy,
although exports and production have been
tempered by the slowdown in emerging
economies. Meanwhile, the seasonally adjusted
manufacturing PMI fell to 49.1 in March from
50.1 in the previous month. Production growth
62
Markit Flash Eurozone PMI,
http://www.markiteconomics.com/ 63
Eurostat news release 41/2016 dated 1 March 2016. 64
Eurostat news release 40/2016 dated 29 February 2016. 65
European Commission. http://ec.europa.eu/ 66
Department of National Accounts, Economic and Social
Research Institute, Cabinet Office. http://www.esri.cao.go.jp/
decelerated due to a drop in total new orders,
reflecting the decline in international orders
particularly from China and Taiwan.67
Inflation rose to 0.3 percent in February from nil in
January, while the seasonally adjusted
unemployment rate increased slightly to
3.3 percent in February 2016 from 3.2 percent a
month earlier.
China. Real GDP grew by 6.8 percent y-o-y in
Q4 2015, bringing full-year average growth to
6.9 percent. Agricultural production showed
steady growth, while investment in fixed assets
slowed down.
The seasonally adjusted manufacturing PMI rose
to 49.7 in March from 48.0 a month earlier,
indicating a slight improvement in manufacturing
output as new domestic orders increased
marginally.68
Indicators continue to point to
subdued Chinese economic
activity
Inflation rose to 2.3 percent in February from
1.8 percent a month earlier. The prices of food,
particularly fresh vegetables and pork, drove
inflation.
India. Real GDP increased by 7.3 percent y-o-y in
Q4 2015, slower than the 7.7-percent expansion in
the previous quarter, with mining, utilities, and
construction posting slower growths during the
quarter compared to the same period a year ago.69
Output growth in India softens
Meanwhile, the composite PMI decreased to
51.2 in February from 53.3 in January, reflecting a
slower intake of new business in both the
manufacturing and service sectors.
67
Nikkei Japan Manufacturing PMI,
http://www.markiteconomics.com/ 68
Caixin China General Manufacturing PMI,
http://www.markiteconomics.com/ 69
Central Statistics Office of India.
http://mospi.nic.in/Mospi_New/Site/home.aspx

Q1 2016 Inflation Report | | | | 31313131
Inflation based on the consumer price index (CPI)
decreased to 5.2 percent in February from 5.7
percent in January.
Policy Actions by Central Banks. Bank Indonesia
reduced its BI rate by 25 bps each in January,
February, and March in line with its previous
moves to ease macroprudential policy and lower
primary reserves in rupiah to further support the
domestic economy amid a more benign inflation
environment. In addition, following the reduction
in reserve requirements in December 2015, Bank
Indonesia lowered primary reserve requirements
anew by 100 bps in March.
In February, Bank Negara Malaysia cut its statutory
reserve requirement (SRR) ratio by 50 bps from
4.0 percent to 3.5 percent to ensure sufficient
liquidity in the domestic financial system and to
support the banking system amid net external
outflows. Meanwhile, the Bank of Japan
introduced a program of “quantitative and
qualitative monetary easing (QQE) with negative
interest rate” in order to achieve its price stability
target of 2 percent.
A number of central banks
ease their monetary policy
settings
In March, the Reserve Bank of New Zealand cut its
official cash rate by 25 bps, citing evidence of a
material decline in long-run inflation expectations.
Similarly, the Central Bank of the Republic of China
(Taiwan) reduced its key policy rates by 12.5 bps to
promote financial stability as well as to stimulate
the domestic economy.
The European Central Bank (ECB) decided to ease
further its policy settings by reducing ECB interest
rates, expanding its asset purchase programme,
and implementing other measures to stem the
increasing risks to ECB’s price stability mandate.
Interest rates on the main refinancing operations
and marginal lending facility were lowered by 5
bps each, while the interest rate on the deposit
facility was reduced further into negative territory
with another 10 bps cut.
Meanwhile, the People’s Bank of China decided to
cut its reserve requirement ratio by 50 bps to
17 percent, in line with its efforts to stabilize
growth and manage capital outflows.

Q1 2016 Inflation Report | | | | 32323232
V. Monetary Policy Developments
During its monetary policy meetings on
11 February and 23 March, the BSP decided to
maintain its key policy interest rates at 4.0 percent
for the overnight borrowing or RRP facility and
6.0 percent for the overnight lending or RP facility.
The interest rates on term RRPs, RPs, and SDAs
were also kept steady. Similarly, the reserve
requirement ratios were left unchanged.
The BSP maintains monetary
policy settings in Q1 2016
The BSP’s assessment of a manageable inflation
outlook and robust growth conditions continue to
support steady monetary policy settings. Latest
forecasts indicate that average inflation is likely to
settle within the target range of 3.0 percent ± 1
percentage point for 2016-2017, while inflation
expectations continue to be firmly anchored
within the inflation target band over the policy
horizon. The BSP also noted that the risks
surrounding the inflation outlook have shifted
slightly to the downside. Downward price
pressures could arise from slower-than-expected
global economic activity and potential
second-round effects from lower international oil
prices. Meanwhile, upside risks to the inflation
outlook persist, particularly those that could
emanate from the impact of El Niño dry weather
conditions on food prices and utility rates as well
as pending petitions for power rate adjustments.
The BSP observed that domestic demand
conditions are likely to stay firm, supported by
solid private household and capital spending,
buoyant business sentiment, and adequate credit
and domestic liquidity. The BSP also recognized
that uncertainty over economic growth prospects
across the globe could continue to drive volatility
in global financial markets.
Chart 37. BSP Policy Rates
in percent
0
1
2
3
4
5
6
7
Jan
20
12
Fe
bM
ar
Ap
rM
ay
Jun
Jul
Au
gS
ep
Oct
No
vD
ec
Jan
20
13
Fe
bM
ar
Ap
rM
ay
Jun
Jul
Au
gS
ep
Oct
No
vD
ec
Jan
20
14
Fe
bM
ar
Ap
rM
ay
Jun
Jul
Au
gS
ep
Oct
No
vD
ec
Jan
20
15
Fe
bM
ar
Ap
rM
ay
Jun
Jul
Au
gS
ep
Oct
No
vD
ec
Overnight RRP Rate Overnight RP rate SDA rate
Source: BSP
Given these considerations, the BSP affirmed the
need to keep a watchful eye over domestic and
external developments to ensure that the
monetary policy stance remains in line with the
BSP’s price and financial stability objectives.

Q1 2016 Inflation Report | | | | 33333333
VI. Inflation Outlook
BSP Inflation Forecasts70
Inflation is expected to remain manageable over
the policy horizon. The latest BSP baseline
forecasts show that inflation could settle at the
low-end of the government’s target range of
3.0 percent ± 1.0 percentage point for 2016 and
approach the midpoint of the target in 2017.
Inflation is expected to follow
a manageable and target-
consistent path over the
policy horizon
The inflation projections for the current forecast
round are lower compared to the previous
quarter’s forecast due mainly to the
lower-than-projected inflation outturns in recent
months, further decline in global crude oil prices
as well as rollback in transport fares.
Demand Conditions. Key demand indicators
support the view of continued vigor in domestic
real sector activity. The domestic economy grew to
post a 6.3-percent expansion in Q4 2015 from
6.1 percent in the previous quarter. The strong
Q4 2015 economic performance was driven mainly
by steady private consumption, sustained capital
formation, and robust government spending. This
brought the full-year output growth to 5.8 percent
from 6.1 percent in 2014.
Looking ahead, prospects for the domestic
economy continue to remain favorable. GDP
expansion in the first half of 2016 could continue
to pick up due to stronger growth in
manufacturing and public sector construction.
The government has identified expenditure
measures to address the lag in disbursements and
avoid underspending. The national and local
elections could likewise provide a temporary boost
to growth in 2016. Private demand is likewise
70
The inflation forecast path in this report refers to the
forecasts presented during the 17 December 2015 Monetary
Policy Meeting. In the discussion, these forecasts are compared
to the forecasts presented in the Q3 Inflation Report (or the
forecasts during the 24 September 2015 Monetary Policy
Meeting).
expected to remain firm, aided mainly by
sustained remittance inflows and low inflation.
Private capital formation should also contribute to
economic growth with construction and
investments in durable equipment expected to remain solid, particularly as more Public-Private
Partnership (PPP) projects get underway.
Other real sector indicators likewise point to firm
growth prospect in the near term. Production
indices for the manufacturing sector suggest
continued expansion with more than half of all
major manufacturing sectors operating above
80 percent of their capacity. The composite PMI
also remains above the 50-point mark at 52.8 in
January 2016. There have also been improvements
in labor market conditions with the
unemployment rate lower compared to a year
ago, based on the results of the January 2016
Labor Force Survey (LFS).
The favorable economic outlook has also been
reflected in the results of the BSP expectations
surveys as sentiment of businesses and
households appeared to be buoyant. In particular,
households’ and firms’ expectations for Q2 2016
are upbeat, broadly in line with the expectation of
brisker operations during the election period as
well as anticipated pick-up in the economic activity during the summer season.
Supply Conditions. Commodity prices are likely to
remain subdued, reflecting ample supply
conditions. Food inflation is likely to remain benign
over the near term given prospects of favorable
harvest of key agricultural commodities.
Favorable supply prospects
point to manageable inflation
environment over the policy
horizon
International oil prices are also likely to remain
below 2015 levels as suggested by futures prices of
oil and forecasts by multilateral agencies, with
projected modest gains over the medium term.
Global agricultural prices are expected to decline
in 2016 and could remain at moderate levels over

Q1 2016 Inflation Report | | | | 34343434
the medium term. Forecasts by the IMF and the
World Bank suggest a continued decline in
benchmark prices of key grains (wheat, maize, and
rice) in 2016. Despite the ongoing El Niño weather
phenomenon, ample global supply should keep
food price pressures at bay. 71,72
In the domestic front, first quarter palay and corn
production could contract by 5.0 percent and
6.5 percent, respectively, due primarily to
insufficient rainfall and dry spells brought about by
the El Niño weather condition. By contrast, palay
and corn production in Q2 2016 is expected to
increase by 2.4 percent and 14.7 percent,
respectively, based on farmers’ planting
intentions. 73
The latest assessment of the Philippine
Atmospheric, Geophysical and Astronomical
Services Administration (PAGASA) showed that the
ongoing El Niño phenomenon could last until
1H 2016. The slightly warmer average temperature
and significant reduction in rainfall could result in
moderate to severe drought conditions over the
forecast horizon. Further intensification of El Niño
conditions could provide upside pressures on the
prices of agricultural commodities and utilities.
Table 16. Forecast Probabilities of El Niño
Southern Oscillation (ENSO) Events
as of 10 March 2016
Season La Niña Neutral El Niño
2016
Feb-Apr 0% 1% 99%
Mar-May 0% 3% 97%
Apr-Jun 1% 25% 74%
May-Jul 9% 51% 40%
Jun-Aug 32% 49% 19%
Jul-Sep 43% 43% 14%
Aug-Oct 50% 38% 12%
Sep-Nov 54% 35% 11%
Oct-Dec 57% 33% 10%
Note: Optional cropping period and summer harvest
are during Q1 and Q2, respectively.
Source: International Research Institute for Climate
and Society and Climate Prediction Center
To help mitigate the impact of El Niño on
agricultural production, the Department of
Agriculture (DA) has activated its National El Niño
Task Force to coordinate the various response
measures. These programs include cloud seeding
71
IMF, Commodity Price Outlook and Risks, February 2016,
available online at http://www.imf.org 72
World Bank, Commodity Markets Outlook, January 2016,
available online at http://www.worldbank.org 73
PSA, Rice and Corn Situation Outlook, January 2016, available
online at http://www.agstat.psa.gov.ph
operations, installation of alterative irrigation
systems, crop rotation, the use of hybrid crop
varieties, and other government assistance for
farmers. Furthermore, the national government
has approved additional rice import for 2016 to
ensure that existing inventory levels remain
sufficient to meet national requirements.
Similarly, international oil prices fell further
compared to the previous quarter’s level. The
decline in crude oil prices could be traced to a
combination of ample supply and sluggish
demand.
Forecast by the EIA suggests that Brent crude oil
price could average at US$34.28 per barrel in
2016. Meanwhile, IMF and World Bank expect
crude oil prices to average at US$34.75 per barrel
and US$37.00 per barrel in 2016, respectively.
However, there remains substantial uncertainty in
the global oil price outlook. On the one hand,
world oil supply could continue to outstrip
demand in the near term given firm supply from
OPEC countries, the impact of Iran’s additional
production with its re-entry in the global oil
market, combined with weak demand growth. On
the other hand, agreement between several OPEC
and major non-OPEC producers, such as Russia, to
freeze production levels and the accelerating pace
in the reduction of US rig counts could support a
recovery in global crude oil prices. 74,75
Key assumptions used to generate the BSP’s
inflation forecasts. The BSP's baseline inflation
forecasts generated from the BSP’s single equation
model (SEM) and the multi-equation model (MEM)
are based on the following assumptions:
1) BSP’s overnight RRP rate at 4.00 percent from
March 2016 to December 2017;
2) BSP’s reserve requirement at 20.0 percent
from March 2016 to December 2017;
3) NG fiscal deficits for 2016 to 2017, which are
consistent with the DBCC-approved estimates;
4) Dubai crude oil price assumptions, the trend
of which is consistent with the trend of futures
prices of oil in the international market;
74
IMF, Commodity Price Outlook and Risks, 10 February 2016,
available online at http://www.imf.org 75
EIA, Short-Term Energy Outlook, 8 March 2016, available
online at http://www.eia.gov
Q1 2016 Inflation Report | | | | 35353535
5) Increase in nominal wage in July 2016 and
July 2017 based on historical wage increases;
6) Real GDP growth is endogenously
determined in the BSP’s MEM; and
7) Foreign exchange rate is endogenously
determined in the BSP’s MEM through the
purchasing power parity and interest rate parity
relationships.
Risks to the Inflation Outlook
The risks to the inflation outlook may be presented
graphically through a fan chart. The fan chart
depicts the probability of different inflation
outcomes based on the central projection
(corresponding to the baseline forecast of the BSP)
and the risks surrounding the inflation outlook.
Compared with the previous
report, the latest projected
inflation path is lower for 2016
and 2017
Compared to the previous inflation report, the
latest fan chart presents a slight downward shift in
the inflation projections for 2016 and 2017. The
lower inflation projections for 2016 and 2017
reflected the continued decline in global crude oil
prices, lower-than-projected inflation outturns in
recent months, as well as the rollback in transport
fares.
The BSP’s review of current price trends suggests
that the risks surrounding the inflation outlook
appear to be on the downside. This assessment is
depicted in the latest fan chart wherein the
projection bands below the central projection are
wider than the bands above it. Slower global
economic activity and potential second-round
effects emanating from the sustained decline in
global oil prices pose downside risks. Meanwhile,
pending petitions for adjustments in electricity
rates and the impact on food and utility prices of
stronger-than-expected El Niño conditions are the
upside risks to inflation.
The possibility of a slower global economic growth
could imply weaker demand-related price
pressures as well as further uncertainties in the
global oil market. The rebalancing in China, further
decline in commodity prices, higher foreign
currency exposure of corporate balance sheets,
and capital flow reversals due to disruptive asset
price shifts related to the normalization in US Fed
policy rates are potential sources of downside risks
to global growth prospects.76
The second-round effects of lower oil prices could
come in the form of further reductions in transport
fares and lower prices of basic commodities.
Following the decline in diesel prices, the Land
Transportation Franchising and Regulatory Board
(LTFRB) approved the additional provisional
rollback in the minimum jeepney fares by ₱0.50
for Metro Manila, Regions 2 to 7 in February 2016.
Moreover, the LTFRB approved the permanent
reduction in the flagdown taxi fares from ₱40.00
to ₱30.00 in March 2016. In addition, several bus
operators in Metro Manila have volunteered to
reduce by ₱1.00 the minimum fares for regular
and air-conditioned buses. The continued decline
in global and domestic oil prices could lead to
reductions in transport fares in other regions.
At the same time, the DTI has proposed for a
rollback in the suggested retail prices (SRP) of
basic goods due to lower transportation and
distribution costs of manufacturers brought about
by the decline in oil prices. This includes bread,
canned sardines, milk, coffee, noodles, bottled
water, processed meat, condiments, and batteries.
The risks to inflation outlook
appear to be on the
downside
Meanwhile, the intensification of the El Niño
weather disturbance could adversely affect
domestic food production as well as power and
water supply. The said weather condition is
expected to manifest as both drier-than-normal
weather conditions and stronger-than-usual
typhoons, which could impact negatively the
agricultural production, ultimately posing a risk to
food prices. Similarly, the El Niño weather
phenomenon could lower the output of
hydro-powered generation plants and
consequently raise the cost of electricity and
water.
76
IMF, World Economic Outlook, January 2016, available online
at http://www.imf.org

Q1 2016 Inflation Report | | | | 36363636
The pending petition of Meralco on the December
2013 rate adjustment, which is still under the
temporary restraining order of the Supreme Court,
also continues to pose an upside risk to the
inflation outlook.
Chart 38. Inflation Projection
Source: BSP estimates
The fan chart shows the probability of various
outcomes for inflation over the forecast horizon.
The darkest band depicts the central projection,
which corresponds to the BSP’s baseline inflation
forecast. It covers 25 percent of the probability
distribution. Each successive pair of bands is
drawn to cover a further 25 percent of probability,
until 75 percent of the probability distribution is
covered. Lastly, the lightest band covers the lower
and upper90 percent of the probability
distribution. The bands widen (i.e., “fan out”) as
the time frame is extended, indicating increasing
uncertainty about outcomes. The band in wire
mesh depicts the inflation profile in the previous
report.
The shaded area, which measures the range of
uncertainty, is based on the forecast errors from
the past years. In greater detail, it can be
enhanced by adjusting the level of skewness of the
downside and upside shocks that could affect the
inflationary process over the next two years in
order to change the balance of the probability area
lying above or below the central projection.
As of 17 December 2015 Monetary Board Meeting
As of 23 March 2016 Monetary Board Meeting

Q1 2016 Inflation Report | | | | 37373737
VII. Implications for the Monetary Policy Stance
The latest baseline inflation forecasts show that
inflation could move close to the 3.0 percent
± 1.0 ppt inflation target range for 2016-2017.
The downward shift in the forecasted inflation
path for 2016 is due mainly to lower global crude
oil prices. Meanwhile, the slightly higher inflation
forecast for 2017 reflected a weaker peso.
Average inflation is projected
to return gradually to the
inflation target range over the
policy horizon
Potential adjustments in electricity rates given
pending petitions and the impact of prolonged
El Niño dry weather conditions are seen as the key
upside risks to inflation. Meanwhile, the ongoing
weakness in the global economy could provide
downside risk to inflation.
Inflation expectations remain well-anchored over
the policy horizon. Consistent with the BSP’s
inflation outlook, mean inflation forecasts based
on December 2015 surveys of private sector
economists have remained within the inflation
target range in 2016-2017 while settling below the
lower bound of the target range for 2015..
Headline inflation averaged higher in Q4 2015 at
1.0 percent from 0.6 percent in the previous
quarter as prices of some food items went up due
to decreasing supply caused by the recent
typhoons that visited the country. Likewise,
non-food inflation edged higher as prices of
service-related CPI components accelerated during
the quarter.
The Philippine economy grew by 6.0 percent in the
third quarter, an improvement from the 5.8
percent growth in the previous quarter and from
5.5 percent in Q3 2014.
This brought year-to-date growth to 5.6 percent,
albeit still below the government’s growth target
of 7-8 percent. Strong domestic demand fueled
output growth, led by significant improvement in
government spending, solid household
consumption, and higher capital formation.
On the supply side, growth was driven by the
services sector while growth in the industry
sector was supported by manufacturing.
Consistent with these developments, other
indicators continue to point to positive growth
momentum. Business outlook on the economy
turned more upbeat for Q4 2015, with the overall
confidence index (CI) rising to 51.3 percent—the
highest in two years. Business outlook also remain
positive for Q1 2016 at 43.9 percent albeit lower
due to the typical slowdown in demand after the
holiday season, concerns over the adverse effects
of El Niño, and uncertainties in the global
economy. Meanwhile, consumers’ outlook
improved for Q4 2015 as the overall confidence
index (CI) turned less negative (from -11.6 percent
to -8.1 percent) for Q3 2015. For the next quarter
(Q1 2016), consumers’ optimism was sustained as
the CI was broadly steady while sentiment was
more favorable for the next 12 months.
Growth in the US economy holds firm while
economic activity in the euro area strengthen.
However, downturn in key emerging markets,
such as Brazil, China, and Russia, continues.
Domestic demand continues
to be firm while external
prospects remain uneven
Meanwhile, a number of central banks ease their
monetary policy settings in Q4 2015 to support
domestic economic activity and stave off
delfationary pressures, while the US Fed decides
to raise interest rates.
Notwithstanding below-target inflation for 2015,
inflation dynamics are expected to gather some
momentum in 2016 but will remain manageable
given well-contained inflation expectations over
the policy horizon.

Q1 2016 Inflation Report | | | | 38383838
Current monetary policy
settings remain appropriate
Moreover, latest baseline inflation forecasts
extending to 2017 show that annual average
inflation is likely to settle within the target range.
This outlook serves as the key argument for
maintaining the BSP’s monetary policy settings.
At the same time, firm demand-side conditions
suggest that current monetary policy settings are
appropriately calibrated with minimal deflationary
risks. Thus, the economy does not need further
monetary stimulus given the still ample liquidity in
the system, sustained credit expansion and
increased fiscal spending. Keeping a steady hand
on policy levers remains prudent given the
challenging global economic environment and to
better gauge the impact of the US Fed
normalization. Over the period ahead, emerging
market economies (EMEs) could face the challenge
of potential capital flow reversals and renewed
volatility in financial markets. Keeping policy
settings unchanged will allow authorities to
consider further information on economic and
financial conditions, and provide flexibility in
responding to future monetary policy challenges
resulting from the critical early stages of policy
normalization in the US.
On balance, the BSP is of the view that current
monetary policy settings remain appropriately
calibrated. Going forward, the BSP will continue
to monitor domestic and external developments
to ensure that the monetary policy stance
remains consistent with its price and financial
stability objectives.

Q1 2016 Inflation Report | | | | 39
Summary of Monetary Policy Decisions
Effectivity Date
Levels (in percent)
Monetary Policy Decisions RRP
Overnight
RP
Overnight
2 0 0 8
31 Jan 2008 5.00 7.00
The Monetary Board (MB) decided to reduce by 25 basis
points (bps) the BSP’s key policy interest rates to 5 percent
for the overnight borrowing or reverse repurchase (RRP)
facility and 7 percent for the overnight lending or repurchase
(RP) facility. The interest rates on term RRPs, RPs, and special
deposit accounts (SDAs) were also reduced accordingly. In its
assessment of macroeconomic conditions, the MB noted
that the latest inflation forecasts indicated that inflation
would fall within the 4.0 percent ± 1 percentage point
target range in 2008 and the 3.5 ± 1 percentage point target
range in 2009.
13 Mar 2008 5.00 7.00
The MB decided to keep the BSP’s key policy interest rates at
5 percent for the overnight borrowing or RRP facility and
7 percent for the overnight lending or RP facility. The MB also
decided to implement immediately the following refinements
in the SDA facility: (1) the closure of existing windows for the
two-, three-, and six-month tenors; and (2) the reduction of
the interest rates on the remaining tenors. The interest rates
on term RRPs and RPs were also left unchanged.
24 Apr 2008 5.00 7.00
The MB kept the BSP’s key policy interest rates at
5.0 percent for the overnight borrowing or RRP facility
and 7.0 percent for the overnight lending or RP facility.
The interest rates on term RRPs and RPs were also left
unchanged.
5 Jun 2008 5.25 7.25
The MB decided to increase by 25 bps the BSP’s key
policy interest rates to 5.25 percent for the RRP facility
and 7.25 percent for RP facility as emerging baseline
forecasts indicate a likely breach of the inflation target
for 2008 along with indications that supply-driven
pressures are beginning to feed into demand. Given the
early evidence of second-round effects, the MB
recognized the need to act promptly to rein in
inflationary expectations. The interest rates on term
RRPs, RPs, and SDAs were also increased accordingly.
17 Jul 2008 5.75 7.75
The MB increased by 50 bps the BSP’s key policy
interest rates to 5.75 percent for the overnight
borrowing or RRP facility and 7.75 percent for the
overnight lending or RP facility. The interest rates on
term RRPs, RPs, and SDAs were also increased
accordingly.
28 Aug 2008 6.00 8.00
The MB increased by 25 bps the BSP’s key policy
interest rates to 6.0 percent for the overnight
borrowing or reverse repurchase (RRP) facility and
8.0 percent for the overnight lending or repurchase
(RP) facility. The interest rates on term RRPs, RPs, and
SDAs were also increased accordingly.

Q1 2016 Inflation Report | | | | 40
Summary of Monetary Policy Decisions
Effectivity Date
Levels (in percent)
Monetary Policy Decisions RRP
Overnight
RP
Overnight
6 Oct 2008 6.00 8.00
The MB kept the BSP’s key policy interest rates
unchanged at 6.0 percent for RRP facility and
8.0 percent for the RP facility. The interest rates on
term RRPs, RPs, and SDAs were also left unchanged.
6 Nov 2008 6.00 8.00
The MB decided to keep the BSP’s key policy interest
rates steady at 6 percent for the overnight borrowing
or RRP facility and 8 percent for the overnight lending
or RP facility. The interest rates on term RRPs, RPs,
and SDAs were also left unchanged.
18 Dec 2008 5.50 7.50
The MB decided to reduce the BSP’s key policy interest rates
by 50 bps to 5.5 percent for the overnight borrowing or RRP
facility and 7.5 percent for the overnight lending or RP facility.
The interest rates on term RRPs, RPs, and SDAs were also
adjusted accordingly. Latest baseline forecasts showed a
decelerating inflation path over the policy horizon, with
inflation falling within target by 2010. This outlook is
supported by the downward shift in the balance of risks,
following the easing of commodity prices, the moderation in
inflation expectations, and the expected slowdown in
economic activity.
2 0 0 9
29 Jan 2009 5.00 7.00
The MB decided to reduce the BSP’s key policy interest rates
by another 50 bps to 5 percent for the overnight borrowing or
RRP facility and 7 percent for the overnight lending or RP
facility. The interest rates on term RRPs, RPs, and SDAs were
also adjusted accordingly. Latest baseline forecasts showed a
decelerating inflation path over the policy horizon, with
inflation falling within target by 2010. The MB based its
decision on the latest inflation outlook which shows inflation
falling within the target range for 2009 and 2010. The Board
noted that the balance of risks to inflation is tilted to the
downside due to the softening prices of commodities, the
slowdown in core inflation, significantly lower inflation
expectations, and moderating demand.
5 Mar 2009 4.75 6.75
The MB decided to reduce the BSP’s key policy interest rates
by 25 bps to 4.75 percent for the overnight borrowing or RRP
facility and 6.75 percent for the overnight lending or RP
facility. The interest rates on term RRPs, RPs, and SDAs were
also reduced accordingly. Given possible upside risks to
inflation, notably the volatility in oil prices and in exchange
rates, increases in utility rates, and potential price pressures
coming from some agricultural commodities, the MB decided
that a more measured adjustment of policy rates was needed.

Q1 2016 Inflation Report | | | | 41
Summary of Monetary Policy Decisions
Effectivity Date
Levels (in percent)
Monetary Policy Decisions RRP
Overnight
RP
Overnight
16 Apr 2009 4.50 6.50
The MB reduced key policy rates by another 25 bps to
4.5 percent for the overnight borrowing or RRP facility and
6.5 percent for the overnight lending or RP facility, effective
immediately. This rate cut brings the cumulative reduction in
the BSP’s key policy rates to 150 bps since December last
year. The current RRP rate is the lowest since 15 May 1992.
Meanwhile, the interest rates on term RRPs, RPs, and SDAs
were also reduced accordingly. In its assessment of
macroeconomic conditions, the MB noted that the latest
baseline inflation forecasts indicated a lower inflation path
over the policy horizon, with average inflation expected to
settle within the target ranges in 2009 and 2010. In addition,
the MB considered that the risks to inflation are skewed to
the downside given expectations of weaker global and
domestic demand conditions and a low probability of a
significant near-term recovery in commodity prices.
28 May 2009 4.25 6.25
The MB decided to reduce the BSP’s key policy interest rates
by another 25 bps to 4.25 percent for the overnight
borrowing or RRP facility and 6.25 percent for the overnight
lending or RP facility. The interest rates on term RRPs, RPs,
and SDAs were also reduced accordingly. Baseline forecasts
indicated a lower inflation path over the policy horizon, with
average inflation expected to settle within the target ranges
in 2009 and 2010. In addition, the Monetary Board
considered that, on balance, the risks to inflation are skewed
to the downside given expectations of weaker global and
domestic demand conditions and a low probability of a
significant near-term recovery in commodity prices.
9 Jul 2009 4.00 6.00
The MB decided to reduce the BSP's key policy interest rates
by 25 bps to 4 percent for the overnight borrowing or RRP
facility and 6 percent for the overnight lending or RP facility,
effective immediately. The interest rates on term RRPs, RPs,
and SDAs were reduced accordingly. This is the sixth time
since December 2008 that the BSP has cut its policy interest
rates.
20 Aug 2009
1 Oct 2009
5 Nov 2009
17 Dec 2009
4.00 6.00
The MB kept key policy rates unchanged at 4 percent for the
RRP facility and 6 percent for the overnight lending RP facility.
The decision to maintain the monetary policy stance comes
after a series of policy rate cuts since December 2008 totaling
200 bps and other liquidity enhancing measures.
2 0 1 0
28 Jan 2010
11 Mar 2010
22 Apr 2010
3 Jun 2010
15 Jul 2010
26 Aug 2010
7 Oct 2010
18 Nov 2010
29 Dec 2010
4.00 6.00
The MB decided to keep the BSP's key policy interest rates
steady at 4 percent for the RRP facility and 6 percent for the
RP facility. The interest rates on term RRPs, RPs, and SDAs
were also left unchanged.

Q1 2016 Inflation Report | | | | 42
Summary of Monetary Policy Decisions
Effectivity Date
Levels (in percent)
Monetary Policy Decisions RRP
Overnight
RP
Overnight
2 0 1 1
10 Feb 2011 4.00 6.00
The MB decided to keep the BSP’s key policy interest rates
steady at 4 percent for the overnight borrowing or RRP facility
and 6 percent for the overnight lending or RP facility. The
interest rates on term RRPs, RPs, and SDAs were also left
unchanged.
24 Mar 2011 4.25 6.25
The MB decided to increase by 25 bps the BSP’s key policy
interest rates to 4.25 percent for the overnight borrowing or
RRP facility and 6.25 percent for the overnight lending or RP
facility. The interest rates on term RRPs, RPs, and SDAs were
also raised accordingly. The MB’s decision was based on signs
of stronger and broadening inflation pressures as well as a
further upward shift in the balance of inflation risks.
International food and oil prices have continued to escalate
due to the combination of sustained strong global demand
and supply disruptions and constraints.
5 May 2011 4.50 6.50
The MB decided to increase the BSP’s key policy interest rates
by another 25 bps to 4.5 percent for the overnight borrowing
or RRP facility and 6.5 percent for the overnight lending or RP
facility. The interest rates on term RRPs, RPs, and SDAs were
also raised accordingly. Baseline inflation forecasts continue
to suggest that the 3-5 percent inflation target for 2011
remains at risk, mainly as a result of expected pressures from
oil prices.
16 Jun 2011 4.50 6.50
The MB decided to keep policy rates steady at 4.5 percent for
the overnight borrowing or RRP facility and 6.5 percent for
the overnight lending or RP facility. At the same time, the
Board decided to raise the reserve requirement on deposits
and deposit substitutes of all banks and non-banks with
quasi-banking functions by one percentage point effective on
Friday, 24 June 2011. The MB's decision to raise the reserve
requirement is a preemptive move to counter any additional
inflationary pressures from excess liquidity.
28 Jul 2011 4.50 6.50
The MB maintained the BSP's key policy interest rates at
4.5 percent for the overnight borrowing or RRP facility and
6.5 percent for the overnight lending or RP facility. At the
same time, the Board increased anew the reserve
requirement on deposits and deposit substitutes of all banks
and non-banks with quasi-banking functions by one
percentage point effective on 5 August 2011. The MB's
decision to raise the reserve requirement anew is a
forward-looking move to better manage liquidity.
8 Sep 2011
20 Oct 2011
1 Dec 2011
4.50 6.50 The MB decided to keep the overnight policy rates steady.
At the same time, the reserve requirement ratios were kept
unchanged.

Q1 2016 Inflation Report | | | | 43
Summary of Monetary Policy Decisions
Effectivity Date
Levels (in percent)
Monetary Policy Decisions RRP
Overnight
RP
Overnight
2 0 1 2
19 Jan 2012 4.25 6.25
The MB decided to reduce the BSP's key policy interest rates
by 25 bps to 4.25 percent for the overnight borrowing or RRP
facility and 6.25 percent for the overnight lending or RP
facility. The interest rates on term RRPs, RPs, and SDAs were
also reduced accordingly The MB's decision is based on its
assessment that the inflation outlook remains comfortably
within the target range, with expectations well-anchored and
as such, allowed some scope for a reduction in policy rates to
help boost economic activity and support market confidence.
1 Mar 2012 4.00 6.00
The MB decided to reduce the BSP's key policy interest rates
by another 25 bps to 4.0 percent for the overnight borrowing
or RRP facility and 6.0 percent for the overnight lending or RP
facility. The interest rates on term RRPs, RPs, and SDAs were
also reduced accordingly. The MB is of the view that the
benign inflation outlook has allowed further scope for a
measured reduction in policy rates to support economic
activity and reinforce confidence.
19 Apr 2012 4.00 6.00
The MB decided to keep the BSP’s key policy interest rates
steady at 4 percent for the overnight borrowing or RRP facility
and 6 percent for the overnight lending or RP facility. The
interest rates on term RRPs, RPs, and SDAs were also left
unchanged.
14 Jun 2012 4.00 6.00
The MB decided to keep the BSP’s key policy interest rates
steady at 4 percent for the overnight borrowing or RRP facility
and 6 percent for the overnight lending or RP facility. The
interest rates on term RRPs, RPs, and SDAs were also left
unchanged. The MB’s decision was based on its assessment
that the inflation environment remains manageable. Baseline
forecasts continue to track the lower half of the 3-5 percent
target range for 2012 and 2013, while inflation expectations
remain firmly anchored. At the same time, domestic
macroeconomic readings have improved significantly in
Q1 2012.
26 Jul 2012 3.75 5.75
The MB decided to reduce the BSP’s key policy interest rates
by 25 bps to 3.75 percent for the overnight borrowing or RRP
facility and 5.75 percent for the overnight lending or RP
facility. The interest rates on term RRPs, RPs, and SDAs were
also reduced accordingly. This is the third time in 2012 that
the BSP has cut its policy rates. The MB’s decision was based
on its assessment that price pressures have been receding,
with risks to the inflation outlook slightly skewed to the
downside. Baseline forecasts indicate that inflation is likely to
settle within the lower half of the 3-5 percent target for 2012
and 2013, as pressures on global commodity prices are seen
to continue to abate amid weaker global growth prospects. At
the same time, the MB is of the view that prospects for global
economic activity are likely to remain weak.
13 SEP 2012 3.75 5.75
The MB decided to keep the BSP’s key policy interest rates
steady at 3.75 percent for the overnight borrowing or RRP
facility and 5.75 percent for the overnight lending or RP
facility. The interest rates on term RRPs, RPs, and SDAs were
also left unchanged. The MB’s decision was based on its
assessment that the inflation environment remains benign,

Q1 2016 Inflation Report | | | | 44
Summary of Monetary Policy Decisions
Effectivity Date
Levels (in percent)
Monetary Policy Decisions RRP
Overnight
RP
Overnight
with the risks to the inflation outlook appearing to be broadly
balanced.
25 Oct 2012 3.50 5.50
The MB decided to reduce the BSP’s key policy interest rates
by 25 bps to 3.50 percent for the overnight borrowing or RRP
facility and 5.50 percent for the overnight lending or RP
facility. The interest rates on term RRPs, RPs, and SDAs were
also reduced accordingly. This is the fourth time in 2012 that
the BSP has cut its policy rates. The MB’s decision was based
on its assessment that the inflation environment continued to
be benign with latest baseline forecasts indicating that the
future inflation path will remain within target for 2012-2014.
A rate cut would also be consistent with a symmetric
response to the risk of below-target inflation.
13 Dec 2012 3.50 5.50
The MB decided to keep the BSP’s key policy interest rates
steady at 3.50 percent for the overnight borrowing or RRP
facility and 5.50 percent for the overnight lending or RP
facility. The interest rates on term RRPs, RPs, and SDAs were
also left unchanged. The MB’s decision was based on its
assessment that current monetary settings remained
appropriate, as the cumulative 100-basis-point reduction in
policy rates in 2012 continued to work its way through the
economy.
2 0 1 3
24 Jan 2013 3.50 5.50
The MB decided to keep the BSP’s key policy interest rates
steady at 3.50 percent for the overnight borrowing or RRP
facility and 5.50 percent for the overnight lending or RP
facility. The interest rates on term RRPs and RPs were also
maintained accordingly. The reserve requirement ratios were
kept steady as well. At the same time, the MB decided to set
the interest rates on the SDA facility at 3.00 percent
regardless of tenor, effective immediately, consistent with
the BSP’s continuing efforts to fine-tune the operation of its
monetary policy tools.
14 Mar 2013 3.50 5.50
The MB decided to keep the BSP’s key policy interest rates
steady at 3.50 percent for the overnight borrowing or RRP
facility and 5.50 percent for the overnight lending or RP
facility. The interest rate on the RRP was also set at
3.50 percent regardless of tenor. Following its previous
decision to rationalize the SDA facility in January 2013, the
MB further reduced the interest rates on the SDA facility by
50 bps to 2.50 percent across all tenors effective immediately.
25 Apr 2013 3.50 5.50
The MB decided to keep the BSP’s key policy interest rates
steady at 3.50 percent for the overnight borrowing or RRP
facility and 5.50 percent for the overnight lending or RP
facility. The interest rate on the RRP was also set at
3.50 percent regardless of tenor. Meanwhile, the SDA rate
was further reduced by 50 basis points to 2.0 percent across
all tenors.
13 Jun 2013
25 Jul 2013
12 Sep 2013
24 Oct 2013
12 Dec 2013
3.50 5.50
The MB decided to keep the BSP’s key policy interest rates
steady at 3.50 percent for the overnight borrowing or RRP
facility and 5.50 percent for the overnight lending or RP
facility. The interest rates on term RRPs, RPs, and SDA were
also maintained.

Q1 2016 Inflation Report | | | | 45
Summary of Monetary Policy Decisions
Effectivity Date
Levels (in percent)
Monetary Policy Decisions RRP
Overnight
RP
Overnight
2 0 1 4
6 Feb 2014 3.50 5.50
The MB decided to keep the BSP’s key policy interest rates
steady at 3.50 percent for the overnight borrowing or RRP
facility and 5.50 percent for the overnight lending or RP
facility. The interest rates on term RRPs, RPs, and SDA were
also maintained.
27 Mar 2014 3.50 5.50
The MB decided to keep the BSP’s key policy interest rates
steady at 3.50 percent for the overnight borrowing or RRP
facility and 5.50 percent for the overnight lending or RP
facility. The interest rates on term RRPs, RPs, and SDA were
also maintained. Meanwhile, the MB decided to increase the
reserve requirement by one percentage point effective on
11 April 2014.
8 May 2014 3.50 5.50
The MB decided to keep the BSP's key policy interest rates
steady at 3.50 percent for the overnight borrowing or RRP
facility and 5.50 percent for the overnight lending or RP
facility. The interest rates on term RRPs, RPs, and SDA were
also maintained. Meanwhile, the MB decided to increase the
reserve requirements for U/KBs and TBs by a further one
percentage point effective on 30 May 2014.
19 Jun 2014 3.50 5.50
The MB decided to keep the BSP's key policy interest rates
steady at 3.50 percent for the overnight borrowing or RRP
facility and 5.50 percent for the overnight lending or RP
facility. The interest rates on term RRPs and RPs were also
maintained. The reserve requirement ratios were left
unchanged as well. Meanwhile, the MB decided to raise the
interest rate on the SDA facility by 25 basis points from 2.0
percent to 2.25 percent across all tenors effective
immediately.
31 Jul 2014 3.75 5.75
The MB decided to increase the BSP's key policy rates by
25 bps to 3.75 percent for the overnight borrowing or RRP
facility and 5.75 percent for the overnight lending or RP
facility. The interest rates on term RRPs and RPs were also
raised accordingly. The rate on special deposit accounts (SDA)
was left unchanged. Meanwhile, the reserve requirement
ratios were also kept steady.
11 Sep 2014 4.00 6.00
The MB decided to increase the BSP's key policy rates by
25 bps to 4.0 percent for the overnight borrowing or RRP
facility and 6.0 percent for the overnight lending or RP facility.
The interest rates on term RRPs, RPs, and SDA were also
raised accordingly. Meanwhile, the reserve requirement
ratios were left unchanged.
23 Oct 2014
11 Dec 2014 4.00 6.00
The MB decided to maintain the BSP’s key policy interest
rates at 4.0 percent for the overnight borrowing or reverse
repurchase (RRP) facility and 6.0 percent for the overnight
lending or repurchase (RP) facility. The interest rates on term
RRPs, RPs, and special deposit accounts were also kept
steady. The reserve requirement ratios were left unchanged
as well.

Q1 2016 Inflation Report | | | | 46
Summary of Monetary Policy Decisions
Effectivity Date
Levels (in percent)
Monetary Policy Decisions RRP
Overnight
RP
Overnight
2 0 1 5
12 Feb 2015
26 Mar 2015
14 May 2015
25 Jun 2015
13 Aug 2015
24 Sep 2015
12 Nov 2015
17 Dec 2015
4.00 6.00
The MB decided to maintain the BSP’s key policy interest
rates at 4.0 percent for the overnight borrowing or reverse
repurchase (RRP) facility and 6.0 percent for the overnight
lending or repurchase (RP) facility. The interest rates on term
RRPs, RPs, and special deposit accounts were also kept
steady. The reserve requirement ratios were left unchanged
as well.
2 0 1 6
11 Feb 2016
23 Mar 2016 4.00 6.00
The MB decided to maintain the BSP’s key policy interest
rates at 4.0 percent for the overnight borrowing or reverse
repurchase (RRP) facility and 6.0 percent for the overnight
lending or repurchase (RP) facility. The interest rates on term
RRPs, RPs, and special deposit accounts were also kept
steady. The reserve requirement ratios were left unchanged
as well.

Q1 2016 Inflation Report | | | | 47
The BSP Inflation Report is published every quarter by the Bangko
Sentral ng Pilipinas. The report is available as a complete document in
pdf format, together with other general information about inflation
targeting and the monetary policy of the BSP, on the BSP’s website:
www.bsp.gov.ph/monetary/inflation.asp
If you wish to receive an electronic copy of the latest BSP Inflation
Report, please send an e-mail to [email protected].
The BSP also welcomes feedback from readers on the contents of the
Inflation Report as well as suggestions on how to improve the
presentation. Please send comments and suggestions to the following
addresses:
By post: BSP Inflation Report
c/o Department of Economic Research
Bangko Sentral ng Pilipinas
A. Mabini Street, Malate, Manila
Philippines 1004
By e-mail: [email protected]