influence of agricultural practices on soil properties
TRANSCRIPT

INFLUENCE OF AGRICULTURAL PRACTICES ON SOIL PROPERTIES,
ABUNDANCE AND DIVERSITY OF PLANT PARASITIC NEMATODES IN SMALL
SCALE TEA FARMS IN KENYA
MOGENI ISAAC HARRISON
B.Sc Range Management (Hons), University of Nairobi
A THESIS SUBMITTED IN PARTIAL FULFILLMENT OF THE REQUIREMENTS
FOR THE AWARD OF THE DEGREE OF MASTER OF SCIENCE IN CROP
PROTECTION
DEPARTMENT OF PLANT SCIENCE AND CROP PROTECTION
FACULTY OF AGRICULTURE
UNIVERSITY OF NAIROBI
2019

i
DECLARATION
I, Mogeni Isaac Harrison, hereby declare that this thesis is my original work and has not been
presented for award of a degree in any other university.
Mogeni Isaac Harrison Signature ………………. Date …………...
This thesis has been submitted with our approval as the University Supervisors
Dr. William Maina Muiru Signature ……………... Date …………...
Department of Plant Science and Crop Protection
University of Nairobi
Prof. John Wangai Kimenju Signature ……………... Date ……………
Department of Plant Science and Crop Protection
University of Nairobi

ii
DEDICATION
Dedicated to my wife Peris Wanjiku Mogeni and our daughter Joy Shelby Nyaboke Mogeni

iii
ACKNOWLEDGEMENTS
I give thanks to God for protection, health, guidance and providence throughout the period of
study. I appreciate the efforts and assistance of my academic supervisors, Prof. Kimenju W. J
and Dr. Muiru M. W., throughout the study and until completion of this thesis.
My further appreciation goes to Anthony Makwaka and Justine Miriti of KTDA Research and
Development, Mr. Kaburi, Mr. Mutugu and Mr. Kinoti, factory unit managers of Kangaita and
Weru tea factories and the extension and field services staff of the two factories for the assistance
and facilitation during the fieldwork exercise. To Francis W Wamae, factory unit manager
Kagwe tea factory, thanks for facilitation and encouragement while compiling this thesis.
I also extend my appreciation to E. Cheramgoi of Tea Research Institute of Kenya for her advice
and assistance when setting up the pathogenicity experiment.
I also thank Mr. Naphis Bitange Mokaya for his immense contribution during the study and in
completion of this work.
Special thanks go to my family members, my wife, mother, father and sister for their
understanding, support, encouragement and prayers during the period of study.
To all who in one way or another participated in the study to completion of this work, I convey
my appreciation and wish them all God’s blessings.

iv
Table of Contents
DECLARATION ............................................................................................................................. i
DEDICATION ................................................................................................................................ ii
ACKNOWLEDGEMENTS ........................................................................................................... iii
Table of Contents ........................................................................................................................... iv
List of Tables ............................................................................................................................... viii
List of acronyms and abbreviations .................................................................................................x
ABSTRACT .................................................................................................................................. xii
CHAPTER 1: INTRODUCTION ....................................................................................................1
1.1 Background information ....................................................................................................... 1
1.2 Problem statement ................................................................................................................. 2
1.3 Justification ........................................................................................................................... 3
1.4 Objectives of the study .......................................................................................................... 4
1.5 Hypotheses ............................................................................................................................ 4
CHAPTER 2: LITERATURE REVIEW .........................................................................................5
2.1 Tea industry in Kenya ........................................................................................................... 5
2.2 Ecological requirements for tea production .......................................................................... 6
2.3 Good agricultural practices (GAPs) in tea ............................................................................ 6

v
2.4 Site selection for tea growing ................................................................................................ 7
2.5 Farming practices in tea farms .............................................................................................. 7
2.6 Ecology and biology of nematodes ....................................................................................... 9
2.7 Nematode pathology ........................................................................................................... 10
2.8 Nematodes associated with tea ............................................................................................ 10
2.9 Management of plant parasitic nematodes in tea ................................................................ 11
2.10 Influence of land use practices on abundance and diversity of nematodes ....................... 11
CHAPTER 3: INFLUENCE OF FARMING PRACTICES ON THE ABUNDANCE AND
DIVERSITY OF PLANT PARASITIC NEMATODES IN SMALL SCALE TEA
FARMS IN KIRINYAGA AND THARAKA-NITHI COUNTIES OF KENYA ..........13
3.1 Abstract .......................................................................................................................... 13
3.2 Introduction ......................................................................................................................... 14
3.3 Materials and Methods ........................................................................................................ 14
3.3.1 Study area ......................................................................................................................... 14
3.3.2 Selection criteria ............................................................................................................... 15
3.3.3 Experimental design ......................................................................................................... 15
3.3.4 Soil sampling .................................................................................................................... 16
3.3.5 Extraction of nematodes from the soil, their identification and quantification ................ 16

vi
3.3.6 Statistical analysis ............................................................................................................ 17
3.4 Results ................................................................................................................................. 17
3.6 Discussion ........................................................................................................................... 33
CHAPTER 4: INFLUENCE OF FARMING PRACTICES ON THE CHEMICAL
PROPERTIES OF SOIL IN SMALL SCALE TEA FARMS IN KIRINYAGA AND
THARAKA-NITHI COUNTIES OF KENYA ...............................................................37
4.1 Abstract ............................................................................................................................... 37
4.2 Introduction ......................................................................................................................... 38
4.3 Materials and methods ........................................................................................................ 39
4.4 Results ................................................................................................................................. 41
4.4.1 Soil chemical analysis ...................................................................................................... 41
4.4.2 Influence of soil chemical properties on the abundance and diversity of soil
nematodes .................................................................................................................................. 45
4.5 Discussion ........................................................................................................................... 53
CHAPTER 5: EFFECT OF ROOT KNOT NEMATODE ON THE GROWTH AND
PRODUCTIVITY OF TEA CLONES IN MERU COUNTY OF KENYA ...................56
5.1 Abstract ............................................................................................................................... 56
5.2 Introduction ......................................................................................................................... 57

vii
5.4 Materials and method .......................................................................................................... 58
5.4.1 Experimental design..................................................................................................... 58
5.4.2 Establishment of experimental plants .......................................................................... 59
5.4.3. Preparation of nematode inoculum and inoculation ................................................... 59
5.4.4 Data collection and analysis......................................................................................... 59
5.5 Results ................................................................................................................................. 60
5.6 Discussion ........................................................................................................................... 63
CHAPTER 6: GENERAL DISCUSSION CONCLUSION AND RECOMMENDATIONS .......65
6.1 Discussion ........................................................................................................................... 65
6.2 Conclusion ........................................................................................................................... 69
6.3 Recommendations ............................................................................................................... 70
REFERENCES ..............................................................................................................................71
APPENDICES ...............................................................................................................................80
Appendix 1: Soil test results for Kangaita study site ................................................................ 80
Appendix 1: Soil test results for Kangaita study site ‘continued’ ............................................. 81
Appendix 2: Soil test results for Weru study site ...................................................................... 82

viii
List of Tables
1. Table 3.1: Family, genera, C-P value and trophic groups of nematodes recovered at Kangaita
and Weru ....................................................................................................................................... 18
2. Table 3.2: Nematode species recovered at Kangaita and their distribution in the three farming
practices across the three zones .................................................................................................... 20
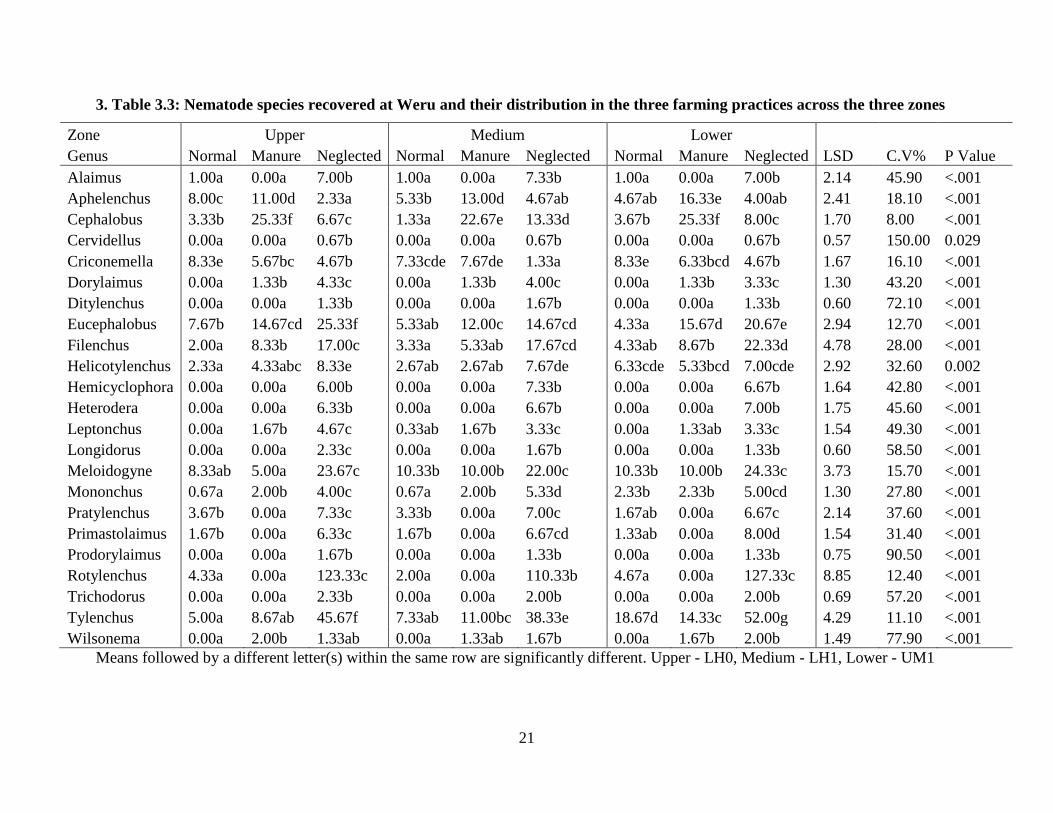
3. Table 3.3: Nematode species recovered at Weru and their distribution in the three farming
practices across the three zones .................................................................................................... 21
4. Table 3.4: Nematode numbers and their distribution in the different farming practices at
Kangaita ........................................................................................................................................ 23
5. Table 3.5: Nematode numbers and their distribution in the different farming practices at Weru
....................................................................................................................................................... 24
6. Table 3.6: Nematode numbers and their distribution in the different zones at Kangaita ......... 26
7. Table 3.7: Nematode numbers and their distribution in the different zones at Weru ............... 27
8. Table 3.8: Nematode trophic levels, abundance and species diversity and their distribution in
different farming practices across the three agro ecological zones at Kangaita and Weru .......... 29
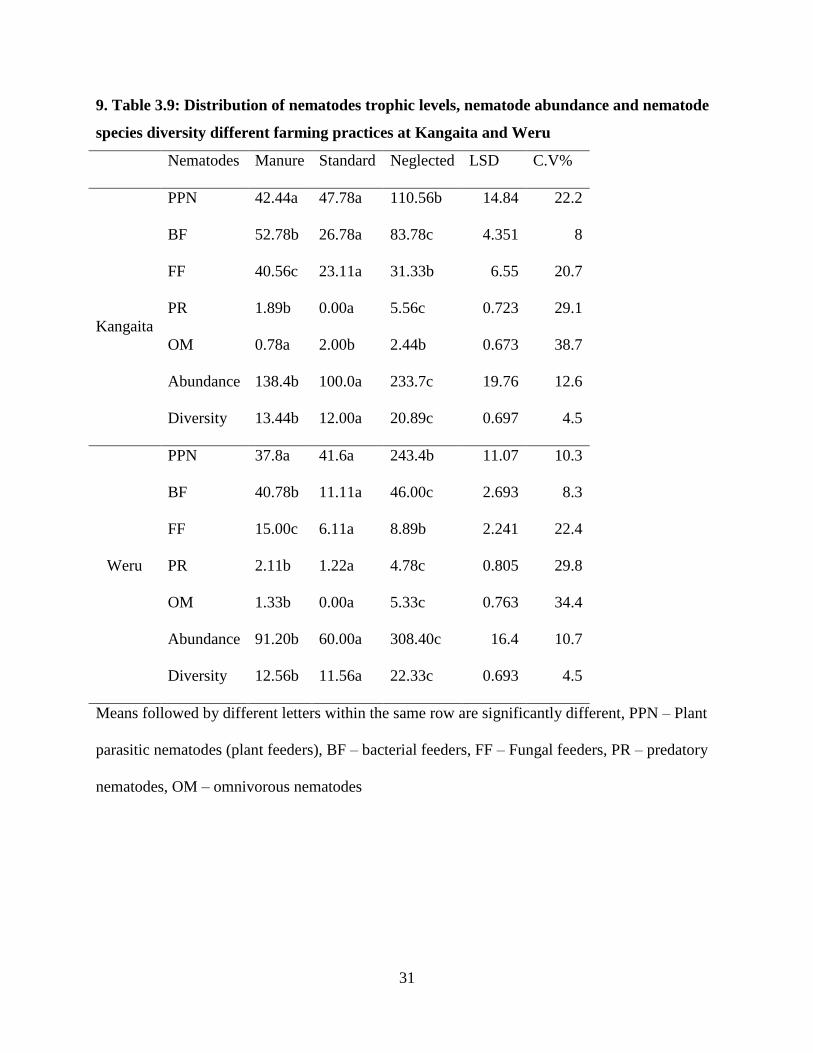
9. Table 3.9: Distribution of nematodes trophic levels, nematode abundance and nematode
species diversity different farming practices at Kangaita and Weru ............................................ 31
10. Table 3.10: Distribution of nematodes trophic levels, nematode abundance and nematode
species diversity across zones at Kangaita and Weru ................................................................... 32
11. Table 4.1: Soil chemical properties in different farming practices across the agro ecological
zones in Kangaita .......................................................................................................................... 42
12. Table 4.2: Soil chemical properties in different farming practices across the agro ecological
zones in Weru ............................................................................................................................... 43

ix
13. Table 4.3: Effect of farming practices on soil pH, exchangeable acidity, total organic carbon
and micronutrients at Kangaita ..................................................................................................... 44
14. Table 4.4: Effect of farming practices on soil pH, exchangeable acidity, total organic carbon
and micronutrients at Weru ........................................................................................................... 45
15. Table 4.5: Correlation analysis between nematode trophic levels, nematode abundance,
nematode species diversity, and soil pH, exchangeable acidity, macro and micro nutrients at
Kangaita ........................................................................................................................................ 48
16. Table 4.6: Correlation analysis between nematode trophic levels, nematode abundance,
nematode species diversity, and soil pH, exchangeable acidity, macro and micro nutrients at
Weru .............................................................................................................................................. 51
17. Table 5.1: Effect of root knot nematode on the stem girth, internode length and number of
new leaves (growth parameters) of tea clones TRFK 31/8, TRFK 301/4, TRFK 371/3, TRFK
430/90 and TRFK 306/1 ............................................................................................................... 61

x
List of acronyms and abbreviations
AAS Atomic Absorption Spectroscopy
BF Bacterial feeders
DAP Di - Ammonium Phosphate fertilizer
EMCA Environmental Management and Coordination Act
FAO Food and Agricultural Organization
FF Fungal feeders
GAP(s) Good Agricultural Practice(s)
J2(s) Nematode Second Stage Juvenile
Kg Kilograms
KTDA Kenya Tea Development Agency
LH0 Lower Highland 0
LH1 Lower Highland 1
M.a.s.l. Meters above sea level
me Milli equivalents
MoA Ministry of Agriculture
NEMA National Environment Management Authority
NPK Nitrogen, Phosphorus, Potassium
OM Omnivores
ppm Parts per million
PPN Plant Parasitic Nematodes

xi
PR Predatory
r.p.m Revolutions per Minute
RA Rainforest Alliance
RKN Root knot nematodes
s.g Specific gravity
SAN Sustainable Agriculture Network
TBK Tea Board of Kenya
TESA(s) Tea Extension Services Assistant(s)
TRFK Tea Research Foundation of Kenya
TRI Tea Research Institute
UM1 Upper medium 1

xii
ABSTRACT
Tea (Camelia sinensis L (O) Kuntze) is a major cash crop in Kenya contributing to the economy
majorly through exports. Plant parasitic nematodes are widely distributed in tea fields and cause
significant yield losses. In an effort to maximize production of green leaves from tea fields,
farmers practice various cultural practices. Studies were carried out to determine the influence of
farming practices and soil chemical properties on the abundance and diversity of nematodes as
well as to evaluate the reaction of different tea clones to root knot nematodes. The experiments
were carried out in Kangaita, Kirinyaga County, Weru, Tharaka Nithi County and Kionyo, Meru
County. Three farming practices namely neglected, manure applied farms and inorganic fertilizer
applied farms were used to assess the abundance and diversity of nematodes as well as the
chemical properties of soil. Soil samples were randomly collected from the farms, nematodes
were extracted, identified and quantified and chemical analysis was conducted on the soil
samples. Tea clones TRFK 31/8, TRFK 430/90, TRFK301/4, TRFK 371/3, and TRFK 306/1
were assessed for reaction to root knot nematode infestation. Growth parameters assessed
included stem girth, length of internode (internode space) and number of new (harvestable)
leaves. Randomized complete block design was used. In both Kangaita and Weru sites,
nematodes from all the five feeding groups (plant feeders, bacterial feeders, fungal feeders,
predatory and omnivorous) were recovered. Nematode numbers decreased from neglected farms
to manure applied farms to standard farms. There was a general reduction of the number of
leaves produced, stem girth and internode space on clones TRFK 430/90, TRFK301/4, TRFK
371/3, and TRFK 306/1. Clone TRFK 430/90 was the most severely affected as most of the
plants died while clone TRFK 31/8 did not show any significant effect on growth parameters.
The farming practices had a significant effect on the soil pH, N, P, K and other trace elements in

xiii
the soil. Soil acidity increased from neglected farms to manure applied farms and to NPK
fertilizer applied (Standard) farms. There was a positive correlation between the soil pH and
nematode abundance, species diversity and all the five nematode trophic levels. There was a
negative correlation between exchangeable acidity and total organic carbon with nematode
abundance and species diversity. The soils had generally low levels of potassium, magnesium
and zinc due to rapid removal through harvesting of the young shoots and leaves. PPNs led to
reduction in crop productivity and general physical health of tea plants. Clone 430/90 is highly
susceptible to nematode attack while Clone TFRK 31/8 is tolerant to nematode infestation. The
high use of NPK fertilizer led to acidifying of the soil. High soil acidity negatively affects both
nematode abundance and species diversity. Farmers should follow good agricultural practices to
realize maximum benefit from their farms. These includes application of inorganic fertilizers
using recommended rates and use of farmyard manure to avert increase in soil acidity. Use of
resistant/tolerant plant cultivars/ tea clones will also help the farmers maximize yield and returns
from their farms. Clone 31/8 can be recommended for planting in areas with incidence of plant
parasitic nematodes. Clone 430/90 is highly susceptible to plant parasitic nematode attack and
can only be grown when methods of nematode control are employed. More research is
recommended on clone 430/90 to incorporate resistance to nematode attack. Manure application
can be recommended as the most appropriate farming practice to maximize yield and reduce
nematode numbers in farms.
1
CHAPTER 1: INTRODUCTION
1.1 Background information
The agricultural sector contributes 25% of the Gross Domestic Product to the Kenyan Economy.
Tea (Camelia sinensis L [O] Kutze) contributes 4% to the GDP nationally (Tea Board of Kenya,
2013) and 26% of the total export earnings (Tabu et. al., 2015). According to TBK (2013), in the
year 2013, tea earned the country Ksh. 114 billion in export earnings and Ksh. 22 billion in local
sales.
Tea is a shrub believed to have originated from China (Tapan, 2004). It was originally used by
the people of China as a medicinal drink (Tapan, 2004). Later, the tea was used as a relaxing and
stimulating drink. The use of tea as a beverage spread from China to other parts of the world.
The British became tea drinkers in the 17th
century after the devastation of coffee by the coffee
berry disease. They introduced tea to other parts of the world, especially in India, to counter
China’s monopoly in tea production (Tapan, 2004).
Tea is currently grown in many countries of the world and on various geographical locations,
with suitable climate able to support its growth. Tea is cultivated in Asia, Africa, and South
America with the major tea producing countries including China, India, Japan, Sri Lanka
(Ceylon), Taiwan, Kenya, among others. Kenya is ranked third in terms of annual tea production
after China and India (TBK, 2013).
Tea is mainly cultivated for its use as a beverage, which is popular all over the world (Tapan,
2014). It has a wide range of habitats depending on the elevation and the climate of the area.
These variations in climate and geographical features affect the plant growth habits, yields and
quality (Owuor et al. 2010; Sarkar et al. 2010). As such, tea is very adaptable to the climatic

2
conditions of a number of countries in the world. Various research institutions have come up
with tea clones and varieties, which are suitable for specific climatic and edaphic conditions
intended to enhance the productivity of the plant.
Nematodes are worm like organisms inhabiting a wide range of ecosystems. Some are free living
while others are parasitic. According to Coleman et al. (1984), nematodes interact in various
ways with their environment, both directly and indirectly where they regulate decomposition of
organic matter and the release of nutrients to plants. Due to their important role in the complex
food webs in the soil ecosystems, nematodes, both pathogenic and beneficial, need to be given
special attention (Yeates et al. 1999; Neher, 2010). Plant parasitic nematodes feed on tea plants
affecting their growth and productivity.
Most tea farmers practice monoculture but in some instances, small scale tea farmers practice
intercropping during various seasons. Some of the activities carried out by small-scale tea
farmers on their farms include weeding, fertilizer application, manure application, irrigation, and
intercropping (mostly practiced during the pruning season). These cultural practices affect the
soils as well as the health and performance of the crops (TBK, 2003).
1.2 Problem statement
Good agricultural practices (GAPs) should produce the best returns in terms of production per
unit. Agricultural practices employed affect soil nutrient balance and soil physical properties
which in turn affect soil biodiversity. Pests and diseases in tea hamper development of the plant
leading to reduced production and eventual death of the plant. Plant parasitic nematodes affect
tea plants causing diseases thus affecting the productivity of affected plants. Studies in India
have shown an association of declining populations of tea with nematode infestation (Mukherjee

3
et al. 1982). In Kenya, Otieno et al. (2002) reported an outbreak of root knot nematodes in tea in
Kerugoya and Imenti areas. Kamunya et al. (2008) recorded nematodes associated with tea in
Kenya and reported that root knot nematodes were responsible for death of some tea clones. It is
not known how the applied agricultural practices influence population and diversity of
nematodes. It is important to establish how various farming practices applied by small-scale
holder tea farmers in Kenya in various environmental conditions affect the soil chemical and
physical characteristics, diversity and abundance of plant parasitic nematodes and the effects of
those nematodes on the growth and productivity of tea.
1.3 Justification
In an effort to maximize yields per bush from tea farms, farmers practice various methods of
farming. These practices affect the composition and population of soil microorganisms that in
turn affect the plants in various ways. Research has shown that cultivated lands have lower
numbers of nematodes compared to non-cultivated lands and that nematode diversity declines
with increase in the intensity of cultivation (Kimenju et al. 2009). Farms practicing monoculture
tend to have a low diversity of nematodes. Research conducted on tea farms in Ngere, Murang’a
County, showed that 16 genera of nematodes existed on the tea farms studied (Kibet et al. 2003).
These included both beneficial and pathogenic nematodes.
The research work conducted on tea farms in the past have not taken into consideration the type
of farming practices applied on those farms. As a result, it is not known which type of commonly
applied farming practices contribute to high or low levels of both harmful and beneficial
nematodes. Consequently, it is important to establish how various agricultural practices affect
the abundance and diversity of soil nematodes. It is also important to establish how the farming
practices impact on the soil chemical properties and the effect of those soil properties on the

4
abundance and diversity of nematodes. It is also important to establish the effect of nematodes on
the health, growth and productivity of the tea plant. This will help farmers choose efficient
farming practices beneficial to them in terms of increased production from healthy tea plants.
1.4 Objectives of the study
The main objective of the study was to contribute to better management of nematodes in tea
farms by studying the influence of commonly applied farming practices in small-scale tea farms
on the establishment of soil nematodes
The specific objectives of the study were;
1. To determine the abundance and diversity of nematodes under different farming practices
and tea production zones
2. To determine the soil chemical properties that influence nematode abundance and
diversity in tea production zones
3. To evaluate the reaction of different tea clones to root knot nematodes
1.5 Hypotheses
Farming practices under different tea production zones do not affect the population and
diversity of soil nematodes.
Soil properties do not influence nematode abundance and diversity.
Tea clones do not react differently to root knot nematodes.

5
CHAPTER 2: LITERATURE REVIEW
2.1 Tea industry in Kenya
Tea plays a major role in the Kenyan agriculture accounting for 26% of total export earnings and
contributing to about 4% of the GDP (TRFK, 2009; TBK, 2013). This cash crop supports over
650,000 small scale farmers directly and others indirectly along the value chain. Kenya is the
leading tea exporter in the world accounting for 23% of total world tea export (Owuor, 2011)
hence tea is an important source of foreign exchange. Kenya’s tea accounts for 14% of world
production. The tea industry in Kenya is divided into two sectors: Plantation and small scale. The
small scale sector contributes a significant portion of the total production of over 80% of the total
annual tea production. Private companies run large scale tea production in Kenya. Small-scale
tea production in Kenya is organized, coordinated, and managed by the Kenya Tea Development
Agency (KTDA). KTDA manages 66 tea factory companies on behalf of the farmers who are
shareholders and owners of those companies. Under the management of KTDA, the small holder
sector has been a success owing to the fact that farmers are paid on time (Owuor, 2011).
Despite this, the sector is still faced with a number of challenges. One major challenge is the
fluctuation of prices owing to the fact that the country’s local consumption is very low hence
external factors highly influence the market. There is minimal value addition in Kenya as noted
by Kagira et al. (2012) as Kenya exports 88% of her tea in bulk while the rest is sold as value
added. Another challenge is the increasing cost of production affected by the cost of labor, low
labor productivity, high costs of electricity, poor agronomic practices and poor extension
services (Sanne van der Wal, 2008).

6
2.2 Ecological requirements for tea production
Successful tea cultivation requires a minimum annual rainfall of between 1200 mm and 1400
mm, well distributed throughout the year (TRFK, 2002). However, Waheed et al. (2013)
considers optimal rainfall requirement to be 2500mm-3000mm. Tea can be cultivated from sea
level to mountainous regions of up to 2700 meters above sea level (M.a.s.l) (TBK, 2013).
Cultivation has also been reported in areas below sea level in Iran (TRFK, 2002). Tea requires
tropical, red volcanic, acidic soils of pH between 5.0 and 5.6 (Njogu et al. 2013). Soil pH is an
important consideration in site selection for the growth of tea (De Silva, 2007). Tea growth is
affected by soil and air temperatures. Ideal air temperatures should range from 18 to 25oC
(Waheed et al. 2013). According to Waheed et al. (2013), temperatures below 13oC lead to
foliage damage while those above 30oC lead to reduced shoot extension and growth due to
reduced humidity. There is a direct relationship between mean air temperature and tea yields as
noted by Cheserek et al. (2015). In Kenya, tea is mainly grown in areas experiencing moderate to
cool temperatures and in highlands to mountainous regions of altitude between 1500 m to 2200
meters above sea level.
The tea growing regions in Kenya include Mt. Kenya region, the Aberdare ranges, along the
Nyambene hills, the Mau escarpment, Kericho highlands, Nandi hills and Kisii highlands (TBK,
2013; TRFK, 2002).
2.3 Good agricultural practices (GAPs) in tea
In all tea farming systems, GAPs are an essential part of the farming culture to ensure production
of quality tea and sustainability of the tea production. GAPs should be applied right from site
selection, cultivar/planting material selection, nursery preparation, field preparation, planting,
weeding, plucking, pruning, disease and pest control and chemical application. Technologies to
7
promote these GAPs are developed in collaboration with tea stakeholders including the Ministry
of Agriculture (MoA), Tea Board of Kenya (TBK), Tea Research Foundation of Kenya (TRFK),
KTDA, and multinational tea producing companies (Waarts et al. 2012). Other international
organizations and certification bodies like Sustainable Agriculture Network (SAN), Rainforest
Alliance (RA), and Fairtrade also assist in formulation, promotion and monitoring of the
implementation of GAPs for sustainable production of safe teas in a safe environment while
conserving the environment (Waats et al. 2012).
2.4 Site selection for tea growing
In Kenya, site selection for tea growing is governed by a number of national and international
regulations. These include the Agricultural Act, Cap. 318 of the Laws of Kenya, the TRFK
Growers’ Handbook, Environmental Management and Coordination Act (EMCA) No. 8 of 1999,
The Forest Act, 2005 and the stipulations of Food and Agricultural Organization (FAO).
National Environment Management Agency (NEMA) requires that an environmental impact
assessment is conducted in an area before the site can be licensed for tea production. This is in
line with the laws governing environmental protection. Such information is disseminated to the
farmers through the agricultural extension services. In KTDA, the Tea Extension Assistants
(TESAs) are tasked to offer these services to farmers. Tea should also be grown in areas with
favorable environmental, climatic and geographical conditions favorable for its sustainable crop
production (TBK, 2003).
2.5 Farming practices in tea farms
A field prepared for tea growing should be planted with a cover crop to minimize soil erosion
and environmental degradation (TBK, 2003). The young tea should also be planted together with
other crops until the plantation establishes well to safeguard the soil. This will majorly depend on

8
the slope of the land under cultivation. Control of weeds is mostly done manually especially in
smallholder tea production even though in some instances controlled chemical application is
practiced (TBK, 2003).
Tea farms are pruned at an interval of 3 – 4 years depending on the productivity of the tea farm
(TBK, 2003). Pruning is aimed at rejuvenating the production potential of the tea bushes by
breaking the tea’s reproduction cycle. It also helps to lower the plucking table for ease of tea
plucking. The pruned branches of the tea plant are supposed to be left in situ to decompose in the
farm to improve soil fertility by increasing soil organic matter. This is also important in the
balance of soil micro and macro fauna. Organic matter also suppresses parasitic microorganisms
like nematodes thus improving the health of the tea plants (TBK, 2003; Sultan et al. 2014).
In Kenya’s small scale holder tea farms, chemical use in control of pests and diseases is not
common. This makes tea production in this system safe from pesticide residues. Chemical use is
however employed in treatment of extreme cases and for study purposes (TBK, 2003). The Pest
Control Products Act, Cap 346 of the Laws of Kenya, does this under close monitoring by
experts and according to the laid down procedures.
Chemical fertilizers commonly used include Di Ammonium Phosphate (DAP) and Nitrogen
Phosphorus Potassium (NPK) (TBK, 2003). Double Ammonium Phosphate is used during
nursery establishment and transplanting. For top dressing, NPK is used. Excessive application of
fertilizer can cause imbalance in nutrient uptake and fix some nutrients leading to poor
performance of the tea plant (Hamid, 2006; Thenmonzi, 2012; Sultan et al. 2014). In KTDA, the
recommended NPK application rate is 50ks per 700 bushes (TBK, 2003).

9
2.6 Ecology and biology of nematodes
Nematodes are worm like multi-cellular organisms inhabiting a wide area of ecosystems. They
are bilaterally symmetrical and non-segmented. Nematodes lack the respiratory and circulation
systems while their excretory and nervous systems are primitive (Coleman et al. 1996).
Nematodes interact with plants directly and indirectly and play an important role in the complex
soil ecosystem, especially in regulating decomposition, release of nutrients and parasitizing on
plants (Yeates et al. 1999; Neher, 2010).
Generally, nematodes are free-living in a wide range of environments including marine, fresh
water, and soil environments. However, a number of species are parasitic and infest different
species of plants and animals (O’Halloran et al. 2003). Free-living nematodes can survive in
various environmental conditions. Some can withstand very low temperatures, below freezing
point, while others have been found in hot springs (Ferris et al. 2008). Plant parasitic nematodes
(PPN), however, can only survive in restricted temperature ranges with 27oC being optimal
(Agrios, 2005). PPN cannot survive temperatures beyond 50oC.
Plant parasitic nematodes (PPN) normally undergo four molting stages in their life cycle from
egg to adult. The larval stage, first stage juvenile (J1), develops inside the egg. This undergoes
first molting to form second stage juvenile (J2). The J2 emerge from the egg and move in the soil
until it finds a suitable and susceptible root to be its host or to feed on. In most nematodes,
especially the root knot nematodes (RKN), the J2s are the only active stage in their life cycle
(Agrios, 2005). The J2 undergoes a second molt to form a J3. In J3 stage nematodes lack a stylet.
The third molt gives a J4, which can be distinguished as either male or female. The fourth and
final molt gives an adult nematode, which may become a free-living male nematode or a
parasitic adult female.

10
Nematodes lay eggs in egg masses covered with a sac-like gelatinous matrix that prevents the
eggs from adverse external conditions (Evans et al. 2009). Under favorable conditions,
especially temperature, moisture and availability of food, an individual nematode can lay up to
2800 eggs and raise a nematode generation within 25 days (Agrios, 2005). Under unfavorable
conditions, reproduction rate may be slowed or cease (Moens et al. 2009).
2.7 Nematode pathology
Plant parasitic nematodes (PPNs) cause injury to plants as they feed on them. The nematodes
have a hollow feeding structure, with a stylet and a pharynx that have undergone morphological
and physiological adaptations to suit the nematode’s mode of feeding (Lee, 2002). They feed by
forming diverse and sometimes complex feeding relationships with their host plants (Davis et al.
2004; Luc et al. 2005).
In general, PPNs use their stylet to mechanically injure plants through piercing as they withdraw
and ingest nutrients from plants (Bilgrami et al. 2004; Guagler et al. 2004). In the process of
feeding or in the attempt to obtain food from plants, the nematodes may also inject secretions
into the plant cells weakening or modifying those plants (Gheysen et al. 2006).
2.8 Nematodes associated with tea
Around ten genera of bacteriophores, fungiphores and omniphores have been found to be
associated with tea (Kibet et al. 2003; Kimenju et al. 2009). Plant parasitic nematodes have also
been found in tea plantations. These include Pratylenchus spp., Helicotylenchus spp.,
Rotylenchus spp., Aphelenchus spp., Rotylechulus spp., Xiphinema spp., and Meloidogyne spp.
Just like in other crops, RKN are found to be widely spread in tea farms (Kibet et al. 2003).

11
2.9 Management of plant parasitic nematodes in tea
Application of nematicides has been used to control PPN but the chemicals have been banned
due to human health and environmental effects (Wachira et al. 2014). A number of studies have
been conducted on the incidence and pathogenicity of nematodes in tea (Kibet et al, 2003;
Gnapragasam et al. 2005; Kimenju et al, 2009). Such studies have however been done mainly on
tea plants in nurseries or on young tea farms (Gnapragasam et al. 2005). As a result,
management and control measures of plant parasitic nematodes have largely been developed in
tea under nursery conditions. In countries like Sri Lanka and Japan where PPN are a major threat
to tea farming in mature fields, a number of methods have been developed to minimize the
effects on the growth, health and productivity of the tea plant. Such methods include cultural
methods, physical methods, using resistant and tolerant tea varieties and clones, chemical
application and biological control (TRFK, 2002; Gnapragasam et al. 2005).
Cultural control methods are premised on the fact that a plant is able to withstand the effects of
the nematode damage if it can grow vigorously and replace the damaged parts at a high rate
(Gnapragasam et al. 2005). Therefore, those cultural methods that enhance growth are used such
as incorporation of organic matter, soil cultivation (forking) to prevent soil compaction and
remove hard pans that impede the normal replenishment of damaged and dying feeder roots,
fertilizer application, use of cover crops, planting antagonistic crops and irrigation (Gnapragasam
et al. 2005).
2.10 Influence of land use practices on abundance and diversity of nematodes
Biodiversity is the variety of life below the ground and it’s an indicator of sustainable land use
(Wachira et al. 2014. Soil hosts a wide range of microbes (fungi and bacteria), macrobes
12
(termites and earthworms) and mesofauna (acari, collembolan and nematodes) (Bardgett, 2005;
Wachira et al. 2014). The occurrence of this biodiversity is greatly affected by human activities.
Wachira et al. (2014) noted that land use affects soil characteristics like carbon percentage which
was highest in least disturbed land. Wachira et al. (2014) further noted that soil nematodes were
affected by land use types whereby they were least reported in tea land. This was attributed to
low biological activity in tea husbandry and the monocrop husbandry characteristic in tea
growing. Soil chemical properties, agro-ecological zones and land management levels also affect
the distribution and abundance of nematode species as noted by Nzesya et al. (2014). Nzesya et
al. (2014) noted that farms that are well managed had less plant parasitic nematodes.
13
CHAPTER 3: INFLUENCE OF FARMING PRACTICES ON THE ABUNDANCE AND
DIVERSITY OF PLANT PARASITIC NEMATODES IN SMALL SCALE TEA FARMS
IN KIRINYAGA AND THARAKA-NITHI COUNTIES OF KENYA
3.1 Abstract
Nematodes are known to be well distributed in tea farms. Farming practices are known to
influence positively or negatively the nematode populations. Studies were carried out to
determine the influence of farming practices on the abundance and diversity of nematodes in
small scale tea farms. The experiments were carried out in Kangaita, Kirinyaga County and
Weru, Tharaka-Nithi County using randomized complete block design. Three commonly used
farming practices were used as treatments. These farming practices were neglected farms,
inorganic fertilizer applied farms with regular weeding and prescribed pruning (standard) and
manure applied farms. Soil samples were randomly obtained from each farm representing
farming practices in three agro-ecological zones in each of the two study sites namely lower
highland sub zone 0 (LH0), lower highland subzone 1 (LH1) and upper medium subzone 1
(UM1). Nematodes were extracted from the soil samples in the laboratory using centrifugal
floatation technique. The extracted nematodes were identified, classified and quantified.
Nematodes from 23 genera were recovered in the two study sites representing all the five feeding
groups; plant feeders, fungal feeders, bacterial feeders, omnivores and predatory nematodes. Of
the 23 genera, 11 were plant feeders, 6 bacterial feeders, 3 fungal feeders 2 omnivores and 1
predatory nematode. Nematode numbers decreased from neglected farms to manure applied
farms to NPK fertilizer applied farms. The nematode species diversity was highest in neglected
farms followed by manure applied farms and lowest in inorganic fertilizer applied (Standard)

14
farms. Application of inorganic fertilizer (NPK) leads to reduction of both nematode abundance
and species diversity.
3.2 Introduction
Kirinyaga and Tharaka-Nithi counties are some of the major tea growing areas in Kenya
representing the Mt. Kenya region, others being Nyambene hills, the Mau escarpment, the
Aberdare ranges, Kericho highlands, Nandi hills and Kisii highlands (TBK, 2013). Tea is grown
in these areas mainly for export while a small percentage is consumed locally (TRFK, 2009;
TBK, 2013). Farmers engage in various cultural practices with the aim of maximizing profit
from their farms. The practices include inorganic fertilizer application manure application and
neglect of the farms. The practices affect the soil microorganisms which in turn affect not only
the nutrient availability and uptake of the plant, but also the health and productivity of the tea
plant (Hamid, 2006; Thenmonzi, 2012; Sultan et al. 2014). The study was carried out with the
aim of evaluating the impact of farming practices on the abundance and diversity of plant
parasitic nematodes.
3.3 Materials and Methods
3.3.1 Study area
The study was carried out in already established small-scale tea farms in Kirinyaga and Tharaka-
Nithi counties of Kenya. The two counties were chosen to allow for comparison between various
ecological zones. One tea factory catchment managed by KTDA was chosen per county. Each
factory catchment was zoned into three based on elevation, that is, high, medium and low
elevation as represented in agro-ecological zones LH0, LH1 and UM1 as described by Jaetzold
et al. (2010).

15
Three farms were randomly selected per farming practice of interest in each of the three zones in
each factory catchment with the help of the Agricultural Services Department of the KTDA
managed factories within the two counties. Kangaita area, Kirinyaga County was chosen because
it is located in high elevation with most of the farms lying above 2,000 meters above sea level
while Weru, Tharaka-Nithi County was chosen because most of its farms lie in low elevation of
about 1,400 meters above sea level.
3.3.2 Selection criteria for farming practices
Information used to classify the farms into the three farming practices were given by the tea
extension department in each of the factory where the study took place. A standard farm was
chosen if the farm was kept weed free throughout the year, inorganic fertilizer applied annually
and the tea farm pruned at the interval of three years as recommended. A manure applied farm
was selected if the farm followed same practice as a standard farm with additional application of
farmyard manure at recommended rates of one bucket per bush at the interval of three years. A
farm was considered neglected if it was left weedy and with neither inorganic fertilizer
application nor manure application for at least three years.
3.3.3 Experimental design
The experiments were set up in a randomized complete block design. Soil samples were
collected from different farms applying the three different farming practices. Three types of
agricultural/farming practices were considered across the ecological zones within the area of
study. These were non-cultivated (neglected) farms, cultivated farms with regular application of
NPK fertilizer and farms practicing organic farming with organic mulching and/or manure
application.
16
The factory catchments were zoned into three zones depending on elevation using agro
ecological zones as described by Jaetzold et al. (2010). Three farms per farming practice per
zone were selected and sampled. Five sub-samples were randomly obtained from each farm.
Twenty-seven samples were collected from the three farming practices replicated three times.
The samples were transported in a cool box to the laboratory for analysis.
3.3.4 Soil sampling
Random sampling was done in each farm under study. Five sub samples of 200g each were
collected in each farm using a soil auger from the surface to a depth of 45 cm. The soil sub
samples were thoroughly mixed to come up with a composite sample of 500g. Twenty-seven
farms were sampled per county making total sampled farms 54. The 54 samples were transported
to the laboratory in a cool box at 15oC for analysis. The samples were divided into three parts;
200g for nematode extraction, 200g for soil chemical properties and 100g library sample.
3.3.5 Extraction of nematodes from the soil, their identification and quantification
The nematodes were extracted using centrifugal floatation technique as described by Jenkins
(1964). This involved first dissolving the 200g soil sample in 5 liters of water in a bucket and
stirring to make homogenate slurry. The stirring was done to release the nematodes from the
soil. The slurry was then passed through sieves of fine apertures; 250µm, 150 µm and 38 µm
sieves. The slurry collected from the 38 µm aperture sieve was backwashed and loaded into 50
ml falcon tubes. The mixture in the tubes was centrifuged at 1700 rpm for 7 minutes. The
supernatant obtained from the first spin was discarded and the pellet was topped up with sugar
solution to balance at the 30ml mark. The sugar solution was prepared by dissolving 454g of
sugar in 1 liter of water. This formed a sugar solution at 1.18 s.g. The contents of the falcon
tubes topped up with the sugar solution underwent a second spin at 1700 rpm for 3 minutes. The

17
supernatant formed was then passed over a 38µm sieve and the contents backwashed to make a 3
ml nematode suspension. The suspension was placed in tubes and the nematodes were fixed
using formalin at 75oC. The nematodes were identified using morphological features to genus
level by observation through a compound microscope. The nematode numbers per genera were
determined by counting.
3.3.6 Statistical analysis
All statistical analysis was done using GENSTAT edition 14 statistical software. The data was
subjected to ANOVA. Comparison of treatment means was done and the data obtained
interpreted.
3.4 Results
Nematodes from 19 different families and 23 genera were recovered from the soil obtained from
the three farming practices in the two study sites; Kangaita and Weru (Table 3.1). These
nematodes could be grouped into the five main trophic levels namely herbivores/plant feeders
(PF), bacterial feeders (BF), Fungal feeders FF), omnivores (OM), and predatoty (PR) nematodes
as described by Yeates et al. (1993). The nematodes were assigned to the Colonizer-Persister
value (C-P Value) based on a scale of 1-5 as described by Bongers, (1990) (Table 3.1). C-P 1s
are colonizers characterized by short generation time while C-P 5s are persisters characterized by
long generation time.
Out of the 23 recovered nematode genera, eleven of them were plant parasitic nematodes (Plant
Feeders). The plant parasitic nematodes identified were Criconemella Spp., Filenchus Spp.,
Helicotylenchus Spp., Hemicyclophora Spp., Heterodera Spp., Longidorus Spp., Meloidogyne
Spp., Pratylenchus Spp., Rotylenchus Spp., Tricodorus Spp., and Tylenchus Spp (Tables 3.1).

18
Six genera of Bacterial feeders were identified and these included Alaimus, Cephalobus,
Cervidellus, Eucephalobus, Prismatolaimus, and Wilsonema. Three Fungal feeding nematode
genera were identified including Aphelenchus, Ditylenchus and Leptochus. Two genera of
Omnivorous nematodes identified were Dorylaimus and Prodorylaimus. Only one genus of
predatory nematodes was identified and this was Mononchus (Tables 3.1).
1. Table 3.1: Family, genera, C-P value and trophic groups of nematodes recovered at
Kangaita and Weru
Family Genera C-P Value Trophic Group
Alaimidae Alaimus 4 BF
Aphelenchidae Aphelenchus 2 FF
Cephalobidae Cephalobus 2 BF
Cephalobidae Cervidellus 2 BF
Criconematidae Criconemella 3 PF
Anguinidae Ditylenchus 2 FF
Dorylaimidae Dorylaimus 4 OM
Cephalobidae Eucephalobus 2 BF
Tylenchidae Filenchus 2 PF
Hoplolaimidae Helicotylenchus 3 PF
Hemicyclophoridae Hemicyclophora 3 PF
Heteroderidae Heterodera 2 PF
Leptonchidae Leptochus 4 FF
Longidoridae Longidorus 5 PF
Meloidogynidae Meloidogyne 3 PF
Monochidae Mononchus 4 PR
Pratylenchidae Pratylenchus 3 PF
Prismatolaimidae Prismatolaimus 3 BF
Bunonematidae Prodorylaimus 5 OM
Hoplolaimidae Rotylenchus 3 PF
Trichodoridae Trichodorus 4 PF

19
Tylenchidae Tylenchus 2 PF
Plectidae Wilsonema 2 BF
C-P – colonizer persister, PF – plant feeders, BF – bacterial feeders, FF – fungal feeders, PR –
predatory, OM - omnivores
Nematode numbers varied significantly (P<0.05) across the zones and among the farming
practices in both study sites (Tables 3.2 and 3.3). Generally, it was observed that the nematode
numbers were highest in neglected farms, followed by manure applied farms and least in NPK
fertilizer applied (standard) farms (Tables 3.2 and 3.3).

20
2. Table 3.2: Nematode species recovered at Kangaita and their distribution in the three farming practices across the three
zones
Zone Upper Medium Lower
Genus Normal Manure Neglected Normal Manure Neglected Normal Manure Neglected LSD C.V% P Value
Alaimus 5.00bcd 6.67de 8.67ef 2.67ab 6.00cde 9.67f 3.67bc 0.00a 9.67f 2.79 28.00 <.001
Aphelenchus 15.00b 32.67d 9.67a 19.33c 31.00d 16.00b 13.00b 37.67e 30.67d 3.05 7.70 <.001
Cephalobus 14.67ab 22.00c 21.67c 13.33a 22.33c 18.67bc 17.67abc 17.67abc 20.67c 5.04 15.60 0.012
Cervidellus 0.00a 0.00a 0.67b 0.00a 0.00a 0.67b 0.00a 0.00a 0.67b 0.61 159.10 0.045
Criconemella 13.33e 1.67a 6.33c 11.33d 2.67ab 3.67b 10.00d 3.67b 6.00c 1.76 15.60 <.001
Dorylaimus 2.33c 0.00a 0.00a 1.67b 0.00a 0.00a 2.00bc 0.00a 0.00a 0.45 39.50 <.001
Ditylenchus 0.00a 0.00a 2.33b 0.00a 0.00a 2.33b 0.00a 0.00a 2.00b 1.60 124.90 0.006
Eucephalobus 2.33a 17.67bc 26.00d 3.00a 15.00b 17.33bc 2.33a 19.33bc 19.33bc 4.91 20.60 <.001
Filenchus 2.67a 1.33a 18.67d 11.33c 3.33a 24.33e 6.67b 1.67a 18.67d 2.60 15.30 <.001
Helicotylenchus 3.67ab 1.67a 5.67bc 5.33bc 2.67a 6.33c 9.67d 2.67a 9.67d 2.01 22.10 <.001
Hemicyclophora 0.00a 0.00a 2.67b 0.00a 0.00a 3.00b 0.00a 0.00a 3.33b 1.71 99.30 <.001
Heterodera 0.00a 0.00a 1.00ab 0.00a 0.00a 1.33b 0.00a 0.00a 1.33b 1.09 159.90 0.034
Leptonchus 9.33cd 6.33abc 9.00cd 4.33a 9.00cd 10.67d 8.33bcd 5.00ab 11.33d 3.54 25.20 0.007
Longidorus 1.33ab 3.33c 1.00ab 0.00a 3.67c 1.00ab 0.00a 2.33bc 1.00ab 1.48 56.30 <.001
Meloidogyne 0.00a 10.33b 37.67e 25.00d 63.67g 41.67f 14.33c 7.67b 34.00e 3.78 8.40 0.005
Mononchus 0.67ab 2.00b 5.33c 0.00a 1.33ab 5.33c 0.00a 2.00b 6.00c 1.8 41.50 <.001
Pratylenchus 0.00a 0.00a 1.67b 0.00a 0.00a 1.67b 0.00a 0.00a 1.67b 1.22 127.30 0.007
Primastolaimus 0.00a 8.67bc 8.33bc 0.00a 11.00cd 7.33b 0.00a 12.00d 8.33bc 3.13 29.30 <.001
Prodorylaimus 0.00a 0.67ab 3.67e 0.00a 0.67ab 1.67cd 0.00a 1.00bc 2.00d 0.92 49.90 <.001
Rotylenchus 0.00a 0.00a 5.67bc 0.00a 0.00a 6.00c 0.00a 0.00a 4.67b 1.33 42.40 <.001
Trichodorus 0.00a 0.00a 3.33c 0.00a 0.00a 2.67bc 0.00a 0.00a 2.33b 0.85 53.50 <.001
Tylenchus 8.33bc 4.67a 16.67d 9.67c 4.33a 21.00e 10.67c 6.00ab 36.00f 3.13 13.90 <.001
Wilsonema 4.33c 0.00a 22.00c 6.67b 0.00a 25.00c 4.67b 0.00a 25.00c 3.13 18.80 <.001
Means followed by a different letter(s) within the same row are significantly different. Upper - LH0, Medium - LH1, Lower - UM1
21
3. Table 3.3: Nematode species recovered at Weru and their distribution in the three farming practices across the three zones
Zone Upper Medium Lower
Genus Normal Manure Neglected Normal Manure Neglected Normal Manure Neglected LSD C.V% P Value
Alaimus 1.00a 0.00a 7.00b 1.00a 0.00a 7.33b 1.00a 0.00a 7.00b 2.14 45.90 <.001
Aphelenchus 8.00c 11.00d 2.33a 5.33b 13.00d 4.67ab 4.67ab 16.33e 4.00ab 2.41 18.10 <.001
Cephalobus 3.33b 25.33f 6.67c 1.33a 22.67e 13.33d 3.67b 25.33f 8.00c 1.70 8.00 <.001
Cervidellus 0.00a 0.00a 0.67b 0.00a 0.00a 0.67b 0.00a 0.00a 0.67b 0.57 150.00 0.029
Criconemella 8.33e 5.67bc 4.67b 7.33cde 7.67de 1.33a 8.33e 6.33bcd 4.67b 1.67 16.10 <.001
Dorylaimus 0.00a 1.33b 4.33c 0.00a 1.33b 4.00c 0.00a 1.33b 3.33c 1.30 43.20 <.001
Ditylenchus 0.00a 0.00a 1.33b 0.00a 0.00a 1.67b 0.00a 0.00a 1.33b 0.60 72.10 <.001
Eucephalobus 7.67b 14.67cd 25.33f 5.33ab 12.00c 14.67cd 4.33a 15.67d 20.67e 2.94 12.70 <.001
Filenchus 2.00a 8.33b 17.00c 3.33a 5.33ab 17.67cd 4.33ab 8.67b 22.33d 4.78 28.00 <.001
Helicotylenchus 2.33a 4.33abc 8.33e 2.67ab 2.67ab 7.67de 6.33cde 5.33bcd 7.00cde 2.92 32.60 0.002
Hemicyclophora 0.00a 0.00a 6.00b 0.00a 0.00a 7.33b 0.00a 0.00a 6.67b 1.64 42.80 <.001
Heterodera 0.00a 0.00a 6.33b 0.00a 0.00a 6.67b 0.00a 0.00a 7.00b 1.75 45.60 <.001
Leptonchus 0.00a 1.67b 4.67c 0.33ab 1.67b 3.33c 0.00a 1.33ab 3.33c 1.54 49.30 <.001
Longidorus 0.00a 0.00a 2.33c 0.00a 0.00a 1.67b 0.00a 0.00a 1.33b 0.60 58.50 <.001
Meloidogyne 8.33ab 5.00a 23.67c 10.33b 10.00b 22.00c 10.33b 10.00b 24.33c 3.73 15.70 <.001
Mononchus 0.67a 2.00b 4.00c 0.67a 2.00b 5.33d 2.33b 2.33b 5.00cd 1.30 27.80 <.001
Pratylenchus 3.67b 0.00a 7.33c 3.33b 0.00a 7.00c 1.67ab 0.00a 6.67c 2.14 37.60 <.001
Primastolaimus 1.67b 0.00a 6.33c 1.67b 0.00a 6.67cd 1.33ab 0.00a 8.00d 1.54 31.40 <.001
Prodorylaimus 0.00a 0.00a 1.67b 0.00a 0.00a 1.33b 0.00a 0.00a 1.33b 0.75 90.50 <.001
Rotylenchus 4.33a 0.00a 123.33c 2.00a 0.00a 110.33b 4.67a 0.00a 127.33c 8.85 12.40 <.001
Trichodorus 0.00a 0.00a 2.33b 0.00a 0.00a 2.00b 0.00a 0.00a 2.00b 0.69 57.20 <.001
Tylenchus 5.00a 8.67ab 45.67f 7.33ab 11.00bc 38.33e 18.67d 14.33c 52.00g 4.29 11.10 <.001
Wilsonema 0.00a 2.00b 1.33ab 0.00a 1.33ab 1.67b 0.00a 1.67b 2.00b 1.49 77.90 <.001
Means followed by a different letter(s) within the same row are significantly different. Upper - LH0, Medium - LH1, Lower - UM1
22
The nematode numbers varied significantly (P<0.05) among the three farming practices in the two
study sites (Tables 3.4 and 3.5). At Kangaita, seven nematode species recorded in the neglected
tea farms were not recorded in the other two farming practices. These nematodes include
Cervidellus spp., Ditylenchus spp., Hemicyclophora spp., Heterodera spp., Pratylenchus spp.,
Rotylenchus spp., and Trichodorus spp. (Table 3.4). Similarly, at Weru, seven nematode species
recorded in the neglected teas farms were not recorded in the other two farming practices. These
include Cervidellus spp., Ditylenchus spp., Hemicyclophora spp., Heterodera spp., Longidorus
spp., Prodorylaimus spp., and Trichodorus spp. (Table 3.5).

23
4. Table 3.4: Nematode numbers and their distribution in the different farming practices at
Kangaita
Genus Manure Standard Neglected LSD C.V% P Value
Alaimus 4.22a 3.78a 9.33b 2.31 39.90 <.001
Aphelenchus 33.78b 15.78a 18.78a 6.01 26.40 <.001
Cephalobus 20.67b 15.22a 20.33b 3.51 18.70 0.007
Cervidellus 0.00a 0.00a 0.67b 0.29 129.90 <.001
Criconemella 2.67a 11.56c 5.33b 1.60 24.50 <.001
Dorylaimus 0.00a 2.00b 0.00a 0.29 43.30 <.001
Ditylenchus 0.00a 0.00a 2.22b 0.86 115.50 <.001
Eucephalobus 17.33b 2.56a 21.44c 3.26 23.70 <.001
Filenchus 2.11a 6.89b 20.56c 2.03 20.60 <.001
Helicotylenchus 2.33a 6.22b 7.22b 1.64 31.30 <.001
Hemicyclophora 0.00a 0.00a 3.00b 0.87 86.60 <.001
Heterodera 0.00a 0.00a 1.22b 0.56 137.70 <.001
Leptonchus 6.78a 7.33a 10.33b 2.91 35.70 0.042
Longidorus 3.11b 0.44a 1.00a 0.88 57.90 <.001
Meloidogyne 27.22b 13.11a 37.78b 13.61 52.30 0.005
Mononchus 1.78b 0.22a 5.56c 0.89 35.20 <.001
Pratylenchus 0.00a 0.00a 1.667b 0.58 103.90 <.001
Primastolaimus 10.56c 0.00a 8.00b 1.86 30.10 <.001
Prodorylaimus 0.78b 0.00a 2.44c 0.71 65.50 <.001
Rotylenchus 0.00a 0.00a 5.44b 0.82 45.30 <.001
Trichodorus 0.00a 0.00a 2.78b 0.48 52.00 <.001
Tylenchus 5.00a 9.56a 24.56b 4.93 37.80 <.001
Wilsonema 0.00a 5.22b 24.00c 1.84 18.90 <.001
Numbers followed by a different letter within the same row are significantly different

24
5. Table 3.5: Nematode numbers and their distribution in the different farming practices at
Weru
Genus Manure Standard Neglected LSD C.V% P Value
Alaimus 0.00a 1.00a 7.11b 1.14 42.00 <.001
Aphelenchus 13.44c 6.00b 3.67a 2.32 30.10 <.001
Cephalobus 25.00c 2.78a 9.33b 2.74 22.20 <.001
Cervidellus 0.00a 0.00a 0.67b 0.29 129.90 <.001
Criconemella 6.56b 8.00b 3.56a 1.54 25.60 <.001
Dorylaimus 1.33b 0.00a 3.89c 0.69 39.90 <.001
Ditylenchus 0.00a 0.00a 1.44b 0.30 63.20 <.001
Eucephalobus 14.11b 5.78a 20.22c 2.69 20.20 <.001
Filenchus 7.44b 3.22a 19.00c 2.95 29.80 <.001
Helicotylenchus 4.11a 3.78a 7.67b 1.94 37.50 <.001
Hemicyclophora 0.00a 0.00a 6.67b 0.91 41.10 <.001
Heterodera 0.00a 0.00a 6.67b 0.99 45.00 <.001
Leptonchus 1.56b 0.11a 3.78c 0.84 46.20 <.001
Longidorus 0.00a 0.00a 1.78b 0.38 65.00 <.001
Meloidogyne 8.33a 9.67a 23.33b 2.55 18.60 <.001
Mononchus 2.11b 1.22a 4.78c 0.81 29.80 <.001
Pratylenchus 0.00a 2.89b 7.00c 1.15 35.00 <.001
Primastolaimus 0.00a 1.56b 7.00c 0.89 31.40 <.001
Prodorylaimus 0.00a 0.00a 1.44b 0.42 87.10 <.001
Rotylenchus 0.00a 3.67a 120.33b 6.23 15.10 <.001
Trichodorus 0.00a 0.00a 2.11b 0.35 49.30 <.001
Tylenchus 11.33a 10.33a 45.33b 3.74 16.80 <.001
Wilsonema 1.67b 0.00a 1.67b 0.87 77.90 <.001
Numbers followed by a different letter within the same row are significantly different

25
The distribution of the number of nematode species across the zones was not significantly
different (P >0.05) at both study sites (Tables 3.6 and 3.7). At Kangaita study site, only five out
of the twenty-three nematode genera had significant difference in distribution of the nematode
numbers (P<0.05) across the zones. These were Aphelenchus, Filenchus, Helicotylenchus,
Meloidogyne and Tylenchus (Table 3.6). At Weru Study site only three genera out of the twenty-
three recovered had their numbers having significantly difference in their distribution (P<0.005)
across the three zones. These were Eucephalobus, Filenchus and Tylenchus (Table 3.7)

26
6. Table 3.6: Nematode numbers and their distribution in the different zones at Kangaita
Genus Upper Medium Lower LSD C.V%
Alaimus 6.78a 6.11a 4.44a 2.38 41.4
Aphelenchus 19.11a 22.11ab 27.11b 6.01 26.4
Cephalobus 19.44a 18.11a 18.67a 3.41 18.2
Cervidellus 0.22a 0.22a 0.22a 0.35 159.1
Criconemella 7.11a 5.89a 6.56a 1.6 24.6
Dorylaimus 0.77a 0.55a 0.66a 0.26 39.5
Ditylenchus 0.78a 0.78a 0.67a 0.64 86.7
Eucephalobus 15.33a 11.78a 14.22a 3.35 24.3
Filenchus 7.56a 13.00b 9.00a 2.08 21.2
Helicotylenchus 3.66a 4.77a 7.33b 1.63 31.2
Hemicyclophora 0.89a 1.00a 1.11a 0.9 90.5
Heterodera 0.33a 0.44a 0.44a 0.53 131.5
Leptonchus 8.22a 8.00a 8.22a 2.82 34.7
Longidorus 1.89a 1.56a 1.11a 0.93 61.4
Meloidogyne 16.00a 43.44b 18.67a 13.56 52.1
Mononchus 2.67a 2.22a 2.67a 0.96 38.2
Pratylenchus 0.56a 0.56a 0.56a 0.7 127.3
Primastolaimus 5.67a 6.11a 6.78a 1.62 26.3
Prodorylaimus 1.44a 0.78a 1.00a 0.73 68.2
Rotylenchus 1.88a 2.00a 1.55a 0.48 26.5
Trichodorus 1.11a 0.89a 0.78a 0.54 59.2
Tylenchus 9.89a 11.67a 17.56b 4.79 36.8
Wilsonema 8.78a 10.56a 9.89a 1.79 18.4
Numbers followed by a different letter within the same row are significantly different

27
7. Table 3.7: Nematode numbers and their distribution in the different zones at Weru
Genus Upper Medium Lower LSD C.V%
Alaimus 2.67a 2.78a 2.67a 1.17 43.3
Aphelenchus 7.11a 7.67a 8.33a 2.21 15.3
Cephalobus 12.33a 12.44a 12.33a 2.81 22.8
Cervidellus 0.22a 0.22a 0.22a 0.28 129.9
Criconemella 6.22a 5.44a 6.44a 1.53 25.4
Dorylaimus 1.89a 1.78a 1.56a 1.71 41
Ditylenchus 0.44a 0.55a 0.44a 0.34 72.1
Eucephalobus 15.89a 10.67a 13.56b 2.81 21.1
Filenchus 9.11a 8.77a 11.77b 2.47 24
Helicotylenchus 5.00a 4.33a 6.22a 1.78 34.4
Hemicyclophora 2.00a 2.44a 2.22a 0.8 36.4
Heterodera 2.11a 2.22a 2.33a 0.44 19.8
Leptonchus 2.11a 1.78a 1.56a 0.81 44.8
Longidorus 0.77a 0.55a 0.44a 0.41 70.8
Meloidogyne 12.33a 14.11a 14.89b 2.14 15.6
Mononchus 2.22a 2.67a 3.22a NS 31.3
Pratylenchus 3.67a 3.44a 2.78a 1.06 32.3
Primastolaimus 2.67a 2.78a 3.11a 0.96 34
Prodorylaimus 0.55a 0.44a 0.44a 0.28 58.3
Rotylenchus 42.60a 37.40a 44.00b 5.85 14.2
Trichodorus 0.77a 0.66a 0.66a 0.4 57.2
Tylenchus 28.33b 18.89a 19.78a 3.85 5.8
Wilsonema 1.11a 1.00a 1.22a 0.88 79.4
Numbers followed by a different letter within the same row are significantly different

28
The numbers of nematode trophic levels, nematode abundance and nematode species diversity
were significantly distributed (P<0.05) across the zones and among the farming practices in both
study sites (Tables 3.8). Generally, it was observed that the plant parasitic nematodes were
highest in neglected farms, followed by manure applied farms and least in NPK fertilizer applied
(Standard) farms. Similarly, nematode abundance and species diversity was highest in neglected
farms, followed by manure applied farms and least in NPK fertilizer applied (standard) farms
(Table 3.8)

29
8. Table 3.8: Nematode trophic levels, abundance and species diversity and their distribution in different farming practices across
the three agro ecological zones at Kangaita and Weru
Zone Upper Medium Lower
Farming
practice Standard Manure Neglected Standard Manure Neglected Standard Manure Neglected LSD C.V%
P
Value
Kangaita
PPN 29.33a 23.00a 100.33e 62.67c 80.33d 112.67f 51.33b 24.00a 118.67f 6.44 5.6 <.001
BF 26.33a 55.00b 87.33d 25.67a 54.33b 78.67c 28.33a 49.00b 85.33cd 6.68 7.1 <.001
FF 24.33ab 39.00c 21.00a 23.63a 40.00c 29.00b 21.33a 42.67c 44.00c 5.05 9.2 <.001
PR 0.00a 2.33b 5.33c 0.00a 1.33ab 5.33c 0.00a 2.00b 6.00c 1.54 36.1 <.001
OM 2.33c 0.67a 3.67d 1.67abc 0.67a 1.67abc 2.00bc 1.00ab 2.00bc 1.03 34.3 <.001
Total 82.30a 120.00c 217.70e 113.70bc 176.70d 227.30e 104.00b 118.70c 256.00f 12.53 4.6 <.001
Species 12.00a 13.67b 21.00c 12.00a 13.67b 20.67c 12.00a 13.00ab 21.00c 1.2 4.5 <.001
Weru
PPN 34.00a 32.00a 247.00d 36.30a 36.70a 222.00c 54.30b 44.70ab 261.3d 14.5 7.8 <.001
BF 13.67b 43.67de 47.33e 9.33a 36.00c 44.33de 10.33ab 42.67d 46.33de 4.28 7.6 <.001
FF 8.00bc 12.67d 8.33bc 5.67ab 14.67d 9.67c 4.67a 17.67e 8.67c 2.75 15.9 <.001
PR 0.67a 2.00b 4.00c 0.67a 2.00b 5.33d 2.33b 2.33b 5.00cd 1.3 13.2 <.001
OM 0.00a 1.33a 6.00b 0.00a 1.33a 5.33b 0.00a 1.33a 4.67b 1.39 36.4 <.001
Total 56.30a 91.70b 312.70cd 52.00a 90.70b 286.70c 71.70ab 91.30b 326.00d 27.46 10.4 <.001
Species 11.67a 13.00b 22.33c 11.00a 11.67a 22.33c 12.00ab 13.00b 22.33c 1.13 4.2 <.001
Means followed by a different letter(s) within the same row are significantly different. PPN – plant parasitic nematodes, BF – bacterial
feeders, FF – fungal feeders, PR – predators, OM – Omnivores, Total – nematode abundance, Species – Species diversity, Upper - LH0,
Medium - LH1, Lower - UM1

30
The total nematode numbers varied significantly (P<0.05) among the different farming practices
in the two study sites (Tables 3.9). Nematode abundance and species diversity varied
significantly (P<0.05) among the three farming practices in both study sites (Table3.9).
Nematode abundance was highest in neglected farms in both study sites while it was lowest in
standard farms. Nematode diversity was highest in the neglected farms while it was lowest in the
standard farms in the two study sites (Table 3.9). All the five trophic groups had a significant
difference (P<0.005) in distribution in the three farming practices in both study sites. The
nematode trophic levels also varied significantly (P<0.05) with the different farming practices
(Table 3.8). In both sites, plant parasitic nematodes were highest in neglected farms followed by
standard farms and lowest in manure applied farms, BF were highest in neglected farms followed
by manure farms and lowest in standard farms. Fungal feeders were highest in manure farms
followed by neglected farms and lowest in standard farms, predatory nematodes were highest in
neglected farms followed by manure farms and lowest in standard farms. Omnivorous nematodes
were highest in neglected farms. The omnivorous nematodes were however lowest in manure
farms for Kangaita site while they were lowest in standard farms for Weru site.
Across the zones in the two study sites, the numbers of plant parasitic nematodes, nematode
abundance and species diversity had a significant difference (P<0.005) in distribution. At
Kangaita, the numbers of bacterial feeders, fungal feeders, predatory and omnivorous
nematodes’ distribution was not significantly different (P>0.005) while at Weru, the numbers of
fungal feeders, predatory and omnivorous nematodes did not show significant difference
(P>0.005) in distribution across the zones (Table 3.10).
31
9. Table 3.9: Distribution of nematodes trophic levels, nematode abundance and nematode
species diversity different farming practices at Kangaita and Weru
Nematodes Manure Standard Neglected LSD C.V%
PPN 42.44a 47.78a 110.56b 14.84 22.2
Kangaita
BF 52.78b 26.78a 83.78c 4.351 8
FF 40.56c 23.11a 31.33b 6.55 20.7
PR 1.89b 0.00a 5.56c 0.723 29.1
OM 0.78a 2.00b 2.44b 0.673 38.7
Abundance 138.4b 100.0a 233.7c 19.76 12.6
Diversity 13.44b 12.00a 20.89c 0.697 4.5
Weru
PPN 37.8a 41.6a 243.4b 11.07 10.3
BF 40.78b 11.11a 46.00c 2.693 8.3
FF 15.00c 6.11a 8.89b 2.241 22.4
PR 2.11b 1.22a 4.78c 0.805 29.8
OM 1.33b 0.00a 5.33c 0.763 34.4
Abundance 91.20b 60.00a 308.40c 16.4 10.7
Diversity 12.56b 11.56a 22.33c 0.693 4.5
Means followed by different letters within the same row are significantly different, PPN – Plant
parasitic nematodes (plant feeders), BF – bacterial feeders, FF – Fungal feeders, PR – predatory
nematodes, OM – omnivorous nematodes

32
10. Table 3.10: Distribution of nematodes trophic levels, nematode abundance and
nematode species diversity across zones at Kangaita and Weru
Nematodes Upper Medium Lower LSD C.V%
PPN 50.89a 85.22b 64.67a 14.77 22.1
Kangaita
BF 56.22a 52.89a 54.22a 4.52 8.3
FF 29.10a 30.90a 36.00a 7.59 20.8
PR 2.56a 2.22a 2.67a 0.9 36.4
OM 2.02a 1.33a 1.67a 0.72 41.6
Abundance 140.00a 172.60b 159.60ab 19.61 3.4
Diversity 15.56a 15.44a 15.33a 0.69 4.5
Weru
PPN 104.30a 98.30a 120.10b 9.92 9.2
BF 34.89b 29.89a 33.11b 2.77 8.5
FF 9.67a 10.00a 10.33a 2.34 23.5
PR 2.22a 2.67a 3.22a 0.84 31.3
OM 2.44a 2.22a 2.00a 0.78 35.2
Abundance 153.60ab 143.10a 163.00b 15.04 9.8
Diversity 15.67a 15.00a 15.78a 0.86 4.4
Means followed by different letters within the same row are significantly different, PPN – Plant
parasitic nematodes (plant feeders), BF – bacterial feeders, FF – Fungal feeders, PR – predatory
nematodes, OM – omnivorous nematodes

33
3.6 Discussion
This study showed that nematode abundance and diversity varied depending on the farming
practice used by farmers. Neglected farms had the highest nematode numbers and species
diversity compared to standard and manure applied farms. The neglected farms are characterized
by long-term freedom from human interference in terms of cultivation/weeding, fertilizer
application, plucking and other cultural practices associated with tea farming. As a result, these
farms end up having high above ground plant diversity and high organic matter. The natural
balance in such an ecosystem promotes prolific growth of nematode numbers and survival of
diverse nematode species hence high nematode diversity (Maina et al. 2009; Wachira et al.
2014).
The standard farming practice involves regular weeding and application of inorganic fertilizer
once or twice every year. In order to maximize production per bush from the tea plant, farmers
have a tendency of applying inorganic fertilizer above the recommended rate (TBK 2013). This
excess application of fertilizers boost productivity in the short period but in the long run has
more detrimental effects. The farms become over dependent on chemical fertilizers to produce
and becomes unproductive in the long run. The chemical fertilizer (NPK) lock nutrients in the
soil and render them unavailable for uptake by the plants (Hamid, 2006; Thenmonzi, 2012;
Sultan et al. 2014). The fertilizer also makes the soil acidic, which makes survival conditions for
nematodes unfavorable leading to decline in their numbers (Thenmonzi, 2012).
The manure applied farms follow the same cultural practice as standard farming practice with an
additional application of animal manure and other organic mulch. Due to application of manure
in these farms, the use of inorganic fertilizer is minimized. The amount of organic matter in such
farms is relatively high compared to farms without manure application. This promotes robust

34
growth of soil microorganisms including soil nematodes. It also promotes good growth and
health of the tea plant.
This study results agree with other studies conducted earlier which revealed that increased
disturbance in an ecosystem in terms of intensity of cultivation leads to decrease in nematode
abundance, species richness and species composition (Bloemers et al. 1997; Bongers and
Bongers. 1998; Yeates et al. 1999). This in the long run interferes with the functions of an
ecosystem (Giller et al. 1997). Human interference in an agro ecosystem alters both the density
and heterogeneity of plant communities (Kimenju et al. 2005). This in turn plays a role in
restructuring nematode communities, which depend on the plants (Yeates, 1999). It has also been
revealed that destruction of natural forests to pave way for establishment of a single species
plantation results to a decline in nematode abundance and species richness (Kimenju et al. 2005).
From the survey, it was observed that the nematodes in the genus Meloidogyne are well
distributed in the tea farms in the two study sites. This is because tea plants are host to the plant
parasitic nematode and supports its proliferation. This is consistent with a research carried earlier
in India which concluded that root knot nematodes, Meloidogyne javanica, Meloidogyne
incognita and Meloidogyne brevica, are widely distributed in tea plants (Glover, PM., 1961).
Five trophic groups of nematodes were recovered in the study areas. These are herbivores,
bacteriovores, fungivores, omnivores and predators. This is due to the natural balance of
nematode communities in their trophic levels in the ecosystem. The availability of the tea plant
leads to proliferation of plant parasitic nematodes and the fungus supported by decomposing
organic matter around the plant supports growth of fungal feeders. There is a large amount of
bacteria around the rizosphere of the tea plants (Kibet et al. 2013) which supports the growth of

35
fungal feeders. The mix of these three trophic levels supports the growth of predatory and
omnivorous nematodes. This finding is in line with many research findings which have
indicated that the five trophic levels are represented in almost every soil sample (Freckman and
Baldwin, 1990; Kibet et al. 2013).
Nematodes of Aphelenchus spp. were widespread in the tea fields of both Kangaita and Weru.
The nematode is a fungal feeder. The numbers of proliferate in tea farms due to high availability
of fungus in the tea farms (Kibet et al. 2013). The high amount of fungus in the tea farms is
supported by the availability of high amount of decomposing matter (Kibet et al. 2013) from old
tea leaves, pruned shoots and branches, organic mulch and manure applied to tea farms. These
findings agree with studies previously conducted in tea fields (Kibet et al. 2003; Kimenju et al.
2009).
The study also reveals that more nematode species are found in tea farms than those observed
earlier in other studies. Kibet et. al. (2003) reported 16 genera of nematodes in their study while
this study revealed that 23 genera of nematodes were found to thrive in tea farms. The zones did
not have an effect in nematode species diversity in both Kangaita nand weru study sites.
In conclusion, the neglected farming practice had high nematode numbers as compared to
standard and manure applied farms. The weeds in the neglected farms contributed to the high
nematode numbers. Standard farming practice had the least nematode numbers and nematode
species diversity. The manure application farming practice is recommended because despite it
having high nematode numbers as compared to the standard farm, it promotes rapid growth of
the plant which counters effect of nematode attack leading to high yield of the tea bushes. The

36
farming practices influenced nematode species abundance and numbers in the nematode trophic
levels across the agro ecological zones.

37
CHAPTER 4: INFLUENCE OF FARMING PRACTICES ON THE CHEMICAL
PROPERTIES OF SOIL IN SMALL SCALE TEA FARMS IN KIRINYAGA AND
THARAKA-NITHI COUNTIES OF KENYA
4.1 Abstract
Chemical properties of a soil are important in plant growth as they determine the nutrient
availability for uptake for the plant. Experiments were set up in Kangaita, Kirinyaga County, and
Weru, Tharaka-Nithi County using randomized complete bock design to establish the influence
of farming practices on the chemical properties of soil. The study was carried out with the aim of
understanding the role of the farming practices on the availability of soil nutrients, its effect on
tea productivity and the abundance and diversity of soil nematodes. Each study site was divided
into three zones depending on elevation and three farming practices identified within each zone
namely neglected farms, manure applied farms and chemical fertilizer (NPK) applied farm. Soil
samples were collected randomly from farms in each zone and analyzed for chemical properties
and nematodes were extracted from each sample, quantified and identified. A correlation
analysis for the nutrients and nematode species was conducted. The soil chemical analysis
yielded results for both macro and micro nutrients, exchangeable acidity, total organic carbon
and soil pH. Soil acidity increased from neglected farms through manure applied farms to NPK
fertilizer applied (standard) farms. There was a significant positive correlation between the
nematode trophic levels and the total nitrogen and total organic carbon. There was however a
significant negative correlation between soil pH, exchangeable acidity, magnesium, sodium,
potassium, calcium and other trace elements in the soil. The soils had generally low levels of
potassium, magnesium and zinc due to rapid removal through harvesting of the young shoots and
leaves. Increase in soil organic matter and soil nitrogen leads to increase in nematode trophic

38
groups. This means that an increase in total organic carbon or total nitrogen led to an increase in
plant parasitic nematodes. It also led to an increase in nematode abundance and species diversity.
However, increase in soil acidity, exchangeable acidity and other macro and micro nutrients led
do decrease in nematode trophic groups. This means that increase in macro and micro nutrients
leads to decrease in plant parasitic nematodes.
4.2 Introduction
Chemical properties of soil determine availability of nutrients for uptake by plants. The balance
of both macro and micro nutrients in any soil plays a vital role in plant growth. The interactions
of the nutrients also affect the availability of each other either positively or negatively (Hamid,
2006; Thenmonzi, 2012; Sultan et al. 2014). Various cultural practices including weeding,
fertilizer application and even harvesting of farm produce affect the nutrient composition and
balance in the soil which in turn affect the performance of crops in terms of productivity. Other
factors like leaching and surface run off also play a role in soil physical and chemical
composition.
Tea is cultivated using a number of cultural practices which are aimed at increasing the
productivity of the tea plant. These cultural practices include weeding, pruning, fertilizer
application and plucking/harvesting rounds (TBK, 2013). These practices greatly affect
biodiversity in the soil (Wachira et al. 2014). Soil biodiversity is the variety of life below the
ground and it’s an indicator of sustainable land use (Wachira et al. 2014). Soil hosts a wide range
of microbes (fungi and bacteria), macrobes (termites and earthworms) and mesofauna (acari,
collembolan and nematodes) (Bardgett, 2005; Wachira et al. 2014). Wachira et al. (2014) noted
that land use affects soil characteristics like organic carbon which was highest in least disturbed
land. Wachira et al. (2014) further noted that soil nematodes were affected by land use types and

39
they were least reported in tea farms. This was attributed to low biological activity in tea
husbandry and the monocrop husbandry characteristic in tea growing. Soil chemical properties,
agro-ecological zones and land management levels also affect the distribution and abundance of
nematode species (Nzesya et al. 2014). Nzesya et al. (2014) also noted that farms that are well
managed had less plant parasitic nematodes. The amount of organic matter in the soil affects the
health and performance of the plants. The organic matter acts to suppresses parasitic
microorganisms like nematodes thus improving the health of the tea plants (TBK, 2003; Sultan et
al. 2014).
Farmers use chemical fertilizers in the cultivation of tea, mainly Di ammonium phosphate (DAP)
during nursery establishment and planting and nitrogen phosphorus potassium (NPK) for top
dressing (TBK, 2003). Excessive application of fertilizer can cause imbalance in nutrient uptake
and fix some nutrients leading to poor performance of the tea plant (Hamid, 2006; Thenmonzi,
2012; Sultan et al. 2014). NPK fertilizer application rate in Kenya’s small scale holder tea
farming is recommended at 50kgs per 700 bushes (TBK, 2003). The study was carried out to
establish the influence of farming practices on soil chemical characteristic and the influence of
the soil chemical characteristics on the abundance and diversity of soil nematodes.
4.3 Materials and methods
The study area, site selection, experimental design and soil sampling was done as described in
sections 3.3.1, 3.3.2, 3.3.3 and 3.3.4 respectively. Two hundred grams of soil from the farms in
each zone was analyzed for physical and chemical characteristics and this related to the
nematode diversity and abundance. The analysis determined the soil pH, exchangeable acidity,
total nitrogen (N), total organic carbon (TOC), available nutrient elements (phosphorus (P),
potassium (K), sodium (Na), calcium (Ca), magnesium (mg) and manganese (Mn) and available

40
trace elements (Iron (Fe), zinc (Zn) and copper (Cu). Soil pH was determined in a 1:1 (w/v) soil
– water suspension with a pH meter.
Exchangeable acidity was determined using the titration method. The soil was oven dried at 400
C. Five grams of the oven dried soil sample (< 2mm) was placed into a 50ml container. This was
followed by addition of 125ml of 1 M KCl to the container and the contents were stirred using a
clean glass rod. The mixture was allowed to stand for 30 minutes. The mixture was filtered
through a funnel and leached with 5 successive 12.5ml aliquots of 1 M KCl. Three drops of
phenolphthalein indicator solution were added and then titrated with 0.1 M NaOH to the first
permanent pink color of the end point. The burette was read and the volume (ml) of NaOH used
was recorded. The titration readings were corrected for a blank of titration of 75 ml KCl solution.
Total nitrogen was determined using Kjeldahl method. Two grams of the soil sample (< 0.5mm)
was oven dried at 400
C and digested with concentrated sulphuric acid containing potassium
sulphate, selenium and copper sulphate hydrated at approximately 3500C. Total nitrogen was
determined by distillation followed by titration with diluted standardized 0.1 M NaOH.
Total organic carbon was determined using the calorimetric method. All the organic carbon in
the oven dried soil sample (< 0.5mm) at 400C was oxidized by acidified dichromate at 150
0C for
30 minutes to ensure complete oxidation. Barium chloride was added to the cool digests. After
mixing thoroughly, the digests were allowed to stand overnight. The carbon concentration was
read on the spectrophotometer at 600nm.
Available nutrient elements (P, K, Na, Mg and Mn) were determined using the Mehlich Double
Acid method. The oven dry soil samples at 400 C (< 2mm) were extracted in a 1:5 ratios (w/v)

41
with a mixture of 0.1 M HCl and 0.025 M H2SO4. Na, Ca and K were determined using a flame
photometer. P, Mg and Mn were determined spectrophotometrically.
Available trace elements (Fe, Zn and Cu) were determined by the atomic absorption
spectrophotometer (AAS). The oven dry (at 400 C) soil samples (<2mm) were extracted in a 1:10
ratio (w/v) with 0.1 M HCl. The elements were then determined with the AAS. A correlation
analysis for soil pH, exchangeable acidity, total organic carbon, macro and micro nutrients and
nematode trophic levels, abundance and diversity was conducted using Genstat edition 14.
4.4 Results
4.4.1 Soil chemical analysis
Soil chemical analysis conducted yielded results for soil pH, exchangeable acidity, total nitrogen,
total organic carbon, phosphorus, potassium, calcium, magnesium, manganese, copper, iron, zinc
and sodium. At Kangaita, the figures ranged as follows; pH 3.0-4.95, exchangeable acidity (me
%) 0.3-0.5, total nitrogen (me %) 0.54-5.5, total organic carbon (%) 5.6-8.17, phosphorus (ppm)
50-180, potassium (me%) 0.2-2.79, (Table 4.1). At Weru, the figures ranged as follows; pH 4.0-
5.2, exchangeable acidity (me%) 0.2-0.5, total nitrogen (me%) 0.14-0.4, total organic carbon (%)
1.3-3.95, phosphorus (ppm) 5-25, potassium (me%) 0.22-0.78 (Table 4.2).

42
11. Table 4.1: Soil chemical properties in different farming practices across the agro ecological zones in Kangaita
Zone Upper Medium Lower
Farming practice Standard Manure Neglected Standard Manure Neglected Standard Manure Neglected LSD C.V%
Soil pH 3.00a 4.05d 4.07d 3.80c 3.32b 4.25e 3.02a 4.01d 4.08d 0.15 2.4
EA me% 0.50a 0.50a 0.50a 0.50a 0.50a 0.50a 0.50a 0.50a 0.50a - -
TN % 0.56a 0.65bc 0.60b 0.65bc 0.65bc 0.56a 0.79e 0.69cd 0.70d 0.04 3.8
TOC % 5.86a 6.81bc 6.61b 6.62b 6.69b 5.73a 8.14e 7.06cd 7.25d 0.33 2.9
P ppm 125.00d 140.00e 80.00b 150.00f 145.00ef 50.00a 178.30g 95.00c 85.00b 5.36 2.7
K me% 0.40cd 2.72f 0.26b 0.42d 0.30b 0.20a 0.28b 1.50e 0.36c 0.05 4.1
Ca me% 3.00a 10.67g 3.67b 5.00d 4.00c 3.00a 6.00e 9.30f 5.00d 0.31 3.3
Mg me% 1.67c 3.63e 0.56a 0.95b 1.95d 0.93b 0.95b 3.80f 0.93b 0.02 0.9
Mn me% 0.82f 0.43d 0.41d 0.44d 0.30c 0.60e 0.28c 0.20b 0.11a 0.02 3.9
Cu ppm 3.81b 0.66a 0.64a 0.54a 1.12a 1.02a 0.40a 0.57a 4.90b 2.1 79.9
Fe ppm 122.00f 56.63d 38.00c 24.40a 145.00h 34.43b 137.00g 40.70c 68.70e 3 2.3
Zn ppm 3.52c 8.62d 3.95c 2.20b 9.98e 3.48c 1.11a 13.10f 2.00b 0.67 7.3
Na me% 0.22cd 1.22f 0.14a 0.20c 0.17b 0.16ab 0.20c 1.04e 0.24d 0.02 3.5
Means followed by different letters within the same column are significantly different. EA – exchangeable acidity, TN – Total
Nitrogen, TOC – Total Organic Carbon, P – Phosphorus, K – Potassium, Ca – Calcium, Mg – Magnesium, Mn – Manganese, Cu –
Copper, Fe – Iron, Zn – Zinc, Na – Sodium, me – milli equivalents, ppm – parts per million, Upper - LH0, Medium - LH1, Lower -
UM1

43
12. Table 4.2: Soil chemical properties in different farming practices across the agro ecological zones in Weru
Zone Upper Medium Lower
Farming practice Standard Manure Neglected Standard Manure Neglected Standard Manure Neglected LSD C.V%
Soil pH 4.33b 4.12a 4.12a 5.16e 5.02d 4.42bc 4.47c 4.10a 4.16a 0.11 1.5
EA me% 0.40a 0.50a 0.50a 0.20a 0.30a 0.40a 0.40a 0.50a 0.50a - -
TN % 0.38e 0.35d 0.38e 0.22b 0.24c 0.25c 0.21c 0.14a 0.15a 0.01 2.8
TC % 4.05g 3.46f 3.93g 2.26cd 2.46de 2.65e 2.01bc 1.34a 1.81b 0.36 7.9
P ppm 10.00b 23.33d 20.00c 6.67a 23.33d 10.00b 10.00b 5.00a 10.00b 3 13.2
K me% 0.40d 0.51e 0.22a 0.28c 0.75f 0.24ab 0.26bc 0.52e 0.24ab 0.02 3.1
Ca me% 8.23fg 8.26g 5.40d 6.20e 12.20h 8.00f 5.00c 8.26g 4.16a 0.24 2.1
Mg me% 0.46ab 0.81b 0.50ab 1.76c 1.50c 0.50ab 0.17a 0.47ab 0.57ab 0.4 31.3
Mn me% 0.71f 0.30c 0.18a 0.46e 0.21b 0.41d 0.71f 0.44e 0.88g 0.02 2.9
Cu ppm 1.71ab 1.82ab 1.00a 2.89b 15.67e 1.00a 9.18d 23.46f 4.80c 1.36 11.5
Fe ppm 49.20h 53.27i 34.10d 44.67g 23.90c 35.13e 13.97b 39.50f 11.60a 0.45 0.8
Zn ppm 5.51h 2.22f 1.08a 2.08e 1.70b 3.22g 1.75c 2.07e 2.00d 0.05 1.2
Na me% 0.21c 0.40e 0.16ab 0.18b 0.35d 0.18b 0.14a 0.36d 0.15a 0.02 5.6
Means followed by different letters within the same column are significantly different. EA – exchangeable acidity, TN – Total
Nitrogen, TOC – Total Organic Carbon, P – Phosphorus, K – Potassium, Ca – Calcium, Mg – Magnesium, Mn – Manganese, Cu –
Copper, Fe – Iron, Zn – Zinc, Na – Sodium, me – milli equivalents, ppm – parts per million, Upper - LH0, Medium - LH1, Lower -
UM1

44
There was a significant (P<0.05) difference in the three farming practices for soil pH,
exchangeable acidity, total organic carbon, phosphorus, potassium, calcium, magnesium,
manganese, copper zinc and sodium (Table 4.3 and 4.4). There was no significant difference for
total nitrogen, and iron in the two sites.
13. Table 4.3: Effect of farming practices on soil pH, exchangeable acidity, total organic
carbon and micronutrients at Kangaita
Parameter Manure Standard Neglected LSD C.V%
pH 3.95b 3.11a 4.44c 0.24 6.2
EA me% 0.40a 0.50b 0.38a 0.04 9
T N % 0.66a 1.17a 0.67a 0.953 114.3
TOC % 6.80b 6.15a 7.24c 0.24 3.6
P ppm 126.70b 151.10b 71.70a 26.14 22.5
K me% 1.51b 0.37a 0.28a 0.61 84.5
Ca me% 7.99b 4.67a 3.89a 1.93 35
Mg me% 3.13b 1.19a 0.81a 0.56 33
Mn me% 0.31a 0.52b 0.38ab 0.14 34.7
Cu ppm 5.77b 2.25a 2.19a 1.89 55.6
Fe ppm 80.80a 94.50a 47.00a 51.55 69.6
Zn ppm 10.57b 2.28a 3.15a 1.73 32.5
Na me% 0.81b 0.21a 0.18a 0.28 70.1
Means followed by different letters within the same row are significantly different. EA –
exchangeable acidity, TN – Total Nitrogen, TOC – Total Organic Carbon P – Phosphorus, K –
Potassium, Ca – Calcium, Mg – Magnesium, Mn – Manganese, Cu – Copper, Fe – Iron, Zn –
Zinc, Na – Sodium, me – milli equivalents, ppm – parts per million

45
14. Table 4.4: Effect of farming practices on soil pH, exchangeable acidity, total organic
carbon and micronutrients at Weru
Parameter Manure Standard Neglected LSD C.V% P Value
pH 4.41b 4.23a 4.66c 0.18 4 <.001
EA me% 0.43b 0.46b 0.34a 0.05 11.8 <.001
TN % 0.24a 0.27a 0.26a 0.03 9.3 0.07
TOC % 2.567b 2.22a 2.87c 0.19 7.6 0.015
P ppm 17.22b 8.89a 13.33ab 5.79 44.1 0.025
K me% 0.60b 0.32a 0.24a 0.09 22.7 <.001
Ca me% 8.36b 6.48a 5.86a 1.65 24 0.015
Mg me% 0.93a 0.80a 0.52a 0.44 58.4 0.168
Mn me% 0.32a 0.63b 0.50b 0.16 34.3 0.004
Cu ppm 13.65b 4.60a 2.27a 4.4 64.4 <.001
Fe ppm 38.90a 35.90a 26.90a 11.17 33 0.091
Zn ppm 7.00b 3.11a 3.43a 1.14 25.3 <.001
Na me% 0.37b 0.18a 0.17a 0.02 8.8 <.001
Means followed by different letters within the same row are significantly different. EA –
exchangeable acidity, TN – Total Nitrogen, TOC – Total Organic Carbon P – Phosphorus, K –
Potassium, Ca – Calcium, Mg – Magnesium, Mn – Manganese, Cu – Copper, Fe – Iron, Zn –
Zinc, Na – Sodium, me – milli equivalents, ppm – parts per million
4.4.2 Influence of soil chemical properties on the abundance and diversity of soil nematodes
There was a positive correlation between the soil pH, total organic carbon, exchangeable acidity
and micronutrients and total nematode numbers (nematode abundance) and nematode species
diversity in the two study sites (Table 4.5, Table 4.6,).
At Kangaita (Table 4.5), there was a positive correlation between soil pH and total nematode
numbers/nematode abundance (r = 0.7927). This means that the nematode numbers decreased

46
with increase in soil acidity. The nematode trophic levels PPN, BF, FF, PR and OM had a
positive correlation (r = 0.5567, 0.9191, 0.3942 0.79 and 0.20 respectively) with soil pH. This
means that the nematode numbers increased with decrease in soil acidity. For OM (omnivorous)
nematodes, the positive correlation was not significant. There was a negative correlation between
exchangeable acidity and total nematode numbers, nematode diversity, PPN, BF, FF and PR
nematodes. This means that the nematode numbers decreased with increase in exchangeable
acidity. The negative correlation between exchangeable acidity and OM nematodes was not
significant. Total nitrogen had a positive correlation with nematode abundance, species diversity,
PPN, BF and PR nematodes. However, total nitrogen had a negative correlation with FF and
OM. There was a negative correlation between total organic carbon and total nematodes, species
diversity, PPN, BF, FF and PR nematodes. There was a negative correlation between phosphorus
and nematode abundance, species diversity, PPN, BF, and PR nematodes. There was a negative
correlation between potassium and species diversity, PPN, BF, PR and OM nematodes. There
was a positive correlation between potassium and FF nematodes. There was a negative
correlation between calcium and nematode abundance, species diversity, OM, PPN, BF, and PR
nematodes. There was however a positive correlation between calcium and FF. For magnesium,
there was a negative correlation with nematode abundance, species diversity, PPN, OM, BF and
PR nematodes. There was however a positive correlation between magnesium and FF
nematodes. Sodium levels had a negative correlation with PPN and OM nematodes nematode
abundance, species diversity and BF, and a positive correlation with FF nematodes and no
significant correlation with predatory nematodes.

47
There was a positive correlation between total organic carbon and PPN, BF, FF, PR, OM,
nematode abundance as well as nematode species diversity. This means that an increase in total
organic carbon leads to an increase in nematode populations and species diversity.

48
15. Table 4.5: Correlation analysis between nematode trophic levels, nematode abundance, nematode species diversity, and soil
pH, exchangeable acidity, macro and micro nutrients at Kangaita
PPN BF FF PR OM A SD pH EA TN TOC P K Ca Mg Mn Cu Fe Zn Na
PPN -
BF 0.73 -
FF -0.01 0.32 -
PR 0.71 0.92 0.25 -
OM 0.36 0.26 -0.53 0.26 -
A 0.92 0.92 0.27 0.87 0.26 -
SD 0.84 0.93 0.09 0.90 0.41 0.93 -
pH 0.56 0.92 0.39 0.79 0.20 0.79 0.81 -
EA -0.40 -0.81 -0.45 -0.62 -0.18 -0.66 -0.64 -0.91 -
TN 0.13 0.27 -0.20 0.35 0.24 0.18 0.21 0.13 -0.08 -
TOC 0.42 0.62 0.52 0.61 0.05 0.61 0.54 0.54 -0.55 0.10 -
P -0.56 -0.78 -0.19 -0.81 -0.27 -0.71 -0.81 -0.73 0.52 -0.15 -0.36 -
K -0.63 -0.07 0.46 -0.10 -0.48 -0.35 -0.29 0.13 -0.18 -0.12 0.00 0.15 -
Ca -0.63 -0.15 0.48 -0.15 -0.50 -0.38 -0.37 0.06 -0.12 -0.08 0.21 0.26 0.91 -
Mg -0.73 -0.20 0.60 -0.24 -0.62 -0.44 -0.45 0.01 -0.12 -0.20 0.00 0.13 0.87 0.83 -
Mn -0.20 -0.29 -0.54 -0.23 0.21 -0.33 -0.14 -0.35 0.43 -0.04 -0.78 -0.07 -0.11 -0.42 -0.14 -
Cu -0.33 -0.07 0.72 -0.06 -0.66 -0.13 -0.26 -0.03 -0.11 -0.23 0.19 0.14 0.50 0.46 0.68 -0.29 -
Fe -0.19 -0.39 -0.02 -0.46 -0.13 -0.29 -0.42 -0.53 0.28 -0.15 -0.05 0.58 -0.25 -0.21 -0.05 0.04 0.27 -
Zn -0.45 0.02 0.63 -0.09 -0.55 -0.18 -0.27 0.22 -0.34 -0.07 0.07 -0.04 0.59 0.57 0.86 -0.25 0.64 -0.03 -
Na -0.66 -0.07 0.53 -0.08 -0.50 -0.35 -0.30 0.14 -0.19 -0.12 0.10 0.06 0.96 0.94 0.93 -0.20 0.53 -0.27 0.69 -
PPN BF FF PR OM A SD pH EA TN TOC P K Ca Mg Mn Cu Fe Zn Na
PPN- Plant parasitic nematodes, BF – Bacterial feeders, FF – Fungal feeders, PR – Predatory OM – Omnivores, A – Abundance
(Total nematodes), SD – Species diversity, pH – Soil pH, EA – Exchangeable acidity, TN – Total nitrogen, TOC – Total organic

49
carbon, P – Phosphorus, K – Potassium, Ca – Calcium, Mg – Magnesium, Mn – Manganese, Cu – Copper, Fe – Iron, Zn – Zinc, Na -
Sodium
50
At Weru, (Table 4.6), there was a positive correlation between soil pH and total nematode
numbers/nematode abundance (r = 0.3855). This means that the nematode numbers decreased
with increase in soil acidity. The nematode trophic levels PPN, BF, FF, PR and OM has a
positive correlation with soil pH. This means that the nematode numbers increased with decrease
in soil acidity. There was a negative correlation between exchangeable acidity and total
nematode numbers, nematode diversity, PPN, OM, BF, FF and PR nematodes. This means that
the nematode numbers decreased with increase in exchangeable acidity. There was a negative
correlation between potassium and species diversity, PPN, PR, BF and OM nematodes. There
was a positive correlation between potassium and FF nematodes. There was a negative
correlation between calcium and nematode abundance, species diversity, PPN, BR, OM and PR
nematodes while FF had a negative correlation with calcium. For magnesium, there was a
negative correlation with PPN, BF, PR, OM nematode abundance and species diversity. There
was however a positive correlation between magnesium and FF. Sodium had a negative
correlation with nematode abundance, species diversity, PPN, PR and OM nematodes. The
correlation between sodium and BF and FF was positive.
There was a positive correlation between total organic carbon and PPN, BF, FF, PR, OM,
nematode abundance as well as nematode species diversity. This means that an increase in total
organic carbon lead to an increase in nematode populations and species diversity.

51
16. Table 4.6: Correlation analysis between nematode trophic levels, nematode abundance, nematode species diversity, and soil
pH, exchangeable acidity, macro and micro nutrients at Weru
PPN BF FF PR OM A SD pH EA TN TOC P K Ca Mg Mn Cu Fe Zn Na
PPN -
BF 0.59 -
FF -0.21 0.57 -
PR 0.84 0.66 0.03 -
OM 0.90 0.71 0.00 0.75 -
A 0.99 0.69 -0.10 0.85 0.92 -
SD 0.98 0.67 -0.10 0.88 0.93 0.98 -
pH 0.35 0.28 0.09 0.41 0.42 0.39 0.36 -
EA -0.41 -0.25 0.02 -0.47 -0.43 -0.42 -0.42 -0.94 -
TN -0.03 -0.03 -0.19 -0.20 0.07 -0.02 0.01 -0.16 0.08 -
TOC 0.23 0.37 0.05 0.06 0.34 0.28 0.29 0.02 -0.09 0.85 -
P 0.00 0.39 0.22 0.02 0.17 0.09 0.03 0.19 -0.13 0.55 0.61 -
K -0.62 0.12 0.73 -0.41 -0.40 -0.52 -0.56 0.10 0.05 -0.01 0.00 0.46 -
Ca -0.37 -0.01 0.30 -0.26 -0.19 -0.31 -0.33 0.53 -0.43 0.36 0.30 0.59 0.71 -
Mg -0.32 -0.20 0.07 -0.39 -0.24 -0.30 -0.35 0.32 -0.25 -0.06 0.05 0.18 0.37 0.46 -
Mn 0.10 -0.37 -0.43 0.04 -0.19 0.01 0.02 -0.29 0.34 -0.38 -0.55 -0.61 -0.43 -0.49 -0.37 -
Cu -0.39 0.09 0.66 -0.16 -0.30 -0.35 -0.38 -0.06 0.15 -0.62 -0.56 -0.17 0.60 0.01 0.03 -0.09 -
Fe -0.43 -0.08 0.20 -0.47 -0.25 -0.39 -0.33 -0.28 0.22 0.56 0.55 0.07 0.20 0.24 0.21 -0.40 -0.24 -
Zn -0.41 0.41 0.84 -0.21 -0.16 -0.30 -0.30 -0.01 0.13 0.15 0.25 0.37 0.82 0.53 0.07 -0.40 0.43 0.48 -
Na -0.56 0.32 0.80 -0.33 -0.30 -0.45 -0.46 -0.08 0.18 0.04 0.14 0.43 0.86 0.49 0.24 -0.50 0.50 0.46 0.91 -
PPN BF FF PR OM A SD pH EA TN TOC P K Ca Mg Mn Cu Fe Zn Na
PPN- Plant parasitic nematodes, BF – Bacterial feeders, FF – Fungal feeders, PR – Predatory OM – Omnivores, A – Abundance
(Total nematodes), SD – Species diversity, pH – Soil pH, EA – Exchangeable acidity, TN – Total nitrogen, TOC – Total organic

52
carbon, P – Phosphorus, K – Potassium, Ca – Calcium, Mg – Magnesium, Mn – Manganese, Cu – Copper, Fe – Iron, Zn – Zinc, Na -
Sodium

53
4.5 Discussion
The study investigated the influence of farming practices on the soil chemical properties and the
relationship between the soil chemical properties and the abundance and diversity of soil
nematodes. The different farming practices influenced soil chemical properties differently. The
soil chemical properties had both positive and negative relationship with nematode abundance,
species diversity and nematode numbers in their various trophic levels.
The farming practices had a significant effect on the soil pH. The soil acidity was highest in
inorganic fertilizer applied farms (Standard) followed by manure applied farms and lowest in
neglected farms. Tea grows well in acidic soils of pH between 4.5 and 5.6 (Njogu et al. 2013).
However, as this study revealed and as noted by Sultan et al. (2014), continuous use of
nitrogenous fertilizer increases the soil acidity. The farmers tend to use the recommended
fertilizers non-judiciously with the hope of increasing yield but this instead leads to increase in
soil acidity, pollution of water masses and poses a challenge to the sustainability of the tea
production (Tabu et al. 2015). The acidified soils tend to adversely affect the soil
microorganisms (Thenmonzi et al. 2012). The applied manure plays an important role in
reducing soil acidity which is increased by continuous application of nitrogenous fertilizers
(Sultan et al. 2014).
There was a significant difference among the three farming practices in soil pH, exchangeable
acidity, total organic carbon, phosphorus, potassium, calcium, magnesium, manganese, copper
zinc and sodium. There was no significant difference for total nitrogen, and iron in the two sites.
This can be attributed to the interaction of both macro and micro nutrients in the soil (IPCC,
1999; IPCC, 2000) and application of the fertilizers affecting soil pH (Sultan et al. 2014).

54
The study revealed a correlation between soil nutrients, soil pH, total organic carbon,
exchangeable acidity, nematode abundance and nematode species diversity. The interaction of
these factors affected each other either positively or negatively. Where there was a decrease in
soil pH leading to soil acidity there was observed a decline of both nematode abundance and
species diversity. Thenmonzi et al. (2012) also noted that increase in soil acidity leads to
decrease in soil microorganisms. Soil pH was also affected by the farming practice due to the
type and intensity of fertilizer application. High rates of inorganic nitrogenous fertilizers led to
increased soil acidity (Sultan et al. 2014) while application of manure led to decrease in soil
acidity.
Nelson (2006) noted that deficiency of zinc in the soil can be induced by a buildup of
phosphorus resulting from excessive application of phosphate fertilizers. Kitundu et al. (2006)
noted that high levels of iron in the soil led to copper deficiency and that even though iron was
found to be sufficient in the soil, it was poorly reflected in the leaves due to high levels of zinc in
the leaves. Nath, (2013b) noted that high soil pH results to retention of micronutrients in the soil.
Nath, (2013b) also noted that the concentration of Mn, Cu, Fe and Zn increases with the increase
in organic content in the soil. Jessy (2010) noted that where potassium is not matched with
nitrogen, there is depletion of starch reserves in the roots, degeneration of feeder roots
characterized by die back and buildup of nitrates in the soil. Phosphorus is affected by soil
acidity. Hamid (2006) reported that phosphorus availability to plants is highest when there is
moderate pH of about 5.5 – 7 and becomes exceedingly unavailable at pH above 7 and below
5.5. Hamid (2006) further noted that in very acidic soils, phosphorus combines with hydroxides
of iron and aluminum to form compounds that are unavailable to plants.

55
The availability of nitrogen in the soil is affected by other nutrients and it also affects the
availability of other nutrients in the soil. IPCC, (1990) reported that increase in nitrogen leads to
decrease in mature leaf P, K, Ca and Mg due to the acidification of the soil by ammonia in the
fertilizer. A decrease in mature leaf potassium can be attributed to leaching (IPCC, 1990).
Soil chemical properties of a farm depend on the type of agricultural practice employed. Use of
inorganic fertilizer led to increase in soil acidity. Increased soil acidity was responsible for
decline in nematode numbers and species diversity. For a better balance of soil nematodes in the
soil in their trophic levels, manure application in tea farms is recommended.

56
CHAPTER 5: EFFECT OF ROOT KNOT NEMATODE ON THE GROWTH AND
PRODUCTIVITY OF TEA CLONES IN MERU COUNTY OF KENYA
5.1 Abstract
Nematodes have been reported in tea plantations in Kenya and have been associated with death
of tea plants in some areas. Nematodes associated with tea have been found to be well distributed
in Ngere catchment of Murang’a County, Kangaita catchment of Kirinyaga County and Imenti
catchment of Meru County. This study was conducted in Kionyo, Meru county, to establish the
effect of the root knot nematodes on the growth and productivity of the common tea clones and
the recently released, high yielding clones in Kenya. These clones include TRFK 31/8, TRFK
301/4, TRFK371/3, TRFK430/90, and TRFK 306/1 (purple tea). The experiment was set up in a
randomized complete block design. Two thousand eggs of Meloidogyne spp were inoculated in
each potted plant and one potted plant was not inoculated to act as control. Growth parameters
like stem girth, length of internode (internode space) and number of new leaves were recorded.
The data was recorded fortnightly for a period of twenty-four weeks. The data was analyzed
using Genstat edition 14. The nematodes affected significantly the growth parameters and yield
of the high yielding, newly released clones TRFK 301/4, TRFK371/3, TRFK 430/90 and TRFK
306/1. Tea clone TRFK 31/8 was least affected and therefore considered resistant to the
nematode attack while clone TRFK 430/90 was the most affected and therefore susceptible to
nematode attack. Clone TRFK 430/90 is unsuitable for cultivation in areas infested with root
knot nematodes while clone TRFK 31/8 is the most suited clone in areas infested with root knot
nematodes.

57
5.2 Introduction
Tea is a major cash crop in Kenya contributing up to 26% of total exports in the country. Tea
originated in China (Tapan, 2004). Tea is cultivated in Kenya mainly through small scale holder
system. It is mainly grown in Mt. Kenya region, the Aberdares, nandi hills, Kericho, Kisii
highlands and along the Nyambene hills (TBK, 2003). Otieno et al. (2002) documented the
outbreak of root knot nematodes in Kenya’s Kerugoya and Imenti areas. Otieno et al. (2002)
recorded that areas which were previously under coffee or forests were severely affected by the
nematode infestation leading to decline in plant health and die back. Kamunya et al. (2008)
conducted a study and reported that root knot nematodes were responsible for death of some tea
clones in nursery conditions.
Nematodes have been reported in tea plantations in Kenya and have been associated with loss of
tea plants in some areas (TBK, 2013). A study conducted by Wachira et al. (2014) in Ngere
catchment of Murang’a County found out that nematode species associated with tea were well
distributed in tea farms. Other studies conducted by Kamunya et al. (2008) found out that
nematodes were well distributed in Kangaita, Kirinyaga County and Imenti, Meru County and
were responsible for the declining population of tea in the areas. The study also reported that
Meloidogyne spp. was responsible for total death of tea plants of clone TRFK 303/577 under
nursery conditions. Nematodes have also been found to be responsible for declining populations
of tea in other parts of the world. In India, root knot nematode species (Meloidogyne javanica,
Meloidogyyne incognita and Meloidogyne brevicauda) have been found to be well distributed in
tea farms and have been linked to declining populations of tea plants in farms (Glover, 1961).
Plant parasitic nematodes cause injury to plants as they feed on them. The nematodes have a
hollow feeding structure, with a stylet and a pharynx that have undergone morphological and

58
physiological adaptations to suit the nematode’s mode of feeding (Lee, 2002). They feed by
forming diverse and sometimes complex feeding relationships with their host plants (Davis et al.
2004; Luc et al. 2005).
In general, PPNs use their stylet to mechanically injure plants through piercing as they withdraw
and ingest nutrients from plants (Bilgrami et al. 2004; Guagler et al. 2004). In the process of
feeding or in the attempt to obtain food from plants, the nematodes may also inject secretions
into the plant cells weakening or modifying those plants (Gheysen et al. 2006).
Root knot nematodes are best controlled using resistant tea clones (TBK, 2003). Studies by
Kamunya et al. (2008) showed that various tea clones have varying degrees of resistance to root
knot nematode attack. Clone TRFK 303/577 was reported to be the most susceptible to root knot
nematode attack. TRI carries out research and develops new tea clones which are resistant to
pests and diseases and are high yielding (TBK, 2003). This study was conducted with the aim of
evaluating the susceptibility of commonly grown and recently released tea clones to root knot
nematode and the effect of the nematode of the clones’ productivity.
5.4 Materials and method
5.4.1 Experimental design
The experiment was set up in a randomized complete block design. Potted tea plants were used
in the experiment. The plants were two years old when the experiment started. Five different
clones were used in the study. These were TRFK 31/8, TRFK 301/4, TRFK 371/3, TRFK 430/90
and TRFK 306/1 (Purple Tea).

59
5.4.2 Establishment of experimental plants
Tea plants were obtained from a tea nursery at Kionyo tea factory in Meru. The plants had been
propagated in the nursery for two years. They were mature enough for transplanting. Fifteen
plants per clone were obtained. Pots were filled with steam sterilized soil and the tea was planted
in the pots, one plant per pot. The tea plants were then raised for two years until they reached
bearing level. Three plants per clone were randomly selected and placed in a plot as an
experimental unit. The experiment was replicated three times.
5.4.3. Preparation of nematode inoculum and inoculation
Spinach plants (Spinacia oleracea) was used as a bioassay plant. The spinach plants were raised
in Kionyo tea factory in a place infested with the root knot nematode. The plants were raised for
two months and the roots harvested for extraction of nematode eggs and J2s. The nematode eggs
were extracted from the two months old plant roots in the laboratory using 1% sodium
hypochlorite solution technique as described by Hussey and Barker (1973). The number of eggs
per milliliter was determined by counting over a microscope in a counting slide as described by
Ravichandra (2010). Two thousand eggs were inoculated to each potted plant. The egg masses
and J2s were inoculated on the plants by placing them under the roots of the tea plant. Un
inoculated plants served as control.
5.4.4 Data collection and analysis
Growth parameters including stem girth, internode length and number of new leaves were
measured at an interval of fourteen days for twenty-four weeks. Stem girth was meant to monitor
the lateral growth of the tea plant. Internode length was meant to monitor the growth of the tea
plant in height (apical growth). Number of new leaves was meant to measure productivity of the
plant. The number of new leaves were the shoots comprising of at least two leaves and a bud;

60
which is the harvestable part of the tea plant. These new shoots were harvested and counted per
plant. Tea plants were also observed for physical symptoms like chlorosis, wilting, drooling of
leaves, stunting and die back. The symptoms were assigned numbers in a scale of 0-9 to denote
severity of the effect of RKN infestation. Where 0 - dead plant, 1-3 –wilting and drooling of
leaves, 4-6 - plants showing chlorosis, 7 - stunted plants 8-9 – healthy plants. The obtained data
was analyzed using Genstat edition 14.
5.5 Results
Root knot nematodes had no significant impact on the growth parameters of tea clone 31/8
(Table 5.1). In tea clone 301/4, the root knot nematodes had a significant reduction effect on the
number of new leaves while the internode length and stem girth were not significantly affected
(Table 5.1). This means that there was no notable physical difference between an infested tea
plant and a healthy one but there was reduction in yield in the infested plants. This is because the
new leaves are the yield forming parts of the plant. In tea clone 371/3, only the stem girth was
negatively affected by the root knot nematode while the internode space and number of new
leaves suffered an insignificant reduction (Table 5.1). For clone 430/90, there was a significant
reduction in all the growth parameters in the plants infested with the root knot nematode (Table
5.1). This means that the tea clone’s growth is susceptible to the nematode attack. For tea clone
306/1 (purple tea), the nematode had a significant reduction on the number of new leaves while
the effect on the other two parameters was not significant (Table 5.1).

61
17. Table 5.1: Effect of root knot nematode on the stem girth, internode length and number
of new leaves (growth parameters) of tea clones TRFK 31/8, TRFK 301/4, TRFK 371/3,
TRFK 430/90 and TRFK 306/1
Clone Parameter A B Control LSD C.V% P Value
TRFK 31/8
SG 9.35a 10.72a 11.02a 2.78 15.5 0.36
IL 18.2a 15.1a 11.2a 9.61 37.5 0.28
NL 214a 104a 93a 121 51.1 0.092
TRFK 301/4
SG 5.35a 5.28a 6.10a 1.16 12 0.47
IL 15.93a 16.10a 19.90a 4.43 14.8 0.12
NL 166.20a 170.70a 610.50b 66 12.1 <.001
TRFK 371/3
SG 5.93a 6.03a 9.20b 2.08 17 0.013
IL 34.80a 29.50a 25.90a 19.22 38 0.403
NL 160.00a 140.00a 183.00a 70 25.1 0.376
TRFK 430/90
SG 4.375a 4.750a 6.80b 1.43 15.6 0.012
IL 4.78a 5.20a 13.50b 1.89 13.9 <.001
NL 146.20a 145.00a 290.00b 114.6 34.2 0.033
TRK 306/1
SG 6.85a 7.05a 7.50a 2.97 24 0.863
IL 18.10a 16.40a 16.40a 14.98 55.4 0.656
NL 88.00a 99.80a 231.00b 24.44 10.1 <.001
Means followed by different letters within the same row are significantly different. SG – Stem
girth, IL- Internode length, NL – New leaves, Treatments A and B – inoculated with 2,000 eggs
of Meloidogyne spp., Control – Free of nematodes

62
In un infested clones, Clone TRFK 31/8 had the highest production in terms of number of leaves
followed by clone TRFK 430/90 (figure 5.1). Clone TRFK 31/8 had the least leaf production
followed by clone TRFK 371/3 (figure 5.1).
0
100
200
300
400
500
600
700
2 4 6 8 10 12 14 16 18 20 22 24
Time (Week)
Figure 5.1: Cummulative leaf production of tea clones infested
with RKN (bar chart) as compared with uninfested ones (line
graph)
Clone Clone
Clone Clone
Clone Clone
Clone Clone
Clone Clone
Nu
mb
er o
f n
ew le
aves
Bar chart
Line graph

63
5.6 Discussion
The study was conducted with an aim of establishing the reaction of tea clones to infestation with
root knot nematodes. It was aimed at establishing and recommending the most suitable clones to
be grown in areas infested with root knot nematodes.
Clone TRFK 31/8 was observed to resist attack by the nematode since it had high yield despite
the nematodes attack and by the fact that it did not exhibit any sign of physical disorders like
chlorosis, wilting and die back. The nematode Meloidogyne spp did not have any significant
effect on the clone’s stem girth, internode length and number of new leaves. This makes this
clone resistant to nematode attack. This resistance/tolerance to nematode attack can be used by
farmers as a method of cultural control of the nematodes as noted by Gnapragasam et al. (2005).
Resistance/tolerance coupled with other cultural methods like use of organic matter, soil
cultivation and inorganic fertilizer application will greately help in reducing the negative effects
of nematodes on tea plants Gnapragasam et al. (2005).
Clones TRFK 301/4, TRFK371/3 and TRFK 430/90 suffered most in terms of loss in number of
harvestable new leaves and showing physical disorders. Clone 430/90 exhibited the most severe
above ground symptoms. This renders these clones susceptible to the nematode attack.
Meliodogyne spp affected different growth parameters of these clones thus affecting their
performance and productivity. The nematode significantly reduced the stem girth and number of
new leaves produced by the tea plants. The new leaves are the harvestable product that is of
interest to the tea farmers. The reduction on number of leaves means reduction in productivity
and decline in production per area leading to direct loss to the farmers.

64
These findings are consistent with studies carried out by Kamunya et al. (2008) in nematode
infested areas of Kenya. Kamunya et al. (2008) noted that the tea plants of clone TRFK 31/8
infested with nematode Meloidogyne spp did not show any above ground symptoms and the
effect of the nematode on the plant was insignificant. The study by Kamunya et al. (2008) also
established that clone 301/4 and 303/577 were most affected and showed severe above ground
symptoms and galling of the roots. Gnanapragasam (2002), also indicated that there have been
several instances of slow decline leading to death of tea bushes in Sri Lanka caused by plant
parasitic nematodes. Orisajo (2012) in a study conducted in Nigeria also found that, Meloidogyne
significantly reduced stem girth and leaf area of tea plants. Sivipalan (1957) and Venkata (1963)
also reported that tea of all ages were susceptible to attack by Meloidogyne brevicauda. It was
also noted that, root knot nematodes were causing loss in tea plants in fields (Otieno et al. 2002).
The survey by Otieno et al. (2002) further indicated that, Meloidogyne spp attacked young plants
of clone TRFK 303/577 leading to the death of the plants.
Root knot nematodes (RKN) also affect many other plants and have been found to reduce yield
and even cause death of the plants. Other plants affected by RKN include common beans, tomato
(Solunum lycopersicum L.), tobacco, cantaloupe, bananas, among others. The nematodes have
been reported to affect growth parameters of the plants, reducing yield and even causing death of
the plants (Kimenju et al. 1999; Kankam et al. 2014). The inoculum levels also play a major role
in the effect of the nematodes on the plants as the plants have varying rates of tolerance or
resistance (Vitro et al. 1983; El-Sherif et al. 2007).
In terms of performance in productivity, the five clones can be ranked, from best performing, as
TRFK 31/8, TRFK 301/4, TRFK 371/3, TRFK 430/90 and TRFK 306/1. Clone TRFK 31/8 is
recommended for propagation in areas infested by the root knot nematode.
65
CHAPTER 6: GENERAL DISCUSSION CONCLUSION AND
RECOMMENDATIONS
6.1 Discussion
This study showed that nematode abundance and diversity varied depending on the farming
practice adopted by farmers. Neglected farms had the highest nematode numbers and species
diversity. The neglected farms are characterized by long-term freedom from human interference
in terms of cultivation/weeding, fertilizer application, plucking and other cultural practices
associated with tea farming. As a result, these farms end up having high above ground plant
diversity and high organic matter. The standard farming practice involves regular weeding and
application of inorganic fertilizer once or twice every year. The manure applied farms follow the
same cultural practice as Standard farming practice with an additional application of animal
manure and/or other organic mulch. Due to application of manure in these farms, the use of
organic fertilizer is minimized.
This study agrees with other studies conducted earlier which revealed that increased disturbance
in an ecosystem in terms of intensity of cultivation leads to decrease in nematode abundance,
species richness and species composition (Bloemers et al. 1997; Bongers and Bongers. 1998;
Yeates et al. 1999). This in the long run interferes with the functions of an ecosystem (Giller et
al. 1997). Human interference in an agro ecosystem alters both the density and heterogeneity of
plant communities (Kimenju et al. 2005). This in turn plays a role in restructuring nematode
communities, which depend on the plants (Yeates, 1999). It has also been revealed that
destruction of natural forests to pave way for establishment of a single species plantation results
in the decline in nematode abundance and species richness (Kimenju et al. 2005).

66
From the survey, it was observed that the nematodes in genus Meloidogyne are well distributed
in the tea farms in the two study sites. This is constistent with a research carried earlier in India
which concluded that root knot nematodes, Meloidogyne javanica, Meloidogyne incognita and
Meloidogyne brevica, are widely distributed in tea plants (Glover, 1961).
Five trophic groups of nematodes were recovered in the study areas. These are herbivores,
bacteriovores, fungivores, omnivores and predators. This is in line with many research findings
which have indicated that the five trophic levels are represented in almost every soil sample
(Freckman and Baldwin, 1990; Kibet et al. 2013). Nematodes of Aphelenchus spp. were wide
spread in the tea fields of both Kangaita and Weru. These findings agree with studies previously
conducted in tea fields (Kibet et al. 2003; Kimenju et al. 2009).
Farming practices had a significant effect on the soil pH. Soil acidity was highest in inorganic
fertilizer applied farms (standard) followed by manure applied farms and lowest in neglected
farms. Tea grows well in acidic soils of pH between 4.5 and 5.6 (Njogu et al. 2013). However, as
this study revealed and as noted by Sultan et al. (2014), continuous use of nitrogenous fertilizer
increases soil acidity. Farmers tend to use the recommended fertilizers non-judiciously with the
hope of increasing yield but this instead leads to increase in soil acidity, pollution of water
masses and poses a challenge to the sustainability of tea production (Tabu et al. 2015). The
acidified soils tend to adversely affect the soil microorganisms (Thenmonzi et al. 2012). The
applied manure plays an important role in reducing soil acidity which is increased by continuous
application of nitrogenous fertilizers (Sultan et al. 2014).
There was a significant difference among the three farming practices in soil pH, exchangeable
acidity, total organic carbon, phosphorus, potassium, calcium, magnesium, manganese, copper

67
zinc and sodium. There was no significant difference for total nitrogen, and iron from the two
sites. This can be attributed to the interaction of both macro and micro nutrients in the soil
(IPCC, 1999; IPCC, 2000) and application of the fertilizers affecting soil pH (Sultan et al. 2014).
The study demonstrated a correlation between soil nutrients, soil pH, total organic carbon,
exchangeable acidity, nematode abundance and nematode species diversity. The interaction of
these factors affected each other either positively or negatively. Decrease in soil pH leading to
soil acidity led to the decline of both nematode abundance and species diversity. Thenmonzi et
al. (2012) also noted that increase in soil acidity leads to decrease in soil microorganisms. Soil
pH was also affected by the farming practice due to the type and intensity of fertilizer
application. High rates of inorganic nitrogenous fertilizers lead to increased soil acidity while
application of manure leads to decrease in soil acidity (Sultan et al. 2014).
Nelson (2006) noted that deficiency of zinc in the soil can be induced by a buildup of
phosphorus resulting from excessive application of phosphate fertilizers. Kitundu et al. (2006)
noted that high levels of iron in the soil led to copper deficiency and that even though iron was
found to be sufficient in the soil, it was poorly reflected in the leaves due to high levels of zinc in
the leaves. Nath, (2013b) noted that, high soil pH results to retention of micronutrients in the
soil. Nath, (2013b) also noted that the concentration of Mn, Cu, Fe and Zn increases with the
increase in organic content in the soil. Jessy (2010) noted that where levels of potassium are not
matched with those of nitrogen, there is depletion of starch reserves in the roots, degeneration of
feeder roots characterized by die back and buildup of nitrates in the soil. Phosphorus is affected
by soil acidity. Hamid (2006) reported that phosphorus availability to plants is highest when
there is moderate pH of about 5.5 – 7 and becomes exceedingly unavailable at pH above 7 and

68
below 5.5. Hamid (2006) further noted that in very acidic soils, phosphorus combines with
hydroxides of iron and aluminum to form compounds that are unavailable to plants.
The availability of nitrogen in the soil is affected by other nutrients and it also affects the
availability of other nutrients in the soil. IPCC, (1990) reported that increase in nitrogen leads to
decrease in mature leaf P, K, Ca and Mg due to the acidification of the soil by ammonia in the
fertilizer. A decrease in mature leaf potassium can be attributed to leaching triggered by
Ammonium nitrate in NPK fertilizer (IPCC, 1990).
Meloidogyne spp affect different growth parameters of tea plants thus affecting the performance
and productivity of the tea plant. The nematode significantly reduced the stem girth and number
of new leaves produced by the tea plants. New leaves are the harvestable product that is of
interest to farmers. Its reduction means reduction in productivity and decline in production per
area leading to direct loss to the farmer. Clone TRFK 31/8 was observed to resist attack by the
nematode since it had high yield despite the nematodes attack and by the fact that it did not
exhibit any sign of physical distress like chlorosis, wilting and die back. The nematode
Meloidogyne spp did not have any significant effect on the clone’s stem girth, internode space
and number of new leaves. Clones TRFK 301/4, TRFK371/3 and TRFK 430/90 suffered most in
terms of loss in number of harvestable new leaves and showing physical distress like plant
chlorosis, stunted growth and die off. Clone 430/90 exhibited the most severe above ground
symptoms. This makes these clones susceptible to nematode attack. These findings are consistent
with studies carried out by Kamunya et al. (2008) in nematode infested areas of Kenya.
Kamunya et al. (2008) noted that the tea plants of clone TRFK 31/8 infested with nematode
Meloidogyne spp did not show any aboveground symptoms and the effect of the nematode on the
plant was insignificant. The study also established that clone 301/4 and 303/577 were most

69
affected and showed severe above ground symptoms and galling of the roots (Kamunya et al.
2008). Gnanapragasam, (2002) also reported that there have been several instances of slow
decline leading to death of tea bushes in Sri Lanka caused by plant parasitic nematodes. Orisajo
(2012) in a study conducted in Nigeria also found that Meloidogyne significantly reduced stem
girth and leaf area of tea plants. Sivipalan (1957) and Venkata (1963) also reported that tea of all
ages were susceptible to attack by Meloidogyne brevicauda. Meloidogyne brevicauda was also
recorded to be well distributed in fields of mature tea in Sri Lanka (Loos, 1953). Otieno et al.
(2002) reported that Meloidogyne spp were found to be distributed in areas of Kerugoya in
Kirinyaga county and Imenti in Meru county of Kenya. It was also noted that root knot
nematodes were causing losses of tea plants (Otieno et al. 2002). The survey by Otieno et al.
(2002) further indicated that Meloidogyne spp attacked young plants of clone TRFK 303/577
leading to death of the plants.
6.2 Conclusion
The findings of the study reveal that soil nematodes are well distributed in tea growing fields.
PPNS and total nematode numbers vary with the cultural practices applied in tea production.
Nematode numbers are highest in neglected farms while they are lowest in manure applied
farms.
Root knot nematodes affect various tea clones differently and lead to reduction in tea
productivity from farms. The most susceptible clones were TRFK 301/4, TRFK371/3 and TRFK
430/90 while clone TRFK 31/8 was the most resistant cultivar.
The various farming practices have an effect on the soil pH, exchangeable acidity, total organic
carbon, total nitrogen, phosphorus, and potassium and micro nutrients in the soil. There was also

70
correlation between the farming practice employed and the nematode abundance, nematode
species diversity, soil pH, total organic carbon and various soil nutrients. Increase in soil acidity
leads to decline of both nematode abundance and species diversity. Increase in total organic
carbon in the soil leads to increase in nematode communities and nematode numbers (species
diversity and nematode abundance).
6.3 Recommendations
Due to increased soil acidity resulting from the non-judicious use of inorganic fertilizers,
farmers are advised to follow the recommended application rates to reverse the trend.
Manure should also be applied to the tea bushes at the recommended rate per bush per
year to lower soil acidity.
There is need for further research to investigate the effect of nematode damage on the
quality of tea produced by nematode infested clones.
Further research should also be carried out to investigate the seasonal variation of
nematode numbers and community structures in the tea farms in various tea growing
ecological zones.
There is also need for further research to identify the species of the root knot nematode
responsible for severe damage on the tea plants in Kenya.
Clone TRFK 31/8 can be recommended for growth in areas infested with root knot
nematodes.

71
REFERENCES
Agrios, G. N. 2005. Plant Pathology. 5th Edition San Diego CA. Elsevier Academic Press. 15-70
pp.
Bardgett, R. D. (2005). The biology of soil: a community and ecosystem approach. New York:
Oxford University Press Inc. http://dx.doi.org/10.1093/acprof:oso/9780198525035.001.0001
Bilgrami, A. L., Gaugler, R. 2004. Feeding behavior. In Gaugler R, Bilgrami A.L., editors.
Nematode Behavior. Wallingford, UK: CAB International. 91-126 pp.
Bloemers, G. F., Hodda, M., Lambshead, P.J.D., J. H. and Wanless, F. R. (1997). The effects of
forest disturbance on diversity of tropical soil nematodes. Oecologia, 111, 575-582.
Bongers T (1990). The maturity index: An ecological measure of environmental disturbance
based on nematode species composition. Oecology 83:14-19.
Bongers T, and Bongers M., (1998). Functional diversity of nematodes. Applied Soil Ecology
10:239-251
Bremner, J.M. 1996. Total nitrogen. In Methods of Soil Analysis: Chemical Methods. Part 3.
D.L. Sparks, editor. Soil Science Society of America. Madison WI.C.
Cheserek B. C., Elbehri A. and Bore J., 2015. Analysis of links between climate variables and
tea production in the recent past in Kenya. Donnish Journal of Research in Environmental
Studies. 2(2): 5-17
Coleman D.C., Cole C.V. & Elliot E.T. (1984). Decomposition, organic matter turnover, and
nutrient dynamics in agroecosystems. New York, NY: Wiley Publishing.

72
Coleman, D. C. and Crossley, D. A., 1996. Fundamentals of soil ecology. Academic Press.
London.
Davis, E. L., Hussey, R. S. and Baum T. J., 2004. Getting to the roots of parasitism by
nematodes. Trends Parasitol. 20, 134-141.
El-Sherif, A. G.; A. R. Refaei, m. E. el-Nagar, and Hagar, M. M. Salem (2007) The role of eggs
inoculum level of Meloidogyne incognita on their reproduction and host reaction. African
Journal of Agricultural Research Vol. 2(4), pp. 159-163, April, 2007.
Evans, A. A. F., and Perry, R. N. 2009. Survival Mechanisms. In: “Root Knot Nematodes”
edited by Perry, R.N., Moens, M. and Starr, J. CABI 2009 201-222 pp.
F. Kankam and J. Adomako (2014). Influence of inoculum levels of root knot nematodes
(Meloidogyne spp.) on tomato (Solanum lycopersicum L.). Asian Journal of Agriculture and
Food Science (ISSN: 2321 – 1571) Volume 02 – Issue 02, April 2014.
Ferris, H. and Melakeberhan, H. 2008. Nematode physiology: Significant developments in the
understanding of the biology of simple eukaryotic animals. Pages 80-97 in: J. M. Webster, K.
B. Eriksson, and D. G. McNamara (Eds). AnAnecdotal History of Nematology. Pensoft
Publishers, Sofia – Moscow. 80-97 pp.
Freckman, D. W. and Baldwin, J. G. 1990. Nematoda. In: “Soil Biology Guide”. D.L. Dindal
(ed.), John Willey and Sons, Inc., New York. Pp. 155-200
Gaugler, R., and Anwar, B. 2004. “Nematode Behavior.” Oxfordshire, UK: CABI

73
Gheysen, G. and Jones J. T. 2006. Molecular aspects of plant-nematode interactions. In: Perry,
R. N. and Moens, M. (Eds). Plant Nematology. Wallingford, UK, CABI publishing, pp. 234-
254
Giller, K. E., Beare, M., Lavelle, P., Izac, A. M. and Swift, M. J. (1997) Agricultural
intensification, soil biodiversity and agroecosystem function. Applied Soil Ecology 6:3-16
Glover, P. M., 1961. Nematodes in N. E. India. Two and a Bud. 8:6-7
Gnanapragasam N. C. and M. M. Mohoti (2005). Nematode Parasites of Tea. In Plant Parasitic
Nematodes in subtropical and Tropical Agriculture. 2nd
Edition. Edited by M. Luc, R. A.
Sikora and J. Bridge. CABI 2005. 596 pp.
Gnanapragasam N. C., 2002. Slow decline observed in nematode tolerant tea cultivar.
International journal of Nematology, 12:232-233
Hamid F. S., (2006). Yield and quality of tea under varying conditions of soil and nitrogen
availability. PhD dissertation. Department of plant sciences, Faculty of biological sciences,
Quaid-i-Azam University Islamabad, Pakistan.
Hussey, R. S., and Barker, K. R. 1973. Comparison of methods for collecting inocula of
Meloidogyne spp., including a new technique. Plant Disease Reporter 57:1025–1028.
IPCC (1990). Special report, land use, land use change and forestry. United Nations
Environmental program, Intergovernmental Panel on Climate Change
Jaetzold, R., Hornetz, B., Shisanya, C.A. & Schmidt, H. (2010): Farm Management Handbook of
Kenya. - Vol. I-IV (Western, Central, Eastern, Nyanza, Southern Rift Valley, Northern Rift
Valley, Coast), Nairobi
74
Jenkins W. R., (1964). A rapid centrifugal floatation technique for separating nematodes from
soil. Plant Dis. Rep. 48:692.
Jessy M. D. 2010. Potassium management in plantation crops with special reference to tea,
coffee and rubber. Karnataka J.Agric.Sci, .24(1): 67-74.
Kagira Elias Kiarie, Sarah Wambui Kimani, and Kagwathi Stephen Githii, (2012). Sustainable
methods of addressing challenges facing small holder tea sector in Kenya: A supply chain
management approach. Journal of Management and Sustainability; Vol. 2, No. 2; pp 75-89.
Kamunya, S. M., Lang’at, J. K., Muoki, R. C., Nyabundi, K., Wachira, F. N., Otieno, W., and
Sudi, V., (2008). Performance of tea clones established in root knot nematode host spots
under varying treatment regimes. Tea 29(1), 13-22.
Kibet T.K., Johnson K., Daniel K., Edward G. M., & Justus O. (2003). Diversity and distribution
of soil nematodes in Ngere tea catchment area of Murang’a County, Kenya African Journal of
Agricultural Research, 8, 1986-1989
Kimenju J. W., N. K. Karanja and I. Macharia (1999). Plant parasitic nematodes associated with
common bean in Kenya and the effect of Meloidogyne infection on bean nodulation. African
Crop Science Journal, Vol. 7. No. 4, pp 503-510.
Kimenju J.W., Karanja N.K., Mutua G.K., Rimberia B.M., & Wachira P.M. (2009). Nematode
community structure as influenced by land use and intensity of cultivation. Trop. Subtrop.
Agroecosystems, 11, 353-360

75
Kimenju, J. W., Karanja, N. K., Mutua, G. K., Rimberia, B. M., Nyongesa, M. W. (2005).
Impact of land use changes on nematode diversity and abundance. Proceedings African Crop
Science Conference
Kitundu, K. B. M. and Mrema J. P., 2006. The status of Zn, Cu, Mn and Fe in the soils and tea
leaves of Kibena Tea Estates, Njombe, Tanzania. Tanzania Journal of Agricultural Sciences
7(1): 34-41pp
Lee, D. L. (2002). The biology of Nematodes. Taylor and Francis, London. 76-84 pp
Loos, C. A. (1953). Meloidogyne brevicauda. A cause for root knot of mature tea in Ceylon.
Proceedings of the Helminthological society. Washington. 20:83-91pp
Luc, M., Sikora, R. A. and Bridge, J. 2005. Plant parasitic nematodes in Subtropical and Tropical
Agriculture. 2nd
Ed., CABI International, Wallingford, Oxford, UK, 871 pp.
Maina, P., Okoth, S., & Monda, E. (2009). Impact of land use on distribution and diversity of
Fusarium Spp. In Taita Taveta, Kenya. Subtropical and Subtropical Agro ecosystem, 11, 323-
335 pp.
Moens, M., Perry, R. N. and Starr, J. L. 2009. Meloidogyne species – a diverse novel group and
important plant parasite. In: Perry, R. N., Moens, M. & Starr, J. L. (Eds). Root-knot
nematodes. Wallingford, UK, CAB International, 1-17 pp.
Mukherjee, B. and M. K. Dasgupta. 1982. Community analyses of plant parasitic nematodes in
tea plantations, West Bengal, India. Nematol. Medit. 10: 1-7.
Nath T. N. 2013b. The status of Micronutrients (Mn, Fe, Cu, Zn) in Tea plantations in Dibrugarh
district of Assam, India. International Research Journal of Environment Sciences 2(6): 25-30.

76
Neher, D.A. 2010. Ecology of plant and free living nematodes in natural and agricultural soil.
Annual Review of Phytopathology 48: 371-394.
Nelson S., (2006). Zinc deficiency in tea (Camellia sinensis). Plant Disease PD-34pp
Njogu R. N., Kariuki D. M., Kamau D. M. and Wachira F. N. (2013). Relationship between tea
(Camelia sinensis) leaf uptake of major nutrients, nitrogen, phosphorus, and potassium (NPK)
and leaf anatomy of different varieties grown in the Kenyan highlands. International journal
of Humanities, Arts, Medicine and Sciences 2(8):95-102pp
Nzesya MJ, Wangai KJ, Maina MW, Peter WM, Elijah GK (2014) Plant parasitic nematodes
associated with coffee in Kenya and factors influencing their occurrence, abundance and
diversity. J Biol Agric Healthc 4:120–129
O’Halloran, D. M., and Burnell, A. M. 2003. An investigation of chemotaxis in the insect
parasitic nematode Heterorhabditis bacteriophora. Parasitology 127:375-385.
Otieno W., Sudoi V., Wachira F., Mamati G., and Chalo R., (2002). A report on outbreak of root
knot nematodes on tea in Kerugoya and Imenti. TRFK Quaterly Bulletin. 7(3): 6-8
Owuor P.O., Wachira F.N., & Ng’etich W.K. (2010). Influence of region of production on
relative clonal plain tea quality parameters in Kenya. Food Chem, 119, 1168-1174.
Owuor P.O., 2011. Tea in Kenya: Production and country profile. Two and a Bud 58: 10- 18
Ravichandra N. G. (2010). Methods and techniques in plant nematology. PHI learning Pvt. Ltd,
2010.

77
Samuel B. Orisajo, 2012. Distribution of plant parasitic nematodes associated with tea in
Nigeria. World journal of Agricultural sciences 8(5):459-463
Sanne Van Der Wal, 2008 Sustainability Issues in the tea Sector: A comparative Analysis of Six
Leading Producing Countries. http://papers.ssrn.com/sol3/papers.cfm?abstract_id=1660434
Accessed on September 16, 2014.
Sarkar S., Seenivasan S., & Asir R.P.S. (2010). Biodegradation of propargite by Pseudomonas
putida, isolated from tea rhizosphere. Mater, 174, 295-298.
Sivaparan, P. (1967). Nematodes and Tea. Tea Quarterly 38:260-268pp
Sultana J., Siddique M. N. A., Kamaruzzaman M., Halim, M. A. 2014. Conventional to
Ecological: Tea Plantation Soil Management in Panchagarh District of Bangladesh. Journal of
Science, Technology & Environment Informatics, 1(1):27–35.
http://www.journalbinet.com/current-issue-jstei.html
Tabu I.M., Kekana V.M. and Kamau D.M.2015. Effects of Varying Ratios and Rates of
Enriched Cattle Manure on Leaf Nitrogen Content, Yield and Quality of Tea (Camellia
sinensis), Journal of Agricultural Science (5):175-18
Tapan Kumar Mondal (2014). Breeding and biotechnology of tea and its wild species. Springer
2014. 1-8pp.
TBK, 2013. Tea Board of Kenya June News. Posted on 18 June 2013
http://www.teaboard.or.ke/news/2013/28.06.2013.html Accessed on 14, July 2014
78
Thenmozhi K., Manian S and Paulsamy S. (2012). Influence of long term nitrogen and potassium
fertilization on the biochemistry of ftea soil. Journal of research in Agriculture 1(2):124-
135pp
TRFK (2002). Tea Grower’s handbook. The Tea Research Foundation of Kenya. Tea Growers
Handbook. 5th
Edition. The Tea Research Foundation of Kenya. Times Printing Services
Limited.
TRFK, 2009. Tea research foundation of Kenya, strategic plan 2005 – 2010.
http://www.tearesearch.or.ke/index.php?option=com_rokdownloads&view=file&task=do
wnload&id=5:trfk-strategic-plan-march-2009 Accessed on April 23,2017
Venkata, R. (1963). The root knot eelworm of mature tea, Meloidogyne brevicauda, its
importance in S. India and evaluation of certain chemical treatments for its control. Annual
report of UPASI, Tea scientific department, 63pp.
Vitro M. Di, H. M. Rohini and K. Ekanayake (1983). Relationship between population densities
of Meloidogyne incognita and growth of resistant and susceptible tomato. Nematol. Medit.
1983, 11:151-155.
Vitro M. Di, N. Greco and A. Carella (1983). The effect of population densities of Meloidogyne
incognita on the yield of cantaloupe and tobacco. Nematol. Medit. 1983, 11: 169-174
Waarts, Y., L. Ge, G. Ton and D. Jansen 2012. Sustainable tea production in Kenya: Impact
assessment of Rainforest Alliance and Farmer Field School training. LEI report 2012-043.
ISBN/EAN: 978-90-8615-589-7. Available at www.lei.wur.nl/uk

79
Wachira P. M, J. W. Kimenju, S. A. Okoth, J. W. Wangu and T. M. Ng’ang’a (2014). Effect of
land use on abundance and diversity of nematode destroying fungi and soil nematodes in
Embu county, Kenya. Journal of agricultural science; Vol. 6, No. 5; 2014.
Waheed A., Amid F S., Ahmad H., Aslam S., Ahmad N., Akbar A., 2013. Different climatic data
observation and its effect on tea crop. Journal of Mater and Environmental Science 4(2): 299-
308.
Yeates GW, Bongers T, De Goede RG, Freckman DW, Georgieva S (1993). Feeding habits in
soil nematode families and genera--an outline for soil ecologists. J. Nematol. 25:315-331.
Yeates G.W. & Bongers T. (1999). Nematode diversity in agroecosystems. Agric. Ecosyst.
Environ, 74, 113-135.
Yeates, G. W. 1999. Effects of plants on nematode community structure. Annu. Rev.
Phytopathol. 37:127-49
Yeates, G. W., Newton, P. C. D., and Ross, D. J. (1999). Response of soil nematode fauna to
naturally elevated CO2 levels influenced by soil pattern. Nematology 1, 285-326
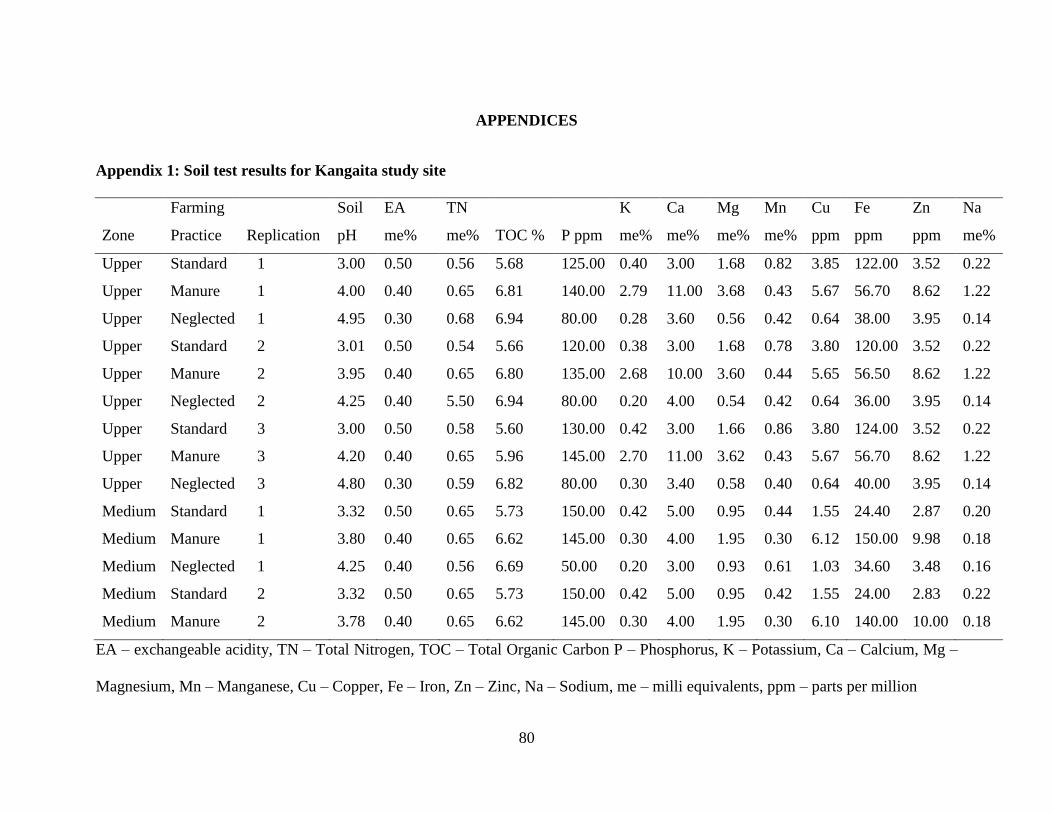
80
APPENDICES
Appendix 1: Soil test results for Kangaita study site
Zone
Farming
Practice Replication
Soil
pH
EA
me%
TN
me% TOC % P ppm
K
me%
Ca
me%
Mg
me%
Mn
me%
Cu
ppm
Fe
ppm
Zn
ppm
Na
me%
Upper Standard 1 3.00 0.50 0.56 5.68 125.00 0.40 3.00 1.68 0.82 3.85 122.00 3.52 0.22
Upper Manure 1 4.00 0.40 0.65 6.81 140.00 2.79 11.00 3.68 0.43 5.67 56.70 8.62 1.22
Upper Neglected 1 4.95 0.30 0.68 6.94 80.00 0.28 3.60 0.56 0.42 0.64 38.00 3.95 0.14
Upper Standard 2 3.01 0.50 0.54 5.66 120.00 0.38 3.00 1.68 0.78 3.80 120.00 3.52 0.22
Upper Manure 2 3.95 0.40 0.65 6.80 135.00 2.68 10.00 3.60 0.44 5.65 56.50 8.62 1.22
Upper Neglected 2 4.25 0.40 5.50 6.94 80.00 0.20 4.00 0.54 0.42 0.64 36.00 3.95 0.14
Upper Standard 3 3.00 0.50 0.58 5.60 130.00 0.42 3.00 1.66 0.86 3.80 124.00 3.52 0.22
Upper Manure 3 4.20 0.40 0.65 5.96 145.00 2.70 11.00 3.62 0.43 5.67 56.70 8.62 1.22
Upper Neglected 3 4.80 0.30 0.59 6.82 80.00 0.30 3.40 0.58 0.40 0.64 40.00 3.95 0.14
Medium Standard 1 3.32 0.50 0.65 5.73 150.00 0.42 5.00 0.95 0.44 1.55 24.40 2.87 0.20
Medium Manure 1 3.80 0.40 0.65 6.62 145.00 0.30 4.00 1.95 0.30 6.12 150.00 9.98 0.18
Medium Neglected 1 4.25 0.40 0.56 6.69 50.00 0.20 3.00 0.93 0.61 1.03 34.60 3.48 0.16
Medium Standard 2 3.32 0.50 0.65 5.73 150.00 0.42 5.00 0.95 0.42 1.55 24.00 2.83 0.22
Medium Manure 2 3.78 0.40 0.65 6.62 145.00 0.30 4.00 1.95 0.30 6.10 140.00 10.00 0.18
EA – exchangeable acidity, TN – Total Nitrogen, TOC – Total Organic Carbon P – Phosphorus, K – Potassium, Ca – Calcium, Mg –
Magnesium, Mn – Manganese, Cu – Copper, Fe – Iron, Zn – Zinc, Na – Sodium, me – milli equivalents, ppm – parts per million

81
Appendix 1: Soil test results for Kangaita study site ‘continued’
Zone
Farming
Practice Replication
Soil
pH
EA
me%
TN
me% TOC %
P
ppm
K
me%
Ca
me%
Mg
me%
Mn
me%
Cu
ppm
Fe
ppm
Zn
ppm
Na
me%
Medium Neglected 2 4.20 0.50 0.56 6.69 50.00 0.20 3.00 0.93 0.60 1.00 34.20 3.48 0.16
Medium Standard 3 3.32 0.50 0.65 5.73 150.00 0.42 5.00 0.95 0.46 1.52 24.80 0.92 0.18
Medium Manure 3 3.82 0.40 0.65 6.62 145.00 0.30 4.00 1.95 0.30 6.14 145.00 9.96 0.14
Medium Neglected 3 4.30 0.40 0.56 6.69 50.00 0.20 3.00 0.93 0.61 1.05 34.50 3.50 0.16
Lower Standard 1 3.02 0.50 0.79 7.07 180.00 0.28 6.00 0.95 0.29 1.40 137.00 1.08 0.20
Lower Manure 1 4.01 0.40 0.69 7.27 95.00 1.50 9.30 3.80 0.20 5.58 40.70 13.10 1.04
Lower Neglected 1 4.90 0.30 0.70 8.14 85.00 0.36 5.00 0.93 0.11 0.70 68.70 2.00 0.24
Lower Standard 2 3.00 0.50 0.78 7.02 175.00 0.26 5.80 0.95 0.28 1.42 136.00 1.04 0.22
Lower Manure 2 4.00 0.40 0.66 7.22 100.00 1.48 9.00 3.80 0.20 5.57 40.40 12.90 1.04
Lower Neglected 2 4.20 0.40 0.70 8.11 85.00 0.40 5.00 0.93 0.10 7.00 68.70 2.00 0.22
Lower Standard 3 3.04 0.50 0.81 7.09 180.00 0.30 6.20 0.95 0.29 1.38 138.00 1.22 0.18
Lower Manure 3 4.02 0.40 0.73 7.28 90.00 1.52 9.60 3.80 0.20 5.58 41.00 13.30 1.04
Lower Neglected 3 4.15 0.40 0.70 8.17 85.00 0.34 5.00 0.93 0.13 7.00 68.70 2.00 0.26
EA – exchangeable acidity, TN – Total Nitrogen, TOC – Total Organic Carbon P – Phosphorus, K – Potassium, Ca – Calcium, Mg –
Magnesium, Mn – Manganese, Cu – Copper, Fe – Iron, Zn – Zinc, Na – Sodium, me – milli equivalents, ppm – parts per million

82
Appendix 2: Soil test results for Weru study site
Zone
Farming
Practice Replication pH
EA
me%
TN
Me%
TOC
%
P
ppm
K
me%
Ca
me%
Mg
me%
Mn
me%
Cu
ppm
Fe
ppm
Zn
ppm
Na
me%
Upper Standard 1 4.11 0.50 0.38 3.04 10.00 0.40 8.20 0.20 0.70 1.60 49.40 5.50 0.20
Upper Manure 1 4.13 0.50 0.34 3.46 25.00 0.52 8.30 0.80 0.30 2.00 53.30 7.20 0.40
Upper Neglected 1 4.20 0.40 0.38 3.93 20.00 0.24 5.40 0.50 0.20 1.00 34.20 3.10 0.20
Upper Standard 2 4.11 0.50 0.36 3.00 10.00 0.40 8.30 0.20 0.70 1.60 49.00 5.40 0.20
Upper Manure 2 4.10 0.50 0.34 3.44 20.00 0.50 8.20 0.80 0.30 2.00 53.10 7.20 0.40
Upper Neglected 2 4.50 0.40 0.38 3.90 20.00 0.22 5.60 0.50 0.20 1.00 34.00 3.10 0.20
Upper Standard 3 4.10 0.50 0.40 3.10 10.00 0.42 8.20 1.00 0.70 2.00 49.20 5.60 0.20
Upper Manure 3 4.12 0.50 0.36 3.48 25.00 0.52 8.30 0.80 0.30 1.50 53.40 7.20 0.40
Upper Neglected 3 4.30 0.40 0.38 3.95 20.00 0.22 5.20 0.50 0.20 1.00 34.10 3.10 0.20
Medium Standard 1 4.35 0.40 0.22 2.26 5.00 0.28 6.20 1.70 0.50 5.60 44.70 2.10 0.20
Medium Manure 1 5.01 0.30 0.24 2.46 25.00 0.76 12.00 0.80 0.20 16.00 23.90 6.70 0.40
Medium Neglected 1 5.18 0.20 0.25 2.65 10.00 0.24 8.00 0.50 0.40 1.00 35.20 4.20 0.20
Medium Standard 2 4.50 0.40 0.22 2.25 10.00 0.26 6.00 1.80 0.50 1.50 44.40 2.10 0.20
Medium Manure 2 5.04 0.30 0.24 2.45 20.00 0.72 12.00 1.80 0.20 15.00 23.70 6.70 0.30
EA – exchangeable acidity, TN – Total Nitrogen, TOC – Total Organic Carbon P – Phosphorus, K – Potassium, Ca – Calcium, Mg –
Magnesium, Mn – Manganese, Cu – Copper, Fe – Iron, Zn – Zinc, Na - Sodium, me – milli equivalents, ppm – parts per million

83
Appendix 2: Soil test results for Weru study site ‘continued’
Zone
Farming
Practice Replication pH
EA
me%
TN
Me%
TOC
%
P
ppm
K
me%
Ca
me%
Mg
me%
Mn
me%
Cu
ppm
Fe
ppm
Zn
ppm
Na
me%
Medium Neglected 2 5.11 0.20 0.25 2.60 10.00 0.24 7.80 0.50 0.40 1.00 35.00 4.20 0.20
Medium Standard 3 4.40 0.40 0.22 2.27 5.00 0.30 6.40 1.80 0.50 1.60 44.90 2.10 0.20
Medium Manure 3 5.00 0.30 0.24 2.47 25.00 0.78 12.00 1.80 0.20 16.00 24.10 6.70 0.40
Medium Neglected 3 5.20 0.20 0.25 2.70 10.00 0.24 8.20 0.50 0.40 1.00 35.20 4.20 0.20
Lower Standard 1 4.14 0.50 0.21 1.34 10.00 0.26 5.00 0.20 0.70 9.20 13.90 1.80 0.10
Lower Manure 1 4.00 0.50 0.14 1.56 5.00 0.52 4.60 0.50 0.40 24.00 39.50 7.10 0.40
Lower Neglected 1 4.50 0.40 0.15 2.28 10.00 0.24 4.20 0.60 0.90 4.80 11.60 3.00 0.20
Lower Standard 2 4.18 0.50 0.21 1.30 10.00 0.26 4.80 0.20 0.70 9.20 14.40 1.70 0.10
Lower Manure 2 4.20 0.50 0.14 2.30 5.00 0.50 4.60 0.50 0.40 23.00 39.00 7.10 0.30
Lower Neglected 2 4.50 0.40 0.15 2.26 10.00 0.22 4.10 0.60 0.90 4.80 11.20 3.00 0.10
Lower Standard 3 4.16 0.40 0.21 1.38 10.00 0.26 5.20 0.20 0.70 9.20 13.60 1.80 0.20
Lower Manure 3 4.10 0.50 0.14 1.50 5.00 0.54 4.60 0.50 0.40 24.00 40.00 7.10 0.40
Lower Neglected 3 4.40 0.50 0.15 1.57 10.00 0.26 4.20 0.60 0.90 4.80 12.00 3.00 0.20
EA – exchangeable acidity, TN – Total Nitrogen, TOC – Total Organic Carbon P – Phosphorus, K – Potassium, Ca – Calcium, Mg –
Magnesium, Mn – Manganese, Cu – Copper, Fe – Iron, Zn – Zinc, Na – Sodium, me – milli equivalents, ppm – parts per million

84
Appendix 3: Nematode trophic levels, abundance and species diversity and their distribution in different farming practices
across the zones in Kangaita and Weru study sites
Kangaita Weru
Zone
Farming
Practice Replication PPN BF FF PR OM Total Species PPN BF FF PR OM Total Species
Upper Standard 1 27 28 23 0 2 80 12 36 13 9 1 0 59 12
Upper Manure 1 21 55 41 2 1 120 14 33 42 14 2 1 92 13
Upper Weedy 1 101 83 18 5 4 211 21 258 49 9 6 5 327 23
Upper Standard 2 29 26 23 0 2 80 12 35 14 7 1 0 57 12
Upper Manure 2 21 57 38 3 1 120 14 32 46 13 2 1 94 13
Upper Weedy 2 93 89 22 7 3 214 20 241 45 8 3 7 304 22
Upper Standard 3 32 25 27 0 3 87 12 31 14 8 0 0 53 11
Upper Manure 3 27 53 38 2 0 120 13 31 43 11 2 2 89 13
Upper Weedy 3 107 90 23 4 4 228 22 242 48 8 3 6 307 22
Medium Standard 1 61 23 27 0 1 112 12 40 11 6 1 0 58 12
Medium Manure 1 78 54 36 1 0 169 13 32 40 15 2 1 90 11
Medium Weedy 1 112 80 29 5 1 227 22 237 42 8 5 5 297 22
Medium Standard 2 60 30 21 0 2 113 12 50 11 3 0 0 64 10
Medium Manure 2 82 56 42 2 1 183 14 36 32 12 2 2 84 12
PPN – plant parasitic nematodes, BF – bacterial feeders, FF – fungal feeders, PR – predators, OM – Omnivores, Total – nematode
abundance, Species – Species diversity

85
Appendix 3: Nematode trophic levels, abundance and species diversity and their distribution in different farming practices
across the zones in Kangaita and Weru study sites ‘continued’
Kangaita Weru
Zone
Farming
Practice Replication PPN BF FF PR OM Total Species PPN BF FF PR OM Total Species
Medium Weedy 2 112 73 29 5 2 221 20 221 47 11 5 5 289 23
Medium Standard 3 67 24 23 0 2 116 12 19 6 8 1 0 34 11
Medium Manure 3 81 53 42 1 1 178 14 42 36 17 2 1 98 12
Medium Weedy 3 114 83 29 6 2 234 20 208 44 10 6 6 274 22
Lower Standard 1 51 30 19 0 2 105 12 56 11 6 2 0 75 12
Lower Manure 1 28 53 44 1 1 127 13 38 41 17 3 1 48 13
Lower Weedy 1 114 93 48 5 3 263 21 268 45 8 6 4 331 23
Lower Standard 2 54 29 25 0 2 110 12 53 11 4 3 0 71 12
Lower Manure 2 22 49 44 2 1 118 13 45 44 19 2 1 111 13
Lower Weedy 2 115 81 40 5 1 242 22 257 50 9 5 3 324 21
Lower Standard 3 49 26 20 0 2 97 12 54 9 4 2 0 69 12
Lower Manure 3 22 45 40 3 1 111 13 51 43 17 2 2 115 13
PPN – plant parasitic nematodes, BF – bacterial feeders, FF – fungal feeders, PR – predators, OM – Omnivores, Total – nematode
abundance, Species – Species diversity