influence of commercial shipping on the color and composition of apple juice concentrate
TRANSCRIPT
INFLUENCE OF COMMERCIAL SHIPPING ON THE COLOR AND COMPOSITION OF APPLE JUICE CONCENTRATE'
NORMA E. BABSKY
Plapiqui-UNS-Conicet Universidad Nacional Del Sur
12 de Octubre 1842 8000 Bahia Blunca
Argentina
RONALD E. WROLSTAD' and ROBERT W. DURST
Department of Food Science and Technology Oregon State Universiiy
Corvallis, OR 97331
Accepted for Publication February 22, 1989
ABSTRACT
Apple juice concentrate manufactured in Argentina was sampled before and after shipment to the USA and subjected to a number of color and compositional analyses. These included browning, haze, Hunter parameters, titratable acidi9, hydroxymethyljurjiural (HMF) , and HPLC determination of sugars, nonvolatile acids, and chlorogenic acid. The primary objective was to determine those parameters which showed sign$cant changes as a result of commercial trans- port. Browning signijicantly increased as did HMF and fumaric acid content. There was no evidence for sucrose inversion and there was no signijicant change in titratable acidity as a result of this 55 day commercial shipment.
INTRODUCTION
In a previous publication (Babsky et al. 1986), it was demonstrated that nonenzymic browning and a number of compositional changes-sucrose inver- sion, decrease in titratable acidity, loss of free amino acids, hydroxymethyl- furfural (HMF) accumulation-took place in apple juice concentrate during stor- age at 37" C. Shipment by sea at ambient temperature is a common transport
'Technical Paper No. 8470 from the Oregon State Agricultural Experiment Station 'Author to whom correspondence should be sent
Journal of Food Quality 12 (1989) 355-367. A / / Rights Reserved. 0 Copyright 1989 by Food & Nutrition Press. tnc. . Triimbull, Connecticut. 355

356 N. E. BABSKY, R. E. WROLSTAD and R. W. DURST
condition in the international commerce of apple juice concentrate. Both pro- cessors and users are interested in knowing what changes in color and composition are likely to occur during actual shipping conditions. To address this question, authentic apple juice concentrate was sampled at a commercial processing plant in the Rio Negro valley, Argentina, and sampled again after shipment to Modesto, California.
Color analyses of samples included measurement of absorbance at 420 nm, determination of Hunter values, and visual comparisons against USDA honey standards. Compositional measurements included sugar and nonvolatile acid profiles, titratable acidity, chlorogenic acid concentration and HMF content. The paired T-test was applied to the data sets to determine differences significant at the 95 and 99% levels. Quantities of HMF, fumaric acid and chlorogenic acid, both before and after shipping, were of particular interest because of their use as indices for authenticity and quality (Brause er al. 1986; Evans ef al. 1983; Junge and Spadinger 1982; Zyren and Elkins 1985).
The focus of this study was to determine what significant compositional and color changes occurred in apple juice concentrate during commercial shipment from Argentina to the USA. A secondary objective was to compare these results with data generated from experimental storage studies under controlled condi- tions. The investigation also allows for the evaluation of various chemical indices which are being proposed and applied for measurement of quality and authenticity.
MATERIALS AND METHODS
Sample Description and History
Clarified apple juice concentrate, 72-73' Brix, was processed at Industrias Cippoletti (Cippoletti, Rio Negro, Argentina) from mixed lots of Red Delicious, Spur, and Golden Delicious fruit. Nine lots were sampled at the processing plant according to the recommended sampling procedure of the Canadian Food and Drug directorate (Nickerson and Sinskey 1972). The 55 gal drums were trans- ported by truck to Puerto Madryn and shipped, unrefrigerated. in early April and received late May at Oakland, CA, for a total transit time of 53-55 days. The drums were sampled again at Tri-Valley Growers, Modesto, CA, on May 3 1 . The concentrate samples were stored in aseptic glass vials without head space at - IS" C until analysis. Samples were diluted to 12.5" Brix at time of analysis.
HPLC Instrumentation
Analyses utilized a Varian Model LC 5000 equipped with a column heater and Varian refractive Index and UV-50 variable wavelength detectors (Varian

SHIPPING APPLE JUICE CONCENTRATE 351
Instrument Group, Walnut Creek, CA) and a Model HP 3380A recording integrator (Hewlett-Packard Corp., Avondale, PA).
HPLC Determination of Sugars, Nonvolatile Acids and Phenolics
Sample preparation, HPLC separation and quantitation of glucose, fructose, sucrose and sorbitol were done following the procedure of Lee and Wrolstad (1988). Malic, quinic, citric, fumaric and shikimic acid determinations were done using the procedures of Hong and Wrolstad (1986). HPLC separation of phenolics and quantitation of chlorogenic acid was done according to the methods of Lee and Wrolstad (1988).
Determination of Titratable Acidity (TA) and Hydroxymethylfurfural (HMF)
TA was done according to the procedure described by the International Fed- eration of Fruit Juice Producers (IFFJP 1974) and reported as g malic/l00 mL. HMF was determined by the procedure described by the IFFJP (1974) which is based on the colorimetric reaction between barbituric acid, p-toluidine and HMF. Results are reported as mg/L.
Color Measurements
The absorbance at 420 nm of single strength juices was measured using 1 cm pathlength quartz cuvettes on a Varian DMS 100 UV-Visible spectrophotometer. The index for turbidity was recorded as the % transmittance at 625 nm.
Hunter L, a, and b values were determined on a Hunter Model DP-25-2 Color Difference Meter. Transmittance measurements utilized 1.0 X 5.0 x 5.5 cm (inside measurement) optical glass cells.
The samples were also visually assessed with the USDA Honey Color Stan- dards. To establish the relationship between the USDA Honey Color Standards and A,?” and Hunter measurements, the following experiment was conducted: Three panelists were given an apple juice concentrate sample and asked to dilute it with distilled water until they obtained a visual match to the “water white”, “extra white”, “white”, and “extra light amber” honey standards. Hunter, A,?,,, and O Brix measurements were made on the panelists’ visually matched samples.
Statistical Analyses
The range, mean, standard deviation (SD) and percent coefficient of variance (%CV) were determined for the various measurements. The paired T-test was

358 N. E. BABSKY, R. E. WROLSTAD and R. W. DURST
used to determine those compositional parameters which were significantly dif- ferent at the 95 and 99% confidence levels between fresh and shipped samples.
RESULTS AND DISCUSSION
Changes in the Sugar Profile
Table 1 compares the glucose, fructose, sucrose and sorbitol contents of the 9 lots of apple juice concentrate before and after shipping. The results are reported for concentrate diluted to 12.5" Brix, which is close to the mean value of 12.73" obtained by Mattick and Moyer in their 93 sample study of apple juice com-
TABLE 1. FREE SUGARS AND SORBITOL CONTENT OF ARGENTINE APPLE JUICE CONCEN-
TRATE BEFORE AND AFTER SHIPMENT TO THE USA
BEFORE SHIPMENT:
Sample Fructose Glucose G1u:Pru Sucrose Sugars Sorbitol Total
g/100ml g/100ml ratio g/100ml g/100ml g/100ml Lot 02 7.08 3.54 0.50 1.54 12.16 0.48 Lot 03 7.03 3.35 0.48 1.54 11.92 0.25 Lot 04 6.84 3.33 0.49 1.52 11.89 0.28 Lot 06 6.68 3.28 0.49 1.56 11.52 0.36 Lot 01 6.65 3.09 0.46 1.63 11.37 0.38 Lot 08 1.19 3.32 0.46 1.75 12.26 0.36 Lot 09 6.90 3.27 0.41 1.69 11.86 0.42 Lot 10 1.10 3.25 0.46 1.18 12.13 0.44 Lot 19 6.83 2.89 0.42 1.70 11.42 0.54
Range 6.65-1.19 2.89-3.54 0.42-0.50 1.52-1.78 11.37-12.26 0.25-0.54 Mean 6.92 3.26 0. 47a 1.63 11.81 0.39 so 0.189 0.181 0.024 0.099 0.333 0.092 z cv 2.1 5.5 5.1 6.0 2.8 23.6
AFTER SHIPMENT:
Sample Fructose
Lot 02 6.96 g/lOOmL
Lot 03 6.37 Lot 04 6.65 Lot 06 6.21 Lot 01 1.53 Lot 08 6.06 Lot 09 7.42 Lot 10 7.24 Lot 19 7.22
Glucose g/100rnL 3.41 2.95 3.11 2.85 3.36 2.61 3.41 3.33 3.07
G1u:Pru ratio 0.49 0.46 0.48 0.46 0.46 0.44 0.41 0.46 0.42
Sucrose g/100nL
1.41 1.43 1.42 1.42 1.84 1.48 1.18 1.81 1.78
Total Sugars g/100ml 11.84 10.15 11.24 10.48 12.83 10.21 12.67 12.38 12.01
Sorbi to1 g/100mL 0.31 0.25 0.22 0.35 0.43 0.45 0.46 0.46 0.51
Range 6.06-1.53 2.61-3.47 0.42-0.49 1.42-1.84 10.21-12.83 0.22-0.57 Mean 6.85 3.15 0. 46a 1.60 11.6 0.39 SD 0.547 0.288 0.021 0.191 0.973 0.114 x cv 1.9 9.1 4.5 11.9 8.4 29.3
a Mean values before and after shipping are significantly different at the 95% confidence level
SHIPPING APPLE JUICE CONCENTRATE 359
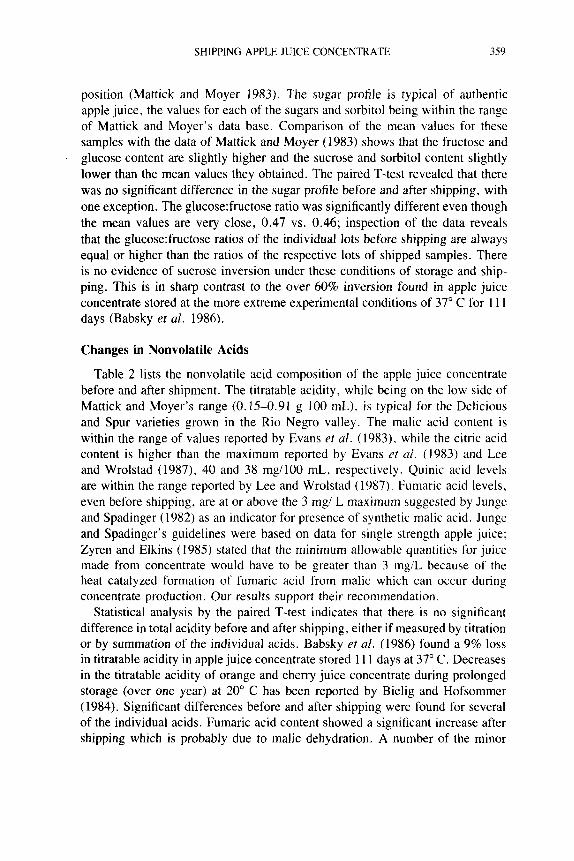
position (Mattick and Moyer 1983). The sugar profile is typical of authentic apple juice, the values for each of the sugars and sorbitol being within the range of Mattick and Moyer's data base. Comparison of the mean values for these samples with the data of Mattick and Moyer (1983) shows that the fructose and glucose content are slightly higher and the sucrose and sorbitol content slightly lower than the mean values they obtained. The paired T-test revealed that there was no significant difference in the sugar profile before and after shipping, with one exception. The g1ucose:fructose ratio was significantly different even though the mean values are very close, 0.47 vs. 0.46; inspection of the data reveals that the g1ucose:fructose ratios of the individual lots before shipping are always equal or higher than the ratios of the respective lots of shipped samples. There is no evidence of sucrose inversion under these conditions of storage and ship- ping. This is in sharp contrast to the over 60% inversion found in apple juice concentrate stored at the more extreme experimental conditions of 37" C for 11 1 days (Babsky et al. 1986).
.
Changes in Nonvolatile Acids
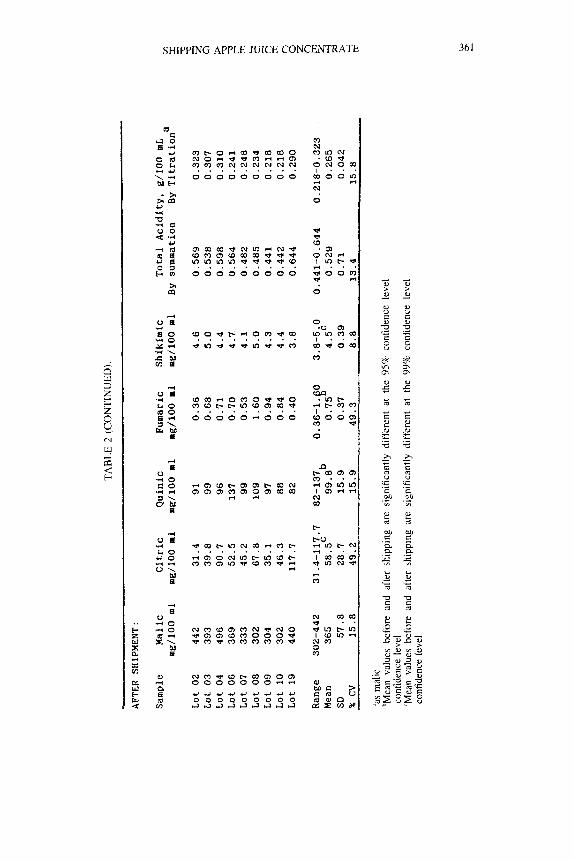
Table 2 lists the nonvolatile acid composition of the apple juice concentrate before and after shipment. The titratable acidity, while being on the low side of Mattick and Moyer's range (0.15-0.91 g 100 mL), is typical for the Delicious and Spur varieties grown in the Rio Negro valley. The malic acid content is within the range of values reported by Evans et al. (1983). while the citric acid content is higher than the maximum reported by Evans et a!. ( 1983) and Lee and Wrolstad (1987), 40 and 3% mg/100 mL, respectively. Quinic acid levels are within the range reported by Lee and Wrolstad (1987). Fumaric acid levels, even before shipping, are at or above the 3 mg/ L maximum suggested by Junge and Spadinger (1982) as an indicator for presence of synthetic malic acid. Junge and Spadinger's guidelines were based on data for single strength apple juice; Zyren and Elkins (1985) stated that the minimum allowable quantities for juice made from concentrate would have to be greater than 3 mgiL because of the heat catalyzed formation of fumaric acid from malic which can occur during concentrate production. Our results support their recommendation.
Statistical analysis by the paired T-test indicates that there is no significant difference in total acidity before and after shipping, either if measured by titration or by summation of the individual acids. Babsky et al. (1986) found a 9% loss in titratable acidity in apple juice concentrate stored 1 1 1 days at 37" C. Decreases in the titratable acidity of orange and cherry juice concentrate during prolonged storage (over one year) at 20" C has been reported by Bielig and Hofsommer (1984). Significant differences before and after shipping were found for several of the individual acids. Fumaric acid content showed a significant increase after shipping which is probably due to malic dehydration. A number of the minor

TAB
LE 2
. N
ON
VO
LATI
LE A
CID
CO
MPO
SITI
ON
AN
D T
OTA
L A
CID
ITY
OF
AR
GEN
TIN
E A
PPLE
JU
ICE
CO
NC
ENTR
ATE
BEF
OR
E A
ND
AR
ER
SH
IPM
ENT
TO T
HE
USA
BEFO
RE S
HIPM
ENT:
Samp
le
Mali
c mg/lOO
m1
Lot 02
408
Lot 03
383
Lot 04
397
Lot 06
317
Lot 07
348
Lot 08
291
Lot 09
316
Lot 10
314
Lot
19
410
Ran
ge
291-410
Mea
n
354
SD
46.3
% cv
13.1
Citr
ic
ng/lOO m
1
21.7
31.8
62.5
35.5
31.5
50.7
30.8
31.4
81.3
21.7-81.3
41.9'
19.19
45.8
Quin
ic
mg/100 m
1
89
88
84
81
101 77
74
90
75
74-108
84.3
8.69
10.3
Fuma
ric
mg/lOO
m1
0.30
0.71
0.61
0.56
0.58
1.55
0.87
0.68
0.36
0.30-1 55
0.69
0.36 b
52.9
Shikimic
mg/100 .1
3.9
4.7
4.4
4.1
4.2
4.8
4.2
3.9
3.5
3.5-4.8
4.2'
0.407
9.7
Tota
l Ac
idit
y, g/100 nl
By
Su
mm
atio
n
By Titrationa
0.523
0.508
0.549
0.438
0.485
0.425
0.426
0.440
0.570
0.323
0.307
0.310
0.241
0.260
0.240
0.220
0.220
0.290
0.425-0.570
0.220-0.323
0.485
0.268
0.555
0.040
11.4
15.0
?
P
?
P
TAB
LE 2
(C
ON
TIN
UED
).
AFT
ER
SHIP
MEN
T :
Sam
ple
Lot
02
L
ot 0
3
Lot
04
Lot
06
Lot
07
L
ot 0
8
Lot
09
L
ot
10
L
ot
19
Ran
ge
Mea
n SD
Mal
ic
ng/l
OO
m
l
442
39
3
496
36
9
33
3
30
2
304
302
440
302-
442
36
5
57
.8
Cit
ric
ng
/lO
O
nl
31
.4
39
.8
90
.7
52
.5
45
.2
67
.8
35
.1
46
.3
11
7.7
31
.4-1
17
.7
58.5
' 2
8.7
Qu
inic
m
g/10
0 a1
91
99
96
13
7
99
10
9
97
88
82
82-1
37b
99
.8
15
.9
Pu
na
ric
n
g/1
00
m
1
0.3
6
0.6
8
0.7
1
0.7
0
0.5
3
1.6
0
0.9
4
0.8
4
0.4
0
0.3
6-1
. 0
0.7
5
0.3
7 PI
Sh
ikim
ic
ng
/10
0 mI
4.6
5
.0
4.4
4
.7
4.1
5
.0
4.3
4
.4
3.8
3.8
-5.0
4
.5c
0.3
9
To
tal
Ac
idit
y.
g/1
00
mL
By
su
mm
atio
n
By
Tit
rati
on
a
0.5
69
0
.53
8
0.5
98
0
.56
4
0.4
82
0
.48
5
0.4
41
0
.44
2
0.6
44
0.3
23
0
.30
7
0.3
10
0
.24
1
0.2
48
0
.23
4
0.2
18
0
.21
8
0.2
90
0.4
41
-0.6
44
0
.21
8-0
.32
3
0.5
29
0
.26
5
0.7
1
0.0
42
%
cv
1
5.8
4
9.2
1
5.9
4
9.3
8
.8
13
.4
15
.8
'as m
alic
'M
ean
valu
es b
efor
e an
d af
ter
ship
ping
are
sig
nifi
cant
ly d
iffe
rent
at
the
95%
con
fide
nce
leve
l co
nfid
ence
lev
el
'Mea
n va
lues
bef
ore
and
afte
r sh
ippi
ng a
re s
igni
fica
ntly
dif
fere
nt a
t th
e 99
% c
onfi
denc
e le
vel
conf
iden
ce l
evel

362 N. E. BABSKY, R. E. WROLSTAD and R . W. DURST
acids--citric, quinic, and shikimic-also showed significant increases after ship- ping. These differences are believed to be due to systematic analytical error rather than actual formation. [While the analyses of the two data sets were performed by the same analyst, they were done on different days in different laboratories. Subsequent to this experiment, an HPLC method for determination of nonvolatile acids in apple juice has been collaboratively tested and approved by AOAC (Coppola and Starr 1986); it is to be recommended for more accurate determination of apple nonvolatile acids. J
Changes in HMF and Chlorogenic Acid Content
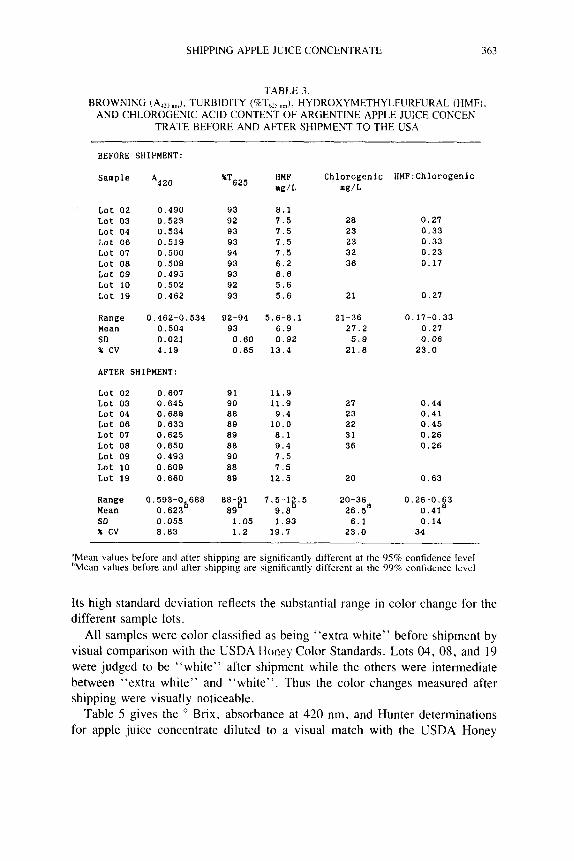
Table 3 gives the results for the browning, turbidity, HMF, and chlorogenic acid determinations before and after shipping. HMF content increased signifi- cantly after shipping. This is not surprising in light of Beilig et al.’s (1982) report that its concentration in apple juice could double during filling and storage. The mean values either before or after storage are higher than the 5.0 mg /L guideline recommended by the International Federation of Fruit Juice Producers (1974). Four of the eight samples in Lee and Wrolstad’s (1987) study exceeded 5 mg/L. The chlorogenic acid content decreased slightly but significantly (95%) as a result of shipping. The mean values for both data sets at 27 mg/L were slightly below the 30 ppm minimum value used by Brause et a!. (1986) as an index for authenticity. Wrolstad and Lee (1987) found chlcrogenic content to vary widely (1-214 mg/L) in authentic apple juice. Van Buren et al. (1976) demonstrated that enzymic activity during depectinization had a pronounced effect on chlorogenic acid content of apple juice. Zyren and Elkins (1985) included HMF and chlorogenic acid determinations in their collaborative study concerning apple juice authenticity. A level of 20 ppm chlorogenic acid was considered. by them to be normal. They concluded from their data base that the HMF: chlorogenic acid ratio for authentic apple juice should be 0.2 or less. Only Lot 08,before shipping of our samples,had a HMF: chlorogenic ratio less than 0.20.
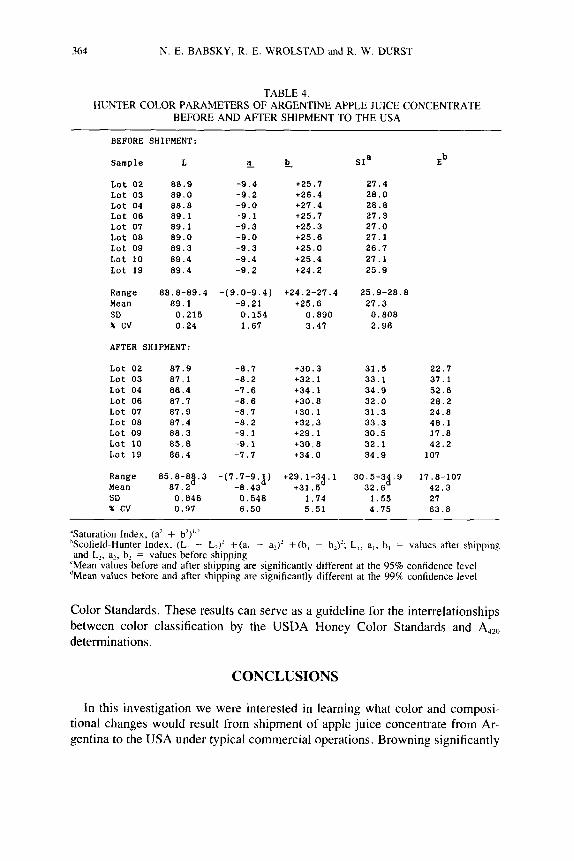
Color Changes as a Result of Shipping
Shipping resulted in a significant increase in browning as measured by the absorbance at 420 nm (Table 3). There was also a significant increase in turbidity as measured by percent transmittance at 625 nm. Table 4 lists the Hunter color parameters of the samples before and after shipment. All of the color indices were significantly different at the 99% confidence level before and after shipping. The % CV for all of the color measurements was low (6.5% or less) for all the individual data sets. The Scofield-Hunter index was calculated from the differ- ences in the Hunter measurements of the individual lots before and after shipping.
363 SHIPPING APPLE JUICE CONCENTRATE
TABLE 3 .
AND CHLOROGENIC ACID CONTENT O F ARGENTINE APPLE J U X E CONCEN- TRATE BEFORE AND AFTER SHIPMENT TO THE USA
BROWNING (A420 ..J. TURBIDITY ( 9 T c ,,), HYDROXYMETHYLFURFURAL (HMF).
BEFORE SHIPMENT:
Sample A420
Lot 0 2 0 .490 Lot 03 0 .523 Lot 04 0.534 Lot 06 0 .519 Lot 07 0 .500 Lot 08 0 . 5 0 9 Lot 09 0 . 4 9 5 Lot 10 0 .502 Lot 19 0 .462
Range 0.462-0.534 Mean 0.504 SD 0 . 0 2 1 % cv 4.19
AFTER SHIPMENT:
Lot 02 0 . 6 0 1 Lot 03 0 .645 Lot 04 0.668 Lot 06 0 .633 Lot 01 0.825 Lot 08 0 .850 Lot 09 0 . 4 9 3 Lot 10 0 . 6 0 9 Lot 19 0.660
Range 0.593-0 688 Mean 0 . 6 2 3 SD 0.05.5 % cv 8 . 8 3
b
HMF Chlorogenic HMF:Chlorogenic %*li25 mg/L mg/L
93 9 2 93 93 94 93 93 92 93
8 . 1 1 . 5 28 7 . 5 23 7 . 5 23 1 . 5 32 6 . 2 36 8.6 5 . 6 5 . 6 2 1
0 . 2 1 0 . 3 3 0 . 3 3 0 . 2 3 0 . 1 7
0 . 2 1
92-94 5 . 6 - 8 . 1 21-36 0 . 1 7 - 0 . 3 3 93 6 .9 21.2 0 . 2 7 0.60 0 . 9 2 5 . 9 0 .06 0 . 6 5 1 3 . 4 21 .8 2 3 . 0
91 11.9 90 1 1 . 9 27 0 . 4 4 88 9 . 4 23 0.41 89 10.0 22 0 . 4 5 89 8 . 1 3 1 0 . 2 6 88 9 . 4 36 0 . 2 6 90 1 . 5 88 7 . 5 89 1 2 . 5 20 0 . 6 3
88-%1 7.5-1g .5 20-36 0 .26-0 .63 89 9 . 8 26.5‘ 0.41a
1.05 1.93 6 .1 0.14 1 . 2 1 9 . 7 2 3 . 0 34
‘Mean values before and after shipping are significantly different at the 95% confidence level ’Mean values before and after shipping are significantly different at the 99% confidence level
Its high standard deviation reflects the substantial range in color change for the different sample lots.
All samples were color classified as being “extra white” before shipment by visual comparison with the USDA Honey Color Standards. Lots 04, 08, and 19 were judged to be “white” after shipment while the others were intermediate between “extra white” and “white”. Thus the color changes measured after shipping were visually noticeable.
Table 5 gives the O Brix, absorbance at 420 nm, and Hunter determinations for apple juice concentrate diluted to a visual match with the USDA Honey
364 N. E. BABSKY, R. E. WROLSTAD and R. W. DURST
TABLE 4. HUNTER COLOR PARAMETERS OF ARGENTINE APPLE JUICE CONCENTRATE
BEFORE AND AFTER SHIPMENT TO THE USA
BEFORE SHIPMENT:
Sample L
Lot 02 88.9 Lot 03 89.0 Lot 04 88.8 Lot 06 89.1 Lot 07 89.1 Lot 08 89.0 Lot 09 89.3 Lot 10 89.4 Lot 19 89.4
Range 88.8-89.4 Mean 89.1 SD 0.215 % cv 0.24
AFTER SHIPMENT:
Lot 02 87.9 Lot 03 87.1 Lot 04 86.4 Lot 06 87.7 Lot 07 87.9 Lot 08 87.4 Lot 09 88.3 Lot 10 85.8 Lot 19 86.4
Range 85.8-8g. 3 Mean 87.2 SD 0.846 % cv 0.97
a !i.
-9.4 t25.7
-9.0 t27.4 -9.1 t25.7
-9.0 t25.6
-9.2 t26.4
-9.3 t25.3
-9.3 t25 I 0 -9.4 t25.4 -9.2 t24.2
-(9.0-9.4) t24.2-27.4 -9.21 t25.6 0.154 0.890 1.67 3.47
-8.7 t30.3 -8.2 t32.1
-8.6 t30.8 -8.7 t30.1 -8.2 t32.3 -9.1 t29.1 -9.1 +30,8 -7.7 t34.0
-(7.7-9.4) t29.1-34.1 -8.43 +31.5
-7.0 t34.1
0.548 1.74 6.50 5.51
SIa Eb
27.4 28.0
27.3 27.0 27.1 26.7 27.1 25.9
28.8
25.9-28.8
0.808 2.96
21.3
31.5 22.7 33.1 37.1 34.9 52.6 32.0 28.2 31.3 24.8 33.3 48.1 30.5 17.8 32.1 42.2 34.9 101
30.5-34.9 17.8-107 32.6 42.3 1.55 21 4.75 63.8
"Saturation Index, (a2 + b')' 'Scofield-Hunter Index, ( L , - L2)' +(a, - a$ +(b, - b$; L, , a,, b, = values after shipping and L,, a>, bZ = values before shipping
'Mean values before and after shipping are significantly different at the 95% confidence level 'Mean values before and after shipping are significantly different at the 99% confidence level
Color Standards. These results can serve as a guideline for the interrelationships between color classification by the USDA Honey Color Standards and A,,, determinations.
CONCLUSIONS
In this investigation we were interested in learning what color and composi- tional changes would result from shipment of apple juice concentrate from Ar- gentina to the USA under typical commercial operations. Browning significantly

SHIPPING APPLE JUICE CONCENTRATE 365
TABLE 5 . "BRIX AND ABSORBANCE AT 420 NM DETERMINATIONS OF APPLE JUICE CONCENTRATE DILUTED BY 3 PANELISTS TO A VISUAL MATCH OF THE
USDA HONEY COLOR STANDARDS
Standard
"Water Wh I t e "
Mean
"Extra White"
Mean
"White"
Mean
"Extra Light Amber"
Mean
Panel Is t
1 2 3
1 2 3
1 2 3
1 2 3
'Brix
6 . 0 4 . 2 5 . 8
5 . 3
9 . 0 9 . 5 8 . 0
8 . 8
1 6 . 4 1 7 . 8 1 8 . 8
1 7 . 7
3 2 . 6 3 6 . 0 3 4 . 8
3 4 . 5
*420
0 . 2 9 5 0 . 2 1 7 0 . 2 6 2
0 . 2 5 8
0 . 4 4 7 0 . 4 4 6 0 . 3 9 7
0 . 4 3 0
0 . 8 3 2 0 . 8 6 4 0 . 9 4 2
0 . 8 7 9
1 . 6 9 5 1 . 9 4 0 1 . 8 7 0
1 . 8 3 5
increased as measured by the absorbance at 420 nm and Hunter measurements. Other significant increases were in HMF and fumaric acid content. In light of these results, proposed standards for authenticity based on fumaric and HMF content need to take into consideration the quantities that can be formed during storage and shipment as well as processing. There was no significant difference in total acidity, nor did sucrose inversion take place. Juice samples in this study even before shipping contained lower chlorogenic acid levels and higher fumaric and HMF levels than has been suggested as guidelines for authenticity by various workers. While indices derived from HMF, fumaric acid and chlorogenic content can be useful in evaluating juice quality and authenticity, caution needs to be used in their application.
ACKNOWLEDGMENTS
Technical Paper No. 8470 from the Oregon State Agricultural Experiment Station.
The senior author expresses her appreciation to PLAPIQUI for the awarding of a travel-research grant for the purpose of conducting the research at Oregon State University.
366 N. E. BABSKY, R. E. WROLSTAD and R. W. DURST
The cooperation and help of Industrias Cippoletti, Cippoletti, Argentina, Tri- Valley Growers, Inc., Modesto, CA, and Tree Top, Inc., Selah, WA, in con- ducting this study is appreciated. The work was supported in part by grants from the following companies through the Oregon State University Agricultural Re- search Foundation: Industrias Cippoletti, Clermont Fruit Packers lnc., Gama Foods Inc., General Mills Inc., General Foods Corporation, Juices and Beverages Inc., Kerr Concentrates Inc., Lewis Packing Company, Minot Food Packers Inc., A. F. Murch Co., Ocean Spray Cranberries Inc., J . M. Smucker Co. and Tree Top Inc.
REFERENCES
BABSKY. N . E., TORIBIO, J . L. and LOZANA, J . E. 1986. Influence of storage on the composition of clarified apple juice concentrate. J. Food Sci. 51, 564567.
BIELIG, H. J. , FEATHE, W., KOCH, J., WALLRAUCH, S. and WUCH- ERPFENNIG, K. 1982. Standard values and ranges of specific refernce num- bers for apple juice, grape juice and orange juice. Flussiges Obst. 49, 177-
BIELIG, H. J . and HOFSOMMER, H. J. 1984. Technology of fruit juice man- ufacture and its effect on composition. Voedingsmiddelentechnologie 17 (4),
BRAUSE, A. R., RATERMAN, J . M., DONER, L. W. and HILL, E. C. 1986. Detection of adulteration in apple juice and orange juice by chemical matrix method. Flussiges Obst. 53, 15-16, 19-20.
COPPOLA, E. D. and STARR, M. S. 1986. Liquid chromatographic deter- mination of major organic acids in apple juice and cranberry juice cocktail: Collaborative study. J . Assoc. Off. Anal. Chem. 69, 594.597.
EVANS, R. H., VAN SOESTBERGEN, A. W. and RISTOW, K. A. 1983. Evaluation of apple juice authenticity by organic acid analysis. J. Assoc. Off. Anal. Chem. 66, 1517-1519.
HONG, V. and WROLSTAD, R. E. 1986. Cranberry juice composition. J . Assoc. Off. Anal. Chem. 69, 199-207.
IFFJP. 1974. International Federation of Fruit Juice Producers Methods. Analysen-analyses; Fruit-Union Suisse Assoc. Svizzera Frutta, Zug, Suiza,
JUNGE, C. and SPADINGER, C. 1982. Proving an addition of L(-) and DL malic acid in apple and pear juices by determining the quantity of fumaric acid. Flussiges Obst. 49, 57-62.
LEE, H. S. and WROLSTAD, R. E. 1988. Apple juice composition: Sugar, nonvolatile acid, and phenolic profiles. J . Assoc. Off. Anal. Chem. 71, 789- 794.
176; 188-199.
12-17.
1962-1974, 12, 1 .
SHIPPING APPLE JUICE CONCENTRATE 367
MATTICK, L. R. and MOYER, J. C. 1983. Composition of apple juice. J . Assoc. Off. Anal. Chem. 66, 1251-1255.
NICKERSON, J. T. and WINSKEY, A. J . 1972. Microbiology of Food and Food Processing, American Elsevier Publ., New York.
VAN BUREN, J . , de VOS, L. and PILNIK, W. 1976. Polyphenols in Golden Delicious apple juice in relation to method of preparation. J. Agric. Food Chem. 24, 448-451.
ZYREN, J. and ELKINS, E. R. 1985. Interlaboratory variability of methods used for detection of economic adulteration in apple juice. J . Assoc. Off. Anal. Chem. 68. 672-676.