influence of customer values and self- … congruity on customer behavior-based crm performance ......
TRANSCRIPT
INFLUENCE OF CUSTOMER VALUES AND SELF-IMAGE CONGRUITY ON CUSTOMER BEHAVIOR-
BASED CRM PERFORMANCE
Mandy Loh Maisarah Ahmad
Suhaila Abdul Kadir Syed Shah Alam
Universiti Kebangsaan Malaysia Email: [email protected]
Abstract: The purpose of this study is to investigate the influence of the key dimensions of customer value (functional value, emotional value, social value, and perceived sacrifice) and self-image congruity on customer-behavior based CRM performance. The study also attempts to investigate on the effect of key dimensions of customer value and self-image congruity on customer satisfaction and brand loyalty. The research model for this study was adopts an integrated framework from a previous study, and adds new element into it. This study has chosen to examine the framework in the retail industry, specifically hypermarket in Malaysia, where the adoption of CRM tools is increasing incrementally. The study target on the Generation Y who believed will be the future driver of retail industry. The findings show that perceived sacrifice appears to be a critical customer perceived value in influencing the customer behavior-based CRM performance and customer satisfaction. This study show that brand loyalty would directly influence the customer behavior-based CRM performance. Perceived sacrifice and brand loyalty should be focused when trying to improve the performance of CRM. Keywords: Customer Values, Self-Image Congruity, Customer Behavior, CRM Performance 1. Introduction
Over the past decade, firms have gradually moved away from product-centric marketing towards customer-centric marketing. Customer relationship management (CRM) emerges as a popular relationship marketing tool and captures the interests of both academicians and practitioners since the late of 1990s (Foss, Stone & Ekinci 2008; Ngai 2005; Payne, & Frow 2005). A recent statistics shows that the total worldwide CRM software revenue totaled $18 billion in 2012, grew 12.5 percent from $16 billion in 2011. However, greater potential in business have encouraged companies to move from product-centric marketing
to the customer-centric marketing. Lim (2002) found that over 30% of respondents agree that CRM market in Malaysia shows a healthy growth. It is also found that those primarily dealing in B2C have a high adoption rate and are actively seeking CRM solutions.
In an international survey of 1,337 companies that have implemented CRM systems, CSO Insights estimated that only 25 percent reported significant improvements in performance (Foss et al, 2008). However, there is still costly for a firm to invest in CRM solutions. Buttle (2008) suggested there are three areas the firm has to invest in: IT, people, and process costs.
The paper is organised as follows. Following this introduction, the problem
24 statement and objective, the theoretical background and conceptual framework, research model and hypothesis, and the key hypotheses are provided. The next section presents the methodology of the study. Then the empirical analysis is conducted by developing structural equation models using the AMOS method based on a customer survey of 194 respondents conducted in Universiti Kebangsaan Malaysia Bangi Campus, and at a hypermarket in Kajang and all the hypotheses proposed in this paper are tested. Finally, discussion and conclusions are presented.
2. Problem statement and
objective Customer relationship
management is a strategic tool for attracting and maintaining customers and is one of the most important factors in production and service businesses success (Yonggui et al, 2004). Delivering value has become a constant approach in creating and strengthening competitive advantage through CRM. As most researchers' believe, if companies want to improve their performance based on CRM, they must revise the process of creating and delivering value to their customers (Yonggui et al, 2004). Researchers have suggested that, firms should reorient their operations towards the creation and delivery of superior customer value in order to improve their CRM performance (Jensen 2001; Maryam Eskafi, Hosseini & Mohammadzadeh 2013; Wang et al. 2004). Delivering superior value becomes a strategic weapon in attracting and retaining customers, and it has an important role in providing managers with insights into how to achieve superior CRM performance (Maryam Eskafi et al. 2013; Wang et al. 2004).Thus, this research would try to investigate on the effect of different dimensions of customer value towards CRM performance. This study would adopt an integrated framework
developed by Wang et al. (2004), add a new element, and test it in a different setting. Therefore, this study will focus on understanding Generation Y, on their perceived customer values and how their perceived customer values affect their satisfaction and loyalty, and also their behavior towards CRM tools. Specifically, the main objectives of this study are:
i. To examine the effect of different dimensions of perceived customer value (functional, perceived sacrifices, social and emotional) and self-image congruity on customer behavior-based CRM performance.
ii. To investigate the effect of different dimensions of perceived customer value (functional, perceived sacrifices, social and emotional) and self-image congruity to customer satisfaction and brand loyalty.
3. Theoretical Background
and Conceptual Framework With the increasingly intense
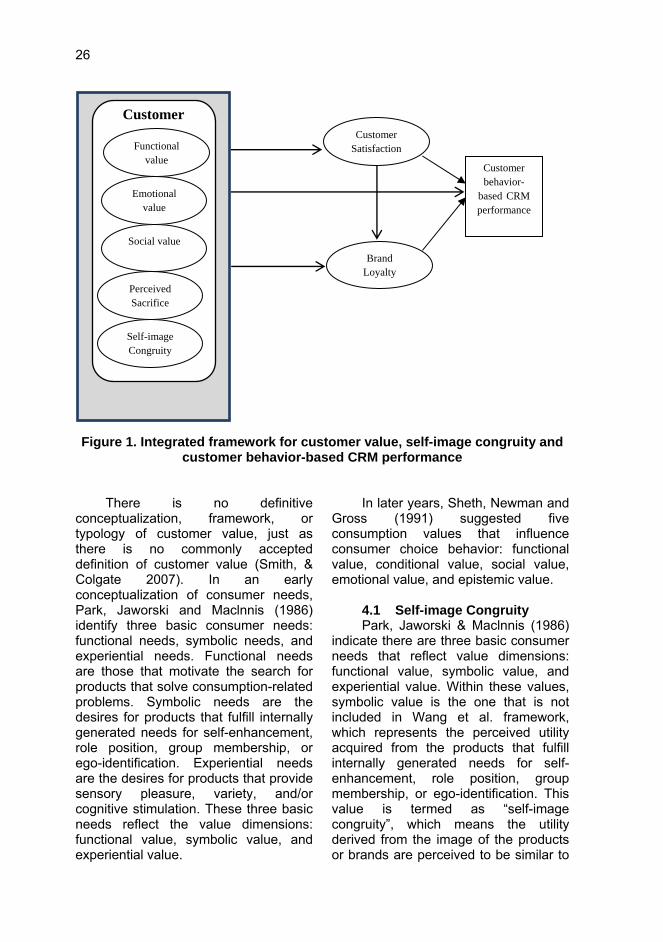
business competition and globalization, it becomes a trend for firms to shift to a customer-centric perspective, and increase interest in value creation and delivery, focusing more on the effective of customer relationship management (Wang et al. 2004). For that purpose, understanding the influence of different elements on the customer relationship quality is important to achieve desired customer behavior or performance. Figure 1.1 illustrates an integrated framework proposed by (Wang et al. 2004), examined on the relationship of key dimensions of customer value, customer satisfaction, customer loyalty, and customer behavior-based CRM performance. This framework was then adopted by Eskafi (2013) and tested in different segment of sample, proved its reliability. In the present study, this framework adopts and adds in a new dimension which is “self-image congruity” to provide a thoroughly measurement on the customer behavior-based CRM performance. The
25 addition of new dimension into this framework is further discussed in the following section.
There are two dominants of the term “customer value” - value for the customer (customer perceived value or customer received value) and value for the firm (more commonly referred to as customer lifetime value)(Smith, & Colgate 2007). This study focuses on the former. In a study, Zeithaml (1988)integrates different consumer expressions of value from previous researches and captured them in an overall definition to customer value: “the consumer’s overall assessment of the utility of a product based on perceptions of what is received and what is given”. Woodruffdefines customer value as “a customer’s perceived preference for and evaluation of those product attributes, attribute performances, and consequences arising from use that facilitate (or block) achieving the customer’s goals and purposes in use situations” (1997, p. 142). Similarly, Buttle (2008, p. 228) defines customer value as the customer’s perception of the balance between benefits received and sacrifices made to experience those benefits. Buttle also suggests that, to increase the customer’s perception on value gained, firm has to increase the benefits that customer experience, or decreases the sacrifices they make (2008, p. 228). These sacrifices can be classified into three categories: monetary costs, search costs, and psychic costs (Buttle, 2008). In line with this, Kotler et al. (2010) also defines customer value from the perspective of trade-off between “benefits received” and “costs or sacrifices given”, that is “the different between the benefits the customer gains from having access to or owning and using an offering and the costs of obtaining it.”
Delivering superior customer value is now recognized as one of the most important success factors of a firm in the future because it has a significant
impact on the behavioral intentions of customers and because it has an important role in providing managers with insights into how to achieve superior CRM performance (Wang et al., 2004). The ability of a company to provide superior value to its customers is regarded as one of the most successful competitive strategies (Ravald, & Grönroos 1996). Unarguably, customer perceived value is the antecedent of customer satisfaction (Flint, Blocker & Boutin 2011; Oh 1999; Ravald, & Grönroos 1996; Woodruff 1997). Customer value also affects customer retention or continued customer patronage (Mittal, & Sheth 2001), repurchase intention (Oh, 1999), and word-of-mouth (Oh, 1999). As customer value becomes a new strategy element that need to be considered to compete in today’s market, Flint et al (2001) suggested that suppliers should not only be better than their competitors at uncovering and creating what customer value, but need to also be good at anticipating what those customers will value in the future.
4. Research Model and
Hypotheses of this Study As shown in Figure 1, functional
value, emotional value, social value, and perceived sacrifice are proposed as key dimensions of customer value, and self-image congruity proposed as new dimension that would also influence the customer relationship. The key dimensions of customer value and self-image congruity are proposed to influence the customer behavior-based CRM performance, directly or indirectly through customer satisfaction and brand loyalty. Customer behavior-based CRM performance is emphasizes more on possible customer behaviors such as customer retention, cross buying, repurchase, WOM and so on, which are potential to produce benefits and profits to the firm as the ultimate objective of practicing CRM.
26
Figure 1. Integrated framework for customer value, self-image congruity and
customer behavior-based CRM performance
There is no definitive
conceptualization, framework, or typology of customer value, just as there is no commonly accepted definition of customer value (Smith, & Colgate 2007). In an early conceptualization of consumer needs, Park, Jaworski and Maclnnis (1986) identify three basic consumer needs: functional needs, symbolic needs, and experiential needs. Functional needs are those that motivate the search for products that solve consumption-related problems. Symbolic needs are the desires for products that fulfill internally generated needs for self-enhancement, role position, group membership, or ego-identification. Experiential needs are the desires for products that provide sensory pleasure, variety, and/or cognitive stimulation. These three basic needs reflect the value dimensions: functional value, symbolic value, and experiential value.
In later years, Sheth, Newman and Gross (1991) suggested five consumption values that influence consumer choice behavior: functional value, conditional value, social value, emotional value, and epistemic value.
4.1 Self-image Congruity Park, Jaworski & Maclnnis (1986)
indicate there are three basic consumer needs that reflect value dimensions: functional value, symbolic value, and experiential value. Within these values, symbolic value is the one that is not included in Wang et al. framework, which represents the perceived utility acquired from the products that fulfill internally generated needs for self-enhancement, role position, group membership, or ego-identification. This value is termed as “self-image congruity”, which means the utility derived from the image of the products or brands are perceived to be similar to
Functional value
Emotional value
Social value
Perceived Sacrifice
Self-image Congruity
Customer Satisfaction
Brand Loyalty
Customer behavior-
based CRM performance
Customer
27 customers’ own self-concept. On the contrary, “social value” dimension is more focus on enhancing self-concept, whereas “self-image congruity” focuses on the product selection process where customers tend to select products with attributes or image that match some aspects of the self (Graeff, 1996; Jamal, & Goode 2001) or desired self. Research also suggest that consumers might prefer a brand on the basis of its symbolic properties or its image rather than its functional qualities (Jamal& Goode 2001). Thus, self-image congruence should not be ignored as one of the dimensions that will has effect on customer satisfaction, brand loyalty, and behavior-based CRM performance.
Self-concept (or self-image) has become a popular approach in investigating relationships between how individuals perceive themselves and how they behave as consumers (Loudon & Bitta, p. 488). Self-concept refers to the totality of an individual’s thoughts and feelings about himself, not only about physical being, but includes characteristics such as “strength, honesty, good humor, sophistication, justice, guilt and others (Loudon & Bitta, p. 488)”. Sirgy (1983) identifies six dimensions of self-concepts: actual, ideal, social, ideal social, expected and expressive. Actual self-concept refers to the image of oneself as he/she perceives him/herself; ideal self-concept refers to the image of oneself he/she would like to be; social self-concept (also referred as “looking-glass self” or “presenting self”) defined as the image that one believes others have of him/her; ideal social self-concept (or “desired social self”) refers to the image that one would like others to have about him/her; expected self refers to that image somewhere between the actual and the ideal self-concept; and the expressive self refers to either the ideal self-concept or social self-concept.
Belk (1988) states that possessions are a major contributor to
and reflection of our identities. We are equal to sum of our possessions. Graeff (1996) suggests that people would act in ways that maintain and enhance their self-concept. These directly or indirectly influence a customer’s choice behavior on a product or a brand. In the increasingly crowded marketplace, consumers tend to make purchase decisions relying more on a brand’s image than on its physical characteristics, particularly for the product in the “mature” stage (Graeff, 1996). Consumer may develop preferences toward a certain brands because the consumer perceive the brand as reflecting his/her own self-image (actual self-concept), or he/she views it as projecting an image that he/she presently does not possess but aspires to have (ideal self-concept) (Loudon, & Bitta, 1988).
4.2 Customer Relationship
Management (CRM) CRM means different things to
different people (Buttle 2008). In the early 1980s, CRM is considered as database marketing, primarily linking marketing of the organization with the database of the customers (Rai 2008). Some of the information technology (IT) company, use the term CRM to describe software applications that automate the marketing, selling and service functions of businesses (Buttle, 2008). Buttle (2008) classified CRM into three different perspectives: strategic CRM, operational CRM, and analytical CRM. Strategic CRM is focused on the development of a customer-centric business culture, operational CRM focused on the automation of the customer-facing parts of businesses, while analytical CRM is focused on exploiting customer data to enhance both customer and company value. In a later literature review, Wahlberg et al.,(2009) identified another perspective of CRM out of these three levels, collaborative CRM which is focused on the use of different communication
28 channels to communicate with the customers. The review of Wahl berg et al. also show that the trends of researches in CRM is shifting from analytical CRM to strategic CRM in recent year, suggesting that possible cause by the high rate of implementation failures reported.
Another conceptualization of CRM by Zablah et. al.(2004)suggest classification of CRM into five dominant perspectives: process, strategy, philosophy, capability, and technology. Following the analysis and review on different perspectives of CRM, Zablah et. al. proposed that the CRM is best conceptualized as “an ongoing process that involves the development and leveraging of market intelligence for the purpose of building and maintaining a profit-maximizing portfolio of customer relationships”.
4.3 Customer behavior-based
CRM performance Several measurement tools have
been developed trying to conceptualize CRM processes and measure its performance (Reinartz, Krafft, & Hoyer, 2004; Ryals, 2005; Öztaysi, Sezgin, & Özok, 2011). Kim and Kim(2009) develop a CRM score card, attempt to diagnose and assess a firm’s CRM practice thoroughly, ranging from the infrastructure used, to the CRM process and from customer’s perspectives, and ultimately to organizational performance. M. Kim et. al.(2012) argued that the success of CRM implementation should explore through customers’ viewpoints, given that customer as one of the beneficiaries of CRM. However, there are little concern given regarding customers’ viewpoints, whereas much research are concerning on CRM user’s point of view (M. Kim et al. 2012). Ryals's research (2005) also shows that, the practice of CRM will delivers greater profits or generates better firm performance, when managers focus on maximizing the value of the customer. Wang et.
al.(2004) also support this point of view, stressing that CRM performance should be measured ultimately in terms of customer behaviors, since they are the underlying sources of value of current customers of a firm, and have the potential to increase the future revenue. Wang et. al. (2004) examine customer behavior-based CRM performance in term of customer retention, repurchase, cross-buying and WOM. In addition, it is also shown that these customer behavior are also influenced by customer satisfaction and brand loyalty (E. Anderson, & Sullivan 1993; Dick, & Basu 1994; Maryam Eskafi et al. 2013; Wang et al. 2004; Zeithaml, Berry & Parasuraman 1996), also directly or indirectly influenced by self-image congruity (Fiol 2009; He, Li & Harris 2012; Kang, Tang & Bosselman 2011; Kressmann et al. 2006; Liu et al. 2012).
Based on the above discussion, the proposed hypotheses are as follow:
Hypothesis 1a: Functional value has a direct and positive effect on customer behavior-based CRM performance.
Hypothesis 1b: Emotional value has a direct and positive effect on customer behavior-based CRM performance.
Hypothesis 1c: Social value has a direct and positive effect on customer behavior-based CRM performance.
Hypothesis 1d: Perceived sacrifice has a direct and negative effect on customer behavior-based CRM performance.
Hypothesis 1e: Self-image congruity has a direct and positive effect on customer behavior-based CRM performance.
5. Brand Loyalty Loyalty is commonly defined in two
different approaches: attitudinal or behavioral (Gilbert, 2003, p. 64; Peppers & Rogers, 2011, p. 193). The attitudinal definition of loyalty implies that the loyalty of a customer is in the
29 customer’s state of mind. A customer is “loyal” to a brand or company if the customer has a positive, preferential attitude toward it. However, the behavioral definition of loyalty relies on a customer’s actual conduct, regardless attitudes or preferences that underlie that conduct. A customer is “loyal” to a brand or company simply they buy from it and continue to buy from it (Peppers, & Rogers 2011). It is inappropriate to incline on any of the approach when measuring brand loyalty. For example, behavioral loyalty cannot distinguish between true loyalty and spurious loyalty, a person theoretically considered as “loyal” to a brand when they repurchase the offer, but actually they don’t really like it, provided other reasons such as lower price, familiarity or social influences (Dick, & Basu 1994). Peppers and Rogers also argue that attitudinal loyalty without behavioral loyalty has no financial benefit for a firm, but behavioral loyalty without attitudinal loyalty is unsustainable. Therefore, the present study adopts definition by Assael (1992), which defined brand loyalty as “a favorable attitude towards a brand, thus resulting in consistent purchase of the brand over time”, included both attitudinal and behavioral approaches.
Findings show that customer perceived value and satisfaction are antecedents of loyalty (Eskafi, 2013; Fiol, 2009; Wang, et. al., 2004). Customer perceived value directly or indirectly influencing customer loyalty through customer satisfaction. Customer perceived value, specifically from a multidimensional perspective, is identified as a key variable in the formation of satisfaction and loyalty (Fiol 2009). Findings also show that self-image congruity has direct or indirect positive influence on loyalty (Kressmann et al., 2006; Liu, Li, Mizerski, & Soh, 2012), suggested that firms should develop or enhance brand images in order to enhance consumer’s loyalty towards the brand.
Customer loyalty is very important to any firm, for it would bring increased spending of consumers, making consumers willing to pay more, and spread Word-Of-Mouth (WOM), ultimately, providing ongoing revenue (Zeithaml et al. 1996). Dick and Basu (1994) identified three different antecedents of loyalty: cognitive, affective and conative loyalty, and found that three of them collaborate with repeat patronage, and search motivation, resistance to counter persuasion, and WOM as consequences. Buttle (2008) suggests that customer retention is more important than customer acquisition, as the cost to retain a customer is lower than to acquire a new one. Customer retention would bring benefits like growing tenure, lower management costs over time, customer referrals and premium prices (p. 301-302). Hence, building loyalty is important to retain the customer, and ultimately, loyalty would increase the profitability (Hallowell 1996)
Based on the above discussion, the proposed hypotheses are as follow:
Hypothesis 2a: Functional value has a direct and positive effect on brand loyalty.
Hypothesis 2b: Emotional value has a direct and positive effect on brand loyalty.
Hypothesis 2c: Social value has a direct and positive effect on brand loyalty.
Hypothesis 2d: Perceived sacrifice has a direct and negative effect on brand loyalty.
Hypothesis 2e: Self-image congruity has a direct and positive effect on brand loyalty.
Hypothesis 2f:Brand loyalty has a positive effect on customer behavior-based CRM performance.
6. Customer Satisfaction Customer satisfaction is commonly
accepted as “a person’s feelings of pleasure or disappointment resulting
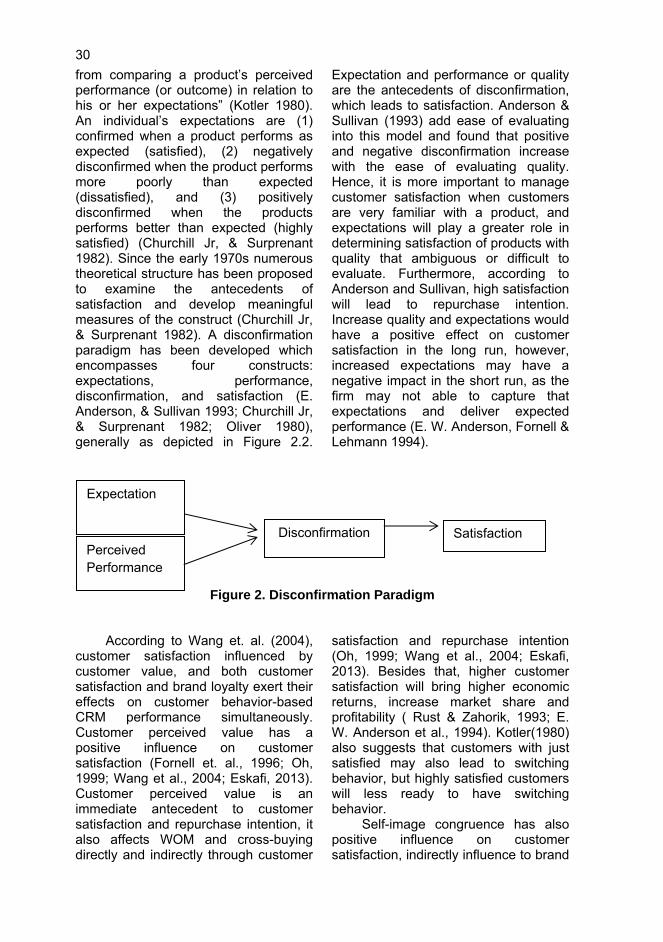
30 from comparing a product’s perceived performance (or outcome) in relation to his or her expectations” (Kotler 1980). An individual’s expectations are (1) confirmed when a product performs as expected (satisfied), (2) negatively disconfirmed when the product performs more poorly than expected (dissatisfied), and (3) positively disconfirmed when the products performs better than expected (highly satisfied) (Churchill Jr, & Surprenant 1982). Since the early 1970s numerous theoretical structure has been proposed to examine the antecedents of satisfaction and develop meaningful measures of the construct (Churchill Jr, & Surprenant 1982). A disconfirmation paradigm has been developed which encompasses four constructs: expectations, performance, disconfirmation, and satisfaction (E. Anderson, & Sullivan 1993; Churchill Jr, & Surprenant 1982; Oliver 1980), generally as depicted in Figure 2.2.
Expectation and performance or quality are the antecedents of disconfirmation, which leads to satisfaction. Anderson & Sullivan (1993) add ease of evaluating into this model and found that positive and negative disconfirmation increase with the ease of evaluating quality. Hence, it is more important to manage customer satisfaction when customers are very familiar with a product, and expectations will play a greater role in determining satisfaction of products with quality that ambiguous or difficult to evaluate. Furthermore, according to Anderson and Sullivan, high satisfaction will lead to repurchase intention. Increase quality and expectations would have a positive effect on customer satisfaction in the long run, however, increased expectations may have a negative impact in the short run, as the firm may not able to capture that expectations and deliver expected performance (E. W. Anderson, Fornell & Lehmann 1994).
Figure 2. Disconfirmation Paradigm
According to Wang et. al. (2004), customer satisfaction influenced by customer value, and both customer satisfaction and brand loyalty exert their effects on customer behavior-based CRM performance simultaneously. Customer perceived value has a positive influence on customer satisfaction (Fornell et. al., 1996; Oh, 1999; Wang et al., 2004; Eskafi, 2013). Customer perceived value is an immediate antecedent to customer satisfaction and repurchase intention, it also affects WOM and cross-buying directly and indirectly through customer
satisfaction and repurchase intention (Oh, 1999; Wang et al., 2004; Eskafi, 2013). Besides that, higher customer satisfaction will bring higher economic returns, increase market share and profitability ( Rust & Zahorik, 1993; E. W. Anderson et al., 1994). Kotler(1980) also suggests that customers with just satisfied may also lead to switching behavior, but highly satisfied customers will less ready to have switching behavior.
Self-image congruence has also positive influence on customer satisfaction, indirectly influence to brand
Perceived Performance
Disconfirmation Satisfaction
Expectation
31 loyalty through customer satisfaction, and also indirectly to customer behavior-based CRM performance (Eskafi, 2013; Wang et al., 2004; Ibrahim &Najjar, 2008; Jamal & Goode, 2001). It is suggests that the higher the satisfaction, the higher levels of behavioral intentions it would be, that is, the consumers are more likely to recommend or to revisit the store (Ibrahim, & Najjar 2008).
Based on the above discussion, the proposed hypotheses are as follow:
Hypothesis 3a: Functional value has a direct and positive effect on customer satisfaction.
Hypothesis 3b: Emotional value has a direct and positive effect on customer satisfaction.
Hypothesis 3c: Social value has a direct and positive effect on customer satisfaction.
Hypothesis 3d: Perceived sacrifice has a direct and negative effect on customer satisfaction.
Hypothesis 3e: Self-image congruity has a direct and positive effect on customer satisfaction.
Hypothesis 3f: Customer satisfaction has a positive effect on customer behavior-based CRM performance.
Hypothesis 3g: Customer satisfaction has a positive effect on brand loyalty.
7. Key Dimensions of
Customer Value There is no definitive
conceptualization, framework, or typology of customer value, just as there is no commonly accepted definition of customer value (Smith, & Colgate 2007). In an early conceptualization of consumer needs, Park, Jaworski and Maclnnis (1986) identify three basic consumer needs: functional needs, symbolic needs, and experiential needs. Functional needs are those that motivate the search for products that solve consumption-related problems. Symbolic needs are the
desires for products that fulfill internally generated needs for self-enhancement, role position, group membership, or ego-identification. Experiential needs are the desires for products that provide sensory pleasure, variety, and/or cognitive stimulation. These three basic needs reflect the value dimensions: functional value, symbolic value, and experiential value.
In later years, Sheth, Newman and Gross (1991) suggested five consumption values that influence consumer choice behavior: functional value, conditional value, social value, emotional value, and epistemic value. Functional value is the perceived utility acquired from an alternative’s capacity for functional, utilitarian, or physical performance. Conditional value is the perceived utility acquired by an alternative as the result of the specific situation or set of circumstances facing the choice maker. Social value is the perceived utility acquired from an alternative’s association with one or more specific social groups. Emotional value is the perceived utility acquired from an alternative’s capacity to arouse feelings or affective states. Epistemic value is the perceived utility acquired from an alternative’s capacity to arouse curiosity, provide novelty, and/or satisfy a desire for knowledge.
In a recent conceptualization, Smith and Colgate (2007) based on existing frameworks, present a new customer value conceptual framework which identified four major types of value that can be created by organizations: functional/instrumental value, experiential/hedonic value, symbolic/expressive value and cost/sacrifice value. Functional/instrumental value is concerned with the extent to which a product (good or service) has desired characteristics, is useful, or performs a desired function. Experiential/hedonic value is concerned with the extent to which a product creates appropriate experiences, feelings and emotions for
32 the customer. Symbolic/expressive value is concerned with the extent to which customers attach or associate psychological meaning to a product. Cost/sacrifice value is concerned with the transaction costs that may be involved in the purchase, ownership, and use of a product. Different from the framework suggested by Sheth et al. (1991), Smith and Colgate included the cost or sacrifice value as one of the values that influencing customer choice behaviors.
The present study adopts the framework suggested by Wang et al. (2004), which is originally adopts from Sweeney and Soutar (2001). Sweeney and Soutar (2001) suggest four major types of values: emotional value, social value, quality/performance value, and price/value for money. Emotional value represents the utility derived from the feelings or affective states that a product generates. Social value represents the utility derived from the product’s ability to enhance social self-concept. Quality/performance value represents the utility derived from the perceived quality and expected performance of the product. Price/value for money represents the utility derived from the product due to the reduction of its perceived short term and longer term costs. Sweeny and Soutar develop a 19-item measure, Perceived Value (PERVAL),that can be used to assess customers’ perceived value of consumer durable goods at brand level. However, in later study, Wang et al. (2004) argue that when talking about “sacrifice”, non-monetary factors should also be considered other than price in the dimension of “price/value of money”. Non-monetary factors such as time, effort or energy may even be more important than price. Therefore, the non-monetary factors are integrated into price/value for money and termed as “perceived sacrifice”, which refers to the loss derived from the product or service due to increment of its perceived short-term and long-term costs.
8. Research Methodology An empirical study was designed
to test the research framework and the abovementioned hypothesis. We will briefly address here some methodological issues related to the subject, data collection and the measurement of variables.
8.1 Population This study will focus in the retailing
industry in Malaysia. While there are various kinds of retailers, this study will narrow down the scope and focus on the customers of hypermarket which is also food-oriented retailer in Malaysia, such as AEON, AEON Big, Giant, Tesco, Econsave, Carrefour, Jaya Grocer, Cold Storage, Mydin, Big 10 and so on. These hypermarkets may be located in a community shopping center or isolated site. A hypermarket unites supermarket and general merchandise in one facility, with general merchandise accounting for 26 to 40 percent of sales (Berman, 2010). Hypermarkets are heavy users of CRM solutions and therefore will be more relevant to this study.
8.2 Data Collection The questionnaire was sent out
online through Facebook message and email conveniently to the respondents with age group 19 to 33 years old. Distributing the questionnaire online overcome the geographic barrier. There were 63 respondents collected from online questionnaire. The hard copy questionnaires were distributed conveniently in the Universiti Kebangsaan Malaysia Bangi Campus, and at a hypermarket in Kajang. The questionnaire distributed in UKM was not only to students (both undergraduate and post-graduate), but also to the staff of UKM (offices, library, restaurants, and etc.), in order to capture the different segments of consumers. There were 141 hard-copy questionnaires collected in two weeks’
33 time. Total questionnaires collected were204, however among these 204 collected there are 10 sets with incomplete response. The missing values are less than 10% of the total sample, thus, the missing values cases were deleted to avoid statistical inaccuracy. Therefore, only 194 responses were utilized and reported in this study.
8.3 Measuring Instrument The present study adopted the
questionnaire that was previously developed by Wang et. al. (2004), and added in three items for self-image congruity construct. The questionnaire consists of three sections, with Section A seeking basic information of the respondents, Section B consisting items to be tested with five-points assumed Likert scale, and Section C on demographic information of the respondent. In section A, the information required are the frequency of visiting hypermarket, which hypermarket visited, and owning loyalty card(s) or not. Section B consists of 33 questions, with assumed five-points Likert scale (1 = strongly disagree, 2 = disagree, 3 = neither agree nor disagree, 4 = agree, 5 = strongly agree), that included items measuring five key dimensions of customer value, self-image congruity, customer satisfaction, customer loyalty, and customer behavior-based CRM performance. At the beginning of the Section B, respondents are asked to recall only one hypermarket that they had visited as the standard when answering the questions, providing consistency in answering the questions. In Section C the data requested include gender, ethnic, age, present marital status, highest education level, employment, and gross income per month (Appendix A) The questionnaire was distributed via by hand and online.
9. Discussion of the Findings This section starts with a
discussion of the respondent’s profile. Data Analysis and Structural Equation Model Building will also discussed in this section.
9.1 Demographic profile of the
respondents From the 194 responses collected,
through both online and face-to-face administration, it is shown that there are 50 males and 144 females, as depicted in Table 1.1. For the ethnic group, the Malays consists of over half of the respondents, 53.6% with 104 respondents, followed by Chinese, 32.5% (63 respondents), other ethnic 10.8% (21 respondents) and Indian 3.1% (6 respondents). Among the age group, 19 to 23 years old has the highest respondents, 67.0% with 130 respondents, followed by 24 to 28 years old, 22.2% (43 respondents), 29 to 33 years old 5.2% (10 respondents), 18 or less than 18 years old 4.1% (8 respondents), and the least more than 33 years old, 1.5% with 3 respondents only. 93.3% of the respondents are single, with 6.2% are married, and 0.5% of divorces or widowed. 67.5% of the respondents reach Bachelor’s Degree as highest education level, followed by 12.9% postgraduate degree, 11.3% certificate or diploma, 5.2% of secondary school, 2.6% for others and 0.5% primary school or below. For the employment status, the majority formed by student (68.0%), followed by private sector (19.1%), public sector (7.7%), not working (3.1%), own business 1.5%) and others (0.5%). The last segment is about gross income per month, 77.9% of respondents have income less than RM 2,000, 19.1% with RM 2,000 to RM 4,999, 2.6% with RM 5,000 to RM 10,000 and 0.5% have more than RM 10,000. A summary of the demographic profile of the respondents is shown in
9.2 Measurement Model
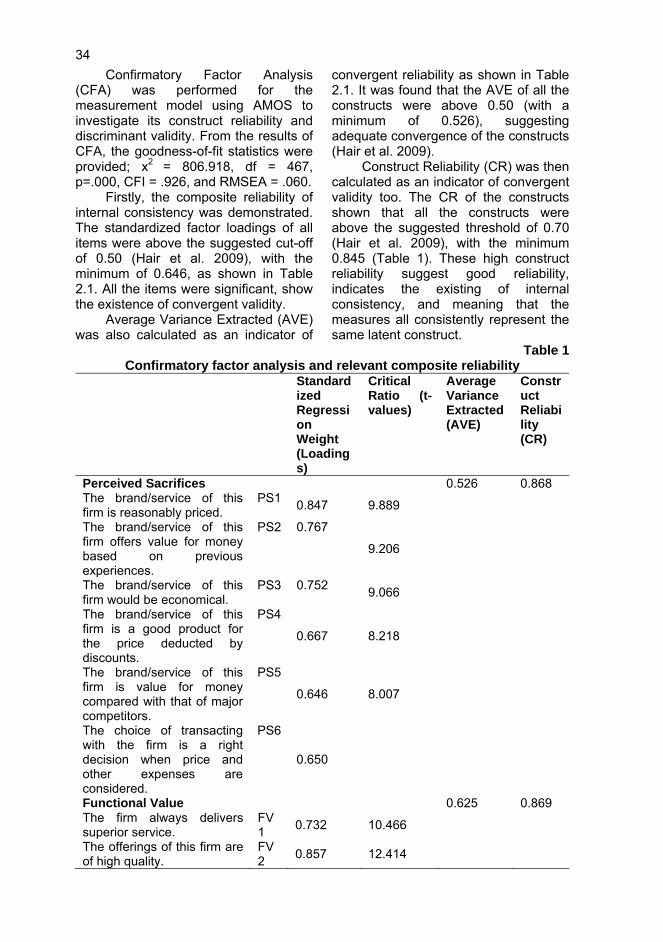
34 Confirmatory Factor Analysis
(CFA) was performed for the measurement model using AMOS to investigate its construct reliability and discriminant validity. From the results of CFA, the goodness-of-fit statistics were provided; x2 = 806.918, df = 467, p=.000, CFI = .926, and RMSEA = .060.
Firstly, the composite reliability of internal consistency was demonstrated. The standardized factor loadings of all items were above the suggested cut-off of 0.50 (Hair et al. 2009), with the minimum of 0.646, as shown in Table 2.1. All the items were significant, show the existence of convergent validity.
Average Variance Extracted (AVE) was also calculated as an indicator of
convergent reliability as shown in Table 2.1. It was found that the AVE of all the constructs were above 0.50 (with a minimum of 0.526), suggesting adequate convergence of the constructs (Hair et al. 2009).
Construct Reliability (CR) was then calculated as an indicator of convergent validity too. The CR of the constructs shown that all the constructs were above the suggested threshold of 0.70 (Hair et al. 2009), with the minimum 0.845 (Table 1). These high construct reliability suggest good reliability, indicates the existing of internal consistency, and meaning that the measures all consistently represent the same latent construct.
Table 1 Confirmatory factor analysis and relevant composite reliability
Standardized Regression Weight (Loadings)
Critical Ratio (t-values)
Average Variance Extracted (AVE)
Construct Reliability (CR)
Perceived Sacrifices 0.526 0.868 The brand/service of this firm is reasonably priced.
PS1 0.847 9.889
The brand/service of this firm offers value for money based on previous experiences.
PS2 0.767
9.206
The brand/service of this firm would be economical.
PS3 0.752 9.066
The brand/service of this firm is a good product for the price deducted by discounts.
PS4
0.667 8.218
The brand/service of this firm is value for money compared with that of major competitors.
PS5 0.646 8.007
The choice of transacting with the firm is a right decision when price and other expenses are considered.
PS6 0.650
Functional Value 0.625 0.869 The firm always delivers superior service.
FV1 0.732 10.466
The offerings of this firm are of high quality.
FV2 0.857 12.414
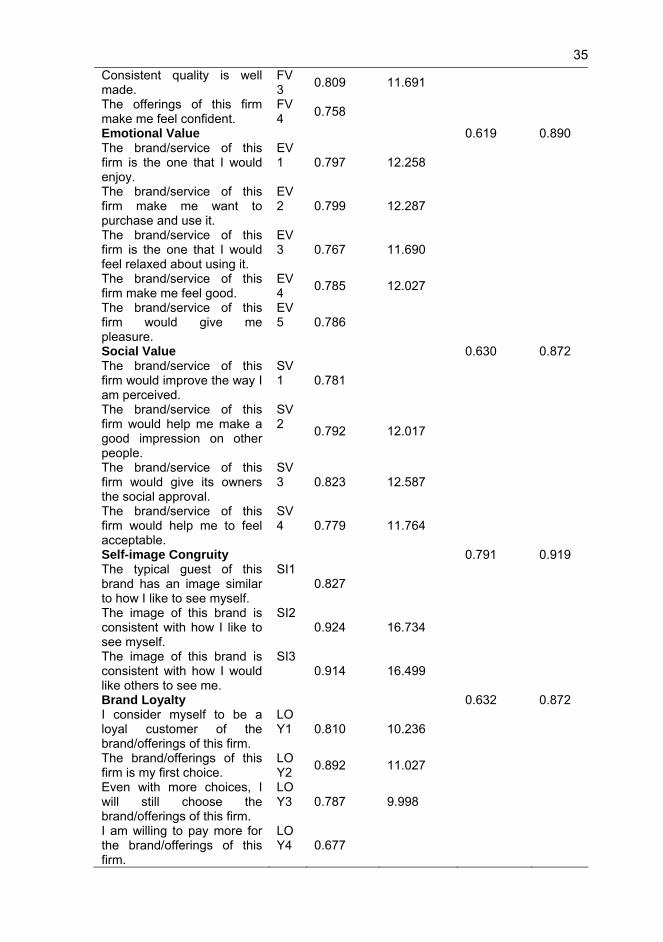
35 Consistent quality is well made.
FV3 0.809 11.691
The offerings of this firm make me feel confident.
FV4 0.758
Emotional Value 0.619 0.890 The brand/service of this firm is the one that I would enjoy.
EV1 0.797 12.258
The brand/service of this firm make me want to purchase and use it.
EV2 0.799 12.287
The brand/service of this firm is the one that I would feel relaxed about using it.
EV3 0.767 11.690
The brand/service of this firm make me feel good.
EV4 0.785 12.027
The brand/service of this firm would give me pleasure.
EV5 0.786
Social Value 0.630 0.872 The brand/service of this firm would improve the way I am perceived.
SV1 0.781
The brand/service of this firm would help me make a good impression on other people.
SV2 0.792 12.017
The brand/service of this firm would give its owners the social approval.
SV3 0.823 12.587
The brand/service of this firm would help me to feel acceptable.
SV4 0.779 11.764
Self-image Congruity 0.791 0.919 The typical guest of this brand has an image similar to how I like to see myself.
SI1 0.827
The image of this brand is consistent with how I like to see myself.
SI2 0.924 16.734
The image of this brand is consistent with how I would like others to see me.
SI3 0.914 16.499
Brand Loyalty 0.632 0.872 I consider myself to be a loyal customer of the brand/offerings of this firm.
LOY1 0.810 10.236
The brand/offerings of this firm is my first choice.
LOY2 0.892 11.027
Even with more choices, I will still choose the brand/offerings of this firm.
LOY3 0.787 9.998
I am willing to pay more for the brand/offerings of this firm.
LOY4 0.677
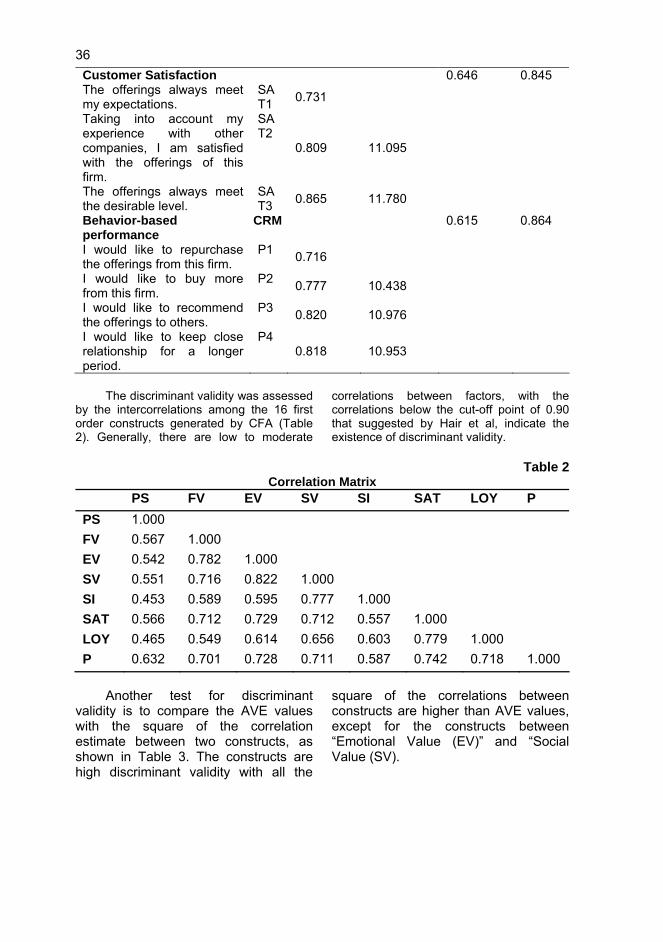
36 Customer Satisfaction 0.646 0.845 The offerings always meet my expectations.
SAT1 0.731
Taking into account my experience with other companies, I am satisfied with the offerings of this firm.
SAT2
0.809 11.095
The offerings always meet the desirable level.
SAT3 0.865 11.780
Behavior-based CRM performance 0.615 0.864
I would like to repurchase the offerings from this firm.
P1 0.716
I would like to buy more from this firm.
P2 0.777 10.438
I would like to recommend the offerings to others.
P3 0.820 10.976
I would like to keep close relationship for a longer period.
P4 0.818 10.953
The discriminant validity was assessed
by the intercorrelations among the 16 first order constructs generated by CFA (Table 2). Generally, there are low to moderate
correlations between factors, with the correlations below the cut-off point of 0.90 that suggested by Hair et al, indicate the existence of discriminant validity.
Table 2
Correlation Matrix PS FV EV SV SI SAT LOY P PS 1.000 FV 0.567 1.000 EV 0.542 0.782 1.000 SV 0.551 0.716 0.822 1.000 SI 0.453 0.589 0.595 0.777 1.000 SAT 0.566 0.712 0.729 0.712 0.557 1.000 LOY 0.465 0.549 0.614 0.656 0.603 0.779 1.000 P 0.632 0.701 0.728 0.711 0.587 0.742 0.718 1.000
Another test for discriminant
validity is to compare the AVE values with the square of the correlation estimate between two constructs, as shown in Table 3. The constructs are high discriminant validity with all the
square of the correlations between constructs are higher than AVE values, except for the constructs between “Emotional Value (EV)” and “Social Value (SV).
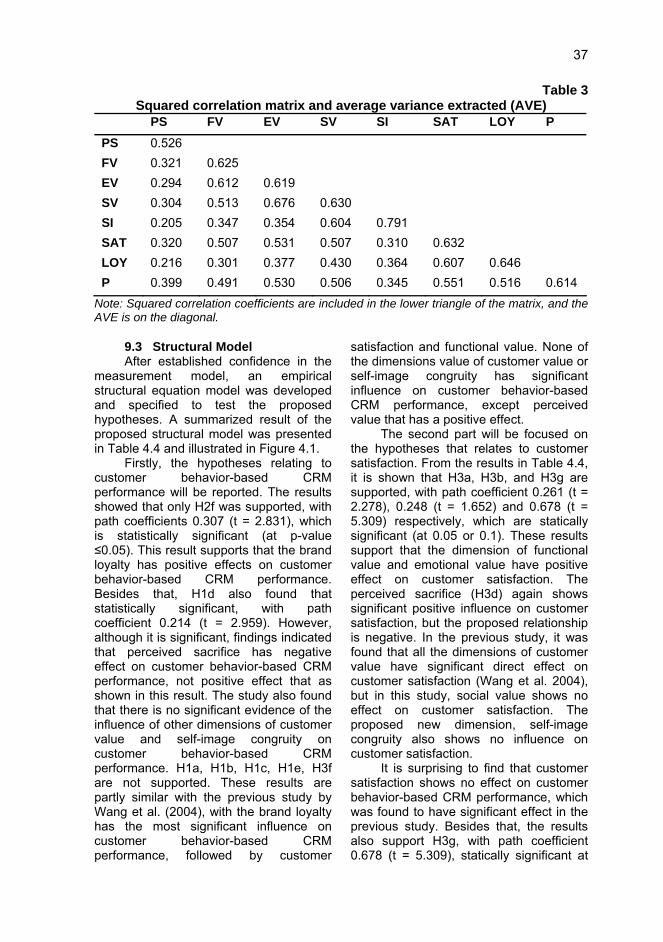
37
Table 3 Squared correlation matrix and average variance extracted (AVE)
PS FV EV SV SI SAT LOY P PS 0.526 FV 0.321 0.625 EV 0.294 0.612 0.619 SV 0.304 0.513 0.676 0.630 SI 0.205 0.347 0.354 0.604 0.791 SAT 0.320 0.507 0.531 0.507 0.310 0.632 LOY 0.216 0.301 0.377 0.430 0.364 0.607 0.646 P 0.399 0.491 0.530 0.506 0.345 0.551 0.516 0.614
Note: Squared correlation coefficients are included in the lower triangle of the matrix, and the AVE is on the diagonal.
9.3 Structural Model After established confidence in the
measurement model, an empirical structural equation model was developed and specified to test the proposed hypotheses. A summarized result of the proposed structural model was presented in Table 4.4 and illustrated in Figure 4.1.
Firstly, the hypotheses relating to customer behavior-based CRM performance will be reported. The results showed that only H2f was supported, with path coefficients 0.307 (t = 2.831), which is statistically significant (at p-value ≤0.05). This result supports that the brand loyalty has positive effects on customer behavior-based CRM performance. Besides that, H1d also found that statistically significant, with path coefficient 0.214 (t = 2.959). However, although it is significant, findings indicated that perceived sacrifice has negative effect on customer behavior-based CRM performance, not positive effect that as shown in this result. The study also found that there is no significant evidence of the influence of other dimensions of customer value and self-image congruity on customer behavior-based CRM performance. H1a, H1b, H1c, H1e, H3f are not supported. These results are partly similar with the previous study by Wang et al. (2004), with the brand loyalty has the most significant influence on customer behavior-based CRM performance, followed by customer
satisfaction and functional value. None of the dimensions value of customer value or self-image congruity has significant influence on customer behavior-based CRM performance, except perceived value that has a positive effect.
The second part will be focused on the hypotheses that relates to customer satisfaction. From the results in Table 4.4, it is shown that H3a, H3b, and H3g are supported, with path coefficient 0.261 (t = 2.278), 0.248 (t = 1.652) and 0.678 (t = 5.309) respectively, which are statically significant (at 0.05 or 0.1). These results support that the dimension of functional value and emotional value have positive effect on customer satisfaction. The perceived sacrifice (H3d) again shows significant positive influence on customer satisfaction, but the proposed relationship is negative. In the previous study, it was found that all the dimensions of customer value have significant direct effect on customer satisfaction (Wang et al. 2004), but in this study, social value shows no effect on customer satisfaction. The proposed new dimension, self-image congruity also shows no influence on customer satisfaction.
It is surprising to find that customer satisfaction shows no effect on customer behavior-based CRM performance, which was found to have significant effect in the previous study. Besides that, the results also support H3g, with path coefficient 0.678 (t = 5.309), statically significant at
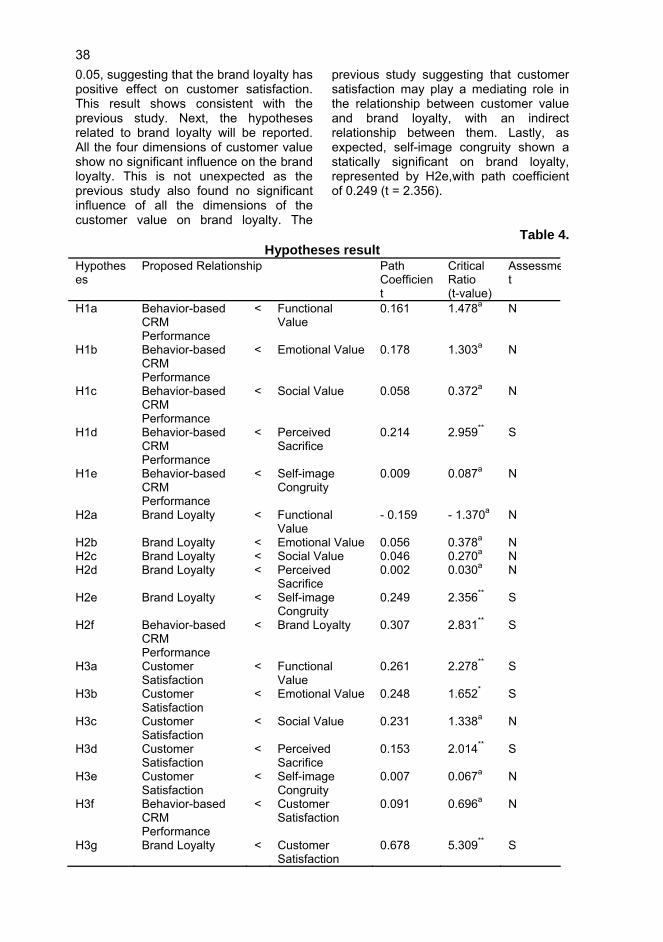
38 0.05, suggesting that the brand loyalty has positive effect on customer satisfaction. This result shows consistent with the previous study. Next, the hypotheses related to brand loyalty will be reported. All the four dimensions of customer value show no significant influence on the brand loyalty. This is not unexpected as the previous study also found no significant influence of all the dimensions of the customer value on brand loyalty. The
previous study suggesting that customer satisfaction may play a mediating role in the relationship between customer value and brand loyalty, with an indirect relationship between them. Lastly, as expected, self-image congruity shown a statically significant on brand loyalty, represented by H2e,with path coefficient of 0.249 (t = 2.356).
Table 4. Hypotheses result
Hypotheses
Proposed Relationship Path Coefficient
Critical Ratio (t-value)
Assessmet
H1a Behavior-based CRM Performance
< Functional Value
0.161 1.478a N
H1b Behavior-based CRM Performance
< Emotional Value 0.178 1.303a N
H1c Behavior-based CRM Performance
< Social Value 0.058 0.372a N
H1d Behavior-based CRM Performance
< Perceived Sacrifice
0.214 2.959** S
H1e Behavior-based CRM Performance
< Self-image Congruity
0.009 0.087a N
H2a Brand Loyalty < Functional Value
- 0.159 - 1.370a N
H2b Brand Loyalty < Emotional Value 0.056 0.378a N H2c Brand Loyalty < Social Value 0.046 0.270a N H2d Brand Loyalty < Perceived
Sacrifice 0.002 0.030a N
H2e Brand Loyalty < Self-image Congruity
0.249 2.356** S
H2f Behavior-based CRM Performance
< Brand Loyalty 0.307 2.831** S
H3a Customer Satisfaction
< Functional Value
0.261 2.278** S
H3b Customer Satisfaction
< Emotional Value 0.248 1.652* S
H3c Customer Satisfaction
< Social Value 0.231 1.338a N
H3d Customer Satisfaction
< Perceived Sacrifice
0.153 2.014** S
H3e Customer Satisfaction
< Self-image Congruity
0.007 0.067a N
H3f Behavior-based CRM Performance
< Customer Satisfaction
0.091 0.696a N
H3g Brand Loyalty < Customer Satisfaction
0.678 5.309** S
39
10. Discussion Among the four dimensions,
perceived sacrifice is the only one that has significant influence on customer behavior-based CRM performance. Respondents were asked to choose a hypermarket as a point of reference when they answer the questions, it would be possible that the respondents choose their preferred hypermarket, or the one that they perceived the highest value, and hence perceived sacrifice would be significantly affect customer behavior-based CRM performance, specifically of cross-buying, WOM, customer retention and repurchase. Another reason is that, this study targets Generation Y, and the majority of the respondents (68%) are made up of students or working adults with no or low income, the price/value for money or perceived sacrifice would be their first consideration when they choose to do grocery in a hypermarket, rather than other dimensions of customer value. Previous research also found that perceived value for money is a key driver in discount store with significant relationship to both customer satisfaction and repatronage intention, suggesting that monetary sacrifice is a noteworthy contender in the customer’s value perceptions (Grace, & O’Cass 2005). Hypermarket is similar to discount store with its price-driven nature.
Although perceived value is the only one that is found to have significant influence on customer satisfaction and customer behavior-based CRM performance, but the influence is positive, not negative, as suggested in Wang et al.’s study. The dimension “perceived sacrifice”, was originally adopted from Sweeney& Soutar's (2001), termed as “price/value for money”. Wang et al then argued that non-monetary factors should be also included into this dimension, and hence added two new non-monetary costs items into the measure. It would be
possible that respondents do not consider the items as sacrifices, but rather the benefits they received, hence leading to a positive effect.
The results revealed that all the four key dimensions of customer value have no significant effect on brand loyalty, consistent with the findings in Wang et al.’s study. However, the new add-ins element, self-image congruity, is the only element that has significant positive influence on customer loyalty. It is the only one that has direct effect on brand loyalty. This suggests that the image of hypermarket will influence brand loyalty of customer. As brand loyalty has significant influence on customer behavior-based CRM performance, firms can improve brand loyalty, through investigation and creation of the desired image, and hence, led to customer retention, cross buying, repurchase and WOM.
The results of the study support that brand loyalty has significant positive effect on customer-behavior based CRM performance. It means that when the customers have loyalty towards the hypermarket, it will leads to cross-buying, customer retention, WOM and repurchase intention. However, in this study customer satisfaction has revealed no significant influence on customer behavior-based CRM performance, which is significant in the previous study (Wang et al. 2004). The possible explanation for this is that, in the sector of hypermarket retailing, the customers are mature and the competition is very intense, customer satisfaction is not enough to retain the customer. Besides, just like what Kotler (1980) suggests, customers with just satisfied may also lead to switching behavior, but highly satisfied customers will less ready to have switching behavior. The customer satisfaction of the respondents may be not high enough to lead to those desired behavior, or perhaps the satisfaction level is very high in this hypermarket
40 sector, customers have higher expectation toward it and the performance of the hypermarkets did not reach their expectation. In addition, the target group of this study, which is Generation Y consumer, research suggests that they have a lower level of retailer loyalty (Parment 2013), and this may be the reason that they do not stay with a hypermarket, even they were satisfied.
Results also showed that customer satisfaction has a positive significant influence on brand loyalty. Since that the brand loyalty has significant effect on customer behavior-based CRM performance, therefore it is also suggesting that brand loyalty plays a mediating role between customer satisfaction and customer behavior-based CRM performance, which is also suggested in Wang et. al.’s study, supported by Yang, & Peterson (2004). Among the four dimensions of customer perceived value, functional value, emotional value and perceived sacrifice proved to have significant positive influence on customer satisfaction. Hence, in order to generate the loyalty, hypermarket firms can improve their customer satisfaction through providing better offers or services from these three dimensions.
This study also reveals that social value has no any significant influence on customer satisfaction, which is inconsistent with Wang et al.’s study. One probable explanation would be the peculiarities of grocery products purchase process in hypermarket, like routine purchases and low customer involvement (Ruiz-Molina, & Gil-Saura 2008).
11. Conclusion This research is interested in
finding the effect of key dimensions of customer value and self-image congruity on customer behavior-based CRM performance in the retail setting in Malaysia Generation Y. However, it is revealed that only perceived sacrifice
has direct effect on customer behavior-based CRM performance. This also suggested that perceived sacrifice appears as a critical factor that would leads to customer retention, WOM, cross-buying and repurchase among the Generation Y.
Apart from that, this research also aims to investigate the effect on key dimensions of customer value and self-image congruity on customer satisfaction and brand loyalty. It is found that besides of social value and self-image congruity, the other three elements (functional value, emotional value and perceived sacrifice) have direct influence on customer satisfaction. Perceived sacrifice once again appears as an important factor in influencing the customer satisfaction. Firms should pay more attention on perceived sacrifice and it should become the focus when delivering customer value among the hypermarkets in Malaysia when targeting Generation Y.
It is also found that all the key dimensions of customer value have no direct effect on brand loyalty. However, the study found that brand loyalty has a very important role in influencing the customer behavior-based CRM performance, as it is the only element that would directly affect the customer behavior-based CRM performance besides of perceived sacrifice. It also plays a moderating role between customer satisfaction and customer behavior-based CRM performance. Although functional value and emotional value have no direct effect on customer behavior-based CRM performance, but they would influence the customer satisfaction, which would indirectly influence the customer behavior-based CRM performance through brand loyalty. Therefore, this also means that, if firms want to achieve better customer behavior-based CRM performance, they need to first improve the customer satisfaction through delivering the desired customer perceived value, and
41 the satisfaction would then bring to brand loyalty. Besides that, self-image congruity is also found as the only one element that has direct effect on brand loyalty. Firms could easily create strong brand loyalty from Generation Y by create the desired image.
This research would help to increase the knowledge of how the key dimensions of customer value and self-image congruity influence on customer behavior-based CRM performance, directly or indirectly through customer satisfaction and brand loyalty. This study had investigated on the hypermarkets in Malaysia, and it would be interesting if future research can extend on other segments or even other industries, for example insurance, bank, automotive, air lines or industry that
have incremental adoption of CRM tools. It is also suggested to conduct further research into B2B industry. In addition, this research is focus on Generation Y, future research would extend the investigation on other segments, or even cross-cultural group.
The moderating role of brand loyalty on the relationship between customer satisfaction and customer behavior-based CRM performance is worth to have further investigate too. Finally, there may be many other factors that might influence customer behavior-based CRM performance besides of customer value and self-image congruity, it would be useful and practical to model and test that factors in an integrated framework, to advance knowledge on this framework.
REFERENCES Anderson, E. & Sullivan, M. (1993), The antecedents and consequences of customer
satisfaction for firms. Marketing science, 12(2), 125–143. Anderson, E. W., Fornell, C. & Lehmann, D. R. (1994), Customer satisfaction, Market
share, and Profitability: Findings From Sweden. Journal of Marketing, 58, 53–66. Assael, H. (1999), Consumer Behavior and Marketing Action. Cincinnati South: Western
College Publisher. Band, W. (2012), The Forrester Wave TM�: CRM Suites For Midsize Organizations , Q3
2012. Forrester Research, Inc.,. Cambridger, USA. Belk, R. W. (1988), Possessions and the extended self. Journal of Consumer Research,
15(2), 139–168. Buttle, F. (2008), Customer Relationship Management: Concepts and Technologies.
Heinemann: Elsevior Butterworth. Churchill Jr, G. & Surprenant, C. (1982), An investigation into the determinants of
customer satisfaction. Journal of Marketing research, XIX(Nov), 491–504. Conn., S. (2013), Gartner Says Worldwide Customer Relationship Management
Software Market Greww 12.5 Percent in 2012. Gartner Newsroom,. http://www.gartner.com/newsroom/id/2459015 [1 November 2014].
Dick, A. & Basu, K. (1994), Customer loyalty: toward an integrated conceptual framework. Journal of the academy of marketing science, 22(2), 99–113.
Economic Planning Unit. (2013), The Malaysian Economy in Figures. Fiol, L. C. (2009), Customer loyalty in clusters: perceived value and satisfaction as
antecedents. Flint, D. J., Blocker, C. P. & Boutin, P. J. (2011), Customer value anticipation, customer
satisfaction and loyalty: An empirical examination. Industrial Marketing Management, 40(2), 219–230.
Fornell, C., Johnson, M. D., Anderson, E. W., Cha, J. & Bryant, B. E. (1996), The American Customer Satisfaction Index: Nature, Purpose, and Findings. Journal of Marketing, 60(4), 7.
42 Foss, B., Stone, M. & Ekinci, Y. (2008), What makes for CRM system success — Or
failure? Journal of Database Marketing & Customer Strategy Management, 15(2), 68–78.
Ganesan, A. (2012), Consumption, spending and investment behaviour of malaysia generation y. Retrieved from http://eprints.utar.edu.my/683/1/MBA-2012-08UKM1961-1.pdf
Gilbert, D. (2003), Retail Marketing Management.2nd Edisi . England: Prentice Hall. Grace, D. & O’Cass, A. (2005), An examination of the antecedents of repatronage
intentions across different retail store formats. Journal of Retailing and Consumer Services, 12(4), 227–243.
Graeff, T. R. (1996), Using promotional messages to manage the effects of brand and self-image on brand evaluations. Journal of Consumer Marketing, 13(3), 4–18.
Gramling, G. (2007), Upcoming Trends and Recommendations in CRM Retail. The Sterling Report,. http://www.sterlinghoffman.com/newsletter/articles/article310.html [1 November 2013].
Hair, J., Black, W., Babin, B. & Anderson, R. (2009), Multivariate Data Analysis.7th Edisi . Upper Saddle River, NJ: Prentice Hall.
Hallowell, R. (1996), The relationships of customer satisfaction, customer loyalty, and profitability: an empirical study. International Journal of Service Industry Management, 7(4), 27–42.
Hamid Hamisah. (2011), Making Way For Gen Y. Business Times,. http://www.btimes.com.my/Current_News/BTIMES/articles/29GENY/Article/ [1 November 2013].
He, H., Li, Y. & Harris, L. (2012), Social identity perspective on brand loyalty. Journal of Business Research, 65(5), 648–657.
Hosany, S. & Martin, D. (2012), Self-image congruence in consumer behavior. Journal of Business Research, 65(5), 685–691.
Ibrahim, H. & Najjar, F. (2008), Assessing the effects of self-congruity, attitudes and customer satisfaction on customer behavioural intentions in retail environment. Marketing Intelligence & Planning, 26(2), 207–227.
Jamal, A. & Goode, M. M. H. (2001), Consumers and brands: a study of the impact of self-image congruence on brand preference and satisfaction. Marketing Intelligence & Planning, 19(7), 482–492.
Jensen, H. R. (2001), Antecedents and consequences of consumer value assessments: implications for marketing strategy and future research. Journal of Retailing and Consumer Services, 8(6), 299–310.
Kang, J., Tang, L. & Bosselman, R. (2011), Changes of Coffee Consumption Behaviors in Korea: The Effects of Image Congruity Toward Brand Name Coffeehouses on Consumer Attitude and Repurchase.
Kim, H.-S. & Kim, Y.-G. (2009), A CRM performance measurement framework: Its development process and application. Industrial Marketing Management, 38(4), 477–489.
Kim, M., Park, J. E., Dubinsky, A. J. & Chaiy, S. (2012), Frequency of CRM implementation activities: a customer-centric view. Journal of Services Marketing, 26(2), 83–93.
Kotler, P. (1980), Marketing Management: Analysis, Planning, Implementation and Control. New Jersey: Prentice Hall International.
Kressmann, F., Sirgy, M. J., Herrmann, A., Huber, F., Huber, S. & Lee, D.-J. (2006), Direct and indirect effects of self-image congruence on brand loyalty. Journal of Business Research, 59(9), 955–964.
Lim, S. J. (2002), CRM market in Malaysia and the factors that affect the adoption of CRM by Malaysian companies. University of Southern Queensland.
Liu, F., Li, J., Mizerski, D. & Soh, H. (2012), Self-congruity, brand attitude, and brand loyalty: a study on luxury brands. European Journal of Marketing, 46(7/8), 922–937.
43 Loudon, D. & Bitta, A. (1988), Consumer Behavior: Concepts and Applications.3rd Edisi
. Singapore: McGraw-Hill International Editions. Maryam Eskafi, Hosseini, S. H. & Mohammadzadeh, Y. A. (2013), The value of telecom
subscribers and customer relationship management. Business Process Management Journal, 19(4), 737–748.
Mittal, B. & Sheth, J. (2001), Value Space: Winning the Battle for Market Leadership. USA: McGraw-Hill.
Ngai, E. W. T. (2005), Customer relationship management research (1992-2002): An academic literature review and classification. Marketing Intelligence & Planning, 23(6), 582–605.
Oh, H. (1999), Service quality, customer satisfaction, and customer value: A holistic perspective. International Journal of Hospitality Management, 18(1), 67–82.
Oliver, R. (1980), A cognitive model of the antecedents and consequences of satisfaction decisions. Journal of marketing research, 17(4), 460–469.
Orgel, D. (2012), Supermarkets Rethink How to Capture Millennials. Supermarket News,. http://supermarketnews.com/blog/supermarkets-rethink-how-capture-millennials [1 November 2013].
Öztaysi, B., Sezgin, S. & Özok, A. F. (2011), A measurement tool for customer relationship management processes. Industrial Management & Data Systems, 111(6), 943–960.
Park, C., Jaworski, B. & Maclnnis, D. (1986), Strategic brand concept-image management. The Journal of Marketing, 50(October), 135–145.
Parment, A. (2013), Generation Y vs. Baby Boomers: Shopping behavior, buyer involvement and implications for retailing. Journal of Retailing and Consumer Services, 20(2), 189–199.
Payne, A. & Frow, P. (2005), A Strategic Framework for Customer Relationship Management. Journal of Marketing, 69, 167–176.
Peppers, D. & Rogers, M. (2011), Managing Customer Relationships: A Strategic Framework. New Jersey: John Wiley & Sons, Inc.
Rai, A. K. (2008), Customer Relationship Management: Concepts and Cases. New Delhi: PHI Learning.
Ravald, A. & Grönroos, C. (1996), The value concept and relationship marketing. European Journal of Marketing, 30(2), 19–30.
Reinartz, W., Krafft, M. & Hoyer, W. (2004), The customer relationship management process: its measurement and impact on performance. Journal of marketing research, XLI(August), 293–305.
Ruiz-Molina, M.-E. & Gil-Saura, I. (2008), Perceived value, customer attitude and loyalty in retailing. Journal of Retail and Leisure Property, 7(4), 305–314.
Rust, R. & Zahorik, A. (1993), Customer satisfaction, customer retention, and market share. Journal of retailing, 69(2), 193–215.
Ryals, L. (2005), Making customer relationship management work: the measurement and profitable management of customer relationships. Journal of Marketing, 69(October), 252–261.
Sheth, J., Newman, B. & Gross, B. (1991), Why we buy what we buy: a theory of consumption values. Journal of business research, 22, 159–170.
Sirgy, M. J. (1983), Social Cognition and Consumer Behavior. USA: Praeger Publishers. Smith, J. & Colgate, M. (2007), Customer Value Creation: A Practical Framework. The
Journal of Marketing Theory and Practice, 15(1), 7–23. Sweeney, J. C. & Soutar, G. N. (2001), Consumer perceived value: The development of
a multiple item scale. Journal of Retailing, 77(2), 203–220. Wahlberg, O., Strandberg, C. & Sandberg, K. (2009), Trends, Topics and Under-
Researched Areas in CRM Research-A Literature Review. International Journal of Public Information Systems, 2009(3), 191–208.
44 Wang, Y., Lo, H. P., Chi, R. & Yang, Y. (2004), An integrated framework for customer
value and customer-relationship-management performance: a customer-based perspective from China. Managing Service Quality, 14(2/3), 169–182.
Woodruff, R. (1997), Customer value: the next source for competitive advantage. Journal of the academy of marketing science, 25(2), 139–153.
Yang, Z. & Peterson, R. T. (2004), Customer perceived value, satisfaction, and loyalty: The role of switching costs. Psychology and Marketing, 21(10), 799–822.
Zablah, A. R., Bellenger, D. N. & Johnston, W. J. (2004), An evaluation of divergent perspectives on customer relationship management: Towards a common understanding of an emerging phenomenon. Industrial Marketing Management, 33(6), 475–489.
Zeithaml, V. (1988), Consumer perceptions of price, quality, and value: a means-end model and synthesis of evidence. The Journal of Marketing, 52(July), 2–22.
Zeithaml, V., Berry, L. & Parasuraman, A. (1996), The behavioral consequences of service quality. The Journal of Marketing, 60(April), 31–46.